EXHIBIT (c)(v)
Queensland’s Budget Papers for 2019-20.
FORWARD-LOOKING STATEMENTS
This exhibit contains forward-looking statements. Statements that are not historical facts, including statements about the State of Queensland’s (the “State” or “Queensland”) beliefs and expectations, are forward-looking statements. These statements are based on current plans, budgets, estimates and projections and therefore you should not place undue reliance on them. The words “believe”, “may”, “will”, “should”, “estimate”, “continue”, “anticipate”, “intend”, “expect”, “forecast” and similar words are intended to identify forward-looking statements. Forward-looking statements speak only as of the date they are made, and neither the Queensland Treasury Corporation nor the State undertake any obligation to update publicly any of them in light of new information or future events.
Forward-looking statements are based on current plans, estimates and projections and, therefore, undue reliance should not be placed on them. Although the Queensland Treasury Corporation and the State believe that the beliefs and expectations reflected in such forward-looking statements are reasonable, no assurance can be given that such beliefs and expectations will prove to have been correct. Forward-looking statements involve inherent risks and uncertainties. We caution you that actual results may differ materially from those contained in any forward-looking statements.
A number of important factors could cause actual results to differ materially from those expressed in any forward-looking statement. Factors that could cause the actual outcomes to differ materially from those expressed or implied in forward-looking statements include:
| | • | | the international and Australian economies, and in particular the rates of growth (or contraction) of the State’s major trading partners; |
| | • | | the effects, both internationally and in Australia, of any subsequent economic downturn, the effect of ongoing economic, banking and sovereign debt risk, and any stalling of the protracted United States recovery; |
| | • | | increases or decreases in international and Australian domestic interest rates; |
| | • | | changes in the State’s domestic consumption; |
| | • | | changes in the State’s labor force participation and productivity; |
| | • | | downgrades in the credit ratings of the State and Australia; |
| | • | | changes in the rate of inflation in the State; |
| | • | | changes in environmental and other regulation; and |
| | • | | changes in the distribution of revenue from the Commonwealth of Australia Government to the State. |
QUEENSLAND BUDGET 2019-20
Budget Speech
Budget Paper No.1
budget.qld.gov.au

2019-20 Queensland Budget Papers
1. Budget Speech
2. Budget Strategy and Outlook
3. Capital Statement
4. Budget Measures
5. Service Delivery Statements
Appropriation Bills
Budget Highlights
The Budget Papers are available online at budget.qld.gov.au
© The State of Queensland (Queensland Treasury) 2019
Copyright
This publication is protected by the Copyright Act 1968
Licence
This document is licensed by the State of Queensland (Queensland Treasury) under a Creative Commons Attribution (CC BY 4.0) International licence.

In essence, you are free to copy, communicate and adapt this publication, as long as you attribute the work to the State of Queensland (Queensland Treasury). To view a copy of this licence, visit http://creativecommons.org/licenses/by/4.0/
Attribution
Content from this publication should be attributed to:
© The State of Queensland (Queensland Treasury) - 2019-20 Queensland Budget

Translating and interpreting assistance
The Queensland Government is committed to providing accessible services to Queenslanders from all cultural and linguistic backgrounds. If you have difficulty in understanding this publication, you can contact us on telephone (07) 3035 3503 and we will arrange an interpreter to effectively communicate the report to you.
Budget Speech
Budget Paper No. 1
ISSN 1445-4890 (Print)
ISSN 1445-4904 (Online)

Appropriation Bill 2019
(First reading speech, 11 June 2019)
The Honourable Jackie Trad MP
Deputy Premier
Treasurer
Minister for Aboriginal and Torres Strait Islander Partnerships
Mr Speaker,
I move that the Bill be now read a first time.
Today I deliver a Queensland Budget unashamedly focussed on our regions.
I do so because Queensland is the most decentralised state in the federation.
1
A state that relies – more than any other – on the strength of its regional cities and towns.
On the prosperity of its regional economies.
And on the character and resilience of its regional communities.
Mr Speaker, our regions define who we are as Queenslanders.
When our regions do well, all of Queensland does well.
And so in shaping this Budget, it is regional Queenslanders who have been at the forefront of our thoughts.
Mr Speaker, this is a Budget for regional Queensland.
Our tourism regions. Our agricultural regions. And our coal and resource regions.
And it builds on a significant ongoing commitment by the Palaszczuk Government to regional Queensland.
Since 2015, the Palaszczuk Government has invested $29 billion in infrastructure outside of Greater Brisbane.
That’s almost 70 per cent of our entire capital spend – to strengthen our regional economies and improve hospitals and schools.
2
Mr Speaker, the list of projects completed or underway is too long to mention in detail, but the investment across our state includes:
| | • | | The Smithfield Bypass in Far North Queensland |
| | • | | The Berth 4 upgrade at the Port of Townsville |
| | • | | The Rockhampton Ring Road |
| | • | | The Capricornia Correctional Centre expansion |
| | • | | Major upgrades to the Bruce Highway |
| | • | | The Sunshine Coast University Hospital |
| | • | | The Gold Coast Light Rail extension; and |
| | • | | The Kingaroy and Roma Hospital redevelopments. |
And Mr Speaker
We’re not about to stop investing in regional Queensland.
Staying the Course
Budgets are about choices.
Today, through this Budget, the Palaszczuk Government is choosing to stay the course.
We choose to continue our strategy of investing in jobs and in front line services to meet the needs of a growing state.
3
We choose to support business, particularly small and medium sized business, to create jobs.
We choose to prepare our state for the future by investing in new industries and skills.
We choose not to cut, sack and sell.
And we make these choices because our economic plan is working to create jobs.
The proof is in the numbers.
Since 2015, 199,000 jobs have been created.
And the gap between unemployment in the regions and SEQ is narrowing.
Because of this Government’s focus on delivering infrastructure and creating jobs, in recent years this gap has fallen from 2.5 per cent to just 0.7 per cent.
In fact, in the last year alone in regional Queensland jobs are being created twice as fast as the population is growing.
Infrastructure
Mr Speaker,
These outcomes are no coincidence.
4
They have been achieved as a result of the Palaszczuk Government’s focus on our number one priority – jobs for Queenslanders.
And in this Budget, we stay the course.
We continue our focus on job generating infrastructure with an investment of $49.5 billion over four years.
This year the capital program will invest almost $13 billion in job generating infrastructure, directly supporting more than 40,000 jobs.
And more than 25,000 or 63 per cent of those jobs will be in regions outside of Greater Brisbane.
This contrasts sharply with the Federal Government’s Northern Australia Infrastructure Facility, which is yet to spend a single cent – or deliver a single new job – in regional Queensland.
Here’s a sample of what our Government is delivering right across Queensland:
| | • | | Continuing the work on the Mackay Ring Road |
| | • | | Expanding the Townsville Port |
| | • | | Upgrading to the RG Tanna Coal Terminal in Gladstone |
| | • | | Upgrading the M1 at key congestion points including the Pacific and Gateway Motorway merge |
5
| | • | | Improving regional roads including the Kennedy Development Road and the Barkly Highway from Mt Isa to Cloncurry |
| | • | | Delivering Cross River Rail to double our rail network capacity across the river meaning more trains from the Gold Coast and the Sunshine Coast |
| | • | | Building the new North Queensland Stadium due to open ahead of the NRL Premiership Season next year |
| | • | | Making a multi–million dollar investment in train manufacturing jobs in Maryborough at Downer EDI |
| | • | | Developing a new export hub for regional Queensland |
| | • | | Building a new counter-terrorism training facility at Wacol |
And so much more.
In this Budget we are investing another $70 million in the Building our Regions Program bringing our total commitment in this job generating program to $515 million.
Building infrastructure creates good jobs in construction.
But it also builds our economic capacity, attracting new industry and private investment.
6
Our Economy Today
That’s why, Mr Speaker, now is not the time to change course.
Despite the challenges of natural disasters, Canberra’s cuts and an unfair GST distribution – it’s not the time to diminish our investment in Queensland’s economic prosperity.
Our commitment to keep building job-generating infrastructure and capital projects will see our borrowing with Queensland Treasury Corporation remain at affordable levels – $72 billion in 2019-20.
Mr Speaker, Queensland can afford this continued investment.
The General Government debt-to-revenue ratio is a key measure of our capacity to sustain our investment.
The Government’s careful management of borrowings means that this ratio will remain lower than any other major state except New South Wales.
And it is only lower in New South Wales because they have chosen to privatise assets.
Mr Speaker, Queensland’s economy – and our Budget – are strong.
7
Counting the total value of everything we produce, Queensland is a $350 billion economy – three times what it was in 1990.
And Queensland’s economic growth is forecast to strengthen next financial year to 3 per cent and then 2 and three-quarter per cent for the following three years.
In fact, 2019-20 is expected to be the third year in a row that Queensland’s growth rate outperforms national growth.
We will achieve surpluses in every year of the forward estimates period.
And this will see revenue growth outpace expenses growth over the forward estimate period.
We will continue to see the net worth of the state grow.
And by 2021, for the first time, the state’s net worth will be more than $200 billion.
Sectors & innovation
Mr Speaker,
As our economy grows, we also need to underpin its strength through diversification.
8
That’s why the Palaszczuk Government is committed to developing new industries.
Advanced Manufacturing
Queensland is emerging as an advanced manufacturing state – creating new products for a new decade.
For example, together with industry and the community, we won the $5.2 billion Land 400 contract with Rheinmettall at Ipswich.
This will see advanced manufacturing activity never before undertaken in Queensland.
With new skills and new capabilities contributing to a more diverse economy.
Energy
As well, Queensland is at the forefront of the global energy revolution – another opportunity to diversify our economy.
No state has more to gain from gas and hydrogen, solar and wind.
We lead the nation when it comes to energy supply and reform.
9
We power the nation with our energy exports to the national grid.
We help to power the globe with Queensland’s coal and now our LNG exports which total $15 billion a year.
All thanks to a Labor Government with the foresight more than a decade ago to create an entirely new resource industry for our state.
And now we have the opportunity to do it again with hydrogen.
Global demand for hydrogen is increasing, with the market expected to reach an astonishing US$155 billion by 2022 – only three years away.
We want Queensland to be the home of this new industry. In the same way as we’ve become a key player in LNG.
Our renewable resources of solar and wind, combined with the existing gas pipeline infrastructure and port facilities gives us a competitive edge for the future production and export of hydrogen.
That’s why this Budget provides $19 million to help kick start the hydrogen industry in Queensland.
10
Innovation
Mr Speaker, this Government continues to support the entrepreneurs who are helping to diversify our economy.
Like the entrepreneurs from RedEarth Energy Storage at Darra who have developed battery systems which can store excess electricity for use after the sun goes down.
Like the social entrepreneurs who founded Orange Sky in Brisbane.
This enterprise has now expanded to 29 services across the country. Each week their vans do 10 tonnes of laundry and provide 122 showers for people in need.
Like the home-grown start-up company, Didgigo – based in Cairns and delivering new and exciting bespoke solutions in the tourism industry.
And the amazing work of Immunologist Professor Ian Frazer – who is investigating the use of a new therapeutic vaccine he invented to treat head and neck cancers.
Our $175 million Jobs and Regional Growth Fund is helping Queensland to be at the forefront of a developing biofuels industry.
11
For example, the latest biorefinery pilot project in the Gladstone region will target production of four tonnes of renewable diesel and jet fuel daily, creating an estimated 50 jobs.
Resources
Mr Speaker, our efforts to build innovative new industries rests on the shoulders of Queensland’s continuing traditional strengths.
Queensland is a resources state.
In the past four years we have attracted more than $20 billion worth of new investment in resources and created more than 7,000 jobs.
And we will continue to innovate in mining and exploration.
The North West Minerals Province contains approximately 75 per cent of Queensland’s base metal and mineral endowment, including copper, lead, zinc, silver, gold and phosphate deposits.
These are the very resources the world’s new economy is demanding.
We want to unlock this potential.
12
That’s why this Budget invests in new initiatives to promote exploration, mining and exports in the North West Minerals Province.
This includes common-user facilities at the Port of Townsville – open for use by any above-rail operator.
It means that wagons of mineral concentrate that are destined for the world’s markets will no longer have to be unloaded more than 12 kilometres away and transported by truck through Townsville to the Port.
Our investment also includes a reduction in rail access charges on the Mt Isa line.
This means our resources will get from pit to port in the most competitive and cost-effective way.
This is a clear signal to global markets that we are serious about opening up the North West Minerals Province to the world and we’ve backed it with a half-a-billion-dollar investment in this year’s Budget.
Agriculture
Mr Speaker,
Queensland is an agricultural state.
13
And we are meeting the rising demand for clean and green food from the growing Asian middle class.
This has helped us set trade records – with total exports rising more than 16 per cent to $85 billion in the year to April 2019, including almost $10 billion of rural exports.
In the face of instability and uncertainty in international markets we have worked with the agricultural sector to secure jobs and opportunities.
For example, this Budget dedicates $14 million towards securing an international investor in Mackay Sugar Limited to secure more than 800 jobs on top of the proposed private investment of $120 million.
Tourism
Mr Speaker,
Queensland is a tourism state.
Tourism numbers in our state are at an all-time high. We have seen record highs in international visitor numbers, with nearly 2.8 million visitors spending $6 billion in Queensland.
14
Queensland’s tourism is thriving by offering new experiences – and more visitors than ever have fallen in love with our natural beauty and cherished lifestyle.
That’s how we have created thousands of tourism jobs, investing in direct flights from key locations in Asia whose people want to come straight to Queensland.
Our Budget again invests in a wide range of initiatives to attract tourists to Queensland and support jobs.
From the South East Corner, to the Outback we have our plan for jobs in tourism, backing it in with a more than $600 million investment in major events, programs and projects, including:
| | • | | Completing the Wangetti Trail |
| | • | | The rejuvenation of Great Barrier Reef Island Resorts |
| | • | | Outback tourism infrastructure, including an investment in a new glass bridge spanning the Cobbold Gorge |
| | • | | The rejuvenation of Airlie Beach |
| | • | | Infrastructure for Great Keppel Island |
| | • | | Premium ecotourism facilities on Whitsunday Island |
| | • | | The continuation of the World Science Festival; and |
| | • | | Funding for exclusive Queensland blockbuster exhibitions. |
15
Payroll tax relief
Mr Speaker,
Queensland is the place to do business.
What we have achieved as a state – in our emerging and traditional industries – we have achieved in partnership with business.
We know that the private sector creates most jobs in our economy.
And more than four in ten private sector workers in the state work in small and medium businesses. These businesses are the beating heart of our economy.
Small and medium-sized enterprises make up more than 99 per cent of all businesses in this state.
And if even one in five of them was able to employ just one extra person, that would be more than 80,000 new jobs.
That is why a centrepiece of this Budget is help for small and medium sized businesses, especially in the regions.
Today, I announce a payroll tax relief package worth $885 million to assist small and medium sized businesses to create jobs for Queenslanders.
16
From July, the exemption threshold for payroll tax will be increased for all Queensland businesses from $1.1 million to $1.3 million.
This will mean 1,500 additional businesses will no longer pay any payroll tax.
Queensland’s new tax-free threshold for business is double Victoria’s.
This means a business in Queensland can employ twice as many people – and operate at twice the size of a business in Victoria – before paying a single dollar in payroll tax.
As well, regional business who employ 85 per cent or more local workers will receive a payroll tax discount of 1 per cent off the set rate.
Our combined payroll tax threshold increase and the regional discount will mean an estimated 13,000 businesses are better off.
This demonstrates our continued determination to create jobs in regional communities.
17
Mr Speaker,
We will also keep our Back to Work incentive program which has provided support to more than 9,000 Queensland businesses who have been able to take on 19,000 previously unemployed Queenslanders.
And to further help address youth unemployment, the 50 per cent payroll tax rebate for apprentices and trainees – due to expire on June 30 – will be extended to June 2021.
Since the scheme started in 2015, more than 5,300 businesses have claimed a total of $76 million.
In addition to payroll tax relief and Back to Work programs, we are driving down electricity costs for regional businesses.
The latest Queensland Competition Authority decision will see energy prices drop by almost 6 per cent for regional small businesses and 4.4 per cent for regional households.
This is a direct result of this Governments facilitation of renewable energy generation into the grid right across our state.
18
Health
Mr Speaker,
As I have said, budgets are about choices.
We have chosen to stay the course on our economic plan to create jobs.
And we are staying the course on building – not cutting – our frontline services.
In 2015 Queenslanders made the choice to stop the LNP’s cuts and we have rebuilt the services the previous Government stripped away.
In health we have employed almost 6,000 nurses, more than 2,000 doctors and 500 ambulance officers to provide frontline health services for Queenslanders across the state.
This Budget provides a more-than $18 billion operating budget for Queensland Health and more than $770 million in capital investments to help keep Queenslanders healthy.
Regional hospitals in Roma and Gladstone will receive $78 million for redevelopments that support local jobs and improve healthcare for our regions.
19
Community helicopter providers like CareFlight will receive more than $58 million to help rapidly transport our most critically ill patients.
There will be even better mental health care at Hervey Bay and Maryborough Hospitals, along with new MRI and CT scanning equipment for Redcliffe Hospital.
And this Budget commits $80 million over four years for a range of initiatives under the Shifting Minds Suicide Prevention Flagship program.
Mr Speaker, tragically, too many young Indigenous Queenslanders are taking their own lives.
Of this $80 million investment, the Palaszczuk Government will direct almost $7 million toward the specific circumstances of Indigenous mental health and wellbeing.
Education and training
Mr Speaker,
Good education and training transforms lives by unlocking opportunity.
And it transforms the economy by creating a future-ready workforce.
20
The Palaszczuk Government has:
| | • | | mandated that apprentices or trainees make up at least 15 per cent of the workforce on large-scale Government projects. |
| | • | | provided a payroll tax rebate for businesses that take on apprentices |
Never forget those four words:
Labor. Made. TAFE. Free.
And we have restored education services previously cut.
In this Budget we again deliver a record investment in education and training.
We are increasing our investment in education infrastructure by a massive 80 per cent on last year’s budget.
This means better and new schools, with world class learning environments and facilities.
We have committed an additional $30 million over two years to support universal access for kindergarten in the year before school.
21
Mr Speaker, we know that early intervention can make all the difference to how a life is led.
That’s why this Budget continues our commitment to vulnerable youth.
In addition to our historic $330 million youth justice package, we will support at-risk young people through the expansion of our FlexiSpace program.
This program provides support to keep at-risk young people engaged in learning. Our $17 million investment over coming years will see this program expanded to up to 52 state schools across the state.
Mr Speaker, it’s hard to learn on an empty stomach. That’s why we will fund Foodbank to expand their proven school breakfast program to an additional 70 schools throughout our state.
Climate change, natural disasters, renewable energy
Mr Speaker,
This has been another tough year for Queenslanders enduring extreme weather events.
In the long term, there is no greater threat to job creation than climate change.
22
And it is places like Queensland – where regional jobs matter so much – that stand to lose the most.
You only have to look at the natural disasters that have hit our communities and our Budget over the past year to see the very real impact we are facing.
The bushfires in Central Queensland in November last year.
The unprecedented February flood events in Townsville and the North.
We think of our farmers in areas like Cloncurry, Normanton and Julia Creek, who battled drought for years to keep their farms productive.
And how their happiness at the first sight of rain turned to devastation as their stock was wiped out by the deluge.
We remember Cyclone Trevor hitting our communities in the Cape York Peninsula hard.
Then crossing the coast further south as a low-pressure system, flooding our communities in Central and Western Queensland.
Communities like Barcaldine, Tambo and Longreach.
23
As Queenslanders we take pride in the fact that we band together in times like this – we lend a helping hand to those in need.
And Queenslanders know better than anyone how these events devastate the economy and damage the Budget bottom line.
All told, 84 disasters in the past decade have now caused more than $15 billion in damage to public infrastructure.
Including an estimated $1.3 billion in damage since November 2018 alone.
So that is reality today. Extreme weather events already cost us through direct government expenditure, lost revenue and lost production.
We are paying the price of climate change right now. And it will only grow over time.
So because of the environmental emergency unfolding over decades, the Government has an immediate economic responsibility.
We must act to mitigate the climate risk to the state’s economy and the livelihoods of Queenslanders.
24
We must heed calls from business leaders within our economy – from energy and mining to retail, insurance and finance.
We must not ignore warnings from the Reserve Bank of Australia.
In March, Deputy Governor of the RBA, Guy Debelle, warned of the serious consequences of climate change to our economy when he said:
“… the physical impact of climate change and the transition are likely to have first-order economic effects … [including] … challenges for financial stability…”.
Mr Speaker,
In short, if we don’t act now, climate change will cut jobs and growth, lift prices and inflation, and destabilise our insurance and banking systems.
The problem is environmental and economic, urgent and important.
In response, our leadership must be global and local.
25
And that’s why we are pursuing a range of initiatives to lower emissions and create more renewable energy.
For example, next financial year, the Government’s renewable and low-emissions electricity generator – CleanCo – will begin operating and trading in the national electricity market.
CleanCo will assist in the provision of a cleaner, more affordable, sustainable and secure energy supply for Queensland.
Alongside the Government’s existing generation businesses, CleanCo will play a key role in the Government’s commitment to generate 50 per cent of the state’s energy from renewable sources by 2030.
As always, Queensland will carry its weight.
We will do our part.
Canberra
And Mr Speaker,
That’s what makes Canberra’s treatment of Queensland all the more disappointing.
26
As we struggle with natural disasters and the challenges of funding the needs of a growing state, the Federal Government is intent on being a ball and chain around our ankle.
Mr Speaker, this Government was not counting on a federal Labor win at the recent election.
But we cannot underestimate the impact of what another term of a Morrison LNP Government means for our state.
Less investment in Queensland’s infrastructure.
Less for our schools and hospitals and other services.
And less revenue from GST.
Let’s take the GST distribution, for example.
The Federal Government earlier this year announced a new approach to distributing GST revenues to the states.
As a result of these changes – and Mr Frydenberg’s directions to the Grants Commission – Queensland will be the only state to receive less in GST revenue next year than last year.
In fact, Queensland’s share of the GST has been slashed by $866 million as a direct result of interference by Canberra.
27
As a result of Canberra’s cuts, there will be an increase in land tax rates for companies and trusts of 0.25 per cent.
This change is forecast to raise $238 million over the forward estimates and apply only to land holdings over the value of $5 million.
Land tax rates for individuals will not change.
We will also bring the land tax absentee surcharge adjustment in line with NSW and Victoria. This will see an increase in the surcharge from 1.5 per cent to 2 per cent, along with a widening of the definition to include foreign companies and trusts.
The estimated revenue for this measure is $540 million over the forward estimates.
The measures will help buffer Queenslanders from Canberra’s rip-off.
Mr Speaker, the Government makes these land tax changes reluctantly.
And so I make this commitment.
28
If Canberra fixes the current bias in their GST calculations and returns what we are owed, we will repeal these land tax measures.
I urge Queensland business to lobby their State and Federal LNP Members of Parliament.
Demand they return Queensland’s fair share of GST.
Petroleum Royalty
Mr Speaker, earlier I spoke of the achievement of creating an entire LNG industry from scratch.
This relatively new industry is providing jobs and economic prosperity for regional Queensland.
However, the current royalty regime has been in place essentially since the industry commenced operations 10 years ago.
A feature of the arrangements is that different organisations are operating under separately struck royalty arrangements.
We intend to review royalty arrangements with a view to levelling the playing field.
In the process we will also increase royalties overall by 2.5 per cent – to 12.5 per cent for petroleum.
29
This is still a very fair outcome for a global industry operating in an international market in circumstances where other royalty rates, for example Canada, are as high as 30 per cent.
We will bring industry and producers together to work out a new scheme which is fair for all and will get us the best outcome.
These resources are from our regions and it’s only fair that Queenslanders get a dividend. Our petroleum resources are in high demand, internationally and domestically.
The petroleum dividend returned to Queenslanders for their resources will be $476 million over the forward estimates.
CONCLUSION
Mr Speaker,
Let me conclude where I began.
Budgets are about choices.
The Palaszczuk Labor Government chooses to stay the course.
We do so because all of the evidence points to the fact our economic plan is working.
Our promise to Queenslanders was that we would not cut, sack and sell.
30
This Budget delivers on that promise.
We will continue our plan to back Queensland jobs and stand by our communities.
To invest in our regions and build critical infrastructure.
To grow and diversify our economy.
To encourage small and medium businesses to grow.
To deliver the frontline services Queenslanders rely upon.
And to never shy away from the tough challenges.
Mr Speaker, this is a Budget for all Queenslanders.
But particularly, this is a Budget for Queensland’s regions.
I commend the Bill to the House.
31
Queensland Budget 2019-20 Budget Speech Budget Paper No.1

Queensland Budget 2019-20
Budget Speech Budget Paper No.1
budget.qld.gov.au
QUEENSLAND BUDGET 2019–20
Budget Strategy and Outlook
Budget Paper No.2
budget.qld.gov.au
2019-20 Queensland Budget Papers
1. Budget Speech
2. Budget Strategy and Outlook
3. Capital Statement
4. Budget Measures
5. Service Delivery Statements
Appropriation Bills
Budget Highlights
The Budget Papers are available online at budget.qld.gov.au
© The State of Queensland (Queensland Treasury) 2019
Copyright
This publication is protected by the Copyright Act 1968
Licence
This document is licensed by the State of Queensland (Queensland Treasury) under a Creative Commons Attribution (CC BY 4.0) International licence.
In essence, you are free to copy, communicate and adapt this publication, as long as you attribute the work to the State of Queensland (Queensland Treasury). To view a copy of this licence, visit http://creativecommons.org/licenses/by/4.0/
Attribution
Content from this publication should be attributed to:
© The State of Queensland (Queensland Treasury) - 2019-20 Queensland Budget
Translating and interpreting assistance
The Queensland Government is committed to providing accessible services to Queenslanders from all cultural and linguistic backgrounds. If you have difficulty in understanding this publication, you can contact us on telephone (07) 3035 3503 and we will arrange an interpreter to effectively communicate the report to you.
Budget Strategy and Outlook
Budget Paper No. 2
ISSN 1445-4890 (Print)
ISSN 1445-4904 (Online)
Budget Strategy and Outlook 2019-20

State Budget
2019-20
Budget Strategy and Outlook
Budget Paper No. 2
Budget Strategy and Outlook 2019-20
Contents
| | | | | | |
Overview | | | 1 | |
| | |
1 | | Economic Plan – Backing Queensland Jobs | | | 11 | |
| | |
1.1 | | A plan to create jobs and drive economic growth across Queensland’s regions | | | 12 | |
1.2 | | Backing Queensland Jobs – key focus areas of the economic plan | | | 21 | |
| | |
2 | | Economic performance and outlook | | | 30 | |
| | |
2.1 | | International conditions | | | 31 | |
2.2 | | National conditions | | | 32 | |
2.3 | | Queensland conditions and outlook | | | 33 | |
2.4 | | Risks to the outlook | | | 43 | |
| | |
3 | | Fiscal strategy and outlook | | | 46 | |
| | |
3.1 | | Context | | | 47 | |
3.2 | | Key fiscal aggregates | | | 48 | |
3.3 | | Fiscal strategies | | | 52 | |
3.4 | | Achievement of fiscal principles | | | 64 | |
| | |
4 | | Revenue | | | 66 | |
| | |
4.1 | | Queensland Revenue Outlook | | | 67 | |
4.2 | | 2018-19 estimated actual | | | 69 | |
4.3 | | 2019-20 revenue by category | | | 70 | |
4.4 | | 2019-20 Budget initiatives | | | 71 | |
4.5 | | Queensland’s revenue trends | | | 74 | |
4.6 | | Taxation revenue | | | 77 | |
4.7 | | Grants | | | 84 | |
Budget Strategy and Outlook 2019-20
| | | | | | |
4.8 | | Royalty revenue | | | 85 | |
4.9 | | Sales of goods and services | | | 89 | |
4.10 | | Interest income | | | 90 | |
4.11 | | Dividend and income tax equivalent income | | | 90 | |
4.12 | | Other revenue | | | 91 | |
| | |
5 | | Expenses | | | 92 | |
| | |
5.1 | | 2018-19 estimated actual | | | 93 | |
5.2 | | 2019-20 Budget and out-years | | | 93 | |
5.3 | | Expenses by operating statement category | | | 94 | |
5.4 | | Operating expenses by purpose | | | 105 | |
5.5 | | Departmental expenses | | | 106 | |
| | |
6 | | Balance sheet and cash flows | | | 108 | |
| | |
6.1 | | Context | | | 109 | |
6.2 | | Balance Sheet | | | 110 | |
6.3 | | Cash flows | | | 116 | |
| | |
7 | | Intergovernmental financial relations | | | 117 | |
| | |
7.1 | | Federal financial arrangements | | | 118 | |
7.2 | | Australian Government funding to the states | | | 119 | |
7.3 | | Australian Government funding to Queensland | | | 120 | |
7.4 | | GST revenue | | | 120 | |
7.5 | | Payments to Queensland for specific purposes | | | 124 | |
7.6 | | State-local government financial relations | | | 130 | |
| | |
8 | | Public Non-Financial Corporations Sector | | | 134 | |
| | |
8.1 | | Context | | | 135 | |
8.2 | | Finances and Performance | | | 142 | |
Budget Strategy and Outlook 2019-20
| | | | | | |
| | |
9 | | Uniform Presentation Framework | | | 150 | |
| | |
9.1 | | Context | | | 150 | |
9.2 | | Uniform Presentation Framework financial information | | | 150 | |
9.3 | | Reconciliation of net operating balance to accounting operating result | | | 160 | |
9.4 | | General Government Sector time series | | | 160 | |
9.5 | | Other General Government uniform presentation framework data | | | 162 | |
9.6 | | Contingent liabilities | | | 166 | |
9.7 | | Background and interpretation of uniform presentation framework | | | 166 | |
9.8 | | Sector classification | | | 168 | |
9.9 | | Reporting entities | | | 169 | |
| |
Appendix A: Concessions statement | | | 173 | |
| |
Context | | | 173 | |
Focus | | | 173 | |
Explanation of scope | | | 174 | |
A.1 Concessions summary | | | 175 | |
A.2 Concessions by agency | | | 176 | |
A.3 Concessions by entity – Government-owned corporations | | | 201 | |
| |
Appendix B: Tax expenditure statement | | | 203 | |
| |
Context | | | 203 | |
Methodology | | | 203 | |
The Tax Expenditure Statement | | | 204 | |
Discussion of individual taxes | | | 206 | |
| |
Appendix C: Revenue and expense assumptions and sensitivity analysis | | | 210 | |
| |
Taxation revenue assumptions and revenue risks | | | 211 | |
Royalty assumptions and revenue risks | | | 212 | |
Budget Strategy and Outlook 2019-20
| | | | | | |
Parameters influencing Australian Government GST payments to Queensland | | | 213 | |
Sensitivity of expenditure estimates and expenditure risks | | | 213 | |
| |
Appendix D: Fiscal Aggregates and Indicators | | | 214 | |
Budget Strategy and Outlook 2019-20
Overview
The latest National Accounts show the Queensland Economy leads the mainland states and territories in terms of domestic economic growth in March quarter 2019, while Queensland’s 2¾% forecast growth in gross state product (GSP) in 2018-19 is expected to outpace forecast national gross domestic product (GDP) growth of 2¼%.
The underlying performance of the State’s economy has been strong due to the unwavering commitment and focus by the Government to drive own-source revenue, focus on jobs and deliver the infrastructure necessary to support private sector investment.
Queensland has a dynamic, diversified export economy. The Government has built a strong, sustainable and growing export capability which has delivered 13 consecutive months of record annual export totals, with the 12 months to April 2019 topping $85 billion. This is more than the total overseas goods exports of NSW and Victoria combined over the same period.
The top two export commodities in total export value were metallurgical coal ($37.4 billion) and liquefied natural gas (LNG, $15.2 billion). The LNG industry, which did not even exist in Queensland a decade ago, recorded more than twice the export value of thermal coal.
The 2019-20 Budget forecasts continuing strong growth for the coming financial year, with GSP forecast to grow by 3%.
However, in the face of this performance, national and global economic conditions have continued to deteriorate since late 2018 and forecasts indicate there will be a further weakening in global conditions. This uncertain external environment provides context for GSP growth to moderate to 23⁄4% over the forward estimates period beyond the 2019-20 financial year.
The Queensland Government will continue to use all levers at its disposal to drive economic growth and maintain a strong economy despite the loss of revenue due to the continual erosion of the State’s share of GST.
The impact of the Commonwealth’s GST reductions since the Mid Year Fiscal and Economic Review (MYFER) is taking $1.5 billion out of Queenslander’s pockets over the forward estimates. The actions taken by the Commonwealth Government have meant that Queensland is the only jurisdiction in the Commonwealth that will receive less GST revenue in 2019-20 than in the previous year. These challenges are in addition to the budget impact of natural disasters which occurred in the 2018-19 year with a total cost of $1.3 billion over the forward estimates.
While Queensland is unique in receiving less GST revenue, the impact of subdued activity in the housing market nationally has delivered a revenue reduction across many jurisdictions. In Queensland, transfer duties have been revised down by $1 billion since the Mid Year Fiscal and Economic Review over the forward estimates period. Despite facing these headwinds, segments of the State’s dwelling construction industry have held up well, with labour-intensive additions and alterations activity hitting a record high in March quarter 2019.
1
Budget Strategy and Outlook 2019-20
The net operating surplus for this year is almost $700 million higher than forecast in the 2018-19 Budget. The State has conservatively budgeted revenue outcomes and this trend has been replicated for the past three budget years.
Over the preceding three budgets, revenues have exceeded original budget forecasts by $7.3 billion. A continuation of this trend, of exceeding the 2019-20 Budget forecasts by 4%, would see an additional $2.4 billion in actual revenues above the level currently forecast for 2019-20.
The 2019-20 Budget maintains its consistently prudent approach to forecasting revenue growth and delivering on the fiscal principles of the Queensland Government.
Building on the successful strategies, initiatives and substantial investment implemented in the Government’s four previous budgets, the 2019-20 State Budget will continue to drive sustainable economic growth and create secure, well-paid jobs across all regions of Queensland.
Following the strong economic growth and 199,000 jobs created since 2015, ongoing solid jobs growth is forecast in Queensland over the four years to 2022-23.
In the face of a changing global landscape, Queensland’s businesses, industries, communities and regions continue to grow and adapt as the State successfully transitions to a more resilient and diversified economy.
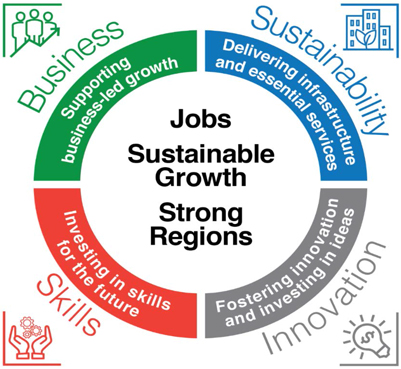
As Queensland’s economy continues to evolve and grow, the 2019-20 Budget and the Government’s economic plan will help create jobs across all regions of the State through an enhanced focus on:
| • | | supporting businesses and business-led growth |
| • | | delivering sustainable investment in productive infrastructure and essential services |
| • | | fostering the next wave of innovation and investing in ideas |
| • | | investing in skills and training for current and future generations of Queenslanders. |
Payroll tax initiatives – Supporting Queensland business and backing jobs
Queensland’s small, medium and growing businesses across all regions will benefit from a $885 million package of targeted payroll tax initiatives, making it easier for businesses to grow, invest and employ more Queenslanders.
Key elements of the package to be implemented in 2019-20 include:
| • | | an increased exemption threshold – rising from $1.1 million to $1.3 million, which will benefit employers with annual wages up to $6.5 million |
| • | | regional payroll tax discount – from 1 July 2019, a 1% payroll tax discount will apply for eligible employers with 85% of their employees outside of South East Queensland |
| • | | employment growth rebate – for two years from 1 July 2019, employers that have increased their number of full-time employees will be eligible for a rebate on the payroll tax paid on these additional employees |
2
Budget Strategy and Outlook 2019-20
| • | | extension of apprentice and trainee rebate – the Government is also extending the successful 50% payroll tax rebate for apprentices and trainees until 30 June 2021. Since the introduction of the rebate in 2015-16, over 5,300 businesses have claimed a total of $76 million in rebates. |
Growing our regions
The Queensland Government continues its commitment to building stronger regional economies by investing in transformative infrastructure to encourage industry development, investment, innovation, and creating secure and well paid regional jobs.
Close to 60% of the $12.9 billion capital works program in 2019-20 is to be delivered in regions outside of the Greater Brisbane area, supporting 25,500 jobs in those regions.
Other key initiatives in the 2019-20 Budget supporting economic growth and jobs across regional Queensland include:
| • | | ongoing funding of the $600 million Works for Queensland program to support job-creating maintenance and minor infrastructure works across regional Queensland |
| • | | transformative regional tourism infrastructure projects such as $41.4 million to develop the Wangetti Trail ecotourism walk from Palm Cove north to Port Douglas; and $25 million to help industry rejuvenate the Great Barrier Reef Island resorts |
| • | | $110 million over four years from 2019-20 to provide further support for the North West Minerals Province and to promote mining exploration and investment in the region; and the $193.5 million Townsville Port channel capacity upgrade |
| • | | a $70 million boost to Building our Regions, bringing total funding for the program to $515 million, of which $365 million is administered by the Department of State Development, Manufacturing, Infrastructure and Planning and $150 million is administered by the Department of Transport and Main Roads through their Transport Infrastructure Development Scheme |
| • | | an increased commitment of $25 million to the Jobs and Regional Growth Fund, bringing the total funding of this program to $175 million, to assist businesses and projects that will generate ongoing economic development and employment opportunities in regional Queensland. |
Investing in infrastructure
The $49.5 billion capital works program over four years outlined in the Budget will directly support private sector jobs, with the $12.9 billion capital works program in 2019-20 estimated to directly support 40,500 jobs across the State.
To further enhance the productive capacity of the State’s businesses, industries, communities and regions, the Government will deliver a $5.6 billion investment in transformative transport infrastructure in 2019-20. In addition, the energy and water portfolios will invest $2.7 billion in infrastructure in 2019-20 to support the ongoing delivery of safe, secure, reliable and cost-effective energy and water across the State.
3
Budget Strategy and Outlook 2019-20
Capital expenditure across the health portfolio is $777.7 million in 2019-20, including $78.6 million as part of the Enhancing Regional Hospitals program and $40.7 million as part of the Rural and Regional Infrastructure package. The Government’s Building Better Hospitals commitment includes projects at three major south-east Queensland hospitals with a combined value of $956.9 million.
The education portfolio’s capital expenditure totals $1.2 billion in 2019-20. This includes an additional $272.8 million for new schools and classrooms, and air-conditioning. The 2019-20 Budget includes increased funding of $532.6 million over seven years from 2018-19 to expand the Building Future Schools Fund to a total of $1.3 billion to deliver world class learning environments for children, including new primary, secondary and special schools opening in 2020 and 2021.
Other highlights of the Government’s capital works program include:
| • | | ongoing construction of the transformative Cross River Rail project, which will ease congestion, improve network reliability and increase heavy rail accessibility to the Brisbane CBD for all South East Queensland regions. The State Government has allocated $5.409 billion to the Cross River Rail, which will mean more trains, more often and turn-up-and-go transport for South East Queensland commuters |
| • | | major projects on the M1 Pacific Motorway, including the Varsity Lakes to Tugun and Eight Mile Plains to Daisy Hill projects, as well delivery of the Pacific Motorway/Gateway Motorway merge project, due for completion in 2020 |
| • | | several key projects on the Bruce Highway, aimed at improving safety, flood resilience and capacity along its 1,700km length. These projects, being delivered in partnership with the Australian Government, will also continue to support construction jobs across regional Queensland |
| • | | several major infrastructure projects to support the Government’s commitment to preventing offending and reoffending, and keeping young people out of courts and custody |
| • | | construction of the $152 million Smithfield Bypass project to improve safety and traffic flow for road users around the northern beaches of Cairns |
| • | | a $930.7 million investment in Townsville in 2019-20, contributing to the delivery of a number of significant productivity enhancing and job creating infrastructure projects in the region over the coming years, including: |
| | • | | $225 million Townsville water security project to address long-term water security needs |
| | • | | $193.5 million Stage 1 of the Townsville Port Expansion Project, to upgrade capacity of the Townsville Channel to allow access by larger vessels and boost trade at the Port of Townsville |
| | • | | completion of the $290 million North Queensland Stadium, a 25,000-seat stadium in Townsville, in time for the 2020 National Rugby League Premiership Season |
| | • | | $31.9 million Townsville (Pimlico) TAFE project to refurbish and expand training facilities |
| | • | | $25 million to help industry rejuvenate the Great Barrier Reef Island resorts and offer world-class experiences to visitors |
4
Budget Strategy and Outlook 2019-20
| | • | | $7.3 million in 2019-20 out of a $45.4 million total spend to rehabilitate and widen various sections of the Gregory Development Road for freight and productivity gains |
| | • | | $6.7 million in 2019-20 out of a $44.4 million total spend to complete construction of the new North Shore State School. |
Increasing frontline services
To ensure all Queenslanders have access to world-class essential services, no matter where they live across the State, the Government continues to maintain record spending on delivery of health and education and training services.
The 2019-20 Budget allocates a record $18.5 billion for the provision of health services.
The 2019-20 Budget allocates a record $14.9 billion for education and training services.
An additional $847.9 million has been provided over five years for both capital investments and service provision in the justice system to keep Queensland’s communities safe.
The Budget also outlines the Government’s substantial ongoing investment in keeping our communities safe, protecting our environment for the future, supporting our Aboriginal and Torres Strait Islander communities and lowering the cost of living.
Investing in ideas and fostering the next wave of innovation
In the face of a changing global landscape, the Government is supporting businesses throughout the State to develop and adopt innovative approaches and seize new opportunities.
Advance Queensland, the Queensland Government’s $755 million flagship innovation program, continues to play a key role throughout the State in unlocking new opportunities to sustain and grow traditional industries while also helping to shape the development of emerging industries by fostering and supporting innovative ideas, research and technologies.
Highlights of the 2019-20 Budget that will foster and support adoption of the next wave of innovation by Queensland businesses and communities include:
| • | | additional funding of $19 million to establish an agenda for renewable hydrogen industry attraction and incentivisation to drive job creation, regional growth, and increased innovation and development, with Gladstone being a focus point for hydrogen development |
| • | | additional funding of $8.6 million over two years is provided for FibreCo to potentially make high speed and low-cost internet available to regional Queensland, with substantial additional funding provided for a range of other key telecommunications infrastructure to enhance community connectivity across regional Queensland. |
Skilling current and future generations of Queenslanders
With the number of employed persons in Queensland projected to surpass 2.6 million by 2022, the Palaszczuk Government is focused on providing people with the education, training and skills to access employment opportunities, including the jobs of the future.
5
Budget Strategy and Outlook 2019-20
The Budget includes several initiatives to support pre-school education and learning, including increased funding of $63.6 million over four years and $18.7 million ongoing to continue the provision of Early Childhood Development Programs, as well as $30.4 million over two years for the continued provision of universal access to kindergarten for children in the year before school.
The Government is providing increased funding of approximately $1.4 billion over calendar years 2019 to 2023 for Queensland state schools, as part of the five-year school funding agreement reached with the Australian Government in December 2018.
Further, significant commitments are made in the 2019-20 Budget to improve Queensland’s state schools, including $532.6 million over seven years to expand the Building Future Schools Fund and $251.3 million over three years for additional facilities at existing state schools experiencing enrolment growth.
The 2019-20 Budget also builds on the Government’s substantial existing investment in training and skills, through innovative initiatives such as the Micro-Credentialing Pilot and a Higher Level Apprenticeship Pilot to provide modern and flexible pathways to address current, emerging and future skills needs. Further targeted support is provided to disadvantaged groups, including mature-age jobseekers, through the $420 million Skilling Queenslanders for Work initiative to help them re-enter and stay in the workforce.
Since the Free TAFE initiative launched in August 2018, more than 6,000 students have started a new qualification, subject or module as part of their vocational education.
Further, the Government is continuing to deliver Free TAFE to help Year 12 graduates gain the training they need to develop skills in growing industry areas by covering the full cost of training in one of 160 high priority qualifications to ensure they get the skills to start their career.
Building the resilience of our communities impacted by natural disasters
The Government remains committed to rebuilding regional communities impacted by the North Queensland floods and other recent natural disasters. Key elements of the Government’s investment focused on improving existing infrastructure to improve the resilience of the State’s communities (with partial funding provided by the Australian Government) include:
| • | | a $242 million disaster funding package following the North and Far North Queensland Monsoon Trough |
| • | | ongoing funding as part of the Queensland Government’s $110 million commitment for extraordinary recovery and reconstruction projects following Severe Tropical Cyclone Debbie |
| • | | supporting drought-affected communities through continuation of the Drought Assistance Package by providing up to $74.6 million over four years. |
Economic Outlook
Queensland’s economy has continued to grow solidly. However, a range of global, national and local factors are expected to see Queensland’s Gross State Product (GSP) growth ease to 2¾% in 2018-19.
6
Budget Strategy and Outlook 2019-20
Global economic conditions have deteriorated substantially since early 2018, with a slowdown in China’s domestic economy, escalation of global trade tensions and uncertainty related to Brexit resulting in a slowing of global growth in late 2018. These trends have intensified in early 2019.
Nationally, the weaker global outlook and sharper than expected slowdown in the housing sector have led to an easing in domestic economic growth. Recent ABS National Accounts data confirmed this trend, with national GDP growing by only 0.4% (seasonally adjusted) in March quarter 2019, while Queensland recorded the strongest growth in state final demand (SFD) of all the mainland states and territories at 0.5% (seasonally-adjusted) for the same period.
An ongoing moderation in dwelling investment and the associated flow-on to consumption spending, as well as a moderation in business investment, are all contributing to the easing of growth in 2018-19.
The easing growth in 2018-19 also reflects the impact of the flooding event in North Queensland, which impacted many local communities. Losses in economic output from the floods are estimated to be around 1⁄4 percentage point of GSP, spread across 2018-19 and 2019-20.
GSP growth is forecast to strengthen to 3% in 2019-20, underpinned by a pick-up in domestic activity as business investment strengthens. From 2020-21 onwards, economic growth is expected to remain solid, at around 23⁄4% per annum, consistent with its longer-term capacity and with a more balanced contribution from all major components across the economy.
As reflected in the fiscal revenue forecasts, the softer global and national outlook, a sharper than expected slowdown in the housing sector and the moderation in employment growth are expected to have impacts on the growth in key Queensland government revenues, including GST, transfer duty and payroll tax.
The strong GSP growth in 2017-18 was accompanied by exceptional employment growth of 4.1%, the strongest growth in more than a decade and the largest annual rise (97,700 persons) in the State’s history. However, in line with more subdued domestic activity, employment is still expected to grow, but at more moderate rates of 1½% in 2018-19 and 1¼% in 2019-20.
As employment growth eases, the participation rate is expected to decline, and the unemployment rate is forecast to stabilise at around 6% in both years.
Beyond 2019-20, as domestic activity strengthens, jobs growth is expected to pick up to around 13⁄4%, while the unemployment rate is expected to edge lower to 53⁄4% by the end of the projection period.
7
Budget Strategy and Outlook 2019-20
| Overview Table 1 | Queensland economic forecasts/projections1 |
| | | | | | | | | | | | | | | | | | | | | | | | |
| | | Actual | | | Est. Act. | | | Forecasts | | | Projections | |
| | | 2017-18 | | | 2018-19 | | | 2019-20 | | | 2020-21 | | | 2021-22 | | | 2022-23 | |
Gross state product2 | | | 3.5 | | | | 23⁄4 | | | | 3 | | | | 23⁄4 | | | | 23⁄4 | | | | 23⁄4 | |
Nominal gross state product | | | 5.7 | | | | 6 | | | | 31⁄4 | | | | 31⁄2 | | | | 41⁄2 | | | | 43⁄4 | |
Employment3 | | | 4.1 | | | | 11⁄2 | | | | 11⁄4 | | | | 11⁄2 | | | | 13⁄4 | | | | 13⁄4 | |
Unemployment rate4 | | | 6.0 | | | | 6 | | | | 6 | | | | 6 | | | | 6 | | | | 53⁄4 | |
Inflation3 | | | 1.7 | | | | 13⁄4 | | | | 2 | | | | 21⁄4 | | | | 21⁄2 | | | | 21⁄2 | |
Wage Price Index3 | | | 2.2 | | | | 21⁄4 | | | | 21⁄4 | | | | 21⁄2 | | | | 21⁄2 | | | | 23⁄4 | |
Population3 | | | 1.7 | | | | 13⁄4 | | | | 13⁄4 | | | | 13⁄4 | | | | 13⁄4 | | | | 13⁄4 | |
Notes:
| 1. | Unless otherwise stated, all figures are annual percentage changes. |
| 2. | Chain volume measure (CVM), 2016-17 reference year. |
| 3. | Annual percentage change, year-average. |
| 4. | Per cent, year-average. |
Sources: ABS 3101.0, 6202.0, 6345.0, 6401.0 and Queensland Treasury.
8
Budget Strategy and Outlook 2019-20
Fiscal Outlook
The 2019-20 Budget demonstrates the Government’s commitment to supporting job creation, investing in the regions and delivering the infrastructure and frontline services Queensland needs, in a financially sustainable manner.
Net operating surpluses are projected in each year of the forward estimates. This is being achieved despite a reduction in Queensland’s share of GST revenue and downward revisions to transfer duty revenue. Across the forward estimates, the net operating balance is expected to improve as revenue growth outpaces expense growth with the gap widening each year from 2020-21 onwards.
A $49.5 billion capital program over four years will deliver infrastructure that supports economic growth across Queensland, enhances frontline services and provides employment opportunities. This level of investment will be partly funded through borrowings.
Even so, General Government borrowings as a share of revenue are expected to remain substantially below the peak level reached in 2012-13. The Government will continue to fund infrastructure investment while managing debt. This is being achieved while retaining strategic assets, such as electricity and water businesses, in public ownership.
In the Non-financial Public sector, which also includes the government-owned corporations, borrowings are expected to peak as a share of revenue in 2021-22, before declining in 2022-23.
9
Budget Strategy and Outlook 2019-20
The 2019-20 Budget incorporates adoption of a new accounting standard, which requires operating leases, such as office accommodation leases, to be recognised on the balance sheet as liabilities, despite there being no change in the State’s financial commitments. This new accounting standard has added $2.2 billion to lease liabilities, and therefore net debt, in the General Government Sector in 2019-20. For the Non-financial Public sector, the new accounting standard has increased liabilities and net debt, by $2.6 billion on adoption.
| Overview Table 2 | Key fiscal aggregates1 |
| | | | | | | | | | | | | | | | | | | | | | | | | | | | |
| | | 2017-18
Actual2
$ million | | | 2018-19
MYFER
$ million | | | 2018-19
Est. Act.
$ million | | | 2019-20
Budget
$ million | | | 2020-21
Projection
$ million | | | 2021-22
Projection
$ million | | | 2022-23
Projection
$ million | |
General Government Sector | | | | | | | | | | | | | | | | | | | | | | | | | | | | |
Revenue | | | 58,087 | | | | 59,002 | | | | 60,068 | | | | 60,387 | | | | 61,729 | | | | 63,583 | | | | 65,540 | |
Expenses | | | 56,335 | | | | 58,478 | | | | 59,226 | | | | 60,198 | | | | 61,416 | | | | 63,101 | | | | 64,753 | |
Net operating balance | | | 1,753 | | | | 524 | | | | 841 | | | | 189 | | | | 313 | | | | 483 | | | | 787 | |
PNFA3 | | | 5,127 | | | | 5,981 | | | | 6,060 | | | | 6,727 | | | | 7,125 | | | | 7,963 | | | | 6,179 | |
Fiscal balance | | | (586 | ) | | | (2,632 | ) | | | (2,677 | ) | | | (3,527 | ) | | | (3,667 | ) | | | (4,280 | ) | | | (1,731 | ) |
Borrowing with QTC4 | | | 29,256 | | | | 30,610 | | | | 29,933 | | | | 32,781 | | | | 35,218 | | | | 40,174 | | | | 42,589 | |
Leases and similar arrangements5 | | | 2,152 | | | | 2,557 | | | | 2,623 | | | | 5,824 | | | | 7,071 | | | | 6,943 | | | | 6,966 | |
Securities and Derivatives | | | 122 | | | | 75 | | | | 122 | | | | 122 | | | | 122 | | | | 122 | | | | 122 | |
Non-financial Public Sector Borrowing with QTC | | | 66,964 | | | | 68,774 | | | | 68,141 | | | | 71,954 | | | | 75,413 | | | | 80,645 | | | | 82,972 | |
Leases and similar arrangements | | | 2,152 | | | | 2,557 | | | | 2,623 | | | | 6,217 | | | | 7,430 | | | | 7,266 | | | | 7,254 | |
Securities and Derivatives | | | 405 | | | | 278 | | | | 671 | | | | 544 | | | | 502 | | | | 492 | | | | 492 | |
Notes:
| 1. | Numbers may not add due to rounding. Bracketed numbers represent negative amounts. |
| 2. | Reflects published actuals. |
| 3. | PNFA: Purchases of non-financial assets. |
| 4. | Queensland Treasury Corporation. |
| 5. | This includes adoption of new accounting standard AASB 16 Leases. |
10
Budget Strategy and Outlook 2019-20
| 1 | Economic Plan – Backing Queensland Jobs |
Features
| • | | Queensland’s businesses, industries, communities and regions continue to grow and adapt as the State successfully transitions to a more resilient, diversified economy in the face of a changing global landscape. |
| • | | Queensland is not immune from the global forces shaping our economy – from technology to climate change to the changing nature of work in the future. This is what businesses in the private sector – from mining to agriculture, to financial services – are already adapting to: so too must the State’s economic strategy. |
| • | | Jobs and growth in the future will require our economy to: |
| | • | | diversify more and embed technologies better |
| | • | | train our people in new skills and in different ways |
| | • | | tailor our products and services to better meet the demands of Australian and global consumers. |
| • | | As the State’s economy continues to evolve and grow, creating jobs now and into the future remains at the heart of the Government’s economic plan – a plan that will ensure all Queenslanders, across all regions, benefit from the opportunities that current and future economic and jobs growth will deliver. |
| • | | Leveraging off the successful initiatives and investment in the Government’s four previous budgets, the 2019-20 Budget will continue to create secure, well-paid jobs and drive sustainable economic growth across all the State’s regions through an enhanced focus on: |
Supporting businesses and business-led growth Delivering sustainable investment in productive infrastructure and essential services Fostering the next wave of innovation and investing in ideas Investing in skills and training for current and future generations of Queenslanders.
| • | | Building on the 199,000 jobs created since 2015, ongoing solid jobs growth in Queensland is forecast over the four years to 2022-23. This growth is underpinned by the Government’s commitment to provide Queensland’s businesses with the confidence they need to grow, invest, innovate, export and employ. |
| • | | The gap between the regional and South East Queensland unemployment rates has continued to narrow, from 2.5 percentage points in mid-2016 to 0.7 percentage points over the year to April 2019. The Budget builds on this with further incentives and investments to drive jobs growth across Queensland, especially in regional Queensland. |
| • | | The 2019-20 Budget will see thousands of businesses across all areas of the State benefit from a $885 million payroll tax package, a boost to the Back to Work jobs program, increased funding for key business attraction and investment programs and a range of other initiatives to promote growth in key industries and priority sectors. |
11
Budget Strategy and Outlook 2019-20
| • | | Queensland remains highly competitive in terms of payroll tax and in terms of taxation per capita – in order to attract business and skilled people to our State. |
| • | | The Budget features a $49.5 billion investment in productivity-enhancing capital works over four years, delivering critical economic and social infrastructure and jobs across all regions. The $12.9 billion capital works program in 2019-20 will directly support 40,500 jobs across the State, with close to 60% of the 2019-20 capital works, estimated to support 25,500 jobs, to be delivered in regions outside of the Greater Brisbane area. |
| • | | The Budget also outlines ongoing and increased funding for a range of programs to support tens of thousands of jobs in key regional industries, including mining, agriculture, tourism, and emerging sectors supporting regional jobs. |
| • | | Record spending on health and education, and ongoing investment in schools, hospitals and other social infrastructure will ensure provision of world-class health, education and training services, as well as the justice services needed to keep communities safe and protect Queenslanders. This investment will help Queenslanders in all regions access secure, well-paid jobs and enjoy an improved quality of life. |
| 1.1 | A plan to create jobs and drive economic growth across Queensland’s regions |
A range of economic, social, demographic and environmental factors continue to impact the global economy, including: technological advancements; growth of knowledge-based industries; demographic change including ageing of the population; increased environmental concerns, including the impacts of severe weather events; and instability and uncertainty in global markets.
In the face of this changing global landscape, Queensland’s businesses, industries, communities and regions continue to grow and adapt as the State continues to successfully transition to a more resilient, diversified economy.
To continue the State’s growth and create jobs into the future, the Queensland Government understands the need to diversify the economy to meet the changing needs of the global economy and equip people with the skills they need.
The Queensland Government’s economic plan (see Figure 1.1 below), including the key initiatives outlined in the 2019-20 Budget, will continue to create secure, well-paid jobs and drive sustainable economic growth, including the ongoing growth of the State’s regional economies, through an enhanced focus on four key objectives:
| • | | Supporting businesses and business-led growth – to attract more businesses and private sector activity, and embed new technologies to meet changing consumer and investor needs |
| • | | Delivering sustainable investment in productive infrastructure and essential services – to improve our wellbeing and lower the transaction costs of doing business |
12
Budget Strategy and Outlook 2019-20
| • | | Fostering the next wave of innovation and investing in ideas – to modernise our businesses and create the next wave of businesses engaging in new markets |
| • | | Investing in skills and training for current and future generations of Queenslanders - to boost employment and incomes. |
| Figure 1.1 | Backing Queensland Jobs |
| 1.1.1 | Creating secure, well paid jobs |
Since January 2015, the Queensland Government’s priority has been creating jobs and improving labour market outcomes across all regions of Queensland, including for the State’s young people and disadvantaged jobseekers.
Over this period, 199,000 new jobs have been created across the State in trend terms, while the State’s unemployment rate has improved, from 6.6% in January 2015 to 5.9% in April 2019. This is despite a slowdown in the national economy which has seen annual GDP growth slow to only 1.8% (seasonally adjusted) in the year to March quarter 2019 and prompted the Reserve Bank of Australia to cut the cash rate for the first time in almost three years.
Importantly, labour market conditions in many key regions have strengthened over recent years. As highlighted in Chapter 2, Chart 2.5, the gap between unemployment rates in regional Queensland and South East Queensland has narrowed significantly over the last two years.
13
Budget Strategy and Outlook 2019-20
In line with the Government’s focus on creating jobs for the future, youth employment has also grown steadily over recent years, with 17,900 youth jobs created and the State’s youth unemployment rate falling by 1.5 percentage points since January 2015.
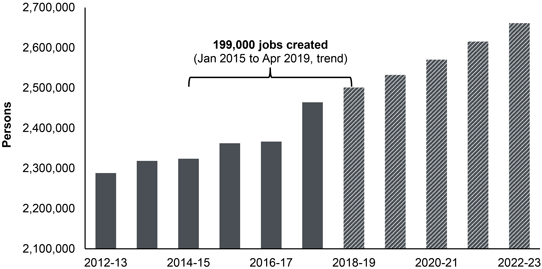
Building on the Government’s strong track record of job creation, ongoing solid jobs growth in Queensland is forecast over the four years to 2022-23 (see Chart 1.1 below).
| Chart 1.1 | Total employment, Queensland1 |
Note:
| 1. | 2018-19 to 2020-21 are forecasts; 2021-22 and 2022-23 are projections. Bars are in year average terms. Trend jobs growth and forecast jobs are not directly comparable. Jobs created reflects net additional jobs. |
Sources: ABS 6202.0 and Queensland Treasury.
Key Palaszczuk Government initiatives are directly assisting Queenslanders secure well paid jobs. For example, the Jobs and Regional Growth Fund and Advance Queensland Industry Attraction Fund, which has successfully attracted the multimillion-dollar Qantas pilot training academy to Toowoomba, are attracting and supporting businesses and projects that are creating ongoing jobs across the State, including in our regional economies.
To maintain this momentum, the 2019-20 Budget includes a suite of new initiatives and increased funding to support business growth and create additional job opportunities, as well as investing in the skills and training needed to ensure jobseekers can capitalise on those opportunities.
Queensland’s small, medium and growing businesses across all regions will benefit from the $885 million payroll tax package, making it easier for businesses to grow, invest and employ more Queenslanders.
14
Budget Strategy and Outlook 2019-20
The $49.5 billion capital works program over four years outlined in the Budget will directly support many tens of thousands of private sector jobs across the State. The $12.9 billion capital works program in 2019-20 alone is estimated to directly support 40,500 jobs, with 25,500 of these jobs in regions outside the Greater Brisbane area.
The Queensland Government’s Our Future State: Advancing Queensland Priorities, identified Creating jobs in a strong economy as one of its six priorities and highlighted the importance of supporting jobs across the State through key Budget initiatives.
| 1.1.2 | Driving sustainable economic growth |
Sustainable economic growth is essential to increase and maintain secure long-term employment opportunities, thereby increasing prosperity, incomes and living standards.
Aligned with the State’s strong jobs growth since 2015 and the Government’s ongoing focus on supporting growth across all sectors and regions, the State’s economy grew by 2.7% per year on average over the four years to 2018. This is stronger than the 2.6% per annum growth in the rest of Australia over the same period.
Queensland’s strong economic performance has been underpinned by a range of factors, including the State’s trade sector, with the value of the State’s overseas merchandise and services exports growing strongly and reaching record levels.
| Box 1.1 | Queensland exports at record levels |
The value of Queensland’s total overseas goods and services exports exceeded $100 billion in 2018, with the value of both overseas goods and overseas services exports reaching record levels over the last year.
Queensland exported a record $85.2 billion worth of goods overseas in the 12 months to April 2019, a rise of $12 billion over the previous 12 months. This increase was driven primarily by higher prices and increased volumes of LNG and hard coking (metallurgical) coal exports.
This was the 13th consecutive record breaking month for annual Queensland exports and was more than the value of goods exported overseas from New South Wales and Victoria combined over the same period.
Further, Queensland’s key services exports such as tourism, education and business services, also continue to grow, with the latest Queensland State Accounts showing the value of overseas services exports totalled a record $18.5 billion in 2018.
Driven by key regionally-important industries including mining, agriculture and manufacturing, around 80 per cent of Queensland’s goods exports are shipped from the State’s regional ports.
The exceptional performance of Queensland’s goods and services exports over recent years is highlighted in Chart 1.2 below.
15
Budget Strategy and Outlook 2019-20
| Chart 1.2 | Overseas exports, Queensland, nominal |
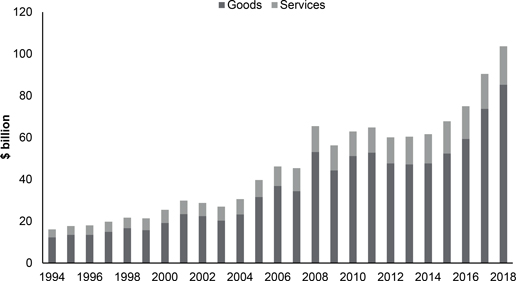
Source: Queensland Treasury (Queensland State Accounts).
In order to maintain this momentum and continue to drive sustainable growth across all regions, a key element of the Government’s focus is to optimise the use of Queensland’s natural resources.
By building on existing strengths and unlocking new opportunities, the resources sector will continue to deliver economic and social benefits for present and future generations, as well as supporting thousands of regional jobs.
The sustainable use and protection of the State’s natural environment is also critical to support ongoing growth in other key regional industries such as tourism. In 2018, the Tropical North Queensland and the Whitsundays regions alone attracted around 3.6 million international and domestic overnight visitors, injecting over $4.4 billion into the State’s economy. This is helping support around 53,000 tourism jobs more broadly across regional Queensland.
Importantly, the Government has implemented a number of key measures to protect the State’s world-renowned natural environment, including Queensland’s land, vegetation, waterways and the iconic Great Barrier Reef. The sustainability of our environment will deliver benefits for Queenslanders and the entire global community, as well as attracting millions of tourists from around the globe and generating tourism-related jobs for decades and generations to come.
Another key focus of the Government’s approach to driving sustainable economic growth is through the ongoing investment in its comprehensive waste management strategy, which will be instrumental in discouraging the disposal of waste to landfill, while generating investment in job-creating reuse, recycling, bioproducts and waste-to-energy industries.
16
Budget Strategy and Outlook 2019-20
Given the vital contribution of regional areas to Queensland’s overall economic growth and the ongoing diversification of the State’s economy, it is critical that sustainable growth is fostered and supported across all regions, as well as across key existing industries and emerging sectors. This will increasingly be necessary to build greater resilience in our industries, businesses and regions in the face of the headwinds, like more frequent natural disasters caused by climate change, and opportunities presented by new markets.
The 2019-20 Budget continues to build additional productive capacity through strategic infrastructure investment and a broad range of initiatives that will support sustainable business-led growth and investment across all sectors and regions of the State.
| 1.1.3 | Supporting the ongoing growth of our regions |
Regions outside of South East Queensland account for approximately one-third of the State’s total economic output and are home to around 28% of the State’s growing population.
More than 640,000 Queenslanders are employed in regional Queensland, including almost 70% of all agricultural jobs and two-thirds of all mining jobs across the State.
However, Queensland’s regional economies have also transitioned over time to become increasingly diverse, with health care and social assistance (83,400), retail trade (67,400), education and training (59,000), and construction (48,700) the largest employing industries outside of South East Queensland as of March quarter 2019.
Queensland’s industry structure varies significantly across regions, with key industries such as resources and agriculture, including the billions of dollars of exports they produce, comprising a much larger share of economic activity in regional areas than in South East Queensland.
Mining and agriculture combined comprised almost 40% of total gross regional product (that is, economic output) in regional Queensland in 2016-17, compared with less than 2% of economic activity in South East Queensland (see Chart 1.3 below).
Further, around 80% of Queensland’s goods exports were shipped from the State’s regional ports in 2017-18, highlighting the substantial contribution of our regions to the State’s flourishing trade sector.
In the year to April 2019, Queensland exported $37.4 billion of metallurgical coal, $15.2 billion of LNG, $10.6 billion of minerals and metals, $9.9 billion of agricultural products, $7.4 billion of thermal coal, and $4.7 billion of other merchandise exports, including manufactured goods.
Additionally, total tourism expenditure in regional Queensland was worth $9.2 billion in 2018, accounting for 38% of the total tourism expenditure in Queensland.
The Queensland Government clearly recognises the critical role the State’s regional economies play in driving sustainable growth, increasing prosperity, building resilience in the face of a changing global landscape and, most importantly, supporting ongoing growth in secure, highly skilled and well-paid jobs.
Central to the Government’s economic plan is providing all Queenslanders with incentives and transformative infrastructure, including improved connectivity of all communities, and the provision of essential services to communities across all areas of the State.
17
Budget Strategy and Outlook 2019-20
| Chart 1.3 | Industry structure, Regional Queensland and South East Queensland1 |
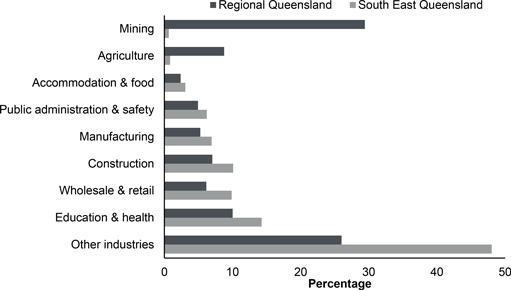
Note:
| 1. | Regional Queensland is defined as the summation of the following Statistical Area Level 4 (SA4) areas: Cairns, Darling Downs - Maranoa, Central Queensland, Mackay - Isaac - Whitsunday, Queensland - Outback, Townsville, and Wide Bay. South East Queensland comprises all remaining Queensland SA4s. |
Source: Queensland Treasury, 2016-17 estimates.
18
Budget Strategy and Outlook 2019-20
| Box 1.2 | Building stronger regional economies |
The Queensland Government continues its commitment to building stronger regional economies by investing in transformative infrastructure, encouraging industry development, investment, innovation, and creating secure and well paid regional jobs.
Some of the key existing and new initiatives supported in the 2019-20 State Budget include:
Investing in transformative regional infrastructure
Capital works – 60 per cent of the $12.9 billion capital works program in 2019-20 will be delivered in regions outside of the Greater Brisbane area, directly supporting 25,500 jobs in 2019-20.
Building our Regions – The 2019-20 Budget commits an additional $70 million to Building our Regions, bringing total funding for the program to $515 million, to support infrastructure projects that meet specific community needs and support enduring economic outcomes and job creation in regions.
Works for Queensland – This $600 million program, which commenced in 2016-17, supports regional councils to undertake job-creating maintenance and infrastructure projects.
Regional tourism infrastructure – Includes transformative projects such as the $193.5 million Townsville Port channel capacity upgrade; a total of $41.4 million to develop the Wangetti Trail ecotourism walk from Palm Cove north to Port Douglas; and $25 million to help industry rejuvenate the Great Barrier Reef Island resorts.
FibreCo Qld – Additional funding of $8.6 million over two years is provided to potentially make high speed and low cost internet available to regional Queensland. FibreCo Qld will utilise the existing Government infrastructure by unlocking spare capacity in government-owned fibre networks.
Other telecommunications infrastructure – Including additional funding of $26.9 million over two years from 2018-19 to upgrade the Queensland Fire and Emergency Services regional radio networks and equipment; $15 million through the Jobs and Regional Growth Fund to support the Sunshine Coast Council in delivering the Sunshine Coast International Broadband Submarine Cable network project; and a $3.4 million investment in South West Queensland Connectivity projects funded through the Building our Regions program to provide high-speed, reliable internet networks to communities in Balonne, Murweh, Bulloo, Paroo and Maranoa.
Supporting industry development, investment and innovation
North West Minerals Province – Building on the $39 million existing commitment, the 2019-20 Budget invests a further $110 million over four years from 2019-20 to provide further support for this important mining region.
Hydrogen Strategy – Additional funding of $19 million is provided to establish an agenda for renewable hydrogen industry attraction and incentivisation to drive job creation, regional growth, and increased innovation and development. Gladstone will be a focus point for hydrogen development, drawing on the skills and talents of the regions, particularly those involved in the LNG industry.
19
Budget Strategy and Outlook 2019-20
Jobs and Regional Growth Fund – Now totalling $175 million after an increased commitment of $25 million in the 2019-20 Budget, the fund assists businesses and projects that will generate ongoing economic development and employment opportunities in regional Queensland.
Great Barrier Reef – The 2019-20 Budget continues to support the Palaszczuk Government’s delivery of various commitments as part of the record $330 million, five-year allocation to protect the Great Barrier Reef, including measures to protect and maintain marine and island ecosystems and improve water quality and reduce nutrient runoff.
Natural Disaster Recovery – The Queensland Government has secured Australian Government matching funding for $254 million in extraordinary assistance under the jointly-funded Disaster Recovery Funding Arrangements. This includes a $242 million disaster funding package following the North and Far North Queensland Monsoon Trough; and $12 million to respond to the Central Queensland Bushfires. Preliminary estimates indicate the cost of recovery efforts related to the event is $1.3 billion over the forward estimates.
Drought Assistance Package and Queensland Drought Reform – Up to $74.6 million over four years is provided to support drought-affected regional communities.
Supporting small to medium regional businesses
Regional payroll tax discount – To support regional businesses and generate jobs, the Government is introducing, from 1 July 2019, a 1 per cent discount on the relevant payroll tax rate for businesses who have more than 85 per cent of their employees outside South East Queensland. Also available to regional business is the increase in the threshold to $1.3 million, training and apprentice rebate, and the new employee rebate.
Back to Work – $305 million regional component to give regional employers the confidence they need to take on eligible workers.
Under the Palaszczuk Government, more than $36 billion has been budgeted to fund capital projects in regions outside of Greater Brisbane over the five years to 2019-20. This equates to an average annual per capita spend of around $2,500 per person in regions outside of Greater Brisbane, compared with $1,900 per person in Greater Brisbane over this period.
Reducing the cost of living for people living in regional areas is another critical element of the Government’s economic plan. Under the Uniform Tariff Policy, the 2019-20 Budget allocates $498 million to offset energy costs and ensure electricity prices in regional Queensland do not exceed prices in South East Queensland. The Budget also provides an additional $14.3 million over two years to continue the Local Fare Scheme, subsidising the costs of airfares for residents of regional and remote Queensland travelling to neighbouring communities.
The 2019-20 Budget also provides record funding for the provision of essential services and additional support for the State’s most vulnerable and disadvantaged. This funding will support safer, healthier communities across all regions of the State, including in rural and remote Aboriginal and Torres Strait Islander communities.
20
Budget Strategy and Outlook 2019-20
| 1.2 | Backing Queensland Jobs – key focus areas of the economic plan |
Building on the successful strategies, initiatives and investment announced in the Government’s four previous Budgets, the economic plan and 2019-20 Budget will continue to create secure, well-paid jobs and drive sustainable economic growth, including the ongoing growth of strong regional economies.
| 1.2.1 | Supporting business and business-led growth |
A strong and competitive private sector, aligned with Queensland’s economic strengths and comparative advantages, is critical to drive sustainable economic and jobs growth.
Business is the growth engine of the Queensland economy, with the private sector accounting for around 84% of total employment and around 76% of total economic activity.
The private sector also produces the vast majority of Queensland’s merchandise and services exports. Therefore, the ongoing growth of Queensland businesses is critical to create and support employment in the trade sector, which is estimated to directly support one in every five jobs in Queensland.
Small and medium sized businesses (SMEs) are key contributors to private sector growth and employment across all regions of the State, with SMEs accounting for around 99% of total employing businesses and providing more than two thirds of all jobs in Queensland.
Small businesses account for 94% of total employing businesses in Queensland and are estimated to make up around 44% of total private sector employment in Queensland.
Building on Queensland’s reputation as one of the most competitive tax destinations in Australia for businesses to locate and expand, the 2019-20 Budget outlines a $885 million payroll tax package that provides targeted incentives for businesses across the State, particularly small, medium and growing businesses in regional areas, to invest, expand and create jobs.
Key elements of the package to be implemented in 2019-20 include: raising the payroll tax exemption threshold to $1.3 million, a 1% discount on the relevant payroll tax rate for businesses who have more than 85% of their employees outside South East Queensland, and a rebate of the payroll tax on additional employees that businesses can demonstrate they have employed over and above their level of full time employees from 1 July 2019 until 30 June 2021.
The Government is also extending the successful 50% payroll tax rebate on the exempt wages of apprentices and trainees until 30 June 2021. Since the introduction of the rebate in 2015-16, over 5,300 businesses have claimed a total of $76 million in rebates.
Further, the Budget provides increased funding of up to $14 million for the flagship Back to Work program, bringing the total program to $383 million, to ensure businesses in both regional Queensland and targeted areas of South East Queensland have the confidence to take on an eligible new employee. Since its inception in 2016-17, the Back to Work program has supported over 9,200 businesses to employ more than 19,000 persons.
21
Budget Strategy and Outlook 2019-20
The Back to Work program also predominantly benefits small businesses, with 77% of total firms accessing payments through the initiative employing less than 20 employees.
The 2019-20 Budget includes an additional $70 million in funding to boost the Government’s key business attraction and investment programs, comprising an additional $45 million for the $150 million Advance Queensland Industry Attraction Fund and an extra $25 million for the $175 million Jobs and Regional Growth Fund. This funding boost will continue to encourage businesses to establish and expand in Queensland, thereby boosting investment and creating new job opportunities across Queensland and its regions.
To support businesses in the tourism industry, the Budget allocates an additional $48 million to Tourism and Events Queensland and $17 million to create Indigenous jobs and business growth through Indigenous tourism development, Global Tourism Hubs and Ecotourism Trails. The Budget also allocates increased funding of $35.7 million for the Production Attraction Strategy to support the growth of the State’s world-renowned film and television industry and create job opportunities in this growth sector.
The Budget also builds on the existing Advancing Small Business Queensland Strategy 2016-2020 by committing an additional $4 million in grant funding, bringing the total commitment under the Strategy to $26.2 million.
In addition to this Strategy, the Government continues to reduce the cost of doing business through ongoing implementation of regulatory reform initiatives which should support growth and jobs over the coming years.
| 1.2.2 | Sustainable investment in infrastructure and essential services |
The Government recognises that investment in productive infrastructure and essential services is critical for keeping pace with global changes, and for unlocking economic and employment opportunities now and into the future. Well-targeted sustainable public investment acts as a catalyst for driving private sector investment and economic growth, as well as ensuring safe, healthy and thriving communities.
The Government’s investment in transport, schools, roads, hospitals, technology and other vital infrastructure will position the Queensland economy for the future, while ensuring current and future generations of Queenslanders continue to have access to world-class health and education services.
22
Budget Strategy and Outlook 2019-20
In 2019-20, the Government will deliver a $5.6 billion investment in transformative transport infrastructure. To further help enhance the productive capacity of the State’s businesses, industries, communities and regions, the energy and water portfolios will invest $2.7 billion in infrastructure in 2019-20 to support the ongoing delivery of safe, secure, reliable and cost-effective energy and water across the State.
Capital expenditure across the health portfolio is $777.7 million in 2019-20, including $78.6 million as part of the Enhancing Regional Hospitals program and $40.7 million as part of the Rural and Regional Infrastructure package. Additionally, the Government’s Building Better Hospitals program includes projects at three major south-east Queensland hospitals with a combined value of $956.9 million including the redevelopment of the Caboolture Hospital, expansion of the Logan Hospital and maternity ward and staged redevelopment of the Ipswich Hospital.
The education portfolio’s capital expenditure totals $1.2 billion in 2019-20. This Budget includes increased funding of $532.6 million over seven years from 2018-19 to expand the Building Future Schools Fund to a total of $1.3 billion to deliver world class learning environments for children, including new primary, secondary and special schools opening in 2020 and 2021.
In total, the 2019-20 Budget invests more than $49.5 billion in productivity-enhancing infrastructure projects, with the Government’s capital works program expected to directly support 40,500 jobs in 2019-20. Importantly, 25,500 of these jobs are in regions outside of the Greater Brisbane area (see Chart 1.4 below).
| Chart 1.4 | Jobs supported by capital works outside Greater Brisbane, 2019-20 |
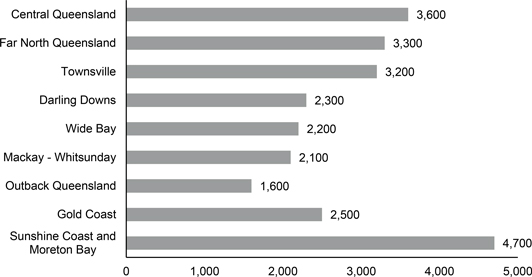
Number of jobs supported
Source: Queensland Treasury.
23
Budget Strategy and Outlook 2019-20
To ensure all Queenslanders have access to world-class essential services, the Government continues to maintain record spending on delivery of health and education and training services, as well as a substantial investment in keeping our communities safe, protecting our environment for the future, supporting our Aboriginal and Torres Strait Islander communities and lowering the cost of living for all Queenslanders.
The 2019-20 Budget allocates a record $18.5 billion for the provision of health services and $14.9 billion for education and training services in 2019-20. In addition, a further $847.9 million over five years is allocated for both capital investments and service provision in the justice system to keep Queensland’s communities safe.
This investment will not only ensure access to critical health and education services in the short term, but will enable all Queenslanders to increase their economic participation and improve their potential to earn higher incomes.
The Queensland Government is also taking strong action to put further downward pressure on electricity prices and secure Queensland’s clean energy supply. Ensuring reliable and affordable energy is critical to supporting the competitiveness of Queensland’s industries and businesses, and households’ economic welfare. The Government’s Queensland Renewable Energy Target (QRET) and focus on sustainable and reliable energy can also attract investment funds and new businesses, drive exports, and create new jobs into the future.
Ongoing funding flowing through to Queensland households and businesses as part of the $1.16 billion Powering Queensland Plan and the broader $2 billion Affordable Energy Plan will ensure Queenslanders have access to affordable, secure and sustainable energy.
Further, the Government has recently established a new clean energy government-owned corporation, CleanCo, which will put ongoing downward pressure on electricity prices and help grow investment and jobs in the renewable energy sector. The Government will also invest an additional $250 million over 2019-20 and 2020-21 to progress the development of new public renewable energy generation assets.
The 2019-20 capital program includes a $930.7 million investment in Townsville, contributing to the delivery of a number of significant productive enhancing and job creating infrastructure projects in the region over the coming years, including:
| • | | $225 million Townsville water security project to address long-term water security needs |
| • | | $193.5 million Stage 1 of Townsville Port Expansion Project, to upgrade capacity of the Townsville Channel to allow access by larger vessels and boost trade at the Port of Townsville |
| • | | completion of the $290 million North Queensland Stadium, a 25,000-seat stadium in Townsville, in time for the 2020 National Rugby League Premiership Season |
| • | | $31.9 million Townsville (Pimlico) TAFE project to refurbish and expand training facilities |
| • | | $25 million to help industry rejuvenate the Great Barrier Reef Island resorts and offer world-class experiences to visitors |
| • | | $7.3 million in 2019-20 out of a $45.4 million total spend to rehabilitate and widen various sections of the Gregory Development Road for freight and productivity gains |
24
Budget Strategy and Outlook 2019-20
| | • | | $6.7 million in 2019-20 out of a $44.4 million total spend to complete construction of the new North Shore State primary school. |
A key element of the Government’s capital program is providing grants to local governments and non-government organisations to support their work within communities across Queensland. In total, the Government will provide $1.599 billion in capital grants in 2019-20.
This includes an additional $70 million over four years for Building our Regions, bringing the total investment in Building our Regions to $515 million, and ongoing funding across all regional councils through the existing $600 million Works for Queensland program.
The Government also remains committed to rebuilding regional communities impacted by the North Queensland floods and other recent natural disasters. Key elements of the Government’s investment focused on improving existing infrastructure to improve the resilience of the State’s communities include (in conjunction with the Australian Government):
| | • | | a $242 million disaster funding package following the North and Far North Queensland Monsoon Trough |
| | • | | ongoing funding as part of the Queensland Government’s $110 million commitment for extraordinary recovery and reconstruction projects following Severe Tropical Cyclone Debbie |
| | • | | supporting drought-affected communities through continuation of the Drought Assistance Package by providing up to $74.6 million over four years. |
| 1.2.3 | Supporting the next wave of innovation |
As a key driver of increased productivity and enhanced business competitiveness, innovation is at the forefront of driving economic growth and the creation of new high value-added industries and jobs. A highly innovative economy will strongly position the State to most effectively address some of the challenges faced by Queenslanders both today and into the future and improve overall living standards for all Queenslanders.
Technological advancements continue to transform existing business models and create new opportunities for Queensland businesses. Meanwhile, markets for the State’s exports are evolving, both internationally on the back of growing prosperity in Asia, and domestically as consumers increasingly demand new and more tailored products.
In the face of this changing global landscape, the Government is supporting businesses throughout the State to develop and adopt innovative approaches and seize new opportunities.
Advance Queensland, the Queensland Government’s $755 million flagship innovation program, continues to play a key role throughout the State in unlocking new opportunities to sustain and grow traditional industries while also helping to shape the development of emerging industries by fostering and supporting innovative ideas, research and technologies.
Building on this success and to drive the next wave of innovation, the Government will be releasing a new innovation strategy, Building Our Innovation Economy, later this year.
Supporting the development of this new strategy, the 2019-20 Budget contains numerous measures that will promote innovation activity throughout the State now and into the future.
25
Budget Strategy and Outlook 2019-20
In addition to the wide range of innovation-related opportunities from ongoing funding through the Advance Queensland initiative, the Budget also provides funding of $25 million over four years to the Queensland Government Research Infrastructure Co-Investment Fund to support high-quality collaborative research and innovation in the State’s research sector.
Further, the 2019-20 Budget commits $19 million to develop the Queensland Hydrogen Industry Attraction and Development Strategy to build Queensland’s capacity in producing this important renewable fuel that is increasingly in-demand globally.
Additionally, $14 million has been allocated to support the Defence Cooperative Research Centre to develop drone and robotics technology for the Defence Force.
The Government is also contributing $9 million towards Queensland hosting the World Science Festival for a further two years, offering collaboration and networking opportunities for industry and boosting the State’s reputation as a world leader in science, technology and innovation.
These initiatives are aimed at ensuring traditional, emerging and new industries have the best possible chance to establish, grow and thrive in Queensland.
To support Queensland manufacturers to become more advanced and internationally competitive by adopting innovative processes and technologies, the 2019-20 Budget boosts the successful Made in Queensland program by allocating an additional $6 million over two years, taking the total value of the program to $46 million.
| 1.2.4 | Investing in skills and training for current and future generations of Queenslanders |
The world of work is always changing. Over recent decades, the global, national and Queensland labour markets have been transformed by forces such as increasing global integration, rapid improvements in information and communication technology, and significant social and demographic changes.
In response to this change, Queensland’s workers, businesses and industries have developed, adopted and embraced the new skills needed to operate more productively in both emerging and established occupations and industries.
In the years ahead, the State’s labour market and workplaces will continue to evolve as the Queensland economy adapts and transitions to a more diversified economy, in the face of factors such as increased automation and the continuing growth of Asia.
26
Budget Strategy and Outlook 2019-20
| Box 1.3 | Queensland’s growing skills base |
There is a global consensus among economists, academics and education specialists that a strong policy focus on education and training, and the resulting flexibility, adaptability and resilience it builds into the workforce, is essential to promote sustainable economic growth and increase productivity.
Just as importantly, ongoing skills development is critical to enable all Queenslanders to access and capitalise on employment opportunities, achieve higher incomes and improve their quality of life.
The benefits of education and training to individuals are clear. In 2015, in terms of average weekly personal income, Australian full-time workers with either one or two non-school qualifications respectively earned $372 and $667 more than full-time workers without non-school qualifications.1
There is also a recognition that a lifelong approach to education and training is critical. Where a single qualification may once have set up a person for a ‘job for life’ in a single industry, it is now becoming more common for individuals to have multiple jobs in multiple industries over their careers. This is amplified by the fact that people are generally working longer - the average age of retirement for recent retirees increased from 60 in 2005 to 62.9 in 2017.2
Over the past 20 years, the proportion of employed persons in Queensland who hold a post-school qualification has risen noticeably. In 1996, around 60 per cent of persons employed in the State did not hold a post-school qualification, with this proportion declining to less than half (48 per cent) in 2006 and lowering even further to just over one-third (36%) by 2016.
Over this same period, the proportion of persons holding a university-based qualification has risen from 14 per cent in 1996 to over one-quarter of all employed persons in Queensland by 2016. Meanwhile, the proportion of employed persons with a TAFE-based qualification increased from 27 per cent in 1996 to 38 per cent in 2016 (see Chart 1.5 below).
27
Budget Strategy and Outlook 2019-20
| Chart 1.5 | Proportion of employed persons by level of educational attainment, Queensland |
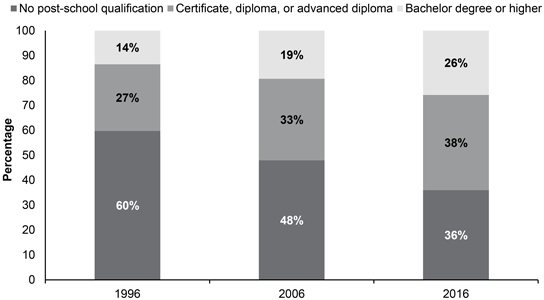
Source: ABS Census of Population and Housing (1996, 2006, and 2016).
Notes:
| 1. | ABS 4235.0 - Qualifications and Work, Australia, 2015 |
| 2. | ABS 6238.0 - Retirement and Retirement Intentions, Various |
This analysis helps illustrate the evolving skills base of the Queensland workforce over the past two decades, reflecting ongoing economic diversification and the range of different job opportunities across both traditional and emerging industries that have arisen during this period.
The Queensland Government is committed to giving Queenslanders of all backgrounds and ages the education, training and skills development opportunities they need to take part in the future economy. Reflecting the need for lifelong learning, the Queensland Government is investing in skills and training across all life stages, from early education to adulthood.
Improving the wellbeing of children prior to school is a key priority for the Government. The 2019-20 Budget includes several initiatives to support pre-school education and learning, including increased funding of $63.6 million over four years and $18.7 million ongoing to continue the provision of Early Childhood Development Programs, as well as $30.4 million over two years to support the continued provision of universal access to kindergarten for children in the year before school.
The Government is providing increased funding of approximately $1.4 billion over calendar years 2019 to 2023 for Queensland state schools, as part of the five-year school funding agreement reached with the Australian Government in December 2018.
28
Budget Strategy and Outlook 2019-20
The Government is continuing to deliver Free TAFE to help Year 12 graduates gain the training they need to develop skills in growing industry areas by covering the full cost of training in one of 160 high priority qualifications to ensure they get the skills to start their career.
Since the Free TAFE initiative launched in August 2018, more than 6,000 students have started a new qualification, subject or module as part of their vocational education.
Further, significant commitments are made in the 2019-20 Budget to improve Queensland’s state schools, including $532.6 million over seven years to expand the Building Future Schools Fund and $251.3 million over three years for additional facilities at existing state schools experiencing enrolment growth. The Budget also allocates increased funding of $100 million to address air conditioning needs to give Queensland students the best possible learning environment.
The 2019-20 Budget builds on the Government’s substantial existing investment in training and skills, through innovative initiatives such as the Micro-Credentialing Pilot and a Higher Level Apprenticeship Pilot to provide modern and flexible pathways to address current, emerging and future skills needs.
To help Queenslanders at all stages of life and from disadvantaged backgrounds access employment and training opportunities, the Queensland Government provides a higher level of subsidy to concessional students studying VET qualifications. Further targeted support is provided to disadvantaged groups, including mature-age jobseekers, through the $420 million Skilling Queenslanders for Work initiative to help them re-enter and stay in the workforce.
In addition to substantial investments in skills and training, the Queensland Government is implementing a suite of initiatives to better connect Queenslanders with employment, education and training opportunities, particularly for the State’s young people.
Initiatives funded in this Budget include:
| | • | | a $4.6 million Digital Engagement Strategy to help re-engage at-risk youth back into school and training |
| | • | | the $9.6 million Link & Launch initiative to help disengaged year 12 leavers engage in education, training or employment |
| | • | | a $11.2 million expansion of the Regional Youth Engagement Hubs program to locate, case manage and re-engage early school leavers back into school and training |
| | • | | $16.6 million for FlexiSpaces to support schools to provide innovative learning spaces, as an alternative to traditional learning spaces to retain students who are at risk of disengagement and early leaving by providing wrap around support. |
In preparing workers for the jobs of the future, a key focus will be the ongoing development of skills which cut across all industries and sectors, such as digital and commercial literacy, problem solving, communication, and entrepreneurial skills. These broad, cross-cutting skills complement field-specific expertise, and will be critical in helping workers to navigate job changes over time. In line with this, the next phase of the Advance Queensland agenda includes New Skills and New Jobs as one of its five priorities.
Going forward, the Queensland Government’s focus on skills will also be bolstered by a new Skills Strategy, informed by the Skills and Industry Summit held in late 2018, and will continue to be guided by the strategic advice of Jobs Queensland on future skills and workforces.
29
Budget Strategy and Outlook 2019-20
| 2 | Economic performance and outlook |
Features
| | • | | A range of global, national and local factors are expected to see Queensland’s Gross State Product (GSP) growth ease to an estimated 23⁄4% in 2018-19. |
| | • | | Global economic conditions have deteriorated substantially since early 2018, with a slowdown in China’s domestic economy, escalation of trade tensions between the United States (US) and China, and uncertainty surrounding Brexit resulting in a slowing of global growth in late 2018. These trends have intensified in early 2019. |
| | • | | Nationally, the weaker global outlook and sharper than expected slowdown in housing have led to an easing in economic growth. As a result, the Reserve Bank of Australia (RBA) has downgraded forecasts for national growth and cut the cash rate to 1.25%. |
| | • | | The easing in Queensland’s economic growth in 2018-19 also reflects the impact of the North Queensland floods, with losses in economic output estimated to be around 1⁄4 percentage point of GSP, spread across 2018-19 and 2019-20. |
| | • | | The ongoing decline in dwelling investment and the flow-on impacts to consumption, as well as a moderation in business investment, have constrained growth in the domestic economy. However, the commencement of new metal mines and continued strong growth in education exports are expected to drive faster growth in overseas exports in 2018-19. |
| | • | | Queensland’s economic growth is forecast to strengthen to 3% in 2019-20, underpinned by a modest pick-up in domestic activity as business investment improves, as well as some recovery in regions and sectors impacted by the floods. |
| | • | | Compared with both Australian Treasury and RBA forecasts, 2019-20 is expected to be the third consecutive year where Queensland growth outstrips national economic growth. |
| | • | | As reflected in revenue forecasts, the softer global and national outlook, sharper than expected slowdown in housing and moderation in employment growth are expected to impact growth in key government revenues, including GST, transfer duty and payroll tax. |
| | • | | From 2020-21 onwards, economic growth is expected to remain solid, at around 23⁄4% per annum, with a more balanced contribution from all major components across the economy. |
| | • | | Strong GSP growth in 2017-18 saw employment growth of 4.1%, the strongest in more than a decade and the largest rise (97,700 persons) in any year in the State’s history. |
| | • | | However, in line with more subdued domestic activity, employment growth is expected to return to more sustainable rates of 11⁄2% in 2018-19 and 11⁄4% in 2019-20. |
| | • | | Similar to recent years, variations in employment growth are expected to be mostly absorbed by changes in participation, seeing the unemployment rate stabilise around 6%. |
| | • | | Beyond 2019-20, as domestic activity strengthens, labour market conditions are set to improve modestly, with a strengthening of jobs growth and the unemployment rate edging lower to 53⁄4% by the end of the projection period. |
30
Budget Strategy and Outlook 2019-20
| 2.1 | International conditions |
Following a strengthening in 2017, global growth remained robust for most of the first half of 2018. At the time, the International Monetary Fund (IMF) maintained a positive outlook for the international economy. In the second half of 2018, an escalation of US-China trade tensions, a slowdown in China’s domestic economy and the uncertainty related to Brexit led to a downgrade to global growth forecasts and the outlook for industrial production in several key economies.
As of April 2019, the IMF had subsequently downgraded growth forecasts for 2019 (by 0.4 percentage point) and 2020 (by 0.1 percentage point) compared with their October 2018 outlook.
Growth in industrial production among Queensland’s major trading partners, which drives their demand for Queensland’s energy and mineral products, weakened over the course of 2018 and growth is expected to remain moderate in coming years (Table 2.1).
| Table 2.1 | Queensland’s major trading partners’ industrial production outlook1 |
| | | | | | | | | | | | | | | | | | | | | | | | | | | | |
| | | Actual | | | Forecasts | |
| | | 2017 | | | 2018 | | | 2019 | | | 2020 | | | 2021 | | | 2022 | | | 2023 | |
Major trading partners2 | | | 4.3 | | | | 3.3 | | | | 2.9 | | | | 3.3 | | | | 3.2 | | | | 3.4 | | | | 3.4 | |
China | | | 6.5 | | | | 6.2 | | | | 5.8 | | | | 5.6 | | | | 5.1 | | | | 5.1 | | | | 5.0 | |
Japan | | | 2.9 | | | | 1.0 | | | | -0.1 | | | | 0.6 | | | | 0.7 | | | | 0.8 | | | | 1.1 | |
India3 | | | 4.4 | | | | 3.6 | | | | 5.7 | | | | 5.7 | | | | 5.8 | | | | 6.3 | | | | 5.8 | |
Korea | | | 2.5 | | | | 1.3 | | | | 0.6 | | | | 1.6 | | | | 1.8 | | | | 2.1 | | | | 2.2 | |
Eurozone | | | 2.9 | | | | 0.9 | | | | 0.3 | | | | 1.4 | | | | 1.0 | | | | 1.5 | | | | 1.4 | |
Taiwan4 | | | 5.3 | | | | 3.9 | | | | 1.1 | | | | 3.2 | | | | 2.9 | | | | 2.9 | | | | 2.7 | |
USA | | | 2.3 | | | | 3.9 | | | | 2.0 | | | | 1.4 | | | | 1.6 | | | | 1.8 | | | | 1.9 | |
Notes:
| 1. | Annual percentage change. 2017 and 2018 are actuals; 2019 onwards are forecasts. |
| 2. | Major trading partners include China, Japan, India, South Korea, Eurozone, Taiwan, USA, UK and NZ. |
| 3. | India’s growth profile is based on an April to March fiscal year. ‘2017’ refers to 2017-18 fiscal year. |
| 4. | Manufacturing production. |
Sources: April and May 2019 Consensus Forecasts and Queensland Treasury.
China’s gross domestic product (GDP) growth slowed from 6.8% in 2017 to 6.6% in 2018 and is expected to moderate further in 2019. Faced with the challenges of slowing domestic demand, US-China trade tensions and the substantial accumulation of private sector debt, China’s short-term economic outlook likely depends on the effectiveness of the Chinese Government’s stimulatory measures.
More broadly, trade tensions between the US and China have remained a key source of uncertainty and contributed to the softer global economic outlook. With tensions escalating in May 2019, the negative impact on industrial or manufacturing activity, particularly on the outlook for industrialised economies in Asia, is likely to be intensified during 2019.
31
Budget Strategy and Outlook 2019-20
Japan and, to a lesser degree, Korea have been particularly impacted by the increased uncertainty. Until late 2018, Japan’s industrial production growth was expected to be around 2.2%-2.4% in 2019, but Japan is now forecast to record slightly negative growth in 2019.
Japan’s weaker outlook may be compounded by the scheduled increase in the country’s consumption tax (from 8% to 10%) as well as the peaking of Olympic Games’ related construction activity. Korea’s forecast industrial production growth in 2019 has also been downgraded, from around 2% to less than 1%. These downgrades have already been reflected in the slowing of coal imports into these two countries in early 2019.
In India, recent data indicate that the slowdown in industrial production is steeper than previously thought, suggesting Indian industrial production growth in 2019 may be weaker than suggested by the latest Consensus Forecasts (Table 2.1).
Brexit negotiations remain a key uncertainty in the United Kingdom (UK) and European Union (EU), weighing on business and consumer sentiment in recent times. The economic outlook for the UK and EU hinge largely on the outcome of these negotiations, due to be concluded before the 31 October 2019 Brexit deadline.
The impacts of the slowdown in industrial production on commodity prices have so far been uneven. While prices of industrial metals have declined over the year to mid-May 2019, supply issues have seen prices of hard coking coal and iron ore rise 15% and 38% respectively over the year. After falling from around US$85/barrel (bbl) to almost US$50/bbl in late 2018, Brent crude oil prices rebounded strongly in 2019, again due to supply and other geo-political factors.
Another significant effect of the slowdown in the global growth outlook has been the decline of long-term interest rates across many major economies, with yields on long-term government bonds falling substantially.
Industrialised economies in Asia have been the most affected by the trade tensions between China and the US. This is due to the stronger supply chain relationships between China and these economies, which has placed increased pressure on their exchange rates against the US$. These impacts are expected to continue, or possibly intensify.
Australian Treasury estimates Australian real GDP growth to be 21⁄4% in 2018-19, strengthening to 23⁄4% in 2019-20 and 2020-21, with most sectors expected to contribute to growth. Rising global and domestic challenges have seen the RBA downgrade its growth outlook markedly since late 2018, to 21⁄4% in 2018-19 and 21⁄2% in 2019-20.
Recent ABS National Accounts data, which showed GDP growth of only 0.4% (seasonally adjusted) in March quarter 2019, confirmed this weakening national trend.
Household consumption growth is expected to be subdued in 2018-19 but pick up gradually over the forecast period, supported by strengthening wage growth and solid employment growth. However, uncertainty remains around the extent to which the national housing market downturn will influence overall household consumption.
32
Budget Strategy and Outlook 2019-20
Following solid gains over the past few years, growth in dwelling investment has moderated recently. Falling house prices, particularly in Sydney and Melbourne, tighter credit conditions and weakening investor sentiment are providing headwinds to the dwelling investment outlook. While a solid pipeline of work yet to be done in higher-density projects will support activity in 2018-19, dwelling investment is forecast to fall in 2019-20 and 2020-21 as existing projects are completed.
After a soft result in 2018-19, growth in business investment is forecast to be stronger in 2019-20 and 2020-21. Following an expected fall in 2018-19, mining investment is forecast to rise in 2019-20, as firms maintain large capital stocks and sustain production levels. Despite recent business surveys indicating a softening in business conditions, improving capital expenditure intentions suggest steady growth in non-mining investment over the forecast period.
Exports growth over the short-term continues to be supported by the ramp-up in national LNG production, a return to growth in rural exports, and continued steady growth in services exports. As construction of the remaining LNG projects in Western Australia and Northern Territory reach completion, capital imports are expected to ease and keep overall growth in imports modest.
Australian Treasury expects national employment growth to slow to 2% through the year to June quarter 2019 (down from 2.7% in 2018), and to broadly match population growth in the years to June quarter 2020 and 2021. With the participation rate to remain stable, the unemployment rate is expected to be steady at 5% over the forecast years.
Inflation is expected to gradually return to the mid-point of the RBA target band of 2-3%, with the pick-up in wages growth expected to be slightly faster as economic growth strengthens and spare capacity in the labour market continues to be reduced.
| 2.3 | Queensland conditions and outlook |
After stronger than expected growth of 3.5% in 2017-18, the combination of global, national and domestic factors impacting on economic activity is expected to see GSP growth in Queensland ease to 23⁄4% in 2018-19 (Chart 2.1).
Ongoing moderation in dwelling investment and the associated flow-on to consumption spending, as well as a moderation in business investment, have all contributed to this constrained growth in the domestic economy.
The moderation in Queensland’s economic growth in 2018-19 also reflects the impact of the recent flooding event in North Queensland, which impacted many local communities. It is estimated the floods have resulted in economic losses (that is, reduced output, not including property damage) of around 1⁄4 percentage point of GSP, spread across 2018-19 and 2019-20.
The state-wide impact of the event compares with estimated losses of around 3⁄4 percentage point of GSP for Severe Tropical Cyclone (STC) Debbie and 21⁄4 percentage points for the 2010-11 Floods and STC Yasi. Despite the impact of the recent North Queensland floods on some export sectors, commencement of new metal mines and continued strong growth in education exports are expected to drive faster growth in total overseas exports in 2018-19.
33
Budget Strategy and Outlook 2019-20
Queensland’s economic growth is forecast to strengthen to 3% in 2019-20, underpinned by a modest pick-up in domestic activity as business investment returns to growth. Despite this forecast strengthening in headline growth, domestic activity is still forecast to be constrained by subdued growth in household consumption and a further decline in dwelling investment.
Compared with both Australian Treasury and RBA forecasts, 2019-20 is expected to be the third consecutive year where Queensland growth outstrips national economic growth.
| Chart 2.1 | Economic growth1, Queensland and Australia |
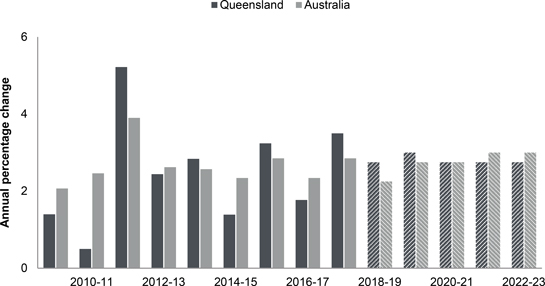
Note:
| 1. | CVM, 2016-17 reference year, 2018-19 to 2020-21 are forecasts, while 2021-22 and 2022-23 are projections. |
Sources: ABS 5206.0, Australian Government Budget 2019-20 and Queensland Treasury.
From 2020-21 onwards, economic growth is expected to remain solid, at around 23⁄4% per annum (Table 2.2), with a more balanced contribution from all major components of the economy.
Reflecting the State’s strong economic growth, employment grew 4.1% in 2017-18, the strongest year-average growth in over a decade and the largest single-year rise (97,700 persons) in the State’s history. However, subdued domestic activity is expected to see employment growth return to more sustainable rates of 11⁄2% in 2018-19 and 11⁄4% in 2019-20, while the unemployment rate is forecast to stabilise at around 6%.
As employment growth returns to more sustainable rates from 2018-19, the participation rate is expected to fall, reversing some of the sharp rise recorded in 2017-18 which limited reductions in the State’s unemployment rate at that time. A modestly lower participation rate is expected to limit upward pressure on Queensland’s unemployment rate in the near term.
Beyond 2019-20, as domestic activity strengthens, labour market conditions are set to improve modestly, with a strengthening in jobs growth and the unemployment rate edging lower to 53⁄4% by the end of the projection period.
34
Budget Strategy and Outlook 2019-20
| Table 2.2 | Queensland economic forecasts/projections1 |
| | | | | | | | | | | | | | | | | | | | | | | | |
| | | Actual | | | Est. Act. | | | Forecasts | | | Projections | |
| | | 2017-18 | | | 2018-19 | | | 2019-20 | | | 2020-21 | | | 2021-22 | | | 2022-23 | |
Gross state product2 | | | 3.5 | | | | 23⁄4 | | | | 3 | | | | 23⁄4 | | | | 23⁄4 | | | | 23⁄4 | |
Nominal gross state product | | | 5.7 | | | | 6 | | | | 31⁄4 | | | | 31⁄2 | | | | 41⁄2 | | | | 43⁄4 | |
Employment3 | | | 4.1 | | | | 11⁄2 | | | | 11⁄4 | | | | 11⁄2 | | | | 13⁄4 | | | | 13⁄4 | |
Unemployment rate4 | | | 6.0 | | | | 6 | | | | 6 | | | | 6 | | | | 6 | | | | 53⁄4 | |
Inflation3 | | | 1.7 | | | | 13⁄4 | | | | 2 | | | | 21⁄4 | | | | 21⁄2 | | | | 21⁄2 | |
Wage Price Index3 | | | 2.2 | | | | 21⁄4 | | | | 21⁄4 | | | | 21⁄2 | | | | 21⁄2 | | | | 23⁄4 | |
Population3 | | | 1.7 | | | | 13⁄4 | | | | 13⁄4 | | | | 13⁄4 | | | | 13⁄4 | | | | 13⁄4 | |
Notes:
| 1. | Unless otherwise stated, all figures are annual percentage changes. |
| 2. | CVM, 2016-17 reference year. |
| 3. | Annual percentage change, year-average. |
| 4. | Per cent, year-average. |
Sources: ABS 3101.0, 6202.0, 6345.0, 6401.0 and Queensland Treasury.
Household consumption
Following a strengthening in growth to 2.3% in 2017-18, supported by strong employment and a marginal pick-up in private sector wages, household consumption growth is forecast to remain subdued in 2018-19 and 2019-20.
With employment growth to slow and wages to pick up only modestly, household disposable income growth is forecast to be moderate. Weakness in dwelling investment is also likely to constrain spending on associated household goods and furnishings, while softer house prices are expected to constrain rises in household wealth. Consumers are also likely to exercise a degree of caution amid the uncertain global and domestic economic environments.
Following subdued growth in 2018-19 and 2019-20, consumption growth is forecast to pick up gradually in subsequent years, supported by an improvement in employment and wages growth.
Dwelling investment
Overall, dwelling investment is estimated to fall 51⁄2% in 2018-19 and to decline a further 3% in 2019-20, before returning to growth in 2020-21 (up 23⁄4%).
Highlighted as a key risk in the 2018-19 Mid-Year Fiscal and Economic Review (MYFER), the outlook for dwelling investment has weakened materially since late 2018, with approvals and finance commitments falling further and faster than previously anticipated. Approvals for new houses and attached dwellings have fallen 18.8% and 28.1%, respectively, in the first 10 months of 2018-19.
35
Budget Strategy and Outlook 2019-20
A range of factors have contributed to the weaker demand for new housing, including: the slowdown from the high levels of investment in apartments in previous years; a response by lenders and borrowers to tighter national lending regulations targeting investors and interest-only loans; a softer outlook for house prices, particularly in Sydney and Melbourne; and increased scrutiny of credit applications by banks, particularly in the context of the outcomes of the Banking Royal Commission.
Consequently, construction of attached dwellings (that is, units, apartments and townhouses) has continued to return to more sustainable levels following the apartment construction boom in inner Brisbane. Meanwhile, construction of detached housing (that is, houses) has also softened. Reflecting these trends, new and used dwelling investment is expected to decline 151⁄2% in 2018-19 and a further 81⁄4% in 2019-20, before returning to modest growth in 2020-21.
Partly offsetting this decline, strong growth continues to be recorded in alterations and additions activity (that is, renovations), which has risen 76.6% since its trough in March quarter 2013 to reach a record high in March quarter 2019, and to be the largest individual component of dwelling investment (Chart 2.2). In an uncertain global and national economic environment, households are preferring to invest in their current homes. As a result, momentum in alterations and additions activity is expected to continue, with a strong 121⁄2% rise in 2018-19 forecast to be followed by further rises of around 4% per annum in the next two years.
| Chart 2.2 | Dwelling investment, by component1, Queensland |
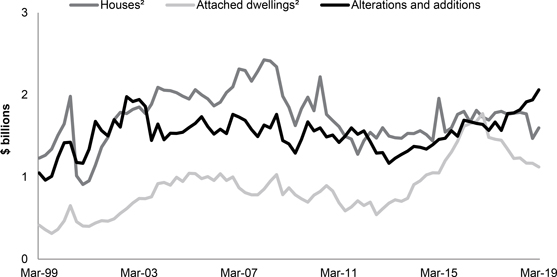
Notes:
| 1. | CVM, quarterly, seasonally adjusted. |
| 2. | Work done, CVM, quarterly, seasonally adjusted. |
Sources: ABS 5206.0 and 8755.0.
36
Budget Strategy and Outlook 2019-20
Business investment
Driven by investment in renewable energy projects, business investment rebounded strongly in 2017-18, making its first contribution to annual economic growth in Queensland since the peak of the LNG construction boom in 2012-13. However, business investment is expected to ease slightly in 2018-19, before returning to growth from 2019-20.
Engineering construction is expected to continue to be supported by renewable energy projects, as well as a number of resources projects either under construction or soon to commence, such as the Olive Downs and Byerwen metallurgical coal projects.
Since December 2016, 24 large-scale renewable projects have commenced operations, and a further 11 projects are financially committed or under construction in Queensland. This growth in the sector has led to significant employment gains, with the number of jobs in renewable energy increasing to 5,080 in 2017-18, a 44% growth over the year.
However, the increased uncertainty in both the global and domestic outlooks has seen mining investment more focused on maintaining or expanding the current large capital stock, rather than new major greenfield resource sector projects. This is likely to impact the outlook for engineering construction growth.
Despite strong growth in non-residential building investment in 2017-18, work yet to be done data suggest this component will be constrained in the near term. While accommodation projects and office buildings have supported recent activity, a lack of accommodation projects in the pipeline and elevated office vacancy rates suggest further investment is likely to be modest.
Investment in machinery and equipment has risen strongly in recent years. With risks to the global and domestic economic outlooks rising, many businesses are making investments in machinery and equipment to expand productive capacity, rather than committing to additional large-scale construction projects. These trends are likely to continue in the near-term, with investment in machinery and equipment also likely to be supported by recent strong growth in company profits and low lending costs for businesses.
Public final demand
Public final demand, which includes both consumption and investment spending across all levels of government, is expected to continue to grow strongly, averaging around 4% per annum over the forecast period to 2020-21.
The Queensland Government is continuing to invest in productivity-enhancing economic infrastructure and essential social infrastructure to create jobs, support Queensland businesses and drive economic growth across all regions of the State.
In this Budget, the Government has committed $49.5 billion over the next four years to fund construction of the critical infrastructure and capital works needed to rebuild and grow the State’s regions, facilitate and support business-led growth and deliver essential services to improve the quality of life enjoyed by the State’s growing population.
The Government’s capital program, including $12.9 billion in 2019-20, will directly support substantial employment and economic activity across all regions of the State.
37
Budget Strategy and Outlook 2019-20
Overseas exports and imports
Coal export volumes are expected to grow only slightly in 2018-19. This subdued growth in 2018-19 partly reflects heightened import restrictions at Chinese ports since the end of 2018 and port disruptions at Abbot Point Coal Terminal in February following the North Queensland floods. Looking ahead, while coal export volumes are forecast to continue to grow, the rate of growth will likely be more modest than previously expected, reflecting the softer global outlook and the slowing of industrial production growth in most of the State’s major coal export markets.
Importantly, around 70% of the volume of Queensland’s coal exports is metallurgical coal used for steel making, whose demand has been less affected by port restrictions in China so far. Indeed, China’s coking coal imports increased at an annual rate of 44% in the first four months of 2019, to 23.8 million tonnes, compared with a 24% decline in thermal coal imports over the same period.
Despite slower growth in export volumes, coal export earnings in 2018-19 have been supported by sustained high prices, with benchmark hard coking coal prices remaining high in 2018-19, partly driven by strong demand from India and supply disruptions. Meanwhile, the average thermal coal price in 2018-19 was only marginally lower than in 2017-18. This was despite benchmark spot thermal coal prices falling from around US$120/t at the beginning of the financial year to around US$72/t by late May 2019, partly in response to Chinese port restrictions and a signalling of decreasing reliance on coal fired power generation in developed economies.
Looking ahead, Queensland coal export volumes are forecast to increase at an average 13⁄4% per annum between 2018-19 and 2022-23. Commencement of new mining projects and some expansion of existing projects are expected to see the volume of metallurgical coal exports increase while thermal coal export volumes are forecast to decline slightly. Coal prices are assumed to gradually ease towards levels which are consistent with balancing global coal demand and supply.
38
Budget Strategy and Outlook 2019-20
| Chart 2.3 | Queensland’s overseas goods exports1 |
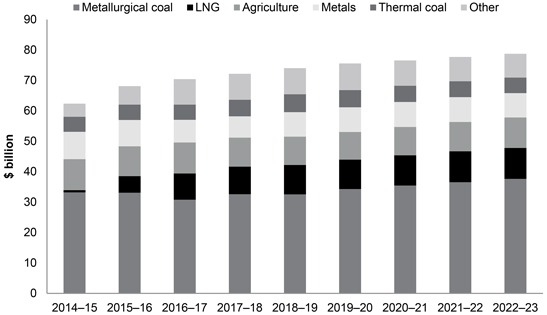
Note:
| 1. | CVM, 2016-17 reference year. 2018-19 to 2020-21 are forecasts, while 2021-22 and 2022-23 are projections. |
Sources: Unpublished ABS data and Queensland Treasury.
LNG export volumes are expected to grow modestly in 2018-19, driven by new coal seam gas developments which will also provide additional supply into the east coast domestic gas market. However, further growth in LNG export volumes is not expected until at least 2020-21, when substantial new gas supply begins to come online.
After four consecutive annual falls, metal exports are estimated to rebound and grow by 141⁄2% in 2018-19. This recovery reflects the commencement of new projects, including Rio Tinto’s Amrun bauxite mine, MMG’s Dugald River zinc mine and New Century’s reprocessing operation at the depleted Century zinc mine, along with the restart of Glencore’s Lady Loretta zinc mine in 2018.
The North Queensland floods impacted rail transportation of metal products from Mount Isa to Townsville. However, these impacts were temporary, with the rail line re-opening on 29 April, while some of the disruptions were mitigated by temporary increases in road haulage. Metal processors have also noted that some lost production will be caught up by the end of 2019.
For further details on the impact of recent natural disasters, including the Government’s responses, refer to the supplementary Budget paper on Disaster Recovery.
39
Budget Strategy and Outlook 2019-20
Although international metal prices were lower in 2018-19, their negative impacts on export earnings were offset by a lower A$ exchange rate and a shift towards exports of metal concentrates, whose prices have been less aligned with metal prices in recent times. The ramp-up in metal production is expected to largely be completed by the end of 2019. Therefore, combined with an expected moderation in production at some existing mines due to lower ore grades, the volume of metal exports is expected to plateau by 2020-21.
Growth in beef production and exports have continued in 2018-19, as dry conditions persisted across many cattle regions in Queensland. An anticipated return to more favourable conditions will see restocking activity gradually increase, as challenging weather conditions have depleted herds in recent years. However, herd rebuilding in the north of the State is likely to be protracted due to local cattle losses following the North Queensland floods.
Sugar exports are expected to return to growth in 2018-19, reflecting elevated levels of sugar content in crushed cane. Drier conditions toward the end of 2018 allowed the harvest to take place over a shorter period, while sugar content was at optimal levels. A softening of sugar exports is expected in the near term, assuming a return to normal sugar content levels.
Cotton exports are expected to fall in 2018-19 as dry conditions continue to reduce the area planted to cotton. Similarly, other crop exports are expected to decline, reflecting a reduction in the area planted for most crops, and therefore, decreased production.
Following a sustained period of solid growth, overseas tourism exports are expected to ease in 2018-19. However, a competitive A$, new air routes to Asia and the Brisbane airport expansion are expected to support a return to growth in following years.
Queensland’s international education exports have continued to grow strongly in recent years with a competitive A$ and ongoing demand from Asia driving growth over the forecast period. China remains a key market, accounting for around 23% of overseas student enrolments in 2018.
Overseas imports rose sharply in 2017-18, reflecting increased imports of capital goods (consistent with the rebound in business investment in that year, including several large scale renewable energy projects), petroleum products (which can be volatile) and motor vehicles (reflecting the cessation of domestic vehicle production in 2017). However, overseas imports are forecast to return to modest growth in 2018-19 and 2019-20, reflecting subdued growth in domestic activity.
Labour market
After exceptionally strong growth of 4.1% in 2017-18, employment growth is expected to return to more sustainable rates over the forecast period. With the outlook for domestic activity subdued in 2018-19 and 2019-20, employment growth is estimated to ease to 11⁄2% in 2018-19 and 11⁄4% in 2019-20, before picking up to 11⁄2% in 2020-21.
The unemployment rate is expected to remain relatively stable over the next two years. Labour force participation has moved broadly in line with employment growth in recent years, resulting in a relatively steady unemployment rate (Chart 2.4). This trend is expected to continue and, as a result, the State’s unemployment rate is expected to stabilise at around 6% through to 2020-21.
40
Budget Strategy and Outlook 2019-20
| Chart 2.4 | Employment growth and unemployment rate, Queensland1 |
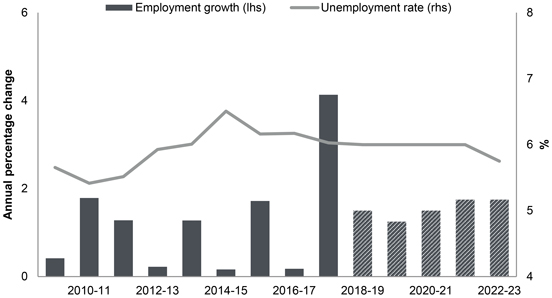
Note:
| 1. | Year-average. 2018-19 to 2020-21 are forecasts, while 2021-22 and 2022-23 are projections. |
Sources: ABS 6202.0 and Queensland Treasury.
The strength of the Queensland labour market has seen 199,000 jobs created across the State since January 2015. This strong jobs growth, in particular the sharp rise in employment in 2017-18, saw additional jobseekers encouraged into the labour market, resulting in a spike in the participation rate which limited the reduction in the State’s unemployment rate in that year.
As employment growth returns to more sustainable rates, some workers are less likely to actively participate in job seeking and the participation rate is expected to decline. As a result, some of the moderation in employment growth is expected to be absorbed by a partial reversal of the previous spike in labour force participation, leaving the unemployment rate broadly stable.
Employment growth is projected to strengthen to 13⁄4% in 2021-22 and 2022-23, reflecting a pick-up in domestic activity, with the unemployment rate to edge down to around 53⁄4% by the end of the projection period in 2022-23.
Regional labour markets
Labour market conditions in regional Queensland have improved over the past year. Over the year to April 2019, employment in regional Queensland increased 8,700 persons, with jobs growth over the year (1.4%) being faster than population growth (0.7%). Further, the gap between the regional and South East Queensland unemployment rates has continued to narrow, from 2.5 percentage points in mid-2016 to 0.7 percentage point in the year to April 2019 (Chart 2.5), reflecting the stronger economic conditions in key regions.
41
Budget Strategy and Outlook 2019-20
| Chart 2.5 | Unemployment rate1 by region, Queensland |
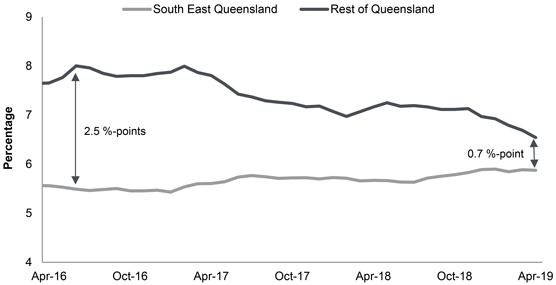
Note:
| 1. | Year-average. South East Queensland is defined as Greater Brisbane, Gold Coast, Sunshine Coast and Toowoomba. |
Source: ABS 6291.0.55.001.
Mackay had the State’s lowest unemployment rate (4.3%) in April 2019. Conditions in the region have eased over the past year, however this follows two years of strong jobs growth.
Central Queensland’s labour market appears to be adjusting well following the end of the LNG construction boom, with employment up 6,900 persons over the year to April 2019 (the most in any region outside South East Queensland) and the unemployment rate falling to 5.6%.
The labour market in Cairns remains buoyed by strong domestic tourism, with employment up 4.5% over the year and the unemployment rate down 1.4 percentage points, to 4.8%.
Conditions in Townsville and the diverse Queensland-Outback region remain challenging. However, Townsville has shown improvement over the past two years, with the unemployment rate falling 2.9 percentage points and employment rising 10,200 persons.
While the north west of the Outback region has been impacted by the recent floods, the south and central west Outback are facing ongoing drought conditions. Further, there are elevated levels of unemployment across rural Indigenous communities in parts of the Outback region.
Wide Bay recorded modest employment growth (1.0%) over the past year and a falling unemployment rate (down 2.0 percentage points to 7.5%). This result was despite the region facing ongoing labour market challenges, low participation rates and relatively high rates of social disadvantage.
42
Budget Strategy and Outlook 2019-20
Labour market conditions in South East Queensland have remained robust over the year to April 2019, with employment up 1.9% and the unemployment rate remaining below the State average. Within South East Queensland, the Gold Coast has recorded the strongest labour market conditions, with employment growing by 4.7% and an unemployment rate of 4.8%, the equal second lowest in the State.
Prices and wages
Brisbane’s consumer price growth has remained steady in recent years, with inflationary pressures remaining subdued in 2018-19. While the further 12.5% annual increase in the Australian Government’s tobacco excise has provided upward pressure on inflation, this has been partially offset by falling global oil prices in late-2018 that have driven automotive fuel prices lower. A modest acceleration in inflation is forecast for 2019-20, driven by a further increase in the tobacco excise and a return to growth in dwelling rents, as apartment supply continues to be absorbed.
Nominal wage growth in Queensland has accelerated slightly in recent years but remains subdued by historical standards. However, despite the modest recent wages growth, slower consumer price inflation has seen real wages continue to rise. Wage growth is expected to strengthen over the medium-term as conditions in the domestic economy improve.
Population
Queensland’s population growth is forecast to average around 13⁄4% in 2018-19, with similar rates of growth forecast in each year over the remainder of the forecast period.
Queensland’s more affordable housing has supported higher net interstate migration from New South Wales. Meanwhile, the unwinding of the Western Australian resources investment boom has seen an increase in net inflows from that state over recent years, following a sustained period of outflows to Western Australia between 2008 and 2015. Queensland’s net interstate migration is expected to moderate over coming years.
Net overseas migration to Queensland has grown strongly and is expected to continue to grow over the medium term, driven by a range of factors including rising incomes in Asia and a competitive A$.
In its April 2019 World Economic Outlook, the IMF noted risks to the global economic outlook are tilted to the downside.
US-China trade tensions could escalate further and the resulting policy uncertainty adversely affect global growth. This may particularly impact on the Chinese economy and its key Asian trading partners, leading to a weaker outlook for industrial production and tempering the outlook for Queensland export growth. Further, there is ongoing uncertainty about the duration of Chinese coal import restrictions and the impacts on coal exports and prices.
43
Budget Strategy and Outlook 2019-20
Nevertheless, the effect of the trade war on Queensland’s coal exports may not be even. Given the high quality of Queensland’s metallurgical coal, which comprise around 70% of the volume of Queensland’s coal exports, and the dominance of the blast furnace method of steel making in Asia, Queensland metallurgical coal exports may be less affected. In fact, China’s State Council announced in mid-May 2019 tariff exemptions on some US imports which included coking coal but not thermal coal.
With political discord in the EU already elevated and prolonged fiscal uncertainty in Italy, a “no deal” Brexit could heighten political and economic instability in that region, further impacting on global confidence.
At the national level, if economic growth was to soften further than currently anticipated, this could lead to continued weakness in wages growth and inflation. It may also prompt the RBA to consider monetary policy easing further or faster than current market expectations. However, with the RBA recently noting the limitations of monetary policy to stimulate demand in the current low interest rate environment, this scenario could also increase the importance of fiscal policy at the national level as a tool in managing demand.
The national and state housing markets have changed considerably since late 2018, as evidenced by the substantial price falls in Sydney and Melbourne. Housing approvals in Queensland have also fallen further than expected since the 2018-19 MYFER, and there remains a high level of uncertainty around the outlook for dwelling investment and property prices.
The moderate declines in dwelling investment forecast in 2018-19 and 2019-20 and a return to growth expected in 2020-21 are based on key underlying fundamentals that should help limit any more substantial weakening of the housing sector. These include the relatively modest price increases recorded in Queensland during the current housing cycle and the State’s ongoing solid population growth.
However, if the dwelling sector were to weaken further than currently anticipated, this could have a negative impact on household wealth and consumption, with flow-on effects to employment.
Table 2.3 overleaf outlines the detailed components of GSP for the Actual 2017-18 outcome, the Estimated Actual 2018-19 outcome and the 2019-20 and 2020-21 forecast period.
44
Budget Strategy and Outlook 2019-20
| Table 2.3 | Queensland economic forecasts1, by component |
| | | | | | | | | | | | | | | | |
| | | Actual | | | Est. Act. | | | Forecasts | |
| | | 2017-18 | | | 2018-19 | | | 2019-20 | | | 2020-21 | |
Economic output2 | | | | | | | | | | | | | | | | |
Household consumption | | | 2.3 | | | | 21⁄2 | | | | 21⁄2 | | | | 23⁄4 | |
Private investment | | | 5.3 | | | | -31⁄2 | | | | 1⁄2 | | | | 31⁄4 | |
Dwelling investment | | | -3.9 | | | | -51⁄2 | | | | -3 | | | | 23⁄4 | |
New and used | | | -8.7 | | | | -151⁄2 | | | | -81⁄4 | | | | 11⁄2 | |
Alterations and additions | | | 6.1 | | | | 121⁄2 | | | | 41⁄4 | | | | 4 | |
Business investment | | | 13.1 | | | | -3 | | | | 21⁄4 | | | | 33⁄4 | |
Non-dwelling construction | | | 16.9 | | | | -91⁄4 | | | | 11⁄4 | | | | 31⁄4 | |
Machinery and equipment | | | 7.7 | | | | 61⁄2 | | | | 33⁄4 | | | | 41⁄4 | |
Private final demand | | | 3.1 | | | | 1 | | | | 2 | | | | 23⁄4 | |
Public final demand | | | 4.0 | | | | 41⁄2 | | | | 41⁄4 | | | | 31⁄2 | |
Gross state expenditure | | | 3.3 | | | | 13⁄4 | | | | 21⁄2 | | | | 3 | |
Net overseas exports3 | | | -1.7 | | | | 1⁄2 | | | | 1⁄2 | | | | 0 | |
Overseas exports | | | 2.6 | | | | 31⁄2 | | | | 21⁄2 | | | | 11⁄2 | |
less Overseas imports | | | 13.5 | | | | 11⁄2 | | | | 11⁄2 | | | | 23⁄4 | |
Gross state product | | | 3.5 | | | | 23⁄4 | | | | 3 | | | | 23⁄4 | |
Nominal gross state product | | | 5.7 | | | | 6 | | | | 31⁄4 | | | | 31⁄2 | |
Employment4 | | | 4.1 | | | | 11⁄2 | | | | 11⁄4 | | | | 11⁄2 | |
Unemployment rate5 | | | 6.0 | | | | 6 | | | | 6 | | | | 6 | |
Inflation6 | | | 1.7 | | | | 13⁄4 | | | | 2 | | | | 21⁄4 | |
Wage Price Index6 | | | 2.2 | | | | 21⁄4 | | | | 21⁄4 | | | | 21⁄2 | |
Population6 | | | 1.7 | | | | 13⁄4 | | | | 13⁄4 | | | | 13⁄4 | |
Notes:
| 1. | Unless otherwise stated, all figures are annual percentage changes. |
| 2. | CVM, 2016-17 reference year, except nominal GSP. Components not separately reported are other investment (cultivated biological resources, intellectual property products and ownership transfer costs) and the balancing item (including interstate trade, inventories and the statistical discrepancy). |
| 3. | Goods and services, percentage point contribution to growth in gross state product. |
| 4. | Annual percentage change, year-average. The comparable through-the-year growth rate to the June quarter (seasonally adjusted) are 3.1%, 11⁄4%, 11⁄4% and 11⁄4% from 2017-18 through to 2020-21. |
| 5. | Per cent, year-average. |
| 6. | Annual percentage change, year-average. |
Forecast assumptions include: an easing bias in the RBA cash rate in 2019 and 2020, before a gradual rise; a broadly stable A$; oil prices to ease marginally from US$70/bbl; and a drier outlook for weather conditions in the short-term.
Sources: ABS 3101.0, 6202.0, 6345.0, 6401.0 and Queensland Treasury.
45
Budget Strategy and Outlook 2019-20
| 3 | Fiscal strategy and outlook |
Features
| • | | The 2019-20 Budget demonstrates this Government’s commitment to sound fiscal management, with operating surpluses projected across the forward estimates, despite significant fiscal pressures. |
| • | | A General Government net operating surplus of $841 million is expected for 2018-19, almost $700 million higher than forecast in the 2018-19 Budget ($317 million more than the 2018-19 Mid Year Fiscal and Economic Review estimate). Beyond 2018-19, the fiscal environment remains challenging with reductions in GST and transfer duty. |
| • | | The 2019-20 Commonwealth Budget included significant downward revisions in the GST pool forecasts. These revisions have further compounded the impact of changes to Queensland’s relativity following the Commonwealth Grants Commission’s 2019 Update which now excludes disaster recovery payments to local governments from the GST calculation. This has resulted in Queensland’s share of GST revenue being revised down by $2.3 billion since the 2018-19 Budget ($1.5 billion since MYFER), over the period 2018-19 to 2021-22. |
| • | | A decline in the volume of residential property transactions since MYFER, particularly for investors, has resulted in forecasts for transfer duty revenues being downgraded by around $1.3 billion since the 2018-19 Budget ($1 billion since MYFER) over the period 2018-19 to 2021-22. |
| • | | While significant budget pressures exist, royalty revenue has remained strong. Since MYFER, royalty revenue has been revised upwards by approximately $1.5 billion, excluding new measures, over 2018-19 to 2021-22. The largest factor in upwards revisions to royalties is the continued strength in the hard coking coal price (primarily used for steel production), resulting in an uplift to price assumptions, across the forward estimates. |
| • | | The preliminary cost of recovery efforts following the North and Far North Queensland Monsoon Trough is estimated to be around $1.3 billion (operating and capital). |
| • | | A new Australian accounting standard, AASB 16 Leases, has been adopted in the 2019-20 State Budget. AASB 16 applies to all government and private sector reporting entities. Under AASB 16, operating leases that previously were not recognised on balance sheet will now be included as lease liabilities and lease assets on the State’s balance sheet. The reporting change results in a one-off increase to General Government Sector borrowing of over $2.2 billion and an increase for Non-financial Public Sector (NFPS) borrowing of over $2.6 billion, on 1 July 2019. |
| • | | General Government and NFPS borrowing with Queensland Treasury Corporation (QTC) will increase over the period to 2022-23 because of ongoing investment in economic and social infrastructure, but remain largely in line with 2018-19 Budget projections. In 2019-20, General Government borrowing with QTC are estimated to be $32.8 billion, which is around $2.7 billion less than projected at the time of the 2016-17 Budget. For the NFPS, borrowing with QTC in 2019-20 is estimated to be $71.95 billion, which is $3.6 billion lower than projected at the time of the 2016-17 Budget. |
46
Budget Strategy and Outlook 2019-20
The Queensland Government is committed to delivering the best possible services and infrastructure to all communities.
Building on the successful strategies, initiatives and investment announced in the Government’s four previous Budgets, the 2019-20 Budget supports the Government’s economic plan to create secure, well-paid jobs and drive sustainable economic growth, including the ongoing growth of strong regional economies.
Another key focus of the 2019-20 Budget is planning for delivery of Our Future State: Advancing Queensland’s Priorities. Identifying priorities and delivering on them enables us as a government to confront and tackle the major opportunities and challenges facing our state.
Ongoing budget sustainability will be central for delivering on the Government’s economic plan, addressing key priority target areas and continuing to deliver enhanced frontline services to the community. Since MYFER, revenue growth has been impacted by significant downward revisions in GST pool forecasts which were included in the 2019-20 Commonwealth Budget. These revisions have further compounded the impact of changes to Queensland’s relativity following the Commonwealth Grants Commission’s 2019 Update which now excludes disaster recovery payments to local governments from the GST calculation. In total, Queensland’s share of GST revenue has been revised down by around $1.5 billion since MYFER, over the period 2018-19 to 2021-22.
A sharp decline in the volume of residential property transactions, particularly for investors, has led to downward revisions to Queensland’s transfer duty. The scale of transfer duty revisions in Queensland is much lower than seen in Victoria and New South Wales, partly due to house prices in Queensland remaining relatively stable, compared with significant declines in the southern capitals where house prices had been at unprecedented levels.
North and Far North Queensland endured a record-breaking monsoon flooding event which devastated infrastructure, businesses, primary producers and residents across 39 local government areas around Townsville and Western Queensland through to the far north of Queensland in January/February 2019. The preliminary cost of recovery efforts following the North and Far North Queensland Monsoon Trough is estimated to be around $1.3 billion (operating and capital).
Due to significant reductions in key revenue sources, the 2019-20 Budget implements land tax, petroleum royalty, and payroll tax measures and a reprioritisation target to ensure the Budget remains sustainable over the forward estimates and that Queenslanders continue to receive the best possible services and infrastructure.
47
Budget Strategy and Outlook 2019-20
The key fiscal aggregates for the 2019-20 Budget are outlined in Table 3.1 and are discussed in detail in this chapter.
| Table 3.1 | Key fiscal aggregates1 |
| | | | | | | | | | | | | | | | | | | | | | | | | | | | |
| | | 2017-18
Actual2
$ million | | | 2018-19
MYFER
$ million | | | 2018-19
Est. Act.
$ million | | | 2019-20
Budget
$ million | | | 2020-21
Projection
$ million | | | 2021-22
Projection
$ million | | | 2022-23
Projection
$ million | |
General Government Sector | | | | | | | | | | | | | | | | | | | | | | | | | | | | |
Revenue | | | 58,087 | | | | 59,002 | | | | 60,068 | | | | 60,387 | | | | 61,729 | | | | 63,583 | | | | 65,540 | |
Expenses | | | 56,335 | | | | 58,478 | | | | 59,226 | | | | 60,198 | | | | 61,416 | | | | 63,101 | | | | 64,753 | |
Net operating balance | | | 1,753 | | | | 524 | | | | 841 | | | | 189 | | | | 313 | | | | 483 | | | | 787 | |
PNFA3 | | | 5,127 | | | | 5,981 | | | | 6,060 | | | | 6,727 | | | | 7,125 | | | | 7,963 | | | | 6,179 | |
Fiscal balance | | | (586 | ) | | | (2,632 | ) | | | (2,677 | ) | | | (3,527 | ) | | | (3,667 | ) | | | (4,280 | ) | | | (1,731 | ) |
Borrowing with QTC4 | |
| 29,256
|
| |
| 30,609
|
| |
| 29,933
|
| |
| 32,781
|
| |
| 35,218
|
| |
| 40,174
|
| |
| 42,589
|
|
Leases and similar arrangements5 | | | 2,152 | | | | 2,557 | | | | 2,623 | | | | 5,824 | | | | 7,071 | | | | 6,943 | | | | 6,966 | |
Securities and derivatives | | | 122 | | | | 75 | | | | 122 | | | | 122 | | | | 122 | | | | 122 | | | | 122 | |
Non-financial Public Sector | �� | | | | | | | | | | | | | | | | | | | | | | | | | | | |
Borrowing with QTC4 | | | 66,964 | | | | 68,774 | | | | 68,141 | | | | 71,954 | | | | 75,413 | | | | 80,645 | | | | 82,972 | |
Leases and similar arrangements5 | | | 2,152 | | | | 2,557 | | | | 2,623 | | | | 6,217 | | | | 7,430 | | | | 7,266 | | | | 7,254 | |
Securities and derivatives | | | 405 | | | | 278 | | | | 671 | | | | 544 | | | | 502 | | | | 492 | | | | 492 | |
Notes:
| 1. | Numbers may not add due to rounding (Bracketed numbers represent negative numbers). |
| 2. | Reflects published actuals. |
| 3. | PNFA: Purchases of non-financial assets. |
| 4. | Queensland Treasury Corporation. |
| 5. | This includes adoption of new accounting standard AASB 16 Leases. |
48
Budget Strategy and Outlook 2019-20
| Box 3.1 | Impact of AASB 16 Leases on borrowing |
A new Australian accounting standard, AASB 16 Leases, has been applied to the 2019-20 Budget. AASB 16 applies to all government and private sector reporting entities. Under AASB 16, operating leases that previously were not recognised on balance sheet will now be included on the State’s balance sheet as lease liabilities and lease assets. The reporting change results in a one-off increase to the General Government Sector borrowing of over $2.2 billion and an increase for NFPS borrowing of over $2.6 billion, on 1 July 2019.
Despite the change in reporting of operating leases, there is no material change to the State’s financial obligations or the underlying financial sustainability of Queensland from the new standard, because the obligations already existed prior to implementation of the standard.
Because of the change required by the new standard, additional details are disclosed on the State’s borrowing in the 2019-20 Budget, to distinguish between borrowing with QTC, leases and similar arrangements, and securities and derivatives. Further details are provided in Chapter 6.
The majority of leases now required to be reported on balance sheet under the new standard relate to office accommodation, with 1 William Street being the largest. Leases and similar arrangements also increases in 2019-20 due to the recognition of new finance leases on the New Generation Rollingstock and Toowoomba Second Range Crossing contracts, and activity on the Cross River Rail PPP. Leases and similar arrangements stabilises at around $7 billion over the out years following the adoption of AASB 16 as new liabilities are largely set off by contractual repayments.
3.2.1 Net operating balance
Table 3.2 compares the General Government Sector net operating balance forecasts for the 2018-19 Budget and MYFER with 2019-20 Budget forecasts.
| Table 3.2 | General Government Sector – net operating balance forecasts |
| | | | | | | | | | | | | | | | | | | | |
| | | 2018-19
$ million | | | 2019-20
$ million | | | 2020-21
$ million | | | 2021-22
$ million | | | 2022-23
$ million | |
2018-19 Budget | | | 148 | | | | 160 | | | | 110 | | | | 690 | | | | n.a. | |
2018-19 MYFER | | | 524 | | | | 193 | | | | 145 | | | | 119 | | | | n.a. | |
2019-20 Budget | | | 841 | | | | 189 | | | | 313 | | | | 483 | | | | 787 | |
The 2019-20 Budget projects net operating surpluses in each year of the forward estimates.
For 2018-19, a net operating surplus of $841 million is expected which is a $317 million improvement on the MYFER estimated surplus of $524 million. Since MYFER, royalty revenue has exceeded estimates, mainly due to coal prices remaining higher than previously expected.
For 2019-20, the estimated General Government Sector operating surplus of $189 million is in line with the MYFER projection of $193 million.
49
Budget Strategy and Outlook 2019-20
In 2019-20, General Government Sector revenue is forecast to be 0.5% higher than the 2018-19 estimated actual. Significant reductions in GST and transfer duty revenue contribute to the low rate of growth. Expenses growth is forecast to be 1.6% higher than the 2018-19 estimated actual, and has been impacted by support for disaster recovery efforts in North and Far North Queensland.
Net operating surpluses will be achieved across the forward estimates with revenue growth expected to increase and exceed expense growth from 2020-21. The widening gap between revenue and expense growth provides increasing support for the net operating balance in the later years of the forward estimates.
Additional measures, detailed in Budget Paper 4 Budget Measures, support the Government’s ongoing commitment to improve service delivery across the State.
Table 3.3 provides a breakdown of the movements in the net operating balance since MYFER.
50
Budget Strategy and Outlook 2019-20
| Table 3.3 | Reconciliation of net operating balance, 2018-19 MYFER to 2019-20 Budget1 |
| | | | | | | | | | | | | | | | |
| | | 2018-19
$ million | | | 2019-20
$ million | | | 2020-21
$ million | | | 2021-22
$ million | |
2018-19 MYFER net operating balance | | | 524 | | | | 193 | | | | 145 | | | | 119 | |
Taxation revisions2 | | | (188 | ) | | | (228 | ) | | | (299 | ) | | | (334 | ) |
Royalty revisions2 | | | 72 | | | | 850 | | | | 259 | | | | 275 | |
GST revisions | | | (268 | ) | | | (560 | ) | | | (434 | ) | | | (237 | ) |
Measures3 | | | | | | | | | | | | | | | | |
Expense | | | 5 | | | | (615 | ) | | | (291 | ) | | | (182 | ) |
Revenue | | | — | | | | 387 | | | | 333 | | | | 387 | |
| | | | | | | | | | | | | | | | |
Net | | | 5 | | | | (228 | ) | | | 42 | | | | 205 | |
Net flows from PNFC and PFC entities4 | | | 320 | | | | 167 | | | | 10 | | | | 96 | |
Natural Disaster Revisions5 | | | 142 | | | | (245 | ) | | | 300 | | | | (187 | ) |
Australian Government funding revisions6 | | | 47 | | | | (151 | ) | | | (4 | ) | | | 596 | |
Other parameter adjustments7 | | | 187 | | | | 391 | | | | 294 | | | | (50 | ) |
2019-20 Budget net operating balance | | | 841 | | | | 189 | | | | 313 | | | | 483 | |
Notes:
| 1. | Numbers may not add due to rounding. |
| 2. | Represents parameter adjustments to revenue forecasts, excluding revenue measures. |
| 3. | Reflects the operating balance impact of Government decisions since MYFER. This differs from the revenue and expense measures listed in Budget Paper 4 due to the timing of some decisions previously held centrally (such as the National Schools Reform Agreement) and policy matters not yet finalised. |
| 4. | Represents revisions to dividends and tax equivalent payments from, and community service obligations (CSOs) and Transport Service Contract (TSC) payments to, Public Non-financial Corporations and Public Financial Corporations. |
| 5. | Impact of disaster expenses net of Disaster Recovery Funding from the Australian Government. |
| 6. | Represents the net impact of funding provided by the Australian Government primarily for Specific Purpose Payments and National Partnership payments, excluding funding for disaster recovery. |
| 7. | Refers to adjustments largely of a non-policy nature, including changes in interest, superannuation, depreciation, swaps, lapses and deferrals. |
| 3.2.2 | Disaster Recovery Funding Arrangements |
The Disaster Recovery Funding Arrangements (DRFA), and the previous National Disaster Relief and Recovery Arrangements (NDRRA) provide a cost sharing formula between the Queensland and Australian Governments, as well as a range of pre-agreed relief measures which may be activated by the Queensland Government immediately following a disaster event, once a need has been established.
The timing of expenditure in relation to natural disasters, and the anticipated DRFA reimbursements from the Australian Government, will impact Queensland’s budget position.
51
Budget Strategy and Outlook 2019-20
| Box 3.2 | North and Far North Queensland Monsoon Trough |
Queensland is the most disaster impacted state in Australia, which underscores our need to continually invest in disaster preparedness and resilience to help save lives, minimise economic loss and enable communities to recover faster.
Queensland’s expertise in disaster management, recovery and mitigation is built upon experience managing more than 84 disaster events in the past decade. The Queensland Government is supporting resilience building initiatives as part of the 2019-20 State Budget. Rebuilding after a disaster is important, but increasing the resilience of our infrastructure to lessen the impacts of natural disasters means that communities can recover more quickly, and with less cost, after a natural disaster strikes.
North and Far North Queensland endured record-breaking monsoon flooding in 2019. The trough wreaked havoc across 39 local government areas and had a catastrophic impact on communities, businesses and primary producers from the Torres Strait in the far north to the South Australian border in the south west.
The preliminary cost of recovery efforts following the disasters is estimated to be $1.3 billion, comprising around $270 million worth of state infrastructure remediation works and around $1 billion worth of operating expenses, the bulk of which is capital grants to local governments.
The direct negative impact of the floods on economic output is estimated at around 1⁄4 percentage point of GSP, spread across 2018-19 and 2019-20. This compares with previously estimated losses of around 1⁄4 percentage point of GSP for Severe Tropical Cyclone (STC) Debbie and 21⁄4 percentage points of GSP for the 2010-11 Floods and STC Yasi.
Under current Disaster Recovery Funding Arrangements, which apply to this event, the bulk of Commonwealth funding is currently expected in the 2020-21 financial year with a net fiscal balance cost to the State of the monsoon event expected to be around $480 million over the forward estimates.
The Palaszczuk Government is committed to the sound management of the State’s finances, while delivering high quality services to all Queenslanders. This includes managing within the State’s means and budgeting for a positive operating position in each year of the forward estimates.
Ongoing budget sustainability is central for delivering on the Government’s economic plan, addressing key priority target areas and achieving public sector reform. To ensure Budget sustainability, revenue and expenditure measures have been introduced in the 2019-20 Budget.
52
Budget Strategy and Outlook 2019-20
| 3.3.1 | State’s operating capacity |
As outlined in Chapter 7, almost half of Queensland’s revenue is from the Australian Government. This means Queensland’s fiscal position is exposed to decisions made by the Australian Government, such as not renewing expiring funding agreements, which leads to a lack of certainty about the funding that will be received each year and limits the Government’s ability to respond to emerging service delivery pressures.
Despite the reliance on Commonwealth funding, the measures introduced in the 2019-20 Budget, together with a focus on expenditure discipline, will ensure the gap between revenue and expenditure growth widens across the forward estimates.
While the Government is delivering on its commitment to provide sound fiscal management, at any given time, issues exist with potentially significant adverse impacts. Until these issues have been considered by Government or formal agreements are in place, it remains unclear if or when these issues will impact the net operating balance. Until there is greater certainty, the potential fiscal impacts of such issues are not included in the forward estimates. These include:
| • | | Native Title Compensation Settlement: The Government is potentially exposed to compensation liability arising from native title claims. At this stage it is not possible to quantify the potential liability. |
| • | | Removal of Statutory Limitation on Physical Abuse: The Government is actively considering the removal of the statutory limitation period of serious child physical abuse and connected psychological abuse, consistent with stakeholder views expressed in response to the Issues Paper: The civil litigation recommendations of the Royal Commission into Institutional Responses to Child Sexual Abuse: Redress and Civil Litigation Report – understanding the Queensland context. The Government acknowledges Queensland’s potential liability that would arise from the removal of the statutory limitation. |
| • | | Share of future GST revenue: The Commonwealth Grants Commission may propose to amend its assessments in consultation with the States as part of its 2020 Methodology Review. The quantum of these impacts cannot be determined at present. If they are incorporated into the assessment methodology, they will impact on Queensland’s GST Revenue from 2020-21. |
| • | | The National Partnership on Remote Housing finished on 30 June 2018, with no additional funding to Queensland provided in the Commonwealth Budget. There will be significant additional investment required to meet the growing housing needs in remote Indigenous communities. |
| • | | Following the January 2011 Queensland flood events, certain property owners commenced a class action making claims against the State. This class action commenced trial in December 2017. At the time of Budget preparation, a judgement is yet to be handed down. |
| • | | National Partnership on Universal Access to Early Childhood Education: The Australian Government has not committed to providing funding to support universal access to kindergarten for children in the year before school beyond 2020, resulting in uncertainty for Queensland, including service providers and parents. |
53
Budget Strategy and Outlook 2019-20
Revenue
Ensuring Queensland remains a competitive taxation environment which supports business and jobs growth, and ensuring cost of living pressures do not place undue strain on Queensland households, are key priorities of this Government.
Queensland businesses and households benefit from one of the most competitive tax environments out of all states in Australia, and will continue to do so under the Palaszczuk Government. Policy and taxation settings are being balanced against appropriate management of the State’s operating position. For the 2019-20 Budget, revenue measures have been introduced which promote jobs and support business while ensuring the continued delivery of high quality services:
Revenue Measures
| • | | From the 2019-20 financial year, a payroll tax rate of 4.95% will apply to employers with total annual taxable wages above $6.5 million. This rate remains lower than New South Wales (5.45%), Western Australia (5.5%), Tasmania (6.1%), Australian Capital Territory (6.85%) and Northern Territory (5.5%), and comparable to South Australia (4.95%) and Victoria (4.85%). This revenue measure will fund the payroll tax package. |
Payroll Tax Package
The Government is increasing the exemption threshold for payroll tax from $1.1 million to $1.3 million of annual wages from 1 July 2019. This change will reduce the payroll tax paid by businesses with annual wages up to $6.5 million by either keeping them below the threshold, or reducing the amount payable due to increasing the deduction threshold.
The Government is extending the 50% payroll tax rebate on the exempt wages of apprentices and trainees until 30 June 2021.
To further encourage regional employment, from 1 July 2019, the Government is introducing a 1% discount on the relevant payroll tax rate for businesses who have more than 85% of their employees outside South-East Queensland. This will benefit regional payroll tax paying businesses.
From 1 July 2019 until 30 June 2021, the Government is introducing a rebate of the payroll tax on additional employees that businesses can demonstrate they have employed over and above their level of full time employees.
| • | | The petroleum royalty rate will increase by 2.5% to 12.5% from 2019-20 onwards. The Government will review design settings of the petroleum royalty regime during 2019-20. The review is discussed further in Chapter 4, Section 4.4.2. |
| • | | From 1 July 2019, the Government will increase land tax rates for companies, trusts and absentees by 0.25 cents for each dollar above $5 million, and 0.25 cents for each dollar above $10 million. |
| • | | From 2019-20, the land tax absentee surcharge rate will be harmonised with Victoria and New South Wales with a 0.5% increase, and application of the surcharge widened to include foreign corporations and trustees of foreign trusts. |
54
Budget Strategy and Outlook 2019-20
| • | | The Government will increase resourcing for Treasury to undertake a program of additional targeted tax compliance activities to ensure all Queenslanders are paying their fair share of taxes. |
Further detail on these measures and more information on Queensland’s revenue outlook are provided in Chapter 4.
Fiscal principle supporting revenue management
Taxation per capita in Queensland remains significantly lower than the average of other Australian states and territories. In 2019-20, Queensland’s taxation per capita of $2,952 will be $666 per capita less than the average of the other jurisdictions.
In addition to comparing Queensland’s competitive taxation status across jurisdictions, the Government also aims to support businesses and households by ensuring that own-source revenue in the General Government Sector, including user charges and royalties, remains at or below 8.5% of nominal gross state product (GSP), on average, across the forward estimates. Own-source revenue is derived from total State revenue less any grants received from external sources, mainly the Australian Government.
This principle is expected to be met over the forward estimates period, with revenue falling as a percentage of GSP. For 2019-20, General Government own-source revenue is forecast to be 8.5% of nominal GSP. This falls to 7.9% by 2022-23.
Expenditure
For the 2019-20 Budget, the government has introduced several savings measures to maintain budget sustainability, and to ensure service delivery remains high quality and provides the outcomes Queenslanders need.
Reprioritisation Target
Ongoing budget sustainability is central to delivering the Queensland Government’s economic plan, addressing key priority target areas and achieving public sector reform.
Reprioritisation targets have been factored into the 2019-20 Budget of $200 million in 2019-20 and $500 million per annum from 2020-21 onwards.
Service Priority Review Office
From 1 July 2019, a new Service Priority Review Office (the Office) will be established in Queensland Treasury. In partnership with the Department of the Premier and Cabinet, the Office will drive the realisation of the reprioritisation targets, by conducting reviews of Queensland public sector agencies and programs.
The review of an agency’s operations, programs and administration (both internal and contracted out), will identify how functions align with government’s priorities, and consider how to optimise the alignment of functions and public resources against these priorities.
The Office will draw on expertise in service delivery from outside Government including from the business and community sectors.
55
Budget Strategy and Outlook 2019-20
Consistent with Government’s employment security policy there will be no forced redundancies in realising these targets.
More information on Queensland’s expenditure outlook is provided in Chapter 5.
Fiscal principle supporting expenditure management
In the General Government Sector, employee expenses equate to approximately 42% of total expenses in 2019-20. Increases in employee expenses reflect changes in the number of public sector employees as well as wages growth.
A key focus is to ensure a balance between high-quality service delivery, and the discipline that underpins the Government’s commitment to fiscal sustainability.
To manage employee expenses growth, the Palaszczuk Government adopted a fiscal principle to maintain a sustainable public service by ensuring that overall growth in full-time equivalent (FTE) employees, on average over the forward estimates, does not exceed population growth.
One of the recommendations from the Coaldrake Review (discussed further in Chapter 5 in Box 5.1) was to nuance the representation of Fiscal Principle 6 to expand disclosure to show health and education growth separately from the rest of the sector. The Government accepted this recommendation in principle. This is now available in Chapter 5, Chart 5.3.
FTEs are estimated to increase by around 4,392 in 2019-20, with approximately 89% of this increase attributable to growth in health and education.
Average FTE growth over the forward estimates period from 2018-19 to 2022-23 is 1.68%, refer Table 3.4. This compares to an estimated Queensland population growth of 13⁄4% annually.
Further details are provided in Chapter 5, with Table 5.2 listing in-scope agencies and their FTE estimates for 2018-19 and 2019-20.
The Queensland Government has an important role in providing essential infrastructure and capital works to meet the State’s increasing service needs and to promote increased productivity and efficiency for the State’s industries. The Queensland Government also recognises that building infrastructure benefits local communities, strengthens local economies and supports local jobs.
56
Budget Strategy and Outlook 2019-20
Through the 2019-20 Budget, the Government continues to invest in health, education and roads that Queenslanders need. Key measures include:
Education
| • | | Through the $1.3 billion Building Future Schools Fund, the Government is building seven new secondary schools, two new special schools, and three new primary schools. For existing state schools, the Government’s Renewing Our Schools Program provides $235 million over four years to 2021-22 to enhance and upgrade facilities in identified state schools across Queensland. The Government is also providing increased funding of $251 million over three years from 2018-19 for the provision of additional facilities at existing state schools experiencing enrolment growth. |
Hospitals
| • | | The Government’s Building Better Hospitals commitment is a key priority for Queensland Health which will help address growing demand by enhancing public hospital capacity and services in the South East Queensland growth corridor. The program includes projects at three major South East Queensland hospitals including Caboolture, Logan and Ipswich with a combined value of $957 million. |
Roads
| • | | The Queensland Government is investing $898 million to deliver major projects on the M1, including the Varsity Lakes to Tugun and Eight Mile Plains to Daisy Hill projects. A safe, efficient and reliable M1 Pacific Motorway plays an important role in driving productivity and competitiveness across South East Queensland. |
| • | | The Government is also investing in several Bruce Highway upgrades through the 2019-20 Budget. Many Queenslanders are dependent on the Bruce Highway for their livelihood and lifestyle. With the Bruce Highway connecting cities and towns over a distance of almost 1,700 kilometres from Brisbane to Cairns, it is essential to maintain and upgrade the Bruce Highway to ensure freight, travel and commuter traffic is safe and efficient. The Queensland Government will continue to work with the Australian Government to deliver the Bruce Highway Upgrade Program, aimed at improving safety, flood resilience and capacity along its length. |
Community Safety
| • | | The Government has also committed around $620 million, held centrally, towards an expansion of the Southern Queensland Correctional Precinct. The Stage 2 Expansion will deliver a correctional facility with a focus on health and rehabilitation, to reduce reoffending. This expanded facility, with its therapeutic health-centred operating model, will help address substance addiction and mental health issues. Further, it will enable Queensland Corrective Services and Queensland Health to provide rehabilitation and treatment in a world-class correctional facility. The Stage 2 Expansion will ease overcrowding across the correctional services system, helping keep correctional officers and prisoners safe. |
57
Budget Strategy and Outlook 2019-20
Youth Justice
| • | | The Government is committed to preventing offending and reoffending, and keeping young people out of courts and custody, supported by the development and upkeep of appropriate infrastructure facilities. This includes increasing capacity in Youth detention facilities by an additional 48 beds, with $178 million for the completion of these projects over the next three years |
Further information about the Government’s capital program is provided in Chapter 6 and Budget Paper 3 Capital Statement.
Borrowing
The Government is committed to managing borrowings in a sustainable way. To achieve this, the government is focused on growing the net operating balance across the forward estimates to reduce future borrowing requirements, while allowing the Government to continue to invest in the infrastructure projects needed for Queensland’s growing population.
The revenue and expense measures identified in Section 3.3.1 are supporting an ongoing improvement in the net operating balance, by ensuring that there is a widening gap between revenue growth and expenses growth. Expenditure control will be achieved without reducing services, with the Government boosting frontline staff in education and health while maintaining total public sector FTE growth at a rate below population growth. This ensures the government delivers the services Queenslanders need while reducing the State’s borrowing requirements.
There are also a range of initiatives and development activities that are either planned, or are underway, that will further support the State’s net operating balance and reduce borrowing requirements, which have not yet been factored into the Budget. These include:
Asset and Liability Management
A new board will be established to oversee the economic and financial risks to the State’s Balance Sheet. This will provide the Government with central oversight of the identification and management of risks associated with whole-of government assets and liabilities.
This approach to managing the State’s assets and liabilities will ensure the Government effectively manages its financial assets to achieve the best outcomes for government as a whole.
Projects that support revenue growth
While the forward estimates period is critical to the Budget planning, ensuring growth prospects are being planned now, for the future, is also important. To support future economic growth, which in turn drives revenue growth, the Government is providing support for the projects of the future. These include:
| • | | North West Minerals Province |
| • | | Hydrogen industry development |
| • | | Releasing gas tenure to support domestic supply |
58
Budget Strategy and Outlook 2019-20
| • | | expansion of Port of Townsville and the Cairns Port |
| • | | further funding of Port of Gladstone |
| • | | Global tourism Gold Coast and Cairns. |
Borrowing costs have reduced
In addition to the improvement in the net operating balance from the measures outlined above, the State is benefitting from significant increased capacity to service its borrowing costs. As shown in Chart 3.1, the State’s interest expense as a proportion of revenue has reduced substantially, reflecting both the reduction in the level of borrowings achieved since 2015 and reductions in interest rates.
While an increase in borrowings is projected across the forward estimates in support of the capital program, the serviceability of existing borrowings has dramatically improved since 2014-15. This means a smaller portion of state revenue is now required to service Queensland’s debt. This provides greater capacity to reduce borrowings across the forward estimates.
From its peak in 2013-14 of 4.7%, Queensland’s interest expense as a proportion of revenue has declined over successive budgets and is projected to remain relatively flat across the forward estimates. From 2020-21, Queensland’s relative cost is below the average of the other states and territories, and is expected to be 2.8% of revenue in 2021-22.
| Chart 3.1 | General Government Sector – interest expense to total revenue |
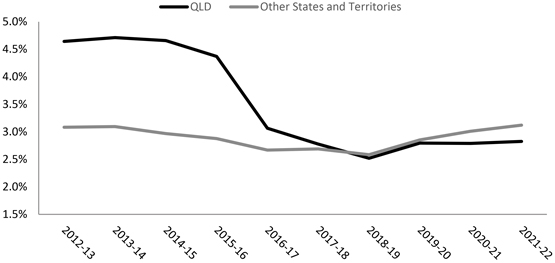
Note: 2022-23 not reported because some jurisdictions have not released their 2019-20 Budgets. AASB 16 Leases increases QLD annual interest expense by around $60 million per annum.
59
Budget Strategy and Outlook 2019-20
Infrastructure funding
To deliver a sustainable capital program, the Government has adopted two fiscal principles which ensure a consistent flow of capital works; and seek to limit the borrowings required to fund capital investment. The two principles (reported in Table 3.4) are:
| • | | Target net operating surpluses to ensure any new capital investment in the General Government Sector is funded primarily through recurrent revenues rather than borrowing. |
| • | | The capital program will be managed to ensure a consistent flow of works to support jobs and the economy and reduce the risk of backlogs emerging. |
Fiscal principles supporting capital investment management
The General Government Sector Cash Flow Statement (refer Chapter 9, Table 9.7) provides details of the sources of funding for capital investment.
It shows that in 2018-19, recurrent revenues (General Government cash inflows from operating activities) are expected to provide 79% of the funding required for new capital investment (General Government net investments in non-financial assets). This is a significant improvement from the 2018-19 Budget estimate of 60%.
The improved ratio means a greater share of capital investment is funded from recurrent revenues rather than borrowings.
General Government net operating cash flows as a proportion of net investment in non-financial assets will average 62% over the 2019-20 budget and forward estimates. This is also a significant improvement from the 2018-19 Budget which estimated an average ratio of 49% over four years. This improvement has been achieved despite the challenging fiscal environment which has seen significant downward revisions to transfer duty and GST revenues.
While the value of the capital program can fluctuate across financial years, the 2019-20 Budget provides for an average General Government Sector Purchase of Non-financial Assets (PNFA) of $7 billion across the budget and forward estimates. By maintaining the annual capital spend near the average, a consistent flow of works can be maintained which supports jobs and the economy and reduces the risk of backlogs emerging.
Fiscal principles supporting liabilities management
A primary objective of the Queensland Government in recent years has been to reduce General Government Sector debt.
Since 2015-16, the Queensland Government has achieved debt reductions both as a proportion of revenue and in real terms. This has allowed the Government to prioritise major infrastructure spending for all Queenslanders whilst keeping debt levels lower than the previous peak.
General Government Sector borrowing with QTC of $29.933 billion at 30 June 2019 is forecast to be $676 million lower than estimated at MYFER and around $7 billion lower than projected at the time of the 2015-16 Budget.
60
Budget Strategy and Outlook 2019-20
The General Government Sector’s debt to revenue ratio reduced from its peak in 2012-13 of 91% to a low of 54% in 2017-18 and 2018-19 budget years. The debt to revenue ratio for 2019-20 is estimated to be 64%, significantly lower than the 2012-13 peak. As shown in Chart 3.2, Queensland’s General Government Sector debt to revenue ratio is expected to be lower than that in Western Australia and Victoria across the forward estimates period.
| Chart 3.2 | General Government Sector debt to revenue ratio interjurisdictional comparison |
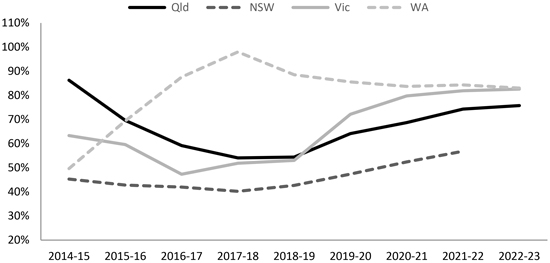
Note: At the time of publication of the Queensland 2019-20 State Budget, NSW had not yet released their 2019-20 Budget. Therefore, the NSW comparator does not include any potential increase in borrowings associated with AASB 16 Leases (refer Box 3.1).
The debt to revenue ratio in all states is impacted by changes in reported borrowing under AASB 16. From 2019-20, the debt to revenue ratio is estimated to be on average 3% higher across the budget and forward estimates due to the inclusion of operating leases (refer Box 3.1).
Leases and similar arrangements increase from 1 July 2019 due to the adoption of AASB 16 Leases ($2.2 billion for General Government Sector and $2.6 billion for NFPS, and recognition of new finance leases on the New Generation Rollingstock, Toowoomba Second Range Crossing as well as activity on the Cross River Rail PPP.
Across the forward estimates, the expected moderation in revenue growth and the timing of significant capital projects and associated borrowings, as well as the impacts of AASB 16, sees a gradual increase in the forecast debt to revenue ratio before a stabilisation in 2022-23. On average over the budget and forward estimates, the debt to revenue ratio is 71%.
In the NFPS, which comprises the General Government Sector and government-owned corporations, borrowing with QTC is forecast to be $68.141 billion at 30 June 2019. The NFPS debt to revenue ratio reached a peak in 2012-13 of 140.5% (while it had been expected to reach 146% at the time of the 2014-15 Budget, this was not realised). Since then the debt to revenue ratio is forecast to reach 123% in 2021-22 before reducing to 122% in the following year.
61
Budget Strategy and Outlook 2019-20
Like the General Government Sector debt to revenue ratio, the NFPS ratio will rise across the forward estimates, but remains lower than then estimates made in the 2014-15 Budget, as shown in Chart 3.3.
Through measures taken in the 2019-20 Budget, growth in NFPS borrowing is expected to halve from 6% in 2020-21 to only 3% by 2022-23, such that the NFPS debt to revenue ratio is expected to decline beyond 2021-22, while borrowing costs are at historical lows.
| Chart 3.3 | Non-financial Public Sector – Debt to Revenue Ratio |
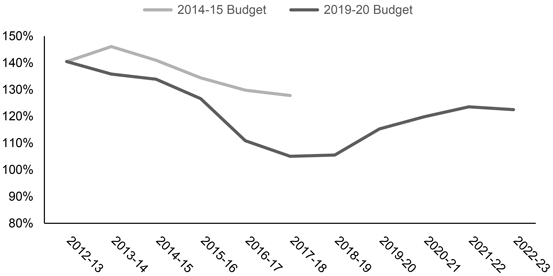
Another way of considering the sustainability of the State’s finances is the net debt measure, which factors in investments the State holds, as well as borrowings. Queensland is unique among Australian states in fully funding employee (superannuation) liabilities.
An interstate comparison of net debt shows that Queensland is well placed, with General Government net debt of $1.661 billion expected at 30 June 2019. Across the forward estimates period, Queensland’s net debt is expected to be lower than in New South Wales, Victoria and Western Australia, as shown in Chart 3.4.
62
Budget Strategy and Outlook 2019-20
| Chart 3.4 | General Government Sector net debt interjurisdictional comparison |
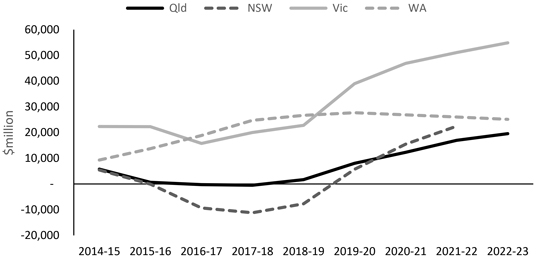
Note: At the time of publication of the Queensland 2019-20 State Budget, NSW had not yet released their 2019-20 Budget. Therefore, the NSW comparator does not include any potential increase in borrowings associated with AASB 16 Leases (refer Box 3.1).
The Government remains committed to maintaining the long-standing practice of ensuring that the State sets aside assets to meet long-term liabilities such as superannuation and WorkCover, in accordance with actuarial advice.
The State Actuary’s most recent valuations indicate that, as at 30 June 2018, both the defined benefit superannuation scheme and the WorkCover scheme were fully funded.
63
Budget Strategy and Outlook 2019-20
| 3.4 | Achievement of fiscal principles |
Table 3.4 provides a summary of the Government’s progress in meeting its fiscal principles’ targets.
| Table 3.4 | The fiscal principles of the Queensland Government |
| | | | | | | | | | | | | | | | |
Principle | | Indicator | |
| | | General Government debt to revenue ratio | |
| | | | | | | | | 2019-20 Budget % | |
Target ongoing reductions in Queensland’s relative debt burden, as measured by the General Government debt to revenue ratio. | | | | | | | 2018-19 MYFER | | | | Excludes | | | | Includes | |
| | | | | % | | | AASB 16 | | | AASB 16 | |
| | | | | | | | impact | | | impact | |
| Note: The debt to revenue ratio includes borrowings from QTC; leases and similar arrangements and securities and derivatives (refer Box 3.1). To allow comparison to MYFER, the 2019-20 Budget is reported as including and excluding the impact of AASB 16 Leases. | | | 2018-19 | | | | 56 | | | | 54 | | | | 54 | |
| | | 2019-20 | | | | 62 | | | | 61 | | | | 64 | |
| | | 2020-21 | | | | 65 | | | | 65 | | | | 69 | |
| | | 2021-22 | | | | 69 | | | | 71 | | | | 74 | |
| | | 2022-23 | | | | n.a. | | | | 73 | | | | 76 | |
| |
| | | General Government net operating cash flows as a
proportion of net investments in non-financial assets | |
| | | | | | | | | 2018-19 MYFER | | | 2019-20 Budget | |
| | | | | | | | | % | | | % | |
Target net operating surpluses that ensure any new capital investment in the General Government Sector is funded primarily through recurrent revenues rather than borrowing. | | | 2018-19 | | | | | | | | 70 | | | | 79 | |
| | | 2019-20 | | | | | | | | 44 | | | | 60 | |
| | | 2020-21 | | | | | | | | 48 | | | | 64 | |
| | | 2021-22 | | | | | | | | 44 | | | | 55 | |
| | | 2022-23 | | | | | | | | n.a. | | | | 70 | |
| |
| | | General Government purchases of non-financial assets | |
| | | | | | | | | 2018-19 MYFER | | | 2019-20 Budget | |
| | | | | | | | | $ million | | | $ million | |
The capital program will be managed to ensure a consistent flow of works to support jobs and the economy and reduce the risk of backlogs emerging. | | | 2018-19 | | | | | | | | 5,981 | | | | 6,060 | |
| | | 2019-20 | | | | | | | | 7,420 | | | | 6,727 | |
| | | 2020-21 | | | | | | | | 7,451 | | | | 7,125 | |
| | | 2021-22 | | | | | | | | 7,182 | | | | 7,963 | |
| | | 2022-23 | | | | | | | | n.a. | | | | 6,179 | |
64
Budget Strategy and Outlook 2019-20
| | | | | | |
Principle | | Indicator | |
Maintain competitive taxation by ensuring that General Government Sector own-source revenue remains at or below 8.5% of nominal gross state product, on average, across the forward estimates. | | General Government own-source revenue to GSP | |
| | 2019-20 Budget: | | | 8.5 | % |
| | Average across the forward estimates | | | 8.1 | % |
Target full funding of long-term liabilities such as superannuation and WorkCover in accordance with actuarial advice. | | As at the last actuarial review (as at June 2018), accruing superannuation liabilities were fully funded. The WorkCover scheme was also fully funded as at 30 June 2018. | | | | |
| | | | |
| | | | |
| | | | |
Maintain a sustainable public service by ensuring that overall growth in full-time equivalents (FTE) employees, on average over the forward estimates, does not exceed population growth. | | FTE growth | | | | |
| | Average across the forward estimates | | | 1.68 | % |
| | Population growth | | | | |
| | Average across the forward estimates | | | 13⁄4 | % |
65
Budget Strategy and Outlook 2019-20
Features
| • | | Total General Government Sector revenue is estimated to be $60.068 billion in 2018-19, $1.98 billion (or 3.4 per cent) higher than in 2017-18 and $2.330 billion (or 4.0 per cent) higher than estimated in the 2018-19 Budget. |
| • | | Total General Government Sector revenue is estimated to be $60.387 billion in 2019-20. The increase of $319 million (or 0.5 per cent) from 2018-19 is largely driven by higher than expected taxation revenue in 2019-20 due to the introduction of the waste disposal levy and taxation measures introduced in this budget. These are partially offset by lower current grants compared to 2018-19, driven by lower GST revenue and other Australian Government grants. |
| • | | Australian Government payments to Queensland in 2019-20 are expected to total $27.744 billion, representing a decrease of $628 million compared to payments in 2018-19. This decrease is driven by a $746 million (2.8 per cent) decrease in GST revenue and other Australian Government grants. This is partially offset by a $119 million (6.3 per cent) increase in Australian Government capital grants. |
| • | | The downward revision to GST revenue is primarily due to the Australian Government revising down its estimate of the GST pool and a reduction in Queensland’s share of the GST pool. Chapter 7 provides a detailed analysis on Queensland’s share of GST revenue and other Australian Government payments to Queensland. |
| • | | Total revenue is expected to grow at an average rate of 2.2 per cent over the four years to 2022-23. Revenue growth over this period is supported by average annual growth in taxation of 5.8% and current grants of 2.1 per cent but is also affected by declining royalties with coal prices expected to return to medium-term levels, lower interest income due to a reduction in the portfolio of financial assets held, and lower dividends from the Public Non-financial Sector. |
| • | | Queensland will maintain its competitive tax status, with per capita state tax estimated at $2,952 in 2019-20, compared to an average of $3,618 for the other states and territories. Taxation as a proportion of Queensland’s economy will be 4.0 per cent in 2019-20, down from the peak of 4.3 per cent in 2014-15. |
| • | | The Government will introduce changes to payroll tax to reduce the tax payable by small businesses by increasing the exemption threshold, introducing a rate reduction for regional employers, as well as providing a temporary rebate to businesses that take on new employees and will maintain its apprentice and trainee rebate until 30 June 2021. These measures will be partially funded by the introduction of a higher rate of 4.95% for businesses with taxable wages above $6.5 million per annum. Combined, the payroll tax package is estimated to have a net revenue reduction of $341 million over the four years ending 2022-23. |
66
Budget Strategy and Outlook 2019-20
| • | | The Government will increase land tax rates by 0.25 percentage points for companies and trustees with aggregated landholdings over $5 million. The absentee land tax surcharge will be increased to 2 per cent and will also apply to foreign companies and trustees of foreign trusts. Revenue is expected to increase by $778 million over the four years up to 2022-23. The definition of absentee for the purposes of land tax will also be refined to exclude Australian citizens and permanent residents holding permanent visas. |
| • | | The petroleum royalty rate will increase by 2.5 per cent to 12.5 per cent from 2019-20 onwards, with a transitional arrangement for one year for royalty payers who lodge and pay on an annual basis ending on 31 December 2019. This will lead to additional revenue of $476 million across the four years until 2022-23. |
| 4.1 | Queensland Revenue Outlook |
According to the latest National Account figures, GDP growth slowed to 1.8% (seasonally adjusted) over the year to March quarter 2019, the weakest annual growth since 2009. The Australian economy grew 0.4% in the March Quarter, while Queensland’s domestic activity did the heavy lifting with the strongest growth in state final demand of all the mainland states at 0.5% (seasonally adjusted) for the same period.
Like the rest of the nation, Queensland is relying on the Commonwealth to provide the fiscal stimulus to the economy necessary for growth. Queensland will continue to deliver economic growth and prosperity through the delivery of programs which directly and indirectly drive economic growth. However, like all states and territories, Queensland is reliant on the Commonwealth Government to implement policies and programs that drive growth.
Reserve Bank of Australia (RBA) Governor Philip Lowe has commented that he would prefer government pull its weight by cutting tax and boosting spending, especially on infrastructure, and through policies that make Australia more productive.
Speaking publicly in May, the RBA Governor stated:
“the best approach to delivering lower unemployment and a stronger economy is through structural policies that support firms expanding, investing, innovating and employing people. As we ease monetary policy, it is in the country’s interest that other policy options are considered too.”
Queensland will continue to implement programs with a positive impact on driving economic and revenue growth, through public spending on infrastructure and funding programs supporting private sector investment.
Key elements in this Budget to deliver growth are underpinned by the measures to make Queensland the most attractive place to establish and operate a business in the nation. The policy settings of the Queensland Government are firmly focused on driving opportunities for growth.
67
Budget Strategy and Outlook 2019-20
Queensland ownership of energy assets allows for the use of necessary levers to drive down energy costs to business and keep household costs low. Additionally, Queensland’s support for the LNG industry has delivered LNG revenues in 2018-19, with the value of LNG exports now twice the value of thermal coal exports. A continued commitment to growing this important export industry for the international market and providing tenements reserved for the production of gas for the domestic market will provide the necessary energy needs for industry and to provide additional exports from Queensland to the National Energy Market.
Since December 2016, 24 large-scale renewable projects have commenced operations, and a further 11 projects are financially committed or under construction in Queensland. This growth in the sector has led to significant employment gains, with the number of jobs in renewable energy increasing to 5,080 in 2017-18, a 44% growth over the year.
Queensland continues to focus its efforts on policies which drive capital investments in sectors and initiatives which will in turn grow investment and revenues including:
North West Minerals Province: Provisioning for a more efficient and effective route to export for the North West corridor for minerals of the future. Providing support for this area to open up new mineral resource to meet emerging domestic and global demand for resources. This will grow the industry and grow the resource revenue base.
Export Hubs: The Government is currently working with industry to grow export hubs. This has progressed to business case stage with $10 million to partner with the private sector to deliver an export facility to expedite channels to market for Queensland agriculture and horticulture products.
Expansions at the Port of Townsville and the Cairns Port: To drive trade revenues.
Further funding to the Port of Gladstone: To grow capacity and export efficiency which in turn will grow royalty revenues.
Hydrogen Strategy: $19 million to establish an agenda for renewable hydrogen industry attraction and to incentivise job creation, regional growth and increased innovation and development.
Global Tourism Gold Coast and Cairns: The Government is in the market for proposals from the private sector to deliver world-class tourism infrastructure to develop integrated resorts. These will have a broad range of tourist related facilities and attractions, and provide high-quality accommodation and a range of experiences encouraging longer visitor stays and greater tourism expenditure.
Advanced manufacturing: The Queensland Government is supporting the development of advanced manufacturing technologies, systems, products and services. The manufacturing sector is a major contributor to jobs and the economy. The Rheinmetall Defence Australia manufacturing facility based in Ipswich is playing a key role in further developing Queensland’s heavy vehicle and defence manufacturing capability
68
Budget Strategy and Outlook 2019-20
The Government recognises the positive impact of these initiatives on driving revenue growth. Importantly, any revenues which may flow from these investments have not been incorporated in the forward estimates. However, Government considers these as providing the foundation for future potential revenue streams as the benefits from the investments begin to flow into the State’s economy.
| 4.2 | 2018-19 estimated actual |
General Government Sector revenue in 2018-19 is estimated to be $60.068 billion, which is $2.33 billion (or 4.0%) more than the 2018-19 Budget estimate. Significant variations from the 2018-19 Budget estimates include:
| • | | a $796 million (or 3.1%) increase in current grants, mainly due to additional funding from the Australian Government under Disaster Recovery Funding Arrangements to support North Queensland communities recover from the impacts of the 2019 floods and the upfront payment of a three-year agreement to assist disaster-affected primary producers in North and Far North Queensland. |
| • | | a $750 million (or 16.2%) increase in revenue from royalties and land rents, mainly resulting from higher coal prices continuing for longer than expected in the 2018-19 Budget, with $677 million of this revision made at the 2018-19 MYFER. |
| • | | a $247 million (or 37.0%) increase in income tax equivalent income supported by increased earnings from electricity generation and network businesses. |
These increases were partially offset by lower than estimated taxation revenue.
69
Budget Strategy and Outlook 2019-20
| Table 4.1 | General Government Sector revenue1 |
| | | | | | | | | | | | | | | | | | | | | | | | | | | | |
| | | 2017-18 | | | 2018-19 | | | 2018-19 | | | 2019-20 | | | 2020-21 | | | 2021-22 | | | 2022-23 | |
| | | Actual | | | Budget | | | Est. Act. | | | Budget | | | Projection | | | Projection | | | Projection | |
| | | $ million | | | $ million | | | $ million | | | $ million | | | $ million | | | $ million | | | $ million | |
Taxation revenue | | | 13,244 | | | | 14,155 | | | | 14,005 | | | | 15,164 | | | | 15,777 | | | | 16,601 | | | | 17,525 | |
Sales of goods and services | | | 5,884 | | | | 5,731 | | | | 5,869 | | | | 6,004 | | | | 6,190 | | | | 6,307 | | | | 6,389 | |
Interest income | | | 2,389 | | | | 2,201 | | | | 2,247 | | | | 2,141 | | | | 2,006 | | | | 1,953 | | | | 1,958 | |
Grants revenue | | | | | | | | | | | | | | | | | | | | | | | | | | | | |
GST Revenue | | | 15,129 | | | | 14,794 | | | | 14,441 | | | | 14,214 | | | | 14,204 | | | | 14,907 | | | | 15,357 | |
Other current grants | | | 10,968 | | | | 11,207 | | | | 12,356 | | | | 11,789 | | | | 12,873 | | | | 13,219 | | | | 13,790 | |
Capital grants | | | 1,870 | | | | 1,700 | | | | 1,913 | | | | 2,000 | | | | 2,769 | | | | 2,545 | | | | 2,256 | |
Dividend and income tax equivalent income | | | | | | | | | | | | | | | | | | | | | |
Dividends | | | 1,909 | | | | 1,552 | | | | 1,749 | | | | 1,473 | | | | 1,054 | | | | 1,080 | | | | 1,205 | |
Income tax equivalent income | | | 1,010 | | | | 666 | | | | 912 | | | | 764 | | | | 600 | | | | 600 | | | | 642 | |
Other revenue | | | | | | | | | | | | | | | | | | | | | | | | | | | | |
Royalties and land rents | | | 4,457 | | | | 4,615 | | | | 5,364 | | | | 5,621 | | | | 4,770 | | | | 4,799 | | | | 4,918 | |
Other | | | 1,228 | | | | 1,118 | | | | 1,211 | | | | 1,217 | | | | 1,487 | | | | 1,572 | | | | 1,500 | |
Total revenue | | | 58,087 | | | | 57,738 | | | | 60,068 | | | | 60,387 | | | | 61,729 | | | | 63,583 | | | | 65,540 | |
Notes:
| 1. | Numbers may not add due to rounding. |
| 2. | Queensland Treasury estimates. Differs from Chapter 7 due to the inclusion of direct Australian Government payments to Queensland agencies for Commonwealth own purpose expenditure. |
| 4.3 | 2019-20 revenue by category |
General Government Sector revenue in 2019-20 is estimated to be $60.387 billion, $319 million (or 0.5%) higher than the 2018-19 estimated actual revenue of $60.068 billion. The revenue increase in 2019-20 reflects a range of factors, including:
| • | | Taxation revenue is expected to be $1.159 billion higher than in 2018-19, reflecting the introduction of the new waste disposal levy, the new measures outlined in Section 4.3, and expected annual growth in most tax lines. |
| • | | Royalty collections are expected to be $252 million higher than in 2018-19, reflecting the new petroleum royalty rate and increased revenue from other royalties, including base and precious metals. |
| • | | These increases were partially offset by current grants that are expected to be $794 million lower in 2019-20 than in 2018-19, mainly due to lower GST and other Australian Government payments. Dividends and income tax equivalent income are also forecast to be $424 million lower in 2019-20. |
70
Budget Strategy and Outlook 2019-20
Major sources of General Government Sector revenue in 2019-20 are grants revenue (46.4%) and taxation revenue (25.1%). Table 4.1 details revenue estimates by category, and Chart 4.1 illustrates the composition of General Government Sector revenue.
| Chart 4.1 | Revenue by operating statement category, 2019-201 |
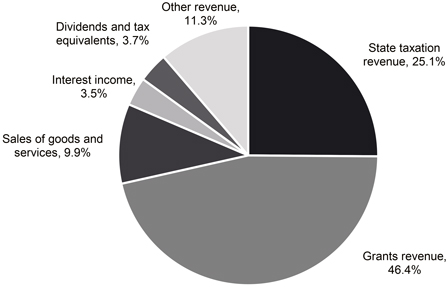
Note:
| 1. | Numbers may not add up to 100% due to rounding. |
| 4.4 | 2019-20 Budget initiatives |
The 2019-20 Budget introduces new revenue measures including:
| • | | changes to payroll tax including: |
| | • | | reducing tax payable for small businesses by increasing the exemption threshold to $1.3 million |
| | • | | introducing a 1% rate reduction for regional employers |
| | • | | providing a temporary rebate of up to $20,000 to businesses taking on new employees |
| | • | | continuing the 50% payroll tax rebate on the wages of apprentices and trainees until 30 June 2021 |
| | • | | increasing the payroll tax rate for employers with taxable wages above $6.5 million |
| • | | changes to land tax including: |
| | • | | changes to the definition of absentee for land tax to ensure that Australian citizens and permanent residents who hold permanent visas are not absentees |
71
Budget Strategy and Outlook 2019-20
| | • | | increases to land tax rates for companies and trustees with aggregated landholdings over $5 million |
| | • | | an increase in the absentee land tax surcharge from 1.5% to 2% |
| | • | | introduction of a foreign land tax surcharge of 2% applying to foreign companies and trustees of foreign trusts |
| • | | increasing the petroleum royalty rate from 10% to 12.5% of wellhead value from 2019-20 onwards |
| • | | increasing resourcing for Treasury to undertake a program of additional targeted tax compliance activities to ensure all Queenslanders are paying their fair share of taxes. |
The Government will increase the payroll tax threshold from $1.1 million to $1.3 million, while retaining the current $1 in $4 rate of reduction so that a deduction will be available if total annual Australian taxable wages are less than $6.5 million. This will reduce the amount of tax paid by around 12,000 employers and around 1,500 employers will no longer form part of the payroll tax base.
A payroll tax increase for employers (or groups of employers) with taxable wages above $6.5 million of 0.2% to 4.95% will also be introduced. The tax rate of 4.75% will be maintained for employers with annual taxable wages of $6.5 million or less.
The Government will provide a 1% discount of the payroll tax rate to employers that have an ABN registered business address and at least 85% of their taxable wages paid to employees located outside South-East Queensland. Accordingly, a tax rate of 3.75% or 3.95% as applicable will apply to those businesses.
A payroll tax rebate of up to $20,000 per employer per year will also be provided, for the 2019-20 and 2020-21 financial years, to employers that can demonstrate a net increase in full time employees. The rebate will be paid in the 2020-21 and 2021-22 financial years.
The Government is continuing the 50% payroll tax rebate on the wages of apprentices and trainees until 30 June 2021.
Combined, the payroll tax package is estimated to have a net revenue reduction of $341 million over the four years ending 2022-23.
| 4.4.2 | Petroleum royalty rate |
The petroleum royalty rate will increase from 10% to 12.5% of wellhead value from 2019-20 onwards, with a transitional arrangement for one year for royalty payers who lodge and pay on an annual basis ending on 31 December 2019. This measure will increase revenue by $476 million across the four years to 2022-23.
72
Budget Strategy and Outlook 2019-20
An increased petroleum royalty rate helps ensure a reasonable return is made to the community for the extraction of Queensland resources, and a rate of 12.5% for petroleum remains competitive with other royalty regimes internationally. For example, petroleum royalties in the USA and Canada are generally charged at a rate between 12.5% and 30% of the wellhead value. The new petroleum royalty rate is comparable with the near-term average royalty rate of just around 12% for high quality coking (metallurgical) coal at current prices.
The Government will also review the design of Queensland’s current petroleum royalty regime to ensure greater certainty and equity for all parties and consider if there are opportunities to simplify the current regime, while providing an appropriate return to Queenslanders. While the Government has already taken measures to ensure greater certainty of domestic gas supply (for example, through release of gas tenures specifically to supply domestic gas), the review will identify further opportunities to strengthen domestic supply through the royalty regime settings.
| 4.4.3 | Company, Trustee and Absentee land tax |
For companies and trustees with aggregated landholdings over $5 million, the Government will increase land tax rates by:
| • | | 0.25 cents to 2.25 cents for each dollar above $5 million |
| • | | 0.25 cents to 2.75 cents for each dollar above $10 million. |
These changes are estimated to increase revenue by $238 million over the four years to 2022-23. The land tax rates for resident individuals remain unchanged.
For the 2019-20 Budget, the Government is changing the land tax policy settings for foreign companies and trustees of foreign trusts, which will be subject to a foreign surcharge from the 2019-20 land tax assessment year. This surcharge will be 2% and at the same time, the absentee surcharge is being increased from 1.5% to 2%.
The Government recognises that there may be particular landholdings where it would be appropriate, having regard to exceptional circumstances to be considered on a case-by-case basis, to grant foreign companies and trustees of foreign trusts ex gratia relief from the new foreign surcharge. Prior to 30 June 2019, the Office of State Revenue will commence consultation with property industry bodies on the arrangements for administering relief.
The Government is also making changes to the definition of absentee for land tax to ensure that Australian citizens and permanent residents who hold permanent visas are not absentees. Currently, a person may be considered an absentee if they do not ordinarily reside in Australia, including a person who is absent from Australia on 30 June or has been absent from Australia for more than 6 months ending on 30 June. Factors such as the reason for absence and the time spent outside of Australia are taken into consideration when determining an absentee status. This can result in Australian citizens and permanent residents being classed as absentees, with a lower tax-free threshold, higher rates of land tax and an additional land tax surcharge applying to them.
73
Budget Strategy and Outlook 2019-20
From the 2019-20 land tax assessment year, Australian citizens and permanent residents holding permanent visas who do not ordinarily reside in Australia will no longer be assessed as absentees for land tax purposes. This means they will benefit from the higher tax-free threshold of $600,000 and lower rates of land tax currently applying to resident individuals and will not be subject to the absentee surcharge.
Increasing the surcharge to 2% and refining its application to exclude Australian citizens and permanent residents brings Queensland’s land tax policy settings into closer alignment with those of New South Wales and Victoria.
In net terms, changes to the definition of absentee and the increased absentee surcharge rate together with the extension of the surcharge will raise an estimated $540 million additional revenue over the four years to 2022-23.
The Government will increase resourcing for Treasury to undertake a program of additional targeted tax compliance activities to ensure all Queenslanders are paying their fair share of taxes, reconciling with broader public interest. The program will target key taxes such as payroll tax, land tax, transfer duty and royalties. It will maintain the integrity of the state tax base and build further community confidence in the equity and fairness of Queensland’s tax system and its administration.
The compliance work program is expected to increase compliance-related revenue, net of the additional costs, by $220 million over the four years ending 2022-23. It will also generate additional recurrent revenues from the entry of new tax payers into the tax system.
| 4.5 | Queensland’s revenue trends |
Total revenue growth is mainly driven by growth in GST, royalties, and taxation.
Total revenue growth is estimated to be 2.2% on average over the four years to 2022-23. This is far lower than the 7.3% average growth over the last fifteen years to 2017-18. This lower growth is driven by slower growth in GST revenue provided by the Australian Government. GST revenue accounts for 23.5% of total revenue expected in 2019-20, however it is only expected to grow by 1.5% per year on average over the four years to 2022-23.
Royalties were the largest driver of growth in 2018-19, due to the continued strength in the hard coking coal price. In 2019-20, taxation revenue contributes the largest proportion to growth. In 2020-21 royalties and GST revenue are both expected to decline.
Chart 4.2 examines the contribution of the key revenue sources of GST, taxation and royalties to revenue growth and incorporates the impacts of new measures discussed in Section 4.3.
74
Budget Strategy and Outlook 2019-20
| Chart 4.2 | Growth in key revenues1 |
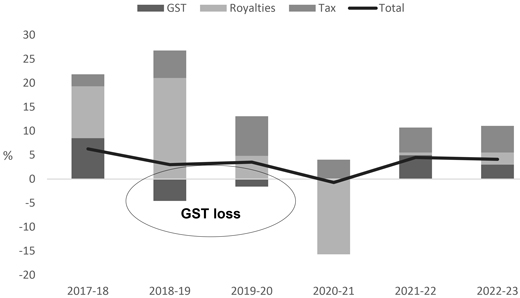
Note:
| 1. | Annual growth in GST, royalties, and taxes. Total is the annual growth of the sum of the three categories. |
Queensland’s GST revenue is expected to decline in 2019-20, compared to 2018-19. This decline in GST revenue is primarily because the Australian Government
| • | | significantly revised down the growth of the GST pool from 2018-19 |
| • | | determined that Queensland has improved its fiscal capacity to deliver services relative to other states, and therefore requires a lesser share of GST. |
As a result, despite the GST pool continuing to grow, albeit slower than previously forecast, Queensland is the only state to receive less GST revenue in 2019-20 than in 2018-19.
Revisions to the GST pool
The decrease in GST revenue in 2019-20 reflects the Australian Government’s outlook for the size of the GST pool. Since the Australian Government’s 2018-19 Budget, the GST pool estimate is around $11 billion lower over the years 2018-19 to 2021-22.
Chart 4.3 compares GST revenue pool forecasts published in the 2018-19 and 2019-20 Australian Budgets. This reflects that the GST pool forecasts at the 2019-20 Australian Budget are lower in each year compared to those forecast at the 2018-19 Australian Budget.
75
Budget Strategy and Outlook 2019-20
| Chart 4.3 | Australian Government forecast of GST revenue pool |
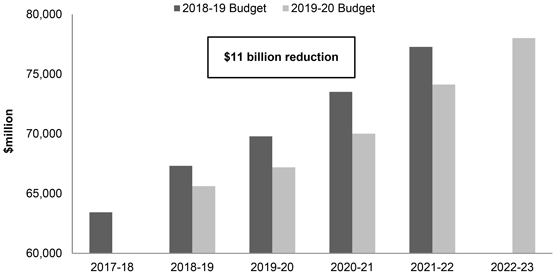
Changes to assessed fiscal capacity
A further driver for the decline in Queensland’s GST revenue is the Australian Government accepting the Commonwealth Grants Commission’s (CGC’s) assessment that Queensland’s fiscal capacity has strengthened relative to other states and territories. This reflects improved mining royalties, lower natural-disaster-related expenditure, and a greater share of other Australian Government grants. Queensland is the only state to receive less GST revenue in 2019-20 compared to 2018-19.
Queensland’s value of coal production increased substantially between 2014-15 and 2017-18, which increased its revenue raising capacity and reduced its GST share. Between 2014-15 and 2017-18, the value of coal production rose by more than any other mineral. This increased the revenue raising capacity of the biggest coal producer, Queensland, and reduced the capacities of other States.
Queensland’s net natural disaster expenses were significantly lower in 2017-18 compared to 2014-15.
A further driver to the downward revision to Queensland’s relativity in 2019-20 was the CGC’s decision to adjust its method for assessing natural disaster expenditure, ignoring state expenditure on disaster-affected local government infrastructure.
76
Budget Strategy and Outlook 2019-20
| 4.5.2 | Royalty revenue trends |
Royalties were the largest driver of growth in 2018-19, due to the continued strength in the hard coking coal price. Lower revenue growth from royalties is expected in 2019-20 compared to 2018-19 due to an expected decline in coal prices during 2019-20.
Total royalty revenue is expected to decline in 2020-21 in line with coal prices gradually declining to medium-term levels by early 2021. This is followed by growth of 0.6% in 2021-22 and 2.5% in 2022-23.
| 4.5.3 | Taxation revenue trends |
Total revenue growth over the forward estimates is mainly driven by moderate taxation revenue growth, averaging 5.8% over the four years to 2022-23, supported by expected growth in major taxes such as payroll tax, transfer duty and land tax, and by the introduction of the Waste Disposal Levy. Taxation revenue as a proportion of Queensland’s economy will remain stable over this period rising only slightly from 4.0% in 2019-20 to 4.1% in 2022-23, below the recent peak of 4.3% in 2014-15.
Total revenue from taxation is expected to grow by 8.3% in 2019-20, following an estimated increase of 5.7% in 2018-19. Chart 4.4 indicates the composition of estimated State taxation revenue for 2019-20. The largest sources are payroll tax and transfer duty, which together represent around 48.3% of the State’s total taxation revenue in 2019-20.
Payroll tax has a relatively stable base with its growth usually driven by the underlying strength of the economy. Transfer duty can present some variability reflecting residential and non-residential market conditions. While land tax can reflect variability in the property market, this impact is moderated by a relatively stable base and the effect on assessments from three-year averaging of land values.
77
Budget Strategy and Outlook 2019-20
| Chart 4.4 | State taxation by tax category, 2019-201 |
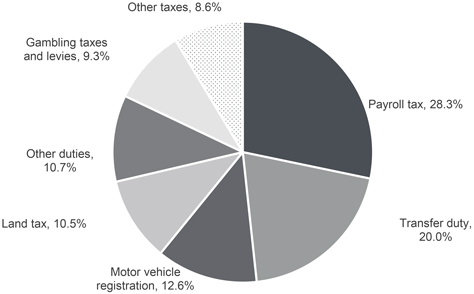
Note:
| 1. | Percentages may not add to 100% due to rounding. ‘Other duties’ includes vehicle registration duty, insurance duty and other minor duties. ‘Other taxes’ includes the Emergency Management Levy, Waste Disposal Levy, guarantee fees and other minor taxes. |
Table 4.2 shows the main components of taxation revenue. Increases in 2019-20 are driven by the introduction of the Waste Disposal Levy and other new revenue measures commencing in 2019-20. In addition, 2019-20 is the first full year in which the 15% betting tax applies, which commenced on 1 October 2018. This was introduced in the 2018-19 Budget in response to changing consumer behaviour facilitated by increased use of online and interactive technologies.
78
Budget Strategy and Outlook 2019-20
| Table 4.2 | State taxation revenue1 |
| | | | | | | | | | | | | | | | | | | | | | | | |
| | | 2017-18
Actual
$ million | | | 2018-19
Est. Act.
$ million | | | 2019-20
Budget
$ million | | | 2020-21
Projection
$ million | | | 2021-22
Projection
$ million | | | 2022-23
Projection
$ million | |
Payroll tax | | | 3,906 | | | | 4,158 | | | | 4,284 | | | | 4,435 | | | | 4,728 | | | | 5,107 | |
Duties | | | | | | | | | | | | | | | | | | | | | | | | |
Transfer | | | 3,023 | | | | 3,049 | | | | 3,038 | | | | 3,205 | | | | 3,383 | | | | 3,578 | |
Vehicle registration | | | 543 | | | | 557 | | | | 583 | | | | 611 | | | | 640 | | | | 670 | |
Insurance2 | | | 894 | | | | 957 | | | | 1,005 | | | | 1,056 | | | | 1,108 | | | | 1,164 | |
Other duties3 | | | 37 | | | | 35 | | | | 36 | | | | 37 | | | | 39 | | | | 40 | |
Total duties | | | 4,498 | | | | 4,598 | | | | 4,663 | | | | 4,909 | | | | 5,170 | | | | 5,451 | |
Gambling taxes and levies | | | | | | | | | | | | | | | | | | | | | | | | |
Gaming machine tax | | | 715 | | | | 733 | | | | 765 | | | | 797 | | | | 832 | | | | 867 | |
Health Services Levy | | | 85 | | | | 90 | | | | 98 | | | | 107 | | | | 116 | | | | 127 | |
Lotteries taxes | | | 256 | | | | 306 | | | | 314 | | | | 322 | | | | 331 | | | | 340 | |
Wagering taxes | | | 9 | | | | 74 | | | | 101 | | | | 103 | | | | 105 | | | | 108 | |
Casino taxes and levies | | | 104 | | | | 110 | | | | 113 | | | | 117 | | | | 120 | | | | 124 | |
Keno tax | | | 20 | | | | 19 | | | | 20 | | | | 21 | | | | 22 | | | | 22 | |
Total gambling taxes and levies | | | 1,190 | | | | 1,331 | | | | 1,410 | | | | 1,466 | | | | 1,526 | | | | 1,588 | |
Other taxes | | | | | | | | | | | | | | | | | | | | | | | | |
Land tax | | | 1,180 | | | | 1,331 | | | | 1,589 | | | | 1,670 | | | | 1,744 | | | | 1,807 | |
Motor vehicle registration | | | 1,770 | | | | 1,847 | | | | 1,908 | | | | 1,977 | | | | 2,049 | | | | 2,124 | |
Emergency Management Levy | | | 512 | | | | 538 | | | | 559 | | | | 584 | | | | 610 | | | | 637 | |
Waste Disposal Levy | | | — | | | | — | | | | 433 | | | | 397 | | | | 413 | | | | 435 | |
Guarantee fees | | | 138 | | | | 154 | | | | 271 | | | | 291 | | | | 311 | | | | 324 | |
Other taxes4 | | | 51 | | | | 48 | | | | 47 | | | | 48 | | | | 49 | | | | 50 | |
Total taxation revenue | | | 13,244 | | | | 14,005 | | | | 15,164 | | | | 15,777 | | | | 16,601 | | | | 17,525 | |
Notes:
| 1. Numbers | may not add due to rounding. |
| 2. Includes | duty on accident insurance premiums. |
| 3. Includes | duty on life insurance premiums. |
| 4. Includes | the Statutory Insurance Scheme Levy and Nominal Defendant Levy. |
79
Budget Strategy and Outlook 2019-20
| 4.6.1 | Queensland’s competitive tax status |
Taxation can impact on business decisions regarding investment and employment, and household investment and home ownership. Maintaining the competitiveness of Queensland’s tax system provides a competitive advantage to business and moderates the tax burden for its citizens, and is therefore fundamental to the Government’s commitment to job creation and sustainable development.
One of the Government’s fiscal principles is to maintain competitive taxation by ensuring General Government Sector own-source revenue remains at or below 8.5% of nominal gross state product (GSP), on average, across the forward estimates. Own-source revenue is the total State revenue less any grants received from external sources, mainly the Australian Government. On average, over the years 2018-19 to 2022-23, General Government own-source revenue is expected to account for 8.1% of nominal GSP, reducing from 8.5% in 2018-19 to 7.9% in 2022-23. Chapter 3 provides more detail on the Government’s fiscal principles.
As Chart 4.5 shows, taxation per capita in Queensland is lower than the average taxation per capita in the other states and territories. In 2019-20, it is estimated that Queensland’s taxation per capita of $2,952 will be $666 per capita less than the average of other jurisdictions. This is more competitive than 2014-15 when Queensland’s taxation per capita was $589 per capita below other jurisdictions.
| Chart 4.5 | Taxation per capita, 2019-20 |
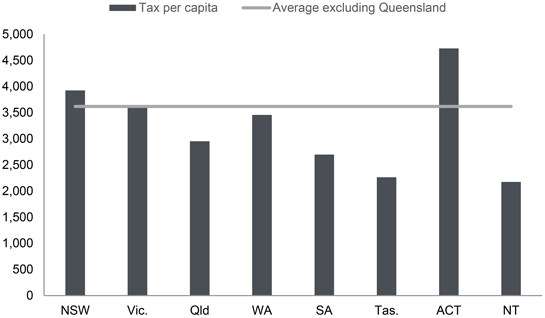
Sources: 2019-20 Budgets for all jurisdictions except NSW, where Pre-Election Budget Update is used, and SA where 2018-19 Mid-year Update is used. Population data from 2019-20 Australian Budget.
80
Budget Strategy and Outlook 2019-20
Table 4.3 demonstrates that the Queensland tax system remains amongst the most competitive in Australia, using various measures of tax competitiveness.
Queensland’s tax effort, as measured by the CGC, was 10.9% below the national average in 2017-18. A third measure of competitiveness, taxation as a share of GSP, also confirms that Queensland’s taxes are competitive with other states.
The taxation effort metric is based on 2017-18 data from the CGC’s 2019 Update using total tax revenue effort for assessed taxes (payroll, transfer duty, land tax, insurance duty and motor vehicle taxes). Revenue raising effort ratios are an indicator of the extent to which governments burden their revenue bases.
| Table 4.3 | Tax competitiveness |
| | | | | | | | | | | | | | | | | | | | | | | | | | | | | | | | | | | | |
| | | NSW | | | Vic. | | | Qld | | | WA | | | SA | | | Tas.3 | | | ACT4 | | | NT3 | | | Avg5 | |
Taxation per capita1($) | | | 3,926 | | | | 3,637 | | | | 2,952 | | | | 3,455 | | | | 2,697 | | | | 2,264 | | | | 4,729 | | | | 2,175 | | | | 3,618 | |
Taxation effort (%) | | | 103.9 | | | | 101.7 | | | | 89.1 | | | | 101.7 | | | | 103.9 | | | | 89.4 | | | | 95.9 | | | | 89.7 | | | | 100.0 | |
Taxation % of GSP2 (%) | | | 5.2 | | | | 5.4 | | | | 3.8 | | | | 3.3 | | | | 4.3 | | | | 3.8 | | | | 4.3 | | | | 2.4 | | | | 4.7 | |
Notes:
| 1. | 2019-20 Budgets for all jurisdictions except NSW, where Pre-Election Budget Update is used, and SA where 2018-19 Mid-year Update is used. Population data from 2019-20 Australian Budget. |
| 2. | 2017-18 data. Sources: Australian Bureau of Statistics 5512.0 and ABS 5220.0. |
| 3. | Low taxation per capita primarily reflects the lower revenue raising capacity of those jurisdictions. |
| 4. | Figures include municipal rates. |
| 5. | Weighted average of states and territories, excluding Queensland (aside from taxation effort, which is the average of all states). |
Changes to payroll tax, as discussed in Section 4.3, will benefit small business and support employment growth in businesses. Additionally, the businesses with annual taxable wages greater than $6.5 million will be subject to a slightly higher payroll tax rate.
All regional businesses subject to payroll tax can benefit from the discounted payroll tax rate and those businesses that can demonstrate a net increase in full time employees can benefit from a payroll tax rebate of up to $20,000 per employer per year.
A deduction will be available if an employer’s total annual Australian taxable wages are up to $6.5 million. The maximum annual deduction will be $1.3 million which phases out at a rate of $1 for every $4 of taxable wages above the threshold.
The increased payroll tax threshold of $1.3 million is designed to ensure small businesses are subject to either no or minimal payroll tax.
The average annual payroll tax growth is forecast to be 5.3% over the four years to 2022-23, compared to the average of 7.4% over the period from 2002-03 to 2017-18.
81
Budget Strategy and Outlook 2019-20
Transfer duty
There are no changes to transfer duty rates in the 2019-20 Budget. Transfer duty is charged at various rates on the transfer of real and business property. The Queensland Government offers extensive concessions for the transfer of land where the property is purchased as a home. For example, eligible home buyers pay a 1% concessional rate on dutiable values up to $350,000, rather than the normal schedule of rates between 1.5% and 3.5%. If a first home buyer purchases a property up to $500,000 they will pay no duty, with reduced rates available up to $550,000.
After growing by 0.9% in 2018-19, revenue from transfer duty is expected to be 0.3% lower in 2019-20. Revenue from transfer duty is expected to grow at an average rate of 4.1% over the four years to 2022-23.
Compared to the 2018-19 Budget forecasts, revenue from transfer duty is expected to be 5.1% lower in 2018-19, and on average around 10% lower in each of the out years.
These revisions are largely due to lower than expected revenue from residential transfer duties compared with the 2018-19 Budget. Revenue from residential transfer duties have been revised down from the 2018-19 Budget by 13% in 2018-19, and 15.6% in 2019-20.
These revisions are driven by a sharp decline in the volume of residential property transactions experienced over the first half of 2018-19, particularly for investors. With transaction volumes appearing to have stabilised over recent months, the scale of transfer duty revisions is much lower than seen in Victoria and New South Wales. This is also partly due to house prices in Queensland remaining relatively stable, compared with significant declines in the southern capitals.
Recent improvement has occurred with auction clearance rates and sale prices in NSW and Victoria showing signs of improvement. Additionally, the RBA’s recent cut to its official interest rate by 0.25 percentage points to 1.25% and APRA’s decision to ease lending standards may provide some improvement in the market conditions in 2019-20.
The downward revisions in 2018-19 are partially offset by an upward revision to transfer duty from large transactions of 17.1% since the 2018-19 Budget. Following this strong growth in 2018-19 collections, growth in transfer duty from large transactions is expected to normalise in 2019-20 although these transactions can be volatile.
Vehicle registration duty
There are no changes to vehicle registration duty rates in the 2019-20 Budget. Vehicle registration duty is charged on the dutiable value of a motor vehicle on the transfer or initial registration, with a general rate of 2% to 4% dependent on the number of cylinders or rotors of the vehicle. Since 1 July 2018, an additional $2 per $100 of dutiable value applies for vehicles valued above $100,000.
Revenue from vehicle registration duty is expected to grow by 4.7% in 2019-20.
82
Budget Strategy and Outlook 2019-20
| 4.6.4 | Gambling taxes and levies |
There are no changes to gambling tax rates in the 2019-20 Budget. A range of gambling activities are subject to State taxes and levies. Total gambling tax and levy collections are estimated to grow by 5.9% in 2019-20, and 4.5% on average over the four years to 2022-23, with these growth rates supported by increased revenue from the point of consumption tax on betting (betting tax).
Land tax is levied on the taxable value of the landowner’s aggregated holdings of freehold land owned in Queensland as at midnight on 30 June each year. The landowner’s home is exempt.
Resident individuals are generally liable for land tax if the total taxable value of the freehold land owned by that person as at 30 June is equal to or greater than $600,000. Companies, trustees and absentees are liable for land tax if the total taxable value of the freehold land owned as at 30 June is equal to or greater than $350,000.
Land tax is estimated to grow to $1.589 billion in 2019-20 and this includes the impact of new marginal land tax rates for companies and trustees and the changes to the absentee land tax surcharge as outlined in Section 4.4.3.
The Waste Disposal Levy, announced in the 2018-19 Budget, will commence on 1 July 2019 and will apply to 39 local government areas, covering more than 90% of the State’s population. The waste disposal levy will apply to all general waste streams.
The levy will be set at $75 per tonne for general waste, increasing by $5 per annum for the first three years. Seventy per cent of proceeds from the waste levy will be used for waste programs, environmental priorities and community purposes.
Revenue of around $433 million is expected from the Waste Disposal Levy in 2019-20. This is expected to decline to around $397 million in 2020-21, reflecting expected behavioural changes in waste being disposed of in landfill following the introduction of the levy.
Tax expenditures are reductions in tax revenue that result from the use of the tax system as a policy tool to deliver Government policy objectives. Tax expenditures are provided through a range of concessions, including tax exemptions, reduced tax rates, tax rebates, tax deductions and provisions which defer payment of a tax liability to a future period. Appendix B provides details of tax expenditure arrangements currently provided by the Queensland Government.
83
Budget Strategy and Outlook 2019-20
Grants revenue is comprised of Australian Government grants, grants from the community and industry, and other miscellaneous grants. The 2.5% decline in grants revenue in 2019-20 is driven by a decline in GST revenue and other Australian Government grants.
| | | | | | | | | | | | | | | | | | | | | | | | |
| | | 2017-18
Actual
$ million | | | 2018-19
Est. Act.
$ million | | | 2019-20
Budget
$ million | | | 2020-21
Projection
$ million | | | 2021-22
Projection
$ million | | | 2022-23
Projection
$ million | |
Current grants | | | | | | | | | | | | | | | | | | | | | | | | |
GST revenue grants2 | | | 15,129 | | | | 14,441 | | | | 14,214 | | | | 14,204 | | | | 14,907 | | | | 15,357 | |
Other Australian Government Grants3 | | | 10,665 | | | | 12,053 | | | | 11,534 | | | | 12,625 | | | | 12,972 | | | | 13,543 | |
Other grants and contributions | | | 303 | | | | 303 | | | | 255 | | | | 248 | | | | 247 | | | | 248 | |
Total current grants | | | 26,096 | | | | 26,797 | | | | 26,003 | | | | 27,077 | | | | 28,126 | | | | 29,147 | |
Capital grants | | | | | | | | | | | | | | | | | | | | | | | | |
Australian Government grants | | | 1,782 | | | | 1,878 | | | | 1,997 | | | | 2,769 | | | | 2,524 | | | | 2,242 | |
Other grants and contributions | | | 88 | | | | 35 | | | | 4 | | | | 0 | | | | 21 | | | | 14 | |
Total capital grants | | | 1,870 | | | | 1,913 | | | | 2,000 | | | | 2,769 | | | | 2,545 | | | | 2,256 | |
Total Australian Government payments | | | 27,576 | | | | 28,372 | | | | 27,744 | | | | 29,597 | | | | 30,403 | | | | 31,141 | |
Total grants revenue | | | 27,965 | | | | 28,709 | | | | 28,003 | | | | 29,846 | | | | 30,670 | | | | 31,404 | |
Note:
| 1. | Numbers may not add due to rounding. |
| 2. | Includes entitlements to payments associated with the ‘no worse off’ guarantee as part of the Australian Government changes to the GST distribution. |
| 3. | Queensland Treasury estimates. Differs from Chapter 7 due to the inclusion of direct Australian Government payments to Queensland agencies for Commonwealth own purpose expenditure. |
| 4.7.1 | Australian Government payments |
Australian Government payments to Queensland in 2019-20 are expected to total $27.744 billion, representing a decrease of $628 million compared to payments in 2018-19. This decrease is driven by a $227 million (1.6%) decrease in GST revenue and a $519 million (4.3%) decrease in other Australian Government grants. This is partially offset by a $119 million (6.3%) increase in Australian Government capital grants.
84
Budget Strategy and Outlook 2019-20
Queensland is the only state to receive less GST revenue in 2019-20 compared to 2018-19. Queensland’s GST revenue will be lower in 2019-20 primarily because the Australian Government has significantly revised down the growth of the GST pool from 2018-19 and accepted the CGC’s assessment that Queensland should receive a smaller share. This reflects improved mining royalties, lower natural-disaster-related expenditure, and a greater share of Australian Government grants.
As a result, despite the GST pool continuing to grow, albeit slower, Queensland is the only state to receive less GST revenue in 2019-20 than in 2018-19.
The decline in payments to Queensland for Australian Government grants is primarily due to the redirection of National Disability SPP funding in 2019-20 to the National Disability Insurance Scheme (NDIS).
Other drivers of the reduction in Australian Government grants include:
| • | | the Australian Government making an upfront payment in 2018-19 for a three-year agreement to assist disaster-affected primary producers in North and Far North Queensland; and |
| • | | seven non-infrastructure National Partnership Agreements expiring on 30 June 2019. |
Chapter 7 provides detailed background on federal-state financial arrangements, including Queensland’s share of GST revenue and other Australian Government payments to Queensland.
| 4.7.2 | Other grants and contributions |
Other grants and contributions are funds received from other state and local government agencies, other bodies and individuals. Contributions exclude Australian Government grants and user charges. The main sources of contributions are those received from private enterprise and community groups to fund research projects and community services and contributed assets and goods and services received for a nominal amount.
The State earns royalties from the extraction of coal, base and precious metals, bauxite, petroleum and gas, mineral sands and other minerals. Royalties ensure some of the proceeds of the extraction of non-renewable resources are returned to the community. Land rents are also earned from pastoral holdings, and mining and petroleum leases. Royalties and land rents are detailed in Table 4.5.
85
Budget Strategy and Outlook 2019-20
| Table 4.5 | Royalties and land rents1 |
| | | | | | | | | | | | | | | | | | | | | | | | |
| | | 2017-18
Actual
$ million | | | 2018-19
Est. Act.
$ million | | | 2019-20
Budget
$ million | | | 2020-21
Projection
$ million | | | 2021-22
Projection
$ million | | | 2022-23
Projection
$ million | |
Coal | | | 3,737 | | | | 4,363 | | | | 4,339 | | | | 3,461 | | | | 3,468 | | | | 3,604 | |
Petroleum2 | | | 187 | | | | 450 | | | | 577 | | | | 620 | | | | 638 | | | | 630 | |
Other royalties3 | | | 372 | | | | 389 | | | | 538 | | | | 520 | | | | 522 | | | | 510 | |
Land rents | | | 162 | | | | 163 | | | | 168 | | | | 169 | | | | 172 | | | | 174 | |
Total royalties and land rents | | | 4,457 | | | | 5,364 | | | | 5,621 | | | | 4,770 | | | | 4,799 | | | | 4,918 | |
Notes:
| 1. | Numbers may not add due to rounding. |
| 2. | Includes impact of liquefied natural gas (LNG). |
| 3. | Includes base and precious metal and other mineral royalties. |
While a large proportion of Queensland’s royalties and land rents comes from coal mining, the majority of this revenue is attributable to the hard coking coal used in steel production. Lower royalties collected from thermal coal mining reflects the smaller volume of this type of coal mined in Queensland, as well as lower values per tonne of coal and the three-tiered coal royalty rate system, where lower value coal is charged a lower average royalty rate. Compared to coal, petroleum royalties make up a relatively smaller share of total royalties, though petroleum royalties have grown strongly over the last few years due to growth in the LNG industry and a recovery in prices compared to those experienced during 2015-16 and 2016-17.
There is a high degree of uncertainty associated with estimates of commodity prices, which can have significant impacts on royalty revenue. Risks to coal export volumes also have the potential to impact royalty estimates, though changes to export volumes may in turn impact prices. Specific risk factors are considered in developing forecasts and include the level of exposure of mining operations to the risk of natural disasters and the timing of scheduled maintenance for the rail network and ports.
Appendix C outlines key parameter assumptions, and the sensitivity of coal royalty estimates to individual changes in price, volume and exchange rate parameters.
Coal prices have remained elevated since the development of forecasts for the 2018-19 MYFER. Royalty forecasts in the 2019-20 Budget incorporate ongoing near-term strength in hard coking coal prices, and a gradual trajectory towards a medium-term expectation of US$150 per tonne by the end of 2020.
On a year average basis, the premium hard coking coal price is estimated to have increased 3% in 2018-19 to $US206 per tonne, and is expected to decline by 13% to $US179 per tonne in 2019-20.
86
Budget Strategy and Outlook 2019-20
Chart 4.6 shows coking coal price forecasts compared to the 2018-19 Budget and average quarterly price from the latest Consensus Economics forecasts. The Australian Government’s 2019-20 Budget assumed that the coking coal spot price would decline over the next year to reach US$150 per tonne by the end of the March quarter 2020. Revisions since the 2018-19 Budget are in line with Consensus Economics forecasts in the next few years, with a degree of conservatism in the medium-term.
| Chart 4.6 | Coking coal price forecasts by iteration |
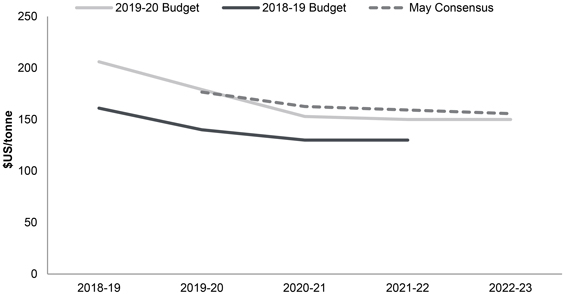
The royalty impact of upward revisions to coal prices has been partially offset by downwards revisions to forecasts of coal export tonnages. Lower crown export tonnages are primarily due to a weakened outlook for the industrial production of major economies, but also consider factors such as disruptions to domestic ports and production in early 2019, and a fall in coal imports to China over the first four months of 2019.
Since the 2018-19 MYFER, coal royalty estimates have been revised upwards by $838 million in 2019-20, with smaller uplifts of $265 million in 2020-21 and $296 million in 2021-22.
87
Budget Strategy and Outlook 2019-20
| Chart 4.7 | Coking coal price |
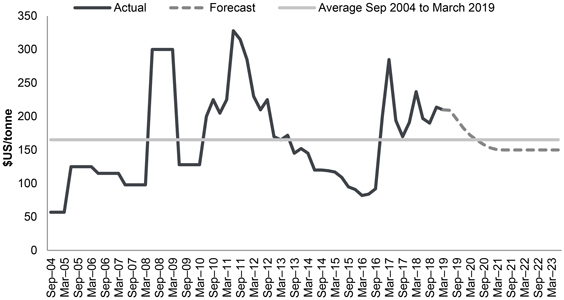
Sources: Consensus Economics and Queensland Treasury.
Oil prices factor strongly into royalty forecasts, with most of the LNG produced in Queensland sold under long-term contracts linked to oil prices. Since the 2018-19 Budget, estimates of Brent oil prices have been revised down by 5% to $US69 per barrel on average in 2018-19. Downwards revisions to Brent oil price forecasts reflect decreased global growth expectations, decreased global oil demand and increased US stockpiles. From 2019-20 onwards, forecasts of the Brent oil price are largely unchanged compared to the 2018-19 MYFER, and are similar to Consensus Economics forecasts. Volumes for LNG have increased slightly compared to MYFER to reflect recent cargoes.
Significant growth in LNG exports over the last few years is supporting growth in petroleum royalty forecasts. Efforts to support LNG industry growth in Queensland also has broader benefits including job creation, and in turn supports increased revenue collection by the Australian Government.
Petroleum royalties have been revised upwards by $131 million (29%) in 2019-20 since the 2018-19 Budget. This increase mainly reflects the policy decision to increase the rate by 2.5% to 12.5%.
88
Budget Strategy and Outlook 2019-20
Other royalties include revenue from metals mined in Queensland such as copper, lead and zinc and other minerals including bauxite. Revenue from other royalties is expected to grow 38.4% in 2019-20, supported by increased metals volumes, with flooding in North Queensland impacting volumes in 2018-19. Adjusting for the impact of the floods on volumes in 2018-19, volumes for these minerals are still expected to be higher on average in 2019-20 than in 2018-19, primarily reflecting production ramping up in recently started mines.
Revenue from land rents derived from mining and petroleum leases and pastoral holdings are expected to grow 3.0% in 2019-20.
| 4.9 | Sales of goods and services |
Sales of goods and services revenue comprises cost recoveries from providing goods or services. Table 4.6 provides a breakdown of the category.
The Government provides concessions in the form of discounts, rebates and subsidies to improve access to and the affordability of a range of services for individuals or families, based on eligibility criteria relating to factors such as age, income and special needs or disadvantage. Appendix A provides details of the concession arrangements provided by the Queensland Government.
| Table 4.6 | Sales of goods and services1 |
| | | | | | | | | | | | | | | | | | | | | | | | |
| | | 2017-18
Actual
$ million | | | 2018-19
Est. Act.
$ million | | | 2019-20
Budget
$ million | | | 2020-21
Projection
$ million | | | 2021-22
Projection
$ million | | | 2022-23
Projection
$ million | |
Fee for service activities | | | 2,429 | | | | 2,298 | | | | 2,277 | | | | 2,294 | | | | 2,300 | | | | 2,301 | |
Public Transport: South East Queensland | | | 343 | | | | 356 | | | | 377 | | | | 387 | | | | 401 | | | | 416 | |
Rent revenue | | | 561 | | | | 596 | | | | 630 | | | | 673 | | | | 714 | | | | 749 | |
Sale of land inventory | | | 48 | | | | 53 | | | | 77 | | | | 114 | | | | 105 | | | | 80 | |
Hospital fees | | | 825 | | | | 873 | | | | 875 | | | | 887 | | | | 899 | | | | 912 | |
Transport and traffic fees | | | 432 | | | | 450 | | | | 469 | | | | 485 | | | | 502 | | | | 519 | |
Other sales of goods and services | | | 1,246 | | | | 1,242 | | | | 1,298 | | | | 1,349 | | | | 1,387 | | | | 1,411 | |
Total | | | 5,884 | | | | 5,869 | | | | 6,004 | | | | 6,190 | | | | 6,307 | | | | 6,389 | |
Note:
| 1. | Numbers may not add due to rounding. |
89
Budget Strategy and Outlook 2019-20
| 4.9.1 | Fee for service activities |
Major items of fee for service activities across the General Government Sector include:
| • | | recoverable works carried out by the Department of Transport and Main Roads and the commercialised arm of the department |
| • | | fees charged by Technical and Further Education (TAFE) colleges |
| • | | fees charged by CITEC to commercial clients for information brokerage services. |
| 4.9.2 | Other sales of goods and services |
As shown in Table 4.6, there are a variety of other types of sales of goods and services. These include revenue from public transport ticketing arrangements, rent or lease of government property, hospital fees, transport and traffic fees, title registration fees and other licences and permits.
Interest income primarily comprises interest earned on investments, including those held for superannuation and insurance purposes.
Interest income is estimated to account for 3.5% of total General Government Sector revenue in 2019-20. Consistent with previous budgets, interest income is expected to decline on average between 2018-19 and 2022-23 due to a reduction in the portfolio of financial assets held for defined benefit superannuation.
| 4.11 | Dividend and income tax equivalent income |
Dividend and income tax equivalent income accounts for 3.7% of total General Government Sector revenue in 2019-20.
Estimated revenue from dividend and income tax equivalent income in 2018-19 has been revised upwards by $444 million since the 2018-19 Budget, supported by increased earnings from electricity generation and network businesses.
In 2019-20, dividend and income tax equivalent income is expected to decline $424 million compared to 2018-19, driven by the electricity generation and network businesses.
Dividend and income tax equivalent income is expected to decline over the four years to 2022-23 (reaching a low in 2021-22), driven by reductions in dividend returns from the electricity network, electricity generation and water sectors. Factors include:
| • | | revised assumptions for revenue performance under the next regulatory period for Energy Queensland Limited |
| • | | revised generation business assumptions for wholesale electricity prices. |
Trends in dividends and income tax equivalent income are discussed in more detail in Chapter 8.
90
Budget Strategy and Outlook 2019-20
Other revenue, including royalty revenue, accounts for 11.3% of total General Government Sector revenue in 2019-20. Royalties themselves account for 9.0% of revenue in 2019-20, and are discussed in section 4.7.
The major fines and infringements included in this category are issued by the Department of Transport and Main Roads (DTMR) and Queensland Police Service (QPS), incorporating fixed and mobile camera offences, speeding and tolling offences.
Revenue from fines and forfeitures are expected to grow by 7.9% in 2019-20, with the expected growth in fines revenue due to increases in enforcement hours and the deployment of additional cameras in coming years.
Revenue not elsewhere classified includes assets contributed to the State and payments received for works delivered on behalf of government-owned corporations.
| | | | | | | | | | | | | | | | | | | | | | | | |
| | | 2017-18
Actual
$ million | | | 2018-19
Est. Act.
$ million | | | 2019-20
Budget
$ million | | | 2020-21
Projection
$ million | | | 2021-22
Projection
$ million | | | 2022-23
Projection
$ million | |
Royalties and land rents | | | 4,457 | �� | | | 5,364 | | | | 5,621 | | | | 4,770 | | | | 4,799 | | | | 4,918 | |
Fines and forfeitures | | | 411 | | | | 443 | | | | 478 | | | | 532 | | | | 557 | | | | 589 | |
Revenue not elsewhere classified | | | 818 | | | | 768 | | | | 738 | | | | 955 | | | | 1,015 | | | | 910 | |
Total other revenue | | | 5,685 | | | | 6,575 | | | | 6,837 | | | | 6,257 | | | | 6,372 | | | | 6,417 | |
Note:
| 1. | Numbers may not add due to rounding. |
91
Budget Strategy and Outlook 2019-20
Features
| • | | The focus of the 2019-20 Budget is on developing the Government’s economic plan for the next decade. This budget continues to target initiatives that drive job creation, business- led growth, sustainable public investment, support for the next wave of innovation and ensure Queenslanders have the skills for the future. The Government through its Our Future State: Advancing Queensland’s Priorities is also focused on delivering on opportunities and tackling the major challenges facing the state. |
| • | | Expenses for 2018-19 are estimated to be $59.226 billion, an increase of $2.891 billion from 2017-18. The increase is due to growth funding to support ongoing demand for health services (around $1.5 billion) and education services (around $600 million). The operating expense component of natural disaster related expenses in 2018-19 is around $500 million. |
| • | | Total expenses are projected to grow at an average annual rate of 2.3% over the four years to 2022-23. From 2020-21, revenues commence growing at a faster rate than expenses, with the gap widening across the remainder of the forward estimates. |
| • | | In 2019-20, General Government Sector expenses are estimated to be $60.198 billion, an expected increase of $972 million over the estimated actual for 2018-19. |
| • | | Ongoing budget sustainability is central to delivering on the Government’s economic plan. A Service Priority Review Office (the Office) will be established in Queensland Treasury. In partnership with the Department of the Premier and Cabinet, the Office will drive the realisation of reprioritisation targets of $200 million in 2019-20 and $500 million per annum from 2020-21, by conducting reviews of Queensland public sector agencies and existing programs. |
| • | | In 2019-20, the major areas of expenditure are health and education, which together constitute approximately 56.1% of General Government Sector expenses. |
This chapter provides an overview of General Government Sector expenses for the estimated actual for 2018-19, forecasts for the 2019-20 Budget year and projections for 2020-21 to 2022-23. The forward estimates are based on the economic projections outlined in Chapter 2.
92
Budget Strategy and Outlook 2019-20
| 5.1 | 2018-19 estimated actual |
General Government Sector expenses in 2018-19 are estimated to be $59.226 billion, $748 million higher than the 2018-19 Mid Year Fiscal and Economic Review (MYFER) estimate. The increase since MYFER is largely driven by:
| • | | higher hospital and health services |
| • | | increased natural disaster expenditure including disaster-affected primary producer grants following the North and Far North monsoon trough event in 2019 |
| • | | advance payments to local councils to compensate for the commencement of the Queensland waste levy from 1 July 2019 |
| • | | the Australian Government’s advance payment of financial assistance grants to local governments in 2018-19 for the 2019-20 financial year |
| • | | actuarial adjustments for the State’s Defined Benefit Superannuation Scheme. |
These expenses were partly offset by lower than estimated payments to the National Disability Insurance Agency due to the slower than anticipated transition of Queenslanders to the NDIS.
| 5.2 | 2019-20 Budget and out-years |
| Table 5.1 | General Government Sector expenses1 |
| | | | | | | | | | | | | | | | | | | | | | | | |
| | | 2017-18
Actual
$ million | | | 2018-19
Est. Act.
$ million | | | 2019-20
Budget
$ million | | | 2020-21
Projection
$ million | | | 2021-22
Projection
$ million | | | 2022-23
Projection
$ million | |
Employee expenses | | | 22,678 | | | | 24,096 | | | | 25,396 | | | | 25,728 | | | | 26,709 | | | | 27,724 | |
Superannuation interest costs | | | 667 | | | | 642 | | | | 516 | | | | 542 | | | | 580 | | | | 624 | |
Other superannuation expenses | | | 2,744 | | | | 3,044 | | | | 3,093 | | | | 3,202 | | | | 3,257 | | | | 3,292 | |
Other operating expenses | | | 17,258 | | | | 16,791 | | | | 15,790 | | | | 15,907 | | | | 16,363 | | | | 16,733 | |
Depreciation and amortisation | | | 3,325 | | | | 3,449 | | | | 3,961 | | | | 4,097 | | | | 4,231 | | | | 4,334 | |
Other interest expenses | | | 1,614 | | | | 1,514 | | | | 1,688 | | | | 1,721 | | | | 1,797 | | | | 1,848 | |
Grants expenses | | | 8,048 | | | | 9,691 | | | | 9,754 | | | | 10,219 | | | | 10,164 | | | | 10,197 | |
Total Expenses | | | 56,335 | | | | 59,226 | | | | 60,198 | | | | 61,416 | | | | 63,101 | | | | 64,753 | |
Note:
| 1. | Numbers may not add due to rounding. |
93
Budget Strategy and Outlook 2019-20
General Government Sector expenses of $60.198 billion in 2019-20 represent an increase of $972 million (or 1.6%) over the 2018-19 estimated actual. Factors influencing the higher expenditure in 2019-20 include:
| • | | increases in education expenditure largely reflects student enrolment growth and enterprise bargaining outcomes, and additional funding under the National School Reform Agreement and associated Bilateral Agreement. |
| • | | growth in demand for public hospital and health services. Increased health expenditure includes workforce requirements to meet the ongoing growth in demand for frontline health services |
| • | | additional funding for the public safety sector, including criminal and youth justice systems, transition of private prisons to public operation and addressing the outcomes of Taskforce Flaxton |
| • | | payment for works delivered on behalf of government-owned corporations |
| • | | natural disaster expenditure following the North and Far North monsoon trough event in 2019 including disaster-affected primary producer grants. |
In 2019-20 expenses growth is also impacted by the Australian Government’s advance payment of financial assistance grants in 2018-19 for 2019-20, advance payments in 2018-19 to local councils for compensation ahead of the commencement of Queensland Waste Levy from 1 July 2019 and whole-of-Government reprioritisation targets.
| 5.3 | Expenses by operating statement category |
As outlined in Chart 5.1, the largest expense categories in the General Government Sector in 2019-20 are employee and superannuation expenses (48.2%), followed by other operating expenses (26.2%) that reflect non-labour costs of providing goods and services to government and non-government recipients including transport service contract payments and repairs and maintenance.
94
Budget Strategy and Outlook 2019-20
| Chart 5.1 | Expenses by operating statement category, 2019-20 |
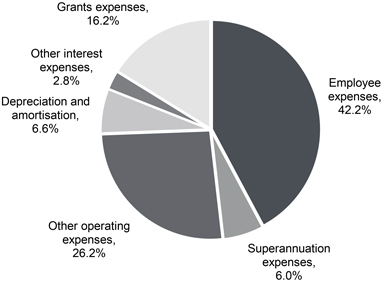
Chart 5.2 identifies the growth in expenses for each operating statement category between the 2018-19 estimated actual and the 2019-20 Budget. The largest increase is in employee expenses, which primarily reflects workforce requirements to meet the ongoing demand for frontline hospital and health services and school enrolment growth.
95
Budget Strategy and Outlook 2019-20
| Chart 5.2 | Growth in expenses by operating statement category – 2018-19 estimated actual to 2019-20 Budget |
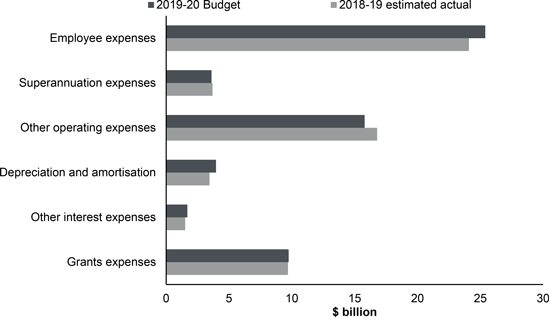
Employee expenses include salaries and wages, annual leave and long service leave.
In 2019-20, employee expenses are expected to be $25.396 billion, $1.3 billion or 5.4% higher than the 2018-19 estimated actual. This reflects both growth in full-time equivalents (FTEs) and the Government’s wages policy. Much of the increase in employee expenses in 2019-20 is the key frontline service areas of health and education reflecting increasing demand for health services and student population growth.
Full-time equivalents
During the 2015 election, the Government made commitments to revitalise frontline service delivery. This contributed in FTEs increasing 22,208 (or 11.0%) from 2014-15 to 2017-18, and an estimated further 5,518 (or 2.5%) in 2018-19. Between March 2015 and March 2019:
| • | | teachers increased by 4,803 (or 11.4%) |
| • | | teacher aides increased by 1,399 (or 15.0%) |
| • | | nurses increased by 5,988 (or 21.5%) |
| • | | health practitioners increased by 1,761 (or 17.8%) |
| • | | doctors increased by 2,020 (or 25.5%) |
| • | | ambulance operatives increased by 510 (or 13.8%) |
| • | | police officers increased by 436 (or 3.9%). |
96
Budget Strategy and Outlook 2019-20
As at March 2019, around 91.4% of public servants were engaged in frontline and frontline support roles.
Given the tight fiscal environment and the fact that employee expenses represent the State’s largest expense category, the Government introduced a new fiscal principle in the 2016-17 Budget to maintain a sustainable public service where overall growth in FTEs, on average over the forward estimates, does not exceed population growth.
The introduction of the fiscal principle has resulted in FTE growth moderating, and continuing to moderate. FTEs are estimated to increase by around 4,391 in 2019-20. The overall average annual growth rate over 2018-19 to 2022-23, based on current estimates, is 1.68%. This compares to an estimated Queensland population growth of 13⁄4% annually.
One of the recommendations from the Coaldrake Review (discussed further in Box 5.1) was to nuance the representation of Fiscal Principle 6 to expand disclosure to show health and education growth separately from the rest of the sector. The Government accepted this recommendation in principle, with a commitment to explore changes to the reporting of Fiscal Principle 6.
In response, Chart 5.3 shows the breakdown of actual FTE growth from 2006-07 to 2017-18 and estimated FTEs from 2018-19 to 2020-23, with health and education shown separately from the rest of the sector. Estimated FTEs for health, education and rest of sector are compared to forecast population growth.
Chart 5.3 demonstrates the growth in health (including Queensland Ambulance Service (QAS)) is expected to be higher than population growth, though not as strong as in previous years (falling from an average annual growth of 5.32% between 2014-15 and 2017-18 to an estimated 3.01% between 2018-19 and 2022-23). The ongoing high FTE growth within health is not unexpected with the Government injecting record health funding every year since coming to power to restore vital frontline services. Further, Commonwealth health funding is based on activity and demand principles, not population growth.
The growth embedded in health and education agreements with the Australian Government is one of the primary drivers of the growth in health and education expenditures and employee numbers, the effects which can be seen in Chart 5.3.
Growth in other agencies is slower, with many remaining relatively flat or declining. The reasons for agency declines include changes in service delivery, for example, due to the introduction of the NDIS.
97
Budget Strategy and Outlook 2019-20
| Chart 5.3 | Education, Health and Rest of Sector departmental FTEs1 |
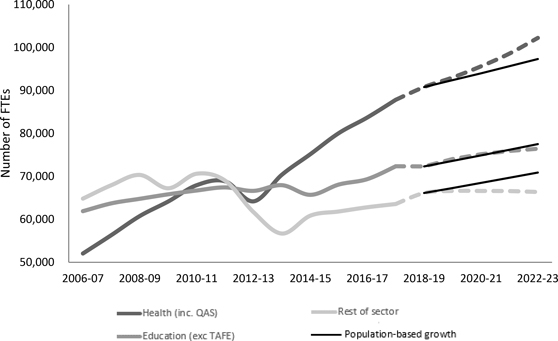
Note:
| 1. | 2018-19 to 2022-23 are forecasts. |
The Government is also committed to ensuring that public service staff are located where they are needed in the community. Around 47% of FTEs are located outside Greater Brisbane, of which around 96% are engaged in frontline and frontline support roles. Regional Action Plans show increases in key service delivery occupations across the regions.
The devolved frontline service delivery models used in some agencies continue to present challenges to FTE estimation and monitoring, in particular when funding is provided in such a way that agencies determine how to most efficiently deliver services. Consistent with last year, the 2019-20 Budget FTE estimates build in an allowance for this.
98
Budget Strategy and Outlook 2019-20
| Box 5.1 | Public Sector FTE Reporting |
The Queensland Government is continuously examining ways to improve the Queensland public sector and its ability to meet the needs of Queenslanders. To ensure the Queensland public sector is the most responsive, consistent and reliable public service possible, the Queensland Government commissioned the Review into the Queensland Public Sector Workforce Reporting (Coaldrake Review).
The Coaldrake Review comprised of two stages and three reports and makes 13 recommendations for Government. The Government has accepted or accepted in principle all the recommendations, which included:
| • | | adopting a single, authoritative and immediately retrievable workforce database |
| • | | replacing the current quarterly Workforce Profile Reports with half-yearly reports covering sector wide analysis of particular trends, and other matters as required by government from time to time |
| • | | adopting a consistent approach to the reporting and monitoring of the indirect workforce (e.g. contractors and consultants) which supports the Queensland public sector. |
In response to these recommendations, the Public Service Commission (PSC) will change its FTE methodology from 1 July 2019 to reduce the inconsistencies in data collections. In addition, the PSC is working on changes and enhancements to the Workforce Profile Report. Queensland Treasury in conjunction with the PSC is assessing options to improve the reporting and monitoring of the indirect workforce.
Table 5.2 shows the funded FTE positions by department and is consistent with agency Service Delivery Statements.
99
Budget Strategy and Outlook 2019-20
| Table 5.2 | Funded controlled FTE positions by Department1,2,3 |
| | | | | | | | | | | | |
| | | 2018-19
Adj. Budget | | | 2018-19
Est. Act | | | 2019-20
Budget | |
Aboriginal and Torres Strait Islander Partnerships | | | 324 | | | | 328 | | | | 321 | |
Agriculture and Fisheries | | | 2,128 | | | | 2,127 | | | | 2,124 | |
Child Safety, Youth and Women | | | 3,375 | | | | 3,423 | | | | 3,439 | |
Youth Justice | | | 1,459 | | | | 1,499 | | | | 1,566 | |
Communities, Disability Services and Seniors4 | | | 2,241 | | | | 2,243 | | | | 1,755 | |
Education | | | 72,784 | | | | 73,190 | | | | 74,885 | |
Electoral Commission of Queensland | | | 60 | | | | 60 | | | | 58 | |
Employment, Small Business and Training | | | 4,432 | | | | 4,417 | | | | 4,436 | |
Environment and Science | | | 3,093 | | | | 3,101 | | | | 3,089 | |
Housing and Public Works | | | 5,570 | | | | 5,568 | | | | 5,565 | |
Innovation, Tourism Industry Development and the Commonwealth Games | | | 173 | | | | 175 | | | | 175 | |
Justice and Attorney-General | | | 3,449 | | | | 3,473 | | | | 3,509 | |
Local Government, Racing and Multicultural Affairs | | | 188 | | | | 188 | | | | 183 | |
Natural Resources, Mines and Energy | | | 2,665 | | | | 2,663 | | | | 2,662 | |
Office of the Inspector-General Emergency Management | | | 22 | | | | 22 | | | | 22 | |
Premier and Cabinet | | | 467 | | | | 465 | | | | 480 | |
Public Safety Business Agency | | | 1,117 | | | | 1,122 | | | | 1,121 | |
Public Service Commission | | | 70 | | | | 70 | | | | 70 | |
Queensland Audit Office | | | 182 | | | | 191 | | | | 191 | |
Queensland Corrective Services | | | 5,039 | | | | 5,039 | | | | 5,761 | |
Queensland Fire and Emergency Services | | | 3,321 | | | | 3,318 | | | | 3,346 | |
Queensland Health (total-disaggregation below) | | | 90,095 | | | | 90,791 | | | | 93,009 | |
Queensland Police Service | | | 15,696 | | | | 15,709 | | | | 15,802 | |
Queensland Treasury | | | 994 | | | | 998 | | | | 1,027 | |
State Development, Manufacturing, Infrastructure and Planning | | | 1,016 | | | | 1,016 | | | | 990 | |
The Public Trustee of Queensland | | | 615 | | | | 617 | | | | 621 | |
Transport and Main Roads | | | 7,427 | | | | 7,433 | | | | 7,425 | |
Total5 | | | 228,002 | | | | 229,246 | | | | 233,637 | |
100
Budget Strategy and Outlook 2019-20
| | | | | | | | | | | | |
| | | 2018-19
Adj. Budget | | | 2018-19
Est. Act | | | 2019-20
Budget | |
Queensland Health Disaggregation | | | | | | | | | | | | |
Health | | | 7,645 | | | | 7,820 | | | | 7,728 | |
Queensland Ambulance Service | | | 4,507 | | | | 4,585 | | | | 4,707 | |
Cairns and Hinterland Hospital and Health Service | | | 4,971 | | | | 5,079 | | | | 5,101 | |
Central Queensland Hospital and Health Service | | | 3,052 | | | | 3,072 | | | | 3,167 | |
Central West Hospital and Health Service | | | 373 | | | | 380 | | | | 380 | |
Children’s Health Queensland Hospital and Health Service | | | 3,700 | | | | 3,862 | | | | 3,823 | |
Darling Downs Hospital and Health Service | | | 4,549 | | | | 4,636 | | | | 4,713 | |
Gold Coast Hospital and Health Service | | | 8,063 | | | | 8,323 | | | | 8,385 | |
Mackay Hospital and Health Service | | | 2,312 | | | | 2,371 | | | | 2,356 | |
Metro North Hospital and Health Service | | | 16,165 | | | | 16,272 | | | | 16,860 | |
Metro South Hospital and Health Service | | | 12,882 | | | | 13,465 | | | | 13,478 | |
North West Hospital and Health Service | | | 782 | | | | 780 | | | | 781 | |
South West Hospital and Health Service | | | 819 | | | | 794 | | | | 816 | |
Sunshine Coast Hospital and Health Service | | | 6,400 | | | | 6,000 | | | | 6,007 | |
Torres and Cape Hospital and Health Service | | | 943 | | | | 1,031 | | | | 1,005 | |
Townsville Hospital and Health Service | | | 5,401 | | | | 5,424 | | | | 5,508 | |
West Moreton Hospital and Health Service | | | 3,572 | | | | 3,717 | | | | 3,659 | |
Wide Bay Hospital and Health Service | | | 3,132 | | | | 3,180 | | | | 3,266 | |
Funded unallocated FTEs6 | | | 827 | | | | — | | | | 1,269 | |
Total Queensland Health | | | 90,095 | | | | 90,791 | | | | 93,009 | |
Notes:
| 1. | Numbers may not add due to rounding. |
| 2. | Explanation of variations in departmental FTEs can be found in the Service Delivery Statements. Departmental totals may include multiple tables from Service Delivery Statements (SDSs), due to separate FTE tables being provided for Departmental service areas and Commercialised Business Units. |
| 3. | Adjusted Budget reflects movements of FTEs following Machinery of Government changes only. |
| 4. | The decrease in 2019-20 is due to the transition of State specialist disability services to the NDIS. |
| 5. | Total 2019-20 Budget includes an additional 5 FTEs held centrally. |
| 6. | Funded unallocated FTEs represents estimates of additional FTEs which have not yet been allocated to particular Hospital and Health Services. |
101
Budget Strategy and Outlook 2019-20
| 5.3.2 | Superannuation expenses |
The superannuation interest cost represents the imputed interest on the Government’s accruing defined benefit superannuation liabilities.
In determining the State’s defined benefit superannuation liabilities, AASB 119 Employee Benefits requires the discounting of future benefit obligations using yield rates on Government bonds net of investment tax. Interest costs are calculated on a net liability approach by applying the discount rate to both the gross liability and superannuation plan assets.
Superannuation interest costs are dependent on the applicable discount rates at the beginning of the year. Rates have declined in 2018-19 comparative to 2017-18 before increasing across the forward estimates, resulting in lower superannuation interest costs in 2019-20 before marginally increasing across the remaining forward estimates. The defined benefit scheme, which is closed to new members and subject to interest rate fluctuations, will decline over time as members leave.
Other superannuation expenses represent employer superannuation contributions to accumulation superannuation and the current service cost of the State’s defined benefit obligation (or the increase in the present value of the defined benefit obligation resulting from employee service in the current period).
| 5.3.3 | Other operating expenses |
Other operating expenses comprise the non-labour costs of providing goods and services, including services to government and non-government organisations, repairs and maintenance, consultancies, contractors, electricity, communications and marketing.
In 2019-20, other operating expenses are expected to be $15.790 billion, a decrease of $1 billion or 6.0% lower compared to the 2018-19 estimated actual.
Other operating expenses decline significantly in 2019-20 due to:
| • | | the accounting treatment for the recognition of leases under the new accounting standard AASB 16 Leases, effective 1 July 2019. Under the new standard previous operating lease rental expenses have been replaced by depreciation expenses on the right of use asset |
| • | | continuing transition of specialist disability services to the NDIS. Queensland’s contributions to the NDIS are reflected as grants expenses |
| • | | a proportion of savings targets allocated to other operating expenses. |
| 5.3.4 | Depreciation and amortisation |
Depreciation and amortisation expense is an estimate of the progressive consumption of the State’s assets through normal usage, wear and tear and obsolescence. Growth in this expense category primarily reflects asset revaluations and the increasing investment in State infrastructure.
102
Budget Strategy and Outlook 2019-20
As mentioned above, depreciation increases significantly in 2019-20 due to the implementation of AASB 16 Leases. Adoption of the new standard results in a reallocation from other operating expenses to depreciation for the right of use asset.
| 5.3.5 | Other interest expenses |
Other interest expenses include interest paid on borrowings, finance leases and similar arrangements to acquire capital assets and infrastructure such as roads and government buildings.
Other interest expenses are estimated to increase $174 million in 2019-20 to $1.688 billion compared to $1.514 billion in 2018-19. Adoption of AASB 16 Leases from 1 July 2019 has resulted in previous operating lease rentals being recognised as finance lease liabilities on the Balance Sheet with a resulting reallocation from operating expenses to interest expenses in 2019-20.
Interest costs have fallen significantly since the recent peak of $2.328 billion in 2014-15. The decline in General Government Sector debt servicing costs is due in part to the repatriation of surplus defined benefit superannuation assets and other balance sheet measures.
Current grants include grants and subsidies to the community (such as non-state schools, hospitals, benevolent institutions and local governments) and personal benefit payments. Community Service Obligations (CSOs) are provided where Public Non-financial Corporations (PNFCs) are required to provide non-commercial services or services at non-commercial prices for the benefit of the community (for further details refer to Chapter 8).
Capital grants represent transfers to the PNFC Sector, local governments, not-for-profit institutions and other non-government entities, such as business and households (including the Queensland First Home Owners’ Grant and non-state schools) for capital purposes.
Table 5.3 provides a breakdown of grants by category and recipient type.
103
Budget Strategy and Outlook 2019-20
| Table 5.3 | Grants expenses1 |
| | | | | | | | | | | | |
| | | 2017-18
Actual
$ million | | | 2018-19
Est. Act.
$ million | | | 2019-20
Budget
$ million | |
Current | | | | | | | | | | | | |
Grants to local government | | | 691 | | | | 853 | | | | 471 | |
Grants to private and not-for-profit organisations | | | | | | | | | | | | |
State funding for non-state schools | | | 688 | | | | 683 | | | | 712 | |
Australian Government funding for non-state schools | | | 2,548 | | | | 2,739 | | | | 2,889 | |
Other | | | 1,449 | | | | 1,663 | | | | 1,713 | |
Grants to other sectors of government | | | | | | | | | | | | |
Community service obligations to PNFCs | | | 490 | | | | 472 | | | | 510 | |
Other payments to PNFCs | | | 46 | | | | 29 | | | | 32 | |
Other (includes payments to NDIA) | | | 408 | | | | 1169 | | | | 1,264 | |
Other | | | 281 | | | | 363 | | | | 554 | |
Total current grants | | | 6,601 | | | | 7,971 | | | | 8,145 | |
Capital | | | | | | | | | | | | |
Grants to local government | | | 930 | | | | 1,214 | | | | 997 | |
State funding for non-state schools | | | 93 | | | | 98 | | | | 100 | |
Grants to private and not-for-profit organisations | | | 183 | | | | 268 | | | | 392 | |
Payments to PNFCs | | | 45 | | | | 13 | | | | 10 | |
Queensland First Home Owners’ Grants | | | 195 | | | | 127 | | | | 110 | |
Other | | | 1 | | | | — | | | | — | |
Total capital grants | | | 1,447 | | | | 1,720 | | | | 1,609 | |
Total current and capital grants | | | 8,048 | | | | 9,691 | | | | 9,754 | |
Notes:
| 1. | Numbers may not add due to rounding. |
In 2018-19, total grant expenses are estimated to be $9.691 billion; $1.643 billion higher than 2017-18. This increase is mainly due to:
| • | | grants and payments by the State to the NDIA on the progressive transition to the NDIS |
| • | | timing of grants under the Townsville Water Security program |
| • | | advance payments to local councils to compensate for the commencement of the Queensland waste levy from 1 July 2019 |
| • | | disaster related grants to local councils and disaster-affected primary producer grants following the North and Far North Queensland monsoon event in 2019. |
In 2019-20, total grant expenses are estimated to be $9.754 billion, an increase of $63 million from 2018-19.
104
Budget Strategy and Outlook 2019-20
Growth in grants expenses remains comparatively low in 2019-20 mainly due to:
| • | | the Australian Government again making advance payment of the 2019-20 financial assistance grants to local councils in 2018-19 |
| • | | funding for the National Disability SPP being redirected to support the implementation of the NDIS |
| • | | significant proportion of grants for the Townsville Water Security program occurring in 2018-19 |
| • | | compensation payments to local councils being made in advance of the introduction of the Queensland Waste Levy. |
| 5.4 | Operating expenses by purpose |
Chart 5.4 indicates the proportion of expenditure by major purpose classification for the 2019-20 Budget. Health accounts for the largest share of expenses (31.2%) followed by Education (24.9%).
| Chart 5.4 | General Government Sector expenses by purpose, 2019-20 |
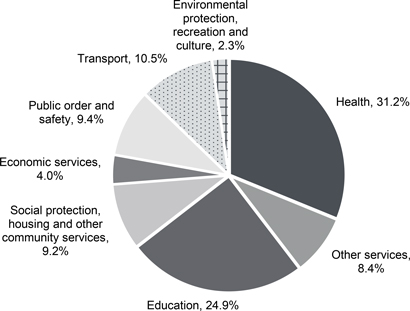
105
Budget Strategy and Outlook 2019-20
Data presented in Tables 5.4 and 5.5 provide a summary drawn from financial statements contained in the Service Delivery Statements (SDS). Further information on the composition of expenses, outputs delivered and factors influencing the movement in expenses can also be obtained from a department’s SDS.
| Table 5.4 | Departmental controlled expense1,2 |
| | | | | | | | |
| | | 2018-19
Est. Act.
$ 000 | | | 2019-20
Budget
$ 000 | |
Aboriginal and Torres Strait Islander Partnerships | | | 83,154 | | | | 83,016 | |
Agriculture and Fisheries | | | 513,423 | | | | 525,015 | |
Child Safety, Youth and Women | | | 1,646,469 | | | | 1,499,237 | |
Communities, Disability Services and Seniors | | | 1,016,266 | | | | 381,116 | |
Education | | | 9,410,818 | | | | 9,954,148 | |
Electoral Commission of Queensland | | | 24,969 | | | | 70,261 | |
Employment, Small Business and Training | | | 1,078,183 | | | | 1,077,636 | |
Environment and Science | | | 933,787 | | | | 797,356 | |
Health Consolidated3 | | | 18,063,133 | | | | 18,454,664 | |
Housing and Public Works | | | 2,409,933 | | | | 2,548,569 | |
Innovation, Tourism Industry Development and the Commonwealth Games | | | 146,597 | | | | 224,529 | |
Inspector General Emergency Management | | | 5,097 | | | | 5,006 | |
Justice and Attorney-General | | | 597,380 | | | | 659,136 | |
Legislative Assembly | | | 99,171 | | | | 103,526 | |
Local Government, Racing and Multicultural Affairs | | | 416,093 | | | | 284,297 | |
Natural Resources, Mines and Energy | | | 725,521 | | | | 601,238 | |
Office of the Governor | | | 7,225 | | | | 7,333 | |
Office of the Ombudsman | | | 9,059 | | | | 9,491 | |
Premier and Cabinet | | | 131,216 | | | | 116,397 | |
Public Safety Business Agency | | | 422,669 | | | | 420,801 | |
Public Service Commission | | | 14,654 | | | | 15,084 | |
Queensland Audit Office | | | 42,804 | | | | 45,032 | |
Queensland Corrective Services | | | 933,744 | | | | 1,003,977 | |
Queensland Fire and Emergency Services | | | 716,098 | | | | 739,732 | |
Queensland Police Service | | | 2,361,742 | | | | 2,428,036 | |
Queensland Treasury | | | 264,923 | | | | 274,050 | |
State Development, Manufacturing, Infrastructure and Planning | | | 408,148 | | | | 479,808 | |
The Public Trustee of Queensland | | | 93,307 | | | | 96,436 | |
Transport and Main Roads | | | 6,085,610 | | | | 6,189,222 | |
Youth Justice | | | 31,087 | | | | 246,052 | |
Total expenses | | | 48,692,280 | | | | 49,340,201 | |
106
Budget Strategy and Outlook 2019-20
Notes:
| 1. | Total expenses by department do not equate to total General Government expenses in Uniform Presentation Framework (UPF) terms reported elsewhere in the Budget Papers as General Government expenses include a wider range of entities including State Government statutory authorities. In addition, transactions eliminated between entities within the General Government Sector are excluded in the preparation of whole-of-Government UPF financial statements. |
| 2. | Explanation of variations in departmental controlled expenses can be found in the Service Delivery Statements. |
| 3. | This represents Health Consolidated in the Service Delivery Statement, which consolidates Queensland Health controlled, the Hospital and Health Services, and Queensland Ambulance Service. |
| Table 5.5 | Departmental administered expense1,2 |
| | | | | | | | |
| | | 2018-19
Est. Act.
$ 000 | | | 2019-20
Budget
$ 000 | |
Aboriginal and Torres Strait Islander Partnerships | | | 11,113 | | | | 10,105 | |
Agriculture and Fisheries | | | 92,168 | | | | 235,613 | |
Child Safety, Youth and Women | | | 5,868 | | | | 5,888 | |
Communities, Disability Services and Seniors | | | 1,592,118 | | | | 1,592,208 | |
Education | | | 3,618,670 | | | | 3,807,457 | |
Environment and Science | | | 142,581 | | | | 147,276 | |
Health Consolidated3 | | | 30,952 | | | | 30,959 | |
Housing and Public Works | | | 57,599 | | | | 58,633 | |
Innovation, Tourism Industry Development and the Commonwealth Games | | | 103,016 | | | | 109,902 | |
Justice and Attorney-General | | | 436,819 | | | | 435,136 | |
Local Government, Racing and Multicultural Affairs | | | 548,636 | | | | 326,714 | |
Natural Resources, Mines and Energy | | | 534,499 | | | | 569,163 | |
Premier and Cabinet | | | 112,705 | | | | 128,064 | |
Queensland Police Service | | | 734 | | | | 739 | |
Queensland Treasury | | | 5,885,711 | | | | 6,010,699 | |
State Development, Manufacturing, Infrastructure and Planning | | | 594,638 | | | | 691,720 | |
The Public Trustee of Queensland | | | 718 | | | | 734 | |
Total expenses | | | 13,768,545 | | | | 14,161,010 | |
Notes:
| 1. | Total expenses by department does not equate to total General Government expenses in Uniform Presentation Framework (UPF) terms reported elsewhere in the Budget Papers as General Government expenses include a wider range of entities including State Government statutory authorities. In addition, transactions eliminated between entities within the General Government Sector are excluded in the preparation of whole-of-Government UPF financial statements. |
| 2. | Explanation of variations in departmental administered expenses can be found in the Service Delivery Statements. |
| 3. | This represents Health Consolidated in the Service Delivery Statement, which consolidates Queensland Health controlled, the Hospital and Health Services, and Queensland Ambulance Service. |
107
Budget Strategy and Outlook 2019-20
| 6 | Balance sheet and cash flows |
Features
| • | | Borrowing with QTC in 2018-19 for the General Government and Non-financial Public Sectors (NFPS) is forecast to be $29.933 billion and $68.141 billion respectively. These estimates are lower than projections in the 2018-19 Mid Year Fiscal Economic Review (MYFER) mainly due to improved operating cash flows. |
| • | | In 2019-20, QTC borrowing for the General Government Sector is forecast to be $32.781 billion, which is lower than expected at MYFER and the 2018-19 Budget. NFPS is $71.954 billion, $1.011 billion lower than MYFER and $345 million lower than the 2018-19 Budget. The increase in QTC borrowing from 2018-19 to 2019-20 arises from the funding of capital purchases. |
| • | | Borrowing for leases and similar arrangements increases significantly from 2018-19 to 2019-20 due to the adoption of the new lease accounting standard ($2.2 billion for the General Government Sector and $2.6 billion for NFPS at 1 July 2019). This adjustment largely relates to accommodation leases and does not have any economic impact on the State’s finances. |
| • | | The increase in borrowing across the forward estimates arises from the funding of essential infrastructure. |
| • | | The State’s net worth, the amount by which its assets exceed its liabilities, is forecast to increase from $196 billion in 2018-19 to $209.8 billion in 2022-23, primarily reflecting expected asset revaluations. |
| • | | At the time of the 2018-19 Budget, net cash inflows from operating activities for 2018-19 were expected to cover 60% of net investments in Non-financial Assets (NFAs) for the General Government Sector. The estimated actual coverage is now expected to be nearly 79% due to improved operating cash flows. |
| • | | Non-financial Public Sector capital expenditure totals $45.458 billion for the period 2019-20 to 2022-23, which comprises $40.519 billion of Purchases of Non-financial Assets (PNFA), and $4.938 billion of capital grant expenses. In addition, acquisitions of NFAs under finance leases and similar arrangements of $4.087 billion bring the total capital program for 2019-20 Budget to $49.544 billion. |
108
Budget Strategy and Outlook 2019-20
The balance sheet shows the projected assets, liabilities and net worth of the General Government Sector as at 30 June each financial year. It is important for the Government to maintain a strong balance sheet to provide it with stability, flexibility and capacity to deal with emerging financial and economic pressures, and to provide a strong foundation for future economic growth. Due to expected changes required by the new accounting standard, AASB 16 Leases, more detail has been disclosed of the State’s Borrowing, separating out QTC borrowing, Leases and similar arrangements), and securities and derivatives.
The cash flow statement shows the expected cash flows of the General Government Sector during each financial year of the forward estimates. The main difference between the accrual operating statement and the cash flow relates to the timing of cash payments and receipts and their recognition in accrual terms and the inclusion of non-cash expenses and revenues. The largest differences between accrual accounting and cash flows are in relation to depreciation and defined benefit superannuation. Differences due to the timing of receipt or payment of amounts are recorded as either a receivable or payable in the balance sheet.
109
Budget Strategy and Outlook 2019-20
Table 6.1 provides a summary of the key balance sheet aggregates for the General Government Sector.
| Table 6.1 | General Government Sector: summary of budgeted balance sheet1 |
| | | | | | | | | | | | | | | | | | | | | | | | |
| | | 2018-19
Budget
$ million | | | 2018-19
Est. Act.
$ million | | | 2019-20
Budget
$ million | | | 2020-21
Projection
$ million | | | 2021-22
Projection
$ million | | | 2022-23
Projection
$ million | |
Financial assets | | | 59,460 | | | | 61,769 | | | | 60,945 | | | | 60,475 | | | | 61,106 | | | | 62,001 | |
Non-financial assets | | | 214,752 | | | | 211,814 | | | | 219,256 | | | | 225,107 | | | | 231,165 | | | | 235,219 | |
Total assets | | | 274,212 | | | | 273,583 | | | | 280,202 | | | | 285,582 | | | | 292,271 | | | | 297,220 | |
Borrowings with QTC | | | 29,735 | | | | 29,933 | | | | 32,781 | | | | 35,218 | | | | 40,174 | | | | 42,589 | |
Leases and similar arrangements | | | 2,556 | | | | 2,623 | | | | 5,824 | | | | 7,071 | | | | 6,943 | | | | 6,966 | |
Securities and derivatives | | | 19 | | | | 122 | | | | 122 | | | | 122 | | | | 122 | | | | 122 | |
Advances and deposits | | | 1,816 | | | | 2,272 | | | | 1,618 | | | | 1,443 | | | | 1,212 | | | | 1,257 | |
Superannuation liability | | | 23,414 | | | | 26,739 | | | | 25,567 | | | | 24,107 | | | | 22,409 | | | | 20,660 | |
Other provisions and liabilities | | | 14,034 | | | | 15,696 | | | | 15,393 | | | | 15,494 | | | | 15,674 | | | | 15,847 | |
Total liabilities | | | 71,575 | | | | 77,386 | | | | 81,306 | | | | 83,455 | | | | 86,533 | | | | 87,441 | |
Net worth | | | 202,636 | | | | 196,197 | | | | 198,896 | | | | 202,126 | | | | 205,738 | | | | 209,778 | |
Net financial worth | | | (12,115 | ) | | | (15,617 | ) | | | (20,361 | ) | | | (22,980 | ) | | | (25,428 | ) | | | (25,441 | ) |
Net financial liabilities | | | 35,928 | | | | 39,568 | | | | 44,796 | | | | 48,098 | | | | 50,760 | | | | 51,226 | |
Net debt | | | 2,815 | | | | 1,661 | | | | 8,001 | | | | 12,306 | | | | 16,961 | | | | 19,562 | |
Note:
| 1. | Numbers may not add due to rounding and bracketed numbers represent negative numbers. |
110
Budget Strategy and Outlook 2019-20
The General Government Sector holds the equity of the State’s public enterprises, principally its shareholding in government-owned corporations (GOCs) but also Public Financial Corporations like Queensland Treasury Corporation (QTC), in much the same manner as the parent or holding company in a group of companies. The estimated investment in public enterprises is included in the General Government Sector’s financial assets.
Financial assets of $61.769 billion are estimated for 2018-19, $2.309 billion higher than originally budgeted for 2018-19 mainly due to the reprofiling of repatriations from surplus assets in the defined benefit scheme and lower levels of beneficiary payments.
Chart 6.1 shows forecast General Government Sector financial assets by category at 30 June 2020. Investments held to meet future liabilities, including superannuation and insurance, comprise the major part of the State’s financial assets.
| Chart 6.1 | Forecast General Government Sector financial assets by category, at 30 June 2020 |
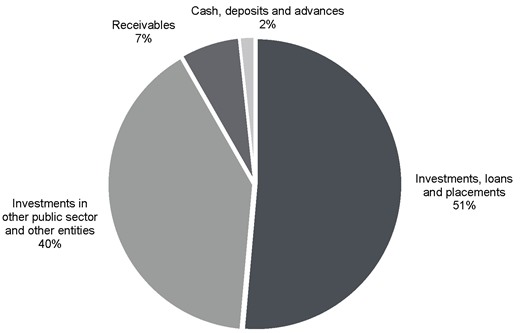
111
Budget Strategy and Outlook 2019-20
| 6.2.2 | Non-financial assets |
General Government Sector non-financial assets are estimated to total $211.814 billion at 30 June 2019, $2.938 billion lower than forecast at 2018-19 Budget due to revaluation decrements on road infrastructure at 30 June 2018.
Non-financial assets in 2019-20 are expected to be $7.442 billion higher than the 2018-19 estimated actuals, to be $219.256 billion at 30 June 2020. These assets consist primarily of land and other fixed assets of $212.382 billion, the majority of which are roads, schools, hospitals and other infrastructure used to provide services to Queenslanders. Other non-financial assets of $6.874 billion held by the State include prepayments and deferred income tax assets relating to GOCs.
General Government Sector capital expenditure for 2019-20 is forecast to be $8.335 billion, which comprises $6.727 billion of PNFA, and $1.609 billion of capital grant expenses. In addition to these, acquisitions of non-financial assets under finance leases are forecast to be $1.119 billion, bringing the total General Government Sector capital program for 2019-20 to $9.454 billion This is over $1 billion higher than in the 2018-19 Budget.
Over the four years to 2022-23, General Government Sector capital expenditure is forecast to be $32.971 billion, which comprises $27.993 billion of PNFA, and $4.978 billion of capital grant expenses. Acquisitions of non-financial assets under finance leases and similar arrangements are forecast to be $4.087 billion, bringing the total General Government Sector capital program over the period to $37.058 billion. This is over $3.8 billion higher than the capital program in the 2018-19 Budget.
General Government Sector PNFA are forecast to increase from $6.060 billion in the 2018-19 estimated actual to $7.963 billion in 2021-22. This increase reflects the Government’s commitment to providing essential infrastructure and capital works to deliver productivity enhancing infrastructure, strengthening local economies and supporting local jobs.
One of the Government’s fiscal principles targets net operating surpluses to ensure General Government Sector PNFA are funded primarily through recurrent revenues rather than borrowing. Forecast net operating cash flows from 2018-19 to 2022-23 of $21.168 billion are funding net investments in NFAs of $32.697 billion.
The State has also entered into a number of finance leases and similar arrangements, mainly in relation to Public Private Partnerships, totalling in excess of $5 billion over the period 2018-19 to 2022-23, including for the Tunnel, Stations, Development components of Cross River Rail (including returned works), New Generation Rollingstock and the Toowoomba Second Range Crossing.
Generally, at the commencement of finance leases, the non-financial assets and the borrowings of the State increase by an equal amount to reflect the acquisition of the asset from the proponent. There are no cash impacts on the commencement of the lease – the finance lease liabilities are subsequently repaid under the terms of the Public Private Partnership agreement.
112
Budget Strategy and Outlook 2019-20
Purchases of non-financial assets by the NFPS over the period 2019-20 to 2022-23 are forecast to be $40.519 billion, which is an average of $10.13 billion per annum. With capital grant expenses of $4.938 billion, this brings total capital expenditure to $45.458 billion. In addition to this, acquisitions of non-financial assets under finance leases and similar arrangements of $4.087 billion bring the total capital program over the period to $49.544 billion. While its primary aim is to facilitate service delivery to Queenslanders, infrastructure investment makes an important contribution to the economy and is a cornerstone of the Queensland job market, particularly in the construction industry.
General Government Sector
Total estimated General Government Sector liabilities of $77.386 billion in 2018-19 are $5.811 billion higher than the 2018-19 Budget, partly due to an increase of $2.182 billion flowing through from the audited actuals at 30 June 2018. The superannuation liability is expected to be higher than budgeted, impacted by actuarial adjustments such as lower discount rates, as well as lower beneficiary payments. Other provisions and liabilities are $1.662 billion higher than budgeted and include the long service leave liability, which was increased as a result of lower interest rates and a modelling revision. Advances received were higher as more GOCs joined the cash management scheme.
Total liabilities in the General Government Sector in 2019-20 will increase by $3.920 billion from the 2018-19 estimated actual, predominantly due to higher borrowing balances partly offset by lower superannuation liabilities and advances from GOCs.
General Government Sector QTC borrowing is expected to increase $2.848 billion, from $29.933 billion in 2018-19 to $32.781 billion in 2019-20, mainly to facilitate capital purchases. General Government Sector QTC borrowing for 2019-20 is $432 million lower than the projection in the 2018-19 Budget and $1.293 billion lower than projected at the time of the 2018-19 MYFER.
Lease liabilities and similar arrangements will increase by $3.2 billion during 2019-20 due to the first-time adoption of AASB 16 Leases ($2.2 billion). The recognition of leases for AASB 16 Leases largely relates to accommodation leases – for example, the recognition of the lease for 1 William Street increases liabilities by approximately $700 million – but does not have any economic impact on the State’s finances. The 2019-20 balance will also increase due to the recognition of new finance leases on the New Generation Rollingstock contract and the costs on the Cross River Rail PPP. Leases and other similar arrangements stabilise at around $7 billion over the outyears following the adoption of AASB 16 as new liabilities are largely set off by contractual repayments.
The defined benefit superannuation liability is projected to be $25.567 billion at 30 June 2020, a $1.172 billion decrease on the 2018-19 estimated actual. The State’s defined benefit fund has been closed to new entrants since 2008. Given the age profile of those employees still in that fund, retirements are also increasing. Accordingly, the State’s superannuation liability is now declining over the forward estimates. In addition, an anticipated increase in bond rates across the forward estimates contributes to the expected decline in the liability.
113
Budget Strategy and Outlook 2019-20
The composition of the General Government Sector’s forecast liabilities at 30 June 2020 is illustrated in Chart 6.2.
| Chart 6.2 | Forecast General Government Sector liabilities by category, at 30 June 2020 |
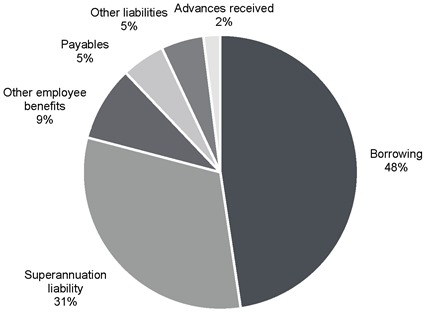
Borrowing in 2019-20 is budgeted to be 48% of total liabilities, compared with 53% in 2014-15, reflecting the reduction in borrowings over this period.
Non-financial Public Sector borrowings
NFPS borrowing with QTC of $71.954 billion is expected for 2019-20, $345 million lower than expected at the 2018-19 Budget, and $1.011 billion lower than 2018-19 MYFER. This largely reflects the Government’s commitment to fiscally responsible infrastructure investment, without substantially increasing debt.
NFPS leases and similar arrangements for 2019-20 are $3.563 billion higher than forecast at MYFER due to the adoption of AASB 16 Leases ($2.6 billion at 1 July 2019).
| 6.2.4 | Net financial liabilities |
Net financial liabilities are total liabilities less financial assets, other than equity investments in other public sector entities. This measure is broader than net debt as it includes other significant liabilities, rather than just borrowings (for example, accrued employee liabilities such as superannuation and long service leave entitlements).
114
Budget Strategy and Outlook 2019-20
The net financial liabilities of the General Government Sector for 2018-19 are estimated to be $39.568 billion.
Net financial liabilities increase across the forward estimates as investments are repatriated from the actuarially assessed defined benefit superannuation fund surplus and borrowings are made to fund priority infrastructure projects.
The net worth, or equity, of the State is the amount by which the State’s assets exceed its liabilities. This is the value of the investment held on behalf of the people of Queensland by public sector instrumentalities.
Changes in the State’s net worth occur for a number of reasons including:
| • | | operating surpluses (deficits) that increase (decrease) the Government’s equity |
| • | | revaluation of assets and liabilities as required by accounting standards |
| • | | movements in the net worth of the State’s investments in the Public Non-financial Corporations and Public Financial Corporations sectors |
| • | | gains or losses on disposal of assets. Where the selling price of an asset is greater (less) than its value in an agency’s accounts, the resultant profit (loss) affects net worth. |
Net debt is the sum of advances received and borrowings less cash and deposits, advances paid and investments, loans and placements.
Net debt for the General Government Sector in 2018-19 is estimated to be $1.661 billion, $1.154 billion less than the 2018-19 Budget mainly as a result of the improved operating position.
In the NFPS, net debt is estimated at $37.428 billion in 2018-19, $1.599 billion less than the 2018-19 Budget.
| 6.2.7 | New accounting standards |
As referred to above and in Box 3.1 in Chapter 3, AASB 16 Leases applies from 1 July 2019 and results in a one-off step up in the State’s borrowings and non-financial assets of $2.2 billion for General Government Sector and $2.6 billion for the NFPS. This adjustment largely relates to accommodation leases (including 1 William Street) and does not have any economic impact on the State’s finances.
AASB 1059 Service Concession Arrangements will apply to public sectors in Australia from 1 July 2020 and will significantly impact the State’s balance sheet, increasing assets and liabilities. This standard was meant to take effect in 2019-20 but its implementation was deferred to 1 July 2020 by the Australian Accounting Standards Board.
115
Budget Strategy and Outlook 2019-20
The State, as a grantor, will recognise an asset and matching liability which may be classified as a borrowing or unearned revenue (included in other liabilities), depending on the individual contract. The adoption of this new standard will be addressed in the 2020-21 Budget. The most significant impact will likely to arise from transactions the State has previously entered into, such as the granting of concessions on the Gateway and Logan Motorways and AirportLink where the State will be required to recognise an infrastructure asset (included in land and other fixed assets on the balance sheet) and unearned revenue (included in other liabilities on the balance sheet).
Other transactions such as Gold Coast Light Rail are already on the State’s balance sheet and may only be reclassified within non-financial asset categories.
The cash flow statement provides the cash surplus (deficit) measure which is comprised of the net cash flows from operating activities plus the net cash flows from investments in non-financial assets (or physical capital).
The estimated General Government Sector cash deficit of $1.224 million in 2018-19 is $1.024 billion lower than that forecast at the time of the 2018-19 Budget. This is largely due to the higher than expected operating cash flows.
After taking into account net investments in non-financial assets of $6.422 billion, a cash deficit of $2.586 billion is forecast for 2019-20, an improvement of $1.381 billion compared to the 2018-19 MYFER and an improvement of $1.709 billion compared to the 2018-19 Budget
Net cash flows from investments in financial assets for policy purposes include net cash flows from disposal or return of equity, net equity injections into GOCs and concessional loans and advances. Cash flows from the return of equity from the PNFC and PFC sectors are the primary driver of net inflows of $295 million over the period 2018-19 to 2022-23.
Net cash flows from investments in financial assets for liquidity purposes represent net investment in financial assets to cover liabilities such as superannuation, other employee entitlements and insurance as well as drawdowns from the redraw facility. The repatriation of surpluses in the actuarially assessed defined benefit superannuation fund and the QGIF flow through this line in the Statement of Cash Flows.
Total General Government Sector PNFA of $6.727 billion are budgeted for 2019-20 and, over the period 2019-20 to 2022-23, PNFA are expected to total $27.994 billion in the General Government Sector.
116
Budget Strategy and Outlook 2019-20
| 7 | Intergovernmental financial relations |
Features
| • | | Queensland is the only state to receive less GST revenue in 2019-20 compared to 2018-19. Queensland’s GST revenue will be lower in 2019-20 primarily because the Australian Government has significantly revised down the growth of the GST pool from 2018-19 and accepted the Commonwealth Grants Commission’s assessment that Queensland should receive a smaller share. This reflects improved mining royalties, lower natural-disaster-related expenditure, and a greater share of payments for specific purposes. |
| • | | The integrity of horizontal fiscal equalisation (principle of GST distribution) is at risk due to actions of the Australian Government. The Australian Government has legislated changes that have weakened the principles underpinning horizontal fiscal equalisation. It has also interfered with the independence of the Commonwealth Grants Commission by instructing the Commission to cease reviewing its mining revenue assessment as part of its 2020 Methodology Review. Without the Commission’s proposed changes (due to come into effect in 2020-21), Queensland will continue to unfairly lose most of its coal seam gas royalty revenue through GST distribution. |
| • | | Australian Government payments comprise approximately 44.5 per cent of Queensland’s General Government revenue. |
| • | | The Australian Government estimates that it will provide the Queensland Government $26.902 billion in 2019-20 ($360 million less than in 2018-19), comprising: |
| | • | | $14.214 billion in payments for general revenue assistance (share of GST revenue) ($227 million less than 2018-19) |
| | • | | $12.688 billion in payments for specific purposes ($134 million less than in 2018-19). |
| • | | Payments for specific purposes in 2019-20 comprise: |
| | • | | $4.902 billion for National Health Reform |
| | • | | $4.771 billion for Quality Schools |
| | • | | $0.320 billion for National Housing and Homelessness |
| | • | | $2.388 billion for National Partnership payments (e.g. Infrastructure Investment Program and Disaster Recovery Funding Arrangement) |
| | • | | $0.308 billion for National Specific Purpose Payments (National Skills and Workforce Development). |
| • | | Payments to Queensland for specific purposes will be lower in 2019-20 primarily due to the redirection of funding to the National Disability Insurance Scheme (NDIS), an upfront payment in 2018-19 for disaster-affected primary producers in north Queensland, and seven non-infrastructure National Partnership Agreements expiring on 30 June 2019. |
| • | | Despite repeated requests, the Australian Government has not allocated funding for Queensland’s Cross River Rail project or remote Indigenous housing. |
117
Budget Strategy and Outlook 2019-20
| 7.1 | Federal financial arrangements |
Vertical Fiscal Imbalance
Federal financial relations in Australia are characterised by different levels of government sharing responsibility for raising revenue and delivering services to communities. State and territory governments’ ability to raise revenue is less than required to meet their service delivery responsibilities. Conversely, the Australian Government raises more revenue than is required to meet its service delivery responsibilities. This is called vertical fiscal imbalance (VFI), and requires the sharing of revenue between the Australian Government and states and territories.
In 2017-18, the Australian Government collected the majority of taxation revenues (80.7%), while states and territories (states)1 collected 15.9% and local governments the remaining 3.4%2. Chart 7.1 illustrates the revenue and expense disparity between the different levels of government.
| Chart 7.1 | Own-source revenue and expenses by levels of government, 2017-181,2 |
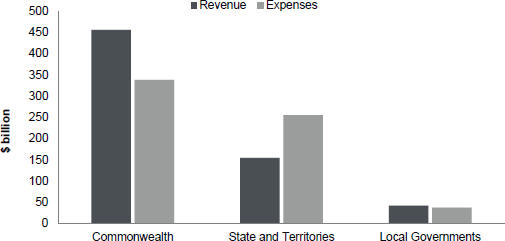
Notes:
| 1. | Revenue calculated as total revenue minus grant revenue. |
| 2. | Expenses calculated as total expenses minus grant expenses. |
Source: ABS 5512.0 2017-18.
| 1 | States refers to states and territories unless otherwise specified. |
| 2 | ABS Government Finance Statistics Cat No. 5506.0 |
118
Budget Strategy and Outlook 2019-20
In Australia, VFI is addressed through a system of intergovernmental payments from the Australian Government to the states which allows them to meet their service delivery and infrastructure responsibilities. The Australian Government makes two types of payments:
| • | | general revenue assistance payments (e.g. shares of GST revenue) which can be used by states for any purpose (untied funding) |
| • | | payments for specific purposes (tied funding) such as National Specific Purpose Payments (SPPs, contribution toward states’ service delivery) and National Partnership payments (NPs; funding to support the delivery of specific outputs or projects and to facilitate and incentivise reforms). |
Without the contribution by the Australian Government, states would not be able to provide essential services and infrastructure to their communities.
Horizontal Fiscal Imbalance and Horizontal Fiscal Equalisation
Another feature of Australian federalism is horizontal fiscal imbalance (HFI). HFI arises from disparities between the states’ capacity to raise revenue and deliver services. Some states can raise higher revenue or deliver services at a lower cost compared to other states. Over time, this can distort capital and labour mobility towards states providing higher level of services.
To address HFI, GST revenue collected by the Australian Government is distributed to states in a way that ensures each state is provided with the fiscal capacity to deliver the same standard of service and infrastructure to their population no matter where they live. This is known as horizontal fiscal equalisation (HFE).
The Commonwealth Grants Commission (CGC) uses the principles of HFE in recommending to the Australian Government how GST revenue should be distributed to the states. The amount each state receives is a function of the amount of GST revenue collected (the GST pool) and the share of revenue recommended by the CGC.
| 7.2 | Australian Government funding to the states |
The Australian Government estimates that it will provide states $127.358 billion in 2019-20, $646 million (0.5%) less than in 2018-19, comprising:
| • | | $67.2 billion in payments as shares of GST revenue, $1.57 billion more than 2018-19 |
| • | | $58.305 billion in payments for specific purposes, $2.565 billion (4.2%) less than in 2018-19, including: |
| | • | | $22.535 billion in National Health Reform funding |
| | • | | $20.944 billion in Quality Schools funding |
| | • | | $1.565 billion in National Housing and Homelessness funding. |
| | • | | $11.55 billion in National Partnership payments (e.g. Infrastructure Investment Program and Disaster Recovery Funding Arrangement (DRFA), and DisabilityCare Australia Fund) |
| | • | | $1.712 billion in National Specific Purpose Payments |
| • | | $1.853 billion in other payments (e.g. GST top-up and royalty payments). |
119
Budget Strategy and Outlook 2019-20
| 7.3 | Australian Government funding to Queensland |
The Australian Government estimates that it will provide Queensland $26.902 billion1 in 2019-20, $360 million (1.3%) less than in 2018-19.
Australian Government funding is estimated to account for 44.5% of Queensland’s total General Government Sector revenue sources in 2019-20 (shown in Chart 7.2).
| Chart 7.2 | General Government Sector revenue sources, Queensland, 2019-201,2 |
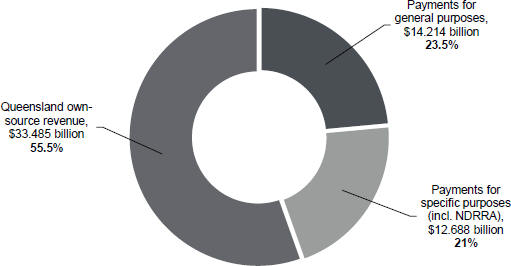
Notes:
| 1. | Percentage may not add to 100% due to rounding. |
| 2. | Queensland own-source revenue figure includes direct Australian Government payments to Queensland departments for Commonwealth own purpose expenditure. |
Source: 2019-20 Commonwealth Budget Paper No. 3 and Queensland Treasury estimates.
GST revenue accounts for all general revenue assistance payments Queensland receives. In 2019-20, Queensland expects to receive $14.214 billion of GST revenue, $227 million (1.6%) less than in 2018-19 (see Chart 7.3).
| 1 | This figure differs to Chapter 4 Australian Government payments estimates, owing to the exclusion of direct Australian Government payments to Queensland departments for Commonwealth own purpose expenditure. |
120
Budget Strategy and Outlook 2019-20
| Chart 7.3 | Estimated GST payments to Queensland, 2014-15 to 2019-201 |
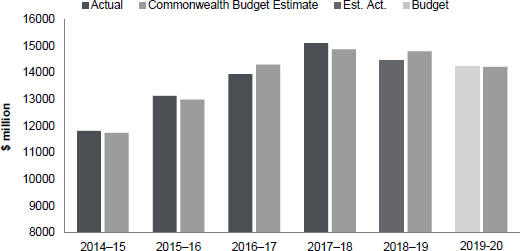
Note:
| 1. | Figures include the balancing adjustments which account for differences between the GST paid to states and the final GST pool size and population outcomes in the prior year. |
Sources: 2019-20 Commonwealth Budget Paper No. 3 and Queensland Treasury estimates.
The anticipated decrease in GST revenue in 2019-20 is primarily because the Australian Government revised down the growth of the GST pool from 2018-19 by approximately $11 billion over the forward estimates compared to the 2018-19 Commonwealth Budget.
They have also determined that Queensland has improved its fiscal capacity to deliver services relative to other states, and therefore requires a lesser share of GST. Fiscal strength is assessed and recommended by the Commonwealth Grants Commission and expressed numerically as a ‘relativity’. In 2019-20, the Australian Government accepted the Commission’s recommended relativity for Queensland of 1.05370, down from 1.09584 in 2018-19. As a result, despite the GST pool continuing to grow, albeit slower, Queensland is the only state to receive less GST revenue in 2019-20 than in 2018-19.
Specifically, the Commonwealth Grants Commission recommended a decreased share of GST revenue primarily due to:
| • | | Queensland’s value of mining production, particularly coal, has increased substantially, increasing the State’s revenue raising capacity |
| • | | Queensland required less GST funding to cover natural disaster expenses. In addition, the Commission made a one-off correction to remove local government expenditure from its assessment of Queensland’s natural disaster expenses. Queensland has raised concerns with this change as it assumes that local governments do not require the assistance of state governments to recover and it is not a true reflection of the support that the Queensland Government provides |
121
Budget Strategy and Outlook 2019-20
| • | | Queensland’s share of payments for specific purposes has increased mainly due to higher shares of payments for health and infrastructure. |
Marginal positive influences on Queensland’s GST revenue were:
| • | | slower than average growth in the value of property sales in Queensland for the assessment years reduced revenue raising capacity |
| • | | Queensland’s below average growth in taxable land values reduced the State’s revenue raising capacity. |
Queensland’s GST revenue is also adversely affected by the Australian Government excluding some payments from the GST distribution calculations. These have favoured other states in recent years, for example, funding for hospital infrastructure paid to Western Australia and funding for remote Indigenous housing paid to the Northern Territory. The adverse effect of such payments on Queensland’s GST revenue lasts several years. For 2019-20 alone, Queensland’s GST revenue is reduced by $282 million compared to 2018-19 because of the exclusions.
The Commission’s report on GST Sharing Relativities (2019 Update Report) provides details on the factors that determine Queensland’s GST share. It also provides information on Queensland’s GST share compared to other states and the reasons underpinning any differences.
The Commission is currently undertaking a comprehensive review of its methodology of assessing states’ fiscal strength and recommending shares of GST revenue. This 2020 Methodology Review is due to be completed in 2019-20, with a final report to be provided to the Australian Government and the states by 28 February 2020. Through this review, Queensland aims to ensure the assessment accurately reflects the challenges of delivering services to a large and decentralised state and that the State receives its fair share of GST revenue.
122
Budget Strategy and Outlook 2019-20
2018 was a disruptive year for horizontal fiscal equalisation, with the Australian Government introducing a series of reforms and undertaking unprecedented actions to selectively interfere with the independence of the Commonwealth Grants Commission; and, at other times, choosing to not intervene when it did not suit the Australian Government’s interests.
Australian Government changes to Horizontal Fiscal Equalisation
On 5 July 2018, the Productivity Commission (PC) released its Final Report into Horizontal Fiscal Equalisation that recommended changes to GST distribution.
The Australian Government accepted many of the recommendations and passed the Treasury Laws Amendment (Making Sure Every State and Territory Gets Their Fair Share of GST) Bill on 14 November 2018. Among other things, the Bill legislated:
| • | | ‘Top up’ payments to Western Australia and the Northern Territory from 2019-20 to 2021-22 |
| • | | from 2021-22, all states will transition over six years to equalising to the stronger of New South Wales or Victoria, and not to the strongest state |
| • | | a GST relativity floor of 0.7 in 2022-23, raised to 0.75 from 2024-25 |
| • | | a permanent boost to the GST pool. The Australian Government will inject $600 million per annum from 2021-22 and an additional $250 million per year from 2024-25. This funding will continue in perpetuity and grow at the same rate as the GST pool. |
In response to states’ concerns regarding the changes, the Australian Government legislated a ‘no worse off’ guarantee and another review by the Productivity Commission. The guarantee ensures that all states will receive GST revenue that is the better of the current distribution system or the new system over the transition period (2021-22 to 2026-27); and the Productivity Commission must conduct an inquiry by December 2026 to assess whether the updated distribution system is operating efficiently, effectively and as intended.
Australian Government interference in the 2020 Methodology Review
Every five years, the Commission undertakes a comprehensive review of its methodology for assessing states’ fiscal strength and recommending shares of GST revenue. It is a rare opportunity to improve a 20-year-old system that accounts for approximately one quarter of Queensland’s revenue.
Through the normal course of the review, the Commission proposed changes to the mining revenue assessment that improved its fairness and ensured that individual state policies do not have an undue influence on shares of GST. However, the Australian Government has taken an unprecedented step to instruct the Commission to not make any changes to the assessment. Without changes to the assessment (due to come into effect in 2020-21), Queensland will continue to lose most of the royalties collected from the State’s growing coal seam gas industry through GST distribution because other states have chosen not to invest in this sector.
123
Budget Strategy and Outlook 2019-20
Disaster Recovery
The Commission unilaterally decided to adjust its method for assessing natural disaster expenditure, and no longer considers state government expenditure on disaster-affected local government assets to be necessary.
Queensland is the most disaster impacted state in Australia, and this change is not reflective of the support the Palaszczuk Government provides local governments.
The Australian Treasurer declined to intervene and prevent the Commission’s methodology changes when requested by the Queensland Government, despite having the authority to do so. Queensland will lose out on its fair share of GST revenue from 2019-20 as a result. This change places additional strain on Queensland’s budget and increases the fiscal burden when helping local governments recover from natural disasters.
| 7.5 | Payments to Queensland for specific purposes |
In 2019-20, Queensland expects to receive $12.688 billion in payments for specific purposes, $134 million (1.0%) less than in 2018-19.
| Table 7.1 | Estimated Payments to Queensland for Specific Purposes1 |
| | | | | | | | | | | | |
| | | 2017-18
Actual
$ million | | | 2018-19
Est. Act.
$ million | | | 2019-20
Budget
$ million | |
National Specific Purpose Payments2,3 | | | 925 | | | | 673 | | | | 308 | |
National Health Reform funding | | | 4,289 | | | | 4,709 | | | | 4,902 | |
Quality Schools funding | | | 4,163 | | | | 4,474 | | | | 4,771 | |
National Housing and Homelessness funding3 | | | — | | | | 314 | | | | 320 | |
National Partnership Payments (incl. DRFA4) | | | 2,202 | | | | 2,652 | | | | 2,388 | |
Total payments for specific purposes | | | 11,579 | | | | 12,822 | | | | 12,688 | |
Notes:
| 1. | Numbers may not add due to rounding. |
| 2. | From 2019-20, the National Disability SPP will be redirected to the National Disability Insurance Agency to support implementation of the NDIS in Queensland. |
| 3. | From 2018-19, funding under the National Affordable Housing SPP and the National Partnership Agreement on Homelessness is combined under the National Housing and Homelessness Agreement. |
| 4. | The new Australian Government Disaster Recovery Funding Arrangements (DRFA) will apply from 1 November 2018 for eligible events that occur on or after that date. All eligible events occurring up to and including 31 October 2018 will be governed by the Natural Disaster Relief and Recovery Arrangements. |
Sources: 2019-20 Commonwealth Budget Paper No. 3 and Queensland Treasury estimates.
124
Budget Strategy and Outlook 2019-20
Payments for specific purposes comprise funding for National Health Reform, Quality Schools, National Housing and Homelessness, National Specific Purpose Payments (SPPs) and National Partnership (NP) payments.
In 2019-20, National Health Reform funding accounts for 38.6% of the total payments for specific purposes. National Health Reform funding is estimated to increase by $193 million (or 4.1%) from 2018-19. Queensland projections of National Health Reform funding differ from the projections contained in the 2019-20 Commonwealth Budget. Australian Government projections assume higher activity growth than projected in service agreements between the Queensland Department of Health and Hospitals and Health Services. Actual National Health Reform payments vary from estimates provided in budget papers as they are based on actual public hospital activity delivered each year.
Quality Schools funding, which accounts for 37.6% of the total payments for specific purposes, is expected to increase by 6.7% to $4.771 billion in 2019-20 compared to 2018-19.
The growth embedded in these agreements with the Australian Government is one of the primary drivers of the growth in health and education expenditure and employee numbers, the effects of which can be seen in Chart 5.3.
National Housing and Homelessness funding commenced on 1 July 2018 and is expected to increase by $6 million (or 1.9%) in 2019-20 compared to the previous year.
National Specific Purpose Payments (SPPs), which encompass 2.4% of the total payments for specific purposes, are expected to decrease by 54.2% to $308 million in 2019-20 compared to 2018-19. The reduction is due to funding under the National Disability SPP being redirected to support implementation of the NDIS in Queensland from 2019-20.
National Partnership payments (including Disaster Recovery Financial Assistance (DRFA)), which account for 18.8% of the total payments for specific purposes, is expected to decrease by 10% to $2.388 billion in 2019-20 compared to 2018-19. A significant proportion of National Partnership payments is allocated to infrastructure, DRFA, community services and education (refer to Chart 7.4).
The reduction in payments for specific purposes between 2018-19 and 2019-20 is mainly due to:
| • | | funding for the National Disability SPP will be redirected, from 2019, to support the implementation of the NDIS |
| • | | the Australian Government made an upfront payment in 2018-19 for a three-year agreement to assist disaster-affected primary producers in North and Far North Queensland |
| • | | seven non-infrastructure National Partnership Agreements will expire on 30 June 2019. |
125
Budget Strategy and Outlook 2019-20
| Chart 7.4 | National Partnership Payments by sector, 2019-201 |
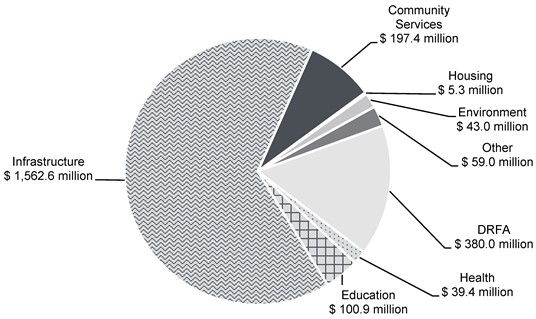
Note:
| 1. | Excludes Australian Government direct funding to local government. |
Sources: 2019-20 Commonwealth Budget Paper No. 3 and Queensland Treasury estimates.
126
Budget Strategy and Outlook 2019-20
| Box 7.2 | Key impacts of 2019-20 Commonwealth Budget |
Infrastructure
In the 2019-20 Commonwealth Budget, the Australian Government announced funding of $4 billion over the next decade for new land transport infrastructure projects in Queensland. However, most of the funding is not provided until beyond the forward estimates.
Projects include:
| • | | $800 million for the Gateway Motorway extension from Bracken Ridge to Pine River |
| • | | $320 million for Warrego Highway upgrades between Ipswich and Toowoomba |
| • | | $287 million for the Cairns Ring Road |
| • | | $1 billion under the Roads of Strategic Importance initiative, including $200 million for the Tennant Creek to Townsville corridor and $50 million for the Toowoomba (Gore Highway) to Seymour corridor |
| • | | $379 million for projects under the Urban Congestion Fund, including $50 million for the M1 intersection upgrades. |
The Commonwealth Budget also allocated $172.9 million under the proposed Regional Deal for Bundaberg and Hervey Bay to support local community and transport infrastructure projects.
There is no funding allocated in the Commonwealth Budget for the Cross -River Rail project.
North Queensland flood recovery
The Australian Government has provided $232 million in 2018-19 under Disaster Recovery Funding Arrangements to support North Queensland communities recover from the impacts of the 2019 floods.
In addition, the 2019-20 Commonwealth Budget provided $300 million in 2018-19 to assist Queensland primary producers impacted by the North and Far North Queensland monsoon trough (25 January to 14 February 2019). Funding will be provided through grants to purchase on-farm infrastructure, replace livestock and replant crops.
Health
The Australian Government is providing $1.3 billion Australia-wide over seven years from 2018-19 through the Community Health and Hospitals Program to boost health services (state allocations yet to be finalised). The Program includes $60 million to support the James Cook University Tropical Enterprise Centre in Queensland and $24 million to improve health outcomes for individuals living with brain and spinal cord injuries in Queensland.
127
Budget Strategy and Outlook 2019-20
Environment
The Australian Government is providing $9.2 million towards controlling yellow crazy ants in the Wet Tropics World Heritage Area in Queensland, $18.3 million has been brought forward across three years from 2018-19 to help eradicate red imported fire ants in Queensland.
| 7.5.1 | Projections of payments for specific purposes to Queensland |
Across the forward estimates, total payments for specific purposes are expected to steadily increase, with average growth of approximately 5% between 2019-20 and 2022-23.
National Health Reform funding for Queensland is expected to increase by an average of 5.8% per annum from 2019-20. Under the Addendum to the National Health Reform Agreement, the Australian Government will fund 45% of efficient growth in hospital activity subject to a national growth cap of 6.5% per annum. Current estimates are based on this methodology; however, funding is subject to Queensland agreeing to the Addendum to the National Health Reform Agreement, including an agreed mechanism for finalising future National Health Reform funding determinations in a timely manner.
Growth in Quality Schools funding for Queensland is expected to average 6.1% per annum between 2019-20 and 2022-23 as a result of enrolment growth and increased per student funding. In December 2018, the Queensland Government signed the National Schools Reform Agreement and associated bilateral agreement with the Australian Government, securing Australian Government funding for Queensland schools for five calendar years, 2019 to 2023. Under the agreement, Queensland is expecting to receive $8.381 billion for state schools and $12.665 billion (including GST) for non-government schools from 2019-20 to 2022-23.
The original intent of the Intergovernmental Agreement on Federal Financial Relations was to limit the number of NPs, allowing for funding to flow to states for efficient service delivery and reduce the reporting burden. However, over time, the number of time-limited and low value NPs has increased, raising community expectations for ongoing services and reducing budget certainty.
When agreements expire, states are left with limited opportunities to deal with the expiring NP as the final decision on continued funding is made through the Australian Government’s budget process. The expiry of many large NPs over the last few years, such as the National Partnership on Remote Housing and the National Partnership on Skills Reform, has brought the risks posed by fixed-term funding arrangements into sharp focus. Unilateral termination by the Australian Government of funding for essential programs, with little or no advice, impacts on the ability of the states to plan ahead and continue delivering essential services to communities. Early indication as to the continuation, lapse or other treatment of funding under expiring agreements is necessary to enable states to undertake effective service delivery and budgetary planning.
128
Budget Strategy and Outlook 2019-20
There are seven non-infrastructure NPs due to expire on 30 June 2019:
| • | | Public Dental Services for Adults |
| • | | National Quality Agenda for Early Childhood Education and Care |
| • | | Family Advocacy and Support Services |
| • | | Pay Equity for the Social and Community Services Sector |
| • | | Managing Established Pest Animals and Weeds |
| • | | Pest Animals and Weed Management in Drought Affected Areas |
| • | | National Water Infrastructure Development (feasibility component) |
A further 11 expire on 30 June 2020:
| • | | Addressing blood-borne viruses and sexually transmissible infections in the Torres Strait |
| • | | Mosquito control and cross border liaison in the Torres Strait protected zone |
| • | | Managing Torres Strait/Papua New Guinea cross border health issues |
| • | | Vaccine preventable diseases surveillance program |
| • | | Universal access to early childhood education – 2018 and 2019 |
| • | | Implementing water reform in the Murray-Darling Basin |
| • | | Women’s safety package – technology trials |
| • | | Legal assistance services |
| • | | Prepared communities (preparedness and resilience to disasters). |
The 2019-20 Commonwealth Budget commits funding for some of these but, at the time of preparing this Budget, formal arrangements are not in place that guarantee their continuation. Queensland’s priority agreements for extension include the NPs on Universal Access to Early Childhood Education, Public Dental Services for Adults and Legal Assistance Services. Also, Queensland is seeking renewal of the NP on Remote Housing which expired on 30 June 2018; no funding was allocated for remote Indigenous housing to Queensland in the 2019-20 Commonwealth Budget.
Queensland will continue to engage with the Australian Government to progress these agreements, noting the 2019-20 Commonwealth Budget committed to extending funding for:
| • | | Universal Access to Early Childhood Education is proposed to be extended to the 2020 school year. This will be the sixth short-term extension for this agreement since 2008. $86.6 million will be available to Queensland for 2019-20 under the NP |
| • | | Public Dental Services for Adults is proposed to be extended until 30 June 2020. Queensland is expecting $21.7 million under the extension |
129
Budget Strategy and Outlook 2019-20
| • | | Legal Assistance Services is proposed to be extended and will receive funding of $1.2 billion nationally (state allocations yet to be finalised) over three years from 2020-21, including services delivered by Legal Aid Commissions, Community Legal Centres and Aboriginal and Torres Strait Islander Legal Services. The funding is intended to be delivered through a new, single national mechanism for Commonwealth legal assistance from 1 July 2020. |
There is no funding allocated to Queensland for remote Indigenous housing in the 2019-20 Commonwealth Budget.
When the Australian Government decides to cease funding for expiring agreements, it presents a significant ongoing fiscal risk for states, with impacts on the quality and continuity of much needed services delivered to some of the most vulnerable members of the community.
| 7.6 | State-local government financial relations |
In 2019-20, the Queensland Government will provide a total of $1.468 billion in grants to local governments, compared to $2.067 billion in 2018-19. The lower level of grants to local governments in 2019-20 is mainly due to early payment of Financial Assistance grants by the Australian Government, a bring forward of grants under the Works for Queensland program, and the early payment of grants as part of the Waste Levy scheme.
130
Budget Strategy and Outlook 2019-20
| Table 7.2 | Estimated Payments to Queensland for Specific Purposes1,2 |
| | | | | | | | | | | | |
| | | 2018-19
Budget
$ million | | | 2018-19
Est. Act.
$ million | | | 2019-20
Budget
$ million | |
Aboriginal and Torres Strait Islander Partnerships | | | 7 | | | | 5 | | | | 8 | |
Child Safety, Youth and Women | | | 2 | | | | | | | | | |
Communities, Disability Services and Seniors | | | 60 | | | | 58 | | | | 59 | |
Education | | | 2 | | | | 2 | | | | 2 | |
Environment and Science3 | | | 61 | | | | 152 | | | | 8 | |
Employment, Small Business and Training | | | | | | | 6 | | | | 6 | |
Housing and Public Works | | | 81 | | | | 76 | | | | 83 | |
Innovation, Tourism Industry Development and the Commonwealth Games | | | 2 | | | | 3 | | | | 3 | |
Local Government, Racing and Multicultural Affairs4 | | | 559 | | | | 814 | | | | 437 | |
Natural Resources, Mines and Energy5 | | | | | | | 160 | | | | 55 | |
Premier and Cabinet | | | 1 | | | | 1 | | | | | |
Queensland Fire and Emergency Services | | | 2 | | | | 2 | | | | 2 | |
Queensland Treasury | | | 2 | | | | 7 | | | | 7 | |
State Development, Manufacturing, Infrastructure and Planning6 | | | 544 | | | | 491 | | | | 391 | |
Transport and Main Roads7 | | | 213 | | | | 265 | | | | 187 | |
Other8 | | | 132 | | | | 25 | | | | 220 | |
Total Queensland Government grants | | | 1,667 | | | | 2,067 | | | | 1,468 | |
Notes:
| 1. | Includes current, capital and asset grants to local government authorities and Aboriginal and Islander councils. Includes Australian Government grants paid through the state to local governments. |
| 2. | Numbers may not add due to rounding. |
| 3. | The increase in 2018-19 is primarily related to new funding for payments to local councils for commencement of the Queensland Waste Levy on 1 July 2019. The reduction in 2019-20 is primarily due to Local Government payments relating to the Waste Levy not being reflected in the 2019-20 budget as the payment in 2018-19 was for 2019-20 operations. Other planned programs in 2019-20 include a capital grant for the Rockhampton Art Gallery. |
| 4. | Increase in 2018-19 Estimated Actual is principally due to the advance payment for the Financial Assistance Grants in June 2019 that applies to 2019-20. Decrease is due to the advance payment of the 2019-21 Works for Queensland program in May 2019 and the advance payment for the Financial Assistance Grants in June 2019 that applies to 2019-20. |
| 5. | The reduction in 2019-20 is due to the grant funding for the Haughton Water Pipeline Duplication (HWPD) Project being realigned more closely with the Townsville City Council’s expenditure. |
| 6. | Reduction from 2018-19 Budget to Estimated Actual is due to lower than expected payments under the Royalties for the Regions (R4R) and Building our Regions (BoR) grant programs. Additionally, the decrease from the 2018-19 budget to 2019-20 is primarily due to movements in expected payments under Disaster Recovery Funding Arrangements, with 2018-19 including progress payments for a suite of recovery projects funded by the Queensland Government following Severe Tropical Cyclone (STC) Debbie. |
| 7. | Increase in 2018-29 Estimated Actual primarily due to increased expenditure on local roads under the Commonwealth funded Cape York Region package and Improving Cattle Supply Chains. Decrease in 2019-20 Budget primarily due to reduction in capital projects on local roads, completion of payments under the Commonwealth funded Cape York Region Package and reduction in payments under the Commonwealth Funded Bridges Renewal Program. |
| 8. | Grants not yet allocated to government agencies, largely in relation to natural disaster relief. |
131
Budget Strategy and Outlook 2019-20
The Queensland Government allocates considerable funding in the State Budget to support local governments across the State. The Queensland Government acknowledges the shared responsibilities in serving the people of Queensland and the important role local governments play. A summary of the major grant programs available to local governments are listed below.
| Table 7.3 | Grant programs exclusively available to local government |
| | | | |
Program Name (Responsible Agency) | | Description | | Total Funding
(from 2015-16
to 2022-23) |
| Works for Queensland | | Support local governments in regional areas to undertake job-creating maintenance and minor infrastructure works. | | $600 million |
| Transport Infrastructure Development Scheme1 | | Provide targeted investment in regional local government transport infrastructure. | | $560 million |
| Building our Regions1 | | Provide funding for critical infrastructure in regional areas to support economic development, including generating jobs. | | $365 million |
| Local Government Grants and Subsidies Program | | Provide funding for priority infrastructure projects that will enhance sustainable and liveable communities. | | $29 million
per annum |
| Coastal Hazard Adaptation Program - QCoast2100 | | Assist coastal local governments to prepare plans and strategies for addressing climate change. | | $12 million |
| Queensland Water Regional Alliances Program | | Assist regional councils to collaborate and improve efficiencies and administration around water infrastructure. | | $6 million |
Note:
| 1. | The $560 million includes $150 million which falls under the Building Our Regions Program. |
In addition to the above grant programs, the Government has provided additional funding of $38 million over four years from 2018-19 to establish the Disaster Resilience Fund. This fund administered by the Queensland Reconstruction Authority, will be available to a range of organisations including local governments, to deliver mitigation and resilience projects.
The Queensland Reconstruction Authority also administers the Disaster Recovery Funding Arrangements which is a joint funding initiative of the State and Australian Governments to provide disaster relief and recovery payments to help communities recover following the effects of natural disasters. Under these arrangements the State contributes significant funding (approximately $700 million) to provide disaster relief and to assist with reconstruction of local government infrastructure damaged during natural disasters. The actual amount will be dependent on the final number of claims submitted.
132
Budget Strategy and Outlook 2019-20
The Government also understands there are added challenges faced by Indigenous local governments, which are often located in very remote areas of the State, to ensure their communities have access to essential services and critical infrastructure. In response, the Government has allocated substantial additional funding to specifically support Indigenous councils and their communities. A summary of grant programs available to Indigenous councils and their communities are listed below.
| Table 7.4 | Grant programs to support Indigenous councils and their communities |
| | | | |
Program Name | | Description | | Total Funding
(from 2015-16
to 2022-23) |
| Indigenous Councils Critical Infrastructure Program | | Contribute water, wastewater and solid waste infrastructure in Indigenous communities. | | $120 million |
| Major Infrastructure Program | | Deliver environmental health and other infrastructure upgrades within the Torres Strait Island Regional Council, Torres Shire Council and Northern Peninsula Area Regional Council areas. | | $15 million |
| State Government Financial Aid | | A financial contribution (in lieu of rates) to meet the costs incurred by Indigenous councils in the provision of local government services. | | $34.5 million
per annum |
| Indigenous Local Government Sustainability Program (2016-18) | | Assist Indigenous councils to increase their capacity, capability and sustainability. | | $8.2 million |
133
Budget Strategy and Outlook 2019-20
| 8 | Public Non-Financial Corporations Sector |
Features
| • | | The Queensland Government expects its businesses to operate commercially and efficiently and improve services to Queenslanders. |
| • | | The Government is supporting $3.496 billion of infrastructure investment through the Public Non-financial Corporations Sector in 2019-20. This includes $2.234 billion on electricity infrastructure, $261.7 million on water infrastructure, $337.4 million on port infrastructure and $638.6 million on rail infrastructure. |
| • | | The Public Non-financial Corporations Sector is forecast to generate dividends of $1.365 billion in 2019-20. Importantly, dividends generated by the government-owned corporations (GOCs) are used to fund vital services for Queensland, such as public hospitals, schools and police. |
| • | | The Government has delivered on key energy policy reforms including the establishment of a new clean energy government-owned corporation, CleanCo Queensland Limited (CleanCo). CleanCo will put ongoing downward pressure on electricity prices, as well as growing investment and jobs in the renewable energy sector. The Government will invest $250 million over 2019-20 and 2020-21 to develop new, public renewable energy generation assets. |
| • | | Government has taken action to put downward pressure on wholesale prices and the establishment of CleanCo will create an even more competitive market. Other initiatives include continuing to remove the costs of the Solar Bonus Scheme from customer bills in 2019-20. Queensland wholesale spot prices remained the lowest in the National Energy Market over the past two summers. The Queensland Competition Authority’s Final Determination for Regulated Retail Electricity Prices estimates prices in regional Queensland will fall by 4.4 per cent in 2019-20 for the typical household bill, with prices in South East Queensland also expected to fall. |
| • | | Energy Queensland Limited has submitted its regulatory proposals for the new regulatory control period 2020-25, through which the Australian Energy Regulator will determine allowable revenues for the business. |
| • | | In 2019-20, Queensland Rail will work in partnership with the Department of Transport and Main Roads to ensure operational readiness for introduction of major new infrastructure including Cross River Rail and the European Train Control System. Queensland Rail will also progress a new subsidy for below rail users of Queensland Rail’s Mount Isa Line. |
| • | | The government-owned port corporations will continue to progress key projects in 2019-20 across the State. This includes progressing delivery of the Cairns Shipping Development Project and the Channel Capacity Upgrade project at the Port of Townsville, progressing the detailed business case and seeking approvals to commence works on the Clinton Vessel Interaction Project, and progressing construction and operation of containerised freight loading and unloading facilities at the Port of Townsville, subject to a business case. |
134
Budget Strategy and Outlook 2019-20
| • | | Progressing the Rookwood Weir project presents an opportunity to supplement urban water supplies and enhance agricultural and industrial development in the Fitzroy Basin and Gladstone region. The Queensland and Australian Government have agreed to work in partnership to deliver the project. In parallel, Sunwater has progressed preparatory works, with early works for the project expected to commence in the second half of 2019. |
| • | | In order to deliver budget sustainability and optimal performance of the State’s GOCs, savings targets for GOCs have been factored into the 2019-20 State Budget. These savings targets, which will realise over $840 million over the forward estimates period, will be reinvested into this sector to deliver a more sustainable business model. GOC proposals for reinvestment will be subject to shareholding Minister approval and will be subject to stringent assessment. Consistent with Government’s employment security policy there will be no forced redundancies in realising these targets. |
Several industries are covered by the Public Non-financial Corporations (PNFC) Sector, including energy, rail, ports and water. Queensland’s government-owned corporations (GOCs), declared by regulation to be GOCs under the Government Owned Corporations Act 1993 (GOC Act), make up a large part of the PNFC Sector. Also included in the sector are non-GOC entities, the Queensland Bulk Water Supply Authority (trading as Seqwater), Queensland Rail, local water boards and other public corporations.
GOCs are accountable for their financial performance and are required to be commercial and efficient organisations. These requirements are legislated under the GOC Act.
PNFC Sector entities provide services or commodities like other businesses. The entities incur costs and bear commercial risks in the delivery of their services or products and generate revenue from the sale of these services or products. The aim of these entities is to deliver vital services while achieving a commercial rate of return for the Government.
The returns to Government are used to pay for important community services such as hospitals, education and concession payments. In some cases, part of a PNFC entity’s revenue may arise from community service obligation (CSO) payments from the Government. These payments are used to subsidise a service or commodity provided by the entity, and allow it to be provided to the community at a lower price than it would be on a purely commercial basis. A key example of this is the CSO paid to Energy Queensland Limited to provide electricity in regional Queensland at prices based on the costs of supply in South East Queensland, in accordance with the Government’s Uniform Tariff Policy. This ensures that electricity prices in regional Queensland are much lower than would otherwise be the case.
135
Budget Strategy and Outlook 2019-20
| 8.1.1 | Electricity Networks |
The Government owns two electricity network businesses that are responsible for transmitting safe, reliable electricity to consumers across the State – Powerlink and Energy Queensland Limited (EQL).
Powerlink
Powerlink owns, develops, operates and maintains the electricity transmission network in Queensland. Its network runs approximately 1,700 kilometres from north of Cairns to New South Wales. Powerlink’s role in the electricity supply chain is to transmit high voltage electricity – generated at major power stations – through its transmission grid to the distribution networks.
Powerlink also transmits electricity to high usage industrial customers such as rail companies, mines and mineral processing facilities, and to New South Wales via the Queensland/New South Wales interconnector transmission line.
Energy Queensland Limited
On 30 June 2016, Energex and Ergon Energy were merged under the parent company, EQL. EQL owns and operates the low-voltage distribution network that transmits electricity from Powerlink’s transmission network and distributes it to households and businesses across Queensland. Ergon Energy Network provides the distribution network in regional Queensland and Ergon Energy Retail offers its customers retail services in regional Queensland. Energex provides distribution network services to customers within South East Queensland.
EQL, through its subsidiary Yurika, is also involved in a range of other service delivery functions including demand management services, large-scale connections, microgrid solutions, the provision of contestable metering services and telecommunications infrastructure. Yurika is focused on pursuing strategic investments in unregulated markets to provide greater choice to customers and provide EQL an enhanced ability to respond to emerging trends.
When the Government announced the merger of Energex and Ergon Energy under EQL, it was estimated that through the merger and other efficiencies, savings of $562 million were to be generated over five years. These savings will deliver benefits to both Government and electricity consumers, through improved returns from the business, and by putting downward pressure on electricity prices. EQL is on track to exceed its savings target by 2019-20, with forecast total savings of $644 million.
Network Revenues
Revenues for the network businesses are largely derived from network services that are regulated by the Australian Energy Regulator (AER). The AER determines these revenues on a five-yearly basis, based on the businesses’ proposals and its view of the reasonable benchmark efficient costs for a network business.
136
Budget Strategy and Outlook 2019-20
The AER published Powerlink’s revenue determination in April 2017 for the 2017-22 regulatory control period, which resulted in a significant reduction in allowable revenues for the business. In January 2019, the Energex and Ergon Energy businesses submitted to the AER their regulatory proposals for the period 1 July 2020 to 30 June 2025. EQL will continue to consult with stakeholders and revise its regulatory proposals over 2019, with revised submissions due to the AER in December 2019, ahead of the AER’s final determination in April 2020.
| 8.1.2 | Electricity Generation |
Queensland is in a strong position to deliver reliable and affordable energy through publicly owned baseload and renewable generation capacity.
Queensland had the lowest wholesale market spot prices over the past two summers and forward wholesale prices in Queensland remain the lowest in the National Electricity Market (NEM).
Queensland continues to operate Australia’s youngest and most efficient fleet of coal-fired generators, safeguarding jobs in traditional industries as well as a growing industry of large-scale renewable projects. This will be supported into the future by CleanCo, the State’s new clean energy GOC.
CleanCo will encourage competition in the energy sector ensuring that downward pressure on electricity prices is maintained. CleanCo will play a key role in delivering the Government’s 50% Queensland Renewable Energy Target by 2030.
CleanCo
In December 2018, CleanCo was established as the third energy generation GOC with the appointment of the inaugural Board. CleanCo will be transferred the ownership, title and dispatch rights of a specified and strategic portfolio of low and no emission generation assets from CS Energy and Stanwell in 2019-20. CleanCo will add to its foundation portfolio, including through building, owning and operating new renewable energy generation assets under its mandate to support the development of 1,000 megawatts (MW) of new renewable energy generation by 2025.
CS Energy
CS Energy is a major provider of energy into the NEM. In addition to owning and operating power stations, CS Energy is also a party to the Gladstone Interconnection and Power Pooling Agreement, which entitles it to trade the output of the Gladstone Power Station that exceeds the requirements of the Boyne Island aluminium smelter.
Stanwell
Stanwell is a significant provider of energy into the NEM, with Queensland’s largest portfolio of power stations. Stanwell also sells electricity directly to large commercial and industrial customers in Queensland, New South Wales, the Australian Capital Territory and Victoria.
137
Budget Strategy and Outlook 2019-20
| Box 8.1 | Clean Energy Leader |
The Government is committed to reaching its 50 per cent Queensland Renewable Energy Target (QRET) by 2030.
As part of the Powering Queensland Plan (PQP), the Government committed to investigate the creation of a clean energy generation GOC. In August 2018, the Government endorsed its establishment and CleanCo was established as the State’s new renewable electricity generator GOC in December 2018.
CleanCo is a structural solution to increase competition in the wholesale electricity market. This will drive down wholesale electricity prices, delivering cheaper energy to Queensland households and businesses. CleanCo builds on Government’s reforms to secure a cleaner, affordable, sustainable and reliable energy supply for Queensland. These plans have worked, as Queensland had the lowest wholesale market spot prices over the past two summers.
CleanCo will have a strategic portfolio of low and no emission power generation assets when it is transferred ownership and dispatch rights to a foundation portfolio of existing government-owned renewable and low emission energy generation assets including the Wivenhoe pumped storage hydro plant, Swanbank E, Barron Gorge, Kareeya and Koombooloomba power stations. CleanCo will add to its foundation portfolio, including through building, owning and operating new renewable energy generation assets. This is supported through an initial funding allocation of $250 million over 2019-20 and 2020-21.
Queensland’s ownership of its assets means its businesses can be run for the benefit of Queenslanders, not just for profit. The PQP and Affordable Energy Plan have reformed the market and given direct price benefits to Queensland consumers. For instance, the Government is continuing to remove the costs of the Solar Bonus Scheme from customer bills over 2019-20.
Queensland has experienced significant growth in the renewable energy sector in recent years with over 1,500 MW of projects having commenced operations. These projects have brought over $3.1 billion worth of investment and delivered over 3,200 construction jobs. A further $800 million worth of projects are under construction or committed and are set to deliver another 1,000 MW of generation capacity by the end of 2019. These works will generate over 820 construction jobs, and put Queensland on track to achieve the 50 per cent QRET by 2030.
138
Budget Strategy and Outlook 2019-20
Queensland Rail is an integrated, publicly-owned rail operator, responsible for the delivery of passenger transport in South East Queensland, long distance passenger services in rural and regional Queensland and provision of third party access to networks for freight transport across the state.
The majority of Queensland Rail’s services are delivered under a Rail Transport Services Contract (TSC) with the Government, represented by the Department of Transport and Main Roads. The Rail TSC provides funding for rail infrastructure, Citytrain (South East Queensland passenger services) and Traveltrain (regional passenger services).
In 2019-20, Queensland Rail will work in partnership with the Department of Transport and Main Roads to ensure operational readiness for introduction of major new infrastructure including Cross River Rail and the European Train Control System. Queensland Rail will also progress a new subsidy for below rail users of Queensland Rail’s Mount Isa Line.
Queensland has a large network of ports along its coastline, ranging from small installations serving local communities to large, world class multi-user and multi-cargo ports, which have public and privately-owned import and export facilities. Apart from the Port of Brisbane, the port authorities responsible for all of Queensland’s ports are owned and run by GOCs. Queensland’s ports are a major component of the State’s supply chain networks and economy, and their efficient and profitable operation is essential to continued economic growth, job creation, and sustainable development in the State.
The port sector’s financial performance is influenced by various factors including supply chain expansions and disruptions, evolving transportation methods and the condition of the Queensland and global economies, particularly demand abroad for Queensland’s natural resources and agricultural products. Queensland ports continue to look to enhance supply chain efficiency and identify new markets to improve financial outcomes and stimulate the economy, while meeting environmental and community obligations.
Key projects for the port GOCs in 2019-20 include progressing:
| • | | construction and operation of containerised freight loading and unloading facilities at the Port of Townsville, subject to a business case |
| • | | delivery of the Cairns Shipping Development Project |
| • | | delivery of the Channel Capacity Upgrade project at the Port of Townsville |
| • | | works for Berth 4 upgrades at the Port of Townsville |
| • | | works for Tug Berth upgrades at the Port of Mackay |
| • | | the detailed business case and seeking approvals to commence works on the Clinton Vessel Interaction Project at the Port of Gladstone. |
139
Budget Strategy and Outlook 2019-20
Cairns Shipping Development Project
The Cairns Shipping Development Project is a $127 million port expansion project involving the deepening and widening of the Trinity Inlet shipping channel at the Port of Cairns, to allow larger cruise ships to pass through to the port. The project will promote expansion of the cruise shipping industry in Cairns and economic activity in the wider North Queensland region. The State is contributing $60 million of the project cost, with the remainder to be funded by Ports North.
Significant steps have been taken throughout 2018-19 to progress this project, including the receipt of all council, State and Federal environmental approvals, and investment approval by shareholding Ministers. Construction works in preparation for dredging parts of the channel and ship swing basins have commenced, with upgrades to wharf areas scheduled to begin later in 2019. The project is due for completion in 2020-21.
The two largest entities in the Queensland bulk water market are the Queensland Bulk Water Supply Authority (trading as Seqwater) and Sunwater Limited (Sunwater).
Seqwater
Seqwater is responsible for supplying safe, secure and reliable bulk drinking water for people across South East Queensland. Its assets and operations spread across a large geographic area from the New South Wales border, to the base of the Toowoomba ranges and as far north as Gympie. Seqwater provides essential flood mitigation services and manages seven water supply schemes which provide irrigation services.
Dams play a vital role in the South East Queensland water supply. Seqwater has an ongoing Dam Improvement Program (DIP) to ensure the safety of its dams and compliance with dam safety guidelines into the future.
Key projects for Seqwater in 2019-20 include:
| • | | progressing planning for the Lake Macdonald Dam Upgrade |
| • | | progressing planning for the Somerset Dam Upgrade |
| • | | commencing construction on the Ewen Maddock Dam Upgrade. |
As a result of extended hot and dry periods over the 2018-19 summer and the South East Queensland drinking water storage reaching 68% in early June 2019, Seqwater is preparing for a drought readiness phase.
140
Budget Strategy and Outlook 2019-20
Sunwater
Sunwater is the Government’s major bulk water supply business for all regions outside of South East Queensland. It supplies untreated bulk water to approximately 5,000 customers across the industrial, mining, urban and irrigation customer segments. Sunwater provides this through an extensive regional asset base, owning and managing water infrastructure assets with a replacement value of around $13 billion.
Dam safety is a major focus for Sunwater as it is for all bulk water suppliers. Sunwater commenced a prioritised DIP in 2005 to ensure that dam safety is maintained. The DIP is regularly reviewed to ensure highest priority projects are addressed first.
The DIP is an essential program to ensure the safety and stability of dams and the ongoing safety of downstream communities, and Sunwater must undertake dam safety work to meet its obligations under Queensland dam safety regulations. However, it is also likely to significantly influence Sunwater’s financial performance and net flows to the Government over the forward estimates period and beyond.
Key projects for Sunwater in 2019-20 include:
| • | | progressing construction on Fairbairn Dam spillway improvements to enhance the dam to meet future extreme weather events |
| • | | progressing planning for Paradise Dam spillway improvements to enhance the spillway to meet future extreme weather events |
| • | | progressing planning for Leslie Dam to enhance the dam to meet future extreme weather events |
| • | | progressing planning for Burdekin Falls Dam spillway improvements to enhance the spillway to meet future extreme weather events |
| • | | continuing feasibility studies into potentially raising Burdekin Falls Dam. |
Progressing the Rookwood Weir project presents an opportunity to supplement urban water supplies and enhance agricultural and industrial development in the Fitzroy Basin and Gladstone region. The weir could add up to 76,000 megalitres of water for agricultural production along the Fitzroy River, as well as an eventual back-up supply for Gladstone, Rockhampton and Livingstone Shire. The project is also expected to create 100 jobs in regional Queensland during construction.
Significant steps have been taken throughout the year toward the construction of Rookwood Weir. The Queensland and Australian Government have agreed to work in partnership to deliver the project. In parallel, Sunwater has progressed preparatory works, with early works for the project expected to commence in the second half of 2019.
141
Budget Strategy and Outlook 2019-20
| 8.2 | Finances and Performance |
| 8.2.1 | Earnings Before Interest and Tax |
Total forecast PNFC Sector earnings before interest and tax (EBIT) for 2018-19 are estimated to be $4.501 billion, up from $3.976 billion forecast at the time of the 2018-19 State Budget. This increase is primarily due to increases in the electricity generation sector, driven primarily by non-operating revenue flowing from the valuation of a favourable coal supply agreement, higher than forecast wholesale energy market prices and coal rebate revenue.
Over the forward estimates, PNFC Sector EBIT is expected to decrease to $3.077 billion in 2021-22. While EBIT is forecast to increase to $3.305 billion in 2022-23 it remains significantly less than in 2018-19.
Relative to 2018-19, EBIT in the electricity sector is estimated to fall by 22% in 2019-20 and 31% in 2022-23. The decrease in electricity generation EBIT is primarily driven by forecast reductions in wholesale generation revenues as new renewable entrants (including CleanCo) enter the wholesale market, adding increased competition and driving down wholesale prices. While electricity generation EBIT is forecast to increase from 2021-22 to 2022-23 due to higher wholesale prices following the expected closure of the Liddell Power Station in New South Wales, it remains significantly less than in 2018-19.
Movements in electricity network EBIT over the forward estimates is influenced by forecasts of regulatory revenue collections for the network businesses. Electricity network EBIT is expected to fall from $1.991 billion in 2018-19 to $1.443 billion in 2020-21. Electricity network EBIT is then expected to increase to $1.648 billion in 2022-23 but remains significantly less than in 2018-19. These movements are consistent with EQL’s new regulatory proposals for the period of 1 July 2020 to 30 June 2025.
Water sector EBIT is expected to reach $586 million in 2020-21, largely reflecting the upwards trend associated with the South East Queensland bulk water price path. Water sector EBIT is forecast to decline from 2021-22 in recognition of the increased spend by Sunwater associated with the DIP, some of which needs to be expensed.
Port sector EBIT is expected to trend steadily upwards over the forward estimates, driven by increased activity and forecast increased tonnage volumes.
142
Budget Strategy and Outlook 2019-20
| Table 8.1 | Earnings before interest and tax1 |
| | | | | | | | | | | | | | | | | | | | | | | | | | | | |
| | | 2017-18
Actual
$ million | | | 2018-19
Budget
$ million | | | 2018-19
Est. Act.
$ million | | | 2019-20
Budget
$ million | | | 2020-21
Projection
$ million | | | 2021-22
Projection
$ million | | | 2022-23
Projection
$ million | |
Electricity Networks | | | 2,198 | | | | 1,899 | | | | 1,991 | | | | 1,850 | | | | 1,443 | | | | 1,592 | | | | 1,648 | |
Electricity Generation | | | 1,194 | | | | 1,009 | | | | 1,442 | | | | 830 | | | | 661 | | | | 551 | | | | 722 | |
Rail | | | 323 | | | | 325 | | | | 301 | | | | 244 | | | | 278 | | | | 305 | | | | 305 | |
Ports | | | 191 | | | | 203 | | | | 202 | | | | 212 | | | | 236 | | | | 242 | | | | 260 | |
Water | | | 499 | | | | 556 | | | | 562 | | | | 571 | | | | 586 | | | | 419 | | | | 403 | |
Other2 | | | 21 | | | | (16 | ) | | | 2 | | | | (34 | ) | | | (30 | ) | | | (32 | ) | | | (33 | ) |
Total PNFC Sector | | | 4,425 | | | | 3,976 | | | | 4,501 | | | | 3,672 | | | | 3,174 | | | | 3,077 | | | | 3,305 | |
Notes:
| 1. | Numbers may not add due to rounding and bracketed numbers represent negative amounts. GOC savings targets are not included as allocations across the GOCs are yet to be determined. |
| 2. | Includes other public corporations. |
Entities in the PNFC Sector utilise debt financing as a source of funds for asset renewal and capital investments, and to maintain an optimum capital structure.
PNFC Sector entities are required to take a prudent and sound approach to the management of debt, including the establishment of borrowing arrangements which are appropriate to the business risk of the organisation. These arrangements consider the appropriateness of the proposed capital expenditure program, together with the implications of the borrowings for key financial and performance related indicators.
Total forecast PNFC Sector borrowings for 2018-19 are estimated to be $38.757 billion. Forecast borrowings are expected to increase to $41.042 billion by 2022-23. The increase in borrowings over the forward estimates is primarily driven by the electricity network and rail businesses.
Electricity network borrowings are forecast to increase over the forward estimates in line with growth in the regulated asset base. Rail sector borrowings are expected to increase in line with the Queensland Rail capital program.
Port sector borrowings are forecast to increase to $1.193 billion by 2022-23. The increase in borrowing is to fund new capital works and infrastructure projects primarily at the Port of Townsville and Ports North.
Borrowings in the water sector are largely attributable to Seqwater, which currently holds $9.425 billion of debt. The debt balance was the result of the large investment in water infrastructure in response to the Millennium Drought and the associated price path. Seqwater’s forecast borrowings reduce across the forward estimates.
143
Budget Strategy and Outlook 2019-20
The gearing levels of all GOCs continue to be monitored to ensure that they maintain metrics that are at a minimum consistent with an investment grade credit rating.
| | | | | | | | | | | | | | | | | | | | | | | | | | | | |
| | | 2017-18
Actual
$ million | | | 2018-19
Budget
$ million | | | 2018-19
Est. Act.
$ million | | | 2019-20
Budget
$ million | | | 2020-21
Projection
$ million | | | 2021-22
Projection
$ million | | | 2022-23
Projection
$ million | |
Electricity Networks | | | 21,692 | | | | 22,252 | | | | 22,172 | | | | 23,073 | | | | 23,670 | | | | 23,802 | | | | 23,855 | |
Electricity Generation | | | 1,761 | | | | 1,602 | | | | 1,941 | | | | 1,831 | | | | 1,790 | | | | 1,780 | | | | 1,750 | |
Rail | | | 3,393 | | | | 3,617 | | | | 3,505 | | | | 3,852 | | | | 4,214 | | | | 4,581 | | | | 4,712 | |
Ports | | | 1,061 | | | | 1,086 | | | | 1,071 | | | | 1,173 | | | | 1,216 | | | | 1,219 | | | | 1,193 | |
Water | | | 9,984 | | | | 10,005 | | | | 9,984 | | | | 9,981 | | | | 9,977 | | | | 9,724 | | | | 9,482 | |
Other2 | | | 102 | | | | (2 | ) | | | 85 | | | | 77 | | | | 68 | | | | 59 | | | | 49 | |
Total PNFC Sector | | | 37,992 | | | | 38,560 | | | | 38,757 | | | | 39,987 | | | | 40,934 | | | | 41,165 | | | | 41,042 | |
Notes:
| 1. | Numbers may not add due to rounding and bracketed numbers represent negative amounts. |
| 2. | Includes other public corporations. |
| 8.2.3 | Returns to Government |
PNFC Sector entities provide returns to Government by way of dividends and tax equivalent payments.
Dividends
A GOC’s dividend policy is agreed with shareholding Ministers as part of the Statement of Corporate Intent for the relevant period. A Statement of Corporate Intent represents a performance contract between the shareholding Ministers and a GOC board, with the board being accountable to shareholding Ministers for meeting financial and non-financial performance targets and delivering on the outcomes detailed in the Statement of Corporate Intent.
When establishing the dividend policy for the period, GOC boards are expected to ensure it considers the return shareholders expect on their investments and the levels of equity required to maintain a preferred capital structure. The final dividend payment is determined in accordance with the GOC Act.
Total forecast PNFC Sector dividends for 2018-19 are expected to be more than $200 million (or 11%) less than in 2017-18. This is driven by a reduction of $280 million in dividends from the electricity network businesses, substantially driven by lower electricity retail and network charges compared to 2017-18.
144
Budget Strategy and Outlook 2019-20
Importantly, the Government uses GOC dividend returns to help fund vital services for Queensland, such as public hospitals, schools and police, as well as investing in initiatives to reduce energy costs for Queenslanders. The PQP and Affordable Energy Plan have reformed the market and given direct price benefits to Queensland consumers. For instance, the Government is continuing to remove the costs of the Solar Bonus Scheme from customer bills over 2019-20.
Lower profits from the GOC sector across the forward estimates are translating into lower dividends. Relative to 2018-19, dividends are forecast to fall by 17% by 2019-20 and by 43% by 2020-21. PNFC Sector dividends are projected to decrease to $932 million in 2020-21 before increasing to $1.046 billion in 2022-23 (still 36 per cent less than in 2018-19). This reduction is being driven by the electricity sector, with electricity dividends almost halving across the forward estimates.
Electricity network dividends are expected to drop from $695 million in 2018-19 to $596 million in 2019-20, and further decline to $297 million in 2020-21. Movements in electricity network dividends are influenced by forecasts of regulatory revenue collections for the network businesses.
Electricity generation dividends are expected to decline until 2021-22 in line with the reduction in generation earnings as renewable generation alternatives enter the market. In 2022-23, electricity generation dividends increase due to higher forecast wholesale prices following the expected closure of the Liddell Power Station in New South Wales.
Competitive pressures are translating into lower electricity prices, with the Queensland Competition Authority’s Final Determination for Regulated Retail Electricity Prices estimating prices in regional Queensland will fall by 4.4% in 2019-20 for the typical household bill, with prices in South East Queensland also expected to fall.
The decline in water sector dividends across the forward estimates reflects the increased costs associated with Sunwater’s DIP, to ensure the safety and stability of dams and the ongoing safety of downstream communities. For example, in 2019-20 Sunwater is progressing construction on Fairbairn Dam spillway improvements to enhance the dam to meet future extreme weather events.
145
Budget Strategy and Outlook 2019-20
| | | | | | | | | | | | | | | | | | | | | | | | | | | | |
| | | 2017-18
Actual
$ million | | | 2018-19
Budget
$ million | | | 2018-19
Est. Act.
$ million | | | 2019-20
Budget
$ million | | | 2020-21
Projection
$ million | | | 2021-22
Projection
$ million | | | 2022-23
Projection
$ million | |
Electricity Networks | | | 976 | | | | 618 | | | | 695 | | | | 596 | | | | 297 | | | | 381 | | | | 406 | |
Electricity Generation | | | 620 | | | | 535 | | | | 657 | | | | 519 | | | | 368 | | | | 301 | | | | 374 | |
Rail | | | 112 | | | | 134 | | | | 139 | | | | 102 | | | | 127 | | | | 137 | | | | 129 | |
Ports | | | 83 | | | | 94 | | | | 90 | | | | 102 | | | | 116 | | | | 119 | | | | 131 | |
Water | | | 48 | | | | 55 | | | | 52 | | | | 45 | | | | 23 | | | | 6 | | | | 6 | |
Other2 | | | 10 | | | | — | | | | 10 | | | | — | | | | — | | | | — | | | | — | |
Total PNFC Sector | | | 1,849 | | | | 1,435 | | | | 1,643 | | | | 1,365 | | | | 932 | | | | 944 | | | | 1,046 | |
Notes:
| 1. | Numbers may not add due to rounding. |
| 2. | Includes other public corporations. |
Tax Equivalent Payments
Tax equivalent payments (TEPs) are paid by the PNFC Sector entities to recognise the benefits derived because they are not liable to pay Australian Government tax. The primary objective of the payment is to promote competitive neutrality, through a uniform application of income tax laws between the government-owned entities and their privately held counterparts.
As TEPs generally move in line with earnings, TEPs are forecast to decrease from $882 million in 2018-19 to $541 million by 2021-22, then increase to $576 million in 2022-23.
| Table 8.4 | Tax equivalent payments1 |
| | | | | | | | | | | | | | | | | | | | | | | | | | | | |
| | | 2017-18
Actual
$ million | | | 2018-19
Budget
$ million | | | 2018-19
Est. Act.
$ million | | | 2019-20
Budget
$ million | | | 2020-21
Projection
$ million | | | 2021-22
Projection
$ million | | | 2022-23
Projection
$ million | |
Electricity Networks | | | 442 | | | | 290 | | | | 331 | | | | 371 | | | | 245 | | | | 278 | | | | 286 | |
Electricity Generation | | | 321 | | | | 236 | | | | 421 | | | | 234 | | | | 203 | | | | 171 | | | | 204 | |
Rail | | | 36 | | | | 47 | | | | 52 | | | | 48 | | | | 26 | | | | 21 | | | | 11 | |
Ports | | | 40 | | | | 51 | | | | 52 | | | | 54 | | | | 63 | | | | 63 | | | | 67 | |
Water | | | 24 | | | | 3 | | | | 20 | | | | 8 | | | | 8 | | | | 3 | | | | 4 | |
Other2 | | | 3 | | | | 5 | | | | 5 | | | | 5 | | | | 5 | | | | 5 | | | | 5 | |
Total PNFC Sector | | | 866 | | | | 630 | | | | 882 | | | | 720 | | | | 549 | | | | 541 | | | | 576 | |
Notes:
| 1. | Numbers may not add due to rounding. |
| 2. | Includes other public corporations. |
146
Budget Strategy and Outlook 2019-20
Competitive Neutrality Fees
In accordance with the National Competition Policy principles, GOCs are expected to operate on the basis that they do not experience significant advantages or disadvantages by virtue of their Government ownership. One of the most significant advantages available to GOCs is the ability to borrow funds at a lower rate than private sector competitors on the basis of the State Government’s credit strength.
In order to account for this advantage, the Competition Principles Agreement requires a notional charge to be applied to a GOC’s cost of debt. A competitive neutrality fee (CNF) is thus applied to all borrowings and financial arrangements in the nature of debt obligations. In general, changes in CNF payments reflect movements in borrowing amounts, interest rate spreads and the entity’s stand-alone credit rating.
Total forecast PNFC Sector CNF payments for 2018-19 are estimated to be $154 million, $4 million higher than the $150 million forecast in the 2018-19 State Budget. CNF payments are forecast to increase to $225 million by 2022-23.
| Table 8.5 | Competitive neutrality fee payments1 |
| | | | | | | | | | | | | | | | | | | | | | | | | | | | |
| | | 2017-18
Actual
$ million | | | 2018-19
Budget
$ million | | | 2018-19
Est. Act.
$ million | | | 2019-20
Budget
$ million | | | 2020-21
Projection
$ million | | | 2021-22
Projection
$ million | | | 2022-23
Projection
$ million | |
Electricity Networks | | | 67 | | | | 84 | | | | 89 | | | | 106 | | | | 125 | | | | 145 | | | | 157 | |
Electricity Generation | | | 20 | | | | 17 | | | | 17 | | | | 17 | | | | 17 | | | | 18 | | | | 17 | |
Rail | | | 34 | | | | 32 | | | | 32 | | | | 30 | | | | 30 | | | | 33 | | | | 35 | |
Ports | | | 11 | | | | 11 | | | | 11 | | | | 12 | | | | 12 | | | | 12 | | | | 12 | |
Water | | | 5 | | | | 5 | | | | 5 | | | | 5 | | | | 5 | | | | 5 | | | | 5 | |
Total PNFC Sector | | | 138 | | | | 150 | | | | 154 | | | | 169 | | | | 189 | | | | 212 | | | | 225 | |
Note:
| 1. | Numbers may not add due to rounding. |
| 8.2.4 | Community Service Obligation and Rail Transport Services Contract Payments |
The Government sometimes directs or requires its businesses to perform activities that are not in the entity’s commercial interest (for example, offering services at a reduced price to benefit the community). In these situations, the Government will often provide a Community Service Obligation (CSO) payment to the entity for the cost of delivering the service.
Transport Services Contract (TSC) payments are made to Queensland Rail to provide rail passenger services at non-commercial (subsidised) prices for the commuter and tourism markets.
147
Budget Strategy and Outlook 2019-20
In line with the Queensland Government’s Uniform Tariff Policy, a CSO payment is provided to EQL to compensate the retail subsidiary for the increased costs of operating in regional Queensland. This subsidy is provided to ensure that Queenslanders, regardless of their geographic location, pay a similar price for their electricity.
Seqwater and Sunwater own and operate water supply schemes, where irrigation prices for some schemes are set below the level necessary to recover the cost of supplying water to irrigators. The Government provides a CSO to offset the reduced revenue and to ensure that increases in water prices paid by rural irrigation customers to recover costs are gradual.
Total forecast PNFC Sector CSO and TSC payments for 2018-19 are estimated to be $2.270 billion, equal to the $2.270 billion forecast at the time of the 2018-19 State Budget.
In 2019-20, it is estimated that the Government will provide CSO and TSC payments to PNFC Sector entities of $2.309 billion. This is forecast to increase to $2.436 billion by 2022-23, largely driven by the TSC. The increase in the TSC is due to a mix of factors such as changes in patronage, escalation of service delivery costs and forecast growth in services.
Water CSOs are forecast to reduce reflecting the inclusion of current Government approved amounts only. In future years, further approval processes will be undertaken for those elements which are not currently included but are expected to continue into the future.
| Table 8.6 | Community service obligation payments and Transport Services Contracts1 |
| | | | | | | | | | | | | | | | | | | | | | | | | | | | |
| | | 2017-18
Actual
$ million | | | 2018-19
Budget
$ million | | | 2018-19
Est. Act.
$ million | | | 2019-20
Budget
$ million | | | 2020-21
Projection
$ million | | | 2021-22
Projection
$ million | | | 2022-23
Projection
$ million | |
Electricity Networks | | | 478 | | | | 462 | | | | 462 | | | | 498 | | | | 421 | | | | 437 | | | | 422 | |
Rail | | | 1,646 | | | | 1,797 | | | | 1,797 | | | | 1,801 | | | | 1,882 | | | | 1,964 | | | | 2,014 | |
Water | | | 11 | | | | 11 | | | | 10 | | | | 10 | | | | 7 | | | | 7 | | | | — | |
Total PNFC Sector | | | 2,136 | | | | 2,270 | | | | 2,270 | | | | 2,309 | | | | 2,310 | | | | 2,408 | | | | 2,436 | |
Note:
| 1. | Numbers may not add due to rounding. |
The levels and weightings of GOC debt and equity are managed by the Government to maintain an optimal and efficient capital structure. Corporations may have different target capital structures for different business entities or to support expected capital programs and projects.
Total forecast PNFC Sector equity movements for 2018-19 are estimated to be an increase of $492 million.
Equity movements across the forward estimates are primarily influenced by the electricity networks sector. These equity movements reflect changes to ensure an efficient level of gearing is maintained for EQL and Powerlink.
148
Budget Strategy and Outlook 2019-20
Over the forward estimates, CleanCo will receive $180 million initial equity funding as well as $250 million to build, own and operate a renewable energy project, pending a business case. As part of the electricity generation restructure, Stanwell makes a $160 million equity return in 2018-19 and will pay a $100 million special dividend in 2019-20.
Queensland Rail will receive equity injections of $460 million in 2018-19 for the Moreton Bay Rail Link project, and $35 million in 2022-23 to support its capital program.
Over the forward estimates, Port of Townsville will receive equity injections totalling $120 million for the Channel Capacity Upgrade project and Ports North will receive $60 million for the Cairns Shipping Development Project.
In 2019-20, Stadiums Queensland will receive an equity injection of $35 million for the refurbishment of the Gabba.
In 2020-21, Sunwater will receive an equity injection of $100 million to undertake essential dam safety upgrades at Burdekin Falls Dam, which aligns with the updated timing for completion of the project’s business case.
| Table 8.7 | Equity movements1 |
| | | | | | | | | | | | | | | | | | | | | | | | | | | | |
| | | 2017-18
Actual
$ million | | | 2018-19
Budget
$ million | | | 2018-19
Est. Act.
$ million | | | 2019-20
Budget
$ million | | | 2020-21
Projection
$ million | | | 2021-22
Projection
$ million | | | 2022-23
Projection
$ million | |
Electricity Networks | | | (50 | ) | | | (110 | ) | | | (74 | ) | | | (106 | ) | | | (130 | ) | | | (439 | ) | | | (311 | ) |
Electricity Generation | | | — | | | | — | | | | 20 | | | | 50 | | | | 101 | | | | — | | | | — | |
Rail | | | (5 | ) | | | 460 | | | | 460 | | | | — | | | | — | | | | — | | | | 35 | |
Ports | | | — | | | | 60 | | | | 90 | | | | 40 | | | | 15 | | | | 15 | | | | 20 | |
Water | | | (5 | ) | | | (4 | ) | | | (4 | ) | | | — | | | | 100 | | | | — | | | | — | |
Other2 | | | 2 | | | | — | | | | — | | | | 35 | | | | — | | | | — | | | | — | |
Total PNFC Sector | | | (58 | ) | | | 406 | | | | 492 | | | | 19 | | | | 86 | | | | (424 | ) | | | (256 | ) |
Notes:
| 1. | Numbers may not add due to rounding. Bracketed numbers represent equity returns from the PNFC Sector to the General Government Sector. |
| 2. | Includes other public corporations including Stadiums Queensland. |
149
Budget Strategy and Outlook 2019-20
| 9 | Uniform Presentation Framework |
This chapter contains detailed financial statements for the Queensland Public Sector prepared under the Uniform Presentation Framework (UPF) first agreed to at the Premier’s Conference in 1991.
The UPF has been reviewed a number of times, most significantly following the release in October 2007 of the Australian Accounting Standards Board’s (AASB) accounting standard, AASB 1049 Whole of Government and General Government Sector Financial Reporting. The standard aims to harmonise Government Finance Statistics (GFS) and Generally Accepted Accounting Principles (GAAP) with the objective of improving the clarity and transparency of government financial statements.
Most recently, the UPF was reviewed in February 2019 following the 2015 update to the Australian GFS Framework. The changes formalised the revised reporting that had already been adopted by Queensland in the 2018-19 budget. In addition, the chapter provides:
| • | | a reconciliation of the General Government Sector net operating balance to the accounting operating result |
| • | | a time series for the General Government Sector using the revised UPF |
| • | | details of General Government Sector grant revenue and expenses |
| • | | details of General Government Sector dividend and income tax equivalent income |
| • | | data on General Government Sector expenses and purchases of non-financial assets by function |
| • | | details of taxation revenue collected by the General Government Sector |
| • | | details of contingent liabilities |
| • | | background information on the revised UPF and disclosure differences arising from it, including the conceptual basis, sector definitions and a list of reporting entities. |
| 9.2 | Uniform Presentation Framework financial information |
The tables on the following pages present operating statements, balance sheets and cash flow statements prepared on a harmonised basis for the General Government, Public Non-financial Corporations (PNFC) and Non-financial Public Sectors.
Under the UPF requirements, budgeted financial information for the Public Financial Corporations sector is not included.
150
Budget Strategy and Outlook 2019-20
| Table 9.1 | General Government Sector Operating Statement1 |
| | | | | | | | | | | | | | | | | | | | | | | | | | | | | | | | |
| | | | | | | 2017-18
Outcome
$ million | | | 2018-19
Budget
$ million | | | 2018-19
Est. Actual
$ million | | | 2019-20
Budget
$ million | | | 2020-21
Projection
$ million | | | 2021-22
Projection
$ million | | | 2022-23
Projection
$ million | |
| | Revenue from Transactions | | | | | | | | | | | | | | | | | | | | | | | | | | | | |
| | Taxation revenue | | | 13,244 | | | | 14,155 | | | | 14,005 | | | | 15,164 | | | | 15,777 | | | | 16,601 | | | | 17,525 | |
| | Grants revenue | | | 27,966 | | | | 27,701 | | | | 28,709 | | | | 28,003 | | | | 29,846 | | | | 30,670 | | | | 31,404 | |
| | Sales of goods and services | | | 5,884 | | | | 5,731 | | | | 5,869 | | | | 6,004 | | | | 6,190 | | | | 6,307 | | | | 6,389 | |
| | Interest income | | | 2,389 | | | | 2,201 | | | | 2,247 | | | | 2,141 | | | | 2,006 | | | | 1,953 | | | | 1,958 | |
| | Dividend and income tax equivalent income | | | 2,920 | | | | 2,217 | | | | 2,661 | | | | 2,237 | | | | 1,653 | | | | 1,680 | | | | 1,848 | |
| | Other revenue | | | 5,685 | | | | 5,733 | | | | 6,575 | | | | 6,837 | | | | 6,257 | | | | 6,372 | | | | 6,417 | |
| | Total Revenue from Transactions | | | 58,087 | | | | 57,738 | | | | 60,068 | | | | 60,387 | | | | 61,729 | | | | 63,583 | | | | 65,540 | |
| | | | | | | | |
Less | | Expenses from Transactions | | | | | | | | | | | | | | | | | | | | | | | | | | | | |
| | Employee expenses | | | 22,678 | | | | 23,807 | | | | 24,096 | | | | 25,396 | | | | 25,728 | | | | 26,709 | | | | 27,724 | |
| | Superannuation expenses | | | | | | | | | | | | | | | | | | | | | | | | | | | | |
| | Superannuation interest cost | | | 667 | | | | 667 | | | | 642 | | | | 516 | | | | 542 | | | | 580 | | | | 624 | |
| | Other superannuation expenses | | | 2,744 | | | | 2,887 | | | | 3,044 | | | | 3,093 | | | | 3,202 | | | | 3,257 | | | | 3,292 | |
| | Other operating expenses | | | 17,258 | | | | 15,774 | | | | 16,791 | | | | 15,790 | | | | 15,907 | | | | 16,363 | | | | 16,733 | |
| | Depreciation and amortisation | | | 3,325 | | | | 3,429 | | | | 3,449 | | | | 3,961 | | | | 4,097 | | | | 4,231 | | | | 4,334 | |
| | Other interest expenses | | | 1,614 | | | | 1,474 | | | | 1,514 | | | | 1,688 | | | | 1,721 | | | | 1,797 | | | | 1,848 | |
| | Grants expenses | | | 8,048 | | | | 9,552 | | | | 9,691 | | | | 9,754 | | | | 10,219 | | | | 10,164 | | | | 10,197 | |
| | Total Expenses from Transactions | | | 56,335 | | | | 57,590 | | | | 59,226 | | | | 60,198 | | | | 61,416 | | | | 63,101 | | | | 64,753 | |
| | | | | | | | |
Equals | | Net Operating Balance | | | 1,753 | | | | 148 | | | | 841 | | | | 189 | | | | 313 | | | | 483 | | | | 787 | |
| | | | | | | | |
Plus | | Other economic flows - included in operating result | | | (384 | ) | | | 85 | | | | (938 | ) | | | 16 | | | | 1 | | | | 317 | | | | 247 | |
| | | | | | | | |
Equals | | Operating Result | | | 1,368 | | | | 233 | | | | (97 | ) | | | 204 | | | | 314 | | | | 799 | | | | 1,034 | |
| | | | | | | | |
Plus | | Other economic flows - other movements in equity | | | (596 | ) | | | 2,717 | | | | 585 | | | | 2,495 | | | | 2,917 | | | | 2,812 | | | | 3,007 | |
| | | | | | | | |
Equals | | Comprehensive Result - Total Change In Net Worth | | | 772 | | | | 2,950 | | | | 488 | | | | 2,699 | | | | 3,231 | | | | 3,611 | | | | 4,041 | |
| | | | | | | | |
| | KEY FISCAL AGGREGATES | | | | | | | | | | | | | | | | | | | | | | | | | | | | |
| | | | | | | | |
| | Net Operating Balance | | | 1,753 | | | | 148 | | | | 841 | | | | 189 | | | | 313 | | | | 483 | | | | 787 | |
| | | | | | | | |
Less | | Net Acquisition of Non-financial Assets | | | | | | | | | | | | | | | | | | | | | | | | | | | | |
| | Purchases of non-financial assets | | | 5,127 | | | | 5,927 | | | | 6,060 | | | | 6,727 | | | | 7,125 | | | | 7,963 | | | | 6,179 | |
| | Less | | Sales of non-financial assets | | | 291 | | | | 345 | | | | 292 | | | | 305 | | | | 250 | | | | 260 | | | | 251 | |
| | Less | | Depreciation | | | 3,325 | | | | 3,429 | | | | 3,449 | | | | 3,961 | | | | 4,097 | | | | 4,231 | | | | 4,334 | |
| | Plus | | Change in inventories | | | 13 | | | | (4 | ) | | | 47 | | | | 17 | | | | 32 | | | | (3 | ) | | | (11 | ) |
| | Plus | | Other movements in non-financial assets | | | 815 | | | | 1,032 | | | | 1,152 | | | | 1,238 | | | | 1,169 | | | | 1,294 | | | | 935 | |
| | Equals | | Total Net Acquisition of Non-financial Assets | | | 2,339 | | | | 3,181 | | | | 3,518 | | | | 3,716 | | | | 3,980 | | | | 4,763 | | | | 2,518 | |
| | | | | | | | |
Equals | | Fiscal Balance | | | (586 | ) | | | (3,033 | ) | | | (2,677 | ) | | | (3,527 | ) | | | (3,667 | ) | | | (4,280 | ) | | | (1,731 | ) |
Note:
| 1. | Numbers may not add due to rounding. |
151
Budget Strategy and Outlook 2019-20
| Table 9.2 | Public Non-financial Corporations Sector Operating Statement1 |
| | | | | | | | | | | | | | | | | | | | | | | | | | | | | | | | |
| | | | | | | 2017-18
Outcome
$ million | | | 2018-19
Budget
$ million | | | 2018-19
Est. Actual
$ million | | | 2019-20
Budget
$ million | | | 2020-21
Projection
$ million | | | 2021-22
Projection
$ million | | | 2022-23
Projection
$ million | |
| | Revenue from Transactions | | | | | | | | | | | | | | | | | | | | | | | | | | | | |
| | Grants revenue | | | 640 | | | | 632 | | | | 561 | | | | 588 | | | | 507 | | | | 524 | | | | 503 | |
| | Sales of goods and services | | | 12,435 | | | | 11,718 | | | | 12,142 | | | | 11,981 | | | | 11,828 | | | | 12,132 | | | | 12,637 | |
| | Interest income | | | 77 | | | | 52 | | | | 67 | | | | 55 | | | | 54 | | | | 53 | | | | 53 | |
| | Dividend and income tax equivalent income | | | 13 | | | | 13 | | | | 13 | | | | 13 | | | | 13 | | | | 13 | | | | 13 | |
| | Other revenue | | | 487 | | | | 318 | | | | 433 | | | | 474 | | | | 345 | | | | 337 | | | | 356 | |
| | Total Revenue from Transactions | | | 13,652 | | | | 12,733 | | | | 13,215 | | | | 13,111 | | | | 12,747 | | | | 13,059 | | | | 13,562 | |
| | | | | | | | |
Less | | Expenses from Transactions | | | | | | | | | | | | | | | | | | | | | | | | | | | | |
| | Employee expenses | | | 1,705 | | | | 1,981 | | | | 2,010 | | | | 2,152 | | | | 2,170 | | | | 2,198 | | | | 2,238 | |
| | Superannuation expenses | | | | | | | | | | | | | | | | | | | | | | | | | | | | |
| | Superannuation interest cost | | | (11 | ) | | | — | | | | — | | | | — | | | | — | | | | — | | | | — | |
| | Other superannuation expenses | | | 218 | | | | 164 | | | | 212 | | | | 216 | | | | 222 | | | | 225 | | | | 230 | |
| | Other operating expenses | | | 4,573 | | | | 4,032 | | | | 3,903 | | | | 3,998 | | | | 4,021 | | | | 3,987 | | | | 4,117 | |
| | Depreciation and amortisation | | | 2,480 | | | | 2,618 | | | | 2,776 | | | | 2,857 | | | | 2,896 | | | | 2,970 | | | | 2,972 | |
| | Other interest expenses | | | 1,903 | | | | 1,908 | | | | 1,876 | | | | 1,847 | | | | 1,862 | | | | 1,879 | | | | 1,884 | |
| | Grants expenses | | | 21 | | | | 22 | | | | 16 | | | | 17 | | | | 18 | | | | 18 | | | | 19 | |
| | Other property expenses | | | 870 | | | | 637 | | | | 886 | | | | 724 | | | | 553 | | | | 545 | | | | 581 | |
| | Total Expenses from Transactions | | | 11,759 | | | | 11,361 | | | | 11,679 | | | | 11,811 | | | | 11,741 | | | | 11,823 | | | | 12,040 | |
| | | | | | | | |
Equals | | Net Operating Balance | | | 1,893 | | | | 1,372 | | | | 1,536 | | | | 1,300 | | | | 1,006 | | | | 1,236 | | | | 1,522 | |
| | | | | | | | |
Plus | | Other economic flows - included in operating result | | | (210 | ) | | | (29 | ) | | | 227 | | | | 7 | | | | (46 | ) | | | (234 | ) | | | (363 | ) |
| | | | | | | | |
Equals | | Operating Result | | | 1,684 | | | | 1,343 | | | | 1,763 | | | | 1,307 | | | | 960 | | | | 1,002 | | | | 1,159 | |
| | | | | | | | |
Plus | | Other economic flows - other movements in equity | | | (653 | ) | | | (532 | ) | | | (796 | ) | | | (823 | ) | | | (278 | ) | | | (787 | ) | | | (706 | ) |
| | | | | | | | |
Equals | | Comprehensive Result - Total Change In Net Worth | | | 1,030 | | | | 810 | | | | 967 | | | | 484 | | | | 683 | | | | 215 | | | | 453 | |
| | | | | | | | |
| | KEY FISCAL AGGREGATES | | | | | | | | | | | | | | | | | | | | | | | | | | | | |
| | | | | | | | |
| | Net Operating Balance | | | 1,893 | | | | 1,372 | | | | 1,536 | | | | 1,300 | | | | 1,006 | | | | 1,236 | | | | 1,522 | |
| | | | | | | | |
Less | | Net Acquisition of Non-financial Assets | | | | | | | | | | | | | | | | | | | | | | | | | | | | |
| | Purchases of non-financial assets | | | 2,509 | | | | 3,130 | | | | 2,801 | | | | 3,496 | | | | 3,322 | | | | 3,247 | | | | 2,461 | |
| | Less | | Sales of non-financial assets | | | 47 | | | | 11 | | | | 44 | | | | 21 | | | | 5 | | | | — | | | | 3 | |
| | Less | | Depreciation | | | 2,480 | | | | 2,618 | | | | 2,776 | | | | 2,857 | | | | 2,896 | | | | 2,970 | | | | 2,972 | |
| | Plus | | Change in inventories | | | 36 | | | | 35 | | | | 36 | | | | (2 | ) | | | (5 | ) | | | — | | | | 5 | |
| | Plus | | Other movements in non-financial assets | | | 79 | | | | 68 | | | | 72 | | | | 71 | | | | 85 | | | | 89 | | | | 93 | |
| | Equals | | Total Net Acquisition of Non-financial Assets | | | 97 | | | | 604 | | | | 90 | | | | 687 | | | | 500 | | | | 366 | | | | (416 | ) |
| | | | | | | | |
Equals | | Fiscal Balance | | | 1,797 | | | | 767 | | | | 1,446 | | | | 613 | | | | 506 | | | | 871 | | | | 1,938 | |
Note:
| 1. | Numbers may not add due to rounding. |
152
Budget Strategy and Outlook 2019-20
| Table 9.3 | Non-financial Public Sector Operating Statement1 |
| | | | | | | | | | | | | | | | | | | | | | | | | | | | | | | | |
| | | | | | | 2017-18
Outcome
$ million | | | 2018-19
Budget
$ million | | | 2018-19
Est. Actual
$ million | | | 2019-20
Budget
$ million | | | 2020-21
Projection
$ million | | | 2021-22
Projection
$ million | | | 2022-23
Projection
$ million | |
| | Revenue from Transactions | | | | | | | | | | | | | | | | | | | | | | | | | | | | |
| | Taxation revenue | | | 12,988 | | | | 13,892 | | | | 13,724 | | | | 14,867 | | | | 15,458 | | | | 16,258 | | | | 17,166 | |
| | Grants revenue | | | 28,006 | | | | 27,788 | | | | 28,745 | | | | 28,028 | | | | 29,871 | | | | 30,696 | | | | 31,429 | |
| | Sales of goods and services | | | 16,375 | | | | 15,353 | | | | 15,854 | | | | 15,845 | | | | 15,719 | | | | 16,094 | | | | 16,730 | |
| | Interest income | | | 2,421 | | | | 2,219 | | | | 2,270 | | | | 2,160 | | | | 2,025 | | | | 1,966 | | | | 1,965 | |
| | Dividend and income tax equivalent income | | | 217 | | | | 164 | | | | 149 | | | | 164 | | | | 185 | | | | 206 | | | | 237 | |
| | Other revenue | | | 6,168 | | | | 6,051 | | | | 6,957 | | | | 7,207 | | | | 6,284 | | | | 6,339 | | | | 6,513 | |
| | Total Revenue from Transactions | | | 66,175 | | | | 65,467 | | | | 67,699 | | | | 68,272 | | | | 69,542 | | | | 71,558 | | | | 74,040 | |
| | | | | | | | |
Less | | Expenses from Transactions | | | | | | | | | | | | | | | | | | | | | | | | | | | | |
| | Employee expenses | | | 24,283 | | | | 25,688 | | | | 25,987 | | | | 27,430 | | | | 27,775 | | | | 28,782 | | | | 29,836 | |
| | Superannuation expenses | | | | | | | | | | | | | | | | | | | | | | | | | | | | |
| | Superannuation interest cost | | | 656 | | | | 667 | | | | 642 | | | | 516 | | | | 542 | | | | 580 | | | | 624 | |
| | Other superannuation expenses | | | 2,962 | | | | 3,051 | | | | 3,256 | | | | 3,309 | | | | 3,423 | | | | 3,483 | | | | 3,522 | |
| | Other operating expenses | | | 19,868 | | | | 17,703 | | | | 18,481 | | | | 17,539 | | | | 17,308 | | | | 17,629 | | | | 18,290 | |
| | Depreciation and amortisation | | | 5,804 | | | | 6,047 | | | | 6,225 | | | | 6,818 | | | | 6,994 | | | | 7,201 | | | | 7,306 | |
| | Other interest expenses | | | 3,336 | | | | 3,198 | | | | 3,192 | | | | 3,330 | | | | 3,360 | | | | 3,427 | | | | 3,464 | |
| | Grants expenses | | | 7,469 | | | | 9,029 | | | | 9,182 | | | | 9,208 | | | | 9,753 | | | | 9,681 | | | | 9,736 | |
| | Total Expenses from Transactions | | | 64,378 | | | | 65,383 | | | | 66,965 | | | | 68,148 | | | | 69,155 | | | | 70,783 | | | | 72,778 | |
| | | | | | | | |
Equals | | Net Operating Balance | | | 1,797 | | | | 84 | | | | 734 | | | | 124 | | | | 387 | | | | 775 | | | | 1,262 | |
| | | | | | | | |
Plus | | Other economic flows - included in operating result | | | (644 | ) | | | (54 | ) | | | (785 | ) | | | (183 | ) | | | (174 | ) | | | (357 | ) | | | (428 | ) |
| | | | | | | | |
Equals | | Operating Result | | | 1,153 | | | | 31 | | | | (51 | ) | | | (60 | ) | | | 213 | | | | 419 | | | | 835 | |
| | | | | | | | |
Plus | | Other economic flows - other movements in equity | | | (380 | ) | | | 2,920 | | | | 539 | | | | 2,759 | | | | 3,018 | | | | 3,192 | | | | 3,206 | |
| | | | | | | | |
Equals | | Comprehensive Result - Total Change In Net Worth | | | 773 | | | | 2,950 | | | | 488 | | | | 2,699 | | | | 3,231 | | | | 3,611 | | | | 4,041 | |
| | | | | | | | |
| | KEY FISCAL AGGREGATES | | | | | | | | | | | | | | | | | | | | | | | | | | | | |
| | | | | | | | |
| | Net Operating Balance | | | 1,797 | | | | 84 | | | | 734 | | | | 124 | | | | 387 | | | | 775 | | | | 1,262 | |
| | | | | | | | |
Less | | Net Acquisition of Non-financial Assets | | | | | | | | | | | | | | | | | | | | | | | | | | | | |
| | Purchases of non-financial assets | | | 7,644 | | | | 9,057 | | | | 8,856 | | | | 10,223 | | | | 10,447 | | | | 11,210 | | | | 8,640 | |
| | Less | | Sales of non-financial assets | | | 339 | | | | 356 | | | | 335 | | | | 326 | | | | 255 | | | | 260 | | | | 255 | |
| | Less | | Depreciation | | | 5,804 | | | | 6,047 | | | | 6,225 | | | | 6,818 | | | | 6,994 | | | | 7,201 | | | | 7,306 | |
| | Plus | | Change in inventories | | | 49 | | | | 31 | | | | 83 | | | | 15 | | | | 27 | | | | (2 | ) | | | (6 | ) |
| | Plus | | Other movements in non-financial assets | | | 894 | | | | 1,100 | | | | 1,224 | | | | 1,309 | | | | 1,254 | | | | 1,382 | | | | 1,028 | |
| | Equals | | Total Net Acquisition of Non-financial Assets | | | 2,443 | | | | 3,785 | | | | 3,602 | | | | 4,403 | | | | 4,479 | | | | 5,129 | | | | 2,102 | |
| | | | | | | | |
Equals | | Fiscal Balance | | | (647 | ) | | | (3,701 | ) | | | (2,868 | ) | | | (4,279 | ) | | | (4,092 | ) | | | (4,353 | ) | | | (840 | ) |
Note:
| 1. | Numbers may not add due to rounding. |
153
Budget Strategy and Outlook 2019-20
| Table 9.4 | General Government Sector Balance Sheet1 |
| | | | | | | | | | | | | | | | | | | | | | | | | | | | |
| | | 2017-18
Outcome
$ million | | | 2018-19
Budget
$ million | | | 2018-19
Est. Actual
$ million | | | 2019-20
Budget
$ million | | | 2020-21
Projection
$ million | | | 2021-22
Projection
$ million | | | 2022-23
Projection
$ million | |
| | | | | | | |
Assets | | | | | | | | | | | | | | | | | | | | | | | | | | | | |
Financial Assets | | | | | | | | | | | | | | | | | | | | | | | | | | | | |
Cash and deposits | | | 1,298 | | | | 303 | | | | 489 | | | | 407 | | | | 489 | | | | 467 | | | | 450 | |
Advances paid | | | 629 | | | | 703 | | | | 676 | | | | 620 | | | | 629 | | | | 653 | | | | 675 | |
Investments, loans and placements | | | 32,846 | | | | 30,306 | | | | 32,125 | | | | 31,318 | | | | 30,429 | | | | 30,370 | | | | 30,248 | |
Receivables | | | 4,750 | | | | 4,182 | | | | 4,377 | | | | 4,019 | | | | 3,663 | | | | 4,136 | | | | 4,696 | |
Equity | | | | | | | | | | | | | | | | | | | | | | | | | | | | |
Investments in other public sector entities | | | 23,120 | | | | 23,812 | | | | 23,951 | | | | 24,435 | | | | 25,118 | | | | 25,333 | | | | 25,785 | |
Investments - other | | | 155 | | | | 154 | | | | 151 | | | | 147 | | | | 147 | | | | 147 | | | | 147 | |
Total Financial Assets | | | 62,797 | | | | 59,460 | | | | 61,769 | | | | 60,945 | | | | 60,475 | | | | 61,106 | | | | 62,001 | |
| | | | | | | |
Non-financial Assets | | | | | | | | | | | | | | | | | | | | | | | | | | | | |
Land and other fixed assets2 | | | 200,458 | | | | 207,985 | | | | 205,180 | | | | 212,382 | | | | 218,163 | | | | 224,136 | | | | 228,059 | |
Other non-financial assets | | | 7,392 | | | | 6,767 | | | | 6,634 | | | | 6,874 | | | | 6,944 | | | | 7,030 | | | | 7,160 | |
Total Non-financial Assets | | | 207,850 | | | | 214,752 | | | | 211,814 | | | | 219,256 | | | | 225,107 | | | | 231,165 | | | | 235,219 | |
| | | | | | | |
Total Assets | | | 270,647 | | | | 274,212 | | | | 273,583 | | | | 280,202 | | | | 285,582 | | | | 292,271 | | | | 297,220 | |
| | | | | | | |
Liabilities | | | | | | | | | | | | | | | | | | | | | | | | | | | | |
Payables | | | 4,396 | | | | 4,088 | | | | 4,265 | | | | 4,148 | | | | 4,215 | | | | 4,273 | | | | 4,326 | |
Superannuation liability | | | 26,000 | | | | 23,414 | | | | 26,739 | | | | 25,567 | | | | 24,107 | | | | 22,409 | | | | 20,660 | |
Other employee benefits | | | 5,974 | | | | 5,888 | | | | 7,073 | | | | 7,177 | | | | 7,291 | | | | 7,444 | | | | 7,572 | |
Deposits held | | | 2 | | | | 2 | | | | 2 | | | | 2 | | | | 2 | | | | 2 | | | | 2 | |
Advances received | | | 2,747 | | | | 1,814 | | | | 2,270 | | | | 1,616 | | | | 1,441 | | | | 1,210 | | | | 1,255 | |
Borrowing with QTC | | | 29,256 | | | | 29,735 | | | | 29,933 | | | | 32,781 | | | | 35,218 | | | | 40,174 | | | | 42,589 | |
Leases and similar arrangements2 | | | 2,152 | | | | 2,556 | | | | 2,623 | | | | 5,824 | | | | 7,071 | | | | 6,943 | | | | 6,966 | |
Securities and derivatives | | | 122 | | | | 19 | | | | 122 | | | | 122 | | | | 122 | | | | 122 | | | | 122 | |
Other liabilities | | | 4,290 | | | | 4,059 | | | | 4,358 | | | | 4,068 | | | | 3,988 | | | | 3,957 | | | | 3,949 | |
Total Liabilities | | | 74,939 | | | | 71,575 | | | | 77,386 | | | | 81,306 | | | | 83,455 | | | | 86,533 | | | | 87,441 | |
| | | | | | | |
Net Worth | | | 195,708 | | | | 202,636 | | | | 196,197 | | | | 198,896 | | | | 202,126 | | | | 205,738 | | | | 209,778 | |
| | | | | | | | | | | | | | | | | | | | | | | | | | | | |
Net Financial Worth | | | (12,141 | ) | | | (12,115 | ) | | | (15,617 | ) | | | (20,361 | ) | | | (22,980 | ) | | | (25,428 | ) | | | (25,441 | ) |
Net Financial Liabilities | | | 35,261 | | | | 35,928 | | | | 39,568 | | | | 44,796 | | | | 48,098 | | | | 50,760 | | | | 51,226 | |
Net Debt | | | (494 | ) | | | 2,815 | | | | 1,661 | | | | 8,001 | | | | 12,306 | | | | 16,961 | | | | 19,562 | |
Notes:
| 1. | Numbers may not add due to rounding. |
| 2. | Approximately $2.2 billion of the increase in 2019-20 is due to the new lease accounting standard AASB16 which brings operating leases onto the balance sheet of lessees. |
154
Budget Strategy and Outlook 2019-20
| Table 9.5 | Public Non-financial Corporations Sector Balance Sheet1 |
| | | | | | | | | | | | | | | | | | | | | | | | | | | | |
| | | 2017-18
Outcome
$ million | | | 2018-19
Budget
$ million | | | 2018-19
Est. Actual
$ million | | | 2019-20
Budget
$ million | | | 2020-21
Projection
$ million | | | 2021-22
Projection
$ million | | | 2022-23
Projection
$ million | |
| | | | | | | |
Assets | | | | | | | | | | | | | | | | | | | | | | | | | | | | |
Financial Assets | | | | | | | | | | | | | | | | | | | | | | | | | | | | |
Cash and deposits | | | 581 | | | | 465 | | | | 599 | | | | 697 | | | | 817 | | | | 949 | | | | 1,254 | |
Advances paid | | | 2,284 | | | | 1,360 | | | | 1,869 | | | | 1,327 | | | | 1,219 | | | | 1,037 | | | | 1,131 | |
Investments, loans and placements | | | 482 | | | | 547 | | | | 545 | | | | 469 | | | | 461 | | | | 472 | | | | 485 | |
Receivables | | | 1,580 | | | | 1,432 | | | | 1,703 | | | | 1,601 | | | | 1,584 | | | | 1,578 | | | | 1,601 | |
Equity | | | | | | | | | | | | | | | | | | | | | | | | | | | | |
Investments - other | | | 238 | | | | 240 | | | | 250 | | | | 250 | | | | 250 | | | | 250 | | | | 250 | |
Total Financial Assets | | | 5,165 | | | | 4,043 | | | | 4,967 | | | | 4,345 | | | | 4,332 | | | | 4,287 | | | | 4,721 | |
| | | | | | | |
Non-financial Assets | | | | | | | | | | | | | | | | | | | | | | | | | | | | |
Land and other fixed assets2 | | | 62,506 | | | | 63,882 | | | | 63,881 | | | | 65,791 | | | | 67,119 | | | | 68,160 | | | | 68,387 | |
Other non-financial assets | | | 1,113 | | | | 1,203 | | | | 1,220 | | | | 1,220 | | | | 1,190 | | | | 1,166 | | | | 1,137 | |
Total Non-financial Assets | | | 63,619 | | | | 65,085 | | | | 65,101 | | | | 67,011 | | | | 68,308 | | | | 69,325 | | | | 69,524 | |
| | | | | | | |
Total Assets | | | 68,784 | | | | 69,128 | | | | 70,068 | | | | 71,356 | | | | 72,640 | | | | 73,612 | | | | 74,245 | |
| | | | | | | |
Liabilities | | | | | | | | | | | | | | | | | | | | | | | | | | | | |
Payables | | | 3,495 | | | | 2,890 | | | | 3,183 | | | | 2,695 | | | | 2,333 | | | | 2,834 | | | | 3,046 | |
Superannuation liability | | | (368 | ) | | | (316 | ) | | | (368 | ) | | | (368 | ) | | | (368 | ) | | | (368 | ) | | | (368 | ) |
Other employee benefits | | | 769 | | | | 746 | | | | 719 | | | | 742 | | | | 754 | | | | 769 | | | | 783 | |
Deposits held | | | 15 | | | | 17 | | | | 17 | | | | 17 | | | | 17 | | | | 17 | | | | 17 | |
Advances received | | | 7 | | | | 6 | | | | 6 | | | | 5 | | | | 5 | | | | 4 | | | | 3 | |
Borrowing with QTC | | | 37,708 | | | | 38,279 | | | | 38,208 | | | | 39,173 | | | | 40,195 | | | | 40,471 | | | | 40,384 | |
Leases and similar arrangements2 | | | — | | | | — | | | | — | | | | 392 | | | | 358 | | | | 324 | | | | 288 | |
Securities and derivatives | | | 283 | | | | 281 | | | | 549 | | | | 422 | | | | 380 | | | | 370 | | | | 370 | |
Other liabilities | | | 7,970 | | | | 7,901 | | | | 7,883 | | | | 7,922 | | | | 7,929 | | | | 7,939 | | | | 8,016 | |
Total Liabilities | | | 49,879 | | | | 49,805 | | | | 50,197 | | | | 51,000 | | | | 51,602 | | | | 52,359 | | | | 52,539 | |
| | | | | | | |
Net Worth | | | 18,905 | | | | 19,323 | | | | 19,872 | | | | 20,356 | | | | 21,038 | | | | 21,253 | | | | 21,706 | |
| | | | | | | | | | | | | | | | | | | | | | | | | | | | |
Net Financial Worth | | | (44,715 | ) | | | (45,761 | ) | | | (45,230 | ) | | | (46,655 | ) | | | (47,270 | ) | | | (48,072 | ) | | | (47,818 | ) |
Net Debt | | | 34,667 | | | | 36,212 | | | | 35,767 | | | | 37,516 | | | | 38,458 | | | | 38,727 | | | | 38,192 | |
Notes:
| 1. | Numbers may not add due to rounding. |
| 2. | Approximately $400 million of the increase in 2019-20 is due to the new lease accounting standard AASB16 which brings operating leases onto the balance sheet of lessees. |
155
Budget Strategy and Outlook 2019-20
| Table 9.6 | Non-financial Public Sector Balance Sheet1 |
| | | | | | | | | | | | | | | | | | | | | | | | | | | | |
| | | 2017-18
Outcome
$ million | | | 2018-19
Budget
$ million | | | 2018-19
Est. Actual
$ million | | | 2019-20
Budget
$ million | | | 2020-21
Projection
$ million | | | 2021-22
Projection
$ million | | | 2022-23
Projection
$ million | |
| | | | | | | |
Assets | | | | | | | | | | | | | | | | | | | | | | | | | | | | |
Financial Assets | | | | | | | | | | | | | | | | | | | | | | | | | | | | |
Cash and deposits | | | 1,879 | | | | 768 | | | | 1,088 | | | | 1,104 | | | | 1,307 | | | | 1,416 | | | | 1,704 | |
Advances paid | | | 622 | | | | 682 | | | | 670 | | | | 615 | | | | 624 | | | | 649 | | | | 671 | |
Investments, loans and placements | | | 33,328 | | | | 30,852 | | | | 32,669 | | | | 31,787 | | | | 30,890 | | | | 30,843 | | | | 30,732 | |
Receivables | | | 4,273 | | | | 3,808 | | | | 4,142 | | | | 4,008 | | | | 4,072 | | | | 4,174 | | | | 4,670 | |
Equity | | | | | | | | | | | | | | | | | | | | | | | | | | | | |
Investments in other public sector entities | | | 4,216 | | | | 4,490 | | | | 4,080 | | | | 4,080 | | | | 4,080 | | | | 4,080 | | | | 4,080 | |
Investments - other | | | 393 | | | | 394 | | | | 401 | | | | 397 | | | | 397 | | | | 397 | | | | 397 | |
Total Financial Assets | | | 44,711 | | | | 40,994 | | | | 43,050 | | | | 41,991 | | | | 41,370 | | | | 41,559 | | | | 42,255 | |
| | | | | | | |
Non-financial Assets | | | | | | | | | | | | | | | | | | | | | | | | | | | | |
Land and other fixed assets2 | | | 262,964 | | | | 271,866 | | | | 269,060 | | | | 278,173 | | | | 285,281 | | | | 292,295 | | | | 296,445 | |
Other non-financial assets | | | 1,591 | | | | 1,014 | | | | 1,187 | | | | 1,300 | | | | 1,244 | | | | 1,130 | | | | 1,005 | |
Total Non-financial Assets | | | 264,554 | | | | 272,880 | | | | 270,248 | | | | 279,473 | | | | 286,525 | | | | 293,425 | | | | 297,450 | |
| | | | | | | |
Total Assets | | | 309,265 | | | | 313,874 | | | | 313,298 | | | | 321,463 | | | | 327,895 | | | | 334,984 | | | | 339,705 | |
| | | | | | | |
Liabilities | | | | | | | | | | | | | | | | | | | | | | | | | | | | |
Payables | | | 5,861 | | | | 5,193 | | | | 5,537 | | | | 5,259 | | | | 5,401 | | | | 5,596 | | | | 5,775 | |
Superannuation liability | | | 25,632 | | | | 23,098 | | | | 26,371 | | | | 25,199 | | | | 23,739 | | | | 22,041 | | | | 20,292 | |
Other employee benefits | | | 6,743 | | | | 6,634 | | | | 7,792 | | | | 7,920 | | | | 8,046 | | | | 8,213 | | | | 8,356 | |
Deposits held | | | 18 | | | | 19 | | | | 19 | | | | 19 | | | | 19 | | | | 19 | | | | 19 | |
Advances received | | | 462 | | | | 439 | | | | 400 | | | | 289 | | | | 222 | | | | 173 | | | | 125 | |
Borrowing with QTC | | | 66,964 | | | | 68,015 | | | | 68,141 | | | | 71,954 | | | | 75,413 | | | | 80,645 | | | | 82,972 | |
Leases and similar arrangements2 | | | 2,152 | | | | 2,556 | | | | 2,623 | | | | 6,217 | | | | 7,430 | | | | 7,266 | | | | 7,254 | |
Securities and derivatives | | | 405 | | | | 300 | | | | 671 | | | | 544 | | | | 502 | | | | 492 | | | | 492 | |
Other liabilities | | | 5,319 | | | | 4,982 | | | | 5,546 | | | | 5,168 | | | | 4,998 | | | | 4,801 | | | | 4,642 | |
Total Liabilities | | | 113,556 | | | | 111,237 | | | | 117,101 | | | | 122,568 | | | | 125,769 | | | | 129,247 | | | | 129,927 | |
| | | | | | | |
Net Worth | | | 195,709 | | | | 202,636 | | | | 196,197 | | | | 198,896 | | | | 202,126 | | | | 205,738 | | | | 209,778 | |
| | | | | | | | | | | | | | | | | | | | | | | | | | | | |
Net Financial Worth | | | (68,845 | ) | | | (70,243 | ) | | | (74,051 | ) | | | (80,577 | ) | | | (84,399 | ) | | | (87,687 | ) | | | (87,672 | ) |
Net Financial Liabilities | | | 73,062 | | | | 74,733 | | | | 78,131 | | | | 84,657 | | | | 88,479 | | | | 91,768 | | | | 91,752 | |
Net Debt | | | 34,173 | | | | 39,027 | | | | 37,428 | | | | 45,517 | | | | 50,764 | | | | 55,688 | | | | 57,755 | |
Notes:
| 1. | Numbers may not add due to rounding. |
| 2. | Approximately $2.6 billion of the increase in 2019-20 is due to the new lease accounting standard AASB16 which brings operating leases onto the balance sheet of lessees. |
156
Budget Strategy and Outlook 2019-20
| Table 9.7 | General Government Sector Cash Flow Statement1 |
| | | | | | | | | | | | | | | | | | | | | | | | | | | | |
| | | 2017-18
Outcome
$ million | | | 2018-19
Budget
$ million | | | 2018-19
Est.Actual
$ million | | | 2019-20
Budget
$ million | | | 2020-21
Projection
$ million | | | 2021-22
Projection
$ million | | | 2022-23
Projection
$ million | |
| | | | | | | |
Cash Receipts from Operating Activities | | | | | | | | | | | | | | | | | | | | | | | | | | | | |
Taxes received | | | 13,232 | | | | 14,153 | | | | 14,003 | | | | 15,162 | | | | 15,776 | | | | 16,600 | | | | 17,523 | |
Grants and subsidies received | | | 28,020 | | | | 27,712 | | | | 28,991 | | | | 28,000 | | | | 29,846 | | | | 30,662 | | | | 31,038 | |
Sales of goods and services | | | 5,916 | | | | 5,947 | | | | 6,175 | | | | 6,294 | | | | 6,423 | | | | 6,545 | | | | 6,630 | |
Interest receipts | | | 2,389 | | | | 2,199 | | | | 2,245 | | | | 2,139 | | | | 2,004 | | | | 1,951 | | | | 1,956 | |
Dividends and income tax equivalents | | | 2,668 | | | | 2,619 | | | | 2,815 | | | | 2,565 | | | | 2,083 | | | | 1,593 | | | | 1,654 | |
Other receipts | | | 6,992 | | | | 7,007 | | | | 8,027 | | | | 8,226 | | | | 7,603 | | | | 7,766 | | | | 7,770 | |
Total Operating Receipts | | | 59,216 | | | | 59,637 | | | | 62,256 | | | | 62,386 | | | | 63,734 | | | | 65,117 | | | | 66,572 | |
| | | | | | | |
Cash Payments for Operating Activities | | | | | | | | | | | | | | | | | | | | | | | | | | | | |
Payments for employees | | | (25,964 | ) | | | (27,701 | ) | | | (27,598 | ) | | | (29,080 | ) | | | (29,521 | ) | | | (30,622 | ) | | | (31,804 | ) |
Payments for goods and services | | | (18,496 | ) | | | (17,635 | ) | | | (18,802 | ) | | | (18,152 | ) | | | (17,982 | ) | | | (18,458 | ) | | | (18,797 | ) |
Grants and subsidies | | | (8,014 | ) | | | (9,492 | ) | | | (9,799 | ) | | | (9,649 | ) | | | (10,132 | ) | | | (10,119 | ) | | | (10,077 | ) |
Interest paid | | | (1,590 | ) | | | (1,474 | ) | | | (1,513 | ) | | | (1,669 | ) | | | (1,665 | ) | | | (1,703 | ) | | | (1,752 | ) |
Other payments | | | (1 | ) | | | — | | | | (1 | ) | | | (1 | ) | | | (1 | ) | | | (1 | ) | | | (1 | ) |
Total Operating Payments | | | (54,066 | ) | | | (56,303 | ) | | | (57,712 | ) | | | (58,550 | ) | | | (59,301 | ) | | | (60,904 | ) | | | (62,430 | ) |
| | | | | | | |
Net Cash Inflows from Operating Activities | | | 5,150 | | | | 3,334 | | | | 4,544 | | | | 3,836 | | | | 4,433 | | | | 4,213 | | | | 4,142 | |
| | | | | | | |
Cash Flows from Investments in Non-Financial Assets | | | | | | | | | | | | | | | | | | | | | | | | | | | | |
Purchases of non-financial assets | | | (5,127 | ) | | | (5,927 | ) | | | (6,060 | ) | | | (6,727 | ) | | | (7,125 | ) | | | (7,963 | ) | | | (6,179 | ) |
Sales of non-financial assets | | | 291 | | | | 345 | | | | 292 | | | | 305 | | | | 250 | | | | 260 | | | | 251 | |
Net Cash Flows from Investments in Non-financial Assets | | | (4,835 | ) | | | (5,582 | ) | | | (5,769 | ) | | | (6,422 | ) | | | (6,875 | ) | | | (7,703 | ) | | | (5,928 | ) |
| | | | | | | |
Net Cash Flows from Investments in Financial Assets for Policy Purposes | | | 534 | | | | (53 | ) | | | (92 | ) | | | 28 | | | | (100 | ) | | | 121 | | | | 338 | |
| | | | | | | |
Net Cash Flows from Investments in Financial Assets for Liquidity Purposes | | | (1,095 | ) | | | 2,877 | | | | 1,426 | | | | 3,611 | | | | 2,037 | | | | 100 | | | | 155 | |
| | | | | | | |
Receipts from Financing Activities | | | | | | | | | | | | | | | | | | | | | | | | | | | | |
Advances received (net) | | | 905 | | | | (410 | ) | | | (475 | ) | | | (651 | ) | | | (173 | ) | | | (228 | ) | | | 48 | |
Borrowing (net) | | | (396 | ) | | | (393 | ) | | | (452 | ) | | | (486 | ) | | | 759 | | | | 3,473 | | | | 1,225 | |
Deposits received (net) | | | 7 | | | | (47 | ) | | | — | | | | — | | | | — | | | | — | | | | — | |
Net Cash Flows from Financing Activities | | | 517 | | | | (851 | ) | | | (927 | ) | | | (1,137 | ) | | | 586 | | | | 3,245 | | | | 1,273 | |
| | | | | | | |
Net Increase/(Decrease) in Cash held | | | 271 | | | | (275 | ) | | | (816 | ) | | | (85 | ) | | | 81 | | | | (24 | ) | | | (18 | ) |
| | | | | | | |
Net cash from operating activities | | | 5,150 | | | | 3,334 | | | | 4,544 | | | | 3,836 | | | | 4,433 | | | | 4,213 | | | | 4,142 | |
Net cash flows from investments in non-financial assets | | | (4,835 | ) | | | (5,582 | ) | | | (5,769 | ) | | | (6,422 | ) | | | (6,875 | ) | | | (7,703 | ) | | | (5,928 | ) |
Surplus/(Deficit) | | | 315 | | | | (2,248 | ) | | | (1,224 | ) | | | (2,586 | ) | | | (2,442 | ) | | | (3,490 | ) | | | (1,785 | ) |
| | | | | | | |
Derivation of ABS GFS Cash Surplus/Deficit | | | | | | | | | | | | | | | | | | | | | | | | | | | | |
Cash surplus/(deficit) | | | 315 | | | | (2,248 | ) | | | (1,224 | ) | | | (2,586 | ) | | | (2,442 | ) | | | (3,490 | ) | | | (1,785 | ) |
Acquisitions under finance leases and similar arrangements | | | (584 | ) | | | (864 | ) | | | (974 | ) | | | (1,119 | ) | | | (1,019 | ) | | | (1,117 | ) | | | (832 | ) |
ABS GFS Cash Surplus/(Deficit) Including Finance Leases and Similar Arrangements | | | (269 | ) | | | (3,112 | ) | | | (2,198 | ) | | | (3,705 | ) | | | (3,461 | ) | | | (4,607 | ) | | | (2,617 | ) |
Note:
| 1. | Numbers may not add due to rounding. |
157
Budget Strategy and Outlook 2019-20
| Table 9.8 | Public Non-financial Corporations Sector Cash Flow Statement1 |
| | | | | | | | | | | | | | | | | | | | | | | | | | | | |
| | | 2017-18
Outcome
$ million | | | 2018-19
Budget
$ million | | | 2018-19
Est.Actual
$ million | | | 2019-20
Budget
$ million | | | 2020-21
Projection
$ million | | | 2021-22
Projection
$ million | | | 2022-23
Projection
$ million | |
| | | | | | | |
Cash Receipts from Operating Activities | | | | | | | | | | | | | | | | | | | | | | | | | | | | |
Grants and subsidies received | | | 707 | | | | 585 | | | | 551 | | | | 572 | | | | 492 | | | | 509 | | | | 488 | |
Sales of goods and services | | | 14,226 | | | | 13,113 | | | | 13,267 | | | | 13,130 | | | | 12,926 | | | | 13,258 | | | | 13,803 | |
Interest receipts | | | 73 | | | | 52 | | | | 66 | | | | 56 | | | | 54 | | | | 53 | | | | 52 | |
Dividends and income tax equivalents | | | 13 | | | | 13 | | | | 13 | | | | 13 | | | | 13 | | | | 13 | | | | 13 | |
Other receipts | | | 426 | | | | 215 | | | | 286 | | | | 486 | | | | 242 | | | | 223 | | | | 228 | |
Total Operating Receipts | | | 15,445 | | | | 13,977 | | | | 14,182 | | | | 14,257 | | | | 13,727 | | | | 14,056 | | | | 14,584 | |
| | | | | | | |
Cash Payments for Operating Activities | | | | | | | | | | | | | | | | | | | | | | | | | | | | |
Payments for employees | | | (1,885 | ) | | | (2,143 | ) | | | (2,273 | ) | | | (2,344 | ) | | | (2,377 | ) | | | (2,408 | ) | | | (2,454 | ) |
Payments for goods and services | | | (5,615 | ) | | | (4,610 | ) | | | (4,619 | ) | | | (4,801 | ) | | | (4,774 | ) | | | (4,711 | ) | | | (4,880 | ) |
Grants and subsidies | | | (270 | ) | | | (264 | ) | | | (298 | ) | | | (233 | ) | | | (46 | ) | | | (18 | ) | | | (19 | ) |
Interest paid | | | (1,896 | ) | | | (1,910 | ) | | | (1,876 | ) | | | (1,833 | ) | | | (1,842 | ) | | | (1,866 | ) | | | (1,867 | ) |
Other payments | | | (1,452 | ) | | | (1,172 | ) | | | (1,395 | ) | | | (1,313 | ) | | | (1,043 | ) | | | (992 | ) | | | (1,054 | ) |
Total Operating Payments | | | (11,118 | ) | | | (10,098 | ) | | | (10,461 | ) | | | (10,525 | ) | | | (10,082 | ) | | | (9,995 | ) | | | (10,273 | ) |
| | | | | | | |
Net Cash Inflows from Operating Activities | | | 4,327 | | | | 3,879 | | | | 3,722 | | | | 3,732 | | | | 3,645 | | | | 4,061 | | | | 4,311 | |
| | | | | | | |
Cash Flows from Investments in Non-Financial Assets | | | | | | | | | | | | | | | | | | | | | | | | | | | | |
Purchases of non-financial assets | | | (2,509 | ) | | | (3,130 | ) | | | (2,801 | ) | | | (3,496 | ) | | | (3,322 | ) | | | (3,247 | ) | | | (2,461 | ) |
Sales of non-financial assets | | | 47 | | | | 11 | | | | 44 | | | | 21 | | | | 5 | | | | — | | | | 3 | |
Net Cash Flows from Investments in Non-financial Assets | | | (2,462 | ) | | | (3,119 | ) | | | (2,758 | ) | | | (3,475 | ) | | | (3,316 | ) | | | (3,247 | ) | | | (2,458 | ) |
| | | | | | | |
Net Cash Flows from Investments in Financial Assets for Policy Purposes | | | (988 | ) | | | 284 | | | | 341 | | | | 436 | | | | (22 | ) | | | 17 | | | | (513 | ) |
| | | | | | | |
Net Cash Flows from Investments in Financial Assets for Liquidity Purposes | | | 71 | | | | (3 | ) | | | (47 | ) | | | (12 | ) | | | (12 | ) | | | (13 | ) | | | (14 | ) |
| | | | | | | |
Receipts from Financing Activities | | | | | | | | | | | | | | | | | | | | | | | | | | | | |
Advances received (net) | | | (1 | ) | | | (1 | ) | | | (1 | ) | | | (1 | ) | | | (1 | ) | | | (1 | ) | | | (1 | ) |
Borrowing (net) | | | (32 | ) | | | 471 | | | | 500 | | | | 925 | | | | 977 | | | | 231 | | | | (133 | ) |
Dividends paid | | | (1,658 | ) | | | (1,805 | ) | | | (1,850 | ) | | | (1,633 | ) | | | (1,365 | ) | | | (932 | ) | | | (944 | ) |
Deposits received (net) | | | (2 | ) | | | — | | | | 1 | | | | — | | | | — | | | | — | | | | — | |
Other financing (net) | | | (138 | ) | | | 60 | | | | 110 | | | | 125 | | | | 215 | | | | 15 | | | | 55 | |
Net Cash Flows from Financing Activities | | | (1,831 | ) | | | (1,275 | ) | | | (1,240 | ) | | | (583 | ) | | | (174 | ) | | | (687 | ) | | | (1,022 | ) |
| | | | | | | |
Net Increase/(Decrease) in Cash held | | | (883 | ) | | | (233 | ) | | | 18 | | | | 97 | | | | 121 | | | | 132 | | | | 304 | |
| | | | | | | |
Net cash from operating activities | | | 4,327 | | | | 3,879 | | | | 3,722 | | | | 3,732 | | | | 3,645 | | | | 4,061 | | | | 4,311 | |
Net cash flows from investments in non-financial assets | | | (2,462 | ) | | | (3,119 | ) | | | (2,758 | ) | | | (3,475 | ) | | | (3,316 | ) | | | (3,247 | ) | | | (2,458 | ) |
Dividends paid | | | (1,658 | ) | | | (1,805 | ) | | | (1,850 | ) | | | (1,633 | ) | | | (1,365 | ) | | | (932 | ) | | | (944 | ) |
Surplus/(Deficit) | | | 207 | | | | (1,045 | ) | | | (886 | ) | | | (1,376 | ) | | | (1,037 | ) | | | (117 | ) | | | 910 | |
| | | | | | | |
Derivation of ABS GFS Cash Surplus/Deficit | | | | | | | | | | | | | | | | | | | | | | | | | | | | |
Cash surplus/(deficit) | | | 207 | | | | (1,045 | ) | | | (886 | ) | | | (1,376 | ) | | | (1,037 | ) | | | (117 | ) | | | 910 | |
ABS GFS Cash Surplus/(Deficit) Including Finance Leases and Similar Arrangements | | | 207 | | | | (1,045 | ) | | | (886 | ) | | | (1,376 | ) | | | (1,037 | ) | | | (117 | ) | | | 910 | |
Note:
| 1. | Numbers may not add due to rounding. |
158
Budget Strategy and Outlook 2019-20
| Table 9.9 | Non-financial Public Sector Cash Flow Statement1 |
| | | | | | | | | | | | | | | | | | | | | | | | | | | | |
| | | 2017-18
Outcome
$ million | | | 2018-19
Budget
$ million | | | 2018-19
Est.Actual
$ million | | | 2019-20
Budget
$ million | | | 2020-21
Projection
$ million | | | 2021-22
Projection
$ million | | | 2022-23
Projection
$ million | |
| | | | | | | |
Cash Receipts from Operating Activities | | | | | | | | | | | | | | | | | | | | | | | | | | | | |
Taxes received | | | 12,982 | | | | 13,891 | | | | 13,723 | | | | 14,866 | | | | 15,457 | | | | 16,257 | | | | 17,165 | |
Grants and subsidies received | | | 28,048 | | | | 27,788 | | | | 29,015 | | | | 28,008 | | | | 29,857 | | | | 30,672 | | | | 31,048 | |
Sales of goods and services | | | 18,210 | | | | 16,609 | | | | 16,759 | | | | 16,728 | | | | 16,489 | | | | 16,885 | | | | 17,560 | |
Interest receipts | | | 2,421 | | | | 2,217 | | | | 2,267 | | | | 2,157 | | | | 2,023 | | | | 1,963 | | | | 1,963 | |
Dividends and income tax equivalents | | | 220 | | | | 166 | | | | 159 | | | | 154 | | | | 172 | | | | 188 | | | | 216 | |
Other receipts | | | 7,416 | | | | 7,222 | | | | 8,268 | | | | 8,602 | | | | 7,527 | | | | 7,619 | | | | 7,737 | |
Total Operating Receipts | | | 69,298 | | | | 67,892 | | | | 70,191 | | | | 70,517 | | | | 71,524 | | | | 73,586 | | | | 75,690 | |
| | | | | | | |
Cash Payments for Operating Activities | | | | | | | | | | | | | | | | | | | | | | | | | | | | |
Payments for employees | | | (27,749 | ) | | | (29,743 | ) | | | (29,751 | ) | | | (31,304 | ) | | | (31,776 | ) | | | (32,906 | ) | | | (34,131 | ) |
Payments for goods and services | | | (22,157 | ) | | | (19,789 | ) | | | (20,697 | ) | | | (20,143 | ) | | | (19,577 | ) | | | (19,877 | ) | | | (20,540 | ) |
Grants and subsidies | | | (7,602 | ) | | | (9,247 | ) | | | (9,569 | ) | | | (9,318 | ) | | | (9,694 | ) | | | (9,636 | ) | | | (9,616 | ) |
Interest paid | | | (3,315 | ) | | | (3,202 | ) | | | (3,192 | ) | | | (3,297 | ) | | | (3,284 | ) | | | (3,320 | ) | | | (3,351 | ) |
Other payments | | | (647 | ) | | | (503 | ) | | | (571 | ) | | | (518 | ) | | | (480 | ) | | | (501 | ) | | | (542 | ) |
Total Operating Payments | | | (61,470 | ) | | | (62,484 | ) | | | (63,781 | ) | | | (64,582 | ) | | | (64,811 | ) | | | (66,241 | ) | | | (68,180 | ) |
| | | | | | | |
Net Cash Inflows from Operating Activities | | | 7,827 | | | | 5,408 | | | | 6,410 | | | | 5,935 | | | | 6,713 | | | | 7,345 | | | | 7,510 | |
| | | | | | | |
Cash Flows from Investments in Non-Financial Assets | | | | | | | | | | | | | | | | | | | | | | | | | | | | |
Purchases of non-financial assets | | | (7,644 | ) | | | (9,057 | ) | | | (8,856 | ) | | | (10,223 | ) | | | (10,447 | ) | | | (11,210 | ) | | | (8,640 | ) |
Sales of non-financial assets | | | 339 | | | | 356 | | | | 335 | | | | 326 | | | | 255 | | | | 260 | | | | 255 | |
Net Cash Flows from Investments in Non-financial Assets | | | (7,305 | ) | | | (8,701 | ) | | | (8,520 | ) | | | (9,897 | ) | | | (10,192 | ) | | | (10,950 | ) | | | (8,385 | ) |
| | | | | | | |
Net Cash Flows from Investments in Financial Assets for Policy Purposes | | | 484 | | | | (104 | ) | | | (57 | ) | | | 46 | | | | (16 | ) | | | (30 | ) | | | (26 | ) |
| | | | | | | |
Net Cash Flows from Investments in Financial Assets for Liquidity Purposes | | | (1,024 | ) | | | 2,873 | | | | 1,379 | | | | 3,599 | | | | 2,025 | | | | 86 | | | | 141 | |
| | | | | | | |
Receipts from Financing Activities | | | | | | | | | | | | | | | | | | | | | | | | | | | | |
Advances received (net) | | | (34 | ) | | | (16 | ) | | | (60 | ) | | | (109 | ) | | | (65 | ) | | | (46 | ) | | | (46 | ) |
Borrowing (net) | | | (428 | ) | | | 78 | | | | 48 | | | | 439 | | | | 1,736 | | | | 3,704 | | | | 1,092 | |
Deposits received (net) | | | 5 | | | | (47 | ) | | | 1 | | | | — | | | | — | | | | — | | | | — | |
Other financing (net) | | | (138 | ) | | | — | | | | — | | | | — | | | | — | | | | — | | | | — | |
Net Cash Flows from Financing Activities | | | (595 | ) | | | 15 | | | | (11 | ) | | | 330 | | | | 1,671 | | | | 3,658 | | | | 1,046 | |
| | | | | | | |
Net Increase/(Decrease) in Cash held | | | (612 | ) | | | (509 | ) | | | (798 | ) | | | 13 | | | | 202 | | | | 110 | | | | 286 | |
| | | | | | | |
Net cash from operating activities | | | 7,827 | | | | 5,408 | | | | 6,410 | | | | 5,935 | | | | 6,713 | | | | 7,345 | | | | 7,510 | |
Net cash flows from investments in non-financial assets | | | (7,305 | ) | | | (8,701 | ) | | | (8,520 | ) | | | (9,897 | ) | | | (10,192 | ) | | | (10,950 | ) | | | (8,385 | ) |
Surplus/(Deficit) | | | 522 | | | | (3,293 | ) | | | (2,110 | ) | | | (3,962 | ) | | | (3,478 | ) | | | (3,605 | ) | | | (876 | ) |
| | | | | | | |
Derivation of ABS GFS Cash Surplus/Deficit | | | | | | | | | | | | | | | | | | | | | | | | | | | | |
Cash surplus/(deficit) | | | 522 | | | | (3,293 | ) | | | (2,110 | ) | | | (3,962 | ) | | | (3,478 | ) | | | (3,605 | ) | | | (876 | ) |
Acquisitions under finance leases and similar arrangements | | | (584 | ) | | | (864 | ) | | | (974 | ) | | | (1,119 | ) | | | (1,019 | ) | | | (1,117 | ) | | | (832 | ) |
ABS GFS Cash Surplus/(Deficit) Including Finance Leases and Similar Arrangements | | | (62 | ) | | | (4,157 | ) | | | (3,084 | ) | | | (5,081 | ) | | | (4,498 | ) | | | (4,721 | ) | | | (1,707 | ) |
Note:
| 1. | Numbers may not add due to rounding. |
159
Budget Strategy and Outlook 2019-20
| 9.3 | Reconciliation of net operating balance to accounting operating result |
The primary difference between the net operating balance and the accounting operating result calculated under Australian Accounting Standards is that valuation adjustments are excluded from the net operating balance.
Data presented in Table 9.10 provides a reconciliation of the General Government Sector net operating balance to the accounting operating result.
| Table 9.10 | Reconciliation of UPF net operating balance to accounting operating result1 |
| | | | | | | | | | | | |
| | | 2018-19
Budget
$ million | | | 2018-19
Est. Act.
$ million | | | 2019-20
Budget
$ million | |
| | | |
Net operating balance General Government sector (Table 9.1) | | | 148 | | | | 841 | | | | 189 | |
| | | |
Remeasurement/valuation adjustments | | | | | | | | | | | | |
Bad debts and amortisation | | | (96 | ) | | | (118 | ) | | | (103 | ) |
Deferred tax equivalents | | | (1 | ) | | | (60 | ) | | | (111 | ) |
Dividends from network GOCs under Debt Action Plan (treated as return of equity for UPF) | | | 110 | | | | 74 | | | | 206 | |
Market value adjustments on financial assets and liabilities | | | 11 | | | | 46 | | | | 9 | |
Revaluation of provisions | | | 87 | | | | (864 | ) | | | 48 | |
Decommissioned infrastructure assets and land under roads | | | (12 | ) | | | — | | | | — | |
Gain/(loss) on assets sold/written off/impaired | | | (12 | ) | | | (16 | ) | | | (33 | ) |
| | | |
Accounting operating result General Government sector | | | 233 | | | | (97 | ) | | | 204 | |
Note:
| 1. | Numbers may not add due to rounding. |
| 9.4 | General Government Sector time series |
Data presented in Table 9.11 provides a time series from 2006-07 to 2017-18 for the General Government Sector on the key fiscal aggregates used by the Government to measure financial performance. These aggregates have been backcast (as far as possible) to comply with AASB 1049 Whole of Government and General Government Sector Financial Reporting.
160
Budget Strategy and Outlook 2019-20
Table 9.11 General Government Sector time series1
| | | | | | | | | | | | | | | | | | | | | | | | | | | | | | | | | | | | | | | | | | | | | | | | |
| | | 2006-07
Actual
$ million | | | 2007-08
Actual
$ million | | | 2008-09
Actual
$ million | | | 2009-10
Actual
$ million | | | 2010-11
Actual
$ million | | | 2011-12
Actual
$ million | | | 2012-13
Actual
$ million | | | 2013-14
Actual
$ million | | | 2014-15
Actual
$ million | | | 2015-16
Actual
$ million | | | 2016-17
Actual
$ million | | | 2017-18
Actual
$ million | |
| | | | | | | | | | | | |
Revenue from Transactions | | | | | | | | | | | | | | | | | | | | | | | | | | | | | | | | | | | | | | | | | | | | | | | | |
Taxation revenue | | | 8,484 | | | | 9,546 | | | | 8,866 | | | | 9,375 | | | | 9,981 | | | | 10,608 | | | | 10,937 | | | | 11,840 | | | | 12,598 | | | | 12,547 | | | | 12,919 | | | | 13,244 | |
Grant revenue | | | 14,378 | | | | 15,510 | | | | 17,481 | | | | 20,205 | | | | 20,338 | | | | 22,652 | | | | 18,322 | | | | 21,740 | | | | 23,583 | | | | 23,740 | | | | 27,384 | | | | 27,966 | |
Sales of goods and services | | | 2,909 | | | | 3,357 | | | | 3,648 | | | | 3,961 | | | | 4,172 | | | | 5,002 | | | | 5,087 | | | | 5,039 | | | | 5,443 | | | | 5,712 | | | | 5,642 | | | | 5,884 | |
Interest income | | | 3,338 | | | | (275 | ) | | | 1,482 | | | | 2,204 | | | | 2,368 | | | | 2,485 | | | | 2,644 | | | | 2,460 | | | | 2,470 | | | | 2,543 | | | | 2,351 | | | | 2,389 | |
Dividend and income tax equivalent income | | | 858 | | | | 1,244 | | | | 1,180 | | | | 949 | | | | 1,232 | | | | 1,112 | | | | 1,351 | | | | 1,975 | | | | 2,554 | | | | 2,661 | | | | 2,675 | | | | 2,920 | |
Other revenue | | | 2,032 | | | | 2,041 | | | | 4,421 | | | | 3,033 | | | | 3,921 | | | | 3,942 | | | | 3,415 | | | | 3,650 | | | | 3,322 | | | | 3,577 | | | | 5,223 | | | | 5,685 | |
Total Revenue | | | 31,999 | | | | 31,424 | | | | 37,078 | | | | 39,727 | | | | 42,013 | | | | 45,801 | | | | 41,755 | | | | 46,705 | | | | 49,970 | | | | 50,780 | | | | 56,194 | | | | 58,087 | |
| | | | | | | | | | | | |
Expenses from Transactions | | | | | | | | | | | | | | | | | | | | | | | | | | | | | | | | | | | | | | | | | | | | | | | | |
Employee expenses | | | 11,731 | | | | 13,175 | | | | 14,310 | | | | 15,566 | | | | 16,826 | | | | 18,250 | | | | 18,130 | | | | 17,816 | | | | 18,592 | | | | 20,045 | | | | 21,258 | | | | 22,678 | |
Superannuation expenses | | | | | | | | | | | | | | | | | | | | | | | | | | | | | | | | | | | | | | | | | | | | | | | | |
Superannuation interest costs | | | 1,154 | | | | 816 | | | | 858 | | | | 1,320 | | | | 1,240 | | | | 1,216 | | | | 923 | | | | 963 | | | | 878 | | | | 767 | | | | 514 | | | | 667 | |
Other superannuation expenses | | | 1,513 | | | | 1,865 | | | | 2,012 | | | | 2,051 | | | | 2,171 | | | | 2,301 | | | | 2,420 | | | | 2,277 | | | | 2,319 | | | | 2,507 | | | | 2,661 | | | | 2,744 | |
Other operating expenses | | | 6,138 | | | | 6,646 | | | | 7,300 | | | | 7,568 | | | | 8,646 | | | | 9,497 | | | | 12,817 | | | | 13,108 | | | | 14,539 | | | | 14,811 | | | | 15,578 | | | | 17,258 | |
Depreciation and amortisation | | | 1,764 | | | | 1,851 | | | | 2,496 | | | | 2,501 | | | | 2,507 | | | | 2,777 | | | | 2,902 | | | | 3,060 | | | | 3,137 | | | | 2,921 | | | | 3,068 | | | | 3,325 | |
Other interest expenses | | | 180 | | | | 347 | | | | 599 | | | | 803 | | | | 1,125 | | | | 1,659 | | | | 1,940 | | | | 2,200 | | | | 2,328 | | | | 2,220 | | | | 1,722 | | | | 1,614 | |
Grant expenses | | | 7,565 | | | | 8,329 | | | | 9,525 | | | | 9,790 | | | | 10,963 | | | | 10,327 | | | | 7,182 | | | | 6,792 | | | | 7,758 | | | | 6,841 | | | | 8,568 | | | | 8,048 | |
Total Expenses | | | 30,046 | | | | 33,030 | | | | 37,099 | | | | 39,599 | | | | 43,479 | | | | 46,028 | | | | 46,312 | | | | 46,217 | | | | 49,551 | | | | 50,112 | | | | 53,369 | | | | 56,335 | |
| | | | | | | | | | | | |
Net Operating Balance | | | 1,953 | | | | (1,606 | ) | | | (21 | ) | | | 128 | | | | (1,466 | ) | | | (226 | ) | | | (4,558 | ) | | | 488 | | | | 420 | | | | 668 | | | | 2,825 | | | | 1,753 | |
| | | | | | | | | | | | |
OTHER KEY AGGREGATES | | | | | | | | | | | | | | | | | | | | | | | | | | | | | | | | | | | | | | | | | | | | | | | | |
| | | | | | | | | | | | |
Purchases of non-financial assets | | | 4,412 | | | | 5,725 | | | | 6,772 | | | | 8,959 | | | | 8,237 | | | | 7,971 | | | | 7,001 | | | | 6,323 | | | | 4,635 | | | | 4,044 | | | | 4,620 | | | | 5,127 | |
| | | | | | | | | | | | |
Net acquisition of non-financial assets | | | 2,157 | | | | 3,680 | | | | 4,349 | | | | 6,665 | | | | 5,583 | | | | 5,241 | | | | 3,389 | | | | 3,087 | | | | 992 | | | | 1,164 | | | | 2,265 | | | | 2,339 | |
| | | | | | | | | | | | |
Fiscal Balance | | | (204 | ) | | | (5,286 | ) | | | (4,371 | ) | | | (6,537 | ) | | | (7,049 | ) | | | (5,467 | ) | | | (7,947 | ) | | | (2,599 | ) | | | (572 | ) | | | (497 | ) | | | 560 | | | | (586 | ) |
| | | | | | | | | | | | |
Cash Surplus/(Deficit) | | | 2,360 | | | | (4,924 | ) | | | (2,866 | ) | | | (5,341 | ) | | | (5,880 | ) | | | (4,951 | ) | | | (8,585 | ) | | | (3,213 | ) | | | (105 | ) | | | 866 | | | | 1,448 | | | | 315 | |
| | | | | | | | | | | | |
Net Worth | | | 118,532 | | | | 193,838 | | | | 184,277 | | | | 175,588 | | | | 177,875 | | | | 170,745 | | | | 172,963 | | | | 166,492 | | | | 171,933 | | | | 188,099 | | | | 194,988 | | | | 195,708 | |
| | | | | | | | | | | | |
Net Debt | | | (26,622 | ) | | | (22,586 | ) | | | (19,251 | ) | | | (13,354 | ) | | | (9,542 | ) | | | (5,720 | ) | | | 2,399 | | | | 5,208 | | | | 5,749 | | | | 653 | | | | (355 | ) | | | (494 | ) |
| | | | | | | | | | | | |
Borrowing with QTC2 | | | 1,984 | | | | 5,819 | | | | 9,671 | | | | 15,182 | | | | 23,711 | | | | 28,391 | | | | 36,508 | | | | 39,864 | | | | 41,343 | | | | 34,200 | | | | 31,358 | | | | 29,256 | |
| | | | | | | | | | | | |
Leases and similar arrangements | | | 274 | | | | 508 | | | | 637 | | | | 734 | | | | 882 | | | | 1,126 | | | | 1,370 | | | | 1,503 | | | | 1,761 | | | | 1,286 | | | | 1,882 | | | | 2,152 | |
| | | | | | | | | | | | |
Borrowing with QTC (NFPS) | | | 19,857 | | | | 29,358 | | | | 41,726 | | | | 50,745 | | | | 52,521 | | | | 60,205 | | | | 67,116 | | | | 70,668 | | | | 73,256 | | | | 71,160 | | | | 69,107 | | | | 66,964 | |
| | | | | | | | | | | | |
Leases and similar arrangements (NFPS) | | | 302 | | | | 545 | | | | 637 | | | | 735 | | | | 884 | | | | 1,127 | | | | 1,559 | | | | 1,752 | | | | 1,802 | | | | 1,316 | | | | 1,882 | | | | 2,152 | |
| | | | | | | | | | | | |
Securities and derivatives (NFPS) | | | 3,812 | | | | 953 | | | | 282 | | | | 234 | | | | 303 | | | | 210 | | | | 411 | | | | 216 | | | | 175 | | | | 446 | | | | 895 | | | | 405 | |
Notes:
| 1. | Numbers may not add due to rounding. |
| 2. | Borrowing with QTC in 2013-14 includes bank overdraft of $1.434 billion. |
Source: Report on State Finances for Queensland 2006-07 to 2017-18. (Numbers have been recast for changes to UPF presentation.)
161
Budget Strategy and Outlook 2019-20
| 9.5 | Other General Government uniform presentation framework data |
Data in the following tables is presented in accordance with the UPF.
Data presented in Tables 9.12 and 9.13 provide details of General Government Sector current and capital grant revenue and expenses.
| Table 9.12 | General Government Sector grant revenue1 |
| | | | | | | | |
| | | 2018-19
Est. Act.
$ million | | | 2019-20
Budget
$ million | |
| | |
Current grant revenue | | | | | | | | |
Current grants from the Commonwealth | | | | | | | | |
General purpose grants | | | 14,470 | | | | 14,233 | |
Specific purpose grants | | | 8,746 | | | | 8,329 | |
Specific purpose grants for on-passing | | | 3,238 | | | | 3,147 | |
Total current grants from the Commonwealth | | | 26,454 | | | | 25,709 | |
Other contributions and grants | | | 342 | | | | 294 | |
Total current grant revenue | | | 26,797 | | | | 26,003 | |
| | |
Capital grant revenue | | | | | | | | |
Capital grants from the Commonwealth | | | | | | | | |
Specific purpose grants | | | 1,870 | | | | 1,996 | |
Specific purpose grants for on-passing | | | 5 | | | | — | |
Total capital grants from the Commonwealth | | | 1,875 | | | | 1,996 | |
Other contributions and grants | | | 38 | | | | 4 | |
Total capital grant revenue | | | 1,913 | | | | 2,000 | |
Total grant revenue | | | 28,709 | | | | 28,003 | |
Note:
| 1. | Numbers may not add due to rounding. |
162
Budget Strategy and Outlook 2019-20
| Table 9.13 | General Government Sector grant expenses1 |
| | | | | | | | |
| | | 2018-19
Est. Act.
$ million | | | 2019-20
Budget
$ million | |
| | |
Current grant expense | | | | | | | | |
Private and Not-for-profit sector | | | 2,327 | | | | 2,402 | |
Private and Not-for-profit sector on-passing | | | 2,759 | | | | 2,912 | |
Local Government | | | 361 | | | | 221 | |
Local Government on-passing | | | 492 | | | | 251 | |
Grants to other sectors of Government | | | 1,671 | | | | 1,806 | |
Other | | | 362 | | | | 554 | |
Total current grant expense | | | 7,971 | | | | 8,145 | |
| | |
Capital grant expense | | | | | | | | |
Private and Not-for-profit sector | | | 366 | | | | 492 | |
Local Government | | | 1,209 | | | | 997 | |
Local Government on-passing | | | 5 | | | | — | |
Grants to other sectors of Government | | | 13 | | | | 10 | |
Other | | | 127 | | | | 110 | |
Total capital grant expense | | | 1,720 | | | | 1,609 | |
Total grant expense | | | 9,691 | | | | 9,754 | |
Note:
| 1. | Numbers may not add due to rounding. |
| 9.5.2 | Dividends and income tax equivalent income |
Table 9.14 provides details of the source of dividend and income tax equivalent income in the General Government Sector.
| Table 9.14 | General Government Sector dividend and income tax equivalent income1 |
| | | | | | | | |
| | | 2018-19
Est. Act.
$ million | | | 2019-20
Budget
$ million | |
Dividend and Income Tax Equivalent income from PNFC sector | | | 2,525 | | | | 2,085 | |
Dividend and Income Tax Equivalent income from PFC sector | | | 136 | | | | 151 | |
Total Dividend and Income Tax Equivalent income | | | 2,661 | | | | 2,237 | |
Note:
| 1. | Numbers may not add due to rounding. |
163
Budget Strategy and Outlook 2019-20
| 9.5.3 | Expenses by function |
Data presented in Table 9.15 provides details of General Government Sector expenses by function.
| Table 9.15 | General Government Sector expenses by function1 |
| | | | | | | | | | | | | | | | | | | | | | | | |
| | | 2018-19
Budget
$ million | | | 2018-19
Est. Act.
$ million | | | 2019-20
Budget
$ million | | | 2020-21
Projection
$ million | | | 2021-22
Projection
$ million | | | 2022-23
Projection
$ million | |
| | | | | | |
General public services | | | 5,368 | | | | 5,583 | | | | 5,073 | | | | 4,846 | | | | 5,064 | | | | 5,006 | |
Public order and safety | | | 5,154 | | | | 5,347 | | | | 5,652 | | | | 5,660 | | | | 5,710 | | | | 5,900 | |
Economic affairs | | | 2,241 | | | | 2,142 | | | | 2,431 | | | | 2,185 | | | | 1,939 | | | | 1,901 | |
Environmental protection | | | 631 | | | | 745 | | | | 624 | | | | 737 | | | | 691 | | | | 659 | |
Housing and community amenities | | | 275 | | | | 1,093 | | | | 1,108 | | | | 1,006 | | | | 1,045 | | | | 1,021 | |
Health | | | 17,347 | | | | 18,304 | | | | 18,761 | | | | 19,139 | | | | 19,887 | | | | 20,718 | |
Recreation, culture and religion | | | 842 | | | | 843 | | | | 776 | | | | 767 | | | | 703 | | | | 771 | |
Education | | | 14,006 | | | | 14,243 | | | | 15,013 | | | | 15,765 | | | | 16,319 | | | | 16,946 | |
Social protection | | | 5,865 | | | | 4,689 | | | | 4,458 | | | | 4,516 | | | | 4,880 | | | | 5,037 | |
Transport | | | 5,861 | | | | 6,238 | | | | 6,303 | | | | 6,794 | | | | 6,863 | | | | 6,794 | |
| | | | | | |
Total Expenses | | | 57,590 | | | | 59,226 | | | | 60,198 | | | | 61,416 | | | | 63,101 | | | | 64,753 | |
Note:
| 1. | Numbers may not add due to rounding. |
| 9.5.4 | Purchases of non-financial assets by function |
Data presented in Table 9.16 provides details of General Government Sector purchases of non-financial assets by function.
| Table 9.16 | General Government Sector purchases of non-financial assets by function1 |
| | | | | | | | | | | | | | | | | | | | | | | | |
| | | 2018-19
Budget
$ million | | | 2018-19
Est. Act.
$ million | | | 2019-20
Budget
$ million | | | 2020-21
Projection
$ million | | | 2021-22
Projection
$ million | | | 2022-23
Projection
$ million | |
| | | | | | |
General public services | | | 373 | | | | 215 | | | | 323 | | | | 161 | | | | 80 | | | | 36 | |
Public order and safety | | | 555 | | | | 426 | | | | 697 | | | | 659 | | | | 515 | | | | 202 | |
Economic affairs | | | 47 | | | | 47 | | | | 43 | | | | 39 | | | | 57 | | | | 23 | |
Environmental protection | | | 67 | | | | 62 | | | | 66 | | | | 30 | | | | 26 | | | | 17 | |
Housing and community amenities | | | 78 | | | | 374 | | | | 422 | | | | 358 | | | | 353 | | | | 188 | |
Health | | | 1,099 | | | | 723 | | | | 771 | | | | 883 | | | | 1,031 | | | | 542 | |
Recreation, culture and religion | | | 161 | | | | 41 | | | | 121 | | | | 151 | | | | 124 | | | | 63 | |
Education | | | 711 | | | | 858 | | | | 1,242 | | | | 885 | | | | 622 | | | | 387 | |
Social protection | | | 384 | | | | 40 | | | | 57 | | | | 29 | | | | 30 | | | | 25 | |
Transport | | | 2,451 | | | | 3,275 | | | | 2,984 | | | | 3,930 | | | | 5,126 | | | | 4,696 | |
| | | | | | |
Total Purchases | | | 5,927 | | | | 6,060 | | | | 6,727 | | | | 7,125 | | | | 7,963 | | | | 6,179 | |
Note:
| 1. | Numbers may not add due to rounding. |
164
Budget Strategy and Outlook 2019-20
Data presented in Table 9.17 provides details of taxation revenue collected by the General Government Sector.
| Table 9.17 | General Government Sector taxes1 |
| | | | | | | | |
| | | 2018-19
Est. Act.
$ million | | | 2019-20
Budget
$ million | |
| | |
Taxes on employers’ payroll and labour force | | | 4,158 | | | | 4,284 | |
| | |
Taxes on property | | | | | | | | |
Land taxes | | | 1,331 | | | | 1,589 | |
Stamp duties on financial and capital transactions | | | 3,049 | | | | 3,038 | |
Other | | | 727 | | | | 1,299 | |
| | |
Taxes on the provision of goods and services | | | | | | | | |
Taxes on gambling | | | 1,331 | | | | 1,410 | |
Taxes on insurance | | | 1,005 | | | | 1,052 | |
| | |
Taxes on use of goods and performance of activities | | | | | | | | |
Motor vehicle taxes | | | 2,403 | | | | 2,490 | |
| | |
Total Taxation Revenue | | | 14,005 | | | | 15,164 | |
Note:
| 1. | Numbers may not add due to rounding. |
165
Budget Strategy and Outlook 2019-20
| 9.6 | Contingent liabilities |
Contingent liabilities represent items that are not included in the Budget as significant uncertainty exists as to whether the Government would sacrifice future economic benefits in respect of these items. Nevertheless, such contingencies need to be recognised and managed wherever possible in terms of their potential impact on the Government’s financial position in the future.
The State’s quantifiable and non-quantifiable contingent liabilities are detailed in the 2017-18 Report on State Finances – whole-of-government financial statements (note 43).
A summary of the State’s quantifiable contingent liabilities as at 30 June 2018 is provided in Table 9.18.
| Table 9.18 | Contingent liabilities |
| | | | |
| | | 2017-18
$ million | |
Nature of contingent liability | | | | |
| |
Guarantees and indemnities | | | 11,203 | |
Other | | | 16 | |
| |
Total | | | 11,219 | |
| 9.7 | Background and interpretation of uniform presentation framework |
As mentioned in the introduction to this chapter, the UPF was reviewed in 2007 following the release of the AASB accounting standard, AASB 1049 Whole of Government and General Government Sector Financial Reporting.
This standard aims to harmonise GFS and GAAP with the objective of improving the clarity and transparency of government financial statements.
| 9.7.1 | Accrual Government Finance Statistics framework |
The GFS reporting framework, developed by the Australian Bureau of Statistics (ABS), is based on international statistics standards (the International Monetary Fund Manual on Government Finance Statistics and the United Nations System of National Accounts). This allows comprehensive assessments to be made of the economic impact of government.
The accrual GFS framework is based on an integrated recording of stocks and flows. Stocks refers to a unit’s holdings of assets and liabilities at a point in time, whilst flows represent the movement in the stock of assets and liabilities between two points in time. Flows comprise two separate types, transactions and other economic flows. Transactions come about as a result of mutually agreed interactions between units or within a single unit. Other economic flows would include revaluations and destruction or discovery of assets that do not result from a transaction.
166
Budget Strategy and Outlook 2019-20
In GFS operating statements, other economic flows, being outside of the control of government, are excluded and do not affect the net operating balance or fiscal balance.
| 9.7.2 | Generally Accepted Accounting Principles |
In addition to the GFS framework, public sector entities were previously required to report at year end against AAS 31 Financial Reporting by Government, which meant complying with the Accounting Standards issued by the AASB.
| 9.7.3 | Harmonisation under AASB 1049 |
This dual reporting regime caused confusion for financial report users and the Financial Reporting Council asked the AASB to develop a framework harmonising GAAP and GFS and to issue an Australian accounting standard for a single set of government reports.
In the development of the AASB 1049, the AASB adopted the following approaches:
| • | | adoption of GAAP definition, recognition and measurement principles in almost all cases |
| • | | amending presentation requirements to encompass a comprehensive result that retains GAAP classification system but overlays it with a transaction and other economic flows classification system based on GFS |
| • | | expanding the disclosure requirements to incorporate key fiscal aggregates required by GFS. |
| 9.7.4 | Revisions to the Uniform Presentation Framework |
Following the introduction of AASB 1049, the Australian, state and territory governments consider that the UPF will continue to be an important framework for ensuring comparability of financial information across jurisdictions. The UPF shall continue to apply to financial statements produced by government in budgets, mid-year budget updates and final budget outcome reports, whereas the accounting standard applies only to outcome reports.
Therefore, rather than replacing the UPF with the accounting standard, the framework was updated to align with AASB 1049. Australia, state and territory governments agreed that the updated framework would continue to provide a common core of comparable financial information in their budget papers and comparable data amongst jurisdictions while maintaining at least the current level of transparency.
Aligning the framework with the AASB 1049 was not intended to create a UPF that complies with all the reporting requirements of AASB 1049. For example, the UPF does not include the same level of detail in relation to disclosure requirements as AASB 1049. Instead, the revised UPF allows jurisdictions to utilise the framework as the base set of statements and add additional relevant information in order to comply with AASB 1049.
167
Budget Strategy and Outlook 2019-20
GFS data is presented by institutional sector, distinguishing between the General Government Sector and the PNFC sector.
Budget reporting focuses on the General Government Sector, which provides regulatory services, and goods and services of a non-market nature that are provided at less than cost or at no cost. These services are largely financed by general revenue (Australian Government grants and state taxation). This service comprises government departments, their commercialised business units/shared service providers and certain statutory bodies.
The PNFC Sector comprises bodies that provide mainly market goods and services that are of a non-regulatory and non-financial nature. PNFCs are financed through sales to consumers of their goods and services and may be supplemented by explicit government subsidy to satisfy community service obligations. In general, PNFCs are legally distinguishable from the governments that own them. Examples of PNFCs include the energy entities and Queensland Rail.
Together, the General Government Sector and the PNFC Sector comprise the Non-financial Public Sector.
Further discussion of the GFS framework of reporting, including definitions of GFS terms, can be obtained from the webpage of the ABS at www.abs.gov.au.
168
Budget Strategy and Outlook 2019-20
The reporting entities included in the General Government and PNFC Sectors in these Budget papers are provided below.
Departments
Aboriginal and Torres Strait Islander Partnerships
Agriculture and Fisheries
Child Safety, Youth and Women
Communities, Disability Services and Seniors
Education
Electoral Commission of Queensland
Employment, Small Business and Training
Environment and Science
Housing and Public Works
Innovation, Tourism Industry Development and the Commonwealth Games
Justice and Attorney-General
Legislative Assembly
Local Government, Racing and Multicultural Affairs
Natural Resources, Mines and Energy
Office of the Governor
Office of the Inspector-General Emergency Management
Office of the Ombudsman
Premier and Cabinet
Public Safety Business Agency
Public Service Commission
Queensland Audit Office
Queensland Corrective Services
Queensland Fire and Emergency Services
Queensland Health
Queensland Police Service
Queensland Treasury
State Development, Manufacturing, Infrastructure and Planning
The Public Trustee of Queensland
Transport and Main Roads
Youth Justice
169
Budget Strategy and Outlook 2019-20
Commercialised Business Units
Building and Asset Services
CITEC
Economic Development Queensland
QFleet
RoadTek
Shared Service Providers
Corporate Administration Agency
Queensland Shared Services
170
Budget Strategy and Outlook 2019-20
Statutory Authorities
Board of the Queensland Museum
Crime and Corruption Commission
Cross River Rail Delivery Authority
Gold Coast 2018 Commonwealth Games Corporation
Gold Coast Waterways Authority
Hospital and Health Services
Cairns and Hinterland
Central Queensland
Central West
Children’s Health Queensland
Darling Downs
Gold Coast
Mackay
Metro North
Metro South
North West
South West
Sunshine Coast
Torres and Cape
Townsville
West Moreton
Wide Bay
Human Rights Commission
Legal Aid Queensland
Library Board of Queensland
Motor Accident Insurance Commission
Nominal Defendant
Office of the Information Commissioner
Office of the Health Ombudsman
Prostitution Licensing Authority
Queensland Agricultural Training Colleges
Queensland Art Gallery Board of Trustees
Queensland Building and Construction Commission
Queensland Curriculum and Assessment Authority
Queensland Family and Child Commission
Queensland Mental Health Commission
Queensland Performing Arts Trust
Queensland Racing Integrity Commission
Queensland Reconstruction Authority
Queensland Rural and Industry Development Authority
Residential Tenancies Authority
South Bank Corporation
TAFE Queensland
The Council of the Queensland Institute of Medical Research
Tourism and Events Queensland
Trade and Investment Queensland
171
Budget Strategy and Outlook 2019-20
| 9.9.2 | Public Non-financial Corporations |
Brisbane Port Holdings Pty Ltd
CleanCo Queensland Ltd
CS Energy Limited
DBCT Holdings Pty Ltd
Energy Queensland
Far North Queensland Ports Corporation Limited
Gladstone Area Water Board
Gladstone Ports Corporation Limited
Mount Isa Water Board
North Queensland Bulk Ports Corporation Limited
Port of Townsville Limited
Powerlink Queensland
Queensland Bulk Water Supply Authority (Seqwater)
Queensland Lottery Corporation Pty Ltd
Queensland Rail
Queensland Treasury Holdings Pty Ltd
Stadiums Queensland
Stanwell Corporation Limited
Sunwater Limited
172
Budget Strategy and Outlook 2019-20
| Appendix A: | Concessions statement |
Context
The Queensland Government provides a wide range of concessions across a variety of services and products. In addition to targeted discounts, rebates and subsidies for Queenslanders based on eligibility criteria relating to factors such as age, income and special needs or disadvantage, broader concession arrangements are in place to reduce the price paid by all consumers in areas such as transport, electricity and water.
The majority of Queenslanders benefit from at least one concession and in many cases, may benefit from multiple concessions each year. For example, aged pensioners are eligible for a number of Queensland Government concessions, such as discounts on their council rates, water, gas and electricity bills, vehicle registration fees as well as subsidised optometry and dental services.
Further information on the eligibility requirements and benefits of a range of Government concessions can be found at: http://www.qld.gov.au/community/cost-of-living-support/concessions/.
Focus
This statement highlights the cost and nature of concessions provided by the Queensland Government. It covers both concessions that are direct Budget outlays (for example, fee subsidy payments), and concessions that are revenue foregone through fees and charges that are set at a lower rate than applies to the wider community or, in the case of broader concessions, the full cost of service provision.
Sections A.2 and A.3 set out the individual concessions by agency and government-owned corporation (GOC) respectively, sorted in descending order. The total value of these concessions is estimated to be $5.66 billion in 2019-20. This represents a significant Government and taxpayer commitment to improving the accessibility and affordability of a diverse range of services, and reducing the price paid by consumers of those services to ease cost of living pressures.
The 2019-20 concessions estimate is almost $29 million higher than the 2018-19 estimated actual amount of $5.631 billion, and more than $ 75 million higher than the 2018-19 budget amount of $5.584 billion. This takes into account the cessation of the Electricity Asset Ownership Dividend, which was a temporary measure to provide Queensland households with a $50 electricity rebate in 2017-18 and 2018-19. This initiative was funded from the dividends of Queensland’s GOCs and formed part of the $2 billion Affordable Energy Plan.
173
Budget Strategy and Outlook 2019-20
Explanation of scope
For the purposes of this document, concessions include:
| • | | discounts, rebates and subsidies to improve access to, and the affordability of, a range of services for individuals or families based on eligibility criteria relating to factors such as age, income and special needs or disadvantage |
| • | | concessional prices for Government services, where the price charged to all consumers is less than the full cost of service provision. |
Both General Government and Public Non–financial Corporations (PNFC) Sector concessions are included. Where a payment is made from a General Government Sector agency to a PNFC entity for a concession arrangement, the expenditure is reported against the General Government Sector agency only to avoid double counting. To be included in this statement, concessions must meet the minimum materiality threshold of estimated expenditure or revenue foregone of $50,000 in 2019-20.
Varying methods have been used to estimate the cost of concessions depending on the nature of the concessions, including:
| • | | direct Budget outlay cost (for example, direct subsidy or rebate payments or Government’s contribution in the case of items such as rental subsidies) |
| • | | revenue foregone (for example, concessional fees and charges) |
| • | | cost of goods and services provided. |
For the purposes of illustration, the document often uses averages to demonstrate the potential value of the concession to consumers. However, averages are not reflective of individual circumstances, meaning the actual dollar value of the concession to consumers may vary from person to person.
The Concessions Statement does not include Tax Expenditures (for example, tax exemptions, reduced tax rates, tax rebates and deductions). Information on Tax Expenditures can be found in Appendix B – Tax expenditure statement.
174
Budget Strategy and Outlook 2019-20
| Table A.1.1 | Concession by entity1 |
| | | | | | | | |
Concession by entity | | 2018-19
Est. Act.
$ million | | | 2019-20
Estimate
$ million | |
Agency | | | | | | | | |
Department of Agriculture and Fisheries | | | 32.9 | | | | 42.4 | |
Department of Communities, Disability Services and Seniors | | | 371.6 | | | | 283.1 | |
Department of Education | | | 128.3 | | | | 139.7 | |
Department of Employment, Small Business and Training | | | 450.5 | | | | 470.7 | |
Department of Environment and Science | | | 11.0 | | | | 9.8 | |
Department of Housing and Public Works | | | 461.3 | | | | 457.1 | |
Department of Justice and Attorney-General | | | 94.6 | | | | 101.5 | |
Department of Natural Resources, Mines and Energy | | | 755.5 | | | | 802.2 | |
Department of Transport and Main Roads | | | 2,874.8 | | | | 2,918.2 | |
Queensland Fire and Emergency Services | | | 9.9 | | | | 10.3 | |
Queensland Health | | | 308.0 | | | | 292.8 | |
Total Agency | | | 5,498.4 | | | | 5,527.8 | |
| | |
Government-owned corporations | | | | | | | | |
Energy Queensland | | | 25.6 | | | | 25.5 | |
Far North Queensland Ports Corporation Limited | | | 0.9 | | | | 0.8 | |
Gladstone Ports Corporation Limited | | | 47.0 | | | | 45.8 | |
North Queensland Bulk Ports Corporation Limited | | | 1.7 | | | | 1.7 | |
Port of Townsville Limited | | | 5.9 | | | | 6.0 | |
Queensland Rail Limited | | | 1.9 | | | | 2.0 | |
Sunwater Limited | | | 49.4 | | | | 50.2 | |
Total Government-owned corporations | | | 132.4 | | | | 132.0 | |
| | |
Total all entities | | | 5,630.8 | | | | 5,659.8 | |
Note:
| 1. | Numbers may not add due to rounding. |
175
Budget Strategy and Outlook 2019-20
| Table A.2.1 | Department of Agriculture and Fisheries |
| | | | | | | | |
Concession | | 2018-19
Est. Act.
$ million | | | 2019-20
Estimate
$ million | |
Drought Relief Assistance Scheme1 | | | 16.5 | | | | 21.0 | |
Primary Industry Productivity Enhancement Scheme (PIPES)2 | | | 15.0 | | | | 18.0 | |
Vessel Tracking Rebate Scheme3 | | | 0.4 | | | | 2.5 | |
Farm Management Grant4 | | | 1.0 | | | | 0.9 | |
Total | | | 32.9 | | | | 42.4 | |
Notes:
| 1. | In 2019-20 the Government is providing funding of up to $21 million, held centrally, for subsidies and rebates associated with the continuation of the Drought Relief Assistance Scheme (DRAS). The demand for DRAS assistance is expected to increase in 2019-20, based on current forecasts which show that the percentage of the State drought declared may increase. |
| 2. | The variance is due to an anticipated increased take up of PIPES lending from $80 million in 2018-19 to $100 million in 2019-20. The 2018-19 year is considered to have been affected by prolonged adverse seasonal conditions of drought and the northern Queensland flooding event. |
| 3. | The variance is due to an anticipated increased take up of the Vessel Tracking Rebate Scheme in 2019-20. During the 2018-19 year there has been slow take up of the scheme due to supply issues; clarifying the requirements of the scheme, with most applications being processed after 1 January 2019. |
| 4. | The scheme closes 30 June 2019, however there is expected to be an increase in applications at the end of the financial year which will be paid in the 2019-20 financial year. |
Drought Relief Assistance Scheme
The Drought Relief Assistance Scheme provides freight subsidies and emergency water infrastructure rebates to support producers and communities that have been affected by drought conditions across the State. Freight subsidies of up to 50% and emergency water infrastructure rebates of up to 50% are available to eligible applicants, up to a maximum of between $20,000 and $50,000 per property, per financial year. This is funded through the Drought Assistance Package.
Primary Industry Productivity Enhancement Scheme (PIPES)
PIPES is administered by the Queensland Rural and Industry Development Authority (QRIDA) and provides concessional rates of interest on loans to eligible primary producers in need of financial assistance. First Start Loans and Sustainability Loans of up to $2 million and $1.3 million respectively support applicants to enter primary production and to improve productivity and sustainability. The average concessional interest rate for new lending is 3.69%. The amounts shown in the above table represent the fair values of the interest rate concessions pertaining to loans issued in each of the financial years shown.
176
Budget Strategy and Outlook 2019-20
Vessel Tracking Rebate Scheme
The Queensland Sustainable Fisheries Strategy 2017-2027 requires vessel tracking on all commercial fishing boats by 2020 to assist in the management of Queensland Fisheries. This initiative is designed to assist commercial fishers by providing rebates up to prescribed amounts, to offset the cost of purchasing and installing approved vessel tracking units.
Farm Management Grant
The Farm Management Grant aims to assist eligible Queensland primary producers, or their relatives, to offset the costs of professional advice associated with succession planning. The grant provides rebates of up to 50% of the amount paid for professional advice, up to a maximum of $2,500 per financial year.
| Table A.2.2 | Department of Communities, Disability Services and Seniors |
| | | | | | | | |
Concession | | 2018-19
Est. Act.
$ million | | | 2019-20
Estimate
$ million | |
Electricity Rebate Scheme1, 2 | | | 187.0 | | | | 192.3 | |
Pensioner Rate Subsidy Scheme | | | 53.0 | | | | 55.2 | |
South East Queensland Pensioner Water Subsidy Scheme | | | 17.4 | | | | 18.9 | |
Home Energy Emergency Assistance Scheme | | | 8.0 | | | | 10.0 | |
Reticulated Natural Gas Rebate Scheme | | | 2.5 | | | | 2.6 | |
Electricity Life Support Concession Scheme2 | | | 2.2 | | | | 2.3 | |
Medical Cooling and Heating Electricity Concession Scheme2 | | | 1.5 | | | | 1.8 | |
Electricity Asset Ownership Dividend | | | 100.0 | | | | — | |
Total | | | 371.6 | | | | 283.1 | |
Notes:
| 1. | The variance is primarily due to the estimated growth in recipients, primarily Health Care Card holders. |
| 2. | Electricity price rebates are adjusted annually according to the Queensland Competition Authority’s (QCA) price determination for the general household electricity tariff (Tariff 11). For 2019-20, the QCA determined Tariff 11 will decrease by 4.4%. However, Government has determined existing rebate values will not be decreased and will continue to apply in 2019-20. |
177
Budget Strategy and Outlook 2019-20
Electricity Rebate Scheme
The Electricity Rebate Scheme provides a rebate of up to approximately $341 per annum, to assist with the cost of domestic electricity supply to the home of eligible holders of a Pensioner Concession Card, a Queensland Seniors Card or a Department of Veterans’ Affairs Gold Card (and receive a War Widow/er Pension or special rate Totally or Permanently Incapacitated Pension).
Additionally, the rebate was extended to Commonwealth Health Care Card Holders and asylum seekers from 1 January 2017, allowing an estimated 157,000 additional Queensland families to access the rebate.
Pensioner Rate Subsidy Scheme
The Pensioner Rate Subsidy Scheme offers a 20% subsidy (up to a maximum of $200 per annum) to lessen the impact of local government rates and charges on pensioners, thereby assisting them to continue to live in their own homes.
South East Queensland Pensioner Water Subsidy Scheme
The South East Queensland Pensioner Water Subsidy Scheme provides a subsidy of up to $120 per annum to eligible pensioner property owners in the South East Queensland Water Grid to lessen the impact of water prices. This subsidy is in addition to the Pensioner Rate Subsidy Scheme.
Home Energy Emergency Assistance Scheme
The Home Energy Emergency Assistance Scheme provides emergency assistance of up to $720 once in a two-year period to assist low income households experiencing a short-term financial crisis and who are unable to pay their current electricity and/or reticulated natural gas account. It is not a requirement for the claimant to hold a concession card.
Reticulated Natural Gas Rebate Scheme
The Reticulated Natural Gas Rebate Scheme provides a rebate of up to approximately $74 per annum to assist with the cost of reticulated natural gas supplied to the home of eligible holders of a Pensioner Concession Card, Queensland Seniors Card or a Department of Veterans’ Affairs Gold Card (and receive the War Widow/er Pension or special rate Totally or Permanently Incapacitated Pension).
Electricity Life Support Concession Scheme
The Electricity Life Support Concession Scheme is aimed at assisting seriously ill people who use home based life support systems by providing a rebate of up to approximately $694 per annum for users of oxygen concentrators and a rebate of up to approximately $465 per annum for users of kidney dialysis machines to meet their electricity costs. The concession is paid quarterly and is subject to the patient being medically assessed in accordance with Queensland Health eligibility criteria.
178
Budget Strategy and Outlook 2019-20
Medical Cooling and Heating Electricity Concession Scheme
The Medical Cooling and Heating Electricity Concession Scheme provides a rebate of up to approximately $341 per annum for eligible concession card holders with a medical condition who have dependence on air conditioning to regulate body temperature.
| Table A.2.3 | Department of Education |
| | | | | | | | |
Concession | | 2018-19
Est. Act.
$ million | | | 2019-20
Estimate
$ million | |
Textbook and Resource Allowance1 | | | 60.3 | | | | 67.7 | |
School Transport Assistance for Students with Disabilities2 | | | 42.2 | | | | 45.8 | |
Living Away from Home Allowance Scheme2 | | | 7.4 | | | | 7.5 | |
Tuition Fee Exemptions/Waivers - Dependants of International Students2 | | | 7.1 | | | | 7.3 | |
Non-Government Schools Transport Assistance Scheme2 | | | 6.1 | | | | 6.2 | |
Dalby State High School - Bunya Campus Residential Facility | | | 2.5 | | | | 2.5 | |
Spinifex State College - Mount Isa Student Residential Facility | | | 1.1 | | | | 1.1 | |
Distance Education - Information and Communication Technology Subsidy Scheme | | | 0.9 | | | | 0.9 | |
Distance Education - Non-Government Student Fee Subsidy | | | 0.7 | | | | 0.7 | |
Total | | | 128.3 | | | | 139.7 | |
Notes:
| 1. | The variance is due to a combination of indexation and student enrolment growth due to the full cohort of students in 2020. |
| 2. | The variance is due to indexation. |
Textbook and Resource Allowance
The Textbook and Resource Allowance is available for all parents/caregivers of secondary school age students attending State and non-government schools, and children registered in home education of equivalent age, to assist with the cost of textbooks and learning resources. Parents may sign over this allowance to the school to reduce the fees associated with participating in the school’s Student Resource Scheme. In 2019, the rates per annum are $127 for students in Years 7 to 10 and $276 for students in Years 11 and 12.
179
Budget Strategy and Outlook 2019-20
School Transport Assistance for Students with Disabilities
School Transport Assistance for Students with Disability is provided for eligible students to attend State school programs that meet their individual education needs. This assistance includes co-ordinated service delivery in taxis or specialised contracted minibuses, payment of fares on buses, ferries and trains, or an allowance for parents who drive their children to school or a transport point. The benefit level is to a maximum of $400 per week, per student, however in exceptional circumstances higher amounts may be approved. A separate scheme is in place for students with disabilities attending non-government schools (refer ‘Non-Government Schools Transport Assistance Scheme’).
The COAG Disability Reform Council has agreed that states and territories will continue to deliver these services for National Disability Insurance Scheme (NDIS) participants on an ‘in kind’ basis until the end of the 2023 school year. The Department of Education is working with the Department of Transport and Main Roads (DTMR), the Australian Government, the National Disability Insurance Agency and other jurisdictions to develop viable national models for the delivery of school transport for students with disability under the NDIS.
Living Away from Home Allowance Scheme
The Living Away from Home Allowances Scheme provides financial assistance to support geographically isolated families. The scheme assists with the costs of children required to live away from home to attend school. This concession is available to Queensland students attending both state and non-state schools.
The benefits available for eligible students in 2019 are:
| • | | Remote Area Tuition Allowance – assistance is available for primary students of up to $3,808 per annum and for secondary students of up to $5,483 per annum. |
| • | | Remote Area Travel Allowance – available where the distance from the family home to the boarding location is at least 50km. Benefit levels depend on the distance travelled, and range from $144 to a maximum of $1,756 per annum. |
| • | | Remote Area Allowance – assistance of $2,394 per annum is available to students attending campuses of the Queensland Agricultural Training Colleges in lieu of Years 11 and 12. |
| • | | Remote Area Disability Supplement – available to students with disabilities who incur additional costs associated with living away from home to attend school. Benefits are up to $7,789 per student per annum. |
Tuition Fee Exemptions/Waivers – Dependants of International Students
International students who meet the approved exemption criteria and wish to enrol their child in Preparatory (Prep) Year to Year 12 of schooling are exempt from paying dependant tuition fees. The exemption only applies for the duration of the main temporary visa holder’s (parent) course of study in Queensland. A dependant student (Prep to Year 12) of a temporary visa holder may also be eligible for a tuition fee waiver in certain circumstances, including financial hardship.
The estimated average amount exempted or waived per student is $7,469 for the 2019-20 financial year.
180
Budget Strategy and Outlook 2019-20
Non-Government Schools Transport Assistance Scheme
The Non-Government Schools Transport Assistance Scheme assists families by providing funding towards the transport costs of students attending non-government schools outside of the Brisbane City Council area. Under the scheme, payments are provided for transport expenses above a set weekly threshold amount. In 2019, the weekly threshold is $ 20 per family, or $15 for families with a current Health Care, Pensioner or Veteran’s Affairs Card.
The program also assists families of students with disabilities who attend a non-government school. The level of assistance provided is dependent on the type of transport needed and travel assistance already provided by the DTMR. For families using taxis, assistance is capped at $300 per week.
The Department of Education is working with the DTMR and other jurisdictions to establish a long-term solution for the delivery of school transport for students with disability under the NDIS.
Dalby State High School – Bunya Campus Residential Facility
The Dalby State High School – Bunya Campus Residential Facility provides affordable residential accommodation for secondary school students in a boarding facility. The concession particularly targets secondary school students from rural and remote communities, however, any secondary age student is eligible. Students accommodated at the residential facility are enrolled at Dalby State High School and participate in agricultural education programs.
Spinifex State College – Mount Isa Student Residential Facility
The Spinifex State College – Mount Isa Student Residential Facility provides an affordable residential facility in Mount Isa for students from the North Western area of the state whose home community does not provide secondary schooling. The funding meets the cost of wages for the residential college, increasing the affordability of the accommodation rates charged to students.
Distance Education – Information and Communication Technology Subsidy Scheme
The Distance Education – Information and Communication Technology Subsidy Scheme provides assistance to students enrolled in a school of distance education that are geographically isolated or in the medical category.
The scheme provides $250 per annum to assist with purchasing, replacing or upgrading computer hardware for students in the distance/geographically isolated and medical categories, and $500 per annum to assist students in the distance/geographically isolated category to meet the costs of broadband Internet access and download charges for the home classroom. Eligible students also receive access to free software licences.
181
Budget Strategy and Outlook 2019-20
Distance Education – Non-Government Student Fee Subsidy
The Distance Education – Non-Government Student Fee Subsidy is available to students who are enrolled in non-government schools and also choose to access distance education subjects. It provides an average annual subsidy of approximately $1,390 per distance education subject enrolment.
This subsidises approximately 50% of the total average cost per annum of providing a subject through distance education for non-government school student. The concession contributes towards the state continuing to make distance education available to non-government schools, ensuring the widest possible subject choice for students, while recovering a proportion of the teaching and overhead costs.
| Table A.2.4 | Department of Employment, Small Business and Training |
| | | | | | | | |
Concession | | 2018-19
Est. Act.
$ million | | �� | 2019-20
Estimate
$ million | |
User Choice - Apprentice and Trainee Training Subsidy1 | | | 187.0 | | | | 199.0 | |
Vocation Education and Training (VET) - Certificate 3 Guarantee Tuition Fee Subsidy1 | | | 189.2 | | | | 193.7 | |
VET - Higher Level Skills Tuition Fee Subsidy1 | | | 72.0 | | | | 75.0 | |
Travel and Accommodation Subsidy1 | | | 2.3 | | | | 3.0 | |
Total | | | 450.5 | | | | 470.7 | |
Note:
| 1. | The variance is due to the anticipated increase in activity due to the demand driven nature of the programs. |
User Choice – Apprentice and Trainee Training Subsidy
The User Choice – Apprentice and Trainee Training Subsidy program provides government funding towards the costs of training and assessment for eligible Queensland apprentices and trainees or complementary pathways leading to apprenticeship and traineeship outcomes. The subsidy is available to public and private registered training organisations (pre-approved as pre-qualified suppliers) to subsidise tuition fees to reduce the cost of required accredited, entry level training for apprentices and trainees. The program provides greater flexibility for apprentices, trainees and their employers to select a preferred registered training organisation and to negotiate the type of training to meet their specific needs.
The value of this subsidy for each qualification ranges from $1,150 to $50,720 depending on the eligibility and qualification subsidised. The average subsidy value is $9,673.
182
Budget Strategy and Outlook 2019-20
Vocation Education and Training (VET) – Certificate 3 Guarantee Tuition Fee Subsidy
The Vocational Education and Training (VET) Certificate 3 Guarantee Tuition Fee Subsidy provides a government subsidy to allow eligible Queenslanders to obtain their first post-school Certificate III qualification to gain a job or to improve their employment status. The subsidy is available to private and public registered training organisations (pre-approved as pre-qualified suppliers) to subsidise tuition fees paid by students undertaking eligible vocation education and training qualifications (primarily Certificate III qualifications).
The value of this subsidy for each qualification ranges from $448 to $6,400 depending on the eligibility and qualification subsidised. The average subsidy value is $2,934.
VET – Higher Level Skills Tuition Fee Subsidy
The VET Higher Level Skills Tuition Fee Subsidy provides a government subsidy to eligible students and employers to undertake a priority Certificate IV, diploma or advanced diploma or industry endorsed skill set. This program will help individuals gain employment in a critical occupation, career advancement in a priority industry or transition to university to continue their studies. The subsidy is available to private and public registered training organisations (pre-approved as pre-qualified suppliers) to subsidise tuition fees paid by students undertaking eligible vocational education and training qualifications at Certificate IV or above.
The value of this subsidy for each qualification ranges from $1,130 to $9,979 depending on the eligibility and qualification subsidised. The average subsidy value is $4,041.
Travel and Accommodation Subsidy
The Travel and Accommodation Subsidy provides financial assistance to Queensland apprentices and trainees for travel expenses incurred in attending off the job training at a registered training organisation. To be eligible, apprentices must attend the closest registered training organisation that offers the required qualification and travel a minimum of 100 kilometres (km) return from their usual place of residence to the registered training organisation. The subsidy provides for:
| • | | return land travel to the registered training organisation of 15 cents per km for distances between 100-649 km, increasing to 19 cents per km for distances between 650-1,400 km |
| • | | cost of ferry travel if necessary |
| • | | a return economy air ticket to the location of the registered training organisation if necessary |
| • | | accommodation assistance of $28 per day for overnight stay within Queensland and $68 for interstate travellers, if it is necessary to live away from their usual place of residence to attend training. |
183
Budget Strategy and Outlook 2019-20
| Table A.2.5 | Department of Environment and Science |
| | | | | | | | |
Concession | | 2018-19
Est. Act.
$ million | | | 2019-20
Estimate
$ million | |
Queensland Performing Arts Trust - Arts concessional entry fees1 | | | 4.2 | | | | 3.0 | |
Queensland Museum - Arts concessional entry fees2 | | | 2.6 | | | | 2.3 | |
Queensland Art Gallery - Arts concessional entry fees3 | | | 0.1 | | | | 0.6 | |
Arts Queensland - Discount on property lease rentals | | | 0.7 | | | | 0.6 | |
Queensland Performing Arts Trust - Venue hire rebates | | | 0.5 | | | | 0.5 | |
State Library of Queensland - Venue hire rebates | | | 0.5 | | | | 0.5 | |
Arts Queensland - Venue hire rebates | | | 0.2 | | | | 0.3 | |
Tour fee and access permit concessions | | | 2.2 | | | | 2.0 | |
Total | | | 11.0 | | | | 9.8 | |
Notes:
| 1. | Variance between published budget and estimated actual is due to an increase by Queensland Performing Arts Centre in the net investment of International Series events in 2018-19, thereby allowing more concessional tickets to be offered and greater than expected levels of activity compared to budget. |
| 2. | Variance is mainly due to higher level of visitation as a result of programming and events, i.e. spaces being re-opened at Southbank campus, for example Sparklab that were not included in the original budget calculation. Reduction in next year’s estimate is based on changes in programming in the current year. |
| 3. | Increase in concessions in 2019-20 is due to a planned ticketed exhibition. |
Queensland Performing Arts Trust – Arts concessional entry fees
Concessional entry fees are offered for specific Queensland Performing Arts Trust productions and to provide support for other not for profit theatre companies to enable tickets to be sold at concessional prices. The level of concession provided varies depending on the number and size of events being held each year.
Queensland Museum – Arts concessional entry fees
Queensland Museum provides concessional entry fees to seniors, students, children, families and a variety of concession card holders for ticketed exhibitions at Queensland Museum and Sciencentre and for general entry to Cobb & Co Museum Toowoomba, The Workshops Rail Museum Ipswich and Museum of Tropical Queensland Townsville. Concessions are also provided to targeted groups, such as schools, to encourage visits to museums. The level of concession provided varies depending on the venue and the event.
184
Budget Strategy and Outlook 2019-20
Queensland Art Gallery – Arts concessional entry fees
Queensland Art Gallery’s ticket prices are set to ensure that they are affordable and to maximise attendance, with additional concessions provided to seniors, students, children, families and a variety of concession card holders. The purpose of the Queensland Art Gallery Arts concessional entry fees concession is to contribute to the cultural, social and intellectual development of Queenslanders, and encourage diverse audiences.
Arts Queensland – Discount on property lease rentals
Property lease rentals are provided to arts and cultural organisations at a discount from market rental rates at the Judith Wright Centre of Contemporary Arts, Festival House and the Cairns Centre of Contemporary Arts. Discounts range from 20% to 100% of the market rate (dependent on location) of the commercial office space. Further discounts on specialist rehearsal and gallery space are given as negotiated at the time of entering the lease and dependent on the individual arts or cultural organisation and its funding.
Queensland Performing Arts Trust – Venue hire rebates
Venue hire rebates are offered to Government funded cultural organisations, charitable organisations, government departments and educational institutions. Organisations currently receiving discounts are Queensland Symphony Orchestra, Opera Queensland, Queensland Theatre Company and Queensland Ballet.
State Library of Queensland – Venue hire rebates
State Library of Queensland provides venue hire concessions to targeted community and non-profit groups including cultural and charitable organisations and educational institutions in order to support events and programs directly linked to State Library of Queensland’s services, programs and activities.
Arts Queensland – Venue hire rebates
Venue hire rebates support Queensland Government funded arts organisations and professional artists to develop and present new work at the Judith Wright Centre of Contemporary Arts and the Cairns Centre of Contemporary Arts.
Tour fee and access permit concessions
Admission and ranger guided tour fee concessions are available at several attractions for children, pensioners and educational purposes. Vehicle access permit concessions are available in the Cooloola Recreation Area, Moreton, Bribie and K’gari (Fraser) islands. Camping concessions are available in all national park and forest camping areas for educational purposes and children under five.
185
Budget Strategy and Outlook 2019-20
| Table A.2.6 | Department of Housing and Public Works |
| | | | | | | | |
Concession | | 2018-19
Est. Act.
$ million | | | 2019-20
Estimate
$ million | |
Government managed housing rental rebate1 | | | 404.1 | | | | 398.0 | |
National Rental Affordability Scheme | | | 29.3 | | | | 29.9 | |
Home Assist Secure | | | 20.8 | | | | 21.5 | |
Non-residential buildings - subsidised rents | | | 5.9 | | | | 6.5 | |
Rental Bond Loans | | | 0.9 | | | | 0.9 | |
Queensland Recreation Centres - Concessional usage rates | | | 0.3 | | | | 0.3 | |
Non-government managed housing2 | | | — | | | | — | |
Total | | | 461.3 | | | | 457.1 | |
Notes:
| 1. | The concession is estimated to decrease in 2019-20 due to a variation in the estimated amount of rent charges. |
| 2. | The value of this concession arrangement cannot be easily quantified. |
Government managed housing rental rebate
The Government managed housing rental rebate targets low income families and individuals and represents the difference between the rents that would be payable in the private market and rent that is charged by Government based on household income.
Assistance is provided to approximately 53,700 households. The estimated average yearly subsidy per household for 2019-20 is $7,416.
National Rental Affordability Scheme
The National Rental Affordability Scheme (NRAS) is an Australian Government initiative, delivered in partnership with the Queensland Government, to increase the supply of new affordable rental housing. The scheme provides financial incentives to investors to build well located dwellings and rent them to eligible low to moderate income households, at a discounted rate at least 20% below market rent.
Under the scheme, the concession to the tenant is provided by the property owner. Due to the nature of the arrangement, the overall value of the concession to the tenant cannot be quantified. In 2019-20, the Government has allocated $29.9 million for the payment of financial incentives to NRAS investors who are then required to discount rents to tenants.
186
Budget Strategy and Outlook 2019-20
Home Assist Secure
Home Assist Secure provides free safety related information and referrals, and subsidised assistance to eligible clients unable to undertake or pay for critical maintenance services without assistance. To be considered for assistance, home owners or tenants over the age of 60 or of any age with a disability must hold a Pensioner Concession Card and be unable to complete the work themselves. In addition, they must be unable to access assistance from other services. Labour costs (up to $500 per household per year) for the assistance provided are subsidised by Home Assist Secure while the balance of the costs (including the materials) are met by the client.
Home Assist Secure targets home owners and those in rental housing who are over 60 years of age or have disability, and who require assistance to remain living in their home. In 2019-20, it is estimated that over 40,000 households will be assisted.
Non-residential buildings – subsidised rents
Accommodation is provided to 41 community, education, arts and not-for-profit organisations in Government owned non-residential buildings. Tenures for the occupancies are by way of leases, licences or month to month arrangements. Rents paid by the organisations are often below independently assessed market rent levels. Subsidised rental arrangements are provided to 25 properties comprising a total floor area of approximately 27,631 square metres. The total subsidy is calculated by deducting the actual amount paid by the occupants from the total estimated annual market rent for the office space.
Rental Bond Loans
The Government provides interest-free rental bond loans through two products, 1. Bond Loans: equivalent to a maximum amount of four weeks rent or 2. Bond Loan Plus: equivalent to a maximum amount of six weeks rent, to people who cannot afford to pay a full bond to move into private rental accommodation reducing the need for more costly, subsidised housing assistance. The interest free bond loan targets low-income households and can stabilise tenancies, prevent households from entering the cycle of homelessness and engaging with fringe, high interest credit providers. The concession represents the interest saving for the client on the bond loan. In 2019-20, $28.5 million in bond loans and bond loan plus may be advanced to an estimated 22,000 clients.
Queensland Recreation Centres – Concessional usage rates
Concessional usage rates are offered to students and children 17 years and under, for the use of Queensland Recreation Centres, primarily at Currimundi and Tallebudgera. These concessional rates provide a discount between 3.25% to 18% of the full charge to approximately 31,000 recipients.
187
Budget Strategy and Outlook 2019-20
Non-government managed housing
The Government provides contributions to social housing providers, including capital grants, granted land or properties, or recurrent funding, to assist in increasing housing affordability and access to social housing. Due to the nature of the arrangement, the overall value of the concession provided by the Government cannot be easily quantified.
Rents charged for social housing managed by the providers are based on between 25% and 30% of a household’s assessable income or the market rent, whichever is lower, which substantially reduces accommodation costs for eligible individuals and families. Many of these families may also be eligible for Commonwealth Rent Assistance to assist in the cost of their accommodation.
| Table A.2.7 | Department of Justice and Attorney-General |
| | | | | | | | |
Concession | | 2018-19
Est. Act.
$ million | | | 2019-20
Estimate
$ million | |
Public Trustee of Queensland - Concessions | | | 37.9 | | | | 39.4 | |
Court Services - Civil Court | | | 24.4 | | | | 26.4 | |
Queensland Civil and Administrative Tribunal | | | 19.3 | | | | 21.8 | |
Blue Card - Volunteer Applicants | | | 10.5 | | | | 11.0 | |
Body Corporate and Community Management - Dispute Resolution | | | 2.5 | | | | 2.5 | |
Office Liquor and Gaming Regulation - Rural Hotel Concessions | | | — | | | | 0.4 | |
Total | | | 94.6 | | | | 101.5 | |
Public Trustee of Queensland – Concessions
The Public Trustee of Queensland (the Public Trustee) is a self-funding organisation and uses a scale of fees which is designed to reflect a fair cost for the services provided.
The Public Trustee has established a safety net limit on the annual fees payable by certain clients which provides for a rebate of fees for some clients with limited assets. The rebate is applied to clients such as financial administration clients with impaired capacity, or estate administration clients of limited means. The Public Trustee also provides Will making services at no cost for all Queenslanders.
In addition, the Public Trustee provides funding to the Public Guardian and financial assistance under the Civil Law Legal Aid Scheme administered by Legal Aid Queensland, to enable these organisations to provide services to the people of Queensland.
188
Budget Strategy and Outlook 2019-20
Court Services – Civil Court
The Supreme, District and Magistrates Courts hear civil disputes between two or more parties (people or organisations) where one party sues the other, usually to obtain compensation, or seek some other remedy. These disputes may involve anything from defamation to outstanding debts. Civil Court Fees are prescribed under the Uniform Civil Procedure (Fees) Regulation 2009 for proceedings commenced in civil matters and are set below full cost recovery to ensure that civil remedies are accessible to all Queenslanders.
Queensland Civil and Administrative Tribunal
The Queensland Civil and Administrative Tribunal (QCAT) is an independent tribunal which makes decisions and resolves disputes across a wide range of jurisdictions for the community. Fees for these services are set below cost recovery to ensure services are accessible, fair and inexpensive. QCAT provides human rights services with no application fees for matters in guardianship and administration of adults, children and young people and anti-discrimination.
Blue Card – Volunteer Applicants
Individuals providing child-related services or conducting child-related activities in regulated service environments are required to undergo an assessment of their police and relevant disciplinary information, and if approved, are issued with a blue card. A blue card is valid for three years unless cancelled or suspended earlier. Since the inception of the blue card system in 2001, Government has met the cost of blue card assessment for volunteer applicants.
Body Corporate and Community Management – Dispute Resolution
The Office of the Commissioner for Body Corporate and Community Management provides a dispute resolution service to parties unable to resolve disputes themselves. The service consists of conciliation, with the aim of achieving a voluntary agreement, and adjudication, which results in a formal order. The service is delivered below full cost recovery so as to not restrict access to justice due to affordability reasons. The commissioner has the discretion to waive application fees on the grounds of financial hardship.
Office Liquor and Gaming Regulation – Rural Hotel Concessions
The Office of Liquor and Gaming Regulation licenses hotels and clubs under the Liquor Act 1992. Under the Liquor (Rural Hotels Concession) Amendment Act 2019, the Rural Hotels Concession provides licence fee relief to establishments in remote communities by reducing the base licence fees for hotels and community clubs with no more than 2,000 members for eligible licences from July 2019.
189
Budget Strategy and Outlook 2019-20
| Table A.2.8 | Department of Natural Resources, Mines and Energy |
| | | | | | | | |
Concession | | 2018-19
Est. Act.
$ million | | | 2019-20
Estimate
$ million | |
Energy Queensland - Uniform Tariff Policy (excluding Isolated Systems)1 | | | 413.5 | | | | 440.3 | |
Energy Queensland - Uniform Tariff Policy for Isolated Systems1 | | | 48.3 | | | | 57.9 | |
Powering Queensland Plan Electricity Affordability Package2 | | | 259.2 | | | | 247.6 | |
Affordable Energy Plan - Energy Savers Program3 | | | 0.7 | | | | 14.8 | |
Affordable Energy Plan - Solar & Storage Interest Free Loans Scheme | | | 4.6 | | | | 4.8 | |
Affordable Energy Plan - Energy Savvy Families4 | | | 2.5 | | | | 1.4 | |
Extending existing drought relief arrangements - Water Licence Fee Waiver and Land Rental Rebates | | | 4.2 | | | | 4.2 | |
Origin Energy - Uniform Tariff Policy | | | 2.8 | | | | 2.8 | |
Solar for Rental Property Rebate5 | | | 0.3 | | | | 2.7 | |
Sunwater Rural Irrigation Water Price Subsidy | | | 2.1 | | | | 2.2 | |
Cloncurry Pipeline Water Supply Subsidy | | | 5.9 | | | | 6.3 | |
Extending existing drought relief arrangements - Electricity Charge Scheme6 | | | 9.3 | | | | 15.0 | |
Seqwater Bulk Water Rural Irrigation Water Price Subsidy | | | 2.1 | | | | 2.2 | |
Total | | | 755.5 | | | | 802.2 | |
Notes:
| 1. | For 2019–20, the increase in the community service obligation (CSO) largely relates to an increase in Ergon Energy’s distribution charges relative to Energex’s charges. All CSO payments are agreed by both parties prior to execution of the CSO Deed. This means that DNRME must be in agreement with the assumptions applied. The annual CSO payment for 2019-20 is higher than the 2018-19 CSO payment because the consumption volume assumed for 2019-20 is higher than 2018-19. |
| 2. | Financing of the Solar Bonus Scheme was moved from electricity distribution network prices to the state budget from 1 July 2017 for three years until 30 June 2020, as part of the Powering Queensland Plan. The government will make a decision about the ongoing costs of the Solar Bonus Scheme closer to when this current commitment will end. |
| 3. | The variance between the 2018-19 estimated actual and 2019-20 budget is due to the transfer of $12.5 million in 2018-19 to QRIDA from DNRME. This was to support program administration of the application for grant funds under the Affordable Energy Plan – Energy Savers program. The remainder estimated actual relates to the delivery of free energy audits under the program. |
| 4. | Delivery of goods and services to the value of the outstanding expenditure are already substantively delivered, and anticipated to be completely delivered and the department invoiced by the end of the financial year. |
| 5. | This project was launched on 5 March 2019. The increase from 2018-19 estimated actuals to 2019-20 budget is due to the expected uptake of the solar for rental property rebate. |
| 6. | Expenditure is dependent on the number of registered eligible parties in drought declared areas seeking a rebate for fixed charges of their electricity accounts. This includes annual fixed charges under Tariff 66, service fees and minimum payments. The arrangement only applies to electricity used to pump water for farm or irrigation purposes. |
190
Budget Strategy and Outlook 2019-20
Energy Queensland – Uniform Tariff Policy (excluding Isolated Systems)
The Energy Queensland – Uniform Tariff Policy (excluding Isolated Systems) ensures that, where possible, all Queensland non-market electricity customers of a similar type pay a similar price for electricity regardless of where they live. As the notified prices do not reflect the full cost of electricity supply for most remote and regional Queenslanders, a subsidy is provided. The community service obligation (CSO) payment to the regional retailer Energy Queensland covers the difference between the revenue earned by charging customers notified prices and the actual costs in the regional areas (due to differences in network costs and energy losses).
Energy Queensland – Uniform Tariff Policy for Isolated Systems
The Energy Queensland – Uniform Tariff Policy for Isolated Systems ensures that, where possible, all Queensland non-market electricity customers of a similar type pay a similar price for electricity regardless of where they live. Energy Queensland owns and operates 33 isolated power stations which supply electricity to remote and isolated Queensland communities. Energy Queensland retails electricity to these customers at the notified prices, and the Government provides funding to the retailer to cover the difference between the revenue earned and the cost of supplying electricity to these customers.
Powering Queensland Plan – Electricity Affordability Package
The Powering Queensland Plan provided one-off funding in 2016-17 of $771 million to support the stabilisation of electricity prices for Queensland consumers, by funding the removal of costs of the Solar Bonus Scheme from electricity prices for three years from 1 July 2017 to 30 June 2020, and directing Energy Queensland to remove costs from network charges. This has placed downward pressure on electricity prices, with an average saving of $51 for households and $90 for small businesses, compared with the increase which would have occurred in 2017-18, without Government intervention. It is estimated that the benefit to Queenslanders in 2019-20 as a result of this measure will be $247.6 million.
Affordable Energy Plan – Energy Savers Program
The $20 million Business Energy Savers Program, an initiative under the Affordable Energy Plan, provides free energy audits for agricultural customers and large business customers, and co-contributions to fund energy efficiency upgrades. It includes a three year extension of the existing Energy Savers Plus Program (for agricultural businesses) and the Large Customer Adjustment Program (for large electricity users).
Under the expanded Energy Savers Plus Program, up to 200 additional audits for agricultural customers will be completed. In addition to this, co-contribution grants of up to $20,000 will be made available to assist businesses in implementing the recommendations from the audit.
Under the expanded Large Customer Adjustment Program up to 30 additional audits of large customers will be completed and 50% co-contributions, capped at up to $250,000, will be made available to help encourage the business to implement the audit recommendations.
191
Budget Strategy and Outlook 2019-20
Affordable Energy Plan – Solar & Storage Interest Free Loans Scheme
This scheme is designed to assist households and small businesses address electricity affordability by providing upfront capital to those who otherwise would not have access to funds to invest in rooftop solar and battery energy storage technology.
Affordable Energy Plan – Energy Savvy Families
Under this plan, $4 million has been provided over three years to enable the provision of digital electricity meters as well as providing educational material and information to low income families in regional Queensland to help them better understand and manage their energy use.
Extending existing drought relief arrangements – Water Licence Fee Waiver and Land Rental Rebates
As part of the Government’s drought assistance package, the annual water licence fee of $82 will be waived for 2019-20 for landholders in Local Government Areas (LGA) that are drought declared and other properties that are individually drought declared. The estimate is dependent on drought declarations and the demand for drought assistance.
Category 11 Grazing and Primary Production landholders under the Land Act 1994 will also be eligible to a rent rebate in 2019-20. The rebate is available to lessees, other than those on minimum rent that are in a drought declared LGA and to individually drought declared properties. In addition to this rebate, drought declared landholders will be granted a hardship deferral for required rent payments.
Origin Energy – Uniform Tariff Policy
The Origin Energy – Uniform Tariff Policy ensures that, where possible, all Queensland non-market electricity customers of a similar type pay the similar price for electricity regardless of where they live. Origin Energy retails electricity to approximately 5,450 Queensland non-market customers in the Goondiwindi, Texas and Inglewood areas who are supplied electricity through the New South Wales (NSW) Essential Energy distribution network.
The Government provides a rebate to these customers, via a CSO payment to Origin Energy, to ensure they pay no more for electricity than similar customers in Queensland. Therefore, the CSO amount depends on the relative difference between Queensland and New South Wales retail electricity tariffs for non-market customers.
Solar for Rental Property Rebate
The $3.58 million solar for rentals trial is an initiative of the government’s affordable energy plan. It aims to help landlords and tenants share the value of installing solar systems. As part of the trial, around 1,000 rebates of up to $3,500 are available for eligible landlords to install solar and monitoring at their rental properties in the Bundaberg, Gladstone and Townsville local government areas.
192
Budget Strategy and Outlook 2019-20
Sunwater Rural Irrigation Water Price Subsidy
Sunwater owns and operates water supply schemes across regional Queensland. As the owner of Sunwater, the Government decides how much to recover of Sunwater’s costs through irrigation prices. Currently, Sunwater’s irrigation water prices for some schemes are set below the level necessary to recover the cost of supplying water to the irrigators.
Government funding is provided to Sunwater to offset the reduced revenue and to ensure that increases in water prices paid by rural irrigation customers to recover costs are gradual.
Cloncurry Pipeline Water Supply Subsidy
North West Queensland Water Pipeline Limited (NWQWP), a Sunwater Limited (Sunwater) subsidiary, owns and operates the Cloncurry Pipeline between the Ernest Henry Mine and Cloncurry. The pipeline guarantees Cloncurry Shire Council’s long-term water supply and supports industrial development in the region. As the construction and operation of the Cloncurry Water Pipeline is a non-commercial investment, the Government provides funding to NWQWP to ensure that Sunwater receives a return on its investment in the pipeline.
Extending existing drought relief arrangements – Electricity Charge Scheme
Drought Relief Arrangements provide relief to farming customers from fixed charges for electricity accounts that are used to pump water for farm or irrigation purposes during periods of drought. The concessions can vary depending on the shires that are drought declared and the number of eligible customers.
Seqwater Bulk Water Rural Irrigation Water Price Subsidy
Seqwater owns and operates water supply schemes across South East Queensland which also supply bulk water services to rural irrigation customers. Currently Seqwater’s rural irrigation prices for some schemes are set below the level necessary to recover the cost of supplying water to the irrigators. Government funding is provided to Seqwater to offset the reduced revenue and to ensure that increases in water prices paid by rural irrigation customers to recover costs are gradual.
193
Budget Strategy and Outlook 2019-20
| Table A.2.9 | Department of Transport and Main Roads |
| | | | | | | | |
Concession | | 2018-19
Est. Act.
$ million | | | 2019-20
Estimate
$ million | |
General Public Transport Concessions (South East Queensland)1 | | | 1,433.3 | | | | 1,410.5 | |
Rail Network and Infrastructure Funding | | | 684.6 | | | | 700.4 | |
General Public Transport Concessions (Regional Queensland) | | | 256.1 | | | | 270.7 | |
Vehicle and boat registration concessions2 | | | 175.9 | | | | 185.1 | |
School Transport Assistance Scheme | | | 137.1 | | | | 139.0 | |
TransLink Transport Concessions (South East Queensland) | | | 78.4 | | | | 83.4 | |
Rail Concession Scheme | | | 37.4 | | | | 38.5 | |
Livestock and Regional Freight Contracts | | | 37.2 | | | | 37.4 | |
Other transport concessions (Regional Queensland) and taxi subsidies | | | 27.2 | | | | 25.4 | |
Mount Isa Line Below Rail subsidy | | | — | | | | 20.0 | |
Practical Driving Test | | | 3.8 | | | | 3.9 | |
Designated Public Transport Concessions for Seniors Card Holders | | | 3.8 | | | | 3.9 | |
Total | | | 2,874.8 | | | | 2,918.2 | |
Notes:
| 1. | The decrease is due to the continuing negotiations for a new contract with Transport for Brisbane (TfB) and an increase in fare revenue. |
| 2. | The increase is due to the increasing number of vehicles and boats becoming eligible for concessions as the population ages and the value of the concession. |
General Public Transport Concessions (South East Queensland)
The General Public Transport Concessions (South East Queensland) represents the direct funding contribution that Government makes towards the cost of operating public transport services within South East Queensland. This contribution effectively reduces the ticket price paid by all public transport users on bus, rail and ferry services, increasing the affordability of these services.
Rail Network and Infrastructure Funding
Rail network and infrastructure funding ensures that the State supported rail network is safe, reliable and fit for purpose. The contract also provides funding to Queensland Rail to support major capital projects and related asset strategies. The funding provided via this contract directly benefits customers of the State supported rail network, including both freight and passengers. Without this funding, rail access charges (including public transport fares) would be significantly higher for all users of the rail network.
194
Budget Strategy and Outlook 2019-20
General Public Transport Concessions (Regional Queensland)
The General Public Transport Concessions (Regional Queensland) represents the financial contribution that Government provides across a range of transport services in regional Queensland. The impact of this contribution benefits all public transport users through reduced transport fares. This concession covers:
| • | | TravelTrain (excluding the ‘Rail Concession Scheme’ for eligible pensioners, veterans and seniors) |
| • | | subsidies for Kuranda Scenic Railway |
| • | | subsidies for Heritage Rail Services |
| • | | subsidies for regional bus and ferry operators (excluding concessional top up amounts and School Transport Assistance Scheme related amounts) |
| • | | subsidies for the Rail XPT Service (Sydney-Brisbane) and Savannahlander (Atherton Tableland) |
| • | | subsidies for air services to remote and rural communities within the State |
| • | | subsidies for long distance coach services to rural/remote communities within the State. |
Vehicle and boat registration concessions
Registration concessions for light and heavy motor vehicles and recreational boats are provided to holders of the Pensioner Concession Card, Queensland Seniors Card and to those assessed by the Department of Veterans’ Affairs as meeting the necessary degree of incapacity or impairment. The concession is aimed at improving access to travel for pensioners, seniors and persons with a disability by providing a reduced rate of registration fees. For most eligible card holders, a concession for a family 4-cylinder vehicle would reduce the 12 month registration charge from $328.60 to $164.30. For a recreational boat, up to and including 4.5 metres in length, the concession reduces the registration charge from $88.70 to $44.35 (based on registration charges at 1 July 2019).
A Special Interest Vehicle (SIV) registration concession is offered for motor vehicles that have low use associated with vintage and historic and street rod car club events. A 12 month registration for a 6-cylinder SIV concession reduces registration from $520.30 to $92.60. A concession is also available for specific purposes such as water, mineral or oil exploration and bee keeping. Other motor vehicle registration concessions are also provided to primary producers, local governments, charitable and community service organisations, and people living in remote areas without access to the wider road network. Other vessel registration concessions may be provided to accredited surf lifesaving clubs and schools.
195
Budget Strategy and Outlook 2019-20
School Transport Assistance Scheme
The School Transport Assistance Scheme assists students that do not have a school in their local area or who are from defined low income groups with travel costs. The scheme provides funding to reduce the cost of travelling to school on bus, rail and/or ferry services, with allowances for private vehicle transport in certain circumstances. A typical concession would be to fully fund the cost of travel from home to the nearest State primary or high school where no local primary or high school is available (for example, from Bargara to Bundaberg High School).
TransLink Transport Concessions (South East Queensland)
The TransLink Transport Concessions (South East Queensland) are provided by the Government to ensure access and mobility for Queenslanders who require assistance because of age, disability or fixed low income. Passengers entitled to receive public transport concessions include holders of a Pensioner Concession Card, Veterans’ Affairs Gold Card, Seniors Card (all states and territories), Companion Card, Vision Impairment Travel Pass, Total Permanent Incapacitated (TPI) Veteran Travel Pass, children, secondary and tertiary students, Newstart and Youth Allowance (Job Seeker) recipients, asylum seekers and White Card Holders. Under the new 2019 fares, for a peak one zone journey using a go card, the concession will reduce an adult fare from $3.31 to $1.66.
Rail Concession Scheme
The Queensland Rail Concession Scheme improves the affordability of long distance and urban rail services for eligible pensioners, veterans, seniors and current/past rail employees with 25 years of service. Assistance for long distance rail services is provided through discounted fares and free travel vouchers. For TravelTrain (long distance rail) services, depending on the service, the concession may be for free travel for up to four trips per year for Queensland pensioners (subject to availability of seats and payment of an administration fee).
Livestock and Regional Freight Contracts
The Livestock and Regional Freight Contracts provide funding to support the movement of cattle (via rail only) and freight (via road and rail) to and from regional areas of Queensland. The funding provided directly benefits the cattle industry and enables regional Queensland communities to maintain employment and directly benefits those communities who are reliant on rail freight services by reducing the cost of these freight services for users.
196
Budget Strategy and Outlook 2019-20
Other transport concessions (Regional Queensland) and taxi subsidies
Other transport concessions (Regional Queensland) and taxi subsidies are provided by the Government to ensure access and mobility for Queenslanders who require assistance because of age, disability or fixed low income. Passengers entitled to receive public transport concessions include holders of a Pensioner Concession Card, Veterans’ Affairs Gold Card, Seniors Card (all states and territories), Companion Card, Vision Impairment Travel Pass, TPI Veteran Travel Pass, children, secondary and tertiary students, Newstart and Youth Allowance (Job Seeker) recipients, asylum seekers and White Card holders. The Taxi Subsidy Scheme aims to improve the mobility of persons with severe disabilities by providing a 50% concession fare up to a maximum subsidy of $25 per trip.
Practical Driving Test
As part of the State’s driver licensing arrangements, applicants for new licences are required to undertake a practical driving test. The total cost to pre-book driver examinations and to perform the practical driver assessment is not fully recovered by the fee charged ($53.82 (ex GST) as at 1 July 2019), providing a direct concession to applicants.
Mount Isa Line Below Rail Subsidy
In recognition of the importance the Mount Isa Line plays in facilitating the transportation of the freight task from pit to port, the Queensland Government will introduce a $20M per annum Transport Services Contract payment for this freight line.
This payment will be to reduce below rail access costs for users and further promote rail for freight, as well as support continued development of the North West Minerals Province.
Designated Public Transport Concessions for Seniors Card Holders
Designated Public Transport Concessions for Seniors Card Holders allows visitors from interstate, who hold a state or territory Seniors Card, to access public transport concessions within Queensland and is fully funded by the Queensland Government.
197
Budget Strategy and Outlook 2019-20
| Table A.2.10 | Queensland Fire and Emergency Services |
| | | | | | | | |
Concession | | 2018-19
Est. Act.
$ million | | | 2019-20
Estimate
$ million | |
Emergency Management Levy Concession | | | 9.9 | | | | 10.3 | |
Total | | | 9.9 | | | | 10.3 | |
Emergency Management Levy Concession
The Emergency Management Levy applies to all prescribed properties within Queensland. The levy provides a funding base for emergency services including emergency management, fire and rescue services. Owners of prescribed properties who are in receipt of an Australian Government pension are eligible to receive a discount of 20% on the levy payable for a property that is their principal place of residence. In addition, community organisation owners of specified properties are exempt from payment of the levy.
| Table A.2.11 | Queensland Health |
| | | | | | | | |
Concession | | 2018-19
Est. Act.
$ million | | | 2019-20
Estimate
$ million | |
Oral Health Scheme | | | 163.6 | | | | 163.6 | |
Patient Travel Subsidy Scheme | | | 90.2 | | | | 92.5 | |
Medical Aids Subsidy Scheme1 | | | 35.9 | | | | 27.4 | |
Spectacle Supply Scheme | | | 9.3 | | | | 9.3 | |
Community Aids Equipment, Assistive Technologies Initiative and Vehicle Options Subsidy Scheme2 | | | 9.0 | | | | — | |
Total | | | 308.0 | | | | 292.8 | |
Notes:
| 1. | The 2019-20 estimate is lower than the 2018-19 estimated actual as funding of activity for NDIS eligible applicants is transferred to the NDIS. |
| 2. | CAEATI and VOSS stopped receiving applications from 1 October 2018 in preparation of full transition of clients to the NDIS. |
Oral Health Scheme
The Oral Health Scheme provides free dental care to eligible clients and their dependants who possess a current Health Care Card, Pensioner Concession Card, Queensland Seniors Card or Commonwealth Seniors Card. The average value of a course of treatment for eligible clients is approximately $600 for general care, $1,600 for treatment involving dentures, and $250 for emergency dental care. In rural and remote areas where no private dental practitioner exists, access to dental care for the general public is provided at a concessional rate, generally 15% to 20% less than average private dental fees.
198
Budget Strategy and Outlook 2019-20
Patient Travel Subsidy Scheme
The Patient Travel Subsidy Scheme (PTSS) provides financial assistance to patients travelling for specialist medical services that are not available locally. The PTSS provides a financial subsidy toward the cost of travel and accommodation for patients and, in some cases, an approved escort when patients are required to travel more than 50 kilometres from their nearest public hospital or public health facility to access specialist medical services.
Patients receive fully subsidised commercial transport for the most clinically appropriate cost-effective mode or will be subsidised at the economy/government discount rate (less GST). A mileage subsidy rate of 30 cents per kilometre is paid where patients travel by private car. Accommodation subsidies are $60 per person per night, for the patient and approved escort if they stay in commercial accommodation, or a subsidy of $10 per person per night if staying with family or friends.
Medical Aids Subsidy Scheme
The Medical Aids Subsidy Scheme (MASS) provides access to subsidy funding assistance for the provision of a range of aids and equipment to eligible Queensland residents with permanent and established conditions or disabilities. Aids and equipment are provided primarily to assist people to live at home therefore avoiding premature or inappropriate residential care or hospitalisation.
Subsidies vary based on service category and clinical criteria and are provided to assist with the costs of communication aids, continence aids, daily living aids, medical grade footwear, mobility aids, orthoses and oxygen. The scheme provided over 63,000 occasions of service to approximately 54,000 clients during 2018-19.
The NDIS is currently being rolled out in Queensland. MASS clients who are NDIS eligible are being transitioned to the scheme with associated funding progressively cashed out to the NDIS. As the NDIS is rolled out, it is assuming responsibility for the provision of necessary supports for eligible Queenslanders, including medical aids and equipment. The transition point from state funded to NDIS is the implementation of an NDIS plan or when an area has been classified as fully transitioned.
Spectacle Supply Scheme
The Spectacle Supply Scheme provides eligible Queensland residents with free access to a comprehensive range of basic spectacles every two years including bifocals and trifocals. Applicants must be holders of eligible concession cards and be deemed by a prescriber to have a clinical need for spectacles.
The scheme provides around 82,000 items each year to approximately 72,000 clients (some clients require more than one pair of spectacles due to clinical need). The average cost of services provided to applicants is approximately $114.60 per item, including the costs of administering the scheme through the Medical Aids Subsidy Scheme.
199
Budget Strategy and Outlook 2019-20
Community Aids Equipment, Assistive Technologies Initiative and Vehicle Options Subsidy Scheme
The Community Aids Equipment and Assistive Technologies Initiative (CAEATI) and Vehicle Options Subsidy Scheme (VOSS) provide financial assistance to eligible Queensland residents to support them to be more independent, participate further in social and economic opportunities in the community and contribute to a better quality of life.
CAEATI funding is capped at $10,000 per client over a three-year period. CAEATI includes aids, equipment and assistive technologies for postural support, communication support, community mobility and active participation.
VOSS funding is capped at $10,000 per client over a five-year period. VOSS provides subsidies for a range of vehicle access options, including the subsidy of driving lessons on a suitably modified vehicle, modifications to a vehicle, purchase of a suitably modified vehicle or vehicle suitable for modification.
To receive funding through either of these schemes, an individual must be assessed as eligible for specialist disability support under the Disability Support Act 2006. Queensland resident eligibility is determined during the intake process, and confirmed as part of the assessment process.
The NDIS is currently being rolled out in Queensland. CAEATI and VOSS clients who are NDIS eligible are being transitioned to the scheme with associated funding progressively cashed out to the NDIS.
CAEATI and VOSS stopped receiving applications from 1 October 2018 in preparation of full transition of clients to the NDIS.
200
Budget Strategy and Outlook 2019-20
A.3 Concessions by entity – Government-owned corporations
| Table A.3.1 | Energy Queensland |
| | | | | | | | |
Concession | | 2018-19
Est. Act.
$ million | | | 2019-20
Estimate
$ million | |
Regulated Service Charges - Energex | | | 17.8 | | | | 17.0 | |
Regulated Service Charges - Ergon Energy | | | 7.8 | | | | 8.5 | |
Total | | | 25.6 | | | | 25.5 | |
Regulated Service Charges – Energex
Under Schedule 8 of the Electricity Regulation 2006, charges for a range of services provided by Energex Limited (Energex) to energy retailers, for example disconnection and reconnection of supply, are capped. The maximum amount Energex is able to charge for these services is, on average, less than the value which the Australian Energy Regulator ascribes to the provision of these services by Energex, resulting in a concession provided to energy retailers and in turn, to households.
Regulated Service Charges – Ergon Energy
Under Schedule 8 of the Electricity Regulation 2006, service charges for a range of services provided by Ergon Energy Corporation Limited (Ergon Energy) to energy retailers, for example disconnection and reconnection of supply, are capped. The maximum amount Ergon Energy is able to charge for these services is, on average, less than the value which the Australian Energy Regulator ascribes to the provision of these services by Ergon Energy, resulting in a concession provided to energy retailers and in turn, to households.
| Table A.3.2 | Gladstone Ports Corporation Limited |
| | | | | | | | |
Concession | | 2018-19
Est. Act.
$ million | | | 2019-20
Estimate
$ million | |
Concessional Port Charges | | | 43.7 | | | | 42.9 | |
Total | | | 43.7 | | | | 42.9 | |
Concessional Port Charges
The Gladstone Ports Corporation Limited (GPC) is subject to a number of long-term major industry contracts where port charges are significantly lower than market rates. These historical contracts were entered into to support various industries and government initiatives from time to time. The amounts shown are estimates of the revenue foregone by GPC as a result of being unable to charge commercial rates.
201
Budget Strategy and Outlook 2019-20
| Table A.3.3 | Sunwater Limited |
| | | | | | | | |
Concession | | 2018-19
Est. Act.
$ million | | | 2019-20
Estimate
$ million | |
Water Supply Contracts | | | 49.4 | | | | 50.2 | |
Total | | | 49.4 | | | | 50.2 | |
Water Supply Contracts
Sunwater Limited has a number of historic non-commercial water supply contracts that benefit specific entities (including local governments). The amount shown represents the difference between the estimated revenue under these contracts and that which could be recovered under a full cost allocation model. Sunwater is continuing to work together with stakeholders to agree new arrangements for water supply.
| Table A.3.4 | Concessional Leases (Industry, Commercial and Community) by entity |
| | | | | | | | |
Concession | | 2018-19
Est. Act.
$ million | | | 2019-20
Estimate
$ million | |
Far North Queensland Ports Corporation Limited | | | 0.9 | | | | 0.8 | |
Gladstone Ports Corporation Limited | | | 3.3 | | | | 2.9 | |
North Queensland Bulk Ports Corporation Limited | | | 1.7 | | | | 1.7 | |
Port of Townsville Limited | | | 5.9 | | | | 6.0 | |
Queensland Rail Limited | | | 1.9 | | | | 2.0 | |
Total | | | 13.7 | | | | 13.4 | |
Concessional Leases (Industry, Commercial and Community)
The above government-owned corporation entities provide leases to various community organisations, local councils, Government departments and industry participants at below commercial rates. The amounts shown are estimates of the revenue foregone by not charging commercial rates.
202
Budget Strategy and Outlook 2019-20
| Appendix B: | Tax expenditure statement |
Context
Governments employ a range of policy tools to achieve social and economic objectives. These include the use of direct budgetary outlays, regulatory mechanisms and taxation. This Tax Expenditure Statement (TES) details revenue foregone as a result of Government decisions relating to the provision of tax exemptions or concessions. The TES is designed to improve transparency in the use of tax expenditures and increase public understanding of the fiscal process.
Tax expenditures are reductions in tax revenue that result from the use of the taxation system as a policy tool to deliver Government policy objectives. Tax expenditures are provided through a range of measures, including:
| • | | the application of reduced tax rates to certain groups or sectors of the community |
| • | | provisions which defer payment of a tax liability to a future period. |
Labelling an exemption or concession as a tax expenditure does not necessarily imply any judgement as to its appropriateness. It merely makes the amount of the exemption or concession explicit and thereby facilitates its scrutiny as part of the annual Budget process.
Methodology
Revenue foregone approach
The method used almost exclusively by governments to quantify the value of their tax expenditures is the revenue foregone approach. This method estimates the revenue foregone through use of the concession by applying the benchmark rate of taxation to the volume of activities or assets affected by the concession. One of the deficiencies of the revenue foregone approach is that the effect on taxpayer behaviour resulting from the removal of the particular tax expenditure is not factored into the estimate. Consequently, the aggregation of costings for individual tax expenditure items presented in the TES will not necessarily provide an accurate estimate of the total level of assistance provided through tax expenditures.
Measuring tax expenditures requires the identification of:
| • | | concessionally taxed components of the benchmark tax base such as a specific activity or class of taxpayer |
| • | | a benchmark tax rate to apply to the concessionally taxed components of the tax base. |
203
Budget Strategy and Outlook 2019-20
Defining the tax benchmark
The most important step in the preparation of a TES is the establishment of a benchmark for each tax included in the statement. The benchmark provides a basis against which each tax concession can be evaluated. The aim of the benchmark is to determine which concessions are tax expenditures as opposed to structural elements of the tax. The key features of a tax benchmark are:
| • | | any specific accounting conventions applicable to the tax |
| • | | the deductibility of compulsory payments |
| • | | any provisions to facilitate administration |
| • | | provisions relating to any fiscal obligations. |
By definition, tax expenditures are those tax concessions not included as part of the tax benchmark.
Identification of benchmark revenue bases and rates requires a degree of judgement and is not definitive. Furthermore, data limitations mean that the tax expenditures are approximations and are not exhaustive. This statement does not include estimates of revenue foregone from exemptions or concessions provided to Government agencies. Very small exemptions or concessions are also excluded.
The Tax Expenditure Statement
This year’s statement includes estimates of tax expenditures in 2017-18 for payroll tax, land tax, duties and gambling taxes. A summary of the major tax expenditures valued on the basis of revenue foregone is presented in Table B.1. Not all expenditures can be quantified at this time. Accordingly, the total value of tax expenditures should be considered as indicative only.
204
Budget Strategy and Outlook 2019-20
| Table B.1 | Tax expenditure summary1 |
| | | | | | | | |
| | | 2017-182
$ million | | | 2018-19
$ million | |
Payroll Tax | | | | | | | | |
Exemption threshold | | | 1,377 | | | | 1,373 | |
Deduction scheme | | | 357 | | | | 381 | |
Section 14 exemptions | | | | | | | | |
Local Government | | | 145 | | | | 149 | |
Education | | | 196 | | | | 201 | |
Hospitals | | | 422 | | | | 451 | |
Total Payroll Tax | | | 2,497 | | | | 2,554 | |
Land Tax | | | | | | | | |
Liability thresholds3 | | | 752 | | | | 781 | |
Graduated land tax scale | | | 719 | | | | 1,308 | |
Primary production deduction | | | 94 | | | | 105 | |
Part 6 Divisions 2 and 3 exemptions not included elsewhere4 | | | 147 | | | | 171 | |
Land developers’ concession | | | 12 | | | | 14 | |
Total Land Tax | | | 1,724 | | | | 2,379 | |
Duties | | | | | | | | |
Transfer duty on residential property | | | | | | | | |
Home concession | | | 407 | | | | 388 | |
First home concession | | | 219 | | | | 207 | |
First home vacant land | | | 32 | | | | 21 | |
Insurance duty | | | | | | | | |
WorkCover | | | 58 | | | | 68 | |
Health insurance | | | 437 | | | | 452 | |
Total Duties | | | 1,152 | | | | 1,137 | |
Taxes on Gambling | | | | | | | | |
Gaming machine taxes | | | 115 | | | | 125 | |
Casino taxes | | | 9 | | | | 8 | |
Total Gambling Tax | | | 124 | | | | 133 | |
Total | | | | | | | | |
Notes:
| 1. | Numbers may not add due to rounding. |
| 2. | 2017-18 estimates may have been revised since the 2018-19 Budget. |
| 3. | Land tax is payable only on the value of taxable land above a threshold which depends on the ownership structure. |
| 4. | Applicable, but not limited, to religious bodies, public benevolent institutions and other exempt charitable institutions. |
205
Budget Strategy and Outlook 2019-20
Discussion of individual taxes
Payroll tax
The benchmark tax base for payroll tax is assumed to be all taxable wages, salaries and supplements (including employer superannuation contributions) paid in Queensland, as defined in the Payroll Tax Act 1971. The benchmark tax rate for payroll tax is assumed to be the statutory rate applying in each financial year.
Payroll tax exemption threshold
Employers who employ in Queensland with an annual Australian payroll of $1.1 million or less are exempt from payroll tax. On the basis of December 2018 quarter average weekly adult total earnings, this threshold corresponded to approximately 13 full-time equivalent employees. This exemption is designed to assist small and medium sized businesses. From 1 July 2019, the exemption threshold will be increased to $1.3 million in annual Australian wages.
Deduction scheme
Employers who employed in Queensland with Australian payrolls between $1.1 million and $5.5 million benefited from a deduction of $1.1 million, which reduced by $1 for every $4 by which the annual payroll exceeded $1.1 million. The deduction is pro-rated for interstate wages. There was no deduction for employers or groups that had an annual payroll in excess of $5.5 million. From 1 July 2019, the deduction will apply between annual Australian payrolls of $1.3 million and $6.5 million.
Section 14 exemptions
A number of organisations are provided with exemptions from payroll tax under Section 14 of the Payroll Tax Act 1971. The activities for which estimates have been calculated are wages paid by public hospitals, non-tertiary private educational institutions and local governments (excluding commercial activities).
Land tax
The benchmark tax base is assumed to be all freehold land within Queensland, excluding residential land used as a principal place of residence and land owned by individuals with a value for that year below the threshold. The benchmark tax rate for land tax is assumed to be the top rate of land tax applicable in Queensland in each financial year.
Liability thresholds
Land tax is payable on the value of taxable land equal to or above a threshold which depends on the land’s ownership. The threshold for companies, trusts and absentees is $350,000 and for resident individuals the threshold is $600,000.
206
Budget Strategy and Outlook 2019-20
Land owned by resident individuals as their principal place of residence is excluded from the estimate. The exemption from paying below a minimum amount is not included as a tax expenditure as it is regarded as the application of an administration threshold.
Graduated land tax scale
A graduated (concessional) scale of land tax rates is applicable to land with a taxable value of less than $5 million for resident individuals and companies, trustees and absentees.
The benchmark rates used for estimating the tax expenditures were 1.75% for individuals and 2% for companies, trustees and absentees.
Primary production deduction
The taxable value of land owned by a resident individual, trustee or some absentees and companies does not include all or part of their land that is used for the business of agriculture, pasturage or dairy farming.
Part 6 Divisions 2 and 3 exemptions (not elsewhere included)
A number of land tax exemptions are granted in Part 6 Divisions 2 and 3 of the Land Tax Act 2010 to eligible organisations. These include, but are not limited to, public benevolent institutions, religious institutions and other exempt charitable institutions, retirement villages, trade unions and showgrounds.
Land developers’ concession
Land tax payable by land developers is calculated on the basis that the unimproved value of (undeveloped) land subdivided in the previous financial year and which remains unsold at 30 June of that year is 60% of the Valuer-General’s value. This concession is outlined in Section 30 of the Land Tax Act 2010.
Duties
Home concession
A concessional rate of duty applies to purchases of a principal place of residence. A 1% concessional rate applies on dutiable values up to $350,000, rather than the normal schedule of rates between 1.5% and 3.5%. For properties valued over $350,000, the scheduled rates of transfer duty apply on the excess.
First home concession
Where a purchaser has not previously owned a residence in Queensland or elsewhere, the purchaser of a home receives a more generous concession on duty. This concession comprises a rebate in addition to the home concession on properties (this concession may not be applicable if the purchase price is less than the full market value of the property). The size of the rebate depends on the value of the property. A full concession is provided to purchases of a first principal place of residence valued up to $500,000.
207
Budget Strategy and Outlook 2019-20
First home vacant land concession
A first home concession is available for the purchase of certain vacant land up to the value of $400,000, with a full concession available on certain vacant land up to the value of $250,000.
Insurance duty
The benchmark tax base is assumed to be all premiums for general insurance policies (not for life insurance). The benchmark tax scale is assumed to be the scale that actually applied in each financial year.
Gambling taxes
Gaming machine tax concessions for licensed clubs
The benchmark tax base is assumed to be all gaming machines operated by licensed clubs and hotels in Queensland. The benchmark tax rate is assumed to be the highest marginal tax rate (as is applied to hotels) that actually applied in each financial year.
A progressive tax rate scale applies to gaming machines operated by licensed clubs. The tax rate is calculated monthly on the gaming machine taxable metered win and the top tax rate is only applied to the portion of gaming machine revenue where the monthly metered win exceeds $1.4 million for any licensed club.
Casino tax concessions
The benchmark tax base is assumed to be all casinos operating in Queensland. The benchmark tax rate is assumed to be the highest tax rate that is actually applied in each financial year.
A tax rate of 20% of gross revenue applies for standard transactions in the Brisbane and Gold Coast casinos. A concessional tax rate of 10% applies for gross revenue from standard transactions in the Cairns and Townsville casinos. The tax rate applicable to gaming machines in casinos is 30% of gross revenue in the Brisbane and Gold Coast casinos and 20% in the Cairns and Townsville casinos.
In addition, concessional rates of 10% also apply for revenue from high rollers table game play in all casinos. A goods and services tax (GST) credit is provided to casinos that approximates a reduction in the above tax rates of 9.09%
Queensland Waste Levy
The Queensland Waste Levy will commence on 1 July 2019 at $75 per tonne (higher for regulated wastes). The levy is payable on waste disposed to landfill, except waste generated and disposed in the non-levy zone.
208
Budget Strategy and Outlook 2019-20
Levy exemptions of 100% are available on application for different wastes, such as waste from charitable recycling organisations and community clean-up events. Levy discounts of 50% are available on application for residue wastes from particular recycling activities. General levy exemptions exist for other wastes, such as those from declared disasters and severe local weather events. Seventy per cent of proceeds from the waste levy will be used for waste programs, environmental priorities and community purposes.
209
Budget Strategy and Outlook 2019-20
| Appendix C: | Revenue and expense assumptions and sensitivity analysis |
The Queensland Budget, like those of other jurisdictions, is based in part on assumptions made about parameters that are uncertain, both internal and external to the State, which can impact directly on economic and fiscal forecasts.
This appendix outlines the assumptions underlying the revenue and expense estimates and analyses the sensitivity of the estimates to changes in the economic and other assumptions. This analysis is provided to enhance the level of transparency and accountability of the Government.
The forward estimates in the Budget are framed on a no policy change basis. That is, the expenditure and revenue policies in place at the time of the Budget (including those announced in the Budget) are applied consistently throughout the forward estimates period.
The following discussion provides details of some of the key assumptions, estimates and risks associated with revenue and expenditure and, where a direct link can be established, the indicative impact on forecasts resulting from a movement in those variables.
| Table C.1 | Taxation and royalty revenue1 |
| | | | | | | | | | | | | | | | | | | | | | | | |
| | | 2017-18
Actual
$ million | | | 2018-19
Est. Act.
$ million | | | 2019-20
Budget
$ million | | | 2020-21
Projection
$ million | | | 2021-22
Projection
$ million | | | 2022-23
Projection
$ million | |
Payroll tax | | | 3,906 | | | | 4,158 | | | | 4,284 | | | | 4,435 | | | | 4,728 | | | | 5,107 | |
Transfer duty | | | 3,023 | | | | 3,049 | | | | 3,038 | | | | 3,205 | | | | 3,383 | | | | 3,578 | |
Other duties | | | 1,474 | | | | 1,549 | | | | 1,624 | | | | 1,704 | | | | 1,787 | | | | 1,873 | |
Gambling taxes and levies | | | 1,190 | | | | 1,331 | | | | 1,410 | | | | 1,466 | | | | 1,526 | | | | 1,588 | |
Land tax | | | 1,180 | | | | 1,331 | | | | 1,589 | | | | 1,670 | | | | 1,744 | | | | 1,807 | |
Motor vehicle registration | | | 1,770 | | | | 1,847 | | | | 1,908 | | | | 1,977 | | | | 2,049 | | | | 2,124 | |
Other taxes | | | 701 | | | | 740 | | | | 1,310 | | | | 1,320 | | | | 1,383 | | | | 1,447 | |
Total taxation revenue | | | 13,244 | | | | 14,005 | | | | 15,164 | | | | 15,777 | | | | 16,601 | | | | 17,525 | |
Royalties | | | | | | | | | | | | | | | | | | | | | | | | |
Coal | | | 3,737 | | | | 4,363 | | | | 4,339 | | | | 3,461 | | | | 3,468 | | | | 3,604 | |
Petroleum2 | | | 187 | | | | 450 | | | | 577 | | | | 620 | | | | 638 | | | | 630 | |
Other royalties3 | | | 372 | | | | 389 | | | | 538 | | | | 520 | | | | 522 | | | | 510 | |
Land rents | | | 162 | | | | 163 | | | | 168 | | | | 169 | | | | 172 | | | | 174 | |
Total royalties and land rents | | | 4,457 | | | | 5,364 | | | | 5,621 | | | | 4,770 | | | | 4,799 | | | | 4,918 | |
Notes:
| 1. | Numbers may not add due to rounding. |
| 2. | Includes impact of liquefied natural gas (LNG). |
| 3. | Includes base and precious metal and other mineral royalties. |
210
Budget Strategy and Outlook 2019-20
Taxation revenue assumptions and revenue risks
The rate of growth in tax revenues is dependent on a range of factors that are linked to the rate of growth in economic activity in the State. Some taxes are closely related to activity in specific sectors of the economy, whilst others are broadly related to the general rate of economic growth, employment, inflation and wages. A change in the level of economic activity, resulting from economic growth differing from forecast levels, would impact upon a broad range of taxation receipts.
Wages and employment growth – payroll tax collections
Wages and employment growth have a direct impact on payroll tax collections. The Budget assumptions are for an increase in wages of 21⁄4% and an increase in employment of 11⁄4% in 2019-20. The composition of the payroll tax base is also important as businesses in fast growing sectors such as tourism, retail and hospitality are often outside the tax base because they are below the threshold. A one percentage point variation in either Queensland wages growth or employment would change payroll tax collections by approximately $43 million in 2019-20.
Transfer duty estimates
Transfer duty collections in 2019-20 are expected to decrease by 0.3% on the 2018-19 estimated actual. This decrease is driven by a decline in the volume of residential property transactions, particularly for investors
Across the forward estimates period, annual average growth of around 4.1% is expected in both the residential and non-residential components of transfer duty.
A one percentage point variation in either the average value of property transactions or the volume of transactions would change transfer duty collections by approximately $30 million in 2019-20.
211
Budget Strategy and Outlook 2019-20
Royalty assumptions and revenue risks
| Table C.2 | Coal royalty assumptions |
| | | | | | | | | | | | | | | | | | | | |
| | | 2018-19 | | | 2019-20 | | | 2020-21 | | | 2021-22 | | | 2022-23 | |
| | | Est. Act. | | | Budget | | | Projection | | | Projection | | | Projection | |
Tonnages - crown export1 coal (Mt) | | | 213 | | | | 220 | | | | 224 | | | | 229 | | | | 237 | |
Exchange rate US$ per A$2 | | | 0.72 | | | | 0.72 | | | | 0.73 | | | | 0.73 | | | | 0.73 | |
Year average coal prices (US$ per tonne)3 | | | | | | | | | | | | | | | | | | | | |
Hard coking | | | 206 | | | | 179 | | | | 153 | | | | 150 | | | | 150 | |
Semi-soft | | | 153 | | | | 138 | | | | 121 | | | | 118 | | | | 118 | |
Thermal | | | 106 | | | | 93 | | | | 86 | | | | 84 | | | | 84 | |
Year average oil price | | | | | | | | | | | | | | | | | | | | |
Brent ($US per barrel)4 | | | 69 | | | | 69 | | | | 68 | | | | 67 | | | | 66 | |
Notes:
| 1. | Excludes coal produced for domestic consumption and coal where royalties are not paid to the Government, i.e. private royalties. 2019-20 estimate for domestic coal volume is approximately 24.7 Mt and private coal is 9.4 Mt. |
| 3. | Price for highest quality coking and thermal coal. Lower quality coal can be sold below this price with indicative average prices for 2019-20 as follows: Hard coking US$167/t and thermal US$76/t. |
| 4. | Published Brent oil prices are lagged by one quarter to better align with royalty revenue. |
Royalty Assumptions
Table C.2 provides the 2019-20 Budget assumptions regarding coal royalties, which represent the bulk of Queensland’s royalty revenue.
Exchange rate and commodity prices and volumes – royalties estimates
Estimates of mining royalties are sensitive to movements in the A$-US$ exchange rate and commodity prices and volumes. Contracts for the supply of commodities are generally written in US dollars. Accordingly, a change in the exchange rate impacts on the Australian dollar price of commodities and therefore expected royalties collections.
Coal
For each one cent movement in the A$-US$ exchange rate, the impact on royalty revenue would be approximately $74 million in 2019-20.
A 1% variation in export coking and thermal coal volumes would lead to a change in royalty revenue of approximately $37 million. A 1Mt variation would lead to a change in royalty revenue of approximately $19 million.
212
Budget Strategy and Outlook 2019-20
A 1% variation in the average price of export coal would lead to a change in royalty revenue of approximately $54 million.
Parameters influencing Australian Government GST payments to Queensland
The Queensland Budget incorporates estimates of GST revenue grants to Queensland based on Australian Government estimates of national GST collections and Queensland Treasury assumptions of Queensland’s share. The estimates of collections are primarily determined by the value of consumption subject to GST.
Since the Australian Government payments are based on the amount actually collected, it is Queensland’s Budget that bears the risks of fluctuations in GST collections. As with all other tax estimates, there is a risk of lower collections than estimated if economic growth and consumption are weaker than expected.
Due to the complexities associated with the GST base, the information provided in the Australian Government Budget Papers is not sufficient to prepare indicative forecasts of the sensitivity of GST estimates to key variables.
Sensitivity of expenditure estimates and expenditure risks
Public sector wage costs
Salaries and wages form a large proportion of General Government Sector operating expenses. Increases in salaries and wages are negotiated through enterprise bargaining agreements.
The 2019-20 Budget and forward estimates reflect wage increases as per existing agreements and the Government’s wages policy where outcomes are yet to be finalised.
A general 1% increase in wage outcomes in one year would increase expenses by around $254 million in that year. The impact would compound and be much larger in the later years.
Interest rates
The General Government Sector has a total debt servicing cost estimated at $1.688 billion in 2019-20. The current average duration of General Government Sector debt is just over 5.5 years. The majority of General Government Sector debt is held under fixed interest rates and therefore the impact of interest rate variations on debt servicing costs in 2019-20 would be relatively modest, with the impact occurring progressively across the forward estimates.
Actuarial estimates of superannuation and long service leave
Liabilities for superannuation and long service leave are estimated by the State Actuary with reference to, among other things, assumed rates of investment returns, salary growth, inflation and discount rate. These liabilities are therefore subject to changes in these parameters. Similarly, the long service leave liabilities are subject to the risk that the actual rates of employee retention will vary from those assumed in the liability calculation.
213
Budget Strategy and Outlook 2019-20
| Appendix. D: | Fiscal Aggregates and Indicators |
Table D.1 Key Fiscal Aggregates1,
| | | | | | | | | | | | | | | | | | | | | | | | | | | | | | | | | | | | | | | | | | | | | | | | |
| | | 2011-12 | | | 2012-13 | | | 2013-14 | | | 2014-15 | | | 2015-16 | | | 2016-17 | | | 2017-18 | | | 2018-19 | | | 2019-20 | | | 2020-21 | | | 2021-22 | | | 2022-23 | |
| | | Actual2 | | | Actual2 | | | Actual2 | | | Actual2 | | | Actual2 | | | Actual2 | | | Actual2 | | | Revised | | | Budget | | | Projection | | | Projection | | | Projection | |
| | | $ million | | | $ million | | | $ million | | | $ million | | | $ million | | | $ million | | | $ million | | | $ million | | | $ million | | | $ million | | | $ million | | | $ million | |
General Government | | | | | | | | | | | | | | | | | | | | | | | | | | | | | | | | | | | | | | | | | | | | | | | | |
Total revenue | | | 45,801 | | | | 41,755 | | | | 46,705 | | | | 49,970 | | | | 50,780 | | | | 56,194 | | | | 58,087 | | | | 60,068 | | | | 60,387 | | | | 61,729 | | | | 63,583 | | | | 65,540 | |
Tax revenue | | | 10,608 | | | | 10,937 | | | | 11,840 | | | | 12,598 | | | | 12,547 | | | | 12,919 | | | | 13,244 | | | | 14,005 | | | | 15,164 | | | | 15,777 | | | | 16,601 | | | | 17,525 | |
Total expenses | | | 46,028 | | | | 46,313 | | | | 46,217 | | | | 49,551 | | | | 50,112 | | | | 53,369 | | | | 56,335 | | | | 59,226 | | | | 60,198 | | | | 61,416 | | | | 63,101 | | | | 64,753 | |
Employee expenses | | | 18,250 | | | | 18,130 | | | | 17,816 | | | | 18,592 | | | | 20,045 | | | | 21,258 | | | | 22,678 | | | | 24,096 | | | | 25,396 | | | | 25,728 | | | | 26,709 | | | | 27,724 | |
Net operating balance | | | (226 | ) | | | (4,558 | ) | | | 488 | | | | 420 | | | | 668 | | | | 2,825 | | | | 1,752 | | | | 841 | | | | 189 | | | | 313 | | | | 483 | | | | 787 | |
Capital purchases | | | 7,971 | | | | 7,001 | | | | 6,323 | | | | 4,635 | | | | 4,044 | | | | 4,620 | | | | 5,127 | | | | 6,060 | | | | 6,727 | | | | 7,125 | | | | 7,963 | | | | 6,179 | |
Net capital purchases | | | 5,241 | | | | 3,387 | | | | 3,085 | | | | 996 | | | | 1,163 | | | | 2,265 | | | | 2,339 | | | | 3,518 | | | | 3,716 | | | | 3,980 | | | | 4,763 | | | | 2,518 | |
Fiscal balance | | | (5,467 | ) | | | (7,944 | ) | | | (2,597 | ) | | | (576 | ) | | | (495 | ) | | | 560 | | | | (586 | ) | | | (2,677 | ) | | | (3,527 | ) | | | (3,667 | ) | | | (4,280 | ) | | | (1,731 | ) |
Borrowings with QTC | | | 28,391 | | | | 36,508 | | | | 39,864 | | | | 41,343 | | | | 34,200 | | | | 31,358 | | | | 29,256 | | | | 29,933 | | | | 32,781 | | | | 35,218 | | | | 40,174 | | | | 42,589 | |
Leases and similar arrangements3 | | | 1,126 | | | | 1,370 | | | | 1,503 | | | | 1,761 | | | | 1,286 | | | | 1,882 | | | | 2,152 | | | | 2,623 | | | | 5,824 | | | | 7,071 | | | | 6,943 | | | | 6,966 | |
Securities and Derivatives | | | 1 | | | | 1 | | | | 1 | | | | (0 | ) | | | (0 | ) | | | (0 | ) | | | 122 | | | | 122 | | | | 122 | | | | 122 | | | | 122 | | | | 122 | |
Net debt | | | (5,720 | ) | | | 2,466 | | | | 5,208 | | | | 5,749 | | | | 654 | | | | (355 | ) | | | (497 | ) | | | 1,661 | | | | 8,001 | | | | 12,306 | | | | 16,961 | | | | 19,562 | |
| | | | | | | | | | | | |
Non-Financial Public Sector | | | | | | | | | | | | | | | | | | | | | | | | | | | | | | | | | | | | | | | | | | | | | | | | |
Total revenue | | | 52,307 | | | | 49,181 | | | | 53,502 | | | | 56,178 | | | | 57,393 | | | | 64,855 | | | | 66,164 | | | | 67,699 | | | | 68,272 | | | | 69,542 | | | | 71,558 | | | | 74,040 | |
Capital purchases | | | 11,980 | | | | 10,774 | | | | 9,313 | | | | 7,811 | | | | 6,852 | | | | 7,291 | | | | 7,644 | | | | 8,856 | | | | 10,223 | | | | 10,447 | | | | 11,210 | | | | 8,640 | |
Borrowings with QTC | | | 60,205 | | | | 67,116 | | | | 70,668 | | | | 73,256 | | | | 71,160 | | | | 69,107 | | | | 66,964 | | | | 68,141 | | | | 71,954 | | | | 75,413 | | | | 80,645 | | | | 82,972 | |
Leases and similar arrangements3 | | | 1,127 | | | | 1,559 | | | | 1,752 | | | | 1,802 | | | | 1,316 | | | | 1,882 | | | | 2,152 | | | | 2,623 | | | | 6,217 | | | | 7,430 | | | | 7,266 | | | | 7,254 | |
Securities and Derivatives | | | 210 | | | | 411 | | | | 216 | | | | 175 | | | | 446 | | | | 895 | | | | 405 | | | | 671 | | | | 544 | | | | 502 | | | | 492 | | | | 492 | |
Notes:
| 1. | Bracketed numbers represent negative amounts. |
| 2. | With the implementation of the latest GFS Manual (AGFS15), some categories have been restated above to ensure comparability. |
| 3. | Approximately $2.2 billion increase in General Government and $2.6 billion in NFPS in 2019-20 on adoption of the new lease accounting standard AASB 16 |
214
Budget Strategy and Outlook 2019-20
Table D.2 Key Fiscal Indicators1
| | | | | | | | | | | | | | | | | | | | | | | | | | | | | | | | | | | | | | | | | | | | | | | | |
| | | 2011-12 | | | 2012-13 | | | 2013-14 | | | 2014-15 | | | 2015-16 | | | 2016-17 | | | 2017-18 | | | 2018-19 | | | 2019-20 | | | 2020-21 | | | 2021-22 | | | 2022-23 | |
| | | Actual2 | | | Actual2 | | | Actual2 | | | Actual2 | | | Actual2 | | | Actual2 | | | Actual2 | | | Revised | | | Budget | | | Projection | | | Projection | | | Projection | |
| | | % | | | % | | | % | | | % | | | % | | | % | | | % | | | % | | | % | | | % | | | % | | | % | |
General Government | | | | | | | | | | | | | | | | | | | | | | | | | | | | | | | | | | | | | | | | | | | | | | | | |
Revenue/GSP | | | 16.5 | | | | 14.8 | | | | 16.1 | | | | 16.9 | | | | 16.7 | | | | 17.2 | | | | 16.7 | | | | 16.3 | | | | 15.8 | | | | 15.6 | | | | 15.4 | | | | 15.2 | |
Tax/GSP | | | 3.8 | | | | 3.9 | | | | 4.1 | | | | 4.3 | | | | 4.1 | | | | 4.0 | | | | 3.8 | | | | 3.8 | | | | 4.0 | | | | 4.0 | | | | 4.0 | | | | 4.1 | |
Own source revenue/GSP | | | 8.3 | | | | 8.3 | | | | 8.6 | | | | 8.9 | | | | 8.9 | | | | 8.8 | | | | 8.6 | | | | 8.5 | | | | 8.5 | | | | 8.1 | | | | 8.0 | | | | 7.9 | |
Expenses/GSP | | | 16.5 | | | | 16.4 | | | | 16.0 | | | | 16.8 | | | | 16.5 | | | | 16.3 | | | | 16.2 | | | | 16.0 | | | | 15.8 | | | | 15.6 | | | | 15.3 | | | | 15.0 | |
Employee expenses/GSP | | | 6.6 | | | | 6.4 | | | | 6.2 | | | | 6.3 | | | | 6.6 | | | | 6.5 | | | | 6.5 | | | | 6.5 | | | | 6.7 | | | | 6.5 | | | | 6.5 | | | | 6.4 | |
Net operating balance/GSP | | | (0.1 | ) | | | (1.6 | ) | | | 0.2 | | | | 0.1 | | | | 0.2 | | | | 0.9 | | | | 0.5 | | | | 0.2 | | | | 0.0 | | | | 0.1 | | | | 0.1 | | | | 0.2 | |
Capital purchases/GSP | | | 2.9 | | | | 2.5 | | | | 2.2 | | | | 1.6 | | | | 1.3 | | | | 1.4 | | | | 1.5 | | | | 1.6 | | | | 1.8 | | | | 1.8 | | | | 1.9 | | | | 1.4 | |
Net cash inflows from operating activities/Net cash flows from investments in non-financial assets | | | 36.3 | | | | (40.7 | ) | | | 45.9 | | | | 97.5 | | | | 122.9 | | | | 134.2 | | | | 106.7 | | | | 78.8 | | | | 59.7 | | | | 64.5 | | | | 54.7 | | | | 69.9 | |
Fiscal balance/GSP | | | (2.0 | ) | | | (2.8 | ) | | | (0.9 | ) | | | (0.2 | ) | | | (0.2 | ) | | | 0.2 | | | | (0.2 | ) | | | (0.7 | ) | | | (0.9 | ) | | | (0.9 | ) | | | (1.0 | ) | | | (0.4 | ) |
Total borrowings/GSP | | | 10.6 | | | | 13.4 | | | | 14.3 | | | | 14.6 | | | | 11.7 | | | | 10.2 | | | | 9.1 | | | | 8.9 | | | | 10.2 | | | | 10.7 | | | | 11.4 | | | | 11.5 | |
Total Borrowings/Revenue | | | 64.4 | | | | 90.7 | | | | 88.6 | | | | 86.3 | | | | 69.9 | | | | 59.2 | | | | 54.3 | | | | 54.4 | | | | 64.1 | | | | 68.7 | | | | 74.3 | | | | 75.8 | |
| | | | | | | | | | | | |
Revenue growth | | | 9.0 | | | | (8.8 | ) | | | 11.9 | | | | 7.0 | | | | 1.6 | | | | 10.7 | | | | 3.4 | | | | 3.4 | | | | 0.5 | | | | 2.2 | | | | 3.0 | | | | 3.1 | |
Tax growth | | | 6.3 | | | | 3.1 | | | | 8.3 | | | | 6.4 | | | | (0.4 | ) | | | 3.0 | | | | 2.5 | | | | 5.7 | | | | 8.3 | | | | 4.0 | | | | 5.2 | | | | 5.6 | |
Expenses growth | | | 5.9 | | | | 0.6 | | | | (0.2 | ) | | | 7.2 | | | | 1.1 | | | | 6.5 | | | | 5.6 | | | | 5.1 | | | | 1.6 | | | | 2.0 | | | | 2.7 | | | | 2.6 | |
Employee expenses growth | | | 8.5 | | | | (0.7 | ) | | | (1.7 | ) | | | 4.4 | | | | 7.8 | | | | 6.1 | | | | 6.7 | | | | 6.3 | | | | 5.4 | | | | 1.3 | | | | 3.8 | | | | 3.8 | |
| | | | | | | | | | | | |
Non-Financial Public Sector | | | | | | | | | | | | | | | | | | | | | | | | | | | | | | | | | | | | | | | | | | | | | | | | |
Capital purchases/GSP | | | 4.3 | | | | 3.8 | | | | 3.2 | | | | 2.6 | | | | 2.3 | | | | 2.2 | | | | 2.2 | | | | 2.4 | | | | 2.7 | | | | 2.6 | | | | 2.7 | | | | 2.0 | |
Total borrowings/GSP | | | 22.1 | | | | 24.5 | | | | 25.1 | | | | 25.5 | | | | 24.0 | | | | 22.0 | | | | 20.0 | | | | 19.4 | | | | 20.7 | | | | 21.1 | | | | 21.4 | | | | 21.0 | |
Total Borrowings/Revenue | | | 117.7 | | | | 140.5 | | | | 135.8 | | | | 133.9 | | | | 127.1 | | | | 110.8 | | | | 105.1 | | | | 105.5 | | | | 115.3 | | | | 119.8 | | | | 123.5 | | | | 122.5 | |
Net financial liabilities2/revenue | | | 115.6 | | | | 133.4 | | | | 129.8 | | | | 125.2 | | | | 127.4 | | | | 111.2 | | | | 110.4 | | | | 115.4 | | | | 124.0 | | | | 127.2 | | | | 128.2 | | | | 123.9 | |
Notes:
| 1. | Bracketed numbers represent negative amounts. |
| 2. | UPF definition, which is equal to total financial assets less investments in other public sector entities less total liabilities. Has been revised since 2018-19 MYFER to correct an error in the calculation. |
| 3. | With the implementation of the latest GFS Manual (AGFS15), some categories have been restated above to ensure comparability. |
215
Queensland Budget 2019-20 Budget Strategy and Outlook Budget Paper No.2

Queensland Budget 2019-20
Budget Strategy and Outlook Budget Paper No.2
budget.qld.gov.au
QUEENSLAND BUDGET 2019-20
Capital Statement
Budget Paper No. 3
budget.qld.gov.au
2019-20 Queensland Budget Papers
1. Budget Speech
2. Budget Strategy and Outlook
3. Capital Statement
4. Budget Measures
5. Service Delivery Statements
Appropriation Bills
Budget Highlights
The Budget Papers are available online at budget.qld.gov.au
© The State of Queensland (Queensland Treasury) 2019
Copyright
This publication is protected by the Copyright Act 1968
Licence
This document is licensed by the State of Queensland (Queensland Treasury) under a Creative Commons Attribution (CC BY 4.0) International licence.

In essence, you are free to copy, communicate and adapt this publication, as long as you attribute the work to the State of Queensland (Queensland Treasury). To view a copy of this licence, visit http://creativecommons.org/licenses/by/4.0/
Attribution
Content from this publication should be attributed to:
© The State of Queensland (Queensland Treasury) - 2019-20 Queensland Budget
 Translating and interpreting assistance
The Queensland Government is committed to providing accessible services to Queenslanders from all cultural and linguistic backgrounds. If you have difficulty in understanding this publication, you can contact us on telephone (07) 3035 3503 and we will arrange an interpreter to effectively communicate the report to you.
Capital Statement
Budget Paper No. 3
ISSN 1445-4890 (Print)
ISSN 1445-4904 (Online)
Capital Statement 2019-20

State Budget
2019-20
Capital Statement
Budget Paper No. 3
Capital Statement 2019-20
Contents
| | | | | | |
| 1 | | Approach and highlights | | | 1 | |
| |
| Features | | | 1 | |
| | |
| 1.1 | | Introduction | | | 3 | |
| 1.2 | | Capital planning and prioritisation | | | 4 | |
| 1.3 | | Key capital projects and programs | | | 5 | |
| | |
| 2 | | 2019-20 Capital program overview | | | 13 | |
| | |
| 2.1 | | Introduction | | | 13 | |
| 2.2 | | Capital purchases | | | 14 | |
| 2.3 | | Capital grants | | | 18 | |
| | |
| 3 | | Capital outlays by entity | | | 22 | |
| | |
| 3.1 | | Aboriginal and Torres Strait Islander Partnerships | | | 22 | |
| 3.2 | | Agriculture and Fisheries | | | 24 | |
| 3.3 | | Child Safety, Youth and Women | | | 26 | |
| 3.4 | | Communities, Disability Services and Seniors | | | 27 | |
| 3.5 | | Education | | | 29 | |
| 3.6 | | Electoral Commission of Queensland | | | 42 | |
| 3.7 | | Employment, Small Business and Training | | | 43 | |
| 3.8 | | Environment and Science | | | 45 | |
| 3.9 | | Housing and Public Works | | | 50 | |
| 3.10 | | Innovation, Tourism Industry Development and the Commonwealth Games | | | 56 | |
| 3.11 | | Justice and Attorney-General | | | 58 | |
| 3.12 | | Legislative Assembly of Queensland | | | 61 | |
| 3.13 | | Local Government, Racing and Multicultural Affairs | | | 62 | |
| 3.14 | | Natural Resources, Mines and Energy | | | 65 | |
| 3.15 | | Public Safety Business Agency | | | 80 | |
| 3.16 | | Queensland Corrective Services | | | 86 | |
Capital Statement 2019-20
| | | | | | |
3.17 | | Queensland Fire and Emergency Services | | | 88 | |
3.18 | | Queensland Health | | | 90 | |
3.19 | | Queensland Police Service | | | 102 | |
3.20 | | Queensland Treasury | | | 103 | |
3.21 | | State Development, Manufacturing, Infrastructure and Planning | | | 105 | |
3.22 | | Transport and Main Roads | | | 110 | |
3.23 | | Youth Justice | | | 131 | |
| | | | | | |
| Appendix A: | | Entities included in capital outlays 2019-20 | | | 132 | |
| | |
| Appendix B: | | Key concepts and coverage | | | 135 | |
| | |
| Appendix C: | | Capital purchases by entity by region 2019-20 | | | 136 | |
Capital Statement 2019-20
Features
| • | | The Queensland Government is continuing to invest in productivity-enhancing economic infrastructure and essential social infrastructure to create jobs, support Queensland businesses and drive economic growth across all regions of the State. |
| • | | In this Budget, the Government has committed $49.544 billion over the next four years to fund construction of the critical infrastructure and capital works needed to rebuild and grow the State’s regions, facilitate and support business-led growth and deliver essential services to improve the quality of life enjoyed by the State’s growing population. |
| • | | The Government’s capital program will directly support substantial employment and economic activity across all regions of the State, with the $12.941 billion capital program in 2019-20 estimated to support 40,500 jobs. Importantly, around 60% of the capital program and 25,500 of the jobs supported are outside the Greater Brisbane area. |
| • | | In 2019-20, the Government will deliver a $5.625 billion investment in transformative transport infrastructure. Highlights of the 2019-20 transport capital program include: $1.480 billion to commence major construction work on Cross River Rail, as well as progress the planning, procurement and development associated with the project; substantial ongoing investment to fund major upgrades to the M1 Pacific Motorway and the Bruce Highway; and $46.3 million for ongoing work on the Smithfield Bypass project, which will relieve congestion, improve safety and improve traffic flow for road users around the northern beaches of Cairns. |
| • | | To help enhance the productive capacity of Queensland’s businesses, industries, communities and regions for the future, the energy and water portfolios will invest $2.660 billion in infrastructure in 2019-20 to support the ongoing delivery of safe, secure, reliable and cost-effective energy and water across the State. |
| • | | The capital program will also deliver the critical infrastructure required to ensure current and future generations of Queenslanders continue to have access to world-class health and education services. |
| • | | Capital expenditure for the health portfolio is $777.7 million in 2019-20, including $78.6 million as part of the Enhancing Regional Hospitals program, $40.7 million as part of the Rural and Regional Infrastructure package and $36.3 million as part of the Building Better Hospitals program. |
| • | | The education portfolio’s capital purchases total $1.227 billion in 2019-20, including: $479.2 million as part of the $1.3 billion Building Future Schools Fund and $296.7 million for the provision of additional facilities at existing state schools experiencing faster enrolment growth. The increase in the 2019-20 budget demonstrates the Government’s commitment to ensuring Queensland state schools continue to meet enrolment demand and have world-class facilities. |
1
Capital Statement 2019-20
| • | | Importantly, the Budget also includes substantial ongoing investment in key infrastructure supporting the State’s delivery of enhanced justice and public safety services, including $178 million over three years on additional youth justice infrastructure. |
| • | | In line with the Government’s commitment to ensure all Queenslanders share in the State’s prosperity and enjoy an improved quality of life, ongoing investment in social housing in 2019-20 includes $479.3 million of capital purchases and grants to construct new dwellings and upgrade existing properties, including in Indigenous communities. |
| • | | A key element of the Government’s capital program is providing grants to local governments and non-government organisations to support their work within communities across Queensland. In total, the Government will provide $1.599 billion in capital grants in 2019-20, including $50 million as part of the Works for Queensland program. |
| • | | Another highlight of the 2019-20 capital program will see completion of the $290 million North Queensland Stadium, which will deliver an iconic, 25,000-seat stadium in Townsville in time for the 2020 National Rugby League (NRL) Premiership Season. |
| • | | Port of Townsville Limited has commenced the Channel Capacity Upgrade project to widen the existing Platypus Channel and Sea Channel connection to the port to allow larger vessels safe access, at an estimated cost of $193.5 million. |
| • | | The Government also remains committed to rebuilding regional communities impacted by the North Queensland floods and other recent natural disasters, with a critical element of the Government’s investment focussed on improving existing infrastructure to improve the resilience of the State’s communities. The direct cost of recovery and damage to public assets from 2018-19 natural disasters is estimated at $1.3 billion. |
| • | | Funding of $5.4 million is allocated in 2019-20 as part of the Queensland Disaster Resilience Fund, a State funded program delivering $38 million over four years and administered by the Queensland Reconstruction Authority (QRA). |
| • | | The QRA will also administer the $100 million Betterment Fund to improve the resilience of infrastructure damaged by the monsoon flooding event of early 2019 under the joint State Commonwealth Disaster Recovery Funding Arrangements, with the fund to be fully allocated in 2019-20 and delivered over three years. |
2
Capital Statement 2019-20
The Queensland Government is continuing to invest in productivity-enhancing economic infrastructure and essential social infrastructure across all regions of the State.
In line with the Government’s Economic Plan, the 2019-20 Capital Statement highlights the Government’s substantial investment in critical infrastructure that will help create secure, well-paid jobs, support Queensland businesses and drive the ongoing growth of strong regional economies.
This investment will ensure Queensland’s economy and regions continues to prosper in the face of an everchanging global landscape, thereby ensuring all Queenslanders share in the opportunities and prosperity delivered by a growing economy now and in the future.
The Government is building the transport, energy, water, health and education infrastructure needed to ensure the State’s businesses can continue to grow, invest and employ, while our communities remain resilient and safe.
Importantly, the capital program benefits communities across all regions of the State, with new hospitals, schools, social housing and cultural facilities ensuring Queensland communities and families can continue to enjoy an improved quality of life.
The Government’s capital program will also directly support substantial jobs across the State during the construction phase, with the $12.941 billion capital program in 2019-20 estimated to support 40,500 jobs, with 25,500 of these jobs outside of Greater Brisbane.
The vital infrastructure the Government is investing in now will endure and support Queensland businesses, regional economies and communities, driving ongoing economic growth and creating jobs for decades and generations to come.
3
Capital Statement 2019-20
| 1.2 | Capital planning and prioritisation |
The Queensland Government has established a clear and comprehensive infrastructure planning framework to underpin and inform the prioritisation of the State’s capital works, thereby ensuring delivery of the capital program reflects the most appropriate, cost-effective approach to address the service needs and infrastructure challenges facing Queensland.
Key elements of the infrastructure planning and prioritisation framework include the State Infrastructure Plan, Building Queensland’s Infrastructure Pipeline Report and the Queensland Transport and Infrastructure Program.
State Infrastructure Plan (SIP)
The SIP provides the Government’s vision for infrastructure planning, investment and delivery. The SIP ensures the State is investing in the right infrastructure, in the right place and at the right time. It provides confidence and certainty to industry, local government and the community by confirming the Government’s investment program over the next four years.
Implementation of the SIP is led by the Department of State Development, Manufacturing, Infrastructure and Planning.
Further details on the SIP are available at https://www.dsdmip.qld.gov.au/infrastructure/state-infrastructure-plan.html.
Building Queensland (BQ)
BQ, an independent statutory body, provides expert advice on major infrastructure projects to the Queensland Government, including leading or assisting with the development of detailed business cases on major projects. BQ also develops the Infrastructure Pipeline Report to assist in determining the projects that will best address the State’s infrastructure priorities.
Further details on BQ and its functions are available at http://buildingqueensland.qld.gov.au/.
Queensland Transport and Investment Program (QTRIP)
QTRIP is the Department of Transport and Main Roads’ annually published program of current and planned investments in road and transport infrastructure (including roads, railways, active transport, marine infrastructure and public transport) over the next four years.
The program of works detailed in QTRIP represents a $ 23 billion1 investment over the four years from 2019-20, directly supporting an estimated average of approximately 21,500 direct jobs over the life of the program.
The strategic intent of QTRIP is shaped by the SIP and the Transport Coordination Plan 2017-2027. It is developed in accordance with funding allocations identified by the Queensland and Australian Governments.
Further details on QTRIP are available at
https://www.tmr.qld.gov.au/About-us/Corporate-information/Publications/Queensland-Transport-and-Roads-Investment-Program .
| 1 | Total QTRIP investment is inclusive of both non-capital and capital components. |
4
Capital Statement 2019-20
| 1.3 | Key capital projects and programs |
Cross River Rail
Cross River Rail is a 10.2 kilometre rail line from Dutton Park to Bowen Hills, with 5.9 kilometres of twin tunnels under the Brisbane River and CBD. Cross River Rail will see four new high capacity and two upgraded stations developed at Boggo Road, Woolloongabba, Albert Street, Roma Street, Dutton Park and the Exhibition showgrounds.
Cross River Rail means more trains, more often and turn-up-and-go transport for South East Queensland (SEQ) commuters. The preferred proponents have been announced and work is well underway, with demolition continuing in 2019 and tunnelling starting next year.
This second rail river crossing will ease congestion, improve network reliability and increase heavy rail accessibility to the Brisbane CBD for all SEQ regions. The Government recognises the significant potential of this infrastructure to boost jobs and economic growth. During its five-year construction period, Cross River Rail will support up to 7,700 full-time equivalent (FTE) jobs, with an average of 1,500 FTE jobs supported per year and almost 3,000 FTE supported jobs during the most intensive year of construction. This includes 450 apprentice and trainee opportunities.
Cross River Rail is being delivered through several works packages, with a Public Private Partnership (PPP) for the Tunnels, Stations and Development package currently at the preferred proponent stage. This approach optimises risk allocation and provides opportunities for the private sector to provide innovation in relation to the delivery and maintenance of tunnels, stations and over station development.
During the 2018-19 financial year, the Cross River Rail project has progressed early works and procurement activities, with delivery and procurement overseen by the Cross River Rail Delivery Authority. Early works are now nearing completion and Preferred Proponents for the Tunnel, Stations and Development PPP consortia and the Rail, Integration and Systems alliance were appointed in April 2019, with contract award due in mid-2019. Further, preparation of the key project works site in Woolloongabba is well progressed following completion of the demolition of the Goprint and Landcentre buildings in late 2018.
M1 Pacific Motorway upgrades
A safe, efficient and reliable M1 Pacific Motorway plays an important role in driving productivity and competitiveness across SEQ. The Queensland Government is investing $897.5 million to deliver major projects on the M1, including the Varsity Lakes to Tugun and Eight Mile Plains to Daisy Hill projects.
The 10 kilometre section of the M1 Pacific Motorway between Varsity Lakes and Tugun carries approximately 85,000 vehicles per day, including around 7,500 heavy vehicles. During 2019-20, it is expected that the main construction contract will be awarded and early works will commence. The indicative total estimated cost for the project is $1.030 billion.
The section of the M1 Pacific Motorway between Eight Mile Plains and Daisy Hill carries in the order of 150,000 vehicles per day, including approximately 12,000 heavy vehicles. The widening from six to eight lanes project is currently in design phase with construction expected to commence in mid-2020. The total estimated cost of this project is $749 million.
5
Capital Statement 2019-20
In addition, the Queensland and Australian Governments have committed substantial funding for the Pacific Motorway/Gateway Motorway Merge project and the Mudgeeraba to Varsity Lakes project, both of which are due for completion in 2020.
Bruce Highway upgrades
Many Queenslanders are dependent on the Bruce Highway for their livelihood and lifestyle. With the Bruce Highway connecting cities and towns over a distance of almost 1,700 kilometres from Brisbane to Cairns, it is essential to maintain and upgrade the Bruce Highway to ensure freight, travel and commuter traffic is safe and efficient. The Queensland Government will continue to work with the Australian Government to deliver the Bruce Highway Upgrade Program, aimed at improving safety, flood resilience and capacity along its length.
The 2019-20 capital program includes several key projects on the Bruce Highway, supporting construction jobs across the regions, including:
| • | | $186 million to widen the Bruce Highway from four to six lanes, Caloundra Road to the Sunshine Motorway. |
| • | | $108 million to construct bridges and approaches on the Haughton River Floodplain, south of Giru between Horseshoe Lagoon and Palm Creek. |
| • | | $60 million to construct Mackay Ring Road (Stage 1). |
| • | | $40 million to upgrade Bruce Highway/Maroochydore Road Interchange (Stage 1). |
| • | | $37.9 million, as part of the Cairns Southern Access Corridor Stage 3, to duplicate from two to four lanes the Bruce Highway from Collinson Creek in Edmonton as far as the vicinity of Wrights Creek near Gordonvale Cairns. |
| • | | $36.8 million to upgrade the Deception Bay Road interchange. |
| • | | $30.3 million as part of the Cairns Southern Access Corridor Stage 4, to widen the Bruce Highway from four to six lanes, from Kate Street to Aumuller Street near the Port of Cairns and wharf precinct. |
| • | | $29.1 million, as part of Rockhampton Northern Access (Stage 1), to duplicate from two to four lanes on the Bruce Highway between Rockhampton – Yeppoon Road and Parkhurst. |
| • | | $21.4 million to widen and pave approximately 18 kilometres of the Bruce Highway, north of Benaraby. |
| • | | $20 million towards Mackay Northern Access Upgrade project on the Bruce Highway from Ron Camm Bridge to the Mackay Ring Road (Stage 1). |
This Budget also includes key Bruce Highway upgrades that will commence construction after 2019-20, supporting ongoing local construction jobs in regions over the longer term:
| • | | Rockhampton Ring Road – to provide a western link of the Bruce Highway to the west of Rockhampton, with key linkages into the city at the Capricorn Highway, Ridgelands Road, Alexandra Street and Yaamba Road (Rockhampton-Yeppoon Road), at a total cost of $1 billion. |
| • | | Cooroy – Curra Section D – the planned construction of a new 26 kilometre highway running east of Gympie (between Woondum to Curra), at a total cost of $1 billion. |
6
Capital Statement 2019-20
| • | | Pine River – Caloundra Road Interchange – to widen to six lanes between Caboolture – Bribie Island Road Interchange and Steve Irwin Way, at a total cost of $662.5 million. |
| • | | Townsville Ring Road (Stage 5) – to duplicate from two to four lanes on the section of the Townsville Ring Road (Bruce Highway) between Vickers Bridge over Ross River and Shaw Road interchange, at a total cost of $180 million. |
North Queensland Stadium
Construction work on the $290 million North Queensland Stadium project commenced in 2018. The project will deliver an iconic, 25,000-seat stadium in Townsville in time for the 2020 National Rugby League (NRL) Premiership Season.
The North Queensland Stadium is a joint project of the Queensland Government, Australian Government and Townsville City Council, and is supported by both the NRL and North Queensland Cowboys. The stadium forms part of the Townsville City Deal signed in December 2016.
The project aims to maximise employment and business opportunities for the people of Townsville and the North Queensland region, supporting 250 jobs per year during construction.
The stadium will also be a catalyst for urban renewal and regeneration for Townsville’s inner city and waterfront. Once complete, the stadium will host a multitude of sporting, cultural and community events.
Youth justice reforms and additional youth justice infrastructure
The Government is committed to preventing offending and reoffending, and keeping young people out of courts and custody, supported by the development and upkeep of appropriate infrastructure facilities. This includes increasing capacity in youth detention facilities by an additional 48 beds, with $178 million for the completion of these projects over the next three years.
An additional 16 beds for young persons are to be built within the Brisbane Youth Detention Centre (BYDC) located at Wacol, along with upgrades to existing facilities and additional amenities including educational classrooms, kitchen and laundry facilities.
In addition, a new youth detention centre, with a 32-bed capacity, will be constructed on land adjacent to the existing BYDC.
Port of Townsville Channel Capacity Upgrade
Port of Townsville Limited (POTL) has commenced the Channel Capacity Upgrade project to widen the existing Platypus Channel and Sea Channel connection to the port to allow larger vessels safe access, at an estimated cost of $193.5 million. Supporting the local economy and jobs, both during and after construction, the Queensland Government has invested $75 million in the project and the Australian Government has committed to provide $75 million, with POTL funding $43 million. The Channel Capacity Upgrade forms part of the Townsville City Deal signed in December 2016.
As well as widening the channels, associated works include construction of rock walls and revetments to form receiving ponds for the beneficial re-use of dredged material, sourcing marine-grade armour rock required for rock walls and revetments, and installing navigation aids aligned with the new channel configuration. POTL will beneficially re-use the capital dredged material consistent with the Sustainable Ports Development Act 2015.
7
Capital Statement 2019-20
New Gold Coast train stations
The Queensland Government has fully funded the construction of three new rail stations on the Gold Coast Line at Pimpama, Helensvale North, and Worongary/Merrimac. These stations will be opened for the first services on Cross River Rail to the Gold Coast and will ease congestion pressure on key arterial roads. Gold Coast customers will have more options to choose a local station for their commute.
The commitment, which will also support substantial jobs during construction, commencing in 2020-21, as part of total funding of $120 million to 2022-23.
Smithfield Bypass
The $152 million Smithfield Bypass project is a 3.8 kilometre alternative route to the Captain Cook Highway. The new bypass road will relieve congestion at the busy intersections at Kennedy Highway and Cairns Western Arterial Road, which will improve safety and traffic flow for road users around the northern beaches of Cairns. Early works commenced in late 2018 with construction expected to be completed in late 2021, weather permitting.
Building Better Hospitals
The Government’s Building Better Hospitals commitment is a key priority for Queensland Health which will help address growing demand by enhancing public hospital capacity and services in the South East Queensland growth corridor. The program includes projects at three major South East Queensland hospitals with a combined value of $956.9 million:
| • | | redevelopment of the Caboolture Hospital to increase its capacity by 130 beds |
| • | | expansion of the Logan Hospital to deliver an additional 206 beds as well as expansion and refurbishment of the Logan maternity ward |
| • | | staged redevelopment of the Ipswich Hospital including new mental health facilities for adults and older persons and a Magnetic Resonance Imaging (MRI) suite to grow clinical capacity. |
Building Future Schools and Renewing our Schools
Through the $1.3 billion Building Future Schools Fund, the Government is building seven new secondary schools, two new special schools, and three new primary schools.
For existing state schools, the Government’s Renewing Our Schools Program provides $235 million over four years to 2021-22 to enhance and upgrade facilities in identified state schools across Queensland. The Government is also providing increased funding of $251.3 million over three years from 2018-19 for the provision of additional facilities at existing state schools experiencing faster enrolment growth.
New Generation Rollingstock
The Queensland Government will continue to deliver the New Generation Rollingstock (NGR) project. The project is an availability-based Public Private Partnership (PPP) and includes 75 new passenger trains, the Wulkuraka maintenance centre and three NGR training simulators. The NGR trains have been operating alongside the rest of the SEQ network fleet since December 2017.
The Queensland Government is currently working with the disability sector to make accessibility modifications and functional improvements for people with disabilities to NGR trains in compliance with the disability standards. These modifications will be carried out in Queensland, sustaining 50 existing jobs and creating 30 new jobs in Maryborough. The modifications and improvements include: installing larger toilet modules that provide access to passengers with mobility devices; doubling the number of priority seating from 24 to 48 seats; revising seating layouts to improve access for passengers with mobility devices; and further functionality improvements to internal fittings and carriage features. It is expected that the first upgraded train will be back on the network in 2020, with all 75 NGR trains modified with accessibility upgrades to be back on the network in 2024.
8
Capital Statement 2019-20
Rail network infrastructure upgrades
In 2019-20, this Budget includes the following new measures to deliver priority rail network enhancements in inner Brisbane:
| • | | $27 million to acquire land for a new $380 million train stabling facility at the Clapham Rail Yard in Yeerongpilly. The facility will provide for increased capacity and reliability of the rail network and will reduce empty running of trains outside peak service periods. |
| • | | $13 million to upgrade Mayne Rail Yard and the nearby Breakfast Creek Bridge, increasing the speed and reliability of rail services and enhancing the safety and operations of the rail yard. A further $146.9 million is provided over 2020-21 to 2023-24. |
| • | | $2 million as part of a $57 million increase to the $300 million station accessibility upgrade program, to upgrade accessibility to rail stations between Fairfield and Salisbury, and improve passenger and staff accessibility, comfort and convenience. |
European Train Control System (ETCS)
Implementation of ETCS through the centre of Brisbane’s rail network will improve passenger safety and provide increased network capacity to run additional rail services. The Budget provides $73.5 million in 2019-20 as part of a $634.4 million allocation for the delivery of ETCS through the inner-city rail network.
Rookwood Weir
Progressing the Rookwood Weir project presents an opportunity to supplement urban water supplies and enhance agricultural and industrial development in the Fitzroy Basin and Gladstone region. The weir could add up to 76,000 megalitres of water for agricultural production along the Fitzroy River, as well as an eventual back-up supply for Gladstone, Rockhampton and Livingstone Shire. The project is also expected to create 100 jobs in regional Queensland during construction.
Significant steps have been taken throughout the year toward the construction of Rookwood Weir. The Queensland and Australian Government have agreed to work in partnership to deliver the project. In parallel, Sunwater has progressed preparatory works, with early works for the project expected to commence in the second half of 2019.
New Performing Arts Venue at the Queensland Performing Arts Centre
The Queensland Government has committed to deliver a new $150 million state-of-the-art theatre for Brisbane, investing $125 million over four years from 2018-19. This investment in a new theatre follows the recommendations of the detailed business case for a minimum 1,500 seat theatre at the Playhouse Green site, to be operated by the Queensland Performing Arts Centre (QPAC), which will contribute $25 million to the new venue.
9
Capital Statement 2019-20
QPAC, which schedules over 1,300 performances annually with a record 1.5 million people attending in 2017-18, is nearing full capacity with a strong forward program of bookings to 2022 and beyond. The unique opportunity exists to invest in QPAC’s growth to create Queensland’s largest performing arts centre, with five outstanding venues that will further bolster Queensland’s cultural vibrancy, support the local arts sector and drive cultural tourism.
With QPAC operating the new theatre, it can program across all venues to ensure Queensland companies are supported by the best sized theatre and season duration, while also meeting growing demand for musicals. An independent expert panel is providing heritage advice on the design of the new theatre.
The addition of this new theatre will see QPAC become Australia’s largest performing arts centre with the potential to welcome an additional 300,000 visitors each year when fully operational from 2022.
North Coast Line – Beerburrum to Nambour Rail Project
The Queensland Government is providing $160.8 million over four years towards the Beerburrum to Nambour rail duplication project to address the infrastructure and capacity constraints on this section of the North Coast Line.
Detailed design is underway for enabling works and will be complete in 2019-20, with construction to be progressed based on further negotiations with the Australian Government. The Australian Government has provided an initial $390 million towards the project.
New Public Transport Ticketing System
The State has provided $371.1 million for a new public transport ticketing system that will be delivered across public transport over a four-year period. The system will add new customer facing functionality including payment by contactless debit and credit cards, mobile phones and wearables, in addition to go card and paper tickets.
Southern Queensland Correctional Precinct – Stage 2
As part of the Government’s reforms to the criminal justice system, the Government is providing additional funding of around $620 million, held centrally, towards an expansion of the Southern Queensland Correctional Precinct.
A number of major benefits will be achieved through the Stage 2 Expansion. It will deliver a correctional facility with a focus on health and rehabilitation, to reduce reoffending.
This expanded facility, with its therapeutic health-centred operating model, will help address substance addiction and mental health issues. Further, it will enable Queensland Corrective Services and Queensland Health to provide rehabilitation and treatment in a world-class correctional facility.
The Stage 2 Expansion will ease overcrowding across the correctional services system, helping keep correctional officers and prisoners safe.
10
Capital Statement 2019-20
Roma Street Busway upgrade
The Roma Street busway interchange will undergo an underground transformation to create a seamless rail and bus connection for commuters. 36,000 passengers will use Roma Street every day to transfer between trains and buses. This Budget provides $20 million in 2019-20 for a new $250 million underground busway station, to deliver an underground busway to rail interchange between the Cross River Rail station and the Roma Street Busway, to deliver enhanced connectivity between bus and rail at Queensland’s busiest public transport interchange. Delivery will be concurrent with underground works for the new Cross River Rail station.
Building our Regions
Building our Regions received a boost of $70 million over four years, taking the total funding for the program to $515 million for regional infrastructure program for local government projects. The program supports critical infrastructure in regional areas that meet specific community needs, with a focus on delivering enduring economic outcomes and creating jobs.
Of this funding, $150 million has been allocated to the Transport Infrastructure Development Scheme (TIDS) to increase the funding delivered through TIDS to regional local governments. These funds are managed by the Department of Transport and Main Roads.
The remaining $365 million of the Building our Regions program is administered by the Department of State Development, Manufacturing, Infrastructure and Planning, with approvals to date of $292.6 million in funding towards 223 infrastructure projects across 66 local governments in regional Queensland, supporting approximately 2,419 construction jobs.
This has leveraged further financial co-contributions of almost $487 million from local governments, the Australian Government and others, to create a total value of capital expenditure of $779.5 million.
Works for Queensland
The Works for Queensland program supports local governments outside SEQ by funding job-creating maintenance and minor infrastructure projects relating to assets owned or controlled by local governments.
The 2017-18 State Budget allocated an additional $200 million over two years for a second Works for Queensland funding round, which was then supplemented by a further $200 million during 2017-18. This brings the total program funding from 2016-17 to 2020-21 to $600 million. Based on data from participating local councils, the Works for Queensland Program has created/supported more than 14,000 jobs, as at 30 April 2019.
In 2019-20, $50 million will be delivered from these additional funds.
Disaster Resilience Program
Queensland is impacted by natural disasters and, while rebuilding after a disaster is important, increasing resilience of our infrastructure to lessen the impacts of natural disasters means that communities can recover more quickly after a natural disaster strikes. Therefore, a critical element of the Government’s infrastructure investment is improving existing infrastructure to improve the resilience of the State’s communities. The direct cost of recovery and damage to public assets from 2018-19 natural disasters is estimated at $1.3 billion.
11
Capital Statement 2019-20
To help foster this enhanced resilience, $ 5.4 million is allocated in 2019-20 to the Queensland Disaster Resilience Fund, a State funded program delivering $38 million over four years and administered by the Queensland Reconstruction Authority, to support delivery of disaster-mitigation projects and initiatives that build resilience to natural disasters.
Amongst a suite of measures aimed at promoting recovery and resilience, the Queensland Reconstruction Authority will also administer the $100 million Betterment Fund to improve the resilience of infrastructure damaged by the monsoon flooding event of early 2019 under the joint State Commonwealth Disaster Recovery Funding Arrangements, with the fund to be fully allocated in 2019-20 and delivered over three years.
12
Capital Statement 2019-20
| 2 | 2019-20 Capital program overview |
In this Budget, the Queensland Government has allocated a total of $12.941 billion in 2019-20 to provide productivity-enhancing economic infrastructure, essential social infrastructure and a broad range of capital works projects and programs across the State.
This investment will help create jobs, support Queensland businesses and grow the economy, including in Queensland’s vital regional areas.
The 2019-20 capital program, which is estimated to directly support around 40,500 jobs across the State, represents an 11.7% increase compared with the $11.583 billion allocated for the 2018-19 capital program in last year’s Budget.
The 2019-20 capital works program comprises $11.342 billion of purchases of non-financial assets (PNFA) and acquisitions of non-financial assets under finance leases and $1.599 billion of capital grants expenses.
Importantly, the 2019-20 capital program also demonstrates the Government’s commitment to rebuilding and grow the State’s regions, with $7.693 billion, or around 60%, of the capital program in 2019-20 to be spent outside of Greater Brisbane (Brisbane and Redlands, Logan and Ipswich), supporting an estimated 25,500 jobs across those regions.
The Government’s capital program includes a range of critical infrastructure projects in the port, rail, water and energy sectors being delivered through the State’s Public Non-financial Corporations (PNFC) sector (that is, commercial entities of government, including government-owned corporations).
Capital purchases by the PNFC sector in 2019-20 total $3.5 billion and comprise 27% of the total capital program.
The Government has implemented a clear focus on improving the timely delivery of essential infrastructure for Queensland. This has resulted in an improvement in the amount of capital expenditure delivered, with 96% of budgeted capital purchases actually delivered in 2017-18, the highest proportion in the past six years.
A similar outcome is anticipated in 2018-19, with around 99% of budgeted capital purchases expected to be delivered, compared with the average of 85% for the five years from 2012-13 to 2016-17.
13
Capital Statement 2019-20
The Queensland Government is continuing to provide the essential economic and social infrastructure needed to support economic growth, deliver essential services and ensure ongoing improvements in the quality of life enjoyed by Queensland’s growing population.
The 2019-20 capital program is comprised of $11.342 billion of PNFA and acquisitions of non-financial assets under finance leases.
Capital purchases in 2019-20, categorised according to purpose, are outlined in Chart 1. Transport continues to account for the largest share of purchases, followed by energy, health and community services, and education and training.
| Chart 1 | Capital purchases by purpose 2019-20 |
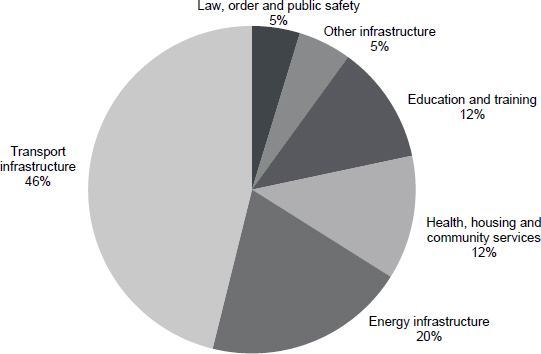
14
Capital Statement 2019-20
Table 2 outlines the capital purchases by Queensland Government entity, including the 2018-19 year (estimated actual) and the Budget for 2019-20. Transport and Main Roads has the largest proportion of total capital purchases.
| Table 1 | Capital purchases by Queensland Government entity1,2 |
| | | | | | | | |
Entity | | 2018-19
Est. Actual
$‘000 | | | 2019-20
Budget
$‘000 | |
Aboriginal and Torres Strait Islander Partnerships | | | 6,100 | | | | 100 | |
Agriculture and Fisheries | | | 23,963 | | | | 22,020 | |
Child Safety, Youth and Women | | | 33,915 | | | | 24,758 | |
Communities, Disability Services and Seniors | | | 19,691 | | | | 20,010 | |
Education | | | 880,012 | | | | 1,227,336 | |
Electoral Commission of Queensland | | | 2,689 | | | | 1,925 | |
Employment, Small Business and Training | | | 53,700 | | | | 128,950 | |
Environment and Science | | | 92,557 | | | | 114,031 | |
Housing and Public Works | | | 558,002 | | | | 665,468 | |
Justice and Attorney-General | | | 52,954 | | | | 77,531 | |
Legislative Assembly of Queensland | | | 9,214 | | | | 6,832 | |
Local Government, Racing and Multicultural Affairs | | | 3,142 | | | | 2,834 | |
Natural Resources, Mines and Energy | | | | | | | | |
Natural Resources, Mines and Energy | | | 91,818 | | | | 109,593 | |
Energy Generation | | | 290,288 | | | | 613,509 | |
Energy Transmission and Distribution | | | 1,559,901 | | | | 1,620,163 | |
Water Distribution and Supply | | | 190,313 | | | | 261,729 | |
Public Safety Business Agency3 | | | 231,720 | | | | 263,621 | |
Queensland Corrective Services | | | 132,605 | | | | 126,709 | |
Queensland Fire and Emergency Services | | | 5,750 | | | | 5,450 | |
Queensland Health | | | 761,456 | | | | 777,746 | |
Queensland Police Service | | | 15,651 | | | | 24,646 | |
Queensland Treasury | | | | | | | | |
Queensland Treasury | | | 7,107 | | | | 561 | |
Cross River Rail Delivery Authority | | | 721,000 | | | | 1,479,707 | |
State Development, Manufacturing, Infrastructure and Planning | | | 100,141 | | | | 109,051 | |
Transport and Main Roads | | | | | | | | |
Transport and Main Roads | | | 3,756,236 | | | | 2,902,793 | |
Queensland Rail | | | 550,507 | | | | 638,635 | |
Port Authorities | | | 180,624 | | | | 337,366 | |
Youth Justice | | | 3,560 | | | | 51,914 | |
Other agencies4 | | | 8,900 | | | | 2,841 | |
Other adjustments5 | | | (164,104 | ) | | | 374,230 | |
Anticipated contingency reserve6 | | | (350,000 | ) | | | (650,000 | ) |
Total Capital Purchases | | | 9,829,412 | | | | 11,342,059 | |
15
Capital Statement 2019-20
| | | | | | | | |
Total Capital Purchases Breakdown | | 2018-19
Est. Actual
$‘000 | | | 2019-20
Budget
$‘000 | |
Consisting of: | | | | | | | | |
Purchases of non-financial assets per Non-financial Public Sector Cash Flow Statement (BP2 Table 9.9) | | | 8,855,539 | | | | 10,222,835 | |
New finance leases | | | 973,873 | | | | 1,119,224 | |
Total Capital Purchases | | | 9,829,412 | | | | 11,342,059 | |
Notes:
| 1. | Includes all associated statutory bodies. |
| 2. | Numbers may not add due to rounding. |
| 3. | The Public Safety Business Agency is a capital purchaser for Queensland Fire and Emergency Services, Queensland Police Service and the Office of the Inspector-General Emergency Management. |
| 4. | Includes other Government entities with non-material capital programs. |
| 5. | Representing Inter-agency eliminations, movements in capital payable and receivable, funds held centrally and other accounting adjustments to align with Uniform Presentation Framework Statements. |
| 6. | Contingency recognises that on a whole-of-Government basis, there is likely to be under spending, resulting in a carryover of capital allocations. |
16
Capital Statement 2019-20
Table 2 shows capital purchases by Regional Action Plan (RAP) region and statistical area. The Government’s commitment to support growth in Queensland’s vital regional areas is highlighted by the fact that $6.494 billion (around 57.3%) of capital purchases in 2019-20 will be spent outside of Greater Brisbane (Brisbane and Redlands, Logan and Ipswich).
| Table 2 | Capital purchases by RAP region and statistical area for 2019-201,2 |
| | | | | | | | | | | | | | |
Regional Action Plan Region | | Capital
Purchases
$‘000 | | | Statistical Area | | Capital
Purchases
$‘000 | |
Brisbane and Redlands | | | 3,592,989 | | | | 301 | | | Brisbane East | | | 200,832 | |
| | | | | | | 302 | | | Brisbane North | | | 341,685 | |
| | | | | | | 303 | | | Brisbane South | | | 464,135 | |
| | | | | | | 304 | | | Brisbane West | | | 240,068 | |
| | | | | | | 305 | | | Inner Brisbane | | | 2,346,269 | |
Ipswich3 | | | 832,826 | | | | 310 | | | Ipswich | | | 832,826 | |
Wide Bay | | | 515,351 | | | | 319 | | | Wide Bay | | | 515,351 | |
Darling Downs | | | 661,032 | | | | 307 | | | Darling Downs Maranoa | | | 452,193 | |
| | | | | | | 317 | | | Toowoomba | | | 208,839 | |
Gold Coast | | | 712,595 | | | | 309 | | | Gold Coast | | | 712,595 | |
Logan | | | 422,342 | | | | 311 | | | Logan Beaudesert | | | 422,342 | |
Mackay-Whitsunday | | | 462,196 | | | | 312 | | | Mackay | | | 462,196 | |
Outback Queensland4 | | | 284,688 | | | | 315 | | | Outback | | | 405,420 | |
Far North Queensland4 | | | 753,733 | | | | 306 | | | Cairns | | | 633,001 | |
Central Queensland | | | 975,443 | | | | 308 | | | Central Queensland | | | 975,443 | |
Sunshine Coast and Moreton Bay | | | 1,364,268 | | | | 316 | | | Sunshine Coast | | | 818,414 | |
| | | | | | | 313 | | | Moreton Bay North | | | 313,622 | |
| | | | | | | 314 | | | Moreton Bay South | | | 232,232 | |
Townsville | | | 764,596 | | | | 318 | | | Townsville | | | 764,596 | |
Total Capital Purchases | | | | | | | | | | | | | 11,342,059 | |
Notes:
| 1. | Numbers may not add due to rounding. |
| 2. | The Anticipated Contingency Reserve and other adjustments have been spread across statistical areas proportionate to capital spends. |
| 3. | Capital purchases allocated to the Ipswich region include capital purchases related to the New Generation Rollingstock project, consistent with the approach adopted in previous State budgets. |
| 4. | $120.7 million of capital purchases in the Outback statistical area belongs to the Far North Queensland region. |
17
Capital Statement 2019-20
The Queensland Government provides grants for capital purposes to a range of organisations and private individuals.
Total capital grants are expected to be $1.599 billion in 2018-19, with Chart 2 below outlining the capital grants to local governments (LG), non-government organisations (NGOs) and individuals.
| Chart 2 | Capital grants by purpose and recipient |
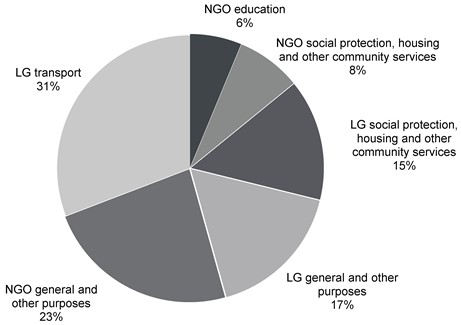
18
Capital Statement 2019-20
Table 3 shows the planned expenditure on capital grants by Queensland Government entity for 2019-20. The Department of State Development, Manufacturing, Infrastructure and Planning has the highest level of capital grants.
Table 3 Expenditure on capital grants by Queensland Government entity1,2
| | | | | | | | |
Entity | | 2018-19
Est. Actual
$‘000 | | | 2019-20
Budget
$‘000 | |
Aboriginal and Torres Strait Islander Partnerships | | | 12,849 | | | | 7,142 | |
Agriculture and Fisheries | | | 800 | | | | 914 | |
Child Safety, Youth and Women | | | 500 | | | | — | |
Communities, Disability Services and Seniors | | | 1,961 | | | | 2,699 | |
Education | | | 98,323 | | | | 100,098 | |
Environment and Science | | | 13,045 | | | | 5,585 | |
Housing and Public Works | | | 132,579 | | | | 152,494 | |
Innovation, Tourism Industry Development and the Commonwealth Games | | | 7,885 | | | | 93,405 | |
Local Government, Racing and Multicultural Affairs | | | 304,477 | | | | 159,512 | |
Natural Resources, Mines and Energy | | | 160,000 | | | | 55,000 | |
Queensland Fire and Emergency Services | | | 897 | | | | 897 | |
Queensland Treasury | | | | | | | | |
Queensland Treasury | | | 126,664 | | | | 109,839 | |
Cross River Rail Delivery Authority | | | — | | | | 49,658 | |
State Development, Manufacturing, Infrastructure and Planning | | | 448,696 | | | | 348,170 | |
Transport and Main Roads | | | 294,967 | | | | 216,742 | |
Other agencies | | | 4,200 | | | | — | |
Other adjustments3 | | | 99,750 | | | | 75,756 | |
Anticipated contingency reserve | | | — | | | | 221,000 | |
Total Capital Grants | | | 1,707,593 | | | | 1,598,911 | |
Notes:
| 1. | Includes associated statutory bodies. |
| 2. | Numbers may not add due to rounding. |
| 3. | Includes assets transferred, funds held centrally and other technical accounting adjustments. |
19
Capital Statement 2019-20
Table 4 shows expenditure on capital grants by RAP region and statistical area. The Government’s commitment to support growth in Queensland’s vital regional areas is highlighted by the fact that $1.199 billion (around 75%) of capital grants in 2019-20 will be spent outside of Greater Brisbane (Brisbane and Redlands, Logan and Ipswich).
| Table 4 | Capital grants by RAP region and statistical area for 2019-201,2 |
| | | | | | | | | | | | | | |
Regional Action Plan Region | | Grants
$‘000 | | | Statistical Area | | Grants
$‘000 | |
Brisbane and Redlands | | | 266,349 | | | | 301 | | | Brisbane East | | | 34,983 | |
| | | | | | | 302 | | | Brisbane North | | | 37,054 | |
| | | | | | | 303 | | | Brisbane South | | | 59,376 | |
| | | | | | | 304 | | | Brisbane West | | | 26,480 | |
| | | | | | | 305 | | | Inner Brisbane | | | 108,456 | |
Ipswich | | | 63,118 | | | | 310 | | | Ipswich | | | 63,118 | |
Wide Bay | | | 72,424 | | | | 319 | | | Wide Bay | | | 72,424 | |
Darling Downs | | | 70,512 | | | | 307 | | | Darling Downs Maranoa | | | 37,085 | |
| | | | | | | 317 | | | Toowoomba | | | 33,427 | |
Gold Coast | | | 94,918 | | | | 309 | | | Gold Coast | | | 94,918 | |
Logan | | | 70,144 | | | | 311 | | | Logan Beaudesert | | | 70,144 | |
Mackay-Whitsunday | | | 152,986 | | | | 312 | | | Mackay | | | 152,986 | |
Outback Queensland3 | | | 152,217 | | | | 315 | | | Outback | | | 236,024 | |
Far North Queensland3 | | | 213,310 | | | | 306 | | | Cairns | | | 129,503 | |
Central Queensland | | | 145,759 | | | | 308 | | | Central Queensland | | | 145,759 | |
Sunshine Coast and Moreton Bay | | | 131,088 | | | | 316 | | | Sunshine Coast | | | 55,419 | |
| | | | | | | 313 | | | Moreton Bay North | | | 46,042 | |
| | | | | | | 314 | | | Moreton Bay South | | | 29,627 | |
Townsville | | | 166,086 | | | | 318 | | | Townsville | | | 166,086 | |
Total Capital Grants | | | | | | | | | | | | | 1,598,911 | |
Notes:
| 1. | Numbers may not add due to rounding. |
| 2. | The adjustments referred to in Table 4 have been spread across statistical areas proportionate to allocation of Grants. |
| 3. | $83.8 million of capital grants in the Outback statistical area belongs to the Far North Queensland region. |
Chart 3 shows the distribution of the total 2019-20 capital program (capital purchases and capital grants) across the geographical regions of Queensland, as classified for Budget Paper 3 purposes.
20
Capital Statement 2019-20
| Chart 3 | Map of 2019-20 capital program by Queensland regions |
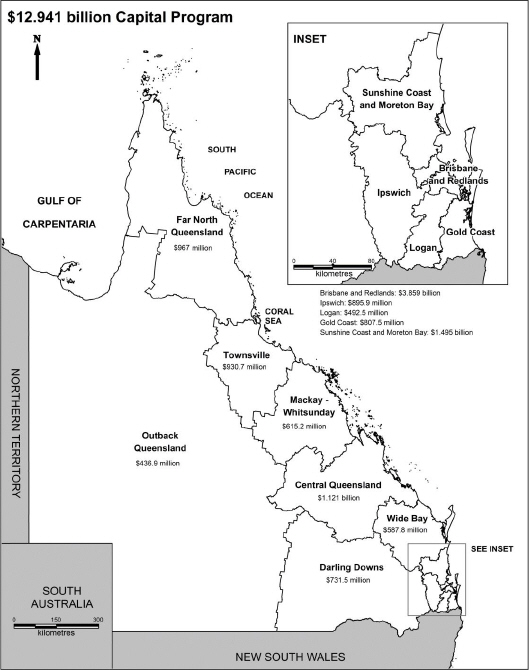
Note: Boundaries are based on ASGS 2016
21
Capital Statement 2019-20
| 3 | Capital outlays by entity |
| 3.1 | ABORIGINAL AND TORRES STRAIT ISLANDER PARTNERSHIPS |
Department of Aboriginal and Torres Strait Islander Partnerships
Total capital purchases for the Department of Aboriginal and Torres Strait Islander Partnerships are estimated to be $100,000 in 2019-20. Total capital grants for the department are estimated to be $7.1 million in 2019-20.
Program Highlights (Property, Plant and Equipment)
| • | | $100,000 for other property, plant and equipment to support departmental operations. |
Program Highlights (Capital Grants)
| • | | $400,000 to advance land and infrastructure works in Aboriginal and Torres Strait Islander discrete communities. |
| • | | $365,000 to complete the Kickstart Mossman Gorge infrastructure intitiative. |
| • | | $600,000 to provide accommodation at the Three Rivers Community Centre redevelopment. |
| • | | $337,000 to provide accommodation to support the Wathaniin on-country training initiative. |
| • | | $120,000 to complete splash parks in the Cape York communities of Pormpuraaw, Napranum and Mapoon. |
| • | | $320,000 to complete the Kowanyama Men’s Shed and the Women’s Meeting Place. |
| • | | $5 million to construct new splash park facilities on Palm Island and Thursday Island. |
22
Capital Statement 2019-20
| | | | | | | | | | | | | | | | | | | | |
| Aboriginal and Torres Strait Islander Partnerships | |
Project | | Statistical
Area | | | Total
Estimated
Cost
$‘000 | | | Expenditure
to
30-06-19
$‘000 | | | Budget
2019-20
$‘000 | | | Post
2019-20
$‘000 | |
DEPARTMENT OF ABORIGINAL AND TORRES STRAIT ISLANDER PARTNERSHIPS | | | | | | | | | | | | | | | | | | | | |
| | | | | |
Property, Plant and Equipment | | | | | | | | | | | | | | | | | | | | |
Other property, plant and equipment | | | Various | | | | | | | | | | | | 100 | | | | Ongoing | |
| | | | | | | | | | | | | | | | | | | | |
Total Property, Plant and Equipment | | | | | | | | | | | | | | | 100 | | | | | |
| | | | | | | | | | | | | | | | | | | | |
| | | | | |
Capital Grants | | | | | | | | | | | | | | | | | | | | |
Indigenous land and infrastructure programs | | | 315 | | | | 88,756 | | | | 88,356 | | | | 400 | | | | | |
Kickstart Mossman Gorge infrastructure | | | 306 | | | | 4,818 | | | | 4,453 | | | | 365 | | | | | |
Three Rivers Community Centre redevelopment | | | 315 | | | | 3,267 | | | | 2,667 | | | | 600 | | | | | |
Wathaniin on-country training accommodation | | | 315 | | | | 500 | | | | 163 | | | | 337 | | | | | |
Cape York splash parks | | | Various | | | | 4,000 | | | | 3,880 | | | | 120 | | | | | |
Kowanyama Men’s Shed and Women’s Meeting Place | | | 315 | | | | 1,249 | | | | 929 | | | | 320 | | | | | |
Palm Island Splash Park | | | 318 | | | | 3,000 | | | | | | | | 2,500 | | | | 500 | |
Thursday Island Splash Park | | | 315 | | | | 3,000 | | | | | | | | 2,500 | | | | 500 | |
| | | | | | | | | | | | | | | | | | | | |
Total Capital Grants | | | | | | | | | | | | | | | 7,142 | | | | | |
| | | | | | | | | | | | | | | | | | | | |
| | | | | | | | | | | | | | | | | | | | |
| | | | | | | | | | | | | | | | | | | | |
TOTAL ABORIGINAL AND TORRES STRAIT ISLANDER PARTNERSHIPS (PPE) | | | | | | | | | | | | | | | 100 | | | | | |
| | | | | | | | | | | | | | | | | | | | |
| | | | | | | | | | | | | | | | | | | | |
| | | | | | | | | | | | | | | | | | | | |
TOTAL ABORIGINAL AND TORRES STRAIT ISLANDER PARTNERSHIPS (CG) | | | | | | | | | | | | | | | 7,142 | | | | | |
| | | | | | | | | | | | | | | | | | | | |
23
Capital Statement 2019-20
| 3.2 | AGRICULTURE AND FISHERIES |
Department of Agriculture and Fisheries
Capital purchases and grants for the Department of Agriculture and Fisheries (DAF), reporting to the Minister for Agricultural Industry Development and Fisheries, are $19.7 million in 2019-20. The department’s capital program is focused on developing and upgrading research facilities to deliver outcomes for agriculture, biosecurity, fisheries and forestry.
DAF has facilities located throughout rural and regional Queensland. These require continual minor works, mechanical items and plant and equipment upgrades to keep them operating effectively.
Program Highlights (Property, Plant and Equipment)
| • | | $6.4 million to continue upgrades of the department’s research and operational facilities through the research facilities development, scientific equipment and minor works programs. |
| • | | $2 million for new and replacement heavy plant and equipment including trucks, tractors, irrigators, all-terrain vehicles and other machinery. |
| • | | $1.7 million to complete Stage 1 of the Toowoomba facilities upgrade project, which will enhance service delivery and improve operational efficiency. |
| • | | $1.1 million to continue replacement of vessels and marine equipment for fisheries research and regulatory functions. |
| • | | $700,000 to commence refurbishing the Tick Fever Centre at Wacol to meet required Australian Pesticides and Veterinary Medicines Authority standards. |
Program Highlights (Capital Grants)
| • | | $914,000 for the Royal Society for the Prevention of Cruelty to Animals Queensland as a contribution towards a new adoption facility at Townsville. |
Queensland Racing Integrity Commission
Capital purchases for the Queensland Racing Integrity Commission, reporting to the Minister for Local Government, Minister for Racing and Minister for Multicultural Affairs, are $3.3 million for 2019-20. This includes $1.6 million for system upgrades to support the delivery of the Queensland Greyhound Racing Industry Commission of Inquiry (MacSporran Report) recommendations and $1.7 million for upgrades to laboratory and other equipment necessary to support other core services.
24
Capital Statement 2019-20
| | | | | | | | | | | | | | | | | | | | |
| Agriculture and Fisheries | |
Project | | Statistical
Area | | | Total
Estimated
Cost
$‘000 | | | Expenditure
to
30-06-19
$‘000 | | | Budget
2019-20
$‘000 | | | Post
2019-20
$‘000 | |
DEPARTMENT OF AGRICULTURE AND FISHERIES | | | | | | | | | | | | | |
| | | | | |
Property, Plant and Equipment | | | | | | | | | | | | | | | | | | | | |
Computer equipment | | | 305 | | | | | | | | | | | | 4,965 | | | | Ongoing | |
Minor works | | | Various | | | | | | | | | | | | 2,500 | | | | Ongoing | |
Heavy plant and equipment | | | Various | | | | | | | | | | | | 2,000 | | | | Ongoing | |
Scientific equipment | | | Various | | | | | | | | | | | | 2,000 | | | | Ongoing | |
Research facilities development | | | Various | | | | | | | | | | | | 1,862 | | | | Ongoing | |
Upgrade and refurbishment of existing facilities at Toowoomba | | | 317 | | | | 9,600 | | | | 7,914 | | | | 1,686 | | | | | |
Vessels and marine equipment | | | Various | | | | | | | | | | | | 1,100 | | | | Ongoing | |
Other property, plant and equipment | | | Various | | | | | | | | | | | | 918 | | | | Ongoing | |
Refurbishment of Wacol Tick Fever Centre | | | 310 | | | | 1,500 | | | | | | | | 700 | | | | 800 | |
Ecosciences and Health and Food Sciences Precincts fitout | | | Various | | | | | | | | | | | | 406 | | | | Ongoing | |
Software purchases and development | | | 305 | | | | | | | | | | | | 600 | | | | Ongoing | |
| | | | | | | | | | | | | | | | | | | | |
Total Property, Plant and Equipment | | | | | | | | | | | | | | | 18,737 | | | | | |
| | | | | | | | | | | | | | | | | | | | |
| | | | | |
Capital Grants | | | | | | | | | | | | | | | | | | | | |
Royal Society for the Prevention of Cruelty to Animals capital grant | | | 318 | | | | 3,000 | | | | 2,086 | | | | 914 | | | | | |
| | | | | | | | | | | | | | | | | | | | |
Total Capital Grants | | | | | | | | | | | | | | | 914 | | | | | |
| | | | | | | | | | | | | | | | | | | | |
| | | |
QUEENSLAND RACING INTEGRITY COMMISSION | | | | | | | | | | | | | |
| | | | | |
Property, Plant and Equipment | | | | | | | | | | | | | | | | | | | | |
Racing Science Centre laboratory technology upgrades | | | 305 | | | | 11,637 | | | | 7,518 | | | | 1,360 | | | | 2,759 | |
Other asset replacements | | | 305 | | | | 300 | | | | | | | | 300 | | | | | |
Registration and Licencing Environment (RandLE) | | | 305 | | | | 1,623 | | | | | | | | 1,623 | | | | | |
| | | | | | | | | | | | | | | | | | | | |
Total Property, Plant and Equipment | | | | | | | | | | | | | | | 3,283 | | | | | |
| | | | | | | | | | | | | | | | | | | | |
| | | | | | | | | | | | | | | | | | | | |
| | | | | | | | | | | | | | | | | | | | |
TOTAL AGRICULTURE AND FISHERIES (PPE) | | | | | | | | | | | | | | | 22,020 | | | | | |
| | | | | | | | | | | | | | | | | | | | |
| | | | | | | | | | | | | | | | | | | | |
| | | | | | | | | | | | | | | | | | | | |
TOTAL AGRICULTURE AND FISHERIES (CG) | | | | | | | | | | | | | | | 914 | | | | | |
| | | | | | | | | | | | | | | | | | | | |
25
Capital Statement 2019-20
| 3.3 | CHILD SAFETY, YOUTH AND WOMEN |
Department of Child Safety, Youth and Women
The capital works program for the Department of Child Safety, Youth and Women is $24.8 million in 2019-20. These funds provide the infrastructure and systems to support children, young people and families to be safe and help prevent and respond to crime, violence, abuse and neglect.
Program Highlights (Property, Plant and Equipment)
| • | | $2.1 million to continue compliance works and building upgrades to residential care facilities. |
| • | | $14.8 million of a total $21.9 million for the Integrated Client Management System (ICMS) Replacement Program - Stage 1, to improve multi-agency collaboration and information sharing to better support children and families in the child protection and youth justice systems. |
| • | | $3.1 million to enhance and develop information systems to support the department’s document, contract and record management systems. |
| • | | $4 million to fitout and upgrade office accommodation and Child Safety Service Centres. |
| | | | | | | | | | | | | | | | | | | | |
| Child Safety, Youth and Women | |
Project | | Statistical
Area | | | Total
Estimated
Cost
$‘000 | | | Expenditure
to
30-06-19
$‘000 | | | Budget
2019-20
$‘000 | | | Post
2019-20
$‘000 | |
DEPARTMENT OF CHILD SAFETY, YOUTH AND WOMEN | | | | | | | | | | | | | | | | | | | | |
| | | | | |
Property, Plant and Equipment | | | | | | | | | | | | | | | | | | | | |
Child and Family Services Residential Care Facilities | | | Various | | | | | | | | | | | | 2,053 | | | | Ongoing | |
| | | | | | | | | | | | | | | | | | | | |
Sub-total Child and Family Services | | | | | | | | | | | | | | | 2,053 | | | | | |
| | | | | | | | | | | | | | | | | | | | |
| | | | | |
Other Property, Plant and Equipment | | | | | | | | | | | | | | | | | | | | |
ICMS Replacement Program - Stage 1 | | | Various | | | | 21,901 | | | | | | | | 14,782 | | | | 7,119 | |
Information Systems Enhancements | | | Various | | | | | | | | | | | | 3,095 | | | | Ongoing | |
Information Technology Infrastructure Replacement | | | Various | | | | | | | | | | | | 851 | | | | Ongoing | |
Office Accommodation | | | Various | | | | | | | | | | | | 3,977 | | | | Ongoing | |
| | | | | | | | | | | | | | | | | | | | |
Sub-total Other Property, Plant and Equipment | | | | | | | | | | | | | | | 22,705 | | | | | |
| | | | | | | | | | | | | | | | | | | | |
| | | | | | | | | | | | | | | | | | | | |
| | | | | | | | | | | | | | | | | | | | |
Total Property, Plant and Equipment | | | | | | | | | | | | | | | 24,758 | | | | | |
| | | | | | | | | | | | | | | | | | | | |
| | | | | | | | | | | | | | | | | | | | |
| | | | | | | | | | | | | | | | | | | | |
TOTAL CHILD SAFETY, YOUTH AND WOMEN (PPE) | | | | | | | | | | | | | | | 24,758 | | | | | |
| | | | | | | | | | | | | | | | | | | | |
26
Capital Statement 2019-20
| 3.4 | COMMUNITIES, DISABILITY SERVICES AND SENIORS |
Total capital purchases for the Department of Communities, Disability Services and Seniors are $20 million in 2019-20. Total capital grants for the portfolio are $2.7 million. These funds provide for integrated community services and strengthen and protect the well-being of Queenslanders, particularly those who are vulnerable and most in need.
Department of Communities, Disability Services and Seniors
Program Highlights (Property, Plant and Equipment)
| • | | $10.7 million to continue the upgrade and construction program for neighbourhood and community centres, including: $3.5 million for building upgrades, improvements and compliance works; $2.5 million to commence construction of the Thursday Island Community Centre; $4.1 million to continue design and construction of new neighbourhood and community centres in Bowen, New Farm, Kallangur and Wilsonton; and $600,000 to purchase land for a new neighbourhood centre planned for Ripley. |
| • | | $2.9 million out of an up to $3.2 million total spend to construct a new Townsville Women’s Centre. |
| • | | $4.1 million to construct the Oasis Townsville, to provide a one-stop shop for support services to ex-Australian Defence Force personnel and families. |
| • | | $2.2 million to continue upgrading, improving and modifying accommodation facilities for people with an intellectual or cognitive disability who exhibit extremely challenging behaviours. |
Program Highlights (Capital Grants)
| • | | $1.9 million towards establishing a community centre in Atherton. |
| • | | $800,000 to complete the Elderly Parent Carer Innovation Initiative project at Maroochydore which is aimed at assisting elderly parent carers to secure accommodation for their adult son or daughter with a disability when they can no longer care for them. |
27
Capital Statement 2019-20
| | | | | | | | | | | | | | | | | | | | |
| Communities, Disability Services and Seniors | |
Project | | Statistical
Area | | | Total
Estimated
Cost
$‘000 | | | Expenditure
to
30-06-19
$‘000 | | | Budget
2019-20
$‘000 | | | Post
2019-20
$‘000 | |
DEPARTMENT OF COMMUNITIES, DISABILITY SERVICES AND SENIORS | | | | | | | | | | | | | | | | | | | | |
| | | | | |
Property, Plant and Equipment | | | | | | | | | | | | | | | | | | | | |
Community Services | | | | | | | | | | | | | | | | | | | | |
Neighbourhood and Community Centre Upgrades | | | | | | | | | | | | | | | | | | | | |
General property upgrades | | | Various | | | | | | | | | | | | 3,480 | | | | Ongoing | |
Neighbourhood and Community Centre Land Acquisition and Construction | | | | | | | | | | | | | | | | | | | | |
Thursday Island Community Centre | | | 315 | | | | 4,900 | | | | 1,100 | | | | 2,500 | | | | 1,300 | |
Bowen Neighbourhood Centre | | | 312 | | | | 2,600 | | | | 408 | | | | 892 | | | | 1,300 | |
New Farm Neighbourhood Centre | | | 305 | | | | 1,792 | | | | 250 | | | | 1,542 | | | | | |
Kallangur Community Centre | | | 314 | | | | 4,100 | | | | 730 | | | | 1,270 | | | | 2,100 | |
Wilsonton Neighbourhood Centre | | | 317 | | | | 3,800 | | | | 429 | | | | 371 | | | | 3,000 | |
Ripley Neighbourhood Centre | | | 310 | | | | 4,100 | | | | | | | | 600 | | | | 3,500 | |
Townsville Women’s Centre | | | 318 | | | | 3,200 | | | | 330 | | | | 2,870 | | | | | |
The Oasis Townsville | | | 318 | | | | 4,300 | | | | 200 | | | | 4,100 | | | | | |
Disability Services | | | | | | | | | | | | | | | | | | | | |
General property upgrades | | | Various | | | | | | | | | | | | 2,159 | | | | Ongoing | |
Other Property, Plant and Equipment | | | | | | | | | | | | | | | | | | | | |
Office accommodation | | | Various | | | | | | | | | | | | 226 | | | | Ongoing | |
| | | | | | | | | | | | | | | | | | | | |
Total Property, Plant and Equipment | | | | | | | | | | | | | | | 20,010 | | | | | |
| | | | | | | | | | | | | | | | | | | | |
| | | | | |
Capital Grants | | | | | | | | | | | | | | | | | | | | |
| | | | | |
Community Services | | | | | | | | | | | | | | | | | | | | |
Atherton Community Centre | | | 306 | | | | 2,050 | | | | 151 | | | | 1,899 | | | | | |
Disability Services | | | | | | | | | | | | | | | | | | | | |
Elderly Parent Carer Innovation Initiative | | | 316 | | | | 3,803 | | | | 3,003 | | | | 800 | | | | | |
| | | | | | | | | | | | | | | | | | | | |
Total Capital Grants | | | | | | | | | | | | | | | 2,699 | | | | | |
| | | | | | | | | | | | | | | | | | | | |
| | | | | | | | | | | | | | | | | | | | |
| | | | | | | | | | | | | | | | | | | | |
TOTAL COMMUNITIES, DISABILITY SERVICES AND SENIORS (PPE) | | | | | | | | | | | | 20,010 | | | | | |
| | | | | | | | | | | | | | | | | | | | |
| | | | | | | | | | | | | | | | | | | | |
| | | | | | | | | | | | | | | | | | | | |
TOTAL COMMUNITIES, DISABILITY SERVICES AND SENIORS (CG) | | | | | | | | | | | | 2,699 | | | | | |
| | | | | | | | | | | | | | | | | | | | |
28
Capital Statement 2019-20
Total capital purchases for the Education portfolio (including the Department of Education and related entities) are $1.227 billion in 2019-20. Total capital grants for the portfolio are $100.1 million in 2019-20.
Department of Education
The 2019-20 capital purchases of $1.224 billion includes $1.169 billion for the construction and refurbishment of school educational facilities and early childhood education and care services. Capital works planning targets Government priorities by considering population growth and shifts, changes in educational needs and addressing high-priority needs for student and staff health and safety.
Program Highlights (Property, Plant and Equipment)
| • | | $479.2 million as part of the $1.3 billion Building Future Schools Fund, to deliver world class learning environments for students. |
| • | | $296.7 million for the provision of additional facilities at existing state schools experiencing faster enrolment growth. This includes $101.3 million as part of the increased funding of $251.3 million over three years provided in this Budget. |
| • | | $134.1 million as part of the $235 million Renewing Our Schools program to enhance and upgrade facilities. |
| • | | $78.7 million to replace and enhance facilities at existing schools. |
| • | | $48 million as part of the $97 million Advancing Clean Energy in Schools program to upgrade and install solar and energy efficiency measures in Queensland state schools. |
| • | | $25 million as part of $100 million of additional funding to augment the existing air-conditioning replacement program. |
| • | | $2.9 million to continue refurbishing and enhancing existing Early Childhood Education and Care facilities. |
Program Highlights (Capital Grants)
| • | | $100.1 million is provided for the non-state schooling sector and student hostels. |
29
Capital Statement 2019-20
Queensland Curriculum and Assessment Authority
The 2019-20 capital purchases of $3.5 million includes the redevelopment of the Queensland Curriculum and Assessment Authority’s (QCAA) information and communication technology systems to support the transition process towards, and fundamental elements of, the new senior assessment system. The new centralised web-based solution will use contemporary technologies to deliver essential business functionality for QCAA and schools that includes:
| • | | access to syllabus documents, along with supporting resources and assessment, |
| • | | support for new school-based assessment processes implemented across the State, |
| • | | management of external assessment processes (including test development, special provisions for students and marker management and assessment administration), |
| • | | management of schools, student enrolments, subject enrolments, student results, vocational education and training registration and results, calculation of subject results and certification processes, |
| • | | school access to student performance datasets, and |
| • | | student access to curriculum, assessment and results information. |
| | | | | | | | | | | | | | | | | | | | |
| Education | |
Project | | Statistical
Area | | | Total
Estimated
Cost
$‘000 | | | Expenditure
to
30-06-19
$‘000 | | | Budget
2019-20
$‘000 | | | Post
2019-20
$‘000 | |
DEPARTMENT OF EDUCATION | | | | | | | | | | | | | | | | | | | | |
| | | | | |
Property, Plant and Equipment | | | | | | | | | | | | | | | | | | | | |
Capital Works Program | | | | | | | | | | | | | | | | | | | | |
Education Capital Works Program | | | | | | | | | | | | | | | | | | | | |
New Inner City North State Secondary College - Stage 1 | | | 305 | | | | 77,907 | | | | 20,493 | | | | 56,935 | | | | 479 | |
New Inner City North State Secondary College - Stage 2 | | | 305 | | | | 31,991 | | | | | | | | 2,389 | | | | 29,602 | |
New Inner City South State Secondary College - Stage 1 and 2 | | | 303 | | | | 118,146 | | | | 4,022 | | | | 33,672 | | | | 80,452 | |
New Inner City South State Secondary College - External site works and upgrades | | | 303 | | | | 6,088 | | | | 894 | | | | 5,194 | | | | | |
New primary school in Palmview | | | 316 | | | | 58,021 | | | | 500 | | | | 17,332 | | | | 40,189 | |
New primary school in Pimpama | | | 309 | | | | 54,180 | | | | 500 | | | | 14,848 | | | | 38,832 | |
New primary school in Ripley - Stage 1 | | | 310 | | | | 41,906 | | | | 15,374 | | | | 26,532 | | | | | |
30
Capital Statement 2019-20
| | | | | | | | | | | | | | | | | | |
| Education | |
Project | | Statistical
Area | | Total
Estimated
Cost
$‘000 | | | Expenditure
to
30-06-19
$‘000 | | | Budget
2019-20
$‘000 | | | Post
2019-20
$‘000 | |
New secondary school in Calliope - Stage 1 | | 308 | | | 36,888 | | | | 16,659 | | | | 20,229 | | | | | |
New secondary school in Caloundra South | | 316 | | | 83,062 | | | | 500 | | | | 23,977 | | | | 58,585 | |
New secondary school in Coomera - Stage 1 | | 309 | | | 53,972 | | | | 7,712 | | | | 43,463 | | | | 2,797 | |
New secondary school in Mango Hill - Stage 1 | | 314 | | | 45,533 | | | | 8,083 | | | | 37,450 | | | | | |
New secondary school in Palmview - Early works | | 316 | | | 10,335 | | | | | | | | 4,134 | | | | 6,201 | |
New secondary school in Ripley - Stage 1 | | 310 | | | 52,229 | | | | 18,144 | | | | 34,085 | | | | | |
New secondary school in Yarrabilba - Stage 1 | | 311 | | | 50,731 | | | | 9,922 | | | | 40,809 | | | | | |
New special school in Caboolture - Stage 1 | | 313 | | | 21,215 | | | | 7,538 | | | | 13,677 | | | | | |
New special school in Palmview | | 316 | | | 62,547 | | | | 500 | | | | 17,012 | | | | 45,035 | |
Agnes Water State School - Traffic safety improvements | | 308 | | | 860 | | | | | | | | 860 | | | | | |
Albany Creek State High School - Additional classrooms | | 314 | | | 5,821 | | | | 3,720 | | | | 2,101 | | | | | |
Alexandra Hills State High School - Additional classrooms | | 301 | | | 4,061 | | | | 3,467 | | | | 594 | | | | | |
Aspley State High School - Refurbishment and upgrade works | | 302 | | | 10,509 | | | | 116 | | | | 7,417 | | | | 2,976 | |
Augusta State School - Additional classrooms | | 310 | | | 5,495 | | | | 2,901 | | | | 2,594 | | | | | |
Banksia Beach State School - New carpark | | 313 | | | 830 | | | | 215 | | | | 615 | | | | | |
Bardon State School - Covered school pick up area | | 305 | | | 860 | | | | 430 | | | | 430 | | | | | |
Baringa State Primary School - Construction of new primary school | | 316 | | | 31,177 | | | | 29,660 | | | | 1,517 | | | | | |
Beenleigh Special School - Additional classrooms | | 311 | | | 6,498 | | | | 945 | | | | 5,553 | | | | | |
Branyan Road State School - Additional classrooms | | 319 | | | 2,904 | | | | 1,550 | | | | 1,354 | | | | | |
Bray Park State High School - Additional classrooms | | 314 | | | 8,000 | | | | | | | | 2,000 | | | | 6,000 | |
31
Capital Statement 2019-20
| | | | | | | | | | | | | | | | | | |
| Education | |
Project | | Statistical
Area | | Total
Estimated
Cost
$‘000 | | | Expenditure
to
30-06-19
$‘000 | | | Budget
2019-20
$‘000 | | | Post
2019-20
$‘000 | |
Bribie Island State High School - Additional classrooms | | 313 | | | 7,645 | | | | 5,250 | | | | 2,395 | | | | | |
Brightwater State School - Additional classrooms | | 316 | | | 6,871 | | | | 4,179 | | | | 2,692 | | | | | |
Brisbane Central State School - Additional classrooms | | 305 | | | 14,100 | | | | | | | | 3,525 | | | | 10,575 | |
Broadbeach State School - Additional classrooms | | 309 | | | 7,646 | | | | 1,110 | | | | 6,536 | | | | | |
Bucasia State School - Replacement air-conditioning | | 312 | | | 1,054 | | | | 41 | | | | 405 | | | | 608 | |
Buddina State School - Additional classrooms | | 316 | | | 3,000 | | | | | | | | 750 | | | | 2,250 | |
Bundaberg State High School - Refurbishment and upgrade works | | 319 | | | 10,488 | | | | 870 | | | | 7,707 | | | | 1,911 | |
Burpengary State Secondary College - Additional classrooms | | 313 | | | 10,000 | | | | | | | | 2,750 | | | | 7,250 | |
Caboolture State High School - Additional classrooms | | 313 | | | 11,610 | | | | 6,633 | | | | 4,977 | | | | | |
Caboolture State High School - School enhancement works | | 313 | | | 783 | | | | | | | | 783 | | | | | |
Caboolture State High School - Site renewal including administration extension | | 313 | | | 1,247 | | | | 20 | | | | 1,227 | | | | | |
Cairns State High School - Refurbishment and upgrade works | | 306 | | | 10,510 | | | | 74 | | | | 10,436 | | | | | |
Cannonvale State School - Additional classrooms, new administration and resource centre | | 312 | | | 8,000 | | | | | | | | 2,000 | | | | 6,000 | |
Cavendish Road State High School - Additional classrooms | | 303 | | | 8,887 | | | | 5,614 | | | | 3,273 | | | | | |
Centenary Heights State High School - Performing arts centre and additional classrooms | | 317 | | | 10,034 | | | | 9,105 | | | | 929 | | | | | |
Centenary State High School - Additional classrooms | | 304 | | | 7,645 | | | | 6,785 | | | | 860 | | | | | |
32
Capital Statement 2019-20
| | | | | | | | | | | | | | | | | | |
| Education | |
Project | | Statistical
Area | | Total
Estimated
Cost
$‘000 | | | Expenditure
to
30-06-19
$‘000 | | | Budget
2019-20
$‘000 | | | Post
2019-20
$‘000 | |
Chancellor State College - Additional classrooms | | 316 | | | 4,582 | | | | 4,057 | | | | 525 | | | | | |
Cleveland District State High School - Additional classrooms | | 301 | | | 7,763 | | | | 6,072 | | | | 1,691 | | | | | |
Coolum State High School - Additional classrooms under existing building | | 316 | | | 2,580 | | | | 669 | | | | 1,911 | | | | | |
Coolum State High School - Additional classrooms | | 316 | | | 5,447 | | | | 488 | | | | 4,959 | | | | | |
Corinda State High School - Refurbishment and upgrade works | | 304 | | | 10,508 | | | | 135 | | | | 10,373 | | | | | |
Darling Point Special School - Additional classrooms | | 301 | | | 1,000 | | | | | | | | 1,000 | | | | | |
Dirranbandi P-10 State School - Replacement air-conditioning | | 307 | | | 454 | | | | 89 | | | | 365 | | | | | |
Eagle Junction State School - Additional classrooms | | 305 | | | 7,900 | | | | | | | | 2,370 | | | | 5,530 | |
Eagleby South State School - Additional classrooms | | 311 | | | 3,822 | | | | 575 | | | | 3,247 | | | | | |
Emerald State High School - Replacement air-conditioning | | 308 | | | 2,430 | | | | 729 | | | | 1,701 | | | | | |
Eumundi State School - Additional classrooms | | 316 | | | 7,000 | | | | | | | | 1,535 | | | | 5,465 | |
Everton Park State High School - Refurbishment and upgrade works | | 302 | | | 10,507 | | | | 166 | | | | 8,871 | | | | 1,470 | |
Fernbrooke State School - Additional classrooms | | 310 | | | 10,200 | | | | 500 | | | | 7,000 | | | | 2,700 | |
Ferny Grove State High School - Additional classrooms | | 304 | | | 17,297 | | | | 9,863 | | | | 7,434 | | | | | |
Ferny Grove State High School - Refurbishment and upgrade works | | 304 | | | 10,508 | | | | 117 | | | | 7,746 | | | | 2,645 | |
Forest Lake State High School - Additional classrooms | | 310 | | | 7,932 | | | | 5,985 | | | | 1,947 | | | | | |
Gooburrum State School - Additional classrooms | | 319 | | | 3,567 | | | | 1,337 | | | | 2,230 | | | | | |
Goodna Special School - Additional classrooms | | 310 | | | 10,500 | | | | | | | | 2,625 | | | | 7,875 | |
33
Capital Statement 2019-20
| | | | | | | | | | | | | | | | | | |
| Education | |
Project | | Statistical
Area | | Total
Estimated
Cost
$‘000 | | | Expenditure
to
30-06-19
$‘000 | | | Budget
2019-20
$‘000 | | | Post
2019-20
$‘000 | |
Griffin State School - Additional classrooms - Stage 3 | | 314 | | | 10,034 | | | | 1,911 | | | | 8,123 | | | | | |
Griffin State School - Additional classrooms - Stage 4 | | 314 | | | 9,270 | | | | | | | | 478 | | | | 8,792 | |
Hamilton State School - Additional classrooms | | 305 | | | 4,500 | | | | | | | | 1,125 | | | | 3,375 | |
Harristown State High School - Additional classrooms | | 317 | | | 13,379 | | | | 11,518 | | | | 1,861 | | | | | |
Heatley Secondary College - Refurbishment and upgrade works | | 318 | | | 10,510 | | | | 73 | | | | 8,215 | | | | 2,222 | |
Hervey Bay State High School - Performing arts centre and additional classroooms | | 319 | | | 10,000 | | | | | | | | 2,500 | | | | 7,500 | |
Indooroopilly State High School - Additional classrooms | | 304 | | | 16,246 | | | | 7,600 | | | | 8,646 | | | | | |
Indooroopilly State High School - Refurbishment and upgrade works | | 304 | | | 10,510 | | | | 107 | | | | 9,251 | | | | 1,152 | |
Indooroopilly State School - Additional classrooms | | 304 | | | 9,683 | | | | 6,441 | | | | 3,242 | | | | | |
Ingham State High School - Replacement air-conditioning | | 318 | | | 2,187 | | | | 49 | | | | 2,138 | | | | | |
Inner City South State Secondary College playing fields - Sports field development Stage 1 | | 303 | | | 1,911 | | | | 57 | | | | 1,854 | | | | | |
Ipswich State High School - Additional classrooms | | 310 | | | 6,700 | | | | | | | | 2,010 | | | | 4,690 | |
Ironside State School - Additional classrooms | | 304 | | | 580 | | | | | | | | 580 | | | | | |
Ithaca Creek State School - Additional classrooms | | 305 | | | 11,200 | | | | 560 | | | | 7,000 | | | | 3,640 | |
Jamboree Heights State School - Additional classrooms | | 304 | | | 2,500 | | | | | | | | 450 | | | | 2,050 | |
James Nash State High School - Additional classrooms | | 319 | | | 4,305 | | | | 3,775 | | | | 530 | | | | | |
Kallangur State School - Hall extension | | 314 | | | 3,822 | | | | | | | | 1,720 | | | | 2,102 | |
Kawana Waters State College - Additional classrooms | | 316 | | | 5,008 | | | | 1,382 | | | | 3,626 | | | | | |
34
Capital Statement 2019-20
| | | | | | | | | | | | | | | | | | |
| Education | |
Project | | Statistical
Area | | Total
Estimated
Cost
$‘000 | | | Expenditure
to
30-06-19
$‘000 | | | Budget
2019-20
$‘000 | | | Post
2019-20
$‘000 | |
Kedron State High School - Additional classrooms | | 305 | | | 5,781 | | | | 3,673 | | | | 2,108 | | | | | |
Kedron State School - Additional classrooms | | 302 | | | 5,734 | | | | 3,556 | | | | 2,178 | | | | | |
Kelvin Grove State College - New indoor sports facility and additional classrooms | | 305 | | | 3,058 | | | | 1,113 | | | | 1,945 | | | | | |
Kelvin Grove State College - New ballet facility and additional classrooms | | 305 | | | 2,676 | | | | 1,001 | | | | 1,675 | | | | | |
Kelvin Grove State College - New indoor sports facility - Additional works | | 305 | | | 5,208 | | | | 821 | | | | 4,387 | | | | | |
Kelvin Grove State College - Queensland Ballet Academy and associated site works | | 305 | | | 12,710 | | | | 4,253 | | | | 8,457 | | | | | |
Kelvin Grove State College - New indoor sports facility | | 305 | | | 8,875 | | | | 3,509 | | | | 5,366 | | | | | |
Laidley State High School - Additional classrooms | | 310 | | | 8,123 | | | | 4,559 | | | | 3,564 | | | | | |
Lawnton State School - Contribution to new hall | | 314 | | | 2,389 | | | | | | | | 597 | | | | 1,792 | |
Logan City Special School - Additional classrooms | | 311 | | | 8,625 | | | | | | | | 1,740 | | | | 6,885 | |
Logan Reserve State School - Additional classrooms | | 311 | | | 3,600 | | | | | | | | 900 | | | | 2,700 | |
Logan Reserve State School - Utilities upgrade | | 311 | | | 391 | | | | 2 | | | | 389 | | | | | |
Lowood State High School - Additional classrooms | | 310 | | | 3,639 | | | | 3,089 | | | | 550 | | | | | |
MacGregor State School - Stop drop ‘n’ go facility | | 303 | | | 737 | | | | 473 | | | | 264 | | | | | |
Mackay District Special School - Replacement air-conditioning | | 312 | | | 851 | | | | 146 | | | | 705 | | | | | |
Mackenzie State Special School - Additional classrooms | | 303 | | | 3,823 | | | | 96 | | | | 956 | | | | 2,771 | |
Mango Hill State School - New hall | | 314 | | | 5,733 | | | | | | | | 2,102 | | | | 3,631 | |
Mansfield State School - Additional classrooms | | 303 | | | 7,700 | | | | | | | | 1,500 | | | | 6,200 | |
35
Capital Statement 2019-20
| | | | | | | | | | | | | | | | | | |
| Education | |
Project | | Statistical
Area | | Total
Estimated
Cost
$‘000 | | | Expenditure
to
30-06-19
$‘000 | | | Budget
2019-20
$‘000 | | | Post
2019-20
$‘000 | |
Mansfield State High School - Additional classrooms | | 303 | | | 8,983 | | | | 4,440 | | | | 4,543 | | | | | |
Mansfield State High School - Refurbishment and upgrade works | | 303 | | | 10,510 | | | | 98 | | | | 6,620 | | | | 3,792 | |
Maroochydore State High School - Additional classrooms | | 316 | | | 4,921 | | | | 3,356 | | | | 1,565 | | | | | |
Marsden State High School - Additional classrooms | | 311 | | | 16,100 | | | | | | | | 4,025 | | | | 12,075 | |
Maryborough State High School - Refurbishment and upgrade works | | 319 | | | 10,496 | | | | 620 | | | | 6,021 | | | | 3,855 | |
Milton State School - Additional classrooms | | 305 | | | 7,740 | | | | 490 | | | | 7,250 | | | | | |
Mitchelton State High School - Refurbishment and upgrade works | | 304 | | | 10,509 | | | | 125 | | | | 5,316 | | | | 5,068 | |
Mitchelton Special School - Additional classrooms | | 304 | | | 5,830 | | | | 96 | | | | 956 | | | | 4,778 | |
Moggill State School - Additional classrooms | | 304 | | | 5,900 | | | | | | | | 1,775 | | | | 4,125 | |
Moranbah State High School - New hall | | 312 | | | 4,300 | | | | 303 | | | | 3,997 | | | | | |
Morayfield State High School - New hall | | 313 | | | 5,733 | | | | | | | | 2,102 | | | | 3,631 | |
Morningside State School - Additional classrooms | | 305 | | | 5,000 | | | | | | | | 1,500 | | | | 3,500 | |
Mornington Island State School - Replacement air-conditioning | | 315 | | | 757 | | | | 28 | | | | 729 | | | | | |
Mount Cotton State School - New prep and administration building | | 301 | | | 3,440 | | | | | | | | 860 | | | | 2,580 | |
Mount Gravatt State High School - Additional classrooms | | 303 | | | 4,444 | | | | 3,393 | | | | 1,051 | | | | | |
Mount Ommaney Special School - Additional classrooms | | 304 | | | 6,689 | | | | 3,846 | | | | 2,843 | | | | | |
Murgon State High School - Construction of new administration building | | 319 | | | 4,300 | | | | | | | | 860 | | | | 3,440 | |
Murgon State High School - New hall | | 319 | | | 5,734 | | | | | | | | 2,580 | | | | 3,154 | |
36
Capital Statement 2019-20
| | | | | | | | | | | | | | | | | | |
| Education | |
Project | | Statistical
Area | | Total
Estimated
Cost
$‘000 | | | Expenditure
to
30-06-19
$‘000 | | | Budget
2019-20
$‘000 | | | Post
2019-20
$‘000 | |
Murrumba State Secondary College - Additional classrooms | | 314 | | | 12,423 | | | | 4,569 | | | | 7,854 | | | | | |
New Farm State School - Additional classrooms | | 305 | | | 13,000 | | | | | | | | 3,250 | | | | 9,750 | |
Newmarket State School - Additional classrooms | | 305 | | | 4,500 | | | | | | | | 1,350 | | | | 3,150 | |
North Rockhampton State High School - Refurbish home economics and classroom block | | 308 | | | 2,150 | | | | 962 | | | | 1,188 | | | | | |
North Shore State School - Completing construction of new primary school | | 318 | | | 44,418 | | | | 37,694 | | | | 6,724 | | | | | |
Northern Beaches State High School - Additional classrooms | | 318 | | | 5,113 | | | | 2,889 | | | | 2,224 | | | | | |
Nursery Road State Special School - Additional classrooms | | 303 | | | 8,600 | | | | | | | | 2,150 | | | | 6,450 | |
One Mile State School - Replacement building | | 319 | | | 2,694 | | | | 1,188 | | | | 1,506 | | | | | |
Ormeau State School - Additional classrooms | | 309 | | | 8,744 | | | | 382 | | | | 8,281 | | | | 81 | |
Pacific Pines State High School - Additional classrooms | | 309 | | | 6,993 | | | | 3,249 | | | | 3,744 | | | | | |
Pallara State School - Additional classrooms | | 303 | | | 7,000 | | | | | | | | 700 | | | | 6,300 | |
Palm Beach Currumbin State High School - Additional classrooms | | 309 | | | 10,498 | | | | 8,262 | | | | 2,236 | | | | | |
Parkhurst State School - Additional classrooms | | 308 | | | 5,700 | | | | | | | | 1,600 | | | | 4,100 | |
Peregian Springs State School - Additional classrooms | | 316 | | | 6,500 | | | | | | | | 1,625 | | | | 4,875 | |
Petrie Terrace State School - Additional classrooms | | 305 | | | 1,000 | | | | | | | | 300 | | | | 700 | |
Pimpama State Primary College - Additional classrooms | | 309 | | | 5,543 | | | | 1,689 | | | | 3,854 | | | | | |
Pimpama State School - Additional classrooms | | 309 | | | 6,585 | | | | 3,466 | | | | 3,119 | | | | | |
37
Capital Statement 2019-20
| | | | | | | | | | | | | | | | | | |
| Education | |
Project | | Statistical
Area | | Total
Estimated
Cost
$‘000 | | | Expenditure
to
30-06-19
$‘000 | | | Budget
2019-20
$‘000 | | | Post
2019-20
$‘000 | |
Pine Rivers Special School - Additional classrooms | | 314 | | | 9,700 | | | | | | | | 2,000 | | | | 7,700 | |
Proserpine State High School - Additional classrooms | | 312 | | | 7,338 | | | | 6,000 | | | | 1,338 | | | | | |
Proserpine State High School - Refurbishment and upgrade works | | 312 | | | 10,509 | | | | 90 | | | | 7,558 | | | | 2,861 | |
Pumicestone State School - Additional classrooms | | 313 | | | 10,000 | | | | | | | | 2,500 | | | | 7,500 | |
Queensland Academy for Science Mathematics and Technology - Additional classrooms - Stage 2 and 3 | | 305 | | | 25,802 | | | | 8,720 | | | | 17,082 | | | | | |
Ravenswood State School - Relocation of school | | 318 | | | 8,027 | | | | 3,723 | | | | 4,304 | | | | | |
Redland District Special School - Additional classrooms | | 301 | | | 9,000 | | | | | | | | 2,700 | | | | 6,300 | |
Redlynch State College - Additional classrooms | | 306 | | | 8,400 | | | | | | | | 2,100 | | | | 6,300 | |
Richlands East State School - Additional classrooms | | 310 | | | 3,489 | | | | 2,642 | | | | 847 | | | | | |
Rochedale State High School - Additional classrooms | | 303 | | | 4,826 | | | | 3,975 | | | | 851 | | | | | |
Roma State College - Middle Campus - Replacement air-conditioning | | 307 | | | 2,107 | | | | 122 | | | | 1,985 | | | | | |
Runcorn Heights State School - Additional classrooms | | 303 | | | 6,500 | | | | | | | | 600 | | | | 5,900 | |
Sarina State High School - Refurbishment and upgrade works | | 312 | | | 10,508 | | | | 134 | | | | 2,389 | | | | 7,985 | |
Shailer Park State High School - Additional classrooms | | 311 | | | 8,185 | | | | | | | | 1,750 | | | | 6,435 | |
Southport State High School - Additional classrooms | | 309 | | | 10,417 | | | | 8,326 | | | | 2,091 | | | | | |
Springfield Central State High School - New multi-purpose hall | | 310 | | | 7,735 | | | | 5,082 | | | | 2,653 | | | | | |
Springfield Central State High School - Additional classrooms | | 310 | | | 10,100 | | | | | | | | 2,525 | | | | 7,575 | |
38
Capital Statement 2019-20
| | | | | | | | | | | | | | | | | | |
| Education | |
Project | | Statistical
Area | | Total
Estimated
Cost
$‘000 | | | Expenditure
to
30-06-19
$‘000 | | | Budget
2019-20
$‘000 | | | Post
2019-20
$‘000 | |
Springwood State High School - Refurbishment and upgrade works | | 311 | | | 10,508 | | | | 136 | | | | 8,119 | | | | 2,253 | |
St George State High School - Replacement air-conditioning | | 307 | | | 2,107 | | | | 1,418 | | | | 689 | | | | | |
St George State School - Replacement air-conditioning | | 307 | | | 1,297 | | | | 770 | | | | 527 | | | | | |
Stretton State College - Additional classrooms - secondary campus | | 303 | | | 7,167 | | | | 4,656 | | | | 2,511 | | | | | |
Stretton State College - Additional classrooms - primary campus | | 303 | | | 11,945 | | | | 8,335 | | | | 3,610 | | | | | |
Stretton State College - Additional classrooms | | 303 | | | 9,500 | | | | | | | | 2,850 | | | | 6,650 | |
Sunnybank Hills State School - Additional classrooms | | 303 | | | 10,034 | | | | 4,247 | | | | 5,787 | | | | | |
Sunshine Beach State High School - Additional classrooms | | 316 | | | 7,537 | | | | 2,302 | | | | 5,235 | | | | | |
Tamborine Mountain State High School - Additional classrooms | | 309 | | | 9,939 | | | | 5,695 | | | | 4,244 | | | | | |
The Gap State High School - Additional classrooms | | 304 | | | 5,600 | | | | | | | | 1,400 | | | | 4,200 | |
The Willows State School - Security fence | | 318 | | | 616 | | | | | | | | 616 | | | | | |
Toolooa State High School - Additional classrooms | | 308 | | | 4,635 | | | | 2,764 | | | | 1,871 | | | | | |
Toowong State School - Additional classrooms | | 305 | | | 5,000 | | | | | | | | 1,250 | | | | 3,750 | |
Toowoomba East State School - Replace amenities | | 317 | | | 1,434 | | | | | | | | 717 | | | | 717 | |
Toowoomba State High School - Refurbishment and upgrade works | | 317 | | | 10,509 | | | | 104 | | | | 5,699 | | | | 4,706 | |
Trinity Bay State High School - Additional classrooms | | 306 | | | 9,078 | | | | 5,440 | | | | 3,638 | | | | | |
Tropical North Learning Academy - Smithfield State High School - Refurbishment and upgrade works | | 306 | | | 10,507 | | | | 186 | | | | 10,246 | | | | 75 | |
39
Capital Statement 2019-20
| | | | | | | | | | | | | | | | | | |
| Education | |
Project | | Statistical
Area | | Total
Estimated
Cost
$‘000 | | | Expenditure
to
30-06-19
$‘000 | | | Budget
2019-20
$‘000 | | | Post
2019-20
$‘000 | |
Tropical North Learning Academy - Smithfield State High School - Additional classrooms | | 306 | | | 7,000 | | | | | | | | 1,750 | | | | 5,250 | |
Tropical North Learning Academy - Trinity Beach State School - Refurbishment and upgrade works | | 306 | | | 10,511 | | | | 58 | | | | 10,453 | | | | | |
Victoria Plantation State School - Replacement air-conditioning | | 318 | | | 380 | | | | 28 | | | | 352 | | | | | |
Victoria Point State High School - Hall extension | | 301 | | | 1,911 | | | | | | | | 860 | | | | 1,051 | |
Warrigal Road State School - Additional classrooms | | 303 | | | 6,200 | | | | | | | | 1,550 | | | | 4,650 | |
West End State School - Additional classrooms - Stage 1 | | 305 | | | 22,357 | | | | 1,737 | | | | 18,830 | | | | 1,790 | |
West End State School - Additional classrooms - Stage 2 | | 305 | | | 25,426 | | | | 96 | | | | 3,651 | | | | 21,679 | |
Windaroo Valley State High School - Additional classrooms | | 311 | | | 3,822 | | | | 3,568 | | | | 254 | | | | | |
Windsor State School - Additional classrooms | | 305 | | | 7,568 | | | | 200 | | | | 1,500 | | | | 5,868 | |
Wishart State School - Additional classrooms | | 303 | | | 5,500 | | | | 315 | | | | 3,985 | | | | 1,200 | |
Woodford State School - Refurbish learning spaces | | 313 | | | 956 | | | | | | | | 478 | | | | 478 | |
Wyreema State School - Additional classrooms | | 317 | | | 5,100 | | | | | | | | 1,275 | | | | 3,825 | |
Yeppoon State High School - Additional classrooms | | 308 | | | 4,869 | | | | 3,393 | | | | 1,476 | | | | | |
Yeronga State High School - Upgrades and enhancement works | | 303 | | | 1,911 | | | | | | | | 860 | | | | 1,051 | |
Advancing Clean Energy Schools | | Various | | | 97,000 | | | | 3,000 | | | | 48,000 | | | | 46,000 | |
General and minor works | | Various | | | | | | | | | | | 80,027 | | | | Ongoing | |
Land acquisition | | Various | | | | | | | | | | | 74,000 | | | | Ongoing | |
40
Capital Statement 2019-20
| | | | | | | | | | | | | | | | | | |
| Education | |
Project | | Statistical
Area | | Total
Estimated
Cost
$‘000 | | | Expenditure
to
30-06-19
$‘000 | | | Budget
2019-20
$‘000 | | | Post
2019-20
$‘000 | |
School Infrastructure Enhancement - Capital contribution | | Various | | | | | | | | | | | 25,000 | | | | Ongoing | |
Priority air-conditioning in state schools | | Various | | | 100,000 | | | | | | | | 25,000 | | | | 75,000 | |
School Subsidy Scheme | | Various | | | | | | | | | | | 6,689 | | | | Ongoing | |
Public Private Partnerships | | Various | | | | | | | | | | | 1,433 | | | | Ongoing | |
| | | | | | | | | | | | | | | | | | |
Sub-total Education Capital Works Program | | | | | | | | | | | | | 1,166,283 | | | | | |
| | | | | | | | | | | | | | | | | | |
| | | | | |
Early Childhood Education and Care Capital Works Program | | | | | | | | | | | | | | | | | | |
Tara Shire State College - Early years service | | 307 | | | 3,887 | | | | 3,330 | | | | 557 | | | | | |
General and minor works | | Various | | | | | | | | | | | 2,334 | | | | Ongoing | |
| | | | | | | | | | | | | | | | | | |
Sub-total Early Childhood Education and Care Capital Works Program | | | | | | | | | | | | | 2,891 | | | | | |
| | | | | | | | | | | | | | | | | | |
| | | | | | | | | | | | | | | | | | |
| | | | | | | | | | | | | | | | | | |
Sub-total Capital Works Program | | | | | | | | | | | | | 1,169,174 | | | | | |
| | | | | | | | | | | | | | | | | | |
| | | | | |
Plant and Equipment | | | | | | | | | | | | | | | | | | |
Education plant and equipment | | Various | | | | | | | | | | | 52,028 | | | | Ongoing | |
Office of Industrial Relations plant and equipment | | Various | | | | | | | | | | | 2,646 | | | | Ongoing | |
| | | | | | | | | | | | | | | | | | |
Sub-total Plant and Equipment | | | | | | | | | | | | | 54,674 | | | | | |
| | | | | | | | | | | | | | | | | | |
| | | | | | | | | | | | | | | | | | |
| | | | | | | | | | | | | | | | | | |
| | | | | |
Total Property, Plant and Equipment | | | | | | | | | | | | | 1,223,848 | | | | | |
| | | | | | | | | | | | | | | | | | |
| | | | | |
Capital Grants | | | | | | | | | | | | | | | | | | |
Capital grants | | Various | | | | | | | | | | | 100,098 | | | | Ongoing | |
| | | | | | | | | | | | | | | | | | |
Total Capital Grants | | | | | | | | | | | | | 100,098 | | | | | |
| | | | | | | | | | | | | | | | | | |
| | | | | |
QUEENSLAND CURRICULUM AND ASSESSMENT AUTHORITY | | | | | | | | | | | | | | | | | | |
| | | | | |
Property, Plant and Equipment | | | | | | | | | | | | | | | | | | |
Student management system | | 305 | | | 4,476 | | | | 4,022 | | | | 454 | | | | | |
Endorsed assessment system | | 305 | | | 1,640 | | | | 1,569 | | | | 71 | | | | | |
Confirmation system | | 305 | | | 1,408 | | | | 733 | | | | 675 | | | | | |
External assessment system | | 305 | | | 966 | | | | 400 | | | | 566 | | | | | |
QCAA portal | | 305 | | | 2,107 | | | | 741 | | | | 1,366 | | | | | |
Other plant and equipment | | 305 | | | | | | | | | | | 356 | | | | Ongoing | |
| | | | | | | | | | | | | | | | | | |
Total Property, Plant and Equipment | | | | | | | | | | | | | 3,488 | | | | | |
| | | | | | | | | | | | | | | | | | |
| | | | | | | | | | | | | | | | | | |
| | | | | | | | | | | | | | | | | | |
TOTAL EDUCATION (PPE) | | | | | | | | | | | | | 1,227,336 | | | | | |
| | | | | | | | | | | | | | | | | | |
| | | | | | | | | | | | | | | | | | |
| | | | | | | | | | | | | | | | | | |
TOTAL EDUCATION (CG) | | | | | | | | | | | | | 100,098 | | | | | |
| | | | | | | | | | | | | | | | | | |
41
Capital Statement 2019-20
| 3.6 | ELECTORAL COMMISSION OF QUEENSLAND |
Electoral Commission of Queensland
$1.8 million of a total $7.5 million is allocated in 2019-20 to replace the Electoral Commission of Queensland’s strategic election management system. A further $79,000 is allocated to replace plant and equipment.
| | | | | | | | | | | | | | | | | | | | |
| Electoral Commission of Queensland | |
Project | | Statistical
Area | | | Total
Estimated
Cost
$‘000 | | | Expenditure
to
30-06-19
$‘000 | | | Budget
2019-20
$‘000 | | | Post
2019-20
$‘000 | |
ELECTORAL COMMISSION OF QUEENSLAND | | | | | | | | | | | | | | | | | | | | |
| | | | | |
Property, Plant and Equipment | | | | | | | | | | | | | | | | | | | | |
Plant and equipment | | | 305 | | | | | | | | | | | | 79 | | | | Ongoing | |
Strategic election management system replacement project | | | 305 | | | | 7,459 | | | | 5,613 | | | | 1,846 | | | | | |
| | | | | | | | | | | | | | | | | | | | |
Total Property, Plant and Equipment | | | | | | | | | | | | | | | 1,925 | | | | | |
| | | | | | | | | | | | | | | | | | | | |
| | | | | | | | | | | | | | | | | | | | |
| | | | | | | | | | | | | | | | | | | | |
TOTAL ELECTORAL COMMISSION OF QUEENSLAND (PPE) | | | | | | | | | | | | | | | 1,925 | | | | | |
| | | | | | | | | | | | | | | | | | | | |
42
Capital Statement 2019-20
| 3.7 | EMPLOYMENT, SMALL BUSINESS AND TRAINING |
Total capital purchases for the Employment, Small Business and Training portfolio, including TAFE Queensland, are $129 million in 2019-20.
Department of Employment, Small Business and Training
The 2019-20 capital purchases for the Department of Employment, Small Business and Training of $105.8 million includes $58.9 million to refurbish and expand training facilities across several TAFE training sites and regions as part of the long-term plan to revitalise the state’s infrastructure portfolio. The capital program also includes a further $46.9 million as part of the Annual Training Infrastructure Program to renew and refurbish Queensland’s statewide training assets.
Program Highlights (Property, Plant and Equipment)
| • | | $58.9 million to refurbish and expand TAFE training facilities. This includes $15 million for Mount Gravatt, $15 million for the Gold Coast region, $10 million for Alexandra Hills, $13.9 million for the continuation of Pimlico and $5 million for the continuation of Toowoomba. |
| • | | $25 million for a safety and compliance program at TAFE facilities across the State. |
| • | | $21.9 million to renew and refurbish Queensland’s statewide training assets to enable delivery of priority skills training that supports workforce and economic development. |
43
Capital Statement 2019-20
| | | | | | | | | | | | | | | | | | | | |
| Employment, Small Business and Training | |
Project | | Statistical
Area | | | Total
Estimated
Cost
$‘000 | | | Expenditure
to
30-06-19
$‘000 | | | Budget
2019-20
$‘000 | | | Post
2019-20
$‘000 | |
DEPARTMENT OF EMPLOYMENT, SMALL BUSINESS AND TRAINING | | | | | | | | | | | | | | | | | | | | |
| | | | | |
Property, Plant and Equipment | | | | | | | | | | | | | | | | | | | | |
Alexandra Hills TAFE | | | 301 | | | | 10,000 | | | | | | | | 10,000 | | | | | |
Gold Coast TAFE | | | 309 | | | | 15,000 | | | | | | | | 15,000 | | | | | |
Mount Gravatt TAFE | | | 303 | | | | 15,000 | | | | | | | | 15,000 | | | | | |
Pimlico TAFE | | | 318 | | | | 31,920 | | | | 18,000 | | | | 13,920 | | | | | |
Toowoomba TAFE | | | 317 | | | | 7,028 | | | | 2,000 | | | | 5,028 | | | | | |
Annual Training Infrastructure Program | | | | | | | | | | | | | | | | | | | | |
Safety and compliance | | | Various | | | | 25,000 | | | | | | | | 25,000 | | | | | |
Renewal and growth | | | Various | | | | | | | | | | | | 21,891 | | | | Ongoing | |
| | | | | | | | | | | | | | | | | | | | |
Total Property, Plant and Equipment | | | | | | | | | | | | | | | 105,839 | | | | | |
| | | | | | | | | | | | | | | | | | | | |
| | | | | |
TAFE QUEENSLAND | | | | | | | | | | | | | | | | | | | | |
| | | | | |
Property, Plant and Equipment | | | | | | | | | | | | | | | | | | | | |
Training facility upgrade and fit outs | | | Various | | | | 850 | | | | | | | | 850 | | | | | |
Training and operational equipment acquisition, replacement and modernisation | | | Various | | | | | | | | | | | | 9,250 | | | | Ongoing | |
Product development | | | Various | | | | | | | | | | | | 2,000 | | | | Ongoing | |
One Network | | | Various | | | | | | | | | | | | 4,481 | | | | Ongoing | |
Identity Access Management build | | | Various | | | | 1,050 | | | | | | | | 1,050 | | | | | |
Contact Centre technology refresh | | | Various | | | | 780 | | | | | | | | 780 | | | | | |
Human resources payroll and time attendance system implementation | | | Various | | | | | | | | | | | | 1,200 | | | | Ongoing | |
E-Learning projects | | | Various | | | | 2,850 | | | | | | | | 1,000 | | | | 1,850 | |
Information and communications technology program of work | | | Various | | | | | | | | | | | | 2,500 | | | | Ongoing | |
| | | | | | | | | | | | | | | | | | | | |
Total Property, Plant and Equipment | | | | | | | | | | | | | | | 23,111 | | | | | |
| | | | | | | | | | | | | | | | | | | | |
| | | | | | | | | | | | | | | | | | | | |
| | | | | | | | | | | | | | | | | | | | |
TOTAL EMPLOYMENT, SMALL BUSINESS AND TRAINING (PPE) | | | | | | | | | | | | | | | 128,950 | | | | | |
| | | | | | | | | | | | | | | | | | | | |
44
Capital Statement 2019-20
| 3.8 | ENVIRONMENT AND SCIENCE |
The Environment and Science portfolio, including its statutory bodies and shared service provider, has a capital program of $119.6 million in 2019-20.
Department of Environment and Science
In 2019-20, the capital program for the Department of Environment and Science is $106.2 million, including capital grants of $5.6 million. The capital program reflects the department’s ongoing contribution to the protection and sustainable use of Queensland’s environment and natural, cultural and heritage values as well as supporting and investing in the science and arts sectors. The Government will also hold centrally $9.5 million to support the acquisition of land to be added to Queensland’s Protected Area Estate and $5.5 million over four years for protected area expansion and construction of a long-term ranger base on North Stradbroke Island (Minjerribah).
Program Highlights (Property, Plant and Equipment)
| • | | $10 million to extend the Revitalising National Parks program. |
| • | | $9.1 million to renew and replace critical infrastructure items across the Queensland Cultural Centre. |
| • | | $8.5 million for priority infrastructure projects across State-owned arts and cultural facilities, delivered through the Arts Infrastructure Investment Fund. |
| • | | $7.5 million towards the redevelopment of the Mon Repos Turtle Centre. |
| • | | $6.7 million to support ecotourism opportunities and tourism recovery in the Whitsunday Islands National Park. |
| • | | $5.2 million towards the construction of a new performing arts venue at the Queensland Performing Arts Centre. |
| • | | $4.4 million to implement sustainability and energy efficiency measures at the Queensland Cultural Centre. |
| • | | $3.8 million to enhance critical infrastructure to support tourism activities at Glass House Mountains National Park, Noosa National Park and D’Aguilar National Park. |
| • | | $3.5 million under the Accelerating Science Delivery Innovation Program, to modernise systems to enhance our environmental science capability. |
| • | | $3.2 million to renew and replace large critical infrastructure items at the Queensland Performing Arts Centre. |
45
Capital Statement 2019-20
| • | | $3.1 million towards the replacement of major vessels for marine parks management. |
| • | | $2.4 million under the Growth Area and Regional Infrastructure Investment Fund, to upgrade visitor access to the Magnetic Island Fort Complex. |
| • | | $1.7 million for enhanced parks and forests fire management. |
Program Highlights (Capital Grants)
| • | | $4 million towards the construction of the new Rockhampton Art Gallery. |
| • | | $1.5 million towards restoration works on heritage buildings. |
Library Board of Queensland
The Library Board of Queensland will invest $2.3 million to purchase heritage and reference collections, intangible assets in the form of digital collections, and replace information technology equipment.
Program Highlights (Property, Plant and Equipment)
| • | | $900,000 to replace information technology equipment. |
| • | | $595,000 to acquire new items for the digital collection. |
| • | | $349,000 to acquire new items for the information collection. |
| • | | $465,000 to acquire new items for the heritage collection. |
Queensland Art Gallery
The Queensland Art Gallery will invest $2.8 million in acquiring art for the gallery’s collection, as well as life-cycle replacement of other property, plant and equipment assets.
Program Highlights (Property, Plant and Equipment)
| • | | $2.5 million to acquire art for the gallery’s collection. |
| • | | $300,000 to replace other property, plant and equipment. |
46
Capital Statement 2019-20
Queensland Performing Arts Trust
The Queensland Performing Arts Trust will invest $1 million in the life-cycle replacement of operational property, plant and equipment assets such as theatre equipment and food and beverage equipment.
Queensland Museum
The Queensland Museum will invest $7.3 million to expand the research and biodiversity collection storage centre, replace information technology assets and acquire new equipment.
Program Highlights (Property, Plant and Equipment)
| • | | $6.7 million to deliver an expanded research and biodiversity collection storage centre. |
| • | | $608,000 primarily for the life-cycle replacement of information technology assets and upgrades across the museum network. |
| | | | | | | | | | | | | | | | | | | | |
| Environment and Science | |
Project | | Statistical
Area | | | Total
Estimated
Cost
$‘000 | | | Expenditure
to
30-06-19
$‘000 | | | Budget
2019-20
$‘000 | | | Post
2019-20
$‘000 | |
DEPARTMENT OF ENVIRONMENT AND SCIENCE | | | | | | | | | | | | | | | | | | | | |
| | | | | |
Property, Plant and Equipment | | | | | | | | | | | | | | | | | | | | |
Buildings and infrastructure | | | | | | | | | | | | | | | | | | | | |
Revitalising National Parks stage 2 | | | Various | | | | | | | | | | | | 10,000 | | | | Ongoing | |
Mon Repos Turtle Centre redevelopment | | | 319 | | | | 21,110 | | | | 13,593 | | | | 7,517 | | | | | |
Whitsunday Islands National Park | | | 312 | | | | 12,481 | | | | 5,790 | | | | 6,691 | | | | | |
Magnetic Island Fort Complex visitor access upgrade | | | 318 | | | | 2,350 | | | | | | | | 2,350 | | | | | |
D’Aguilar National Park | | | 314 | | | | 3,000 | | | | 832 | | | | 2,168 | | | | | |
Cape York - recreation, visitor, management and access facilities | | | 315 | | | | | | | | | | | | 1,386 | | | | Ongoing | |
Glass House Mountains National Park | | | 316 | | | | 3,373 | | | | 2,148 | | | | 1,225 | | | | | |
Naree Budjong Djara National Park - North Stradbroke Island (Minjerribah) | | | 301 | | | | | | | | | | | | 679 | | | | Ongoing | |
East Trinity infrastructure upgrade | | | 306 | | | | 2,750 | | | | | | | | 640 | | | | 2,110 | |
Moggill Koala Hospital upgrade | | | 304 | | | | 816 | | | | | | | | 516 | | | | 300 | |
Noosa National Park | | | 316 | | | | 2,490 | | | | 2,087 | | | | 403 | | | | | |
47
Capital Statement 2019-20
| | | | | | | | | | | | | | | | | | |
| Environment and Science | |
Project | | Statistical
Area | | Total
Estimated
Cost
$‘000 | | | Expenditure
to
30-06-19
$‘000 | | | Budget
2019-20
$‘000 | | | Post
2019-20
$‘000 | |
Management and access facilities - parks and forests | | Various | | | | | | | | | | | 7,672 | | | | Ongoing | |
Recreation and visitor facilities - parks and forests | | Various | | | | | | | | | | | 6,360 | | | | Ongoing | |
Queensland Cultural Centre critical infrastructure asset renewal | | 305 | | | 15,370 | | | | 850 | | | | 9,050 | | | | 5,470 | |
Arts Infrastructure Investment Fund | | Various | | | 16,488 | | | | 5,499 | | | | 8,489 | | | | 2,500 | |
New Performing Arts Venue | | 305 | | | 150,000 | | | | 890 | | | | 5,210 | | | | 143,900 | |
Queensland Cultural Centre - future energy efficiency | | 305 | | | 9,000 | | | | 555 | | | | 4,395 | | | | 4,050 | |
Critical infrastructure asset renewal and equipment replacement at QPAC | | 305 | | | 3,300 | | | | 120 | | | | 3,180 | | | | | |
Queensland Cultural Centre - critical infrastructure works program | | 305 | | | 23,575 | | | | 23,177 | | | | 398 | | | | | |
Plant and equipment | | | | | | | | | | | | | | | | | | |
General plant and equipment | | Various | | | | | | | | | | | 6,838 | | | | Ongoing | |
Marine parks major vessel replacements | | Various | | | 9,910 | | | | 5,865 | | | | 3,075 | | | | 970 | |
Parks and forests fire management | | Various | | | 6,800 | | | | | | | | 1,700 | | | | 5,100 | |
Systems development | | | | | | | | | | | | | | | | | | |
General systems development | | Various | | | | | | | | | | | 4,953 | | | | Ongoing | |
Accelerating Science Delivery | | Various | | | 4,805 | | | | 405 | | | | 3,450 | | | | 950 | |
Innovation Program | | | | | | | | | | | | | | | | | | |
Land | | | | | | | | | | | | | | | | | | |
Protected area land acquisitions | | Various | | | 1,804 | | | | | | | | 1,804 | | | | | |
Cape York Peninsula land acquisitions | | 315 | | | 500 | | | | | | | | 500 | | | | | |
| | | | | | | | | | | | | | | | | | |
Total Property, Plant and Equipment | | | | | | | | | | | | | 100,649 | | | | | |
| | | | | | | | | | | | | | | | | | |
| | | | | |
Capital Grants | | | | | | | | | | | | | | | | | | |
New Rockhampton Art Gallery | | 308 | | | 8,000 | | | | | | | | 4,000 | | | | 4,000 | |
Restoration of heritage buildings | | Various | | | 5,783 | | | | | | | | 1,500 | | | | 4,283 | |
Queensland Maritime Museum | | 305 | | | 308 | | | | 223 | | | | 85 | | | | | |
| | | | | | | | | | | | | | | | | | |
Total Capital Grants | | | | | | | | | | | | | 5,585 | | | | | |
| | | | | | | | | | | | | | | | | | |
48
Capital Statement 2019-20
| | | | | | | | | | | | | | | | | | | | |
| Environment and Science | |
Project | | Statistical
Area | | | Total
Estimated
Cost
$‘000 | | | Expenditure
to
30-06-19
$‘000 | | | Budget
2019-20
$‘000 | | | Post
2019-20
$‘000 | |
LIBRARY BOARD OF QUEENSLAND | | | | | | | | | | | | | | | | | | | | |
| | | | | |
Property, Plant and Equipment | | | | | | | | | | | | | | | | | | | | |
Information technology equipment replacements | | | 305 | | | | | | | | | | | | 900 | | | | Ongoing | |
Digital collection additions | | | 305 | | | | | | | | | | | | 595 | | | | Ongoing | |
Information collection additions | | | 305 | | | | | | | | | | | | 349 | | | | Ongoing | |
Heritage collection additions | | | 305 | | | | | | | | | | | | 465 | | | | Ongoing | |
| | | | | | | | | | | | | | | | | | | | |
Total Property, Plant and Equipment | | | | | | | | | | | | | | | 2,309 | | | | | |
| | | | | | | | | | | | | | | | | | | | |
| | | | | |
QUEENSLAND ART GALLERY | | | | | | | | | | | | | | | | | | | | |
| | | | | |
Property, Plant and Equipment | | | | | | | | | | | | | | | | | | | | |
Acquisition of art works for the gallery | | | 305 | | | | | | | | | | | | 2,500 | | | | Ongoing | |
Ongoing replacement of plant and equipment | | | 305 | | | | | | | | | | | | 300 | | | | Ongoing | |
| | | | | | | | | | | | | | | | | | | | |
Total Property, Plant and Equipment | | | | | | | | | | | | | | | 2,800 | | | | | |
| | | | | | | | | | | | | | | | | | | | |
| | | | | |
QUEENSLAND PERFORMING ARTS TRUST | | | | | | | | | | | | | | | | | | | | |
| | | | | |
Property, Plant and Equipment | | | | | | | | | | | | | | | | | | | | |
Property, plant and equipment | | | 305 | | | | | | | | | | | | 1,000 | | | | Ongoing | |
| | | | | | | | | | | | | | | | | | | | |
Total Property, Plant and Equipment | | | | | | | | | | | | | | | 1,000 | | | | | |
| | | | | | | | | | | | | | | | | | | | |
| | | | | |
QUEENSLAND MUSEUM | | | | | | | | | | | | | | | | | | | | |
| | | | | |
Property, Plant and Equipment | | | | | | | | | | | | | | | | | | | | |
Critical maintenance and infrastructure works | | | 305 | | | | 9,652 | | | | | | | | 6,655 | | | | 2,997 | |
Information technology | | | Various | | | | | | | | | | | | 608 | | | | Ongoing | |
Equipment | | | 305 | | | | | | | | | | | | 10 | | | | Ongoing | |
| | | | | | | | | | | | | | | | | | | | |
Total Property, Plant and Equipment | | | | | | | | | | | | | | | 7,273 | | | | | |
| | | | | | | | | | | | | | | | | | | | |
| | | | | | | | | | | | | | | | | | | | |
| | | | | | | | | | | | | | | | | | | | |
TOTAL ENVIRONMENT AND SCIENCE (PPE) | | | | | | | | | | | | | | | 114,031 | | | | | |
| | | | | | | | | | | | | | | | | | | | |
| | | | | | | | | | | | | | | | | | | | |
| | | | | | | | | | | | | | | | | | | | |
TOTAL ENVIRONMENT AND SCIENCE (CG) | | | | | | | | | | | | | | | 5,585 | | | | | |
| | | | | | | | | | | | | | | | | | | | |
49
Capital Statement 2019-20
| 3.9 | HOUSING AND PUBLIC WORKS |
Total capital purchases for the Housing and Public Works portfolio, including its statutory bodies, are $665.5 million in 2019-20, with capital grants of $152.5 million. Capital purchases for the statutory bodies include Stadiums Queensland of $56.3 million and the Residential Tenancies Authority of $1.2 million.
Department of Housing and Public Works
Program Highlights (Property, Plant and Equipment)
| • | | $324.2 million (including $11.1 million from the expired National Partnership on Remote Housing) to deliver 497 social housing dwellings, commence construction of 581 social housing dwellings (including 580 under the Housing Construction Jobs Program) and upgrade existing social housing dwellings. |
| • | | $63.3 million for social housing in Aboriginal and Torres Strait Islander communities (including $5.3 million from the expired National Partnership on Remote Housing) to deliver 19 social housing dwellings, commence construction of 10 social housing dwellings, upgrade existing social housing and purchase three dwellings for use as temporary accommodation to support the transfer of social housing to home ownership on Aboriginal and Torres Strait Islander land. |
| • | | $102.8 million to complete construction of the North Queensland Stadium, in time for the 2020 National Rugby League (NRL) Premiership Season. |
| • | | $51.8 million for a capital and upgrade program to deliver safe and secure government employee housing in regional and remote locations across the State, including Aboriginal and Torres Strait Islander communities, thereby enabling police, teachers, medical professionals and associated government employees to deliver critical frontline services to the people of Queensland. This includes the completion of the government employee housing precinct at Aurukun providing 24 residences for Department of Education staff. |
| • | | $21.6 million to enhance existing State-owned sport and active recreation facilities at the Gold Coast, Sunshine Coast and Townsville, to deliver quality experiences that inspire physical activity. |
Program Highlights (Capital Grants)
| • | | $30.5 million to deliver 49 social housing dwellings, commence construction of 27 social housing dwellings (including 20 under the Housing Construction Jobs Program) and commence construction of four dwellings for a domestic and family violence shelter. |
50
Capital Statement 2019-20
| • | | $53.1 million for social housing in Aboriginal and Torres Strait Islander communities to deliver 10 social housing dwellings, commence construction of 15 social housing dwellings, undertake infrastructure development, upgrade existing social housing and undertake upgrades to support the transfer of social housing to home ownership on Aboriginal and Torres Strait Islander land. |
| • | | $46.4 million for new and existing capital grants programs to build, upgrade and improve sport and recreation infrastructure to support healthy communities. This funding includes programs designed to boost community use of schools, and to support female participation through new and upgraded female facilities. |
| • | | $22.4 million in 2019-20 to support sport and recreation clubs at the grassroots level through the continued delivery of infrastructure projects including the Underwood Sports Park, the University of the Sunshine Coast Stadium and the Zillmere Sports Centre. |
CITEC
CITEC has capital purchases of $3.3 million in 2019-20, comprising $2 million for hardware replacement and $1.3 million for critical software enhancements relating to information brokerage.
Queensland Shared Services
Queensland Shared Services has capital purchases of $2.6 million in 2019-20, including $2.5 million to implement a Human Capital Management solution and other optimisation projects and initiatives.
Stadiums Queensland
Stadiums Queensland’s 2019-20 capital outlay of $56.3 million represents the capital funding available to Stadiums Queensland to contribute towards maintaining Queensland’s major sporting and entertainment facilities to a standard appropriate to host national and international events, and community sports activity. This includes $35 million towards the refurbishment of the Gabba.
Residential Tenancies Authority
Residential Tenancies Authority has capital purchases of $1.2 million in 2019-20 to implement strategic projects to improve effectiveness and efficiency in delivering services for the residential rental sector.
51
Capital Statement 2019-20
| | | | | | | | | | | | | | | | | | |
| Housing and Public Works | |
Project | | Statistical
Area | | Total
Estimated
Cost
$‘000 | | | Expenditure
to
30-06-19
$‘000 | | | Budget
2019-20
$‘000 | | | Post
2019-20
$‘000 | |
DEPARTMENT OF HOUSING AND PUBLIC WORKS | | | | | | | | | | | | | |
| | | | | |
Property, Plant and Equipment | | | | | | | | | | | | | | | | | | |
Housing and Homelessness Services | | | | | | | | | | | | | | | | | | |
Construct social housing | | | | | | | | | | | | | | | | | | |
Brisbane - East | | 301 | | | | | | | | | | | 531 | | | | Ongoing | |
Brisbane - North | | 302 | | | | | | | | | | | 10,911 | | | | Ongoing | |
Brisbane - South | | 303 | | | | | | | | | | | 9,665 | | | | Ongoing | |
Brisbane - West | | 304 | | | | | | | | | | | 4,171 | | | | Ongoing | |
Brisbane Inner City | | 305 | | | | | | | | | | | 15,430 | | | | Ongoing | |
Cairns | | 306 | | | | | | | | | | | 34,465 | | | | Ongoing | |
Central Queensland | | 308 | | | | | | | | | | | 8,908 | | | | Ongoing | |
Gold Coast | | 309 | | | | | | | | | | | 31,353 | | | | Ongoing | |
Ipswich | | 310 | | | | | | | | | | | 18,718 | | | | Ongoing | |
Logan - Beaudesert | | 311 | | | | | | | | | | | 18,685 | | | | Ongoing | |
Mackay | | 312 | | | | | | | | | | | 1,648 | | | | Ongoing | |
Moreton Bay - North | | 313 | | | | | | | | | | | 6,448 | | | | Ongoing | |
Moreton Bay - South | | 314 | | | | | | | | | | | 5,478 | | | | Ongoing | |
Queensland - Outback | | 315 | | | | | | | | | | | 18,098 | | | | Ongoing | |
Sunshine Coast | | 316 | | | | | | | | | | | 11,308 | | | | Ongoing | |
Toowoomba | | 317 | | | | | | | | | | | 2,516 | | | | Ongoing | |
Townsville | | 318 | | | | | | | | | | | 15,964 | | | | Ongoing | |
Wide Bay | | 319 | | | | | | | | | | | 1,491 | | | | Ongoing | |
| | | | | | | | | | | | | | | | | | |
Sub-total Construct social housing | | | | | | | | | | | | | 215,788 | | | | | |
| | | | | | | | | | | | | | | | | | |
Upgrade existing social housing | | | | | | | | | | | | | | | | | | |
Brisbane - East | | 301 | | | | | | | | | | | 1,801 | | | | Ongoing | |
Brisbane - North | | 302 | | | | | | | | | | | 601 | | | | Ongoing | |
Brisbane - South | | 303 | | | | | | | | | | | 2,020 | | | | Ongoing | |
Brisbane - West | | 304 | | | | | | | | | | | 350 | | | | Ongoing | |
Brisbane Inner City | | 305 | | | | | | | | | | | 1,580 | | | | Ongoing | |
Cairns | | 306 | | | | | | | | | | | 23,759 | | | | Ongoing | |
Darling Downs - Maranoa | | 307 | | | | | | | | | | | 670 | | | | Ongoing | |
Central Queensland | | 308 | | | | | | | | | | | 2,636 | | | | Ongoing | |
Gold Coast | | 309 | | | | | | | | | | | 1,970 | | | | Ongoing | |
Ipswich | | 310 | | | | | | | | | | | 2,511 | | | | Ongoing | |
Logan - Beaudesert | | 311 | | | | | | | | | | | 2,274 | | | | Ongoing | |
Mackay | | 312 | | | | | | | | | | | 2,100 | | | | Ongoing | |
Moreton Bay - North | | 313 | | | | | | | | | | | 2,050 | | | | Ongoing | |
Moreton Bay - South | | 314 | | | | | | | | | | | 574 | | | | Ongoing | |
Queensland - Outback | | 315 | | | | | | | | | | | 18,247 | | | | Ongoing | |
52
Capital Statement 2019-20
| | | | | | | | | | | | | | | | |
| Housing and Public Works |
Project | | Statistical
Area | | Total
Estimated
Cost
$‘000 | | | Expenditure
to
30-06-19
$‘000 | | | Budget
2019-20
$‘000 | | | Post
2019-20
$‘000 |
Sunshine Coast | | 316 | | | | | | | | | | | 7,690 | | | Ongoing |
Toowoomba | | 317 | | | | | | | | | | | 5,530 | | | Ongoing |
Townsville | | 318 | | | | | | | | | | | 4,252 | | | Ongoing |
Wide Bay | | 319 | | | | | | | | | | | 5,281 | | | Ongoing |
Statewide | | Various | | | | | | | | | | | 33,804 | | | Ongoing |
| | | | | | | | | | | | | | | | |
Sub-total Upgrade existing social housing | | | | | | | | | | | 119,700 | | | |
| | | | | | | | | | | | | | | | |
| | | | | |
Purchase of existing properties | | | | | | | | | | | | | | | | |
Queensland - Outback | | 315 | | | | | | | | | | | 650 | | | Ongoing |
Statewide | | Various | | | | | | | | | | | 2,500 | | | Ongoing |
| | | | | | | | | | | | | | | | |
Sub-total Purchase of existing properties | | | | | | | | | | | 3,150 | | | |
| | | | | | | | | | | | | | | | |
| | | | | |
Social housing land aquisition | | | | | | | | | | | | | | | | |
Brisbane - South | | 303 | | | | | | | | | | | 4,250 | | | Ongoing |
Gold Coast | | 309 | | | | | | | | | | | 8,829 | | | Ongoing |
Ipswich | | 310 | | | | | | | | | | | 12,000 | | | Ongoing |
Logan - Beaudesert | | 311 | | | | | | | | | | | 8,000 | | | Ongoing |
Moreton Bay - North | | 313 | | | | | | | | | | | 3,000 | | | Ongoing |
Sunshine Coast | | 316 | | | | | | | | | | | 11,325 | | | Ongoing |
Toowoomba | | 317 | | | | | | | | | | | 1,000 | | | Ongoing |
Statewide | | Various | | | | | | | | | | | 500 | | | Ongoing |
| | | | | | | | | | | | | | | | |
Sub-total Social housing land aquisition | | | | | | | | | | | | | 48,904 | | | |
| | | | | | | | | | | | | | | | |
Other plant and equipment | | Various | | | | | | | | | | | 8,100 | | | Ongoing |
| | | | | | | | | | | | | | | | |
Sub-total Housing and Homelessness Services | | | | | | | | | | | 395,642 | | | |
| | | | | | | | | | | | | | | | |
| | | | | |
Sport and recreation | | | | | | | | | | | | | | | | |
Sport and recreation - Queensland recreation centres | | Various | | | | | | | | | | | 5,647 | | | Ongoing |
Queensland Active Precincts | | Various | | | 40,000 | | | | | | | | 16,000 | | | 24,000 |
| | | | | | | | | | | | | | | | |
Sub-total Sport and recreation | | | | | | | | | | | | | 21,647 | | | |
| | | | | | | | | | | | | | | | |
| | | | | |
Public Works | | | | | | | | | | | | | | | | |
Brisbane - Boggo Road precinct redevelopment | | 303 | | | 42,067 | | | | 39,191 | | | | 2,876 | | | |
Building works and capital replacements | | Various | | | | | | | | | | | 500 | | | Ongoing |
Government employee housing | | Various | | | | | | | | | | | 46,445 | | | Ongoing |
Government employee housing construction - Aurukun | | 315 | | | 22,600 | | | | 17,289 | | | | 5,311 | | | |
53
Capital Statement 2019-20
| | | | | | | | | | | | | | | | |
| Housing and Public Works |
Project | | Statistical
Area | | Total
Estimated
Cost
$‘000 | | | Expenditure
to
30-06-19
$‘000 | | | Budget
2019-20
$‘000 | | | Post
2019-20
$‘000 |
Brisbane - Thomas Dixon Centre refurbishment | | 305 | | | 13,500 | | | | | | | | 13,500 | | | |
North Queensland Stadium | | 318 | | | 292,417 | | | | 187,873 | | | | 102,753 | | | 1,791 |
Office Accommodation Program | | Various | | | | | | | | | | | 10,000 | | | Ongoing |
Other property, plant and equipment | | Various | | | | | | | | | | | 3,347 | | | Ongoing |
| | | | | | | | | | | | | | | | |
Sub-total Public Works | | | | | | | | | | | | | 184,732 | | | |
| | | | | | | | | | | | | | | | |
| | | | | | | | | | | | | | | | |
| | | | | | | | | | | | | | | | |
Total Property, Plant and Equipment | | | | | | | | | | | | | 602,021 | | | |
| | | | | | | | | | | | | | | | |
| | | | | |
Capital Grants | | | | | | | | | | | | | | | | |
Housing and Homelessness Services | | | | | | | | | | | | | | | | |
Brisbane - South | | 303 | | | | | | | | | | | 5,000 | | | Ongoing |
Brisbane Inner City | | 305 | | | | | | | | | | | 1,737 | | | Ongoing |
Cairns | | 306 | | | | | | | | | | | 42,066 | | | Ongoing |
Central Queensland | | 308 | | | | | | | | | | | 149 | | | Ongoing |
Logan - Beaudesert | | 311 | | | | | | | | | | | 6,298 | | | Ongoing |
Moreton Bay - North | | 313 | | | | | | | | | | | 8,682 | | | Ongoing |
Queensland - Outback | | 315 | | | | | | | | | | | 4,839 | | | Ongoing |
Townsville | | 318 | | | | | | | | | | | 2,098 | | | Ongoing |
Wide Bay | | 319 | | | | | | | | | | | 7,751 | | | Ongoing |
Statewide | | Various | | | | | | | | | | | 5,059 | | | Ongoing |
| | | | | | | | | | | | | | | | |
Sub-total Housing and Homelessness Services | | | | | | | | | | | 83,679 | | | |
| | | | | | | | | | | | | | | | |
| | | | | |
Sport and Recreation | | | | | | | | | | | | | | | | |
Get Playing Plus | | Various | | | 39,724 | | | | 34,724 | | | | 5,000 | | | |
Get Playing Places and Spaces | | Various | | | 28,410 | | | | 17,690 | | | | 7,165 | | | 3,555 |
Female Facilities Program | | Various | | | 15,000 | | | | 8,000 | | | | 7,000 | | | |
Various capital grants | | Various | | | | | | | | | | | 8,250 | | | Ongoing |
Grant funding boost | | Various | | | 7,282 | | | | 2,832 | | | | 4,450 | | | |
Zillmere Sports Centre | | 302 | | | 5,500 | | | | 400 | | | | 5,100 | | | |
Underwood Sports Park | | 311 | | | 9,110 | | | | 1,055 | | | | 8,055 | | | |
University of the Sunshine Coast Stadium | | 316 | | | 8,050 | | | | 6,050 | | | | 2,000 | | | |
Whitsunday Sports Park | | 312 | | | 2,100 | | | | 105 | | | | 1,995 | | | |
Camilleri Street | | 312 | | | 1,000 | | | | 200 | | | | 800 | | | |
Community infrastructure solutions | | Various | | | 50,000 | | | | | | | | 15,000 | | | 35,000 |
Community use of schools | | Various | | | 15,000 | | | | | | | | 4,000 | | | 11,000 |
| | | | | | | | | | | | | | | | |
Sub-total Sport and Recreation | | | | | | | | | | | | | 68,815 | | | |
| | | | | | | | | | | | | | | | |
| | | | | | | | | | | | | | | | |
| | | | | | | | | | | | | | | | |
Total Capital Grants | | | | | | | | | | | | | 152,494 | | | |
| | | | | | | | | | | | | | | | |
54
Capital Statement 2019-20
| | | | | | | | | | | | | | | | | | | | |
| Housing and Public Works | |
Project | | Statistical
Area | | | Total
Estimated
Cost
$‘000 | | | Expenditure
to
30-06-19
$‘000 | | | Budget
2019-20
$‘000 | | | Post
2019-20
$‘000 | |
CITEC | | | | | | | | | | | | | | | | | | | | |
| | | | | |
Property, Plant and Equipment | | | | | | | | | | | | | | | | | | | | |
Hardware replacement - information and communications technology | | | 305 | | | | | | | | | | | | 2,000 | | | | Ongoing | |
Software enhancements - information brokerage | | | 305 | | | | | | | | | | | | 1,300 | | | | Ongoing | |
| | | | | | | | | | | | | | | | | | | | |
Total Property, Plant and Equipment | | | | | | | | | | | | | | | 3,300 | | | | | |
| | | | | | | | | | | | | | | | | | | | |
| | | | | |
QUEENSLAND SHARED SERVICES | | | | | | | | | | | | | | | | | | | | |
| | | | | |
Property, Plant and Equipment | | | | | | | | | | | | | | | | | | | | |
Asset replacement | | | 305 | | | | | | | | | | | | 100 | | | | Ongoing | |
Optimisation projects and initiatives | | | 305 | | | | | | | | | | | | 2,500 | | | | Ongoing | |
| | | | | | | | | | | | | | | | | | | | |
Total Property, Plant and Equipment | | | | | | | | | | | | | | | 2,600 | | | | | |
| | | | | | | | | | | | | | | | | | | | |
| | | | | |
STADIUMS QUEENSLAND | | | | | | | | | | | | | | | | | | | | |
| | | | | |
Property, Plant and Equipment | | | | | | | | | | | | | | | | | | | | |
Annual capital program | | | Various | | | | | | | | | | | | 17,847 | | | | Ongoing | |
Safe, secure sporting and entertainment facilities | | | Various | | | | 8,300 | | | | 4,800 | | | | 3,500 | | | | | |
Gabba refurbishment | | | 303 | | | | 35,000 | | | | | | | | 35,000 | | | | | |
| | | | | | | | | | | | | | | | | | | | |
Total Property, Plant and Equipment | | | | | | | | | | | | | | | 56,347 | | | | | |
| | | | | | | | | | | | | | | | | | | | |
| | | | |
RESIDENTIAL TENANCIES AUTHORITY | | | | | | | | | | | | | | | | | |
| | | | | |
Property, Plant and Equipment | | | | | | | | | | | | | | | | | | | | |
Software enhancement | | | 305 | | | | 803 | | | | | | | | 803 | | | | | |
Hardware replacement | | | 305 | | | | 397 | | | | | | | | 397 | | | | | |
| | | | | | | | | | | | | | | | | | | | |
Total Property, Plant and Equipment | | | | | | | | | | | | | | | 1,200 | | | | | |
| | | | | | | | | | | | | | | | | | | | |
| | | | | | | | | | | | | | | | | | | | |
| | | | | | | | | | | | | | | | | | | | |
TOTAL HOUSING AND PUBLIC WORKS (PPE) | | | | | | | | 665,468 | | | | | |
| | | | | | | | | | | | | | | | | | | | |
| | | | | | | | | | | | | | | | | | | | |
| | | | | | | | | | | | | | | | | | | | |
TOTAL HOUSING AND PUBLIC WORKS (CG) | | | | | | | | | | | | 152,494 | | | | | |
| | | | | | | | | | | | | | | | | | | | |
55
Capital Statement 2019-20
| 3.10 | INNOVATION, TOURISM INDUSTRY DEVELOPMENT AND THE COMMONWEALTH GAMES |
Department of Innovation, Tourism Industry Development and the Commonwealth Games
Total capital grants for the Innovation, Tourism Industry Development and the Commonwealth Games portfolio are $93.4 million for 2019-20.
Program Highlights (Capital Grants)
| • | | $23.1 million under the Great Barrier Reef Island Resorts Rejuvenation Program to help industry rejuvenate the Great Barrier Reef island resorts and offer world-class experiences to visitors. |
| • | | $19.9 million under the Growing Tourism Infrastructure Fund, which is an element of the Queensland Government’s economic development agenda to build resilient businesses, regions and communities by creating sustainable new jobs and increasing visitor expenditure through investment in tourism infrastructure. |
| • | | $16.4 million under the Great Keppel Island Rejuvenation Pilot to stimulate major tourism redevelopment through common user infrastructure. |
| • | | $14.4 million under the Attracting Tourism Fund to position Queensland as Australia’s leading tourism destination by delivering landmark new tourism products and projects. |
| • | | $3.8 million under the Connecting with Asia initiative to grow tourism and make Queensland the destination of choice for Asian travellers by developing new tourism products and projects. |
| • | | $3.4 million under the Outback Tourism Infrastructure Fund, which is an element of the Queensland Government’s economic development agenda to build resilient businesses, regions and communities by creating sustainable new jobs and increasing visitor expenditure through investment in tourism infrastructure. |
| • | | $3.4 million under the Whitsundays Cyclone Debbie Tourism Recovery Fund, jointly funded by the Australian and Queensland Governments, to help the tourism sector recover following the devastating impact of ex-Tropical Cyclone Debbie to the Whitsunday region in March 2017. |
| • | | $2.9 million to the Mowbray North section of the Wangetti Trail, which is part of the State’s first purpose-built, multi-day walking and mountain bike trail with public and eco-accommodation facilities. |
56
Capital Statement 2019-20
| • | | $1.9 million to create a Queensland Government owned entity called FibreCo, charged with implementing the Government’s election commitment to unlock spare capacity in the Queensland government-owned fibre network. |
| • | | $1.7 million to the Australian Workers Heritage Centre Barcaldine for the development of a purpose designed entry building, café, retail outlet, children’s activity area, rest room facilities, disabled parking and environmental utilities. |
| • | | $1.5 million to finalise Gold Coast 2018 Commonwealth Games venue projects. This includes finalising the infrastructure designation for the clay target range at the Belmont Shooting Centre and finalising Commonwealth Games venue contract financial closures. |
| • | | $1 million to develop the Museum of Underwater Art, an underwater tourist attraction, by installing underwater statues at marine sites near Townsville as part of the Jobs and Regional Growth Fund. |
| | | | | | | | | | | | | | | | | | |
| Innovation, Tourism Industry Development and the Commonwealth Games | |
Project | | Statistical
Area | | Total
Estimated
Cost
$‘000 | | | Expenditure
to
30-06-19
$‘000 | | | Budget
2019-20
$‘000 | | | Post
2019-20
$‘000 | |
DEPARTMENT OF INNOVATION, TOURISM INDUSTRY DEVELOPMENT AND THE COMMONWEALTH GAMES | | | | | | | | | | | | | | | | | | |
| | | | | |
Capital Grants | | | | | | | | | | | | | | | | | | |
Great Barrier Reef Island Resorts Rejuvenation Program | | Various | | | 23,498 | | | | | | | | 23,055 | | | | 443 | |
Growing Tourism Infrastructure Fund | | Various | | | 31,581 | | | | 100 | | | | 19,916 | | | | 11,565 | |
Great Keppel Island Rejuvenation Pilot | | 308 | | | 22,314 | | | | 770 | | | | 16,374 | | | | 5,170 | |
Attracting Tourism Fund | | Various | | | 14,416 | | | | | | | | 14,416 | | | | | |
Advance Queensland - Connecting with Asia | | Various | | | 3,800 | | | | | | | | 3,800 | | | | | |
Outback Tourism Infrastructure Fund | | 315 | | | 9,300 | | | | 1,150 | | | | 3,414 | | | | 4,736 | |
Whitsundays Cyclone Debbie Tourism Recovery Fund | | 312 | | | 4,020 | | | | 654 | | | | 3,366 | | | | | |
Mowbray North section of the Wangetti Trail | | 306 | | | 5,738 | | | | 820 | | | | 2,918 | | | | 2,000 | |
FibreCo | | 315 | | | 1,900 | | | | | | | | 1,900 | | | | | |
Australian Workers Heritage Centre | | 315 | | | 2,200 | | | | 500 | | | | 1,700 | | | | | |
Museum of Underwater Art | | 318 | | | 2,000 | | | | 1,000 | | | | 1,000 | | | | | |
Belmont Shooting Centre | | 301 | | | 18,645 | | | | 17,662 | | | | 983 | | | | | |
Other Games Projects | | 309 | | | 168,641 | | | | 168,078 | | | | 563 | | | | | |
| | | | | | | | | | | | | | | | | | |
Total Capital Grants | | | | | | | | | | | | | 93,405 | | | | | |
| | | | | | | | | | | | | | | | | | |
| | | | | | | | | | | | | | | | | | |
| | | | | | | | | | | | | | | | | | |
| | | | | |
TOTAL INNOVATION, TOURISM INDUSTRY DEVELOPMENT AND THE COMMONWEALTH GAMES (CG) | | | | | | | | | | | | | 93,405 | | | | | |
| | | | | | | | | | | | | | | | | | |
57
Capital Statement 2019-20
| 3.11 | JUSTICE AND ATTORNEY-GENERAL |
The 2019-20 capital acquisitions budget for Justice and Attorney-General (including the Department of Justice and Attorney-General, Public Trustee of Queensland, Legal Aid Queensland and the Crime and Corruption Commission) is $77.5 million.
Department of Justice and Attorney-General
The Department of Justice and Attorney-General capital acquisitions budget for 2019-20 of $48.3 million will primarily focus on the upgrade of courthouses, the expansion and upgrade of the existing audio-visual capacity in the justice system, the implementation of an online Blue Card application system and a program of minor works in courthouses.
Program Highlights (Property, Plant and Equipment)
| • | | $3.1 million of $12 million to complete the upgrade to the Rockhampton Courthouse. |
| • | | $7 million of $11 million to complete the upgrade to the Beenleigh Courthouse. |
| • | | $3.5 million of $9 million to complete the upgrade to the Townsville Courthouse. |
| • | | $8.3 million of $9.8 million to implement an online Blue Card application system. |
| • | | $11.6 million to continue the ongoing program of minor works in courthouses. |
| • | | $8.9 million to expand and upgrade existing audio-visual capacity in the justice system, which includes video conferencing and in-custody court appearances. |
Public Trustee of Queensland
During 2019-20 the capital acquisitions budget is $22.1 million. This capital expenditure will enable the Public Trust Office to continue to provide a wide range of efficient services to the Queensland community, as well as continuing to maintain appropriate workplace health and safety standards for clients and staff. In addition it will support the delivery of the digital business transformation program of works.
Program Highlights (Property, Plant and Equipment)
| • | | $3.6 million to refurbish existing head office premises and improve building facilities. |
| • | | $4.5 million to upgrade office fit-outs and invest in computer hardware to manage the upgrade of telecommunications and data networks. |
| • | | $14 million to invest in digitisation projects and the business transformation program of works. |
58
Capital Statement 2019-20
Legal Aid Queensland
Legal Aid Queensland’s 2019-20 capital acquisitions budget is $2.8 million. An investment of $1.8 million will be made in major property, plant and equipment projects, including the refurbishment of the Mount Isa office and Brisbane leasehold refurbishments.
A further $283,000 will be invested to replace some motor vehicles and $550,000 will be invested in replacing multifunctional devices.
Crime and Corruption Commission
The Crime and Corruption Commission’s 2019-20 capital acquisitions budget is $4.3 million.
Program Highlights (Property, Plant and Equipment)
| • | | $1.7 million to replace computer and other information technology equipment. |
| • | | $794,000 to continue to develop a new Integrated Case Management System. |
| • | | $700,000 to replace vehicles. |
| | | | | | | | | | | | | | | | | | |
| Justice and Attorney-General | |
Project | | Statistical
Area | | Total
Estimated
Cost
$‘000 | | | Expenditure
to
30-06-19
$‘000 | | | Budget
2019-20
$‘000 | | | Post
2019-20
$‘000 | |
DEPARTMENT OF JUSTICE AND ATTORNEY-GENERAL | | | | | | | | | | | | | | | | | | |
| | | | | |
Property, Plant and Equipment | | | | | | | | | | | | | | | | | | |
Rockhampton Courthouse upgrade | | 308 | | | 12,000 | | | | 8,900 | | | | 3,100 | | | | | |
Beenleigh Courthouse upgrade | | 311 | | | 11,000 | | | | 4,000 | | | | 7,000 | | | | | |
Townsville Courthouse upgrade | | 318 | | | 9,000 | | | | 5,530 | | | | 3,470 | | | | | |
Implementation of online Blue Card application system | | 305 | | | 9,790 | | | | 1,486 | | | | 8,304 | | | | | |
Courthouses, minor capital works | | Various | | | | | | | | | | | 11,637 | | | | Ongoing | |
Expansion and upgrade of existing audio visual capacity in the justice system | | Various | | | | | | | | | | | 8,917 | | | | Ongoing | |
Minor capital works - software | | 305 | | | | | | | | | | | 2,127 | | | | Ongoing | |
Leasehold improvements | | Various | | | | | | | | | | | 1,908 | | | | Ongoing | |
Queensland Courts Information Systems | | 305 | | | | | | | | | | | 945 | | | | Ongoing | |
Other acquisitions of property, plant and equipment | | Various | | | | | | | | | | | 931 | | | | Ongoing | |
| | | | | | | | | | | | | | | | | | |
Total Property, Plant and Equipment | | | | | | | | | | | | | 48,339 | | | | | |
| | | | | | | | | | | | | | | | | | |
59
Capital Statement 2019-20
| | | | | | | | | | | | | | | | | | |
| Justice and Attorney-General | |
Project | | Statistical
Area | | Total
Estimated
Cost
$‘000 | | | Expenditure
to
30-06-19
$‘000 | | | Budget
2019-20
$‘000 | | | Post
2019-20
$‘000 | |
PUBLIC TRUSTEE OF QUEENSLAND | | | | | | | | | | | | | | | | |
| | | | | |
Property, Plant and Equipment | | | | | | | | | | | | | | | | | | |
Building improvements - head office | | 305 | | | | | | | | | | | 3,603 | | | | Ongoing | |
Plant and equipment upgrades | | Various | | | | | | | | | | | 4,461 | | | | Ongoing | |
Business transformation program of works and digital projects | | 305 | | | | | | | | | | | 14,044 | | | | Ongoing | |
| | | | | | | | | | | | | | | | | | |
Total Property, Plant and Equipment | | | | | | | | | | | | | 22,108 | | | | | |
| | | | | | | | | | | | | | | | | | |
| | | | | |
LEGAL AID QUEENSLAND | | | | | | | | | | | | | | | | | | |
| | | | | |
Property, Plant and Equipment | | | | | | | | | | | | | | | | | | |
Mt Isa office refurbishment | | 315 | | | 546 | | | | | | | | 546 | | | | | |
Brisbane leasehold refurbishments | | 305 | | | 896 | | | | | | | | 896 | | | | | |
Miscellaneous refurbishment works | | 305 | | | 410 | | | | 35 | | | | 375 | | | | | |
Building management system | | 305 | | | 145 | | | | | | | | 145 | | | | | |
Motor vehicle replacements | | 305 | | | 473 | | | | 190 | | | | 283 | | | | | |
Multifunctional device replacements | | 305 | | | 550 | | | | | | | | 550 | | | | | |
| | | | | | | | | | | | | | | | | | |
Total Property, Plant and Equipment | | | | | | | | | | | | | 2,795 | | | | | |
| | | | | | | | | | | | | | | | | | |
| | | | |
CRIME AND CORRUPTION COMMISSION | | | | | | | | | | | | | | | | |
| | | | | |
Property, Plant and Equipment | | | | | | | | | | | | | | | | | | |
Computer and other equipment | | 305 | | | 1,730 | | | | | | | | 1,730 | | | | | |
Computer software | | 305 | | | 1,754 | | | | | | | | 1,754 | | | | | |
Vehicle replacements | | 305 | | | 700 | | | | | | | | 700 | | | | | |
Leasehold improvements | | 305 | | | 105 | | | | | | | | 105 | | | | | |
| | | | | | | | | | | | | | | | | | |
Total Property, Plant and Equipment | | | | | | | | | | | | | 4,289 | | | | | |
| | | | | | | | | | | | | | | | | | |
| | | | | | | | | | | | | | | | | | |
| | | | | | | | | | | | | | | | | | |
TOTAL JUSTICE AND ATTORNEY-GENERAL (PPE) | | | | | | | | 77,531 | | | | | |
| | | | | | | | | | | | | | | | | | |
60
Capital Statement 2019-20
| 3.12 | LEGISLATIVE ASSEMBLY OF QUEENSLAND |
Legislative Assembly of Queensland
The total planned 2019-20 capital expenditure for the Legislative Assembly of Queensland is $6.8 million. Major capital projects within the parliamentary precinct include the upgrade of critical building infrastructure and services supporting the Parliamentary Annexe, the restoration and upgrade of the Parliament House heritage fence, and ongoing replacement of core information technology and audio visual system infrastructure. In 2019-20, an ongoing electorate office relocation program will continue to address changes arising from the 2017 Electoral Boundary Redistribution and other compliance and risk issues.
| | | | | | | | | | | | | | | | | | |
| Legislative Assembly of Queensland | |
Project | | Statistical
Area | | Total
Estimated
Cost
$‘000 | | | Expenditure
to
30-06-19
$‘000 | | | Budget
2019-20
$‘000 | | | Post
2019-20
$‘000 | |
LEGISLATIVE ASSEMBLY OF QUEENSLAND | | | | | | | | | | | | | | | | |
| | | | | |
Property, Plant and Equipment | | | | | | | | | | | | | | | | | | |
Critical infrastructure and services upgrade program | | 305 | | | 14,493 | | | | | | | | 3,412 | | | | 11,081 | |
Electorate office accommodation program | | Various | | | | | | | | | | | 1,000 | | | | Ongoing | |
Parliament House fence upgrade and restoration | | 305 | | | | | | | | | | | 1,000 | | | | Ongoing | |
Information technology network infrastructure | | 305 | | | | | | | | | | | 500 | | | | Ongoing | |
Parliamentary precinct audio visual infrastructure | | 305 | | | | | | | | | | | 120 | | | | Ongoing | |
Other property, plant and equipment | | 305 | | | | | | | | | | | 800 | | | | Ongoing | |
| | | | | | | | | | | | | | | | | | |
Total Property, Plant and Equipment | | | | | | | | | | | | | 6,832 | | | | | |
| | | | | | | | | | | | | | | | | | |
| | | | | | | | | | | | | | | | | | |
| | | | | | | | | | | | | | | | | | |
TOTAL LEGISLATIVE ASSEMBLY OF QUEENSLAND (PPE) | | | | 6,832 | | | | | |
| | | | | | | | | | | | | | | | | | |
61
Capital Statement 2019-20
| 3.13 | LOCAL GOVERNMENT, RACING AND MULTICULTURAL AFFAIRS |
Department of Local Government, Racing and Multicultural Affairs
The Department of Local Government, Racing and Multicultural Affairs has capital purchases of $2.8 million and capital grants of $159.5 million in 2019-20.
Program Highlights (Property, Plant and Equipment)
| • | | $1.7 million to safeguard the security of the Northern Peninsula Area water supply system through the replacement of existing asbestos cement pipelines. |
| • | | $1.1 million to develop a new grants management system to improve and simplify the administration of grants to local government. |
Program Highlights (Capital Grants)
| • | | $50 million as part of the $600 million Works for Queensland program to support local governments in regional Queensland undertake job-creating maintenance and minor infrastructure works. |
| • | | $29.4 million for the Local Government Grants and Subsidies Program which provides funding for priority infrastructure projects to meet identified community needs and to support projects that will enhance sustainable and liveable communities. |
| • | | $28.8 million as part of the $120 million Indigenous Councils Critical Infrastructure Program to support Indigenous councils to implement projects and infrastructure works relating to critical water, wastewater and solid waste assets, and provide a basis for the long-term strategic management of essential assets. |
| • | | $15 million as part of $20 million in total funding to continue coastal inundation mitigation works on five outer Torres Strait Islands, which will protect infrastructure and communities on these islands from rising sea levels and the impacts of coastal inundation. |
| • | | $12.4 million under the Racing Infrastructure Fund to assist the Queensland racing industry improve racing infrastructure across the State. |
| • | | $7 million as part of $9.1 million in total funding for the Paroo Shire Council to continue upgrades to critical sewerage infrastructure. |
62
Capital Statement 2019-20
| | | | | | | | | | | | | | | | | | | | |
| Local Government, Racing and Multicultural Affairs | |
Project | | Statistical
Area | | | Total
Estimated
Cost
$‘000 | | | Expenditure
to
30-06-19
$‘000 | | | Budget
2019-20
$‘000 | | | Post
2019-20
$‘000 | |
DEPARTMENT OF LOCAL GOVERNMENT, RACING AND MULTICULTURAL AFFAIRS | | | | | | | | | | | | | | | | | | | | |
| | | | | |
Property, Plant and Equipment | | | | | | | | | | | | | | | | | | | | |
Northern Peninsula Area water supply system - replacement of asbestos cement pipelines | | | 315 | | | | 5,000 | | | | 300 | | | | 1,700 | | | | 3,000 | |
Implementing more effective funding grants to local government | | | Various | | | | 1,300 | | | | 191 | | | | 1,109 | | | | | |
Other property, plant and equipment | | | Various | | | | | | | | | | | | 25 | | | | Ongoing | |
| | | | | | | | | | | | | | | | | | | | |
Total Property, Plant and Equipment | | | | | | | | | | | | | | | 2,834 | | | | | |
| | | | | | | | | | | | | | | | | | | | |
| | | | | |
Capital Grants | | | | | | | | | | | | | | | | | | | | |
Works for Queensland | | | Various | | | | 600,000 | | | | 480,000 | | | | 50,000 | | | | 70,000 | |
Local Government Grants and Subsidies Program | | | Various | | | | | | | | | | | | 29,392 | | | | Ongoing | |
Indigenous Councils Critical Infrastructure Program | | | Various | | | | 120,000 | | | | 52,904 | | | | 28,765 | | | | 38,331 | |
Torres Strait Islands seawalls and coastal inundation mitigation upgrades | | | 315 | | | | 20,000 | | | | 5,000 | | | | 15,000 | | | | | |
Paroo Shire Council upgrade to critical sewerage infrastructure | | | 315 | | | | 9,100 | | | | 2,100 | | | | 7,000 | | | | | |
Torres Shire Council water treatment infrastructure upgrade | | | 315 | | | | 12,000 | | | | 7,200 | | | | 4,800 | | | | | |
Major Infrastructure Program - stage 6 | | | 315 | | | | 15,000 | | | | 11,250 | | | | 3,750 | | | | | |
Beautiful Bowen - Bowen townscape project | | | 312 | | | | 5,000 | | | | 3,000 | | | | 2,000 | | | | | |
Whitsunday Coast Airport terminal expansion project | | | 312 | | | | 15,000 | | | | 13,500 | | | | 1,500 | | | | | |
Local Government Levy Ready Grant Program | | | Various | | | | 5,510 | | | | 4,507 | | | | 1,003 | | | | | |
Kuranda Skyrail and infrastructure levy | | | 306 | | | | | | | | | | | | 744 | | | | Ongoing | |
Ayr nature-based playground (Plantation Park) | | | 318 | | | | 1,500 | | | | 900 | | | | 600 | | | | | |
Racing Infrastructure Fund | | | Various | | | | 128,217 | | | | 25,693 | | | | 12,358 | | | | 90,166 | |
63
Capital Statement 2019-20
| | | | | | | | | | | | | | | | | | | | |
| Local Government, Racing and Multicultural Affairs | |
Project | | Statistical
Area | | | Total
Estimated
Cost
$‘000 | | | Expenditure
to
30-06-19
$‘000 | | | Budget
2019-20
$‘000 | | | Post
2019-20
$‘000 | |
Country Racing Program | | | Various | | | | 10,400 | | | | 5,200 | | | | 2,600 | | | | 2,600 | |
| | | | | | | | | | | | | | | | | | | | |
Total Capital Grants | | | | | | | | | | | | | | | 159,512 | | | | | |
| | | | | | | | | | | | | | | | | | | | |
| | | | | | | | | | | | | | | | | | | | |
| | | | | | | | | | | | | | | | | | | | |
TOTAL LOCAL GOVERNMENT, RACING AND MULTICULTURAL AFFAIRS (PPE) | | | | | | | | | | | | | | | 2,834 | | | | | |
| | | | | | | | | | | | | | | | | | | | |
| | | | | | | | | | | | | | | | | | | | |
| | | | | | | | | | | | | | | | | | | | |
TOTAL LOCAL GOVERNMENT, RACING AND MULTICULTURAL AFFAIRS (CG) | | | | | | | | | | | | | | | 159,512 | | | | | |
| | | | | | | | | | | | | | | | | | | | |
64
Capital Statement 2019-20
| 3.14 | NATURAL RESOURCES, MINES AND ENERGY |
The Natural Resources, Mines and Energy portfolio includes the Department of Natural Resources, Mines and Energy, energy and water supply government-owned corporations, and statutory bodies reporting to the Minister for Natural Resources, Mines and Energy. The portfolio’s capital program for 2019-20 is $2.660 billion.
Department of Natural Resources, Mines and Energy
The capital purchases for the Department of Natural Resources, Mines and Energy are estimated to be $109.6 million in 2019-20. Total capital grants for the department are estimated to be $55 million in 2019-20.
Program Highlights (Property, Plant and Equipment)
| • | | $83 million to construct the Rookwood Weir to supplement urban water supplies and enhance agricultural and industrial development in the Fitzroy Basin and Gladstone region. |
Program Highlights (Capital Grants)
| • | | $55 million to address Townsville’s long-term water security needs. |
CS Energy Limited
Total capital expenditure planned for 2019-20 is $180.7 million. This reflects CS Energy’s continued commitment to ongoing reliability and efficiency of generation plant at its power station sites.
Program Highlights (Property, Plant and Equipment)
| • | | $85.8 million for overhauls, enhancements and refurbishments to existing infrastructure at Callide Power Station. |
| • | | $84.6 million for overhauls, enhancements and refurbishments to existing infastructure at Kogan Creek Power Station. |
Stanwell Corporation Limited
Total capital expenditure planned for 2019-20 is $211.4 million. This reflects Stanwell’s continued commitment to ongoing reliability and efficiency of generation plant at its power station sites.
Program Highlights (Property, Plant and Equipment)
| • | | $69.3 million for statutory inspections, replacements and refurbishments to existing infrastructure at Tarong Power Station. |
| • | | $33.1 million for statutory inspections, replacement and refurbishment of existing infrastructure at Stanwell Power Station. |
65
Capital Statement 2019-20
Energy Queensland
Total capital expenditure planned for 2019-20 of $1.402 billion forms part of Energy Queensland’s commitment to providing safe, secure and highly reliable electricity supply to all Queensland customers. Energy Queensland is focused on efficiency, asset management and network capability. The capital program aims to improve and reinforce electricity supplies across Queensland to meet customer needs, especially to cover periods of peak electricity demand.
Program Highlights (Property, Plant and Equipment)
| • | | $47.4 million to continue work on the multi-stage SunCoast sub-transmission powerline project to increase network capacity and improve reliability. |
| • | | $1.2 million to carry out switchgear replacement and protection equipment installations at Kenmore substation to improve network performance. |
Powerlink Queensland
Total capital expenditure planned for 2019-20 is $217.9 million. Powerlink Queensland is the high voltage electricity transmission entity for Queensland. This is predominantly focused on replacement of aged equipment and assets to ensure continued reliable supply of electricity.
Program Highlights (Property, Plant and Equipment)
| • | | $1.5 million to replace aged secondary systems at Rocklea Substation in Brisbane’s south. |
| • | | $6.6 million to replace aged assets on the Collinsville to Proserpine transmission line in North Queensland. |
| • | | $3.7 million to replace primary plant and secondary systems at Mackay Substation. |
| • | | $5.7 million to install a new transformer at Calvale Substation and reconfigure the network servicing the Callide Power Station in Central Queensland. |
| • | | $6 million to upgrade Gin Gin Substation near Bundaberg. |
| • | | $5.5 million to replace aged secondary systems at two substations at Callide Power Station in Central Queensland. |
| • | | $7.7 million to replaced aged primary plant at Bouldercombe Substation near Rockhampton. |
| • | | $2.3 million to replace aged primary plant at Nebo Substation south west of Mackay. |
66
Capital Statement 2019-20
| • | | $3.6 million to replace aged secondary systems at Nebo Substation south-west of Mackay. |
Sunwater Limited
Total capital expenditure planned for 2019-20 total $81.9 million. This will focus on enhancing Sunwater’s dam infrastructure to meet extreme weather conditions and continue to provide a reliable water supply to regional Queensland as well as investing in innovative digital technology to drive collaboration and efficiency.
Program Highlights (Property, Plant and Equipment)
| • | | $18.6 million to construct gravity sidewalls in the spillway chute at Fairbairn Dam to complement earlier stages and enhance the dam to safeguard against future extreme weather events. |
| • | | $7.8 million to continue planning works to enhance the spillway at Paradise Dam to safeguard against future extreme weather events. |
| • | | $2.6 million for safety improvement works at Leslie Dam to safeguard against extreme weather events. |
| • | | $717,000 to extend the Beardmore Dam - Thuraggi Channel structure 40 metres downstream to safeguard against future extreme weather events. |
| • | | $5.9 million to continue planning works to enhance the spillway at Burdekin Falls Dam to safeguard against future extreme weather events. |
| • | | $1.4 million to enhance the saddle Teemburra Dam to safeguard against future extreme weather events. |
| • | | $4.4 million for routine capital works on irrigation water supply schemes across regional Queensland. |
| • | | $4.6 million for non-routine capital works on industrial pipelines across regional Queensland. |
| • | | $12.7 million to implement new digital enterprise business solutions across Sunwater to better service its customers. |
Gladstone Area Water Board
Total capital expenditure planned for 2019-20 is $18.2 million. The capital program is focused on continuing effective and safe operations of Gladstone Area Water Board’s property, plant and equipment.
Program Highlights (Property, Plant and Equipment)
| • | | $5.3 million to relocate the Gladstone fish hatchery. |
67
Capital Statement 2019-20
| • | | $3.4 million to construct a new pump station and connection to Gladstone Regional Council/Kirkwood Reservoir. |
| • | | $1.6 million to construct an emergency shelter at Muster Point near Awoonga Dam. |
| • | | $1.3 million to secure easements for the Gladstone-Fitzroy Pipeline. |
| • | | $1.2 million to replace sections of the pipeline from Gladstone Water Treatment Plant to South Gladstone Reservoir. |
| • | | $500,000 to install cathodic protection on pipeline at South Trees. |
| • | | $2.3 million to install various water infrastructure in the Gladstone region. |
Mount Isa Water Board
Total capital expenditure planned for 2019-20 is $8 million. The capital program is focused on continuing the cost-efficient, reliable and safe operation of Mount Isa Water Board’s water delivery infrastructure.
Program Highlights (Property, Plant and Equipment)
| • | | $1.8 million to complete Mount Isa Terminal Reservoir storage tanks project, which will provide new potable water storage tanks to replace the aged north tank, eliminate water losses, improve water supply reliability and address water quality assurance requirements. |
| • | | $882,000 to complete the renewal of aged pump sets at Lake Moondarra Deep Well Pump Station, to improve their reliability and energy efficiency. |
| • | | $1.9 million to complete the next renewal stage of the Moondarra to Mount Isa Terminal Reservoir pipeline, particularly the aged and high-risk segment downstream of Lake Moondarra Booster Station. |
Seqwater
Capital purchases for Seqwater in 2019-20 are $153.6 million. The capital program is focused on the continuation of a safe, secure and reliable water supply for South East Queensland, as well as providing essential flood mitigation services and managing catchment health. Seqwater has facilities located throughout South East Queensland. These require minor works and renewals, as well as upgrades and compliance driven works to ensure effective operation.
Program Highlights (Property, Plant and Equipment)
| • | | $5.1 million to continue the refurbishment and upgrade 20 filters at the Mount Crosby East Bank Water Treatment Plant to maintain and improve capacity and reliability. |
68
Capital Statement 2019-20
| • | | $8.2 million to commence the Ewen Maddock Dam Stage 2 safety upgrade to comply with dam safety standards for extreme weather events. |
| • | | $6.2 million to continue planning works in relation to the Somerset Dam safety upgrade to comply with dam safety standards for extreme weather events. |
| • | | $8.4 million to continue planning works in relation to the Lake Macdonald Dam safety upgrade to comply with dam safety standards for extreme weather events. |
| • | | $10 million to continue planning works for the proposed pipeline to connect Beaudesert to the water grid to secure long-term water supply. |
CleanCo Queensland Limited
Total capital expenditure planned for 2019-20 is $221.5 million. The capital program is focused on overhauls, maintenance and upgrades of generator units and establishing trading and enterprise resource planning systems.
Program Highlights (Property, Plant and Equipment)
| • | | $150 million out of a total $250 million, held centrally, for CleanCo to build, own and operate new renewable energy generation in Queensland. This funding will be provided to CleanCo as projects are approved. |
| • | | $44 million for scheduled major overhauls of existing infrastructure at Swanbank E Power Station. |
| • | | $4.7 million to implement the energy market trading system. |
| | | | | | | | | | | | | | | | | | | | |
| Natural Resources, Mines and Energy | |
Project | | Statistical
Area | | | Total
Estimated
Cost
$‘000 | | | Expenditure
to
30-06-19
$‘000 | | | Budget
2019-20
$‘000 | | | Post
2019-20
$‘000 | |
DEPARTMENT OF NATURAL RESOURCES, MINES AND ENERGY | | | | | | | | | |
| | | | | |
Property, Plant and Equipment | | | | | | | | | | | | | | | | | | | | |
Hopeland (Linc Energy) Management and Remediation Project | | | 307 | | | | 4,260 | | | | | | | | 3,770 | | | | 490 | |
Abandoned Mines - Care and Maintenance, Risk Mitigation, Remediation and Consultation | | | Various | | | | 3,300 | | | | | | | | 2,800 | | | | 500 | |
Rookwood Weir | | | 308 | | | | 352,000 | | | | 66,000 | | | | 83,000 | | | | 203,000 | |
Geoscience Data Modernisation Project (Strategic Resources Exploration Program) | | | Various | | | | 7,125 | | | | 3,766 | | | | 3,359 | | | | | |
69
Capital Statement 2019-20
| | | | | | | | | | | | | | | | | | |
| Natural Resources, Mines and Energy | |
Project | | Statistical
Area | | Total
Estimated
Cost
$‘000 | | | Expenditure
to
30-06-19
$‘000 | | | Budget
2019-20
$‘000 | | | Post
2019-20
$‘000 | |
Financial Assurance Framework Reform Program | | 305 | | | 3,975 | | | | 2,932 | | | | 1,043 | | | | | |
Water monitoring network | | Various | | | | | | | | | | | 1,150 | | | | Ongoing | |
Stock route network | | Various | | | | | | | | | | | 800 | | | | Ongoing | |
Systems development | | 305 | | | | | | | | | | | 8,627 | | | | Ongoing | |
Other property, plant and equipment | | Various | | | | | | | | | | | 5,044 | | | | Ongoing | |
| | | | | | | | | | | | | | | | | | |
Total Property, Plant and Equipment | | | | | | | | | | | | | 109,593 | | | | | |
| | | | | | | | | | | | | | | | | | |
| | | | | |
Capital Grants | | | | | | | | | | | | | | | | | | |
Townsville Water Security | | 318 | | | 215,000 | | | | 160,000 | | | | 55,000 | | | | | |
| | | | | | | | | | | | | | | | | | |
Total Capital Grants | | | | | | | | | | | | | 55,000 | | | | | |
| | | | | | | | | | | | | | | | | | |
| | | | | |
CS ENERGY LIMITED | | | | | | | | | | | | | | | | | | |
| | | | | |
Property, Plant and Equipment | | | | | | | | | | | | | | | | | | |
Callide Power Station enhancements, overhauls and refurbishment | | 308 | | | 85,794 | | | | | | | | 85,794 | | | | | |
Kogan Creek Power Station enhancements, overhauls and refurbishment | | 307 | | | 84,638 | | | | | | | | 84,638 | | | | | |
Kogan Creek Mine developments and refurbishment | | 307 | | | 1,836 | | | | | | | | 1,836 | | | | | |
Upgrade of corporate information systems to support the business | | 305 | | | 8,405 | | | | | | | | 8,405 | | | | | |
| | | | | | | | | | | | | | | | | | |
Total Property, Plant and Equipment | | | | | | | | | | | | | 180,673 | | | | | |
| | | | | | | | | | | | | | | | | | |
| | | | |
STANWELL CORPORATION LIMITED | | | | | | | | | | | | | | | | |
| | | | | |
Property, Plant and Equipment | | | | | | | | | | | | | | | | | | |
Mica Creek Power Station - minor works | | 315 | | | 9,470 | | | | 8,595 | | | | 875 | | | | | |
Stanwell Power Station - overhauls | | 308 | | | 227,738 | | | | 37,410 | | | | 33,108 | | | | 157,220 | |
Stanwell Power Station - control system upgrade | | 308 | | | 23,273 | | | | 14,255 | | | | 8,435 | | | | 583 | |
Stanwell Power Station - other sustaining projects | | 308 | | | 91,617 | | | | 31,295 | | | | 10,416 | | | | 49,906 | |
Tarong Power Station - overhauls | | 319 | | | 240,958 | | | | 34,771 | | | | 69,250 | | | | 136,937 | |
Tarong Power Station - ash off take project | | 319 | | | 16,673 | | | | 310 | | | | 16,224 | | | | 139 | |
70
Capital Statement 2019-20
| | | | | | | | | | | | | | | | | | |
| Natural Resources, Mines and Energy | |
Project | | Statistical
Area | | Total
Estimated
Cost
$‘000 | | | Expenditure
to
30-06-19
$‘000 | | | Budget
2019-20
$‘000 | | | Post
2019-20
$‘000 | |
Tarong Power Station - other sustaining projects | | 319 | | | 96,083 | | | | 38,457 | | | | 16,211 | | | | 41,415 | |
Meandu Mine - overhauls | | 319 | | | 27,095 | | | | 1,999 | | | | 6,500 | | | | 18,596 | |
Meandu Mine - dozer replacement program | | 319 | | | 31,854 | | | | | | | | 3,470 | | | | 28,384 | |
Meandu Mine - fleet ancillary equipment program | | 319 | | | 16,350 | | | | | | | | 355 | | | | 15,995 | |
Meandu Mine - minor works | | 319 | | | 61,981 | | | | 11,839 | | | | 20,915 | | | | 29,227 | |
Meandu Mine - development program | | 319 | | | 63,922 | | | | 5,923 | | | | 3,566 | | | | 54,433 | |
Information and communication technology - hardware and software upgrades | | 305 | | | 82,275 | | | | 24,292 | | | | 13,050 | | | | 44,933 | |
Information and communication technology - five minute settlements | | 305 | | | 21,369 | | | | 1,495 | | | | 8,397 | | | | 11,477 | |
Other capital projects | | 305 | | | 2,170 | | | | 837 | | | | 584 | | | | 749 | |
| | | | | | | | | | | | | | | | | | |
Total Property, Plant and Equipment | | | | | | | | | | | | | 211,356 | | | | | |
| | | | | | | | | | | | | | | | | | |
| | | | | |
ENERGY QUEENSLAND | | | | | | | | | | | | | | | | | | |
| | | | | |
Property, Plant and Equipment | | | | | | | | | | | | | | | | | | |
Other | | | | | | | | | | | | | | | | | | |
Non-System | | | | | | | | | | | | | | | | | | |
Vehicles - Ergon Energy | | Various | | | 33,410 | | | | | | | | 33,410 | | | | | |
Vehicles - Energex | | 305 | | | 22,063 | | | | | | | | 22,063 | | | | | |
Tools and equipment | | Various | | | 6,000 | | | | | | | | 6,000 | | | | | |
Tools and equipment | | 305 | | | 1,785 | | | | | | | | 1,785 | | | | | |
Searle Street Maryborough redevelopment | | 319 | | | 4,740 | | | | 210 | | | | 3,000 | | | | 1,530 | |
Proserpine redevelopment | | 312 | | | 13,636 | | | | 471 | | | | 5,152 | | | | 8,013 | |
Property and buildings | | Various | | | 70,830 | | | | 17,146 | | | | 27,000 | | | | 26,684 | |
Property - minor program for 2019-20 | | Various | | | 53,002 | | | | 27,174 | | | | 25,300 | | | | 528 | |
Information and communication technologies | | Various | | | 29,026 | | | | | | | | 29,026 | | | | | |
Information and communication technologies | | 305 | | | 25,621 | | | | | | | | 25,621 | | | | | |
Cairns Depot development | | 306 | | | 9,137 | | | | 77 | | | | 6,000 | | | | 3,060 | |
Cairns - Bunda Street | | 306 | | | 9,593 | | | | 8,083 | | | | 1,000 | | | | 510 | |
71
Capital Statement 2019-20
| | | | | | | | | | | | | | | | | | | | |
| Natural Resources, Mines and Energy | |
Project | | Statistical
Area | | | Total
Estimated
Cost
$‘000 | | | Expenditure
to
30-06-19
$‘000 | | | Budget
2019-20
$‘000 | | | Post
2019-20
$‘000 | |
Alternative Control Services | | | | | | | | | | | | | | | | | | | | |
Other regulated customer initiated capital work (alternative control services) | | | Various | | | | 70,190 | | | | | | | | 70,190 | | | | | |
Customer initiated works - Sunshine Coast | | | 316 | | | | 12,396 | | | | | | | | 12,396 | | | | | |
Customer initiated works - Ipswich | | | 310 | | | | 7,110 | | | | | | | | 7,110 | | | | | |
Customer initiated works - Brisbane | | | Various | | | | 52,502 | | | | | | | | 52,502 | | | | | |
Customer initiated works - Wide Bay/Burnett | | | 319 | | | | 6,290 | | | | | | | | 6,290 | | | | | |
Customer initiated works - Gold Coast | | | 309 | | | | 12,852 | | | | | | | | 12,852 | | | | | |
ICT | | | | | | | | | | | | | | | | | | | | |
Digital office capital expenditure | | | Various | | | | 67,489 | | | | | | | | 67,489 | | | | | |
Ergon Energy retail capital expenditure | | | 305 | | | | 33,080 | | | | | | | | 33,080 | | | | | |
Non-Regulated | | | | | | | | | | | | | | | | | | | | |
Yurika digital platform | | | 305 | | | | 32,200 | | | | 6,200 | | | | 13,000 | | | | 13,000 | |
Barcaldine Power Station upgrade | | | 315 | | | | 4,200 | | | | 2,400 | | | | 1,800 | | | | | |
Infrastructure services | | | Various | | | | 218,300 | | | | 42,000 | | | | 79,900 | | | | 96,400 | |
Unregulated metering/metering dynamics | | | 305 | | | | 264,000 | | | | 42,900 | | | | 46,300 | | | | 174,800 | |
Other isolated capital work | | | Various | | | | 25,201 | | | | | | | | 25,201 | | | | | |
Multiple site line reconductor program | | | 315 | | | | 1,064 | | | | | | | | 220 | | | | 844 | |
Isolated systems augmentation and upgrades | | | Various | | | | 13,312 | | | | 9,571 | | | | 750 | | | | 2,991 | |
Environment related projects - Torres Strait | | | 315 | | | | 2,124 | | | | 1,713 | | | | 411 | | | | | |
System | | | | | | | | | | | | | | | | | | | | |
Connections | | | | | | | | | | | | | | | | | | | | |
Other regulated customer initiated capital work (standard control services) | | | Various | | | | 71,358 | | | | | | | | 71,358 | | | | | |
Connections - Sunshine Coast | | | 316 | | | | 12,782 | | | | | | | | 12,782 | | | | | |
Connections - Ipswich | | | 310 | | | | 3,815 | | | | | | | | 3,815 | | | | | |
Connections - Gold Coast | | | 309 | | | | 7,830 | | | | | | | | 7,830 | | | | | |
Connections - Brisbane | | | Various | | | | 42,494 | | | | | | | | 42,494 | | | | | |
72
Capital Statement 2019-20
| | | | | | | | | | | | | | | | | | | | |
| Natural Resources, Mines and Energy | |
Project | | Statistical
Area | | | Total
Estimated
Cost
$‘000 | | | Expenditure
to
30-06-19
$‘000 | | | Budget
2019-20
$‘000 | | | Post
2019-20
$‘000 | |
Replacements | | | | | | | | | | | | | | | | | | | | |
Hendra Substation upgrade | | | 305 | | | | 2,679 | | | | 263 | | | | 2,395 | | | | 21 | |
Mt Crosby Substation | | | 310 | | | | 20,036 | | | | 1,739 | | | | 3,284 | | | | 15,013 | |
Yarranlea Substation upgrade | | | 307 | | | | 8,137 | | | | 4,486 | | | | 3,576 | | | | 75 | |
Toowong Substation upgrade | | | 305 | | | | 3,757 | | | | 302 | | | | 3,447 | | | | 8 | |
Toolara Forest Substation upgrade | | | 319 | | | | 5,415 | | | | 4,017 | | | | 1,398 | | | | | |
Surfers Paradise Substation upgrade | | | 309 | | | | 8,462 | | | | 316 | | | | 632 | | | | 7,514 | |
Richlands Substation upgrade | | | 310 | | | | 4,386 | | | | 537 | | | | 3,047 | | | | 802 | |
Redcliffe Substation upgrade | | | 313 | | | | 7,871 | | | | 2,332 | | | | 3,875 | | | | 1,664 | |
Queensport-Bulimba underground feeder | | | 305 | | | | 5,513 | | | | 5,217 | | | | 295 | | | | 1 | |
Protection replacement | | | Various | | | | 10,229 | | | | 7,651 | | | | 2,578 | | | | | |
Other regulated network initiated capital work - replacements | | | Various | | | | 216,783 | | | | | | | | 216,783 | | | | | |
Network initiated replacement works - Wide Bay | | | 319 | | | | 2,804 | | | | | | | | 2,804 | | | | | |
Network initiated replacement works - Sunshine Coast | | | 316 | | | | 31,461 | | | | | | | | 31,461 | | | | | |
Network initiated replacement works - Ipswich | | | 310 | | | | 10,747 | | | | | | | | 10,747 | | | | | |
Network initiated replacement works - Gold Coast | | | 309 | | | | 19,001 | | | | | | | | 19,001 | | | | | |
Network initiated replacement works - Brisbane | | | Various | | | | 91,735 | | | | | | | | 91,735 | | | | | |
Meeandah - Whinstanes underground feeder | | | 302 | | | | 8,692 | | | | 5,585 | | | | 3,084 | | | | 23 | |
Mackay Tennyson Street Substation upgrade | | | 312 | | | | 21,655 | | | | 14,276 | | | | 5,629 | | | | 1,750 | |
Low voltage small copper replacement (stage 2 and 3) | | | Various | | | | 98,484 | | | | 6,695 | | | | 10,979 | | | | 80,810 | |
Lota Substation upgrade | | | 301 | | | | 3,912 | | | | 3,820 | | | | 92 | | | | | |
Kilcoy Substation upgrade | | | 313 | | | | 10,794 | | | | 520 | | | | 7,999 | | | | 2,275 | |
Kenmore Substation upgrade | | | 304 | | | | 3,072 | | | | 1,889 | | | | 1,183 | | | | | |
Inala Substation upgrade | | | 310 | | | | 3,990 | | | | 3,796 | | | | 194 | | | | | |
Howard Substation upgrade | | | 319 | | | | 8,195 | | | | 2,160 | | | | 3,521 | | | | 2,514 | |
Herring Lagoon Substation upgrade | | | 301 | | | | 3,165 | | | | 3,115 | | | | 50 | | | | | |
73
Capital Statement 2019-20
| | | | | | | | | | | | | | | | | | |
| Natural Resources, Mines and Energy | |
Project | | Statistical
Area | | Total
Estimated
Cost
$‘000 | | | Expenditure
to
30-06-19
$‘000 | | | Budget
2019-20
$‘000 | | | Post
2019-20
$‘000 | |
Hendra - Nundah underground feeder | | 302 | | | 8,398 | | | | 275 | | | | 631 | | | | 7,492 | |
Hendra - Clayfield underground feeder | | 305 | | | 11,742 | | | | 10,313 | | | | 1,427 | | | | 2 | |
Hemmant Substation upgrade | | 301 | | | 8,957 | | | | 6,691 | | | | 2,266 | | | | | |
Glenore Grove Substation upgrade | | 310 | | | 5,804 | | | | 174 | | | | 3,614 | | | | 2,016 | |
Emerald Cornet Substation upgrade | | 308 | | | 3,477 | | | | 708 | | | | 1,773 | | | | 996 | |
Dysart Substation upgrade | | 312 | | | 12,839 | | | | 9,910 | | | | 2,889 | | | | 40 | |
Conductor Clearance to Structure | | Various | | | 40,170 | | | | | | | | 40,170 | | | | | |
Clayfield Substation upgrade | | 305 | | | 8,006 | | | | 2,766 | | | | 4,360 | | | | 880 | |
Chermside Substation upgrade | | 302 | | | 5,595 | | | | 2,140 | | | | 685 | | | | 2,770 | |
Charters Towers Substation upgrade | | 318 | | | 3,930 | | | | 3,235 | | | | 695 | | | | | |
Barcaldine Substation upgrade | | 315 | | | 3,411 | | | | | | | | 1,567 | | | | 1,844 | |
Augmentation | | | | | | | | | | | | | | | | | | |
Gracemere Substation | | 308 | | | 11,520 | | | | 1,490 | | | | 1,037 | | | | 8,993 | |
SunCoast Power Project | | 316 | | | 106,718 | | | | 59,300 | | | | 47,418 | | | | | |
Safety net implementation | | Various | | | 7,324 | | | | 6,731 | | | | 356 | | | | 237 | |
Other regulated network initiated capital work - augmentation | | Various | | | 43,601 | | | | | | | | 43,601 | | | | | |
Network initiated capacity augmentation - Sunshine Coast | | 316 | | | 16,503 | | | | | | | | 16,503 | | | | | |
Network initiated capacity augmentation - Ipswich | | 310 | | | 5,345 | | | | | | | | 5,345 | | | | | |
Network initiated capacity augmentation - Gold Coast | | 309 | | | 10,422 | | | | | | | | 10,422 | | | | | |
Network initiated capacity augmentation - Brisbane | | Various | | | 34,541 | | | | | | | | 34,541 | | | | | |
| | | | | | | | | | | | | | | | | | |
Total Property, Plant and Equipment | | | | | | | | | | | | | 1,402,216 | | | | | |
| | | | | | | | | | | | | | | | | | |
| | | | | |
POWERLINK QUEENSLAND | | | | | | | | | | | | | | | | | | |
| | | | | |
Property, Plant and Equipment | | | | | | | | | | | | | | | | | | |
Rocklea Substation secondary systems replacement | | 303 | | | 21,100 | | | | 16,532 | | | | 1,477 | | | | 3,091 | |
74
Capital Statement 2019-20
| | | | | | | | | | | | | | | | | | |
| Natural Resources, Mines and Energy | |
Project | | Statistical
Area | | Total
Estimated
Cost
$‘000 | | | Expenditure
to
30-06-19
$‘000 | | | Budget
2019-20
$‘000 | | | Post
2019-20
$‘000 | |
Collinsville to Proserpine transmission line refit | | 312 | | | 34,300 | | | | 27,422 | | | | 6,613 | | | | 265 | |
Mackay Substation replacement | | 312 | | | 28,000 | | | | 23,047 | | | | 3,695 | | | | 1,258 | |
Callide A / Calvale 132kV network reinvestment | | 308 | | | 34,800 | | | | 12,923 | | | | 5,693 | | | | 16,184 | |
Gin Gin Substation rebuild | | 319 | | | 22,800 | | | | 15,326 | | | | 6,012 | | | | 1,462 | |
Calvale & Callide B secondary systems replacement | | 308 | | | 21,800 | | | | 11,477 | | | | 5,500 | | | | 4,823 | |
Bouldercombe primary plant replacement | | 308 | | | 22,800 | | | | 4,678 | | | | 7,722 | | | | 10,400 | |
Nebo primary plant replacement | | 312 | | | 22,500 | | | | 14,878 | | | | 2,262 | | | | 5,360 | |
Nebo secondary systems replacement | | 312 | | | 21,000 | | | | 11,384 | | | | 3,587 | | | | 6,029 | |
Total non-prescribed transmission network connections | | Various | | | | | | | | | | | 36,284 | | | | Ongoing | |
Total other projects | | Various | | | | | | | | | | | 139,102 | | | | Ongoing | |
| | | | | | | | | | | | | | | | | | |
Total Property, Plant and Equipment | | | | | | | | | | | | | 217,947 | | | | | |
| | | | | | | | | | | | | | | | | | |
| | | | | |
SUNWATER LIMITED | | | | | | | | | | | | | | | | | | |
| | | | | |
Property, Plant and Equipment | | | | | | | | | | | | | | | | | | |
Digital Enterprise Business Solution project | | 305 | | | 14,759 | | | | | | | | 12,697 | | | | 2,062 | |
Non-infrastructure capital investments | | Various | | | 10,421 | | | | | | | | 2,777 | | | | 7,644 | |
Burdekin Falls Dam improvement project - planning works | | 318 | | | 10,131 | | | | 4,204 | | | | 5,927 | | | | | |
Mareeba Dimbulah Channel efficiency improvements | | 315 | | | 17,280 | | | | 1,951 | | | | 5,879 | | | | 9,450 | |
Nogoa Mackenzie Channel efficiency improvements | | 308 | | | 9,260 | | | | 1,169 | | | | 2,198 | | | | 5,893 | |
Teemburra Dam improvement project - planning works | | 312 | | | 10,797 | | | | 683 | | | | 1,446 | | | | 8,668 | |
Leslie Dam improvement project - planning works | | 307 | | | 28,834 | | | | 474 | | | | 2,621 | | | | 25,739 | |
Other major dam improvement works | | Various | | | 36,544 | | | | | | | | 6,404 | | | | 30,140 | |
Irrigation schemes non-routine program of capital works | | Various | | | 20,612 | | | | | | | | 4,381 | | | | 16,231 | |
Industrial pipelines non-routine program of capital works | | Various | | | 15,718 | | | | | | | | 4,629 | | | | 11,089 | |
75
Capital Statement 2019-20
| | | | | | | | | | | | | | | | | | |
| Natural Resources, Mines and Energy | |
Project | | Statistical
Area | | Total
Estimated
Cost
$‘000 | | | Expenditure
to
30-06-19
$‘000 | | | Budget
2019-20
$‘000 | | | Post
2019-20
$‘000 | |
Beardmore Dam - Thuraggi Channel repair | | 307 | | | 1,967 | | | | 1,250 | | | | 717 | | | | | |
Burdekin Falls Dam raising feasibility studies | | 318 | | | 14,258 | | | | | | | | 5,831 | | | | 8,427 | |
Fairbairn Dam improvement project | | 308 | | | 40,000 | | | | 21,427 | | | | 18,573 | | | | | |
Paradise Dam improvement project - planning works | | 319 | | | 12,080 | | | | 3,070 | | | | 7,818 | | | | 1,192 | |
| | | | | | | | | | | | | | | | | | |
Total Property, Plant and Equipment | | | | | | | | | | | | | 81,898 | | | | | |
| | | | | | | | | | | | | | | | | | |
| | | | | |
GLADSTONE AREA WATER BOARD | | | | | | | | | | | | | | | | | | |
| | | | | |
Property, Plant and Equipment | | | | | | | | | | | | | | | | | | |
Hatchery relocation | | 308 | | | 6,663 | | | | 1,380 | | | | 5,283 | | | | | |
Connection to Gladstone Regional Council/Kirkwood Reservoir | | 308 | | | 4,240 | | | | 884 | | | | 3,356 | | | | | |
Muster Point - emergency shelter | | 308 | | | 1,706 | | | | 60 | | | | 1,646 | | | | | |
Gladstone-Fitzroy Pipeline transition and management | | 308 | | | 6,866 | | | | 5,566 | | | | 1,300 | | | | | |
Gladstone Water Treatment Plant to South Gladstone Reservoir Stage 3 Pipeline | | 308 | | | 1,342 | | | | 142 | | | | 1,200 | | | | | |
Capital work orders - Performance Plan reference | | 308 | | | 1,886 | | | | 1,182 | | | | 704 | | | | | |
Mobile emergency electrical generation unit | | 308 | | | 991 | | | | 491 | | | | 500 | | | | | |
Condition assessment of South Trees Pipe | | 308 | | | 1,276 | | | | 776 | | | | 500 | | | | | |
Offline storage fencing, gates and embankment access barrier gate | | 308 | | | 495 | | | | | | | | 495 | | | | | |
Switchboard upgrade - 136 Goondoon Street | | 308 | | | 375 | | | | | | | | 375 | | | | | |
Offline storage floating barriers around pump inlets | | 308 | | | 310 | | | | | | | | 310 | | | | | |
Data centre relocation | | 308 | | | 275 | | | | | | | | 275 | | | | | |
Other projects | | 308 | | | 9,009 | | | | 6,720 | | | | 2,289 | | | | | |
| | | | | | | | | | | | | | | | | | |
Total Property, Plant and Equipment | | | | | | | | | | | | | 18,233 | | | | | |
| | | | | | | | | | | | | | | | | | |
76
Capital Statement 2019-20
| | | | | | | | | | | | | | | | | | | | |
| Natural Resources, Mines and Energy | |
Project | | Statistical
Area | | | Total
Estimated
Cost
$‘000 | | | Expenditure
to
30-06-19
$‘000 | | | Budget
2019-20
$‘000 | | | Post
2019-20
$‘000 | |
MOUNT ISA WATER BOARD | | | | | | | | | | | | | | | | | | | | |
| | | | | |
Property, Plant and Equipment | | | | | | | | | | | | | | | | | | | | |
Power reliability - Hilton to Lake Julius | | | 315 | | | | | | | | | | | | 585 | | | | Ongoing | |
Other plant and equipment | | | 315 | | | | | | | | | | | | 85 | | | | Ongoing | |
Mount Isa Terminal Reservoir storage tanks | | | 315 | | | | 4,324 | | | | 2,546 | | | | 1,778 | | | | | |
Mount Isa City Council Supply - diesel backup | | | 315 | | | | 1,303 | | | | 145 | | | | 1,158 | | | | | |
Moondarra to Mount Isa Terminal Reservoir pipeline upgrade | | | 315 | | | | 2,840 | | | | 976 | | | | 1,864 | | | | | |
Lake Moondarra Deep Well Pump Station pumps renewal | | | 315 | | | | 901 | | | | 19 | | | | 882 | | | | | |
Lake Julius power pole replacement | | | 315 | | | | | | | | | | | | 285 | | | | Ongoing | |
Control systems supervisory control and data acquisition upgrade | | | 315 | | | | 384 | | | | 314 | | | | 70 | | | | | |
Chlorine dose equipment upgrade | | | 315 | | | | 517 | | | | 367 | | | | 150 | | | | | |
Asset renewals | | | 315 | | | | | | | | | | | | 470 | | | | Ongoing | |
Asset enhancement | | | 315 | | | | | | | | | | | | 704 | | | | Ongoing | |
| | | | | | | | | | | | | | | | | | | | |
Total Property, Plant and Equipment | | | | | | | | | | | | | | | 8,031 | | | | | |
| | | | | | | | | | | | | | | | | | | | |
| | | | | |
SEQWATER | | | | | | | | | | | | | | | | | | | | |
| | | | | |
Property, Plant and Equipment | | | | | | | | | | | | | | | | | | | | |
Mount Crosby East Bank Water Treatment Plant filtration upgrade | | | 310 | | | | 34,171 | | | | 5,031 | | | | 5,096 | | | | 24,044 | |
Ewen Maddock Dam safety upgrade - stage 2 | | | 316 | | | | 23,450 | | | | 1,740 | | | | 8,230 | | | | 13,480 | |
Somerset Dam safety upgrade (planning costs) | | | 310 | | | | 8,879 | | | | 2,688 | | | | 6,191 | | | | | |
Lake Macdonald Dam upgrade - stage 2 (planning costs) | | | 316 | | | | 19,779 | | | | 11,375 | | | | 8,404 | | | | | |
Beaudesert Water Supply Zone upgrade (planning costs) | | | 311 | | | | 16,126 | | | | 6,130 | | | | 9,996 | | | | | |
Water treatment improvements | | | Various | | | | | | | | | | | | 34,371 | | | | Ongoing | |
Other infrastructure improvements | | | Various | | | | | | | | | | | | 63,269 | | | | Ongoing | |
Non-infrastructure capital works | | | Various | | | | | | | | | | | | 9,199 | | | | Ongoing | |
Information and communication technology capital program | | | Various | | | | | | | | | | | | 8,811 | | | | Ongoing | |
| | | | | | | | | | | | | | | | | | | | |
Total Property, Plant and Equipment | | | | | | | | | | | | | | | 153,567 | | | | | |
| | | | | | | | | | | | | | | | | | | | |
77
Capital Statement 2019-20
| | | | | | | | | | | | | | | | | | | | |
| Natural Resources, Mines and Energy | |
Project | | Statistical
Area | | | Total
Estimated
Cost
$‘000 | | | Expenditure
to
30-06-19
$‘000 | | | Budget
2019-20
$‘000 | | | Post
2019-20
$‘000 | |
CLEANCO QUEENSLAND LIMITED | | | | | | | | | | | | | | | | | | | | |
| | | | | |
Property, Plant and Equipment | | | | | | | | | | | | | | | | | | | | |
New Renewable Generation1 | | | Various | | | | 250,000 | | | | | | | | 150,000 | | | | 100,000 | |
Wivenhoe Split Yard Creek maintenance | | | 310 | | | | 315 | | | | | | | | 315 | | | | | |
Wivenhoe Silo 2 lift | | | 310 | | | | 306 | | | | | | | | 306 | | | | | |
Wivenhoe Silo 1 lift | | | 310 | | | | 265 | | | | | | | | 265 | | | | | |
Wivenhoe other projects | | | 310 | | | | 2,000 | | | | | | | | 2,000 | | | | | |
Wivenhoe W1 major overhaul preparation work | | | 310 | | | | 740 | | | | | | | | 740 | | | | | |
Barron Gorge Hydro other projects | | | 306 | | | | 208 | | | | | | | | 208 | | | | | |
Kareeya Hydro bridge upgrade | | | 306 | | | | 1,400 | | | | | | | | 1,400 | | | | | |
Kareeya Hydro connection upgrade | | | 306 | | | | 900 | | | | | | | | 900 | | | | | |
Kareeya Hydro Governor Control System | | | 306 | | | | 726 | | | | | | | | 726 | | | | | |
Kareeya Hydro essential services shed | | | 306 | | | | 300 | | | | | | | | 300 | | | | | |
Kareeya Hydro other projects | | | 306 | | | | 1,400 | | | | | | | | 1,400 | | | | | |
Koombooloomba Hydro other projects | | | 306 | | | | 120 | | | | | | | | 120 | | | | | |
Swanbank E major overhaul | | | 310 | | | | 44,000 | | | | | | | | 44,000 | | | | | |
Swanbank E site accommodation | | | 310 | | | | 2,700 | | | | | | | | 2,700 | | | | | |
Swanbank E fast start upgrade | | | 310 | | | | 2,900 | | | | | | | | 2,900 | | | | | |
Swanbank E low part load | | | 310 | | | | 800 | | | | | | | | 800 | | | | | |
Swanbank E site reconfiguration | | | 310 | | | | 600 | | | | | | | | 600 | | | | | |
Swanbank E heater replacement | | | 310 | | | | 450 | | | | | | | | 450 | | | | | |
Swanbank E other projects | | | 310 | | | | 800 | | | | | | | | 800 | | | | | |
Corporate - Energy Trading System | | | 305 | | | | | | | | | | | | 4,650 | | | | Ongoing | |
Corporate - Enterprise Resource Planning (ERP) system | | | 305 | | | | | | | | | | | | 2,000 | | | | Ongoing | |
Corporate - asset advisory/TSA transition | | | 305 | | | | | | | | | | | | 1,200 | | | | Ongoing | |
Corporate - general corporate systems | | | 305 | | | | | | | | | | | | 1,000 | | | | Ongoing | |
Corporate - design and build core hosted IT services | | | 305 | | | | | | | | | | | | 500 | | | | Ongoing | |
Corporate - information technology services - business modelling and implementation | | | 305 | | | | | | | | | | | | 400 | | | | Ongoing | |
78
Capital Statement 2019-20
| | | | | | | | | | | | | | | | | | | | |
| Natural Resources, Mines and Energy | |
Project | | Statistical
Area | | | Total
Estimated
Cost
$‘000 | | | Expenditure
to
30-06-19
$‘000 | | | Budget
2019-20
$‘000 | | | Post
2019-20
$‘000 | |
Corporate - information technology services - equipment | | | 305 | | | | | | | | | | | | 300 | | | | Ongoing | |
Corporate - other projects | | | 305 | | | | | | | | | | | | 500 | | | | Ongoing | |
| | | | | | | | | | | | | | | | | | | | |
Total Property, Plant and Equipment | | | | | | | | | | | | | | | 221,480 | | | | | |
| | | | | | | | | | | | | | | | | | | | |
| | | | | | | | | | | | | | | | | | | | |
| | | | | | | | | | | | | | | | | | | | |
TOTAL NATURAL RESOURCES, MINES AND ENERGY (PPE) | | | | 2,604,994 | | | | | |
| | | | | | | | | | | | | | | | | | | | |
| | | | | | | | | | | | | | | | | | | | |
| | | | | | | | | | | | | | | | | | | | |
TOTAL NATURAL RESOURCES, MINES AND ENERGY (CG) | | | | 55,000 | | | | | |
| | | | | | | | | | | | | | | | | | | | |
Note:
| 1. | Additional funding of $150 million in 2019-20 (of $250 million total) is being held centrally for CleanCo Queensland Limited to own and operate new renewable energy generation in Queensland. This funding will be provided to CleanCo as projects are approved. |
79
Capital Statement 2019-20
| 3.15 | PUBLIC SAFETY BUSINESS AGENCY |
Public Safety Business Agency
The 2019-20 Public Safety Business Agency capital program of $263.6 million supports the delivery of essential frontline public safety services to Queensland communities.
The program will fund capital works, vehicles, information technology and other essential equipment for the Queensland Fire and Emergency Services (QFES), Queensland Police Service (QPS) and the Office of the Inspector-General Emergency Management.
Queensland Fire and Emergency Services
In 2019-20, $97.7 million is provided for fire and emergency services facilities, fire appliances and information and communications systems and equipment, including:
| • | | $11.1 million to continue the replacement of the regional QFES headquarters and the new permanent fire and rescue station at Charlton. |
| • | | $5.4 million to complete the replacement of the permanent fire and rescue station at Bracken Ridge and upgrade the permanent fire and rescue station at West Logan. |
| • | | $4.8 million to complete replacement of the auxiliary fire and rescue stations at El Arish, Esk and Yarraman. |
| • | | $2.5 million to continue the upgrade of the QFES complex at Mount Isa. |
| • | | $2.1 million to continue the replacement QFES complex at Maleny and complete the replacement QFES complex at Kilkivan. |
| • | | $2 million to continue the new permanent fire and rescue station at Pimpama. |
| • | | $1.7 million to complete the replacement QFES facility at Rathdowney. |
| • | | $1.5 million to commence the replacement QFES mechanical workshop at Pinkenba. |
| • | | $1 million to commence the Cairns QFES communications centre upgrade collocated with the Queensland Ambulance Service. |
| • | | $900,000 to commence replacement of the composite fire and rescue station at Charters Towers. |
| • | | $800,000 to complete the new Weipa QFES emergency and disaster centre. |
| • | | $550,000 to commence replacement of the auxiliary fire and rescue stations at Gracemere, Longreach, Rainbow Beach and Rosewood. |
80
Capital Statement 2019-20
| • | | $300,000 to commence the new permanent fire and rescue station at Yarrabilba. |
| • | | $250,000 to commence replacement of the permanent fire and rescue station at Loganlea. |
| • | | $50,000 to commence the relocation and upgrade of the auxiliary fire and rescue station at Mossman. |
| • | | $3.6 million for QFES strategic land acquisitions and rural operations land purchases. |
| • | | $50 million for replacement and new fire and rescue and rural fire appliances. |
| • | | $5.6 million for QFES minor capital works across the State, including upgrades of fire and rescue station amenities. |
| • | | $3.6 million for QFES information and communications systems and other plant and equipment. |
Queensland Police Service
In 2019-20, $153.7 million is provided for Queensland Police Service facilities, information and communication technology and other essential equipment, including:
| • | | $28 million to continue the new Counter Terrorism and Community Safety Training Centre at Wacol. |
| • | | $12.1 million to complete the new Saibai Island Community Safety and Security Facility. |
| • | | $10.8 million to complete the new police facility at Arundel. |
| • | | $5.7 million to complete the new police warehouse facility at Wacol. |
| • | | $4.9 million to continue the replacement police facility at Pormpuraaw. |
| • | | $4.6 million to continue the new police facility at Highfields and replacement police facilities at Beaudesert, Coolum and Nambour. |
| • | | $2.4 million to continue the upgrades of the Aurukun and West End police facilities and refurbishment of the old Caboolture police facility. |
| • | | $844,000 to complete the replacement police facility and district headquarters at Caboolture and new police facility at Newtown. |
| • | | $300,000 to complete the upgrade of the Logan Village police facility to service the Yarrabilba community and surrounds. |
| • | | $200,000 to commence the replacement police facility at Biloela. |
81
Capital Statement 2019-20
| • | | $41.1 million for new and replacement police service vehicles. |
| • | | $6 million for the police service vessel management program. |
| • | | $20.3 million for QPS information and communications systems, including the Public Safety Network. |
| • | | $9.5 million for air-conditioning replacement, closed-circuit camera upgrades and electricity optimisation programs at police facilities across the State. |
| • | | $7 million for QPS minor capital works and other plant and equipment across the state. |
Public Safety Business Agency - Other Departmental Capital
| • | | $7.1 million to maintain aircraft. |
| • | | $4 million to support Queensland Ambulance Service information and communication technology. |
| • | | $300,000 for other departmental information systems development. |
| • | | $850,000 for other plant and equipment. |
| | | | | | | | | | | | | | | | | | |
| Public Safety Business Agency | |
Project | | Statistical
Area | | Total
Estimated
Cost
$‘000 | | | Expenditure
to
30-06-19
$‘000 | | | Budget
2019-20
$‘000 | | | Post
2019-20
$‘000 | |
PUBLIC SAFETY BUSINESS AGENCY | | | | | | | | | | | | | | | | | | |
| | | | | |
Property, Plant and Equipment | | | | | | | | | | | | | | | | | | |
Queensland Fire and Emergency Services | | | | | | | | | | | | | | | | | | |
Buildings | | | | | | | | | | | | | | | | | | |
Bracken Ridge replacement permanent fire and rescue station | | 302 | | | 6,766 | | | | 1,753 | | | | 5,013 | | | | | |
Cairns QFES communications centre upgrade collocated with Queensland Ambulance Service | | 306 | | | 3,000 | | | | | | | | 1,000 | | | | 2,000 | |
Charlton replacement regional QFES headquarters and new permanent fire and rescue station | | 317 | | | 16,967 | | | | 500 | | | | 11,067 | | | | 5,400 | |
Charters Towers replacement composite fire and rescue station | | 318 | | | 3,000 | | | | | | | | 900 | | | | 2,100 | |
82
Capital Statement 2019-20
| | | | | | | | | | | | | | | | | | |
| Public Safety Business Agency | |
Project | | Statistical
Area | | Total
Estimated
Cost
$‘000 | | | Expenditure
to
30-06-19
$‘000 | | | Budget
2019-20
$‘000 | | | Post
2019-20
$‘000 | |
El Arish replacement auxiliary fire and rescue station | | 306 | | | 1,800 | | | | 100 | | | | 1,700 | | | | | |
Esk replacement auxiliary fire and rescue station | | 310 | | | 1,800 | | | | 100 | | | | 1,700 | | | | | |
Gracemere replacement auxiliary fire and rescue station | | 308 | | | 2,200 | | | | | | | | 200 | | | | 2,000 | |
Kilkivan replacement QFES complex | | 319 | | | 1,800 | | | | 200 | | | | 1,600 | | | | | |
Loganlea replacement permanent fire and rescue station | | 311 | | | 3,500 | | | | | | | | 250 | | | | 3,250 | |
Longreach replacement auxiliary fire and rescue station | | 315 | | | 3,100 | | | | | | | | 100 | | | | 3,000 | |
Maleny replacement QFES1 complex | | 316 | | | 2,500 | | | | 50 | | | | 500 | | | | 1,950 | |
Mossman auxiliary fire and rescue station relocation and upgrade | | 306 | | | 2,000 | | | | | | | | 50 | | | | 1,950 | |
Mount Isa QFES complex upgrade | | 315 | | | 3,400 | | | | 400 | | | | 2,500 | | | | 500 | |
Pimpama new permanent fire and rescue station | | 309 | | | 3,000 | | | | 200 | | | | 2,000 | | | | 800 | |
Pinkenba replacement QFES mechanical workshop | | 302 | | | 9,000 | | | | | | | | 1,500 | | | | 7,500 | |
Rainbow Beach replacement auxiliary fire and rescue station | | 319 | | | 2,000 | | | | | | | | 200 | | | | 1,800 | |
Rathdowney replacement QFES facility | | 311 | | | 2,101 | | | | 364 | | | | 1,737 | | | | | |
Rosewood replacement auxiliary fire and rescue station | | 310 | | | 2,000 | | | | | | | | 50 | | | | 1,950 | |
Weipa new QFES emergency and disaster centre | | 315 | | | 1,200 | | | | 400 | | | | 800 | | | | | |
West Logan permanent fire and rescue station upgrade | | 311 | | | 650 | | | | 250 | | | | 400 | | | | | |
Yarrabilba new permanent fire and rescue station | | 311 | | | 3,900 | | | | | | | | 300 | | | | 3,600 | |
83
Capital Statement 2019-20
| | | | | | | | | | | | | | | | | | |
| Public Safety Business Agency | |
Project | | Statistical
Area | | Total
Estimated
Cost
$‘000 | | | Expenditure
to
30-06-19
$‘000 | | | Budget
2019-20
$‘000 | | | Post
2019-20
$‘000 | |
Yarraman replacement auxiliary fire and rescue station | | 307 | | | 1,500 | | | | 150 | | | | 1,350 | | | | | |
QFES minor works | | Various | | | | | | | | | | | 5,590 | | | | Ongoing | |
Land | | | | | | | | | | | | | | | | | | |
QFES strategic land acquisitions | | Various | | | | | | | | | | | 3,350 | | | | Ongoing | |
QFES rural operations land purchases | | Various | | | | | | | | | | | 200 | | | | Ongoing | |
Plant and Equipment | | | | | | | | | | | | | | | | | | |
Rural fire appliances | | Various | | | | | | | | | | | 4,309 | | | | Ongoing | |
Fire and rescue appliances | | Various | | | | | | | | | | | 45,712 | | | | Ongoing | |
QFES information and communications equipment | | Various | | | | | | | | | | | 3,376 | | | | Ongoing | |
QFES other plant and equipment | | Various | | | | | | | | | | | 250 | | | | Ongoing | |
| | | | | | | | | | | | | | | | | | |
Sub-total Queensland Fire and Emergency Services | | | | | | | | | | | 97,704 | | | | | |
| | | | | | | | | | | | | | | | | | |
| | | | | |
Queensland Police Service | | | | | | | | | | | | | | | | | | |
Buildings | | | | | | | | | | | | | | | | | | |
Arundel new police facility | | 309 | | | 11,500 | | | | 736 | | | | 10,764 | | | | | |
Aurukun police facility upgrade | | 315 | | | 6,700 | | | | 211 | | | | 640 | | | | 5,849 | |
Beaudesert replacement police facility | | 311 | | | 7,095 | | | | 495 | | | | 800 | | | | 5,800 | |
Biloela replacement police facility | | 308 | | | 2,100 | | | | | | | | 200 | | | | 1,900 | |
Caboolture replacement police facility and district headquarters | | 313 | | | 17,296 | | | | 17,152 | | | | 144 | | | | | |
Caboolture refurbishment of old police facility | | 313 | | | 13,795 | | | | 456 | | | | 1,292 | | | | 12,047 | |
Coolum replacement police facility | | 316 | | | 2,700 | | | | 182 | | | | 1,611 | | | | 907 | |
Highfields new police facility | | 317 | | | 2,769 | | | | 194 | | | | 2,060 | | | | 515 | |
Logan Village - Yarrabilba police facility upgrade | | 311 | | | 550 | | | | 250 | | | | 300 | | | | | |
Nambour replacement police facility | | 316 | | | 9,040 | | | | 412 | | | | 100 | | | | 8,528 | |
Newtown new police facility | | 317 | | | 900 | | | | 200 | | | | 700 | | | | | |
Pormpuraaw replacement police facility | | 315 | | | 8,200 | | | | 243 | | | | 4,894 | | | | 3,063 | |
Saibai Island new Community Safety and Security Facility | | 315 | | | 13,066 | | | | 1,013 | | | | 12,053 | | | | | |
84
Capital Statement 2019-20
| | | | | | | | | | | | | | | | | | | | |
| Public Safety Business Agency | |
Project | | Statistical
Area | | | Total
Estimated
Cost
$‘000 | | | Expenditure
to
30-06-19
$‘000 | | | Budget
2019-20
$‘000 | | | Post
2019-20
$‘000 | |
Wacol new QPS Counter-Terrorism and Community Safety Training Centre | | | 310 | | | | 52,219 | | | | 8,549 | | | | 28,000 | | | | 15,670 | |
Wacol new police warehouse facility | | | 310 | | | | 20,000 | | | | 14,260 | | | | 5,740 | | | | | |
West End police facility upgrade | | | 305 | | | | 4,300 | | | | 158 | | | | 510 | | | | 3,632 | |
QPS air conditioning plant replacement program | | | Various | | | | | | | | | | | | 4,000 | | | | Ongoing | |
Closed circuit camera upgrades in various police facilities | | | Various | | | | | | | | | | | | 2,000 | | | | Ongoing | |
QPS electricity optimisation program | | | Various | | | | | | | | | | | | 3,500 | | | | Ongoing | |
QPS minor works | | | Various | | | | | | | | | | | | 5,800 | | | | Ongoing | |
Plant and Equipment | | | | | | | | | | | | | | | | | | | | |
QPS Information and communication technology | | | Various | | | | | | | | | | | | 11,222 | | | | Ongoing | |
QPS Public Safety Network | | | 305 | | | | | | | | | | | | 9,045 | | | | Ongoing | |
QPS new and replacement vehicles | | | Various | | | | | | | | | | | | 41,111 | | | | Ongoing | |
QPS vessel management program | | | Various | | | | | | | | | | | | 5,965 | | | | Ongoing | |
QPS other plant and equipment | | | Various | | | | | | | | | | | | 1,200 | | | | Ongoing | |
| | | | | | | | | | | | | | | | | | | | |
Sub-total Queensland Police Service | | | | | | | | | | | | | | | 153,651 | | | | | |
| | | | | | | | | | | | | | | | | | | | |
| | | | | |
Other Departmental | | | | | | | | | | | | | | | | | | | | |
Aircraft maintenance | | | Various | | | | | | | | | | | | 7,091 | | | | Ongoing | |
Queensland Ambulance Service information systems development | | | Various | | | | | | | | | | | | 4,025 | | | | Ongoing | |
Other departmental information systems development | | | Various | | | | | | | | | | | | 300 | | | | Ongoing | |
Other departmental plant and equipment | | | Various | | | | | | | | | | | | 850 | | | | Ongoing | |
| | | | | | | | | | | | | | | | | | | | |
Sub-total Other Departmental | | | | | | | | | | | | | | | 12,266 | | | | | |
| | | | | | | | | | | | | | | | | | | | |
| | | | | | | | | | | | | | | | | | | | |
| | | | | | | | | | | | | | | | | | | | |
Total Property, Plant and Equipment | | | | | | | | | | | | | | | 263,621 | | | | | |
| | | | | | | | | | | | | | | | | | | | |
| | | | | | | | | | | | | | | | | | | | |
| | | | | | | | | | | | | | | | | | | | |
TOTAL PUBLIC SAFETY BUSINESS AGENCY (PPE) | | | | | | | | 263,621 | | | | | |
| | | | | | | | | | | | | | | | | | | | |
Note:
| 1. | Part of the $3 million commitment for a new complex for emergency services in Maleny. $500,000 for this project is included in strategic land acquisitions. |
85
Capital Statement 2019-20
| 3.16 | QUEENSLAND CORRECTIVE SERVICES |
Queensland Corrective Service’s capital purchases for 2019-20 of $126.7 million will primarily focus on prison infrastructure, perimeter security upgrades and correctional centre enhancements.
Queensland Corrective Services
Program Highlights (Property, Plant and Equipment)
| • | | $88 million of $241 million to provide an additional 348 cells at Capricornia Correctional Centre. |
| • | | $6 million of $76.6 million to continue upgrading the perimeter security at a number of correctional centres as part of Stage 2 of the Perimeter Security Upgrade Program. |
| • | | $7 million of $16.6 million in to enhance Woodford Correctional Centre and Princess Alexandra Hospital Secure Unit. |
| • | | $2.1 million to complete various prison infrastructure projects. |
| • | | $2.2 million to support the implementation of Taskforce Flaxton. |
| • | | $500,000 of $3 million to upgrade the commercial laundry in the Brisbane Correctional Centre. |
| • | | $20.9 million to acquire other property, plant and equipment. |
| | | | | | | | | | | | | | | | | | | | |
| Queensland Corrective Services | |
Project | | Statistical
Area | | | Total
Estimated
Cost
$‘000 | | | Expenditure
to
30-06-19
$‘000 | | | Budget
2019-20
$‘000 | | | Post
2019-20
$‘000 | |
QUEENSLAND CORRECTIVE SERVICES | | | | | | | | | | | | | | | | | |
| | | | | |
Property, Plant and Equipment | | | | | | | | | | | | | | | | | | | | |
Queensland Corrective Services | | | | | | | | | | | | | | | | | | | | |
Major works - correctional centres | | | | | | | | | | | | | | | | | | | | |
Capricornia Correctional Centre expansion | | | 308 | | | | 241,000 | | | | 103,703 | | | | 88,000 | | | | 49,297 | |
Perimeter Security Upgrade Program - stage 2 | | | Various | | | | 76,579 | | | | 70,579 | | | | 6,000 | | | | | |
| | | | | | | | | | | | | | | | | | | | |
Sub-total Major works - correctional centres | | | | | | | | | | | | 94,000 | | | | | |
| | | | | | | | | | | | | | | | | | | | |
86
Capital Statement 2019-20
| | | | | | | | | | | | | | | | | | | | |
| Queensland Corrective Services | |
Project | | Statistical
Area | | | Total
Estimated
Cost
$‘000 | | | Expenditure
to
30-06-19
$‘000 | | | Budget
2019-20
$‘000 | | | Post
2019-20
$‘000 | |
Correctional centre enhancements | | | | | | | | | | | | | | | | | | | | |
Woodford Correctional Centre - intercoms | | | 313 | | | | 13,600 | | | | | | | | 5,000 | | | | 8,600 | |
Princess Alexandra Hospital secure unit | | | 303 | | | | 3,000 | | | | | | | | 2,000 | | | | 1,000 | |
Prison Infrastructure | | | Various | | | | 16,936 | | | | 12,816 | | | | 2,120 | | | | 2,000 | |
| | | | | | | | | | | | | | | | | | | | |
Sub-total Correctional centre enhancements | | | | | | | | | | | | | | | 9,120 | | | | | |
| | | | | | | | | | | | | | | | | | | | |
| | | | | |
Information technology Taskforce Flaxton | | | Various | | | | 2,200 | | | | | | | | 2,200 | | | | | |
| | | | | | | | | | | | | | | | | | | | |
Sub-total Information technology | | | | | | | | | | | | | | | 2,200 | | | | | |
| | | | | | | | | | | | | | | | | | | | |
| | | | | |
Other acquisitions of property, plant and equipment | | | | | | | | | | | | | | | | | | | | |
Brisbane Correctional Centre laundry | | | 310 | | | | 3,000 | | | | | | | | 500 | | | | 2,500 | |
Other acquisitions of property, plant and equipment | | | Various | | | | | | | | | | | | 20,889 | | | | Ongoing | |
| | | | | | | | | | | | | | | | | | | | |
Sub-total Other acquisitions of property, plant and equipment | | | | | | | | | | | | | | | 21,389 | | | | | |
| | | | | | | | | | | | | | | | | | | | |
| | | | | | | | | | | | | | | | | | | | |
| | | | | | | | | | | | | | | | | | | | |
Sub-total Queensland Corrective Services | | | | | | | | | | | | | | | 126,709 | | | | | |
| | | | | | | | | | | | | | | | | | | | |
| | | | | | | | | | | | | | | | | | | | |
| | | | | | | | | | | | | | | | | | | | |
Total Property, Plant and Equipment | | | | | | | | | | | | | | | 126,709 | | | | | |
| | | | | | | | | | | | | | | | | | | | |
| | | | | | | | | | | | | | | | | | | | |
| | | | | | | | | | | | | | | | | | | | |
TOTAL QUEENSLAND CORRECTIVE SERVICES (PPE) | | | | | | | | | | | | | | | 126,709 | | | | | |
| | | | | | | | | | | | | | | | | | | | |
87
Capital Statement 2019-20
| 3.17 | QUEENSLAND FIRE AND EMERGENCY SERVICES |
Queensland Fire and Emergency Services
Most new and ongoing capital initiatives to support Queensland Fire and Emergency Services (QFES) operational capability are delivered by the Public Safety Business Agency. This includes fire and emergency services facilities, fire appliances and information and communications equipment.
QFES continues to be responsible for delivering operational equipment and information systems development to support the provision of fire and rescue and emergency management services throughout Queensland.
In 2019-20, QFES will invest $5.5 million in capital purchases and $897,000 in capital grants.
Program Highlights (Property, Plant and Equipment)
| • | | $4 million for operational equipment, which includes protective clothing such as fully encapsulated gas suits and equipment to service them, specialist and field-portable scientific analysis and detection equipment, and compressors for self-contained breathing apparatus. Equipment purchases also include motorised swiftwater rescue craft, battery powered rescue equipment, accommodation shelters and satellite communications hardware for deployable disaster response. |
| • | | $1.2 million for additions and upgrades to information systems. |
| • | | $250,000 for State Emergency Service (SES) on-boarding to the Government Wireless Network in South East Queensland, to support volunteers and local government and enhance an integrated emergency response. |
Program Highlights (Capital Grants)
| • | | $712,000 for State Emergency Service capital grants. |
| • | | $185,000 for Rural Fire Brigade capital grants. |
88
Capital Statement 2019-20
| | | | | | | | | | | | | | | | | | | | |
| Queensland Fire and Emergency Services | |
Project | | Statistical
Area | | | Total
Estimated
Cost
$‘000 | | | Expenditure
to
30-06-19
$‘000 | | | Budget
2019-20
$‘000 | | | Post
2019-20
$‘000 | |
QUEENSLAND FIRE AND EMERGENCY SERVICES | | | | | | | | | | | | | | | | | | | | |
| | | | | |
Property, Plant and Equipment | | | | | | | | | | | | | | | | | | | | |
Operational equipment | | | Various | | | | | | | | | | | | 4,000 | | | | Ongoing | |
Information systems development | | | Various | | | | | | | | | | | | 1,200 | | | | Ongoing | |
SES on-boarding to the Government Wireless Network | | | Various | | | | 500 | | | | 250 | | | | 250 | | | | | |
| | | | | | | | | | | | | | | | | | | | |
Total Property, Plant and Equipment | | | | | | | | | | | | | | | 5,450 | | | | | |
| | | | | | | | | | | | | | | | | | | | |
| | | | | |
Capital Grants | | | | | | | | | | | | | | | | | | | | |
Rural Fire Brigades | | | Various | | | | | | | | | | | | 185 | | | | Ongoing | |
State Emergency Service | | | Various | | | | | | | | | | | | 712 | | | | Ongoing | |
| | | | | | | | | | | | | | | | | | | | |
Total Capital Grants | | | | | | | | | | | | | | | 897 | | | | | |
| | | | | | | | | | | | | | | | | | | | |
| | | | | | | | | | | | | | | | | | | | |
| | | | | | | | | | | | | | | | | | | | |
TOTAL QUEENSLAND FIRE AND EMERGENCY SERVICES (PPE) | | | | | | | | 5,450 | | | | | |
| | | | | | | | | | | | | | | | | | | | |
| | | | | | | | | | | | | | | | | | | | |
| | | | | | | | | | | | | | | | | | | | |
TOTAL QUEENSLAND FIRE AND EMERGENCY SERVICES (CG) | | | | | | | | 897 | | | | | |
| | | | | | | | | | | | | | | | | | | | |
89
Capital Statement 2019-20
The Queensland public healthcare system comprises the Department of Health, Queensland Ambulance Service (QAS), the Council of the Queensland Institute of Medical Research (QIMR), the Queensland Mental Health Commission, the Office of the Health Ombudsman, and 16 independent Hospital and Health Services. The total capital investment program in 2019-20 for Queensland Health, including QIMR, is $777.7 million.
Queensland Health and Hospital and Health Services
The Queensland Health capital investment program works to ensure staff, patients, and communities have access to contemporary health infrastructure that supports the delivery of health services. Health infrastructure that is fit for purpose and ensures value for money underpins the delivery of quality frontline services for patients and better healthcare in the community. The department takes a strategic view to ensure health infrastructure, healthcare technology, and information and communications technology (ICT) strengthen our public health system to meet changing models of care and growing health service demand.
Program Highlights (Property, Plant and Equipment)
In 2019-20, Queensland Health will continue to invest in health infrastructure, capital works and purchases across a broad range of areas including hospitals, ambulance stations and vehicles, health technology, research and scientific services, mental health services, staff accommodation and ICT.
Hospital and health facility project highlights in 2019-20 will include:
| • | | $36.3 million as part of the total funding for the Building Better Hospitals program including: |
$7.5 million for the Logan Hospital expansion which will deliver an additional 206 beds with a vertical expansion of Building 3 and targeted refurbishment of other key locations;
$18.4 million for the Caboolture Hospital expansion to deliver an additional 130 beds and refurbishment of critical clinical support services;
$10 million for Stage 1A of the Ipswich Hospital expansion, which will include new mental health facilities for adults and older persons and a Magnetic Resonance Imaging (MRI) suite to grow clinical capacity; and
$400,000 plus additional funding of $2.3 million from the Metro South Hospital and Health Service for the Logan Hospital Maternity Services upgrade, with the refurbishment to deliver six additional maternity inpatient beds, five extra birthing suites, an expanded special care nursery with 10 additional cots, and the installation of birthing pools suitable for water birthing.
90
Capital Statement 2019-20
| • | | $80 million under the Priority Capital Program to be distributed across Hospital and Health Services and Health Support Queensland for a range of capital works projects to enhance or replace existing infrastructure and to sustain and improve business and service level continuity. The program seeks to address legislative compliance (including fire safety and food safety), essential services (including electricity, water supply and sewerage), major plant and systems (including air-conditioners, chillers, lifts and infrastructure and call systems) and major building elements (including foundations, floors, walls and roofs). |
| • | | $78.6 million as part of the Enhancing Regional Hospitals Program, to continue the delivery of the Roma Hospital redevelopment and upgrade of the Gladstone Hospital Emergency Department. |
| • | | $40.7 million, as part of the Rural and Regional Infrastructure Package, to: continue to deliver redevelopments for Blackall Hospital, Sarina Hospital, Kingaroy Hospital, Townsville Hospital Clinical Services and Maryborough Hospital Emergency Department and Specialist Outpatients Department; for staff accommodation projects across the State; and to replace the Mer (Murray) Island Primary Health Care Centre and build a new mental health unit at Cairns Hospital. |
| • | | $34.5 million as part of the Advancing Queensland’s Health Infrastructure Program to continue essential upgrades to health facilities and supporting infrastructure across Queensland, including repurposing of Nambour General Hospital, redevelopment of the Atherton Hospital, redevelopment of Thursday Island Hospital, and delivery of a new health precinct for the southern corridor of Cairns. |
| • | | $27.9 million to continue the delivery of a new Adolescent Extended Treatment Facility at The Prince Charles Hospital, two new Adolescent Step Up Step Down units in Brisbane, and refurbishment of two adolescent Day Program spaces at Logan and the Gold Coast. |
| • | | $27 million to continue building a new multi-storey car park at the Redcliffe Hospital. |
| • | | $15.7 million to continue replacing non-compliant cladding at Princess Alexandra Hospital. |
| • | | $10.7 million to fit out an additional ward on Level 12 of the Queensland Children’s Hospital. |
| • | | $6.4 million funding to continue developing a detailed business case for a new Toowoomba Hospital on the Baillie Henderson site. |
91
Capital Statement 2019-20
| • | | $3.9 million to complete the refurbishment of the Boulia Primary Health Care Centre as part of the Significant Regional Infrastructure Projects Program. |
| • | | $1.7 million to build a new multi-storey carpark at the Caboolture Hospital. |
| • | | $1.4 million for a four-bed expansion of the Redland Hospital Emergency Department and an expansion of the birthing suites from six to seven, including a suite suitable for water birthing. |
| • | | $988,000 to develop a new 42-bed residential drug rehabilitation and treatment facility in Rockhampton as part of the Government’s Action on Ice strategy. |
In 2019-20, $92.1 million will be invested in the prioritised ICT categories to ensure continued efficiency of the Queensland Health system. This investment will transform health services and enable new ways of delivering healthcare, support the integrated electronic Medical Record rollout (ieMR), mitigate the risk of digital infrastructure failure, and improve equity of service at rural and remote sites.
The Government is providing funding, held centrally, to support the delivery of a new 22-bed adult acute mental health inpatient unit at Hervey Bay Hospital and the refurbishment of the existing acute mental health inpatient unit at Maryborough Hospital. The Government has sought funding for the projects under the Australian Government’s Community Health and Hospitals Program and is awaiting outcomes.
Hospital and Health Services will allocate $166.8 million in 2019-20 for capital projects across Queensland. Projects include:
| • | | $73 million in funding distributed to Hospital and Health Services for the Health Technology Equipment Replacement Program across the State. |
| • | | $58.3 million in funding distributed to Hospital and Health Services for Minor Capital Projects and Acquisitions across the State. |
| • | | $6.2 million to provide modular health pods for a transit lounge and sub-acute ward to address current bed capacity and decanting issues at the Logan Hospital. |
| • | | $5.9 million in funding to support the ieMR project in the Toowoomba Hospital and across the Darling Downs Hospital and Health Service. |
| • | | $4.8 million to extend existing ICT services and develop new ICT services at the Sunshine Coast University Hospital. |
| • | | $4.1 million to construct an additional operating theatre, to support additional surgery and improve workflows, and upgrade current storage space to conform with sterile stock storage standards at the Redcliffe Hospital. |
92
Capital Statement 2019-20
| • | | $1.5 million to provide a Mental Health Clinical Decision Unit in the courtyard of the Logan Hospital Emergency Department. |
In 2019-20, $82.5 million has been allocated to other acquisitions of property, plant and equipment across the State, including:
| • | | $17.7 million to replace the current Laboratory Information Systems. |
| • | | $13 million to replace the Pathology Queensland Laboratory General Chemistry and Immunoassay analysers across 34 laboratories statewide, including the introduction of new sample processing and track automation. |
| • | | $6.9 million to continue delivery of the Regional eHealth project to introduce an electronic health record system for regional and remote communities in Far North Queensland. |
Queensland Ambulance Service
In 2019-20, the Queensland Ambulance Service will invest $55.7 million in capital purchases to support essential frontline services to provide the highest possible quality pre-hospital emergency and non-emergency care and services to the community. In implementing its capital program, the QAS will review opportunities for co-location with health services, thus improving the close linkages and working relationships between public hospitals, as well as other emergency management infrastructure. Highlights of the capital program include:
| • | | $7.5 million for ambulance facilities, including planning and progression of new stations at Urraween, Drayton, Yarrabilba and Munruben, and replacement stations at Kirwan and Mareeba. |
| • | | $2.2 million to refurbish the Rockhampton Ambulance Station and Operations Centre and redevelop the Cairns Ambulance Station and Operations Centre. |
| • | | $300,000 to plan an upgrade for the Southport Ambulance Station and Gold Coast Operations Centre. |
| • | | $5 million investment in minor works at various existing stations to improve functionality, amenities and prolong useful life. |
| • | | $1.5 million investment to acquire strategically located land to accommodate future expansion of services in identified growth areas. |
| • | | $24 million for vehicles and stretchers including commissioning 122 new and replacement ambulance vehicles and to continue the rollout of power-assisted stretchers. |
| • | | $6.4 million investment in ICT for software development projects to enhance patient care and service delivery. |
93
Capital Statement 2019-20
| • | | $8.8 million in operational equipment, such as chest compression devices and push-to-talk satellite radios, to support frontline services. |
Council of the Queensland Institute of Medical Research
The QIMR Berghofer capital program in 2019-20 will invest $4.3 million to acquire new and/or replacement state-of-the-art scientific equipment and research facilities.
| | | | | | | | | | | | | | | | | | |
| Queensland Health1 | |
Project | | Statistical
Area | | Total
Estimated
Cost
$‘000 | | | Expenditure
to
30-06-19
$‘000 | | | Budget
2019-20
$‘000 | | | Post
2019-20
$‘000 | |
QUEENSLAND HEALTH AND HOSPITAL AND HEALTH SERVICES | | | | | | | | | |
| | | | | |
Property, Plant and Equipment2 | | | | | | | | | | | | | | | | | | |
Hospital and Health Services | | | | | | | | | | | | | | | | | | |
Advancing Queensland’s Health Infrastructure Program | | Various | | | 230,000 | | | | 26,501 | | | | 34,495 | | | | 169,004 | |
Building Better Hospitals | | | | | | | | | | | | | | | | | | |
Caboolture Hospital expansion3 | | 313 | | | 352,900 | | | | 9,100 | | | | 18,400 | | | | 325,400 | |
Ipswich Hospital expansion -3 Stage 1A | | 310 | | | 127,500 | | | | 3,500 | | | | 10,000 | | | | 114,000 | |
Logan Hospital expansion3 | | 311 | | | 460,871 | | | | 10,242 | | | | 7,500 | | | | 443,129 | |
Logan Hospital Maternity4 Services upgrade | | 311 | | | 15,600 | | | | 100 | | | | 400 | | | | 15,100 | |
Caboolture Hospital multi-storey car park | | 313 | | | 46,610 | | | | | | | | 1,650 | | | | 44,960 | |
Cairns Hospital Central Sterilising Department | | 306 | | | 1,000 | | | | 721 | | | | 279 | | | | | |
Cairns Hybrid Theatre | | 306 | | | 3,681 | | | | 1,562 | | | | 2,119 | | | | | |
Enhancing Regional Hospitals Program | | | | | | | | | | | | | | | | | | |
Gladstone Hospital Emergency Department | | 308 | | | 42,000 | | | | 11,888 | | | | 22,121 | | | | 7,991 | |
Roma Hospital redevelopment | | 307 | | | 98,100 | | | | 33,682 | | | | 56,448 | | | | 7,970 | |
Logan Hospital Maternity access road | | 311 | | | 3,048 | | | | 45 | | | | 335 | | | | 2,668 | |
Master planning studies | | Various | | | | | | | | | | | 2,157 | | | | Ongoing | |
Princess Alexandra Hospital cladding project | | 303 | | | 45,545 | | | | 13,197 | | | | 15,700 | | | | 16,648 | |
Princess Alexandra Hospital Rehabilitation Unit | | 303 | | | 3,000 | | | | 1,646 | | | | 1,354 | | | | | |
Priority Capital Program5 | | Various | | | | | | | | | | | 80,000 | | | | Ongoing | |
Queensland Children’s Hospital Level 12 fitout | | 305 | | | 20,000 | | | | 252 | | | | 10,651 | | | | 9,097 | |
94
Capital Statement 2019-20
| | | | | | | | | | | | | | | | | | |
| Queensland Health1 | |
Project | | Statistical
Area | | Total
Estimated
Cost
$‘000 | | | Expenditure
to
30-06-19
$‘000 | | | Budget
2019-20
$‘000 | | | Post
2019-20
$‘000 | |
Redcliffe Hospital carpark | | 313 | | | 36,780 | | | | 1,296 | | | | 27,015 | | | | 8,469 | |
Redland Hospital upgrade | | 301 | | | 1,730 | | | | 365 | | | | 1,365 | | | | | |
Rockhampton drug rehabiliation and treatment facility | | 308 | | | 9,500 | | | | 134 | | | | 988 | | | | 8,378 | |
Rural and Regional Infrastructure Package | | | | | | | | | | | | | | | | | | |
Blackall Hospital redevelopment | | 315 | | | 17,900 | | | | 647 | | | | 2,650 | | | | 14,603 | |
Cairns Hospital Mental Health Unit | | 306 | | | 70,000 | | | | 1,354 | | | | 2,805 | | | | 65,841 | |
Kingaroy Hospital6 redevelopment | | 319 | | | 68,900 | | | | 10,538 | | | | 23,830 | | | | 34,532 | |
Maryborough Hospital Emergency Department | | 319 | | | 7,185 | | | | 2,527 | | | | 2,473 | | | | 2,185 | |
Maryborough Hospital Specialist Outpatients refurbishment | | 319 | | | 5,000 | | | | 4,364 | | | | 636 | | | | | |
Mer (Murray) Island building replacement | | 315 | | | 7,000 | | | | 683 | | | | 274 | | | | 6,043 | |
Sarina Hospital redevelopment | | 312 | | | 16,500 | | | | 329 | | | | 1,041 | | | | 15,130 | |
Townsville Hospital Clinical Services redevelopment | | 318 | | | 10,400 | | | | 6,038 | | | | 3,861 | | | | 501 | |
Staff accommodation program | | Various | | | 13,150 | | | | 6,173 | | | | 3,143 | | | | 3,834 | |
Significant Regional Infrastructure Projects Program | | | | | | | | | | | | | | | | | | |
Boulia Primary Health Care Centre refurbishment | | 315 | | | 7,243 | | | | 1,902 | | | | 3,890 | | | | 1,451 | |
South East Queensland - adolescent mental health facilities | | Various | | | 68,237 | | | | 34,630 | | | | 27,946 | | | | 5,661 | |
South East Queensland - Planning for Growth | | | | | | | | | | | | | | | | | | |
Caboolture Hospital Emergency Department expansion | | 313 | | | 19,600 | | | | 17,968 | | | | 1,484 | | | | 148 | |
Sunshine Coast University Hospital | | 316 | | | 1,872,151 | | | | 1,792,125 | | | | 2,740 | | | | 77,286 | |
Toowoomba Hospital redevelopment detailed business case | | 317 | | | 9,000 | | | | 753 | | | | 6,385 | | | | 1,862 | |
University of Queensland Oral Health Centre at Herston | | 305 | | | 4,699 | | | | 4,280 | | | | 119 | | | | 300 | |
| | | | | | | | | | | | | | | | | | |
Sub-total Hospital and Health Services | | | | | | | | | | | | | 376,254 | | | | | |
| | | | | | | | | | | | | | | | | | |
95
Capital Statement 2019-20
| | | | | | | | | | | | | | | | | | |
| Queensland Health1 | |
Project | | Statistical
Area | | Total
Estimated
Cost
$‘000 | | | Expenditure
to
30-06-19
$‘000 | | | Budget
2019-20
$‘000 | | | Post
2019-20
$‘000 | |
Other acquisitions of property, plant and equipment | | | | | | | | | | | | | | | | | | |
Building works capital project management | | Various | | | | | | | | | | | 850 | | | | Ongoing | |
Children’s Health Queensland Imaging Informatics Program | | 305 | | | 5,900 | | | | 2,976 | | | | 2,924 | | | | | |
Emergent Works Program funding | | Various | | | 20,000 | | | | | | | | 18,000 | | | | 2,000 | |
Gold Coast Medical Imaging Informatics Program | | 309 | | | 12,800 | | | | 9,436 | | | | 3,364 | | | | | |
Health technology equipment replacement | | Various | | | | | | | | | | | 4,334 | | | | Ongoing | |
Laboratory information systems | | Various | | | 60,905 | | | | 33,035 | | | | 17,717 | | | | 10,153 | |
Mareeba Hospital new CT scanner | | 306 | | | 5,000 | | | | 300 | | | | 3,494 | | | | 1,206 | |
Queensland Health external cladding taskforce project | | Various | | | 8,500 | | | | 4,483 | | | | 4,017 | | | | | |
Redcliffe Hospital MRI machine and second CT scanner | | 313 | | | 16,000 | | | | | | | | 3,000 | | | | 13,000 | |
Regional eHealth | | Various | | | 34,950 | | | | 28,056 | | | | 6,894 | | | | | |
Statewide General Chemistry and Immunoassay Replacement and Automation Project | | Various | | | 16,511 | | | | | | | | 13,010 | | | | 3,501 | |
Townsville Hospital MRI machine7 | | 318 | | | 2,350 | | | | 1,919 | | | | 431 | | | | | |
Minor capital projects and8 acquisitions | | Various | | | | | | | | | | | 4,496 | | | | Ongoing | |
| | | | | | | | | | | | | | | | | | |
Sub-total Other acquisitions of property, plant and equipment | | | | | | | | | | | | | 82,531 | | | | | |
| | | | | | | | | | | | | | | | | | |
| | | | | |
Information and communications technology | | | | | | | | | | | | | | | | | | |
Information and communications technology | | Various | | | | | | | | | | | 92,117 | | | | Ongoing | |
| | | | | | | | | | | | | | | | | | |
Sub-total Information and communications technology | | | | | | | | | | | | | 92,117 | | | | | |
| | | | | | | | | | | | | | | | | | |
| | | | | |
Cairns and Hinterland | | | | | | | | | | | | | | | | | | |
Health technology equipment | | 306 | | | | | | | | | | | 4,789 | | | | Ongoing | |
Minor capital projects and acquisitions | | 306 | | | | | | | | | | | 3,096 | | | | Ongoing | |
BreastScreen van for Cairns | | 306 | | | 900 | | | | | | | | 900 | | | | | |
| | | | | | | | | | | | | | | | | | |
Sub-total Cairns and Hinterland | | | | | | | | | | | | | 8,785 | | | | | |
| | | | | | | | | | | | | | | | | | |
96
Capital Statement 2019-20
| | | | | | | | | | | | | | | | | | |
| Queensland Health1 | |
Project | | Statistical
Area | | Total
Estimated
Cost
$‘000 | | | Expenditure
to
30-06-19
$‘000 | | | Budget
2019-20
$‘000 | | | Post
2019-20
$‘000 | |
Central Queensland | | | | | | | | | | | | | | | | | | |
Health technology equipment | | 308 | | | | | | | | | | | 1,661 | | | | Ongoing | |
Minor capital projects and acquisitions | | 308 | | | | | | | | | | | 2,274 | | | | Ongoing | |
| | | | | | | | | | | | | | | | | | |
Sub-total Central Queensland | | | | | | | | | | | | | 3,935 | | | | | |
| | | | | | | | | | | | | | | | | | |
| | | | | |
Central West | | | | | | | | | | | | | | | | | | |
Health technology equipment | | 315 | | | | | | | | | | | 332 | | | | Ongoing | |
Minor capital projects and acquisitions | | 315 | | | | | | | | | | | 760 | | | | Ongoing | |
| | | | | | | | | | | | | | | | | | |
Sub-total Central West | | | | | | | | | | | | | 1,092 | | | | | |
| | | | | | | | | | | | | | | | | | |
| | | | | |
Children’s Health Queensland | | | | | | | | | | | | | | | | | | |
Health technology equipment | | 305 | | | | | | | | | | | 1,764 | | | | Ongoing | |
Minor capital projects and acquisitions | | 305 | | | | | | | | | | | 1,668 | | | | Ongoing | |
| | | | | | | | | | | | | | | | | | |
Sub-total Children’s Health Queensland | | | | | | | | | | | | | 3,432 | | | | | |
| | | | | | | | | | | | | | | | | | |
| | | | | |
Darling Downs | | | | | | | | | | | | | | | | | | |
Health technology equipment | | 317 | | | | | | | | | | | 2,925 | | | | Ongoing | |
Minor capital projects and acquisitions | | 317 | | | | | | | | | | | 3,518 | | | | Ongoing | |
ieMR - Toowoomba Hospital | | 317 | | | 1,400 | | | | | | | | 1,400 | | | | | |
ieMR - additional commitment | | 317 | | | 4,500 | | | | | | | | 4,500 | | | | | |
Toowoomba Hospital Renal Unit | | 317 | | | 3,287 | | | | | | | | 3,287 | | | | | |
| | | | | | | | | | | | | | | | | | |
Sub-total Darling Downs | | | | | | | | | | | | | 15,630 | | | | | |
| | | | | | | | | | | | | | | | | | |
| | | | | |
Gold Coast | | | | | | | | | | | | | | | | | | |
Health technology equipment | | 309 | | | | | | | | | | | 7,972 | | | | Ongoing | |
Minor capital projects and acquisitions | | 309 | | | | | | | | | | | 3,543 | | | | Ongoing | |
| | | | | | | | | | | | | | | | | | |
Sub-total Gold Coast | | | | | | | | | | | | | 11,515 | | | | | |
| | | | | | | | | | | | | | | | | | |
| | | | | |
Mackay | | | | | | | | | | | | | | | | | | |
Health technology equipment | | 312 | | | | | | | | | | | 2,734 | | | | Ongoing | |
Minor capital projects and acquisitions | | 312 | | | | | | | | | | | 1,489 | | | | Ongoing | |
Proserpine Simulation Laboratory | | 312 | | | | | | | | | | | 100 | | | | Ongoing | |
| | | | | | | | | | | | | | | | | | |
Sub-total Mackay | | | | | | | | | | | | | 4,323 | | | | | |
| | | | | | | | | | | | | | | | | | |
97
Capital Statement 2019-20
| | | | | | | | | | | | | | | | | | | | |
| Queensland Health1 | |
Project | | Statistical
Area | | | Total
Estimated
Cost
$‘000 | | | Expenditure
to
30-06-19
$‘000 | | | Budget
2019-20
$‘000 | | | Post
2019-20
$‘000 | |
Metro North | | | | | | | | | | | | | | | | | | | | |
Health technology equipment | | | 302 | | | | | | | | | | | | 16,042 | | | | Ongoing | |
Minor capital projects and acquisitions | | | 302 | | | | | | | | | | | | 14,365 | | | | Ongoing | |
Acute bed capacity at Redcliffe Hospital | | | 313 | | | | 8,436 | | | | 8,306 | | | | 130 | | | | | |
Caboolture additional 32-bed ward, Stage 2 ward fitout | | | 313 | | | | 8,560 | | | | 8,471 | | | | 89 | | | | | |
Nuclear Medicine Hot-Laboratory expansions | | | 305 | | | | 6,110 | | | | 5,809 | | | | 236 | | | | 65 | |
Redcliffe Operating Theatre Level 2 | | | 313 | | | | 5,450 | | | | 767 | | | | 4,118 | | | | 565 | |
Redcliffe Hospital Day Procedure5 Unit | | | 313 | | | | 2,694 | | | | 120 | | | | 2,574 | | | | | |
Royal Brisbane and Women’s Hospital Queensland Sony You Can Centre | | | 305 | | | | 2,478 | | | | 1,912 | | | | 243 | | | | 323 | |
Royal Brisbane and Women’s Hospital Health Support Queensland relocations | | | 305 | | | | 4,976 | | | | 3,998 | | | | 192 | | | | 786 | |
| | | | | | | | | | | | | | | | | | | | |
Sub-total Metro North | | | | | | | | | | | | | | | 37,989 | | | | | |
| | | | | | | | | | | | | | | | | | | | |
| | | | | |
Metro South | | | | | | | | | | | | | | | | | | | | |
Health technology equipment | | | 303 | | | | | | | | | | | | 16,741 | | | | Ongoing | |
Minor capital projects and4 acquisitions | | | 303 | | | | | | | | | | | | 11,086 | | | | Ongoing | |
Logan Hospital Mental Health Clinical Decision Unit | | | 311 | | | | 1,531 | | | | 70 | | | | 1,461 | | | | | |
Logan Hospital modular hospital units | | | 311 | | | | 6,295 | | | | 140 | | | | 6,155 | | | | | |
Logan Hospital Maternity Services upgrade | | | 311 | | | | 2,275 | | | | | | | | 2,275 | | | | | |
| | | | | | | | | | | | | | | | | | | | |
Sub-total Metro South | | | | | | | | | | | | | | | 37,718 | | | | | |
| | | | | | | | | | | | | | | | | | | | |
| | | | | |
North West | | | | | | | | | | | | | | | | | | | | |
Health technology equipment | | | 315 | | | | | | | | | | | | 592 | | | | Ongoing | |
Minor capital projects and acquisitions | | | 315 | | | | | | | | | | | | 869 | | | | Ongoing | |
| | | | | | | | | | | | | | | | | | | | |
Sub-total North West | | | | | | | | | | | | | | | 1,461 | | | | | |
| | | | | | | | | | | | | | | | | | | | |
98
Capital Statement 2019-20
| | | | | | | | | | | | | | | | | | | | |
| Queensland Health1 | |
Project | | Statistical
Area | | | Total
Estimated
Cost
$‘000 | | | Expenditure
to
30-06-19
$‘000 | | | Budget
2019-20
$‘000 | | | Post
2019-20
$‘000 | |
South West | | | | | | | | | | | | | | | | | | | | |
Health technology equipment | | | 315 | | | | | | | | | | | | 526 | | | | Ongoing | |
Minor capital projects and acquisitions | | | 315 | | | | | | | | | | | | 882 | | | | Ongoing | |
Waroona Dementia Wing | | | 315 | | | | 750 | | | | | | | | 750 | | | | | |
| | | | | | | | | | | | | | | | | | | | |
Sub-total South West | | | | | | | | | | | | | | | 2,158 | | | | | |
| | | | | | | | | | | | | | | | | | | | |
| | | | | |
Sunshine Coast | | | | | | | | | | | | | | | | | | | | |
Health technology equipment | | | 316 | | | | | | | | | | | | 5,548 | | | | Ongoing | |
Minor capital projects and acquisitions | | | 316 | | | | | | | | | | | | 2,969 | | | | Ongoing | |
Sunshine Coast University Hospital Group 4 ICT Project | | | 316 | | | | 66,300 | | | | 53,332 | | | | 4,790 | | | | 8,178 | |
| | | | | | | | | | | | | | | | | | | | |
Sub-total Sunshine Coast | | | | | | | | | | | | | �� | | 13,307 | | | | | |
| | | | | | | | | | | | | | | | | | | | |
| | | | | |
Torres and Cape | | | | | | | | | | | | | | | | | | | | |
Health technology equipment | | | 315 | | | | | | | | | | | | 892 | | | | Ongoing | |
Minor capital projects and acquisitions | | | 315 | | | | | | | | | | | | 2,334 | | | | Ongoing | |
| | | | | | | | | | | | | | | | | | | | |
Sub-total Torres and Cape | | | | | | | | | | | | | | | 3,226 | | | | | |
| | | | | | | | | | | | | | | | | | | | |
| | | | | |
Townsville | | | | | | | | | | | | | | | | | | | | |
Health technology equipment | | | 318 | | | | | | | | | | | | 6,537 | | | | Ongoing | |
Minor capital projects and acquisitions | | | 318 | | | | | | | | | | | | 4,763 | | | | Ongoing | |
Townsville Hospital MRI machine7 | | | 318 | | | | 2,350 | | | | | | | | 2,350 | | | | | |
| | | | | | | | | | | | | | | | | | | | |
Sub-total Townsville | | | | | | | | | | | | | | | 13,650 | | | | | |
| | | | | | | | | | | | | | | | | | | | |
| | | | | |
West Moreton | | | | | | | | | | | | | | | | | | | | |
Health technology equipment | | | 310 | | | | | | | | | | | | 2,371 | | | | Ongoing | |
Minor capital projects and acquisitions | | | 310 | | | | | | | | | | | | 2,537 | | | | Ongoing | |
| | | | | | | | | | | | | | | | | | | | |
Sub-total West Moreton | | | | | | | | | | | | | | | 4,908 | | | | | |
| | | | | | | | | | | | | | | | | | | | |
| | | | | |
Wide Bay | | | | | | | | | | | | | | | | | | | | |
Health technology equipment | | | 319 | | | | | | | | | | | | 1,569 | | | | Ongoing | |
Minor capital projects and acquisitions | | | 319 | | | | | | | | | | | | 2,125 | | | | Ongoing | |
| | | | | | | | | | | | | | | | | | | | |
Sub-total Wide Bay | | | | | | | | | | | | | | | 3,694 | | | | | |
| | | | | | | | | | | | | | | | | | | | |
99
Capital Statement 2019-20
| | | | | | | | | | | | | | | | | | | | |
| Queensland Health1 | |
Project | | Statistical
Area | | | Total
Estimated
Cost
$‘000 | | | Expenditure
to
30-06-19
$‘000 | | | Budget
2019-20
$‘000 | | | Post
2019-20
$‘000 | |
Queensland Ambulance Service | | | | | | | | | | | | | | | | | | | | |
Building and general works | | | | | | | | | | | | | | | | | | | | |
Cairns Ambulance Station and Operations Centre redevelopment | | | 306 | | | | 5,600 | | | | 414 | | | | 900 | | | | 4,286 | |
Drayton new station and local ambulance service networks office | | | 317 | | | | 4,600 | | | | 89 | | | | 1,800 | | | | 2,711 | |
Southport Ambulance and Gold Coast Operations Centre redevelopment | | | 309 | | | | 6,200 | | | | 200 | | | | 300 | | | | 5,700 | |
Urraween new ambulance station | | | 319 | | | | 5,500 | | | | 13 | | | | 1,200 | | | | 4,287 | |
Kirwan replacement ambulance station | | | 318 | | | | 5,000 | | | | 47 | | | | 1,600 | | | | 3,353 | |
Mareeba replacement ambulance station | | | 306 | | | | 2,000 | | | | 19 | | | | 1,600 | | | | 381 | |
Munruben new ambulance station | | | 311 | | | | 4,000 | | | | | | | | 50 | | | | 3,950 | |
Rockhampton Ambulance Stations and Operations Centre redevelopment | | | 308 | | | | 7,000 | | | | 220 | | | | 1,300 | | | | 5,480 | |
Yarrabilba new ambulance station | | | 311 | | | | 4,300 | | | | 60 | | | | 1,200 | | | | 3,040 | |
Minor works | | | Various | | | | | | | | | | | | 5,000 | | | | Ongoing | |
Strategic land acquisitions | | | Various | | | | | | | | | | | | 1,500 | | | | Ongoing | |
Ambulance vehicle purchases | | | Various | | | | | | | | | | | | 24,000 | | | | Ongoing | |
Information systems department | | | Various | | | | | | | | | | | | 6,428 | | | | Ongoing | |
Operational equipment | | | Various | | | | | | | | | | | | 8,827 | | | | Ongoing | |
| | | | | | | | | | | | | | | | | | | | |
Sub-total Building and general works | | | | | | | | | | | | | | | 55,705 | | | | | |
| | | | | | | | | | | | | | | | | | | | |
| | | | | | | | | | | | | | | | | | | | |
| | | | | | | | | | | | | | | | | | | | |
Total Property, Plant and Equipment | | | | | | | | | | | | | | | 773,430 | | | | | |
| | | | | | | | | | | | | | | | | | | | |
100
Capital Statement 2019-20
| | | | | | | | | | | | | | | | | | |
| Queensland Health1 | |
Project | | Statistical
Area | | Total
Estimated
Cost
$‘000 | | | Expenditure
to
30-06-19
$‘000 | | | Budget
2019-20
$‘000 | | | Post
2019-20
$‘000 | |
COUNCIL OF THE QUEENSLAND INSTITUTE OF MEDICAL RESEARCH | | | | | | | | | | | | | | | | | | |
| | | | | |
Property, Plant and Equipment | | | | | | | | | | | | | | | | | | |
Other scientific equiment | | 305 | | | | | | | | | | | 4,316 | | | | Ongoing | |
| | | | | | | | | | | | | | | | | | |
Total Property, Plant and Equipment | | | | | | | | | | | | | 4,316 | | | | | |
| | | | | | | | | | | | | | | | | | |
| | | | | | | | | | | | | | | | | | |
| | | | | | | | | | | | | | | | | | |
TOTAL QUEENSLAND HEALTH (PPE) | | | | | | | | | | | | | 777,746 | | | | | |
| | | | | | | | | | | | | | | | | | |
Notes:
| 1. | Total funding for the capital investment program is $777.7 million including $4.3 million funding for the Queensland Institute of Medical Research. |
| 2. | Total estimated cost may include both non-capital and capital components of project expenditure. |
| 3. | Total estimated cost includes funding of $3 million from South East Queensland - Planning for Growth. |
| 4. | Total funding for the Logan Hospital Maternity Services upgrade is $18.9 million which includes funding from the Building Better Hospitals Program, Metro South Hospital and Health Service funding, as well as minor capital projects and acquisitions funding. |
| 5. | Total funding for the Redcliffe Hospital Day Procedure Unit is $10.1 million including $7.4 million funding from the Priority Capital Program. |
| 6. | Total funding for the Kingaroy Hospital redevelopment is $73.9 million including a $5 million contribution from Darling Downs Hospital and Health Service. |
| 7. | Total funding for Townsville Hospital magnetic resonance imaging (MRI) machine is $4.7 million including $2.4 million from Townsville Hospital and Health Service. |
| 8. | Amount is net of non capital component of project expenditure. |
The QIMR Berghofer capital program in 2019-20 will invest $4.3 million for the acquisition of new and/or replacement state-of-the-art scientific equipment and research facilities.
101
Capital Statement 2019-20
| 3.19 | QUEENSLAND POLICE SERVICE |
Queensland Police Service
Most new and ongoing capital initiatives to support the Queensland Police Service (QPS) operational capability are provided by the Public Safety Business Agency. This includes police facilities, motor vehicles, vessels and information and communication technology.
The QPS continues to be responsible for delivering operational equipment to maintain quality frontline services. In 2019-20, the QPS will invest $24.6 million in capital purchases.
Program Highlights (Property, Plant and Equipment)
| • | | $3.9 million for Camera Detected Offence Program equipment. |
| • | | $4.7 million for mobile capability and the development of new applications for QPS QLiTE mobile tablet devices. |
| • | | $16.1 million for other plant and equipment, including the replacement of operational assets. |
| | | | | | | | | | | | | | | | | | | | |
| Queensland Police Service | |
Project | | Statistical
Area | | | Total
Estimated
Cost
$‘000 | | | Expenditure
to 30-06-19
$‘000 | | | Budget
2019-20
$‘000 | | | Post
2019-20
$‘000 | |
QUEENSLAND POLICE SERVICE | | | | | | | | | | | | | | | | | | | | |
| | | | | |
Property, Plant and Equipment | | | | | | | | | | | | | | | | | | | | |
Camera Detected Offence Program | | | Various | | | | | | | | | | | | 3,854 | | | | Ongoing | |
Mobile capability | | | Various | | | | | | | | | | | | 4,720 | | | | Ongoing | |
Other plant and equipment | | | Various | | | | | | | | | | | | 16,072 | | | | Ongoing | |
| | | | | | | | | | | | | | | | | | | | |
Total Property, Plant and Equipment | | | | | | | | | | | | | | | 24,646 | | | | | |
| | | | | | | | | | | | | | | | | | | | |
| | | | | | | | | | | | | | | | | | | | |
| | | | | | | | | | | | | | | | | | | | |
TOTAL QUEENSLAND POLICE SERVICE (PPE) | | | | | | | | | | | | | | | 24,646 | | | | | |
| | | | | | | | | | | | | | | | | | | | |
102
Capital Statement 2019-20
Queensland Treasury
Queensland Treasury’s capital purchases for 2019-20 are $561,000. Total capital grants for the department are $109.8 million.
Program Highlights (Property, Plant and Equipment)
| • | | $561,000 to complete the Office of State Revenue Transformation Program. This will enable the delivery of an upgraded information and communication technology platform and support improved revenue management services into the future. |
Program Highlights (Capital Grants)
| • | | $109.8 million through the Queensland First Home Owners’ Grant to assist first home buyers to enter the housing market. |
Cross River Rail Delivery Authority
In 2019-20, the Cross River Rail Delivery Authority (Delivery Authority) has budgeted capital acquisitions of $1.480 billion, which will be made through a combination of State and private finance contributions, and capital grants of $49.7 million. During 2019-20 the Delivery Authority will finalise contract award and progress delivery and development associated with the Cross River Rail project.
| | | | | | | | | | | | | | | | | | |
| Queensland Treasury | |
Project | | Statistical
Area | | Total
Estimated
Cost
$‘000 | | | Expenditure
to
30-06-19
$‘000 | | | Budget
2019-20
$‘000 | | | Post
2019-20
$‘000 | |
QUEENSLAND TREASURY | | | | | | | | | | | | | | | | | | |
| | | | | |
Property, Plant and Equipment | | | | | | | | | | | | | | | | | | |
Office of State Revenue Transformation Program | | 305 | | | 17,739 | | | | 17,178 | | | | 561 | | | | | |
| | | | | | | | | | | | | | | | | | |
Total Property, Plant and Equipment | | | | | | | | | | | | | 561 | | | | | |
| | | | | | | | | | | | | | | | | | |
| | | | | |
Capital Grants | | | | | | | | | | | | | | | | | | |
Queensland First Home Owners’ Grant | | Various | | | | | | | | | | | 109,839 | | | | Ongoing | |
| | | | | | | | | | | | | | | | | | |
Total Capital Grants | | | | | | | | | | | | | 109,839 | | | | | |
| | | | | | | | | | | | | | | | | | |
103
Capital Statement 2019-20
| | | | | | | | | | | | | | | | | | |
| Queensland Treasury | |
Project | | Statistical
Area | | Total
Estimated
Cost
$‘000 | | | Expenditure
to
30-06-19
$‘000 | | | Budget
2019-20
$‘000 | | | Post
2019-20
$‘000 | |
| | | | |
CROSS RIVER RAIL DELIVERY AUTHORITY | | | | | | | | | | | | | | | | |
| | | | | |
Property, Plant and Equipment | | | | | | | | | | | | | | | | | | |
State contributions | | | | | 5,409,000 | | | | | | | | | | | | | |
Private finance contributions | | | | | 1,479,000 | | | | | | | | | | | | | |
| | | | | | | | | | | | | | | | | | |
Total | | | | | 6,888,000 | | | | | | | | | | | | | |
Less capital grants | | | | | (162,196 | ) | | | | | | | | | | | | |
| | | | | | | | | | | | | | | | | | |
Property plant and equipment | | 305 | | | 6,725,804 | | | | 849,032 | | | | 1,479,707 | | | | 4,397,065 | |
| | | | | | | | | | | | | | | | | | |
Total Property, Plant and Equipment | | | | | | | | | | | | | 1,479,707 | | | | | |
| | | | | | | | | | | | | | | | | | |
| | | | | |
Capital Grants | | | | | | | | | | | | | | | | | | |
Third party returnable works | | 305 | | | 162,196 | | | | | | | | 49,658 | | | | 112,538 | |
| | | | | | | | | | | | | | | | | | |
Total Capital Grants | | | | | | | | | | | | | 49,658 | | | | | |
| | | | | | | | | | | | | | | | | | |
| | | | | | | | | | | | | | | | | | |
| | | | | | | | | | | | | | | | | | |
TOTAL QUEENSLAND TREASURY (PPE) | | | | | | | | | | | | | 1,480,268 | | | | | |
| | | | | | | | | | | | | | | | | | |
| | | | | | | | | | | | | | | | | | |
| | | | | | | | | | | | | | | | | | |
TOTAL QUEENSLAND TREASURY (CG) | | | | | | | | | | | | | 159,497 | | | | | |
| | | | | | | | | | | | | | | | | | |
104
Capital Statement 2019-20
| 3.21 | STATE DEVELOPMENT, MANUFACTURING, INFRASTRUCTURE AND PLANNING |
In 2019-20, the State Development, Manufacturing, Infrastructure and Planning portfolio, including Economic Development Queensland, South Bank Corporation and the Queensland Reconstruction Authority, has capital purchases of $109.1 million and capital grants of $348.2 million.
Department of State Development, Manufacturing, Infrastructure and Planning
The Department of State Development, Manufacturing, Infrastructure and Planning has capital purchases of $13.7 million and capital grants of $111.9 million in 2019-20 to support economic development in Queensland.
Program Highlights (Property, Plant and Equipment)
| • | | $12.3 million for State Development Area (SDA) acquisitions. |
Program Highlights (Capital Grants)
| • | | $97.4 million through the Building our Regions program to fund critical infrastructure in regional areas. |
Economic Development Queensland
In 2019-20, Economic Development Queensland has capital purchases of $64.3 million.
Program Highlights (Property, Plant and Equipment)
| • | | $17.3 million for the urban renewal development at Northshore Hamilton. |
| • | | $16.3 million to develop the Oxley Priority Development Area. |
| • | | $15 million to develop Carseldine Urban Village and construct a pedestrian bridge. |
| • | | $5 million for the proposed Cairns Regional Industrial Estate development. |
| • | | $2.4 million for the industrial expansion at the Gladstone State Development Area. |
| • | | $2.4 million for the Gold Coast Health and Knowledge Precinct. |
South Bank Corporation
In 2019-20, South Bank Corporation has budgeted capital works expenditure totalling $29.7 million to enhance the South Bank Parklands, the Corporation’s commercial assets and the Brisbane Convention and Exhibition Centre.
105
Capital Statement 2019-20
Included in this amount is $10.5 million as part of the Riverside Open Space, which will create a new green heart for South Bank where the Riverside Restaurants previously stood.
Queensland Reconstruction Authority
In 2019-20, the Queensland Reconstruction Authority has capital spend of $1.3 million and capital grants of $236.2 million to support the Queensland Government’s program of infrastructure renewal and recovery within disaster-affected communities and help build disaster resilience across the State.
Program Highlights (Capital Grants)
| • | | $210.5 million for Natural Disaster Relief and Recovery Arrangements and Disaster Recovery Funding Arrangements will be paid to local government authorities for reconstruction, betterment and other projects relating to natural disaster events between 2017 and 2019. A total of up to 75% is funded by the Australian Government with the remainder funded by the Queensland Government. |
| • | | $6.2 million for the Natural Disaster Resilience Program 2017-18 to support Queensland communities’ resilience to natural disasters, funded jointly by the Australian Government and the Queensland Government. |
| • | | $5.4 million for the Queensland Disaster Resilience Fund, a State-funded program delivering $38 million over four years ($36 million in capital grants and $2 million in operating funds for the Strategic Floodplain Management Plan) to support delivery of disaster mitigation projects and initiatives that build resilience to natural disasters. |
| • | | $13.3 million for extraordinary recovery and reconstruction projects following Severe Tropical Cyclone Debbie, including |
| | • | | $2 million for the Proserpine Entertainment Centre. |
| | • | | $1.8 million for the Whitsunday Regional Council administration building. |
| | • | | $700,000 for the Toowoomba SES Operations Centre. |
| | • | | $6.3 million for the Mackay Beaches and Bluewater Trail and Queens Park Revitalisation. |
| | • | | $860,000 for the Airlie Beach Foreshore Revitalisation. |
| | • | | $1.7 million for other resilience projects. |
106
Capital Statement 2019-20
Program Highlights (Property, Plant and Equipment)
| • | | $1.3 million to develop a new grants management system to improve and simplify the administration of disaster-recovery grants. |
| | | | | | | | | | | | | | | | | | | | |
| State Development, Manufacturing, Infrastructure and Planning | |
Project | | Statistical
Area | | | Total
Estimated
Cost
$‘000 | | | Expenditure
to
30-06-19
$‘000 | | | Budget
2019-20
$‘000 | | | Post
2019-20
$‘000 | |
DEPARTMENT OF STATE DEVELOPMENT, MANUFACTURING, INFRASTRUCTURE AND PLANNING | | | | | | | | | | | | | | | | | | | | |
| | | | | |
Property, Plant and Equipment | | | | | | | | | | | | | | | | | | | | |
Other plant and equipment | | | Various | | | | | | | | | | | | 1,169 | | | | Ongoing | |
Grants management system | | | Various | | | | 1,702 | | | | 1,472 | | | | 230 | | | | | |
State Development Area (SDA) acquisitions | | | 318 | | | | 12,329 | | | | | | | | 12,329 | | | | | |
| | | | | | | | | | | | | | | | | | | | |
Total Property, Plant and Equipment | | | | | | | | | | | | | | | 13,728 | | | | | |
| | | | | | | | | | | | | | | | | | | | |
| | | | | |
Capital Grants | | | | | | | | | | | | | | | | | | | | |
Building our Regions | | | Various | | | | 355,015 | | | | 184,659 | | | | 97,356 | | | | 73,000 | |
Other regional assistance programs | | | Various | | | | 90,153 | | | | 80,665 | | | | 9,488 | | | | | |
Roma Street Parklands | | | 305 | | | | | | | | | | | | 5,081 | | | | Ongoing | |
| | | | | | | | | | | | | | | | | | | | |
Total Capital Grants | | | | | | | | | | | | | | | 111,925 | | | | | |
| | | | | | | | | | | | | | | | | | | | |
| | | | | |
ECONOMIC DEVELOPMENT QUEENSLAND | | | | | | | | | | | | | | | | | | | | |
| | | | | |
Property, Plant and Equipment | | | | | | | | | | | | | | | | | | | | |
Yeppoon Heritage Rail Station restoration | | | 308 | | | | 475 | | | | | | | | 475 | | | | | |
Capricorn Coast Pineapple Rail-Trail extension | | | 308 | | | | 455 | | | | | | | | 100 | | | | 355 | |
Student nurse accommodation - Roma | | | 307 | | | | 5,950 | | | | | | | | 1,500 | | | | 4,450 | |
Carseldine Urban Village pedestrian bridge | | | 302 | | | | 900 | | | | | | | | 900 | | | | | |
Yeronga Priority Development Area | | | 303 | | | | 8,033 | | | | 4,254 | | | | 564 | | | | 3,215 | |
Oxley Priority Development Area | | | 310 | | | | 33,045 | | | | 4,138 | | | | 16,333 | | | | 12,574 | |
Gold Coast Health and Knowledge Precinct | | | 309 | | | | 31,041 | | | | 21,412 | | | | 2,371 | | | | 7,258 | |
Northshore Hamilton | | | 302 | | | | 345,128 | | | | 52,408 | | | | 17,265 | | | | 275,455 | |
Yeerongpilly Green | | | 303 | | | | 66,730 | | | | 52,508 | | | | 1,890 | | | | 12,332 | |
107
Capital Statement 2019-20
| | | | | | | | | | | | | | | | | | |
| State Development, Manufacturing, Infrastructure and Planning | |
Project | | Statistical
Area | | Total
Estimated
Cost
$‘000 | | | Expenditure
to
30-06-19
$‘000 | | | Budget
2019-20
$‘000 | | | Post
2019-20
$‘000 | |
Carseldine Urban Village | | 302 | | | 31,890 | | | | 7,825 | | | | 14,066 | | | | 9,999 | |
Townsville Regional Industrial Estate | | 318 | | | 6,925 | | | | 4,425 | | | | 200 | | | | 2,300 | |
Salisbury Plains Industrial Precinct | | 312 | | | 5,654 | | | | 1,904 | | | | 250 | | | | 3,500 | |
Sunshine Coast Industrial Park - stage 2 | | 316 | | | 15,600 | | | | 100 | | | | 500 | | | | 15,000 | |
Cairns Regional Industrial Estate | | 306 | | | 10,000 | | | | | | | | 5,000 | | | | 5,000 | |
Clinton Industrial Estate | | 308 | | | 11,028 | | | | 778 | | | | 500 | | | | 9,750 | |
Gladstone State Development Area | | 308 | | | 12,974 | | | | 6,724 | | | | 2,400 | | | | 3,850 | |
| | | | | | | | | | | | | | | | | | |
Total Property, Plant and Equipment | | | | | | | | | | | | | 64,314 | | | | | |
| | | | | | | | | | | | | | | | | | |
| | | | | |
SOUTH BANK CORPORATION | | | | | | | | | | | | | | | | | | |
| | | | | |
Property, Plant and Equipment | | | | | | | | | | | | | | | | | | |
Parklands enhancement and replacement | | 305 | | | | | | | | | | | 9,830 | | | | Ongoing | |
Brisbane Convention and Exhibition Centre | | 305 | | | | | | | | | | | 7,342 | | | | Ongoing | |
Investment properties - other enhancements and replacements | | 305 | | | | | | | | | | | 1,905 | | | | Ongoing | |
Riverside open space | | 305 | | | 18,460 | | | | 1,480 | | | | 10,500 | | | | 6,480 | |
Car park upgrades and replacement | | 305 | | | | | | | | | | | 166 | | | | Ongoing | |
| | | | | | | | | | | | | | | | | | |
Total Property, Plant and Equipment | | | | | | | | | | | | | 29,743 | | | | | |
| | | | | | | | | | | | | | | | | | |
| | | | | |
QUEENSLAND RECONSTRUCTION AUTHORITY | | | | | | | | | | | | | | | | | | |
| | | | | |
Property, Plant and Equipment | | | | | | | | | | | | | | | | | | |
Grants management and reporting system | | 302 | | | 4,706 | | | | 3,440 | | | | 1,266 | | | | | |
| | | | | | | | | | | | | | | | | | |
Total Property, Plant and Equipment | | | | | | | | | | | | | 1,266 | | | | | |
| | | | | | | | | | | | | | | | | | |
| | | | | |
Capital Grants | | | | | | | | | | | | | | | | | | |
Disaster recovery funding arrangements (local government authorities) | | Various | | | | | | | | | | | 210,548 | | | | Ongoing | |
Natural Disaster Resilience Program (jointly funded with the Australian Government) | | Various | | | 15,475 | | | | 5,999 | | | | 6,190 | | | | 3,286 | |
Disaster Resilience Fund | | Various | | | 36,000 | | | | 2,100 | | | | 5,400 | | | | 28,500 | |
108
Capital Statement 2019-20
| | | | | | | | | | | | | | | | | | |
| State Development, Manufacturing, Infrastructure and Planning | |
Project | | Statistical
Area | | Total
Estimated
Cost
$‘000 | | | Expenditure
to
30-06-19
$‘000 | | | Budget
2019-20
$‘000 | | | Post
2019-20
$‘000 | |
Airlie Beach Foreshore Revitalisation Project | | 312 | | | 2,657 | | | | 1,797 | | | | 860 | | | | | |
Proserpine Entertainment Centre | | 312 | | | 5,775 | | | | 1,732 | | | | 2,022 | | | | 2,021 | |
Whitsunday Regional Council administration building | | 312 | | | 5,000 | | | | 1,500 | | | | 1,750 | | | | 1,750 | |
Toowoomba SES Operations Centre | | 317 | | | 1,000 | | | | 300 | | | | 700 | | | | | |
Mackay beaches | | 312 | | | 4,562 | | | | 1,368 | | | | 3,194 | | | | | |
Bluewater Trail and Queens Park revitalisation | | 312 | | | 8,864 | | | | 2,659 | | | | 3,105 | | | | 3,100 | |
Bowen Beach seawall | | 312 | | | 895 | | | | 268 | | | | 313 | | | | 314 | |
Bakers Road floodway | | 319 | | | 272 | | | | 82 | | | | 95 | | | | 95 | |
Wackford Street drainage | | 308 | | | 1,884 | | | | 565 | | | | 659 | | | | 660 | |
Logan City Council Flooded Road Warning System | | 311 | | | 880 | | | | 264 | | | | 308 | | | | 308 | |
Halifax flood mitigation levee | | 318 | | | 391 | | | | 117 | | | | 137 | | | | 137 | |
Other State-funded disaster resilience projects | | Various | | | 453 | | | | 136 | | | | 159 | | | | 158 | |
Community Preparedness Fund | | Various | | | 1,150 | | | | 345 | | | | 805 | | | | | |
| | | | | | | | | | | | | | | | | | |
Total Capital Grants | | | | | | | | | | | | | 236,245 | | | | | |
| | | | | | | | | | | | | | | | | | |
| | | | | | | | | | | | | | | | | | |
| | | | | | | | | | | | | | | | | | |
TOTAL STATE DEVELOPMENT, MANUFACTURING, INFRASTRUCTURE AND PLANNING (PPE) | | | | | | | | | | | | | 109,051 | | | | | |
| | | | | | | | | | | | | | | | | | |
| | | | | | | | | | | | | |
| | | | | | | | | | | | | | | | | | |
TOTAL STATE DEVELOPMENT, MANUFACTURING, INFRASTRUCTURE AND PLANNING (CG) | | | | | | | | | | | | | 348,170 | | | | | |
| | | | | | | | | | | | | | | | | | |
109
Capital Statement 2019-20
| 3.22 | TRANSPORT AND MAIN ROADS |
In 2019-20, the total capital program for the Transport and Main Roads portfolio is $4.096 billion, including capital purchases of $3.879 billion and capital grants of grants of $216.7 million. The portfolio includes the Department of Transport and Main Roads, Queensland Rail, Far North Queensland Ports Corporation Limited, Gladstone Ports Corporation Limited, North Queensland Bulk Ports Corporation Limited, Port of Townsville Limited, RoadTek and the Gold Coast Waterways Authority.
Department of Transport and Main Roads
In 2019-20, the capital program totals $3.094 billion for infrastructure investment across the State. The Queensland Government is committed to delivering an integrated, safe and efficient transport system that connects regional Queenslanders and other communities throughout the State.
Program Highlights (Property, Plant and Equipment)
| • | | $213.3 million to complete delivery of 75 new six car sets and ongoing accessibility modifications to comply with disability standards. |
| • | | $186 million to widen the Bruce Highway from four to six lanes, Caloundra Road to the Sunshine Motorway, at a total estimated cost of $812.9 million, in partnership with the Australian Government. |
| • | | $119.9 million towards the new statewide public transport ticketing system at a total cost of $371.1 million. |
| • | | $108 million to construct bridges and approaches on the Bruce Highway (Haughton River Floodplain) south of Giru between Horseshoe Lagoon and Palm Creek, at a total cost of $514.3 million, in partnership with the Australian Government. |
| • | | $70 million towards the Rocklea to Darra Stage 1 project to provide a three kilometre upgrade of the Ipswich Motorway between Granard Road, Rocklea and Oxley Road, Oxley at a total cost of $400 million, in partnership with the Australian Government. |
| • | | $65.5 million to construct additional lanes on the Pacific Motorway between Mudgeeraba and Varsity Lakes, in partnership with the Australian Government. |
| • | | $60 million to construct the Mackay Ring Road (Stage 1), at a total estimated cost of $497.4 million, in partnership with the Australian Government. |
| • | | $59.7 million to upgrade the Pacific Motorway/Gateway Motorway Merge, in partnership with the Australian Government. |
110
Capital Statement 2019-20
| • | | $50 million to duplicate the North Coast Line between Beerburrum and Nambour to address rail infrastructure and capacity constraints. Project timing, potential staging and funding arrangements are subject to negotiations with the Australian Government. |
| • | | $46.3 million to construct the Smithfield Bypass on the Captain Cook Highway between McGregor Road roundabout and Caravonica roundabout to ensure route continuity, at a total cost of $152 million. |
| • | | $37.9 million to duplicate from two to four lanes on the Bruce Highway (Cairns Southern Access Corridor Stage 3) from Collinson Creek in Edmonton as far as the vicinity of Wrights Creek near Gordonvale, at a total cost of $481 million, in partnership with the Australian Government. |
| • | | $35.9 million to duplicate from two to four lanes on a section of the Capricorn Highway between Rockhampton and Gracemere, at a total cost of $75 million, in partnership with the Australian Government. |
| • | | $30.3 million to widen from four to six lanes on the section of the Bruce Highway (Cairns Southern Access Corridor Stage 4) from Kate Street to Aumuller Street near the Port of Cairns and wharf precinct, at a total cost of $104.1 million, in partnership with the Australian Government. |
| • | | $29.1 million to duplicate from two to four lanes on the Bruce Highway Rockhampton Northern Access (Stage 1) between Rockhampton - Yeppoon Road and Parkhurst, at a total cost of $121 million, in partnership with the Australian Government. |
| • | | $28.6 million to widen, seal and apply wide-centreline treatment at various locations on the Warrego Highway between Dalby and Miles, at a total cost of $63.6 million, in partnership with the Australian Government. |
| • | | $20 million towards Mackay Northern Access Upgrade project on the Bruce Highway from Ron Camm Bridge to the Mackay Ring Road (Stage 1), at a total cost of $110.6 million, in partnership with the Australian Government. |
| • | | $20 million to enhance connectivity between the new Roma Street underground train station and the Inner Northern Busway, at a total cost of $250 million. |
| • | | $17.5 million to realign the Peak Downs Highway at Eton Range, at a total cost of $189.3 million, in partnership with the Australian Government. |
| • | | $15 million to continue pavement widening and strengthening works on the Landsborough Highway between Dingo Creek and Darr River, at a total cost of $25 million, in partnership with the Australian Government. |
111
Capital Statement 2019-20
| • | | $12.4 million to extend a three-metre wide V1 cycleway from Birdwood Road, Holland Park to Gaza Road, Tarragindi, at a total cost of $42.7 million. |
| • | | $11.3 million to seal sections of the Kennedy Developmental Road between Hughenden and The Lynd (Hann Highway), at a total cost of $50 million, in partnership with the Australian Government. |
| • | | $8.6 million to replace Coondoo Creek Bridge on Tin Can Bay Road near Gympie, at a total cost of $14.8 million, in partnership with the Australian Government. |
| • | | $8 million to construct the Everton Park Link Road connecting Stafford Road and South Pine Road, at a total cost of $26 million. |
Program Highlights (Capital Grants)
| • | | $70 million for the Transport Infrastructure Development Scheme (TIDS) to local governments including Aboriginal and Torres Strait Islander community assistance. |
| • | | $18.5 million towards development of the cycle network throughout Queensland. |
| • | | $17.1 million for the Queensland School Bus Upgrade Scheme to provide funding to eligible school bus operators to assist with the purchase of new buses or buses that are less than five years old. |
| • | | $13 million to continue paving and sealing along Pasha Road in Moranbah from Eaglefield Road to Riverside Mine Road, at a total cost of $16 million. |
Gold Coast Waterways Authority
In 2019-20, the Gold Coast Waterways Authority has allocated $6.3 million to improve management of, and provide better access to, the Gold Coast waterways, canals and rivers.
Program Highlights (Property, Plant and Equipment)
| • | | $4.3 million to improve the Gold Coast Seaway Sand Bypass system, including upgrading the electrical switching gear equipment and completion of the jetty deck upgrade. |
| • | | $1.8 million to improve access and safety by dredging navigation channels and to improve accessibility and quality of waterways information. |
| • | | $220,000 to provide boating infrastructure such as boat ramp and pontoon upgrades. |
112
Capital Statement 2019-20
RoadTek
In 2019-20, RoadTek is allocating $19 million to replace plant and equipment used in road construction and maintenance throughout Queensland.
Queensland Rail Limited
In 2019-20, $638.6 million is allocated towards capital purchases for Queensland Rail.
Program Highlights (Property, Plant and Equipment)
$254.4 million is provided towards projects that will grow or enhance the Queensland Rail network including:
| • | | $73.5 million to implement the European Train Control System – Inner City. |
| • | | $29.5 million to upgrade the capacity of the North Coast Rail Line to increase productivity and efficiency of freight transport. |
| • | | $15.2 million to improve station accessibility at Dakabin train station. |
| • | | $10.7 million to continue investment to support the delivery of the New Generation Rollingstock into service. |
| • | | $8.9 million to improve station accessibility at South Bank train station. |
| • | | $6.3 million to continue track and tunnel upgrades between Brisbane and Toowoomba to cater for growing demand. |
$384.2 million to replace, renew and upgrade rail infrastructure, rollingstock, buildings, facilities, and other supporting assets including:
| • | | $207.9 million to invest in the network including track infrastructure, civil structures, signalling and other network assets. |
| • | | $106.7 million to invest in rail operations including rollingstock overhauls, operational facilities, and other rail operations assets. |
| • | | $52 million for business enabling investment on corporate, property and ICT works across Queensland. |
| • | | $17.6 million to improve customer experience, maintain service continuity and build network resilience on the Townsville – Mount Isa Rail Line. |
113
Capital Statement 2019-20
Far North Queensland Ports Corporation Limited
In 2019-20, Far North Queensland Ports Corporation Limited has allocated $76.1 million to undertake new and continue existing development of its port in Far North Queensland.
Program Highlights (Property, Plant and Equipment)
| • | | $70.1 million towards the Cairns shipping development project which is for the dredging of Trinity Inlet shipping channel to facilitate cruise ship growth, with a total cost of $127.6 million. |
Gladstone Ports Corporation Limited
In 2019-20, Gladstone Ports Corporation Limited has allocated $115.9 million to continue development of the Port of Gladstone, and additional works at the Port of Bundaberg and the Port of Rockhampton.
Program Highlights (Property, Plant and Equipment)
| • | | $36.8 million to continue upgrades at the RG Tanna Coal Terminal at the Port of Gladstone, at a total cost of $258.2 million. |
| • | | $32.4 million towards port services projects including East Shores Stage 1B and marina bulk earthworks, with a total cost of $87.2 million. |
North Queensland Bulk Ports Corporation Limited
In 2019-20, North Queensland Bulk Ports Corporation Limited has allocated $20.8 million to continue port planning and development initiatives to meet industry requirements for export facilities.
Program Highlights (Property, Plant and Equipment)
| • | | $7.8 million to relocate Mackay tug berth facilities to provide a permanent fit for purpose berthing facility which is fully designed for the safe berthing of the tugs currently in operation and which can suit the potential future larger tug fleet, at a total cost of $8 million. |
114
Capital Statement 2019-20
Port of Townsville Limited
In 2019-20, Port of Townsville Limited has allocated $124.5 million to continue development at the Port of Townsville, and additional works at the Port of Lucinda.
Program Highlights (Property, Plant and Equipment)
| • | | $83.8 million to continue dredging and reclamation works to widen the shipping channels for access by larger vessels, at a total cost of $193.5 million. This is Stage 1 of the Townsville Port Expansion Project. |
| • | | $17.5 million to procure and commission a Berth 4 ship-to-shore crane and to continue development of associated cargo terminal areas to cater for future trade growth, at a total cost of $29.3 million. |
| | | | | | | | | | | | | | | | | | |
| Transport and Main Roads | |
Project | | Statistical
Area | | Total
Estimated
Cost
$‘000 | | | Expenditure
to
30-06-19
$‘000 | | | Budget
2019-20
$‘000 | | | Post
2019-20
$‘000 | |
DEPARTMENT OF TRANSPORT AND MAIN ROADS | | | | | | | | | | | | | |
| | | | | |
Property, Plant and Equipment | | | | | | | | | | | | | | | | | | |
South Coast District | | | | | | | | | | | | | | | | | | |
Beaudesert - Beenleigh Road, various safety treatments | | 311 | | | 12,000 | | | | 5,500 | | | | 5,000 | | | | 1,500 | |
Greenbank bus facility park ‘n’ ride upgrade | | 311 | | | 21,000 | | | | 2,409 | | | | 2,281 | | | | 16,310 | |
Mount Lindesay Highway (Brisbane - Beaudesert), Camp Cable Road - Johanna Street, four lane upgrade | | 311 | | | 20,000 | | | | 3,100 | | | | 12,000 | | | | 4,900 | |
Mount Lindesay Highway (Brisbane - Beaudesert), Greenbank Road, North Maclean, improve intersection | | 311 | | | 20,000 | | | | 10,061 | | | | 9,939 | | | | | |
Mount Lindesay Highway (Brisbane - Beaudesert), Rosia Road - Stoney Camp Road, four lane upgrade | | 311 | | | 20,000 | | | | 800 | | | | 16,200 | | | | 3,000 | |
Mount Lindesay Highway (Brisbane - Beaudesert), Stockleigh Road, South Maclean, improve intersection | | 311 | | | 14,000 | | | | 3,440 | | | | 7,560 | | | | 3,000 | |
115
Capital Statement 2019-20
| | | | | | | | | | | | | | | | | | |
| Transport and Main Roads | |
Project | | Statistical
Area | | Total
Estimated
Cost
$‘000 | | | Expenditure
to
30-06-19
$‘000 | | | Budget
2019-20
$‘000 | | | Post
2019-20
$‘000 | |
Pacific Motorway (M1),1,2 Mudgeeraba to Varsity Lakes upgrade | | 309 | | | 197,500 | | | | 123,216 | | | | 65,479 | | | | 8,805 | |
Pacific Motorway (Rochedale3,4 South), Miles Platting Road - Rochedale Road (Gateway Merge) | | 311 | | | 195,300 | | | | 113,427 | | | | 59,720 | | | | 22,153 | |
Pacific Motorway (M1), Eight Mile5 Plains to Daisy Hill, widening and busway extension | | 311 | | | 749,000 | | | | 23,438 | | | | 25,312 | | | | 700,250 | |
Pacific Motorway (M1), Exit 571 (Oxenford) interchange upgrade | | 309 | | | 25,000 | | | | 3,000 | | | | 12,000 | | | | 10,000 | |
Pacific Motorway (M1), Varsity1,5 Lakes to Tugun, widen to six lanes | | 309 | | | 1,030,000 | | | | 16,151 | | | | 45,000 | | | | 968,849 | |
Veloway 1 (V1) Cycleway, Logan Road (Levington Road - Kingston Road), construct cycleway | | 311 | | | 4,000 | | | | 500 | | | | 3,500 | | | | | |
Other South Coast construction | | 309 | | | 58,436 | | | | | | | | 58,436 | | | | | |
| | | | | | | | | | | | | | | | | | |
Sub-total South Coast District | | | | | | | | | | | | | 322,427 | | | | | |
| | | | | | | | | | | | | | | | | | |
| | | | | |
Metropolitan District | | | | | | | | | | | | | | | | | | |
Centenary Motorway, Sumners1 Road interchange upgrade | | 304 | | | 80,000 | | | | 10,484 | | | | 16,000 | | | | 53,516 | |
Cleveland - Redland Bay Road (Cleveland), Anita Street, intersection upgrade | | 301 | | | 5,000 | | | | 500 | | | | 3,000 | | | | 1,500 | |
Eight Mile Plains bus station park ‘n’ ride upgrade | | 303 | | | 4,500 | | | | 1,448 | | | | 2,441 | | | | 611 | |
Everton Park Link Road (Stafford Road - South Pine Road), construct new link road | | 302 | | | 26,000 | | | | 1,629 | | | | 8,000 | | | | 16,371 | |
Ipswich Motorway, Rocklea to3 Darra (Stage 1) | | 310 | | | 400,000 | | | | 162,310 | | | | 70,000 | | | | 167,690 | |
Linkfield Connection Road, (Gympie Arterial Road), extend on-ramp | | 302 | | | 3,186 | | | | 271 | | | | 2,287 | | | | 628 | |
116
Capital Statement 2019-20
| | | | | | | | | | | | | | | | | | |
| Transport and Main Roads | |
Project | | Statistical
Area | | Total
Estimated
Cost
$‘000 | | | Expenditure
to
30-06-19
$‘000 | | | Budget
2019-20
$‘000 | | | Post
2019-20
$‘000 | |
North Brisbane Bikeway (Stages 2, 3 and 4), Somerset Street - Rigby Street and Rigby Street - Price Street, design and construct cycle facilities | | 305 | | | 17,180 | | | | 5,762 | | | | 5,300 | | | | 6,118 | |
Northern Transitway | | 302 | | | 53,000 | | | | 2,686 | | | | 2,560 | | | | 47,754 | |
Roma Street busway interchange | | 305 | | | 250,000 | | | | | | | | 20,000 | | | | 230,000 | |
Veloway 1 (V1), Stage E, Birdwood Road - Gaza Road, construct cycleway | | 303 | | | 42,695 | | | | 14,412 | | | | 12,413 | | | | 15,870 | |
Other Metropolitan construction | | Various | | | 64,557 | | | | | | | | 64,557 | | | | | |
| | | | | | | | | | | | | | | | | | |
Sub-total Metropolitan District | | | | | | | | | | | | | 206,558 | | | | | |
| | | | | | | | | | | | | | | | | | |
| | | | | |
North Coast District | | | | | | | | | | | | | | | | | | |
Brisbane - Woodford Road, Dixon Street, improve intersection | | 314 | | | 3,500 | | | | 466 | | | | 3,034 | | | | | |
Bruce Highway (Brisbane - Gympie), Deception Bay Road interchange upgrade | | 313 | | | 150,000 | | | | 6,253 | | | | 36,847 | | | | 106,900 | |
Bruce Highway (Brisbane - Gympie), Maroochydore Road interchange upgrade | | 316 | | | 301,250 | | | | 43,232 | | | | 40,000 | | | | 218,018 | |
Bruce Highway safety barrier installation | | Various | | | 79,790 | | | | 58,050 | | | | 21,740 | | | | | |
Bruce Highway, Caloundra Road to Sunshine Motorway | | 316 | | | 812,948 | | | | 499,194 | | | | 186,000 | | | | 127,754 | |
Burpengary - Caboolture Road and Beerburrum Road, improve intersections | | 313 | | | 28,800 | | | | 8,700 | | | | 9,500 | | | | 10,600 | |
Caboolture - Bribie Island Road (Old Toorbul Point Road), intersection signalisation | | 313 | | | 10,400 | | | | 450 | | | | 5,665 | | | | 4,285 | |
Caboolture Connection Road, improve intersections | | 313 | | | 7,555 | | | | 3,034 | | | | 2,833 | | | | 1,688 | |
Deception Bay Road (Rothwell), Morris Road, improve intersection | | 313 | | | 6,000 | | | | 296 | | | | 4,954 | | | | 750 | |
Dohles Rocks Road boat ramp, upgrade boating infrastructure | | 314 | | | 1,500 | | | | 200 | | | | 1,300 | | | | | |
North Coast Line - Beerburrum to6 Nambour Rail Upgrade | | 316 | | | 550,791 | | | | 3,500 | | | | 49,971 | | | | 497,320 | |
117
Capital Statement 2019-20
| | | | | | | | | | | | | | | | | | |
| Transport and Main Roads | |
Project | | Statistical
Area | | Total
Estimated
Cost
$‘000 | | | Expenditure
to
30-06-19
$‘000 | | | Budget
2019-20
$‘000 | | | Post
2019-20
$‘000 | |
Redcliffe Road, Anzac Avenue / Gympie Road / Dayboro Road (Petrie roundabout), improve intersection | | 314 | | | 30,000 | | | | 1,500 | | | | 10,500 | | | | 18,000 | |
Scarborough Boat Harbour, construct barge ramp | | 313 | | | 4,000 | | | | 132 | | | | 3,868 | | | | | |
Other North Coast construction | | 316 | | | 94,610 | | | | | | | | 94,610 | | | | | |
| | | | | | | | | | | | | | | | | | |
Sub-total North Coast District | | | | | | | | | | | | | 470,822 | | | | | |
| | | | | | | | | | | | | | | | | | |
| | | | | |
Wide Bay Burnett District | | | | | | | | | | | | | | | | | | |
Bruce Highway (Gin Gin - Benaraby), Gin Gin, widening and intersection upgrades | | 319 | | | 8,630 | | | | 4,418 | | | | 3,567 | | | | 645 | |
Bruce Highway (Gympie - Maryborough), Tinana, construct overtaking lanes | | 319 | | | 14,700 | | | | 930 | | | | 6,062 | | | | 7,708 | |
Bruce Highway (Gympie - Maryborough), various locations, improve intersections | | 319 | | | 7,560 | | | | 1,076 | | | | 4,000 | | | | 2,484 | |
Bruce Highway (Maryborough - Gin Gin), Apple Tree Creek, improve intersections | | 319 | | | 12,640 | | | | 1,133 | | | | 2,877 | | | | 8,630 | |
Bruce Highway (Maryborough - Gin Gin), North of Mixhills Road - South of Walla Island Road, construct overtaking lanes | | 319 | | | 10,260 | | | | 711 | | | | 8,214 | | | | 1,335 | |
Bruce Highway (Maryborough - Gin Gin), Maryborough Showgrounds and Howard Heights Road, improve intersections | | 319 | | | 9,780 | | | | 2,409 | | | | 4,713 | | | | 2,658 | |
Bruce Highway (Gympie - Maryborough), Fleming Road - Fishermans Pocket Road, improve intersections | | 319 | | | 11,470 | | | | 4,982 | | | | 4,848 | | | | 1,640 | |
Bundaberg - Gin Gin Road, Burnett River Traffic Bridge rehabilitation | | 319 | | | 28,550 | | | | 21,046 | | | | 5,000 | | | | 2,504 | |
Tin Can Bay Road (Gympie),7 Coondoo Creek Bridge replacement | | 319 | | | 14,821 | | | | 1,876 | | | | 8,630 | | | | 4,315 | |
118
Capital Statement 2019-20
| | | | | | | | | | | | | | | | | | |
| Transport and Main Roads | |
Project | | Statistical
Area | | Total
Estimated
Cost
$‘000 | | | Expenditure
to
30-06-19
$‘000 | | | Budget
2019-20
$‘000 | | | Post
2019-20
$‘000 | |
Other Wide Bay Burnett construction | | 319 | | | 81,882 | | | | | | | | 81,882 | | | | | |
| | | | | | | | | | | | | | | | | | |
Sub-total Wide Bay Burnett District | | | | | | | | | | | | | 129,793 | | | | | |
| | | | | | | | | | | | | | | | | | |
| | | | | |
Darling Downs District | | | | | | | | | | | | | | | | | | |
New England Highway (Yarraman7 - Toowoomba), Emu Creek Bridge upgrade | | 307 | | | 9,263 | | | | 1,206 | | | | 8,057 | | | | | |
New England Highway (Yarraman - Toowoomba), Ruthven Street and North Street intersection improvements | | 317 | | | 6,446 | | | | 657 | | | | 5,189 | | | | 600 | |
Toowoomba - Cecil Plains Road, realign Oakey - Pittsworth Road approaches | | 307 | | | 3,235 | | | | 363 | | | | 2,872 | | | | | |
Warrego Highway (Dalby - Miles),8 Oakey - Miles, safety upgrade | | 307 | | | 43,510 | | | | 33,208 | | | | 8,195 | | | | 2,107 | |
Warrego Highway (Dalby - Miles),8 various locations, widen and seal shoulders | | 307 | | | 11,653 | | | | 1,865 | | | | 8,277 | | | | 1,511 | |
Warrego Highway (Dalby - Miles),8 widening and apply wide centre line treatment | | 307 | | | 63,640 | | | | 16,391 | | | | 28,559 | | | | 18,690 | |
Warrego Highway, Chinchilla Rail8 Crossing Upgrade | | 307 | | | 19,040 | | | | 5,172 | | | | 12,110 | | | | 1,758 | |
Other Darling Downs construction | | 307 | | | 121,359 | | | | | | | | 121,359 | | | | | |
| | | | | | | | | | | | | | | | | | |
Sub-total Darling Downs District | | | | | | | | | | | | | 194,618 | | | | | |
| | | | | | | | | | | | | | | | | | |
| | | | | |
South West District | | | | | | | | | | | | | | | | | | |
Carnarvon Highway (Injune -7 Rolleston), pavement widening and five culvert extensions | | 307 | | | 2,880 | | | | 245 | | | | 1,635 | | | | 1,000 | |
Carnarvon Highway (St George -7 Surat), pavement widening and four culvert extensions | | 307 | | | 4,400 | | | | 480 | | | | 2,470 | | | | 1,450 | |
Landsborough Highway (Morven - Augathella), pavement rehabilitation and stabilisation | | 315 | | | 2,200 | | | | 32 | | | | 1,783 | | | | 385 | |
Noondoo - Thallon Road, Moonie River, construct new bridge and approaches | | 307 | | | 7,589 | | | | 1,043 | | | | 6,546 | | | | | |
119
Capital Statement 2019-20
| | | | | | | | | | | | | | | | | | |
| Transport and Main Roads | |
Project | | Statistical
Area | | Total
Estimated
Cost
$‘000 | | | Expenditure
to
30-06-19
$‘000 | | | Budget
2019-20
$‘000 | | | Post
2019-20
$‘000 | |
Warrego Highway (Miles - Roma), pavement rehabilitation and stabilisation | | 307 | | | 2,521 | | | | 83 | | | | 2,438 | | | | | |
Other South West construction | | 315 | | | 21,359 | | | | | | | | 21,359 | | | | | |
| | | | | | | | | | | | | | | | | | |
Sub-total South West District | | | | | | | | | | | | | 36,231 | | | | | |
| | | | | | | | | | | | | | | | | | |
| | | | | |
Fitzroy District | | | | | | | | | | | | | | | | | | |
Bajool - Port Alma Road,9 pavement widening and safety upgrades | | 308 | | | 14,500 | | | | 4,138 | | | | 10,362 | | | | | |
Bruce Highway (Benaraby - Rockhampton), Benaraby - Calliope River, widen pavement | | 308 | | | 40,263 | | | | 8,368 | | | | 21,421 | | | | 10,474 | |
Bruce Highway (Benaraby - Rockhampton), Calliope River - Mount Larcom, widen pavement | | 308 | | | 17,560 | | | | 660 | | | | 3,825 | | | | 13,075 | |
Bruce Highway (Benaraby - Rockhampton), Gentle Annie Road and St Arnauds Creek, widen pavement | | 308 | | | 26,660 | | | | 817 | | | | 12,334 | | | | 13,509 | |
Bruce Highway (Rockhampton - St Lawrence), Neilsen Avenue - Plentiful Creek, widen pavement | | 308 | | | 18,271 | | | | 950 | | | | 12,434 | | | | 4,887 | |
Bruce Highway (Rockhampton - St Lawrence), Plentiful Creek, construct overtaking lanes | | 308 | | | 9,435 | | | | 866 | | | | 6,900 | | | | 1,669 | |
Bruce Highway (Rockhampton - St Lawrence), Rockhampton Northern Access Upgrade (Stage 1) | | 308 | | | 121,001 | | | | 58,239 | | | | 29,062 | | | | 33,700 | |
Bruce Highway (Rockhampton - St Lawrence), Terranova Drive, improve intersection | | 308 | | | 36,048 | | | | 7,000 | | | | 15,000 | | | | 14,048 | |
Capricorn Highway (Rockhampton - Emerald), Gracemere - Emerald, overtaking lanes | | 308 | | | 19,000 | | | | 2,000 | | | | 16,800 | | | | 200 | |
Capricorn Highway duplication9 (Rockhampton - Gracemere) | | 308 | | | 74,990 | | | | 9,512 | | | | 35,888 | | | | 29,590 | |
Corbetts Landing boat ramp and floating walkway | | 308 | | | 1,400 | | | | 100 | | | | 1,300 | | | | | |
120
Capital Statement 2019-20
| | | | | | | | | | | | | | | | | | |
| Transport and Main Roads | |
Project | | Statistical
Area | | Total
Estimated
Cost
$‘000 | | | Expenditure
to
30-06-19
$‘000 | | | Budget
2019-20
$‘000 | | | Post
2019-20
$‘000 | |
Gladstone - Benaraby Road, Philip10 Street, duplicate lanes | | 308 | | | 20,000 | | | | 850 | | | | 19,150 | | | | | |
Gladstone - Benaraby Road, Dalrymple Drive - Bruce Highway, various safety treatments | | 308 | | | 20,400 | | | | 8,022 | | | | 9,400 | | | | 2,978 | |
Rockhampton Road Train Access3,11 (Stage 2) | | 308 | | | 30,000 | | | | 14,870 | | | | 14,940 | | | | 190 | |
Thompson Point boat ramp and floating walkway | | 308 | | | 2,000 | | | | 200 | | | | 1,800 | | | | | |
Other Fitzroy construction | | 308 | | | 76,710 | | | | | | | | 76,710 | | | | | |
| | | | | | | | | | | | | | | | | | |
Sub-total Fitzroy District | | | | | | | | | | | | | 287,326 | | | | | |
| | | | | | | | | | | | | | | | | | |
| | | | | |
Central West District | | | | | | | | | | | | | | | | | | |
Capricorn Highway (Alpha - Barcaldine), pavement rehabilitation | | 315 | | | 2,600 | | | | 61 | | | | 2,539 | | | | | |
Kennedy Developmental Road12 (Winton - Boulia), pavement widening and sealing | | 315 | | | 4,825 | | | | | | | | 1,240 | | | | 3,585 | |
Kennedy Developmental Road12 (Winton - Boulia), pavement widening and sealing | | 315 | | | 3,875 | | | | | | | | 3,875 | | | | | |
Kennedy Developmental Road (Winton - Boulia), pavement rehabilitation | | 315 | | | 5,131 | | | | 2,717 | | | | 2,414 | | | | | |
Landsborough Highway9 (Longreach - Winton), Dingo Creek - Darr River, pavement strengthening and widening | | 315 | | | 24,980 | | | | 9,950 | | | | 15,030 | | | | | |
Other Central West construction | | 315 | | | 25,120 | | | | | | | | 25,120 | | | | | |
| | | | | | | | | | | | | | | | | | |
Sub-total Central West District | | | | | | | | | | | | | 50,218 | | | | | |
| | | | | | | | | | | | | | | | | | |
| | | | | |
Mackay Whitsunday District | | | | | | | | | | | | | | | | | | |
Bowen Boat Harbour breakwaters extension | | 312 | | | 3,200 | | | | 100 | | | | 3,100 | | | | | |
Bowen Developmental Road9 (Collinsville - Belyando Crossing), Rockingham Creek - Mount Coolon, pave and seal | | 312 | | | 28,750 | | | | 4,131 | | | | 6,000 | | | | 18,619 | |
121
Capital Statement 2019-20
| | | | | | | | | | | | | | | | | | |
| Transport and Main Roads | |
Project | | Statistical
Area | | Total
Estimated
Cost
$‘000 | | | Expenditure
to
30-06-19
$‘000 | | | Budget
2019-20
$‘000 | | | Post
2019-20
$‘000 | |
Bruce Highway (Mackay - Proserpine), Hampden - Kuttabul, widening formation and rehabilitation | | 312 | | | 28,430 | | | | 2,486 | | | | 2,523 | | | | 23,421 | |
Bruce Highway (Mackay - Proserpine), Mackay Northern Access, construct additional lanes | | 312 | | | 110,565 | | | | 11,500 | | | | 20,000 | | | | 79,065 | |
Bruce Highway (St Lawrence - Mackay), Sarina Northern Access, construct roundabout | | 312 | | | 14,363 | | | | 4,281 | | | | 4,400 | | | | 5,682 | |
Mackay Ring Road (Stage 1) | | 312 | | | 497,375 | | | | 215,343 | | | | 60,000 | | | | 222,032 | |
Molongle Creek channel deepening | | 312 | | | 9,000 | | | | 1,256 | | | | 3,438 | | | | 4,306 | |
Peak Downs Highway (Clermont -9 Nebo), Wuthung Road - Caval Ridge Mine, widen pavement | | 312 | | | 35,000 | | | | 1,481 | | | | 7,000 | | | | 26,519 | |
Peak Downs Highway, Eton13 Range Realignment | | 312 | | | 189,264 | | | | 111,177 | | | | 17,500 | | | | 60,587 | |
Shute Harbour Road boating14 facilities | | 312 | | | 3,500 | | | | 715 | | | | 1,285 | | | | 1,500 | |
Other Mackay Whitsunday construction | | 312 | | | 64,343 | | | | | | | | 64,343 | | | | | |
| | | | | | | | | | | | | | | | | | |
Sub-total Mackay Whitsunday District | | | | | | | | | | | | | 189,589 | | | | | |
| | | | | | | | | | | | | | | | | | |
| | | | | |
Northern District | | | | | | | | | | | | | | | | | | |
Bruce Highway (Ayr - Townsville), Haughton River Floodplain, construct bridges and approaches | | 318 | | | 514,335 | | | | 60,000 | | | | 108,031 | | | | 346,304 | |
Bruce Highway (Ayr - Townsville), Mailman Road - Mackenzie Creek, widen and seal | | 318 | | | 23,400 | | | | 1,925 | | | | 6,234 | | | | 15,241 | |
Bruce Highway (Ayr - Townsville), Mailman Road - Mackenzie Creek, construct overtaking lanes | | 318 | | | 11,295 | | | | 55 | | | | 5,372 | | | | 5,868 | |
Bruce Highway (Townsville - Ingham), Bluewater Station Road and Forestry Road / Toolakea Beach Road, improve intersections | | 318 | | | 6,600 | | | | 8 | | | | 3,057 | | | | 3,535 | |
122
Capital Statement 2019-20
| | | | | | | | | | | | | | | | | | |
| Transport and Main Roads | |
Project | | Statistical
Area | | Total
Estimated
Cost
$‘000 | | | Expenditure
to
30-06-19
$‘000 | | | Budget
2019-20
$‘000 | | | Post
2019-20
$‘000 | |
Bruce Highway (Townsville - Ingham), Deep Creek - Bluewater Creek, pavement widening | | 318 | | | 9,431 | | | | 802 | | | | 5,476 | | | | 3,153 | |
Bruce Highway (Townsville - Ingham), Two Mile Creek - Sleeper Log Creek, construct overtaking lanes | | 318 | | | 6,100 | | | | 1,176 | | | | 2,725 | | | | 2,199 | |
Gregory Developmental Road (Charters Towers - The Lynd), rehabilitate and widen | | 318 | | | 45,410 | | | | 26,702 | | | | 7,278 | | | | 11,430 | |
Other Northern construction | | 318 | | | 56,670 | | | | | | | | 56,670 | | | | | |
| | | | | | | | | | | | | | | | | | |
Sub-total Northern District | | | | | | | | | | | | | 194,843 | | | | | |
| | | | | | | | | | | | | | | | | | |
| | | | | |
North West District | | | | | | | | | | | | | | | | | | |
Barkly Highway (Cloncurry - Mount9 Isa), improve intersections | | 315 | | | 8,273 | | | | 3,430 | | | | 4,843 | | | | | |
Gregory Downs - Camooweal Road, paving and sealing unsealed road | | 315 | | | 4,500 | | | | 1,200 | | | | 3,300 | | | | | |
Kennedy Developmental Road9,15 (The Lynd - Hughenden), Hann Highway, seal sections | | 315 | | | 50,000 | | | | 34,411 | | | | 11,289 | | | | 4,300 | |
Other North West construction | | 315 | | | 33,461 | | | | | | | | 33,461 | | | | | |
| | | | | | | | | | | | | | | | | | |
Sub-total North West District | | | | | | | | | | | | | 52,893 | | | | | |
| | | | | | | | | | | | | | | | | | |
| | | | | |
Far North District | | | | | | | | | | | | | | | | | | |
Bruce Highway (Ingham - Innisfail), various locations, improve intersections | | 306 | | | 3,959 | | | | 252 | | | | 2,871 | | | | 836 | |
Bruce Highway (Innisfail - Cairns), Cairns Southern Access Corridor (Stage 3), Edmonton to Gordonvale, duplicate two to four lanes | | 306 | | | 481,000 | | | | 36,745 | | | | 37,895 | | | | 406,360 | |
Bruce Highway (Innisfail - Cairns), Cairns Southern Access Corridor (Stage 4), Kate Street to Aumuller Street, widen four to six lanes | | 306 | | | 104,070 | | | | 29,736 | | | | 30,301 | | | | 44,033 | |
123
Capital Statement 2019-20
| | | | | | | | | | | | | | | | | | |
| Transport and Main Roads | |
Project | | Statistical
Area | | Total
Estimated
Cost
$‘000 | | | Expenditure
to
30-06-19
$‘000 | | | Budget
2019-20
$‘000 | | | Post
2019-20
$‘000 | |
Burke Developmental Road11 (Normanton - Dimbulah), Chillagoe - Almaden (Package 1), pavement widening | | 315 | | | 4,734 | | | | 741 | | | | 2,877 | | | | 1,116 | |
Burke Developmental Road (Normanton - Dimbulah), Chillagoe - Almaden (Package 2), pavement widening | | 315 | | | 2,726 | | | | 482 | | | | 2,244 | | | | | |
Cairns Western Arterial Road,16 Harley Street intersection upgrade | | 306 | | | 16,357 | | | | 337 | | | | 3,353 | | | | 12,667 | |
Captain Cook Highway (Cairns - Mossman), various locations, safety improvements | | 306 | | | 21,917 | | | | 3,628 | | | | 3,826 | | | | 14,463 | |
Clump Point boat ramp (Mission Beach), upgrade boating infrastructure | | 306 | | | 23,326 | | | | 6,229 | | | | 17,097 | | | | | |
Newell boat ramp (north bank of Mossman River), upgrade boating infrastructure | | 306 | | | 3,200 | | | | 220 | | | | 1,000 | | | | 1,980 | |
Peninsula Developmental Road17 (Coen - Weipa), Stage 2, Telecom Tower - Archer River, pave and seal | | 315 | | | 20,500 | | | | 5,992 | | | | 14,508 | | | | | |
Smithfield Bypass, construct1 bypass to a sealed standard | | 306 | | | 152,000 | | | | 31,029 | | | | 46,275 | | | | 74,696 | |
Other Far North construction | | 306 | | | 63,761 | | | | | | | | 63,761 | | | | | |
| | | | | | | | | | | | | | | | | | |
Sub-total Far North District | | | | | | | | | | | | | 226,008 | | | | | |
| | | | | | | | | | | | | | | | | | |
| | | | | |
State Wide District | | | | | | | | | | | | | | | | | | |
Bruce Highway, Additional Electric18 Vehicle Charging Stations Program | | Various | | | 2,500 | | | | | | | | 2,500 | | | | | |
Maritime safety minor works | | Various | | | | | | | | | | | 6,823 | | | | Ongoing | |
New Generation Rollingstock19 | | 310 | | | 4,155,705 | | | | 1,341,398 | | | | 213,285 | | | | 2,601,022 | |
Transport Corridor Acquisition Fund | | Various | | | | | | | | | | | 60,430 | | | | Ongoing | |
Other Statewide construction | | Various | | | 76,419 | | | | | | | | 76,419 | | | | | |
| | | | | | | | | | | | | | | | | | |
Sub-total State Wide District | | | | | | | | | | | | | 359,457 | | | | | |
| | | | | | | | | | | | | | | | | | |
124
Capital Statement 2019-20
| | | | | | | | | | | | | | | | | | | | |
| Transport and Main Roads | |
Project | | Statistical
Area | | | Total
Estimated
Cost
$‘000 | | | Expenditure
to
30-06-19
$‘000 | | | Budget
2019-20
$‘000 | | | Post
2019-20
$‘000 | |
Other Property, Plant and Equipment Corporate buildings | | | Various | | | | | | | | | | | | 8,000 | | | | Ongoing | |
Information technology | | | Various | | | | | | | | | | | | 17,483 | | | | Ongoing | |
Plant and equipment | | | Various | | | | | | | | | | | | 11,354 | | | | Ongoing | |
New public transport ticketing system | | | Various | | | | 371,060 | | | | 69,964 | | | | 119,863 | | | | 181,233 | |
| | | | | | | | | | | | | | | | | | | | |
Sub-total Other Property, Plant and Equipment | | | | | | | | | | | | | | | 156,700 | | | | | |
| | | | | | | | | | | | | | | | | | | | |
| | | | | | | | | | | | | | | | | | | | |
| | | | | | | | | | | | | | | | | | | | |
Total Property, Plant and Equipment | | | | | | | | | | | | | | | 2,877,483 | | | | | |
| | | | | | | | | | | | | | | | | | | | |
| | | | | |
Capital Grants | | | | | | | | | | | | | | | | | | | | |
Black Spot Program | | | Various | | | | | | | | | | | | 12,178 | | | | Ongoing | |
Bridges Renewal Program | | | Various | | | | 70,534 | | | | 59,114 | | | | 9,547 | | | | 1,873 | |
Bus Stop Shelter Program | | | Various | | | | 20,000 | | | | 1,000 | | | | 5,500 | | | | 13,500 | |
Cape York Region Package17 | | | 315 | | �� | | 50,338 | | | | 48,674 | | | | 1,664 | | | | | |
Cycling Program | | | Various | | | | | | | | | | | | 18,481 | | | | Ongoing | |
Eastern Transitway | | | 303 | | | | 22,000 | | | | 1,033 | | | | 1,893 | | | | 19,074 | |
Heavy vehicle safety and7 productivity | | | Various | | | | | | | | | | | | 7,966 | | | | Ongoing | |
Off-Network - road projects | | | Various | | | | 60,313 | | | | 50,359 | | | | 5,574 | | | | 4,380 | |
Pasha Road (Moranbah), pave and seal | | | 312 | | | | 16,000 | | | | 3,000 | | | | 13,000 | | | | | |
Passenger Transport Facilities Program | | | Various | | | | | | | | | | | | 7,214 | | | | Ongoing | |
Queensland school bus upgrades | | | Various | | | | | | | | | | | | 17,149 | | | | Ongoing | |
Regional Roads Infrastructure Package | | | Various | | | | 8,302 | | | | 3,293 | | | | 5,009 | | | | | |
Reid Park Active Transport Bridge | | | 318 | | | | 7,400 | | | | | | | | 4,000 | | | | 3,400 | |
School Transport Infrastructure Program | | | Various | | | | 20,000 | | | | | | | | 7,000 | | | | 13,000 | |
Transport Infrastructure Development Scheme | | | Various | | | | | | | | | | | | 70,000 | | | | Ongoing | |
Wheelchair Accessible Taxi Sustainability Program | | | Various | | | | 20,890 | | | | | | | | 4,567 | | | | 16,323 | |
Other capital grants | | | Various | | | | 26,000 | | | | | | | | 26,000 | | | | | |
| | | | | | | | | | | | | | | | | | | | |
Total Capital Grants | | | | | | | | | | | | | | | 216,742 | | | | | |
| | | | | | | | | | | | | | | | | | | | |
125
Capital Statement 2019-20
| | | | | | | | | | | | | | | | | | |
| Transport and Main Roads | |
Project | | Statistical
Area | | Total
Estimated
Cost
$‘000 | | | Expenditure
to
30-06-19
$‘000 | | | Budget
2019-20
$‘000 | | | Post
2019-20
$‘000 | |
GOLD COAST WATERWAYS AUTHORITY | | | | | | | | | | | | | | | | | | |
| | | | | |
Property, Plant and Equipment | | | | | | | | | | | | | | | | | | |
Navigation access and safety | | 309 | | | 13,246 | | | | 5,751 | | | | 1,795 | | | | 5,700 | |
Boating Infrastructure Program | | 309 | | | 3,545 | | | | 375 | | | | 220 | | | | 2,950 | |
Plant, equipment and minor works | | 309 | | | 8,944 | | | | 1,899 | | | | 4,295 | | | | 2,750 | |
| | | | | | | | | | | | | | | | | | |
Total Property, Plant and Equipment | | | | | | | | | | | | | 6,310 | | | | | |
| | | | | | | | | | | | | | | | | | |
| | | | | |
ROADTEK | | | | | | | | | | | | | | | | | | |
| | | | | |
Property, Plant and Equipment | | | | | | | | | | | | | | | | | | |
Construction plant works | | Various | | | | | | | | | | | 19,000 | | | | Ongoing | |
| | | | | | | | | | | | | | | | | | |
Total Property, Plant and Equipment | | | | | | | | | | | | | 19,000 | | | | | |
| | | | | | | | | | | | | | | | | | |
| | | | | |
QUEENSLAND RAIL LIMITED | | | | | | | | | | | | | | | | | | |
| | | | | |
Property, Plant and Equipment | | | | | | | | | | | | | | | | | | |
Growth | | | | | | | | | | | | | | | | | | |
Breakfast Creek Bridge realignment | | 305 | | | 40,200 | | | | | | | | 5,000 | | | | 35,200 | |
European Train Control System Level 2 - Inner city works | | 305 | | | 634,380 | | | | 61,891 | | | | 73,540 | | | | 498,949 | |
Mayne Yard accessibility | | 305 | | | 97,300 | | | | | | | | 2,000 | | | | 95,300 | |
Mayne Yard - relocation | | 305 | | | 22,400 | | | | | | | | 6,000 | | | | 16,400 | |
Moolabin Power upgrade | | 303 | | | 18,000 | | | | | | | | 1,000 | | | | 17,000 | |
New Generation Rollingstock - power distribution | | Various | | | 48,404 | | | | 35,650 | | | | 9,842 | | | | 2,912 | |
New Generation Rollingstock - station compatibility | | Various | | | 13,734 | | | | 13,058 | | | | 676 | | | | | |
Other New Generation Rollingstock - operational readiness projects | | Various | | | 192 | | | | | | | | 192 | | | | | |
North Coast Line capacity improvement project | | Various | | | 68,224 | | | | 9,274 | | | | 29,450 | | | | 29,500 | |
Bridge pier protection | | Various | | | 4,000 | | | | | | | | 1,000 | | | | 3,000 | |
Relocation of network operations (Stage 1) | | Various | | | 41,476 | | | | 3,170 | | | | 24,446 | | | | 13,860 | |
Relocation of Roma Street operations | | 305 | | | 15,009 | | | | 2,928 | | | | 12,081 | | | | | |
Toowoomba Range capacity and clearance upgrades | | 317 | | | 77,320 | | | | 70,975 | | | | 6,345 | | | | | |
Yeppoon Rail Line upgrade | | 308 | | | 5,046 | | | | 3,953 | | | | 1,093 | | | | | |
126
Capital Statement 2019-20
| | | | | | | | | | | | | | | | | | |
| Transport and Main Roads | |
Project | | Statistical
Area | | Total
Estimated
Cost
$‘000 | | | Expenditure
to
30-06-19
$‘000 | | | Budget
2019-20
$‘000 | | | Post
2019-20
$‘000 | |
Other Central train station upgrades | | 305 | | | 1,459 | | | | | | | | 193 | | | | 1,266 | |
Albion train station upgrade | | 305 | | | 17,078 | | | | 1,138 | | | | 1,793 | | | | 14,147 | |
Auchenflower train station upgrade | | 305 | | | 43,997 | | | | 1,577 | | | | 4,480 | | | | 37,940 | |
Boondall train station upgrade | | 302 | | | 19,422 | | | | 11,016 | | | | 5,626 | | | | 2,780 | |
Buranda train station upgrade | | 303 | | | 29,097 | | | | 1,279 | | | | 3,279 | | | | 24,539 | |
Cannon Hill train station upgrade | | 303 | | | 26,668 | | | | 1,311 | | | | 4,102 | | | | 21,255 | |
Dakabin train station upgrade | | 314 | | | 41,899 | | | | 2,092 | | | | 15,248 | | | | 24,559 | |
East Ipswich train station upgrade | | 310 | | | 34,812 | | | | 1,023 | | | | 6,454 | | | | 27,335 | |
Morayfield train station upgrade | | 313 | | | 21,685 | | | | 13,209 | | | | 5,984 | | | | 2,492 | |
South Bank train station upgrade | | 305 | | | 11,080 | | | | 2,230 | | | | 8,850 | | | | | |
Strathpine train station upgrade | | 314 | | | 28,366 | | | | 14,605 | | | | 7,945 | | | | 5,816 | |
Fairfield train station - Salisbury train station upgrades | | 303 | | | 57,000 | | | | | | | | 2,000 | | | | 55,000 | |
Darra train station park ‘n’ ride20 | | 310 | | | 8,770 | | | | 2,914 | | | | 273 | | | | 5,583 | |
Geebung train station park ‘n’ ride20 | | 302 | | | 3,100 | | | | 160 | | | | 427 | | | | 2,513 | |
Lawnton train station park ‘n’ ride20 | | 314 | | | 10,400 | | | | 2,739 | | | | 594 | | | | 7,067 | |
Lindum train station park ‘n’ ride20 | | 301 | | | 5,000 | | | | 230 | | | | 216 | | | | 4,554 | |
Salisbury train station park ‘n’ ride20 | | 303 | | | 14,500 | | | | 4,010 | | | | 273 | | | | 10,217 | |
Springfield Central train station20 park ‘n’ ride | | 310 | | | 44,500 | | | | 550 | | | | 2,361 | | | | 41,589 | |
Virginia train station park ‘n’ ride20 | | 302 | | | 2,300 | | | | 164 | | | | 370 | | | | 1,766 | |
Other rail projects21 | | Various | | | | | | | | | | | 11,278 | | | | Ongoing | |
| | | | | | | | | | | | | | | | | | |
Sub-total Growth | | | | | | | | | | | | | 254,411 | | | | | |
| | | | | | | | | | | | | | | | | | |
| | | | | |
Network | | | | | | | | | | | | | | | | | | |
Below rail cost optimisation22 | | Various | | | | | | | | | | | 14,203 | | | | Ongoing | |
Below rail operational22 performance | | Various | | | | | | | | | | | 193,673 | | | | Ongoing | |
Townsville - Mount Isa Rail Line | | Various | | | | | | | | | | | 17,647 | | | | Ongoing | |
| | | | | | | | | | | | | | | | | | |
Sub-total Network | | | | | | | | | | | | | 225,523 | | | | | |
| | | | | | | | | | | | | | | | | | |
| | | | | |
Rail Operations | | | | | | | | | | | | | | | | | | |
Above rail cost optimisation23 | | Various | | | | | | | | | | | 5,713 | | | | Ongoing | |
Above rail operational23 performance | | Various | | | | | | | | | | | 101,010 | | | | Ongoing | |
| | | | | | | | | | | | | | | | | | |
Sub-total Rail Operations | | | | | | | | | | | | | 106,723 | | | | | |
| | | | | | | | | | | | | | | | | | |
| | | | | |
Business Enabling | | | | | | | | | | | | | | | | | | |
Customer service and innovation program | | Various | | | | | | | | | | | 7,786 | | | | Ongoing | |
Safety program | | Various | | | | | | | | | | | 5,019 | | | | Ongoing | |
127
Capital Statement 2019-20
| | | | | | | | | | | | | | | | | | |
| Transport and Main Roads | |
Project | | Statistical
Area | | Total
Estimated
Cost
$‘000 | | | Expenditure
to 30-06-19
$‘000 | | | Budget
2019-20
$‘000 | | | Post
2019-20
$‘000 | |
Workforce productivity program | | Various | | | | | | | | | | | 3,059 | | | | Ongoing | |
Other enabling programs | | Various | | | | | | | | | | | 36,114 | | | | Ongoing | |
| | | | | | | | | | | | | | | | | | |
Sub-total Business Enabling | | | | | | | | | | | | | 51,978 | | | | | |
| | | | | | | | | | | | | | | | | | |
| | | | | | | | | | | | | | | | | | |
| | | | | | | | | | | | | | | | | | |
Total Property, Plant and Equipment | | | | | | | | | | | | | 638,635 | | | | | |
| | | | | | | | | | | | | | | | | | |
| | |
FAR NORTH QUEENSLAND PORTS CORPORATION LIMITED | | | | | | | | | |
| | | | | |
Property, Plant and Equipment | | | | | | | | | | | | | | | | | | |
Cairns shipping development project | | 306 | | | 127,600 | | | | 57,506 | | | | 70,094 | | | | | |
Foreshore development | | 306 | | | 19,576 | | | | 19,276 | | | | 200 | | | | 100 | |
Marlin Marina reconfiguration and expansion | | 306 | | | 4,843 | | | | 1,893 | | | | 1,850 | | | | 1,100 | |
Mourilyan lease acquisitions | | 306 | | | 966 | | | | 300 | | | | 333 | | | | 333 | |
Tingira street subdivision development | | 306 | | | 14,799 | | | | 4,799 | | | | 2,000 | | | | 8,000 | |
Plant, equipment and minor works | | 306 | | | 4,338 | | | | | | | | 1,636 | | | | 2,702 | |
| | | | | | | | | | | | | | | | | | |
Total Property, Plant and Equipment | | | | | | | | | | | | | 76,113 | | | | | |
| | | | | | | | | | | | | | | | | | |
| | | | |
GLADSTONE PORTS CORPORATION LIMITED | | | | | | | | | | | | | | | | |
| | | | | |
Property, Plant and Equipment | | | | | | | | | | | | | | | | | | |
RG Tanna Coal Terminal Projects | | | | | | | | | | | | | | | | | | |
Process control systems, stockpile management and upgrades | | 308 | | | 168,025 | | | | 11,065 | | | | 25,617 | | | | 131,343 | |
Capacity maximisation | | 308 | | | 2,900 | | | | 1,500 | | | | 1,400 | | | | | |
Conveyor life extension | | 308 | | | 87,318 | | | | 7,764 | | | | 9,778 | | | | 69,776 | |
Auckland Point berth 1 projects | | 308 | | | 14,340 | | | | 210 | | | | 630 | | | | 13,500 | |
Auckland Point berth 4 projects24 | | 308 | | | 25,285 | | | | 1,930 | | | | 8,355 | | | | 15,000 | |
Barney Point projects | | 308 | | | 1,600 | | | | 425 | | | | 1,175 | | | | | |
Fisherman’s Landing projects | | 308 | | | 31,935 | | | | 400 | | | | 3,085 | | | | 28,450 | |
Marina projects | | 308 | | | 2,400 | | | | | | | | 1,000 | | | | 1,400 | |
Port Alma projects | | 308 | | | 2,500 | | | | | | | | 2,500 | | | | | |
Port of Bundaberg projects | | 319 | | | 4,875 | | | | 1,267 | | | | 1,608 | | | | 2,000 | |
Port services projects | | 308 | | | 87,233 | | | | 31,305 | | | | 32,408 | | | | 23,520 | |
Quarry projects | | 308 | | | 5,350 | | | | | | | | 1,800 | | | | 3,550 | |
South Trees projects | | 308 | | | 7,200 | | | | | | | | 1,800 | | | | 5,400 | |
Information systems projects | | 308 | | | 57,473 | | | | 3,257 | | | | 18,356 | | | | 35,860 | |
Plant, equipment and minor works | | 308 | | | 22,265 | | | | 955 | | | | 6,422 | | | | 14,888 | |
| | | | | | | | | | | | | | | | | | |
Total Property, Plant and Equipment | | | | | | | | | | | | | 115,934 | | | | | |
| | | | | | | | | | | | | | | | | | |
128
Capital Statement 2019-20
| | | | | | | | | | | | | | | | | | |
| Transport and Main Roads | |
Project | | Statistical
Area | | Total
Estimated
Cost
$‘000 | | | Expenditure
to
30-06-19
$‘000 | | | Budget
2019-20
$‘000 | | | Post
2019-20
$‘000 | |
NORTH QUEENSLAND BULK PORTS CORPORATION LIMITED | | | | | | | | | |
| | | | | |
Property, Plant and Equipment | | | | | | | | | | | | | | | | | | |
Abbot Point Port Development General | | 312 | | | 15,031 | | | | 171 | | | | 980 | | | | 13,880 | |
Autoclaves replacement | | 312 | | | 4,560 | | | | | | | | 2,280 | | | | 2,280 | |
Hay Point Port Development General | | 312 | | | 2,557 | | | | 543 | | | | 94 | | | | 1,920 | |
Louisa Creek Acquisition Program | | 312 | | | 5,195 | | | | 237 | | | | 1,052 | | | | 3,906 | |
Mackay Northern Access Road | | 312 | | | 2,571 | | | | 76 | | | | 2,495 | | | | | |
Mackay Port Development General | | 312 | | | 30,228 | | | | 1,826 | | | | 2,387 | | | | 26,015 | |
Mackay Tug Berth Facilities Stage 1 | | 312 | | | 8,000 | | | | 216 | | | | 7,784 | | | | | |
Mackay water network enhancements | | 312 | | | 3,250 | | | | 95 | | | | 755 | | | | 2,400 | |
Pilotage Upgrade and Replacements | | 312 | | | 7,909 | | | | | | | | 48 | | | | 7,861 | |
Upgrade of Hay Point VTS building | | 312 | | | 678 | | | | 8 | | | | 520 | | | | 150 | |
Weipa Port Development General | | 315 | | | 1,160 | | | | | | | | 700 | | | | 460 | |
Transformer project ERP implementation | | 312 | | | 3,000 | | | | | | | | 1,500 | | | | 1,500 | |
Business improvement (information technology) | | 312 | | | 2,187 | | | | 47 | | | | 250 | | | | 1,890 | |
| | | | | | | | | | | | | | | | | | |
Total Property, Plant and Equipment | | | | | | | | | | | | | 20,845 | | | | | |
| | | | | | | | | | | | | | | | | | |
| | | | | |
PORT OF TOWNSVILLE LIMITED | | | | | | | | | | | | | | | | | | |
| | | | | |
Property, Plant and Equipment | | | | | | | | | | | | | | | | | | |
Berth 4 cranes and cargo terminal area | | 318 | | | 29,306 | | | | 4,249 | | | | 17,464 | | | | 7,593 | |
Channel capacity upgrade | | 318 | | | 193,460 | | | | 21,141 | | | | 83,831 | | | | 88,488 | |
Road network upgrades | | 318 | | | 20,867 | | | | 285 | | | | 10,132 | | | | 10,450 | |
Wharf facilities upgrades | | 318 | | | 19,649 | | | | 663 | | | | 4,900 | | | | 14,086 | |
Plant, equipment and minor works | | 318 | | | 17,326 | | | | | | | | 8,147 | | | | 9,179 | |
| | | | | | | | | | | | | | | | | | |
Total Property, Plant and Equipment | | | | | | | | | | | | | 124,474 | | | | | |
| | | | | | | | | | | | | | | | | | |
| | | | | | | | | | | | | | | | | | |
| | | | | | | | | | | | | | | | | | |
TOTAL TRANSPORT AND MAIN ROADS (PPE) | | | | | | | | 3,878,794 | | | | | |
| | | | | | | | | | | | | | | | | | |
| | | | | | | | | | | | | |
| | | | | | | | | | | | | | | | | | |
TOTAL TRANSPORT AND MAIN ROADS (CG) | | | | | | | | 216,742 | | | | | |
| | | | | | | | | | | | | | | | | | |
129
Capital Statement 2019-20
Notes:
| 1. | Part of the State Infrastructure Fund. |
| 2. | Indicative total project cost to be confirmed. The Australian Government contribution capped at $110 million, with the Queensland Government to fund the balance. Queensland Government contribution includes $44 million from the State Infrastructure Fund. |
| 3. | Part of the State Infrastructure Fund - Priority Economic Works and Productivity Program. |
| 4. | The Australian Government contribution capped at $115 million, with the Queensland Government to fund the balance. The Queensland Government contribution includes $42 million from the State Infrastructure Fund - Priority Economic Works and Productivity Program. |
| 5. | Funding arrangements subject to negotiations with the Australian Government. |
| 6. | Indicative total project cost subject to confirmation. Project timing, potential staging and funding arrangements subject to negotiations with the Australian Government. |
| 7. | Part of the Australian Government’s Heavy Vehicle Safety and Productivity Program, jointly funded by the Australian Government and Queensland Government. |
| 8. | Part of the $635 million Warrego Highway Upgrade Package to upgrade the Warrego Highway between Toowoomba and Miles. |
| 9. | Part of the Northern Australia Roads Program. |
| 10. | This project is fully-funded by the Australian Government. |
| 11. | Part of the Northern Australia Beef Roads Program. |
| 12. | Part of the Australian Government’s commitment to the Outback Way, jointly funded by the Australian Government and Queensland Government. |
| 13. | The Australian Government will fund 100% of the project cost up to $166 million. The Queensland Government will contribute up to $23 million (if required) for costs above $166 million. |
| 14. | Project is subject to council agreement. |
| 15. | The scope of this work also falls within Etheridge Shire Council, with funding for this project only represented in North West District. Project is part of the Australian Government’s Northern Australia Roads Program, jointly funded by the Australian Government and Queensland Government. |
| 16. | Part of the State Infrastructure Fund - Significant Regional Infrastructure Projects and Program. |
| 17. | Part of the Cape York Region Package. |
| 18. | Represents the Queensland Government’s funding contribution, as per the Future Proofing the Bruce Policy. |
| 19. | This project is being delivered under a Public Private Partnership arrangement (PPP). |
| 20. | The project is jointly delivered by Queensland Rail and Department of Transport and Main Roads. |
| 21. | Projects other than European Train Control System, New Generation Rollingstock - Operational Readiness, Central and other train station upgrades that will grow and enhance the Queensland Rail Network. They are mainly related to infrastructure and civil works. |
| 22. | Below Rail includes track infrastructure. |
| 23. | Above Rail includes stations, platforms and rollingstock. |
| 24. | Selected Auckland Point berth 4 projects remain subject to shareholding Ministers’ approval. |
All Projects - Total estimated cost is inclusive of both non-capital and capital components of project expenditure.
130
Capital Statement 2019-20
Department of Youth Justice
The capital works program for the Department of Youth Justice is $51.9 million in 2019-20.
Program highlights (Property, Plant and Equipment)
| • | | $23.9 million of a total $27 million to build 16 more beds at Brisbane Youth Detention Centre. |
| • | | $9.7 million to undertake early works on the development of a new 32 bed youth detention centre at Wacol. A further $140 million will be held centrally for the remaining estimated cost of the project. |
| • | | $8.5 million of a total $33.6 million to complete the security management system at Brisbane Youth Detention Centre. |
| • | | $6.1 million of a total $26 million to support the transition of 17 year olds into the youth justice system, including the completion of zonal fencing projects and fire system upgrades at existing youth detention centres. |
| | | | | | | | | | | | | | | | | | |
| Youth Justice | |
Project | | Statistical
Area | | Total
Estimated
Cost
$‘000 | | | Expenditure
to
30-06-19
$‘000 | | | Budget
2019-20
$‘000 | | | Post
2019-20
$‘000 | |
DEPARTMENT OF YOUTH JUSTICE | | | | | | | | | | | | | | | | | | |
| | | | | |
Property, Plant and Equipment | | | | | | | | | | | | | | | | | | |
Brisbane Youth Detention Centre - 16 additional beds | | 310 | | | 27,008 | | | | 150 | | | | 23,858 | | | | 3,000 | |
New youth detention centre - 32 bed1 construction project | | 310 | | | 10,000 | | | | 300 | | | | 9,700 | | | | | |
Brisbane Youth Detention Centre - security management system | | 310 | | | 33,609 | | | | 25,119 | | | | 8,490 | | | | | |
Transition of 17 year olds to the youth justice system | | Various | | | 25,986 | | | | 19,860 | | | | 6,126 | | | | | |
Youth Justice Facilities Program | | Various | | | | | | | | | | | 3,740 | | | | Ongoing | |
| | | | | | | | | | | | | | | | | | |
Total Property, Plant and Equipment | | | | | | | | | | | | | 51,914 | | | | | |
| | | | | | | | | | | | | | | | | | |
| | | | | | | | | | | | | | | | | | |
| | | | | | | | | | | | | | | | | | |
TOTAL YOUTH JUSTICE (PPE) | | | | | | | | | | | | | 51,914 | | | | | |
| | | | | | | | | | | | | | | | | | |
Note:
| 1. | A further $140 million will be held centrally for the remaining estimated cost of the project. |
131
Capital Statement 2019-20
Appendices
| Appendix A: | Entities included in capital outlays 2019-20 |
Aboriginal and Torres Strait Islander Partnerships
Department of Aboriginal and Torres Strait Islander Partnerships
Agriculture and Fisheries
Department of Agriculture and Fisheries
Queensland Racing Integrity Commission
Child Safety, Youth and Women
Department of Child Safety, Youth and Women
Communities, Disability Services and Seniors
Department of Communities, Disability Services and Seniors
Education
Department of Education
Queensland Curriculum and Assessment Authority
Electoral Commission of Queensland
Employment, Small Business and Training
Department of Employment, Small Business and Training
TAFE Queensland
Environment and Science
Department of Environment and Science
Library Board of Queensland
Queensland Art Gallery
Queensland Museum
Queensland Performing Arts Trust
Housing and Public Works
Department of Housing and Public Works
CITEC
Queensland Shared Services
Stadiums Queensland
132
Capital Statement 2019-20
Innovation, Tourism Industry Development and Commonwealth Games
Department of Innovation, Tourism Industry Development and Commonwealth Games
Justice and Attorney General
Department of Justice and Attorney General
Public Trustee of Queensland
Legal Aid Queensland
Crime and Corruption Commission
Legislative Assembly of Queensland
Local Government, Racing and Multicultural Affairs
Department of Local Government, Racing and Multicultural Affairs
Natural Resources, Mines and Energy
Department of Natural Resources, Mines and Energy
CleanCo Queensland Limited
CS Energy Limited
Energy Queensland
Powerlink Queensland
Stanwell Corporation Limited
Gladstone Area Water Board
Mount Isa Water Board
Seqwater
SunWater Limited
Premier and Cabinet
Department of the Premier and Cabinet
Public Safety Business Agency
Queensland Corrective Services
Queensland Fire and Emergency Services
Queensland Health
Queensland Health and Hospital and Health Services
Council of the Queensland Institute of Medical Research
Queensland Ambulance Service
Queensland Police Service
133
Capital Statement 2019-20
Queensland Treasury
Queensland Treasury
Cross River Rail Delivery Authority
State Development, Manufacturing, Infrastructure and Planning
Department of State Development, Manufacturing, Infrastructure and Planning
Economic Development Queensland
Queensland Reconstruction Authority
South Bank Corporation
Transport and Main Roads
Department of Transport and Main Roads
Far North Queensland Ports Corporation
Gladstone Ports Corporation
Gold Coast Waterways Authority
North Queensland Bulk Ports Corporation
Port of Townsville Limited
Queensland Rail Limited
RoadTek
Youth Justice
Department of Youth Justice
134
Capital Statement 2019-20
| Appendix B: | Key concepts and coverage |
Coverage of the capital statement
Under accrual output budgeting, capital is the stock of assets including property, plant and equipment and intangible assets that any agency owns and/or controls and uses in the delivery of services, as well as capital grants made to other entities. The following definitions are applicable throughout this document:
| • | | capital purchases – property, plant and equipment outlays as per the financial statements excluding asset sales, depreciation and revaluations |
| • | | capital grants – capital grants to other entities and individuals (excluding grants to other government departments and statutory bodies). |
Capital contingency
Consistent with the approach adopted in previous years, a capital contingency reserve has been included. This reserve recognises that while agencies budget to fully use their capital works allocation, circumstances such as project lead-in times, project management constraints, unexpected weather conditions and capacity constraints such as the supply of labour and materials may prevent full usage. On a whole-of-government basis, there is likely to be underspending, resulting in a carry-over of capital allocations.
Estimated jobs supported by capital works
The $12,941 billion capital works program in 2019-20 is estimated to directly support 40,500 jobs, equating to around 37,800 full-time equivalent jobs. The estimate of jobs supported by the Government’s capital works program in 2019-20 is based on Queensland Treasury’s Guidelines for estimating the full-time equivalent (FTE) jobs directly supported by the construction component of the capital works program.
The estimate of jobs supported by the capital works program is presented both in terms of FTEs and total jobs. Further, in some cases, jobs estimates quoted for specific projects throughout the Capital Statement and in other Budget papers may reflect other approaches, including proponent’s estimates or project specific information, rather than the methodology in the Queensland Treasury Guidelines for estimating jobs supported by capital works.
135
Capital Statement 2019-20
| Appendix C: | Capital purchases by entity by region 2019-20 |
| | | | | | | | | | | | | | | | | | | | | | | | |
| | | Brisbane and Redlands | |
| | | East | | | North | | | South | | | West | | | Inner City | | | Sub total | |
Entity2 | | $‘000 | | | $‘000 | | | $‘000 | | | $‘000 | | | $‘000 | | | $‘000 | |
| | | | | | |
Aboriginal and Torres Strait Islander Partnerships | | | — | | | | — | | | | — | | | | — | | | | 60 | | | | 60 | |
| | | | | | |
Agriculture and Fisheries | | | 744 | | | | 165 | | | | 574 | | | | 40 | | | | 8,848 | | | | 10,371 | |
| | | | | | |
Child Safety, Youth and Women | | | 1,077 | | | | 1,009 | | | | 1,677 | | | | 868 | | | | 1,281 | | | | 5,912 | |
| | | | | | |
Communities, Disability Services and Seniors | | | 280 | | | | 260 | | | | 433 | | | | 223 | | | | 1,873 | | | | 3,069 | |
| | | | | | |
Education | | | 22,739 | | | | 32,548 | | | | 107,787 | | | | 72,956 | | | | 175,051 | | | | 411,081 | |
| | | | | | |
Electoral Commission of Queensland | | | — | | | | — | | | | — | | | | — | | | | 1,925 | | | | 1,925 | |
| | | | | | |
Employment, Small Business and Training | | | 13,273 | | | | 3,170 | | | | 20,104 | | | | 2,635 | | | | 3,901 | | | | 43,083 | |
| | | | | | |
Environment and Science | | | 3,283 | | | | 2,440 | | | | 4,055 | | | | 2,609 | | | | 38,106 | | | | 50,493 | |
| | | | | | |
Housing and Public Works | | | 11,247 | | | | 18,700 | | | | 66,701 | | | | 12,746 | | | | 51,498 | | | | 160,892 | |
| | | | | | |
Justice and Attorney-General | | | 1,110 | | | | 1,039 | | | | 1,726 | | | | 891 | | | | 37,941 | | | | 42,707 | |
| | | | | | |
Legislative Assembly of Queensland | | | — | | | | 200 | | | | — | | | | — | | | | 6,432 | | | | 6,632 | |
| | | | | | |
Local Government, Racing and Multicultural Affairs | | | 55 | | | | 50 | | | | 84 | | | | 43 | | | | 64 | | | | 296 | |
| | | | | | |
Natural Resources, Mines and Energy | | | 74,167 | | | | 117,614 | | | | 81,245 | | | | 75,547 | | | | 309,637 | | | | 658,210 | |
| | | | | | |
Public Safety Business Agency3 | | | 7,101 | | | | 13,166 | | | | 11,059 | | | | 5,709 | | | | 18,007 | | | | 55,042 | |
| | | | | | |
Queensland Corrective Services | | | 1,478 | | | | 1,386 | | | | 4,303 | | | | 1,189 | | | | 1,760 | | | | 10,116 | |
| | | | | | |
Queensland Fire and Emergency Services | | | 257 | | | | 242 | | | | 402 | | | | 208 | | | | 307 | | | | 1,416 | |
| | | | | | |
Queensland Health | | | 18,189 | | | | 46,167 | | | | 71,075 | | | | 13,524 | | | | 42,132 | | | | 191,087 | |
| | | | | | |
Queensland Police Service | | | 1,170 | | | | 1,094 | | | | 1,819 | | | | 939 | | | | 1,390 | | | | 6,412 | |
| | | | | | |
Queensland Treasury | | | — | | | | — | | | | — | | | | — | | | | 1,480,268 | | | | 1,480,268 | |
| | | | | | |
State Development, Manufacturing, Infrastructure and Planning | | | 9 | | | | 33,507 | | | | 2,471 | | | | 9 | | | | 29,806 | | | | 65,802 | |
| | | | | | |
Transport and Main Roads | | | 49,293 | | | | 77,006 | | | | 98,704 | | | | 55,571 | | | | 193,558 | | | | 474,132 | |
| | | | | | |
Youth Justice | | | 108 | | | | 104 | | | | 172 | | | | 90 | | | | 131 | | | | 605 | |
| | | | | | |
Other agencies4 | | | 135 | | | | 126 | | | | 210 | | | | 108 | | | | 160 | | | | 739 | |
| | | | | | |
Anticipated contingency reserve and other adjustments5 | | | — | | | | — | | | | — | | | | — | | | | — | | | | — | |
| | | | | | |
Funds allocated | | | 200,832 | | | | 341,685 | | | | 464,135 | | | | 240,068 | | | | 2,346,269 | | | | 3,592,990 | |
Notes
| 1. | Numbers may not add due to rounding and allocations of adjustments. |
| 2. | Includes all associated statutory bodies. |
| 3. | The Public Safety Business Agency is a capital purchaser for Queensland Fire and Emergency Services, Queensland Police Service and the Office of the Inspector-General Emergency Management. |
| 4. | Includes other Government entities with non-material capital programs. |
| 5. | The anticipated contingency reserve and other adjustments have been spread across statistical areas proportionate to capital spends. |
136
Capital Statement 2019-20
| | | | | | | | | | | | | | | | | | | | | | | | |
| | | Ipswich | | | Wide Bay | | | Darling Downs | | | Gold Coast | |
| | | | | | | | | DD Maranoa | | | Toowoomba | | | Sub total | | | | |
Entity2 | | $‘000 | | | $‘000 | | | $‘000 | | | $‘000 | | | $‘000 | | | $‘000 | |
| | | | | | |
Aboriginal and Torres Strait Islander Partnerships | | | — | | | | — | | | | — | | | | — | | | | — | | | | — | |
| | | | | | |
Agriculture and Fisheries | | | 700 | | | | 290 | | | | 1,735 | | | | 2,865 | | | | 4,600 | | | | 60 | |
| | | | | | |
Child Safety, Youth and Women | | | 1,594 | | | | 1,594 | | | | 584 | | | | 710 | | | | 1,294 | | | | 3,169 | |
| | | | | | |
Communities, Disability Services and Seniors | | | 1,012 | | | | 347 | | | | 152 | | | | 555 | | | | 707 | | | | 728 | |
| | | | | | |
Education | | | 109,196 | | | | 44,064 | | | | 12,369 | | | | 20,408 | | | | 32,777 | | | | 131,775 | |
| | | | | | |
Electoral Commission of Queensland | | | — | | | | — | | | | — | | | | — | | | | — | | | | — | |
| | | | | | |
Employment, Small Business and Training | | | 4,855 | | | | 4,094 | | | | 1,798 | | | | 7,193 | | | | 8,991 | | | | 24,332 | |
| | | | | | |
Environment and Science | | | 3,858 | | | | 10,770 | | | | 1,429 | | | | 1,720 | | | | 3,149 | | | | 6,819 | |
| | | | | | |
Housing and Public Works | | | 42,133 | | | | 14,281 | | | | 3,968 | | | | 13,016 | | | | 16,984 | | | | 60,696 | |
| | | | | | |
Justice and Attorney-General | | | 1,642 | | | | 1,485 | | | | 608 | | | | 782 | | | | 1,390 | | | | 4,423 | |
| | | | | | |
Legislative Assembly of Queensland | | | — | | | | — | | | | — | | | | — | | | | — | | | | — | |
| | | | | | |
Local Government, Racing and Multicultural Affairs | | | 80 | | | | 67 | | | | 29 | | | | 35 | | | | 64 | | | | 141 | |
| | | | | | |
Natural Resources, Mines and Energy | | | 185,531 | | | | 206,270 | | | | 145,648 | | | | 77,668 | | | | 223,316 | | | | 122,479 | |
| | | | | | |
Public Safety Business Agency3 | | | 46,010 | | | | 10,671 | | | | 5,246 | | | | 18,517 | | | | 23,763 | | | | 31,361 | |
| | | | | | |
Queensland Corrective Services | | | 2,691 | | | | 1,848 | | | | 811 | | | | 977 | | | | 1,788 | | | | 3,873 | |
| | | | | | |
Queensland Fire and Emergency Services | | | 383 | | | | 323 | | | | 142 | | | | 171 | | | | 313 | | | | 676 | |
| | | | | | |
Queensland Health | | | 39,824 | | | | 52,844 | | | | 65,677 | | | | 34,924 | | | | 100,601 | | | | 59,226 | |
| | | | | | |
Queensland Police Service | | | 1,730 | | | | 1,459 | | | | 641 | | | | 771 | | | | 1,412 | | | | 3,059 | |
| | | | | | |
Queensland Treasury | | | — | | | | — | | | | — | | | | — | | | | — | | | | — | |
| | | | | | |
State Development, Manufacturing, Infrastructure and Planning | | | 16,349 | | | | 14 | | | | 1,506 | | | | 7 | | | | 1,513 | | | | 2,400 | |
| | | | | | |
Transport and Main Roads | | | 350,156 | | | | 176,065 | | | | 220,711 | | | | 33,436 | | | | 254,147 | | | | 274,061 | |
| | | | | | |
Youth Justice | | | 45,132 | | | | 1,227 | | | | 60 | | | | 73 | | | | 133 | | | | 290 | |
| | | | | | |
Other agencies4 | | | 199 | | | | 168 | | | | 74 | | | | 89 | | | | 163 | | | | 353 | |
| | | | | | |
Anticipated contingency reserve and other adjustments5 | | | — | | | | — | | | | — | | | | — | | | | — | | | | — | |
| | | | | | |
Funds allocated | | | 832,826 | | | | 515,351 | | | | 452,193 | | | | 208,839 | | | | 661,032 | | | | 712,595 | |
Notes
| 1. | Numbers may not add due to rounding and allocations of adjustments. |
| 2. | Includes all associated statutory bodies. |
| 3. | The Public Safety Business Agency is a capital purchaser for Queensland Fire and Emergency Services, Queensland Police Service and the Office of the Inspector-General Emergency Management. |
| 4. | Includes other Government entities with non-material capital programs. |
| 5. | The anticipated contingency reserve and other adjustments have been spread across statistical areas proportionate to capital spends. |
137
Capital Statement 2019-20
| | | | | | | | | | | | | | | | | | | | | | | | |
| | | Logan –
Beaudesert | | | Mackay -
Whitsunday | | | Outback and Far North Queensland | | | Central | |
| | | | | | | | | Outback | | | Cairns | | | Sub total | | | Queensland | |
Entity2 | | $‘000 | | | $‘000 | | | $‘000 | | | $‘000 | | | $‘000 | | | $‘000 | |
| | | | | | |
Aboriginal and Torres Strait Islander Partnerships | | | — | | | | — | | | | 20 | | | | 10 | | | | 30 | | | | — | |
| | | | | | |
Agriculture and Fisheries | | | — | | | | 110 | | | | 852 | | | | 1,575 | | | | 2,427 | | | | 465 | |
| | | | | | |
Child Safety, Youth and Women | | | 1,626 | | | | 781 | | | | 753 | | | | 1,341 | | | | 2,094 | | | | 1,022 | |
| | | | | | |
Communities, Disability Services and Seniors | | | 399 | | | | 1,094 | | | | 2,596 | | | | 294 | | | | 2,890 | | | | 264 | |
| | | | | | |
Education | | | 88,384 | | | | 29,302 | | | | 5,930 | | | | 54,544 | | | | 60,474 | | | | 43,197 | |
| | | | | | |
Electoral Commission of Queensland | | | — | | | | — | | | | — | | | | — | | | | — | | | | — | |
| | | | | | |
Employment, Small Business and Training | | | 4,709 | | | | 2,379 | | | | 1,134 | | | | 3,472 | | | | 4,606 | | | | 3,112 | |
| | | | | | |
Environment and Science | | | 3,742 | | | | 8,581 | | | | 2,787 | | | | 3,399 | | | | 6,186 | | | | 2,472 | |
| | | | | | |
Housing and Public Works | | | 37,597 | | | | 8,112 | | | | 44,386 | | | | 64,592 | | | | 108,978 | | | | 17,252 | |
| | | | | | |
Justice and Attorney-General | | | 8,593 | | | | 885 | | | | 980 | | | | 1,174 | | | | 2,154 | | | | 5,753 | |
| | | | | | |
Legislative Assembly of Queensland | | | — | | | | — | | | | — | | | | — | | | | — | | | | 200 | |
| | | | | | |
Local Government, Racing and Multicultural Affairs | | | 77 | | | | 39 | | | | 1,719 | | | | 57 | | | | 1,776 | | | | 51 | |
| | | | | | |
Natural Resources, Mines and Energy | | | 36,240 | | | | 159,833 | | | | 138,889 | | | | 140,653 | | | | 279,542 | | | | 340,846 | |
| | | | | | |
Public Safety Business Agency3 | | | 13,992 | | | | 5,155 | | | | 23,445 | | | | 10,273 | | | | 33,718 | | | | 7,143 | |
| | | | | | |
Queensland Corrective Services | | | 2,125 | | | | 1,074 | | | | 512 | | | | 1,567 | | | | 2,079 | | | | 89,404 | |
| | | | | | |
Queensland Fire and Emergency Services | | | 371 | | | | 187 | | | | 89 | | | | 274 | | | | 363 | | | | 245 | |
| | | | | | |
Queensland Health | | | 43,546 | | | | 17,573 | | | | 20,571 | | | | 37,800 | | | | 58,371 | | | | 44,316 | |
| | | | | | |
Queensland Police Service | | | 1,678 | | | | 848 | | | | 404 | | | | 1,237 | | | | 1,641 | | | | 1,109 | |
| | | | | | |
Queensland Treasury | | | — | | | | — | | | | — | | | | — | | | | — | | | | — | |
| | | | | | |
State Development, Manufacturing, Infrastructure and Planning | | | 16 | | | | 258 | | | | 4 | | | | 5,012 | | | | 5,016 | | | | 4,604 | |
| | | | | | |
Transport and Main Roads | | | 189,164 | | | | 237,045 | | | | 170,120 | | | | 320,858 | | | | 490,978 | | | | 437,472 | |
| | | | | | |
Youth Justice | | | 159 | | | | 80 | | | | 39 | | | | 117 | | | | 156 | | | | 105 | |
| | | | | | |
Other agencies4 | | | 193 | | | | 98 | | | | 47 | | | | 143 | | | | 190 | | | | 128 | |
| | | | | | |
Anticipated contingency reserve and other adjustments5 | | | — | | | | — | | | | — | | | | — | | | | — | | | | — | |
| | | | | | |
Funds allocated | | | 422,342 | | | | 462,196 | | | | 405,420 | | | | 633,001 | | | | 1,038,421 | | | | 975,443 | |
Notes
| 1. | Numbers may not add due to rounding and allocations of adjustments. |
| 2. | Includes all associated statutory bodies. |
| 3. | The Public Safety Business Agency is a capital purchaser for Queensland Fire and Emergency Services, Queensland Police Service and the Office of the Inspector-General Emergency Management. |
| 4. | Includes other Government entities with non-material capital programs. |
| 5. | The anticipated contingency reserve and other adjustments have been spread across statistical areas proportionate to capital spends. |
138
Capital Statement 2019-20
| | | | | | | | | | | | | | | | | | | | | | | | |
| | | Sunshine Coast and Moreton Bay | | | Townsville | | | Totals1 | |
| | | Sunshine | | | Moreton | | | Moreton | | | | | | | | | | |
| | | Coast | | | Bay North | | | Bay South | | | Sub total | | | | | | | |
Entity2 | | $‘000 | | | $‘000 | | | $‘000 | | | $‘000 | | | $‘000 | | | $‘000 | |
| | | | | | |
Aboriginal and Torres Strait Islander Partnerships | | | — | | | | — | | | | — | | | | — | | | | 10 | | | | 100 | |
| | | | | | |
Agriculture and Fisheries | | | 1,627 | | | | — | | | | — | | | | 1,627 | | | | 1,370 | | | | 22,020 | |
| | | | | | |
Child Safety, Youth and Women | | | 1,700 | | | | 1,733 | | | | 968 | | | | 4,401 | | | | 1,271 | | | | 24,758 | |
| | | | | | |
Communities, Disability Services and Seniors | | | 440 | | | | 294 | | | | 1,520 | | | | 2,254 | | | | 7,246 | | | | 20,010 | |
| | | | | | |
Education | | | 112,182 | | | | 47,425 | | | | 77,968 | | | | 237,575 | | | | 39,511 | | | | 1,227,336 | |
| | | | | | |
Electoral Commission of Queensland | | | — | | | | — | | | | — | | | | — | | | | — | | | | 1,925 | |
| | | | | | |
Employment, Small Business and Training | | | 5,187 | | | | 3,472 | | | | 2,953 | | | | 11,612 | | | | 17,177 | | | | 128,950 | |
| | | | | | |
Environment and Science | | | 5,750 | | | | 2,759 | | | | 4,514 | | | | 13,023 | | | | 4,938 | | | | 114,031 | |
| | | | | | |
Housing and Public Works | | | 39,836 | | | | 17,866 | | | | 11,468 | | | | 69,170 | | | | 129,373 | | | | 665,468 | |
| | | | | | |
Justice and Attorney-General | | | 1,754 | | | | 1,174 | | | | 999 | | | | 3,927 | | | | 4,572 | | | | 77,531 | |
| | | | | | |
Legislative Assembly of Queensland | | | — | | | | — | | | | — | | | | — | | | | — | | | | 6,832 | |
| | | | | | |
Local Government, Racing and Multicultural Affairs | | | 85 | | | | 57 | | | | 48 | | | | 190 | | | | 53 | | | | 2,834 | |
| | | | | | |
Natural Resources, Mines and Energy | | | 176,104 | | | | 39,429 | | | | 27,281 | | | | 242,814 | | | | 149,913 | | | | 2,604,994 | |
| | | | | | |
Public Safety Business Agency3 | | | 13,450 | | | | 8,959 | | | | 6,399 | | | | 28,808 | | | | 7,958 | | | | 263,621 | |
| | | | | | |
Queensland Corrective Services | | | 2,341 | | | | 6,567 | | | | 1,333 | | | | 10,241 | | | | 1,470 | | | | 126,709 | |
| | | | | | |
Queensland Fire and Emergency Services | | | 409 | | | | 274 | | | | 233 | | | | 916 | | | | 257 | | | | 5,450 | |
| | | | | | |
Queensland Health | | | 42,667 | | | | 76,277 | | | | 15,155 | | | | 134,099 | | | | 36,259 | | | | 777,746 | |
| | | | | | |
Queensland Police Service | | | 1,848 | | | | 1,237 | | | | 1,052 | | | | 4,137 | | | | 1,161 | | | | 24,646 | |
| | | | | | |
Queensland Treasury | | | — | | | | — | | | | — | | | | — | | | | — | | | | 1,480,268 | |
| | | | | | |
State Development, Manufacturing, Infrastructure and Planning | | | 517 | | | | 12 | | | | 10 | | | | 539 | | | | 12,540 | | | | 109,051 | |
| | | | | | |
Transport and Main Roads | | | 432,029 | | | | 113,452 | | | | 85,756 | | | | 631,237 | | | | 364,337 | | | | 3,878,794 | |
| | | | | | |
Youth Justice | | | 174 | | | | 117 | | | | 100 | | | | 391 | | | | 3,636 | | | | 51,914 | |
| | | | | | |
Other agencies4 | | | 213 | | | | 143 | | | | 121 | | | | 477 | | | | 134 | | | | 2,841 | |
| | | | | | |
Anticipated contingency reserve and other adjustments5 | | | — | | | | — | | | | — | | | | — | | | | — | | | | (275,770 | ) |
| | | | | | |
Funds allocated | | | 818,414 | | | | 313,622 | | | | 232,232 | | | | 1,364,268 | | | | 764,596 | | | | 11,342,059 | |
Notes
| 1. | Numbers may not add due to rounding and allocations of adjustments. |
| 2. | Includes all associated statutory bodies. |
| 3. | The Public Safety Business Agency is a capital purchaser for Queensland Fire and Emergency Services, Queensland Police Service and the Office of the Inspector-General Emergency Management. |
| 4. | Includes other Government entities with non-material capital programs. |
| 5. | The anticipated contingency reserve and other adjustments have been spread across statistical areas proportionate to capital spends. |
139
Queensland Budget 2019-20 Capital Statement Budget Paper No. 3
Queensland Budget 2019–20
Capital Statement Budget Paper No.3
budget.qld.gov.au
QUEENSLAND BUDGET 2019–20
Budget Measures
Budget Paper No.4
budget.qld.gov.au
2019–20 Queensland Budget Papers
1. Budget Speech
2. Budget Strategy and Outlook
3. Capital Statement
4. Budget Measures
5. Service Delivery Statements
Appropriation Bills
Budget Highlights
The Budget Papers are available online at budget.qld.gov.au
© The State of Queensland (Queensland Treasury) 2019
Copyright
This publication is protected by the Copyright Act 1968
Licence
This document is licensed by the State of Queensland (Queensland Treasury) under a Creative Commons Attribution (CC BY 4.0) International licence.
In essence, you are free to copy, communicate and adapt this publication, as long as you attribute the work to the State of Queensland (Queensland Treasury). To view a copy of this licence, visit http://creativecommons.org/licenses/by/4.0/
Attribution
Content from this publication should be attributed to:
© The State of Queensland (Queensland Treasury) - 2019–20 Queensland Budget
| | |
| | Translating and interpreting assistance |
The Queensland Government is committed to providing accessible services to Queenslanders from all cultural and linguistic backgrounds. If you have difficulty in understanding this publication, you can contact us on telephone (07) 3035 3503 and we will arrange an interpreter to effectively communicate the report to you.
Budget Measures
Budget Paper No.4
ISSN 1445-4890 (Print)
ISSN 1445-4904 (Online)
2019-20 Budget Measures

State Budget
2019-20
Budget Measures
Budget Paper No. 4
2019-20 Budget Measures
Contents
| | | | | | |
| Key Features | | | 1 | |
| | |
| 1 | | Introduction | | | 2 | |
| 1.1 | | Explanation of Scope and Terms | | | 2 | |
| 1.2 | | Overview | | | 3 | |
| 1.3 | | Government Indexation Policy | | | 7 | |
| | |
| 2 | | Expense Measures | | | 24 | |
| | |
| | Introduction | | | 24 | |
| | Department of Aboriginal and Torres Strait Islander Partnerships | | | 25 | |
| | Department of Agriculture and Fisheries | | | 29 | |
| | Department of Child Safety, Youth and Women | | | 32 | |
| | Department of Communities, Disability Services and Seniors | | | 38 | |
| | Department of Education | | | 42 | |
| | Department of Employment, Small Business and Training | | | 48 | |
| | Department of Environment and Science | | | 51 | |
| | Department of Housing and Public Works | | | 58 | |
| | Department of Innovation, Tourism Industry Development and the Commonwealth Games | | | 62 | |
| | Department of Justice and Attorney-General | | | 65 | |
| | Department of Local Government, Racing and Multicultural Affairs | | | 75 | |
| | Department of Natural Resources, Mines and Energy | | | 77 | |
| | Department of State Development, Manufacturing, Infrastructure and Planning | | | 80 | |
| | Department of the Premier and Cabinet | | | 84 | |
| | Department of Transport and Main Roads | | | 87 | |
| | Department of Youth Justice | | | 90 | |
| | Electoral Commission of Queensland | | | 98 | |
| | Legislative Assembly of Queensland | | | 99 | |
| | Public Safety Business Agency | | | 100 | |
2019-20 Budget Measures
| | | | | | |
| | Queensland Corrective Services | | | 101 | |
| | Queensland Fire and Emergency Services | | | 104 | |
| | Queensland Health | | | 105 | |
| | Queensland Police Service | | | 113 | |
| | Queensland Treasury | | | 118 | |
| | |
| 3 | | Capital Measures | | | 120 | |
| | |
| | Introduction | | | 120 | |
| | Department of Agriculture and Fisheries | | | 121 | |
| | Department of Child Safety, Youth and Women | | | 122 | |
| | Department of Education | | | 123 | |
| | Department of Environment and Science | | | 125 | |
| | Department of Housing and Public Works | | | 129 | |
| | Department of Innovation, Tourism Industry Development and the Commonwealth Games | | | 131 | |
| | Department of Justice and Attorney-General | | | 132 | |
| | Department of Natural Resources, Mines and Energy | | | 133 | |
| | Department of Transport and Main Roads | | | 134 | |
| | Department of Youth Justice | | | 137 | |
| | Legislative Assembly of Queensland | | | 139 | |
| | Public Safety Business Agency | | | 140 | |
| | Queensland Corrective Services | | | 141 | |
| | Queensland Health | | | 142 | |
| | Queensland Police Service | | | 145 | |
| | Queensland Treasury | | | 146 | |
2019-20 Budget Measures
| | | | | | |
| 4 | | Revenue Measures | | | 147 | |
| | |
| | Introduction | | | 147 | |
| | Department of Education | | | 148 | |
| | Department of Environment and Science | | | 149 | |
| | Department of Natural Resources, Mines and Energy | | | 150 | |
| | Department of Transport and Main Roads | | | 151 | |
| | Electoral Commission of Queensland | | | 152 | |
| | Queensland Treasury | | | 153 | |
2019-20 Budget Measures
Key Features
This Budget Paper presents a consolidation of expense, capital and revenue measures reflecting decisions since the 2018-19 Budget. The 2019-20 Budget measures will support improved education outcomes by Queensland students, build world class education infrastructure, increase capacity in the health system to meet demand, attract investment to Queensland and create jobs to support our regions and keep communities safe.
| • | | The Government is providing increased funding of approximately $1.1 billion over the forward estimates (approximately $1.4 billion over calendar years 2019 to 2023) to improve educational outcomes for students as part of a five-year school funding agreement reached with the Australian Government. |
| • | | The Government is providing increased funding of $493.8 million over five years ($532.6 million over seven years) to deliver world class learning environments for students by building new schools, bringing total investment in the Building Future Schools Fund to $1.3 billion. |
| • | | The Government is providing increased funding of $251.3 million over three years for the provision of additional facilities at existing state schools experiencing enrolment growth. |
| • | | The Government is providing an additional investment of $847.9 million over five years to address demand pressures and develop and implement targeted reforms across the justice system. |
| • | | The Government is providing increased funding of $1.6 billion over four years to support frontline staff, improve health services and meet the ongoing growth in demand for health and ambulance services. |
| • | | The Government is providing increased funding of around $400 million over four years to invest in health infrastructure and capital works. |
| • | | The Government is providing increased funding of $45 million to continue the Advance Queensland Industry Attraction Fund. |
| • | | The Government is providing increased funding of up to $14 million over two years to meet continued demand for the Back to Work program in south-east Queensland in areas facing significant labour market challenges. |
| • | | The Government is providing increased funding of $35.7 million over three years for the Production Attraction Strategy to attract film productions to Queensland. |
| • | | The Government is providing additional funding of $517.5 million ($401.6 million new funding and $115.9 million funded internally) over four years to continue Queensland’s family support and child protection reforms. |
| • | | As part of its ongoing support for the North West Minerals Province, the Government is providing an additional $30 million over two years to contribute to the construction and operation of loading facilities at the Port of Townsville |
| • | | The Government is also providing an additional $20 million per annum to subsidise below rail user access charges on Queensland Rail’s Mount Isa Line. |
| • | | The Government is providing additional funding of $30 million over three years for the Resources Community Infrastructure Fund to invest in improving critical social and economic infrastructure across Queensland’s resource communities. |
1
2019-20 Budget Measures
This document provides a consolidated view of policy decisions with budgetary impacts made by the Government since the 2018-19 Budget.
This document complements other Budget Papers, in particular Budget Paper No. 2 Budget Strategy and Outlook, Budget Paper No. 3 Capital Statement and the Service Delivery Statements.
This Budget Paper includes only new policy decisions and does not detail the full amount of additional funding being provided to agencies to deliver services and infrastructure. Other adjustments, including those that are parameter based and where the funding formula remains unchanged, are similarly excluded.
The total funding impact of new measures is summarised in Tables 1.2 to 1.4 at the conclusion of this chapter.
For details on the total funding available to agencies, refer to agencies’ Service Delivery Statements.
| 1.1 | Explanation of Scope and Terms |
This document includes measures with the following features:
| • | | Sector: Only Queensland General Government sector agencies are included. Measures involving government-owned corporations or other Public Non-financial Corporations Sector agencies are within scope only if the measures are being funded directly by the General Government Sector or if there is a flow through effect (for example, Community Service Obligations). |
| • | | Timeframe: Measures based on decisions made by the Government since the 2018-19 Budget. |
| • | | Type: Measures with budgetary impacts, in particular: |
(i) expense and capital measures with service delivery, capital enhancement, grant or subsidy impacts on the community; and
(ii) revenue measures involving a significant change in revenue policy, including changes in the tax rate.
| • | | Materiality: Minor measures or measures with non-significant community impact are not included in this document. |
| • | | Initiatives of a technical nature or non-policy based adjustments, such as parameter based funding adjustments, are not included if the formula to calculate these adjustments has not changed, as they do not reflect changes in Government policy. Similarly, policy matters not yet finalised by Government are not included. The main focus is on measures reflecting policy decisions that impact directly on the community through service delivery or other means. |
2
2019-20 Budget Measures
Tables in this document are presented on a net funding basis.
| • | | Net funding refers to the impact that the funding of the measure has on appropriations from the Consolidated Fund or centrally held funds to the relevant General Government agency. The tables do not include funding directed to the measure from existing agency resources or other sources. |
| • | | Amounts refer to additional funding being provided to agencies for a particular program or project, as a result of decisions by Government since the 2018-19 Budget. The amount provided for a measure may differ from other Budget papers, such as Budget Paper No. 3 Capital Statement, that may refer to total funding. |
| • | | Where a measure involves material expenditure or revenue collections by more than one department, the measure is reported under each department involved. The addition of each individual department’s portion of a particular measure may not equate to the reported total whole-of-government figure due to the omission of some departments’ portions that did not meet Budget Paper 4’s materiality threshold (i.e. over $250,000). |
| • | | Amounts included in the tables relating to revenue measures represent the impact of the measure on Government revenue (with a positive amount representing additional revenue). |
Tables 1.2 to 1.4 identify expense, capital and revenue measures separately, categorised as follows:
| • | | up to and including 2018-19 Mid-Year Fiscal and Economic Review (MYFER); and |
| • | | since the 2018-19 MYFER. |
The following section presents selected measures relating to decisions taken since the 2018-19 Budget.
| 1.2.1 | Investing in Education |
The Government is providing increased funding of approximately $1.1 billion over the forward estimates (approximately $1.4 billion over calendar years 2019 to 2023) for Queensland state schools, as part of the five-year school funding agreement reached with the Australian Government. This funding will support improved educational outcomes in Queensland state schools and support the implementation of the National School Reform Agreement.
Other key measures in the 2019-20 Budget for education include:
| • | | increased funding of $493.8 million over five years to deliver world class learning environments for students, including the second stage of new schools opening in 2020, a further four new schools to open in 2021 and land acquisitions. Total funding for this initiative is $532.6 million over seven years (to 2024-25), bringing total investment in the Building Future Schools Fund to $1.3 billion |
| • | | increased funding of $251.3 million over three years for the provision of additional facilities at existing state schools experiencing enrolment growth |
| • | | increased funding of $167.6 million over three years from 2020-21 and $56.6 million per annum ongoing to support new senior assessment and tertiary entrance arrangements |
3
2019-20 Budget Measures
| • | | increased funding of $30.4 million over two years to support the continued provision of universal access to kindergarten for children in the year before school. |
| 1.2.2 | Improving Health Care |
The Government is providing increased funding of $1.6 billion over four years to support frontline staff, improve health services and meet the ongoing growth in demand for health and ambulance services. The Government is providing increased funding of around $400 million over four years to invest in health infrastructure and capital works to sustain and enhance business and service level continuity.
Measures in the 2019-20 Budget that will deliver improved health care for the community include:
| • | | increased funding of $1.1 billion over four years to support the ongoing growth in demand for health services |
| • | | increased funding of $77.4 million in 2020-21 to extend the Specialist Outpatient Long Wait Strategy, to ensure patients continue to have timely access to specialist outpatient appointments |
| • | | increased funding of $30.7 million over two years and $15.5 million per annum ongoing to continue employing an additional 100 midwives, to support maternity services across Queensland |
| • | | increased funding of $116.8 million over two years and $59.3 million per annum ongoing to provide ongoing support for the Nurse Navigators program |
| • | | increased funding is provided to secure the expansions of the Caboolture and Logan Hospitals. |
| 1.2.3 | Delivering Jobs and a Strong Economy |
To continue to strengthen the Queensland economy and deliver more jobs, this budget will provide:
| • | | increased funding of $45 million to the Advance Queensland Industry Attraction Fund, bringing the total funding to $150 million |
| • | | a commitment of $60 million to support the delivery of The Southport Spit master plan to enhance the public realm of The Spit, improve connections to the surrounding marine environment and generate opportunities for job creation through tourism, entertainment and recreation. The master plan secures the future of 138 hectares of green space, unlocks the potential for 1,800 new jobs, provides for more than 800 new short-term accommodation rooms, enhanced tourism and recreation opportunities, and creates vibrant community spaces |
| • | | increased funding of $6 million over two years for the Made in Queensland grants program. This brings the total funding to $46 million over five years from 2017-18 to support the manufacturing sector to become more internationally competitive, increase productivity and adopt new processes and technologies |
| • | | increased funding of $25 million for the Jobs and Regional Growth Fund to assist businesses and projects that will generate economic development and employment opportunities in regional Queensland. This increase brings the total funding to $175 million. |
4
2019-20 Budget Measures
| • | | increased funding of up to $14 million over two years to meet continued demand for the Back to Work program in areas of south-east Queensland with significant labour market challenges, with applications open until 30 June 2020 |
| • | | increased funding of $4 million in 2019-20 for additional grant funding under the Advancing Small Business Queensland Strategy 2016-2020, to continue making Queensland the place for small business to start, grow and employ. This brings the total funding for this program to $26.2 million over four years from 2016-17 |
| • | | increased funding of $35.7 million over three years from 2018-19 for the Production Attraction Strategy to grow a pipeline of large-scale film and high-end television productions in Queensland |
| • | | additional funding of $19 million over four years to establish an agenda for renewable hydrogen industry attraction and to drive job creation, regional growth and increased innovation and development. |
The Government is also supporting the further development of the tourism industry to grow the economy and deliver jobs, especially in regional Queensland. This budget will provide:
| • | | additional funding of $33.7 million over four years toward the development of the Wangetti Trail as a high quality ecotourism experience for Far North Queensland, in addition to $7.7 million to be funded internally by the department and from revenue |
| • | | additional funding of $13.9 million over two years to progress market approaches for the Cairns and Gold Coast Global Tourism Hub procurement processes for the contract management of the Queen’s Wharf Brisbane Integrated Resort Development and construction of the Thorsborne, Cooloola and Whitsunday Ecotourism Trails |
| • | | additional funding of funding of $2 million over two years to introduce a new grant fund to support the development of new Indigenous tourism products and experiences, with a focus on ecotourism; and $1.5 million over two years to support targeted initiatives to develop Indigenous tourism in Queensland and to establish an Indigenous Tourism Development Service for Indigenous tourism businesses, to guide prospective businesses toward the most appropriate services and support for their business needs |
| • | | increased funding of $1 million in 2018-19 as part of a $2.5 million media campaign, funded in partnership with the local tourism industry, to position the Gold Coast as a must-visit for families from the key visitor markets of Sydney, Melbourne and Brisbane. |
| 1.2.4 | Building Our Regions |
The Government is providing increased funding of $70 million over four years for Round 5 of Building our Regions to deliver critical infrastructure for regional Queensland. Total funding for Building our Regions now totals $515 million. Building our Regions supports critical infrastructure projects in regional areas that meet specific community needs, with a focus on delivering enduring economic outcomes and job creation.
| 1.2.5 | Investment in the Justice System |
The Government is committed to keeping communities safe and the 2019-20 Budget provides an additional $847.9 million investment over five years to address demand pressures and develop and implement targeted reforms across the justice system.
5
2019-20 Budget Measures
Measures in the 2019-20 Budget in the justice system include:
| • | | increased funding of $57.7 million over four years and $14.7 million per annum ongoing to respond to increased demand in Queensland Courts |
| • | | increased funding of $42.8 million over four years and $12.1 million per annum ongoing to respond to increased workloads within the Office of the Director of Public Prosecutions |
| • | | additional funding of $143 million over four years and $43.7 million per annum ongoing to commission and operate the expanded Capricornia Correctional Centre |
| • | | additional funding of $111.4 million over five years and $29.6 million per annum ongoing for the operations of Arthur Gorrie and Southern Queensland Correctional Centres. |
The Government is also providing additional funding of around $620 million, held centrally, towards an expansion of the Southern Queensland Correctional Precinct. The expansion will deliver a correctional facility with a focus on health and rehabilitation, which will reduce reoffending, and ease overcrowding across the correctional services system.
| 1.2.6 | Youth Justice Reforms |
The Government is making a significant investment in Youth Justice to support the Palaszczuk Government’s Youth Justice Strategy. Government is providing increased funding of $154.5 million operating and $178 million capital (including $140 million held centrally against estimated project costs) over five years. This funding will support a suite of initiatives aimed at preventing offending and reoffending, and keeping young people out of courts and custody, supported by the development of appropriate infrastructure facilities, including;
| • | | increased funding of $28.7 million over four years to expand on the successful Transition to Success program and support young people to reconnect with education, training and employment, and build life skills |
| • | | increased funding of $18.5 million over four years for the continuation and expansion of the Townsville Community Youth Response and to address recommendations in the Townsville’s Voice: Local Solutions to Address Youth Crime report |
| • | | additional funding of $10 million over two years to commence early works on a new 32 bed youth detention centre on land adjacent to the Brisbane Youth Detention Centre at Wacol |
| • | | additional funding of $27 million capital and $18.3 million operating funding to construct and operate an additional 16 beds within the Brisbane Youth Detention Centre located at Wacol, along with upgrades to facilities and additional amenities including educational classrooms, kitchen and laundry facilities. |
The Queensland Government is supporting drought affected communities through the continuation of the Drought Assistance Package as well as implementing Queensland drought reform, with a provision of up to $74.6 million over four years. This includes:
| • | | $50 million for the Drought Relief Assistance Scheme |
| • | | $15 million for the Drought Relief from Electricity Charges Scheme |
| • | | $5.2 million for Community Drought Support |
| • | | $4.2 million for Land Rent Rebates and Water Licence Waivers |
| • | | $200,000 for fodder management. |
6
2019-20 Budget Measures
| 1.3 | Government Indexation Policy |
To relieve cost of living pressures, from 2019-20 the Queensland Government has moved to a rate of escalation of fees and charges that is based on forecasts of CPI. This replaces the previous Government’s policy of an indexation rate of 3.5% per annum introduced in 2012-13. In 2019-20, fees and charges will increase by 2.25%, consistent with the CPI projection for 2019-20 at MYFER. From 2020-21 onwards, CPI is projected to increase by 2.5% per annum, consistent with the mid-point of the Reserve Bank of Australia’s target band. This measure results in a reduction in revenue of approximately $30 million in 2019-20 and $60 million in 2020-21. This change means fees and charges subject to the Government indexation policy, including motor vehicle registration fees and transport and traffic fees, will only rise at the rate of expected inflation.
7
2019-20 Budget Measures
| Table 1.2: | Expense measures since the 2018-19 Budget |
| | | | | | | | | | | | | | | | | | | | |
| | | 2018-19 | | | 2019-20 | | | 2020-21 | | | 2021-22 | | | 2022-23 | |
Expense measures up to and including MYFER | | $‘000 | | | $‘000 | | | $‘000 | | | $‘000 | | | $‘000 | |
| | | | | |
Department of Agriculture and Fisheries | | | | | | | | | | | | | | | | | | | | |
Panama Disease Tropical Race 4 Program | | | — | | | | — | | | | — | | | | — | | | | — | |
Queensland Agricultural Training Colleges | | | — | | | | — | | | | — | | | | — | | | | — | |
| | | | | | | | | | | | | | | | | | | | |
Portfolio Total | | | — | | | | — | | | | — | | | | — | | | | — | |
| | | | | | | | | | | | | | | | | | | | |
| | | | | |
Department of Child Safety, Youth and Women | | | | | | | | | | | | | | | | | | | | |
Family Support and Child Protection Reforms1 | | | — | | | | 127,514 | | | | 120,628 | | | | 120,663 | | | | — | |
Family Support and Child Protection Reforms - Extension of Foster Carer Allowance | | | — | | | | — | | | | 2,398 | | | | 2,398 | | | | 2,398 | |
Supporting Children and Young People with Complex and Challenging Behaviours | | | — | | | | 20,000 | | | | — | | | | — | | | | — | |
Staged Replacement of Integrated Client Management System1 | | | — | | | | — | | | | — | | | | — | | | | — | |
Women in Custody | | | 2,365 | | | | 2,975 | | | | 2,525 | | | | — | | | | — | |
National Redress Scheme | | | 3,411 | | | | 5,901 | | | | 6,250 | | | | 6,440 | | | | — | |
Truth, Healing and Reconciliation Taskforce | | | 431 | | | | 432 | | | | 438 | | | | 445 | | | | 454 | |
Anti-Cyberbullying Initiatives | | | 1,250 | | | | 1,250 | | | | — | | | | — | | | | — | |
Fighting Youth Sexual Violence | | | 1,450 | | | | 3,442 | | | | 3,515 | | | | 3,508 | | | | — | |
Women with disability and their children | | | — | | | | 755 | | | | 755 | | | | — | | | | — | |
| | | | | | | | | | | | | | | | | | | | |
Portfolio Total | | | 8,907 | | | | 162,269 | | | | 136,509 | | | | 133,454 | | | | 2,852 | |
| | | | | | | | | | | | | | | | | | | | |
| | | | | |
Department of Communities, Disability Services and Seniors | | | | | | | | | | | | | | | | | | | | |
National Redress Scheme | | | — | | | | 145 | | | | 148 | | | | 152 | | | | — | |
| | | | | | | | | | | | | | | | | | | | |
Portfolio Total | | | — | | | | 145 | | | | 148 | | | | 152 | | | | — | |
| | | | | | | | | | | | | | | | | | | | |
| | | | | |
Department of Education | | | | | | | | | | | | | | | | | | | | |
Remuneration and Certification of Highly Accomplished and Lead Teachers | | | 3,624 | | | | 8,246 | | | | 12,110 | | | | 14,290 | | | | 14,290 | |
Family Support and Child Protection Reforms - Student Protection Principal Advisors | | | — | | | | 593 | | | | 608 | | | | 623 | | | | — | |
Anti-Cyberbullying Initiatives | | | — | | | | — | | | | — | | | | — | | | | — | |
| | | | | | | | | | | | | | | | | | | | |
Portfolio Total | | | 3,624 | | | | 8,839 | | | | 12,718 | | | | 14,913 | | | | 14,290 | |
| | | | | | | | | | | | | | | | | | | | |
| | | | | |
Department of Environment and Science | | | | | | | | | | | | | | | | | | | | |
Queensland Government Research Infrastructure Co-Investment Fund | | | — | | | | 5,000 | | | | 7,500 | | | | 7,500 | | | | 5,000 | |
World Science Festival 2019 to 2021 | | | 3,000 | | | | 3,000 | | | | 3,000 | | | | — | | | | — | |
National Parks Harsh Environment Fire Vehicles | | | — | | | | 805 | | | | — | | | | — | | | | — | |
Quandamooka World Heritage Nomination | | | 273 | | | | 308 | | | | 362 | | | | 307 | | | | — | |
Accelerating Science Delivery Innovation - Tranche 2 | | | — | | | | — | | | | — | | | | — | | | | — | |
| | | | | | | | | | | | | | | | | | | | |
Portfolio Total | | | 3,273 | | | | 9,113 | | | | 10,862 | | | | 7,807 | | | | 5,000 | |
| | | | | | | | | | | | | | | | | | | | |
| | | | | |
Department of Housing and Public Works | | | | | | | | | | | | | | | | | | | | |
Cyber Security - Securing trust in a Responsive Government | | | — | | | | 4,278 | | | | 4,757 | | | | 5,269 | | | | 6,038 | |
Stadiums Queensland Capital Grant Increase | | | — | | | | 250 | | | | 506 | | | | 769 | | | | 1,038 | |
8
2019-20 Budget Measures
| | | | | | | | | | | | | | | | | | | | |
| | �� | 2018-19 | | | 2019-20 | | | 2020-21 | | | 2021-22 | | | 2022-23 | |
Expense measures up to and including MYFER | | $‘000 | | | $‘000 | | | $‘000 | | | $‘000 | | | $‘000 | |
| | | | | |
National Redress Scheme | | | 105 | | | | 132 | | | | 135 | | | | 138 | | | | — | |
Queensland Building and Construction Commission Financial Sustainability Review1 | | | 5,260 | | | | — | | | | — | | | | — | | | | — | |
| | | | | | | | | | | | | | | | | | | | |
Portfolio Total | | | 5,365 | | | | 4,660 | | | | 5,398 | | | | 6,176 | | | | 7,076 | |
| | | | | | | | | | | | | | | | | | | | |
| | | | | |
Department of Innovation, Tourism Industry Development and the Commonwealth Games | | | | | | | | | | | | | | | | | | | | |
FibreCo Qld | | | 4,730 | | | | 3,870 | | | | — | | | | — | | | | — | |
Gold Coast Family Campaign | | | 1,000 | | | | — | | | | — | | | | — | | | | — | |
| | | | | | | | | | | | | | | | | | | | |
Portfolio Total | | | 5,730 | | | | 3,870 | | | | — | | | | — | | | | — | |
| | | | | | | | | | | | | | | | | | | | |
| | | | | |
Department of Justice and Attorney-General | | | | | | | | | | | | | | | | | | | | |
Family Support and Child Protection Reforms - Director of Child Protection Litigation | | | — | | | | 13,524 | | | | — | | | | — | | | | — | |
Office of the Director of Public Prosecutions1 | | | — | | | | 4,796 | | | | 8,715 | | | | 8,940 | | | | 9,172 | |
Office of the Public Guardian | | | 734 | | | | 4,478 | | | | 5,809 | | | | 7,000 | | | | 9,000 | |
Family Support and Child Protection Reforms - Queensland Family and Child Commission | | | — | | | | 3,070 | | | | 3,147 | | | | 3,482 | | | | — | |
Supreme and District Court | | | 1,821 | | | | 2,447 | | | | 2,484 | | | | 2,521 | | | | 2,521 | |
Information, Communication and Technology Strategy | | | 4,158 | | | | 2,321 | | | | — | | | | 1,770 | | | | 1,623 | |
Recording and Transcription Services | | | — | | | | 1,748 | | | | 1,998 | | | | — | | | | — | |
Queensland Civil and Administrative Tribunal1 | | | 340 | | | | 680 | | | | 680 | | | | 680 | | | | 680 | |
Murri Court Expansion | | | 201 | | | | 569 | | | | 578 | | | | 589 | | | | 599 | |
Alleviating pressures in the youth detention system | | | 386 | | | | — | | | | — | | | | — | | | | — | |
| | | | | | | | | | | | | | | | | | | | |
Portfolio Total | | | 7,640 | | | | 33,633 | | | | 23,411 | | | | 24,982 | | | | 23,595 | |
| | | | | | | | | | | | | | | | | | | | |
| | | | | |
Department of Local Government, Racing and Multicultural Affairs | | | | | | | | | | | | | | | | | | | | |
Queensland Racing Industry | | | 17,630 | | | | 30,370 | | | | 30,370 | | | | 26,370 | | | | 26,370 | |
Torres Strait Island Seawalls and Coastal Inundation Mitigation Upgrades | | | 5,000 | | | | 15,000 | | | | — | | | | — | | | | — | |
Paroo Shire Council Upgrade to Critical Sewerage Infrastructure | | | 9,100 | | | | — | | | | — | | | | — | | | | — | |
Queensland Racing Industry Infrastructure | | | 8,000 | | | | — | | | | — | | | | — | | | | — | |
| | | | | | | | | | | | | | | | | | | | |
Portfolio Total | | | 39,730 | | | | 45,370 | | | | 30,370 | | | | 26,370 | | | | 26,370 | |
| | | | | | | | | | | | | | | | | | | | |
| | | | | |
Department of Natural Resources, Mines and Energy | | | | | | | | | | | | | | | | | | | | |
Interim Great Artesian Basin Infrastructure Investment Program | | | 2,526 | | | | — | | | | — | | | | — | | | | — | |
| | | | | | | | | | | | | | | | | | | | |
Portfolio Total | | | 2,526 | | | | — | | | | — | | | | — | | | | — | |
| | | | | | | | | | | | | | | | | | | | |
| | | | | |
Department of State Development, Manufacturing, Infrastructure and Planning | | | | | | | | | | | | | | | | | | | | |
Queensland Reconstruction Authority Proserpine Entertainment Centre | | | 1,568 | | | | 3,657 | | | | — | | | | — | | | | — | |
Queensland Reconstruction Authority Disaster Recovery | | | 1,433 | | | | 3,342 | | | | — | | | | — | | | | — | |
Resource Recovery Industries Roadmap | | | 300 | | | | 700 | | | | — | | | | — | | | | — | |
Queensland Reconstruction Authority SES Operations Centre | | | 500 | | | | 500 | | | | — | | | | — | | | | — | |
| | | | | | | | | | | | | | | | | | | | |
Portfolio Total | | | 3,801 | | | | 8,199 | | | | — | | | | — | | | | — | |
| | | | | | | | | | | | | | | | | | | | |
9
2019-20 Budget Measures
| | | | | | | | | | | | | | | | | | | | |
| | | 2018-19 | | | 2019-20 | | | 2020-21 | | | 2021-22 | | | 2022-23 | |
Expense measures up to and including MYFER | | $‘000 | | | $‘000 | | | $‘000 | | | $‘000 | | | $‘000 | |
| | | | | |
Department of the Premier and Cabinet | | | | | | | | | | | | | | | | | | | | |
Safer Communities Grants Program | | | 2,000 | | | | 2,000 | | | | 1,000 | | | | — | | | | — | |
| | | | | | | | | | | | | | | | | | | | |
Portfolio Total | | | 2,000 | | | | 2,000 | | | | 1,000 | | | | — | | | | — | |
| | | | | | | | | | | | | | | | | | | | |
| | | | | |
Department of Transport and Main Roads | | | | | | | | | | | | | | | | | | | | |
Cost Recovery for Drink Driving Reforms | | | — | | | | 2,020 | | | | 2,111 | | | | 2,212 | | | | 2,316 | |
Continuation of the Citytrain Response Unit | | | 698 | | | | 705 | | | | — | | | | — | | | | — | |
| | | | | | | | | | | | | | | | | | | | |
Portfolio Total | | | 698 | | | | 2,725 | | | | 2,111 | | | | 2,212 | | | | 2,316 | |
| | | | | | | | | | | | | | | | | | | | |
| | | | | |
Department of Youth Justice | | | | | | | | | | | | | | | | | | | | |
Alleviating pressures in the youth detention system | | | 2,206 | | | | 4,441 | | | | — | | | | — | | | | — | |
| | | | | | | | | | | | | | | | | | | | |
Portfolio Total | | | 2,206 | | | | 4,441 | | | | — | | | | — | | | | — | |
| | | | | | | | | | | | | | | | | | | | |
| | | | | |
Legislative Assembly of Queensland | | | | | | | | | | | | | | | | | | | | |
Electorate Office Technology Improvements | | | 1,459 | | | | 1,162 | | | | 1,041 | | | | 521 | | | | — | |
| | | | | | | | | | | | | | | | | | | | |
Portfolio Total | | | 1,459 | | | | 1,162 | | | | 1,041 | | | | 521 | | | | — | |
| | | | | | | | | | | | | | | | | | | | |
| | | | | |
Public Safety Business Agency | | | | | | | | | | | | | | | | | | | | |
Public Safety Regional Radio Communications | | | 7,007 | | | | 19,893 | | | | — | | | | — | | | | — | |
Queensland Government Air - Aircraft Maintenance and Compliance1 | | | 1,165 | | | | — | | | | — | | | | — | | | | — | |
| | | | | | | | | | | | | | | | | | | | |
Portfolio Total | | | 8,172 | | | | 19,893 | | | | — | | | | — | | | | — | |
| | | | | | | | | | | | | | | | | | | | |
| | | | | |
Queensland Health | | | | | | | | | | | | | | | | | | | | |
Correctional Centre Health Services1 | | | 6,550 | | | | — | | | | — | | | | — | | | | — | |
| | | | | | | | | | | | | | | | | | | | |
Portfolio Total | | | 6,550 | | | | — | | | | — | | | | — | | | | — | |
| | | | | | | | | | | | | | | | | | | | |
| | | | | |
Queensland Police Service | | | | | | | | | | | | | | | | | | | | |
Monitoring Reportable Offenders | | | 4,884 | | | | 5,351 | | | | 5,476 | | | | 5,592 | | | | 5,724 | |
Body Worn Cameras for Police | | | — | | | | 2,100 | | | | 2,100 | | | | 2,100 | | | | — | |
Civilian Prosecutors | | | — | | | | 1,858 | | | | 1,908 | | | | 1,960 | | | | 2,014 | |
Youth Justice Investment - Project Booyah - Framing the Future1 | | | 367 | | | | 982 | | | | — | | | | — | | | | — | |
Murri Court Expansion | | | — | | | | — | | | | — | | | | — | | | | — | |
| | | | | | | | | | | | | | | | | | | | |
Portfolio Total | | | 5,251 | | | | 10,291 | | | | 9,484 | | | | 9,652 | | | | 7,738 | |
| | | | | | | | | | | | | | | | | | | | |
| | | | | |
Queensland Treasury | | | | | | | | | | | | | | | | | | | | |
Native Title Compensation Project Management Office | | | 872 | | | | 1,560 | | | | — | | | | — | | | | — | |
| | | | | | | | | | | | | | | | | | | | |
Portfolio Total | | | 872 | | | | 1,560 | | | | — | | | | — | | | | — | |
| | | | | | | | | | | | | | | | | | | | |
| | | | | |
Total impact on Expense up to and including MYFER | | | 107,804 | | | | 318,170 | | | | 233,052 | | | | 226,239 | | | | 89,237 | |
10
2019-20 Budget Measures
| | | | | | | | | | | | | | | | | | | | |
Expense measures since 2018-19 MYFER | | 2018-19
$‘000 | | | 2019-20
$‘000 | | | 2020-21
$‘000 | | | 2021-22
$‘000 | | | 2022-23
$‘000 | |
| | | | | |
Department of Aboriginal and Torres Strait Islander Partnerships | | | | | | | | | | | | | | | | | | | | |
Infrastructure for remote Aboriginal and Torres Strait Islander Communities | | | — | | | | 5,200 | | | | 1,700 | | | | 700 | | | | 700 | |
Reframing the relationship | | | — | | | | 3,962 | | | | 3,475 | | | | 1,699 | | | | — | |
Aboriginal and Torres Strait Islander Youth Mental Health and Wellbeing | | | — | | | | 750 | | | | 1,500 | | | | 2,050 | | | | 2,600 | |
Developing an Aboriginal and Torres Strait Islander Languages Policy | | | — | | | | 674 | | | | — | | | | — | | | | — | |
Work history research and legal services | | | — | | | | 520 | | | | — | | | | — | | | | — | |
Closing the Gap monitoring - essential data services | | | — | | | | 477 | | | | 491 | | | | 505 | | | | 519 | |
Addressing domestic and family violence impacting Aboriginal and Torres Strait Islander people | | | — | | | | 456 | | | | 464 | | | | 471 | | | | 480 | |
Alcohol Management Plans | | | — | | | | 400 | | | | 500 | | | | 750 | | | | 750 | |
Kupai Omasker | | | — | | | | 368 | | | | — | | | | — | | | | — | |
Former Origin Greats Achieving Results Through Indigenous Education Program | | | — | | | | — | | | | — | | | | — | | | | — | |
Legislative Reform | | | — | | | | — | | | | — | | | | — | | | | — | |
| | | | | | | | | | | | | | | | | | | | |
Portfolio Total | | | — | | | | 12,807 | | | | 8,130 | | | | 6,175 | | | | 5,049 | |
| | | | | | | | | | | | | | | | | | | | |
| | | | | |
Department of Agriculture and Fisheries | | | | | | | | | | | | | | | | | | | | |
Improving Swimmer Safety including the Shark Control Program | | | — | | | | 4,219 | | | | 4,259 | | | | 4,207 | | | | 4,398 | |
Continuation of Fisheries Reform | | | — | | | | 2,100 | | | | 8,506 | | | | — | | | | — | |
Queensland’s Obligations within the National Biosecurity System | | | 1,411 | | | | 1,370 | | | | 790 | | | | — | | | | — | |
Small Business Regulatory Reform | | | 2,395 | | | | 1,273 | | | | 150 | | | | 7 | | | | — | |
Supporting Delivery of the Queensland Greyhound Racing Industry Commission of Inquiry (MacSporran Report) Recommendations | | | — | | | | 848 | | | | 843 | | | | 955 | | | | 1,091 | |
Drought Assistance Package and Queensland Drought Reform | | | — | | | | — | | | | — | | | | — | | | | — | |
| | | | | | | | | | | | | | | | | | | | |
Portfolio Total | | | 3,806 | | | | 9,810 | | | | 14,548 | | | | 5,169 | | | | 5,489 | |
| | | | | | | | | | | | | | | | | | | | |
| | | | | |
Department of Child Safety, Youth and Women | | | | | | | | | | | | | | | | | | | | |
Family Support and Child Protection Reforms2 | | | — | | | | 150 | | | | 150 | | | | 150 | | | | 150 | |
Staged Replacement of Integrated Client Management System2 | | | — | | | | 10,286 | | | | 9,443 | | | | 4,710 | | | | 4,795 | |
Youth Justice Investment - Family and Wellbeing Service | | | — | | | | 2,260 | | | | 4,120 | | | | — | | | | — | |
Perpetrator Intervention Initiatives | | | — | | | | 410 | | | | 810 | | | | — | | | | — | |
National Disability Insurance Scheme Transition Support: Children with Disability in the Child Protection System | | | — | | | | 9,636 | | | | — | | | | — | | | | — | |
Youth Justice Investment - Navigate Your Health | | | — | | | | — | | | | — | | | | — | | | | — | |
| | | | | | | | | | | | | | | | | | | | |
Portfolio Total | | | — | | | | 22,742 | | | | 14,523 | | | | 4,860 | | | | 4,945 | |
| | | | | | | | | | | | | | | | | | | | |
| | | | | |
Department of Communities, Disability Services and Seniors | | | | | | | | | | | | | | | | | | | | |
Support for people with disability | | | — | | | | 24,797 | | | | 4,243 | | | | 2,593 | | | | 2,661 | |
National Disability Insurance Scheme Transition Support: Queensland Community Support Scheme - Transport Supports | | | — | | | | 7,000 | | | | — | | | | — | | | | — | |
Tackling Alcohol Fuelled Violence Program | | | — | | | | 3,316 | | | | — | | | | — | | | | — | |
National Disability Insurance Scheme Transition Support: Queensland Community Support Scheme in remote and discrete Aboriginal and Torres Strait Islander communities | | | — | | | | 2,000 | | | | 2,000 | | | | — | | | | — | |
Thriving Communities, Advancing Queensland: Continuation of Community Connect workers | | | — | | | | 1,500 | | | | 1,500 | | | | 1,500 | | | | 1,500 | |
Place-based approaches | | | — | | | | 750 | | | | 750 | | | | 750 | | | | 750 | |
School Breakfast Program | | | — | | | | 348 | | | | 267 | | | | 273 | | | | 280 | |
11
2019-20 Budget Measures
| | | | | | | | | | | | | | | | | | | | |
| | | 2018-19 | | | 2019-20 | | | 2020-21 | | | 2021-22 | | | 2022-23 | |
Expense measures since 2018-19 MYFER | | $‘000 | | | $‘000 | | | $‘000 | | | $‘000 | | | $‘000 | |
| | | | | |
Drought Assistance Package and Queensland Drought Reform | | | — | | | | — | | | | — | | | | — | | | | — | |
Townsville Women’s Centre premises | | | — | | | | — | | | | — | | | | — | | | | — | |
| | | | | | | | | | | | | | | | | | | | |
Portfolio Total | | | — | | | | 39,711 | | | | 8,760 | | | | 5,116 | | | | 5,191 | |
| | | | | | | | | | | | | | | | | | | | |
| | | | | |
Department of Education | | | | | | | | | | | | | | | | | | | | |
State schools - increased funding | | | 3,080 | | | | 194,900 | | | | 247,270 | | | | 263,120 | | | | 425,870 | |
Early childhood education and care - regulation | | | — | | | | 13,163 | | | | 13,368 | | | | — | | | | — | |
Early childhood education and care - universal access to kindergarten | | | — | | | | 10,801 | | | | 19,576 | | | | — | | | | — | |
Office of Industrial Relations ICT Investment | | | — | | | | 1,000 | | | | 1,000 | | | | 1,000 | | | | 1,000 | |
Youth Justice Investment - Additional 16 beds at Brisbane Youth Detention Centre | | | — | | | | 125 | | | | 587 | | | | 601 | | | | 617 | |
Additional Support for Students with a Disability | | | — | | | | — | | | | — | | | | — | | | | — | |
Daniel Morcombe Foundation | | | — | | | | — | | | | — | | | | — | | | | — | |
Digital Engagement Strategy | | | — | | | | — | | | | — | | | | — | | | | — | |
Early Childhood Development Programs | | | — | | | | — | | | | — | | | | — | | | | — | |
Link & Launch Program | | | — | | | | — | | | | — | | | | — | | | | — | |
New Senior Assessment and Tertiary Entrance Arrangements | | | — | | | | — | | | | — | | | | — | | | | — | |
Regional Youth Engagement Hubs | | | — | | | | — | | | | — | | | | — | | | | — | |
Shifting Minds Suicide Prevention Flagship | | | — | | | | — | | | | — | | | | — | | | | — | |
Youth FlexiSpaces in Schools | | | — | | | | — | | | | — | | | | — | | | | — | |
| | | | | | | | | | | | | | | | | | | | |
Portfolio Total | | | 3,080 | | | | 219,989 | | | | 281,801 | | | | 264,721 | | | | 427,487 | |
| | | | | | | | | | | | | | | | | | | | |
| | | | | |
Department of Employment, Small Business and Training | | | | | | | | | | | | | | | | | | | | |
Small Business Regulatory Reform | | | 4,773 | | | | 8,370 | | | | 6,282 | | | | 1,007 | | | | 767 | |
Advancing Small Business Queensland Strategy 2016-2020 | | | — | | | | 4,000 | | | | — | | | | — | | | | — | |
Micro-Credentialing Pilot | | | — | | | | 1,000 | | | | 3,000 | | | | 1,500 | | | | — | |
Back to Work program - South East Queensland | | | — | | | | — | | | | — | | | | — | | | | — | |
Digital Engagement Strategy | | | — | | | | — | | | | — | | | | — | | | | — | |
Higher Level Apprenticeship Pilot | | | — | | | | — | | | | — | | | | — | | | | — | |
Link & Launch Program | | | — | | | | — | | | | — | | | | — | | | | — | |
Queensland Social Enterprise Strategy | | | — | | | | — | | | | — | | | | — | | | | — | |
| | | | | | | | | | | | | | | | | | | | |
Portfolio Total | | | 4,773 | | | | 13,370 | | | | 9,282 | | | | 2,507 | | | | 767 | |
| | | | | | | | | | | | | | | | | | | | |
| | | | | |
Department of Environment and Science | | | | | | | | | | | | | | | | | | | | |
Cape York Peninsula Tenure Resolution Program and National Park Joint Management with Traditional Owners | | | — | | | | 6,985 | | | | 4,152 | | | | 2,940 | | | | 975 | |
Hopeland (Linc Energy) - Ongoing Matters | | | — | | | | 5,414 | | | | 3,479 | | | | — | | | | — | |
Yellow Crazy Ant Control | | | — | | | | 3,000 | | | | 3,000 | | | | 3,000 | | | | — | |
Wildlife Management - Crocodiles | | | — | | | | 2,952 | | | | 3,026 | | | | — | | | | — | |
Queensland Museum - Critical Maintenance and Infrastructure Works | | | — | | | | 2,875 | | | | 1,875 | | | | 875 | | | | 875 | |
Revitalising National Parks | | | — | | | | 2,500 | | | | — | | | | — | | | | — | |
Queensland Art Gallery Blockbuster Exhibition Funding | | | — | | | | 2,250 | | | | 1,750 | | | | — | | | | — | |
Queensland Parks and Wildlife Service - Enhanced Fire Management | | | — | | | | 1,800 | | | | 2,300 | | | | 2,500 | | | | 2,600 | |
Aboriginal and Torres Strait Islander Cultural Centre | | | — | | | | 1,600 | | | | 400 | | | | — | | | | — | |
12
2019-20 Budget Measures
| | | | | | | | | | | | | | | | | | | | |
| | | 2018-19 | | | 2019-20 | | | 2020-21 | | | 2021-22 | | | 2022-23 | |
Expense measures since 2018-19 MYFER | | $‘000 | | | $‘000 | | | $‘000 | | | $‘000 | | | $‘000 | |
| | | | | |
North Stradbroke Island (Minjerribah) Townships Fire Management Strategies by the Quandamooka Yoolooburrabee Aboriginal Corporation | | | — | | | | 1,387 | | | | 2,202 | | | | 3,130 | | | | 1,799 | |
Saving Queensland’s Threatened Species - Koalas | | | — | | | | 729 | | | | — | | | | — | | | | — | |
Implementing Waste Reforms for Queensland under a New Waste Management and Resource Recovery Strategy | | | — | | | | 600 | | | | 400 | | | | — | | | | — | |
Financial Assurance and Rehabilitation Complementary Reform Measures | | | — | | | | 550 | | | | 300 | | | | 150 | | | | — | |
Queensland Cultural Centre - Critical Infrastructure Asset Renewal | | | — | | | | 450 | | | | 450 | | | | — | | | | — | |
North Stradbroke Island (Minjerribah) Protected Area Estate Expansion and Construction of Ranger Base | | | — | | | | — | | | | — | | | | — | | | | — | |
Strategic Science Programs and International Partnerships | | | — | | | | — | | | | — | | | | — | | | | — | |
Wangetti Trail | | | — | | | | — | | | | — | | | | — | | | | — | |
| | | | | | | | | | | | | | | | | | | | |
Portfolio Total | | | — | | | | 33,092 | | | | 23,334 | | | | 12,595 | | | | 6,249 | |
| | | | | | | | | | | | | | | | | | | | |
| | | | | |
Department of Housing and Public Works | | | | | | | | | | | | | | | | | | | | |
Responsive Government | | | — | | | | 9,600 | | | | 7,750 | | | | 7,900 | | | | 8,050 | |
Government Employee Housing - Critical Works | | | — | | | | 7,200 | | | | — | | | | — | | | | — | |
North Queensland Stadium | | | — | | | | 3,500 | | | | 3,500 | | | | 3,500 | | | | 3,500 | |
Queensland Building and Construction Commission Financial Sustainability Review2 | | | — | | | | 2,975 | | | | — | | | | — | | | | — | |
Sport and Active Recreation Strategy 2019-2029 | | | — | | | | 2,000 | | | | 10,000 | | | | 5,000 | | | | 8,000 | |
Aboriginal and Torres Strait Islander Housing Action Plan 2019-2023 | | | — | | | | — | | | | — | | | | — | | | | — | |
Queensland Government Data Centres and Services | | | — | | | | — | | | | — | | | | — | | | | — | |
Queensland Government Office Accommodation Strategy - Regional Initiatives | | | — | | | | — | | | | — | | | | — | | | | — | |
| | | | | | | | | | | | | | | | | | | | |
Portfolio Total | | | — | | | | 25,275 | | | | 21,250 | | | | 16,400 | | | | 19,550 | |
| | | | | | | | | | | | | | | | | | | | |
| | | | | |
Department of Innovation, Tourism Industry Development and the Commonwealth Games | | | | | | | | | | | | | | | | | | | | |
Global Tourism Hubs and Ecotourism Trails | | | — | | | | 5,333 | | | | 8,570 | | | | — | | | | — | |
Creating Indigenous jobs and business growth through Indigenous tourism development in Queensland | | | — | | | | 2,000 | | | | 1,200 | | | | — | | | | — | |
Improving Swimmer Safety including the Shark Control Program | | | — | | | | 200 | | | | 200 | | | | 200 | | | | 200 | |
Wangetti Trail | | | — | | | | 200 | | | | 1,800 | | | | 1,100 | | | | 100 | |
Tourism and Events Queensland | | | — | | | | — | | | | — | | | | — | | | | 48,181 | |
| | | | | | | | | | | | | | | | | | | | |
Portfolio Total | | | — | | | | 7,733 | | | | 11,770 | | | | 1,300 | | | | 48,481 | |
| | | | | | | | | | | | | | | | | | | | |
| | | | | |
Department of Justice and Attorney-General | | | | | | | | | | | | | | | | | | | | |
Court Services Queensland | | | — | | | | 14,238 | | | | 14,296 | | | | 14,487 | | | | 14,705 | |
Crown Law Legal Expenses | | | — | | | | 4,153 | | | | 4,247 | | | | 4,368 | | | | 4,493 | |
Community Justice Groups Enhancement | | | — | | | | 2,774 | | | | 5,377 | | | | 5,577 | | | | 5,377 | |
Queensland Civil and Administrative Tribunal2 | | | — | | | | 2,572 | | | | 2,608 | | | | 2,647 | | | | 2,205 | |
Support for people with disability - Office of the Public Guardian and Queensland Civil and Administrative Tribunal | | | — | | | | 2,563 | | | | 2,627 | | | | 2,692 | | | | 2,760 | |
Office of the Director of Public Prosecutions2 | | | — | | | | 2,502 | | | | 2,855 | | | | 2,901 | | | | 2,949 | |
Victims Assist Queensland | | | — | | | | 2,300 | | | | 5,000 | | | | 4,000 | | | | 4,000 | |
Tackling Alcohol Fuelled Violence Program - Safe Night Precincts | | | — | | | | 2,093 | | | | — | | | | — | | | | — | |
Youth Justice Investment - Additional Childrens Court Matters | | | 327 | | | | 1,966 | | | | — | | | | — | | | | — | |
13
2019-20 Budget Measures
| | | | | | | | | | | | | | | | | | | | |
| | | 2018-19 | | | 2019-20 | | | 2020-21 | | | 2021-22 | | | 2022-23 | |
Expense measures since 2018-19 MYFER | | $‘000 | | | $‘000 | | | $‘000 | | | $‘000 | | | $‘000 | |
| | | | | |
Courthouse Maintenance and Upgrades | | | — | | | | 1,925 | | | | 1,925 | | | | — | | | | — | |
Court Link | | | — | | | | 1,461 | | | | 1,688 | | | | 1,668 | | | | 1,750 | |
Queensland Human Rights Commission | | | 105 | | | | 1,346 | | | | 1,404 | | | | 1,459 | | | | 1,532 | |
Strengthening Coronial Services | | | — | | | | 1,207 | | | | 830 | | | | 407 | | | | 474 | |
Aurukun Restorative Justice Program | | | — | | | | 973 | | | | 801 | | | | 821 | | | | 840 | |
National Redress Scheme | | | 555 | | | | 865 | | | | 818 | | | | 779 | | | | — | |
Youth Justice Investment - Townsville Community Youth Response | | | — | | | | 848 | | | | 797 | | | | 809 | | | | 820 | |
Crime and Corruption Commission - Combating Crime | | | — | | | | 660 | | | | 660 | | | | 660 | | | | 660 | |
Court Approaches to Remand | | | — | | | | 602 | | | | 614 | | | | 623 | | | | 634 | |
New Child Death Review Model | | | — | | | | 376 | | | | 1,211 | | | | 1,255 | | | | 1,300 | |
Legal Aid Queensland | | | — | | | | — | | | | 1,900 | | | | 3,800 | | | | 5,800 | |
Legal Assistance Services | | | — | | | | — | | | | — | | | | 1,188 | | | | 1,443 | |
| | | | | | | | | | | | | | | | | | | | |
Portfolio Total | | | 987 | | | | 45,424 | | | | 49,658 | | | | 50,141 | | | | 51,742 | |
| | | | | | | | | | | | | | | | | | | | |
| | | | | |
Department of Local Government, Racing and Multicultural Affairs | | | | | | | | | | | | | | | | | | | | |
Implementing Waste Reforms for Queensland under a New Waste Management and Resource Recovery Strategy | | | — | | | | 4,000 | | | | — | | | | — | | | | — | |
Northern Peninsula Area Water Supply System - Reservoir Repairs | | | — | | | | 2,700 | | | | — | | | | — | | | | — | |
Northern Peninsula Area Water Supply System - Financial Assistance Package | | | — | | | | — | | | | 1,333 | | | | 1,333 | | | | 1,334 | |
| | | | | | | | | | | | | | | | | | | | |
Portfolio Total | | | — | | | | 6,700 | | | | 1,333 | | | | 1,333 | | | | 1,334 | |
| | | | | | | | | | | | | | | | | | | | |
| | | | | |
Department of Natural Resources, Mines and Energy | | | | | | | | | | | | | | | | | | | | |
Hopeland (Linc Energy) Management and Remediation | | | — | | | | 8,100 | | | | 6,100 | | | | 1,600 | | | | 1,800 | |
Community Service Obligation payments for the Cloncurry Pipeline | | | — | | | | 6,043 | | | | 6,234 | | | | 6,317 | | | | — | |
Community Service Obligation payments for irrigation water supply services | | | — | | | | 3,808 | | | | — | | | | — | | | | — | |
Resources Safety and Health Queensland | | | — | | | | 3,750 | | | | 1,140 | | | | — | | | | — | |
Coal Mine Workers’ Health Scheme | | | — | | | | 2,298 | | | | 4,409 | | | | — | | | | — | |
Abandoned Mines - Care and Maintenance, Risk Mitigation, Remediation and Consultation | | | — | | | | 1,320 | | | | 340 | | | | — | | | | — | |
Local Management Arrangements | | | — | | | | 890 | | | | — | | | | — | | | | — | |
Drought Assistance Package and Queensland Drought Reform | | | — | | | | — | | | | — | | | | — | | | | — | |
| | | | | | | | | | | | | | | | | | | | |
Portfolio Total | | | — | | | | 26,209 | | | | 18,223 | | | | 7,917 | | | | 1,800 | |
| | | | | | | | | | | | | | | | | | | | |
| | | | | |
Department of State Development, Manufacturing, Infrastructure and Planning | | | | | | | | | | | | | | | | | | | | |
Building our Regions | | | — | | | | 35,000 | | | | 10,000 | | | | 15,000 | | | | 10,000 | |
Biofutures | | | — | | | | 794 | | | | 1,408 | | | | 1,798 | | | | 1,000 | |
Queensland Hydrogen Industry Strategy | | | — | | | | 500 | | | | 3,000 | | | | 5,000 | | | | 10,500 | |
Advance Queensland Industry Attraction Fund | | | — | | | | — | | | | — | | | | — | | | | — | |
Jobs and Regional Growth Fund | | | — | | | | — | | | | — | | | | — | | | | — | |
Made in Queensland | | | — | | | | — | | | | 2,000 | | | | 4,000 | | | | — | |
Southport Spit Master Plan | | | — | | | | — | | | | — | | | | — | | | | — | |
| | | | | | | | | | | | | | | | | | | | |
Portfolio Total | | | — | | | | 36,294 | | | | 16,408 | | | | 25,798 | | | | 21,500 | |
| | | | | | | | | | | | | | | | | | | | |
14
2019-20 Budget Measures
| | | | | | | | | | | | | | | | | | | | |
Expense measures since 2018-19 MYFER | | 2018-19
$‘000 | | | 2019-20
$‘000 | | | 2020-21
$‘000 | | | 2021-22
$‘000 | | | 2022-23
$‘000 | |
| | | | | |
Department of the Premier and Cabinet | | | | | | | | | | | | | | | | | | | | |
Screen Queensland | | | 5,705 | | | | 17,434 | | | | 18,041 | | | | 1,747 | | | | 2,253 | |
Criminal Justice System Reform - Program Management Office | | | — | | | | 2,458 | | | | — | | | | — | | | | — | |
Veterans-related Initiatives | | | 250 | | | | 2,219 | | | | 2,416 | | | | 2,391 | | | | 2,382 | |
Year of the Outback Tourism Events Program | | | — | | | | 1,000 | | | | 1,000 | | | | — | | | | — | |
Enhanced Throughcare Service Delivery Model | | | — | | | | 900 | | | | — | | | | — | | | | — | |
| | | | | | | | | | | | | | | | | | | | |
Portfolio Total | | | 5,955 | | | | 24,011 | | | | 21,457 | | | | 4,138 | | | | 4,635 | |
| | | | | | | | | | | | | | | | | | | | |
| | | | | |
Department of Transport and Main Roads | | | | | | | | | | | | | | | | | | | | |
Continuation of the Local Fare Scheme | | | — | | | | 6,973 | | | | 7,367 | | | | — | | | | — | |
National Disability Insurance Scheme Transition Support: Taxi Subsidies | | | — | | | | 6,000 | | | | — | | | | — | | | | — | |
Wheelchair Accessible Taxi Sustainability | | | — | | | | 4,567 | | | | 5,651 | | | | 5,254 | | | | 5,418 | |
Camera Detected Offence Program | | | — | | | | 1,498 | | | | 1,684 | | | | 1,632 | | | | 1,812 | |
Expansion of the School Crossing Supervisor Scheme | | | — | | | | 792 | | | | 1,339 | | | | 1,044 | | | | 1,067 | |
Mount Isa Line Below Rail Subsidy | | | — | | | | — | | | | — | | | | — | | | | — | |
Small Business Regulatory Reform | | | — | | | | — | | | | — | | | | — | | | | — | |
| | | | | | | | | | | | | | | | | | | | |
Portfolio Total | | | — | | | | 19,830 | | | | 16,041 | | | | 7,930 | | | | 8,297 | |
| | | | | | | | | | | | | | | | | | | | |
| | | | | |
Department of Youth Justice | | | | | | | | | | | | | | | | | | | | |
Youth Justice Investment - Youth Detention Capacity | | | — | | | | 8,086 | | | | — | | | | — | | | | — | |
Youth Justice Investment - Transition to Success | | | — | | | | 6,329 | | | | 7,332 | | | | 7,439 | | | | 7,588 | |
Youth Justice Investment - Restorative Justice | | | — | | | | 4,151 | | | | 7,591 | | | | 7,771 | | | | 7,956 | |
Youth Justice Investment - Townsville Community Youth Response | | | — | | | | 3,529 | | | | 3,557 | | | | 3,592 | | | | 3,627 | |
Youth Justice Investment - Community Youth Responses | | | — | | | | 2,191 | | | | 4,346 | | | | 4,262 | | | | 4,201 | |
Youth Justice Investment - Brisbane City Watchhouse Response Team | | | — | | | | 1,323 | | | | — | | | | — | | | | — | |
Youth Justice Investment - Additional 16 beds at Brisbane Youth Detention Centre | | | — | | | | 1,227 | | | | 4,306 | | | | 4,279 | | | | 4,355 | |
Youth Justice Investment - Program Management Office | | | — | | | | 857 | | | | 855 | | | | — | | | | — | |
Youth Justice Investment - Conditional Bail | | | — | | | | 648 | | | | 573 | | | | — | | | | — | |
Youth Justice Investment - Risk and Dynamic Assessment Register | | | — | | | | 526 | | | | 841 | | | | 519 | | | | — | |
Youth Justice Investment - Youth Detention Centres: Maintenance Program | | | — | | | | 500 | | | | — | | | | — | | | | — | |
Youth Justice Investment - Specialist Multi-Agency Response Teams | | | — | | | | 200 | | | | 200 | | | | 200 | | | | 200 | |
Youth Justice Investment - Mount Isa Transitional Hub | | | — | | | | — | | | | — | | | | — | | | | — | |
Youth Justice Investment - Queensland Youth Partnerships Initiative | | | — | | | | — | | | | — | | | | — | | | | — | |
| | | | | | | | | | | | | | | | | | | | |
Portfolio Total | | | — | | | | 29,567 | | | | 29,601 | | | | 28,062 | | | | 27,927 | |
| | | | | | | | | | | | | | | | | | | | |
| | | | | |
Electoral Commission of Queensland | | | | | | | | | | | | | | | | | | | | |
Local Government Elections and State General Election | | | — | | | | 3,713 | | | | 7,745 | | | | — | | | | — | |
| | | | | | | | | | | | | | | | | | | | |
Portfolio Total | | | — | | | | 3,713 | | | | 7,745 | | | | — | | | | — | |
| | | | | | | | | | | | | | | | | | | | |
| | | | | |
Public Safety Business Agency | | | | | | | | | | | | | | | | | | | | |
Queensland Government Air - Aircraft Maintenance and Compliance2 | | | — | | | | 1,300 | | | | — | | | | — | | | | — | |
| | | | | | | | | | | | | | | | | | | | |
Portfolio Total | | | — | | | | 1,300 | | | | — | | | | — | | | | — | |
| | | | | | | | | | | | | | | | | | | | |
15
2019-20 Budget Measures
| | | | | | | | | | | | | | | | | | | | |
Expense measures since 2018-19 MYFER | | 2018-19
$‘000 | | | 2019-20
$‘000 | | | 2020-21
$‘000 | | | 2021-22
$‘000 | | | 2022-23
$‘000 | |
| | | | | |
Queensland Corrective Services | | | | | | | | | | | | | | | | | | | | |
Arthur Gorrie and Southern Queensland Correctional Centres | | | 751 | | | | 15,920 | | | | 36,328 | | | | 28,856 | | | | 29,575 | |
Capricornia Correction Centre Expansion | | | — | | | | 14,672 | | | | 41,677 | | | | 42,887 | | | | 43,718 | |
Correctional Centre Prisoner Growth | | | — | | | | 14,480 | | | | — | | | | — | | | | — | |
Taskforce Flaxton | | | — | | | | 5,764 | | | | 6,491 | | | | 5,315 | | | | 5,444 | |
Minor Capital Works and Maintenance | | | — | | | | 3,600 | | | | 3,600 | | | | 3,600 | | | | 3,600 | |
Correctional Centre Disability Support Services | | | — | | | | 2,862 | | | | — | | | | — | | | | — | |
Parole Board Queensland | | | — | | | | 1,681 | | | | 1,628 | | | | 1,570 | | | | 1,610 | |
Tackling Alcohol Fuelled Violence Program | | | — | | | | 1,183 | | | | — | | | | — | | | | — | |
Aurukun Prisoner Reintegration Program | | | — | | | | 650 | | | | 615 | | | | 630 | | | | 646 | |
Enhanced Throughcare Service Delivery Model | | | — | | | | — | | | | — | | | | — | | | | — | |
Southern Queensland Correctional Precinct - Stage 2 | | | — | | | | — | | | | — | | | | — | | | | — | |
| | | | | | | | | | | | | | | | | | | | |
Portfolio Total | | | 751 | | | | 60,812 | | | | 90,339 | | | | 82,858 | | | | 84,593 | |
| | | | | | | | | | | | | | | | | | | | |
| | | | | |
Queensland Fire and Emergency Services | | | | | | | | | | | | | | | | | | | | |
Improving Swimmer Safety including the Shark Control Program | | | — | | | | 200 | | | | 200 | | | | 200 | | | | 200 | |
| | | | | | | | | | | | | | | | | | | | |
Portfolio Total | | | — | | | | 200 | | | | 200 | | | | 200 | | | | 200 | |
| | | | | | | | | | | | | | | | | | | | |
| | | | | |
Queensland Health | | | | | | | | | | | | | | | | | | | | |
Specialist Outpatient Long Wait Strategy | | | — | | | | — | | | | 77,400 | | | | — | | | | — | |
Nurse Navigators | | | — | | | | — | | | | — | | | | 57,467 | | | | 59,315 | |
Midwives | | | — | | | | — | | | | — | | | | 15,170 | | | | 15,549 | |
National Disability Insurance Scheme Transition Support: Community health support programs | | | — | | | | 35,220 | | | | — | | | | — | | | | — | |
Support for people with disability | | | — | | | | 4,430 | | | | 4,430 | | | | 4,430 | | | | 4,430 | |
Health and Wellbeing Queensland | | | — | | | | — | | | | — | | | | — | | | | — | |
Deadly Choices Healthy Lifestyle Program | | | — | | | | — | | | | 8,200 | | | | 8,405 | | | | 8,615 | |
Safe and Healthy Drinking Water in Indigenous Local Government Areas | | | — | | | | — | | | | — | | | | — | | | | — | |
Operational Growth Funding | | | — | | | | 163,250 | | | | 128,172 | | | | 199,871 | | | | 594,345 | |
Initiatives to improve patient flow and reduce unnecessary hospital activity | | | — | | | | — | | | | — | | | | — | | | | — | |
Shifting Minds Suicide Prevention Flagship | | | — | | | | 7,470 | | | | 13,705 | | | | 20,397 | | | | 20,355 | |
Aeromedical Services Funding | | | — | | | | 13,976 | | | | 14,400 | | | | 14,840 | | | | 15,272 | |
Strengthening Coronial Services | | | — | | | | 534 | | | | 274 | | | | — | | | | — | |
Correctional Centre Health Services2 | | | — | | | | 9,255 | | | | 23,612 | | | | 29,789 | | | | 31,387 | |
Youth Justice Investment - Additional 16 beds at Brisbane Youth Detention Centre | | | — | | | | 120 | | | | 668 | | | | 680 | | | | 696 | |
Youth Justice Investment - Navigate Your Health | | | — | | | | — | | | | — | | | | — | | | | — | |
Court Link | | | — | | | | 586 | | | | 763 | | | | 763 | | | | 763 | |
Right@Home | | | — | | | | 1,289 | | | | 1,588 | | | | 1,588 | | | | 758 | |
Birthing in our Community Hub Expansion | | | — | | | | — | | | | — | | | | — | | | | — | |
Enhanced Throughcare Service Delivery Model | | | — | | | | — | | | | — | | | | — | | | | — | |
Small Business Regulatory Reform | | | 400 | | | | 350 | | | | — | | | | — | | | | — | |
| | | | | | | | | | | | | | | | | | | | |
Portfolio Total | | | 400 | | | | 236,480 | | | | 273,212 | | | | 353,400 | | | | 751,485 | |
| | | | | | | | | | | | | | | | | | | | |
16
2019-20 Budget Measures
| | | | | | | | | | | | | | | | | | | | |
| | | 2018-19 | | | 2019-20 | | | 2020-21 | | | 2021-22 | | | 2022-23 | |
Expense measures since 2018-19 MYFER | | $‘000 | | | $‘000 | | | $‘000 | | | $‘000 | | | $‘000 | |
| | | | | |
Queensland Police Service | | | | | | | | | | | | | | | | | | | | |
Youth Justice Investment - Community-Based Intensive Supervision | | | — | | | | 9,410 | | | | — | | | | — | | | | — | |
Tackling Organised Crime | | | — | | | | 5,000 | | | | — | | | | — | | | | — | |
Taskforce Orion | | | — | | | | 339 | | | | 653 | | | | 669 | | | | 685 | |
Youth Justice Investment - Additional Childrens Court Matters | | | 38 | | | | 225 | | | | — | | | | — | | | | — | |
Youth Justice Investment - Townsville Community Youth Response | | | — | | | | 209 | | | | 215 | | | | 221 | | | | 226 | |
Counter-Terrorism Capability and Capacity | | | — | | | | — | | | | 774 | | | | — | | | | — | |
Targeting Serious and Organised Crime | | | — | | | | — | | | | 4,967 | | | | — | | | | — | |
Youth Justice Investment - Police Overtime for Supervision of Young People in Watchhouses | | | 938 | | | | — | | | | — | | | | — | | | | — | |
Youth Justice Investment - Project Booyah - Framing the Future2 | | | — | | | | — | | | | 410 | | | | — | | | | — | |
| | | | | | | | | | | | | | | | | | | | |
Portfolio Total | | | 976 | | | | 15,183 | | | | 7,019 | | | | 890 | | | | 911 | |
| | | | | | | | | | | | | | | | | | | | |
| | | | | |
Queensland Treasury | | | | | | | | | | | | | | | | | | | | |
Camera Detection Offence Program | | | — | | | | 745 | | | | 2,030 | | | | 2,081 | | | | 2,360 | |
Government Investment in Renewable Energy - CleanCo Queensland Limited Establishment | | | 10,000 | | | | — | | | | — | | | | — | | | | — | |
Jobs and Regional Growth Fund | | | — | | | | — | | | | — | | | | — | | | | — | |
Resources Community Infrastructure Fund | | | — | | | | — | | | | — | | | | — | | | | — | |
| | | | | | | | | | | | | | | | | | | | |
Portfolio Total | | | 10,000 | | | | 745 | | | | 2,030 | | | | 2,081 | | | | 2,360 | |
| | | | | | | | | | | | | | | | | | | | |
| | | | | |
Total impact on Expense since 2018-19 MYFER | | | 30,728 | | | | 890,997 | | | | 926,664 | | | | 883,591 | | | | 1,479,992 | |
| | | | | |
Total impact on Expense since the 2018-19 Budget | | | 138,532 | | | | 1,209,167 | | | | 1,159,716 | | | | 1,109,830 | | | | 1,569,229 | |
| | | | | |
Less Australian Government funding | | | 1,263 | | | | — | | | | — | | | | — | | | | — | |
| | | | | |
Net of Measures funded by Australian Government | | | 137,269 | | | | 1,209,167 | | | | 1,159,716 | | | | 1,109,830 | | | | 1,569,229 | |
| 1. | Further funding for this measure can be found in the Post Mid-Year Fiscal and Economic Review section of this table. |
| 2. | Further funding for this measure can be found in the up to and including Mid-Year Fiscal and Economic Review section of this table. |
17
2019-20 Budget Measures
| Table 1.3: | Capital measures since the 2018-19 Budget |
| | | | | | | | | | | | | | | | | | | | |
| | | 2018-19 | | | 2019-20 | | | 2020-21 | | | 2021-22 | | | 2022-23 | |
Capital measures up to and including MYFER | | $‘000 | | | $‘000 | | | $‘000 | | | $‘000 | | | $‘000 | |
| | | | | |
Department of Child Safety, Youth and Women | | | | | | | | | | | | | | | | | | | | |
Staged Replacement of Integrated Client Management System1 | | | — | | | | — | | | | — | | | | — | | | | — | |
| | | | | | | | | | | | | | | | | | | | |
Portfolio Total | | | — | | | | — | | | | — | | | | — | | | | — | |
| | | | | | | | | | | | | | | | | | | | |
| | | | | |
Department of Environment and Science | | | | | | | | | | | | | | | | | | | | |
Accelerating Science Delivery Innovation Tranche 2 | | | 365 | | | | 3,024 | | | | 84 | | | | (961 | ) | | | (961 | ) |
National Parks Harsh Environment Fire Vehicles | | | — | | | | 560 | | | | — | | | | — | | | | — | |
| | | | | | | | | | | | | | | | | | | | |
Portfolio Total | | | 365 | | | | 3,584 | | | | 84 | | | | (961 | ) | | | (961 | ) |
| | | | | | | | | | | | | | | | | | | | |
| | | | | |
Department of Housing and Public Works | | | | | | | | | | | | | | | | | | | | |
North Queensland Stadium | | | 43,500 | | | | — | | | | — | | | | — | | | | — | |
| | | | | | | | | | | | | | | | | | | | |
Portfolio Total | | | 43,500 | | | | — | | | | — | | | | — | | | | — | |
| | | | | | | | | | | | | | | | | | | | |
| | | | | |
Department of Justice and Attorney-General | | | | | | | | | | | | | | | | | | | | |
Recording and Transcription Services | | | — | | | | 801 | | | | 1,898 | | | | — | | | | — | |
Office of the Public Guardian | | | 175 | | | | 500 | | | | 400 | | | | 125 | | | | — | |
| | | | | | | | | | | | | | | | | | | | |
Portfolio Total | | | 175 | | | | 1,301 | | | | 2,298 | | | | 125 | | | | — | |
| | | | | | | | | | | | | | | | | | | | |
| | | | | |
Public Safety Business Agency | | | | | | | | | | | | | | | | | | | | |
Queensland Government Air - Aircraft Maintenance and Compliance1 | | | 220 | | | | — | | | | — | | | | — | | | | — | |
| | | | | | | | | | | | | | | | | | | | |
Portfolio Total | | | 220 | | | | — | | | | — | | | | — | | | | — | |
| | | | | | | | | | | | | | | | | | | | |
| | | | | |
Queensland Corrective Services | | | | | | | | | | | | | | | | | | | | |
Expansion of Bunk Beds | | | — | | | | — | | | | — | | | | — | | | | — | |
| | | | | | | | | | | | | | | | | | | | |
Portfolio Total | | | — | | | | — | | | | — | | | | — | | | | — | |
| | | | | | | | | | | | | | | | | | | | |
| | | | | |
Queensland Health | | | | | | | | | | | | | | | | | | | | |
Caboolture Hospital Expansion | | | — | | | | — | | | | — | | | | 70,200 | | | | 30,000 | |
| | | | | | | | | | | | | | | | | | | | |
Portfolio Total | | | — | | | | — | | | | — | | | | 70,200 | | | | 30,000 | |
| | | | | | | | | | | | | | | | | | | | |
| | | | | |
Queensland Police Service | | | | | | | | | | | | | | | | | | | | |
Monitoring Reportable Offenders | | | 640 | | | | — | | | | — | | | | — | | | | — | |
| | | | | | | | | | | | | | | | | | | | |
Portfolio Total | | | 640 | | | | — | | | | — | | | | — | | | | — | |
| | | | | | | | | | | | | | | | | | | | |
| | | | | |
Queensland Treasury | | | | | | | | | | | | | | | | | | | | |
Government Investment in Renewable Energy - CleanCo Queensland Limited Establishment | | | 20,000 | | | | — | | | | — | | | | — | | | | — | |
Government Investment in Renewable Energy - CleanCo Queensland Limited Generation | | | — | | | | — | | | | — | | | | — | | | | — | |
| | | | | | | | | | | | | | | | | | | | |
Portfolio Total | | | 20,000 | | | | — | | | | — | | | | — | | | | — | |
| | | | | | | | | | | | | | | | | | | | |
| | | | | |
Total impact on Capital up to and including MYFER | | | 64,900 | | | | 4,885 | | | | 2,382 | | | | 69,364 | | | | 29,039 | |
18
2019-20 Budget Measures
| | | | | | | | | | | | | | | | | | | | |
| | | 2018-19 | | | 2019-20 | | | 2020-21 | | | 2021-22 | | | 2022-23 | |
Capital measures since 2018-19 MYFER | | $‘000 | | | $‘000 | | | $‘000 | | | $‘000 | | | $‘000 | |
| | | | | |
Department of Agriculture and Fisheries | | | | | | | | | | | | | | | | | | | | |
Supporting Delivery of the Queensland Greyhound Racing Industry Commission of Inquiry (MacSporran Report) Recommendations | | | — | | | | 1,623 | | | | — | | | | — | | | | — | |
| | | | | | | | | | | | | | | | | | | | |
Portfolio Total | | | — | | | | 1,623 | | | | — | | | | — | | | | — | |
| | | | | | | | | | | | | | | | | | | | |
| | | | | |
Department of Child Safety, Youth and Women | | | | | | | | | | | | | | | | | | | | |
Staged Replacement of Integrated Client Management System2 | | | — | | | | 14,782 | | | | 7,119 | | | | — | | | | — | |
| | | | | | | | | | | | | | | | | | | | |
Portfolio Total | | | — | | | | 14,782 | | | | 7,119 | | | | — | | | | — | |
| | | | | | | | | | | | | | | | | | | | |
| | | | | |
Department of Education | | | | | | | | | | | | | | | | | | | | |
Building Future Schools Fund - increased funding | | | 21,700 | | | | 146,500 | | | | 172,800 | | | | 102,900 | | | | 49,900 | |
School infrastructure | | | 10,000 | | | | 101,300 | | | | 140,000 | | | | — | | | | — | |
Air-conditioning in state schools | | | — | | | | 25,000 | | | | 25,000 | | | | 25,000 | | | | 25,000 | |
Office of Industrial Relations ICT Investment | | | — | | | | 1,000 | | | | 1,000 | | | | 1,000 | | | | 1,000 | |
Youth FlexiSpaces in Schools | | | — | | | | — | | | | — | | | | — | | | | — | |
| | | | | | | | | | | | | | | | | | | | |
Portfolio Total | | | 31,700 | | | | 273,800 | | | | 338,800 | | | | 128,900 | | | | 75,900 | |
| | | | | | | | | | | | | | | | | | | | |
| | | | | |
Department of Environment and Science | | | | | | | | | | | | | | | | | | | | |
Revitalising National Parks | | | — | | | | 10,000 | | | | — | | | | — | | | | — | |
Queensland Museum - Critical Maintenance and Infrastructure Works | | | — | | | | 6,655 | | | | 2,997 | | | | — | | | | — | |
Arts Infrastructure Investment Fund | | | — | | | | 2,500 | | | | 2,500 | | | | — | | | | — | |
Queensland Parks and Wildlife Service - Enhanced Fire Management | | | — | | | | 1,700 | | | | 3,600 | | | | 1,500 | | | | — | |
Queensland Cultural Centre - Critical Infrastructure Asset Renewal | | | — | | | | 1,450 | | | | 5,470 | | | | — | | | | — | |
East Trinity Environmental Reserve - Infrastructure Program | | | — | | | | 940 | | | | 1,640 | | | | 570 | | | | — | |
Saving Queensland’s Threatened Species - Koalas | | | — | | | | 516 | | | | 300 | | | | — | | | | — | |
Cape York Peninsula Tenure Resolution Program and National Park Joint Management with Traditional Owners | | | — | | | | 500 | | | | — | | | | — | | | | — | |
North Stradbroke Island (Minjerribah) Protected Area Estate Expansion and Construction of Ranger Base | | | — | | | | — | | | | — | | | | — | | | | — | |
Protected Area Acquisitions - Noosa Koala Corridor | | | — | | | | — | | | | — | | | | — | | | | — | |
| | | | | | | | | | | | | | | | | | | | |
Portfolio Total | | | — | | | | 24,261 | | | | 16,507 | | | | 2,070 | | | | — | |
| | | | | | | | | | | | | | | | | | | | |
| | | | | |
Department of Housing and Public Works | | | | | | | | | | | | | | | | | | | | |
Gabba Refurbishment | | | — | | | | 35,000 | | | | — | | | | — | | | | — | |
Government Employee Housing - Critical Works | | | — | | | | 27,700 | | | | — | | | | — | | | | — | |
Queensland Government Data Centres and Services | | | — | | | | — | | | | — | | | | — | | | | — | |
| | | | | | | | | | | | | | | | | | | | |
Portfolio Total | | | — | | | | 62,700 | | | | — | | | | — | | | | — | |
| | | | | | | | | | | | | | | | | | | | |
| | | | | |
Department of Innovation, Tourism Industry Development and the Commonwealth Games | | | | | | | | | | | | | | | | | | | | |
Wangetti Trail | | | — | | | | — | | | | 4,520 | | | | 25,928 | | | | — | |
| | | | | | | | | | | | | | | | | | | | |
Portfolio Total | | | — | | | | — | | | | 4,520 | | | | 25,928 | | | | — | |
| | | | | | | | | | | | | | | | | | | | |
19
2019-20 Budget Measures
| | | | | | | | | | | | | | | | | | | | |
| | | 2018-19 | | | 2019-20 | | | 2020-21 | | | 2021-22 | | | 2022-23 | |
Capital measures since 2018-19 MYFER | | $‘000 | | | $‘000 | | | $‘000 | | | $‘000 | | | $‘000 | |
| | | | | |
Department of Justice and Attorney-General | | | | | | | | | | | | | | | | | | | | |
Courthouse Maintenance and Upgrades | | | — | | | | 2,375 | | | | 2,375 | | | | — | | | | — | |
Community Justice Groups - System Enhancement | | | — | | | | 62 | | | | 188 | | | | — | | | | — | |
| | | | | | | | | | | | | | | | | | | | |
Portfolio Total | | | — | | | | 2,437 | | | | 2,563 | | | | — | | | | — | |
| | | | | | | | | | | | | | | | | | | | |
| | | | | |
Department of Natural Resources, Mines and Energy | | | | | | | | | | | | | | | | | | | | |
Hopeland (Linc Energy) Management and Remediation | | | — | | | | 3,770 | | | | 290 | | | | 100 | | | | 100 | |
Abandoned Mines - Care and Maintenance, Risk Mitigation, Remediation and Consultation | | | — | | | | 2,800 | | | | 500 | | | | — | | | | — | |
| | | | | | | | | | | | | | | | | | | | |
Portfolio Total | | | — | | | | 6,570 | | | | 790 | | | | 100 | | | | 100 | |
| | | | | | | | | | | | | | | | | | | | |
| | | | | |
Department of Transport and Main Roads | | | | | | | | | | | | | | | | | | | | |
Cairns Shipping Development Project | | | 30,000 | | | | 30,000 | | | | — | | | | — | | | | — | |
Disaster Recovery Funding Arrangements | | | — | | | | 16,300 | | | | 33,700 | | | | — | | | | — | |
Townsville Channel Capacity Upgrade Project | | | 59,817 | | | | 10,000 | | | | 15,000 | | | | 15,000 | | | | 20,000 | |
Camera Detected Offence Program | | | — | | | | 2,000 | | | | 15,750 | | | | 38,750 | | | | 110,000 | |
Clapham Rail Yards land acquisition | | | — | | | | — | | | | — | | | | — | | | | — | |
Port of Townsville Common User Facility | | | — | | | | — | | | | — | | | | — | | | | — | |
Roma Street Busway Interchange | | | — | | | | — | | | | — | | | | — | | | | — | |
| | | | | | | | | | | | | | | | | | | | |
Portfolio Total | | | 89,817 | | | | 58,300 | | | | 64,450 | | | | 53,750 | | | | 130,000 | |
| | | | | | | | | | | | | | | | | | | | |
| | | | | |
Department of Youth Justice | | | | | | | | | | | | | | | | | | | | |
Youth Justice Investment - Additional 16 beds at Brisbane Youth Detention Centre | | | 150 | | | | 23,858 | | | | 3,000 | | | | — | | | | — | |
Youth Justice Investment - New Youth Detention Centre at Wacol | | | 300 | | | | 9,700 | | | | — | | | | — | | | | — | |
Youth Justice Investment - Youth Detention Centres: Upgrade Program | | | — | | | | 1,010 | | | | — | | | | — | | | | — | |
| | | | | | | | | | | | | | | | | | | | |
Portfolio Total | | | 450 | | | | 34,568 | | | | 3,000 | | | | — | | | | — | |
| | | | | | | | | | | | | | | | | | | | |
| | | | | |
Legislative Assembly of Queensland | | | | | | | | | | | | | | | | | | | | |
Critical Infrastructure and Services Upgrade Program | | | — | | | | 3,412 | | | | 6,219 | | | | 4,862 | | | | — | |
| | | | | | | | | | | | | | | | | | | | |
Portfolio Total | | | — | | | | 3,412 | | | | 6,219 | | | | 4,862 | | | | — | |
| | | | | | | | | | | | | | | | | | | | |
| | | | | |
Public Safety Business Agency | | | | | | | | | | | | | | | | | | | | |
Queensland Government Air - Aircraft Maintenance and Compliance2 | | | — | | | | 6,611 | | | | — | | | | — | | | | — | |
| | | | | | | | | | | | | | | | | | | | |
Portfolio Total | | | — | | | | 6,611 | | | | — | | | | — | | | | — | |
| | | | | | | | | | | | | | | | | | | | |
| | | | | |
Queensland Corrective Services | | | | | | | | | | | | | | | | | | | | |
Minor Capital Works and Maintenance | | | — | | | | 8,000 | | | | 8,500 | | | | 5,600 | | | | — | |
Taskforce Flaxton | | | — | | | | 2,200 | | | | — | | | | — | | | | — | |
Southern Queensland Correctional Precinct - Stage 2 | | | — | | | | — | | | | — | | | | — | | | | — | |
| | | | | | | | | | | | | | | | | | | | |
Portfolio Total | | | — | | | | 10,200 | | | | 8,500 | | | | 5,600 | | | | — | |
| | | | | | | | | | | | | | | | | | | | |
20
2019-20 Budget Measures
| | | | | | | | | | | | | | | | | | | | |
| | | 2018-19 | | | 2019-20 | | | 2020-21 | | | 2021-22 | | | 2022-23 | |
Capital measures since 2018-19 MYFER | | $‘000 | | | $‘000 | | | $‘000 | | | $‘000 | | | $‘000 | |
| | | | | |
Queensland Health | | | | | | | | | | | | | | | | | | | | |
Caboolture Hospital Carpark | | | — | | | | 1,650 | | | | 28,790 | | | | 11,740 | | | | 4,010 | |
Fraser Coast Mental Health Service | | | — | | | | — | | | | — | | | | — | | | | — | |
Infrastructure Maintenance Program | | | — | | | | — | | | | — | | | | — | | | | — | |
Logan Hospital Expansion | | | — | | | | — | | | | — | | | | 120,000 | | | | 59,671 | |
Redcliffe Hospital MRI and CT Scanner | | | — | | | | — | | | | — | | | | — | | | | — | |
| | | | | | | | | | | | | | | | | | | | |
Portfolio Total | | | — | | | | 1,650 | | | | 28,790 | | | | 131,740 | | | | 63,681 | |
| | | | | | | | | | | | | | | | | | | | |
| | | | | |
Total impact on Capital since 2018-19 MYFER | | | 121,967 | | | | 500,914 | | | | 481,258 | | | | 352,950 | | | | 269,681 | |
| | | | | |
Total impact on Capital since the 2018-19 Budget | | | 186,867 | | | | 505,799 | | | | 483,640 | | | | 422,314 | | | | 298,720 | |
| | | | | |
Less Australian Government funding | | | — | | | | 10,000 | | | | 15,000 | | | | 15,000 | | | | 20,000 | |
| | | | | |
Net of Measures funded by Australian Government | | | 186,867 | | | | 495,799 | | | | 468,640 | | | | 407,314 | | | | 278,720 | |
| 1. | Further funding for this measure can be found in the Post Mid-Year Fiscal and Economic Review section of this table. |
| 2. | Further funding for this measure can be found in the up to and including Mid-Year Fiscal and Economic Review section of this table. |
21
2019-20 Budget Measures
| Table 1.4: | Revenue measures since the 2018-19 Budget |
| | | | | | | | | | | | | | | | | | | | |
Revenue measures up to and including MYFER | | 2018-19
$‘000 | | | 2019-20
$‘000 | | | 2020-21
$‘000 | | | 2021-22
$‘000 | | | 2022-23
$‘000 | |
| | | | | |
Department of Transport and Main Roads | | | | | | | | | | | | | | | | | | | | |
Cost Recovery for Drink Driving Reforms | | | — | | | | 3,081 | | | | 3,234 | | | | 3,434 | | | | 3,642 | |
| | | | | | | | | | | | | | | | | | | | |
Portfolio Total | | | — | | | | 3,081 | | | | 3,234 | | | | 3,434 | | | | 3,642 | |
| | | | | | | | | | | | | | | | | | | | |
| | | | | |
Total impact on Revenue up to and including MYFER | | | — | | | | 3,081 | | | | 3,234 | | | | 3,434 | | | | 3,642 | |
22
2019-20 Budget Measures
| | | | | | | | | | | | | | | | | | | | |
| | | 2018-19 | | | 2019-20 | | | 2020-21 | | | 2021-22 | | | 2022-23 | |
Revenue measures since 2018-19 MYFER | | $‘000 | | | $‘000 | | | $‘000 | | | $‘000 | | | $‘000 | |
| | | | | |
Department of Education | | | | | | | | | | | | | | | | | | | | |
Amendments to the Schedule of Fees prescribed in the Education (Queensland Curriculum and Assessment Authority) Regulation 2014 | | | — | | | | 637 | | | | 539 | | | | 553 | | | | 567 | |
| | | | | | | | | | | | | | | | | | | | |
Portfolio Total | | | — | | | | 637 | | | | 539 | | | | 553 | | | | 567 | |
| | | | | | | | | | | | | | | | | | | | |
| | | | | |
Department of Environment and Science | | | | | | | | | | | | | | | | | | | | |
Wangetti Trail | | | — | | | | — | | | | — | | | | — | | | | 2,111 | |
Reduction in Regulated Fees - Pig Keeping | | | (34 | ) | | | (155 | ) | | | (159 | ) | | | (163 | ) | | | (166 | ) |
| | | | | | | | | | | | | | | | | | | | |
Portfolio Total | | | (34 | ) | | | (155 | ) | | | (159 | ) | | | (163 | ) | | | 1,945 | |
| | | | | | | | | | | | | | | | | | | | |
| | | | | |
Department of Natural Resources, Mines and Energy | | | | | | | | | | | | | | | | | | | | |
Drought Assistance Package and Queensland Drought Reform | | | — | | | | — | | | | — | | | | — | | | | — | |
| | | | | | | | | | | | | | | | | | | | |
Portfolio Total | | | — | | | | — | | | | — | | | | — | | | | — | |
| | | | | | | | | | | | | | | | | | | | |
| | | | | |
Electoral Commission of Queensland | | | | | | | | | | | | | | | | | | | | |
Local Government Elections | | | — | | | | — | | | | 3,713 | | | | — | | | | — | |
| | | | | | | | | | | | | | | | | | | | |
Portfolio Total | | | — | | | | — | | | | 3,713 | | | | — | | | | — | |
| | | | | | | | | | | | | | | | | | | | |
| | | | | |
Queensland Treasury | | | | | | | | | | | | | | | | | | | | |
Land tax - foreign surcharge | | | — | | | | 131,000 | | | | 134,000 | | | | 136,000 | | | | 139,000 | |
Royalties - Petroleum royalty rate increase | | | — | | | | 113,000 | | | | 123,000 | | | | 120,000 | | | | 120,000 | |
Land tax - Increased rate for Companies and Trusts | | | — | | | | 56,000 | | | | 58,000 | | | | 60,000 | | | | 64,000 | |
Additional Revenue Compliance Program | | | — | | | | 20,000 | | | | 40,000 | | | | 80,000 | | | | 80,000 | |
Payroll tax reform for jobs growth (net revenue impact) | | | — | | | | (45,000 | ) | | | (138,000 | ) | | | (121,000 | ) | | | (37,000 | ) |
| | | | | | | | | | | | | | | | | | | | |
Portfolio Total | | | — | | | | 275,000 | | | | 217,000 | | | | 275,000 | | | | 366,000 | |
| | | | | | | | | | | | | | | | | | | | |
| | | | | |
Total impact on Revenue since 2018-19 MYFER | | | (34 | ) | | | 275,482 | | | | 221,093 | | | | 275,390 | | | | 368,512 | |
| | | | | |
Total impact on Revenue since the 2018-19 Budget | | | (34 | ) | | | 278,563 | | | | 224,327 | | | | 278,824 | | | | 372,154 | |
23
2019-20 Budget Measures
Introduction
The following tables present the relevant portfolio expense measures relating to decisions taken since the 2018-19 Budget. This does not represent the full amount of additional funding provided to agencies since the 2018-19 Budget. For further explanation, refer to Explanation of Scope and Terms in Chapter 1.
24
2019-20 Budget Measures
Department of Aboriginal and Torres Strait Islander Partnerships
| | | | | | | | | | | | | | | | | | | | |
| | | 2018-19
$‘000 | | | 2019-20
$‘000 | | | 2020-21
$‘000 | | | 2021-22
$‘000 | | | 2022-23
$‘000 | |
Infrastructure for remote Aboriginal and Torres Strait Islander Communities | | | — | | | | 5,200 | | | | 1,700 | | | | 700 | | | | 700 | |
The Government is providing additional funding of $8.3 million over four years and $700,000 per annum ongoing for infrastructure in remote Aboriginal and Torres Strait Islander communities. This includes the construction and ongoing maintenance of new splash park facilities on Palm Island and Thursday Island.
| | | | | | | | | | | | | | | | | | | | |
| | | 2018-19
$‘000 | | | 2019-20
$‘000 | | | 2020-21
$‘000 | | | 2021-22
$‘000 | | | 2022-23
$‘000 | |
Reframing the relationship | | | — | | | | 3,962 | | | | 3,475 | | | | 1,699 | | | | — | |
The Government is providing additional funding of $9.1 million over three years to increase self-determination and economic participation, and improve life outcomes for Aboriginal and Torres Strait Islander Queenslanders through co-designed local, regional and statewide initiatives.
Funding of $22.2 million over five years is also being internally met by the department for these initiatives. The initiatives will be developed in consultation with Aboriginal and Torres Strait Islander Queenslanders, and will include reforms to service delivery in remote and discrete communities.
The 2019-20 Budget also continues the Government’s commitment to fund the Family Responsibilities Commission.
25
2019-20 Budget Measures
| | | | | | | | | | | | | | | | | | | | |
| | | 2018-19
$‘000 | | | 2019-20
$‘000 | | | 2020-21
$‘000 | | | 2021-22
$‘000 | | | 2022-23
$‘000 | |
Aboriginal and Torres Strait Islander Youth Mental Health and Wellbeing | | | — | | | | 750 | | | | 1,500 | | | | 2,050 | | | | 2,600 | |
The Government is providing additional funding of $6.9 million over four years to develop and implement an Aboriginal and Torres Strait Islander youth mental health and wellbeing program.
This forms part of the Government’s total funding of $80.1 million over four years to support the Shifting Minds Suicide Prevention Flagship. Further details can be found in the Queensland Health and Department of Education sections of this chapter.
| | | | | | | | | | | | | | | | | | | | |
| | | 2018-19
$‘000 | | | 2019-20
$‘000 | | | 2020-21
$‘000 | | | 2021-22
$‘000 | | | 2022-23
$‘000 | |
Developing an Aboriginal and Torres Strait Islander Languages Policy | | | — | | | | 674 | | | | — | | | | — | | | | — | |
The Government is providing additional funding of $674,000 in 2019-20 for the development of an Aboriginal and Torres Strait Islander Languages Policy. 2019 has been declared the International Year of Indigenous Languages.
| | | | | | | | | | | | | | | | | | | | |
| | | 2018-19
$‘000 | | | 2019-20
$‘000 | | | 2020-21
$‘000 | | | 2021-22
$‘000 | | | 2022-23
$‘000 | |
Work history research and legal services | | | — | | | | 520 | | | | — | | | | — | | | | — | |
The Government is providing increased funding of $520,000 in 2019-20 for legal services and work history research.
| | | | | | | | | | | | | | | | | | | | |
| | | 2018-19
$‘000 | | | 2019-20
$‘000 | | | 2020-21
$‘000 | | | 2021-22
$‘000 | | | 2022-23
$‘000 | |
Closing the Gap monitoring - essential data services | | | — | | | | 477 | | | | 491 | | | | 505 | | | | 519 | |
The Government is providing increased funding of $2 million over four years and $350,000 per annum ongoing from 2023-24 for data services to monitor and inform reporting on progress toward the achievement of Closing the Gap targets.
26
2019-20 Budget Measures
| | | | | | | | | | | | | | | | | | | | |
| | | 2018-19
$‘000 | | | 2019-20
$‘000 | | | 2020-21
$‘000 | | | 2021-22
$‘000 | | | 2022-23
$‘000 | |
Addressing domestic and family violence impacting Aboriginal and Torres Strait Islander people | | | — | | | | 456 | | | | 464 | | | | 471 | | | | 480 | |
The Government is providing increased funding of $1.9 million over four years and $480,000 per annum ongoing to support High Risk Teams tackling domestic and family violence in Caboolture and Mackay.
| | | | | | | | | | | | | | | | | | | | |
| | | 2018-19
$‘000 | | | 2019-20
$‘000 | | | 2020-21
$‘000 | | | 2021-22
$‘000 | | | 2022-23
$‘000 | |
Alcohol Management Plans | | | — | | | | 400 | | | | 500 | | | | 750 | | | | 750 | |
The Government is providing increased funding of $2.4 million over four years for services to reduce alcohol related harm in Aboriginal and Torres Strait Islander communities. The department is internally funding $3.7 million over three years for the implementation of the alcohol management plans.
| | | | | | | | | | | | | | | | | | | | |
| | | 2018-19
$‘000 | | | 2019-20
$‘000 | | | 2020-21
$‘000 | | | 2021-22
$‘000 | | | 2022-23
$‘000 | |
Kupai Omasker | | | — | | | | 368 | | | | — | | | | — | | | | — | |
The Government is providing increased funding of $368,000 in 2019-20 to finalise the design of the preferred model and develop legislation for legal recognition of traditional Torres Strait Islander child rearing practices.
| | | | | | | | | | | | | | | | | | | | |
| | | 2018-19
$‘000 | | | 2019-20
$‘000 | | | 2020-21
$‘000 | | | 2021-22
$‘000 | | | 2022-23
$‘000 | |
Former Origin Greats Achieving Results Through Indigenous Education Program | | | — | | | | — | | | | — | | | | — | | | | — | |
The Government is providing additional funding of $4.5 million over three years from 2019-20 to Former Origin Greats Queensland to support an expansion of the Achieving Results Through Indigenous Education Program into an additional 20 state primary schools across the State. This funding is being sourced from the increased Queensland Government funding for state schools, which can be found in the Department of Education section of this chapter.
27
2019-20 Budget Measures
| | | | | | | | | | | | | | | | | | | | |
| | | 2018-19
$‘000 | | | 2019-20
$‘000 | | | 2020-21
$‘000 | | | 2021-22
$‘000 | | | 2022-23
$‘000 | |
Legislative Reform | | | — | | | | — | | | | — | | | | — | | | | — | |
Funding of $3.2 million over five years from 2018-19 is being internally met by the department to develop legislative reform to inform a rights-based legislative platform for a reframed relationship between Aboriginal and Torres Strait Islander peoples and the Queensland Government.
28
2019-20 Budget Measures
Department of Agriculture and Fisheries
| | | | | | | | | | | | | | | | | | | | |
| | | 2018-19
$‘000 | | | 2019-20
$‘000 | | | 2020-21
$‘000 | | | 2021-22
$‘000 | | | 2022-23
$‘000 | |
Improving Swimmer Safety including the Shark Control Program | | | — | | | | 4,219 | | | | 4,259 | | | | 4,207 | | | | 4,398 | |
The Government is providing additional funding of $17.1 million over four years and $4.4 million per annum ongoing to continue the shark control program, undertake research and trial the application of new technologies (such as drones) in swimmer risk mitigation and roll out education and awareness programs.
This forms part of the Government’s total funding package of $18.7 million over four years and $4.8 million per annum ongoing to improve swimmer safety. Further details can be found in the Department of Innovation, Tourism Industry Development and the Commonwealth Games and the Queensland Fire and Emergency Services sections of this chapter.
| | | | | | | | | | | | | | | | | | | | |
| | | 2018-19
$‘000 | | | 2019-20
$‘000 | | | 2020-21
$‘000 | | | 2021-22
$‘000 | | | 2022-23
$‘000 | |
Continuation of Fisheries Reform | | | — | | | | 2,100 | | | | 8,506 | | | | — | | | | — | |
The Government is providing increased funding of $10.6 million over two years to continue the fisheries reform process which includes upgrades to the compliance system and fish aggregating devices.
| | | | | | | | | | | | | | | | | | | | |
| | | 2018-19
$‘000 | | | 2019-20
$‘000 | | | 2020-21
$‘000 | | | 2021-22
$‘000 | | | 2022-23
$‘000 | |
Queensland’s Obligations within the National Biosecurity System | | | 1,411 | | | | 1,370 | | | | 790 | | | | — | | | | — | |
The Government is providing additional funding of $3.6 million over three years to meet Queensland’s obligations within the National Biosecurity System, which will help mitigate the risks and impacts of significant pests and diseases.
29
2019-20 Budget Measures
| | | | | | | | | | | | | | | | | | | | |
| | | 2018-19
$‘000 | | | 2019-20
$‘000 | | | 2020-21
$‘000 | | | 2021-22
$‘000 | | | 2022-23
$‘000 | |
Small Business Regulatory Reform Project | | | 2,395 | | | | 1,273 | | | | 150 | | | | 7 | | | | — | |
The Government is providing additional funding of $3.8 million over four years to support businesses in the agricultural industries meet their compliance obligations and find targeted information to manage biosecurity risks and agricultural chemicals. This includes additional funding for the Biosecurity Entity Online Customer Portal ($1.9 million), Digitisation and Modernisation of the Agricultural Chemical Regulatory Regime ($1.5 million) and the Biosecurity Planning App ($397,000).
This forms part of the Queensland and Australian Government’s Small Business Regulatory Reform Project Agreement to deliver projects that reduce the regulatory burden on small business. The projects undertaken as part of this Agreement will leverage $60.1 million in reward payments from the Australian Government upon successful completion of relevant project milestones. Further details can be found in the Department of Employment, Small Business and Training, Queensland Health and Department of Transport and Main Roads sections of this chapter.
| | | | | | | | | | | | | | | | | | | | |
| | | 2018-19
$‘000 | | | 2019-20
$‘000 | | | 2020-21
$‘000 | | | 2021-22
$‘000 | | | 2022-23
$‘000 | |
Supporting Delivery of the Queensland Greyhound Racing Industry Commission of Inquiry (MacSporran Report) Recommendations | | | — | | | | 848 | | | | 843 | | | | 955 | | | | 1,091 | |
The Government is providing increased funding of $3.7 million over four years ($4.9 million over five years) to fund depreciation and amortisation expenditure associated with the continued implementation of the Racing Science Centre capital program and system upgrades to the Registration and Licensing Environment. The capital component of this measure can be found in Chapter 3 Capital Measures.
30
2019-20 Budget Measures
| | | | | | | | | | | | | | | | | | | | |
| | | 2018-19
$‘000 | | | 2019-20
$‘000 | | | 2020-21
$‘000 | | | 2021-22
$‘000 | | | 2022-23
$‘000 | |
Drought Assistance Package and Queensland Drought Reform | | | — | | | | — | | | | — | | | | — | | | | — | |
The Government is providing increased funding of up to $50 million over four years from 2019-20 ($25 million in 2019-20), held centrally, as part of the Drought Assistance Package and Queensland Drought Reform. This funding provides for the continuation of freight subsidies and emergency water infrastructure rebates to help producers and communities that have been affected by drought across the State and for the commencement of Queensland Drought Reform.
The Drought Assistance Package and Queensland Drought Reform is a total of up to $74.6 million over four years from 2019-20 to support drought affected communities across the State. Further details can be found in the Department of Communities, Disability Services and Seniors, and Department of Natural Resources, Mines and Energy sections of this chapter and the Department of Natural Resources, Mines and Energy section of Chapter 4 Revenue Measures.
| | | | | | | | | | | | | | | | | | | | |
| | | 2018-19
$‘000 | | | 2019-20
$‘000 | | | 2020-21
$‘000 | | | 2021-22
$‘000 | | | 2022-23
$‘000 | |
Panama Disease Tropical Race 4 Program | | | — | | | | — | | | | — | | | | — | | | | — | |
The Government is providing increased funding of $12.1 million over five years to control and contain the Panama Tropical Race 4 (TR4) disease incorporating a strong, robust industry model that shares the responsibility of managing this disease. The Government is currently negotiating the development of a partnership agreement with industry to jointly fund, deliver, design and govern the Panama TR4 Program in Queensland.
| | | | | | | | | | | | | | | | | | | | |
| | | 2018-19
$‘000 | | | 2019-20
$‘000 | | | 2020-21
$‘000 | | | 2021-22
$‘000 | | | 2022-23
$‘000 | |
Queensland Agricultural Training Colleges | | | — | | | | — | | | | — | | | | — | | | | — | |
The Government is providing additional funding of $7 million over two years, held centrally, to support Queensland Agricultural Training Colleges (QATC) to cease operations at the end of 2019 and transition to more modern and cost-effective training, which is in line with the Coaldrake Review recommendations. This funding will ensure support is provided to students, staff and the community and QATC’s liabilities are extinguished.
31
2019-20 Budget Measures
Department of Child Safety, Youth and Women
| | | | | | | | | | | | | | | | | | | | |
| | | 2018-19
$‘000 | | | 2019-20
$‘000 | | | 2020-21
$‘000 | | | 2021-22
$‘000 | | | 2022-23
$‘000 | |
Family Support and Child Protection Reforms | | | — | | | | 127,664 | | | | 120,778 | | | | 120,813 | | | | 150 | |
The Government is providing increased funding of $369.4 million over four years, with a further $113.3 million being internally met by the department to continue the family support and child protection system reforms through Supporting Families Changing Futures.
This includes $196.5 million for the Intensive Family Support services to continue early intervention support services for families and parents experiencing vulnerability who have more complex needs, to ensure they receive necessary support before Child Safety intervention. Also included is $99.8 million for the Aboriginal and Torres Strait Islander Family Wellbeing Service, $45.5 million for the Family and Child Connect Service and $24.7 million to support foster and kinship carers through non-government organisations.
Funding under this measure (including further funding of $720,000 from the Department of Youth Justice) will assist in implementation of the second Our Way Changing Tracks Action Plan and the development of first Breaking Cycles Action Plan to address the disproportionate representation of Aboriginal and Torres Strait Islander children in the child protection system (total of $14.6 million over four years).
This forms part of the Government’s total funding package of $517.5 million ($401.6 million new funding and $115.9 million internally funded) over four years to continue Queensland’s family support and child protection reforms. Further details can be found in the Department of Education and Department of Justice and Attorney-General sections of this chapter.
| | | | | | | | | | | | | | | | | | | | |
| | | 2018-19
$‘000 | | | 2019-20
$‘000 | | | 2020-21
$‘000 | | | 2021-22
$‘000 | | | 2022-23
$‘000 | |
Family Support and Child Protection Reforms - Extension of Foster Carer Allowance | | | — | | | | — | | | | 2,398 | | | | 2,398 | | | | 2,398 | |
The Government will provide additional funding of $7.2 million over three years and $2.4 million per annum ongoing to extend the foster and kinship carer allowance to support the change in eligibility as a result of the introduction of the Prep year in Queensland, to ensure young people past the age of 18 can remain with their carers while completing high school.
This forms part of the Government’s total funding package of $517.5 million ($401.6 million new funding and $115.9 million internally funded) over four years to continue Queensland’s family support and child protection reforms. Further details can be found in the Department of Education and Department of Justice and Attorney-General sections of this chapter.
32
2019-20 Budget Measures
| | | | | | | | | | | | | | | | | | | | |
| | | 2018-19
$‘000 | | | 2019-20
$‘000 | | | 2020-21
$‘000 | | | 2021-22
$‘000 | | | 2022-23
$‘000 | |
Supporting Children and Young People with Complex and Challenging Behaviours | | | — | | | | 20,000 | | | | — | | | | — | | | | — | |
The Government is providing increased funding of $20 million in 2019-20 to support children and young people in care with complex and challenging behaviours.
| | | | | | | | | | | | | | | | | | | | |
| | | 2018-19
$‘000 | | | 2019-20
$‘000 | | | 2020-21
$‘000 | | | 2021-22
$‘000 | | | 2022-23
$‘000 | |
Staged Replacement of Integrated Client Management System | | | — | | | | 10,286 | | | | 9,443 | | | | 4,710 | | | | 4,795 | |
The Government is providing increased funding of $29.2 million over four years, and $4.9 million per annum ongoing from 2023-24 to progress the next stage of the replacement of the current Integrated Client Management System. The new ‘Unify’ system will incorporate new and enhanced functionality for the department and the Department of Youth Justice, and for integrated multi-agency collaboration and improved sharing and management of child protection information, to better support children and families in the child protection and youth justice systems.
Further expense funding of $52.7 million over four years and recurrent funding averaging $8 million per annum from 2023-24 is held centrally to deliver and support Tranche 1 of the new solution. The capital component of this measure can be found in Chapter 3 Capital Measures.
| | | | | | | | | | | | | | | | | | | | |
| | | 2018-19
$‘000 | | | 2019-20
$‘000 | | | 2020-21
$‘000 | | | 2021-22
$‘000 | | | 2022-23
$‘000 | |
Women in Custody | | | 2,365 | | | | 2,975 | | | | 2,525 | | | | — | | | | — | |
The Government is providing additional funding of $7.9 million over three years to commence a suite of pilot programs and services that targets the needs of women prisoners and offenders. These include a parenting program for mothers on remand, and victim counselling and accommodation support to assist women transitioning from remand to bail. Funding will also support an Aboriginal and Torres Strait Islander Women’s Rehabilitation and Healing program, Early Intervention Community program, and procurement of women’s re-entry services at the Southern Queensland Correctional Centre.
33
2019-20 Budget Measures
| | | | | | | | | | | | | | | | | | | | |
| | | 2018-19
$‘000 | | | 2019-20
$‘000 | | | 2020-21
$‘000 | | | 2021-22
$‘000 | | | 2022-23
$‘000 | |
National Redress Scheme | | | 3,411 | | | | 5,901 | | | | 6,250 | | | | 6,440 | | | | — | |
The Government is providing additional funding of $22 million over four years for the department to lead and coordinate Queensland’s participation in the National Redress Scheme for survivors of institutional child sexual abuse.
Further details can be found in the Department of Housing and Public Works, the Department of Justice and Attorney-General and the Department of Communities, Disability Services and Seniors sections of this chapter.
| | | | | | | | | | | | | | | | | | | | |
| | | 2018-19
$‘000 | | | 2019-20
$‘000 | | | 2020-21
$‘000 | | | 2021-22
$‘000 | | | 2022-23
$‘000 | |
Youth Justice Investment - Family and Wellbeing Service | | | — | | | | 2,260 | | | | 4,120 | | | | — | | | | — | |
The Government is providing additional funding of $6.4 million over two years for an enhanced Youth and Family Wellbeing service for young people and their families at risk of entering the youth justice system. Extra case workers will be assigned in Indigenous community controlled services in priority locations to help Aboriginal and Torres Strait Islander young people stay away from crime.
This contributes to the whole-of-government investment for a suite of youth justice infrastructure and non-infrastructure initiatives of $154.5 million operating (including $143.1 million new funding and $11.4 million to be funded internally) and $178 million capital (including $140 million held centrally for estimated project costs) over five years. Details on the Youth Justice Investment measures can be found in the Department of Youth Justice, Department of Child Safety, Youth and Women, Department of Education, Queensland Health, Queensland Police Service and Department of Justice and Attorney-General sections of this chapter, and the Department of Youth Justice section of Chapter 3 Capital Measures.
| | | | | | | | | | | | | | | | | | | | |
| | | 2018-19
$‘000 | | | 2019-20
$‘000 | | | 2020-21
$‘000 | | | 2021-22
$‘000 | | | 2022-23
$‘000 | |
Truth, Healing and Reconciliation Taskforce | | | 431 | | | | 432 | | | | 438 | | | | 445 | | | | 454 | |
The Government is providing funding of $2.2 million over five years with a further $500,000 internally met by the department to establish and operationalise the Truth, Healing and Reconciliation Taskforce to help guide the implementation of activities and reform initiatives and help raise public awareness of the impact of institutional child sexual abuse.
34
2019-20 Budget Measures
| | | | | | | | | | | | | | | | | | | | |
| | | 2018-19
$‘000 | | | 2019-20
$‘000 | | | 2020-21
$‘000 | | | 2021-22
$‘000 | | | 2022-23
$‘000 | |
Anti-Cyerberbulling Initiatives | | | 1,250 | | | | 1,250 | | | | — | | | | — | | | | — | |
The Government is providing additional funding of $2.5 million over two years for statewide public awareness and education campaigns in response to the Queensland Anti-Cyberbullying Taskforce. This includes $500,000 over two years for a grants program for young people and youth, community and sporting organisations to enable them to undertake anti-cyberbullying initiatives in their community.
This forms part of the Government’s total funding of $3.5 million over two years for the implementation of the recommendations of the Queensland Anti-Cyberbullying Taskforce Report, Adjust our Settings: A community approach to address cyberbullying among children and young people in Queensland. Further details can be found in the Department of Education section of this chapter.
A further $1.2 million over four years has been funded internally by the Department of Child Safety, Youth and Women to expand existing universal parenting support and education programs and phone counselling services to equip parents with the skills and knowledge to respond to the issue of cyberbullying.
| | | | | | | | | | | | | | | | | | | | |
| | | 2018-19
$‘000 | | | 2019-20
$‘000 | | | 2020-21
$‘000 | | | 2021-22
$‘000 | | | 2022-23
$‘000 | |
Perpetrator Intervention Initiatives | | | — | | | | 410 | | | | 810 | | | | — | | | | — | |
The Government is providing additional funding of $1.2 million over two years to provide perpetrator intervention services to help people committing violence and abuse in a domestic or family environment to break the cycle and to help them change their abusive behaviour.
| | | | | | | | | | | | | | | | | | | | |
| | | 2018-19
$‘000 | | | 2019-20
$‘000 | | | 2020-21
$‘000 | | | 2021-22
$‘000 | | | 2022-23
$‘000 | |
Fighting Youth Sexual Violence | | | 1,450 | | | | 3,442 | | | | 3,515 | | | | 3,508 | | | | — | |
The Government is providing additional funding of $11.9 million over four years for new and expanded services to deliver a comprehensive and holistic response to sexual violence and abuse. This includes community education activities and place-based trials to respond to young people who have experienced sexual violence or are at risk of engaging in early sexual offending behaviour.
35
2019-20 Budget Measures
| | | | | | | | | | | | | | | | | | | | |
| | | 2018-19
$‘000 | | | 2019-20
$‘000 | | | 2020-21
$‘000 | | | 2021-22
$‘000 | | | 2022-23
$‘000 | |
Women with disability and their children | | | — | | | | 755 | | | | 755 | | | | — | | | | — | |
The Government is providing additional funding of $1.5 million over two years to respond to the needs of women with disability, and their children, who are experiencing domestic and family violence.
| | | | | | | | | | | | | | | | | | | | |
| | | 2018-19
$‘000 | | | 2019-20
$‘000 | | | 2020-21
$‘000 | | | 2021-22
$‘000 | | | 2022-23
$‘000 | |
National Disability Insurance Scheme Transition Support:
Children with Disability in the Child Protection System | | | — | | | | 9,636 | | | | — | | | | — | | | | — | |
The Government is providing increased funding of $9.6 million in 2019-20 to continue the provision of support for children with disability, both in the child protection system and in voluntary out of home care arrangements. This funding will ensure a smooth transition to the National Disability Insurance Scheme (NDIS) for Queensland children with disability.
This funding is part of the total of $61.9 million over two years provided by the Queensland Government as a temporary measure while interface issues between the NDIS and mainstream services are resolved through national policy work, to ensure clients are able to access critical supports while they transition to the NDIS. Further details can be found in the Department of Communities, Disability Services and Seniors, Queensland Health, and the Department of Transport and Main Roads sections of this chapter.
36
2019-20 Budget Measures
| | | | | | | | | | | | | | | | | | | | |
| | | 2018-19
$‘000 | | | 2019-20
$‘000 | | | 2020-21
$‘000 | | | 2021-22
$‘000 | | | 2022-23
$‘000 | |
Youth Justice Investment - Navigate Your Health | | | — | | | | — | | | | — | | | | — | | | | — | |
The department is internally funding $800,000 over two years for the Navigate Your Health Initiative to expand the trial of comprehensive health screening and assessments for young people in care to include young people in the Youth Justice system.
This forms part of the Government’s total funding of $3.5 million over two years. Further details can be found in the Queensland Health section of this chapter.
This contributes to the whole-of-government investment for a suite of youth justice infrastructure and non-infrastructure initiatives of $154.5 million operating (including $143.1 million new funding and $11.4 million to be funded internally) and $178 million capital (including $140 million held centrally for estimated project costs) over five years. Details on the Youth Justice Investment measures can be found in the Department of Youth Justice, Department of Child Safety, Youth and Women, Department of Education, Queensland Health, Queensland Police Service and Department of Justice and Attorney-General sections of this chapter, and the Department of Youth Justice section of Chapter 3 Capital Measures.
37
2019-20 Budget Measures
Department of Communities, Disability Services and Seniors
| | | | | | | | | | | | | | | | | | | | |
| | | 2018-19
$‘000 | | | 2019-20
$‘000 | | | 2020-21
$‘000 | | | 2021-22
$‘000 | | | 2022-23
$‘000 | |
Support for people with disability | | | — | | | | 24,797 | | | | 4,243 | | | | 2,593 | | | | 2,661 | |
The Government is providing increased funding of $34.3 million over four years and $2.7 million ongoing to continue to support people with disability.
This includes increased funding of $28.7 million over four years and $2.7 million ongoing to continue authorisation of restrictive practices, criminal screening of providers, management of complaints and investigations, National Disability Insurance Scheme (NDIS) performance monitoring, policy and legislative functions, and continuity of support for clients ineligible for the NDIS.
This funding also includes $5.6 million in 2019-20 for peak bodies in the disability services sector.
This funding is part of the total of $62.7 million over four years provided by the Government to continue state services to meet obligations under State legislation and ensure continuity of support for people with disability in Queensland. Further details can be found in the Department of Justice and Attorney-General and Queensland Health sections of this chapter.
| | | | | | | | | | | | | | | | | | | | |
| | | 2018-19
$‘000 | | | 2019-20
$‘000 | | | 2020-21
$‘000 | | | 2021-22
$‘000 | | | 2022-23
$‘000 | |
National Disability Insurance Scheme Transition Support:
Queensland Community Support Scheme - Transport Supports | | | — | | | | 7,000 | | | | — | | | | — | | | | — | |
The Government is providing increased funding of $7 million in 2019-20 to enhance transport supports available through the Queensland Community Support Scheme. This funding will ensure a smooth transition to the National Disability Insurance Scheme (NDIS) for Queenslanders with disability.
This funding is part of the total of $61.9 million over two years provided by the Queensland Government as a temporary measure while interface issues between the NDIS and mainstream services are resolved through national policy work, to ensure clients are able to access critical supports while they transition to the NDIS. Further details can be found in the Department of Child Safety, Youth and Women, Queensland Health and the Department of Transport and Main Roads sections of this chapter.
38
2019-20 Budget Measures
| | | | | | | | | | | | | | | | | | | | |
| | | 2018-19
$‘000 | | | 2019-20
$‘000 | | | 2020-21
$‘000 | | | 2021-22
$‘000 | | | 2022-23
$‘000 | |
Tackling Alcohol Fuelled Violence Program | | | — | | | | 3,316 | | | | — | | | | — | | | | — | |
The Government is providing increased funding of $3.3 million in 2019-20 to continue delivery of Safe Night Precinct Support Services which provide early intervention to ensure people affected by excessive alcohol consumption receive necessary assistance and are not exposed to risk or harm as a result of their condition.
This forms part of the Government’s overall package of $6.6 million to continue the Tackling Alcohol Fuelled Violence Program in 2019-20. Further details can be found in the Queensland Corrective Services and Department of Justice and Attorney-General sections of this chapter.
| | | | | | | | | | | | | | | | | | | | |
| | | 2018-19
$‘000 | | | 2019-20
$‘000 | | | 2020-21
$‘000 | | | 2021-22
$‘000 | | | 2022-23
$‘000 | |
National Disability Insurance Scheme Transition Support:
Queensland Community Support Scheme in remote and discrete Aboriginal and Torres Strait Islander communities | | | — | | | | 2,000 | | | | 2,000 | | | | — | | | | — | |
The Government is providing increased funding of $ 4 million over two years to supplement the Queensland Community Support Scheme in remote and discrete Aboriginal and Torres Strait Islander communities and build capability of service providers. This funding will ensure a smooth transition to the NDIS for Queenslanders with disability.
This funding is part of the total of $61.9 million over two years provided by the Queensland Government as a temporary measure while interface issues between the NDIS and mainstream services are resolved through national policy work, to ensure clients are able to access critical supports while they transition to the NDIS. Further details can be found in the Department of Child Safety, Youth and Women, Queensland Health, and the Department of Transport and Main Roads sections of this chapter.
| | | | | | | | | | | | | | | | | | | | |
| | | 2018-19
$‘000 | | | 2019-20
$‘000 | | | 2020-21
$‘000 | | | 2021-22
$‘000 | | | 2022-23
$‘000 | |
Thriving Communities, Advancing Queensland:
Continuation of Community Connect workers | | | — | | | | 1,500 | | | | 1,500 | | | | 1,500 | | | | 1,500 | |
The Government is providing increased funding of $6 million over four years and $1.5 million per annum ongoing for the continuation of 12 existing Community Connect workers to facilitate support and referrals for individuals and families to specialist services.
39
2019-20 Budget Measures
| | | | | | | | | | | | | | | | | | | | |
| | | 2018-19
$‘000 | | | 2019-20
$‘000 | | | 2020-21
$‘000 | | | 2021-22
$‘000 | | | 2022-23
$‘000 | |
Place-based approaches | | | — | | | | 750 | | | | 750 | | | | 750 | | | | 750 | |
The Government is providing increased funding of $3 million over four years ($3.8 million over five years) to support Logan Together, a co-funded initiative with the Logan City Council and the Australian Government to reduce the rate of developmentally vulnerable 0-8 year-olds in Logan.
The Government is also providing additional funding of $2.7 million over four years ($3.9 million over five years), held centrally, to support new place-based responses in Gladstone and Rockhampton.
Australian Government funding will be provided for these initiatives through the Stronger Places, Stronger People initiative.
| | | | | | | | | | | | | | | | | | | | |
| | | 2018-19
$‘000 | | | 2019-20
$‘000 | | | 2020-21
$‘000 | | | 2021-22
$‘000 | | | 2022-23
$‘000 | |
School Breakfast Program | | | — | | | | 348 | | | | 267 | | | | 273 | | | | 280 | |
The Government is providing increased funding of $1.2 million over four years ($1.5 million over five years) to Foodbank Queensland to expand the School Breakfast Program to additional schools across the State.
| | | | | | | | | | | | | | | | | | | | |
| | | 2018-19
$‘000 | | | 2019-20
$‘000 | | | 2020-21
$‘000 | | | 2021-22
$‘000 | | | 2022-23
$‘000 | |
National Redress Scheme | | | — | | | | 145 | | | | 148 | | | | 152 | | | | — | |
The Government is providing additional funding of $445,000 over three years for a coordinator to support participation in the National Redress Scheme for survivors of institutional child sexual abuse. This funding is complemented by internal funding.
Further details can be found in the Department of Housing and Public Works, the Department of Justice and Attorney-General and the Department of Child Safety, Youth and Women sections of this chapter.
40
2019-20 Budget Measures
| | | | | | | | | | | | | | | | | | | | |
| | | 2018-19
$‘000 | | | 2019-20
$‘000 | | | 2020-21
$‘000 | | | 2021-22
$‘000 | | | 2022-23
$‘000 | |
Drought Assistance Package and Queensland Drought Reform | | | — | | | | — | | | | — | | | | — | | | | — | |
The Government is providing additional funding of up to $5.2 million in 2019-20, held centrally, as part of the Drought Assistance Package and Queensland Drought Reform. This funding provides financial assistance with bills and cost of living to reflect the current needs of those who are struggling in their seventh consecutive year of drought.
The Drought Assistance Package and Queensland Drought Reform is a total of up to $74.6 million over four years from 2019-20 to support drought affected communities across the State. Further details can be found in the Department of Agriculture and Fisheries, Department of Natural Resources, Mines and Energy sections of this chapter and the Department of Natural Resources, Mines and Energy section of Chapter 4 Revenue Measures.
| | | | | | | | | | | | | | | | | | | | |
| | | 2018-19
$‘000 | | | 2019-20
$‘000 | | | 2020-21
$‘000 | | | 2021-22
$‘000 | | | 2022-23
$‘000 | |
Townsville Women’s Centre premises | | | — | | | | — | | | | — | | | | — | | | | — | |
Funding of up to $3.2 million over two years has been internally met by the department to fully fund the construction of the new Townsville Women’s Centre premises. The expanded Centre will continue to provide women with a safe space to access free services including counselling, health services, information and referral, homelessness support, and therapeutic groups.
41
2019-20 Budget Measures
Department of Education
| | | | | | | | | | | | | | | | | | | | |
| | | 2018-19
$‘000 | | | 2019-20
$‘000 | | | 2020-21
$‘000 | | | 2021-22
$‘000 | | | 2022-23
$‘000 | |
State schools - increased funding | | | 3,080 | | | | 194,900 | | | | 247,270 | | | | 263,120 | | | | 425,870 | |
The Government is providing increased funding of approximately $1.1 billion over the forward estimates (approximately $1.4 billion over calendar years 2019 to 2023) for Queensland state schools, as part of the five-year school funding agreement reached with the Australian Government in December 2018. This funding (which will fluctuate with enrolment changes as it is based on per student amounts) will go towards a range of initiatives to support improved educational outcomes in Queensland state schools and support the implementation of the National School Reform Agreement.
| | | | | | | | | | | | | | | | | | | | |
| | | 2018-19
$‘000 | | | 2019-20
$‘000 | | | 2020-21
$‘000 | | | 2021-22
$‘000 | | | 2022-23
$‘000 | |
Early childhood education and care - regulation | | | — | | | | 13,163 | | | | 13,368 | | | | — | | | | — | |
The Government is providing increased funding of $26.5 million over two years to continue and enhance regulation of the early childhood sector. Regulation aims to ensure children’s health, safety and wellbeing, and supports educational outcomes in the early childhood sector.
The Government will continue to work with the Australian Government to seek a funding contribution to early childhood education and care regulation in Queensland.
| | | | | | | | | | | | | | | | | | | | |
| | | 2018-19
$‘000 | | | 2019-20
$‘000 | | | 2020-21
$‘000 | | | 2021-22
$‘000 | | | 2022-23
$‘000 | |
Early childhood education and care - universal access to kindergarten | | | — | | | | 10,801 | | | | 19,576 | | | | — | | | | — | |
The Government is providing increased funding of $30.4 million over two years to support the continued provision of universal access to kindergarten for children in the year before school.
The Government will continue to work with the Australian Government to seek a long-term funding commitment to universal access to kindergarten in Queensland.
42
2019-20 Budget Measures
| | | | | | | | | | | | | | | | | | | | |
| | | 2018-19
$‘000 | | | 2019-20
$‘000 | | | 2020-21
$‘000 | | | 2021-22
$‘000 | | | 2022-23
$‘000 | |
Remuneration and Certification of Highly Accomplished and Lead Teachers | | | 3,624 | | | | 8,246 | | | | 12,110 | | | | 14,290 | | | | 14,290 | |
The Government is providing additional funding of $52.6 million over five years and $14.3 million per annum ongoing for the remuneration and certification of Highly Accomplished and Lead Teachers. This includes additional funding of $ 39.9 million over five years and $11.5 million per annum ongoing for the remuneration of teachers certified as Highly Accomplished or Lead Teachers, and additional funding of $12.7 million over five years and $2.8 million per annum ongoing for the implementation of the certification process.
| | | | | | | | | | | | | | | | | | | | |
| | | 2018-19
$‘000 | | | 2019-20
$‘000 | | | 2020-21
$‘000 | | | 2021-22
$‘000 | | | 2022-23
$‘000 | |
Office of Industrial Relations ICT Investment | | | — | | | | 1,000 | | | | 1,000 | | | | 1,000 | | | | 1,000 | |
The Government is providing additional funding of $4 million over four years to support the implementation of recommendations from the Best Practice Review of Workplace Health and Safety Queensland.
Total funding for this initiative is $8 million over four years. The capital component of this measure can be found in Chapter 3 Capital Measures.
| | | | | | | | | | | | | | | | | | | | |
| | | 2018-19
$‘000 | | | 2019-20
$‘000 | | | 2020-21
$‘000 | | | 2021-22
$‘000 | | | 2022-23
$‘000 | |
Family Support and Child Protection Reforms - Student Protection Principal Advisors | | | — | | | | 593 | | | | 608 | | | | 623 | | | | — | |
The Government is providing increased funding of $1.8 million over three years, with a further $1.8 million internally met by the department, to continue the roles of the regional student protection principal advisors. These advisors strengthen the department’s capacity in supporting schools to respond to student protection matters.
This forms part of the Government’s total funding package of $517.5 million ($401.6 million new funding and $ 115.9 million internally funded) over four years to continue Queensland’s family support and child protection reforms. Further details can be found in the Department of Child Safety, Youth and Women and the Department of Justice and Attorney-General sections of this chapter.
43
2019-20 Budget Measures
| | | | | | | | | | | | | | | | | | | | |
| | | 2018-19
$‘000 | | | 2019-20
$‘000 | | | 2020-21
$‘000 | | | 2021-22
$‘000 | | | 2022-23
$‘000 | |
Youth Justice Investment - Additional 16 beds at Brisbane Youth Detention Centre | | | — | | | | 125 | | | | 587 | | | | 601 | | | | 617 | |
The Government is providing additional funding of $1.9 million over four years and $ 617,000 per annum ongoing to provide education services to support the expanded capacity at the Brisbane Youth Detention Centre.
This forms part of the Government’s total investment of $27 million capital and $18.3 million operating over five years, and $5.7 million per annum operating ongoing for the additional 16 beds at Brisbane Youth Detention Centre. Further details can be found in the Department of Youth Justice and Queensland Health sections of this chapter, and in the Department of Youth Justice section of Chapter 3 Capital measures.
This contributes to the whole-of-government investment for a suite of youth justice infrastructure and non-infrastructure initiatives of $154.5 million operating (including $143.1 million new funding and $11.4 million to be funded internally) and $178 million capital (including $140 million held centrally for estimated project costs) over five years. Details on the Youth Justice Investment measures can be found in the Department of Youth Justice, Department of Child Safety, Youth and Women, Department of Education, Queensland Health, Queensland Police Service and Department of Justice and Attorney-General sections of this chapter, and the Department of Youth Justice section of Chapter 3 Capital Measures.
| | | | | | | | | | | | | | | | | | | | |
| | | 2018-19
$‘000 | | | 2019-20
$‘000 | | | 2020-21
$‘000 | | | 2021-22
$‘000 | | | 2022-23
$‘000 | |
Additional Support for Students with a Disability | | | — | | | | — | | | | — | | | | — | | | | — | |
The Government is providing increased funding of $136.2 million over four years from 2019-20 to ensure that there is optimal student to teacher ratios to support students with a disability. This funding is being sourced from the increased Queensland Government funding for state schools.
44
2019-20 Budget Measures
| | | | | | | | | | | | | | | | | | | | |
| | | 2018-19
$‘000 | | | 2019-20
$‘000 | | | 2020-21
$‘000 | | | 2021-22
$‘000 | | | 2022-23
$‘000 | |
Anti-Cyberbullying Initiatives | | | — | | | | — | | | | — | | | | — | | | | — | |
Funding of $1 million over two years from 2018-19 has been internally met by the department for anti-cyberbullying initiatives in Queensland state schools. This forms part of the Government’s total funding of $3.5 million over two years for the implementation of the recommendations of the Queensland Anti-Cyberbullying Taskforce Report, Adjust our Settings: A community approach to address cyberbullying among children and young people in Queensland. Further details can be found in the Department of Child Safety, Youth and Women section of this chapter.
| | | | | | | | | | | | | | | | | | | | |
| | | 2018-19
$‘000 | | | 2019-20
$‘000 | | | 2020-21
$‘000 | | | 2021-22
$‘000 | | | 2022-23
$‘000 | |
Daniel Morcombe Foundation | | | — | | | | — | | | | — | | | | — | | | | — | |
The Government is providing additional funding of $721,000 over three years from 2019-20 to the Daniel Morcombe Foundation to support the annual Day for Daniel. The Government shares the aims and objectives of the Day for Daniel in delivering the message of child safety awareness to schools across Queensland and the nation. This funding will ensure that the Day for Daniel can continue to grow and achieve its goal of making Australia a safe place for all children. This funding is being sourced from the increased Queensland Government funding for state schools.
| | | | | | | | | | | | | | | | | | | | |
| | | 2018-19
$‘000 | | | 2019-20
$‘000 | | | 2020-21
$‘000 | | | 2021-22
$‘000 | | | 2022-23
$‘000 | |
Digital Engagement Strategy | | | — | | | | — | | | | — | | | | — | | | | — | |
The Government is providing additional funding of $2.3 million over four years from 2018-19 to establish online platforms targeted at disengaged youth and their parents, to facilitate re-engagement with education, training and career opportunities. This funding is being sourced from the increased Queensland Government funding for state schools.
Total funding for this initiative is $4.6 million over five years. Further details can be found in the Department of Employment, Small Business and Training section of this chapter.
45
2019-20 Budget Measures
| | | | | | | | | | | | | | | | | | | | |
| | | 2018-19
$‘000 | | | 2019-20
$‘000 | | | 2020-21
$‘000 | | | 2021-22
$‘000 | | | 2022-23
$‘000 | |
Early Childhood Development Programs | | | — | | | | — | | | | — | | | | — | | | | — | |
The Government is providing increased funding of $63.6 million over four years from 2019-20 and $18.7 million per annum ongoing to continue the provision of early childhood development programs and services to support children aged 0 to 5 years with significant educational support needs.
| | | | | | | | | | | | | | | | | | | | |
| | | 2018-19
$‘000 | | | 2019-20
$‘000 | | | 2020-21
$‘000 | | | 2021-22
$‘000 | | | 2022-23
$‘000 | |
Link & Launch Program | | | — | | | | — | | | | — | | | | — | | | | — | |
The Government is providing additional funding of $8 million over four years from 2018-19 to assist disengaged Year 12 completers in areas of disadvantage to navigate their way back into education, training or employment. This funding is being sourced from the increased Queensland Government funding for state schools.
Total funding for this initiative is $9.6 million over four years from 2018-19. Further details can be found in the Department of Employment, Small Business and Training sector of this chapter.
| | | | | | | | | | | | | | | | | | | | |
| | | 2018-19
$‘000 | | | 2019-20
$‘000 | | | 2020-21
$‘000 | | | 2021-22
$‘000 | | | 2022-23
$‘000 | |
New Senior Assessment and Tertiary Entrance Arrangements | | | — | | | | — | | | | — | | | | — | | | | — | |
The Government will provide increased funding of $133.4 million over three years from 2020-21 and $45.1 million per annum ongoing to support new senior assessment and tertiary entrance arrangements. This funding is being sourced from the increased Queensland Government funding for state schools.
Funding of $34.2 million over three years from 2020-21 will also be met internally by the department to fund this measure, bringing total funding to $167.6 million over three years from 2020-21 and $56.6 million per annum ongoing.
46
2019-20 Budget Measures
| | | | | | | | | | | | | | | | | | | | |
| | | 2018-19
$‘000 | | | 2019-20
$‘000 | | | 2020-21
$‘000 | | | 2021-22
$‘000 | | | 2022-23
$‘000 | |
Regional Youth Engagement Hubs | | | — | | | | — | | | | — | | | | — | | | | — | |
The Government is providing additional funding of $11.2 million over four years from 2018-19 to expand the role played by Regional Youth Engagement Hubs to help young people who become disengaged from education to reconnect with education or training, or to gain employment. This funding is being sourced from the increased Queensland Government funding for state schools.
| | | | | | | | | | | | | | | | | | | | |
| | | 2018-19
$‘000 | | | 2019-20
$‘000 | | | 2020-21
$‘000 | | | 2021-22
$‘000 | | | 2022-23
$‘000 | |
Shifting Minds Suicide Prevention Flagship | | | — | | | | — | | | | — | | | | — | | | | — | |
The Government is providing additional funding of $10 million over four years from 2019-20 and $2.5 million per annum ongoing, for additional Guidance Officers and Mental Health Coaches in schools. This funding is being sourced from the increased Queensland Government funding for state schools.
This forms part of the Government’s total funding of $80.1 million over four years to support the Shifting Minds Suicide Prevention Flagship. Further details can be found in the Queensland Health and Department of Aboriginal and Torres Strait Islander Partnerships sections of this chapter.
| | | | | | | | | | | | | | | | | | | | |
| | | 2018-19
$‘000 | | | 2019-20
$‘000 | | | 2020-21
$‘000 | | | 2021-22
$‘000 | | | 2022-23
$‘000 | |
Youth FlexiSpaces in Schools | | | — | | | | — | | | | — | | | | — | | | | — | |
The Government is providing additional funding of $6.6 million over four years from 2018-19 to establish FlexiSpaces in up to 52 state schools across the State. FlexiSpaces will provide teaching and wellbeing support to keep at-risk young people in education. This funding is being sourced from the increased Queensland Government funding for state schools.
Total funding for this initiative is $16.6 million over four years from 2018-19. The capital component of this measure can be found in Chapter 3 Capital Measures.
47
2019-20 Budget Measures
Department of Employment, Small Business and Training
| | | | | | | | | | | | | | | | | | | | |
| | | 2018-19
$‘000 | | | 2019-20
$‘000 | | | 2020-21
$‘000 | | | 2021-22
$‘000 | | | 2022-23
$‘000 | |
Small Business Regulatory Reform | | | 4,773 | | | | 8,370 | | | | 6,282 | | | | 1,007 | | | | 767 | |
The Government is providing additional funding of $21.2 million over five years and $767,000 per annum ongoing to deliver the Queensland Business Launch Pad and a Vocational Education Training Consumer Support Program to make it easier for businesses to start, grow and employ.
This forms part of the Queensland and Australian Government’s Small Business Regulatory Reform Project Agreement to deliver projects that reduce the regulatory burden on small business. The projects undertaken as part of this Agreement will leverage $60.1 million in reward payments from the Australian Government upon successful completion of relevant project milestones. Further details can be found in the Department of Agriculture and Fisheries, Queensland Health and Department of Transport and Main Roads sections of this chapter.
| | | | | | | | | | | | | | | | | | | | |
| | | 2018-19
$‘000 | | | 2019-20
$‘000 | | | 2020-21
$‘000 | | | 2021-22
$‘000 | | | 2022-23
$‘000 | |
Advancing Small Business Queensland Strategy 2016-2020 | | | — | | | | 4,000 | | | | — | | | | — | | | | — | |
The Government is providing increased funding of $4 million in 2019-20 for additional grant funding under the Advancing Small Business Queensland Strategy 2016-2020, to continue making Queensland the place for small business to start, grow and employ.
| | | | | | | | | | | | | | | | | | | | |
| | | 2018-19
$‘000 | | | 2019-20
$‘000 | | | 2020-21
$‘000 | | | 2021-22
$‘000 | | | 2022-23
$‘000 | |
Micro-Credentialing Pilot | | | — | | | | 1,000 | | | | 3,000 | | | | 1,500 | | | | — | |
The Government is providing additional funding of $5.5 million over three years for the Micro-Credentialing Pilot to support industry led skills development designed to address emerging workforce skills requirements. The pilot will match industry skill needs with focused training for employees and include options to develop skills, skill sets or knowledge that is required by industry, professional associations, or the community. The focused training will help businesses more easily adopt innovations and improve productivity whilst supporting lifelong learning for employees.
48
2019-20 Budget Measures
| | | | | | | | | | | | | | | | | | | | |
| | | 2018-19
$‘000 | | | 2019-20
$‘000 | | | 2020-21
$‘000 | | | 2021-22
$‘000 | | | 2022-23
$‘000 | |
Back to Work program - South East Queensland | | | — | | | | — | | | | — | | | | — | | | | — | |
The Government is providing increased funding of up to $14 million over two years, held centrally, to meet continued demand for the Back to Work program in areas of South East Queensland with significant labour market challenges, with applications open until 30 June 2020.
| | | | | | | | | | | | | | | | | | | | |
| | | 2018-19
$‘000 | | | 2019-20
$‘000 | | | 2020-21
$‘000 | | | 2021-22
$‘000 | | | 2022-23
$‘000 | |
Digital Engagement Strategy | | | — | | | | — | | | | — | | | | — | | | | — | |
Funding of $2.3 million over four years from 2019-20 is being internally met by the department to improve online accessibility of vocational education and consumer training information for all young people.
Total funding for this initiative is $4.6 million over five years. Further details can be found in the Department of Education section of this chapter.
| | | | | | | | | | | | | | | | | | | | |
| | | 2018-19
$‘000 | | | 2019-20
$‘000 | | | 2020-21
$‘000 | | | 2021-22
$‘000 | | | 2022-23
$‘000 | |
Higher Level Apprenticeship Pilot | | | — | | | | — | | | | — | | | | — | | | | — | |
The Government is providing $300,000 over two years internally funded to establish a Higher Level Apprenticeship Pilot to provide opportunities to partner with industry to develop new pathways to layer specialised skills and knowledge with the traditional apprenticeship model.
| | | | | | | | | | | | | | | | | | | | |
| | | 2018-19
$‘000 | | | 2019-20
$‘000 | | | 2020-21
$‘000 | | | 2021-22
$‘000 | | | 2022-23
$‘000 | |
Link & Launch Program | | | — | | | | — | | | | — | | | | — | | | | — | |
The Government is providing $1.6 million over three years from 2019-20 internally funded to trial two community site pilots to assist disengaged Year 12 completers in areas of disadvantage to navigate their way back into education, training or employment.
Total funding for this initiative is $9.6 million over four years from 2018-19. Further details can be found in the Department of Education section of this chapter.
49
2019-20 Budget Measures
| | | | | | | | | | | | | | | | | | | | |
| | | 2018-19
$‘000 | | | 2019-20
$‘000 | | | 2020-21
$‘000 | | | 2021-22
$‘000 | | | 2022-23
$‘000 | |
Queensland Social Enterprise Strategy | | | — | | | | — | | | | — | | | | — | | | | — | |
The Government is providing $1 million in 2019-20 internally funded for the Queensland Social Enterprise Strategy to support the further development and growth of the social enterprise sector in Queensland to create jobs, support inclusive and diverse workforce participation and deliver social impact outcomes.
50
2019-20 Budget Measures
Department of Environment and Science
| | | | | | | | | | | | | | | | | | | | |
| | | 2018-19
$‘000 | | | 2019-20
$‘000 | | | 2020-21
$‘000 | | | 2021-22
$‘000 | | | 2022-23
$‘000 | |
Cape York Peninsula Tenure Resolution Program and National Park Joint Management with Traditional Owners | | | — | | | | 6,985 | | | | 4,152 | | | | 2,940 | | | | 975 | |
The Government is providing increased funding of $ 15.1 million over four years and $975,000 per annum ongoing for the continuation of the Cape York Tenure Resolution program. The funding provides for the return of lands to Traditional Owners and the employment of Indigenous Rangers to manage country in Cape York and National Parks. The capital component of this measure can be found in Chapter 3 Capital Measures.
| | | | | | | | | | | | | | | | | | | | |
| | | 2018-19
$‘000 | | | 2019-20
$‘000 | | | 2020-21
$‘000 | | | 2021-22
$‘000 | | | 2022-23
$‘000 | |
Hopeland (Linc Energy) - Ongoing Matters | | | — | | | | 5,414 | | | | 3,479 | | | | — | | | | — | |
The Government is providing increased funding of $8.9 million over two years to support environmental monitoring of land impacted by underground coal gasification by-products; and the ongoing prosecution of Linc Energy and its former directors for alleged serious environmental harm.
| | | | | | | | | | | | | | | | | | | | |
| | | 2018-19
$‘000 | | | 2019-20
$‘000 | | | 2020-21
$‘000 | | | 2021-22
$‘000 | | | 2022-23
$‘000 | |
Queensland Government Research Infrastructure Co-Investment Fund | | | — | | | | 5,000 | | | | 7,500 | | | | 7,500 | | | | 5,000 | |
The Government is providing additional funding of $25 million over four years to the Queensland Government Research Infrastructure Co-Investment Fund to support investment in scientific research and development in Queensland.
51
2019-20 Budget Measures
| | | | | | | | | | | | | | | | | | | | |
| | | 2018-19
$‘000 | | | 2019-20
$‘000 | | | 2020-21
$‘000 | | | 2021-22
$‘000 | | | 2022-23
$‘000 | |
World Science Festival 2019 to 2021 | | | 3,000 | | | | 3,000 | | | | 3,000 | | | | — | | | | — | |
The Government is providing increased funding of $ 9 million over three years for the continued delivery of the World Science Festival. The program will continue to build upon the success of the past three years, promote year-round engagement, leverage new and additional programming opportunities and continue extension of the Festival in Brisbane and across regional Queensland.
| | | | | | | | | | | | | | | | | | | | |
| | | 2018-19
$‘000 | | | 2019-20
$‘000 | | | 2020-21
$‘000 | | | 2021-22
$‘000 | | | 2022-23
$‘000 | |
Yellow Crazy Ant Control | | | — | | | | 3,000 | | | | 3,000 | | | | 3,000 | | | | — | |
The Government is providing increased funding of $9 million over three years for control of yellow crazy ants, which is anticipated to be matched by the Australian Government. This funding will be directed to the Wet Tropics Management Authority to support local eradication of yellow crazy ants in the Wet Tropics World Heritage Area and adjacent areas.
| | | | | | | | | | | | | | | | | | | | |
| | | 2018-19
$‘000 | | | 2019-20
$‘000 | | | 2020-21
$‘000 | | | 2021-22
$‘000 | | | 2022-23
$‘000 | |
Wildlife Management - Crocodiles | | | — | | | | 2,952 | | | | 3,026 | | | | — | | | | — | |
The Government is providing increased funding of $6 million over two years to provide continued management of problem crocodiles, supported by robust scientific research and evaluation of current control methods.
| | | | | | | | | | | | | | | | | | | | |
| | | 2018-19
$‘000 | | | 2019-20
$‘000 | | | 2020-21
$‘000 | | | 2021-22
$‘000 | | | 2022-23
$‘000 | |
Queensland Museum - Critical Maintenance and Infrastructure Works | | | — | | | | 2,875 | | | | 1,875 | | | | 875 | | | | 875 | |
The Government is providing additional funding of $6.5 million over four years to replace/upgrade the research and biodiversity collection storage at the Queensland Museum. The capital component of this measure can be found in Chapter 3 Capital Measures.
52
2019-20 Budget Measures
| | | | | | | | | | | | | | | | | | | | |
| | | 2018-19
$‘000 | | | 2019-20
$‘000 | | | 2020-21
$‘000 | | | 2021-22
$‘000 | | | 2022-23
$‘000 | |
Revitalising National Parks | | | — | | | | 2,500 | | | | — | | | | — | | | | — | |
The Government is providing increased funding of $2.5 million in 2019-20 towards service and infrastructure programs that will enhance the management of the State’s national parks and support nature based and cultural tourism opportunities to maintain the breadth and quality of visitor experiences. The capital component of this measure can be found in Chapter 3 Capital Measures.
| | | | | | | | | | | | | | | | | | | | |
| | | 2018-19
$‘000 | | | 2019-20
$‘000 | | | 2020-21
$‘000 | | | 2021-22
$‘000 | | | 2022-23
$‘000 | |
Queensland Art Gallery Blockbuster Exhibition Funding | | | — | | | | 2,250 | | | | 1,750 | | | | — | | | | — | |
The Government is providing increased funding of $4 million over two years to secure blockbuster exhibitions that are exclusive to Brisbane. Blockbuster exhibitions will continue to build Queensland Art Gallery’s reputation as a globally significant visual arts institution.
| | | | | | | | | | | | | | | | | | | | |
| | | 2018-19
$‘000 | | | 2019-20
$‘000 | | | 2020-21
$‘000 | | | 2021-22
$‘000 | | | 2022-23
$‘000 | |
Queensland Parks and Wildlife Service - Enhanced Fire Management | | | — | | | | 1,800 | | | | 2,300 | | | | 2,500 | | | | 2,600 | |
The Government is providing increased funding of $9.2 million over four years and $2.6 million per annum ongoing, to provide improved capability for the Queensland Parks and Wildlife Service to reduce risk to life, property and biodiversity from bushfires. The capital component of this measure can be found in Chapter 3 Capital Measures.
| | | | | | | | | | | | | | | | | | | | |
| | | 2018-19
$‘000 | | | 2019-20
$‘000 | | | 2020-21
$‘000 | | | 2021-22
$‘000 | | | 2022-23
$‘000 | |
Aboriginal and Torres Strait Islander Cultural Centre | | | — | | | | 1,600 | | | | 400 | | | | — | | | | — | |
The Government is providing additional funding of $2 million over two years to develop an options assessment for an Aboriginal and Torres Strait Islander Cultural Centre to celebrate and showcase the unique artistry and cultural heritage of Australia’s First Nations Peoples.
53
2019-20 Budget Measures
| | | | | | | | | | | | | | | | | | | | |
| | | 2018-19
$‘000 | | | 2019-20
$‘000 | | | 2020-21
$‘000 | | | 2021-22
$‘000 | | | 2022-23
$‘000 | |
North Stradbroke Island (Minjerribah) Townships Fire Management Strategies by the Quandamooka Yoolooburrabee Aboriginal Corporation | | | — | | | | 1,387 | | | | 2,202 | | | | 3,130 | | | | 1,799 | |
The Government is providing increased funding of $8.5 million over four years for First Nations Peoples to implement the North Stradbroke Island (Minjerribah) Townships Fire Management Strategies to reduce risk to life, property and cultural landscapes from bushfire around the townships of Dunwich, Amity Point and Point Lookout.
| | | | | | | | | | | | | | | | | | | | |
| | | 2018-19
$‘000 | | | 2019-20
$‘000 | | | 2020-21
$‘000 | | | 2021-22
$‘000 | | | 2022-23
$‘000 | |
National Parks Harsh Environment Fire Vehicles | | | — | | | | 805 | | | | — | | | | — | | | | — | |
The Government is providing increased funding of $805,000 in 2019-20 towards the operation of vehicles in harsh environments in Queensland’s Protected Area Estate, to ensure continued safety of staff, property and the community. The capital component of this measure can be found in Chapter 3 Capital Measures.
| | | | | | | | | | | | | | | | | | | | |
| | | 2018-19
$‘000 | | | 2019-20
$‘000 | | | 2020-21
$‘000 | | | 2021-22
$‘000 | | | 2022-23
$‘000 | |
Saving Queensland’s Threatened Species - Koalas | | | — | | | | 729 | | | | — | | | | — | | | | — | |
The Government is providing increased funding of $729,000 in 2019-20 for continued support to the Daisy Hill Koala Centre, Moggill Koala Rehabilitation Centre and RSPCA Wildlife Hotline Service to provide care for sick and injured wildlife. The capital component of this measure can be found in Chapter 3 Capital Measures.
54
2019-20 Budget Measures
| | | | | | | | | | | | | | | | | | | | |
| | | 2018-19
$‘000 | | | 2019-20
$‘000 | | | 2020-21
$‘000 | | | 2021-22
$‘000 | | | 2022-23
$‘000 | |
Implementing Waste Reforms for Queensland under a New Waste Management and Resource Recovery Strategy | | | — | | | | 600 | | | | 400 | | | | — | | | | — | |
The Government is providing an additional $1 million over two years to deliver a waste management data strategy for Queensland. The strategy will improve collection and analysis of waste generation and management in Queensland. Further details can be found in the Department of Local Government, Racing and Multicultural Affairs section of this chapter.
| | | | | | | | | | | | | | | | | | | | |
| | | 2018-19
$‘000 | | | 2019-20
$‘000 | | | 2020-21
$‘000 | | | 2021-22
$‘000 | | | 2022-23
$‘000 | |
Financial Assurance and Rehabilitation Complementary Reform Measures | | | — | | | | 550 | | | | 300 | | | | 150 | | | | — | |
The Government is providing increased funding of $1 million over three years to deliver enhancements to the financial assurance and land rehabilitation regulatory framework. These enhancements will ensure that the impacts of resource and extractive activities are managed sustainably.
| | | | | | | | | | | | | | | | | | | | |
| | | 2018-19
$‘000 | | | 2019-20
$‘000 | | | 2020-21
$‘000 | | | 2021-22
$‘000 | | | 2022-23
$‘000 | |
Queensland Cultural Centre - Critical Infrastructure Asset Renewal | | | — | | | | 450 | | | | 450 | | | | — | | | | — | |
The Government is providing increased funding of $900,000 over two years to continue the renewal of the Central Energy Plant at the Queensland Cultural Centre. The capital component of this measure can be found in Chapter 3 Capital Measures.
55
2019-20 Budget Measures
| | | | | | | | | | | | | | | | | | | | |
| | | 2018-19
$‘000 | | | 2019-20
$‘000 | | | 2020-21
$‘000 | | | 2021-22
$‘000 | | | 2022-23
$‘000 | |
Quandamooka World Heritage Nomination | | | 273 | | | | 308 | | | | 362 | | | | 307 | | | | — | |
The Government is providing an additional $1.3 million over four years to progress the nomination of Quandamooka Country on North Stradbroke Island (Minjerribah) as a World Heritage Area. The nomination will enhance eco-tourism opportunities and preserve environmental values of the island.
| | | | | | | | | | | | | | | | | | | | |
| | | 2018-19
$‘000 | | | 2019-20
$‘000 | | | 2020-21
$‘000 | | | 2021-22
$‘000 | | | 2022-23
$‘000 | |
Accelerating Science Delivery Innovation - Tranche 2 | | | — | | | | — | | | | — | | | | — | | | | — | |
Funding of $15 million over five years is being internally met by the department to fund Tranche 2 of the Accelerating Science Delivery Innovation Program. Tranche 2 will pursue enhancements in artificial intelligence, machine learning, mobile computing and big data.
This forms part of the Government’s total investment of $18.3 million since 2017 into enhancing science-based management of the Queensland environment. The capital component of this measure can be found in Chapter 3 Capital Measures.
| | | | | | | | | | | | | | | | | | | | |
| | | 2018-19
$‘000 | | | 2019-20
$‘000 | | | 2020-21
$‘000 | | | 2021-22
$‘000 | | | 2022-23
$‘000 | |
North Stradbroke Island (Minjerribah) Protected Area Estate Expansion and Construction of Ranger Base | | | — | | | | — | | | | — | | | | — | | | | — | |
The Government is providing increased funding of $3.2 million over four years to support the construction and operation of a permanent ranger base on North Stradbroke Island (Minjerribah). The ranger base will support Traditional Owner employed rangers and Queensland Parks and Wildlife Service rangers. Funding is to be held centrally until the final cost of the Stage B additions and permanent ranger base are known. The capital component of this measure is provided in Chapter 3 Capital Measures.
56
2019-20 Budget Measures
| | | | | | | | | | | | | | | | | | | | |
| | | 2018-19
$‘000 | | | 2019-20
$‘000 | | | 2020-21
$‘000 | | | 2021-22
$‘000 | | | 2022-23
$‘000 | |
Strategic Science Programs and International Partnerships | | | — | | | | — | | | | — | | | | — | | | | — | |
The Government is providing $6.4 million over four years, internally funded, to maintain support for engaging Queenslanders in science and international science partnerships.
| | | | | | | | | | | | | | | | | | | | |
| | | 2018-19
$‘000 | | | 2019-20
$‘000 | | | 2020-21
$‘000 | | | 2021-22
$‘000 | | | 2022-23
$‘000 | |
Wangetti Trail | | | — | | | | — | | | | — | | | | — | | | | — | |
Expenses of $2 million per year from 2022-23, incurred in operations and maintenance for the Wangetti Trail, will be met by the department using revenue from lease payments from the trail operator and camping fees.
Further details can be found in the Department of Innovation, Tourism, Industry Development and the Commonwealth Games section of this chapter, the Department of Innovation, Tourism, Industry Development and the Commonwealth Games section of Chapter 3 Capital Measures and the Department of Environment and Science section of Chapter 4 Revenue Measures.
57
2019-20 Budget Measures
Department of Housing and Public Works
| | | | | | | | | | | | | | | | | | | | |
| | | 2018-19
$‘000 | | | 2019-20
$‘000 | | | 2020-21
$‘000 | | | 2021-22
$‘000 | | | 2022-23
$‘000 | |
Responsive Government | | | — | | | | 9,600 | | | | 7,750 | | | | 7,900 | | | | 8,050 | |
The Government is providing increased funding of $33.3 million over four years and $8.1 million per annum ongoing to improve experiences on-line through the Government’s services channels, to build more customer focused approaches and evaluate progress.
The Government is also providing increased funding of $32.2 million over four years, held centrally, to develop single sign-on capability for customers accessing Government services online.
Total Responsive Government funding of $65.5 million over four years will enhance digital technology and service design capabilities to make services better for Queenslanders.
| | | | | | | | | | | | | | | | | | | | |
| | | 2018-19
$‘000 | | | 2019-20
$‘000 | | | 2020-21
$‘000 | | | 2021-22
$‘000 | | | 2022-23
$‘000 | |
Government Employee Housing - Critical Works | | | — | | | | 7,200 | | | | — | | | | — | | | | — | |
The Government is providing increased funding of $7.2 million in 2019-20 for urgent maintenance to continue to ensure security and health and safety for employees in government housing. The capital component of this measure can be found in Chapter 3 Capital Measures.
| | | | | | | | | | | | | | | | | | | | |
| | | 2018-19
$‘000 | | | 2019-20
$‘000 | | | 2020-21
$‘000 | | | 2021-22
$‘000 | | | 2022-23
$‘000 | |
Cyber Security - Securing trust in a Responsive Government | | | — | | | | 4,278 | | | | 4,757 | | | | 5,269 | | | | 6,038 | |
The Government is providing increased funding of $20.3 million over four years and $1.3 million per annum ongoing for the Queensland Government Chief Information Office to continue the Cyber Security Unit’s operations.
58
2019-20 Budget Measures
| | | | | | | | | | | | | | | | | | | | |
| | | 2018-19
$‘000 | | | 2019-20
$‘000 | | | 2020-21
$‘000 | | | 2021-22
$‘000 | | | 2022-23
$‘000 | |
North Queensland Stadium | | | — | | | | 3,500 | | | | 3,500 | | | | 3,500 | | | | 3,500 | |
The Government is providing additional funding of $14 million over four years and $3.5 million per annum ongoing to meet the operating costs of the North Queensland Stadium. The capital component of this measure can be found in Chapter 3 Capital Measures.
| | | | | | | | | | | | | | | | | | | | |
| | | 2018-19
$‘000 | | | 2019-20
$‘000 | | | 2020-21
$‘000 | | | 2021-22
$‘000 | | | 2022-23
$‘000 | |
Queensland Building and Construction Commission Financial Sustainability Review | | | 5,260 | | | | 2,975 | | | | — | | | | — | | | | — | |
The Government has provided additional funding of $5.3 million in 2018-19 for the Queensland Building and Construction Commission (QBCC), including $4.3 million to address operational activities and $922,000 to implement Minimum Financial Requirements reforms.
The Government is also providing additional funding of $3 million in 2019-20 for the QBCC to commence development of the Insights Driven Regulator program.
The Government is also providing additional funding of up to $15.7 million in 2019-20 and $15 million in 2020-21, held centrally, to assist the QBCC to implement building and construction industry reforms.
| | | | | | | | | | | | | | | | | | | | |
| | | 2018-19
$‘000 | | | 2019-20
$‘000 | | | 2020-21
$‘000 | | | 2021-22
$‘000 | | | 2022-23
$‘000 | |
Sport and Active Recreation Strategy 2019-2029 | | | — | | | | 2,000 | | | | 10,000 | | | | 5,000 | | | | 8,000 | |
The Government is providing additional funding of $25 million over four years to fund initiatives under the Sport and Active Recreation Strategy 2019-2029. This will include $10 million for Female Facilities infrastructure projects (with a further $10 million to be internally met). Funding of $267.5 million over four years has been internally met by the department, bringing the total funding for the Strategy to $292.5 million over four years.
The Strategy will address system-wide reform required to deliver both community benefit and achieve Advancing Queensland’s Priorities targets.
59
2019-20 Budget Measures
| | | | | | | | | | | | | | | | | | | | |
| | | 2018-19
$‘000 | | | 2019-20
$‘000 | | | 2020-21
$‘000 | | | 2021-22
$‘000 | | | 2022-23
$‘000 | |
Stadiums Queensland Capital Grant Increase | | | — | | | | 250 | | | | 506 | | | | 769 | | | | 1,038 | |
The Government is providing increased funding of $2.6 million over four years for stadium maintenance and capital improvements with ongoing indexed annual provisions set at the rate of the consumer price index.
| | | | | | | | | | | | | | | | | | | | |
| | | 2018-19
$‘000 | | | 2019-20
$‘000 | | | 2020-21
$‘000 | | | 2021-22
$‘000 | | | 2022-23
$‘000 | |
National Redress Scheme | | | 105 | | | | 132 | | | | 135 | | | | 138 | | | | — | |
The Government is providing additional funding of $510,000 over four years for Queensland State Archives to identify, digitise and provide access to relevant records needed to assess redress applications to support participation in the National Redress Scheme for survivors of institutional child sexual abuse.
Further details can be found in the Department of Child Safety, Youth and Women, the Department of Justice and Attorney-General and the Department of Communities, Disability Services and Seniors sections of this chapter.
| | | | | | | | | | | | | | | | | | | | |
| | | 2018-19
$‘000 | | | 2019-20
$‘000 | | | 2020-21
$‘000 | | | 2021-22
$‘000 | | | 2022-23
$‘000 | |
Aboriginal and Torres Strait Islander Housing Action Plan 2019-2023 | | | — | | | | — | | | | — | | | | — | | | | — | |
Funding of $17 million over four years is being internally met by the department to fund initiatives under the Aboriginal and Torres Strait Islander Housing Action Plan 2019-2023, taking the total funding for the Action Plan to $67.1 million over four years.
| | | | | | | | | | | | | | | | | | | | |
| | | 2018-19
$‘000 | | | 2019-20
$‘000 | | | 2020-21
$‘000 | | | 2021-22
$‘000 | | | 2022-23
$‘000 | |
Queensland Government Data Centres and Services | | | — | | | | — | | | | — | | | | — | | | | — | |
The Government is providing additional funding of $11.3 million over four years, held centrally, to support the delivery of a new, secure model of data centre service delivery for Queensland Government agencies. The capital component of this measure can be found in Chapter 3 Capital Measures.
60
2019-20 Budget Measures
| | | | | | | | | | | | | | | | | | | | |
| | | 2018-19
$‘000 | | | 2019-20
$‘000 | | | 2020-21
$‘000 | | | 2021-22
$‘000 | | | 2022-23
$‘000 | |
Queensland Government Office Accommodation Strategy - Regional Initiatives | | | | | | | | | | | | | | | | | | | | |
Funding of $2 million is being internally funded by the department in 2019-20 for urgent maintenance on Queensland Government office accommodation in Mount Isa.
61
2019-20 Budget Measures
Department of Innovation, Tourism Industry Development and the Commonwealth Games
| | | | | | | | | | | | | | | | | | | | |
| | | 2018-19
$‘000 | | | 2019-20
$‘000 | | | 2020-21
$‘000 | | | 2021-22
$‘000 | | | 2022-23
$‘000 | |
Global Tourism Hubs and Ecotourism Trails | | | — | | | | 5,333 | | | | 8,570 | | | | — | | | | — | |
The Government is providing additional funding of $13.9 million over two years and funding of $7.5 million is being internally met by the department to progress market approaches for the Cairns and Gold Coast Global Tourism Hub procurement processes, for the contract management of the Queens Wharf Brisbane Integrated Resort Development and for the progression of the Thorsborne, Cooloola and Whitsunday Ecotourism Trails Program.
| | | | | | | | | | | | | | | | | | | | |
| | | 2018-19
$‘000 | | | 2019-20
$‘000 | | | 2020-21
$‘000 | | | 2021-22
$‘000 | | | 2022-23
$‘000 | |
FibreCo Qld | | | 4,730 | | | | 3,870 | | | | — | | | | — | | | | — | |
Delivering on our election commitments, the Government is providing additional funding of $8.6 million over two years to make high speed and low cost internet available to regional Queensland. FibreCo Qld will use existing Government infrastructure by unlocking spare capacity in Government-owned fibre networks to improve regional Queenslanders’ ability to access digital capability.
| | | | | | | | | | | | | | | | | | | | |
| | | 2018-19
$‘000 | | | 2019-20
$‘000 | | | 2020-21
$‘000 | | | 2021-22
$‘000 | | | 2022-23
$‘000 | |
Creating Indigenous jobs and business growth through Indigenous tourism development in Queensland | | | — | | | | 2,000 | | | | 1,200 | | | | — | | | | — | |
The Government is providing additional funding of $2 million over two years to introduce a new grant fund to support the development of new Indigenous tourism products and experiences, with a focus on ecotourism.
The Government is also providing additional funding of $1.2 million over two years to support targeted initiatives to develop indigenous tourism in Queensland and $298,000 is being internally met by the department to establish an Indigenous Tourism Development Service for Indigenous tourism businesses, to guide prospective businesses toward the most appropriate Government and industry services and support for their business needs.
62
2019-20 Budget Measures
| | | | | | | | | | | | | | | | | | | | |
| | | 2018-19
$‘000 | | | 2019-20
$‘000 | | | 2020-21
$‘000 | | | 2021-22
$‘000 | | | 2022-23
$‘000 | |
Improving Swimmer Safety including the Shark Control Program | | | — | | | | 200 | | | | 200 | | | | 200 | | | | 200 | |
The Government is providing additional funding of $800,000 over four years and $ 200,000 per annum ongoing for the development of swimmer safety education and awareness programs to educate tourism businesses and visitors on how to swim safely in Queensland’s oceans, rivers and canals.
This forms part of the Government’s total funding package of $18.7 million over four years and $4.8 million per annum ongoing to improve swimmer safety. Further details can be found in the Department of Agriculture and Fisheries and Queensland Fire and Emergency Services sections of this chapter.
| | | | | | | | | | | | | | | | | | | | |
| | | 2018-19
$‘000 | | | 2019-20
$‘000 | | | 2020-21
$‘000 | | | 2021-22
$‘000 | | | 2022-23
$‘000 | |
Wangetti Trail | | | — | | | | 200 | | | | 1,800 | | | | 1,100 | | | | 100 | |
The Government is providing additional funding of $3.2 million over four years, together with the department internally funding $5.7 million over three years, to continue the development of the Wangetti Trail as a high quality ecotourism experience for Far North Queensland.
The trail will be a 94 kilometre dual use walking and mountain biking track through the Tropical North Queensland coast and hinterland from Port Douglas to Palm Cove, and will become an iconic international ecotourism experience with direct economic benefits to regional Queensland and local First Nations Peoples.
Further details can be found in the Department of Environment and Science section of this chapter, the Department of Innovation, Tourism Industry Development and the Commonwealth Games section of Chapter 3 Capital Measures and the Department of Environment and Science section of Chapter 4 Revenue Measures.
| | | | | | | | | | | | | | | | | | | | |
| | | 2018-19
$‘000 | | | 2019-20
$‘000 | | | 2020-21
$‘000 | | | 2021-22
$‘000 | | | 2022-23
$‘000 | |
Gold Coast Family Campaign | | | 1,000 | | | | — | | | | — | | | | — | | | | — | |
The Government has provided additional funding of $1 million in 2018-19 in partnership with the local tourism industry, to position the Gold Coast as a must-visit for families from the key visitor markets of Sydney, Melbourne and Brisbane. The $2.5 million media campaign will showcase the Gold Coast as Australia’s holiday playground and reiterates the Government’s ongoing commitment to the tourism industry.
63
2019-20 Budget Measures
| | | | | | | | | | | | | | | | | | | | |
| | | 2018-19
$‘000 | | | 2019-20
$‘000 | | | 2020-21
$‘000 | | | 2021-22
$‘000 | | | 2022-23
$‘000 | |
Tourism and Events Queensland | | | — | | | | — | | | | — | | | | — | | | | 48,181 | |
The Government will provide increased funding of $48.2 million for 2022-23 to support Tourism and Events Queensland’s activity in priority domestic and internal source markets to grow Queensland’s market share of the visitor economy. This additional funding will continue the momentum in the growth of Queensland’s tourism industry, to achieve economic growth and support job creation.
64
2019-20 Budget Measures
Department of Justice and Attorney-General
| | | | | | | | | | | | | | | | | | | | |
| | | 2018-19
$‘000 | | | 2019-20
$‘000 | | | 2020-21
$‘000 | | | 2021-22
$‘000 | | | 2022-23
$‘000 | |
Court Services Queensland | | | — | | | | 14,238 | | | | 14,296 | | | | 14,487 | | | | 14,705 | |
The Government is providing increased funding of $57.7 million over four years and $14.7 million per annum ongoing to respond to increased demand in Queensland Courts.
| | | | | | | | | | | | | | | | | | | | |
| | | 2018-19
$‘000 | | | 2019-20
$‘000 | | | 2020-21
$‘000 | | | 2021-22
$‘000 | | | 2022-23
$‘000 | |
Family Support and Child Protection Reforms - Director of Child Protection Litigation | | | — | | | | 13,524 | | | | — | | | | — | | | | — | |
The Government is providing increased funding of $13.5 million in 2019-20 for child protection litigation services. This funding will support the management of child protection order applications and proceedings by the Director of Child Protection Litigation, including working with the Office of the Child and Family Official Solicitor.
This forms part of the Government’s total funding package of $517.5 million ($401.6 million new funding and $115.9 million internally funded) over four years to continue Queensland’s family support and child protection reforms. Further details can be found in the Department of Child Safety, Youth and Women and the Department of Education sections of this chapter.
| | | | | | | | | | | | | | | | | | | | |
| | | 2018-19
$‘000 | | | 2019-20
$‘000 | | | 2020-21
$‘000 | | | 2021-22
$‘000 | | | 2022-23
$‘000 | |
Office of the Director of Public Prosecutions | | | — | | | | 7,298 | | | | 11,570 | | | | 11,841 | | | | 12,121 | |
The Government is providing increased funding of $42.8 million over four years and $12.1 million per annum ongoing to respond to increased workloads within the Office of the Director of Public Prosecutions.
65
2019-20 Budget Measures
| | | | | | | | | | | | | | | | | | | | |
| | | 2018-19
$‘000 | | | 2019-20
$‘000 | | | 2020-21
$‘000 | | | 2021-22
$‘000 | | | 2022-23
$‘000 | |
Office of the Public Guardian | | | 734 | | | | 4,478 | | | | 5,809 | | | | 7,000 | | | | 9,000 | |
The Government is providing additional funding of $27 million over five years and $9 million per annum ongoing for the Office of the Public Guardian to respond to increased workloads and continue to deliver protection to children in care and vulnerable adults. The capital component of this measure can be found in Chapter 3 Capital Measures.
| | | | | | | | | | | | | | | | | | | | |
| | | 2018-19
$‘000 | | | 2019-20
$‘000 | | | 2020-21
$‘000 | | | 2021-22
$‘000 | | | 2022-23
$‘000 | |
Crown Law Legal Expenses | | | — | | | | 4,153 | | | | 4,247 | | | | 4,368 | | | | 4,493 | |
The Government is providing additional funding of $17.3 million over four years and $4.5 million per annum ongoing for Crown Law to provide services to the Attorney-General, as Government’s chief legal adviser, with respect to administering the Dangerous Prisoners (Sexual Offenders) Act 2003 and representing the Attorney-General at the Mental Health Review Tribunal.
| | | | | | | | | | | | | | | | | | | | |
| | | 2018-19
$‘000 | | | 2019-20
$‘000 | | | 2020-21
$‘000 | | | 2021-22
$‘000 | | | 2022-23
$‘000 | |
Queensland Civil and Administrative Tribunal | | | 340 | | | | 3,252 | | | | 3,288 | | | | 3,327 | | | | 2,885 | |
The Government is providing additional funding of $13.1 million over five years and $2.9 million per annum ongoing to respond to frontline demand pressures, support the introduction of Lemon Laws legislation and sessional members’ remuneration.
| | | | | | | | | | | | | | | | | | | | |
| | | 2018-19
$‘000 | | | 2019-20
$‘000 | | | 2020-21
$‘000 | | | 2021-22
$‘000 | | | 2022-23
$‘000 | |
Family Support and Child Protection Reforms - Queensland Family and Child Commission | | | — | | | | 3,070 | | | | 3,147 | | | | 3,482 | | | | — | |
The Government is providing increased funding of $9.7 million over three years for the Queensland Family and Child Commission to continue research, evaluation and awareness initiatives.
This forms part of the Government’s total funding package of $517.5 million ($401.6 million new funding and $115.9 million internally funded) over four years to continue Queensland’s family support and child protection reforms. Further details can be found in the Department of Child Safety, Youth and Women and the Department of Education sections of this chapter.
66
2019-20 Budget Measures
| | | | | | | | | | | | | | | | | | | | |
| | | 2018-19
$‘000 | | | 2019-20
$‘000 | | | 2020-21
$‘000 | | | 2021-22
$‘000 | | | 2022-23
$‘000 | |
Community Justice Groups Enhancement | | | — | | | | 2,774 | | | | 5,377 | | | | 5,577 | | | | 5,377 | |
The Government is providing additional funding of $19.1 million over four years and $5.4 million per annum ongoing to expand Community Justice Groups, targeted at areas of greatest need. The capital component of this measure can be found in Chapter 3 Capital Measures.
| | | | | | | | | | | | | | | | | | | | |
| | | 2018-19
$‘000 | | | 2019-20
$‘000 | | | 2020-21
$‘000 | | | 2021-22
$‘000 | | | 2022-23
$‘000 | |
Support for people with disability - Office of the Public Guardian and Queensland Civil and Administrative Tribunal | | | — | | | | 2,563 | | | | 2,627 | | | | 2,692 | | | | 2,760 | |
The Government is providing increased funding of $10.6 million over four years and $2.8 million ongoing for the Office of the Public Guardian and the Queensland Civil and Administrative Tribunal to address increased workload and demand pressures related to the rollout of the National Disability Insurance Scheme.
This funding is part of the total of $62.7 million over four years provided by the Queensland Government to continue state services to meet obligations under State legislation and ensure continuity of support for people with disability in Queensland. Further details can be found in the Department of Communities, Disability Services and Seniors and Queensland Health sections of this chapter.
| | | | | | | | | | | | | | | | | | | | |
| | | 2018-19
$‘000 | | | 2019-20
$‘000 | | | 2020-21
$‘000 | | | 2021-22
$‘000 | | | 2022-23
$‘000 | |
Supreme and District Court | | | 1,821 | | | | 2,447 | | | | 2,484 | | | | 2,521 | | | | 2,521 | |
The Government is providing additional funding of $11.8 million over five years and $2.5 million per annum ongoing for additional judicial officers and support staff for the Supreme and District Courts.
67
2019-20 Budget Measures
| | | | | | | | | | | | | | | | | | | | |
| | | 2018-19
$‘000 | | | 2019-20
$‘000 | | | 2020-21
$‘000 | | | 2021-22
$‘000 | | | 2022-23
$‘000 | |
Information, Communication and Technology Strategy | | | 4,158 | | | | 2,321 | | | | — | | | | 1,770 | | | | 1,623 | |
The Government is providing additional funding of $9.9 million over five years and $1.6 million per annum ongoing to commence implementation of the Information, Communication and Technology Strategy.
The Government is also providing additional funding of $38 million over two years from 2019-20 to be held centrally.
| | | | | | | | | | | | | | | | | | | | |
| | | 2018-19
$‘000 | | | 2019-20
$‘000 | | | 2020-21
$‘000 | | | 2021-22
$‘000 | | | 2022-23
$‘000 | |
Victims Assist Queensland | | | — | | | | 2,300 | | | | 5,000 | | | | 4,000 | | | | 4,000 | |
The Government is providing increased funding of $15.3 million over four years and $4 million per annum ongoing to provide financial support to victims of crime. This includes $1 million per annum over two years from 2019-20 to assist with the processing of claims and backlogs.
| | | | | | | | | | | | | | | | | | | | |
| | | 2018-19
$‘000 | | | 2019-20
$‘000 | | | 2020-21
$‘000 | | | 2021-22
$‘000 | | | 2022-23
$‘000 | |
Tackling Alcohol Fuelled Violence Program - Safe Night Precincts | | | — | | | | 2,093 | | | | — | | | | — | | | | — | |
The Government is providing increased funding of $2.1 million in 2019-20 to continue inspections of licensed venues during peak trading periods and to monitor the industry’s progress on implementing the Tackling Alcohol Fuelled Violence policy.
This forms part of the Government’s overall package of $6.6 million to continue the Tackling Alcohol Fuelled Violence Program in 2019-20. Further details can be found in the Queensland Corrective Services and Department of Communities, Disability Services and Seniors sections of this chapter.
68
2019-20 Budget Measures
| | | | | | | | | | | | | | | | | | | | |
| | | 2018-19
$‘000 | | | 2019-20
$‘000 | | | 2020-21
$‘000 | | | 2021-22
$‘000 | | | 2022-23
$‘000 | |
Youth Justice Investment - Additional Childrens Court Matters | | | 327 | | | | 1,966 | | | | — | | | | — | | | | — | |
The Government is providing additional funding of $2.3 million over two years to continue an additional specialist Childrens Court magistrate, support staff, security and legal advocates to increase cases heard in the Childrens Court.
This forms part of the total investment of $2.6 million over two years in additional Childrens Court matters. Further details of this funding can be found in the Queensland Police Service section of this chapter.
This contributes to the whole-of-government investment for a suite of youth justice infrastructure and non-infrastructure initiatives of $154.5 million operating (including $143.1 million new funding and $11.4 million to be funded internally) and $178 million capital (including $140 million held centrally for estimated project costs) over five years. Details on the Youth Justice Investment measures can be found in the Department of Youth Justice, Department of Child Safety, Youth and Women, Department of Education, Queensland Health, Queensland Police Service and Department of Justice and Attorney-General sections of this chapter, and the Department of Youth Justice section of Chapter 3 Capital Measures.
| | | | | | | | | | | | | | | | | | | | |
| | | 2018-19
$‘000 | | | 2019-20
$‘000 | | | 2020-21
$‘000 | | | 2021-22
$‘000 | | | 2022-23
$‘000 | |
Courthouse Maintenance and Upgrades | | | — | | | | 1,925 | | | | 1,925 | | | | — | | | | — | |
The Government is providing additional funding of $3.9 million over two years for priority maintenance projects at various Queensland courthouses. The capital component of this measure can be found in Chapter 3 Capital Measures.
| | | | | | | | | | | | | | | | | | | | |
| | | 2018-19
$‘000 | | | 2019-20
$‘000 | | | 2020-21
$‘000 | | | 2021-22
$‘000 | | | 2022-23
$‘000 | |
Recording and Transcription Services | | | — | | | | 1,748 | | | | 1,998 | | | | — | | | | — | |
The Government is providing additional funding of $3.7 million over two years for the implementation of the new service delivery model for recording and transcription services.
The Government will also provide additional funding of $46.3 million over six years from 2020-21, including $19.9 million to 2022-23, to be held centrally. The capital component of this measure can be found in Chapter 3 Capital Measures.
69
2019-20 Budget Measures
| | | | | | | | | | | | | | | | | | | | |
| | | 2018-19
$‘000 | | | 2019-20
$‘000 | | | 2020-21
$‘000 | | | 2021-22
$‘000 | | | 2022-23
$‘000 | |
Court Link | | | — | | | | 1,461 | | | | 1,688 | | | | 1,668 | | | | 1,750 | |
The Government is providing increased funding of $6.6 million over four years and $1.8 million per annum ongoing, and is internally funding $462,000 over four years and $126,000 ongoing, to expand Court Link to Maroochydore, Redcliffe and Caboolture, and to integrate with the Queensland Magistrates Early Referral into Treatment (QMERIT) Program.
This forms part of Government’s overall package of $9.9 million over four years and $2.6 million per annum ongoing to expand Court Link and integrate with the QMERIT Program. Further details can be found in the Queensland Health section of this chapter.
| | | | | | | | | | | | | | | | | | | | |
| | | 2018-19
$‘000 | | | 2019-20
$‘000 | | | 2020-21
$‘000 | | | 2021-22
$‘000 | | | 2022-23
$‘000 | |
Queensland Human Rights Commission | | | 105 | | | | 1,346 | | | | 1,404 | | | | 1,459 | | | | 1,532 | |
The Government is providing additional funding of $5.8 million over five years and $1.5 million per annum ongoing to the Queensland Human Rights Commission (formerly the Anti- Discrimination Commission Queensland) to support the operation and administration of the Human Rights Act 2019, to provide for a conciliator to meet increased demand, and for rental increases.
| | | | | | | | | | | | | | | | | | | | |
| | | 2018-19
$‘000 | | | 2019-20
$‘000 | | | 2020-21
$‘000 | | | 2021-22
$‘000 | | | 2022-23
$‘000 | |
Strengthening Coronial Services | | | — | | | | 1,207 | | | | 830 | | | | 407 | | | | 474 | |
The Government is providing additional funding of $2.9 million over four years and $474,000 per annum ongoing to establish a second temporary Registrar Unit within the Coroners Court of Queensland to enhance triaging practices and to strengthen case management and structural supports.
This forms part of Government’s total funding of $3.9 million over four years and $474,000 per annum ongoing to strengthen coronial services in Queensland. Further details can be found in the Queensland Health section of this chapter.
70
2019-20 Budget Measures
| | | | | | | | | | | | | | | | | | | | |
| | | 2018-19
$‘000 | | | 2019-20
$‘000 | | | 2020-21
$‘000 | | | 2021-22
$‘000 | | | 2022-23
$‘000 | |
Aurukun Restorative Justice Program | | | — | | | | 973 | | | | 801 | | | | 821 | | | | 840 | |
The Government is providing increased funding of $3.4 million over four years and $840,000 per annum ongoing to continue delivery of the Aurukun Restorative Justice Program.
| | | | | | | | | | | | | | | | | | | | |
| | | 2018-19
$‘000 | | | 2019-20
$‘000 | | | 2020-21
$‘000 | | | 2021-22
$‘000 | | | 2022-23
$‘000 | |
National Redress Scheme | | | 555 | | | | 865 | | | | 818 | | | | 779 | | | | — | |
The Government is providing additional funding of $3 million over four years to the Department of Justice and Attorney-General, the Office of the Public Guardian and the Public Trustee to support participation in the National Redress Scheme for survivors of institutional child sexual abuse.
Further details can be found in the Department of Child Safety, Youth and Women, the Department of Housing and Public Works and the Department of Communities, Disability Services and Seniors sections of this chapter.
| | | | | | | | | | | | | | | | | | | | |
| | | 2018-19
$‘000 | | | 2019-20
$‘000 | | | 2020-21
$‘000 | | | 2021-22
$‘000 | | | 2022-23
$‘000 | |
Youth Justice Investment - Townsville Community Youth Response | | | — | | | | 848 | | | | 797 | | | | 809 | | | | 820 | |
The Government is providing increased funding of $3.3 million over four years to continue and expand the Townsville Community Youth Response and address recommendations in the Townsville’s Voice: Local Solutions to Address Youth Crime report.
This forms part of the Government’s increased investment of $18.5 million over four years to support the Townsville Community Youth Response. Further details of this funding can be found in the Department of Youth Justice and Queensland Police Service sections of this chapter.
This contributes to the whole-of-government investment for a suite of youth justice infrastructure and non-infrastructure initiatives of $154.5 million operating (including $143.1 million new funding and $11.4 million to be funded internally) and $178 million capital (including $140 million held centrally for estimated project costs) over five years. Details on the Youth Justice Investment measures can be found in the Department of Youth Justice, Department of Child Safety, Youth and Women, Department of Education, Queensland Health, Queensland Police Service and Department of Justice and Attorney-General sections of this chapter, and the Department of Youth Justice section of Chapter 3 Capital Measures.
71
2019-20 Budget Measures
| | | | | | | | | | | | | | | | | | | | |
| | | 2018-19
$‘000 | | | 2019-20
$‘000 | | | 2020-21
$‘000 | | | 2021-22
$‘000 | | | 2022-23
$‘000 | |
Crime and Corruption Commission - Combating Crime | | | — | | | | 660 | | | | 660 | | | | 660 | | | | 660 | |
The Government is providing additional funding of $2.6 million over four years and $660,000 per annum ongoing for the continuation of frontline investigation services to combat major crime and corruption.
| | | | | | | | | | | | | | | | | | | | |
| | | 2018-19
$‘000 | | | 2019-20
$‘000 | | | 2020-21
$‘000 | | | 2021-22
$‘000 | | | 2022-23
$‘000 | |
Court Approaches to Remand | | | — | | | | 602 | | | | 614 | | | | 623 | | | | 634 | |
The Government is providing additional funding of $2.5 million over four years and $634,000 per annum ongoing to implement Magistrate-led watchhouse training and enhance approaches to remand.
| | | | | | | | | | | | | | | | | | | | |
| | | 2018-19
$‘000 | | | 2019-20
$‘000 | | | 2020-21
$‘000 | | | 2021-22
$‘000 | | | 2022-23
$‘000 | |
Murri Court Expansion | | | 201 | | | | 569 | | | | 578 | | | | 589 | | | | 599 | |
The Government is providing increased funding of $2.5 million over five years and $599,000 per annum ongoing to establish and maintain a Murri Court at Ipswich.
This forms part of the Government’s total funding of $4.1 million over five years, comprising of $2.5 million new funding and $1.5 million internal funding to expand the Murri Court to Ipswich. Further details can be found in the Queensland Police Service section of this chapter.
72
2019-20 Budget Measures
| | | | | | | | | | | | | | | | | | | | |
| | | 2018-19
$‘000 | | | 2019-20
$‘000 | | | 2020-21
$‘000 | | | 2021-22
$‘000 | | | 2022-23
$‘000 | |
New Child Death Review Model | | | — | | | | 376 | | | | 1,211 | | | | 1,255 | | | | 1,300 | |
The Government is providing funding of $4.1 million over four years ($2.5 million in new funding and $1.6 million redirected from the Department of Child Safety, Youth and Women) and $1.3 million ongoing ($825,000 in new funding and $475,000 redirected from the Department of Child Safety, Youth and Women) to establish a new and independent child death review panel, supported by the Queensland Family & Child Commission.
This forms part of Government’s commitment to develop a new, independent model for reviewing the deaths of children known to the child protection system, in response to the Queensland Family & Child Commission report, A systems review of individual agency findings following the death of a child.
| | | | | | | | | | | | | | | | | | | | |
| | | 2018-19
$‘000 | | | 2019-20
$‘000 | | | 2020-21
$‘000 | | | 2021-22
$‘000 | | | 2022-23
$‘000 | |
Alleviating pressures in the youth detention system | | | 386 | | | | — | | | | — | | | | — | | | | — | |
The Government has provided additional funding of $386,000 in 2018-19 as an immediate response to pressures within the youth justice system as part of the Mid-Year Fiscal and Economic Review, which supported additional Childrens Court services.
This formed part of the Government’s initial investment of $8 million ($7 million new funding and $1 million funded internally) over two years at the Mid-Year Fiscal and Economic Review as an immediate response to pressures in the youth justice system. Further details on this investment can be found in the Department of Youth Justice section of this chapter. The Government’s Youth Justice Investment Package builds on this investment, with increased funding of $154.5 million operating (including $143.1 million new funding and $11.4 million to be funded internally) and $178 million capital (including $140 million held centrally for estimated project costs) over five years. The Youth Justice Investment Package includes funding to continue some of the initiatives under this measure.
| | | | | | | | | | | | | | | | | | | | |
| | | 2018-19
$‘000 | | | 2019-20
$‘000 | | | 2020-21
$‘000 | | | 2021-22
$‘000 | | | 2022-23
$‘000 | |
Legal Aid Queensland | | | — | | | | — | | | | 1,900 | | | | 3,800 | | | | 5,800 | |
The Government will provide $11.5 million over three years and $5.8 million per annum ongoing to address demand growth in legal assistance services.
73
2019-20 Budget Measures
| | | | | | | | | | | | | | | | | | | | |
| | | 2018-19
$‘000 | | | 2019-20
$‘000 | | | 2020-21
$‘000 | | | 2021-22
$‘000 | | | 2022-23
$‘000 | |
Legal Assistance Services | | | — | | | | — | | | | — | | | | 1,188 | | | | 1,443 | |
The Government is providing additional funding of $2.6 million over two years ($5.6 million over four years to 2024-25) and $2.2 million over three years is being internally met to support community organisations delivering legal assistance services.
74
2019-20 Budget Measures
Department of Local Government, Racing and Multicultural Affairs
| | | | | | | | | | | | | | | | | | | | |
| | | 2018-19
$‘000 | | | 2019-20
$‘000 | | | 2020-21
$‘000 | | | 2021-22
$‘000 | | | 2022-23
$‘000 | |
Queensland Racing Industry | | | 17,630 | | | | 30,370 | | | | 30,370 | | | | 26,370 | | | | 26,370 | |
The Government is providing additional funding of $131.1 million over five years for Racing Queensland to increase prize money and support initiatives for the racing industries, including $119.1 million for the Queensland thoroughbred racing industry and $12 million for the greyhound and harness racing codes.
| | | | | | | | | | | | | | | | | | | | |
| | | 2018-19
$‘000 | | | 2019-20
$‘000 | | | 2020-21
$‘000 | | | 2021-22
$‘000 | | | 2022-23
$‘000 | |
Torres Strait Island Seawalls and Coastal Inundation Mitigation Upgrades | | | 5,000 | | | | 15,000 | | | | — | | | | — | | | | — | |
The Government is providing increased funding of $20 million over two years to continue inundation mitigation works on five outer Torres Strait Islands, which will help to protect infrastructure and communities on these islands from rising sea levels and the impacts of coastal inundation.
| | | | | | | | | | | | | | | | | | | | |
| | | 2018-19
$‘000 | | | 2019-20
$‘000 | | | 2020-21
$‘000 | | | 2021-22
$‘000 | | | 2022-23
$‘000 | |
Implementing Waste Reforms for Queensland under a New Waste Management and Resource Recovery Strategy | | | — | | | | 4,000 | | | | — | | | | — | | | | — | |
The Government is providing increased funding of $4 million in 2019-20 to remove waste metal build-up including vehicle stockpiles from islands in the Torres Strait. Further details can be found in the Department of Environment and Science section of this chapter.
75
2019-20 Budget Measures
| | | | | | | | | | | | | | | | | | | | |
| | | 2018-19
$‘000 | | | 2019-20
$‘000 | | | 2020-21
$‘000 | | | 2021-22
$‘000 | | | 2022-23
$‘000 | |
Northern Peninsula Area Water Supply System - Reservoir Repairs | | | — | | | | 2,700 | | | | — | | | | — | | | | — | |
The Government is providing additional funding of $2.7 million in 2019-20 to provide urgent repairs to reservoirs within the Northern Peninsula Area Water Supply System.
| | | | | | | | | | | | | | | | | | | | |
| | | 2018-19
$‘000 | | | 2019-20
$‘000 | | | 2020-21
$‘000 | | | 2021-22
$‘000 | | | 2022-23
$‘000 | |
Northern Peninsula Area Water Supply System - Financial Assistance Package | | | — | | | | — | | | | 1,333 | | | | 1,333 | | | | 1,334 | |
The Government will provide increased funding of $4 million over three years from 2020-21 for identified capital renewal and replacement costs of the Northern Peninsula Area Water Supply System and to support transfer of ownership of the asset to the Northern Peninsula Area Regional Council.
| | | | | | | | | | | | | | | | | | | | |
| | | 2018-19
$‘000 | | | 2019-20
$‘000 | | | 2020-21
$‘000 | | | 2021-22
$‘000 | | | 2022-23
$‘000 | |
Paroo Shire Council Upgrade to Critical Sewerage Infrastructure | | | 9,100 | | | | — | | | | — | | | | — | | | | — | |
The Government has provided additional funding of $9.1 million in 2018-19 for the Paroo Shire Council to upgrade critical sewerage infrastructure.
| | | | | | | | | | | | | | | | | | | | |
| | | 2018-19
$‘000 | | | 2019-20
$‘000 | | | 2020-21
$‘000 | | | 2021-22
$‘000 | | | 2022-23
$‘000 | |
Queensland Racing Industry Infrastructure | | | 8,000 | | | | — | | | | — | | | | — | | | | — | |
The Government has provided additional funding of $8 million in 2018-19 for Racing Queensland to progress the development of harness racing infrastructure.
76
2019-20 Budget Measures
Department of Natural Resources, Mines and Energy
| | | | | | | | | | | | | | | | | | | | |
| | | 2018-19
$‘000 | | | 2019-20
$‘000 | | | 2020-21
$‘000 | | | 2021-22
$‘000 | | | 2022-23
$‘000 | |
Hopeland (Linc Energy) Management and Remediation | | | — | | | | 8,100 | | | | 6,100 | | | | 1,600 | | | | 1,800 | |
The Government is providing increased funding of $17.6 million over four years ($19.4 million over five years) to continue the management and remediation of the former Linc Energy underground coal gasification site. The capital component of this measure can be found in Chapter 3 Capital Measures.
| | | | | | | | | | | | | | | | | | | | |
| | | 2018-19
$‘000 | | | 2019-20
$‘000 | | | 2020-21
$‘000 | | | 2021-22
$‘000 | | | 2022-23
$‘000 | |
Community Service Obligation payments for the Cloncurry Pipeline | | | — | | | | 6,043 | | | | 6,234 | | | | 6,317 | | | | — | |
The Government is providing increased funding of $18.6 million over three years to support the continuation of Community Service Obligation payments for the Cloncurry Pipeline to support Cloncurry Shire Council’s long-term water supply and industrial development in the region.
| | | | | | | | | | | | | | | | | | | | |
| | | 2018-19
$‘000 | | | 2019-20
$‘000 | | | 2020-21
$‘000 | | | 2021-22
$‘000 | | | 2022-23
$‘000 | |
Community Service Obligation payments for irrigation water supply services | | | — | | | | 3,808 | | | | — | | | | — | | | | — | |
The Government is providing increased funding of $3.8 million in 2019-20 to continue the irrigation pricing Community Service Obligation to ensure that the transition to prices which recover costs is gradual for Sunwater and Seqwater rural irrigation customers.
77
2019-20 Budget Measures
| | | | | | | | | | | | | | | | | | | | |
| | | 2018-19
$‘000 | | | 2019-20
$‘000 | | | 2020-21
$‘000 | | | 2021-22
$‘000 | | | 2022-23
$‘000 | |
Resources Safety and Health Queensland | | | — | | | | 3,750 | | | | 1,140 | | | | — | | | | — | |
The Government is providing additional funding of $4.9 million over two years to establish an independent regulator for worker safety and health in Queensland’s resources industries, increase hygiene inspection and audit activities and establish mobile health units.
| | | | | | | | | | | | | | | | | | | | |
| | | 2018-19
$‘000 | | | 2019-20
$‘000 | | | 2020-21
$‘000 | | | 2021-22
$‘000 | | | 2022-23
$‘000 | |
Coal Mine Workers’ Health Scheme | | | — | | | | 2,298 | | | | 4,409 | | | | — | | | | — | |
The Government is providing increased funding of $6.7 million over two years to embed reforms to the Coal Mine Workers’ Health Scheme and other reforms to address resource worker health issues following the re-identification of Coal Workers’ Pneumoconiosis in Queensland’s mining sector.
| | | | | | | | | | | | | | | | | | | | |
| | | 2018-19
$‘000 | | | 2019-20
$‘000 | | | 2020-21
$‘000 | | | 2021-22
$‘000 | | | 2022-23
$‘000 | |
Abandoned Mines - Care and Maintenance, Risk Mitigation, Remediation and Consultation | | | — | | | | 1,320 | | | | 340 | | | | — | | | | — | |
The Government is providing increased funding of $1.7 million over two years to manage safety, health and environmental risks at four high priority abandoned mine sites. The capital component of this measure can be found in Chapter 3 Capital Measures.
| | | | | | | | | | | | | | | | | | | | |
| | | 2018-19
$‘000 | | | 2019-20
$‘000 | | | 2020-21
$‘000 | | | 2021-22
$‘000 | | | 2022-23
$‘000 | |
Local Management Arrangements | | | — | | | | 890 | | | | — | | | | — | | | | — | |
The Government is providing increased funding of $890,000 in 2019-20 to continue to support the finalisation of the transition of the Eton and Emerald Channel Irrigation Schemes to Local Management Arrangements.
78
2019-20 Budget Measures
| | | | | | | | | | | | | | | | | | | | |
| | | 2018-19
$‘000 | | | 2019-20
$‘000 | | | 2020-21
$‘000 | | | 2021-22
$‘000 | | | 2022-23
$‘000 | |
Drought Assistance Package and Queensland Drought Reform | | | — | | | | — | | | | — | | | | — | | | | — | |
The Government is providing increased funding of up to $15.2 million over two years from 2019-20, held centrally, as part of the Drought Assistance Package and Queensland Drought Reform. This funding provides relief to farming customers from fixed charges for electricity accounts that are used to pump water for farm or irrigation purposes during periods of drought ($15 million in 2019-20) and fodder management ($200,000 over two years).
The Drought Assistance Package and Queensland Drought Reform is a total of up to $74.6 million over four years from 2019-20 to support drought affected communities across the State. Further details can be found in the Department of Agriculture and Fisheries, and Department of Communities, Disability Services and Seniors sections of this chapter and in the Department of Natural Resources, Mines and Energy section of Chapter 4 Revenue Measures.
| | | | | | | | | | | | | | | | | | | | |
| | | 2018-19
$‘000 | | | 2019-20
$‘000 | | | 2020-21
$‘000 | | | 2021-22
$‘000 | | | 2022-23
$‘000 | |
Interim Great Artesian Basin Infrastructure Investment Program | | | 2,526 | | | | — | | | | ��� | | | | — | | | | — | |
The Government has provided increased funding of $1.3 million in 2018-19, matched by the Australian Government, for the Interim Great Artesian Basin Infrastructure Investment Program.
79
2019-20 Budget Measures
Department of State Development, Manufacturing, Infrastructure and Planning
| | | | | | | | | | | | | | | | | | | | |
| | | 2018-19
$‘000 | | | 2019-20
$‘000 | | | 2020-21
$‘000 | | | 2021-22
$‘000 | | | 2022-23
$‘000 | |
Building our Regions | | | — | | | | 35,000 | | | | 10,000 | | | | 15,000 | | | | 10,000 | |
Delivering on our election commitments, the Government is providing increased funding of $70 million over four years for Round 5 of Building our Regions to deliver critical infrastructure for the regions. Total funding for Building our Regions is $515 million. The Department of State Development, Manufacturing, Infrastructure and Planning is responsible for $365 million of the program, and the Department of Transport and Main Roads is responsible for $150 million delivered through the Transport Infrastructure Development Scheme.
Building our Regions facilitates critical infrastructure projects in regional areas that meet specific community needs, with a focus on delivering enduring economic outcomes and job creation.
| | | | | | | | | | | | | | | | | | | | |
| | | 2018-19
$‘000 | | | 2019-20
$‘000 | | | 2020-21
$‘000 | | | 2021-22
$‘000 | | | 2022-23
$‘000 | |
Queensland Reconstruction Authority Proserpine Entertainment Centre | | | 1,568 | | | | 3,657 | | | | — | | | | — | | | | — | |
The Government is providing increased funding of up to $5.2 million over two years, in addition to $500,000 previously announced in May 2018, for Whitsunday Regional Council to fund the re-build of the Proserpine Entertainment Centre. The Australian Government will also contribute towards this project.
This forms part of the Queensland Government’s commitment to allocate $110 million towards extraordinary recovery and reconstruction projects following Severe Tropical Cyclone Debbie.
80
2019-20 Budget Measures
| | | | | | | | | | | | | | | | | | | | |
| | | 2018-19
$‘000 | | | 2019-20
$‘000 | | | 2020-21
$‘000 | | | 2021-22
$‘000 | | | 2022-23
$‘000 | |
Queensland Reconstruction Authority Disaster Recovery | | | 1,433 | | | | 3,342 | | | | — | | | | — | | | | — | |
The Government is providing additional funding of up to $4.8 million over two years for nine projects across the State to promote resilience to natural disasters.
This forms part of the Queensland Government’s commitment to allocate $110 million towards extraordinary recovery and reconstruction projects following Severe Tropical Cyclone Debbie.
| | | | | | | | | | | | | | | | | | | | |
| | | 2018-19
$‘000 | | | 2019-20
$‘000 | | | 2020-21
$‘000 | | | 2021-22
$‘000 | | | 2022-23
$‘000 | |
Biofutures | | | — | | | | 794 | | | | 1,408 | | | | 1,798 | | | | 1,000 | |
The Government is providing increased funding of $5 million over four years to continue advancing Queensland’s world-leading biofutures agenda.
| | | | | | | | | | | | | | | | | | | | |
| | | 2018-19
$‘000 | | | 2019-20
$‘000 | | | 2020-21
$‘000 | | | 2021-22
$‘000 | | | 2022-23
$‘000 | |
Resource Recovery Industries Roadmap | | | 300 | | | | 700 | | | | — | | | | — | | | | — | |
The Government is providing additional funding of $1 million over two years for the Resource Recovery Industries Roadmap and Action Plan to position Queensland as a leader in resource recovery by promoting growth and sustainability of the waste, resource recovery and recycling industries.
| | | | | | | | | | | | | | | | | | | | |
| | | 2018-19
$‘000 | | | 2019-20
$‘000 | | | 2020-21
$‘000 | | | 2021-22
$‘000 | | | 2022-23
$‘000 | |
Queensland Hydrogen Industry Strategy | | | — | | | | 500 | | | | 3,000 | | | | 5,000 | | | | 10,500 | |
The Government is providing additional funding of $19 million over four years to establish an agenda for renewable hydrogen industry attraction and to incentivise job creation, regional growth, and increased innovation and development. Gladstone will be a focus point for hydrogen development.
81
2019-20 Budget Measures
| | | | | | | | | | | | | | | | | | | | |
| | | 2018-19
$‘000 | | | 2019-20
$‘000 | | | 2020-21
$‘000 | | | 2021-22
$‘000 | | | 2022-23
$‘000 | |
Queensland Reconstruction Authority SES Operations Centre | | | 500 | | | | 500 | | | | — | | | | — | | | | — | |
The Government is providing additional funding of up to $1 million over two years to Toowoomba Regional Council for a new SES Operations Centre in Charlton.
This forms part of the Queensland Government’s commitment to allocate $110 million towards extraordinary recovery and reconstruction projects following Severe Tropical Cyclone Debbie.
| | | | | | | | | | | | | | | | | | | | |
| | | 2018-19
$‘000 | | | 2019-20
$‘000 | | | 2020-21
$‘000 | | | 2021-22
$‘000 | | | 2022-23
$‘000 | |
Advance Queensland Industry Attraction Fund | | | — | | | | — | | | | — | | | | — | | | | — | |
The Government is providing increased funding of $45 million, held centrally, to the Advance Queensland Industry Attraction Fund, bringing the total funding to $150 million.
This fund is focused on achieving the Queensland Government’s objectives of employment creation, regional growth and encouraging innovation. It aims to harness growth in emerging industries and value add to existing industries through financial support for contestable projects.
| | | | | | | | | | | | | | | | | | | | |
| | | 2018-19
$‘000 | | | 2019-20
$‘000 | | | 2020-21
$‘000 | | | 2021-22
$‘000 | | | 2022-23
$‘000 | |
Jobs and Regional Growth Fund | | | — | | | | — | | | | — | | | | — | | | | — | |
The Government is providing increased funding of $25 million, held centrally, to assist businesses and projects that will generate economic development and employment opportunities in regional Queensland. This increase brings the total funding to $175 million.
Queensland Treasury and the Department of State Development, Manufacturing, Infrastructure and Planning are jointly responsible for the Fund. Further details can be found in the Queensland Treasury section of this chapter.
82
2019-20 Budget Measures
| | | | | | | | | | | | | | | | | | | | |
| | | 2018-19
$‘000 | | | 2019-20
$‘000 | | | 2020-21
$‘000 | | | 2021-22
$‘000 | | | 2022-23
$‘000 | |
Made in Queensland | | | — | | | | — | | | | 2,000 | | | | 4,000 | | | | — | |
Delivering on our election commitments, the Government will provide increased funding of $6 million over two years to the Made in Queensland grants program. This increase brings the total funding to $46 million over five years from 2017-18 to support the manufacturing sector to become more internationally competitive, increase productivity and adopt new processes and technologies.
| | | | | | | | | | | | | | | | | | | | |
| | | 2018-19
$‘000 | | | 2019-20
$‘000 | | | 2020-21
$‘000 | | | 2021-22
$‘000 | | | 2022-23
$‘000 | |
Southport Spit Master Plan | | | — | | | | — | | | | — | | | | — | | | | — | |
The Government has committed $60 million, of which $31.5 million is held centrally, to support delivery of The Southport Spit master plan to enhance the public realm of The Spit, improve connections to the surrounding marine environment and generate opportunities for job creation through tourism, entertainment and recreation. The master plan secures the future of 138 hectares of green space, unlocks the potential for 1,800 new jobs, provides for more than 800 new short-term accommodation rooms, enhanced tourism and recreation opportunities, and creates vibrant community spaces.
83
2019-20 Budget Measures
Department of the Premier and Cabinet
| | | | | | | | | | | | | | | | | | | | |
| | | 2018-19
$‘000 | | | 2019-20
$‘000 | | | 2020-21
$‘000 | | | 2021-22
$‘000 | | | 2022-23
$‘000 | |
Screen Queensland | | | 5,705 | | | | 17,434 | | | | 18,041 | | | | 1,747 | | | | 2,253 | |
The Government is providing increased funding of $45.2 million over five years to support Screen Queensland.
This includes increased funding of $35.7 million over three years from 2018-19 for the Production Attraction Strategy to help grow a pipeline of large-scale film and high-end television productions in Queensland.
This measure also includes additional funding of $9.5 million over four years for initiatives that will further support the growth of the Queensland screen industry, including the establishment of a new Screen Investment Fund and support for the Post, Digital and Visual Effects incentive program and the Queensland video gaming industry.
| | | | | | | | | | | | | | | | | | | | |
| | | 2018-19
$‘000 | | | 2019-20
$‘000 | | | 2020-21
$‘000 | | | 2021-22
$‘000 | | | 2022-23
$‘000 | |
Criminal Justice System Reform - Program Management Office | | | — | | | | 2,458 | | | | — | | | | — | | | | — | |
The Government is providing additional funding of $2.5 million in 2019-20 for a Program Management Office to support a whole-of-government program focussed on developing and implementing reform across the Queensland criminal justice system and informing an integrated and coordinated approach to policy, legislation and budget decision-making. The work program involves embedding a system-level approach to policy, service delivery, and investment across all related criminal justice and human service agencies.
84
2019-20 Budget Measures
| | | | | | | | | | | | | | | | | | | | |
| | | 2018-19
$‘000 | | | 2019-20
$‘000 | | | 2020-21
$‘000 | | | 2021-22
$‘000 | | | 2022-23
$‘000 | |
Veterans-related Initiatives | | | 250 | | | | 2,219 | | | | 2,416 | | | | 2,391 | | | | 2,382 | |
The Government is providing additional funding of $2.7 million over five years and $2.4 million per annum ongoing to establish an Office for Veterans within the department. The Office for Veterans will have broad responsibilities including the delivery of veterans’ grant and employment programs and the coordination of veterans’ policy. In addition, the funding will provide for the ongoing curation and oversight of Anzac Square. Total funding for these initiatives is $9.7 million over five years, including $6.9 million internally funded.
| | | | | | | | | | | | | | | | | | | | |
| | | 2018-19
$‘000 | | | 2019-20
$‘000 | | | 2020-21
$‘000 | | | 2021-22
$‘000 | | | 2022-23
$‘000 | |
Safer Communities Grants Program | | | 2,000 | | | | 2,000 | | | | 1,000 | | | | — | | | | — | |
The Government is providing additional funding of $5 million over three years for a Safer Communities Grants Program to help keep communities safe and alleviate demand pressures in the criminal justice system.
| | | | | | | | | | | | | | | | | | | | |
| | | 2018-19
$‘000 | | | 2019-20
$‘000 | | | 2020-21
$‘000 | | | 2021-22
$‘000 | | | 2022-23
$‘000 | |
Year of the Outback Tourism Events Program | | | — | | | | 1,000 | | | | 1,000 | | | | — | | | | — | |
The Government is providing additional funding of $2 million over two years for the Premier’s Outback Events Program, to support the commitment to grow the tourism industry by providing new opportunities to attract visitors and further drive the economy in Outback Queensland. Funding of $1 million in 2018-19 has also been internally met by the department, bringing total funding to $3 million over three years.
85
2019-20 Budget Measures
| | | | | | | | | | | | | | | | | | | | |
| | | 2018-19
$‘000 | | | 2019-20
$‘000 | | | 2020-21
$‘000 | | | 2021-22
$‘000 | | | 2022-23
$‘000 | |
Enhanced Throughcare Service Delivery Model | | | — | | | | 900 | | | | — | | | | — | | | | — | |
The Government is providing additional funding of $900,000 in 2019-20 to develop a whole-of-government throughcare service delivery model for rehabilitation and remand programs and services for remandees, prisoners and offenders.
This forms part of the Government’s overall package of $263.8 million over four years, including $227.9 million internally funded, to develop and deliver a whole-of-government throughcare service delivery model. Further details can be found in the Queensland Corrective Services and Queensland Health sections of this chapter.
86
2019-20 Budget Measures
Department of Transport and Main Roads
| | | | | | | | | | | | | | | | | | | | |
| | | 2018-19
$‘000 | | | 2019-20
$‘000 | | | 2020-21
$‘000 | | | 2021-22
$‘000 | | | 2022-23
$‘000 | |
Continuation of the Local Fare Scheme | | | — | | | | 6,973 | | | | 7,367 | | | | — | | | | — | |
The Government is providing increased funding of $14.3 million over two years to continue the Local Fare Scheme in Far North Queensland. The scheme assists with affordability of air travel in eligible regional and remote communities.
| | | | | | | | | | | | | | | | | | | | |
| | | 2018-19
$‘000 | | | 2019-20
$‘000 | | | 2020-21
$‘000 | | | 2021-22
$‘000 | | | 2022-23
$‘000 | |
National Disability Insurance Scheme Transition Support: Taxi Subsidies | | | — | | | | 6,000 | | | | — | | | | — | | | | — | |
The Government is providing increased funding of $6 million in 2019-20 to continue the provision of taxi subsidies for National Disability Insurance Scheme (NDIS) eligible participants. This funding will ensure a smooth transition to the NDIS for Queenslanders with disability.
This funding is part of the total of $61.9 million over two years provided by the Queensland Government as a temporary measure while interface issues between the NDIS and mainstream services are resolved through national policy work, to ensure clients are able to access critical supports while they transition to the NDIS. Further details can be found in the Department of Child Safety, Youth and Women, Department of Communities, Disability Services and Seniors, and Queensland Health sections of this chapter.
| | | | | | | | | | | | | | | | | | | | |
| | | 2018-19
$‘000 | | | 2019-20
$‘000 | | | 2020-21
$‘000 | | | 2021-22
$‘000 | | | 2022-23
$‘000 | |
Wheelchair Accessible Taxi Sustainability | | | — | | | | 4,567 | | | | 5,651 | | | | 5,254 | | | | 5,418 | |
The Government is providing additional funding of $20.9 million over four years for a grant program to ensure the sustainability of Queensland’s wheelchair accessible taxi fleet through replacement of aged vehicles and converting some conventional vehicles to wheelchair accessible vehicles.
87
2019-20 Budget Measures
| | | | | | | | | | | | | | | | | | | | |
| | | 2018-19
$‘000 | | | 2019-20
$‘000 | | | 2020-21
$‘000 | | | 2021-22
$‘000 | | | 2022-23
$‘000 | |
Cost Recovery for Drink Driving Reforms | | | — | | | | 2,020 | | | | 2,111 | | | | 2,212 | | | | 2,316 | |
The Government is providing increased funding of $8.7 million over four years and $2.3 million per annum ongoing to fund the administration of the enhanced Alcohol Ignition Interlock Program. The revenue component of this measure can be found in Chapter 4 Revenue Measures.
| | | | | | | | | | | | | | | | | | | | |
| | | 2018-19
$‘000 | | | 2019-20
$‘000 | | | 2020-21
$‘000 | | | 2021-22
$‘000 | | | 2022-23
$‘000 | |
Camera Detected Offence Program | | | — | | | | 1,498 | | | | 1,684 | | | | 1,632 | | | | 1,812 | |
The Government is providing increased funding of $6.6 million over four years and $1.8 million per annum ongoing for road safety education and awareness programs and to improve the safety of the sections of state-controlled roads where accidents happen most frequently.
The Government is providing total increased funding of $180.3 million over four years across departments as part of the Camera Detected Offence Program. Further funding can be found in the Queensland Treasury section of this chapter. The capital component of this measure can be found in the Department of Transport and Main Roads section of Chapter 3 Capital Measures.
| | | | | | | | | | | | | | | | | | | | |
| | | 2018-19
$‘000 | | | 2019-20
$‘000 | | | 2020-21
$‘000 | | | 2021-22
$‘000 | | | 2022-23
$‘000 | |
Expansion of the School Crossing Supervisor Scheme | | | — | | | | 792 | | | | 1,339 | | | | 1,044 | | | | 1,067 | |
The Government is providing increased funding of $4.2 million over four years and $1.1 million per annum ongoing to provide supervised crossings at an additional 50 school sites. The scheme enhances the safety of primary school children in the school traffic environment.
| | | | | | | | | | | | | | | | | | | | |
| | | 2018-19
$‘000 | | | 2019-20
$‘000 | | | 2020-21
$‘000 | | | 2021-22
$‘000 | | | 2022-23
$‘000 | |
Continuation of the Citytrain Response Unit | | | 698 | | | | 705 | | | | — | | | | — | | | | — | |
The Government is providing increased funding of $1.4 million over two years to enable the continuation of the Fixing the Trains Assurance Program and ensure Strachan Inquiry recommendations are implemented.
88
2019-20 Budget Measures
| | | | | | | | | | | | | | | | | | | | |
| | | 2018-19
$‘000 | | | 2019-20
$‘000 | | | 2020-21
$‘000 | | | 2021-22
$‘000 | | | 2022-23
$‘000 | |
Mount Isa Line Below Rail Subsidy | | | — | | | | — | | | | — | | | | — | | | | — | |
In recognition of the importance the Mount Isa Line plays in facilitating the transportation of the freight task from pit to port, the Government will introduce a $20 million per annum Transport Services Contract payment for this freight line. This payment will be to reduce below rail access costs for users and further promote rail for freight, as well as support continued development of the North West Minerals Province (NWMP).
The funding forms part of the Government’s broader package of $110 million over four years from 2019-20 to support the NWMP. This is in addition to the $39 million that was committed in the 2017-18 Budget to deliver initiatives to support the NWMP.
The capital component of this measure can be found in Chapter 3 Capital Measures under the title Port of Townsville Common User Facility.
| | | | | | | | | | | | | | | | | | | | |
| | | 2018-19
$‘000 | | | 2019-20
$‘000 | | | 2020-21
$‘000 | | | 2021-22
$‘000 | | | 2022-23
$‘000 | |
Small Business Regulatory Reform | | | — | | | | — | | | | — | | | | — | | | | — | |
The Government is providing additional funding of $2.3 million in 2019-20, held centrally, for the Permit for Access to Road and Corridor project.
This forms part of the Queensland and Australian Government’s Small Business Regulatory Reform Project Agreement to deliver projects that reduce the regulatory burden on small business. The projects undertaken as part of this Agreement will leverage $60.1 million in reward payments from the Australian Government upon successful completion of relevant project milestones. Further details can be found in the Department of Agriculture and Fisheries, Queensland Health and Department of Employment, Small Business and Training sections of this chapter.
89
2019-20 Budget Measures
Department of Youth Justice
| | | | | | | | | | | | | | | | | | | | |
| | | 2018-19
$‘000 | | | 2019-20
$‘000 | | | 2020-21
$‘000 | | | 2021-22
$‘000 | | | 2022-23
$‘000 | |
Youth Justice Investment - Youth Detention Capacity | | | — | | | | 8,086 | | | | — | | | | — | | | | — | |
The Government is providing additional funding of $8.1 million in 2019-20 to provide frontline and frontline support positions to enhance the operation of Queensland’s two youth detention centres.
This contributes to the whole-of-government investment for a suite of youth justice infrastructure and non-infrastructure initiatives of $154.5 million operating (including $143.1 million new funding and $11.4 million to be funded internally) and $178 million capital (including $140 million held centrally for estimated project costs) over five years. Details on the Youth Justice Investment measures can be found in the Department of Youth Justice, Department of Child Safety, Youth and Women, Department of Education, Queensland Health, Queensland Police Service and Department of Justice and Attorney-General sections of this chapter, and the Department of Youth Justice section of Chapter 3 Capital Measures.
| | | | | | | | | | | | | | | | | | | | |
| | | 2018-19
$‘000 | | | 2019-20
$‘000 | | | 2020-21
$‘000 | | | 2021-22
$‘000 | | | 2022-23
$‘000 | |
Youth Justice Investment - Transition to Success | | | — | | | | 6,329 | | | | 7,332 | | | | 7,439 | | | | 7,588 | |
The Government is providing increased funding of $28.7 million over four years and $7.6 million per annum ongoing to continue and enhance the Transition to Success program aimed at reducing recidivism and increasing participation in education and vocational activities.
This contributes to the whole-of-government investment for a suite of youth justice infrastructure and non-infrastructure initiatives of $154.5 million operating (including $143.1 million new funding and $11.4 million to be funded internally) and $178 million capital (including $140 million held centrally for estimated project costs) over five years. Details on the Youth Justice Investment measures can be found in the Department of Youth Justice, Department of Child Safety, Youth and Women, Department of Education, Queensland Health, Queensland Police Service and Department of Justice and Attorney-General sections of this chapter, and the Department of Youth Justice section of Chapter 3 Capital Measures.
90
2019-20 Budget Measures
| | | | | | | | | | | | | | | | | | | | |
| | | 2018-19
$‘000 | | | 2019-20
$‘000 | | | 2020-21
$‘000 | | | 2021-22
$‘000 | | | 2022-23
$‘000 | |
Alleviating pressures in the youth detention system | | | 2,206 | | | | 4,441 | | | | — | | | | — | | | | — | |
The Government has provided additional funding of $6.6 million over two years as an immediate response to pressures within the youth justice system as part of the Mid-Year Fiscal and Economic Review. Funding of $1 million in 2018-19 was also met internally by the department to support this measure. This funding supported the commencement of a number of initiatives, including the Brisbane Watchhouse Response Team, Integrated Case Management, enhanced capacity and intensity of the Conditional Bail program, enhanced family group meetings and cultural support in watchhouses.
This formed part of the Government’s initial investment of $8 million ($7 million new funding and $1 million funded internally) over two years at the Mid-Year Fiscal and Economic Review as an immediate response to pressures in the youth justice system. Further details on this investment can be found in the Department of Justice and Attorney-General section of this chapter. The Government’s Youth Justice Investment Package builds on this investment, with increased funding of $154.5 million operating (including $143.1 million new funding and $11.4 million to be funded internally) and $178 million capital (including $140 million held centrally for estimated project costs) over five years. The Youth Justice Investment Package includes funding to continue some of the initiatives under this measure.
| | | | | | | | | | | | | | | | | | | | |
| | | 2018-19
$‘000 | | | 2019-20
$‘000 | | | 2020-21
$‘000 | | | 2021-22
$‘000 | | | 2022-23
$‘000 | |
Youth Justice Investment - Restorative Justice | | | — | | | | 4,151 | | | | 7,591 | | | | 7,771 | | | | 7,956 | |
The Government is providing increased funding of $27.5 million over four years and $8 million per annum ongoing to continue Restorative Justice conferences in the youth justice system, which provide an opportunity for young people to take responsibility for their criminal behaviour and aim to reduce recidivism.
This contributes to the whole-of-government investment for a suite of youth justice infrastructure and non-infrastructure initiatives of $154.5 million operating (including $143.1 million new funding and $11.4 million to be funded internally) and $178 million capital (including $140 million held centrally for estimated project costs) over five years. Details on the Youth Justice Investment measures can be found in the Department of Youth Justice, Department of Child Safety, Youth and Women, Department of Education, Queensland Health, Queensland Police Service and Department of Justice and Attorney-General sections of this chapter, and the Department of Youth Justice section of Chapter 3 Capital Measures.
91
2019-20 Budget Measures
| | | | | | | | | | | | | | | | | | | | |
| | | 2018-19
$‘000 | | | 2019-20
$‘000 | | | 2020-21
$‘000 | | | 2021-22
$‘000 | | | 2022-23
$‘000 | |
Youth Justice Investment - Townsville Community Youth Response | | | — | | | | 3,529 | | | | 3,557 | | | | 3,592 | | | | 3,627 | |
The Government is providing increased funding of $14.3 million over four years to continue and expand the Townsville Community Youth Response and address recommendations in the Townsville’s Voice: Local Solutions to Address Youth Crime report. The Townsville Community Youth Response brings together several different services and programs including the High Risk Youth Court, after-hours diversionary services, cultural mentoring programs and alternative education bridging programs.
This forms part of the Government’s increased investment of $18.5 million over four years to support the Townsville Community Youth Response. Further details can be found in the Department of Justice and Attorney-General and Queensland Police Service sections of this chapter.
This contributes to the whole-of-government investment for a suite of youth justice infrastructure and non-infrastructure initiatives of $154.5 million operating (including $143.1 million new funding and $11.4 million to be funded internally) and $178 million capital (including $140 million held centrally for estimated project costs) over five years. Details on the Youth Justice Investment measures can be found in the Department of Youth Justice, Department of Child Safety, Youth and Women, Department of Education, Queensland Health, Queensland Police Service and Department of Justice and Attorney-General sections of this chapter, and the Department of Youth Justice section of Chapter 3 Capital Measures.
| | | | | | | | | | | | | | | | | | | | |
| | | 2018-19
$‘000 | | | 2019-20
$‘000 | | | 2020-21
$‘000 | | | 2021-22
$‘000 | | | 2022-23
$‘000 | |
Youth Justice Investment - Community Youth Responses | | | — | | | | 2,191 | | | | 4,346 | | | | 4,262 | | | | 4,201 | |
The Government is providing additional funding of $15 million over four years to establish three new Community Youth Responses to address youth crime hotspots in Brisbane, Ipswich and Cairns.
This contributes to the whole-of-government investment for a suite of youth justice infrastructure and non-infrastructure initiatives of $154.5 million operating (including $143.1 million new funding and $11.4 million to be funded internally) and $178 million capital (including $140 million held centrally for estimated project costs) over five years. Details on the Youth Justice Investment measures can be found in the Department of Youth Justice, Department of Child Safety, Youth and Women, Department of Education, Queensland Health, Queensland Police Service and Department of Justice and Attorney-General sections of this chapter, and the Department of Youth Justice section of Chapter 3 Capital Measures.
92
2019-20 Budget Measures
| | | | | | | | | | | | | | | | | | | | |
| | | 2018-19
$‘000 | | | 2019-20
$‘000 | | | 2020-21
$‘000 | | | 2021-22
$‘000 | | | 2022-23
$‘000 | |
Youth Justice Investment - Brisbane City Watchhouse Response Team | | | — | | | | 1,323 | | | | — | | | | — | | | | — | |
The Government is providing increased funding of $1.3 million in 2019-20 to continue to support the Brisbane City Watchhouse Response Team with dedicated youth workers to supervise young people held in the Brisbane Watchhouse.
This contributes to the whole-of-government investment for a suite of youth justice infrastructure and non-infrastructure initiatives of $154.5 million operating (including $143.1 million new funding and $11.4 million to be funded internally) and $178 million capital (including $140 million held centrally for estimated project costs) over five years. Details on the Youth Justice Investment measures can be found in the Department of Youth Justice, Department of Child Safety, Youth and Women, Department of Education, Queensland Health, Queensland Police Service and Department of Justice and Attorney-General sections of this chapter, and the Department of Youth Justice section of Chapter 3 Capital Measures.
| | | | | | | | | | | | | | | | | | | | |
| | | 2018-19
$‘000 | | | 2019-20
$‘000 | | | 2020-21
$‘000 | | | 2021-22
$‘000 | | | 2022-23
$‘000 | |
Youth Justice Investment - Additional 16 beds at Brisbane Youth Detention Centre | | | — | | | | 1,227 | | | | 4,306 | | | | 4,279 | | | | 4,355 | |
The Government is providing additional funding of $14.2 million over four years and $4.4 million per annum ongoing to commission and operate the 16 bed expansion of the Brisbane Youth Detention Centre.
This forms part of the Government’s total investment of $27 million capital and $18.3 million operating over five years, and $5.7 million per annum operating ongoing for the additional 16 beds at Brisbane Youth Detention Centre. Further details can be found in the Department of Education and Queensland Health sections of this chapter and the Department of Youth Justice section of Chapter 3 Capital Measures.
This contributes to the whole-of-government investment for a suite of youth justice infrastructure and non-infrastructure initiatives of $154.5 million operating (including $143.1 million new funding and $11.4 million to be funded internally) and $178 million capital (including $140 million held centrally for estimated project costs) over five years. Details on the Youth Justice Investment measures can be found in the Department of Youth Justice, Department of Child Safety, Youth and Women, Department of Education, Queensland Health, Queensland Police Service and Department of Justice and Attorney-General sections of this chapter, and the Department of Youth Justice section of Chapter 3 Capital Measures.
93
2019-20 Budget Measures
| | | | | | | | | | | | | | | | | | | | |
| | | 2018-19
$‘000 | | | 2019-20
$‘000 | | | 2020-21
$‘000 | | | 2021-22
$‘000 | | | 2022-23
$‘000 | |
Youth Justice Investment - Program Management Office | | | — | | | | 857 | | | | 855 | | | | — | | | | — | |
The Government is providing additional funding of $1.7 million over two years for a Youth Justice Program Management Office to support the whole-of-Government delivery of the Youth Justice Investment package.
This contributes to the whole-of-government investment for a suite of youth justice infrastructure and non-infrastructure initiatives of $154.5 million operating (including $143.1 million new funding and $11.4 million to be funded internally) and $178 million capital (including $140 million held centrally against estimated project costs) over five years. Details on the Youth Justice Investment measures can be found in the Department of Youth Justice, Department of Child Safety, Youth and Women, Department of Education, Queensland Health, Queensland Police Service and Department of Justice and Attorney-General sections of this chapter, and the Department of Youth Justice section of Chapter 3 Capital Measures.
| | | | | | | | | | | | | | | | | | | | |
| | | 2018-19
$‘000 | | | 2019-20
$‘000 | | | 2020-21
$‘000 | | | 2021-22
$‘000 | | | 2022-23
$‘000 | |
Youth Justice Investment - Conditional Bail | | | — | | | | 648 | | | | 573 | | | | — | | | | — | |
The Government is providing increased funding of $1.2 million over two years to continue additional youth workers for the Conditional Bail program which aims to reduce the risk of young people offending or breaching conditions while on bail.
This contributes to the whole-of-government investment for a suite of youth justice infrastructure and non-infrastructure initiatives of $154.5 million operating (including $143.1 million new funding and $11.4 million to be funded internally) and $178 million capital (including $140 million held centrally for estimated project costs) over five years. Details on the Youth Justice Investment measures can be found in the Department of Youth Justice, Department of Child Safety, Youth and Women, Department of Education, Queensland Health, Queensland Police Service and Department of Justice and Attorney-General sections of this chapter, and the Department of Youth Justice section of Chapter 3 Capital Measures.
94
2019-20 Budget Measures
| | | | | | | | | | | | | | | | | | | | |
| | | 2018-19
$‘000 | | | 2019-20
$‘000 | | | 2020-21
$‘000 | | | 2021-22
$‘000 | | | 2022-23
$‘000 | |
Youth Justice Investment - Risk and Dynamic Assessment Register | | | — | | | | 526 | | | | 841 | | | | 519 | | | | — | |
The Government is providing additional funding of $1.9 million over three years to support the development and implementation of a Risk and Dynamic Assessment Register to improve court assessment processes for young people.
This contributes to the whole-of-government investment for a suite of youth justice infrastructure and non-infrastructure initiatives of $154.5 million operating (including $143.1 million new funding and $11.4 million to be funded internally) and $178 million capital (including $140 million held centrally for estimated project costs) over five years. Details on the Youth Justice Investment measures can be found in the Department of Youth Justice, Department of Child Safety, Youth and Women, Department of Education, Queensland Health, Queensland Police Service and Department of Justice and Attorney-General sections of this chapter, and the Department of Youth Justice section of Chapter 3 Capital Measures.
| | | | | | | | | | | | | | | | | | | | |
| | | 2018-19
$‘000 | | | 2019-20
$‘000 | | | 2020-21
$‘000 | | | 2021-22
$‘000 | | | 2022-23
$‘000 | |
Youth Justice Investment - Youth Detention Centres: Maintenance Program | | | — | | | | 500 | | | | — | | | | — | | | | — | |
The Government is providing increased funding of $500,000 in 2019-20 to address essential maintenance projects at existing youth detention centres.
This contributes to the whole-of-government investment for a suite of youth justice infrastructure and non-infrastructure initiatives of $154.5 million operating (including $143.1 million new funding and $11.4 million to be funded internally) and $178 million capital (including $140 million held centrally for estimated project costs) over five years. Details on the Youth Justice Investment measures can be found in the Department of Youth Justice, Department of Child Safety, Youth and Women, Department of Education, Queensland Health, Queensland Police Service and Department of Justice and Attorney-General sections of this chapter, and the Department of Youth Justice section of Chapter 3 Capital Measures.
95
2019-20 Budget Measures
| | | | | | | | | | | | | | | | | | | | |
| | | 2018-19
$‘000 | | | 2019-20
$‘000 | | | 2020-21
$‘000 | | | 2021-22
$‘000 | | | 2022-23
$‘000 | |
Youth Justice Investment - Specialist Multi-Agency Response Teams | | | — | | | | 200 | | | | 200 | | | | 200 | | | | 200 | |
The Government is providing additional funding of $800,000 over four years, with a further $4.8 million internally funded by the department over four years, and $200,000 ongoing to support the Specialist Multi-Agency Response Teams to provide court-based assessment and referral services for young people.
This contributes to the whole-of-government investment for a suite of youth justice infrastructure and non-infrastructure initiatives of $154.5 million operating (including $143.1 million new funding and $11.4 million to be funded internally) and $178 million capital (including $140 million held centrally for estimated project costs) over five years. Details on the Youth Justice Investment measures can be found in the Department of Youth Justice, Department of Child Safety, Youth and Women, Department of Education, Queensland Health, Queensland Police Service and Department of Justice and Attorney-General sections of this chapter, and the Department of Youth Justice section of Chapter 3 Capital Measures.
| | | | | | | | | | | | | | | | | | | | |
| | | 2018-19
$‘000 | | | 2019-20
$‘000 | | | 2020-21
$‘000 | | | 2021-22
$‘000 | | | 2022-23
$‘000 | |
Youth Justice Investment - Mount Isa Transitional Hub | | | — | | | | — | | | | — | | | | — | | | | — | |
The Government is providing funding of $829,000 in 2019-20 from the Safer Communities Grant Program for the establishment of a transitional hub in Mount Isa to deliver after hours diversionary services to high risk young people. The hub will provide a safe therapeutic environment for police to refer young people who do not have appropriate accommodation or safe home environments. The hub will also deliver support services based on culturally appropriate assessments of risk and need, and engage other local service providers to deliver intensive and specialised support to the young people and their families.
This contributes to the whole-of-government investment for a suite of youth justice infrastructure and non-infrastructure initiatives of $154.5 million operating (including $143.1 million new funding and $11.4 million to be funded internally) and $178 million capital (including $140 million held centrally for estimated project costs) over five years. Details on the Youth Justice Investment measures can be found in the Department of Youth Justice, Department of Child Safety, Youth and Women, Department of Education, Queensland Health, Queensland Police Service and Department of Justice and Attorney-General sections of this chapter, and the Department of Youth Justice section of Chapter 3 Capital Measures.
96
2019-20 Budget Measures
| | | | | | | | | | | | | | | | | | | | |
| | | 2018-19
$‘000 | | | 2019-20
$‘000 | | | 2020-21
$‘000 | | | 2021-22
$‘000 | | | 2022-23
$‘000 | |
Youth Justice Investment - Queensland Youth Partnerships Initiative | | | — | | | | — | | | | — | | | | — | | | | — | |
The department is internally funding of $2.3 million over four years for the Queensland Youth Partnerships Initiative for a youth crime prevention and crime response which engages corporate and community partners including retailers.
This contributes to the whole-of-government investment for a suite of youth justice infrastructure and non-infrastructure initiatives of $154.5 million operating (including $143.1 million new funding and $11.4 million to be funded internally) and $178 million capital (including $140 million held centrally for estimated project costs) over five years. Details on the Youth Justice Investment measures can be found in the Department of Youth Justice, Department of Child Safety, Youth and Women, Department of Education, Queensland Health, Queensland Police Service and Department of Justice and Attorney-General sections of this chapter, and the Department of Youth Justice section of Chapter 3 Capital Measures.
97
2019-20 Budget Measures
Electoral Commission of Queensland
| | | | | | | | | | | | | | | | | | | | |
| | | 2018-19
$‘000 | | | 2019-20
$‘000 | | | 2020-21
$‘000 | | | 2021-22
$‘000 | | | 2022-23
$‘000 | |
Local Government Elections and State General Election | | | — | | | | 3,713 | | | | 7,745 | | | | — | | | | — | |
The Government is providing additional funding of $11.5 million over two years, and $3.3 million held centrally to deliver Local Government and State election events in 2020. The revenue component of this measure can be found in Chapter 4 Revenue Measures
98
2019-20 Budget Measures
Legislative Assembly of Queensland
| | | | | | | | | | | | | | | | | | | | |
| | | 2018-19
$‘000 | | | 2019-20
$‘000 | | | 2020-21
$‘000 | | | 2021-22
$‘000 | | | 2022-23
$‘000 | |
Electorate Office Technology Improvements | | | 1,459 | | | | 1,162 | | | | 1,041 | | | | 521 | | | | — | |
The Government is providing additional funding of $4.2 million over four years to deliver improved data service performance and reliability, data security, mobility and business tools through provision of new software and infrastructure. These improvements will assist Members and electorate staff to perform their duties and meet the community’s digital communication expectations.
99
2019-20 Budget Measures
Public Safety Business Agency
| | | | | | | | | | | | | | | | | | | | |
| | | 2018-19
$‘000 | | | 2019-20
$‘000 | | | 2020-21
$‘000 | | | 2021-22
$‘000 | | | 2022-23
$‘000 | |
Public Safety Regional Radio Communications | | | 7,007 | | | | 19,893 | | | | — | | | | — | | | | — | |
The Government is providing additional funding of $26.9 million over two years to upgrade the Queensland Fire and Emergency Services regional radio networks and equipment. This will ensure interoperability with other agencies and compliance with the Australian Communications and Media Authority. These funds will also provide for the development of a business case and strategy for the medium to long term future of public safety communications.
| | | | | | | | | | | | | | | | | | | | |
| | | 2018-19
$‘000 | | | 2019-20
$‘000 | | | 2020-21
$‘000 | | | 2021-22
$‘000 | | | 2022-23
$‘000 | |
Queensland Government Air - Aircraft Maintenance and Compliance | | | 1,165 | | | | 1,300 | | | | — | | | | — | | | | — | |
The Government is providing additional funding of $2.5 million over two years to ensure Queensland Government Air (QGAir) continues to be compliant with Civil Aviation Safety Authority requirements. This funding enables QGAir to continue to support the State for search and rescue, natural disasters, police and aeromedical operations, including organ retrievals, and transport services for Government. The capital component of this measure can be found in Chapter 3 Capital Measures.
100
2019-20 Budget Measures
Queensland Corrective Services
| | | | | | | | | | | | | | | | | | | | |
| | | 2018-19
$‘000 | | | 2019-20
$‘000 | | | 2020-21
$‘000 | | | 2021-22
$‘000 | | | 2022-23
$‘000 | |
Arthur Gorrie and Southern Queensland Correctional Centres | | | 751 | | | | 15,920 | | | | 36,328 | | | | 28,856 | | | | 29,575 | |
The Government is providing additional funding of $111.4 million over five years and $29.6 million per annum ongoing for the operations of Arthur Gorrie Correctional Centre and Southern Queensland Correctional Centre.
| | | | | | | | | | | | | | | | | | | | |
| | | 2018-19
$‘000 | | | 2019-20
$‘000 | | | 2020-21
$‘000 | | | 2021-22
$‘000 | | | 2022-23
$‘000 | |
Capricornia Correction Centre Expansion | | | — | | | | 14,672 | | | | 41,677 | | | | 42,887 | | | | 43,718 | |
The Government is providing additional funding of $143 million over four years and $43.7 million per annum ongoing to commission and operate the expanded Capricornia Correctional Centre.
| | | | | | | | | | | | | | | | | | | | |
| | | 2018-19
$‘000 | | | 2019-20
$‘000 | | | 2020-21
$‘000 | | | 2021-22
$‘000 | | | 2022-23
$‘000 | |
Correctional Centre Prisoner Growth | | | — | | | | 14,480 | | | | — | | | | — | | | | — | |
The Government is providing increased funding of $14.5 million in 2019-20 to safely manage the growth in prisoner numbers.
| | | | | | | | | | | | | | | | | | | | |
| | | 2018-19
$‘000 | | | 2019-20
$‘000 | | | 2020-21
$‘000 | | | 2021-22
$‘000 | | | 2022-23
$‘000 | |
Taskforce Flaxton | | | — | | | | 5,764 | | | | 6,491 | | | | 5,315 | | | | 5,444 | |
The Government is providing additional funding of $23 million over four years and $5.4 million per annum ongoing to commence implementing the recommendations of the Crime and Corruption Commission’s Taskforce Flaxton examination of corruption risks and corruption in Queensland prisons. The capital component of this measure can be found in Chapter 3 Capital Measures.
101
2019-20 Budget Measures
| | | | | | | | | | | | | | | | | | | | |
| | | 2018-19
$‘000 | | | 2019-20
$‘000 | | | 2020-21
$‘000 | | | 2021-22
$‘000 | | | 2022-23
$‘000 | |
Minor Capital Works and Maintenance | | | — | | | | 3,600 | | | | 3,600 | | | | 3,600 | | | | 3,600 | |
The Government is providing increased funding of $14.4 million over four years and $3.6 million per annum ongoing to upgrade and maintain infrastructure within correctional centres. The capital component of this measure can be found in Chapter 3 Capital Measures.
| | | | | | | | | | | | | | | | | | | | |
| | | 2018-19
$‘000 | | | 2019-20
$‘000 | | | 2020-21
$‘000 | | | 2021-22
$‘000 | | | 2022-23
$‘000 | |
Correctional Centre Disability Support Services | | | — | | | | 2,862 | | | | — | | | | — | | | | — | |
The Government is providing increased funding of $2.9 million in 2019-20 to continue providing improved service delivery for prisoners with disability or mental illness, with these responsibilities becoming embedded in Queensland Corrective Services’ ongoing service delivery from 2020-21 onwards.
| | | | | | | | | | | | | | | | | | | | |
| | | 2018-19
$‘000 | | | 2019-20
$‘000 | | | 2020-21
$‘000 | | | 2021-22
$‘000 | | | 2022-23
$‘000 | |
Parole Board Queensland | | | — | | | | 1,681 | | | | 1,628 | | | | 1,570 | | | | 1,610 | |
The Government is providing increased funding of $6.5 million over four years and $1.6 million per annum ongoing for additional resources for the Parole Board Queensland to address increasing demand.
| | | | | | | | | | | | | | | | | | | | |
| | | 2018-19
$‘000 | | | 2019-20
$‘000 | | | 2020-21
$‘000 | | | 2021-22
$‘000 | | | 2022-23
$‘000 | |
Tackling Alcohol Fuelled Violence Program | | | — | | | | 1,183 | �� | | | — | | | | — | | | | — | |
The Government is providing additional funding of $1.2 million in 2019-20 to continue supervised community service projects implemented within Safe Night Precincts across Queensland.
This forms part of the Government’s overall package of $6.6 million to continue the Tackling Alcohol Fuelled Violence Program in 2019-20. Further details can be found in the Department of Communities, Disability Services and Seniors and Department of Justice and Attorney-General sections of this chapter.
102
2019-20 Budget Measures
| | | | | | | | | | | | | | | | | | | | |
| | | 2018-19
$‘000 | | | 2019-20
$‘000 | | | 2020-21
$‘000 | | | 2021-22
$‘000 | | | 2022-23
$‘000 | |
Aurukun Prisoner Reintegration Program | | | — | | | | 650 | | | | 615 | | | | 630 | | | | 646 | |
The Government is providing additional funding of $2.5 million over four years and $646,000 per annum ongoing to continue the prisoner reintegration program in Aurukun.
| | | | | | | | | | | | | | | | | | | | |
| | | 2018-19
$‘000 | | | 2019-20
$‘000 | | | 2020-21
$‘000 | | | 2021-22
$‘000 | | | 2022-23
$‘000 | |
Enhanced Throughcare Service Delivery Model | | | — | | | | — | | | | — | | | | — | | | | — | |
The Government is providing additional funding of $35 million over four years across Queensland Corrective Services and Queensland Health, held centrally, for the delivery of rehabilitation and remand programs and services for remandees, prisoners and offenders.
This forms part of the Government’s overall package of $263.8 million over four years, including $227.9 million internally funded, to develop and deliver a whole-of-government throughcare service delivery model. Further details of this funding can be found in the Department of the Premier and Cabinet and Queensland Health sections of this chapter.
| | | | | | | | | | | | | | | | | | | | |
| | | 2018-19
$‘000 | | | 2019-20
$‘000 | | | 2020-21
$‘000 | | | 2021-22
$‘000 | | | 2022-23
$‘000 | |
Southern Queensland Correctional Precinct - Stage 2 | | | — | | | | — | | | | — | | | | — | | | | — | |
The Government is providing additional funding of $34.5 million, held centrally, towards an expansion of the Southern Queensland Correctional Precinct. The expansion will deliver a correctional centre with a focus on health and rehabilitation, which will reduce reoffending, and ease overcrowding across the correctional services system. The capital component of this measure can be found in Chapter 3 Capital Measures.
103
2019-20 Budget Measures
Queensland Fire and Emergency Services
| | | | | | | | | | | | | | | | | | | | |
| | | 2018-19
$‘000 | | | 2019-20
$‘000 | | | 2020-21
$‘000 | | | 2021-22
$‘000 | | | 2022-23
$‘000 | |
Improving Swimmer Safety including the Shark Control Program | | | — | | | | 200 | | | | 200 | | | | 200 | | | | 200 | |
The Government is providing additional funding of $800,000 over four years and $200,000 per annum ongoing to collaboratively deliver a swimmer safety education and awareness program to cover a range of swimmer safety issues including drowning, and the risks posed by sharks, crocodiles and irukandji jellyfish.
This forms part of the Government’s total funding package of $18.7 million over four years and $4.8 million per annum ongoing to improve swimmer safety. Further details can be found in the Department of Agriculture and Fisheries and the Department of Innovation, Tourism Industry Development and the Commonwealth Games sections of this chapter.
104
2019-20 Budget Measures
Queensland Health
| | | | | | | | | | | | | | | | | | | | |
| | | 2018-19
$‘000 | | | 2019-20
$‘000 | | | 2020-21
$‘000 | | | 2021-22
$‘000 | | | 2022-23
$‘000 | |
Operational Growth Funding | | | — | | | | 163,250 | | | | 128,172 | | | | 199,871 | | | | 594,345 | |
The Government is providing increased funding of $1.1 billion over four years to support the ongoing growth in demand for health services.
| | | | | | | | | | | | | | | | | | | | |
| | | 2018-19
$‘000 | | | 2019-20
$‘000 | | | 2020-21
$‘000 | | | 2021-22
$‘000 | | | 2022-23
$‘000 | |
National Disability Insurance Scheme Transition Support: Community health support programs | | | — | | | | 35,220 | | | | — | | | | — | | | | — | |
The Government is providing increased funding of $35.2 million in 2019-20 for the community nursing program, the Community Managed Mental Health Program, the Medical Aids Subsidy Scheme and the Housing and Support Program. This funding will ensure a smooth transition to the National Disability Insurance Scheme (NDIS) for Queenslanders with disability.
This funding is part of the total of $61.9 million over two years provided by the Queensland Government as a temporary measure while interface issues between the NDIS and mainstream services are resolved through national policy work, to ensure clients are able to access critical supports while they transition to the NDIS. Further details can be found in the Department of Child Safety, Youth and Women, Department of Communities, Disability Services and Seniors, and the Department of Transport and Main Roads sections of this chapter.
| | | | | | | | | | | | | | | | | | | | |
| | | 2018-19
$‘000 | | | 2019-20
$‘000 | | | 2020-21
$‘000 | | | 2021-22
$‘000 | | | 2022-23
$‘000 | |
Aeromedical Services Funding | | | — | | | | 13,976 | | | | 14,400 | | | | 14,840 | | | | 15,272 | |
The Government is providing increased funding of $58.5 million over four years from 2019-20 (including the release of $29.6 million held centrally) for community helicopter providers to support Queensland’s Emergency Helicopter Network services. Funding of $15.3 million per annum is being provided ongoing from 2023-24 for these services.
105
2019-20 Budget Measures
| | | | | | | | | | | | | | | | | | | | |
| | | 2018-19
$‘000 | | | 2019-20
$‘000 | | | 2020-21
$‘000 | | | 2021-22
$‘000 | | | 2022-23
$‘000 | |
Correctional Centre Health Services | | | 6,550 | | | | 9,255 | | | | 23,612 | | | | 29,789 | | | | 31,387 | |
The Government is providing additional funding of $100.6 million over five years and $31.4 million per annum ongoing to proactively address the health needs of prisoners by increasing health staff and improve the safety of health staff working in all Queensland correctional facilities.
| | | | | | | | | | | | | | | | | | | | |
| | | 2018-19
$‘000 | | | 2019-20
$‘000 | | | 2020-21
$‘000 | | | 2021-22
$‘000 | | | 2022-23
$‘000 | |
Shifting Minds Suicide Prevention Flagship | | | — | | | | 7,470 | | | | 13,705 | | | | 20,397 | | | | 20,355 | |
The Government is providing additional funding of $61.9 million over four years for a range of initiatives that better support suicide prevention under the Shifting Minds Suicide Prevention Flagship. These include increased investment in community mental health services and the establishment of the new Way Back initiative to provide follow-up support after a suicide attempt. Funding of $1.3 million over three years is being internally met by the Queensland Mental Health Commission to work with their key stakeholders in partnership with Aboriginal and Torres Strait Islander communities to support better mental health and suicide prevention responses.
This forms part of the Government’s total funding of $80.1 million over four years to support the Shifting Minds Suicide Prevention Flagship. Further details can be found in the Department of Aboriginal and Torres Strait Islander Partnerships and Department of Education sections of this chapter.
106
2019-20 Budget Measures
| | | | | | | | | | | | | | | | | | | | |
| | | 2018-19
$‘000 | | | 2019-20
$‘000 | | | 2020-21
$‘000 | | | 2021-22
$‘000 | | | 2022-23
$‘000 | |
Support for people with disability | | | — | | | | 4,430 | | | | 4,430 | | | | 4,430 | | | | 4,430 | |
The Government is providing increased funding of $17.7 million over four years and $2.7 million ongoing to continue providing state services to support people with disability. This includes the continuation of services previously provided by the Specialist Disability Services Assessment Outreach Team given these services will not be provided under the National Disability Insurance Scheme (NDIS), as well as to ensure continuity of support for Housing and Support Program clients not eligible for the NDIS.
This funding is part of the total of $62.7 million over four years provided by the Queensland Government to continue state services to meet obligations under State legislation and ensure continuity of support for people with disability in Queensland. Further details can be found in the Department of Justice and Attorney-General and Department of Communities, Disability Services and Seniors sections of this chapter.
| | | | | | | | | | | | | | | | | | | | |
| | | 2018-19
$‘000 | | | 2019-20
$‘000 | | | 2020-21
$‘000 | | | 2021-22
$‘000 | | | 2022-23
$‘000 | |
Right@Home | | | — | | | | 1,289 | | | | 1,588 | | | | 1,588 | | | | 758 | |
The Government is providing increased funding of $5.2 million over four years to expand a pilot of the Right@Home program to families living in vulnerable communities across Caboolture. Right@Home is a targeted health visiting program that aims to provide consistent support to improve parental care, parent-child attachment and improve the family environment.
| | | | | | | | | | | | | | | | | | | | |
| | | 2018-19
$‘000 | | | 2019-20
$‘000 | | | 2020-21
$‘000 | | | 2021-22
$‘000 | | | 2022-23
$‘000 | |
Court Link | | | — | | | | 586 | | | | 763 | | | | 763 | | | | 763 | |
The Government is providing additional funding of $2.9 million over four years and $763,000 per annum ongoing to expand the Queensland Magistrates Early Referral into Treatment (QMERIT) Program to Caboolture.
This forms part of Government’s overall package of $9.9 million over four years and $2.6 million per annum ongoing to expand Court Link and integrate with the QMERIT Program. Further details can be found in the Department of Justice and Attorney-General section of this chapter.
107
2019-20 Budget Measures
| | | | | | | | | | | | | | | | | | | | |
| | | 2018-19
$‘000 | | | 2019-20
$‘000 | | | 2020-21
$‘000 | | | 2021-22
$‘000 | | | 2022-23
$‘000 | |
Strengthening Coronial Services | | | — | | | | 534 | | | | 274 | | | | — | | | | — | |
The Government is providing increased funding of $808,000 over two years to employ medical professionals within a second temporary Registrar Unit in the Coroners Court of Queensland to enhance triaging practices.
This forms part of Government’s total funding of $3.9 million over four years and $474,000 per annum ongoing to support the Coroners Court of Queensland. Further details can be found in the Department of Justice and Attorney-General section of this chapter.
| | | | | | | | | | | | | | | | | | | | |
| | | 2018-19
$‘000 | | | 2019-20
$‘000 | | | 2020-21
$‘000 | | | 2021-22
$‘000 | | | 2022-23
$‘000 | |
Small Business Regulatory Reform | | | 400 | | | | 350 | | | | — | | | | — | | | | — | |
The Government is providing additional funding of $750,000 over two years from 2018-19 to 2019-20 for the Digital Food Safety Hub.
This forms part of the Queensland and Australian Government’s Small Business Regulatory Reform Project Agreement initiative to deliver projects that reduce the regulatory burden on small business. The projects undertaken as part of this Agreement will leverage $60.1 million in reward payments from the Australian Government upon successful completion of relevant project milestones. Further details can be found in the Department of Agriculture and Fisheries, Department of Employment, Small Business and Training and Department of Transport and Main Roads sections of this chapter.
108
2019-20 Budget Measures
| | | | | | | | | | | | | | | | | | | | |
| | | 2018-19
$‘000 | | | 2019-20
$‘000 | | | 2020-21
$‘000 | | | 2021-22
$‘000 | | | 2022-23
$‘000 | |
Youth Justice Investment - Additional 16 beds at Brisbane Youth Detention Centre | | | — | | | | 120 | | | | 668 | | | | 680 | | | | 696 | |
The Government is providing additional funding of $2.2 million over four years and $696,000 per annum ongoing to provide health services to support expanded capacity at the Brisbane Youth Detention Centre.
This forms part of the Government’s total investment of $27 million capital and $18.3 million operating over five years, and $5.7 million per annum operating ongoing for the additional 16 beds at Brisbane Youth Detention Centre. Further details can be found in the Department of Education and Department of Youth Justice sections of this chapter and the Department of Youth Justice section of Chapter 3 Capital Measures.
This contributes to the whole-of-government investment for a suite of youth justice infrastructure and non-infrastructure initiatives of $154.5 million operating (including $143.1 million new funding and $11.4 million to be funded internally) and $178 million capital (including $140 million held centrally for estimated project costs) over five years. Details on the Youth Justice Investment measures can be found in the Department of Youth Justice, Department of Child Safety, Youth and Women, Department of Education, Queensland Health, Queensland Police Service and Department of Justice and Attorney-General sections of this chapter, and the Department of Youth Justice section of Chapter 3 Capital Measures.
| | | | | | | | | | | | | | | | | | | | |
| | | 2018-19
$‘000 | | | 2019-20
$‘000 | | | 2020-21
$‘000 | | | 2021-22
$‘000 | | | 2022-23
$‘000 | |
Birthing in our Community Hub Expansion | | | — | | | | — | | | | — | | | | — | | | | — | |
Funding of $1.2 million over four years from 2019-20 is being internally funded by the department to expand the Birthing in our Community Hub which aims to achieve equity in birth outcomes, health status, and life expectancy for Aboriginal and Torres Strait Islander families.
109
2019-20 Budget Measures
| | | | | | | | | | | | | | | | | | | | |
| | | 2018-19
$‘000 | | | 2019-20
$‘000 | | | 2020-21
$‘000 | | | 2021-22
$‘000 | | | 2022-23
$‘000 | |
Deadly Choices Healthy Lifestyle Program | | | — | | | | — | | | | 8,200 | | | | 8,405 | | | | 8,615 | |
The Government will provide increased funding of $25.2 million over three years and $8.6 million per annum ongoing to expand the Deadly Choices Healthy Lifestyle Program. This program will be commissioned through the newly established Health and Wellbeing Queensland, which will have an initial focus on reducing the risk factors for chronic disease, particularly obesity, physical inactivity and poor nutrition.
| | | | | | | | | | | | | | | | | | | | |
| | | 2018-19
$‘000 | | | 2019-20
$‘000 | | | 2020-21
$‘000 | | | 2021-22
$‘000 | | | 2022-23
$‘000 | |
Enhanced Throughcare Service Delivery Model | | | — | | | | — | | | | — | | | | — | | | | — | |
The Government is providing additional funding of $35 million over four years across Queensland Corrective Services and Queensland Health, held centrally, for the delivery of rehabilitation and remand programs and services for remandees, prisoners and offenders.
This forms part of the Government’s overall package of $263.8 million over four years, including $227.9 million internally funded, to develop and deliver a whole-of-government throughcare service delivery model. Further details of this funding can be found in the Department of the Premier and Cabinet and Queensland Corrective Services sections of this chapter.
| | | | | | | | | | | | | | | | | | | | |
| | | 2018-19
$‘000 | | | 2019-20
$‘000 | | | 2020-21
$‘000 | | | 2021-22
$‘000 | | | 2022-23
$‘000 | |
Health and Wellbeing Queensland | | | — | | | | — | | | | — | | | | — | | | | — | |
Delivering on our election commitments, funding of $158.6 million over four years is being allocated to support the establishment of the new health promotion agency, Health and Wellbeing Queensland (HWQ) as a statutory body. This includes $133.4 million that is being internally funded by the department and increased funding of $25.2 million for the Deadly Choices Healthy Lifestyle Program. HWQ will contribute to improving the health and wellbeing of the Queensland population by reducing health inequity and reducing the burden of chronic diseases through targeting risk factors such as poor nutrition, low physical activity and obesity. Health promotion programs currently delivered by the department, which are aimed at reducing chronic disease and improving nutrition and physical activity, will transition to HWQ.
110
2019-20 Budget Measures
| | | | | | | | | | | | | | | | | | | | |
| | | 2018-19
$‘000 | | | 2019-20
$‘000 | | | 2020-21
$‘000 | | | 2021-22
$‘000 | | | 2022-23
$‘000 | |
Initiatives to improve patient flow and reduce unnecessary hospital activity | | | — | | | | — | | | | — | | | | — | | | | — | |
Funding of $50 million over two years is being internally funded by the department for trialling and evaluating diversionary initiatives in Hospital and Health Services to improve patient flow and reduce unnecessary hospital activity. This includes $17 million over two years for palliative care services available in community based settings.
| | | | | | | | | | | | | | | | | | | | |
| | | 2018-19
$‘000 | | | 2019-20
$‘000 | | | 2020-21
$‘000 | | | 2021-22
$‘000 | | | 2022-23
$‘000 | |
Midwives | | | — | | | | — | | | | — | | | | 15,170 | | | | 15,549 | |
Delivering on our election commitments, the Government will provide increased funding of $30.7 million over two years and $15.5 million per annum ongoing to continue employing an additional 100 midwives, to support maternity services across Queensland.
| | | | | | | | | | | | | | | | | | | | |
| | | 2018-19
$‘000 | | | 2019-20
$‘000 | | | 2020-21
$‘000 | | | 2021-22
$‘000 | | | 2022-23
$‘000 | |
Nurse Navigators | | | — | | | | — | | | | — | | | | 57,467 | | | | 59,315 | |
Delivering on our election commitments, the Government will provide increased funding of $116.8 million over two years and $59.3 million per annum ongoing to provide ongoing support for the Nurse Navigators program in Hospital and Health Services. The 400 Nurse Navigators ensure patients with chronic illnesses find the care most appropriate to their needs and play a vital role in coordinating clinical services and reducing preventable admissions to hospitals.
| | | | | | | | | | | | | | | | | | | | |
| | | 2018-19
$‘000 | | | 2019-20
$‘000 | | | 2020-21
$‘000 | | | 2021-22
$‘000 | | | 2022-23
$‘000 | |
Safe and Healthy Drinking Water in Indigenous Local Government Areas | | | — | | | | — | | | | — | | | | — | | | | — | |
Funding of $9.9 million over four years from 2019-20 is being internally funded by the department to improve the operation and management of drinking water supplies in Indigenous communities to ensure public health is protected.
111
2019-20 Budget Measures
| | | | | | | | | | | | | | | | | | | | |
| | | 2018-19
$‘000 | | | 2019-20
$‘000 | | | 2020-21
$‘000 | | | 2021-22
$‘000 | | | 2022-23
$‘000 | |
Specialist Outpatient Long Wait Strategy | | | — | | | | — | | | | 77,400 | | | | — | | | | — | |
Delivering on our election commitments, the Government will provide increased funding of $77.4 million in 2020-21 to extend the Specialist Outpatient Long Wait Strategy, to ensure patients continue to have timely access to specialist outpatient appointments.
| | | | | | | | | | | | | | | | | | | | |
| | | 2018-19
$‘000 | | | 2019-20
$‘000 | | | 2020-21
$‘000 | | | 2021-22
$‘000 | | | 2022-23
$‘000 | |
Youth Justice Investment - Navigate Your Health | | | — | | | | — | | | | — | | | | — | | | | — | |
Funding of $2.7 million over two years is being internally funded by the department for the Navigate Your Health initiative to expand the trial of comprehensive health screening and assessments for young people in care to include young people in the Youth Justice system.
This forms part of the Government’s total internal funding of $3.5 million over two years. Further details can be found in the Department of Child Safety, Youth and Women section of this chapter.
This contributes to the whole-of-government investment for a suite of youth justice infrastructure and non-infrastructure initiatives of $154.5 million operating (including $143.1 million new funding and $11.4 million to be funded internally) and $178 million capital (including $140 million held centrally for estimated project costs) over five years. Details on the Youth Justice Investment measures can be found in the Department of Youth Justice, Department of Child Safety, Youth and Women, Department of Education, Queensland Health, Queensland Police Service and Department of Justice and Attorney-General sections of this chapter, and the Department of Youth Justice section of Chapter 3 Capital Measures.
112
2019-20 Budget Measures
Queensland Police Service
| | | | | | | | | | | | | | | | | | | | |
| | | 2018-19
$‘000 | | | 2019-20
$‘000 | | | 2020-21
$‘000 | | | 2021-22
$‘000 | | | 2022-23
$‘000 | |
Monitoring Reportable Offenders | | | 4,884 | | | | 5,351 | | | | 5,476 | | | | 5,592 | | | | 5,724 | |
The Government is providing additional funding of $27 million over five years and $5.7 million per annum ongoing for the monitoring of reportable offenders following amendments to the Child Protection (Offender Reporting and Offender Prohibition Orders) Act 2004. The capital component of this measure can be found in Chapter 3 Capital Measures.
| | | | | | | | | | | | | | | | | | | | |
| | | 2018-19
$‘000 | | | 2019-20
$‘000 | | | 2020-21
$‘000 | | | 2021-22
$‘000 | | | 2022-23
$‘000 | |
Youth Justice Investment - Community-Based Intensive Supervision | | | — | | | | 9,410 | | | | — | | | | — | | | | — | |
The Government is providing additional funding of $9.4 million in 2019-20 to support the intensive supervision in the community of young people on bail. Dedicated teams of police officers and police liaison officers will undertake random surveillance and bail condition compliance checks during critical risk periods to support young people on bail in six locations across the state.
This contributes to the whole-of-government investment for a suite of youth justice infrastructure and non-infrastructure initiatives of $154.5 million operating (including $143.1 million new funding and $11.4 million to be funded internally) and $178 million capital (including $140 million held centrally for estimated project costs) over five years. Details on the Youth Justice Investment measures can be found in the Department of Youth Justice, Department of Child Safety, Youth and Women, Department of Education, Queensland Health, Queensland Police Service and Department of Justice and Attorney-General sections of this chapter, and the Department of Youth Justice section of Chapter 3 Capital Measures.
| | | | | | | | | | | | | | | | | | | | |
| | | 2018-19
$‘000 | | | 2019-20
$‘000 | | | 2020-21
$‘000 | | | 2021-22
$‘000 | | | 2022-23
$‘000 | |
Tackling Organised Crime | | | — | | | | 5,000 | | | | — | | | | — | | | | — | |
The Government is providing increased funding of $5 million in 2019-20 to continue the Government’s commitment to target crime hotspots throughout the State, and issues such as organised crime, alcohol fuelled violence and the drug ice.
113
2019-20 Budget Measures
| | | | | | | | | | | | | | | | | | | | |
| | | 2018-19
$‘000 | | | 2019-20
$‘000 | | | 2020-21
$‘000 | | | 2021-22
$‘000 | | | 2022-23
$‘000 | |
Body Worn Cameras for Police | | | — | | | | 2,100 | | | | 2,100 | | | | 2,100 | | | | — | |
The Government is providing increased funding of $6.3 million over three years to continue the body worn camera program to provide more effective and efficient policing services to the people of Queensland. This will enable the continuation of over 5,000 body worn camera devices.
| | | | | | | | | | | | | | | | | | | | |
| | | 2018-19
$‘000 | | | 2019-20
$‘000 | | | 2020-21
$‘000 | | | 2021-22
$‘000 | | | 2022-23
$‘000 | |
Civilian Prosecutors | | | — | | | | 1,858 | | | | 1,908 | | | | 1,960 | | | | 2,014 | |
The Government is providing increased funding of $7.7 million over four years and $2 million per annum ongoing for civilian prosecutors across the State. These staff will assist the Police Prosecution Corps to overcome significant increases in workload and ensure prosecutorial services meet the expectations of the community and the judiciary.
| | | | | | | | | | | | | | | | | | | | |
| | | 2018-19
$‘000 | | | 2019-20
$‘000 | | | 2020-21
$‘000 | | | 2021-22
$‘000 | | | 2022-23
$‘000 | |
Youth Justice Investment - Project Booyah - Framing the Future | | | 367 | | | | 982 | | | | 410 | | | | — | | | | — | |
The Government is providing increased funding of $1.8 million over three years to continue funding the Framing the Future initiative, as part of Project Booyah. Project Booyah is an early intervention program for at risk young people aiming to address participants’ disengagement with family, community and education, and reduce offending. The Framing the Future initiative will provide community-based youth support mentorship to graduates of Project Booyah.
The funding of $410,000 in 2020-21 contributes to the whole-of-government investment for a suite of youth justice infrastructure and non-infrastructure initiatives of $154.5 million operating (including $143.1 million new funding and $11.4 million to be funded internally) and $178 million capital (including $140 million held centrally for estimated project costs) over five years. Details on the Youth Justice Investment measures can be found in the Department of Youth Justice, Department of Child Safety, Youth and Women, Department of Education, Queensland Health, Queensland Police Service and Department of Justice and Attorney-General sections of this chapter, and the Department of Youth Justice section of Chapter 3 Capital Measures.
114
2019-20 Budget Measures
| | | | | | | | | | | | | | | | | | | | |
| | | 2018-19
$‘000 | | | 2019-20
$‘000 | | | 2020-21
$‘000 | | | 2021-22
$‘000 | | | 2022-23
$‘000 | |
Taskforce Orion | | | — | | | | 339 | | | | 653 | | | | 669 | | | | 685 | |
The Government is providing increased funding of $2.3 million over four years and $685,000 per annum ongoing to permanently integrate Taskforce Orion into the Queensland Police Service Child Abuse and Sexual Crime Group. Taskforce Orion was established in 2016 as part of the Government’s response to the Queensland Organised Crime Commission of Inquiry report to investigate child exploitation material, focusing on peer-to-peer sharing platforms.
| | | | | | | | | | | | | | | | | | | | |
| | | 2018-19
$‘000 | | | 2019-20
$‘000 | | | 2020-21
$‘000 | | | 2021-22
$‘000 | | | 2022-23
$‘000 | |
Youth Justice Investment - Additional Childrens Court Matters | | | 38 | | | | 225 | | | | — | | | | — | | | | — | |
The Government is providing increased funding of $263,000 over two years to continue Queensland Police Service prosecutorial services to increase cases heard in the Childrens Court.
This forms part of the total investment of $2.6 million over two years in additional Childrens Court matters. Further details can be found in the Department of Justice and Attorney-General section of this chapter.
This contributes to the whole-of-government investment for a suite of youth justice infrastructure and non-infrastructure initiatives of $154.5 million operating (including $143.1 million new funding and $11.4 million to be funded internally) and $178 million capital (including $140 million held centrally for estimated project costs) over five years. Details on the Youth Justice Investment measures can be found in the Department of Youth Justice, Department of Child Safety, Youth and Women, Department of Education, Queensland Health, Queensland Police Service and Department of Justice and Attorney-General sections of this chapter, and the Department of Youth Justice section of Chapter 3 Capital Measures.
115
2019-20 Budget Measures
| | | | | | | | | | | | | | | | | | | | |
| | | 2018-19
$‘000 | | | 2019-20
$‘000 | | | 2020-21
$‘000 | | | 2021-22
$‘000 | | | 2022-23
$‘000 | |
Youth Justice Investment - Townsville Community Youth Response | | | — | | | | 209 | | | | 215 | | | | 221 | | | | 226 | |
The Government is providing increased funding of $871,000 over four years to continue and expand the Townsville Community Youth Response by providing additional prosecutorial staff to support the Specialist High Risk Youth Court and address recommendations in the Townsville’s Voice: Local Solutions to Address Youth Crime report.
This forms part of the Government’s increased investment of $18.5 million over four years to support the Townsville Community Youth Response. Further details of this funding can be found in the Department of Justice and Attorney-General and Department of Youth Justice sections of this chapter.
This contributes to the whole-of-government investment for a suite of youth justice infrastructure and non-infrastructure initiatives of $154.5 million operating (including $143.1 million new funding and $11.4 million to be funded internally) and $178 million capital (including $140 million held centrally for estimated project costs) over five years. Details on the Youth Justice Investment measures can be found in the Department of Youth Justice, Department of Child Safety, Youth and Women, Department of Education, Queensland Health, Queensland Police Service and Department of Justice and Attorney-General sections of this chapter, and the Department of Youth Justice section of Chapter 3 Capital Measures.
| | | | | | | | | | | | | | | | | | | | |
| | | 2018-19
$‘000 | | | 2019-20
$‘000 | | | 2020-21
$‘000 | | | 2021-22
$‘000 | | | 2022-23
$‘000 | |
Counter-Terrorism Capability and Capacity | | | — | | | | — | | | | 774 | | | | — | | | | — | |
The Government will provide increased funding of $774,000 in 2020-21 to maintain counter-terrorism capability and capacity in response to the sustained national threat level. The funding will maintain the ability to profile and assess persons of interest, source valuable intelligence and counter violent extremism.
116
2019-20 Budget Measures
| | | | | | | | | | | | | | | | | | | | |
| | | 2018-19
$‘000 | | | 2019-20
$‘000 | | | 2020-21
$‘000 | | | 2021-22
$‘000 | | | 2022-23
$‘000 | |
Murri Court Expansion | | | — | | | | — | | | | — | | | | — | | | | — | |
Funding of $1.5 million over five years and $356,000 per annum ongoing has been internally met by the department for Queensland Police Service prosecutors to support the expansion of the Murri Court into Ipswich.
This forms part of the Government’s total funding of $4.1 million over five years, comprising of $2.5 million new funding and $1.5 million internal funding to expand the Murri Court to Ipswich. Further details can be found in the Department of Justice and Attorney-General section of this chapter.
| | | | | | | | | | | | | | | | | | | | |
| | | 2018-19
$‘000 | | | 2019-20
$‘000 | | | 2020-21
$‘000 | | | 2021-22
$‘000 | | | 2022-23
$‘000 | |
Targeting Serious and Organised Crime | | | — | | | | — | | | | 4,967 | | | | — | | | | — | |
The Government will provide increased funding of $5 million in 2020-21 to target serious and organised crime. This funding will ensure the Queensland Police Service has the resources to continue implementing the Government’s response to the Queensland Organised Crime Commission of Inquiry report and undertake operational and intelligence-driven activities, legislative reform and education and training.
| | | | | | | | | | | | | | | | | | | | |
| | | 2018-19
$‘000 | | | 2019-20
$‘000 | | | 2020-21
$‘000 | | | 2021-22
$‘000 | | | 2022-23
$‘000 | |
Youth Justice Investment - Police Overtime for Supervision of Young People in Watchhouses | | | 938 | | | | — | | | | — | | | | — | | | | — | |
The Government has provided additional funding of $938,000 in 2018-19 to support increased costs to supervise and support young people in watchhouses.
This contributes to the whole-of-government investment for a suite of youth justice infrastructure and non-infrastructure initiatives of $154.5 million operating (including $143.1 million new funding and $11.4 million to be funded internally) and $178 million capital (including $140 million held centrally for estimated project costs) over five years. Details on the Youth Justice Investment measures can be found in the Department of Youth Justice, Department of Child Safety, Youth and Women, Department of Education, Queensland Health, Queensland Police Service and Department of Justice and Attorney-General sections of this chapter, and the Department of Youth Justice section of Chapter 3 Capital Measures.
117
2019-20 Budget Measures
Queensland Treasury
| | | | | | | | | | | | | | | | | | | | |
| | | 2018-19
$‘000 | | | 2019-20
$‘000 | | | 2020-21
$‘000 | | | 2021-22
$‘000 | | | 2022-23
$‘000 | |
Camera Detection Offence Program | | | — | | | | 745 | | | | 2,030 | | | | 2,081 | | | | 2,360 | |
The Government is providing increased funding of $7.2 million over four years and $2.4 million per annum ongoing to reduce incidents of road trauma.
The Government is providing increased funding of $180.3 million over four years across departments as part of the Camera Detected Offence Program. Further details can be found in the Department of Transport and Main Roads section of this chapter. The capital component of this measure can be found in the Department of Transport and Main Roads section of Chapter 3 Capital Measures.
| | | | | | | | | | | | | | | | | | | | |
| | | 2018-19
$‘000 | | | 2019-20
$‘000 | | | 2020-21
$‘000 | | | 2021-22
$‘000 | | | 2022-23
$‘000 | |
Government Investment in Renewable Energy - CleanCo Queensland Limited Establishment | | | 10,000 | | | | — | | | | — | | | | — | | | | — | |
The Government has provided additional funding of $10 million in 2018-19 to establish and support the operations of Queensland’s newest renewable energy generator. $4 million of this funding is provided for the CleanCo Implementation Taskforce, which is in addition to $2.5 million originally provided under the Powering Queensland Plan to investigate CleanCo’s creation. A further $6 million is provided to CleanCo Queensland Limited as an operating grant.
This forms part of the Government’s total funding of $280 million over three years ($30 million new funding and $250 million internal funding) for Government Investment in Renewable Energy - CleanCo Queensland Limited Generation. The capital component of this measure can be found in Chapter 3 Capital Measures.
118
2019-20 Budget Measures
| | | | | | | | | | | | | | | | | | | | |
| | | 2018-19
$‘000 | | | 2019-20
$‘000 | | | 2020-21
$‘000 | | | 2021-22
$‘000 | | | 2022-23
$‘000 | |
Native Title Compensation Project Management Office | | | 872 | | | | 1,560 | | | | — | | | | — | | | | — | |
The Government is providing additional funding of $2.4 million over two years to support the Native Title Compensation Project Management Office to manage existing compensation claims made against the State and develop a Native Title Compensation Settlement Framework.
| | | | | | | | | | | | | | | | | | | | |
| | | 2018-19
$‘000 | | | 2019-20
$‘000 | | | 2020-21
$‘000 | | | 2021-22
$‘000 | | | 2022-23
$‘000 | |
Jobs and Regional Growth Fund | | | — | | | | — | | | | — | | | | — | | | | — | |
The Government is providing increased funding of $25 million, held centrally, to assist businesses and projects that will generate economic development and employment opportunities in regional Queensland. This increase brings the total funding to $175 million.
Queensland Treasury and the Department of State Development, Manufacturing, Infrastructure and Planning are jointly responsible for the Fund. Further details can be found in the Department of State Development, Manufacturing, Infrastructure and Planning section of this chapter.
| | | | | | | | | | | | | | | | | | | | |
| | | 2018-19
$‘000 | | | 2019-20
$‘000 | | | 2020-21
$‘000 | | | 2021-22
$‘000 | | | 2022-23
$‘000 | |
Resources Community Infrastructure Fund | | | — | | | | — | | | | — | | | | — | | | | — | |
The Government is providing additional funding of $30 million over three years, held centrally, to invest in improving critical economic and social infrastructure across Queensland’s resource communities.
119
2019-20 Budget Measures
Introduction
The following tables present the relevant portfolio capital measures relating to decisions taken since the 2018-19 Budget. This does not represent the full amount of additional funding provided to agencies since the 2018-19 Budget. For further explanation, refer to Explanation of Scope and Terms in Chapter 1.
120
2019-20 Budget Measures
Department of Agriculture and Fisheries
| | | | | | | | | | | | | | | | | | | | |
| | | 2018-19
$‘000 | | | 2019-20
$‘000 | | | 2020-21
$‘000 | | | 2021-22
$‘000 | | | 2022-23
$‘000 | |
Supporting Delivery of the Queensland Greyhound Racing Industry Commission of Inquiry (MacSporran Report) Recommendations | | | — | | | | 1,623 | | | | — | | | | — | | | | — | |
The Government is providing additional funding of $1.6 million in 2019-20 to fund Queensland Racing Industry Commission’s investment in the Registration and Licensing Environment to finalise the implementation of a contemporary digital licensing and registration system for the racing industry and the delivery of MacSporran Report recommendations for greyhound lifecycle tracking. The expense component of this measure can be found in Chapter 2 Expense Measures.
121
2019-20 Budget Measures
Department of Child Safety, Youth and Women
| | | | | | | | | | | | | | | | | | | | |
| | | 2018-19
$‘000 | | | 2019-20
$‘000 | | | 2020-21
$‘000 | | | 2021-22
$‘000 | | | 2022-23
$‘000 | |
Staged Replacement of Integrated Client Management System | | | — | | | | 14,782 | | | | 7,119 | | | | — | | | | — | |
The Government is providing increased funding of $21.9 million over two years to progress the next stage of the replacement of the current Integrated Client Management System. The new ‘Unify’ system will incorporate new and enhanced functionality for the department and the Department of Youth Justice, and for integrated multi-agency collaboration and improved sharing and management of child protection information, to better support children and families in the child protection and youth justice systems.
A further $56.8 million in capital funding is held centrally to deliver Tranche 1 of the new solution. The expense component of this measure can be found in Chapter 2 Expense Measures.
122
2019-20 Budget Measures
Department of Education
| | | | | | | | | | | | | | | | | | | | |
| | | 2018-19
$‘000 | | | 2019-20
$‘000 | | | 2020-21
$‘000 | | | 2021-22
$‘000 | | | 2022-23
$‘000 | |
Building Future Schools Fund - increased funding | | | 21,700 | | | | 146,500 | | | | 172,800 | | | | 102,900 | | | | 49,900 | |
The Government is providing increased funding of $493.8 million over five years to deliver world class learning environments for students, including the second stage of new schools opening in 2020, a further four new schools to open in 2021 and land acquisitions. Total funding for this initiative is $532.6 million over seven years (to 2024-25), bringing total investment in the Building Future Schools Fund to $1.3 billion.
| | | | | | | | | | | | | | | | | | | | |
| | | 2018-19
$‘000 | | | 2019-20
$‘000 | | | 2020-21
$‘000 | | | 2021-22
$‘000 | | | 2022-23
$‘000 | |
School infrastructure | | | 10,000 | | | | 101,300 | | | | 140,000 | | | | — | | | | — | |
The Government is providing increased funding of $251.3 million over three years for the provision of additional facilities at existing state schools experiencing enrolment growth.
| | | | | | | | | | | | | | | | | | | | |
| | | 2018-19
$‘000 | | | 2019-20
$‘000 | | | 2020-21
$‘000 | | | 2021-22
$‘000 | | | 2022-23
$‘000 | |
Air-conditioning in state schools | | | — | | | | 25,000 | | | | 25,000 | | | | 25,000 | | | | 25,000 | |
The Government is providing increased funding of $100 million over four years for priority state school air-conditioning projects, including the urgent replacement of air-conditioning units in schools in the Cooler Schools Zone and other priority school air-conditioning projects, which will be informed by a review of state school air-conditioning needs.
This is in addition to existing funding of $23 million in 2018-19 and $17 million per annum from 2019-20 for air-conditioning upgrades and maintenance, bringing total funding to $191 million over five years.
123
2019-20 Budget Measures
| | | | | | | | | | | | | | | | | | | | |
| | | 2018-19
$‘000 | | | 2019-20
$‘000 | | | 2020-21
$‘000 | | | 2021-22
$‘000 | | | 2022-23
$‘000 | |
Office of Industrial Relations ICT Investment | | | — | | | | 1,000 | | | | 1,000 | | | | 1,000 | | | | 1,000 | |
The Government is providing additional funding of $4 million over four years to support the implementation of recommendations from the Best Practice Review of Workplace Health and Safety Queensland.
Total funding for this initiative is $8 million over four years. The expense component of this measure can be found in Chapter 2 Expense Measures.
| | | | | | | | | | | | | | | | | | | | |
| | | 2018-19
$‘000 | | | 2019-20
$‘000 | | | 2020-21
$‘000 | | | 2021-22
$‘000 | | | 2022-23
$‘000 | |
Youth FlexiSpaces in Schools | | | — | | | | — | | | | — | | | | — | | | | — | |
Funding of $10 million over three years from 2019-20 is being internally met by the department to refurbish state school classrooms to provide an alternative learning environment for at-risk students.
Total funding for this initiative is $16.6 million over four years from 2018-19. The expense component of this measure can be found in Chapter 2 Expense Measures.
124
2019-20 Budget Measures
Department of Environment and Science
| | | | | | | | | | | | | | | | | | | | |
| | | 2018-19
$‘000 | | | 2019-20
$‘000 | | | 2020-21
$‘000 | | | 2021-22
$‘000 | | | 2022-23
$‘000 | |
Revitalising National Parks | | | — | | | | 10,000 | | | | — | | | | — | | | | — | |
The Government is providing increased funding of $10 million in 2019-20 to continue the revitalisation of infrastructure in National Parks including walking trails, lookouts, camping and day use facilities. The expense component of this measure can be found in Chapter 2 Expense Measures.
| | | | | | | | | | | | | | | | | | | | |
| | | 2018-19
$‘000 | | | 2019-20
$‘000 | | | 2020-21
$‘000 | | | 2021-22
$‘000 | | | 2022-23
$‘000 | |
Queensland Museum - Critical Maintenance and Infrastructure Works | | | — | | | | 6,655 | | | | 2,997 | | | | — | | | | — | |
The Government is providing increased funding of $9.7 million over two years to replace/upgrade the research and biodiversity collection storage at the Queensland Museum. The expense component of this measure can be found in Chapter 2 Expense Measures.
| | | | | | | | | | | | | | | | | | | | |
| | | 2018-19
$‘000 | | | 2019-20
$‘000 | | | 2020-21
$‘000 | | | 2021-22
$‘000 | | | 2022-23
$‘000 | |
Accelerating Science Delivery Innovation Tranche 2 | | | 365 | | | | 3,024 | | | | 84 | | | | (961 | ) | | | (961 | ) |
The Government is providing $3.5 million for Tranche 2 with increased funding of $1.6 million over five years and $1.9 million met internally for modernisation of critical scientific infrastructure and increased capacity to deliver enhanced scientific services across Queensland.
This forms part of the Government’s total equity investment of $6.4 million since 2017 into enhancing science-based management of the Queensland environment. The expense component of this measure can be found in Chapter 2 Expense Measures.
125
2019-20 Budget Measures
| | | | | | | | | | | | | | | | | | | | |
| | | 2018-19
$‘000 | | | 2019-20
$‘000 | | | 2020-21
$‘000 | | | 2021-22
$‘000 | | | 2022-23
$‘000 | |
Arts Infrastructure Investment Fund | | | — | | | | 2,500 | | | | 2,500 | | | | — | | | | — | |
The Government is providing increased funding of $5 million over two years to modernise Queensland Performing Arts Centre’s lighting through the installation of energy efficient LED lighting.
| | | | | | | | | | | | | | | | | | | | |
| | | 2018-19
$‘000 | | | 2019-20
$‘000 | | | 2020-21
$‘000 | | | 2021-22
$‘000 | | | 2022-23
$‘000 | |
Queensland Parks and Wildlife Service - Enhanced Fire Management | | | — | | | | 1,700 | | | | 3,600 | | | | 1,500 | | | | — | |
The Government is providing increased funding of $6.8 million over three years to provide for enhanced infrastructure and equipment to enable Queensland Parks and Wildlife Service to reduce risk to life, property and biodiversity from bushfires on the Protected Area Estate. The expense component of this measure can be found in Chapter 2 Expense Measures.
| | | | | | | | | | | | | | | | | | | | |
| | | 2018-19
$‘000 | | | 2019-20
$‘000 | | | 2020-21
$‘000 | | | 2021-22
$‘000 | | | 2022-23
$‘000 | |
Queensland Cultural Centre - Critical Infrastructure Asset Renewal | | | — | | | | 1,450 | | | | 5,470 | | | | — | | | | — | |
The Government is providing increased funding of $6.9 million over two years to continue the renewal of the Central Energy Plant at the Queensland Cultural Centre. This investment will ensure environmental conditions are maintained to meet increased service demand at the Queensland Cultural Centre.
| | | | | | | | | | | | | | | | | | | | |
| | | 2018-19
$‘000 | | | 2019-20
$‘000 | | | 2020-21
$‘000 | | | 2021-22
$‘000 | | | 2022-23
$‘000 | |
East Trinity Environmental Reserve - Infrastructure Program | | | — | | | | 940 | | | | 1,640 | | | | 570 | | | | — | |
The Government is providing additional funding of $3.2 million over three years for infrastructure to manage acid sulphate soils and environmental risks in the East Trinity Environmental Reserve and catchments flowing to the Great Barrier Reef.
126
2019-20 Budget Measures
| | | | | | | | | | | | | | | | | | | | |
| | | 2018-19
$‘000 | | | 2019-20
$‘000 | | | 2020-21
$‘000 | | | 2021-22
$‘000 | | | 2022-23
$‘000 | |
National Parks Harsh Environment Fire Vehicles | | | — | | | | 560 | | | | — | | | | — | | | | — | |
The Government is providing increased funding of $560,000 in 2019-20 towards the fitout of vehicles operating in harsh environments in Queensland’s Protected Area Estate, to ensure continued safety of staff, property and the community. The expense component of this measure can be found in Chapter 2 Expense Measures.
| | | | | | | | | | | | | | | | | | | | |
| | | 2018-19
$‘000 | | | 2019-20
$‘000 | | | 2020-21
$‘000 | | | 2021-22
$‘000 | | | 2022-23
$‘000 | |
Saving Queensland’s Threatened Species - Koalas | | | — | | | | 516 | | | | 300 | | | | — | | | | — | |
The Government is providing increased funding of $816,000 over two years for renewal of infrastructure at the Moggill Koala Rehabilitation Centre. The funding will provide vital infrastructure to support the care and rehabilitation of sick and injured koalas. The expense component of this measure can be found in Chapter 2 Expense Measures.
| | | | | | | | | | | | | | | | | | | | |
| | | 2018-19
$‘000 | | | 2019-20
$‘000 | | | 2020-21
$‘000 | | | 2021-22
$‘000 | | | 2022-23
$‘000 | |
Cape York Peninsula Tenure Resolution Program and National Park Joint Management with Traditional Owners | | | — | | | | 500 | | | | — | | | | — | | | | — | |
The Government is providing additional funding of $500,000 in 2019-20 for the acquisition of land under the Cape York Tenure Resolution Program. Acquired land will be managed as part of the Cape York Joint Management Program. The expense component of this measure can be found in Chapter 2 Expense Measures.
127
2019-20 Budget Measures
| | | | | | | | | | | | | | | | | | | | |
| | | 2018-19
$‘000 | | | 2019-20
$‘000 | | | 2020-21
$‘000 | | | 2021-22
$‘000 | | | 2022-23
$‘000 | |
North Stradbroke Island (Minjerribah) Protected Area Estate Expansion and Construction of Ranger Base | | | — | | | | — | | | | — | | | | — | | | | — | |
The Government is providing additional funding of $5.5 million over four years for the construction of a new ranger base on North Stradbroke Island (Minjerribah). The ranger base will support rangers employed by First Nations Peoples and Queensland Parks and Wildlife Service. Funding will be held centrally until the final cost of the Stage B additions and permanent ranger base are known. The expense component of this measure is can be found in Chapter 2 Expense Measures.
| | | | | | | | | | | | | | | | | | | | |
| | | 2018-19
$‘000 | | | 2019-20
$‘000 | | | 2020-21
$‘000 | | | 2021-22
$‘000 | | | 2022-23
$‘000 | |
Protected Area Acquisitions - Noosa Koala Corridor | | | — | | | | — | | | | — | | | | — | | | | — | |
Funding of $2.1 million is being internally met by the department for the acquisition of land in the Noosa koala corridor which will be added to the Protected Area Estate.
128
2019-20 Budget Measures
Department of Housing and Public Works
| | | | | | | | | | | | | | | | | | | | |
| | | 2018-19
$‘000 | | | 2019-20
$‘000 | | | 2020-21
$‘000 | | | 2021-22
$‘000 | | | 2022-23
$‘000 | |
Gabba Refurbishment | | | — | | | | 35,000 | | | | — | | | | — | | | | — | |
The Government is providing additional funding of $35 million in 2019-20 towards the refurbishment of the Gabba. The planned works will upgrade public, corporate and media facilities as well as streamlining entry to the venue.
| | | | | | | | | | | | | | | | | | | | |
| | | 2018-19
$‘000 | | | 2019-20
$‘000 | | | 2020-21
$‘000 | | | 2021-22
$‘000 | | | 2022-23
$‘000 | |
Government Employee Housing - Critical Works | | | — | | | | 27,700 | | | | — | | | | — | | | | — | |
The Government is providing increased funding of $27.7 million in 2019-20 for government employee housing, including $8.2 million for urgent upgrades and $19.5 million for new capital constructions. The expense component of this measure can be found in Chapter 2 Expense Measures.
| | | | | | | | | | | | | | | | | | | | |
| | | 2018-19
$‘000 | | | 2019-20
$‘000 | | | 2020-21
$‘000 | | | 2021-22
$‘000 | | | 2022-23
$‘000 | |
North Queensland Stadium | | | 43,500 | | | | — | | | | — | | | | — | | | | — | |
The Government has provided increased funding of $43.5 million in 2018-19 for the construction of the North Queensland Stadium. Funding of $40 million will complete the project with a further $3.5 million to install high-density Wi-Fi throughout the stadium and surrounding precinct.
This forms part of the Queensland Government’s overall capital contribution of $193.5 million to construct the stadium.
The North Queensland Stadium is a joint project of the Queensland Government, Australian Government, and Townsville City Council and is supported by both the National Rugby League and the North Queensland Cowboys. The stadium forms part of the Townsville City Deal signed in December 2016. The expense component of this measure can be found in Chapter 2 Expense Measures.
129
2019-20 Budget Measures
| | | | | | | | | | | | | | | | | | | | |
| | | 2018-19
$‘000 | | | 2019-20
$‘000 | | | 2020-21
$‘000 | | | 2021-22
$‘000 | | | 2022-23
$‘000 | |
Queensland Government Data Centres and Services | | | — | | | | — | | | | — | | | | — | | | | — | |
The Government is providing additional funding of $3.7 million over four years, held centrally, to support the delivery of a new, secure model of data centre service delivery for Queensland Government agencies. The expense component of this measure can be found in Chapter 2 Expense Measures.
130
2019-20 Budget Measures
Department of Innovation, Tourism Industry Development and the Commonwealth Games
| | | | | | | | | | | | | | | | | | | | |
| | | 2018-19
$‘000 | | | 2019-20
$‘000 | | | 2020-21
$‘000 | | | 2021-22
$‘000 | | | 2022-23
$‘000 | |
Wangetti Trail | | | — | | | | — | | | | 4,520 | | | | 25,928 | | | | — | |
The Government will provide additional funding of $30.5 million over two years to secure tenure for the Wangetti Trail and build the associated infrastructure, including preparation of eco-tourism accommodation sites.
Further details can be found in the Department of Innovation, Tourism Industry Development and the Commonwealth Games and Department of Environment and Science sections of Chapter 2 Expense Measures and the Department of Environment and Science section of Chapter 4 Revenue Measures.
131
2019-20 Budget Measures
Department of Justice and Attorney-General
| | | | | | | | | | | | | | | | | | | | |
| | | 2018-19
$‘000 | | | 2019-20
$‘000 | | | 2020-21
$‘000 | | | 2021-22
$‘000 | | | 2022-23
$‘000 | |
Courthouse Maintenance and Upgrades | | | — | | | | 2,375 | | | | 2,375 | | | | — | | | | — | |
The Government is providing additional funding of $4.8 million over two years for priority capital projects at various Queensland courthouses. The expense component of this measure can be found in Chapter 2 Expense Measures.
| | | | | | | | | | | | | | | | | | | | |
| | | 2018-19
$‘000 | | | 2019-20
$‘000 | | | 2020-21
$‘000 | | | 2021-22
$‘000 | | | 2022-23
$‘000 | |
Recording and Transcription Services | | | — | | | | 801 | | | | 1,898 | | | | — | | | | — | |
The Government is providing additional funding of $2.7 million over two years for the implementation of the new service delivery model for recording and transcription services. The expense component of this measure, including funds held centrally, can be found in Chapter 2 Expense Measures.
| | | | | | | | | | | | | | | | | | | | |
| | | 2018-19
$‘000 | | | 2019-20
$‘000 | | | 2020-21
$‘000 | | | 2021-22
$‘000 | | | 2022-23
$‘000 | |
Office of the Public Guardian | | | 175 | | | | 500 | | | | 400 | | | | 125 | | | | — | |
The Government is providing additional funding of $1.2 million over four years for the Office of the Public Guardian to undertake accommodation upgrades as part of responding to increased workloads and continuing to deliver protection to children in care and vulnerable adults. The expense component of this measure can be found in Chapter 2 Expense Measures.
| | | | | | | | | | | | | | | | | | | | |
| | | 2018-19
$‘000 | | | 2019-20
$‘000 | | | 2020-21
$‘000 | | | 2021-22
$‘000 | | | 2022-23
$‘000 | |
Community Justice Groups - System Enhancement | | | — | | | | 62 | | | | 188 | | | | — | | | | — | |
The Government is providing additional funding of $250,000 over two years to develop a grants management system as part of expanding Community Justice Groups, targeted at areas of greatest need. The expense component of this measure can be found in Chapter 2 Expense Measures.
132
2019-20 Budget Measures
Department of Natural Resources, Mines and Energy
| | | | | | | | | | | | | | | | | | | | |
| | | 2018-19
$‘000 | | | 2019-20
$‘000 | | | 2020-21
$‘000 | | | 2021-22
$‘000 | | | 2022-23
$‘000 | |
Hopeland (Linc Energy) Management and Remediation | | | — | | | | 3,770 | | | | 290 | | | | 100 | | | | 100 | |
The Government is providing increased funding of $4.3 million over four years ($4.4 million over five years) to continue the management and remediation of the former Linc Energy underground coal gasification site. The expense component of this measure can be found in Chapter 2 Expense Measures.
| | | | | | | | | | | | | | | | | | | | |
| | | 2018-19
$‘000 | | | 2019-20
$‘000 | | | 2020-21
$‘000 | | | 2021-22
$‘000 | | | 2022-23
$‘000 | |
Abandoned Mines - Care and Maintenance, Risk Mitigation, Remediation and Consultation | | | — | | | | 2,800 | | | | 500 | | | | — | | | | — | |
The Government is providing increased funding of $3.3 million over two years to manage safety, health and environmental risks at four high priority abandoned mine sites. The expense component of this measure can be found in Chapter 2 Expense Measures.
133
2019-20 Budget Measures
Department of Transport and Main Roads
| | | | | | | | | | | | | | | | | | | | |
| | | 2018-19
$‘000 | | | 2019-20
$‘000 | | | 2020-21
$‘000 | | | 2021-22
$‘000 | | | 2022-23
$‘000 | |
Cairns Shipping Development Project | | | 30,000 | | | | 30,000 | | | | — | | | | — | | | | — | |
The Government is providing additional funding of $60 million over two years for Ports North to undertake the Cairns Shipping Development Project. The project will widen and deepen the channel thereby increasing the size and number of cruise ships and other vessels able to berth in Cairns.
| | | | | | | | | | | | | | | | | | | | |
| | | 2018-19
$‘000 | | | 2019-20
$‘000 | | | 2020-21
$‘000 | | | 2021-22
$‘000 | | | 2022-23
$‘000 | |
Disaster Recovery Funding Arrangements | | | — | | | | 16,300 | | | | 33,700 | | | | — | | | | — | |
The Government is providing increased funding of $50 million over two years to restore assets damaged by 2018-19 natural disaster events.
| | | | | | | | | | | | | | | | | | | | |
| | | 2018-19
$‘000 | | | 2019-20
$‘000 | | | 2020-21
$‘000 | | | 2021-22
$‘000 | | | 2022-23
$‘000 | |
Townsville Channel Capacity Upgrade Project | | | 59,817 | | | | 10,000 | | | | 15,000 | | | | 15,000 | | | | 20,000 | |
The Government is providing additional funding of $59.8 million in 2018-19 for the Port of Townsville to undertake the Townsville Channel Capacity Upgrade Project. The total project cost is $193.5 million over six years. The Australian Government has committed to provide $75 million (of which $15 million is allocated beyond 2022-23) towards the completion of this project. Negotiations with the Australian Government over timing of this funding are ongoing. The Channel Capacity Upgrade forms part of the Townsville City Deal signed in December 2016.
134
2019-20 Budget Measures
| | | | | | | | | | | | | | | | | | | | |
| | | 2018-19
$‘000 | | | 2019-20
$‘000 | | | 2020-21
$‘000 | | | 2021-22
$‘000 | | | 2022-23
$‘000 | |
Camera Detected Offence Program | | | — | | | | 2,000 | | | | 15,750 | | | | 38,750 | | | | 110,000 | |
The Government is providing increased funding of $166.5 million over four years and $110 million per annum ongoing to improve the safety of the sections of state-controlled roads where accidents happen most frequently.
The Government is providing total increased funding of $180.3 million over four years across departments as part of the Camera Detected Offence Program. Further funding can be found in the Queensland Treasury and Department of Transport and Main Roads sections of Chapter 2 Expense Measures.
| | | | | | | | | | | | | | | | | | | | |
| | | 2018-19
$‘000 | | | 2019-20
$‘000 | | | 2020-21
$‘000 | | | 2021-22
$‘000 | | | 2022-23
$‘000 | |
Clapham Rail Yards land acquisition | | | — | | | | — | | | | — | | | | — | | | | — | |
Funding of $81 million over two years from 2019-20 is being internally funded by the department to purchase land for a train stabling facility at the Clapham Rail Yards in Yeerongpilly. The $380 million facility will provide for increased capacity and reliability of the rail network and will reduce empty running of trains.
| | | | | | | | | | | | | | | | | | | | |
| | | 2018-19
$‘000 | | | 2019-20
$‘000 | | | 2020-21
$‘000 | | | 2021-22
$‘000 | | | 2022-23
$‘000 | |
Port of Townsville Common User Facility | | | — | | | | — | | | | — | | | | — | | | | — | |
The Government is providing additional funding of $30 million over two years, held centrally, to contribute towards the construction and operation of containerised freight loading and unloading facilities at the Port of Townsville. The facility will be open for use by any above rail operator, will reduce the need for road transportation to the port and will benefit the North West Minerals Province through reduced transportation cost and time. The investment by Government is subject to the finalisation of the business case by the Port of Townsville Limited and shareholding Minister consideration.
The funding forms part of the Government’s broader package of $110 million over four years from 2019-20 to support the North West Minerals Province. This is in addition to the $39 million that was committed in the 2017-18 Budget to deliver initiatives to support the North West Minerals Province. The expense component of this measure can be found in Chapter 2 Expense Measures, under the title Mount Isa Line Below Rail Subsidy.
135
2019-20 Budget Measures
| | | | | | | | | | | | | | | | | | | | |
| | | 2018-19
$‘000 | | | 2019-20
$‘000 | | | 2020-21
$‘000 | | | 2021-22
$‘000 | | | 2022-23
$‘000 | |
Roma Street Busway Interchange | | | — | | | | — | | | | — | | | | — | | | | — | |
Funding of $250 million over five years from 2019-20 is being internally funded by the department to deliver an underground busway to rail interchange between the Cross River Rail station and the Roma Street Busway, to deliver enhanced connectivity between bus and rail at Queensland’s busiest public transport interchange. Delivery will be concurrent with underground works for the new Cross River Rail station.
136
2019-20 Budget Measures
Department of Youth Justice
| | | | | | | | | | | | | | | | | | | | |
| | | 2018-19
$‘000 | | | 2019-20
$‘000 | | | 2020-21
$‘000 | | | 2021-22
$‘000 | | | 2022-23
$‘000 | |
Youth Justice Investment - Additional 16 beds at Brisbane Youth Detention Centre | | | 150 | | | | 23,858 | | | | 3,000 | | | | — | | | | — | |
The Government is providing additional funding of $27 million over three years to deliver infrastructure for an additional 16 beds and associated facilities at the Brisbane Youth Detention Centre.
This forms part of the Government’s total investment of $27 million capital and $18.3 million operating over five years, and $5.7 million per annum operating ongoing for the additional 16 beds at Brisbane Youth Detention Centre. Further details can be found in the Department of Youth Justice, Department of Education and Queensland Health sections of Chapter 2 Expense Measures.
This contributes to the whole-of-government investment for a suite of youth justice infrastructure and non-infrastructure initiatives of $154.5 million operating (including $143.1 million new funding and $11.4 million to be funded internally) and $178 million capital (including $140 million held centrally for estimated project costs) over five years. Details on the Youth Justice Investment measures can be found in the Department of Youth Justice, Department of Child Safety, Youth and Women, Department of Education, Queensland Health, Queensland Police Service and Department of Justice and Attorney-General sections of this chapter, and the Department of Youth Justice section of Chapter 3 Capital Measures.
137
2019-20 Budget Measures
| | | | | | | | | | | | | | | | | | | | |
| | | 2018-19
$‘000 | | | 2019-20
$‘000 | | | 2020-21
$‘000 | | | 2021-22
$‘000 | | | 2022-23
$‘000 | |
Youth Justice Investment - New Youth Detention Centre at Wacol | | | 300 | | | | 9,700 | | | | — | | | | — | | | | — | |
The Government is providing additional funding of $10 million over two years to commence early works on a new 32 bed youth detention centre at Wacol to relieve pressures within the youth detention system. The Government is holding an additional $140 million centrally for the estimated total project cost.
This contributes to the whole-of-government investment for a suite of youth justice infrastructure and non-infrastructure initiatives of $154.5 million operating (including $143.1 million new funding and $11.4 million to be funded internally) and $178 million capital (including $140 million held centrally for estimated project costs) over five years. Details on the Youth Justice Investment measures can be found in the Department of Youth Justice, Department of Child Safety, Youth and Women, Department of Education, Queensland Health, Queensland Police Service and Department of Justice and Attorney-General sections of this chapter, and the Department of Youth Justice section of Chapter 3 Capital Measures.
| | | | | | | | | | | | | | | | | | | | |
| | | 2018-19
$‘000 | | | 2019-20
$‘000 | | | 2020-21
$‘000 | | | 2021-22
$‘000 | | | 2022-23
$‘000 | |
Youth Justice Investment - Youth Detention Centres: Upgrade Program | | | — | | | | 1,010 | | | | — | | | | — | | | | — | |
The Government is providing increased funding of $1 million in 2019-20 to address essential upgrade projects at existing youth detention centres.
This contributes to the whole-of-government investment for a suite of youth justice infrastructure and non-infrastructure initiatives of $154.5 million operating (including $143.1 million new funding and $11.4 million to be funded internally) and $178 million capital (including $140 million held centrally for estimated project costs) over five years. Details on the Youth Justice Investment measures can be found in the Department of Youth Justice, Department of Child Safety, Youth and Women, Department of Education, Queensland Health, Queensland Police Service and Department of Justice and Attorney-General sections of this chapter, and the Department of Youth Justice section of Chapter 3 Capital Measures.
138
2019-20 Budget Measures
Legislative Assembly of Queensland
| | | | | | | | | | | | | | | | | | | | |
| | | 2018-19
$‘000 | | | 2019-20
$‘000 | | | 2020-21
$‘000 | | | 2021-22
$‘000 | | | 2022-23
$‘000 | |
Critical Infrastructure and Services Upgrade Program | | | — | | | | 3,412 | | | | 6,219 | | | | 4,862 | | | | — | |
The Government is providing additional funding of $14.5 million over three years to undertake critical infrastructure works to the Parliamentary Annexe. Upgrades to the fire protection systems, air-conditioning units and electrical switchboard systems will ensure the safety of staff and visitors and ensure ongoing reliability of building infrastructure.
139
2019-20 Budget Measures
Public Safety Business Agency
| | | | | | | | | | | | | | | | | | | | |
| | | 2018-19
$‘000 | | | 2019-20
$‘000 | | | 2020-21
$‘000 | | | 2021-22
$‘000 | | | 2022-23
$‘000 | |
Queensland Government Air - Aircraft Maintenance and Compliance | | | 220 | | | | 6,611 | | | | — | | | | — | | | | — | |
The Government is providing additional funding of $6.8 million over two years to ensure Queensland Government Air (QGAir) continues to be compliant with Civil Aviation Safety Authority requirements. This funding enables QGAir to continue to support the State for search and rescue, natural disasters, police and aeromedical operations, including organ retrievals, and transport services for Government. The expense component of this measure can be found in Chapter 2 Expense Measures.
140
2019-20 Budget Measures
Queensland Corrective Services
| | | | | | | | | | | | | | | | | | | | |
| | | 2018-19
$‘000 | | | 2019-20
$‘000 | | | 2020-21
$‘000 | | | 2021-22
$‘000 | | | 2022-23
$‘000 | |
Minor Capital Works and Maintenance | | | — | | | | 8,000 | | | | 8,500 | | | | 5,600 | | | | — | |
The Government is providing increased funding of $22.1 million over three years to upgrade and maintain infrastructure within correctional centres. The expense component of this measure can be found in Chapter 2 Expense Measures.
| | | | | | | | | | | | | | | | | | | | |
| | | 2018-19
$‘000 | | | 2019-20
$‘000 | | | 2020-21
$‘000 | | | 2021-22
$‘000 | | | 2022-23
$‘000 | |
Taskforce Flaxton | | | — | | | | 2,200 | | | | — | | | | — | | | | — | |
The Government is providing additional funding of $2.2 million in 2019-20 to commence implementing the recommendations of the Crime and Corruption Commission’s Taskforce Flaxton examination of corruption risks and corruption in Queensland prisons. The expense component of this measure can be found in Chapter 2 Expense Measures.
| | | | | | | | | | | | | | | | | | | | |
| | | 2018-19
$‘000 | | | 2019-20
$‘000 | | | 2020-21
$‘000 | | | 2021-22
$‘000 | | | 2022-23
$‘000 | |
Expansion of Bunk Beds | | | — | | | | — | | | | — | | | | — | | | | — | |
The Government is providing increased funding of $15 million over two years, held centrally, to install additional purpose-built bunk beds.
| | | | | | | | | | | | | | | | | | | | |
| | | 2018-19
$‘000 | | | 2019-20
$‘000 | | | 2020-21
$‘000 | | | 2021-22
$‘000 | | | 2022-23
$‘000 | |
Southern Queensland Correctional Precinct - Stage 2 | | | — | | | | — | | | | — | | | | — | | | | — | |
The Government is providing additional funding of $620 million, held centrally, towards an expansion of the Southern Queensland Correctional Precinct. The expansion will deliver a correctional facility with a focus on health and rehabilitation, which will reduce reoffending, and ease overcrowding across the correctional services system. The expense component of this measure can be found in Chapter 2 Expense Measures.
141
2019-20 Budget Measures
Queensland Health
| | | | | | | | | | | | | | | | | | | | |
| | | 2018-19
$‘000 | | | 2019-20
$‘000 | | | 2020-21
$‘000 | | | 2021-22
$‘000 | | | 2022-23
$‘000 | |
Caboolture Hospital Carpark | | | — | | | | 1,650 | | | | 28,790 | | | | 11,740 | | | | 4,010 | |
The Government is providing additional funding of $46.2 million over four years ($46.6 million over five years) to build a new multi-storey carpark at the Caboolture Hospital to improve car parking access for patients, carers and their families.
| | | | | | | | | | | | | | | | | | | | |
| | | 2018-19
$‘000 | | | 2019-20
$‘000 | | | 2020-21
$‘000 | | | 2021-22
$‘000 | | | 2022-23
$‘000 | |
Caboolture Hospital Expansion | | | — | | | | — | | | | — | | | | 70,200 | | | | 30,000 | |
Delivering on our election commitments, the Government will provide increased funding to secure the $352.9 million expansion of the Caboolture Hospital. The expansion will deliver an additional 130 beds at Caboolture Hospital as well as the refurbishment of critical clinical support services to meet growing demand in the region.
The new four-story clinical services building will connect with the existing hospital on two levels, and will include a new emergency department with medical imaging services including CT, X-ray and ultrasound, 16-bed Transit Lounge, Operating theatres, 10-bed Intensive Care Unit, enhanced special care nursery with 15 bays, medical day stay unit, 10-bed Palliative Care unit, 20-bed Rehabilitation Unit including multiple therapy spaces and gymnasium, eight bed Cardiac Care Unit, four bed Chest Pain Assessment Unit and 16-bed medical ward, 14-bed geriatric evaluation and management (GEM) Unit, 32-bed medical inpatient ward, upgraded morgue, re-configured entry/exit point, expanded medical records facility, pharmacy and pathology and new café and visitor lounge.
This is part of the Building Better Hospitals program, which will help to deliver the critical infrastructure needed to meet the increase in current and future demand for hospitals and other healthcare services in the south-east Queensland growth corridor.
142
2019-20 Budget Measures
| | | | | | | | | | | | | | | | | | | | |
| | | 2018-19
$‘000 | | | 2019-20
$‘000 | | | 2020-21
$‘000 | | | 2021-22
$‘000 | | | 2022-23
$‘000 | |
Fraser Coast Mental Health Service | | | — | | | | — | | | | — | | | | — | | | | — | |
The Government is providing funding, held centrally, to support the delivery of a new 22-bed adult acute mental health inpatient unit at Hervey Bay Hospital and the refurbishment of the existing acute mental health inpatient unit at Maryborough Hospital. The Government has sought funding for the projects under the Australian Government’s Community Health and Hospitals Program and is awaiting outcomes.
| | | | | | | | | | | | | | | | | | | | |
| | | 2018-19
$‘000 | | | 2019-20
$‘000 | | | 2020-21
$‘000 | | | 2021-22
$‘000 | | | 2022-23
$‘000 | |
Infrastructure Maintenance Program | | | — | | | | — | | | | — | | | | — | | | | — | |
The Government is providing additional funding of $80 million over two years, held centrally, to support priority Information and Communications Technology infrastructure upgrades.
| | | | | | | | | | | | | | | | | | | | |
| | | 2018-19
$‘000 | | | 2019-20
$‘000 | | | 2020-21
$‘000 | | | 2021-22
$‘000 | | | 2022-23
$‘000 | |
Logan Hospital Expansion | | | — | | | | — | | | | — | | | | 120,000 | | | | 59,671 | |
Delivering on our election commitments, the Government will provide increased funding to secure the $460.9 million expansion of the Logan Hospital. The expansion will deliver an additional 206 beds with a vertical expansion of Building 3 and targeted refurbishment of other key locations.
The completed Logan Hospital Expansion project will provide 206 extra beds and include 9 operating theatres, 4 endoscopy suites, medical imaging including CT, X-Ray, Ultra, MRI and fluoroscopy, pharmacy, pathology, an 11-bed intensive care unit, nine chemotherapy chairs, expanded maternity services, outpatients, child and youth mental health, a medical lounge, kitchen expansion and full refurbishment and staff dining.
This is part of the Building Better Hospitals program, which will help to deliver the critical infrastructure needed to meet the increase in current and future demand for hospitals and other healthcare services in the south-east Queensland growth corridor.
143
2019-20 Budget Measures
| | | | | | | | | | | | | | | | | | | | |
| | | 2018-19
$‘000 | | | 2019-20
$‘000 | | | 2020-21
$‘000 | | | 2021-22
$‘000 | | | 2022-23
$‘000 | |
Redcliffe Hospital MRI and CT Scanner | | | — | | | | — | | | | — | | | | — | | | | — | |
Funding of $16 million over three years is being internally funded by the department to purchase a new magnetic resonance imaging (MRI) machine and a computerised tomography (CT) scanner for Redcliffe Hospital.
144
2019-20 Budget Measures
Queensland Police Service
| | | | | | | | | | | | | | | | | | | | |
| | | 2018-19
$‘000 | | | 2019-20
$‘000 | | | 2020-21
$‘000 | | | 2021-22
$‘000 | | | 2022-23
$‘000 | |
Monitoring Reportable Offenders | | | 640 | | | | — | | | | — | | | | — | | | | — | |
The Government has provided additional funding of $640,000 in 2018-19 for the purchase of vehicles required for the monitoring of reportable offenders following amendments to the Child Protection (Offender Reporting and Offender Prohibition Orders) Act 2004. The expense component of this measure can be found in Chapter 2 Expense Measures.
145
2019-20 Budget Measures
Queensland Treasury
| | | | | | | | | | | | | | | | | | | | |
| | | 2018-19
$‘000 | | | 2019-20
$‘000 | | | 2020-21
$‘000 | | | 2021-22
$‘000 | | | 2022-23
$‘000 | |
Government Investment in Renewable Energy - CleanCo Queensland Limited Establishment | | | 20,000 | | | | — | | | | — | | | | — | | | | — | |
The Government has provided additional funding of $20 million in 2018-19 to CleanCo Queensland Limited to support the operations of Queensland’s new government owned renewable energy generator during its establishment phase.
This forms part of the Government’s total funding of $280 million over three years ($30 million new funding and $250 million internally met) for Government Investment in Renewable Energy - CleanCo Queensland Limited Generation. Further details can be found in Chapter 2 Expense Measures.
| | | | | | | | | | | | | | | | | | | | |
| | | 2018-19
$‘000 | | | 2019-20
$‘000 | | | 2020-21
$‘000 | | | 2021-22
$‘000 | | | 2022-23
$‘000 | |
Government Investment in Renewable Energy - CleanCo Queensland Limited Generation | | | — | | | | — | | | | — | | | | — | | | | — | |
The Government is providing additional funding of $250 million over two years ($150 million in 2019-20 and $100 million in 2020-21), held centrally, for CleanCo Queensland Limited to build, own and operate new commercial renewable energy generation in Queensland. This funding will be provided to CleanCo as projects are approved. This funding has been reallocated from several sources. $100 million from the Waste Disposal Levy revenue has been allocated as part of this funding. The Government’s existing $50 million for Solar Thermal has been allocated to CleanCo, which is best placed to deliver innovative and regional projects including Solar Thermal. CleanCo has also been reallocated $100 million for the proposed Burdekin Falls Dam hydro-electric power station pending further consideration of this project. In the event that the project is not progressed, CleanCo will be required to invest this funding in a regional renewable energy project to support regional jobs, and help the Government reach its 50/50 renewable energy target by 2030.
This forms part of the Government’s total funding of $280 million over three years ($30 million new funding and $250 million internally met) for Government Investment in Renewable Energy - CleanCo Queensland Limited Generation. Further details can be found in Chapter 2 Expense Measures.
146
2019-20 Budget Measures
Introduction
The following tables present the relevant portfolio revenue measures relating to decisions taken since the 2018-19 Budget. For further explanation, refer to Explanation of Scope and Terms in Chapter 1.
147
2019-20 Budget Measures
Department of Education
| | | | | | | | | | | | | | | | | | | | |
| | | 2018-19
$‘000 | | | 2019-20
$‘000 | | | 2020-21
$‘000 | | | 2021-22
$‘000 | | | 2022-23
$‘000 | |
Amendments to the Schedule of Fees prescribed in the Education (Queensland Curriculum and Assessment Authority) Regulation 2014 | | | — | | | | 637 | | | | 539 | | | | 553 | | | | 567 | |
The Government will amend the schedule of fees prescribed in the Education (Queensland Curriculum and Assessment Authority) Regulation 2014 to support the introduction of the new senior assessment and tertiary entrance arrangements, ensuring certain existing fees represent full cost recovery, and removing fees for discontinued services.
148
2019-20 Budget Measures
Department of Environment and Science
| | | | | | | | | | | | | | | | | | | | |
| | | 2018-19
$‘000 | | | 2019-20
$‘000 | | | 2020-21
$‘000 | | | 2021-22
$‘000 | | | 2022-23
$‘000 | |
Wangetti Trail | | | — | | | | — | | | | — | | | | — | | | | 2,111 | |
The Government will receive payments from the operator of the Wangetti Trail estimated at $2.1 million per annum from 2022-23, recognising new camping opportunities arising from the opening of the Wangetti Trail. This revenue will contribute to the cost of operating and maintaining the trail.
Further details can be found in the Department of Innovation, Tourism Industry Development and the Commonwealth Games and Department of Environment and Science sections of Chapter 2 Expense Measures and the Department of Innovation, Tourism Industry Development and the Commonwealth Games section of Chapter 3 Capital Measures.
| | | | | | | | | | | | | | | | | | | | |
| | | 2018-19
$‘000 | | | 2019-20
$‘000 | | | 2020-21
$‘000 | | | 2021-22
$‘000 | | | 2022-23
$‘000 | |
Reduction in Regulated Fees - Pig Keeping | | | (34 | ) | | | (155 | ) | | | (159 | ) | | | (163 | ) | | | (166 | ) |
The Government is reducing fees paid for Environmentally Relevant Activity Pig Keeping. The environmental risk assessment for the activity has been revised to reflect contemporary operations in the Queensland industry. This has led to a reduction in the annual fee payable for an environmental authority for carrying out the pig keeping activity.
149
2019-20 Budget Measures
Department of Natural Resources, Mines and Energy
| | | | | | | | | | | | | | | | | | | | |
| | | 2018-19
$‘000 | | | 2019-20
$‘000 | | | 2020-21
$‘000 | | | 2021-22
$‘000 | | | 2022-23
$‘000 | |
Drought Assistance Package and Queensland Drought Reform | | | — | | | | — | | | | — | | | | — | | | | — | |
The Government is providing fee and rental relief of up to $4.2 million in 2019-20, held centrally, as part of the Drought Assistance Package and Queensland Drought Reform. This includes rent rebates for primary production tenures and waiver of annual water licence fees in drought declared local government areas or on individually droughted properties.
The Drought Assistance Package and Queensland Drought Reform is a total of up to
$74.6 million over four years from 2019-20 to support drought affected communities across the State. Further details can be found in the Department of Agriculture and Fisheries, Department of Communities, Disability Services and Seniors and the Department of Natural Resources, Mines and Energy sections of Chapter 2 Expense Measures.
150
2019-20 Budget Measures
Department of Transport and Main Roads
| | | | | | | | | | | | | | | | | | | | |
| | | 2018-19
$‘000 | | | 2019-20
$‘000 | | | 2020-21
$‘000 | | | 2021-22
$‘000 | | | 2022-23
$‘000 | |
Cost Recovery for Drink Driving Reforms | | | — | | | | 3,081 | | | | 3,234 | | | | 3,434 | | | | 3,642 | |
The Government is increasing the existing Interlock ‘I’ Condition Licence fee and introducing new fees for the Brief Intervention Education Program and Repeat Offender Education Program. The expense component of this measure can be found in Chapter 2 Expense Measures.
151
2019-20 Budget Measures
Electoral Commission of Queensland
| | | | | | | | | | | | | | | | | | | | |
| | | 2018-19
$‘000 | | | 2019-20
$‘000 | | | 2020-21
$‘000 | | | 2021-22
$‘000 | | | 2022-23
$‘000 | |
Local Government Elections | | | — | | | | — | | | | 3,713 | | | | — | | | | — | |
The Government will recuperate funding of $3.7 million from councils associated with conducting Local Government elections to be held in March 2020. The expense component of this measure can be found in Chapter 2 Expense Measures.
152
2019-20 Budget Measures
Queensland Treasury
| | | | | | | | | | | | | | | | | | | | |
| | | 2018-19
$‘000 | | | 2019-20
$‘000 | | | 2020-21
$‘000 | | | 2021-22
$‘000 | | | 2022-23
$‘000 | |
Land tax - foreign surcharge | | | — | | | | 131,000 | | | | 134,000 | | | | 136,000 | | | | 139,000 | |
The Government will increase the land tax absentee surcharge rate from 1.5% to 2.0% from 2019-20. The application of the surcharge will also be widened to include foreign corporations and trustees of foreign trusts. These measures are estimated to raise $540 million over four years. The determination of absentee status for land tax purposes will also be adjusted so that Australian citizens and permanent residents are no longer classed as absentees and will be exempt from the absentee surcharge.
| | | | | | | | | | | | | | | | | | | | |
| | | 2018-19
$‘000 | | | 2019-20
$‘000 | | | 2020-21
$‘000 | | | 2021-22
$‘000 | | | 2022-23
$‘000 | |
Royalties - Petroleum royalty rate increase | | | — | | | | 113,000 | | | | 123,000 | | | | 120,000 | | | | 120,000 | |
The Government is increasing the petroleum royalty rate by 2.5% to 12.5% from 2019-20. This will increase revenue by $476 million over the four years ending 2022-23. A transitional arrangement for one year will apply for royalty payers that lodge and pay on an annual basis ending 31 December 2019.
An increased petroleum royalty rate helps ensure a reasonable return is made to the community for the extraction of Queensland resources, and a rate of 12.5% for petroleum remains competitive with other royalty regimes internationally. For example, petroleum royalty in the USA are generally charged at a rate between 12.5% and 30% of the wellhead, while crown royalty rates in Canada are typically up to 45%.
The Government will also review the design of Queensland’s current petroleum royalty regime to ensure greater certainty and equity for all parties and identify opportunities to simplify the current regime, while providing an appropriate return to Queenslanders. While the Government has already taken measures to ensure greater certainty of domestic gas supply (for example, through release of gas tenures specifically to supply domestic gas), the review will identify further opportunities to strengthen domestic supply through the royalty regime settings.
153
2019-20 Budget Measures
| | | | | | | | | | | | | | | | | | | | |
| | | 2018-19
$‘000 | | | 2019-20
$‘000 | | | 2020-21
$‘000 | | | 2021-22
$‘000 | | | 2022-23
$‘000 | |
Land tax - Increased rate for Companies and Trusts | | | — | | | | 56,000 | | | | 58,000 | | | | 60,000 | | | | 64,000 | |
The Government will increase land tax rates for companies and trusts by 0.25 cents for each dollar above $5 million from the 2019-20 assessment year. These changes are estimated to increase revenue by $238 million over the four years ending 2022-23. The land tax rates for individuals will not be affected.
| | | | | | | | | | | | | | | | | | | | |
| | | 2018-19
$‘000 | | | 2019-20
$‘000 | | | 2020-21
$‘000 | | | 2021-22
$‘000 | | | 2022-23
$‘000 | |
Additional Revenue Compliance Program | | | — | | | | 20,000 | | | | 40,000 | | | | 80,000 | | | | 80,000 | |
The Government will increase revenue compliance work undertaken by Queensland Treasury. The compliance program is expected to increase revenue, net of the additional costs, by $220 million over four years, ending 2022-23.
| | | | | | | | | | | | | | | | | | | | |
| | | 2018-19
$‘000 | | | 2019-20
$‘000 | | | 2020-21
$‘000 | | | 2021-22
$‘000 | | | 2022-23
$‘000 | |
Payroll tax reform for jobs growth (net revenue impact) | | | — | | | | (45,000 | ) | | | (138,000 | ) | | | (121,000 | ) | | | (37,000 | ) |
The Government will deliver a package of targeted payroll tax measures to drive employment in Queensland businesses, particularly small, medium and growing businesses in regional Queensland. The measures include a higher payroll tax exemption threshold, reduced payroll tax rates for regional employers over the forward estimates, a two-year extension to the 50% apprentice and trainee rebate and rebates to Queensland employers (capped at $20,000 annually per employer) will be available where employee numbers are increased.
The Government is committing $885 million over four years to these measures, which are being partially funded by an increase in the payroll tax rate applying to employers with annual taxable wages above $6.5 million. Combined, the reforms to payroll tax are estimated to have a net revenue reduction of $341 million over the four years ending 2022-23.
154
Queensland Budget 2019–20 Budget Measures Budget Paper No.4
Queensland Budget 2019-20
Budget Measures Budget Paper No.4
budget.qld.gov.au