EXHIBIT (c)(iv)
Queensland’s Budget Papers for 2021-22
FORWARD-LOOKING STATEMENTS
This exhibit contains forward-looking statements. Statements that are not historical facts, including statements about the State of Queensland’s (the “State” or “Queensland”) beliefs and expectations, are forward-looking statements. These statements are based on current plans, budgets, estimates and projections and therefore you should not place undue reliance on them. The words “believe”, “may”, “will”, “should”, “estimate”, “continue”, “anticipate”, “intend”, “expect”, “forecast” and similar words are intended to identify forward-looking statements. Forward-looking statements speak only as of the date they are made, and neither the Queensland Treasury Corporation nor the State undertake any obligation to update publicly any of them in light of new information or future events.
Forward-looking statements are based on current plans, estimates and projections and, therefore, undue reliance should not be placed on them. Although the Queensland Treasury Corporation and the State believe that the beliefs and expectations reflected in such forward-looking statements are reasonable, no assurance can be given that such beliefs and expectations will prove to have been correct. Forward-looking statements involve inherent risks and uncertainties. We caution you that actual results may differ materially from those contained in any forward-looking statements.
A number of important factors could cause actual results to differ materially from those expressed in any forward-looking statement. Factors that could cause the actual outcomes to differ materially from those expressed or implied in forward-looking statements include:
| | • | | the international and Australian economies, and in particular the rates of growth (or contraction) of the State’s major trading partners; |
| | • | | the effects, both internationally and in Australia, of any subsequent economic downturn, as well as the effect of ongoing economic, banking and sovereign debt risk; |
| | • | | the effect of the ongoing novel coronavirus (COVID-19) pandemic; |
| | • | | increases or decreases in international and Australian domestic interest rates; |
| | • | | changes in the State’s domestic consumption; |
| | • | | changes in the State’s labor force participation and productivity; |
| | • | | downgrades in the credit ratings of the State and Australia; |
| | • | | changes in the rate of inflation in the State; |
| | • | | changes in environmental and other regulation; and |
| | • | | changes in the distribution of revenue from the Commonwealth of Australia Government to the State. |
(c)(iv)-1
| | |
| QUEENSLAND BUDGET 2021-22 | | Unite & Recover |
BUDGET SPEECH
BUDGET PAPER NO. 1
budget.qld.gov.au


2021–22 Queensland Budget Papers
1. Budget Speech
2. Budget Strategy and Outlook
3. Capital Statement
Service Delivery Statements
Appropriation Bills
Budget Highlights
Regional Action Plans
The budget papers are available online at budget.qld.gov.au
© The State of Queensland (Queensland Treasury) 2021
Copyright
This publication is protected by the Copyright Act 1968
Licence
This document is licensed by the State of Queensland (Queensland Treasury) under a Creative Commons Attribution (CC BY 4.0) International licence.

In essence, you are free to copy, communicate and adapt this publication, as long as you attribute the work to the State of Queensland (Queensland Treasury). To view a copy of this licence, visit http://creativecommons.org/licenses/by/4.0/
Attribution
Content from this publication should be attributed to:
© The State of Queensland (Queensland Treasury) - 2021–22 Queensland Budget

Translating and interpreting assistance
The Queensland Government is committed to providing accessible services to Queenslanders from all cultural and linguistic backgrounds. If you have difficulty in understanding this publication, you can contact us on telephone (07) 3035 3503 and we will arrange an interpreter to effectively communicate the report to you.
Budget Speech
Budget Paper No. 1
ISSN 1445-4890 (Print)
ISSN 1445-4904 (Online)
Appropriation Bill 2021
First Reading Speech, 15 June 2021
The Honourable Cameron Dick MP
Treasurer, Minister for Investment
Speaker, the Budget that I present today demonstrates that Queensland’s COVID-19 Economic Recovery Plan is working.
This Plan, endorsed by the people of Queensland just eight months ago, recognises the issues that are important to Queenslanders in a time of unprecedented global uncertainty.
It recognises the importance of better hospitals in giving Queenslanders the confidence that they will be cared for should they need it.
It recognises the importance of smarter schools in educating our children for the jobs of tomorrow.
Page 1 of 52
It recognises the importance of safer roads in creating jobs and driving economic growth.
And it recognises the importance of social and community support that Queenslanders know our government will deliver and always protect.
Our Plan, and the Budget, have at their heart the fundamental lesson that COVID-19 has taught every one of us.
When you protect the health of your people, then jobs will grow.
That is what we see in Queensland today – an economy that is roaring back to life.
Not in spite of our disciplined focus on getting the health response right, but precisely because of it.
Page 2 of 52
Fighting COVID-19 is not the binary choice that some would have us believe, with health on one side and the economy on the other.
Our economy is succeeding only because we have protected the health of Queenslanders.
The right health response enables our economy to recover and grow with confidence.
And this is a Budget that invests in growth.
Growth in jobs.
Growth in services, including health.
Growth in vital infrastructure.
Growth across Queensland.
Our health response stands as a testament to the tenacity, sacrifice and determination of Queenslanders.
Page 3 of 52
And the result of that health response is our strong economic recovery.
To some, the fact Queensland was able to avoid a depression or prolonged recession would be an achievement in itself.
But today, Queensland’s economy is bigger than it was before the pandemic.
On almost every indicator we have seen this year, Queensland is outperforming the rest of Australia.
Household spending – growing faster than the rest of Australia.
Dwelling approvals – growing faster than the rest of Australia.
Dwelling investment – growing faster than the rest of Australia.
Page 4 of 52
Construction starts – growing faster than the rest of Australia.
And our domestic economy – growing faster than the rest of Australia.
We have created more jobs since the depths of the pandemic than anywhere else in Australia.
Speaker, these are not just numbers on a Budget Paper or a computer screen.
They represent workers getting paid.
Queenslanders putting food on the table.
Families getting a fair share of wealth and, through their spending, reinvesting in our economy.
Reinvesting in other Queenslanders.
Page 5 of 52
And the best part is that our economic recovery is only just getting started.
At the heart of any Labor Budget lies our Party’s enduring mission.
A mission 130 years young just last month.
And that mission is delivering better, higher paying jobs for Queensland workers.
Today I can announce that the 2021 Budget sets a trajectory towards more jobs and stronger economic growth.
This financial year, Queensland’s economy will grow by 31⁄4 per cent – more than double the national growth rate.
By the end of the forward estimates, our economy will still be growing faster than the national average.
Page 6 of 52
That economic performance will drive employment growth, with 200,000 jobs predicted to be created over the next four years.
This will drive unemployment lower.
By the end of the forward estimates, unemployment is forecast to be 5 per cent, down from an estimated 61⁄4 per cent in the current quarter.
Speaker, we will deliver this improved jobs performance, while facing the challenge of the highest interstate migration in the country.
Our high interstate migration means that other states are exporting part of their unemployment to Queensland.
This reduces the participation rates of other states – and increases ours.
For our government, migration presents a challenge – and an opportunity.
Page 7 of 52
We must still provide jobs for Queenslanders graduating from school or completing training.
But we must also provide jobs for tens of thousands of interstate migrants over the next four years.
This is a challenge we will meet head on.
And so we will continue to invest to ensure that these new Queenslanders can find jobs.
That they can enrol their children in a great local school. That they can get access to the hospitals that they need.
Queenslanders have surpassed every expectation of them during the pandemic.
In facing down COVID-19, everything that was asked of Queenslanders, they did.
Speaker, our Government aims to deliver to Queenslanders a Budget that rewards this achievement.
Page 8 of 52
Queenslanders deserve a Budget with new investments in frontline services.
A Budget with more infrastructure spending.
And a Budget that delivers one of the strongest financial positions of any major government in Australia.
And that is exactly the Budget that I am delivering today.
INVESTING IN HEALTH
Speaker, 2020 presented an unprecedented challenge to Queensland’s health system.
The Palaszczuk Government responded with an unprecedented investment in health.
Our government knows that protecting the public health system protects Queenslanders.
Page 9 of 52
Under our government, Queenslanders have confidence that if they become unwell, care is available.
As the vaccine rollout finally supresses the threat posed by COVID-19, some would expect us to roll that record investment back.
Can I place on the record that, unlike previous Queensland governments, there will be no cuts to health.
In fact, I can announce that all of that COVID-19 boost will be retained within the system.
This year, we will once again increase health funding to deliver another record health budget.
This means that operating funding for health will increase by more than 13 per cent over two years.
Page 10 of 52
I can also confirm that, in the coming financial year, operational funding will continue to be provided through the Queensland Health Funding Model, with no additional savings applied.
FRONTLINE HEALTH SERVICES
Our operational investments will help to deliver the frontline services that our health system needs.
Since our government was first elected in 2015, we have overseen a 30 per cent increase in the strength of our nursing workforce.
That means an additional 8,400 nurses and midwives.
Queensland has 2,841 more doctors, 4,291 more health practitioners and 858 more ambulance personnel reinforcing our frontline health response.
Page 11 of 52
MORE HOSPITALS
An effective health system needs high quality infrastructure.
That’s why I announce today that the Palaszczuk Government will establish a $2 billion Hospital Building Fund to address growth pressures across the health system.
Initial investments will be made from the Fund for the Toowoomba Day Surgery – a two theatre day surgery to be built at the Baillie Henderson campus.
We are ensuring that healthcare infrastructure and equipment are delivered to the right place, at the right time, for the benefit of Queenslanders.
In South East Queensland, our record health investment means an additional 174 additional beds and a new emergency department at the Mater Public Hospital Springfield.
Page 12 of 52
We are continuing the redevelopment and expansion of Caboolture, Ipswich and Logan Hospitals.
As part of our Satellite Hospitals Program, satellite hospitals will be delivered at Bribie Island, Caboolture, Brisbane South, Pine Rivers, Gold Coast, Ipswich and the Redlands.
But our government is equally committed to high-quality healthcare for regional Queenslanders. We are continuing our investment in new and upgraded regional hospitals at:
Page 13 of 52
The Budget also provides $70 million for the Building Rural and Remote Health Program to upgrade health infrastructure at:
It provides $12.5 million for the Woorabinda Multi- Purpose Health Service to increase its capacity from four residential aged care beds to 14.
And it provides $12.4 million to replace the Windorah Primary Healthcare Centre.
MORE INFRASTRUCTURE
Speaker, it won’t just be new hospitals that this Budget is delivering.
Page 14 of 52
Queensland is a growing state – growing more strongly than the rest of Australia.
And a growing state needs infrastructure.
Speaker, infrastructure investment is the foundation of any Labor Budget.
Infrastructure grows the economy, infrastructure connects communities and infrastructure creates valuable construction and maintenance jobs.
That’s why the hallmark of the Palaszczuk Government has been a strong spend on infrastructure, across the board.
Since we were first elected, we have delivered – and will continue to run – an extensive infrastructure program.
But it has also been a sustainable infrastructure program.
Page 15 of 52
Investment in infrastructure has been funded primarily through recurrent revenues.
However, when the pandemic struck and our revenues were crushed, we faced a choice.
We could have cut infrastructure spending to improve the state’s financial position.
That was, in fact, the decision made in the 2012 Budget delivered by the previous government.
The Newman LNP Government announced that:
“the capital program will be smaller than in previous years, reflecting the determination of the Government to restore the State’s financial position.”
Speaker, the Palaszczuk Government has made a different choice.
Page 16 of 52
We have enshrined our $50 billion Infrastructure Guarantee as a cornerstone of our COVID-19 Economic Recovery Plan.
We made the deliberate decision that a temporary reduction of revenue was no reason for a permanent reduction in infrastructure.
And that is a decision that we carry forward into the Budget today.
I am proud to announce that we are keeping our $50 billion commitment to the people of Queensland.
Over the forward estimates, our capital program will deliver $52.2 billion in infrastructure.
This investment will support around 46,500 jobs next financial year.
Page 17 of 52
And over the 10 years to 2024–25, the Palaszczuk Labor Government will have supported over $110 billion in infrastructure for Queenslanders.
When it comes to infrastructure, including schools, hospitals, roads, rail and renewables, we are keeping our pedal to the metal.
And it is reflected across the portfolios that deliver for Queenslanders.
EDUCATION AND NEW SCHOOLS
In a resource-rich state, Queensland Labor Governments know that our most precious resource is the next generation of Queenslanders.
We know that a well-resourced, quality education system enriches us all.
Page 18 of 52
Because we believe that, regardless of background, wealth, gender, ethnicity or upbringing, all of Queensland’s children deserve a chance to achieve their dreams.
That’s why this Budget will deliver $16.8 billion for education.
Our government will ensure that Queensland’s next generation can access the highest quality schools, skills and training, from preschool to graduation.
Speaker, the Palaszczuk Labor Government knows that the foundations of a strong education must start early.
That is why we are locking in four years of funding to provide ongoing, universal access to kindergarten for Queensland children – an investment of $202.9 million.
Education will be the foundation of our state’s long-term economic prosperity.
Page 19 of 52
Our government has already opened 18 new schools since 2015.
The Budget includes more than $900 million to build 10 new primary and secondary schools in high growth areas of our state.
And it commits another $500 million for additional and renewed infrastructure across our existing state schools.
This includes $309.2 million in the coming financial year to improve and upgrade schools in regional Queensland.
HOUSING INVESTMENT
Speaker, all Queenslanders deserve a place to call home.
One of the flagship initiatives in this Budget is our timely investment in housing and homelessness services.
Page 20 of 52
Today I am pleased to announce that our government will commit $1.9 billion over four years to increase the supply of social housing, upgrade the existing stock of dwellings, and deliver critical housing services to vulnerable Queenslanders.
To support this investment, our government will establish a $1 billion Housing Investment Fund, with its returns to be used to drive new housing supply to support housing needs across the state.
TRANSPORT INFRASTRUCTURE
Speaker, our government recognises the need to continually strengthen our transport networks.
To build the road and rail corridors that get Queenslanders quickly to work and take them safely home.
Page 21 of 52
That’s why our government is redoubling our investment in roads, with $27.5 billion over four years supporting 24,000 jobs for Queenslanders.
Our capital program includes a range of investments in Queensland’s 1,700-kilometre backbone, the Bruce Highway.
We will improve the safety, the capacity and the resilience of the Bruce Highway, from Brisbane to Cairns.
We have locked in an $883 million jointly funded boost for the Bruce, to build four lanes at Tiaro, north of Gympie, and upgrades between Gladstone and Proserpine and north of Townsville.
And we’ll take trucks off the Bruce, rolling out a jointly funded $500 million upgrade to the Inland Freight Route between Charters Towers and New South Wales.
Page 22 of 52
Our program of works on the Gold Coast is delivering major upgrades, including our signature $1.5 billion Coomera Connector, to provide a second M1.
This year we will deliver $188.9 million for Gold Coast Light Rail Stage 3, as part of this $1 billion project. Cross River Rail is full steam ahead, with $1.5 billion next financial year to help deliver four new CBD stations and support 7,700 full-time equivalent jobs.
REGIONAL INFRASTRUCTURE
In Queensland, more of our people live outside the capital city than do in any other mainland state or territory.
We must support this population, as well as the new residents and visitors our regions attract.
That is why 61 per cent of our $14.7 billion capital program next financial year will be spent in the regions.
Page 23 of 52
Our infrastructure investment will support nearly 30,000 regional jobs.
The Budget allocates $350 million to meet our government’s election commitment to continue the Works for Queensland program and the SEQ Community Stimulus Package.
These are programs that fast-track investment, creating jobs and delivering more stimulus.
We will provide an additional $70 million for local government infrastructure projects through the Building our Regions program, taking our total funding to $418.3 million.
SKILLS, TRAINING AND JOBS
Speaker, across Queensland, many businesses are facing labour shortages.
Page 24 of 52
This is a challenge that would have been inconceivable at the start of the pandemic, but one that reflects the growing strength of our economy.
And our government is meeting this challenge.
The Labor Party believes that one of the best things a government can do is to provide its people with the skills, the training and the confidence to get a job.
That is why the Skilling Queenslanders for Work program will be given secure, long term funding.
This Budget commits $320 million over four years – and $80 million each year ongoing – to continue this vital program.
To date, Skilling Queenslanders for Work has seen three out of every four participants go on to secure employment or further training.
Page 25 of 52
Our Back to Work program, which has already helped more than 25,000 Queenslanders find a job, will receive $140 million over four years.
INVESTING IN QUEENSLAND
Speaker, our traditional industries helped create the wealth of Queensland.
And those industries, like agriculture and mining, have been key to our economic recovery from COVID-19, keeping Queenslanders working and our economy moving through the depths of the pandemic.
Their resilience and tenacity meant that Queensland fared better than other states and economies more heavily reliant on service industries.
The wealth of Queensland was not created by standing still.
Page 26 of 52
Our economy will grow faster and create more jobs as we further diversify our industrial base.
Earlier this month, the Premier, Deputy Premier and I announced the Queensland Jobs Fund, now worth $3.34 billion, including $350 million in new funding for industry partnerships.
The Queensland Jobs Fund will build on the suite of programs introduced by our Government to bring new industries and jobs to Queensland.
Part of our $3.34 billion commitment is $2 billion towards the Queensland Renewable Energy and Hydrogen Jobs Fund.
RELIABLE, AFFORDABLE, RENEWABLE ENERGY
Speaker, when the Palaszczuk Government was elected, there were no large-scale wind or solar projects underway in Queensland.
Page 27 of 52
With all of the incredible renewable resources available to our state, the cupboard was bare.
Since our election in 2015, 44 large-scale projects have been committed, commenced or constructed in Queensland.
This represents more than 5,000 megawatts of large- scale renewable generating capacity and almost $10 billion in investment.
These renewable projects have created almost 7,000 new construction jobs, largely in regional Queensland.
Our 50 per cent renewable energy target sent industry the clear policy signal that we are open for renewable business.
We established CleanCo to deliver affordable, low emissions power across the state.
Page 28 of 52
We provided CleanCo with $250 million to build, own and operate the Karara Wind Farm on behalf of the people of Queensland.
Through our government-owned energy corporations, we have developed partnerships with private companies seeking to power their businesses from renewables.
These partnerships give our renewables sector the certainty of demand it needs to grow even faster.
And we’re not done yet.
Our $2 billion investment in commercial renewable energy and hydrogen projects will build on our commitment to providing cheaper, cleaner energy to Queenslanders.
Page 29 of 52
SUPPORTING THE ARTS
Speaker, the appeal of Queensland is based on our natural beauty, our diverse landscapes, our resilient health and quality education systems and our unmatched lifestyle.
We will continue to invest in the industries that make the Queensland way of life the envy of the world.
We will invest $71 million to support the Queensland screen industry, which has kept caterers, carpenters and countless other tradespeople employed through the pandemic, as so much production has ground to a halt elsewhere in the world.
In the thriving heart of Brisbane’s arts precinct, we will commit $36.1 million to renew critical infrastructure.
Page 30 of 52
Across the state, we will deliver priority investments in arts and cultural venues owned by Queenslanders through a $13.1 million Arts Infrastructure Investment Fund.
And for the music industry, which continues to face challenges in a COVID-safe world, we will deliver $7 million in support for live venues next financial year.
PROTECTING OUR ENVIRONMENT
Speaker, our state’s Land Restoration Fund is supporting farmers and Traditional Owners to develop new income streams while reducing their carbon footprint, building healthier waterways and increasing habitat for threatened species.
To ensure the ongoing viability of this Fund, this Budget establishes a $500 million Carbon Reduction Investment Fund.
Page 31 of 52
The proceeds of the Carbon Fund will provide certainty for land restoration projects now and into the future.
When our government reintroduced the waste levy, we successfully stopped the tide of interstate trucks looking to use Queensland as their dumping ground.
Resource recovery is creating new industries and new jobs by diverting waste away from landfill and into new uses across our economy.
We will continue to implement the Queensland Waste Management and Resource Recovery Strategy through a commitment of $93.6 million over four years and $24.2 million each year ongoing.
This Budget also commits $160 million to ensure the success of the waste levy does not increase costs for household domestic waste.
Page 32 of 52
And as custodians of the Great Barrier Reef, we will invest $270.1 million over five years to maintain the Queensland Reef Water Quality program at current levels.
SUPPORTING OUR COMMUNITIES
Queensland is home to two of the world’s oldest continuing living cultures, in Aboriginal and Torres Strait Islander peoples.
As we continue along the Path to Treaty with our state’s First Nations People, it is vital that we provide funding security to support our shared journey.
To that end, through this Budget I am proud to announce today that the government will establish a $300 million Path to Treaty Fund.
The proceeds of this Fund will provide funding certainty for the Path to Treaty into the future.
Page 33 of 52
The Path to Treaty actions will be informed by the government’s consideration of the report of the Treaty Advancement Committee, which is expected to be received later this year.
The Budget also commits $27.6 million to continue the work of managing Native Title Compensation claims in Queensland.
As we have learned through the harrowing stories of the Royal Commission into Violence, Abuse, Neglect and Exploitation of People with Disability, it is essential to ensure that Queenslanders living with a disability know that their voices will be heard.
We are investing $22.7 million to continue to support peak and representative bodies and advocacy services for Queenslanders with a disability and the Queensland Disability Advisory Council.
Page 34 of 52
The Budget will also provide $7.3 million to ensure continuity of support for former Disability Services clients, who have been determined ineligible for the NDIS.
Speaker, our government knows the financial pressure that COVID-19 has placed on many Queenslanders.
It is also why, earlier this year, our government announced the lowest indexation rate in a decade.
Fees and charges now grow at less than half the rate they escalated under the previous government.
And it is why our government is delivering $6.1 billion in discounts, rebates, subsidies and other concessions this financial year.
Most Queenslanders benefit from at least one concession, be it a public transport discount, rental assistance, drought relief assistance, or an electricity bill rebate.
Page 35 of 52
Our near-record $6.1 billion of concessions in this Budget will continue to help Queenslanders manage their own household budgets.
TITLES REGISTRY
Speaker, when I announced our intention to transfer the Titles Registry to the Queensland Future Fund, our preliminary valuation estimate was at least $4 billion.
This valuation is an important number for Queensland.
Because every dollar of value in the Titles Registry reduces our net debt.
Lower net debt means we are better able to respond to future shocks, such as natural disasters, with additional spending.
Lower net debt means we have greater capacity to invest in the infrastructure we need.
Page 36 of 52
Lower net debt means a healthier budget position for Queenslanders.
Today I can announce more good news for Queensland. I can confirm that the independently assessed valuation of the Queensland Titles Registry has been revised – upwards – to $7.8 billion.
Speaker, this valuation is the result of detailed due diligence undertaken by the Queensland Investment Corporation and Queensland Treasury.
QIC obtained advice from four independent firms.
Financial advisory services from Bank of America.
Macroeconomic forecasting from BIS Oxford Economics.
Financial, tax, accounting and information technology due diligence from Deloitte.
Page 37 of 52
And legal advice from Allens Linklaters.
The valuation was approved by QIC’s independent investment committee and was then subject to a further independent peer assessment by two global accounting firms – PwC on behalf of QIC and EY on behalf of the state.
Speaker, we always knew that Queensland was the best, and this valuation is no exception.
The Queensland Titles Registry is the most valuable Titles Registry in the nation.
And there is good reason for this.
Our Titles Registry has been the best run in the nation.
And it should remain in public hands.
The hard-earned wealth of Queensland should remain in Queensland, to work for Queenslanders.
Page 38 of 52
Consistent with the announcements I made last year about the Queensland Future Fund, the majority of the Titles Registry value – $6 billion in total – will be contributed to the Debt Retirement Fund.
By restructuring the Titles Registry, as we have done, and by recognising the full financial value of this asset, Queenslanders will reap the benefit of the state’s net debt being reduced by nearly $8 billion.
FISCAL OUTLOOK
Before I became Treasurer, every Budget that our government handed down delivered a net operating surplus.
The last budget deficit delivered in Queensland before that was delivered by the Newman LNP Government.
So as you might expect, Speaker, those of us on this side of the House are not comfortable with a budget deficit.
Page 39 of 52
While none of us likes budget deficits, Labor will always back jobs.
Jobs must come first.
And our Premier has backed that choice every day.
Our government made the deliberate decision that we would put our Budget into deficit.
We made it clear during the election campaign that our Budget would stay in deficit until our economy had recovered.
There would be no reckless rush to surplus within the forward estimates, or within three years, or within some other arbitrary time frame.
And when I delivered last year’s Budget, we did not back down from this.
Our message is clear – health and jobs come first.
Page 40 of 52
Today’s Budget demonstrates that our choice has paid off.
Our deficits are narrowing because jobs are coming back.
Our debt is falling because jobs are coming back.
And our Budget will return to surplus because jobs are coming back.
Speaker, the four largest governments in Australia – the Commonwealth Government, the New South Wales Government, the Victorian Government, and the Queensland Government – all went into deficit to respond to COVID-19.
Today, only one of those four governments is returning to surplus – the Palaszczuk Labor Government.
Queensland was the first to announce a stimulus to respond to COVID-19.
Page 41 of 52
Queensland was the first to return all of the jobs lost due to COVID-19.
And now Queensland is the first of these jurisdictions to return to surplus.
We had forecast that this year and last year we would see the biggest deficits in Queensland’s history.
While last year’s deficit remains the largest, this year’s deficit will now be smaller than that in the Newman LNP Government’s first Budget.
Speaker, those smaller deficits have, axiomatically, had an impact on Queensland’s debt.
As our economy has improved, the need for increased debt reduces.
Today I can announce that, in this financial year, our net debt will be reduced by $9.7 billion compared to the forecast in December last year.
Page 42 of 52
Speaker, that is the single biggest reduction in net debt ever recorded by the Queensland Government.
Reducing debt, reducing deficits, returning to surplus – these are things that I know many of our side of the House are pleased to hear.
But the part they want to hear the most is that we’ve done all of this without cutting services, without sacking public servants and without selling public assets.
Others may talk about debt reduction or reducing budget deficits.
But only our government has delivered, and we have done it the right way, by growing jobs and growing the economy.
And while we are proud of this achievement, on this side of the House we do not engage in debt reduction for its own sake.
Page 43 of 52
We will reduce debt because doing so creates the future capacity to invest in the services and infrastructure that our state needs.
In this Budget, we are reducing debt because our economy is growing strongly, because jobs are coming back and because it makes sense to rebuild our borrowing capacity.
In future, debt may well rise again, to respond to another crisis, to deal with a disaster, or to build the infrastructure of our state.
Just as we did in the pandemic, we will make no apologies for using debt to defend the health, the jobs and the livelihoods of Queenslanders.
And as we see the Commonwealth Government engaging in a borrowing spree that dwarfs anything the state might do, it is my hope that those opposite, and those in the media, finally come to grips with the fact that debt is not a dirty word.
Page 44 of 52
Queensland does not have a debt problem.
By any measure, in absolute and proportional terms, Queensland’s debt is lower and more affordable than the debt owed by New South Wales, by Victoria and by the Commonwealth Government.
If you think Queensland owes too much, with net debt at $25 billion, then take it up with the New South Wales Government, which owes $68 billion.
If you think Queensland won’t be able to service our borrowings, which represent 102 per cent of revenue, then take it up with the New South Wales Government, which has a debt to revenue ratio of 130 per cent.
Speaker, today the debt double standard stops.
Page 45 of 52
CHARTER OF FISCAL RESPONSIBILITY
Speaker, the Financial Accountability Act 2009 provides that, from time to time, the Treasurer must prepare and table in the Legislative Assembly a Charter of Fiscal Responsibility giving details of the government’s fiscal principles.
The government’s new Charter includes renewed fiscal principles that support our strategy to drive recovery, address fiscal repair and restore the state’s fiscal buffers.
The renewed fiscal principles provide objective measures that support the government’s post-COVID-19 fiscal repair strategy, including a return to operating surplus.
The principles will ensure that debt remains sustainable, expenses do not grow faster than revenues and capital is prudently funded by surplus operating cash.
Page 46 of 52
Queensland will maintain its highly competitive tax environment.
Our government’s longstanding commitment to fully funding its liabilities, such as superannuation, will continue.
To maintain consistency between Budget documentation and the official Charter, I table the revised Charter of Fiscal Responsibility.
ECONOMIC UPDATE
As nations around the world have learned, the heart of any economic recovery from COVID-19 must be a strong and effective health response.
And so it has been for Queensland.
Our state has recovered earlier and stronger than we anticipated in the Budget delivered barely six months ago.
Page 47 of 52
ECONOMIC GROWTH
Growth for this financial year is now forecast to be 31⁄4 per cent – 13 times faster than the 1⁄4 per cent estimated in last year’s Budget.
This significant economic growth is driven by strong household consumption and dwelling investment.
It is this economic growth that underpins our ability to deliver essential services, create jobs and protect those who need help the most.
Our measured economic growth will continue, with the 31⁄4 per cent growth in this financial year to be followed by 23⁄4 per cent growth in each subsequent year of the forward estimates.
Our growth is more measured than the Commonwealth because our recovery started earlier than states like Victoria.
Page 48 of 52
By June 2025, our economy is forecast to be 15 per cent larger than it is today.
UNEMPLOYMENT
Consistent with the recovery delivered by our health response, unemployment is forecast to peak lower and fall further than was estimated in last year’s Budget.
It is forecast to fall from 7 per cent this financial year to 5 per cent by the end of the forward estimates.
In each year, that is an unemployment rate at least 1 per cent lower than that forecast in December.
And while unemployment will be challenged by net interstate migration, it is a challenge we welcome.
CONCLUSION
Speaker, this Budget comes a little over a year after the Premier appointed me as Treasurer.
Page 49 of 52
Along with my colleagues, I have had the privilege of witnessing something extraordinary and powerful – the people of Queensland rising to the challenge of COVID-19 so brilliantly.
And because of their hard work, the people of Queensland will continue to receive the dividend of their strong health response to COVID-19 for many years to come.
More jobs, more economic growth, lower debt, more infrastructure and better government services.
Speaker, Queensland has long been called the Sunshine State.
I like to think of it as the Sunrise State.
Because Queenslanders take each day as it comes – and we back ourselves every step of the way.
Page 50 of 52
Every Queensland family photo album tells the story of generations who saw a brighter future and built it.
And now we are backing ourselves to host the greatest event in the world – the 2032 Olympic and Paralympic Games.
This one event will fire the starter’s gun on the biggest infrastructure building program our state has ever seen.
New roads and railway lines.
Bus lanes.
Housing and sporting facilities.
All of it creating a $17 billion economic uplift and almost 123,000 full time jobs.
The Games will get projects off drawing boards faster, with the benefits and opportunities right there for the taking, right across Queensland.
Page 51 of 52
We will move early to chase new dawns, to capture the opportunities of every day.
This is a Budget that prepares us for those new days and new opportunities ahead.
And it sets Queensland up to make the most of our state’s bright future.
I commend the Bill to the House.
Page 52 of 52
Queensland Budget 2021–22 Budget Speech Budget Paper No.1

Queensland Budget 2021-22
Budget Speech Budget Paper No.1
budget.qld.gov.au
| | |
| QUEENSLAND BUDGET 2021-22 | | Unite & Recover |
BUDGET STRATEGY AND OUTLOOK
BUDGET PAPER NO. 2
budget.qld.gov.au

2021–22 Queensland Budget Papers
1. Budget Speech
2. Budget Strategy and Outlook
3. Capital Statement
Service Delivery Statements
Appropriation Bills
Budget Highlights
Regional Action Plans
The budget papers are available online at budget.qld.gov.au
© The State of Queensland (Queensland Treasury) 2021
Copyright
This publication is protected by the Copyright Act 1968
Licence
This document is licensed by the State of Queensland (Queensland Treasury) under a Creative Commons Attribution (CC BY 4.0) International licence.

In essence, you are free to copy, communicate and adapt this publication, as long as you attribute the work to the State of Queensland (Queensland Treasury). To view a copy of this licence, visit http://creativecommons.org/licenses/by/4.0/
Attribution
Content from this publication should be attributed to:
© The State of Queensland (Queensland Treasury) - 2021–22 Queensland Budget

Translating and interpreting assistance
The Queensland Government is committed to providing accessible services to Queenslanders from all cultural and linguistic backgrounds. If you have difficulty in understanding this publication, you can contact us on telephone (07) 3035 3503 and we will arrange an interpreter to effectively communicate the report to you.
Budget Strategy and Outlook
Budget Paper No. 2
ISSN 1445-4890 (Print)
ISSN 1445-4904 (Online)
Budget Strategy and Outlook 2021–22

State Budget
2021–22
Budget Strategy and Outlook
Budget Paper No. 2
Budget Strategy and Outlook 2021-22
Contents
| | | | | | |
Overview | | | 1 | |
| | |
1 | | Economic Strategy: A strong economy for all Queenslanders | | | 15 | |
| | |
1.1 | | Ensuring economic recovery by safeguarding Queenslanders’ health | | | 16 | |
1.2 | | Protecting health | | | 19 | |
1.3 | | Building our productive capacity | | | 21 | |
1.4 | | Leveraging our natural and competitive advantages | | | 27 | |
1.5 | | Improving business competitiveness | | | 34 | |
1.6 | | Responsive public sector | | | 38 | |
| | |
2 | | Economic performance and outlook | | | 41 | |
| | |
2.1 | | International conditions | | | 42 | |
2.2 | | National conditions | | | 43 | |
2.3 | | Key assumptions | | | 44 | |
2.4 | | Queensland conditions and outlook | | | 46 | |
2.5 | | Risks to the outlook | | | 63 | |
| | |
3 | | Fiscal strategy and outlook | | | 66 | |
| | |
3.1 | | Update on fiscal recovery | | | 67 | |
3.2 | | Key fiscal aggregates | | | 73 | |
| | |
4 | | Revenue | | | 84 | |
| | |
4.1 | | Revenue overview | | | 85 | |
4.2 | | Taxation revenue | | | 90 | |
4.3 | | Grants revenue | | | 100 | |
Budget Strategy and Outlook 2021-22
| | | | | | |
| | |
4.4 | | Royalty revenue | | | 104 | |
4.5 | | Sales of goods and services | | | 109 | |
4.6 | | Interest income | | | 110 | |
4.7 | | Dividend and income tax equivalent income | | | 110 | |
4.8 | | Other revenue | | | 111 | |
| | |
5 | | Expenses | | | 113 | |
| | |
5.1 | | 2020–21 estimated actual | | | 113 | |
5.2 | | 2021–22 Budget and outyears | | | 114 | |
5.3 | | Expenses by operating statement category | | | 115 | |
5.4 | | Operating expenses by purpose | | | 123 | |
5.5 | | Departmental expenses | | | 123 | |
| | |
6 | | Balance sheet and cash flows | | | 126 | |
| | |
6.1 | | Overview | | | 127 | |
6.2 | | Balance sheet | | | 127 | |
6.3 | | Cash flows | | | 133 | |
| | |
7 | | Budget measures | | | 134 | |
| | |
7.1 | | Explanation of scope and terms | | | 137 | |
7.2 | | Government indexation policy | | | 138 | |
| | |
8 | | Intergovernmental financial relations | | | 148 | |
| | |
8.1 | | Federal financial arrangements | | | 149 | |
8.2 | | Australian Government funding to the states | | | 151 | |
8.3 | | Australian Government funding to Queensland | | | 154 | |
8.4 | | GST revenue | | | 156 | |
8.5 | | Payments to Queensland for specific purposes | | | 159 | |
8.6 | | State-local government financial relations | | | 163 | |
Budget Strategy and Outlook 2021-22
| | | | | | |
9 | | Public Non-Financial Corporations Sector | | | 166 | |
| | |
9.1 | | Context | | | 167 | |
9.2 | | Finances and performance | | | 175 | |
| | |
10 | | Uniform Presentation Framework | | | 183 | |
| | |
10.1 | | Context | | | 183 | |
10.2 | | Uniform Presentation Framework financial information | | | 183 | |
10.3 | | General Government Sector time series | | | 193 | |
10.4 | | Other General Government Uniform Presentation Framework data | | | 195 | |
10.5 | | Contingent liabilities | | | 198 | |
10.6 | | Background and interpretation of Uniform Presentation Framework | | | 199 | |
10.7 | | Sector classification | | | 200 | |
10.8 | | Reporting entities | | | 201 | |
| |
Appendix A: Concessions statement | | | 205 | |
| |
Context | | | 205 | |
Focus | | | 205 | |
Explanation of scope | | | 206 | |
A.1 Concessions summary | | | 208 | |
A.2 Concessions by agency | | | 209 | |
A.3 Concessions by Government-owned corporation | | | 239 | |
| |
Appendix B: Tax expenditure statement | | | 242 | |
| |
Context | | | 242 | |
Methodology | | | 243 | |
The tax expenditure statement | | | 244 | |
Discussion of individual taxes | | | 247 | |
Budget Strategy and Outlook 2021-22
| | | | |
Appendix C: Revenue and expense assumptions and sensitivity analysis | | | 251 | |
| |
Taxation revenue assumptions and revenue risks | | | 252 | |
Royalty assumptions and revenue risks | | | 253 | |
Parameters influencing Australian Government GST payments to Queensland | | | 254 | |
Sensitivity of expenditure estimates and expenditure risks | | | 254 | |
| |
Appendix D: Fiscal aggregates and indicators | | | 255 | |
Budget Strategy and Outlook 2021-22
Overview
Queensland’s economic recovery from COVID-19 is well underway, reflecting Queensland’s success in containing the virus.
The Queensland Government’s Economic Recovery Plan continues to support businesses, workers, families and communities across the state, with the government’s focus remaining firmly on protecting Queenslanders’ health, creating jobs and working together.
The Economic Recovery Plan includes 6 recovery priority areas: safeguarding our health: backing small business; making it for Queensland; building Queensland; growing our regions; and investing in skills. In addition to these 6 recovery priority areas, the government’s objectives for the community also include supporting jobs, backing our frontline services and protecting the environment.
The suite of papers released for the 2021–22 Queensland Budget includes a special Queensland’s COVID-19 Economic Recovery Plan – Budget Update, which outlines the Queensland Government’s recovery initiatives in line with the Plan’s 6 priority areas.
Building on Queensland’s economic recovery, the government’s economic response and policy focus will continue to transition over time from shorter-term support and stimulus to enhancing the state’s productivity and competitiveness to drive ongoing private sector growth and jobs.
This Budget delivers additional funding and new initiatives to drive ongoing growth and job creation, while also outlining the government’s improved fiscal outlook and a clear fiscal strategy to return the budget to surplus and stabilise debt over the forward estimates.
Since the 2020–21 Queensland Budget, the state’s domestic economy has been bolstered by a range of factors, including ongoing positive health outcomes across the state, contributing to vastly improved business and consumer confidence, and ongoing strength in consumption and a surge in dwelling activity.
As a result, it is now expected the domestic economy will perform substantially better in 2020–21 than previously anticipated. However, the trade sector continues to face ongoing challenges given the uncertainty surrounding the global recovery and ongoing risks related to trade with China. International travel restrictions will also continue to impact Queensland’s international tourism exports and overseas student arrivals in 2021.
The strong growth in domestic activity is expected to see Queensland’s Gross State Product (GSP) growth rebound by 31⁄4 per cent in 2020–21, with further solid growth of 23⁄4 per cent forecast for 2021–22, before averaging 23⁄4 per cent per annum over the remainder of the forward estimates.
Queensland’s faster recovery means aggregate economic growth across the 3 years, from 2020–21 to 2022–23 inclusive, will be higher in Queensland (around 9 per cent) than nationally (around 81⁄4 per cent).
Employment has also recovered strongly, with Queensland having recovered all the jobs lost during the crisis. In year-average terms, employment is now forecast to grow by 21⁄4 per cent in 2020–21 and 3 per cent in 2021–22.
1
Budget Strategy and Outlook 2021-22
Supported by the ongoing strong employment growth, the unemployment rate is forecast to improve substantially to 53⁄4 per cent in June quarter 2022, before improving further to 5 per cent by June quarter 2025.
Importantly, Queensland entered the pandemic in a strong economic and fiscal position, which enabled the government to respond quickly to the crisis and provided the capacity to support economic recovery. The government’s fiscal strategy initially emphasised prioritising economic recovery alongside targeted expenditure and capital prioritisation, to position Queensland well for fiscal repair.
The fiscal strategy for the 2021–22 Budget is underpinned by the development of a new Charter of Fiscal Responsibility (Charter). The fiscal strategy directs improvements in revenue towards economic recovery priorities and a return to operating surplus, thereby moderating the relative net debt burden over the forecast period and preserving fiscal capacity for future infrastructure requirements and to respond to external shocks.
The earlier and stronger than expected economic recovery has improved the outlook for key fiscal aggregates, particularly revenue. The recovery in the revenue outlook is allowing the government to balance additional funding for priority service needs, including the evolving COVID-19 response, with improved operating balances and significantly lower net debt and borrowings relative to the 2020–21 Budget.
Improvements in the operating balance are forecast to continue across the forward estimates, with a return to surplus expected in 2024–25. Achieving ongoing operating surpluses in the medium term, combined with net operating cashflows from operating activities primarily funding the general government sector capital program, will allow the government to stabilise debt levels and reduce net debt as a proportion of revenue over time.
Our economic recovery – leading the nation in economic growth and jobs
The Queensland Government’s decisive actions to protect Queenslanders from COVID-19 has meant Queensland has returned to economic growth sooner and more strongly than other economies. This rapid turnaround has been backed by the Queensland Government’s Economic Recovery Plan, through its focus on creating jobs and working together to ensure Queensland’s future prosperity.
In line with the Plan’s 6 priority areas, the government has committed substantial funding to support businesses, workers, families and communities across the state.
Since the depths of the pandemic in May 2020, employment has increased by 253,200 persons.
The strength of the recovery has also seen Queensland receive 30,000 net interstate migrants in 2020, more than any other state or territory.
Building on the momentum of Queensland’s strong recovery, the 2021–22 Budget delivers a range of further initiatives to drive sustainable economic growth and job creation for Queenslanders both now and in the future. Many of these initiatives are also future-focused, positioning Queensland to take advantage of opportunities and respond to future challenges by improving our competitiveness, productivity and resilience.
2
Budget Strategy and Outlook 2021-22
Queensland’s COVID-19 Economic Recovery Plan—Budget Update outlines details of the government’s previous, ongoing and new commitments since the onset of COVID-19, with these initiatives having helped put Queensland on a clear pathway to recovery and helping to drive sustainable economic growth.
Into the future, the government’s economic strategy will continue to be responsive to the ongoing impacts and emerging risks of the pandemic. Further, the government’s economic response and policy focus will also continue to transition to a greater focus on improving the state’s productivity and competitiveness to drive ongoing private sector growth and jobs.
To ensure the Queensland economy can continue to respond to external shocks, the government will continue to implement reforms and initiatives that will attract investment, reduce the cost of doing business, create employment opportunities, support regional development and provide positive environmental and community outcomes.
To achieve these outcomes, the government’s economic strategy will continue to focus on several key foundations for economic growth including: building the state’s productive capacity; leveraging Queensland’s natural and competitive advantages; improving business competitiveness; and maintaining a responsive public sector.
Investing in our health
Globally and nationally, there is strong correlation between good health outcomes and good economic outcomes. The Queensland Government’s primary objective throughout the COVID-19 pandemic has been to contain the spread of the virus to minimise health risks for individuals and the community, thereby preventing significant strain on the public health system.
Queensland’s strong health response and success in containing the spread of COVID-19 has provided a platform for the strong economic recovery seen across the state. The government’s priority remains safeguarding the health of all Queenslanders, including ensuring preparedness to contain any future outbreaks.
This is reflected in the significant investments in health outlined in the 2021–22 Budget, with over $22.237 billion being provided for health services.
The Budget establishes a $2 billion Hospital Building Fund to assist in meeting growth pressures across the health system, with initial investments in the Toowoomba Day Surgery, purchasing public health services through the expansion at Mater Public Hospital Springfield and an uplift in Queensland Health’s base capital program.
The new investment in the health system in 2021-22 is $648.7 million comprised of: Queensland Health’s $150 million operating share of the $480 million COVID-19 response; $482.5 million to address pressures in emergency patient flow through our public hospitals, elective surgery waitlists and the opening of the Nambour Hospital Redevelopment; $14.5 million for Making Tracks towards achieving health equity (2021–2025); and $1.7 million for the Rockhampton alcohol and other drug residential rehabilitation.
In total, the Budget includes $480 million to continue the COVID-19 response, which will deliver fever clinics, contact tracing and testing capability, the vaccination program, compliance activities, facilitation of quarantine in government arranged accommodation, COVID-19 contact centres and wellness checks for people in mandatory hotel quarantine.
By keeping Queenslanders safe, this will help maintain the consumer and business confidence needed to support the state’s ongoing strong economic recovery.
3
Budget Strategy and Outlook 2021-22
Investing for jobs
In a post-pandemic era, Queensland needs to compete more intensively with the rest of the world and other states for private sector investment to secure the growth opportunities that benefit all Queenslanders.
The Queensland Government continues to make significant investments to unlock the state’s economic potential, through the $3.34 billion Queensland Jobs Fund, which brings together the government’s key investment attraction and industry development programs.
The Fund incorporates a range of existing initiatives and commits additional funding for a number of new initiatives to strengthen supply chains, foster innovation, diversify regional economies, create jobs and boost income levels. These new initiatives include:
| | • | | $350 million in additional funding for the Industry Partnership Program, providing small to medium-sized enterprises and research institutions with tailored support that strengthens local supply chains and grows the industry footprint, including facilitating a ‘single front door’ approach to industry development that will minimise costs and resources for businesses |
| | • | | $2 billion Renewable Energy and Hydrogen Jobs Fund to increase investment by government-owned corporations in commercial renewable energy and hydrogen projects, along with supporting infrastructure, including in partnership with the private sector. |
Investing in skills and training
Ongoing improvement in the skills of Queensland’s current and future workers, through investment in education, skills and training, is critical to boost Queensland’s productive capacity and to provide individuals with meaningful jobs and higher incomes.
In the context of the crisis and the need for ongoing economic recovery, the government has been responsive in ensuring Queenslanders have the skills they need to find meaningful jobs and establish pathways for the future. This includes funding to extend key Queensland Government employment, skills and training programs, as well as providing a $100.5 million matching investment as part of the initial national JobTrainer Fund.
The 2021–22 Budget outlines additional funding for well-targeted investment in skills and training to meet the needs of the private sector and help individuals to re-engage with the labour market as the economy recovers. Additional funding provided in this Budget for key initiatives include:
| | • | | $320 million over 4 years to extend the Skilling Queenslanders for Work (SQW) program, with the revitalised program assisting up to 15,000 Queenslanders facing disadvantage in the labour market each year. This program is now being permanently funded, embedding the program into the core business of the state |
| | • | | up to $140 million in additional funding over 4 years for a revitalised Back to Work program, helping provide businesses with the confidence to employ Queenslanders |
| | • | | $31.2 million to extend the 50 per cent payroll tax rebate for apprentice and trainees for another 12 months to 30 June 2022 |
The Budget also invests in ensuring our future generations have a great start to their education by providing $202.9 million to support the continued provision of universal access to kindergarten in the year before school for Queensland children.
4
Budget Strategy and Outlook 2021-22
A number of these measures will also be critical to support enhanced women’s economic security and workforce participation, as will the government’s continued strong investment in TAFE, innovation (including the Female Founders Program and Women’s Research Assistance Program) and other targeted grant programs.
The 2021–22 Budget papers include the Investing for Women paper, which outlines investments to address barriers impacting on economic security, safety and success for women and girls.
In addition to the government’s investment in skills and training, this Budget continues to commit significant funding towards education, to provide all young Queenslanders with the opportunity to acquire knowledge and develop their potential to the best of their ability.
To help Queensland’s next generation of workers take full advantage of the opportunities available to them, this Budget provides increased funding of around $1.4 billion for new schools to open in 2023 and 2024 and additional and renewed infrastructure in existing state schools.
Building and connecting Queensland
Building and connecting Queensland is a core focus area of the government’s Economic Recovery Plan, including fast-tracking capital projects where appropriate to support construction jobs in the short term and, more importantly, investing in productive economic infrastructure to position the state for future success.
The government’s continued focus on delivering economic and social infrastructure will support future ongoing economic growth by reducing input costs for business, enhancing supply chains, improving regional connectivity, unlocking economic opportunities and improving liveability across all regions of the state.
The 2021–22 Budget includes a $52.216 billion capital program over 4 years. The $14.688 billion capital program in 2021–22 will directly support around 46,500 jobs during the construction phase and support many more ongoing jobs through increased economic activity and connectivity.
Highlights of the investment in productive infrastructure in the 2021–22 Budget include:
| | • | | $1.517 billion in 2021–22 towards a total of $6.888 billion for the continued delivery of Cross River Rail, including a capital contribution of $5.389 billion along with financing of $1.499 billion secured through the Public Private Partnership |
| | • | | $180 million in 2021–22 towards a total of $1 billion for the Bruce Highway (Cooroy to Curra) Section D |
| | • | | $113.8 million in 2021–22 towards a total of $1.044 billion for Gold Coast Light Rail Stage 3, with project costs subject to the finalisation of contract negotiations |
| | • | | $85 million in 2021–22 towards a total of $195 million for the Haughton Pipeline Stage 2 |
| | • | | $176 million for the upgrade and expansion of the Cairns Convention Centre |
| | • | | $150 million over 5 years from 2022–23 in increased funding to deliver on the government’s election commitment to provide $200 million over 6 years for the SEQ Community Stimulus Program |
| | • | | $913.7 million in additional funding over 7 years for the Building Future Schools Program |
| | • | | $2 billion Hospital Building Fund to assist in meeting growth pressures across the health system. |
5
Budget Strategy and Outlook 2021-22
Building on the substantial capital works investment under this government since 2015–16, the capital program outlined this Budget means that over the 10 years to 2024–25, the government will have supported over $110 billion in infrastructure works.
Promoting regional growth and prosperity
Queensland’s economic recovery to date has been broad-based, with all regions seeing substantial improvements in labour market conditions. However, challenges remain, particularly in those regions most affected by international border closures.
As such, targeted government support continues to be provided as part of the Queensland Government’s Economic Recovery Plan, including through key initiatives such as the ‘Good to Go’ marketing campaign and the $7.5 million Work in Paradise initiative to attract workers.
Another critical factor in leveraging the natural advantages of Queensland regions is the government’s ongoing focus on boosting the regions’ physical, digital and social connectivity with other parts of the state and beyond.
Key regional infrastructure and programs in this budget include:
| • | | $200 million in additional funding as part of a total $1 billion Works for Queensland program for maintenance and minor infrastructure projects by regional councils |
| • | | Up to $71.4 million over 4 years for the Drought Assistance and Reform Package, and a further $50 million per annum for 4 years in drought preparedness and emergency drought loans |
| • | | $70 million in additional funding over 3 years to deliver Building our Regions (Round 6) |
| • | | $16.7 million in additional funding over 5 years to finalise long-term decisions on the future of Queensland Agricultural Training Colleges’ assets, including a new Central Queensland Smart Cropping Centre at Emerald • up to $12 million in additional funding over 3 years for the Mobile Black Spot Program to help increase the connectivity of Queensland’s regions and provide access to essential telecommunications |
| • | | $10 million over 2 years for an Aviation Route Support Package to fast-track route development. |
To reduce the potential damage incurred by Queenslanders in future disasters, the Budget includes targeted measures, including a new $10 million North Queensland Natural Disasters Mitigation Program, to help reduce risks and cost of living pressures for Queenslanders living in cyclone-prone areas, including by putting downward pressure on insurance premiums.
Reducing costs for business
Since first forming Government in 2015, the Palaszczuk Government has delivered productivity-enhancing reforms and red tape reduction across a range of areas, such as reducing trading hours restrictions, facilitating development and regulation of the personalised transport sector, providing for the development of the craft-brewing industry, improving sustainability of fisheries, and reducing red tape for body corporates.
6
Budget Strategy and Outlook 2021-22
Further, the Queensland Government announced substantial support for business, in particular small businesses, as part of its response to COVID-19, including tax relief measures and a utility relief package to support the cashflows and viability of Queensland businesses.
Energy and other utilities are key input costs for many businesses, particularly those in some of Queensland’s more trade-exposed industries such as manufacturing. After several years of significant price increases, the Queensland Government reformed the electricity sector to provide reliable energy and push prices down. As a result, in 2021–22, retail electricity prices are set to fall for Queensland households and businesses for the fourth consecutive year.
The 2021–22 Budget continues the government’s strong investment in energy, including:
| • | | over $2.2 billion in energy generation, transmission and distribution capital purchases to occur in 2021–22 |
| • | | $29.4 million over 4 years for the Electricity Tariff Adjustment Scheme, targeting support towards regional business electricity connections due to the phasing-out of obsolete electricity tariffs. |
The government is also committed to driving regulatory reform to reduce red tape and minimise the regulatory burden on Queensland businesses. A key element of the government’s economic response to the pandemic is making it easier for businesses to recover, invest and employ Queenslanders by reducing compliance costs.
The Queensland Government has been implementing reforms related to simplifying management of taxation obligations, and digitalising and streamlining identification procedures, procurement processes and park permit application processes.
Queensland is also continuing to implement several key reforms to reduce costs for small business, including the Business Launchpad initiative, which will reduce the paperwork and approvals that start-up and expanding small businesses need to obtain from all levels of government. The recently implemented first phase of this program in Logan and Townsville is estimated to deliver over $50 million in benefits to participating businesses through time savings and productivity benefits.
The new Office of Productivity and Red Tape Reduction, which commenced on 2 June 2021, will help develop innovative policy solutions to boost productivity and regulatory reform as part of the government’s economic recovery policies.
Investing in small business
The government continues to ensure its policy and regulatory settings support small businesses to start-up, expand, and, where appropriate, transition to medium and large businesses.
Queensland’s small businesses have demonstrated significant resilience and innovation during recent times. However, a range of small businesses, including those in regions heavily dependent on international tourism, continue to face challenges.
In the 2021–22 Budget, the government continues to invest to promote an entrepreneurial innovation culture that helps build a profitable and vibrant small business sector. Some of the key initiatives to support small business include:
7
Budget Strategy and Outlook 2021-22
| • | | $140 million Big Plans for Small Business commitment, which has a strong focus on helping small business to innovate, grow and access new markets. This includes $100 million from the Business Investment Fund (BIF) to support established small and medium businesses innovate and realise their potential |
| • | | up to $140 million in additional funding over 4 years for a revitalised Back to Work program, helping provide businesses with the confidence to employ Queenslanders facing labour market disadvantage. |
The government is also providing support to Queensland’s live music industry with a new investment of $7 million in 2021–22 supporting the sustainability of the state’s live music venues.
Leveraging our natural assets
Protection of Queensland’s rich natural environment in a way which complements the state’s economic development priorities is essential to ensure the benefits of growth flow to future generations. Further, there are strong incentives to protect our natural environment for the viability of the state’s tourism industry, including the substantial proportion of tourism activity occurring in regional Queensland.
Key initiatives in the 2021–22 Budget supporting the state’s environmental sustainability and leveraging Queensland’s natural assets include:
| • | | $2 billion Renewable Energy and Hydrogen Jobs Fund to increase investment by government-owned corporations in commercial renewable energy and hydrogen projects, along with supporting infrastructure, including in partnership with the private sector |
| • | | $270.1 million, including $162.9 million in additional funding, over 5 years to continue the Queensland Reef Water Quality Program |
| • | | $93.6 million in additional funding over 4 years, for the Queensland Waste Management and Resource Strategy |
| • | | $61 million in additional funding allocated to environmental markets and investment initiatives |
| • | | $500 million Carbon Reduction Investment Fund, with its returns used to support the existing Land Restoration Fund (LRF) to leverage private finance and investment and support financially sustainable carbon markets |
| • | | $9.6 million in additional funding to continue the delivery of comprehensive mapping and assessment of vegetation change. |
The Queensland Government is also actively working, in line with its election commitment, to develop a Climate Action Plan 2020–2030. Further, to meet its target of net zero emissions, the government will continue to establish partnerships with the private sector to ensure the transition to a low carbon economy unlocks the full potential of the state’s regions.
Providing frontline services for all Queenslanders
The government is continuing its focus on ensuring well-resourced and effective frontline service delivery for all Queenslanders, no matter where they live. In particular, this Budget includes significant additional and ongoing investment in key frontline services, including health professionals, teachers, community service staff, firefighters and police personnel.
8
Budget Strategy and Outlook 2021-22
One of the flagship initiatives in the 2021–22 Budget is the timely investment in housing and homelessness services, with $1.908 billion committed over 4 years to increase the supply of social housing, upgrade the existing stock of dwellings, and deliver critical housing services to vulnerable Queenslanders. To support this, the government has established the $1 billion Housing Investment Fund, with its returns to be used to drive new supply to support current and future housing needs across the state.
Additional funding for other key measures committed in the 2021–22 Budget include:
| • | | $61.7 million to support the continued preservation of the heritage-listed Queensland Cultural Centre; maintenance activities across the Queensland Museum Network in Brisbane, Townsville, Toowoomba and Ipswich; and revitalisation of the Judith Wright Arts Centre and other state-owned arts and cultural facilities through the Arts Infrastructure Investment Fund |
| • | | $11 million to enhance cyber security across the Queensland Government |
| • | | $10.8 million over 4 years to implement priority actions in response to the Royal Commission into National Natural Disaster Arrangements |
| • | | $7.7 million over 4 years to establish a drug and alcohol residential treatment program for young people. |
These initiatives are examples of the responsiveness of the Queensland public sector in delivering innovative support and services to Queenslanders to enable them to successfully participate in the economy and society as the state emerges from the global health crisis.
Supporting Queenslanders
In the context of the COVID-19 crisis, the Queensland Government introduced a wide variety of concessions providing support for individuals, families and businesses which reduce the cost of living or the cost of doing business. Many of these concessions provided the targeted and temporary relief needed to allow Queensland businesses to remain viable and to support Queensland households during the crisis.
However, the majority of Queenslanders and Queensland businesses benefit from at least one Queensland Government concession and, in many cases, benefit from multiple concessions each year. These include targeted discounts, rebates and subsidies based on eligibility criteria, as well as broader concession arrangements to reduce prices paid by consumers for transport, electricity and water services.
The total value of all concessions provided to Queenslanders and Queensland businesses in 2021–22 is estimated to be $6.148 billion.
In addition to concessions, the Queensland Government also moved quickly in response to COVID-19 to introduce substantial tax relief measures to support Queensland businesses, particularly small to medium businesses. These initiatives, including refunds, holidays, waivers, rebates, deferrals and exemptions from various tax liabilities and fees and charges, have helped support the cashflow and viability of tens of thousands of Queensland businesses, landlords, tenants, and the state’s many pubs and clubs.
9
Budget Strategy and Outlook 2021-22
Economic outlook
The severe health and economic shock caused by the COVID-19 pandemic saw the global economy contract by 3.3 per cent in 2020, according to the International Monetary Fund, a much greater impact than the 0.1 per cent decline in global activity recorded in 2009 at the height of the Global Financial Crisis.
The national economy fell into recession in 2020, for the first time since 1991. However, Queensland and Australia’s relative success in containing the spread of COVID-19, in addition to significant fiscal and monetary policy support, meant the economic impacts nationally were less severe than in many other countries.
Reflecting the success of Queensland’s health response, Queensland’s domestic economy has rebounded strongly, with business and consumer confidence currently at elevated levels.
However, several ongoing risks remain, including those related to the global vaccine rollout, ongoing geopolitical and trade tensions, particularly between the Unites States and China, and challenges in Australia’s trade relationship with China.
Reflecting the improved domestic conditions, GSP is forecast to rebound 31⁄4 per cent in 2020–21, significantly stronger than the 1⁄4 per cent growth expected at the time of the 2020–21 Budget. Robust ongoing growth of 23⁄4 per cent is forecast for 2021–22 and in each subsequent year across the forward estimates.
Following a 7 per cent rebound in September quarter 2020, Queensland’s domestic activity continued to grow across the December and March quarters, to be 3 per cent above the pre-COVID-19 level of March quarter 2020. This was almost double the 1.7 per cent growth in the rest of Australia over the year, and substantially higher than the 1.9 per cent in New South Wales, while domestic activity in Victoria was still 0.3 per cent below its pre-COVID-19 level.
The strength of the Queensland economy has been underpinned by elevated activity in consumer spending and the housing sector.
Queensland’s labour market has also improved substantially, with employment in April 2021 having rebounded by 253,200 persons since May 2020, to be 54,900 persons above the pre-pandemic level in March 2020. In comparison, employment in the rest of Australia in April 2021 was still 9,000 below the level in March 2020.
Reflecting the current strength in jobs growth and the broader economic recovery, year-average employment growth in 2020–21 is now forecast to be 21⁄4 per cent, much higher than the 1 per cent forecast in the 2020–21 Budget.
This strong jobs growth means the quarterly unemployment rate is now forecast to fall to 6 1⁄4 per cent in June quarter 2021, while the year-average unemployment rate in 2020–21 is now expected to be 7 per cent, down from the 71⁄2 per cent forecast at the previous Budget.
Ongoing strong employment growth of 3 per cent in 2021–22 is expected to drive down the unemployment rate to 53⁄4 per cent by June quarter 2022, with the unemployment rate steadily improving across the forecast period to be 5 per cent by June quarter 2025.
10
Budget Strategy and Outlook 2021-22
| Overview Table 1 | Queensland economic forecasts/projections1 |
| | | | | | | | | | | | | | | | | | | | | | | | |
| | | Actuals | | | Forecasts | | | Projections | |
| | | 2019–20 | | | 2020–21 | | | 2021–22 | | | 2022–23 | | | 2023–24 | | | 2024–25 | |
Gross state product2 | | | -0.7 | | | | 31⁄4 | | | | 23⁄4 | | | | 23⁄4 | | | | 23⁄4 | | | | 23⁄4 | |
Nominal gross state product | | | -1.5 | | | | 21⁄4 | | | | 63⁄4 | | | | 51⁄4 | | | | 5 | | | | 43⁄4 | |
Employment3 | | | 0.6 | | | | 21⁄4 | | | | 3 | | | | 13⁄4 | | | | 13⁄4 | | | | 13⁄4 | |
Unemployment rate4 | | | 7.6 | | | | 61⁄4 | | | | 53⁄4 | | | | 51⁄2 | | | | 51⁄4 | | | | 5 | |
Inflation3 | | | 1.2 | | | | 2 | | | | 13⁄4 | | | | 13⁄4 | | | | 2 | | | | 21⁄4 | |
Wage Price Index3 | | | 1.9 | | | | 13⁄4 | | | | 21⁄4 | | | | 21⁄4 | | | | 21⁄2 | | | | 23⁄4 | |
Population3 | | | 1.7 | | | | 1 | | | | 1 | | | | 11⁄4 | | | | 11⁄2 | | | | 11⁄2 | |
Notes:
| 1. | Unless otherwise stated, all figures are annual percentage changes. |
| 2. | Chain volume measure (CVM), 2018–19 reference year. |
| 3. | Annual percentage change, year-average. |
| 4. | Per cent, June quarter average, seasonally adjusted. |
Sources: ABS National, State and Territory Population, Labour Force, Wage Price Index, Consumer Price Index and Queensland Treasury.
Fiscal outlook
The 2021–22 Budget sets out how the government’s fiscal recovery plans are being implemented and how they are expected to drive improving fiscal performance.
The strategy for fiscal recovery outlined in the 2020–21 Budget clearly emphasised prioritising economic recovery alongside targeted expenditure and capital prioritisation, to position Queensland well for fiscal repair.
The fiscal strategy for the 2021–22 Budget is underpinned by the development of a new Charter of Fiscal Responsibility. This will aim to guide fiscal recovery in the medium term, addressing the key areas of the debt burden, affordable expenditure growth leading to regaining an operating surplus, funding of capital expenditure, competitive taxation, and retaining the long-standing commitment to targeting full funding of superannuation and workers’ compensation liabilities.
The fiscal strategy directs improvements in revenue towards economic recovery priorities and a return to operating surplus. The government’s main objective in response to the COVID-19 induced fiscal challenge is to stabilise its relative net debt burden and, to that end, targeting a return to operating surpluses is recognised as an essential condition for that stabilisation.
Compared to the outlook in the 2020–21 Budget, the economy has recovered quicker and stronger than forecast. This has flowed through to benefit key fiscal aggregates, particularly the uplift in key revenues such as own-source taxes and GST. This has been coupled with targeted expenses growth due to the government implementing strategies to contain increases. The recovery in the revenue outlook is allowing the government to balance additional funding for priority service needs, including the evolving COVID-19 response, with improved operating balances and significantly lower net debt and borrowings relative to the 2020–21 Budget.
11
Budget Strategy and Outlook 2021-22
Improved revenue performance and disciplined expenditure growth have resulted in operating deficits far lower than estimated at the 2020–21 Budget, with a return to operating surplus forecast in 2024–25. Achieving ongoing operating surpluses in the medium term, combined with net operating cashflows from operating activities primarily funding the general government sector capital program, will allow the government to stabilise debt levels and reduce debt as a proportion of revenue over time.
| Overview Chart 1 | General Government net operating balances |
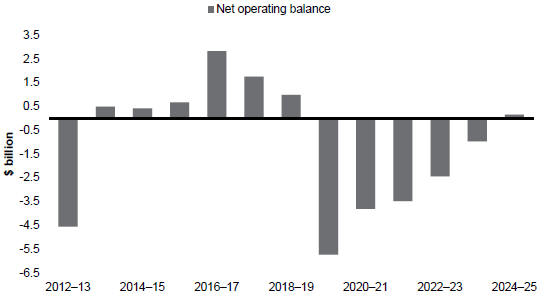
A significant public infrastructure investment program is being maintained as a major driver of economic growth and job creation, with a commitment to a 4-year program of $52.216 billion from 2021–22 to 2024–25. The fiscal position is also recovering from the impacts of COVID-19, with revenue growing more strongly than expenses and an operating surplus forecast in 2024–25. Significantly, net cash flows from operating activities are expected to primarily fund the General Government Sector capital program from 2024–25.
The COVID-19 crisis and actions taken to support and drive the economic recovery had a substantial impact on Queensland’s fiscal aggregates, particularly borrowings. However, the current low interest rate environment strengthens serviceability with interest expense forecast to be 2.6 per cent of revenue in 2021–22, well below the peak of 4.7 per cent in 2013–14.
Compared to the 2020–21 Budget, additional revenue has reduced the need for borrowings to finance the Government’s existing operating and capital program. This is a welcome development that improves fiscal capacity to respond to future shocks and deliver productive infrastructure into the future. Accordingly, the Budget sets a strategy to preserve fiscal capacity by reducing projected debt levels.
12
Budget Strategy and Outlook 2021-22
General Government net debt will be much lower than in the 2020–21 Budget, with net debt in 2021–22 of $24.75 billion ($10.761 billion lower than the 2020–21 Budget estimate of $35.511 billion) increasing gradually to $39.019 billion by 2023–24 ($11.762 billion lower than the 2020–21 Budget estimate of $50.782 billion).
This improvement relative to the 2020–21 Budget estimate is driven by a combination of higher revenue attributable to earlier and stronger than anticipated economic growth, targeted expenditure growth, and a material increase in the anticipated value of investments contributed to the first Queensland Future Fund (QFF) – Debt Retirement Fund (DRF) (refer Box 3.1).
The increase in net debt moderates gradually over the forward estimates as improvements in the operating balance and strengthened net cash inflows from operating activities reduce the requirement to borrow to fund the General Government Sector’s capital program.
There remain several risks to the improved fiscal outlook, in line with the key risks to the economic outlook as discussed above, including any delays in a timely global vaccine rollout and ongoing geopolitical and trade tensions, including Australia’s trade relationship with China.
| Overview Table 2 | General Government Sector key fiscal aggregates1 |
| | | | | | | | | | | | | | | | | | | | | | | | | | | | |
| | | 2019–20 | | | 2020–21 | | | 2020–21 | | | 2021–22 | | | 2022–23 | | | 2023–24 | | | 2024–25 | |
| | | Outcome | | | Budget | | | Est. Act. | | | Budget | | | Projection | | | Projection | | | Projection | |
| | | $ million | | | $ million | | | $ million | | | $ million | | | $ million | | | $ million | | | $ million | |
Revenue | | | 57,764 | | | | 56,249 | | | | 60,396 | | | | 63,664 | | | | 65,711 | | | | 68,408 | | | | 70,367 | |
Expenses | | | 63,498 | | | | 64,881 | | | | 64,199 | | | | 67,148 | | | | 68,151 | | | | 69,376 | | | | 70,214 | |
Net operating balance | | | (5,734 | ) | | | (8,633 | ) | | | (3,803 | ) | | | (3,485 | ) | | | (2,440 | ) | | | (968 | ) | | | 153 | |
PNFA2 | | | 6,291 | | | | 7,572 | | | | 6,965 | | | | 7,800 | | | | 7,786 | | | | 7,275 | | | | 7,041 | |
Fiscal balance | | | (9,158 | ) | | | (13,440 | ) | | | (8,159 | ) | | | (7,965 | ) | | | (6,379 | ) | | | (3,630 | ) | | | (2,079 | ) |
Borrowing with QTC | | | 37,570 | | | | 53,501 | | | | 47,102 | | | | 57,240 | | | | 67,110 | | | | 73,265 | | | | 77,761 | |
Leases and other similar arrangements | | | 6,499 | | | | 7,565 | | | | 7,779 | | | | 7,603 | | | | 7,471 | | | | 7,780 | | | | 7,623 | |
Securities and derivatives | | | 198 | | | | 198 | | | | 198 | | | | 198 | | | | 198 | | | | 198 | | | | 198 | |
Net debt | | | 14,046 | | | | 25,499 | | | | 15,808 | | | | 24,750 | | | | 33,326 | | | | 39,019 | | | | 42,573 | |
Notes:
| 1. | Numbers may not add due to rounding. |
| 2. | PNFA: Purchases of non-financial assets. |
13
Budget Strategy and Outlook 2021-22
| Overview Chart 2 | General Government Sector net debt |
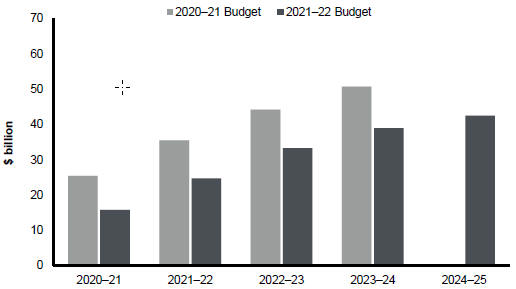
14
Budget Strategy and Outlook 2021-22
| 1 | Economic Strategy: A strong economy for all Queenslanders |
Features
| • | | During the COVID-19 pandemic, the Queensland Government acted decisively to defend the health of Queenslanders. |
| • | | The government is investing $22.237 billion to continue providing a world-class health system, which is critical for effectively managing the ongoing risks of COVID-19. |
| • | | While the emergency health response imposed short-term disruption, Queensland’s success in managing the health challenge means Queensland’s economic recovery from COVID-19 has begun sooner and is stronger than the rest of Australia. As of April 2021, total employment in Queensland is now 54,900 above the pre-COVID-19 level. However, some key industries and regions continue to be impacted due to the closure of international borders. |
| • | | The Queensland Government’s Economic Recovery Plan continues to support businesses, workers, families and communities across the state. The government’s economic response and policy focus will transition from shorter-term stimulatory support to investment in policies and initiatives with a greater focus on improving the state’s productivity, competitiveness, community strength and liveability to drive ongoing private sector growth and jobs. |
| • | | A key element of the government’s efforts to drive private sector growth and jobs is the flagship $3.34 billion Queensland Jobs Fund. The fund has an enhanced focus on investment attraction and industry development, ensuring that in a post-pandemic global environment, Queensland is well positioned to attract the investment needed to support ongoing growth, and provide wider economic and employment benefits. |
| • | | Other key initiatives in the 2021–22 Queensland Budget include targeted measures that: build Queensland’s productive capacity through investments in infrastructure, skills and innovation; promote economic and environmental sustainability; improve business competitiveness; and ensure a responsive public sector. These measures will enable Queensland to continue to successfully compete in national and international markets, both in terms of attracting investment and in the export of Queensland goods and services. |
| • | | The government’s $52.216 billion capital program over the forward estimates will help create thousands of ongoing jobs, in addition to sustaining direct construction jobs, including around 46,500 jobs in 2021–22. The 2021–22 Budget also commits $460 million in additional funding towards targeted investments in skills, training and employment programs to provide an enhanced focus on productivity and support for disadvantaged cohorts to improve their prospects of securing employment. |
| • | | Targeted measures to support small businesses and regional economies will create enduring benefits for businesses and households. |
| • | | Building on the strong economic recovery to date, the government’s economic strategy will be founded on protecting the health of Queenslanders. |
15
Budget Strategy and Outlook 2021-22
| 1.1 | Ensuring economic recovery by safeguarding Queenslanders’ health |
During the COVID-19 pandemic, the Queensland Government acted decisively to protect the health of Queenslanders. These actions were unprecedented, including at various times, lockdowns, border closures, social distancing requirements and mandatory mask directives. While these actions were disruptive to the economy in the short term, by protecting the health of Queenslanders, economic confidence has been maintained and the long-term economic benefits are significant.
Consequently, Queensland’s economic recovery from COVID-19 commenced sooner, and has been stronger, than the rest of Australia. As of April 2021, total employment in Queensland is now 54,900 persons above the pre-COVID-19 level of March 2020, with two-thirds of the increase in full-time employment.
The extent of Queensland’s overall economic recovery to date has exceeded expectations, although certain key industries and regions continue to be materially impacted by international border closures and the ongoing lack of overseas visitors.
The Queensland Government’s Economic Recovery Plan continues to support businesses, workers, families and communities across the state. The Plan includes 6 economic recovery priority areas: safeguarding our health; backing small business; making it for Queensland; building Queensland; growing our regions; and investing in skills. In addition to the 6 recovery priority areas, the Queensland Government’s objectives for the community also include supporting jobs, backing our frontline services and protecting the environment.
Queensland’s COVID-19 Economic Recovery Plan – Budget update details the Queensland Government’s recovery initiatives, which have delivered and continue to deliver on these priority areas by protecting our health, creating jobs and working together.
Beyond the immediate challenges posed by the pandemic, longer-term challenges and opportunities also continue to impact Queensland’s economic performance, including changes in global trade, growth of new and emerging export markets, digital disruption and technological change, demographic change (including the ageing population) and natural disasters.
Therefore, as the health crisis evolves and the economy continues to strengthen, the Queensland Government’s economic response and policy focus will continue to transition from short-term support and stimulus measures to supporting jobs and economic growth by improving productivity and competitiveness, and attracting private sector investment.
The resulting improvement in the state’s fiscal capacity will also support the delivery of improved infrastructure and the essential services and support needed to meet the needs of Queenslanders.
16
Budget Strategy and Outlook 2021-22
To achieve these outcomes, the government’s economic strategy will continue to focus on 5 key foundations for economic growth and related policy focus areas:
| 1. | Protecting health – the foundation of Queensland’s economic success has been its success in managing the pandemic. Accordingly, the government will continue to ensure that Queenslanders are protected from COVID-19. |
| 2. | Building the state’s productive capacity – by delivering productive infrastructure, investing in skills and fostering the development and uptake of innovation. |
| 3. | Leveraging Queensland’s natural and competitive advantages – to promote regional growth by driving and attracting increased private sector investment. |
| 4. | Improving business competitiveness – positive economic conditions, improved infrastructure, effective education, skills and training will help ensure the ongoing success of Queensland business. |
| 5. | Maintaining a responsive public sector – ongoing and innovative delivery of essential services to ensure the needs and expectations of all Queenslanders continue to be met through the delivery of essential services and support across the state. |
17
Budget Strategy and Outlook 2021-22
| Figure 1 | Economic Strategy to boost productivity and competitiveness |
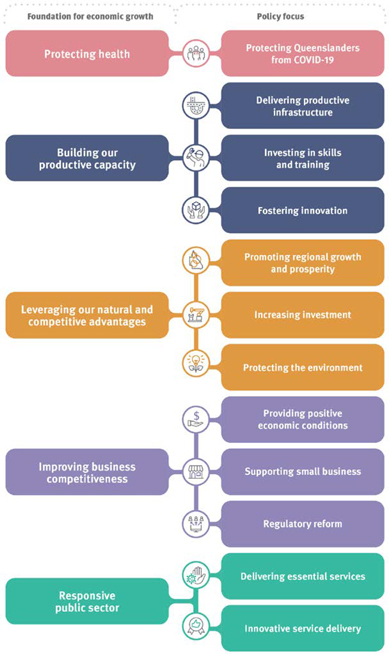
18
Budget Strategy and Outlook 2021-22
During the COVID-19 pandemic, the Queensland Government acted decisively to protect the health of Queenslanders. These actions were unprecedented, including at various times, lockdowns, border closures, social distancing and mandatory mask directives. While these actions were disruptive in the short term, by protecting the health of Queenslanders, economic confidence has been maintained, and the long-term economic benefits are significant.
| 1.2.1 | Protecting Queenslanders from COVID-19 |
Globally and nationally, there is strong correlation between good health outcomes and good economic outcomes. Queensland’s success in containing the spread of the virus has allowed the Queensland Government to relax restrictions and re-invigorate the domestic economy. Queensland Treasury analysis of the economic impact of easing restrictions estimated that the cumulative positive economic impact in line with the 3 stages of Queensland’s roadmap for easing restrictions was around $1.8 billion per month, supporting around 167,000 jobs.
This analysis also found that much, if not all, of these economic gains could be lost if the spread of the virus led to Queensland having to impose or reimpose substantial emergency health restrictions. In particular, Queensland Treasury’s analysis indicated that if an extended ‘hard lockdown’ similar to that previously imposed in Victoria was needed, the incremental impact of moving to a Stage 4 lockdown could reduce Queensland’s GSP by around $3.1 billion per month compared with the level of economic activity that prevailed in December quarter 2020.
The Queensland Government’s primary objective throughout the COVID-19 pandemic has been to contain the spread of the virus to minimise health risks for individuals and the community, thereby preventing significant strain on the public health system. This commitment is further reflected in the significant investments in health outlined in the 2021–22 Budget, with $20.885 billion in operating funding, an increase of $685.7 million (or 3.4 per cent) compared with the 2020–21 Budget. A capital program of $1.352 billion in 2021–22 is also provided to continue to deliver first-class health services to Queenslanders.
The significant additional investment in health includes the establishment of a $2 billion Hospital Building Fund to assist in meeting growth pressures across the health system, with initial investments in the Toowoomba Day Surgery, purchasing public health services through the expansion at Mater Public Hospital Springfield and an uplift in Queensland Health’s base capital program.
Further, $482.5 million has been provided to address pressures in emergency patient flow through our public hospitals, elective surgery and specialist outpatient waitlists and the opening of the Nambour Hospital Redevelopment.
The Budget also provides $480 million to continue the COVID-19 response including fever clinics, contact tracing and testing capability, the vaccination program, compliance activities, facilitation of quarantine in government arranged accommodation, COVID-19 contact centres and wellness checks for people in mandatory hotel quarantine. This funding is provided across several agencies, including Queensland Health, Queensland Police Service and Queensland Fire and Emergency Services.
19
Budget Strategy and Outlook 2021-22
To date, the majority of vaccinations have been administered within the Australian Government’s controlled supply chains including through primary care and aged care sites. To assist the Australian Government to improve vaccine delivery to Queenslanders, the Queensland Government is stepping up its jurisdictional channels.
By keeping Queenslanders safe, this will help maintain the consumer and business confidence needed to support the state’s ongoing strong economic recovery.
| Box 1.1 | Driving a productivity agenda |
Enhancing productivity is integral to delivering a strong economy for all Queenslanders. The government will continue to drive increased productivity and growth by maintaining a regulatory and policy environment to support Queensland businesses, industries, and not-for-profit organisations. Enhancing productivity also promotes government agencies to find better and smarter ways of producing the goods and services that Queenslanders need.
Driving productivity growth has been a policy challenge for most developed economies over recent decades. Consistent with national and global trends, the latest data suggests that market sector productivity growth has been subdued in recent years, with growth between 2016–17 and 2018–19 averaging only 0.3 per cent per annum.
Many factors impact on productivity, including natural disasters, drought and declines in non-renewable resources, but state governments can play a key role in supporting and boosting productivity growth.
It is likely that global productivity will have been heavily impacted by COVID-19. However, Queensland’s success in managing the pandemic and the resulting strong rebound in economic activity should help support the state’s future productivity performance.
The Queensland Government is committed to significant investment in productive infrastructure to improve connectivity and labour mobility. It is also focussed on reducing costs for business, including by making energy prices more affordable, and developing the skills base of the state’s workforce to prepare Queenslanders for the jobs of the future.
Further, the Queensland Government’s approach to attracting investment and industry development, including supporting the growth of sustainable, clean energy generation, will ensure the economy can capitalise on emerging and future opportunities.
Through the COVID-19 pandemic, Queensland workers and businesses have demonstrated their ability to innovate and respond successfully to challenges. The government is committed to building on these successes through well-targeted investment in skills and training to meet the skills needs of the private sector and help individuals to re-engage with the labour market as the economic recovery continues.
20
Budget Strategy and Outlook 2021-22
The 2021–22 Budget reaffirms and refocuses the government’s commitment to 2 of its flagship skills and employment programs, Skilling Queenslanders for Work (SQW) and Back to Work. The budget delivers $320 million over 4 years to extend SQW and the program is now being permanently funded, embedding this program into the core business of the state. Further, up to $140 million over 4 years has been allocated for a revitalised Back to Work program, while the 50 per cent payroll tax rebate for apprentice and trainees has been extended for another 12 months to 30 June 2022.
These expanded and enhanced measures will also be key in supporting women’s economic security and workforce participation. The 2021–22 Queensland Budget papers include the Investing for Women paper, which outlines investments to address barriers impacting on economic security, safety and success for women and girls.
| 1.3 | Building our productive capacity |
Enhancing productive capacity, through ongoing improvements in physical and human capital, is the key to driving sustainable economic and employment growth.
The government’s economic strategy will continue to be shaped by targeted actions that build Queensland’s productive capacity through investments in infrastructure, skills and innovation, thereby enabling Queensland to continue to successfully compete in national and international markets.
| 1.3.1 | Delivering productive infrastructure |
Investment in productive and resilient infrastructure is vital to ensure ongoing strong economic growth and to maintain the high standard of living enjoyed by Queenslanders.
Queensland’s Economic Recovery Plan emphasises building Queensland, including strategies to fast-track capital projects, where appropriate, to support construction jobs in the short-term and more importantly, invest in the productive economic infrastructure critical to the state’s future success.
The government’s focus on delivering economic and social infrastructure will also support future ongoing economic growth by reducing input costs for business, enhancing supply chain linkages, improving regional connectivity, unlocking economic opportunities and improving liveability across all regions of the state.
The 2021–22 Budget includes a $52.216 billion capital program over 4 years. The $14.688 billion capital program in 2021–22 will directly support around 46,500 jobs during the construction phase and support many more ongoing jobs through increased business activity and connectivity.
21
Budget Strategy and Outlook 2021-22
The 2021–22 capital program includes key investments to deliver productive infrastructure for roads, water security, health, education and the arts, and to enhance resilience. Highlights include: $1.517 billion for the continued delivery of Cross River Rail, Queensland’s largest ever capital project; $200 million for the Pacific Motorway (Varsity Lakes to Tugun); $180 million for the Bruce Highway (Cooroy to Curra) Section D; $31.3 million for the Smithfield Bypass; $85 million for the Haughton Pipeline Stage 2; and $176 million for the upgrade and expansion of the Cairns Convention Centre.
As part of the Government’s ongoing capital works program, the 2021–22 Budget provides additional funding for a range of key infrastructure programs, including:
| • | | $200 million over 3 years from 2024–2025 in increased funding as part of a total $1 billion Works for Queensland program for maintenance and minor infrastructure projects by regional councils |
| • | | $70 million over 3 years in increased funding for the Department of Regional Development, Manufacturing and Water to deliver Building our Regions (Round 6), bringing the total government investment in this program to $418.3 million since 2015 |
| • | | $150 million over 5 years from 2022–2023 in increased funding to deliver on the government’s election commitment to provide $200 million over 6 years for the SEQ Community Stimulus Program. |
| Box 1.2 | 2032 Olympic and Paralympic Games |
On 25 February 2021, the International Olympic Committee (IOC) entered into exclusive negotiations with Brisbane, Queensland to host the 2032 Olympic and Paralympic Games (Brisbane 2032). The Brisbane candidature has been developed with the Games Partners, including the Australian Government, relevant local Councils, the Australian Olympic Committee and Paralympics Australia.
On 11 June, the IOC Executive Board considered a report by the Future Host Commission on the proposal. The Board has recommended the Brisbane 2032 candidature be put forward to election by the IOC in July 2021.
Consistent with the Queensland Government’s economic recovery plan, hosting Brisbane 2032 is about creating jobs, boosting our economy and building healthier communities over the next decade. The Games will provide a platform to leverage healthy and active community initiatives, sporting pathways for elite athletes, arts and culture, sustainability initiatives, tourism, trade and local business opportunities.
Brisbane 2032 represents a significant opportunity to work with Games Partners to deliver critical legacy infrastructure to support South East Queensland’s long-term growth and enable successful delivery of the Games.
The 2021–22 Budget provides $29.3 million over 2 years for the Department of Tourism, Innovation and Sport as an initial allocation of funding for preparations for future Olympic Games, should Queensland be successful in securing the 2032 Olympic and Paralympic Games.
22
Budget Strategy and Outlook 2021-22
The 2021–22 capital program includes key investments to deliver productive infrastructure for roads, water security, health, education and the arts, and to enhance resilience. Highlights include: $1.517 billion for the continued delivery of Cross River Rail, Queensland’s largest ever capital project; $200 million for the Pacific Motorway (Varsity Lakes to Tugun); $180 million for the Bruce Highway (Cooroy to Curra) Section D; $31.3 million for the Smithfield Bypass; $85 million for the Haughton Pipeline Stage 2; and $176 million for the upgrade and expansion of the Cairns Convention Centre.
As part of the Government’s ongoing capital works program, the 2021–22 Budget provides additional funding for a range of key infrastructure programs, including:
| Box 1.3 | North Queensland insurance affordability |
Over the past decade, north Queensland has borne the brunt of multiple major cyclones and floods, contributing to large increases in insurance premiums and reduced availability of insurance coverage.
The Australian Competition and Consumer Commission’s (ACCC) Northern Australia Insurance Inquiry - Final report noted that between 2007–08 and 2018–19, average premiums for home and contents insurance increased by 127 per cent in north Queensland, compared with 71 per cent in the rest of Australia.
The ACCC found that mitigation, both at the household and community level, can deliver material and sustainable reductions in insurance premiums.
The Queensland Government has made substantial investments in mitigation works over recent years, including through programs such as the $41.5 million Household Resilience Program, the $65 million Queensland Resilience and Risk Reduction Fund (QRRRF) and the $100 million 2019 Queensland Betterment Fund administered by the Queensland Reconstruction Authority (QRA).
The QRA was established in 2011 and until recently, has been the only permanent, stand-alone agency in Australia with a focus on disaster recovery and mitigation. In recognition of Queensland’s leadership success in disaster recovery, the Commonwealth and a number of the southern states have established similar organisations, emulating Queensland’s model.
Further, the Commonwealth Government’s Royal Commission into National Natural Disaster Arrangements recently acknowledged Queensland’s robust and internationally renowned resilience and betterments systems which have been developed over many years.
The Budget outlines further funding and actions to support risk mitigation through key infrastructure programs such as the $418.3 million Building our Regions program.
Key measures in the 2021–22 Budget that will also help increase disaster resilience and support insurance affordability include:
| • | | $14.4 million in funding to support mitigation projects in 2021–22 through the QRRRF, jointly funded by the Australian Government |
| • | | $10 million additional funding to establish the North Queensland Natural Disasters Mitigation Program to administer grants to local government for disaster mitigation initiatives that assist in reducing the cost of insurance in their communities. |
23
Budget Strategy and Outlook 2021-22
The Australian Government has also recently announced a $10 billion Northern Australia Reinsurance Pool, albeit with a commitment of only $2.4 million in 2021–22, further funding for disaster mitigation, and a $40 million North Queensland Strata Title Resilience Pilot Program to fund mitigation works for strata title properties.
The Queensland Government’s ongoing investment in mitigation works, complemented by the Australian Government’s recent commitments, will help to put downward pressure on insurance premiums for Queensland families and businesses in high-risk and cyclone-prone areas.
| 1.3.2 | Investing in skills and training |
Ongoing improvement in the skills of Queensland’s current and future workers, through investment in education, skills and training, is critical to boost Queensland’s productive capacity.
The government has been responsive in ensuring Queenslanders have the skills they need to find meaningful jobs and set up pathways for the future, including through extensions to key skills and employment programs, as well as providing a $100.5 million matching investment as part of the initial national JobTrainer Fund.
Well-targeted investment in skills and training will be important to meet the needs of the private sector and help individuals to re-engage with the labour market as part of the economic recovery.
Disadvantaged labour market cohorts, who lack the relevant experience, education or skills, are a key focus of the government’s investment in skills and training
Young people have historically been a key disadvantaged cohort. Queenslanders aged 15 to 24 years have a comparatively lower level of engagement in employment, education and training than their peers nationally. This has contributed to Queensland’s historical unemployment rate differential with the rest of Australia, as Queensland’s youth represent a larger share of the state’s labour force (one percentage point higher) than the national average.
Queensland’s relatively high proportion of Aboriginal and Torres Strait Islander peoples, another key disadvantaged labour market cohort, in addition to the state’s more decentralised population means, where appropriate, labour market programs need to have a strong emphasis on place-based responses and comprehensive wrap-around support measures such as financial counselling, mentoring, and job readiness training.
Reflecting the priority of supporting disadvantaged cohorts, the 2021–22 Budget reaffirms and refocuses the government’s commitment to 2 flagship skills and employment programs—Skilling Queenslanders for Work (SQW) and Back to Work. These programs have also been enhanced to boost their effectiveness and better support disadvantaged jobseekers.
The 2021–22 Budget delivers $320 million in additional funding over 4 years to extend SQW, taking the government’s total investment in the program to date to $750 million. This program has now been permanently funded, embedding this program into the core business of the state. The SQW program will assist up to 15,000 disadvantaged Queenslanders each year to gain the skills qualifications, and experience needed to enter and stay in the workforce and includes new programs to provide foundational skills (e.g. literacy and numeracy). It will also deliver targeted assistance to workers aged over 25 who require upskilling or reskilling to re-engage with the labour market.
24
Budget Strategy and Outlook 2021-22
These expanded and enhanced measures will also be key in supporting women’s economic security and workforce participation, as will the government’s continued strong investment in TAFE (which has seen a substantial increase in female enrolments), innovation (including the Female Founders Program and Women’s Research Assistance Program), and targeted grant programs (such as the Investing in Queensland Women’s Grant Program).
The 2021–22 Queensland Budget papers include the Investing for Women paper, which outlines investments to address barriers impacting on economic security, safety and success for women and girls.
To promote employment prospects for Queenslanders, up to $140 million in additional funding over 4 years has been allocated in the Budget for a revitalised Back to Work program. This will provide businesses with the confidence to employ Queenslanders who have experienced a period of unemployment and also help workers facing disadvantage in the labour market.
The government has also allocated $31.2 million to extend the 50 per cent payroll tax rebate for apprentice and trainees for another 12 months to 30 June 2022.
In addition to the government’s investment in skills and training, this Budget continues to commit significant funding towards education, to provide all young Queenslanders the opportunity to acquire knowledge and develop their potential to the best of their ability. To help Queensland’s next generation of workers take full advantage of the opportunities available to them, the 2021–22 Budget provides increased funding of around $1.4 billion for new schools to open in 2023 and 2024 and additional and renewed infrastructure in existing state schools.
| 1.3.3 | Fostering innovation |
Innovation is a key driver of long-term economic growth, particularly in developed economies such as Queensland.
The significant direct economic benefits and ‘spill-over’ effects of innovation provide a clear rationale for governments to foster research and development (R&D), initial commercialisation and the widespread diffusion and adoption of innovative ideas, technologies and practices. Importantly, innovation is clearly recognised in Queensland’s Economic Recovery Plan as a key factor in opening up opportunities in existing and new markets, and making Queensland more globally competitive.
The Queensland Government has invested heavily in innovation across the state over several years through its flagship initiative, Advance Queensland. Advance Queensland has invested a total of $755 million, which has helped over 7,500 innovators and projects to succeed and supported 27,000 jobs across the state. This has included innovative enterprises such as Tritium, the world-leading Queensland based manufacturer of electric vehicle fast charging infrastructure
The public and private response to the pandemic resulted in a wave of innovation that will have an enduring impact on future economic growth. Vaccine development efforts have spurred the development and uptake of numerous biomedical technologies.
25
Budget Strategy and Outlook 2021-22
Many businesses have adapted their business models to continue to effectively serve their customers in a pandemic environment. The crisis also highlighted that regulators and government agencies need to be flexible and implement new policies and delivery models to support economic activity and the provision of essential services.
Further, given the shift to more remote and flexible work practices, many Queensland businesses rapidly upgraded their telecommunications technology and processes. As businesses and workforces continue to adjust to more flexible work practices, innovation will continue to be a key element of ongoing business success and sustainability.
The Queensland Government continues to foster innovation across the economy and will continue to create a business and regulatory environment that encourages innovation and supports the development of new technologies and sectors.
In this context, the 2021–22 Budget continues to support small and medium businesses to innovate, build scale and realise their potential through the $100 million Business Investment Fund.
The government is committed to build manufacturing capabilities across the state, including through the creation of manufacturing hubs, which are supporting enterprises to become more productive and create the jobs of the future through technology adoption, skills and training, strategic business development and advance robotic manufacturing hub services.
The hubs aim to lift productivity, increase international competitiveness and stimulate job growth across the state as well as attract private sector investment. The Queensland Government has committed a total of $38.5 million to the manufacturing hubs and grants program with hubs currently operational in Cairns, Townsville, Rockhampton and Gladstone. Two additional hubs are to be developed, including a new hub to be created in Mackay, focusing on the manufacturing of bioproducts from crops grown in the region, and another at Gold Coast, with a focus on transport equipment and vehicles, food processing and metal products.
Queensland also has the potential to lead the nation in the future production of hydrogen for domestic and international markets. Queensland is already investing in research and development and training infrastructure, including $2.6 million over 2 years to establish the Queensland Hydrogen Taskforce.
The Taskforce will work closely with Government to guide implementation of the Queensland Hydrogen Industry Strategy 2019–2024, including an enhanced focus on the delivery of the necessary policy settings to ensure the sustainable development of the state’s emerging hydrogen industry.
The Budget also provides $9 million over 3 years to enable the Queensland Museum Network to continue to host the World Science Festival Brisbane, positioning Queensland as a hub for scientific leadership and enhancing the state’s profile as a knowledge economy.
Further, $7.7 million will be provided to deliver Tranche 3 of the Government Science Platform, which by making data more accessible, integrated and reliable, will support the ability of government, industry, research and the community to respond to complex environmental challenges.
26
Budget Strategy and Outlook 2021-22
| 1.4 | Leveraging our natural and competitive advantages |
As a relatively small and open economy in a competitive global marketplace, Queensland needs to continue to efficiently produce goods and services that the world wants.
To achieve this, an ongoing focus on leveraging Queensland’s competitive advantages, including the state’s substantial natural endowments across its regions, will be essential to attract and increase investment, and to maximise the economic prosperity shared by all Queenslanders.
| 1.4.1 | Promoting regional growth and prosperity |
Queensland’s economic recovery to date has been broad-based, with all regions seeing improvements in labour market conditions since the lows observed in the depths of the COVID-19 crisis in the first half of 2020. However, challenges remain, particularly in regions most affected by international border closures.
As such, targeted government support continues to be provided as part of Queensland’s Economic Recovery Plan, including through key initiatives such as the ‘Good to Go’ marketing campaign, the provision of tourism vouchers to travellers in key tourism regions like Cairns, the Whitsundays, the Gold Coast and Brisbane, and the $7.5 million Work in Paradise initiative to attract workers to help fill vacancies in key tourism jobs in the regions.
Queensland’s regions have a range of natural advantages, including an abundant supply of metal and mineral resources, energy, and productive agricultural land, as well as the natural beauty of the environment and landscape that make Queensland such an attractive destination for tourists from around the world.
The resources sector has been a key part of Queensland’s economic recovery from COVID-19. While Queensland’s economy has long relied on traditional resources such as coal and gas, there is also an increasing demand for new economy minerals used to make the products of the future.
The Queensland Resources Industry Development Plan sets out a long-term vision to ensure that Queensland’s resources industry can successfully navigate the shift to a lower carbon global economy and capitalise on new and emerging resource markets. The government is working closely with industry, the regions and communities to develop the plan and set a shared vision for the future of the resources industry, with the findings of this consultation to form the basis of a draft plan that will be released later this year.
Agriculture and food manufacturing play a key role in regional economies. The Queensland Government is committed to the development and release of a future-focussed industry development strategy for the agribusiness and food sector, which is designed to help the sector add value to the economy, the community and our environment through initiatives that will promote the productivity, profitability, sustainability, and resilience of Queensland’s industries and safeguard the natural environment.
27
Budget Strategy and Outlook 2021-22
Queensland’s regions also benefit from a large, well-educated and responsive workforce, given around 50 per cent of Queensland’s residents live outside of Greater Brisbane, which is a significantly higher proportion of regional residents compared with New South Wales (34 per cent) or Victoria (23 per cent).
The state’s regional economies are highly trade-exposed. Chart 1.1 presents the share of each region’s total economic output, comprising output across the agriculture, forestry and fishing, mining, manufacturing and tourism and hospitality industries, which broadly represent the key categories of tradable goods and services. This highlights the extent to which many regional economies are relatively more trade-exposed compared with South East Queensland regions.
This means the economic and employment growth prospects of Queensland’s regions are inextricably linked to the level of international and national demand for key goods and services, as well as competition from other jurisdictions and countries exporting similar goods and services.
Improving the competitiveness of businesses and industries in Queensland’s regions is, therefore, one of the key factors that will support and drive the continued development and transition of these important regional economies and labour markets.
| Chart 1.1 | Share of regional output related to highly tradeable goods and services |
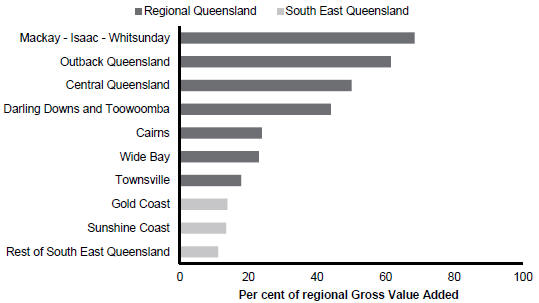
Note: Rest of South East Queensland includes all Brisbane, Moreton Bay, Ipswich and Logan – Beaudesert Statistical Area 4 (SA4) regions.
Source: Queensland Treasury, Gross Regional Product, 2016–17 estimates
Another critical factor in leveraging the natural advantages of Queensland’s regions is the government’s ongoing focus on boosting their physical, digital, and social connectivity with other parts of the state and beyond. This includes ongoing investment in key transport infrastructure such as roads, rail and ports, but also telecommunications and digital infrastructure to support broader business and social integration with the rest of the state.
28
Budget Strategy and Outlook 2021-22
For example, QCN Fibre, the Queensland Government’s company established to improve regional connectivity through leveraging spare telecommunication capacity in government-owned fibre networks, will benefit from an upgrade to Powerlink’s telecommunications network and be able to offer more data capacity and a greater number of services to customers right across Queensland. Completion of the network-wide upgrade is targeted for June 2022.
Continuing the government’s record of strong spending on infrastructure in regional Queensland, the 2021–22 Budget will invest $8.987 billion in capital works outside of the greater Brisbane region in 2021–22, directly supporting around 29,800 jobs in these regions in 2021–22 and helping increase regional connectivity.
Highlights of the regional capital program include:
| • | | continuation of in-river works for the $367.2 million Rookwood Weir, which will add up to 86,000 megalitres of medium priority water supply for the Central Queensland region |
| • | | commencement of construction of the $250 million Karara Wind Farm in the Darling Downs, which will provide 102.6 MW of additional renewable energy capacity. |
Regional development and infrastructure will be further supported by the increased $200 million funding provided in this Budget for the $1 billion Works for Queensland program and $418.3 million Building our Regions program, which includes $70 million in new funding for the Department of Regional Development, Manufacturing and Water to deliver Building our Regions (Round 6).
The Queensland Government’s ongoing commitment to promoting regional development and connectivity is further demonstrated by the allocation of $9.1 million over 4 years and $2.5 million per year ongoing in this Budget to continue the Regional Communities Program, which will help rural and regional communities identify and address their key priorities in consultation with government.
The Budget also continues to support Queensland’s drought-affected regions, with up to $71.4 million over 4 years for the Drought Assistance and Reform Package, helping alleviate cost pressures both for agricultural businesses and communities, and a further $50 million per annum for 4 years in drought preparedness and emergency drought loans. The budget also provides $16.7 million in additional funding over 5 years to finalise long-term decisions on the future of Queensland Agricultural Training Colleges’ assets, including a new Central Queensland Smart Cropping Centre at Emerald.
To support the return of aviation services and rebuild Queensland’s visitor economy, the Budget also provides $10 million over 2 years for the Aviation Route Support Package, which will fast-track route development in Queensland.
Further, to help increase the connectivity of Queensland’s regions and provide access to essential telecommunications, the Budget delivers up to $12 million in additional funding over 3 years for the Mobile Black Spot Program to improve coverage in areas where it is limited or non-existent. The Government has also invested $1 million to develop options to improve digital connectivity for regional communities and businesses.
29
Budget Strategy and Outlook 2021-22
The Queensland Government is supporting better health outcomes for Queenslanders in the regions through investment in regional hospital and health infrastructure upgrades. The Government is investing $426 million for new and upgraded regional hospitals including at Atherton, Cairns, Fraser Coast, Mer (Murray Island), Proserpine, Rockhampton, Roma, Sarina and Thursday Island.
Rural and regional state schools will continue to benefit from the Government’s investment in schools, including an investment of $235 million for new or upgraded multi-purpose school halls and performing arts centres to be delivered through the $1 billion Great Schools, Great Future election commitment. This includes a new hall for Oakey State High School, a new performing arts centre for Trinity Bay State High School, while Woree State High School will get an extension to an existing hall.
| 1.4.2 | Increasing investment |
Queensland’s private sector supports 84 per cent of the state’s employment. Therefore, creating an environment conducive to encouraging private investment is essential to drive sustainable economic growth and job creation over the long term.
The investment climate and conditions in Queensland have evolved substantially over the past decade. In the early 2010s, Queensland experienced an unprecedented business investment boom associated with development of the state’s LNG sector. Since that time, private business investment has been impacted by a range of factors, including a weaker global economic outlook, increased global uncertainty and trade tensions.
More recently, the impacts of the COVID-19 crisis have exacerbated the existing weakness in global economic activity and growth, with flow-on impacts on business confidence and investment, particularly in some trade-exposed industries, sectors and regions.
However, Queensland’s success in containing the spread of COVID-19 and the Queensland Government’s Economic Recovery Plan have seen domestic economic activity and employment recovering strongly. Surveys indicate that business confidence and conditions are now back above both their pre-COVID-19 levels and long-term averages.
Many businesses are now operating above their long-term average capacity levels, and together with prevailing low interest rates, this provides an investment climate which should encourage firms to increase their investment in new capacity. Therefore, notwithstanding the remaining uncertainty around the global pandemic, the outlook for business investment has become increasingly positive in recent months.
The Queensland Government continues to pursue a broad range of policies and programs focused on industry attraction and development. Since 2016, the Advance Queensland Industry Attraction Fund and the Jobs and Regional Growth Fund have supported over 77 projects to deliver more than 4,100 new direct jobs and almost $2.5 billion in capital investment.
Building on this momentum, the 2021–22 Budget is delivering an enhanced investment attraction and industry development program through its centrepiece $3.34 billion Queensland Jobs Fund.
30
Budget Strategy and Outlook 2021-22
As detailed in Box 1.4, the Queensland Jobs Fund has an enhanced focus on the creation of jobs through investment attraction and industry development. In the post-pandemic era, Queensland needs to compete more intensively with the rest of the world and other states for private sector investment. Importantly, the Queensland Jobs Fund will also have a strong focus on facilitating investment in priority sectors where the state has economic strengths, such as renewable energy, hydrogen, manufacturing, food and agritech, aerospace and defence, and digital innovation. It will also support projects that have broader supply chain and regional development benefits extending beyond individual firms.
| Box 1.4 | Queensland Jobs Fund |
The Queensland Jobs Fund (the Fund) is a $3.34 billion program which brings together the Queensland Government’s investment attraction and industry development programs for business attraction and facilitation in Queensland.
The Fund incorporates a range of existing initiatives and commits funding for a number of newly established funds.
Industry Partnership Program
This fund also includes the new $350 million Industry Partnership Program, providing small to medium-sized enterprises and research institutions in Queensland with tailored support that strengthens local supply chains and grows the industry footprint to create and sustain jobs. Facilitating a ‘single front door’ approach to industry development will minimise costs and resources for businesses to expand or maintain jobs in Queensland.
Business Investment Fund (BIF)
As part of the COVID-19 Fiscal and Economic Review released in September 2020, the government announced the Backing Queensland Business Investment Fund (BQBIF).
This support is continuing through the $100 million BIF, which is part of the BQBIF, to drive investment in established small and medium sized businesses to help them innovate, build scale, realise their potential, and promote job creation in Queensland.
The 2021–22 Budget also commits $20.6 million over 5 years to continue the implementation of the International Education and Training Strategy to Advance Queensland 2016–2026. This funding will allow the government to continue to provide targeted support to the international education and training sector, which has been significantly impacted by COVID-19, and will support the industry to remain competitive when international borders reopen.
An additional $71 million has been allocated to support the Queensland screen industry. This includes:
| • | | $53 million to continue the Screen Queensland Production Attraction Strategy to help maintain the state’s competitiveness as a production location |
| • | | $10 million for the Post, Digital and Visual Effects incentive to encourage and attract screen businesses to undertake post-production activities in Queensland |
31
Budget Strategy and Outlook 2021-22
| • | | $4 million for the Screen Finance Program to support growth of the local screen industry by directly investing in productions and games development |
| • | | $4 million for the North Queensland Regional Program to extend the footprint of the Queensland screen industry and support the delivery of the new Far North Queensland Studio in Cairns. |
| 1.4.3 | Protecting the environment |
Protection of Queensland’s rich natural environment in a way which complements the state’s economic development priorities is essential to ensure economic growth is sustainable and to enhance the welfare of future generations of Queenslanders.
The Queensland Government is actively working, in line with its election commitment, to develop a Climate Action Plan 2020–2030, including actions to reduce emissions and increase sustainability.
Queensland has long held a comparative advantage in the provision of reliable and affordable energy. The Queensland energy sector has supported growth in the economy in 2 ways: firstly, as an important sector of the economy that directly creates jobs and value; and secondly, by providing reliable and affordable energy that underpins activity and supports competitiveness in the rest of the economy.
As seen in other parts of Australia, price shocks and supply interruptions can cause significant economic disruption. Queensland’s stable and well-planned electricity network means industry can invest in Queensland with confidence.
International governments and global businesses are transitioning to a lower emissions future and making investment decisions on that basis. Queensland is already well placed to grow within this new paradigm. With a 50 per cent renewable energy target by 2030, and a $2 billion Queensland Renewable Energy and Hydrogen Jobs Fund, the Queensland Government is focused on driving green-based economic development, securing current jobs, and growing future industries and the jobs that come with it.
Embracing green energy will also create jobs and grow the economy. The Queensland Government’s commitment to a 50 per cent renewable energy target by 2030 has created a favourable climate for renewable energy investment, attracting and enabling approximately $10 billion of investment since 2015.
Government ownership of renewable energy assets is a key pillar of this transition, with Queensland’s publicly-owned clean energy generator, CleanCo, commencing construction of the $250 million 102.6MW Karara Wind Farm in the Darling Downs. To further support the 50 per cent renewable energy target by 2030 and net zero emissions by 2050, the government will continue to invest in publicly owned renewables, including in partnership with private sector. The Queensland Renewable Energy and Hydrogen Jobs Fund (formerly the Queensland Renewable Energy Fund) will benefit from an additional investment of $1.5 billion, taking total investment in the fund to $2 billion. The fund allows energy government-owned corporations to increase ownership of commercial renewable energy and hydrogen projects, along with supporting infrastructure, including in partnership with the private sector. This will continue to support the state’s transition to renewable energy.
32
Budget Strategy and Outlook 2021-22
In 2021–22, the $145 million commitment to establish Queensland Renewable Energy Zones (QREZs) will see proposals progressed for the Southern and Northern QREZs, as well as engagement for the Central QREZ. This will aim to bring together coordinated investment in transmission and generation infrastructure with industrial demand in a way that benefits the Queensland economy and communities.
Of the QREZ allocation, $22 million has been committed over 2 years from 2021-22 to undertake a detailed feasibility study for a pumped hydroelectric storage project at Borumba, and concept studies for other sites. Investment in large-scale pumped hydroelectric storage will help manage the transition to renewable energy sources and provide generation support to stabilise the energy network.
Further, $61 million over 15 years from 2021–22 will be allocated to the environmental markets and investment initiatives, which includes funding for Round 2 of the Land Restoration Fund (LRF) and market support activities for the Carbon Farming Advice Rebate. The funding will also support the creation of the Queensland Natural Capital Fund (QNCF), which is a pilot program to be managed by QIC Limited on behalf of the State to facilitate private sector co-investment to generate both commercial and environmental market returns to support environmental, social and economic co-benefits and establish a pathway for ongoing private investment in the sector.
To ensure funding is available for future investment rounds of the LRF, a $500 million Carbon Reduction Investment Fund is being established. The returns on this fund will be available to support the existing LRF to leverage private finance and investment, and support financially sustainable carbon markets. The original $500 million investment will remain intact to deliver ongoing investment returns.
The state’s natural endowments and assets, such as the Great Barrier Reef, also provide significant economic and social benefits to Queensland, particularly in regional economies. To preserve this vital natural wonder of the world, the Queensland Government will continue the Queensland Reef Water Quality Program, providing $270.1 million over 5 years.
The 2021–22 Budget includes additional funding of $19.7 million in 2021–22, as part of $93.6 million additional funding over 4 years, for the Queensland Waste Management and Resource Recovery Strategy. The strategy provides the framework to help deliver coordinated, long-term and sustained growth for the recycling and resource recovery sector while reducing the amount of waste produced and ultimately disposed of, by promoting more sustainable waste management practices for business, industry and households.
In addition, $9.6 million has been allocated to continue the delivery of comprehensive mapping and assessment of vegetation change. This initiative continues the existing science behind the state’s tree clearing mapping by developing and delivering a range of additional scientific approaches to map woody vegetation extent, regrowth and condition, supporting the protection of the state’s vegetation assets.
33
Budget Strategy and Outlook 2021-22
| 1.5 | Improving business competitiveness |
For Queensland businesses to thrive it is critical that they are operating in an environment that supports their competitiveness and gives them the greatest possible chance to compete and succeed in domestic and global markets. To achieve this aim, the government will continue to have an ongoing focus on providing supportive economic conditions for business, delivering productive infrastructure, and helping to provide a labour force that is appropriately skilled and educated.
| 1.5.1 | Providing positive economic conditions |
The Queensland Government’s swift and decisive actions to protect the health of Queenslanders has helped ensure Queensland businesses have enjoyed a strong recovery following the short lockdown period. By March quarter 2021, the Queensland domestic economy was 3 per cent larger than before the COVID-19 outbreak. This can be contrasted with conditions for business in countries where the virus has not been contained, with resulting sharp falls in economic activity and ongoing hardship for business and workers.
The government has also provided substantial support to business as part of its response to COVID-19, including substantial tax relief measures and a $500 million utility relief package, involving $500 rebates for electricity and water utilities for sole traders and small-to-medium businesses, to support the cashflows and viability of Queensland businesses during a critical and difficult period.
Energy and other key utilities are key input costs for many businesses, particularly those in some of Queensland’s more trade-exposed industries such as manufacturing.
Importantly, over the past 4 years energy prices in Queensland have fallen substantially, driven by the expected continued entry of a large amount of renewable generation into Queensland and other National Energy Market regions, and the continuation of lower domestic gas prices. This is directly leading to lower electricity bills for businesses and households, as outlined in Box 1.5.
| Box 1.5 | Lower electricity prices for Queensland |
After several years of significant price increases, the Queensland Government reformed the electricity sector to provide reliable energy and push prices down.
Structural changes and efficiencies in the network and generation sector, including the establishment of a new low-emissions generator, CleanCo, and a commitment to invest in new, clean energy generation, has led to decreasing costs and a diverse and robust electricity supply.
The plan has worked. In 2021–22, retail electricity prices are set to fall for Queensland households and businesses for the fourth consecutive year. The average regional household is set to see their biggest cut in more than a decade.
34
Budget Strategy and Outlook 2021-22
Based on the Queensland Competition Authority’s (QCA’s) Final 2021–22 Determination for regional electricity prices, the typical regional household can expect to see a 7.3 per cent electricity bill reduction.
Over the period from 2017–18 to 2021–22, the QCA’s regulated prices, which apply in regional Queensland, have fallen by over 17 per cent. This represents a retail bill reduction over this period of around $270 for regional Queensland households.
Regional businesses will also benefit in 2021–22, with the typical small business to see a 3.7 per cent reduction, and large business customers to benefit from reductions of between 2.5 per cent and 3.7 per cent. For small business, the reduction in 2021–22 will deliver the lowest electricity bills since 2012–13.
In South East Queensland, the Default Market Offer set by the Australian Energy Regulator (AER) determines the maximum electricity prices which may be charged to households and small businesses. For 2021–22, the AER determined bill reductions of around 3.5 per cent for households, and around 4.2 per cent for small businesses. Customers can also access even lower prices by shopping around between retailers.
In addition, because of the decision to retain ownership of our electricity assets, the government has been able to implement measures to support lower energy prices and greater energy affordability:
| • | | utility bill relief has been provided to households and businesses through the $500 million COVID-19 utility relief package in 2019–20 and the $100 million Asset Ownership Dividend in 2020–21. Over this period, more than 2 million Queensland households have received $250 to help with their utilities, with farmers and small to medium businesses receiving $500. A further $100 million relief package will be provided to households through another $50 Asset Ownership Dividend payment in 2021–22 |
| • | | under the Uniform Tariff Policy, the government provides around $500 million per annum to offset energy costs and ensure electricity prices in regional Queensland are comparable to prices in South East Queensland. Reducing the cost of living for people in regional areas is a critical element of the government’s economic plan |
| • | | the Electricity Rebate Scheme also provides a rebate of up to approximately $341 per annum, at a cost of $228.5 million in 2021–22, to assist with the cost of domestic electricity supply to the home of eligible Pensioner Concession Card, Health Care Card, Queensland Seniors Card and Department of Veterans’ Affairs Gold Card holders. |
The 2021–22 Budget continues the government’s strong energy investment, with over $2.2 billion in energy generation, transmission and distribution capital purchases to occur in 2021–22, including the Queensland Government’s $250 million investment in the 103 MW Karara Wind Farm in the Darling Downs, which CleanCo will build, own and operate.
Further, $29.4 million has been allocated over 4 years for the Electricity Tariff Adjustment
Scheme to provide support for regional business electricity connections due to the phasing-out of obsolete electricity tariffs. This initiative provides eligible customers with individually tailored transitional rebates to help offset the removal of obsolete tariffs and incentivise a pathway to self-sufficiency over time.
35
Budget Strategy and Outlook 2021-22
| 1.5.2 | Supporting small business |
The success and viability of Queensland’s small businesses is central to the overall prosperity of the state and its residents. Small businesses are also critical from an economic recovery perspective. Given they account for around 42 per cent of the private sector workforce in Queensland, a significant proportion of employment growth comes from small businesses who grow and expand.
The Queensland Government’s response to the COVID-19 pandemic recognised this fact, providing substantial support targeted at small businesses, including $196 million in Small Business COVID-19 Adaption Grants, $1 billion in concessional jobs support loans and substantial tax relief.
Small business can also play a key role in the generation and diffusion of innovation across the economy, which is another critical factor in Queensland’s ongoing economic recovery. For instance, the Organisation for Economic Co-operation and Development has noted that the contribution of small business to innovation is increasing as a result of new technologies making it easier to overcome barriers to entry and access larger markets.1
The $140 million Big Plans for Small Business commitment, which includes the $100 million Business Investment Fund, has a strong focus on helping small business to innovate, grow and access new markets, including by investing in skills and capability and by making it easier to do small business in Queensland.
The government is also providing support to Queensland’s live music industry with a new investment of $7 million in 2021–22 supporting the sustainability of the state’s live music venues.
Queensland is also continuing to implement the 7 key reforms under the Small Business Regulatory Reform Agreement with the Australian Government. This includes a range of innovative reforms developed and implemented by the Queensland Government including: reforms targeting small business renewal and start-ups; improving information available to businesses on vocational education requirements; and streamlining requirements and permits related to food safety, transport and agricultural activities.
The flagship initiative under this program, the Business Launchpad, will reduce the amount of paperwork and approvals that start-up and expanding small businesses are required to obtain from all 3 levels of government. The recently-implemented first phase of this program directly assists food, beverage and residential construction businesses in Logan and Townsville to meet their regulatory and compliance obligations, and it is estimated it will deliver over $50 million in benefits to participating businesses through time savings and productivity benefits over a 10-year period.
| 1 | OECD, 2010, SMEs, Entrepreneurship and Innovation. |
36
Budget Strategy and Outlook 2021-22
The government is committed to driving regulatory reform to reduce red tape and minimise the regulatory burden on Queensland businesses, families and communities.
Since first forming government in 2015, the Palaszczuk Government has delivered productivity-enhancing reforms and red tape reduction across a range of areas, including reducing trading hours restrictions, facilitating development and regulation of the personalised transport sector, providing for the development of the craft-brewing industry, improving sustainability of fisheries, and reducing red tape for body corporates.
Further, a key element of the government’s economic response to the pandemic is making it easier for businesses to recover, invest and employ Queenslanders by reducing compliance costs. For example, the Queensland Government recently introduced a suite of temporary reforms providing for electronic signing and witnessing of legal documents such as statutory declarations and deeds. A range of other innovative reforms have also been implemented to reduce costs for business, including reforms related to e-conveyancing, simplifying management of taxation obligations and digitising and streamlining identification procedures, procurement processes and park permit application processes.
Many of these reforms provide innovative digital solutions to previously paper-based processes, delivering more efficient sharing of information and clearer communication. These measures have reduced red tape and provided substantial time savings for businesses.
The government is committed to developing e-invoicing capability across Queensland Government departments. The digital exchange of invoices between suppliers and buyers provides economic benefits to businesses through improved accuracy, enhanced supplier payment times and reduced processing costs. Progressing this important digital reform across government is expected to drive faster uptake of e-invoicing technology across businesses and supply chains, supporting further economic growth through e-commerce.
The government is also implementing a new licence model for racing industry participants and enhanced telecommunications approval processes for bookmakers, which will reduce red tape for industry and promote better regulatory outcomes.
Another key regulatory reform to be implemented during the year includes the introduction of a fee unit model to streamline the annual process of indexing regulatory fees. Government indexation seeks to maintain the value of a fee over time. Currently, annual indexation requires agencies to amend hundreds of pages of regulation each year to reflect the new dollar value of their fees. This process is resource intensive, taking up to 3 months for some agencies to implement these changes.
Removing these administrative inefficiencies will realise productivity gains across government, as staffing effort can be redirected to focus on service delivery and higher value priorities.
The new Office of Productivity and Red Tape Reduction, which commenced on 2 June 2021, will help develop innovative policy solutions to boost productivity and regulatory reform as part of the government’s economic recovery policies.
37
Budget Strategy and Outlook 2021-22
The government’s ongoing regulatory reform agenda will enable the government to identify opportunities to ensure regulation is fit-for-purpose, and also ensure new and existing regulation is well-targeted, effective and flexible.
| 1.6 | Responsive public sector |
As Queensland continues to manage the health, social and economic impacts of the COVID-19 pandemic, it is critical the government remains responsive and innovative in delivering essential services to ensure the best possible outcomes for Queensland.
| 1.6.1 | Delivering essential services |
As highlighted by the success of the response to COVID-19, providing essential services that are flexible and responsive is important to protect Queenslanders and help communities remain resilient. This includes ensuring that our frontline services have the resources they require for effective service delivery.
The Queensland Government is committed to delivering world class frontline services that Queenslanders deserve. Our health, education, law and order, and social services investments are helping Queenslanders improve their living standards and attract thousands of people from all parts of Australia and overseas.
The Queensland Government continues to invest in boosting housing supply and increasing housing and homelessness support across Queensland, with additional funding of $314.9 million over 4 years supporting the $1.908 billion Housing and Homelessness Action Plan 2021–25. This includes $1.813 billion over 4 years to increase supply and upgrade the existing social housing property portfolio, including $502.6 million in capital works and capital grants in 2021–22.
To support this, the Queensland Government has established the $1 billion Housing Investment Fund, a long-term fund with returns used to drive new supply to support current and future housing needs across the state.
Over $317 million has been allocated in 2021–22 to improve housing outcomes for Aboriginal and Torres Strait Islander peoples in Queensland, including $212.4 million to improve social rental housing and deliver services in discrete communities, and $45.3 million to improve state-owned and managed Indigenous housing across Queensland.
The 2021–22 Budget provides $18.3 billion for education and training in 2021–22.
To ensure Queensland’s schools can keep up with the increasing enrolment growth and ensure all children have access to quality school facilities, the 2021–22 Budget provides funding to support construction of new schools and growth projects in existing schools. This includes increased funding of $913.7 million over 7 years for the Building Future Schools Program and $508.3 million over 4 years for additional and renewed infrastructure in existing state schools, and to address emerging issues relating to asbestos.
38
Budget Strategy and Outlook 2021-22
The government is also committed to ensuring a quality education for children of all ages, which is reflected in the investment of an additional $202.9 million over 4 years and $64 million per year ongoing to support the continued provision of universal access to kindergarten in the year before school. This will ensure all children are able to participate in a high-quality kindergarten program and prepare them for school.
The government is committed to protecting communities and keeping Queenslanders safe through the $2.7 billion provided in 2021–22 for policing. The government will continue to provide an additional 2,025 police personnel by 2025, which is the biggest increase in police resourcing in almost 30 years. The 2021–2022 Budget also includes $156.1 million to fund the police capital program, including facilities, motor vehicles, vessels and other essential equipment, to support quality frontline police services.
To build resilience in response to natural disasters, the budget provides funding for drought preparedness, response to the bushfires on Fraser Island (K’Gari) and mitigation measures to put downward pressure on insurance. It also provides $10.8 million over 4 years and $1.3 million per annum ongoing to implement priority actions in response to the Royal Commission into National Natural Disaster Arrangements to help keep Queenslanders safe when natural disasters strike.
| 1.6.2 | Innovative service delivery |
Queensland Government agencies continue to identify opportunities to improve the effectiveness and efficiency of government service delivery to support productivity improvements and growth. Reforming and improving the delivery of these services will reduce costs for businesses and consumers and streamline business and community interactions with government.
The Queensland Government continues to invest in innovative reforms, including identifying and working to implement regulatory technology priority reforms across several key agencies. Reforms currently underway include: a Digital Food Safety Hub, providing food businesses with a streamlined online hub for legislative, licensing and training requirements; a Biosecurity Entity Online Customer Portal, allowing businesses keeping livestock or bees to renew their registration online; and further streamlining and modernisation of the state’s fines administration system.
Innovation in service delivery, such as in health technology, can also support improvements in accessibility. For example, Queensland’s telehealth program enables patients to receive quality care closer to home via telecommunication technology, and expands access to specialist healthcare for people in regional communities by reducing the need to travel for specialist advice.
Telehealth consultations increased by 160 per cent in the first 3 months of the COVID-19 pandemic, enabled by efforts from Queensland Health to increase system capacity. This reduced the number of patients who needed to present at hospitals, freeing up hospitals and health clinics, and reducing potential exposure for at-risk patients with pre-existing conditions.
A further example of innovative health service delivery is the Queensland Government’s Sunshine Coast GPwSI program, a model of care that integrates GPs with additional skills and expertise into specialist-led clinical teams in hospital outpatient units. The program led to improvement in the share of people seen within recommended wait times, as well as having positive effects on access, efficiency, and clinician and consumer satisfaction.
39
Budget Strategy and Outlook 2021-22
The productivity benefits of these innovative approaches to service delivery extend beyond the health sector. As such, ongoing improvements and innovative approaches to facilitate the delivery of key government services and functions has the potential to deliver much broader economic and social benefits for all Queenslanders.
Further innovative service delivery investments have also been announced in the 2021–22 Budget. This includes $11 million to enhance cyber security across the Queensland Government. The 2021–22 Budget also provides funding to continue the Crime Statistics and Research Unit, ensuring up-to-date, targeted crime data can be utilised to develop informed policy responses.
40
Budget Strategy and Outlook 2021-22
| 2 | Economic performance and outlook |
Features
| • | | The severe health and economic shock caused by the COVID-19 pandemic saw the global economy contract by 3.3 per cent in 2020, a much greater impact than the 0.1 per cent decline in global activity recorded in 2009 in the depths of the Global Financial Crisis. |
| • | | The national economy fell into recession in 2020, for the first time since 1991. However, Queensland and Australia’s relative success in containing the spread of COVID-19, in addition to significant fiscal and monetary policy support, meant the economic impacts nationally were less severe than in many other countries. |
| • | | Reflecting the success of Queensland’s health response, the domestic economy has rebounded strongly, with business and consumer confidence currently at elevated levels. |
| • | | Following a 7 per cent rebound in September quarter 2020, Queensland’s domestic activity continued to grow across the December and March quarters, to be 3 per cent above the pre-COVID-19 level of March quarter 2020. This was almost double the 1.7 per cent growth in the rest of Australia over the year, and substantially higher than the 1.9 per cent in New South Wales. Domestic activity in Victoria in March quarter 2021 was still 0.3 per cent below its pre-COVID-19 level. |
| • | | Growth in the Queensland economy has been driven by elevated consumer spending and housing sector activity, supported by timely and targeted government stimulus. |
| • | | Reflecting the improved domestic conditions, Gross State Product (GSP) is forecast to rebound by 31⁄4 per cent in 2020–21, significantly higher than the 1⁄4 per cent growth expected at the time of the 2020–21 Queensland Budget. Robust growth of 23⁄4 per cent is forecast for 2021–22 and in each subsequent year across the forward estimates. |
| • | | In comparison, the national economy is forecast by Australian Treasury to grow 11⁄4 per cent in 2020–21, 41⁄4 per cent in 2021–22 and 21⁄2 per cent in 2022–23. Queensland’s faster recovery means aggregate growth across the 3 forecast years will be higher in Queensland (around 9 per cent) than nationally (around 81⁄4 per cent). |
| • | | Queensland’s labour market has also improved substantially, with employment in April 2021 having rebounded by 253,200 persons since May 2020, to be 54,900 persons above the pre-pandemic level in March 2020. In comparison, employment in the rest of Australia in April 2021 was still 9,000 persons below the level in March 2020. |
| • | | Reflecting the current strength in jobs growth and the broader economic recovery, year-average employment growth in 2020–21 is now forecast to be 21⁄4 per cent, much higher than the 1 per cent forecast in the 2020–21 Budget. |
| • | | This robust jobs growth means the state’s unemployment rate is now forecast to be 61⁄4 per cent in June quarter 2021, while the year-average unemployment rate in 2020–21 is now expected to be 7 per cent, lower than the 71⁄2 per cent forecast at the previous Budget. |
| • | | Strong employment growth of 3 per cent in 2021–22 is expected to drive down the unemployment rate to 53⁄4 per cent in June quarter 2022, with the unemployment rate steadily improving across the forecast period to be 5 per cent by June quarter 2025. |
41
Budget Strategy and Outlook 2021-22
| 2.1 | International conditions |
Global economic output fell sharply in the first half of 2020 due to the public health restrictions and lower confidence in response to COVID-19. According to the International Monetary Fund (IMF), the global economy contracted by 3.3 per cent in 2020, a much greater shock than the 0.1 per cent decline recorded in 2009 in the depths of the Global Financial Crisis.
Over three and a half million people have died from the virus globally, and daily cases and deaths remain elevated in many countries.
Despite this ongoing health crisis, the global economic recovery has clearly begun, with an acceleration in various countries’ vaccine rollouts supporting a lift in sentiment and activity. The IMF’s latest forecasts show the global economy is expected to rebound strongly in the near-term, growing by 6 per cent in 2021 and 4.4 per cent in 2022.
Aggregate Gross Domestic Product (GDP) growth of Queensland’s major trading partners is expected to be slightly stronger than the global average, rising 6.5 per cent in 2021 and 4.7 per cent in 2022. This primarily reflects China and India both being expected to record rapid economic growth across 2021 and 2022.
The economic recovery is most advanced in China, where GDP has already exceeded its pre-COVID-19 level following the successful containment of the virus and ongoing and significant government stimulus. After growing by 2.3 per cent in 2020, the IMF forecasts that China’s economy will grow by a further 8.4 per cent in 2021 and 5.6 per cent in 2022.
The outlook in the United States also appears more positive than expected during the height of the pandemic. While employment has yet to return to its pre-pandemic level, steps have been taken towards fully reopening the economy, with daily COVID-19 cases remaining well below peak levels and the nation-wide vaccine rollout continuing to progress.
The IMF expects the United States to record exceptionally strong economic growth of 6.4 per cent in 2021 and 3.5 per cent in 2022, underpinned by the Biden Administration’s US$1.9 trillion stimulus bill passed in March 2021. This is in addition to the substantial fiscal support during the pandemic and ongoing highly accommodative monetary policy settings.
Surges in case numbers have partially stalled the economic recovery across Europe, with many countries reimposing social distancing measures in late-2020 and early-2021. However, various government fiscal support measures in many countries, including wage subsidies, and highly accommodative monetary policy settings have helped support Europe’s major economies throughout the pandemic.
More recently, India has endured a severe further wave of COVID-19, with cases peaking at more than 400,000 per day in early-May. As India accounts for more than 10 per cent of the value of Queensland’s overseas merchandise exports, the humanitarian crisis is also likely to have an economic impact on the state’s economy.
42
Budget Strategy and Outlook 2021-22
Despite the more positive global economic outlook in recent months, substantial risks remain, centred around the success of the global vaccine rollout and the efficacy of the vaccines, particularly as new variants of the virus continue to emerge. While vaccine rollouts are well progressed across a range of nations, including Israel, Canada, the United Kingdom, the United States and Chile, the proportion of the population to have received at least one vaccine shot is still below 10 per cent in many countries.
In addition to the ongoing health risks associated with the COVID-19 pandemic, geopolitical and trade tensions that existed between various countries before the onset of the pandemic remain a key risk to the global economic outlook. In particular, tensions between the United States and China related to trade, intellectual property and cybersecurity are expected to continue.
Ongoing uncertainty also remains around the longevity of China’s trade restrictions on a range of Australian goods, including some of Queensland’s key commodity exports, particularly coal.
The Australian economy declined by 2.5 per cent in 2020, the first national recession since 1991. Despite this sharp contraction, Australia’s relative success in containing the spread of COVID-19, in addition to significant fiscal and monetary policy support, meant the economic impacts were less severe than in many other countries. In comparison, as highlighted in Chart 2.1, GDP in 2020 fell by 9.9 per cent in the United Kingdom, 8 per cent in India, 6.6 per cent across the Euro area, 5.4 per cent in Canada and 3.5 per cent in the United States.
| Chart 2.1 | GDP/GSP growth in 20201 |
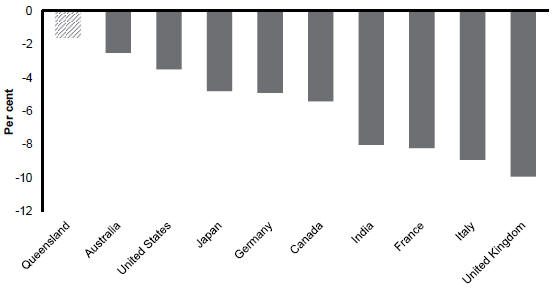
Note:
| 1. | Chain volume measure, annual per cent change. |
Sources: Queensland Treasury and International Monetary Fund.
43
Budget Strategy and Outlook 2021-22
The national economic recovery is well underway and stronger than initially anticipated. The economy has rebounded, with real GDP in March quarter 2021 1.1 per cent above the pre-COVID-19 level of a year earlier, according to the National Accounts. The national unemployment rate fell to 5.5 per cent in April 2021, down from a high of 7.4 per cent in July 2020, while various business and consumer surveys indicate confidence and conditions are at elevated levels.
Buoyed by the substantial fiscal and monetary stimulus provided in response to the crisis, housing market activity has increased, supporting confidence and household consumption.
Despite the stronger-than-anticipated performance of many economic indicators, the recovery to date has been somewhat uneven across the country. The pace of recovery has differed across jurisdictions, in particular with Victoria’s recovery delayed by its extended lockdown period, while those sectors reliant on international travel, such as tourism and education, are not expected to return to pre-COVID-19 levels of activity until after the vaccination rollout is substantially progressed and international borders are reopened.
In the medium to longer-term, recently-reported plans by China to diversify its production and supply chains for key industrial commodities, including iron ore, could represent future risks for Australian resources production and exports. If these risks were to eventuate, it could also have longer term implications for government revenues, including the distribution of GST.
Key assumptions underpinning the forecasts for the Queensland economy include:
| • | | Queensland and Australia will continue to be successful in containing any community outbreaks of COVID-19 to the extent that no prolonged or widespread lockdowns or severe social distancing measures are assumed over the forecasting period |
| • | | consistent with the 2021–22 Federal Budget assumptions: |
| | • | | the interstate border is assumed to remain mostly open across the forecasting period |
| | • | | while more travel bubbles are gradually established from 2022 onwards, the international border is assumed to remain closed to most travellers through to mid-2022. |
| • | | the Reserve Bank of Australia (RBA) is assumed to keep the target cash rate at 0.1 per cent until mid-2023 and the pace of monetary policy normalisation will be gradual over the remainder of the forecast period |
| • | | the A$ is assumed to stabilise at around US$0.75 in the medium term |
| • | | Brent oil prices are expected to fall slightly below US$60/barrel in the short term but are assumed to be anchored at around US$60/barrel from 2023–24 onwards |
| • | | China’s restrictions on Queensland’s coal exports are assumed to remain significant in 2021. Although some relaxation is assumed in 2022, impacts are assumed to persist across the forward estimates. |
| • | | according to the Bureau of Meteorology, the 2021 winter is likely to be wetter than average but there is no clear indication of an El Niño or La Niña developing, at least in the next few months. Therefore, an average seasonal rainfall is assumed for the 2021 and 2022 seasons. |
44
Budget Strategy and Outlook 2021-22
| Box 2.1 | Vaccination roll-out |
The Australian Government is responsible for acquiring and delivering the COVID-19 vaccine to Australians. Queensland is working collaboratively with the Australian Government to roll out the COVID-19 vaccination program across Queensland.
On 22 February 2021, the first Queenslanders began receiving the Pfizer vaccine under Phase 1a of the Australian COVID-19 Vaccination Strategy. Considering all sources of vaccination delivery, as at 5 June 2021, the Australian Government-led vaccination program in Queensland has resulted in 17.94 vaccine doses per 100 people have been delivered, less than the national level of 19.52 vaccines per 100.
To assist the Australian Government to improve vaccine delivery to Queenslanders, the Queensland Government is stepping up its jurisdictional delivery channels.
The Commonwealth Government is responsible for vaccinating residents and staff in residential aged care facilities. While the Commonwealth deployed in-reach vaccination clinics to residential aged care facilities across Queensland, these focussed on residents. Staff were only able to obtain vaccinations if there were excess doses not required by residents, which led to a significant gap in coverage.
Queensland Health therefore stepped up to help ensure the safety of staff and residents by offering the Pfizer COVID-19 vaccine to all Phase 1a and 1b frontline workers in Queensland, including residential aged care workers, regardless of age.
To administer the Pfizer vaccine, Queensland Health established hospital hubs in 6 locations, selected based on their proximity to international arrival points into Queensland. AstraZeneca hospital hubs and outreach services have been subsequently established in every Queensland Hospital and Health Service (HHS). More than 100 services were operating across the state by early-April 2021. This has enabled access to vaccines for Queenslanders in remote, rural, regional and metropolitan areas.
On 8 April 2021, the Australian Technical Advisory Group on Immunisation (ATAGI) and the Therapeutic Goods Administration (TGA) issued advice recommending Pfizer as the preferred COVID-19 vaccine for adults aged under 50 years. This followed reports of a rare but serious blood clotting disorder following administration of the AstraZeneca vaccine. National Cabinet has made a series of decisions since 22 April 2021 to recalibrate the delivery model to administer COVID-19 vaccinations to Australians. The key changes were:
| • | | Pfizer vaccine will be initially limited to Phase 1a and 1b eligible people under the age of 50 years and subsequently provided to additional cohorts with 40-49 year olds now able to access the vaccine |
| • | | part of Phase 2a was brought forward so that individuals 50 years or over could access the AstraZeneca vaccine at Queensland Health vaccination clinics from 3 May 2021 and at general practices from 17 May 2021 |
| • | | increasing access to the Pfizer vaccine for eligible individuals where demand exists and supply permits |
| • | | primary care continuing to be the primary delivery channel. |
45
Budget Strategy and Outlook 2021-22
Queensland Health immediately took action to open additional Pfizer hospital hubs throughout Queensland. The first additional site to open was Mater South Brisbane on 5 May 2021. As of 8 June 2021, Queensland Health has a total of 33 hospital-based Pfizer Hubs and Sub-Hubs providing access to Pfizer across metropolitan, regional and remote communities.
In addition, 14 Community Based Vaccination Locations are being progressively opened across the state. Planning for mass vaccination sites is underway to establish readiness to operate where demand exists and when the supply of Pfizer vaccine increases to a level that makes mass vaccination possible.
Funding arrangements with the Australian Government are still being finalised but it is expected the Australian Government will reimburse only a portion of the costs incurred by jurisdictions to set up additional COVID-19 clinics where necessary to support the recalibrated delivery model. This is in addition to a contribution per vaccination dose delivered by the states and territories.
Queensland’s vaccine roll-out will continue to track the Australian Government vaccine supply.
| 2.4 | Queensland conditions and outlook |
When the 2020–21 Budget was delivered in December 2020, the Queensland economy was forecast to grow by 1⁄4 per cent in 2020–21 and 31⁄2 per cent in 2021–22. Since that time, the domestic economy has grown faster than forecast, bolstered by a range of factors, including a surge in dwelling activity and investment.
As restrictions were unwound, State Final Demand (SFD) grew by 7 per cent in the September quarter, and by 2.3 per cent across the December and March quarters, to be 3 per cent above the pre-COVID-19 level of March quarter 2020.
Annual growth in Queensland’s domestic economy was almost double the 1.7 per cent growth recorded in the rest of Australia’s domestic economy and faster than the rise of only 1.9 per cent in New South Wales. Domestic activity in Victoria in the March quarter 2021 was still 0.3 per cent below its pre-COVID-19 level.
Despite the improved outlook in SFD, the trade sector faces ongoing uncertainty about the timing and extent of the global recovery and about the status of trade with China. International travel restrictions are expected to continue to impact Queensland’s international tourism exports and limit overseas student arrivals in 2021.
Overall, growth in domestic activity is expected to more than offset the decline in the trade sector and Queensland’s GSP, after falling by 0.7 per cent in 2019–20, is forecast to rebound to growth of 31⁄4 per cent in 2020–21.
Further solid growth of 23⁄4 per cent is forecast for 2021–22, as the dwelling construction boom maintains momentum and business investment rebounds after several years at subdued levels.
46
Budget Strategy and Outlook 2021-22
In comparison, the national economy is forecast by Australian Treasury to grow by 11⁄4 per cent in 2020–21, 41⁄4 per cent in 2021–22 and 21⁄2 per cent in 2022–23. Importantly, Queensland’s faster recovery means that aggregate growth across the 3 forecast years will be stronger in Queensland (around 9 per cent) than for the nation as a whole (around 81⁄4 per cent).
Over the remainder of the forward estimates, Queensland’s GSP growth is expected to average 23⁄4 per cent per annum, driven by the strength of the domestic economy and further improvements in exports.
Consistent with the strong rebound in domestic activity, employment in Queensland has also recovered strongly and fared better than the rest of Australia. By late 2020, total employment in Queensland had already exceeded the pre-pandemic level of March 2020, while the state’s monthly unemployment rate has fallen substantially from its COVID-19 induced peak of 8.7 per cent in July 2020, to be around pre-pandemic rates by April 2021.
In year-average terms, employment is now forecast to grow by 21⁄4 per cent in 2020–21 and 3 per cent in 2021–22. In quarterly seasonally adjusted terms, employment is forecast to rise by 83⁄4 per cent (around 212,400 persons) through the year to June quarter 2021.
The unemployment rate is expected to have peaked (in quarterly terms) at 7.7 per cent in September quarter 2020 and is forecast to decline to 61⁄4 per cent in June quarter 2021. The unemployment rate is expected to continue to improve steadily over the forecast period to be 5 per cent by June quarter 2025.
| Table 2.1 | Queensland economic forecasts/projections1 |
| | | | | | | | | | | | | | | | | | | | | | | | |
| | | Actuals | | | Forecasts | | | Projections | |
| | | 2019–20 | | | 2020–21 | | | 2021–22 | | | 2022–23 | | | 2023–24 | | | 2024–25 | |
Gross state product2 | | | -0.7 | | | | 31⁄4 | | | | 23⁄4 | | | | 23⁄4 | | | | 23⁄4 | | | | 23⁄4 | |
Nominal gross state product | | | -1.5 | | | | 21⁄4 | | | | 63⁄4 | | | | 51⁄4 | | | | 5 | | | | 43⁄4 | |
Employment3,4 | | | 0.6 | | | | 21⁄4 | | | | 3 | | | | 13⁄4 | | | | 13⁄4 | | | | 13⁄4 | |
Unemployment rate5,6 | | | 7.6 | | | | 61⁄4 | | | | 53⁄4 | | | | 51⁄2 | | | | 51⁄4 | | | | 5 | |
Inflation3 | | | 1.2 | | | | 2 | | | | 13⁄4 | | | | 13⁄4 | | | | 2 | | | | 21⁄4 | |
Wage Price Index3 | | | 1.9 | | | | 13⁄4 | | | | 21⁄4 | | | | 21⁄4 | | | | 21⁄2 | | | | 23⁄4 | |
Population3 | | | 1.7 | | | | 1 | | | | 1 | | | | 11⁄4 | | | | 11⁄2 | | | | 11⁄2 | |
Notes:
| 1. | Unless otherwise stated, all figures are annual percentage changes. |
| 2. | Chain volume measure (CVM), 2018–19 reference year. |
| 3. | Annual percentage change, year-average. |
| 4. | The comparable through the year employment growth rates to the June quarter (seasonally adjusted) are -4.5 per cent, 83⁄4 per cent, 13⁄4 per cent, 13⁄4 per cent, 13⁄4 per cent and 13⁄4 per cent, from June quarter 2020 to June quarter 2025 respectively. |
| 5. | Per cent, June quarter average, seasonally adjusted. |
| 6. | The comparable year-average unemployment rates are 6.4 per cent, 7 per cent, 53⁄4 per cent, 51⁄2 per cent, 51⁄4 per cent and 5 per cent, from 2019–20 to 2024–25, respectively. |
Sources: ABS National, State and Territory Population, Labour Force, Wage Price Index, Consumer Price Index and Queensland Treasury.
47
Budget Strategy and Outlook 2021-22
| 2.4.1 | Household consumption |
Household consumption fell by 10.2 per cent over the first half of 2020, before recovering more strongly than expected in the latter half of the year.
As COVID-19 restrictions were progressively unwound, a swift recovery in labour income, underpinned by significant government income support measures, saw Queensland’s consumer spending increase by 14.5 per cent across the September and December quarters, to end the year 3.6 per cent above the pre-pandemic level (Chart 2.2).
Greater Brisbane’s brief COVID-19 lockdowns in early-2021, as part of the emergency health response to locally acquired cases, had only marginal impacts on Queensland household spending levels. Consumption fell by 0.3 per cent in the first quarter of 2021, but it remained 3.3 per cent above the pre-COVID-19 level of March quarter 2020.
Consumer spending patterns have continued to adjust over the past few quarters and the composition of consumption expenditure is expected to normalise in the remainder of 2021 as uncertainty related to health and economic outcomes diminish. Expenditure in some categories, such as household goods, will continue to benefit from the substitution of expenditure away from overseas travel.
On balance, and reflecting the better than expected rebound in the second half of 2020 from the substantially reduced spending levels in June quarter 2020, in year-average terms household consumption is now forecast to grow by 51⁄4 per cent in 2020–21.
Looking further ahead, with the Australian Government’s withdrawal of national income support programs and the rollout of COVID-19 vaccination programs taking effect, growth in household consumption is forecast to return to its pre-COVID-19 trajectory from 2021–22 onwards. The substantial strengthening in the dwelling construction sector and sustained growth in labour income are expected to support consumer spending growth of 3 per cent in 2021–22 before growth eases slightly to 21⁄2 per cent in 2022–23.
48
Budget Strategy and Outlook 2021-22
| Chart 2.2 | Labour income1 and household consumption2, Queensland |
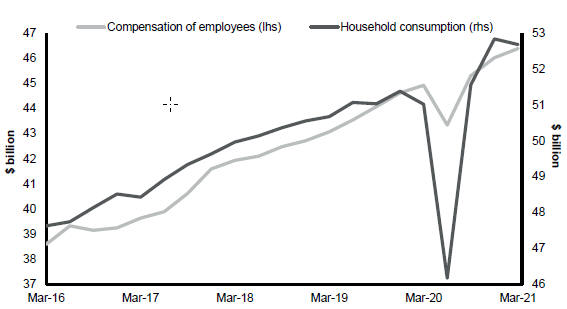
Notes:
| 1. | Nominal, quarterly, seasonally adjusted. |
| 2. | Chain volume measure, quarterly, seasonally adjusted. |
Source: ABS National Accounts, State Details.
Dwelling investment has rebounded strongly since the pandemic-induced low in June quarter 2020. After rising by 13.7 per cent over the last 2 quarters of 2020, dwelling investment in Queensland rose by a further 10.8 per cent in March quarter 2021, to be 18.4 per cent higher over the year.
The construction of new and used dwellings rose by 8.1 per cent in March quarter 2021, to be 14.6 per cent higher over the year. Renovation activity also continued to grow strongly, rising by 13.6 per cent in the March quarter, to be 22.5 per cent higher over the year, reaching its highest level on record. The combination of record low interest rates, clear indications by the RBA that rates will remain low for several years and generous government incentives continue to boost the outlook for dwelling investment, particularly for detached houses.
Measures such as the Queensland Government’s reaffirmed commitment to the $15,000 First Home Owners Grant program, and the $5,000 Regional Home Building Boost Grant, along with the Australian Government’s First Home Loan Deposit Scheme and HomeBuilder Grant, have underpinned strong growth in residential construction and continue to support the outlook.
On 17 April 2021, the Australian Government extended the construction commencement requirement for HomeBuilder applications from 6 to 18 months from the signing of the contract.
49
Budget Strategy and Outlook 2021-22
Given the large amount of residential construction work now in the pipeline, this is expected to see new dwelling construction activity in Queensland maintained at a high level into 2022–23.
Leading indicators for the housing market have surged beyond their pre-COVID-19 levels, pointing to continued strength in dwelling investment in the coming quarters. The number of dwelling approvals in Queensland has risen strongly over the year (Chart 2.3), with approvals for detached houses and attached dwellings both higher. Encouragingly, the strength in approvals has been distributed broadly across most of the state’s regions, supporting activity and jobs.
Loan commitments for both owner-occupiers and investors have also grown rapidly over the year, rising well above their pre-pandemic levels. In early-2021, the value of commitments for owner-occupiers reached their highest level since the inception of the series in July 2002. Further, this surge has been distributed across both first-home and non-first-home buyers.
As a result, the outlook for dwelling investment has improved considerably since the 2020–21 Budget, with dwelling investment now forecast to grow strongly in 2020–21 and 2021–22, before moderating slightly in 2022–23.
| Chart 2.3 | Queensland dwelling approvals and loan commitments to households1 |
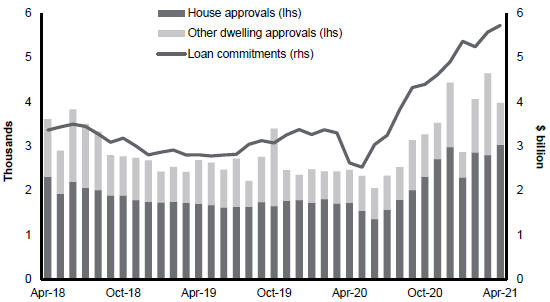
Note:
| 1. | Monthly, seasonally adjusted. |
Sources: ABS Building Approvals and ABS Lending Indicators.
With the onset of the pandemic, business confidence fell sharply in March and April 2020 to levels last seen during the early 1990s recession. Spending on non-dwelling construction and machinery and equipment fell by 8.6 per cent in June quarter 2020.
50
Budget Strategy and Outlook 2021-22
The subsequent success in controlling the spread of COVID-19 in Queensland and the easing of many social distancing restrictions have resulted in a strong rebound in business confidence and conditions, with firms now reporting the best business conditions for some years (Chart 2.4).
Consistent with the improvement in business conditions, the NAB Monthly Business Survey points to a likely upward revision to capital spending nationally. Capacity utilisation has also recovered to be above its long-run average. Together with a sustained period of low interest rates, a tighter labour market and tax incentives for business, this should encourage capacity-expanding investment in machinery and equipment.
Private engineering construction, which typically involves long-term projects, has held up well during the pandemic. Over the year to December quarter 2020, the value of work commenced fell only 2.5 per cent while the value of work yet to be done also fell only modestly. The global economic recovery and improving commodity prices should support some recovery in this area.
Non-residential building investment faces stronger headwinds than machinery and equipment investment and engineering construction. Forward indicators remain subdued with private non-residential building approvals continuing to trend downward. Key challenges include the impact of international border closures on hotels and low office occupancy rates.
Overall, business investment is expected to grow by 4 per cent in 2021–22 after 3 consecutive years of decline. Investment in machinery and equipment is expected to recover at a stronger pace than non-dwelling investment, which is expected to be constrained by some ongoing weakness in non-residential building investment.
| Chart 2.4 | Business Conditions1, Queensland |
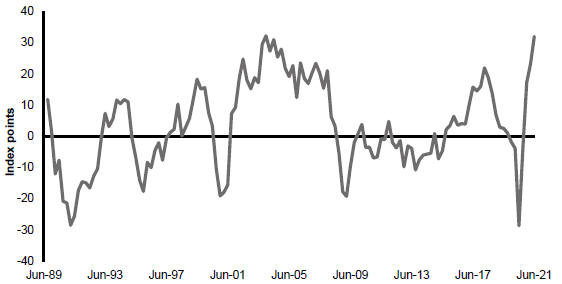
Note:
| 1. | Quarterly, seasonally adjusted by Queensland Treasury. June quarter 2021 is an estimate based on monthly data. |
Source: NAB Quarterly Business Survey.
51
Budget Strategy and Outlook 2021-22
Public final demand has grown strongly in recent years, averaging 5.2 per cent growth over the 5 years to 2019–20, supported by a range of initiatives, including the National Disability Insurance Scheme, the NBN, substantial investment in roads and the Cross River Rail project.
State and local general government investment has made a significant contribution to the domestic economy since the start of the pandemic, rising 15.3 per cent over the year to March quarter 2021. This compares to a small decline in national general government investment in Queensland over the same period.
Growth in public final demand is expected to remain solid in 2020–21, driven by the ramp up in the construction of the Cross River Rail project and the continuation of spending measures implemented to combat COVID-19 and support the Queensland economy.
The Budget continues the government’s commitment, in line with the Economic Recovery Plan, to provide the ongoing support, stimulus and reform needed to drive sustainable economic growth across the state. The government’s response to COVID-19 includes $14.2 billion of initiatives, including investments in productivity-enhancing economic and social infrastructure to support the recovery and drive growth. This will continue to support an environment in which private investment can flourish and create new jobs into the future.
| 2.4.5 | Overseas exports and imports |
Queensland’s overseas exports of goods and services are expected to decline by 153⁄4 per cent in 2020–21, driven by a decline in coal exports. Exports are forecast to recover by 53⁄4 per cent in 2021–22 and 101⁄4 per cent in 2022–23.
Coal
In the first 10 months of 2020–21, Queensland’s coal exports were 17.9 million tonnes (Mt) (or 9.8 per cent) lower than in the same period of 2019–20, with thermal coal exports down by 25.1 per cent and hard coking coal exports down by 5.2 per cent. Overall, Queensland’s coal exports are expected to decline 83⁄4 per cent in 2020–21, reflecting the contraction in global demand.
China’s import ban on Australian coal has also affected Queensland’s coal exports. From October 2020 to April 2021, China imported only 2.5Mt of hard coking coal and 330,000 tonnes of thermal coal from Queensland. In comparison, in the corresponding period in 2019–20, China imported 20Mt of hard coking coal and 8.6Mt of thermal coal.
Increases in Queensland’s hard coking coal exports to India (up 6.8Mt), Japan (up 2.4Mt) and South Korea (up 1.8Mt) have been able to partially offset the loss of hard coking coal exports to China, while thermal coal exports to India (up 2.2Mt) have also increased over the same period.
The import ban has also reduced the spot price for premium Australian hard coking coal, which has averaged US$117 per tonne (/t) between mid-October 2020 and early-June 2021, compared with US$140/t during late September 2020.
52
Budget Strategy and Outlook 2021-22
In comparison, the price for hard coking coal delivered to China averaged US$192/t over the period from mid-October 2020 to early-June 2021, indicating Chinese buyers have had to pay a significant premium to source non-Australian coal over this period. Indonesian thermal coal prices have also traded at a premium relative to Australian thermal coal over this period, although to a lesser extent than for hard coking coal.
A recovery in demand for Australian coal from non-Chinese buyers in late-May/early-June 2021 saw the spot price for hard coking coal increase from US$114/t to US$168/t and the spot price for thermal coal increase from US$56.35/t to US$73.35/t. Despite the recovery in Australian spot prices, Chinese importers were still paying a significant premium to source non-Australian coal.
Looking forward, Queensland’s coal exports are forecast to recover by 13⁄4 per cent in 2021–22, driven by the continued recovery in global economic activity from the COVID-19 pandemic. Some pick up in coal exports to China is expected from 2022, but with some ongoing impacts on Queensland’s coal export volumes to China continuing to persist for a number of years.
The timing and extent of the unwinding of China’s coal import ban is still uncertain and remains a key risk to the outlook. Importantly, despite the recovery forecast in 2021–22, Queensland’s coal exports are expected to remain below 2019–20 levels. From 2021–22 to 2024–25, Queensland’s coal exports are expected to grow by around 41⁄2 per cent per annum.
LNG
The volume of Queensland’s LNG exports is estimated to grow by 41⁄4 per cent in 2020–21, as the supply of LNG from Australia has increased to meet demand driven by a cold snap in the Northern Hemisphere and to offset shortfalls arising at global LNG facilities.
The COVID-19 pandemic only modestly affected export volumes, with all 3 of Queensland’s LNG plants opting to bring forward significant maintenance during the low-price period. However, the pandemic had a significant impact on the price of Queensland’s LNG exports in 2019–20, which in turn drastically reduced the value of Queensland’s LNG exports.
The majority of Queensland’s LNG exports are sold under long-term contracts linked to global oil prices (with several months lag). The sharp fall in global oil prices from March 2020 saw Queensland’s LNG export prices fall sharply in the second half of 2020. As a result, the value of Queensland’s LNG exports is expected to fall by 381⁄2 per cent in 2020–21, to $9.6 billion.
Production cuts by global oil producers have seen oil prices recover to above US$70/barrel, which should see the price (and value) of the state’s LNG exports rebound throughout 2021. With global demand for energy still subdued, LNG export volumes are expected to fall slightly in 2021–22, before plateauing over the remainder of the forecast period.
Metals
In the absence of significant new projects, the outlook for Queensland metals export volumes is relatively stable over the forecast period, with the ramp up in new or expanded production completed during 2019–20. As expected, the impact of COVID-19 on domestic metals production was limited, while key metal prices have recovered to be above pre-pandemic levels.
53
Budget Strategy and Outlook 2021-22
Agriculture
The volume of agriculture exports is estimated to have fallen by 6.6 per cent in 2019–20, driven by dry conditions across most of the state. Despite improved growing conditions, agriculture exports are forecast to fall further in 2020–21, as a decline in beef exports more than offsets increased crop exports.
Agriculture exports are expected to return to growth in 2021–22, supported by higher cotton and crop production. However, beef production and exports are not expected to return to growth until 2022–23, further supporting agriculture exports over the medium term.
Cattle slaughter rates in Queensland have declined sharply in 2020–21, with increased rainfall over the summer (due to the brief La Niña) encouraging herd rebuilding. Increased demand for restocking has supported higher saleyard prices, which reached record levels in 2020–21.
These conditions, along with a small breeding cow inventory in early 2019–20, mean that herd expansion in Queensland is likely to be slow, constraining growth in beef production until 2021–22. Looking further out, a return towards normal seasonal conditions and a recovery in the size of the cattle herd are expected to see beef exports gradually return to growth.
The harvest outcome for the 2020 season suggests sugar export volumes are expected to decline in 2020–21. However, sugar exports are expected to return to growth in 2021–22, reflecting a higher area harvested and an elevated sugar content in crushed sugar. Given Queensland’s sugar industry is well developed, with limited opportunity for increasing land allocation in the near-term, growth is expected to remain moderate to the end of the forecast period.
Cotton production and exports fell sharply in 2019–20 due to poor seasonal conditions and impacts from the COVID-19 pandemic on cotton demand and prices. However, cotton production is expected to rebound significantly in 2020–21, as improved rainfall, water storage and higher cotton prices have encouraged farmers to increase the area planted to cotton, resulting in higher cotton exports in 2021–22.
Reflecting improved seasonal conditions, other crop exports are expected to significantly increase in 2021–22, driven by increases in the production of most crops, including grain sorghum, wheat and chickpeas.
Agriculture and food manufacturing play a key role in regional economies. As outlined in the Economic Strategy Chapter 1.4, Leveraging our Natural and Competitive Advantages, a range of government policies and initiatives are designed to help the sector add value to the economy, the community and the environment by promoting the productivity, profitability, sustainability, and resilience of these industries, as well as safeguarding the natural environment.
Services exports
The closure of international borders since March 2020 reduced the inflow of international tourists and students to negligible levels. While the impact on international tourism was immediate, the impact on education exports has occurred during the early-2021 intake period, as most international students had arrived ahead of the March 2020 border closures.
54
Budget Strategy and Outlook 2021-22
Consistent with the 2021–22 Federal Budget assumptions, international tourism and education exports are not expected to recover to normal levels until a general reopening of international borders, most likely in the second half of calendar year 2022.
Imports
The significant rebound in economic activity following the easing of COVID-19 restrictions is expected to flow through to higher goods imports in the second half of 2020–21 and beyond. In year-average terms, Queensland’s goods imports (overseas and interstate) are still forecast to fall by 51⁄2 per cent in 2020–21, before rising by 81⁄2 per cent in 2021–22 as the domestic economy recovers and demand for imports increases.
Queensland’s labour market has recovered rapidly from the COVID-19 downturn in June quarter 2020. Between March and May 2020, employment fell by 198,300 persons (or 7.7 per cent), the largest decline in the history of the series. The participation rate fell from 65.5 per cent in March to 61.7 per cent in May 2020, the state’s lowest rate since the 1980s.
These declines likely would have been more significant if not for the substantial government support at both a national and state level, including the JobKeeper wage subsidy program, which ensured that many Queenslanders who were working zero hours remained notionally employed.
The number of people who were employed but worked zero hours for economic reasons in Queensland rose from 12,000 in March 2020 to 126,800 in April 2020 and did not return to pre-COVID-19 levels until late 2020. Reflecting this, the number of hours worked in Queensland fell by 9.1 per cent between March and April, with the unemployment rate rising from 5.8 per cent in March 2020 to a peak of 8.7 per cent in July 2020.
However, since May 2020, Queensland’s labour market has recovered much faster and further than initially anticipated, in line with the stronger than expected recovery in domestic activity.
Employment in Queensland increased by 253,200 persons between May 2020 and April 2021, exceeding its pre-pandemic level.
Partially reflecting this strong employment growth, the participation rate rebounded strongly and has remained above its pre-pandemic level since September 2020. While the rebound in the participation rate from 64.1 per cent to 66.4 per cent has tempered the recovery in the unemployment rate, it has still fallen substantially, from a peak of 8.7 per cent in July to 6.1 per cent in April 2021.
Employment fell by 7,400 persons in April 2021, suggesting that the end of the JobKeeper program contributed to the disruption in Queensland’s post-pandemic employment growth, particularly in sectors and regions exposed to international travel and tourism.
Supported by robust household consumption growth and the current surge in housing construction, employment is expected to grow by 21⁄4 per cent in 2020–21 and strengthen further to 3 per cent in 2021–22.
55
Budget Strategy and Outlook 2021-22
From 2022–23, employment growth is expected to moderate to 13⁄4 per cent per annum, in line with growth in economic activity returning to around pre-pandemic rates and slightly above population growth.
The unemployment rate is expected to average 61⁄4 per cent in June quarter 2021. Supported by strong employment growth, the unemployment rate is forecast to fall further to 53⁄4 per cent in June quarter 2022, before improving further to 5 per cent by June quarter 2025 (Chart 2.5).
| Chart 2.5 | Employment1 and unemployment rate2 outlook3, Queensland |
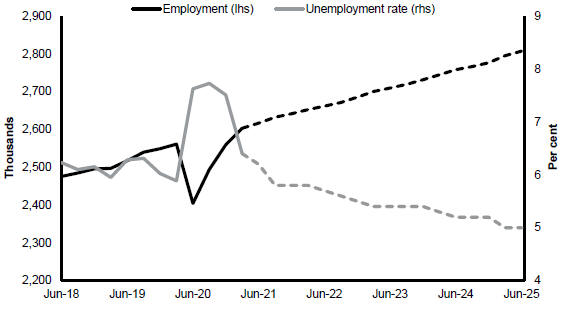
Notes:
| 1. | Seasonally adjusted, quarterly, thousand persons. |
| 2. | Seasonally adjusted, quarterly, per cent. |
| 3. | June quarter 2021 onwards are forecasts. |
Sources: ABS Labour Force and Queensland Treasury.
56
Budget Strategy and Outlook 2021-22
| Box 2.2 | Participation and unemployment rate trends |
The decision to seek work and therefore participate in the labour force is strongly influenced by the likelihood of finding employment. Reflecting the “encouraged worker effect”, robust employment growth can lead to a higher participation rate, as prevailing labour market conditions make potential workers more confident of securing work.
A key driver of high labour force growth is population growth, including net interstate and overseas migration. Historically, periods of strong employment growth have coincided with high migration, as interstate and overseas residents relocate to Queensland to pursue better employment opportunities.
As a result, periods of strong jobs growth in Queensland do not always translate directly into a falling unemployment rate. Instead, employment growth encourages rising participation, including via migration, with many new labour force participants not finding work immediately. Additionally, many new participants may be entering the labour market for the first time or may be re-entering the labour force after a long time.
The strong recovery in Queensland’s labour market from the COVID-19 shutdowns in April 2020 has highlighted aspects of the encouraged worker effect. Between May 2020 and April 2021, employment in Queensland increased by 253,200 persons. At the same time, the participation rate increased by 4.7 percentage points, reflecting growth in the labour force by 222,100 persons.
As a result, because the participation rate is now almost 1 percentage point higher than its pre-crisis level, the unemployment rate of 6.1 per cent in April 2021 remains slightly above its level of 5.8 per cent before COVID-19.
Chart 2.6 highlights the extent to which labour force growth in Queensland has moved in line with employment growth over time, thereby tempering changes in the unemployment rate.
57
Budget Strategy and Outlook 2021-22
| Chart 2.6 | Growth in Employment and the Labour Force, Queensland1 |
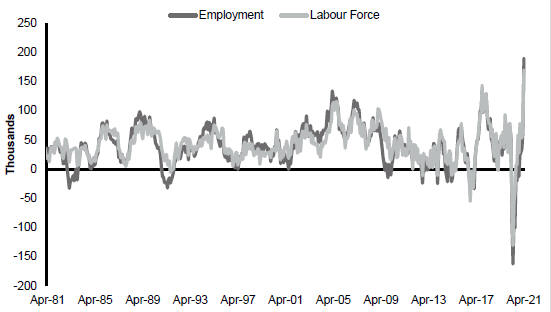
Note:
| 1. | Seasonally adjusted, Monthly, annual difference, thousand persons. |
Source: ABS Labour Force Survey
These trends highlight that the unemployment rate is an imperfect measure of labour market performance, and should be considered alongside other metrics, including employment growth and the participation rate.
The performance of Australian jurisdictions in relation to these labour market indicators has varied considerably over time, reflecting a range of structural and demographic factors. Despite often strong employment growth, Queensland has generally tended to have an unemployment rate higher than the national average over many decades.
Since the start of the ABS monthly Labour Force series in February 1978, Queensland’s seasonally adjusted monthly unemployment rate has been above the national rate for 75 per cent of all months, by an average of 0.5 percentage point.
At the same time, Queensland has recorded a higher monthly participation rate in 71 per cent of the months since February 1978, with the state’s participation rate, on average, being 0.7 percentage point higher than the national rate.
Queensland’s generally higher unemployment rate over time reflects a range of factors, including differences in labour force growth and participation (including higher youth participation), as well as differences in industry structure, demographic characteristics, and Queensland’s more geographically dispersed population compared with other jurisdictions.
58
Budget Strategy and Outlook 2021-22
Regional labour markets
Queensland’s major tourism regions of the Gold Coast, Sunshine Coast and Cairns initially endured the most significant impacts of COVID-19. Between mid-March and mid-April 2020, the number of employee jobs fell by more than 10 per cent in all 3 regions, the largest falls of the regions in Queensland.
As restrictions were eased in the second half of 2020 and domestic travel resumed, labour market conditions in these regions recovered. However, international border closures have meant that overall tourism activity remains below its pre-pandemic level.
Other regional economies more reliant on mining and agriculture have not been impacted as heavily by COVID-19. Agricultural production has not been significantly affected and, while prices declined in the initial stages of the pandemic, they had generally recovered to be above pre-COVID-19 levels by late-2020. Similarly, metals mining production was largely unaffected by the pandemic, with most large producers reporting that their production levels were not substantially impacted.
The coal mining regions of Central Queensland and Mackay–Isaac–Whitsunday have been affected by the lower coal prices throughout the second half of 2020, with Queensland Mines Inspectorate data showing the number of workers at Queensland coal mines fell by 6.1 per cent over the year to December quarter 2020.
59
Budget Strategy and Outlook 2021-22
| Box 2.3 | Queensland’s economic recovery – a strong performance |
Queensland’s economic recovery from the COVID-19 induced downturn in 2020 reflects the state’s success in controlling the spread of the virus and is highlighted in a range of key economic indicators.
Following a 7 per cent rebound in September quarter 2020, domestic activity continued to recover in the December and March quarters, to be 3 per cent above the pre-COVID-19 level of March quarter 2020. This was almost double the 1.7 per cent growth in the rest of Australia’s domestic economy over the year to March quarter 2021.
Of the states, only Western Australia recorded higher growth over the year (up by 3.8 per cent), while growth in New South Wales was only 1.9 per cent, and domestic activity in the Victorian economy remained 0.3 per cent below its pre-COVID-19 level.
Other key indicators of economic activity are also showing Queensland out-performing the rest of the nation:
| • | | real retail turnover rose by 6.2 per cent over the year to March quarter 2021, stronger than the rest of Australia (up 4.3 per cent) |
| • | | the number of dwellings approved in Queensland in the first 4 months of 2021 was 58.4 per cent higher over the year, compared with growth of only 29.2 per cent in the rest of Australia |
| • | | total dwelling starts were up 29.3 per cent in Queensland over the year to December quarter 2020, compared with growth of 17.4 per cent in the rest of Australia |
| • | | the value of dwelling finance commitments to households (excluding refinancing) was up 118 per cent over the year to April 2021, compared with growth of 59.9 per cent in the rest of Australia |
| • | | net interstate migration to Queensland totalled more than 30,000 over 2020, with Western Australia the next highest state with a net increase of 1,385 residents. The 2021–22 Federal Budget has forecast just under a cumulative 85,000 additional net interstate migrants to Queensland by June 2025. |
The state’s success in controlling the virus, combined with the significant government stimulus, including the Queensland Government’s Economic Recovery Plan, has underpinned consumer and business confidence. In turn, this has driven a strong recovery in household consumption and private investment.
Reflecting the improved domestic conditions, Queensland GSP is forecast to rebound by 31⁄4 per cent in 2020–21, with robust ongoing growth of 23⁄4 per cent forecast for 2021–22 and in each subsequent year across the forward estimates.
In comparison, the national economy is forecast by Australian Treasury to grow 11⁄4 per cent in 2020–21, 41⁄4 per cent in 2021–22 and 21⁄2 per cent in 2022–23. Importantly, Queensland’s
60
Budget Strategy and Outlook 2021-22
faster recovery means that aggregate growth across the 3 forecast years will be stronger in Queensland (around 9 per cent) than for the nation as a whole (81⁄4 per cent).
If the last 2 ‘projection’ years of the forward estimates period are included, aggregate growth in Queensland of around 15 per cent over the five years further outpaces national growth of around 131⁄2 per cent (Chart 2.7).
| Chart 2.7 | GDP/GSP outlook1 – Queensland’s comparative growth |
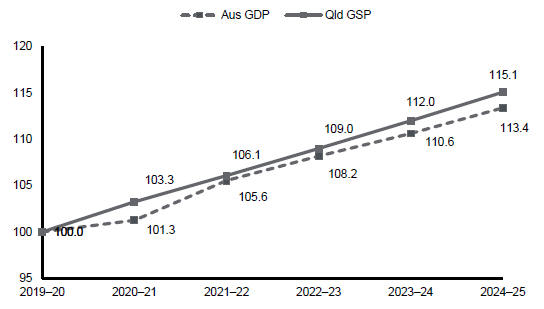
Note:
| 1. | Index points, 2019–20 = 100. |
Sources: Australian Treasury and Queensland Treasury.
The strong recovery in the domestic economy has seen Queensland already recover all of the jobs lost during the COVID-19 crisis period. Employment in Queensland has rebounded to be 54,900 persons higher in April 2021 than its pre-pandemic level in March 2020.
Importantly, Queensland has recorded the strongest employment growth of any jurisdiction since March 2020.
In comparison, New South Wales’ employment in April was 33,400 persons below its pre-pandemic level, while Victoria was only 6,500 persons above its March 2020 level (Chart 2.8).
61
Budget Strategy and Outlook 2021-22
| Chart 2.8 | Growth in Employment1 since March 2020 (i.e. pre-COVID-19) |
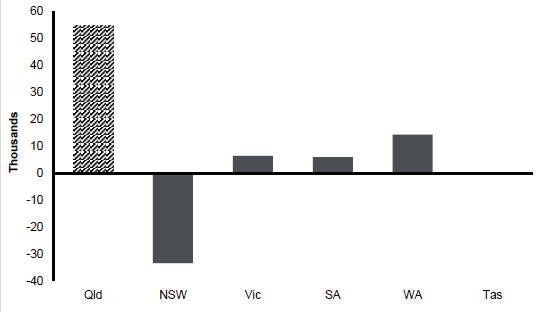
Note:
| 1. | Seasonally adjusted, thousand persons. Source: ABS Labour Force. |
The rebound in Brisbane’s consumer price index (CPI) has been stronger than initially expected following the historic 2.2 per cent decline in the CPI in June quarter 2020. The CPI increase reflected a stronger-than-expected rebound in global oil prices which has flowed through to higher automotive fuel prices. CPI growth in 2020–21 is now expected to be 2 per cent, markedly higher than the 2020–21 Budget forecast of 11⁄4 per cent.
Beyond 2020–21, continued price growth in the housing market in 2021–22 is expected to offset the Australian Government’s discontinuation of the 12.5 per cent annual increase in the tobacco excise.
Spare capacity in the Queensland labour market is likely to result in little upward pressure on wages and prices in the near-term. As a result of these trends, CPI growth is expected to remain modest over the medium-term, before returning to within the RBA’s target band as the labour market continues to tighten and the unemployment rate falls towards 5 per cent.
62
Budget Strategy and Outlook 2021-22
Queensland’s population growth in 2019–20 was negatively impacted by the COVID-19 pandemic. International travel restrictions implemented in late-March 2020 curtailed net overseas migration in the June and September quarters of 2020. Further impacts on net overseas migration are expected over the remainder of 2020–21, including in March quarter 2021, due to an expected large decline in international student arrivals.
The relaxation of interstate border restrictions in the second half of 2020 has meant interstate migration has been only minimally impacted by the pandemic, and strengthening domestic activity is expected to see interstate migration returning to more normal levels over time.
Over the past several decades, consistent positive net interstate migration has underpinned Queensland’s population growth, out-stripping the national average. In addition to the State’s enviable lifestyle, Queensland’s climate, competitive taxation rates and relative housing affordability have been key drivers in attracting interstate migrants.
These fundamental drivers remain in place, with the latest (May 2021) CoreLogic data showing the Brisbane median dwelling price of $574,572 was around 41 per cent below that in Sydney ($970,355) and around 22 per cent below Melbourne ($740,562).
Natural population increase is not expected to be materially impacted by the pandemic, with only minor changes to birth and death rates.
On balance, Queensland’s population growth is forecast to slow to one per cent in both 2020–21 and 2021–22, before gradually strengthening to 11⁄4 per cent in 2022–23 and 11⁄2 per cent in both 2023–24 and 2024–25, in line with the expected easing of restrictions on international travel. Reflecting the anticipated normalisation of interstate migration levels, Queensland’s population growth is expected to be slightly stronger than that nationally over the forecast period.
The key risks to the economic outlook remain centred around the global pandemic. In addition to the risk of new outbreaks, there is considerable uncertainty about the pace of the vaccine rollout and the ultimate process for reopening of international borders.
As the domestic economy recovers, it is expected that governments will continue to wind back the substantial economic stimulus introduced in response to the crisis. So far, the pace of withdrawal does not appear to have adversely impacted the recovery, with many major fiscal policy measures introduced during 2020 having already been wound back or ceased, but domestic activity has continued to rebound strongly. Therefore, risks related to the potential withdrawal of stimulus measures have arguably reduced since the time of the previous Budget.
However, a high level of monetary policy stimulus remains in place and the timing of any return to more normal monetary policy conditions remains an ongoing challenge for the RBA, given the likelihood that any premature tightening of monetary policy may materially impact sentiment and activity.
63
Budget Strategy and Outlook 2021-22
At the international level, while the recovery in activity now appears to have considerable momentum, the global economy remains exposed to potential new variants of COVID-19 and further waves of infection, as well as the ongoing uncertainty around the timing and effectiveness of vaccine rollouts in some major economies.
In addition to these various risks related to the pandemic, trade tensions between China and Australia remain an ongoing source of risk and uncertainty related to the outlook for some key Queensland exports.
64
Budget Strategy and Outlook 2021-22
| Table 2.2 | Queensland economic forecasts1, by component |
| | | | | | | | | | | | | | | | |
| | | Actuals | | | Forecasts | |
| | | 2019–20 | | | 2020–21 | | | 2021–22 | | | 2022–23 | |
Economic output2 | | | | | | | | | | | | | | | | |
Household consumption | | | -1.1 | | | | 51⁄4 | | | | 3 | | | | 21⁄2 | |
Dwelling investment | | | -7.1 | | | | 121⁄2 | | | | 93⁄4 | | | | -21⁄2 | |
New and used | | | -13.9 | | | | 11 | | | | 201⁄2 | | | | 1 | |
Alterations and additions | | | 2.6 | | | | 14 | | | | -21⁄2 | | | | -71⁄2 | |
Business investment | | | -6.6 | | | | -6 | | | | 4 | | | | 71⁄2 | |
Non–dwelling construction | | | -8.5 | | | | -43⁄4 | | | | 3 | | | | 71⁄2 | |
Machinery and equipment | | | -4.1 | | | | -71⁄4 | | | | 51⁄4 | | | | 71⁄4 | |
Private final demand | | | -2.2 | | | | 41⁄2 | | | | 31⁄4 | | | | 23⁄4 | |
Public final demand | | | 6.5 | | | | 41⁄2 | | | | 33⁄4 | | | | 3 | |
Gross state expenditure | | | -0.3 | | | | 43⁄4 | | | | 33⁄4 | | | | 21⁄2 | |
Overseas goods and services exports | | | -4.5 | | | | -153⁄4 | | | | 53⁄4 | | | | 101⁄4 | |
Overseas and interstate goods imports | | | 0.6 | | | | -51⁄2 | | | | 81⁄2 | | | | 41⁄2 | |
Gross state product | | | -0.7 | | | | 31⁄4 | | | | 23⁄4 | | | | 23⁄4 | |
Nominal gross state product | | | -1.5 | | | | 21⁄4 | | | | 63⁄4 | | | | 51⁄4 | |
Employment3,4 | | | 0.6 | | | | 21⁄4 | | | | 3 | | | | 13⁄4 | |
Unemployment rate5,6 | | | 7.6 | | | | 61⁄4 | | | | 53⁄4 | | | | 51⁄2 | |
Inflation3 | | | 1.2 | | | | 2 | | | | 13⁄4 | | | | 13⁄4 | |
Wage Price Index3 | | | 1.9 | | | | 13⁄4 | | | | 21⁄4 | | | | 21⁄4 | |
Population3 | | | 1.7 | | | | 1 | | | | 1 | | | | 11⁄4 | |
Notes:
| 1. | Unless otherwise stated, all figures are annual percentage changes. |
| 2. | CVM, 2018–19 reference year, except nominal GSP. |
| 3. | Annual percentage change, year-average. |
| 4. | The comparable through-the-year employment growth rates to the June quarter (seasonally adjusted) are -4.5 per cent, 83⁄4 per cent, 13⁄4 per cent and 13⁄4 per cent, from June quarter 2020 to June quarter 2023 respectively. |
| 5. | Per cent, June quarter average, seasonally adjusted. |
| 6. | The comparable year-average unemployment rates are 6.4 per cent, 7 per cent, 53⁄4 per cent and 51⁄2 per cent, from 2019–20 to 2022–23, respectively. |
Sources: ABS National, State and Territory Population, Labour Force, Wage Price Index, Consumer Price Index and Queensland Treasury.
65
Budget Strategy and Outlook 2021-22
| 3 | Fiscal strategy and outlook |
Features
| • | | The Queensland Government continues to prioritise the ongoing recovery from COVID-19 through targeted expenditure and capital measures. This includes continued frontline health support as well as initiatives to improve Queensland’s productive capacity and competitiveness in support of jobs and ongoing growth. |
| • | | A new Charter of Fiscal Responsibility supports the Government’s strategy to drive recovery, address fiscal repair and restore the state’s fiscal buffers. A renewal of Fiscal Principles supports the government’s post-COVID-19 fiscal repair strategy, including a return to operating surpluses and stabilising net debt. |
| • | | The immediate impact of COVID-19 on Queensland’s fiscal position has been significant, with revenues reduced and expenses increased through the broad range of support and stimulus measures implemented by the government. |
| • | | In line with improving economic conditions, revenue rebounded strongly in the second half of 2020–21, and is expected to be stronger across the forward estimates. |
| • | | The recovery in revenues is allowing the government to balance additional funding for priority service needs, including the evolving COVID-19 response, with improved operating balances and significantly lower net debt and borrowings relative to the 2020–21 Queensland Budget. |
| • | | A General Government operating deficit of $3.803 billion is forecast in 2020–21, an improvement compared to the $8.633 billion deficit forecast in the previous Budget. |
| • | | Improvements in the operating balance are forecast to continue across the forward estimates, with a return to surplus forecast in 2024–25. Achieving ongoing operating surpluses in the medium term, combined with net operating cashflows from operating activities primarily funding the General Government sector capital program, will allow the government to stabilise debt levels and reduce debt as a proportion of revenue over time. |
| • | | As part of the 2020–21 Budget, the government introduced key measures to manage the fiscal impact of COVID-19, including the Savings and Debt Plan and the establishment of the Queensland Future Fund (QFF) – Debt Retirement Fund (DRF) to be funded with contributions totalling $7.7 billion by 30 June 2021. |
| • | | General Government net debt in 2020–21 is expected to be $9.69 billion lower than forecast in the 2020–21 Budget. This is driven by a combination of higher revenue, targeted expenses and a material increase in the anticipated value of investments contributed to seed the DRF. The balance of the DRF is estimated to improve the rating agencies’ assessment of the state debt to revenue ratio by around 11 percentage points to 13 percentage points when assessing Queensland’s debt burden and credit rating. |
| • | | Historically low interest rates mean the cost of borrowing remains low, with Queensland’s interest expense forecast to be 2.6 per cent of revenue in 2021–22, well below the peak of 4.7 per cent in 2013–14. |
66
Budget Strategy and Outlook 2021-22
| • | | Queensland, like other Australian jurisdictions, is prioritising support for economic recovery over accelerating fiscal repair. However, the fiscal position is expected to also recover from the impacts of COVID-19, with revenue growing more strongly than expenses. Significantly, net cash flows from operating activities are expected to primarily fund the general government sector capital program from 2024–25. |
| 3.1 | Update on fiscal recovery |
The 2021–22 Queensland Budget maintains the government’s focus on supporting jobs and continuing the economic recovery. The government’s targeted expenditure, capital prioritisation and initiatives such as the $3.34 billion Queensland Jobs Fund position the economy for ongoing growth and support the rebuilding of fiscal capacity.
Since the 2020–21 Budget, the economy has recovered sooner and stronger than forecast, translating to higher-than-expected increases in key revenue streams. The improvements in revenues, along with expenditure restraint and the continued implementation of the government’s Savings and Debt Plan, has ensured that operating deficits are lower than were estimated at the 2020–21 Budget, and a return to an operating surplus is forecast in 2024–25.
Australian governments at all levels increased borrowings to combat the COVID-19 crisis. Queensland was no exception, but the government’s borrowings have increased by less than estimated in the 2020–21 Budget. Lower borrowings will enable to state to stabilise debt sooner and restore its capacity to invest in infrastructure and respond to external shocks. Unlike other states, Queensland has maintained its credit rating through the crisis, which has kept debt servicing costs manageable.
The government has developed a new Charter of Fiscal Responsibility (Charter) to inform the 2021–22 Budget strategy. The Charter includes new Fiscal Principles to support the delivery of net operating surpluses and the stabilisation of net debt.
Fiscal Principle 1 – Stabilise the General Government Sector net debt to revenue ratio at sustainable levels in the medium term, and target reductions in the net debt to revenue ratio in the long term.
The new Fiscal Principles provide objective measures supporting the government’s medium-term strategy for fiscal recovery. A renewal of Fiscal Principles was needed for this Budget to ensure they are fit for purpose and provide a balanced and sensible path to restore Queensland’s fiscal buffers as the economic recovery continues. The new Fiscal Principles retain the targeting of full funding of long-term liabilities and maintaining tax competitiveness. In the medium term, net debt will be stabilised and operating surpluses restored by managing growth in general government expenditure to be below average revenue growth.
67
Budget Strategy and Outlook 2021-22
A key component of the fiscal strategy is to stabilise debt at a sustainable level in the medium term. Queensland’s strong public health response and decision to prioritise health and economic recovery during the crisis increased borrowings.
As revenues recover and expenditure growth is managed, the net debt to revenue ratio is forecast to moderate towards the end of the forward estimates, increasing from 57 per cent to 60.5 per cent between 2023–24 and 2024–25.
Continued prudent budget management will reduce the net debt to revenue ratio in the longer term, restoring Queensland’s fiscal capacity to help manage future crises.
| Chart 3.1 | Ratio of General Government net debt/revenue |
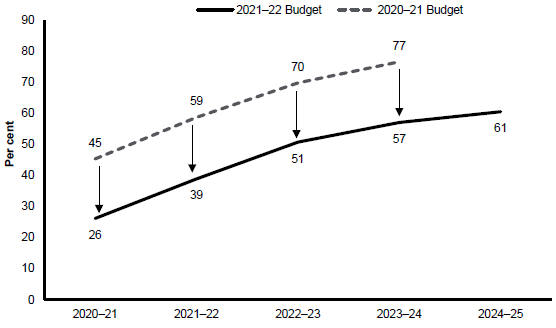
Net operating deficits over the forward estimates are lower than were forecast in the 2020–21 Budget. As a result, the increase in net debt has also been less than anticipated. Net debt is now expected to moderate at a lower level than previously forecast, additionally offset by an increase in the value of assets being contributed to the Queensland Future Fund (QFF) – Debt Retirement Fund (DRF). Queensland’s financial assets are detailed further in Chapter 6.
68
Budget Strategy and Outlook 2021-22
| Box 3.1 | Queensland Future Fund – Debt Retirement Fund |
The Queensland Future Fund Act 2020 provides the legislative framework for establishing Queensland Future Funds, including the first such fund, the Debt Retirement Fund (DRF).
The DRF is created with the sole purpose of debt reduction and will hold state investments for future growth to be used to offset state debt to support Queensland’s credit rating. Moody’s has indicated that the QFF will play a material role in the state’s management of its debt.
Assets contributed or being contributed to the DRF in 2020–21 include:
| • | | $6 billion in seed funding from the transfer of the Queensland Titles Registry operations |
| • | | $1.5 billion from the surplus assets held to support the Defined Benefit Scheme (DB scheme surplus) |
| • | | $206 million in securities held by the State. |
Based on the contribution of these investments, the estimated balance of the Debt Retirement Fund as at 30 June 2021 is $7.7 billion.
This balance is greater than the $5.67 billion estimated when first announced in the COVID-19 Fiscal and Economic Review, driven primarily by an uplift in the value of Queensland Titles Registry and an increase in the contribution from the DB Scheme surplus. The DB Scheme remains in a strong surplus position. It remains the only fully funded superannuation liability across Australian state governments.
Separate to the contribution to the DRF, the government is retaining approximately $1.8 billion from the transfer of the Titles Registry to support a number of long-term government priorities, including the establishment of the $1 billion Housing Investment Fund, the $300 million Path to Treaty Fund and a $500 million Carbon Reduction Investment Fund. The returns will be used to support these priorities, with the original funding remaining invested to deliver sustainable and ongoing returns.
Development rights associated with the Cross River Rail (CRR) development lots within the CRR Precincts, the land surrounding the 4 new underground train stations, have also been identified for transfer to the Debt Retirement Fund when construction of the rail tunnel and stations is completed.
Queensland’s net debt to revenue ratio of 39 per cent in 2021–22 compares favourably with that of its peers. The net debt to revenue ratio in 2021–22 is 75 per cent for New South Wales (2020–21 Half-Yearly Review) and 137 per cent for Victoria (2021–22 Budget).
The balance of the DRF is estimated to improve the rating agencies’ assessment of the state debt to revenue ratio by around 11 percentage points to 13 percentage points when assessing Queensland’s debt burden and credit rating.
69
Budget Strategy and Outlook 2021-22
Fiscal Principle 2 – Ensure that average annual growth in General Government Sector expenditure in the medium term is below the average annual growth in General Government Sector revenue to deliver fiscally sustainable net operating surpluses.
The new Fiscal Principle 2 is designed to provide a broad measure of expenditure growth management. It replaces the previous Fiscal Principle 6, which aimed to ensure growth in employee expenses was sustainable through measuring full-time equivalent employee (FTE) growth.
While employee expenses are a large component of overall expenses growth, the monitoring of FTE growth as the sole expenditure-related principle was considered too narrow to guide fiscal recovery from the impact of COVID-19. Frontline services have been pivotal to ensuring the state was protected from COVID-19 and, therefore, critical to ensuring the state’s economic recovery. A narrow focus on FTEs could also create perverse incentives for agencies to outsource services at higher cost to the state. A broader principle related to overall expenditure growth ensures all components of expenditure are considered by the fiscal principles. FTE management remains an important part of expenditure management and will continue to be reported in detail in Chapter 5.
Maintaining a lower rate of expenditure growth than revenue growth will deliver an operating surplus by 2024–25 and assist debt stabilisation. Over the forward estimates, revenues are forecast to grow by an average of 3.9 per cent per annum, relative to average expenditure growth of 2.3 per cent with an operating surplus forecast to be achieved in 2024–25 (Chart 3.2).
| Chart 3.2 | Comparison of revenue and expenditure |
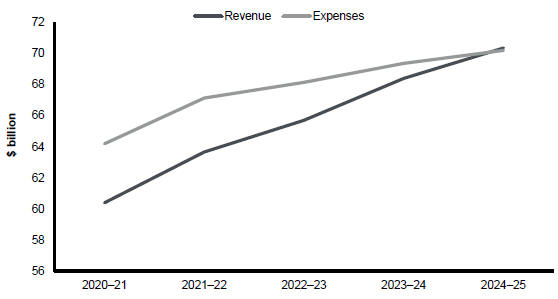
70
Budget Strategy and Outlook 2021-22
Fiscal Principle 3 – Target continual improvements in net operating surpluses to ensure that, in the medium term, net cash flows from investments in non-financial assets (capital) will be funded primarily from net cash inflows from operating activities. The capital program will focus on supporting a productive economy, jobs, and ensuring a pipeline of infrastructure that responds to population growth.
Maintaining a capital program that will support jobs and enhance the productive capacity of the economy remains a government priority. The government’s $50 billion Infrastructure Guarantee has ensured the maintenance of a substantial capital program through the COVID-19 crisis and a capital program of $52.216 billion is planned over the 4 years to 2024–25, taking the total infrastructure investment from 2015–16 to 2024–25 to over $110 billion.
A commitment to a large capital program at the same time as stabilising net debt will require the capital program to be primarily funded through operating cash surpluses rather than borrowings. From 2021–22, new capital investment is expected to be increasingly funded from net cash inflows from operating activities. By 2024–25, 55 per cent of the investment in non-financial assets is expected to be funded from operating cash.
This positions Queensland well for continued improvement beyond the forward estimates period, towards the medium-term goal of funding capital primarily through operating cash surpluses.
This is also a substantial improvement compared to the 2020–21 Budget.
| Chart 3.3 | Share of General Government investments in non-financial assets funded from operating cash surpluses |

71
Budget Strategy and Outlook 2021-22
Fiscal Principle 4 – Maintain competitive taxation by ensuring that, on a per capita basis, Queensland has lower taxation than the average of other states.
The fiscal principles will ensure that Queenslanders continue to pay less tax than Australians in other states and territories. Compared to the previous Charter, this principle has been adjusted to directly measure Queensland’s competitiveness relative to other jurisdictions, rather than as a fixed proportion of GSP. This will provide a more meaningful indication of the comparative impact of Queensland’s tax regime and policies.
Based on the latest available outcomes, Queensland’s taxation per capita was $771 less than the average of other jurisdictions in 2019–20. On average, Queenslanders paid $1,078 less tax than New South Wales residents and $761 less than Victorian residents.
Using the latest forecasts, Queensland’s taxation per capita of $3,328 in 2021–22 compares favourably to an average of $3,814 per capita across the other jurisdictions.
Chart 3.4 demonstrates that Queensland is expected to maintain a highly competitive taxation environment.
| Chart 3.4 | Taxation per capita, Queensland and other jurisdictions |
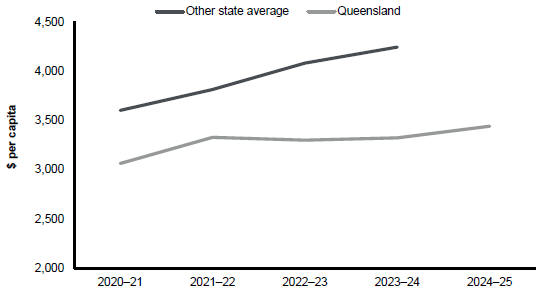
Sources: 2021–22 budgets for Queensland, Victoria and NT. 2020–21 mid-year updates for NSW and WA, April 2021 pre-election update for Tasmania. 2020–21 budgets for SA and ACT. Population data from 2021–22 Federal Budget.
Fiscal Principle 5 – Target the full funding of long-term liabilities such as superannuation and workers’ compensation in accordance with actuarial advice.
The full funding of superannuation and other long-term liabilities is a long-standing Queensland Government priority and a key element of Queensland’s financial management. A commitment to this principle will continue through the economic and fiscal recovery from the COVID-19 crisis, and it will remain part of the long-term fiscal strategy.
72
Budget Strategy and Outlook 2021-22
The key fiscal aggregates for the 2021–22 Budget are outlined in Table 3.1 and are discussed in detail in this chapter.
| Table 3.1 | Key fiscal aggregates1 |
| | | | | | | | | | | | | | | | | | | | | | | | | | | | |
| | | 2019–20
Outcome
$ million | | | 2020–21
Budget
$ million | | | 2020–21
Est. Act.
$ million | | | 2021–22
Budget
$ million | | | 2022–23
Projection
$ million | | | 2023–24
Projection
$ million | | | 2024–25
Projection
$ million | |
Revenue | | | 57,764 | | | | 56,249 | | | | 60,396 | | | | 63,664 | | | | 65,711 | | | | 68,408 | | | | 70,367 | |
Expenses | | | 63,498 | | | | 64,881 | | | | 64,199 | | | | 67,148 | | | | 68,151 | | | | 69,376 | | | | 70,214 | |
Net operating balance | | | (5,734 | ) | | | (8,633 | ) | | | (3,803 | ) | | | (3,485 | ) | | | (2,440 | ) | | | (968 | ) | | | 153 | |
PNFA2 | | | 6,291 | | | | 7,572 | | | | 6,965 | | | | 7,800 | | | | 7,786 | | | | 7,275 | | | | 7,041 | |
Fiscal balance | | | (9,158 | ) | | | (13,440 | ) | | | (8,159 | ) | | | (7,965 | ) | | | (6,379 | ) | | | (3,630 | ) | | | (2,079 | ) |
Borrowing with QTC | | | 37,570 | | | | 53,501 | | | | 47,102 | | | | 57,240 | | | | 67,110 | | | | 73,265 | | | | 77,761 | |
Leases and other similar arrangements | | | 6,499 | | | | 7,565 | | | | 7,779 | | | | 7,603 | | | | 7,471 | | | | 7,780 | | | | 7,623 | |
Securities and derivatives | | | 198 | | | | 198 | | | | 198 | | | | 198 | | | | 198 | | | | 198 | | | | 198 | |
Net debt | | | 14,046 | | | | 25,499 | | | | 15,808 | | | | 24,750 | | | | 33,326 | | | | 39,019 | | | | 42,573 | |
Notes:
| 1. | Numbers may not add due to rounding. |
| 3.2.1 | Net operating balance |
Table 3.2 compares the General Government Sector net operating balance forecasts for the previous budget with the 2021–22 Budget forecasts.
| Table 3.2 | General Government Sector – net operating balance forecasts |
| | | | | | | | | | | | | | | | | | | | |
| | | 2020–21
$ million | | | 2021–22
$ million | | | 2022–23
$ million | | | 2023–24
$ million | | | 2024–25
$ million | |
2020–21 Budget | | | (8,633 | ) | | | (4,303 | ) | | | (2,480 | ) | | | (1,389 | ) | | | na | |
2021–22 Budget | | | (3,803 | ) | | | (3,485 | ) | | | (2,440 | ) | | | (968 | ) | | | 153 | |
The 2021–22 Budget projects improving net operating balances across the forward estimates, reaching a surplus of $153 million by 2024–25, as revenues continue to improve alongside moderate expenditure growth.
A deficit of $3.803 billion is estimated for 2020–21, an improvement of $4.8 billion from the previous budget forecast of $8.633 billion. This improvement has been underpinned by an uplift to revenue since the 2020–21 Budget, particularly from GST and taxes. At the same time, expense measures since the last budget have been modest and focused on key priorities.
73
Budget Strategy and Outlook 2021-22
This prudent approach has allowed the revenue uplift to flow through to improved operating balances and reduced the need to increase borrowings compared to previous estimates. In the 4 years to 2023–24, total general government revenue has increased by $11.706 billion, compared to expense increases of $5.598 billion over the same period.
Table 3.3 provides a breakdown of the changes in the net operating balance since the 2020–21 Budget.
| Table 3.3 | Reconciliation of net operating balance, 2020–21 Budget to 2021–22 Budget1 |
| | | | | | | | | | | | | | | | |
| | | 2020–21
$ million | | | 2021–22
$ million | | | 2022–23
$ million | | | 2023–24
$ million | |
2020–21 Budget net operating balance | | | (8,633 | ) | | | (4,303 | ) | | | (2,480 | ) | | | (1,389 | ) |
Taxation revisions2 | | | 1,577 | | | | 2,052 | | | | 1,268 | | | | 765 | |
Royalty and land rent revisions | | | 36 | | | | (175 | ) | | | (334 | ) | | | (285 | ) |
GST revisions | | | 2,108 | | | | 1,729 | | | | 1,687 | | | | 1,628 | |
Expense measures3 | | | (3 | ) | | | (1,889 | ) | | | (811 | ) | | | (545 | ) |
Net flows from PNFC and PFC entities4 | | | (244 | ) | | | (60 | ) | | | (102 | ) | | | (336 | ) |
Natural Disaster Revisions (DRFA)5 | | | (8 | ) | | | 134 | | | | 40 | | | | (156 | ) |
Australian Government funding revisions6 | | | 252 | | | | (542 | ) | | | (548 | ) | | | (213 | ) |
Other parameter adjustments7 | | | 1,112 | | | | (431 | ) | | | (1,160 | ) | | | (437 | ) |
2021–22 Budget net operating balance | | | (3,803 | ) | | | (3,485 | ) | | | (2,440 | ) | | | (968 | ) |
Notes:
| 1. | Numbers may not add due to rounding. Numbers indicate the impact on the operating balance. A number in brackets indicates a negative impact on the operating balance. |
| 2. | Represents parameter adjustments to taxation revenue. Includes measure to extend Apprentice Rebate Scheme in 2021–22 of $31.2 million. |
| 3. | Reflects the operating balance impact of Government decisions since the 2020–21 Budget (refer to Chapter 7 – Budget Measures for details). |
| 4. | Represents revisions to dividends and tax equivalent payments from, and community service obligations (CSOs) and Transport Service Contract (TSC) payments to, Public Non-financial Corporations and Public Financial Corporations, net of CSO and TSC expense measures. |
| 5. | Disaster Recovery Funding Arrangements. |
| 6. | Represents the net impact of funding provided by the Australian Government primarily for Specific Purpose Payments and National Partnership payments and excludes funding for disaster recovery expenses. |
| 7. | Refers to adjustments largely of a non-policy nature, primarily changes in interest paid on borrowings, depreciation, swaps, lapses and deferrals. |
74
Budget Strategy and Outlook 2021-22
The COVID-19 pandemic and the resulting economic downturn substantially reduced the state’s revenues, particularly across 2019–20 and 2020–21. However, the beginning of economic recovery resulted in stronger revenues in the second half of 2020–21 than previously anticipated, with 2020–21 revenues now expected to be $4.148 billion (7.4 per cent) higher than forecast in the previous budget (see Chart 3.5).
Taxation revenue is forecast to be $1.492 billion (9.4 per cent) higher in 2021–22, primarily driven by continued strength in transfer duty and a rebound in payroll tax as employment and business conditions improve.
Following the strong growth in both 2020–21 and 2021–22, total taxation revenue is forecast to grow by 2.3 per cent per annum on average across the subsequent 3 years.
Following an estimated fall of 44.4 per cent in 2020–21, royalty revenues are forecast to partially rebound by 25.6 per cent in 2021–22, reflecting the expected improvement in global economic activity, as well as the impact of the new volume based petroleum royalty model. More moderate growth is forecast in subsequent years, however, the timing and extent of the unwinding of China’s import ban on Australian coal is still uncertain and remains a key risk to the outlook.
With stronger than expected national consumption and dwelling investment, GST revenue is estimated to be 16 per cent higher in 2020–21 compared to 2019–20. Queensland’s GST revenue is expected to grow by 5.4 per cent in 2021–22 and is forecast to continue to grow on average by 4.9 per cent per annum over the forward years.
| Chart 3.5 | Comparison of revenue forecasts |
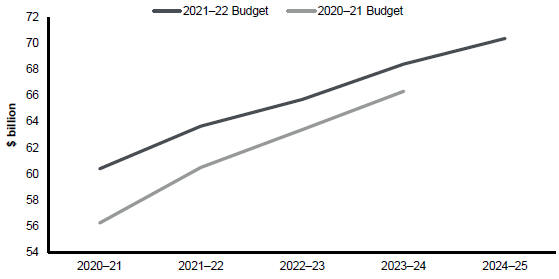
Further information on revenue forecasts is provided in Chapter 4.
75
Budget Strategy and Outlook 2021-22
The 2020–21 Budget estimated expenses would increase by 7.9 per cent in 2019–20, 2.2 per cent in 2020–21 and 1.6 per cent over the 4 years to 2023–24, reflecting the health response to the pandemic and the assistance provided to businesses and industry to stimulate economic recovery. A smaller increase in general government expenses of 1.1 per cent is now expected in 2020–21.
Modest expenses growth has been achievable due to the government implementing strategies to contain increases, while maintaining the expenditure needed to deliver frontline services, targeted support for jobs and the economy, and measures to enhance longer-term productivity.
On average, annual general government expenses are forecast to increase by 2.3 per cent over the 4 years to 2024–25. This is lower than the forecast average annual increases in revenue of 3.9 per cent over the same period, and consistent with Fiscal Principle 2.
The $3 billion Savings and Debt Plan is a key component of managing expenditure growth, with progress towards achieving savings targets detailed in Box 3.2.
Further detail on expense initiatives is provided in Chapter 7.
76
Budget Strategy and Outlook 2021-22
| Box 3.2 | Savings and Debt Plan |
The Queensland Government’s Savings and Debt Plan, announced on 9 July 2020, targeted savings of $3 billion over 4 years to 2023–24. Savings of $750 million in 2020–21 have been achieved under the Savings and Debt Plan. Workstreams established under the Savings and Debt Plan are continuing to identify cross-government savings opportunities and will support agencies to achieve remaining savings through to 2023–24.
Workstreams include Accommodation, Advertising and Marketing, Data and ICT, Workforce, Government Corporate Support Services, Grants Administration, and Procurement. In addition, Government is working to assess how it can deliver its functions more effectively, including through structural reform opportunities and review of agency functions.
$750 million of savings has been achieved in 2020–21, as shown in Table 3.4. Agencies have achieved these savings without reducing services, and in line with the Queensland Government’s commitment to employment security.
Examples of savings made in 2020–21 include:
| | • | | Reduction of 101 social media accounts across government |
| | • | | Net reduction of 33 (4.6%) of the Senior Executive Service via natural attrition between July 2020 and May 2021 |
| | • | | Accommodation savings, including $14.2 million in savings associated with a renegotiation of a Department of Education lease and ongoing savings of $3.5 million per annum |
| | • | | Reduction of $17.7 million over 4 years in ICT contract costs, including savings in telecommunications contracts. |
A further $750 million will be realised in 2021–22 through a combination of savings already realised and agency savings. Savings from the Health and Education portfolios will be managed through existing funding model arrangements.
A range of Savings and Debt Plan measures and workstreams will also support agencies to achieve remaining savings through to 2023–24.
77
Budget Strategy and Outlook 2021-22
| | | | |
Department | | 2020–21
Savings
$ 000 | |
Department of Aboriginal and Torres Strait Islander Partnerships | | | 845 | |
Department of Agriculture and Fisheries | | | 9,842 | |
Department of Child Safety, Youth and Women | | | 11,601 | |
Department of Children, Youth Justice and Multicultural Affairs | | | 11,196 | |
Department of Communities, Disability Services and Seniors | | | 534 | |
Department of Communities, Housing and the Digital Economy | | | 3,534 | |
Department of Education | | | 110,502 | |
Department of Employment, Small Business and Training | | | 55,557 | |
Department of Energy and Public Works | | | 3,185 | |
Department of Environment and Science | | | 61,111 | |
Department of Housing and Public Works | | | 34,115 | |
Department of Justice and Attorney-General | | | 12,961 | |
Department of Local Government, Racing and Multicultural affairs | | | 2,787 | |
Department of Natural Resources, Mines and Energy | | | 20,170 | |
Department of Regional Development, Manufacturing and Water | | | 627 | |
Department of Resources | | | 1,406 | |
Department of Seniors, Disability Services and Aboriginal and Torres Strait Islander Partnerships | | | 2,939 | |
Department of State Development, Infrastructure, Local Government and Planning | | | 5,008 | |
Department of State Development, Tourism and Innovation | | | 37,156 | |
Department of the Premier and Cabinet | | | 4,024 | |
Department of Tourism, Innovation and Sport | | | 653 | |
Department of Transport and Main Roads | | | 80,923 | |
Department of Youth Justice | | | 1,622 | |
Electoral Commission Queensland | | | 1,333 | |
Inspector-General of Emergency Management | | | 61 | |
Legislative Assembly | | | 500 | |
Ombudsman | | | 130 | |
Public Safety Business Agency | | | 2,951 | |
Public Service Commission | | | 1,060 | |
Queensland Audit Office | | | 176 | |
Queensland Corrective Services | | | 15,728 | |
Queensland Fire and Emergency Services | | | 9,238 | |
Queensland Health | | | 177,475 | |
78
Budget Strategy and Outlook 2021-22
| | | | |
Queensland Police Service | | | 32,073 | |
Queensland Treasury | | | 7,059 | |
Trade and Investment Queensland | | | 903 | |
Whole-of-Government | | | 29,015 | |
Total Savings | | | 750,000 | |
Notes:
| 1. | Table includes all savings achieved in 2020–21, including those achieved by entities which were impacted by machinery-of-government changes announced on 12 November 2020. Savings have been reported against the entity which achieved these savings. |
The Queensland Government provides essential infrastructure and capital works to support productivity, connect industries and meet the state’s increasing service needs. Infrastructure investment supports jobs across all regions of the state and is a key component of the Queensland Government’s Economic Recovery Plan.
Key capital investments in 2021–22 include:
| • | | $6.902 billion investment in transformative transport infrastructure. Highlights of the 2021–22 transport capital program include $1.517 billion to continue construction work on Cross River Rail and substantial ongoing investment to fund major upgrades to the M1 Pacific Motorway and the Bruce Highway |
| • | | $1.352 billion to support the delivery of health services, including $283.7 million as part of the Building Better Hospitals program |
| • | | $1.521 billion to ensure Queensland’s state schools and training assets are world-class and continue to meet demand. Investment in new schools is being facilitated through the $2.6 billion Building Future Schools Fund |
| • | | $1.813 billion over 4 years to increase the supply of social housing and upgrade the existing social housing property portfolio, including $502.6 million in capital works and capital grants in 2021–22. |
Further information about the government’s capital program is provided in Chapter 6 and the Capital Statement (Budget Paper 3).
79
Budget Strategy and Outlook 2021-22
Australian governments at all levels increased borrowings to combat the COVID-19 crisis. Queensland was no exception, but the government’s borrowings have increased by less than estimated in the 2020–21 Budget. General Government net debt is forecast to be $24.75 billion at 30 June 2022, $10.761 billion lower than forecast in the 2020–21 Budget. Box 3.3 discusses improvements in the debt position in further detail.
While additional debt has been necessary to deliver an effective response to the crisis, the government has also implemented a range of measures to limit the legacy impacts of the crisis on Queensland’s fiscal position. This includes the Savings and Debt Plan and the creation of the first Queensland Future Fund (QFF) – Debt Retirement Fund (DRF), to safeguard the state’s balance sheet.
The 2020–21 Budget prioritised the state’s health response and economic recovery from COVID-19. Queensland’s decisive response to the pandemic resulted in operating deficits and increased borrowings over the forward estimates.
The 2021–22 Budget continues to focus on protecting the health of Queenslanders. There is a strong correlation between health outcomes and economic outcomes, and Queensland’s continued success in containing the spread of the virus will be key to continued economic gains.
The government has taken a disciplined approach to its fiscal strategy to limit the potential legacy impacts of the crisis and ensure borrowings remain contained, and to set a strategy and path to support ongoing growth in the economy. This is particularly important when considering the risk of future increases to borrowing costs from higher interest rates or the need for government responses to future events.
The government is acting prudently to stabilise debt, directing revenue improvements toward economic recovery priorities and a return to operating surplus. The updated fiscal principles support a path to stabilisation of the relative net debt burden in response to the COVID-19-induced fiscal challenges.
With debt now forecast to increase more slowly than anticipated in the 2020–21 Budget, Queensland is well positioned to stabilise its debt burden.
All measures of the debt burden have been revised downwards since the 2020–21 Budget. The forecast level of total general government borrowing has reduced materially. In 2023–24, the level of general government borrowings is expected to be $7.377 billion lower compared to the outlook at the time of the 2020–21 Budget. Since the 2020–21 Budget, net debt has been revised down by $11.762 billion in 2023–24. In 2024–25, net debt is expected to remain much lower than interstate peers. Net debt is the measure broadly emphasised by governments, including the Australian Government.
80
Budget Strategy and Outlook 2021-22
In addition, the government’s Queensland Future Fund (QFF)—Debt Retirement Fund (DRF) has been established to hold state investments for future growth, which will be used to offset state debt to support Queensland’s credit rating.
By prudently managing expenditure, while continuing to protect the health of Queenslanders and delivering high-quality services, the government will ensure Queensland’s fiscal capacity improves and target debt reduction in the longer term.
Queensland’s net debt has seen a significant improvement. By 2023–24, Queensland’s forecast net debt of $39.019 billion compares to $96.675 billion for New South Wales and $138.35 billion for Victoria. As shown in Chart 3.6, general government net debt as a share of revenue is also expected to be far lower in Queensland than in New South Wales and Victoria across the forward estimates.
| Chart 3.6 | State comparison of general government sector net debt to revenue |
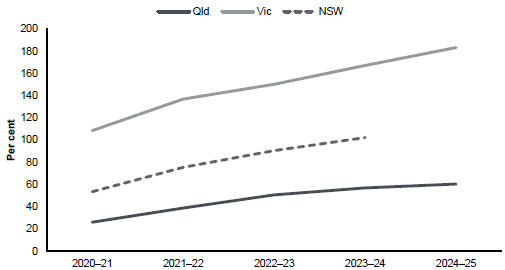
Sources: 2021–22 budgets for Queensland and Victoria, 2020–21 Half-Yearly Review for NSW.
Debt servicing costs remain manageable. As a share of revenue, Queensland’s general government sector interest expenses have declined over successive budgets.
General government sector interest expenses have fallen from a peak of $2.328 billion in 2014–15 to $1.567 billion in 2020–21, despite the impact of the pandemic on borrowings.
81
Budget Strategy and Outlook 2021-22
Chart 3.7 shows that Queensland’s interest expense is forecast to be around 2.6 per cent of revenue in 2021–22, well below the peak of 4.7 per cent in 2013–14. A reduction in overall debt levels in this Budget helps to reduce the impact of future interest rate rises.
| Chart 3.7 | General Government Sector ratio of borrowing costs to revenue |
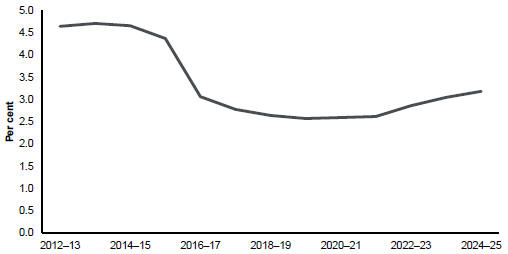
Queensland’s Credit Rating
In April 2021, Moody’s reaffirmed Queensland’s Aa1 credit rating, noting the state’s strong financial management. S&P Global also noted Queensland’s strong financial management and diverse economy in reaffirming Queensland’s AA+ credit rating in October 2020.
The ratings outlook for Queensland is stable, supported by the government’s commitment to improving budgetary performance and stabilising the level of borrowings. The establishment of the Queensland Future Fund (QFF) – Debt Retirement Fund (DRF) and the roll-out of the Savings and Debt Plan demonstrate a commitment to active debt management and improving budgetary performance, which support the state’s strong credit rating.
The credit rating of the state impacts the rate at which new and refinanced borrowings are made, which affects the overall cost of borrowing. Sound financial management supports the credit rating and provides the capacity to respond to future economic and financial shocks, including the long-term impact of the pandemic.
82
Budget Strategy and Outlook 2021-22
| 3.2.6 | Emerging Fiscal Pressures |
Beyond ongoing uncertainties related to the COVID-19 pandemic, including the higher risk of outbreaks and associated need for fiscal support if the vaccination program takes longer than expected, key emerging fiscal issues include:
| • | | Native Title Compensation Settlement: the government has a potential liability with respect to compensation arising from acts that have extinguished or impaired native title since 1975 |
| • | | expiring agreements: Queensland’s fiscal position is exposed to decisions made by the Australian Government, including not renewing funding for National Partnership payments (NPs) where there are ongoing community service needs that must be met. Further information on expiring agreements is provided in Chapter 8 |
| • | | the need to work with Games Partners, including the Australian Government and local governments, to ensure fair funding contributions for required expenses and investment associated with Queensland’s bid to host the 2032 Olympic and Paralympic Games |
| • | | provisions have been made for a regional quarantine facility in Queensland if the Australian Government decides to support the detailed submission provided by the Queensland Government. |
83
Budget Strategy and Outlook 2021-22
Features
| • | | The COVID-19 pandemic and the resulting economic downturn substantially reduced the state’s revenues, particularly across 2019–20 and 2020–21. However, in line with the improving economic conditions since mid-2020, revenue is expected to recover in 2020–21 and is forecast to continue to grow across the forward estimates period. |
| • | | Importantly, while total revenues are expected to be stronger across the forecast period compared to the 2020–21 Queensland Budget, estimated revenue for 2020–21 is still expected to be lower than forecast at the 2019–20 Mid-Year Fiscal and Economic Review (MYFER), prior to the onset of COVID-19. |
| • | | General Government Sector revenue is estimated to total $60.396 billion in 2020–21, up $2.633 billion (4.6 per cent) compared with 2019–20 and $4.148 billion (7.4 per cent) higher than estimated in the 2020–21 Budget. |
| • | | Total General Government Sector revenue is estimated to strengthen further in 2021–22 to $63.664 billion, an increase of $3.268 billion (5.4 per cent) compared with 2020–21. |
| • | | The increase in revenues in 2021–22 primarily reflects a rebound in Queensland and national activity following the initial impacts of COVID-19. |
| | • | | Taxation revenue collections are expected to be $1.492 billion (9.4 per cent) more than in 2020–21, reflecting a combination of increased economic activity and the substantial tax relief measures provided in 2020–21 by the Queensland Government to support businesses in response to COVID-19. |
| | • | | GST revenue is expected to increase by $807 million (5.4 per cent) in 2021–22, reflecting a higher GST pool and Queensland receiving a larger share of GST. |
| | • | | Royalties and land rents are expected to increase by $674 million (25.3 per cent) compared to 2020–21, driven by expected rebounds in coal and LNG prices following significant falls in 2020–21. However, royalty revenues in 2021–22 and in the following 2 years are expected to be lower than forecast in the 2020–21 Budget, primarily reflecting the ongoing uncertainty around China’s restrictions on Australian coal. |
| • | | Australian Government payments to Queensland in 2021–22 are expected to total $31.607 billion, representing an increase of $376 million (1.2 per cent) compared with payments in 2020–21. This increase is primarily driven by the increase in GST revenue. |
| • | | Total revenues are expected to grow at an average rate of 3.9 per cent over the 4 years to 2024–25, with average annual growth of 4 per cent in taxation and 5 per cent in GST. |
| • | | Importantly, Queensland is maintaining its competitive tax status, with per capita state tax $771 below the average of other states and territories in 2019–20. |
84
Budget Strategy and Outlook 2021-22
Queensland’s domestic economy is now expected to grow substantially faster across the forecast period than at the time of the 2020–21 Budget. Combined with a stronger national economic recovery, this has supported total Queensland revenues, which have been revised up across the forward estimates.
These upward revisions primarily reflect stronger than previously expected taxation and GST revenues as a result of improving economic conditions.
In contrast, royalty revenues have been revised downwards in 2021–22 and in subsequent years, primarily reflecting the ongoing impacts and increased uncertainty related to China’s restrictions on the importation of Australian coal.
General Government Sector revenue is estimated to be $60.396 billion in 2020–21, $4.148 billion (7.4 per cent) higher than the 2020–21 Budget estimate. Significant variations from the 2020–21 Budget estimates include:
| • | | a $1.577 billion (11 per cent) increase in taxation revenue, reflecting the stronger than expected domestic economic activity and, in particular, residential property transactions |
| • | | a $2.108 billion (16.6 per cent) increase in GST revenue due to higher national GST collections during 2020–21, as robust national consumption throughout the pandemic was augmented by the recovery of outstanding debt |
| • | | a $264 million (22.4 per cent) decrease in dividends and income tax equivalent income, primarily due to lower earnings from the electricity generation sector. |
The substantial improvement in taxation and GST revenues compared with the 2020–21 Budget outlook reflects Queensland’s successful health response and the stronger recovery in the Queensland and national economies than previously anticipated.
In contrast, forecast royalty revenues in 2020–21 have remained relatively unchanged from the previous budget outlook, given the ongoing subdued demand for key Queensland commodities, particularly coal, across the second half of 2020–21.
Compared with 2019–20, state taxation and GST revenues in 2020–21 are now expected to increase by 9.1 per cent and 16 per cent, respectively. In contrast, royalty revenue has fallen sharply (estimated to be down 44.4 per cent in 2020–21 compared with 2019–20) as the global economic downturn and the increasing impact of Chinese import restrictions have weighed on coal prices and export volumes.
The better than anticipated overall revenue outcome means that Queensland General Government revenue is now expected to be 4.6 per cent higher in 2020–21 than in 2019–20.
85
Budget Strategy and Outlook 2021-22
In line with the ongoing economic recovery, General Government Sector revenue is forecast to increase by $3.268 billion (or 5.4 per cent) in 2021–22, to be $63.664 billion. This is driven by an expected rebound in revenue following the COVID-19 impact on 2019–20 and 2020–21 and is particularly evident across the 3 key state revenue sources: taxation; GST; and royalties.
Chart 4.1 examines the growth in revenue across the 3 key revenue streams and the share of growth attributable to each key revenue item.
| Chart 4.1 | Growth in key revenues1 |
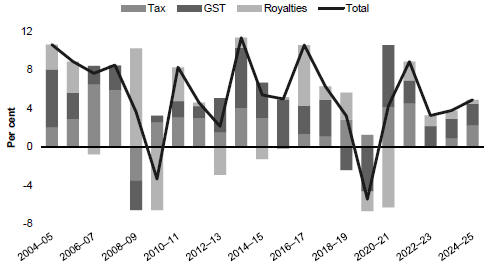
Note:
| 1. | Annual contribution to growth in key revenues. Total is the annual growth of the sum of the 3 categories. |
Taxation revenue is forecast to be $1.492 billion (9.4 per cent) higher in 2021–22. Improved taxation receipts are primarily driven by continued strength in transfer duty, which has been bolstered by a significant increase in residential property activity since restrictions eased in mid-2020, and a rebound in payroll tax, amid the recovery in employment and business conditions.
The forecast growth in 2021–22 also partially reflects the impacts of the significant Queensland Government COVID-19 tax relief provided to support Queensland businesses and landlords in the previous year.
Royalty revenue is expected to rebound in 2021–22 and grow by 25.6 per cent. In particular, coal export values are forecast to rebound in 2021–22, with higher prices driven by the continued recovery in global economic activity from the COVID-19 pandemic. However, the timing and extent of the unwinding of China’s import ban on Australian coal is still uncertain and remains a key risk to the outlook.
86
Budget Strategy and Outlook 2021-22
Following stronger than expected GST receipts in 2020–21, Queensland’s GST revenue is expected to grow by 5.4 per cent in 2021–22 and is forecast to continue to grow on average by 4.9 per cent per annum over the 3 years ending 2024–25.
This increase in expected GST revenue is largely driven by growth in the national GST pool. The 2021–22 Federal Budget forecast the GST pool to grow by 4 per cent in 2021–22 and around 5 per cent per annum on average over the 3 years ending 2024–25, reflecting the expected ongoing growth in taxable consumption.
Total General Government revenue growth is expected to average 3.9 per cent per annum over the 4 years to 2024–25.
The solid but steady growth forecast in 2022–23 and beyond reflects the expected return to more normal economic conditions and activity levels over the forecast period, as well as an ongoing but gradual improvement in commodity prices and export volumes. Table 4.1 details Queensland’s total General Government revenue by component across the forward estimates period.
| Table 4.1 | General Government Sector revenue1 |
| | | | | | | | | | | | | | | | | | | | | | | | | | | | |
| | | 2019–20
Actual
$ million | | | 2020–21
Budget
$ million | | | 2020–21
Est. Act
$ million | | | 2021–22
Budget
$ million | | | 2022–23
Projection
$ million | | | 2023–24
Projection
$ million | | | 2024–25
Projection
$ million | |
Taxation revenue | | | 14,585 | | | | 14,330 | | | | 15,907 | | | | 17,399 | | | | 17,397 | | | | 17,731 | | | | 18,608 | |
Sales of goods and services | | | 5,618 | | | | 5,975 | | | | 6,068 | | | | 6,062 | | | | 6,091 | | | | 6,365 | | | | 6,209 | |
Interest income | | | 2,076 | | | | 1,882 | | | | 1,901 | | | | 2,537 | | | | 2,591 | | | | 2,622 | | | | 2,702 | |
Grants revenue | | | | | | | | | | | | | | | | | | | | | | | | | | | | |
GST revenue | | | 12,761 | | | | 12,701 | | | | 14,809 | | | | 15,616 | | | | 16,399 | | | | 17,164 | | | | 18,016 | |
Other current grants2 | | | 13,039 | | | | 13,597 | | | | 13,875 | | | | 13,749 | | | | 14,529 | | | | 15,321 | | | | 15,513 | |
Capital grants | | | 1,841 | | | | 2,796 | | | | 2,899 | | | | 2,571 | | | | 2,585 | | | | 2,860 | | | | 2,826 | |
Dividend and income tax equivalent income | | | | | | | | | | | | | | | | | | | | | | | | | | | | |
Dividends | | | 1,180 | | | | 714 | | | | 499 | | | | 659 | | | | 637 | | | | 603 | | | | 594 | |
Income tax equivalent income | | | 748 | | | | 465 | | | | 416 | | | | 482 | | | | 435 | | | | 359 | | | | 343 | |
Other revenue | | | | | | | | | | | | | | | | | | | | | | | | | | | | |
Royalties and land rents | | | 4,686 | | | | 2,631 | | | | 2,667 | | | | 3,341 | | | | 3,743 | | | | 4,060 | | | | 4,229 | |
Other | | | 1,229 | | | | 1,157 | | | | 1,356 | | | | 1,248 | | | | 1,303 | | | | 1,323 | | | | 1,328 | |
Total revenue | | | 57,764 | | | | 56,249 | | | | 60,396 | | | | 63,664 | | | | 65,711 | | | | 68,408 | | | | 70,367 | |
Notes:
| 1. | Numbers may not add due to rounding. |
| 2. | Queensland Treasury estimates. Differs from Chapter 8 due to the inclusion of direct Australian Government payments to Queensland agencies for Australian Government own purpose expenditure. |
87
Budget Strategy and Outlook 2021-22
The major sources of total General Government Sector revenue in 2021–22 are grants revenue, which includes GST revenue and Australian Government Grants (50.2 per cent), and taxation revenue (27.3 per cent).
Chart 4.2 illustrates the expected composition of General Government Sector revenue in 2021–22.
| Chart 4.2 | Revenue by operating statement category, 2021–221 |
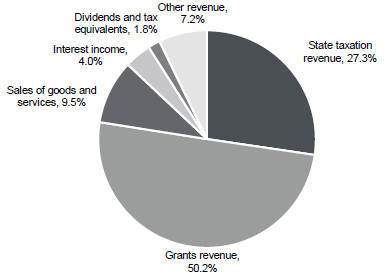
Notes:
| 1. | Numbers may not add up to 100 per cent due to rounding. |
| 2. | Chart prepared in line with Operating Statement categories. ‘Other revenue’ includes royalties and land rents, which comprise 5.2 per cent of total revenues. |
88
Budget Strategy and Outlook 2021-22
| Box 4.1 | Revenue revisions since before COVID-19 |
Despite the improving outlook for total revenue compared with the 2020–21 Budget, the pandemic has still had a significant impact on revenue in 2019–20 and 2020–21.
While conditions have improved substantially since mid-2020 and revenue is expected to rebound in 2021–22, revenue in total across the forward years is still expected to be lower than forecast at the 2019–20 MYFER, prior to the onset of COVID-19.
At the 2020–21 Budget, key revenues of taxation, GST and royalties were revised downwards by a total of $12.340 billion across the 4 years to 2022–23, compared to the 2019–20 MYFER. Despite the upward revisions to some key revenues in this Budget, key revenues over this period are still expected to be $2.399 billion lower than forecast at the 2019–20 MYFER.
Chart 4.3 outlines the aggregated downward revisions to key revenues of taxation, GST, and royalties, both at the time of the 2020–21 Budget and in the 2021–22 Budget, compared to the pre-COVID-19 revenue forecasts at the 2019–20 MYFER.
| Chart 4.3 | Change in key revenue1 forecasts compared to 2019–20 MYFER (i.e. pre-COVID-19 outlook) |
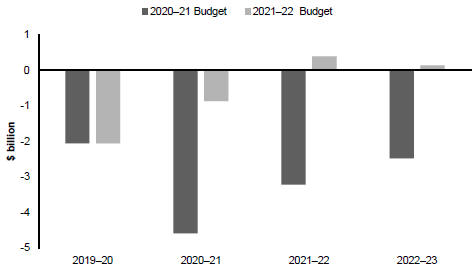
Note:
| | 1. | Aggregated revisions from taxation, GST, and royalty revenues since the 2019–20 MYFER. |
89
Budget Strategy and Outlook 2021-22
Chart 4.4 outlines the composition of estimated state taxation revenue for 2021–22, with the largest sources being payroll tax and transfer duty, together representing 52.2 per cent of the state’s total taxation revenue.
Payroll tax generally has a relatively stable base, with its growth usually driven by the underlying strength of the economy. Transfer duty can be variable, reflecting residential and non-residential market conditions. Land tax can also reflect variability in the property market but is generally more stable than most other tax lines due to the relatively stable base and the effect of assessments being based on 3-year averages of land values.
| Chart 4.4 | State taxation by tax category, 2021–221 |
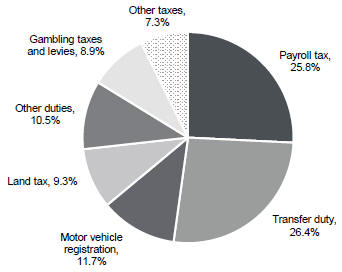
Note:
| 1. | Percentages may not add to 100 per cent due to rounding. ‘Other duties’ includes vehicle registration duty, insurance duty and other minor duties. ‘Other taxes’ includes the emergency management levy, waste disposal levy, guarantee fees and other minor taxes. |
Table 4.2 shows the main components of taxation revenue and the forecast revenues for each component across the forward estimates.
Total taxation revenue is forecast to grow 9.1 per cent in 2020–21. Improved taxation receipts in 2020–21 are primarily being driven by a rebound in transfer duty and stronger gambling tax collections. Transfer duty has been bolstered by a significant increase in the turnover of residential properties since COVID-19 related public health restrictions eased in mid 2020.
Solid growth in taxation revenue is expected in 2021–22, primarily driven by ongoing improvement in transfer duty and payroll tax amid the recovery in employment and business conditions.
90
Budget Strategy and Outlook 2021-22
Following the strong rebound in 2020–21, total taxation revenue is forecast to grow 9.4 per cent in 2021–22, followed by average growth of 2.3 per cent per annum across the subsequent 3 years.
| Table 4.2 | State taxation revenue1 |
| | | | | | | | | | | | | | | | | | | | | | | | |
| | | 2019–20
Actual
$ million | | | 2020–21
Est. Act
$ million | | | 2021–22
Budget
$ million | | | 2022–23
Projection
$ million | | | 2023–24
Projection
$ million | | | 2024–25
Projection
$ million | |
Payroll tax | | | 4,211 | | | | 4,192 | | | | 4,484 | | | | 4,741 | | | | 5,011 | | | | 5,263 | |
Duties | |
Transfer | | | 3,041 | | | | 3,693 | | | | 4,598 | | | | 4,100 | | | | 3,796 | | | | 4,040 | |
Vehicle registration | | | 533 | | | | 668 | | | | 663 | | | | 625 | | | | 644 | | | | 663 | |
Insurance2 | | | 1,016 | | | | 1,072 | | | | 1,136 | | | | 1,182 | | | | 1,241 | | | | 1,303 | |
Other duties3 | | | 34 | | | | 32 | | | | 32 | | | | 32 | | | | 33 | | | | 33 | |
Total duties | | | 4,624 | | | | 5,464 | | | | 6,428 | | | | 5,939 | | | | 5,713 | | | | 6,039 | |
Gambling taxes and levies | | | | | | | | | | | | | | | | | | | | | | | | |
Gaming machine tax | | | 617 | | | | 816 | | | | 795 | | | | 819 | | | | 843 | | | | 869 | |
Health services levy | | | 77 | | | | 122 | | | | 107 | | | | 109 | | | | 117 | | | | 127 | |
Lotteries taxes | | | 332 | | | | 351 | | | | 361 | | | | 372 | | | | 383 | | | | 395 | |
Wagering taxes | | | 118 | | | | 152 | | | | 155 | | | | 161 | | | | 167 | | | | 174 | |
Casino taxes and levies | | | 97 | | | | 103 | | | | 114 | | | | 124 | | | | 139 | | | | 143 | |
Keno tax | | | 17 | | | | 21 | | | | 21 | | | | 22 | | | | 22 | | | | 23 | |
Total gambling taxes and levies | | | 1,258 | | | | 1,565 | | | | 1,553 | | | | 1,606 | | | | 1,672 | | | | 1,730 | |
Other taxes | | | | | | | | | | | | | | | | | | | | | | | | |
Land tax | | | 1,406 | | | | 1,493 | | | | 1,617 | | | | 1,686 | | | | 1,802 | | | | 1,931 | |
Motor vehicle registration | | | 1,910 | | | | 1,987 | | | | 2,044 | | | | 2,103 | | | | 2,169 | | | | 2,242 | |
Emergency management levy | | | 562 | | | | 581 | | | | 605 | | | | 630 | | | | 657 | | | | 686 | |
Waste disposal levy | | | 295 | | | | 291 | | | | 317 | | | | 334 | | | | 341 | | | | 348 | |
Guarantee fees | | | 272 | | | | 289 | | | | 305 | | | | 311 | | | | 318 | | | | 319 | |
Other taxes4 | | | 46 | | | | 45 | | | | 46 | | | | 47 | | | | 49 | | | | 50 | |
Total taxation revenue | | | 14,585 | | | | 15,907 | | | | 17,399 | | | | 17,397 | | | | 17,731 | | | | 18,608 | |
Notes:
| 1. | Numbers may not add due to rounding. |
| 2. | Includes duty on accident insurance premiums. |
| 3. | Includes duty on life insurance premiums. |
| 4. | Includes the statutory insurance scheme levy and nominal defendant levy. |
91
Budget Strategy and Outlook 2021-22
Reflecting the substantial negative impacts of COVID-19 on employment and wages, payroll tax is estimated to be $4.192 billion in 2020–21, a 0.5 per cent decline compared with 2019–20.
This decline in payroll tax also reflects the fact that, as part of the Queensland Government’s Economic Recovery Plan, substantial payroll tax relief measures were implemented to support businesses in response to COVID-19. This included refunds, payment holidays and deferrals for eligible businesses, as well as a payroll tax exemption for JobKeeper payments.
Payroll tax collections have improved substantially with the rebound in labour market and business conditions in Queensland.
Further, payroll tax deferrals from 2020 are being paid in instalments across 2021, with the majority of deferred liabilities that were due in January and April 2021 having been paid. This suggests businesses generally have managed their cash flows throughout the recovery phase of the COVID-19 crisis to enable them to meet their deferred tax obligations.
Payroll tax is expected to grow by 7.0 per cent in 2021–22, reflecting a strong recovery in employment and wage conditions, and expected increased revenue resulting from additional Office of State Revenue compliance activities. Annual average growth of 5.5 per cent is expected in payroll tax revenues from 2022–23 onwards, broadly in line with expected employment and wage growth over the forward years.
The 50 per cent payroll tax rebate for apprentices and trainees will be extended for 12 months until 30 June 2022. In addition to apprentice and trainee wages generally being exempt from payroll tax, this rebate will provide additional support to employment in the ongoing recovery from COVID-19, in particular youth employment and businesses who employ trainees and apprentices.
Box 4.2 Queensland’s competitive payroll tax system
Queensland has very competitive payroll tax settings. Its $1.3 million threshold is one of the highest exemption thresholds of all states and territories, and the standard rate of 4.75 per cent is the lowest of any mainland state.
Several major payroll tax reforms were introduced in 2019–20 to make Queensland an even more attractive destination for businesses, especially in the regions. This included:
| • | | increasing the payroll tax threshold from $1.1 million to $1.3 million, while retaining the current $1 in $4 rate of reduction so that a deduction will be available if total annual Australian taxable wages are less than $6.5 million |
| • | | providing a one per cent discount of the payroll tax rate to employers that have an ABN registered business address and at least 85 per cent of their taxable wages paid to employees located outside South East Queensland. |
92
Budget Strategy and Outlook 2021-22
These reforms were partially funded by an increase of the payroll tax rate for employers (or groups of employers) with taxable wages above $6.5 million from 4.75 per cent to 4.95 per cent, implemented in the 2019–20 Budget.
In addition, as part of the Queensland Government’s Economic Recovery Plan, a number of payroll tax relief measures were implemented to support businesses in response to COVID-19. This included refunds, payment holidays and deferrals for eligible businesses, as well as a payroll tax exemption for JobKeeper payments.
| Chart 4.5 | Comparison of the lowest fixed1 payroll tax rates across Australian mainland states |
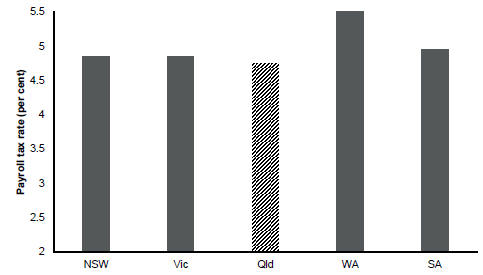
Note:
| 1. | The lowest fixed rate applying to employers in non-regional areas. |
Sources: Australian state government websites.
Transfer duty
Transfer duty is charged at various rates on ‘dutiable transactions’, including transfers of land in Queensland or Queensland business assets.
The Queensland Government offers extensive concessions for the transfer of land where the property is purchased as a home. This means eligible home buyers pay a one per cent concessional rate on the first $350,000 of dutiable value, rather than the normal scheduled rates of between 1.5 per cent and 3.5 per cent.
93
Budget Strategy and Outlook 2021-22
If a first home buyer purchases a property up to $500,000 they will pay no duty, with reduced rates available up to $550,000.
Transfer duty is estimated to be 21.4 per cent higher in 2020–21 compared with 2019–20. This reflects the strong activity in the residential housing sector since mid-2020, with transactions across all components (investor, home, first home) showing significant growth.
Transfer duty is expected to grow by 24.5 per cent in 2021–22, supported by continued strength in residential housing transactions, a further acceleration in property price growth and a shift in the composition of transactions.
As discussed in detail in Chapter 2, the prevailing strength of the housing market has seen new housing loan commitments in Queensland rise to their highest level on record (since July 2002), with record low mortgage rates (and expectations they will stay low for an extended period), various government wage and housing support measures, and temporarily reduced alternative options for household expenditure, including overseas travel.
These factors, combined with expectations that property prices will continue to increase throughout 2021, have also supported investor loan approvals, which have driven recent growth in loan commitments. As a result, a compositional shift towards investor-driven purchases, which are subject to a higher rate of duty, is also expected to support the strength in residential collections.
As shown below in Chart 4.6, residential transactions have grown strongly since the peak of the emergency health restrictions required to control the initial spread of COVID-19 in April 2020.
94
Budget Strategy and Outlook 2021-22
| Chart 4.6 | Residential property transactions by concession type |
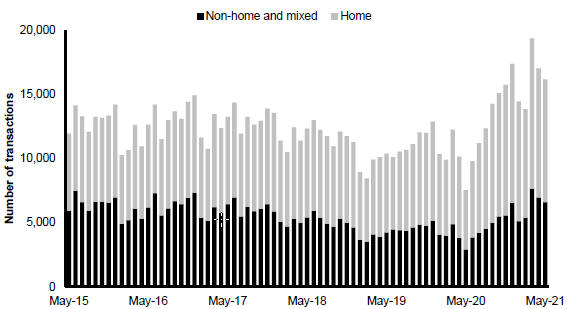
Notes:
| 1. | Home includes transactions subject to the home, first home and first home (vacant land) concessions. Non-home and mixed includes standard transactions (no concession) and mixed/other concessions. |
The current strength of housing activity is expected to moderate in 2022–23 and 2023–24 as dwelling investment eases, resulting in a decline in duty collections from residential sales.
However, the non-residential sector is forecast to recover over time and the outlook for large transactions will partially offset the expected decline in transfer duty from residential transactions across 2022–23 and 2023–24, and support an increase in transfer duty revenue in 2024–25.
95
Budget Strategy and Outlook 2021-22
| Box 4.3 | Generous transfer duty concessions |
Queensland has one of the lowest tax burdens on home buyers, with generous concessions for first home buyers and the principal place of residence meaning Queenslanders pay less than similar buyers in most other jurisdictions.
Based on CoreLogic’s national home value index for May 2021, purchasers of a principal place of residence in Queensland would pay significantly lower duty than their interstate counterparts at the median dwelling price in each capital city.
New South Wales purchasers of median priced homes would pay $27,296 more than Queenslanders, Victorian purchasers would be $27,797 worse off and Western Australian buyers would pay $7,089 more in transfer duty.
Even with their temporary reductions in transfer duty of up to 50 per cent, Victorian buyers are still paying more transfer duty than Queenslanders.
Combined with the lower purchase prices, buyers in Queensland pay around 2 per cent of their median price in duty, compared with 4 per cent in New South Wales and 5.3 per cent at the standard rates in Victoria.
Chart 4.7 illustrates the transfer duties payable in each jurisdiction for a principal place of residence at the relevant local median house value in the capital city of each jurisdiction.
| Chart 4.7 | Transfer duty comparisons at median dwelling price |
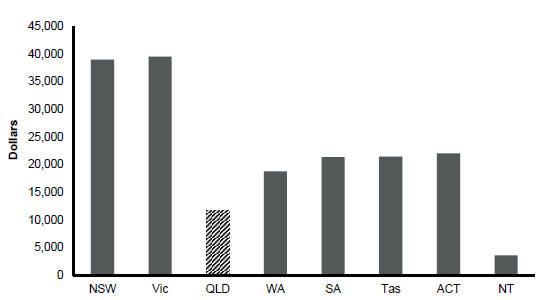
Sources: Revenue Office websites of relevant jurisdictions.
96
Budget Strategy and Outlook 2021-22
Vehicle registration duty
Vehicle registration duty is charged on the dutiable value of a motor vehicle, on the transfer or initial registration of the vehicle, at a rate that depends on the vehicle’s engine size and value.
After more than 2 years of consecutive monthly declines in vehicle sales, activity has recovered solidly since July 2020, in line with the broader recovery in consumption activity, and with volumes to May 2021 significantly higher than during the same period in 2020.
This strength is flowing through to duty collections, with revenue from vehicle registration duty expected to grow by 25.2 per cent in 2020–21. Duty is expected to moderate in 2021–22 and 2022–23, reflecting a return to a more normal level of vehicle transactions as the impact of COVID-19 stimulus measures and the expenditure-switching that arose from overseas travel restrictions abates. Vehicle registration duty is forecast to grow by 3 per cent in both 2023–24 and 2024–25.
| 4.2.3 | Gambling taxes and levies |
A range of gambling activities are subject to state taxes and levies.
There has been significant strength in gambling taxes since the re-opening of gaming and entertainment venues in mid-2020, supporting a strong rebound in gaming activity.
Total gambling tax and levy collections are expected to grow strongly in 2020–21. This partly reflects the reduced impact of venue closures in 2020–21 compared with the longer period of closures experienced in 2019–20, as well as the strength of activity as venues re-opened and emergency health restrictions were eased.
Total gambling tax and levy collections are expected to decline by 0.7 per cent in 2021–22. This largely reflects the impact of revenue from gaming machine tax and the health services levy returning to more normal levels in line with that expected prior to COVID-19. However, the decline was partially offset by ongoing growth in lotteries tax and wagering tax which were largely unaffected by COVID-19. Average annual growth of 3.7 per cent is forecast for gambling tax revenue over the 3 years to 2024–25.
Land tax is levied on the taxable value of the landowner’s aggregated holdings of freehold land owned in Queensland, as at midnight on 30 June each year. The landowner’s home is exempt.
Resident individuals are generally liable for land tax if the total taxable value of the freehold land owned by that person as at 30 June is equal to or greater than $600,000. Companies, trustees and absentees are liable for land tax if the total taxable value of the freehold land owned as at 30 June is equal to or greater than $350,000.
The Queensland Government provided substantial land tax relief measures across 2019–20 and 2020–21 to eligible property owners affected by the COVID-19 outbreak, including rebates, waivers and deferrals.
97
Budget Strategy and Outlook 2021-22
Land tax is expected to grow by 6.2 per cent in 2020–21 and 8.3 per cent in 2021–22, partly reflecting the expiry of the temporary relief measures. Land tax is forecast to grow by an average annual 6.1 per cent across the 3 years to 2024–25, primarily driven by the lagged impact of the solid land value growth expected in line with the current strength of the residential property market.
The waste disposal levy commenced on 1 July 2019 and applies to 39 local government areas, covering more than 90 per cent of the state’s waste generation and population. The levy is paid by landfill operators on wastes disposed to landfill. Exemptions from the levy exist for particular wastes, such as waste from declared disasters, waste donations to charitable recyclers, clean earth and lawfully managed and transported asbestos.
The levy commenced at $75 per tonne for general waste and is regulated to increase by $5 per tonne per annum for the first 3 years. The first annual increase of $5 per tonne was deferred by 6 months to 1 January 2021 to provide financial relief from the impacts of COVID-19. Seventy per cent of proceeds from the waste levy will be used for resource recovery and other programs that reduce the impact of waste and protect the environment and local communities.
Revenue from the waste disposal levy is estimated to be $291 million in 2020–21. Revenue is forecast to grow by 8.9 per cent in 2021–22 and 5.3 per cent in 2022–23, reflecting expected growth in waste disposal as well as regulated levy rate increases.
Revenue from the waste disposal levy is then forecast to grow by 2.2 per cent in 2023–24 and 2.1 per cent in 2024–25. This moderation in growth partially reflects anticipated behavioural changes in the amount of waste disposed to landfill.
| 4.2.6 | Queensland’s competitive tax status |
Taxation can impact on business decisions regarding investment and employment, as well as household investment and home ownership decisions. Therefore, maintaining the competitiveness of Queensland’s tax system is critical to provide a competitive advantage to business and to moderate the tax burden on citizens.
As such, maintaining a competitive tax regime is fundamental to the Queensland Government’s economic strategy and its commitment to job creation and supporting sustainable economic growth.
Importantly, as Chart 4.8 shows, taxation per capita in Queensland was lower in 2019–20 than the average taxation per capita in the other states and territories, highlighting the ongoing competitiveness of Queensland’s taxation regime.
Based on the latest available outcomes, Queensland’s taxation per capita in 2019–20 was $771 less than the average of other jurisdictions. On average, Queenslanders paid $1,078 less tax than New South Wales residents and $761 less than Victorian residents.
98
Budget Strategy and Outlook 2021-22
| Chart 4.8 | Taxation per capita, 2019–20 |
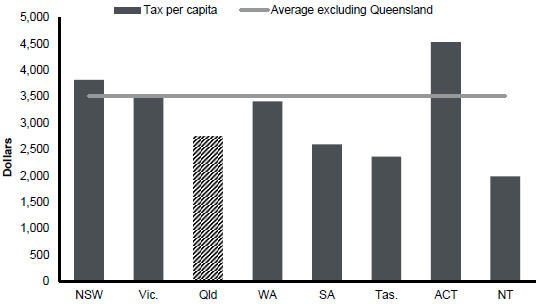
Sources: ABS Government Finance Statistics and ABS National, State and Territory Population.
Other measures of tax competitiveness include estimates by the Commonwealth Grants Commission (CGC) of Queensland’s tax effort compared with other jurisdictions, and each state’s tax revenue as a proportion of the size of the state’s economy.
The CGC’s revenue raising effort ratios are an indicator of the extent to which governments burden their revenue bases, with a lower ratio indicating a relatively lower taxation burden imposed by state taxes.
The CGC’s 2021 Update assessed that Queensland’s tax effort in 2019–20 (latest available CGC estimate, based on 2019–20 data and using total tax revenue effort for assessed taxes, that is, payroll tax, transfer duty, land tax, insurance duty and motor vehicle taxes) was 6.3 per cent below the national average.
In terms of the third measure of tax competitiveness (that is, taxation as a share of GSP), this measure also confirms that Queensland’s taxes are highly competitive, being below the average of the other states and significantly lower than the major southern states.
Table 4.3 summarises the estimates of these 3 measures compared with other jurisdictions and demonstrates that the Queensland tax system remains amongst the most competitive in Australia.
99
Budget Strategy and Outlook 2021-22
| Table 4.3 | Tax competitiveness, 2019–20 |
| | | | | | | | | | | | | | | | | | | | | | | | | | | | | | | | | | | | |
| | | NSW | | | VIC | | | Qld | | | WA | | | SA | | | TAS | | | ACT5 | | | NT | | | Avg6 | |
Taxation per capita1 ($) | | | 3,821 | | | | 3,504 | | | | 2,743 | | | | 3,414 | | | | 2,597 | | | | 2,361 | | | | 4,539 | | | | 1,990 | | | | 3,514 | |
Taxation effort2 (%) | | | 102.1 | | | | 99.7 | | | | 93.7 | | | | 102.5 | | | | 97.5 | | | | 82.9 | | | | 157.6 | | | | 74.9 | | | | 100.0 | |
Taxation % of GSP3,4 (%) | | | 4.9 | | | | 5.0 | | | | 3.9 | | | | 2.9 | | | | 4.1 | | | | 3.9 | | | | 4.7 | | | | 1.9 | | | | 4.4 | |
Notes:
| 1. | 2019–20 data (latest available actuals). Sources: ABS Government Finance Statistics and ABS National, State and Territory Population. |
| 2. | 2019–20 data (latest available). Source: Commonwealth Grants Commission 2021 Update—total tax revenue effort for assessed taxes (payroll, transfer duty, land tax, insurance duty and motor vehicle taxes). Revenue raising effort ratios are an indicator of the extent to which governments burden their revenue bases. |
| 3. | 2019–20 data (latest available). Sources: ABS Annual State Accounts and ABS Government Finance Statistics |
| 4. | ABS Annual State Accounts are used to enable comparison with other jurisdictions. As a result, the estimate for Queensland will differ to that presented in Table D2, which is based on the Queensland State Accounts. |
| 5. | Figures include municipal rates. |
| 6. | Weighted average of states and territories, excluding Queensland (aside from taxation effort, which is the average of all states). |
Tax expenditures are reductions in tax revenue that result from the use of the tax system as a policy tool to deliver government policy objectives. Tax expenditures are provided through a range of concessions, including tax exemptions, reduced tax rates, tax rebates, tax deductions and provisions which defer payment of a tax liability to a future period.
The substantial tax relief provided by the Queensland Government to Queensland businesses and property owners in response to the COVID-19 crisis are significant tax expenditures in both 2019–20 and 2020–21.
The Tax Expenditure Statement (Appendix B) provides details of tax expenditure arrangements currently provided by the Queensland Government.
Grants revenue is comprised of Australian Government grants (including GST), grants from the community and industry, and other miscellaneous grants.
A 1.1 per cent increase in total grants revenue is forecast for 2021–22, primarily driven by increases in GST revenue but partially offset by decreases in Australian Government capital grants.
100
Budget Strategy and Outlook 2021-22
| Table 4.4 | Grants revenue1,2 |
| | | | | | | | | | | | | | | | | | | | | | | | |
| | | 2019–20
Actual
$ million | | | 2020–21
Est. Act
$ million | | | 2021–22
Budget
$ million | | | 2022–23
Projection
$ million | | | 2023–24
Projection
$ million | | | 2024–25
Projection
$ million | |
Current grants | | | | | | | | | | | | | | | | | | | | | | | | |
GST revenue grants3 | | | 12,761 | | | | 14,809 | | | | 15,616 | | | | 16,399 | | | | 17,164 | | | | 18,016 | |
Other Australian Government grants4 | | | 12,726 | | | | 13,556 | | | | 13,453 | | | | 14,231 | | | | 14,981 | | | | 15,209 | |
Other grants and contributions | | | 313 | | | | 318 | | | | 296 | | | | 298 | | | | 339 | | | | 304 | |
Total current grants | | | 25,800 | | | | 28,684 | | | | 29,364 | | | | 30,928 | | | | 32,484 | | | | 33,528 | |
Capital grants | | | | | | | | | | | | | | | | | | | | | | | | |
Australian Government grants | | | 1,805 | | | | 2,865 | | | | 2,538 | | | | 2,546 | | | | 2,840 | | | | 2,791 | |
Other grants and contributions | | | 37 | | | | 33 | | | | 33 | | | | 40 | | | | 20 | | | | 35 | |
Total capital grants | | | 1,841 | | | | 2,899 | | | | 2,571 | | | | 2,585 | | | | 2,860 | | | | 2,826 | |
Total Australian Government payments | | | 27,292 | | | | 31,230 | | | | 31,607 | | | | 33,176 | | | | 34,985 | | | | 36,016 | |
Total grants revenue | | | 27,641 | | | | 31,582 | | | | 31,935 | | | | 33,513 | | | | 35,344 | | | | 36,354 | |
Note:
| 1. | Numbers may not add due to rounding. |
| 2. | Amounts in this table may differ to those outlined in Chapter 10 due to different classification treatments. |
|
3. Includes entitlements to payments associated with the ‘no worse off’ guarantee as part of the Australian |
4. Queensland Treasury estimates. Differs from Chapter 8 due to the inclusion of direct Australian |
Improvements in the national GST pool, along with an increase in the state’s share of the pool, have been the key drivers of stronger forecasts for Queensland’s GST revenue.
Following an 11 per cent decline in 2019–20, GST revenue is estimated to rebound 16 per cent in 2020–21, boosted by stronger than expected national household spending and dwelling investment, as well as better than expected recovery of outstanding GST debt.
Queensland’s GST revenue is expected to grow 5.4 per cent in 2021–22 compared with 2020–21.
This increase in GST revenue is primarily due to:
| • | | the Australian Government forecasting 4 per cent growth in GST for 2021–22, with receipts consolidating at an elevated level following a 15.8 per cent rebound in 2020–21 |
| • | | the Commonwealth Grants Commission recommending to the Australian Government that Queensland should receive a larger share of GST. |
101
Budget Strategy and Outlook 2021-22
Average annual growth in GST revenue of 4.9 per cent is forecast across the 3 years ending 2024–25, in line with forecast growth in the national pool and reflecting solid increases in taxable consumption nationally.
Revisions to the GST pool
The Australian Government’s national GST pool forecast was upgraded in the 2021–22 Federal Budget, to be $26 billion higher across the 4 years to 2023–24 compared with 2020–21 Federal Budget estimates.
For 2020–21, this reflected robust household consumption and dwelling investment as well as better than expected recovery of outstanding GST debt.
From 2021–22 onwards, the Australian Government’s improved outlook for the national economy, particularly taxable consumption, is expected to drive higher than previously expected GST receipts.
Chart 4.9 compares GST revenue pool forecasts published in the 2020–21 and 2021–22 federal budgets.
| Chart 4.9 | Australian Government forecast of national GST revenue pool |
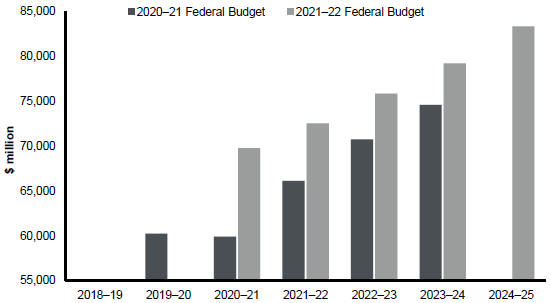
Sources: 2020–21 Federal Budget and 2021–22 Federal Budget
102
Budget Strategy and Outlook 2021-22
GST – Queensland’s assessed fiscal capacity
In early-2021, the Australian Government accepted the CGC’s recommendation that Queensland requires a larger share of GST revenue in 2021–22 compared to 2020–21. The CGC’s recommendation was driven by a range of factors, including the following:
| • | | below average growth in the value of property sales and higher growth in national land tax revenue increased Queensland’s assessed needs |
| • | | an increase in mining royalties for Western Australia led to a reduction in Queensland’s relative capacity to generate mining revenue |
| • | | these changes were partly offset by revisions to state natural disaster relief expenses and above average growth in Australian Government payments. |
| 4.3.2 | Australian Government payments |
Australian Government payments to Queensland in 2021–22 are expected to total $31.607 billion, representing an increase of $376 million (1.2 per cent) compared to payments in 2020–21. This increase is driven by an $807 million (5.4 per cent) increase in GST revenue but is partially offset by a $327 million (11.4 per cent) decrease in other Australian Government capital grants.
Chapter 8 provides a detailed overview of federal-state financial arrangements, including further discussion of matters related to Queensland’s share of GST revenue and other Australian Government payments to Queensland.
| 4.3.3 | Other grants and contributions |
Other grants and contributions are funds received from other state and local government agencies, other bodies and individuals.
The main sources of contributions are those received from private enterprise and community groups to fund research projects and community services and contributed assets and goods and services received for a nominal amount. Contributions exclude Australian Government grants and user charges.
Other grants and contributions comprise only a small share of total grant revenue (one per cent in 2021–22). Given the nature of these revenues, total revenue from other grants and contributions is expected to be volatile across the forecast period.
103
Budget Strategy and Outlook 2021-22
The state earns royalties from the extraction of coal, base and precious metals, bauxite, petroleum and gas, mineral sands and other minerals. Royalties ensure some of the proceeds of the extraction of non-renewable resources are returned to the community. Land rents are also earned from pastoral holdings, and mining and petroleum leases.
There is a high degree of uncertainty associated with estimates of commodity prices, which can have significant impacts on royalty revenue. Risks to coal export volumes also have the potential to impact royalty estimates, although changes to export volumes may in turn impact prices. Specific risk factors are considered in developing forecasts and include the level of exposure of mining operations to the risk of natural disasters and the timing of scheduled maintenance for the rail network and ports.
The Revenue and Expense Assumptions and Sensitivity Analysis (Appendix C) outlines key parameter assumptions, and the sensitivity of coal royalty estimates to individual changes in price, volume and exchange rate parameters.
The COVID-19 pandemic saw an unprecedented downgrade to the outlook for global economic growth in a short period of time. It also resulted in reduced demand and substantially lower prices for key commodities, including coal and oil, to which LNG prices are linked. The impacts on expected royalties and land rents are detailed in Table 4.5.
Table 4.5 Royalties and land rents1
| | | | | | | | | | | | | | | | | | | | | | | | |
| | | 2019–20
Actual
$ million | | | 2020–21
Est. Act
$ million | | | 2021–22
Budget
$ million | | | 2022–23
Projection
$ million | | | 2023–24
Projection
$ million | | | 2024–25
Projection
$ million | |
Coal | | | 3,517 | | | | 1,745 | | | | 2,048 | | | | 2,550 | | | | 2,778 | | | | 2,943 | |
Petroleum2 | | | 466 | | | | 298 | | | | 632 | | | | 551 | | | | 618 | | | | 625 | |
Other royalties3 | | | 549 | | | | 479 | | | | 487 | | | | 466 | | | | 485 | | | | 480 | |
Land rents | | | 154 | | | | 146 | | | | 174 | | | | 177 | | | | 179 | | | | 182 | |
Total royalties and land rents | | | 4,686 | | | | 2,667 | | | | 3,341 | | | | 3,743 | | | | 4,060 | | | | 4,229 | |
Notes:
| 1. | Numbers may not add due to rounding. |
| 2. | Includes liquefied natural gas (LNG). |
| 3. | Includes base and precious metal and other mineral royalties. |
104
Budget Strategy and Outlook 2021-22
Royalty revenues are estimated to fall 44.4 per cent in 2020–21, largely due to lower coal and oil prices and a moderation in coal export volumes. However, royalty revenue is forecast to partially rebound (by 25.6 per cent) in 2021–22, reflecting the expected improvement in global economic activity, as well as the impact of the new volume based petroleum royalty model, before easing to more moderate growth in subsequent years.
While total royalties are expected to improve over the forecast period, coal export volumes are likely to be lower than previously expected amid ongoing Chinese import restrictions. Royalties are also expected to be negatively impacted by the higher Australian dollar.
A large proportion of Queensland’s royalties and land rents comes from coal mining and the majority of this revenue is attributable to the hard coking coal used in global steel production.
The lower level of total royalties collected from thermal coal mining reflects the smaller volume of this type of coal mined in Queensland, the lower values per tonne of thermal coal and the 3-tiered coal royalty rate system, where lower value coal is subject to a lower average royalty rate.
Coal royalties are expected to total $1.745 billion in 2020–21, 50.4 per cent lower than in 2019–20 but 6.2 per cent higher than forecast at the 2020–21 Budget. The decline was driven by significant falls in both prices and volumes of Queensland coal exports. On a year-average basis, the premium hard coking coal price is estimated to decrease by 23.3 per cent in 2020–21, to US$116 per tonne, while crown1 export coal tonnages are expected to be around 9.9 per cent lower.
The fall in coal prices and volumes reflects weaker global economic growth, which was exacerbated significantly by the COVID-19 pandemic. Import restrictions from China have also weighed on Australian seaborne coking coal prices, while the impact on volumes will depend on how long the restrictions remain in place and how much supply will be taken up by other countries.
Coal royalty revenue is forecast to rebound in 2021–22, (growing by 17.4 per cent compared to 2020–21), largely reflecting a 11.7 per cent increase in hard coking coal prices (to US$130 per tonne). However, the extent of this rebound in coal royalties and the subsequent outlook continues to be subdued and subject to substantial uncertainty given the ongoing concerns about China’s restrictions on importing Australian coal.
Revenue is forecast to grow by 24.5 per cent in 2022–23, with crown export coal tonnages forecast to rebound by 10.8 per cent and coal prices expected to gradually improve. This largely reflects the continued recovery in global economic activity from the COVID-19 pandemic and the return of demand from China post 2021–22, albeit at subdued levels.
| 1 | Excludes coal where royalties are not paid to the Queensland Government, that is, private royalties. This will not align with Chapter 2 nor Chart 4.10, both of which include private royalties. |
105
Budget Strategy and Outlook 2021-22
Queensland’s export earnings are expected to improve as the global economy continues to recover from the COVID-19 pandemic, increasing demand and prices for Queensland’s coal exports. As a result, prices are expected to move back towards a longer-term price of around US$145/t and growth in export tonnages is forecast to moderate to 5.9 per cent in 2023–24 and 4.7 per cent in 2024–25.
Coal royalty revenue is forecast to grow by 9 per cent in 2023–24, and 5.9 per cent in 2024–25 as both coal export prices and volumes recover.
Despite the recovery, Queensland’s coal exports are expected to remain below 2019–20 levels until 2023–24 and coal royalties remain well below the level they reached in 2019–20. Chart 4.10 shows total coal export forecasts compared to the 2020–21 Budget outlook.
| Chart 4.10 | Export coal tonnages1 |
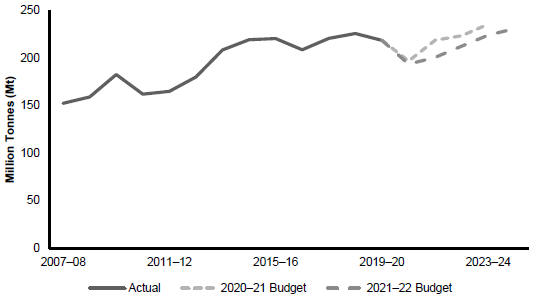
Note:
| 1. | Includes coal exports where royalties are not paid to the government, i.e. private royalties. This will not align with tonnages presented in Appendix C which exclude private royalties. |
Source: Unpublished ABS trade data and Queensland Treasury
Chart 4.11 shows coking coal price forecasts compared to the 2020–21 Budget outlook and average quarterly price forecasts from the latest Consensus Economics forecasts. This shows that the hard coking coal price forecasts underpinning the economic and revenue outlook are broadly similar to the latest Consensus Economics forecasts.
106
Budget Strategy and Outlook 2021-22
Chart 4.11 Coking coal price forecasts by iteration
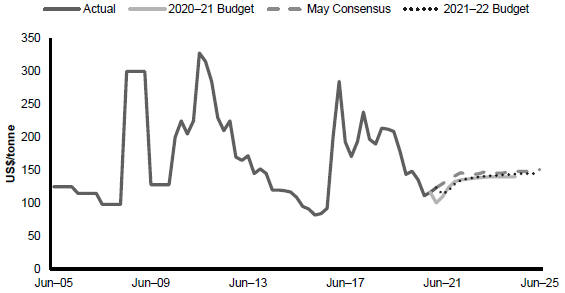
Sources: Consensus Economics and Queensland Treasury.
An ongoing risk to coal export volumes over the medium to longer term is that Japan and South Korea have committed to achieving net zero CO2 emissions by between 2050 while China has committed to achieve this by 2060. This may lead to an earlier reduction in thermal coal consumption in these countries than previously expected. In addition, South East Asia is generally moving away from coal fired power due to limited finances to fund coal fired power projects.
4.4.2 Petroleum royalties
Compared to coal, petroleum royalties make up a smaller share of total royalties, though petroleum royalties have grown strongly as the export industry matured.
Oil prices factor strongly into petroleum royalty forecasts. Most of the LNG produced in Queensland is sold under long-term contracts linked to oil prices, while the production level of the 3 major LNG plants is expected to be relatively stable across the forward estimates.
In 2020–21, revenue from petroleum and gas royalties are estimated to total $298 million, 36.1 per cent lower than 2019–20 and 3.1 per cent lower than forecast at the 2020–21 Budget.
While LNG export volumes were largely unaffected by the COVID-19 crisis, the pandemic led to a sharp fall in global oil prices. This materially impacted LNG values in 2020–21 and, therefore, led to a reduction in petroleum and gas royalties.
107
Budget Strategy and Outlook 2021-22
Production cuts by global oil producers have seen oil prices rise to above US$70/barrel, which should see the price (and value) of Queensland’s LNG exports rebound throughout 2021. As a result, petroleum royalties are expected to rebound in 2021–22, growing by 112 per cent. This also reflects 2021–22 being the first full year under the new volume-based royalty model, which replaced the previous wellhead model in October 2020.
Major oil producers are expected to increase global oil supply throughout 2021, which is expected to put downward pressure on oil prices. As a result, petroleum royalties are forecast to decline by 12.8 per cent in 2022–23.
Following this, oil prices are expected to gradually return to US$60/barrel by June 2023 as demand continues to recover. As a result, petroleum royalties are forecast to grow by 12.2 per cent in 2023–24, and then 1.2 per cent in 2024–25.
Other royalties include revenue from metals mined in Queensland such as copper, lead and zinc, and other minerals including bauxite.
Revenue from other royalties is estimated to total $479 million in 2020–21, 12.8 per cent lower than 2019–20. This reduction reflects collections returning to normal levels following additional compliance activities undertaken in 2019–20. This was partially offset by reassessment activities undertaken in late 2020 which increased revenue across metal and mineral royalty lines.
Revenue from other royalties is expected to be volatile over the forecast period, growing by 1.8 per cent in 2021–22, declining 4.4 per cent in 2022–23, growing 4 per cent in 2023–24, and declining 1.1 per cent in 2024–25. This volatility largely reflects differences in the expected production profiles across minerals and the extent to which some miners are eligible for the mineral processing discount.
Revenue from land rents derived from mining and petroleum leases and pastoral holdings are estimated to total $146 million in 2020–21, a decline of 5.2 per cent compared with 2019–20. This decline is primarily driven by the write down in revenue from rents during the COVID-19 crisis due to the government’s relief measures.
Revenue from land rents are expected to rebound in 2021–22 and grow by 19.5 per cent, driven by the expected recovery in the economy, as well as a tapering of drought relief rental deferrals due to improved La Niña related weather conditions.
Revenue from land rents are then expected to grow by 1.4 per cent per annum over the 3 years ending 2024–25.
108
Budget Strategy and Outlook 2021-22
| 4.5 | Sales of goods and services |
Sales of goods and services revenue comprises the cost recovery from the Queensland Government providing goods or services. Table 4.6 provides a breakdown of the categories of goods and services captured in terms of these revenues.
Table 4.6 Sales of goods and services1
| | | | | | | | | | | | | | | | | | | | | | | | |
| | | 2019–20
Actual
$ million | | | 2020–21
Est. Act.
$ million | | | 2021–22
Budget
$ million | | | 2022–23
Projection
$ million | | | 2023–24
Projection
$ million | | | 2024–25
Projection
$ million | |
Fee for service activities | | | 2,215 | | | | 2,532 | | | | 2,648 | | | | 2,530 | | | | 2,594 | | | | 2,523 | |
Public transport: | | | | | | | | | | | | | | | | | | | | | | | | |
South East Queensland | | | 289 | | | | 221 | | | | 346 | | | | 376 | | | | 414 | | | | 414 | |
Rent revenue | | | 583 | | | | 511 | | | | 554 | | | | 574 | | | | 596 | | | | 607 | |
Sale of land inventory | | | 34 | | | | 61 | | | | 82 | | | | 112 | | | | 63 | | | | 51 | |
Hospital fees | | | 689 | | | | 879 | | | | 894 | | | | 904 | | | | 913 | | | | 923 | |
Transport and traffic fees | | | 471 | | | | 486 | | | | 510 | | | | 529 | | | | 543 | | | | 560 | |
Other sales of goods and services | | | 1,338 | | | | 1,378 | | | | 1,028 | | | | 1,066 | | | | 1,242 | | | | 1,130 | |
Total | | | 5,618 | | | | 6,068 | | | | 6,062 | | | | 6,091 | | | | 6,365 | | | | 6,209 | |
Note:
| 1. | Numbers may not add due to rounding. |
The government provides concessions in the form of discounts, rebates and subsidies to improve access to and the affordability of a range of services for individuals or families, based on eligibility criteria relating to factors such as age, income and special needs or disadvantage. The Concessions Statement (Appendix A) provides details of the concession arrangements provided by the Queensland Government.
| 4.5.1 | Fee for service activities |
Examples of major items of fee for service activities across the General Government Sector include:
| • | | recoverable works carried out by the Department of Transport and Main Roads and the commercialised arm of the department |
| • | | fees charged by Technical and Further Education (TAFE) colleges |
| • | | fees charged by CITEC to commercial clients for information brokerage services. |
109
Budget Strategy and Outlook 2021-22
| 4.5.2 | Other sales of goods and services |
As shown above in Table 4.6, revenue is also raised from a variety of other types of sales of goods and services. These include revenue from public transport ticketing arrangements, rent or lease of government property, hospital fees, transport and traffic fees, title registration fees and other licences and permits.
Interest income primarily comprises interest earned on investments, including those held to support debt, superannuation and insurance liabilities.
Interest income is estimated to account for 4 per cent of total General Government Sector revenue in 2021–22.
Interest income is forecast to increase across the forward estimates, benefiting from increases in investments being made as part of the Queensland Future Fund (QFF) – Debt Retirement Fund (DRF) initiative and other funds (this is discussed in more detail in Chapters 3 and 6).
| 4.7 | Dividend and income tax equivalent income |
Dividend and income tax equivalent income accounts for 1.8 per cent of total General Government Sector revenue in 2021–22.
Revenue from dividend and income tax equivalent income is estimated to total $916 million in 2020–21, $1.013 billion (52.5 per cent) lower than in 2019–20, and $264 million (22.4 per cent) lower than expected at the 2020–21 Budget. These movements are primarily due to decreases in earnings from the electricity generation sector, driven by lower wholesale electricity prices.
Dividend and income tax equivalent incomes are forecast to increase by 24.7 per cent in 2021–22, but then forecast to decline by 6.1 per cent in 2022–23, 10.2 per cent in 2023–24 and 2.6 per cent in 2024–25. The declines in dividend and income tax equivalent incomes from 2022–23 primarily reflect lower forecast profits in the electricity generation sector, with the entry of renewables boosting supply into the grid and keeping downward pressure on wholesale electricity prices.
Trends in dividends and income tax equivalent income are discussed in more detail in Chapter 10.
110
Budget Strategy and Outlook 2021-22
Other revenue, including royalty revenue, accounts for 7.2 per cent of total General Government Sector revenue in 2021–22 (see Table 4.7). Royalties and land rents account for 5.2 per cent of revenue in 2021–22 and are discussed in detail in Section 4.4.
The major fines and infringements included in this category are primarily issued by the Queensland Police Service and include fixed and mobile camera offences, speeding and tolling offences.
Revenue from fines and forfeitures is estimated to grow by 5.3 per cent in 2020–21, following a decline of 11.3 per cent in 2019–20. This rebound is partially due to full year operation of mobile cameras compared to 2019–20, when operations were shut down or reduced over a number of months. The lower base in 2019–20 also likely reflects less traffic on the roads in the last quarter due to COVID-19, delays in the introduction of new cameras and the infringement rate being less than anticipated.
Revenue from fines and forfeitures is forecast to grow by 39.3 per cent in 2021–22, partly driven by the introduction of new cameras that detect use of mobile phones and if seat belts are being worn. Revenue is forecast to grow by 7.9 per cent in 2022–23, driven by the planned rollout of additional cameras, and then remain stable in 2023–24 and 2024–25, growing by 2.5 per cent and 0.2 per cent, respectively.
Revenue not elsewhere classified includes assets contributed to the state and payments received for works delivered on behalf of government-owned corporations.
Table 4.7 Other revenue1
| | | | | | | | | | | | | | | | | | | | | | | | |
| | | 2019–20
Actual
$ million | | | 2020–21
Est. Act.
$ million | | | 2021–22
Budget
$ million | | | 2022–23
Projection
$ million | | | 2023–24
Projection
$ million | | | 2024–25
Projection
$ million | |
Royalties and land rents | | | 4,686 | | | | 2,667 | | | | 3,341 | | | | 3,743 | | | | 4,060 | | | | 4,229 | |
Fines and forfeitures | | | 406 | | | | 427 | | | | 595 | | | | 643 | | | | 659 | | | | 660 | |
Revenue not elsewhere classified | | | 823 | | | | 929 | | | | 652 | | | | 660 | | | | 664 | | | | 668 | |
Total other revenue | | | 5,915 | | | | 4,023 | | | | 4,589 | | | | 5,046 | | | | 5,383 | | | | 5,557 | |
| | | | | | |
Note: 1. Numbers may not add due to rounding. | | | | | | | | | | | | | | | | | | | | | | | | |
111
Budget Strategy and Outlook 2021-22
| Box 4.4 | SPER improved debt collection |
In September 2020, the Palaszczuk Government announced the Debt Recovery and Compliance Program. The program is a package of increased revenue compliance and collection measures to raise an additional $488.1 million by 30 June 2024 at a cost of $74.95 million. The program will increase proactive debt management by the State Penalties and Enforcement Registry (SPER) as well as increase audits and investigations for taxation and royalties.
Queenslanders have every right to expect that people pay their fines and SPER plays a critical role in upholding the integrity of the justice system by ensuring penalty debts are paid.
The key SPER initiatives and outcomes delivered to date under the program are outlined below.
| • | | Since opening in January 2021, the new Debt Management Centre (DMC) at Ipswich has contributed significantly to the increase in the monthly value of debt collected by SPER in the 3 months to the end of May 2021. Monthly SPER collections averaged $26 million during this period compared with an average of $22 million in the preceding 6 months. |
| • | | In 2020–21 to 30 April 2021, increased SPER field enforcement activities have collected approximately $12 million in payments compared to $3.7 million in 2019–20. These enforcement activities include driver licence suspension, vehicle immobilisation, and the seizure and sale of vehicles. |
| • | | In May 2021, SPER commenced regional field enforcement campaigns with uniformed enforcement teams targeting debtors across the state who refuse to pay their SPER debts. Previous field enforcement activities had been limited to South East Queensland and are now being extended across the state. |
| • | | A renewed focus is also being given to collection of debts by full payment (rather than by instalment or other arrangement), with positive results being $142.8 million in payments in 2020–21 to 31 May 2021 compared with $136.6 million in the same period in 2019–20. |
112
Budget Strategy and Outlook 2021-22
Features
| • | | In the 2021–22 Queensland Budget, the Queensland Government continues to provide targeted expense measures in response to the on-going effects of the pandemic as well as pivoting to support longer-term recovery under the Queensland Government’s Economic Recovery Plan. |
| • | | General Government Sector expenses are expected to increase in 2021–22 reflecting the need for a continued strong health response to the COVID-19 pandemic and support to drive economic growth and jobs. |
| • | | Expenses for 2021–22 are estimated to be $67.148 billion, an increase of $2.949 billion from 2020–21. The increase partly reflects Queensland’s continued health response to the COVID-19 pandemic including fever clinics, contact tracing, compliance and quarantine activities and the vaccination program together with additional jobs and industry support initiatives to assist economic recovery. Student enrolment growth and demand for health services also contribute to higher expenses in 2021–22. |
| • | | Beyond 2021–22, growth in General Government Sector expenses is expected to moderate to sustainable levels over the longer term as the need for government support tapers as the economy recovers. |
| • | | Total expenses are projected to grow at an average annual rate of 2.3 per cent over the 4 years to 2024–25. Revenue is expected to grow at an average annual rate of 3.9 per cent over the same period. |
| • | | The Queensland Government’s Savings and Debt Plan, announced on 9 July 2020, targeted savings of $3 billion over 4 years to 2023–24. Savings of $750 million in 2020–21 have been achieved under the Savings and Debt Plan. Workstreams established under the Savings and Debt Plan are continuing to identify cross-government savings opportunities and will support agencies to achieve remaining savings through to 2023–24. |
| • | | In 2021–22, the major areas of expenditure are in the key frontline services of health and education, which together constitute approximately 56.6 per cent of General Government Sector expenses. |
This chapter provides an overview of General Government Sector expenses for the forecast 2021–22 Budget year and projections for 2022–23 to 2024–25. The forward estimates are based on the economic projections outlined in Chapter 2.
| 5.1 | 2020–21 estimated actual |
General Government Sector expenses in 2020–21 are estimated to be $64.199 billion, $682 million lower than the 2020–21 Queensland Budget.
113
Budget Strategy and Outlook 2021-22
The decrease in expenses since the 2020–21 Budget is largely driven by:
| • | | lower than projected costs related to COVID-19 health response, some of which will be delivered in 2021–22 |
| • | | lower interest expenses resulting from reduced borrowing requirements due to stronger taxation and GST revenue than previously forecast and lower than expected interest rates in the second half of 2020–21 |
| • | | timing of expenditure under various grant programs including natural disaster expenditure |
| • | | actuarial adjustments for the state’s Defined Benefit Superannuation Scheme. |
These expenses were partly offset by the Australian Government’s advance payment of financial assistance grants to local governments in 2020–21 for the 2021–22 financial year.
| 5.2 | 2021–22 Budget and outyears |
| Table 5.1 | General Government Sector expenses1 |
| | | | | | | | | | | | | | | | | | | | | | | | |
| | | 2019–20
Outcome
$ million | | | 2020–21
Est.
Act. $
million | | | 2021–22
Budget
$
million | | | 2022–23
Projection
$ million | | | 2023–24
Projection
$ million | | | 2024–25
Projection
$ million | |
Employee expenses | | | 25,660 | | | | 26,284 | | | | 27,474 | | | | 28,598 | | | | 29,337 | | | | 30,344 | |
Superannuation interest costs | | | 354 | | | | 246 | | | | 373 | | | | 398 | | | | 400 | | | | 393 | |
Other superannuation expenses | | | 3,183 | | | | 3,116 | | | | 3,156 | | | | 3,234 | | | | 3,307 | | | | 3,355 | |
Other operating expenses | | | 17,087 | | | | 17,102 | | | | 17,963 | | | | 17,273 | | | | 17,614 | | | | 17,576 | |
Depreciation and amortisation | | | 4,033 | | | | 4,234 | | | | 4,356 | | | | 4,509 | | | | 4,677 | | | | 4,829 | |
Other interest expenses | | | 1,486 | | | | 1,567 | | | | 1,667 | | | | 1,880 | | | | 2,085 | | | | 2,241 | |
Grants expenses | | | 11,695 | | | | 11,649 | | | | 12,160 | | | | 12,260 | | | | 11,957 | | | | 11,476 | |
Total Expenses | | | 63,498 | | | | 64,199 | | | | 67,148 | | | | 68,151 | | | | 69,376 | | | | 70,214 | |
| | | | | | |
Note: | | | | | | | | | | | | | | | | | | | | | | | | |
|
1. Numbers may not add due to rounding. | |
General Government Sector expenses of $67.148 billion in 2021–22 represent an increase of $2.949 billion (or 4.6 per cent) over the 2020–21 estimated actual. Key initiatives contributing to the growth in expenditure in 2021–22 include:
| • | | continuation of the government’s COVID-19 response including fever clinics, contact tracing and testing capability, the vaccination program, compliance activities, facilitation of quarantine in government-arranged accommodation and COVID-19 call centres telephone support for people in mandatory hotel quarantine |
114
Budget Strategy and Outlook 2021-22
| • | | Queensland Health’s performance stabilisation measures to address pressures in emergency patient flow through our public hospitals, elective surgery and specialist outpatient waitlists and the opening of the Nambour Hospital Redevelopment |
| • | | student enrolment growth and increased funding under the National School Reform Agreement and associated Bilateral Agreement |
| • | | creation of the Industry Partnership program (as part of the Queensland Jobs Fund) |
| • | | provision of ongoing funding for the Skilling Queenslanders for Work initiative |
| • | | additional funding for the Housing and Homelessness Action Plan and the establishment of a Housing Investment Fund, with its returns used to drive new supply to support current and future housing needs |
| • | | increased funding for youth justice. |
| 5.3 | Expenses by operating statement category |
As outlined in Chart 5.1, the largest expense categories in the General Government Sector in 2021–22 are employee and superannuation expenses (46.2 per cent). Other operating expenses (26.8 per cent) follows, reflecting non-labour costs of providing goods and services to government and non-government recipients including transport service contract payments and repairs and maintenance.
| Chart 5.1 | Expenses by operating statement category, 2021–22 |
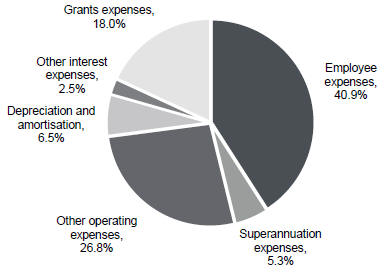
115
Budget Strategy and Outlook 2021-22
Chart 5.2 identifies the growth in expenses in each operating statement category between the 2020–21 Budget and the 2021–22 Budget. The largest increases in 2021–22 are in employee expenses, reflecting workforce requirements to meet the ongoing demand for frontline hospital and health services and school enrolment growth, and other operating expenses driven by COVID-19 response activities.
| Chart 5.2 | Growth in expenses by operating statement category – 2020–21 Budget to 2021–22 Budget |
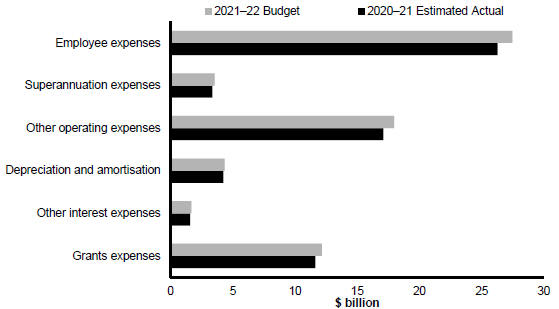
Employee expenses include salaries and wages, annual leave and long service leave.
In 2021–22, employee expenses are expected to be $27.474 billion, $1.189 billion or 4.5 per cent higher than the 2020–21 estimated actual. This reflects the increase in key frontline service areas of health and education due to demand for health services, and student population growth.
In the 2020–21 Budget the government implemented a wage deferral of scheduled increases in General Government sector wages from 2020–21 into the following 2 years to partly offset the impact of its COVID-19 measures. Employee expenses are estimated to increase 4.5 per cent in 2021–22 and 4.1 per cent in 2022–23 reflecting the deferred wage increases and the additional activity in response to the COVID-19 pandemic.
Employee expenses growth over the 4 years to 2024–25 is broadly in line with population growth and government election commitments towards supporting frontline services.
116
Budget Strategy and Outlook 2021-22
Full-time equivalents
The government is delivering on its commitment to revitalise frontline service delivery. This has contributed to full time equivalents (FTE) increasing 34,357 (or 17.26 per cent) from 2014–15 to 2020–21.
Between March 2015 and March 2021:
| • | | teachers increased by 5,662 (or 13.45 per cent) |
| • | | teacher aides increased by 1,431 (or 15.35 per cent) |
| • | | nurses increased by 8,407 (or 30.11 per cent) |
| • | | health practitioners increased by 4,291 (or 43.43 per cent) |
| • | | doctors increased by 2,841 (or 35.83 per cent) |
| • | | ambulance officers increased by 858 (or 23.11 per cent) |
| • | | police officers increased by 728 (or 6.48 per cent) |
| • | | firefighters increased by 172 (or 7.16 per cent). |
As at March 2021, around 91.57 per cent of public servants were engaged in frontline and frontline support roles.
FTEs are estimated to increase by around 3,797 in 2021–22, driven principally by increases in health, education and other frontline services like police, child safety and QBuild.
The government is also committed to ensuring that public service staff are located where they are needed in the community. Around 47 per cent of FTEs are located outside Greater Brisbane, of which around 96 per cent are engaged in frontline and frontline support roles. Regional Action Plans show increases in key service delivery occupations across the regions.
117
Budget Strategy and Outlook 2021-22
| Box 5.1 | Public sector FTE management |
In accordance with the Savings and Debt Plan, the Queensland public sector continues to actively manage its workforce to ensure limited increases in the overall public sector FTE cap.
This includes measures such as prioritising non-frontline recruitment within the existing public sector workforce to prevent unnecessary workforce growth and managing a natural reduction in the senior executive service cohort.
In the 2021–22 Budget, the government has established a whole-of-government pool of unallocated FTEs (the Pool), to resource approved priority functions where they cannot be resourced from within an agency’s existing FTE levels. Unallocated FTE positions for the Pool have been sourced from existing agency allocations where they were not being utilised. This Pool will assist the government to continue to prioritise its resources, including to new priority functions, while limiting increases in overall public sector FTE levels.
The Pool will be managed by the Public Service Commission in partnership with Queensland Treasury and the Department of the Premier and Cabinet.
Public sector workforce information is published bi-annually by the Public Service Commission.
The Public Service Commission publishes a bi-annual Queensland Public Sector Workforce Profile. The March 2021 update reports 235,447.72 full-time equivalents, an increase of 1,305.23 FTEs across the public sector workforce since September 2020. The increase reflects growth of 1,803.08 FTE frontline and frontline support roles and a reduction of 497.85 FTE non-frontline roles. The reporting basis used by the PSC reflects FTEs paid at a certain date. FTEs reported in Table 5.2 reflects approved funded FTE positions.
118
Budget Strategy and Outlook 2021-22
Table 5.2 Funded Controlled FTE positions by Department1
| | | | | | | | | | | | |
| | | 2020–21
Adjusted
Budget2 | | | 2020–21
Estimated
Actuals | | | 2021–22
Budget | |
Agriculture and Fisheries | | | 2,115 | | | | 2,118 | | | | 2,108 | |
Children, Youth Justice and Multicultural Affairs | | | 5,121 | | | | 5,162 | | | | 5,286 | |
Communities, Housing and Digital Economy | | | 3,985 | | | | 3,985 | | | | 3,590 | |
Education | | | 75,334 | | | | 75,170 | | | | 75,706 | |
Electoral Commission of Queensland | | | 76 | | | | 76 | | | | 76 | |
Employment, Small Business and Training | | | 4,542 | | | | 4,567 | | | | 4,576 | |
Energy and Public Works | | | 1,707 | | | | 1,708 | | | | 2,319 | |
Environment and Science | | | 2,867 | | | | 2,861 | | | | 2,841 | |
Justice and the Attorney-General | | | 3,645 | | | | 3,654 | | | | 3,628 | |
Office of the Inspector-General of Emergency Management | | | 22 | | | | 22 | | | | 22 | |
Premier and Cabinet | | | 457 | | | | 456 | | | | 455 | |
Public Safety Business Agency | | | 1,019 | | | | 1,019 | | | | 0 | |
Public Service Commission | | | 63 | | | | 65 | | | | 64 | |
Queensland Audit Office | | | 191 | | | | 191 | | | | 191 | |
Queensland Corrective Services | | | 6,245 | | | | 6,255 | | | | 6,599 | |
Queensland Fire and Emergency Services | | | 3,516 | | | | 3,516 | | | | 3,788 | |
Queensland Health | | | 96,939 | | | | 96,939 | | | | 99,266 | |
Queensland Police Service | | | 15,956 | | | | 15,956 | | | | 17,031 | |
Queensland Treasury | | | 1,111 | | | | 1,227 | | | | 1,213 | |
Regional Development, Manufacturing and Water | | | 526 | | | | 575 | | | | 586 | |
Resources | | | 1,553 | | | | 1,556 | | | | 1,535 | |
Seniors, Disability Services, and Aboriginal and Torres Strait Islander Partnerships | | | 1,995 | | | | 1,998 | | | | 1,961 | |
State Development, Infrastructure, Local Government and Planning | | | 1,029 | | | | 973 | | | | 973 | |
The Public Trustee of Queensland | | | 637 | | | | 637 | | | | 637 | |
Tourism, Innovation and Sport | | | 466 | | | | 475 | | | | 467 | |
Transport and Main Roads | | | 7,512 | | | | 7,512 | | | | 7,512 | |
Whole-of-Government unallocated FTE pool3 | | | | | | | | | | | 40 | |
Total | | | 238,629 | | | | 238,673 | | | | 242,470 | |
Notes:
| 1. | Explanations of variations in departmental FTEs can be found in the Service Delivery Statements (SDS). Departmental totals may include multiple tables from SDS, due to separate FTE tables being provided for Departmental service areas and Commercialised Business Units. |
| 2. | Adjusted Budget reflects movements of FTEs following Machinery of Government changes only. |
| 3. | The total 2021–22 Budget includes an additional 40 FTEs held in the newly established whole-of-government unallocated FTE Pool. Refer to Box 5.1. |
119
Budget Strategy and Outlook 2021-22
| 5.3.2 | Superannuation expenses |
The superannuation interest cost represents the imputed interest on the government’s accruing defined benefit superannuation liabilities.
In determining the state’s defined benefit superannuation liabilities, Australian Accounting Standards Board (AASB) 119 Employee Benefits requires the discounting of future benefit obligations using yield rates on government bonds net of investment tax. Interest costs are calculated on a net liability approach by applying the discount rate to both the gross liability and superannuation plan assets.
Superannuation interest costs are dependent on the applicable discount rates at the beginning of the year. Rates declined in 2019–20 resulting in lower superannuation interest costs in 2020–21.
Bond yields are forecast to rise over the forward estimates increasing superannuation interest costs by $127 million in 2021–22. The impact on superannuation interest costs from rising government bond yields in the later part of the forward estimates is largely offset by the effect of a declining defined benefit superannuation liabilities. The obligations of the defined benefit scheme, which is closed to new members, will decline over time as members leave.
Other superannuation expenses represent employer superannuation contributions to accumulation superannuation and the current service cost of the state’s defined benefit obligation (or the increase in the present value of the defined benefit obligation resulting from employee service in the current period).
| 5.3.3 | Other operating expenses |
Other operating expenses comprise the non-labour costs of providing goods and services including services to government and non-government organisations, repairs and maintenance, consultancies, contractors, electricity, communications and marketing.
In 2021–22, other operating expenses are expected to be $17.963 billion, an increase of $861 million, or 5 per cent, higher compared to the 2020–21 estimated actual.
The increase in other operating expenses is driven mainly by:
| • | | the continuation of the government’s COVID-19 response, in particular facilitation of quarantine in government-arranged accommodation |
| • | | the ramp up of works under the Cross River Rail project. |
Other operating expenses are expected to decline in 2022–23 as the need for the government’s COVID-19 health response tapers and Cross River Rail works reduce as the project gets closer to completion.
| 5.3.4 | Depreciation and amortisation |
Depreciation and amortisation expenses is an estimate of the progressive consumption of the state’s assets through normal usage, wear and tear and obsolescence. Growth in this expense category primarily reflects the increasing investment in state infrastructure and asset revaluations.
120
Budget Strategy and Outlook 2021-22
Depreciation expenses have increased in all years of the forward estimates as the General Government Sector capital program rolls out.
| 5.3.5 | Other interest expenses |
Other interest expenses include interest paid on borrowings, finance leases and similar arrangements to acquire capital assets and infrastructure such as roads and government buildings.
Other interest expenses are estimated to increase $100 million in 2021–22 to $1.667 billion compared to $1.567 billion in 2020–21.
Interest costs have fallen in both 2020–21 and 2021–22 compared to the 2020–21 Budget due to improvements in the fiscal position.
Interest expenses across the forward estimates remain below the peak of $2.328 billion in 2014–15.
Current grants include grants and subsidies to the community (such as non-state schools, hospitals, benevolent institutions and local governments) and personal benefit payments. Community Service Obligations are provided where Public Non-financial Corporations (PNFCs) are required to provide non-commercial services or services at non-commercial prices for the benefit of the community (for further details refer to Chapter 9).
Capital grants also represent transfers to the PNFC Sector, local governments, not-for-profit institutions and other non-government entities, such as business and households (including the Queensland First Home Owner’s Grant and non-state schools) for capital purposes.
| Table 5.3 | provides a breakdown of grants by category and recipient type. |
121
Budget Strategy and Outlook 2021-22
| | | | | | | | | | | | |
| | | 2019–20
Outcome
$ million | | | 2020–21
Est. Act.
$ million | | | 2021–22
Budget
$ million | |
Current | | | | | | | | | | | | |
Grants to local government | | | 696 | | | | 873 | | | | 653 | |
Grants to private and not-for-profit organisations | | | | | | | | | | | | |
State funding for non-state schools | | | 712 | | | | 760 | | | | 790 | |
Australian Government funding for non-state schools | | | 3,152 | | | | 3,124 | | | | 3,472 | |
Other | | | 2,297 | | | | 2,067 | | | | 2,065 | |
Grants to other sectors of government | | | | | | | | | | | | |
Community service obligations to PNFCs | | | 508 | | | | 475 | | | | 538 | |
Other payments to PNFCs | | | 50 | | | | 52 | | | | 89 | |
Other (includes payments to NDIA) | | | 1,580 | | | | 1,988 | | | | 2,055 | |
Other | | | 969 | | | | 514 | | | | 366 | |
Total current grants | | | 9,964 | | | | 9,854 | | | | 10,028 | |
Capital | | | | | | | | | | | | |
Grants to local government | | | 1,070 | | | | 1,070 | | | | 1,447 | |
State funding for non-state schools | | | 100 | | | | 101 | | | | 117 | |
Grants to private and not-for-profit organisations | | | 430 | | | | 418 | | | | 379 | |
Payments to PNFCs | | | 33 | | | | 30 | | | | 50 | |
Queensland First Home Owners’ Grants | | | 96 | | | | 172 | | | | 123 | |
Other | | | 2 | | | | 5 | | | | 16 | |
Total capital grants | | | 1,731 | | | | 1,796 | | | | 2,132 | |
Total current and capital grants | | | 11,695 | | | | 11,649 | | | | 12,160 | |
Note:
| 1. | Numbers may not add due to rounding. |
In 2020–21, grant expenses are estimated to total $11.649 billion, $46 million lower than 2019–20. The relatively flat growth in grants expenses in 2020–21, despite an increase in grants to the National Disability Insurance Agency (NDIA), is mainly due to the immediate stimulus provided in the wake of the COVID-19 crisis. In 2019–20, significant stimulus was provided to businesses through payroll tax and land tax rebates and electricity rebates for small businesses.
In 2021–22, total grant expenses are estimated to be $12.160 billion, $511 million higher than 2020–21. This increase is mainly due to:
| • | | higher Australian government grants on-passed to non-government schools |
| • | | funding for the new Industry Partnership Program (under Queensland Jobs Fund) to boost Queensland’s industry footprint |
| • | | funding for job creation programs including Back to Work, Works for Queensland and South East Queensland Community Stimulus Program |
122
Budget Strategy and Outlook 2021-22
Higher grants in 2021–22 are partly offset by the Australian Government again making advance payment of the 2021–22 Financial Assistance Grants to local councils in 2020–21.
| 5.4 | Operating expenses by purpose |
Chart 5.3 indicates the proportion of expenditure by major purpose classification for the 2021–22 Budget. Health accounts for the largest share of expenses (31.6 per cent) followed by Education (25 per cent).
The COVID-19 pandemic has resulted in a significant increase in health expenditure in 2021–22, increasing the function’s relative percentage of total General Government Sector expenses comparative to most other expenditure classification by purpose.
| Chart 5.3 | General Government Sector expenses by purpose, 2021–22 |
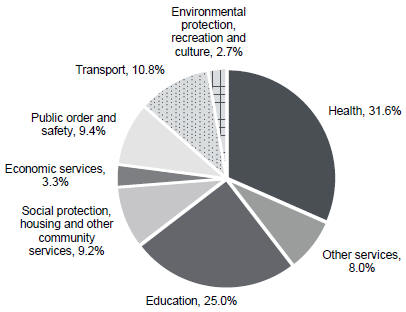
Data presented in Tables 5.4 and 5.5 provide a summary drawn from financial statements contained in the Service Delivery Statements (SDS). Further information can also be obtained from departmental SDS.
123
Budget Strategy and Outlook 2021-22
Table 5.4 Departmental controlled expenses1
| | | | | | | | |
| | | 2020–21
Est. Act.
$ 000 | | | 2021–22
Budget
$ 000 | |
Agriculture and Fisheries | | | 577,544 | | | | 522,630 | |
Children, Youth Justice and Multicultural Affairs | | | 1,821,609 | | | | 1,858,075 | |
Communities, Housing and Digital Economy2 | | | 2,164,056 | | | | 1,862,127 | |
Education | | | 10,270,294 | | | | 11,009,676 | |
Electoral Commission of Queensland | | | 86,335 | | | | 28,925 | |
Employment, Small Business and Training3 | | | 1,397,075 | | | | 1,268,358 | |
Energy and Public Works2 | | | 516,323 | | | | 957,731 | |
Environment and Science2 | | | 858,965 | | | | 832,270 | |
Health Consolidated4 | | | 20,459,668 | | | | 20,884,953 | |
Inspector-General of Emergency Management | | | 4,724 | | | | 4,844 | |
Justice and Attorney-General2 | | | 757,358 | | | | 826,708 | |
Legislative Assembly | | | 106,541 | | | | 106,322 | |
Office of the Governor | | | 7,429 | | | | 8,328 | |
Office of the Ombudsman | | | 9,105 | | | | 9,505 | |
Premier and Cabinet | | | 108,352 | | | | 109,164 | |
Public Safety Business Agency (abolished 1 July 2021) | | | 305,107 | | | | — | |
Public Service Commission | | | 14,217 | | | | 15,169 | |
Queensland Audit Office | | | 44,906 | | | | 44,930 | |
Queensland Corrective Services | | | 1,060,019 | | | | 1,092,256 | |
Queensland Fire and Emergency Services | | | 949,288 | | | | 800,192 | |
Queensland Police Service | | | 2,663,631 | | | | 2,700,738 | |
Queensland Treasury | | | 624,553 | | | | 510,157 | |
Regional Development, Manufacturing and Water2 | | | 136,549 | | | | 186,989 | |
Resources2 | | | 383,160 | | | | 335,850 | |
Seniors, Disability Services and Aboriginal and Torres Strait Islander Partnerships2 | | | 364,289 | | | | 311,455 | |
State Development, Infrastructure, Local Government and Planning2 | | | 479,643 | | | | 751,877 | |
The Public Trustee of Queensland | | | 88,453 | | | | 88,772 | |
Tourism, Innovation and Sport2 | | | 412,332 | | | | 392,254 | |
Transport and Main Roads | | | 6,710,516 | | | | 6,931,191 | |
Total expenses | | | 53,382,041 | | | | 54,451,446 | |
Notes:
| 1. | Total expenses by department do not equate to total General Government Sector expenses in Uniform Presentation Framework (UPF) terms reported elsewhere in the Budget Papers as General Government Sector expenses include a wider range of entities including state government statutory authorities. In addition, transactions eliminated between entities within the General Government Sector are excluded in the preparation of whole-of-government UPF financial statements. |
| 2. | Department expenses in 2020–21 are impacted by Machinery of Government changes which occurred in late 2020. |
124
Budget Strategy and Outlook 2021-22
| 3. | Decrease from estimated actuals to Budget is mainly due to the cessation of time-limited funding in response to COVID-19, including the Small Business COVID-19 Adaption Grants. |
| 4. | This represents Health Consolidated in the Service Delivery Statement, which consolidates Queensland Health controlled, the Hospital and Health Services, and Queensland Ambulance Service. |
| Table 5.5 | Departmental administered expenses1 |
| | | | | | | | |
| | | 2020–21 | | | 2021–22 | |
| | | Est. Act. | | | Budget | |
| | | $ 000 | | | $ 000 | |
Agriculture and Fisheries | | | 64,306 | | | | 57,827 | |
Children, Youth Justice and Multicultural Affairs | | | 16,652 | | | | 1,139 | |
Communities, Housing and Digital Economy2 | | | 141,873 | | | | 197,373 | |
Education | | | 4,168,282 | | | | 4,620,350 | |
Energy and Public Works2 | | | 267,996 | | | | 545,811 | |
Environment and Science2 | | | 75,922 | | | | — | |
Health Consolidated3 | | | 69,774 | | | | 77,216 | |
Justice and Attorney-General | | | 685,608 | | | | 476,616 | |
Premier and Cabinet | | | 148,324 | | | | 167,549 | |
Queensland Police Service | | | 725 | | | | — | |
Queensland Treasury | | | 6,620,240 | | | | 6,428,842 | |
Regional Development, Manufacturing and Water | | | 30,695 | | | | 37,205 | |
Resources2 | | | 260,883 | | | | 57,996 | |
Seniors, Disability Services and Aboriginal and Torres Strait Islander Partnerships | | | 2,450,503 | | | | 2,434,745 | |
State Development, Infrastructure, Local Government and Planning | | | 886,257 | | | | 1,069,112 | |
The Public Trustee of Queensland | | | 759 | | | | 774 | |
Tourism, Innovation and Sport2 | | | 148,766 | | | | 126,559 | |
Transport and Main Roads | | | 71,149 | | | | 109,746 | |
Total expenses | | | 16,108,714 | | | | 16,408,860 | |
Notes:
| 1. | Total expenses by department do not equate to total General Government Sector expenses in Uniform Presentation Framework (UPF) terms reported elsewhere in the Budget Papers as General Government Sector expenses include a wider range of entities including state government statutory authorities. In addition, transactions eliminated between entities within the General Government Sector are excluded in the preparation of whole-of-government UPF financial statements. |
| 2. | Department expenses in 2020–21 are impacted by Machinery of Government changes which occurred in late 2020. |
| 3. | This represents Health Consolidated in the Service Delivery Statement, which consolidates Queensland Health controlled, the Hospital and Health Services, and Queensland Ambulance Service. |
125
Budget Strategy and Outlook 2021-22
| 6 | Balance sheet and cash flows |
Features
| • | | General Government Sector net debt at 30 June 2021 is forecast to be nearly $10 billion lower than anticipated at the time of the 2020–21 Queensland Budget. This is primarily due to faster than anticipated improvements in the domestic and national economies leading to a softer impact on gross borrowing requirements, and the contributed valuation for the Titles Registry, being greater than anticipated. |
| • | | Net debt in the General Government Sector is expected to be considerably lower in every year of the forward estimates compared to estimates in the 2020–21 Budget and is projected to be $42.573 billion by 30 June 2025. By 2023–24, Queensland’s forecast net debt of $39.019 billion compares favourably to Victoria’s projected net debt of $138.35 billion and $96.675 billion for New South Wales. |
| • | | As the state continues its economic recovery, debt will continue to grow over the forward estimates, but at much lower levels than anticipated in the 2020–21 Budget. Notwithstanding this improvement, debt will remain higher than it was pre-pandemic. |
| • | | The Queensland Future Fund (QFF) – Debt Retirement Fund (DRF) is on track to be funded with contributions totalling $7.7 billion by 30 June 2021. In addition, the government is retaining approximately $1.8 billion from the transfer of the Titles Registry to support long-term government priorities to: drive new supply to support current and future housing need; support Path to Treaty action; and create a sustainable funding source for the existing Land Restoration Fund (LRF) to leverage private finance and investment and support financially sustainable carbon markets. The original investment to support the initiatives will remain intact to deliver sustainable and ongoing returns. |
| • | | The government is committed to maintaining a $52.216 billion 4-year infrastructure program over the forward estimates to 2024–25. The profile of the capital program over the forward estimates reflects the government’s economic response to the pandemic and its focus on maintaining a sustainable program of works through to 2024–25. Over the 10 years to 2024–25, the government will have supported over $110 billion in infrastructure works. |
| • | | The Non-financial Public Sector (NFPS) capital program for the period 2021–22 to 2024–25 comprises $43.892 billion of purchases of non-financial assets (PNFA) and $6.29 billion of capital grant expenses as well as acquisitions of non-financial assets under finance leases and similar arrangements of $2.034 billion. |
| • | | With the Queensland economy rebounding faster than previously forecast, positive NFPS operating cash flows of $18.725 billion are projected from 2021–22 to 2024–25. This will contribute to job creating infrastructure by partially funding the expected $43.893 billion of PNFA over the same period. |
| • | | The government will provide a further $1.5 billion to the Queensland Renewable Energy and Hydrogen Jobs Fund for government investments in commercial renewable energy and hydrogen projects. This brings the total investment in the fund to $2 billion, with $1 billion of this funding to be delivered between 2021–22 and 2024–25. |
126
Budget Strategy and Outlook 2021-22
The balance sheet shows the projected assets, liabilities and net worth of the General Government Sector as at 30 June each year. A strong balance sheet provides the government with the ability to respond to financial and economic shocks, such as those brought about by the COVID-19 pandemic and natural disasters.
By leveraging the state’s balance sheet in a fiscally responsible and manageable way, the government has been able to deliver targeted, temporary relief to support economic recovery, while providing a strong foundation for future economic growth.
The cash flow statement shows the expected cash flows of the General Government Sector during each financial year of the forward estimates. While the operating statement is reported in accrual terms – that is, when revenue and expenses are recorded – the cash flow statement is reported in cash terms – that is, when revenues are received, and payments are made.
The largest differences between cash and accrual accounting relate to depreciation and defined benefit superannuation.
Table 6.1 summarises the key balance sheet aggregates for the General Government Sector.
| Table 6.1 | General Government Sector – summary of budgeted balance sheet1 |
| | | | | | | | | | | | | | | | | | | | | | | | |
| | | 2020–21 | | | 2020–21 | | | 2021–22 | | | 2022–23 | | | 2023–24 | | | 2024–25 | |
| | | Budget | | | Est. Act. | | | Budget | | | Projection | | | Projection | | | Projection | |
| | | $ million | | | $ million | | | $ million | | | $ million | | | $ million | | | $ million | |
Financial assets | | | 63,745 | | | | 66,917 | | | | 68,047 | | | | 70,694 | | | | 72,271 | | | | 73,605 | |
Non-financial assets | | | 242,503 | | | | 244,780 | | | | 250,163 | | | | 255,259 | | | | 259,612 | | | | 263,240 | |
Total assets | | | 306,247 | | | | 311,697 | | | | 318,210 | | | | 325,953 | | | | 331,883 | | | | 336,845 | |
Borrowing with QTC | | | 53,501 | | | | 47,102 | | | | 57,240 | | | | 67,110 | | | | 73,265 | | | | 77,761 | |
Leases and other similar arrangements | | | 7,565 | | | | 7,779 | | | | 7,603 | | | | 7,471 | | | | 7,780 | | | | 7,623 | |
Securities and derivatives | | | 198 | | | | 198 | | | | 198 | | | | 198 | | | | 198 | | | | 198 | |
Advances | | | 1,506 | | | | 1,505 | | | | 1,432 | | | | 1,119 | | | | 1,018 | | | | 868 | |
Superannuation liability | | | 27,475 | | | | 23,758 | | | | 22,686 | | | | 21,653 | | | | 20,291 | | | | 18,505 | |
Other provisions and liabilities | | | 24,464 | | | | 26,664 | | | | 25,877 | | | | 25,639 | | | | 25,392 | | | | 25,358 | |
Total liabilities | | | 114,708 | | | | 107,006 | | | | 115,037 | | | | 123,190 | | | | 127,944 | | | | 130,313 | |
Net worth | | | 191,539 | | | | 204,691 | | | | 203,174 | | | | 202,763 | | | | 203,939 | | | | 206,532 | |
Net financial worth | | | (50,963 | ) | | | (40,089 | ) | | | (46,989 | ) | | | (52,496 | ) | | | (55,673 | ) | | | (56,708 | ) |
Net financial liabilities | | | 72,815 | | | | 61,871 | | | | 69,847 | | | | 76,499 | | | | 80,503 | | | | 82,036 | |
Net debt | | | 25,499 | | | | 15,808 | | | | 24,750 | | | | 33,326 | | | | 39,019 | | | | 42,573 | |
Note: | | | | | | | | | | | | | | | | | | | | | | | | |
1. Numbers may not add due to rounding.
127
Budget Strategy and Outlook 2021-22
The major categories of financial assets are investments, loans and placements and investments in other public sector entities. Investments loans and placements incorporate investments held to meet future liabilities, including superannuation and insurance, as well as investments relating to the Queensland Future Fund (QFF) – Debt Retirement Fund (DRF). Moody’s has indicated that the QFF will play a material role in the state’s management of its debt. The General Government Sector holds the equity in the state’s public enterprises, principally the shareholding in government-owned corporations (GOCs) but also Public Financial Corporations like Queensland Treasury Corporation (QTC), in much the same manner as the parent or holding company in a group of companies.
Total financial assets of $66.917 billion are estimated for 2020–21, $3.172 billion higher than published in the 2020–21 Budget. Investments, loans and placements have increased by $3.615 billion, predominantly due to an increase in the value of assets being contributed to the DRF.
The finalisation of the Queensland Titles Registry valuation means the balance of the DRF has increased to over $7.7 billion. In addition, the Queensland Government will retain approximately $1.8 billion from the transfer of the Queensland Titles Registry, held by the government to support the establishment of a Housing Investment Fund, Path to Treaty Fund and Carbon Reduction Investment Fund.
Financial assets are expected to increase by $1.130 billion to $68.047 billion by 30 June 2022, mainly due to increases in the value of investments in GOCs including the expansion of the state’s investment in the Queensland Renewable Energy and Hydrogen Jobs Fund, previously the Queensland Renewable Energy Fund. With increases in the value of public enterprises and expected returns on the DRF, financial assets will continue to grow over the forward estimates and are projected to be $73.605 billion by 30 June 2025.
Chart 6.1 shows forecast General Government Sector financial assets by category at 30 June 2022.
128
Budget Strategy and Outlook 2021-22
| Chart 6.1 | Forecast General Government Sector financial assets by category, at 30 June 2022 |
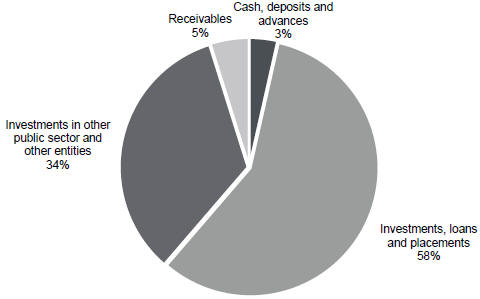
| 6.2.2 | Non-financial assets |
General Government Sector non-financial assets are estimated to be $244.78 billion at 30 June 2021, $2.277 billion higher than expected in the 2020–21 Budget. This increase is largely attributable to a revised valuation for service concession arrangements under AASB 1059 Service Concession Arrangements.
In accordance with Australian Accounting Standards, AASB 1059 was adopted for the first time in 2020–21 with initial valuation estimates included in the 2020–21 Budget.
Service concession arrangements (SCAs) are agreements where an operator (private sector) is contracted to provide or operate an asset on behalf of the grantor (public sector) of the arrangement. The grantor will typically have a social or community obligation to provide the services delivered to the community. AASB 1059 requires the grantor to recognise SCAs over their economic life and to recognise a matching liability (refer to section 6.2.3 Liabilities below).
Non-financial assets in 2021–22 are expected to increase by a further $5.383 billion to be $250.163 billion at 30 June 2022.
Total non-financial assets at 30 June 2022 consist primarily of land and other fixed assets of $243.243 billion, the majority of which are roads, schools, hospitals and other infrastructure used to provide services to Queenslanders. Other non-financial assets of $6.92 billion held by the state include prepayments and deferred income tax assets relating to GOCs.
129
Budget Strategy and Outlook 2021-22
General Government Sector capital expenditure for 2021–22 is forecast to be $9.932 billion, which comprises $7.8 billion of PNFA and $2.132 billion of capital grant expenses. In addition, acquisitions of non-financial assets under finance leases and similar arrangements are forecast to be $1.088 billion, bringing the total General Government Sector capital program for 2021–22 to $11.02 billion.
Over the 4 years to 2024–25, General Government Sector capital expenditure is forecast to be $36.273 billion, which comprises $29.903 billion of PNFA and $6.37 billion of capital grant expenses. Acquisitions of non-financial assets under finance leases and similar arrangements are forecast to be $1.977 billion, bringing the total General Government Sector capital program over the period to $38.25 billion.
The finance leases and similar arrangements are mainly in relation to Public Private Partnerships (PPPs), totalling more than $3.609 billion over the period 2020–21 to 2024–25. This includes major PPPs relating to the Tunnel, Stations and Development components of Cross River Rail (including returned works) and the Surgical, Treatment and Rehabilitation Service (STARS) facility at Herston.
Generally, at the commencement of finance leases, the non-financial assets and the borrowings of the state increase by an equal amount to reflect the acquisition of the asset from the proponent so there are no cash impacts on the commencement of the lease.
The current estimate of the capital program over the 4 years to 2024–25 is over $52 billion. PNFA by the NFPS over this period are forecast to be $43.892 billion. With capital grant expenses of $6.29 billion, this brings total capital expenditure to $50.182 billion. In addition to this, acquisitions of non-financial assets under finance leases and similar arrangements of $2.034 billion bring the total capital program over the period to $52.216 billion.
6.2.3 Liabilities
General Government Sector
Total General Government Sector liabilities are estimated to be $107.006 billion at 30 June 2021, a decrease of $7.702 billion since the 2020–21 Budget, predominantly due to lower than expected borrowing and superannuation liability estimates, offset in part by an increase in other liabilities due to revised valuations for service concession arrangements under AASB 1059 Service Concession Arrangements (refer to section 6.2.2 Non-financial assets above). This adjustment does not have any economic impact on the state’s finances.
Total liabilities are expected to increase by $8.031 billion by 30 June 2022 to be $115.037 billion. General Government Sector borrowing with QTC will increase by $10.138 billion in 2021–22, to be $57.240 billion. This is $7.285 billion lower than the comparable 2020–21 Budget estimate for 2021–22. General Government Sector borrowing with QTC is then forecast to grow over the forward estimates as the economy returns to sustainable growth post the recovery from COVID-19.
130
Budget Strategy and Outlook 2021-22
By 2023–24, borrowing with QTC is expected to reach $73.265 billion, $7.388 billion lower than expected in the 2020–21 Budget. In 2024–25, total borrowing with QTC will increase by $4.496 billion to be $77.761 billion as the government continues to invest in vital infrastructure to drive sustainable economic growth.
The defined benefit superannuation liability is projected to be $23.758 billion at 30 June 2021, $3.717 billion lower than expected in the 2020–21 Budget. This is predominantly due to recent increases in 10-year bond yields which are used to value the liability. By 30 June 2022 the superannuation liability is projected to be $22.686 billion and is expected to continue to decline over the forward estimates as bond rates continue to recover, and members of the defined benefit fund retire. The fund has been closed to new entrants since 2008.
The composition of the General Government Sector’s forecast liabilities at 30 June 2022 is illustrated in Chart 6.2.
| Chart 6.2 | Forecast General Government Sector liabilities by category, at 30 June 2022 |
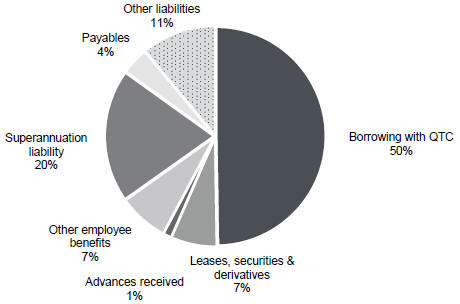
Net debt is the sum of borrowing and advances received, less the sum of cash and deposits, advances paid and investments, loans and placements.
Net debt excludes certain assets and liabilities, such as superannuation and insurance liabilities. However, it still indicates the soundness of the government’s fiscal position, as high levels of net debt will require servicing through interest payments and limit flexibility to adjust expenditure.
131
Budget Strategy and Outlook 2021-22
Net debt for the General Government Sector in 2020–21 is estimated to be $15.808 billion, $9.691 billion lower than expected in the previous budget. The lower net debt is predominantly the result of a reduction in gross borrowing of $6.185 billion largely associated with the improved operating position in the sector, and an increase of $3.615 billion in investments, loans and placements, mainly representing the contribution valuation for the Titles Registry on transfer to the Queensland Future Fund (QFF) – Debt Reduction Fund (DRF), being greater than anticipated.
General Government Sector net debt is budgeted to be $24.75 billion in 2021–22, with expected returns on the DRF partially offsetting increases in gross borrowing which will be employed to support the state’s economic recovery.
| 6.2.5 | Net financial liabilities |
Net financial liabilities are total liabilities, less financial assets other than equity instruments in other public sector entities. This measure is broader than net debt as it includes other significant liabilities rather than just borrowings (for example, accrued employee liabilities such as superannuation and long service leave entitlements).
The net financial liabilities of the General Government Sector for 2020–21 are estimated to be $61.871 billion and are estimated to increase to $69.847 billion by 30 June 2022. This increase is commensurate with the expected increase in borrowing as operating deficits continue to 2023–24, offset in part by a reduction in the superannuation liability.
The net worth, or equity, of the state is the amount by which the state’s assets exceed its liabilities. This is the value of the investment held on behalf of the people of Queensland by public sector entities.
Changes in the state’s net worth occur for several reasons including:
| • | | operating surpluses (deficits) that increase (decrease) the government’s equity |
| • | | revaluation of assets and liabilities as required by accounting standards |
| • | | movements in the net worth of the state’s investments in the PNFC and Public Financial Corporations sectors |
| • | | gains or losses on disposal of assets. Where the selling price of an asset is greater (less) than its value in an agency’s accounts, the resultant profit (loss) affects net worth. |
General Government Sector net worth was $193.731 billion at 30 June 2020. It is expected to increase to $204.691 billion in 2020–21, over $13 billion higher than expected in the 2020–21 Budget.
Contributing to the improvement in net worth, total financial assets have increased by $3.172 billion, predominantly due to an increase in the value of assets being contributed to the DRF and other funds, borrowings have decreased by $6.185 billion in line with the improved operating position, and the superannuation liability has decreased by $3.717 billion, predominantly due to an increase in 10-year bond yields.
132
Budget Strategy and Outlook 2021-22
The net worth of the state is projected to steadily grow over the forward estimates to be $206.532 billion by 2024–25, an increase of 6.6 per cent over the period 2019–20 to 2024–25.
The cash flow statement provides the cash surplus (deficit) measure, which comprises the net cash flows from operating activities plus the net cash flows from investments in non-financial assets (or physical capital).
The General Government Sector cash deficit for 2020–21 is estimated to be $8.033 billion, which is $5.865 billion lower than forecast at the time of the 2020–21 Budget. This is largely due to an improved operating position driven by the faster than anticipated economic recovery and the resulting positive impact on state revenues.
After net investments in non-financial assets of $7.561 billion, a cash deficit of $7.067 billion is forecast for 2021–22. As revenues continue to improve in line with the forecast economic recovery, net cash flows from operating activities increase over the forward estimates, contributing to the government’s investment in non-financial assets and alleviating the need to fund these investments completely through borrowing. In the 2020–21 Budget, positive operating cash flows were first forecast for 2022–23, while in this Budget they are forecast to occur in 2021–22.
Net cash flows from investments in financial assets for policy purposes include net cash flows from disposal or return of equity, net equity injections into GOCs and concessional loans and advances. Cash flows from the injection of equity to the PNFC and Public Financial Corporations sector are the primary driver of net outflows of $1.396 billion over the period from 2021–22 to 2024–25. This includes $1 billion of the government’s $2 billion commitment to the Queensland Renewable Energy and Hydrogen Jobs Fund.
Net cash flows from investments in financial assets for liquidity purposes represent net investment in financial assets to cover liabilities such as superannuation, other employee entitlements and insurance.
Total General Government Sector PNFA of $7.8 billion are budgeted for 2021–22. Over the period from 2021–22 to 2024–25, General Government Sector PNFA are expected to total $29.902 billion as Queensland continues to deliver key elements of the Queensland Government’s Economic Recovery Plan to support jobs and invest in the productivity-enhancing and essential social infrastructure that supports the state’s ongoing recovery and future economic growth.
133
Budget Strategy and Outlook 2021-22
Features
In the 2021–22 Queensland Budget, the Queensland Government is delivering new funding including:
Protecting health
| • | | $2 billion to establish the Hospital Building Fund to assist in meeting growth pressures across the health system, with initial commitments being the Toowoomba Day Surgery, purchasing public health services through the expansion at Mater Public Hospital Springfield and an uplift in Queensland Health’s base capital program. Further commitments are expected beyond 2024–25. |
| • | | $480 million to continue the COVID-19 response including fever clinics, contact tracing and testing capability, the vaccination program, compliance activities, facilitation of quarantine in government arranged accommodation, COVID-19 contact centres and wellness checks for people in mandatory hotel quarantine. |
| • | | $648.7 million investment in the health system in 2021–22, which includes Queensland Health’s $150 million operating share of the $480 million COVID-19 response; $482.5 million to address pressures in emergency patient flow through our public hospitals, elective surgery waitlists and the opening of the Nambour Hospital Redevelopment; $14.5 million for Making Tracks towards achieving health equity (2021–2025); and $1.7 million for the Rockhampton alcohol and other drug residential rehabilitation. |
| • | | $120 million uplift over 2 years to help Queensland Health manage its increasing asset base which includes buildings, medical equipment, information communication and technology (ICT), and engineering equipment. |
Educating future generations
| • | | $913.7 million for 10 new state schools to open across 2023 and 2024. |
| • | | $508.3 million for additional and renewed infrastructure in existing state schools. |
| • | | $202.9 million over 4 years and $64 million per annum ongoing to support the continued provision of universal access to kindergarten in the year before school for all Queensland children. |
Supporting our energy security
| • | | $1.5 billion to increase the existing Queensland Renewable Energy Fund (QREF) to establish the $2 billion Queensland Renewable Energy and Hydrogen Jobs Fund enabling energy government-owned corporations to increase ownership of commercial renewable energy and hydrogen projects in Queensland, in accordance with the current QREF mandate. |
134
Budget Strategy and Outlook 2021-22
| • | | $29.4 million over 4 years from 2021–22 for the Electricity Tariff Adjustment Scheme to support regional businesses. |
| • | | $22 million over 2 years from 2021–22 to undertake a detailed feasibility study for a pumped hydroelectric storage project at Borumba, and concept studies at other sites. |
Protecting our environment
| • | | $500 million for the Carbon Reduction Investment Fund with its returns to support the existing Land Restoration Fund to leverage private finance and investment and support financially sustainable carbon markets. |
| • | | $270.1 million budgeted expenditure over 5 years to maintain the Queensland Reef Water Quality program at current levels. |
| • | | $160 million for statutory annual payments to local governments in 2021–22 to ensure the waste levy will have no direct impact on households. |
| • | | $93.6 million over 4 years and $24.2 million per annum ongoing to continue the implementation of the Queensland Waste Management and Resource Recovery Strategy. |
| • | | $41.5 million over 4 years to support Environmental Markets and Investment, including the second round of grants under the Land Restoration Fund and $35 million in 2021–22 for the Queensland Natural Capital Fund. |
Supporting our communities
| • | | $1 billion for the Housing Investment Fund, with its returns used to drive new supply to support current and future housing needs. |
| • | | $300 million for the Path to Treaty Fund with its returns to be used to support Path to Treaty actions. |
| • | | $30 million over 4 years from 2021–22 to enable increased capacity for domestic, family and sexual violence services to respond to demand. |
| • | | $27.6 million over 4 years and $7.2 million per annum ongoing to continue the work of the Native Title Compensation Office. |
Investing in skills and jobs
| • | | $320 million over 4 years and $80 million per annum ongoing to continue the Skilling Queenslanders for Work initiative, which will assist up to 15,000 disadvantaged Queenslanders each year to gain skills, qualifications and experience to enter and stay in the workforce. |
| • | | Up to $140 million over 4 years for a revitalised Back to Work program to provide eligible businesses the confidence to employ Queenslanders who have experienced a period of unemployment and help workers facing disadvantage in the labour market. |
| • | | $71 million over 4 years to support the Queensland screen industry. |
135
Budget Strategy and Outlook 2021-22
Building Queensland
| • | | $200 million increased funding to deliver on the government’s election commitment for the Works for Queensland program, bringing the total program funding to $1 billion from 2016–17 to 2026–27. |
| • | | $188.9 million increased funding for the Department of Transport and Main Roads to deliver Gold Coast Light Rail Stage 3. This takes the state’s total funding contribution to $538.3 million towards the $1.044 billion project. This project is jointly funded by the Australian Government, Queensland Government and City of Gold Coast, and the total project cost is subject to finalisation of contract negotiations. |
| • | | $150 million increased funding to deliver on the government’s election commitment to provide $200 million over 6 years for the SEQ Community Stimulus Program. |
| • | | $70 million over 3 years for delivery of Building our Regions (Round 6) to support local government infrastructure projects in regional Queensland, with a focus on water and sewerage infrastructure projects. |
| • | | $61.7 million over 4 years to support the continued preservation of the heritage-listed Queensland Cultural Centre; maintenance activities across the Queensland Museum Network in Brisbane, Townsville, Toowoomba and Ipswich; and revitalisation of the Judith Wright Arts Centre and other state-owned arts and cultural facilities through the Arts Infrastructure Investment Fund. |
This chapter provides a consolidated view of policy decisions with budgetary impacts made by the government since the 2020–21 Queensland Budget.
The items listed are in addition to current funding allocated to agencies up to, and including, the 2020–21 Budget. Measures are identified where new policy decisions have been made to create, continue or increase these programs and activities. This is not a list of total funding for programs, activities and infrastructure.
This paper includes only new policy decisions and does not detail the total amount of additional funding being provided to agencies to deliver services and infrastructure. Other adjustments, including those that are parameter based and where the funding formula remains unchanged, are similarly excluded.
The total funding impact of new measures is summarised in Table 7.1, Table 7.2 and Table 7.3 in this chapter.
For details on the total funding available to agencies, refer to agencies’ Service Delivery Statements (SDS).
136
Budget Strategy and Outlook 2021-22
| 7.1 | Explanation of scope and terms |
Scope
This chapter includes measures with the following features:
| • | | Sector. Only Queensland General Government Sector agencies are included. Measures involving government-owned corporations or other Public Non-financial Corporations Sector agencies are within scope only if the measures are being funded directly by the General Government Sector or if there is a flow through effect (for example, Community Service Obligations). |
| • | | Timeframe. Measures based on decisions made by the government since the 2020–21 Budget. |
| • | | Type. Measures with budgetary impacts, in particular: |
- expense and capital measures with service delivery, capital enhancement, grant or subsidy impacts on the community, and
- revenue measures involving significant change in revenue policy, including changes in the tax rate.
| • | | Exclusions. Initiatives of a technical nature or non-policy based adjustments, such as parameter-based funding adjustments, are not included where the formula to calculate these adjustments has not been changed. This is done as they do not reflect changes in government policy. The primary focus is on measures reflecting policy decisions that impact directly on the community through service delivery or other means. |
| • | | Materiality. Minor measures or measures with non-significant community impact are not included in this document. |
Funding basis
Tables in this document are presented on a net funding basis.
| • | | Net funding refers to the impact that the funding of the measure has on appropriations from the Consolidated Fund or centrally held funds to the relevant General Government Sector agency. The tables do not include funding directed to the measure from existing agency resources or other sources. |
| • | | Amounts refer to additional funding being provided to agencies for a particular program or project, as a result of decisions by government since the 2020–21 Budget. The amount provided for a measure may differ from other budget papers, such as Budget Paper No. 3 Capital Statement, that may refer to total funding. |
| • | | Amounts included in the tables relating to revenue measures represent the impact of the measure on government revenue (with a positive amount representing additional revenue). |
Tables 7.1, 7.2 and 7.3 identify expense, capital and revenue measures separately.
137
Budget Strategy and Outlook 2021-22
| 7.2 | Government indexation policy |
For the 2021–22 year, the government further reduced the government indexation rate from 1.8 per cent to 1.7 per cent, continuing to provide financial relief to households and businesses due to the COVID-19 pandemic. This rate reflects the actual March 2021 Consumer Price Index growth for Brisbane.
138
Budget Strategy and Outlook 2021-22
| Table 7.1 | Expense Measures |
| | | | | | | | | | | | | | | | | | | | |
Expense measures | | 2020–21
$ million | | | 2021–22
$ million | | | 2022–23
$ million | | | 2023–24
$ million | | | 2024–25
$ million | |
Abandoned Mines Sites Initiatives | | | — | | | | 11.180 | | | | 4.600 | | | | — | | | | — | |
Additional Support to Racing Industry | | | — | | | | 19.580 | | | | 21.680 | | | | — | | | | — | |
Additional Support to Screen Industry | | | — | | | | 33.000 | | | | 36.000 | | | | 1.000 | | | | 1.000 | |
Asylum Seeker and Refugee Assistance Program | | | — | | | | 2.075 | | | | 2.075 | | | | 2.075 | | | | 2.075 | |
Aviation Route Support Package | | | — | | | | 5.000 | | | | 5.000 | | | | — | | | | — | |
Back to Work | | | — | | | | 35.000 | | | | 35.000 | | | | 35.000 | | | | 35.000 | |
Backing Queensland Maritime Jobs | | | — | | | | 0.500 | | | | 7.000 | | | | — | | | | — | |
Bail Service for Remanded Men | | | — | | | | 1.306 | | | | — | | | | — | | | | — | |
Biosecurity Matters | | | — | | | | 3.017 | | | | 2.213 | | | | 2.421 | | | | 1.121 | |
Building Future Schools Program | | | — | | | | 7.944 | | | | 21.217 | | | | 13.802 | | | | 6.441 | |
Building Legislation and Policy Sustainability | | | — | | | | 3.300 | | | | 3.300 | | | | — | | | | — | |
Building our Regions – Round 6 forwater and sewerage infrastructure | | | — | | | | 10.000 | | | | 30.000 | | | | 30.000 | | | | — | |
Camera Detected Offence Program | | | 0.464 | | | | 10.746 | | | | 7.296 | | | | 5.390 | | | | 5.957 | |
Carbon Reduction Investment Fund1 | | | — | | | | — | | | | — | | | | — | | | | — | |
Celebrating Multicultural Queensland | | | — | | | | — | | | | — | | | | — | | | | — | |
Program | | | — | | | | 1.000 | | | | 1.000 | | | | 1.000 | | | | 1.000 | |
Child Protection Litigation Model | | | — | | | | 19.697 | | | | — | | | | — | | | | — | |
Community Transport | | | — | | | | 7.000 | | | | 7.000 | | | | 7.000 | | | | 7.000 | |
| 1 | Returns generated will be applied to meet the costs of the Land Restoration Fund |
139
Budget Strategy and Outlook 2021-22
| | | | | | | | | | | | | | | | | | | | |
Expense measures | | 2020–21
$ million | | | 2021–22
$ million | | | 2022–23
$ million | | | 2023–24
$ million | | | 2024–25
$ million | |
Comprehensive Vegetation Mappingand Reporting | | | — | | | | 2.303 | | | | 2.349 | | | | 2.414 | | | | 2.461 | |
COVID-19 Transport Services Assistance Program | | | (3.983 | ) | | | 12.166 | | | | — | | | | — | | | | — | |
Crime Statistics and Research Unit | | | — | | | | 1.864 | | | | — | | | | — | | | | — | |
Crocodile Management Program | | | — | | | | 3.000 | | | | 3.000 | | | | 3.000 | | | | 3.000 | |
Cultural Tourism Programming Strategy | | | — | | | | — | | | | 2.000 | | | | 2.000 | | | | 2.000 | |
Culture and Reconciliation Initiatives | | | — | | | | 0.450 | | | | 0.455 | | | | 0.459 | | | | 0.463 | |
Cyber Security | | | — | | | | 5.128 | | | | 5.846 | | | | — | | | | — | |
Digital Archiving Program | | | (0.200 | ) | | | 4.415 | | | | 4.579 | | | | 2.800 | | | | 2.800 | |
Disability Services Functions | | | — | | | | 1.175 | | | | 1.243 | | | | 1.296 | | | | 1.362 | |
Domestic and Family Violence Prevention – Engagement and Community Strategy | | | — | | | | 0.532 | | | | 0.532 | | | | 0.532 | | | | 0.532 | |
Drought Reform Package | | | — | | | | 6.000 | | | | 7.000 | | | | 7.000 | | | | 7.000 | |
DSDSATSIP Legal Affairs Unit | | | — | | | | 0.516 | | | | 0.521 | | | | 0.525 | | | | 0.529 | |
Early Childhood Education and Care Regulation | | | — | | | | 13.145 | | | | — | | | | — | | | | — | |
Electricity Tariff Adjustment Scheme | | | — | | | | 9.102 | | | | 7.666 | | | | 6.670 | | | | 5.939 | |
Enhanced Domestic and Family Violence Services | | | — | | | | 7.500 | | | | 7.500 | | | | 7.500 | | | | 7.500 | |
Environmental Markets and Investment | | | — | | | | 1.000 | | | | 0.110 | | | | 0.700 | | | | 0.770 | |
Extended Live Music Support | | | — | | | | 7.000 | | | | — | | | | — | | | | — | |
Fisheries Reform | | | — | | | | 14.311 | | | | 13.175 | | | | 7.500 | | | | 7.500 | |
Former Queensland Agricultural Training Colleges’ Asset Transition | | | 1.653 | | | | 3.488 | | | | 5.585 | | | | 0.145 | | | | 0.023 | |
140
Budget Strategy and Outlook 2021-22
| | | | | | | | | | | | | | | | | | | | |
Expense measures | | 2020–21
$ million | | | 2021–22
$ million | | | 2022–23
$ million | | | 2023–24
$ million | | | 2024–25
$ million | |
Fraser Island (K’Gari) Bushfire Response | | | — | | | | 1.250 | | | | 1.250 | | | | 1.250 | | | | 1.250 | |
Frontline Child Safety Workers | | | — | | | | 11.095 | | | | 20.255 | | | | 22.358 | | | | 22.932 | |
Future Correctional Infrastructure Needs Business Case | | | — | | | | 2.448 | | | | — | | | | — | | | | — | |
Health COVID-19 Response includingmandatory quarantine | | | — | | | | 462.031 | | | | — | | | | — | | | | — | |
QFES Component | | | — | | | | 232.250 | | | | — | | | | — | | | | — | |
QPS Component | | | — | | | | 68.475 | | | | — | | | | — | | | | — | |
Smart Service Queensland COVID-19 service deliverycapacity and capability to protect Queenslanders duringthe COVID-19 pandemic | | | — | | | | 11.306 | | | | — | | | | — | | | | — | |
QH Component | | | — | | | | 150.000 | | | | — | | | | — | | | | — | |
Health System Investment | | | — | | | | 498.709 | | | | 27.481 | | | | 4.170 | | | | 4.170 | |
Health Performance Stabilisation | | | — | | | | 482.493 | | | | — | | | | — | | | | — | |
Making Tracks towardachieving health equity (2021–2025) | | | — | | | | 14.526 | | | | 23.311 | | | | — | | | | — | |
Rockhampton alcohol andother drug residential rehabilitation | | | — | | | | 1.690 | | | | 4.170 | | | | 4.170 | | | | 4.170 | |
Housing and Homelessness Action Plan (2021–2025) | | | — | | | | 53.720 | | | | 53.720 | | | | 23.720 | | | | 23.720 | |
Housing Investment Fund1 | | | — | | | | — | | | | — | | | | — | | | | — | |
Increased Field Enforcement for Collection of Penalty Debt | | | — | | | | 1.700 | | | | 1.012 | | | | 1.023 | | | | 1.035 | |
Industry Partnership Program | | | — | | | | 23.000 | | | | 36.500 | | | | 38.000 | | | | 43.500 | |
141
Budget Strategy and Outlook 2021-22
| | | | | | | | | | | | | | | | | | | | |
Expense measures | | 2020–21
$ million | | | 2021–22
$ million | | | 2022–23
$ million | | | 2023–24
$ million | | | 2024–25
$ million | |
International Education and Training Strategy to Advance Queensland (2016–2026) | | | — | | | | 4.122 | | | | 4.122 | | | | 4.122 | | | | 4.122 | |
Local Fare Scheme | | | — | | | | 7.841 | | | | — | | | | — | | | | — | |
Maintaining Queensland Public Cyclone Shelters | | | — | | | | 3.460 | | | | 3.460 | | | | 3.460 | | | | 3.460 | |
Managing Native Title Compensation Claims in Queensland | | | — | | | | 6.686 | | | | 6.884 | | | | 6.943 | | | | 7.098 | |
Mobile Black Spot Program | | | — | | | | 4.000 | | | | 4.000 | | | | 4.000 | | | | — | |
Modernising Queensland’s Fine Administration System | | | — | | | | 3.509 | | | | — | | | | — | | | | — | |
National Biosecurity System Obligations | | | 2.373 | | | | 2.916 | | | | | | | | — | | | | — | |
Newstead House Capital Program | | | — | | | | 3.848 | | | | 1.644 | | | | — | | | | — | |
North Queensland Natural Disasters Mitigation Program | | | — | | | | 3.000 | | | | 5.000 | | | | 2.000 | | | | — | |
Olympics Preparations | | | — | | | | 14.365 | | | | 14.365 | | | | — | | | | — | |
Pacific Labour Scheme and Seasonal Worker Program | | | — | | | | 2.601 | | | | — | | | | — | | | | — | |
Parliamentary Annexe criticalinfrastructure and services upgrade (Stage 2) | | | — | | | | — | | | | 1.100 | | | | — | | | | — | |
Path to Treaty Fund1 | | | — | | | | — | | | | — | | | | — | | | | — | |
Peak and Representative Bodies and Advocacy for Queenslanders with a Disability | | | — | | | | 7.706 | | | | 7.706 | | | | 3.664 | | | | 3.667 | |
Positive Behaviour Support and Restrictive Practices | | | — | | | | 3.230 | | | | 3.321 | | | | — | | | | — | |
| 1 | Returns generated will be applied to drive new supply to support current and future housing needs |
142
Budget Strategy and Outlook 2021-22
| | | | | | | | | | | | | | | | | | | | |
Expense measures | | 2020–21
$ million | | | 2021–22
$ million | | | 2022–23
$ million | | | 2023–24
$ million | | | 2024–25
$ million | |
Prosecuting Linc Energy formerexecutives and ongoing environmental monitoring | | | — | | | | 9.316 | | | | 6.287 | | | | — | | | | — | |
Protecting Seniors from Elder Abuse | | | — | | | | 1.200 | | | | 1.200 | | | | 1.200 | | | | 1.200 | |
Queensland Aboriginal and Torres Strait Islander Foundation Scholarship Program | | | — | | | | 4.020 | | | | — | | | | — | | | | — | |
Queensland Building Industry Fairness Reforms | | | — | | | | 9.984 | | | | — | | | | — | | | | — | |
Queensland Cultural Centre Critical Infrastructure Renewal | | | — | | | | 0.768 | | | | 1.320 | | | | 1.717 | | | | 2.009 | |
Queensland Government Air | | | — | | | | 9.857 | | | | | | | | | | | | | |
Queensland Hydro-electric Study Implementation | | | — | | | | 14.000 | | | | 8.000 | | | | | | | | | |
Queensland Museum Network | | | — | | | | 3.864 | | | | 2.540 | | | | 2.574 | | | | 0.123 | |
Queensland Procurement Compliance Unit Expansion | | | — | | | | 4.294 | | | | 4.369 | | | | 4.427 | | | | 4.503 | |
Queensland Reef Water Quality Program | | | — | | | | 1.235 | | | | 56.264 | | | | 55.663 | | | | 48.315 | |
Queensland Renewable Energy Zones (QREZ) Implementation | | | 0.500 | | | | 4.500 | | | | — | | | | — | | | | — | |
Queensland Waste Management and Resource Recovery Strategy | | | — | | | | 176.868 | | | | 22.934 | | | | 23.054 | | | | 24.240 | |
Regional Arts Services Network | | | — | | | | 1.500 | | | | 1.500 | | | | 1.500 | | | | 1.500 | |
Regional Communities Program | | | (0.500 | ) | | | 2.378 | | | | 2.328 | | | | 2.389 | | | | 2.485 | |
Remote Indigenous Land and Infrastructure Program Office | | | — | | | | 4.469 | | | | — | | | | — | | | | — | |
Responding to Fall Armyworm | | | — | | | | 1.485 | | | | 1.518 | | | | — | | | | — | |
Revitalising National Parks | | | — | | | | 3.420 | | | | — | | | | — | | | | — | |
143
Budget Strategy and Outlook 2021-22
| | | | | | | | | | | | | | | | | | | | |
Expense measures | | 2020–21
$ million | | | 2021–22
$ million | | | 2022–23
$ million | | | 2023–24
$ million | | | 2024–25
$ million | |
Roadside Drug Testing | | | — | | | | 1.045 | | | | 1.045 | | | | 1.045 | | | | 1.045 | |
Royal Commission into National Natural Disaster Arrangements | | | — | | | | 4.597 | | | | 3.705 | | | | 1.241 | | | | 1.267 | |
School Infrastructure | | | — | | | | 51.564 | | | | 27.737 | | | | 18.494 | | | | 18.706 | |
Skilling Queenslanders for Work | | | — | | | | 80.000 | | | | 80.000 | | | | 80.000 | | | | 80.000 | |
South East Queensland Community Stimulus Program | | | — | | | | — | | | | 40.000 | | | | 10.000 | | | | 50.000 | |
South East Queensland Koala Conservation Strategy | | | — | | | | 0.897 | | | | 0.919 | | | | 0.942 | | | | 0.965 | |
South East Queensland Wildlife Hospital Network | | | — | | | | 1.500 | | | | 1.500 | | | | 1.500 | | | | 1.500 | |
Southern Downs Drought Resilience Package | | | — | | | | 3.360 | | | | 4.980 | | | | — | | | | — | |
Special Equity and Diversity Commissioner | | | 0.183 | | | | 0.242 | | | | 0.215 | | | | 0.299 | | | | 0.385 | |
State Kindergarten Funding | | | — | | | | 22.924 | | | | 56.673 | | | | 59.302 | | | | 63.955 | |
Strengthening Coronial Services | | | — | | | | 1.154 | | | | 1.011 | | | | 1.011 | | | | 1.011 | |
Strengthening Timely Access to Justice for Queenslanders | | | — | | | | 6.095 | | | | 4.497 | | | | 1.209 | | | | 1.239 | |
Support for Disability Services Clients Ineligible for the NDIS | | | — | | | | 1.833 | | | | 1.833 | | | | 1.833 | | | | 1.833 | |
Supporting the Children’s Court | | | — | | | | 1.139 | | | | 1.139 | | | | 1.139 | | | | 1.139 | |
Swimmer Safety including the Shark Control Program | | | — | | | | 4.209 | | | | 4.118 | | | | 4.169 | | | | 4.220 | |
Tackling Alcohol Fuelled Violence | | | — | | | | 6.252 | | | | — | | | | — | | | | — | |
Victim Assist Queensland | | | — | | | | 1.000 | | | | 1.000 | | | | 1.000 | | | | 1.000 | |
144
Budget Strategy and Outlook 2021-22
| | | | | | | | | | | | | | | | | | | | |
Expense measures | | 2020–21
$ million | | | 2021–22 $
million | | | 2022–23
$ million | | | 2023–24
$ million | | | 2024–25
$ million | |
Wanding Trial in Gold Coast Safe Night Precincts | | | — | | | | 1.000 | | | | — | | | | — | | | | — | |
Women in Custody | | | — | | | | 2.707 | | | | — | | | | — | | | | — | |
Works for Queensland | | | — | | | | — | | | | — | | | | — | | | | 100.000 | |
World Science Festival Brisbane (2022– 2024) | | | — | | | | 3.000 | | | | 3.000 | | | | 3.000 | | | | — | |
Youth Detention Centre Capacity – Detailed Business Case | | | — | | | | 5.700 | | | | — | | | | — | | | | — | |
Youth Detention Centre Capacity – Short Term Remand Centre | | | — | | | | 2.893 | | | | 2.772 | | | | 2.831 | | | | 2.911 | |
Youth Drug and Alcohol Treatment Centre | | | — | | | | 0.200 | | | | 2.500 | | | | 2.500 | | | | 2.500 | |
Youth Justice Investment | | | 2.778 | | | | 48.033 | | | | 27.381 | | | | 6.072 | | | | 6.174 | |
| | | | | | | | | | | | | | | | | | | | |
Total Expense Measures | | | 3.268 | | | | 1,889.179 | | | | 811.047 | | | | 545.050 | | | | 640.652 | |
| | | | | | | | | | | | | | | | | | | | |
145
Budget Strategy and Outlook 2021-22
| Table 7.2 | Capital Measures |
| | | | | | | | | | | | | | | | | | | | |
Capital measures | | 2020–21
$ million | | | 2021–22
$ million | | | 2022–23
$ million | | | 2023–24
$ million | | | 2024–25
$ million | |
Arts Infrastructure Investment Fund | | | — | | | | 4.375 | | | | 4.375 | | | | 4.375 | | | | — | |
Building Future Schools Program | | | — | | | | 124.463 | | | | 332.407 | | | | 216.229 | | | | 100.904 | |
Camera Detected Offence Program | | | (0.464 | ) | | | (33.424 | ) | | | (7.959 | ) | | | 16.733 | | | | 27.503 | |
Comprehensive Vegetation Mapping and Reporting | | | — | | | | 0.011 | | | | 0.011 | | | | — | | | | 0.006 | |
Health COVID-19 Response including mandatory quarantine | | | — | | | | 18.000 | | | | — | | | | — | | | | — | |
Double Up Bunk Beds in Correctional Facilities | | | — | | | | 8.000 | | | | — | | | | — | | | | — | |
Environmental Markets and Investment | | | — | | | | 35.350 | | | | 2.200 | | | | 0.690 | | | | 0.690 | |
Former Queensland Agricultural Training Colleges’ Asset Transition | | | — | | | | 4.650 | | | | 1.000 | | | | 0.200 | | | | — | |
Gold Coast Light Rail (Stage 3) | | | — | | | | — | | | | — | | | | — | | | | 50.000 | |
Government Science Platform | | | — | | | | 2.138 | | | | 2.799 | | | | 2.790 | | | | — | |
Housing for Queensland’s Frontline Workers | | | — | | | | 7.500 | | | | — | | | | — | | | | — | |
Managing and Maintaining Abandoned Mines Sites | | | — | | | | 1.030 | | | | — | | | | — | | | | — | |
Mater Public Hospital Springfield1 | | | — | | | | — | | | | — | | | | — | | | | — | |
Olympics Preparations | | | — | | | | 0.550 | | | | — | | | | — | | | | — | |
Parliamentary Annexe Critical Infrastructure and Services Upgrade (Stage 2) | | | — | | | | — | | | | 39.929 | | | | — | | | | — | |
Queensland Building and Fairness Reforms | | | — | | | | 0.383 | | | | 0.391 | | | | — | | | | — | |
Queensland Government Air | | | — | | | | 2.822 | | | | — | | | | — | | | | — | |
Queensland Health Base Capital Program | | | — | | | | 60.000 | | | | 60.000 | | | | — | | | | — | |
Queensland Reef Water Quality Program | | | — | | | | — | | | | 0.406 | | | | 0.902 | | | | 0.104 | |
| 1 | Project is subject to commercial negotiations. |
146
Budget Strategy and Outlook 2021-22
| | | | | | | | | | | | | | | | | | | | |
Capital measures | | 2020–21
$ million | | | 2021–22
$ million | | | 2022–23
$ million | | | 2023–24
$ million | | | 2024–25
$ million | |
Queensland Renewable Energy and Hydrogen Jobs Fund | | | — | | | | 100.000 | | | | 200.000 | | | | 100.000 | | | | 100.000 | |
Queensland’s Waste Management and Resource Recovery Strategy | | | — | | | | 1.500 | | | | 0.100 | | | | 4.900 | | | | — | |
Remediating Queensland Cultural Centre Cladding | | | — | | | | 3.250 | | | | — | | | | — | | | | — | |
Renewing Queensland Cultural Centre Critical Infrastructure | | | — | | | | 7.650 | | | | 9.680 | | | | 5.700 | | | | 7.250 | |
Revitalising National Parks | | | — | | | | 5.200 | | | | — | | | | — | | | | — | |
School Infrastructure | | | — | | | | 176.288 | | | | 135.550 | | | | 40.000 | | | | 40.000 | |
Thomas Dixon Centre Redevelopment | | | 18.185 | | | | 1.595 | | | | — | | | | — | | | | — | |
Toowoomba Day Surgery Theatre at the Baillie Henderson Hospital | | | — | | | | 5.900 | | | | 6.000 | | | | 23.000 | | | | 7.100 | |
Youth Detention Centre Capacity – Short Term Remand Centre | | | 0.500 | | | | 4.500 | | | | — | | | | — | | | | — | |
Youth Justice Investment | | | 7.450 | | | | 0.520 | | | | — | | | | — | | | | — | |
| | | | | | | | | | | | | | | | | | | | |
Total Capital Measures | | | 25.671 | | | | 542.251 | | | | 786.889 | | | | 415.519 | | | | 333.557 | |
| | | | | | | | | | | | | | | | | | | | |
| Table 7.3 | Revenue Measures |
| | | | | | | | | | | | | | | | | | | | |
Revenue measures | | 2020–21
$ million | | | 2021–22
$ million | | | 2022–23
$ million | | | 2023–24
$ million | | | 2024–25
$ million | |
12-month extension of the 50% Apprentice and Trainee Payroll Tax Rebate | | | — | | | | (31.200 | ) | | | — | | | | — | | | | — | |
| | | | | | | | | | | | | | | | | | | | |
Total Revenue Measures | | | — | | | | (31.200 | ) | | | — | | | | — | | | | — | |
| | | | | | | | | | | | | | | | | | | | |
147
Budget Strategy and Outlook 2021-22
| 8 | Intergovernmental financial relations |
Features
| • | | The Australian Government collects 70.9 per cent of all government revenue, a large proportion of which is transferred to states and territories (states), which are primarily responsible for service delivery and infrastructure provision. |
| • | | Federal financial relations are critical to Queensland’s ongoing recovery. Given the Australian Government’s greater revenue-raising capacity, it is well-positioned to undertake and fund broad economic stimulus and income support measures where necessary to support businesses, communities and households. |
| • | | It is also critical that the Australian Government invests in productivity-enhancing and critical social infrastructure needed to support the Queensland Government’s efforts to drive ongoing productivity and economic growth, and deliver essential services to Queensland’s growing population. |
| • | | However, the Australian Government’s planned large tax cuts for high-income earners, at a time when it is already experiencing structural deficit, is likely to erode its fiscal capacity and may lead to it reducing support for Queensland infrastructure and services. |
| • | | The Australian Government and state and territory governments continue to implement the new National Cabinet governance model, developed in the context of the COVID-19 crisis, and develop new funding and service delivery arrangements to meet the future demand for essential services. |
| • | | Australian Government payments represent approximately 49 per cent of all of Queensland’s General Government revenue. |
| • | | It is estimated the Australian Government will provide the Queensland Government with $30.966 billion1 in 2021–22 ($639 million more than in 2020–21), comprising: |
| | • | | $15.350 billion2 in payments for specific purposes ($167 million less than 2020–21) |
| | • | | $15.616 billion in payments for general purposes ($807 million more than 2020–21). |
| • | | Payments for specific purposes in 2021–22 comprise: |
| | • | | $5.814 billion for National Health Reform funding |
| | • | | $5.630 billion for Quality Schools funding3 |
| | • | | $3.253 billion for National Partnership payments (Infrastructure Investment Program, Disaster Recovery Funding Arrangements and COVID-19 response payments) |
| | • | | $334 million for National Housing and Homelessness funding |
| 1 | Queensland Treasury estimate. Differs from estimate in Chapter 4, which also includes direct Australian Government payments to Queensland agencies for Australian Government own purpose expenditure. |
| 2 | Total payments for specific purposes may not add due to rounding. |
| 3 | Quality Schools funding includes payments for government schools (exclusive of GST) and non-government schools (inclusive of GST). |
148
Budget Strategy and Outlook 2021-22
| | • | | $320 million for National Specific Purpose Payments (National Skills and Workforce Development). |
| • | | Payments to Queensland for specific purposes will be lower in 2021–22 primarily due to: |
| | • | | additional back payment from the DisabilityCare Australia Fund in 2020–21 |
| | • | | payments for roads infrastructure in 2020–21, including funding for the National Land Transport Network, stimulus packages and other accelerated payments |
| | • | | one-year funding in 2020–21 for the JobTrainer Fund |
| | • | | additional funding provided in 2020–21 only for remote Indigenous housing. |
| • | | Payments for general purposes relate to GST revenue. In 2021–22, Queensland expects to receive $15.616 billion of GST revenue (including $24 million in Horizontal Fiscal Equalisation (HFE) transition payments). This is $807 million (5.4 per cent) more than in 2020–21. This is primarily due to an increase in the national GST pool, reflecting economic recovery from the COVID-19 crisis, and the Commonwealth Grants Commission recommending Queensland receive a larger share of GST. |
| • | | Queensland has 14 funding agreements expiring in 2020–21. While national funding was allocated in the 2021–22 Federal Budget to continue support in most of these areas, 2 of these agreements had no funding allocated beyond 2020–21. In relation to the remaining 12 policy areas, state funding allocations are yet to be determined and/or funding is to be provided under yet to be negotiated funding agreements. |
| • | | Of note, funding for public dental services for adults has been extended for another year to 2021–22, while the National Partnership Agreement on Universal Access to Early Childhood Education will initially be replaced by a new 4-year funding agreement covering the 2022 to 2025 preschool years. |
| • | | The Queensland Government provides considerable assistance to local governments, recognising the important services they provide to the community. In particular, a number of state grant programs are provided specifically to Indigenous councils, recognising the higher cost of providing services in remote locations. |
| • | | In 2021–22, the Queensland Government will provide a total of $1.447 billion in grants to local governments. |
| 8.1 | Federal financial arrangements |
National governance
In May 2020, the Australian Government and state and territory governments agreed to new national governance arrangements.
First Ministers agreed to cease the Council of Australian Governments and permanently establish National Cabinet. National Cabinet meets regularly and is the intergovernmental forum for all First Ministers. National Cabinet is supported by National Cabinet Reform Committees covering priority areas of Health, Skills, Energy, Infrastructure and Transport, and Rural and Regional Development. Similarly, Treasurers meet as the Council on Federal Financial Relations.
149
Budget Strategy and Outlook 2021-22
The National Federation Reform Council (NFRC) was additionally established to address new areas of reform. The NFRC meets annually and is comprised of First Ministers, Treasurers and the Australian Local Government Association.
Vertical fiscal imbalance
Federal financial relations in Australia are characterised by different levels of government sharing responsibility for raising revenue and delivering services to communities.
The Australian Government has greater capacity to raise revenue than is required to meet its service delivery responsibilities. Conversely, states’ ability to raise revenue is less than required to meet their service delivery and infrastructure responsibilities. This is called vertical fiscal imbalance (VFI) and requires the sharing of revenue between the Australian Government and states.
In 2019–20, the Australian Government collected the majority of government revenue (70.9 per cent), while states collected 22.7 per cent and local governments the remaining 6.4 per cent1. Chart 8.1 illustrates the revenue and expense disparity between the different levels of government.
| Chart 8.1 | Own-source revenue and expenses by levels of government, 2019–201,2 |
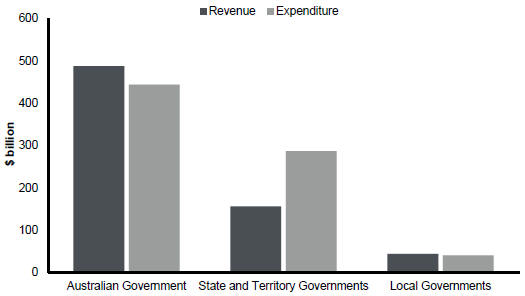
Notes:
| 1. | Revenue calculated as total revenue minus grant revenue. |
| 2. | Expenses calculated as total expenses minus grant expenses. |
Source: ABS Government Finance Statistics.
| 1 | ABS Government Finance Statistics. |
150
Budget Strategy and Outlook 2021-22
In Australia, VFI is addressed through a system of intergovernmental payments from the Australian Government to the states to address this imbalance between revenue raised and service delivery and infrastructure responsibilities. The Australian Government makes 2 types of payments in this regard:
| • | | general revenue assistance payments (largely GST revenue) which can be used by states for any purpose (‘untied’ funding) |
| • | | payments for specific purposes (‘tied’ funding) such as National Specific Purpose Payments (SPPs), which are a contribution toward states’ service delivery priorities, and National Partnership (NP) payments, which represent funding to support the delivery of specific outputs or projects and to facilitate or incentivise reforms. |
Given the Australian Government’s significant revenue raising capability, states are heavily reliant on these intergovernmental transfers in order to provide essential services and infrastructure to their communities.
Horizontal fiscal imbalance and horizontal fiscal equalisation
Another feature of federal financial relations is horizontal fiscal imbalance (HFI), which arises from disparities between the states’ capacity to raise revenue and deliver services.
Some states can raise higher revenue and/or deliver services at a lower cost compared to other states, therefore providing the capacity to offer higher levels of services. Over time, absent of any equalisation, this would distort capital and labour mobility towards states providing a higher level of services.
To address HFI, GST revenue collected by the Australian Government is distributed to states with the objective of ensuring all Australians can expect to receive a comparable level of services and infrastructure, regardless of the state they reside in. This is known as horizontal fiscal equalisation (HFE). The Commonwealth Grants Commission (CGC) uses the principle of HFE in recommending to the Australian Government how GST revenue should be distributed to the states.
| 8.2 | Australian Government funding to the states |
In total across all states, the Australian Government estimates that it will provide funding of $148.982 billion in 2021–22, $6.531 billion (4.6 per cent) more than in 2020–21, comprising:
| • | | $72.530 billion in payments as shares of general revenue assistance including GST revenue ($2.770 billion more than in 2020–21) |
| • | | $73.794 billion in payments for specific purposes ($3.072 billion more than in 2020–21) including: |
| | • | | $25.6 billion in National Health Reform funding, including $410.9 million in COVID-19 public health response funding |
| | • | | $24.439 billion in Quality Schools funding |
| | • | | $1.616 billion in National Housing and Homelessness funding |
151
Budget Strategy and Outlook 2021-22
| | • | | $20.562 billion in National Partnership payments (e.g. Infrastructure Investment Program, HomeBuilder and DisabilityCare Australia Fund) including COVID-19 initiatives1 such as: |
| | • | | $1.516 billion for HomeBuilder |
| | �� | | $339.1 million for the JobTrainer Fund |
| | • | | $130 million for family, domestic and sexual violence responses. |
| | • | | $1.578 billion in National Specific Purpose Payments (National Skills and Workforce Development). |
| • | | $2.658 billion in other payments to states, including: |
| | • | | $2.115 billion for GST top-up payments to Western Australia |
| | • | | $376.9 million for certain royalty payments to Western Australian |
| | • | | $41.7 million for municipal services to the Australian Capital Territory. |
Australian Government payments for specific purposes may not fully fund all underlying programs. Some require states to provide matching contributions (e.g. JobTrainer Fund) or other, significant financial or in-kind contributions (e.g. Disaster Risk Reduction). This reduces budget flexibility for states, particularly where it is not a Queensland Government priority, or the Australian Government dictates specific conditions related to the funding.
| 1 | Queensland contributes to COVID-19 initiatives, including the COVID-19 public health response and the JobTrainer Fund. |
152
Budget Strategy and Outlook 2021-22
| Box 8.1 | Eroding Australian Government fiscal capacity – a material risk to Queensland |
In the 2021–22 Federal Budget, the Australian Government forecast that its net debt will grow to $980.6 billion by 2024–25.
A key contributor is that the Australian Government forecasts underlying cash deficits totalling $342.4 billion from 2020–21 to 2024–25, with expectations that the Federal Budget will still be in deficit by $57 billion (9.0 per cent of Australian Government estimated expenditure) in 2024–25. Despite these ongoing deficits, the Australian Government plans to pursue Stage 3 income tax cuts in 2024–25.
This presents a material long-term risk to all states. As a function of federal financial relations, the Australian Government has greater revenue raising capacity than states and territories. It collects approximately 70.9 per cent of tax revenue in Australia. A proportion of this revenue then flows to states in the form of Australian Government payments (general revenue assistance and payments for specific purposes).
Queensland will receive approximately $31 billion in Australian Government payments in 2021–22 (about 50 per cent of the state’s total revenue).
In addition to pursuing income tax cuts, it is likely that the Australian Government will seek to reduce its payments to states, thereby requiring states to increase their level of funding or reduce services.
This would not be the first time an Australian Government has sought to reduce its expenses in this manner. In the 2014–15 Federal Budget, the Australian Government foreshadowed reducing its contributions to state-run public hospitals and schools by more than $80 billion in the period to 2024–25. This was met with significant resistance from states and eventually reversed.
Alternatively, it may look to apply generic cost benchmarks, ignoring a state’s actual costs of service delivery, as has been evident in recent negotiations of funding agreements. This represents an effective cut in payments without a headline arbitrary cut.
The Queensland Government will continue to advocate that the Australian Government provide an appropriate level of funding to support the state’s delivery of essential infrastructure and services to all Queenslanders across the state.
153
Budget Strategy and Outlook 2021-22
| 8.3 | Australian Government funding to Queensland |
It is estimated the Australian Government will provide the Queensland Government with $30.966 billion in 2021–22 ($639 million more than in 2020–21).
Australian Government funding is estimated to account for 49 per cent of Queensland’s total General Government Sector revenue sources in 2021–22 (shown in Chart 8.2). The proportion of Queensland’s revenue derived from Australian Government funding has grown significantly from 35 per cent1 at the time of the introduction of the GST in 2000.
| Chart 8.2 | General Government Sector revenue sources, Queensland 2021–221,2,3 |
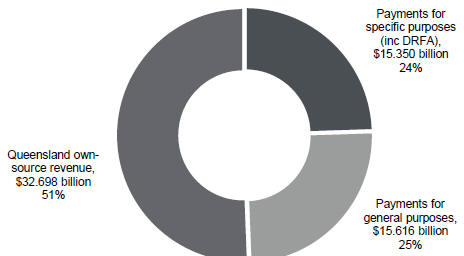
Notes:
| 1. | Queensland own-source revenue figure includes direct Australian Government payments to Queensland departments for Australian Government own-purpose expenditure (e.g. financial assistance grants to local government and funding to HHS’s). |
| 2. | Queensland Treasury estimates. Differs from Chapter 4 due to the inclusion of direct Australian Government payments to Queensland agencies for Australian Government own purpose expenditure. |
| 3. | Queensland own-source revenue includes taxation revenue, sales of goods and services and royalties and land rents. |
Sources: 2021–22 Federal Budget Paper No. 3 and Queensland Treasury estimates.
| 1 | Per cent of Queensland’s revenue derived from Australian Government Funding in 1999–00. |
154
Budget Strategy and Outlook 2021-22
| Box 8.2 | Queensland’s ongoing need for a fair share of Australian Government funding |
Queensland has a large, diverse and geographically dispersed population that presents unique service delivery challenges.
Historically, the Australian Government has recognised these challenges by providing Queensland with a greater share of Australian Government payments for specific purposes.
While the value of payments to Queensland is estimated to increase, Queensland’s share of national funding is set to decrease. The 2021–22 Federal Budget announced that the Australian Government intends to decrease Queensland’s share of these payments over the next 2 years. In 2020–21, Queensland received 23.11 per cent of Australian Government payments, but this decreases to 21.55 per cent and 21.78 per cent in 2021–22 and 2022–23, respectively.
This occurs at a time when Queensland is experiencing faster population growth than any other state, with the Queensland Government needing to fund the necessary infrastructure and essential services to meet the demands of this growing population, the vast majority of whom are coming to Queensland from other states and territories.
Instead of supporting this growth in Queensland, the Australian Government has indicated it will increase investment elsewhere. For example, it will boost infrastructure payments to New South Wales and Victoria by at least $3 billion each, while directing only an additional $1.6 billion to Queensland.
This comes on the back of other decisions made by the Australian Government in recent years that have impacted on other major payments to Queensland, including GST revenue.
The Commonwealth Grants Commission independently calculates states’ shares of GST revenue based on their relative revenue raising capacity and service delivery needs. As such, states with greater revenue raising capacity (e.g. Western Australia with mining royalties or New South Wales with transfer duty) require lesser shares of GST revenue and states with greater service delivery needs (e.g. Queensland) require greater shares of GST revenue.
However, in recent years, the Australian Treasurer has intervened in this process by directing the Commission to quarantine a range of Australian Government payments from their calculations. This artificially reduces some states’ revenue raising capacities and guarantees them more GST, to Queensland’s detriment.
In the last 6 years, the Australian Treasury has quarantined 24 Australian Government payments, but only one of those payments has been for a Queensland-specific program, remote housing.
The Queensland Government continues to strongly advocate for the Australian Government to ensure that Queensland receives its fair share of Australian Government payments, and for equitable consideration of Queensland’s funding needs when determining the treatment of Australian Government payments in the context of GST.
155
Budget Strategy and Outlook 2021-22
In 2021–22, Queensland expects to receive $15.616 billion of GST revenue (including $24 million in HFE transition payments), an increase of $807 million (5.4 per cent) over 2020–21. This increase in GST revenue is primarily due to:
| • | | the Australian Government forecasting a substantial increase in the national GST pool in 2021–22 compared with 2020–21, reflecting the ongoing economic recovery from COVID-19 |
| • | | the Commonwealth Grants Commission (CGC) recommending to the Australian Government that Queensland should receive a larger share of GST. |
Average annual growth in GST revenue of around 5 per cent is forecast across the 4 years ending 2024–25.
Revisions to the GST pool
GST revenue is expected to grow across the forward estimates as the economy continues to recover from the impacts of the COVID-19 pandemic. Since the 2020–21 Federal Budget, the GST pool estimate is, in aggregate, around $26 billion higher over the years from 2020–21 to 2023–24.
In the 2021–22 Federal Budget, the Australian Government estimated the GST pool to total $72.53 billion in 2021–22, 4 per cent higher than 2020–21 and 9.7 per cent higher than forecast at the time of the 2020–21 Federal Budget.
Following growth of 4 per cent in 2021–22, the Australian Government forecast average annual growth of around 5 per cent in the GST pool over the 3 years to 2024–25.
Chart 4.9 compares GST revenue pool forecasts published in the 2020–21 Federal Budget and 2021–22 Federal Budget (including Final Budget Outcome for 2020–21), including the impacts of the Australian Government’s payments for horizontal fiscal equalisation transition.
156
Budget Strategy and Outlook 2021-22
| Chart 8.3 | Estimated GST and HFE transition payments to Queensland, 2018–19 to 2024–25 |
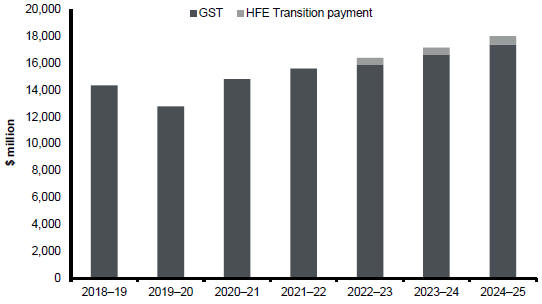
Source: 2021–22 Federal Budget Paper No. 3 and past federal budget papers
GST – Queensland’s assessed fiscal capacity
In early-2021, the Australian Government accepted the CGC’s recommendation that Queensland requires a larger share of GST revenue in 2021–22 compared to 2020–21. The CGC’s recommendation were driven by a range of factors, including the following:
| • | | below-average growth in the value of property sales and higher growth in national land tax revenue also increased Queensland’s assessed needs |
| • | | an increase in mining royalties for Western Australia led to a reduction in Queensland’s relative capacity to generate mining revenue |
| • | | these changes were partly offset by revisions to state natural disaster relief expenses and above average growth in Australian Government payments. |
States’ shares of GST revenue fluctuate based on the CGC’s assessment of their fiscal capacity and expenditure needs. The key drivers of changes to Queensland and all states’ shares of GST mainly include the impacts of changes in royalties from iron ore in Western Australia and transfer duty in New South Wales.
157
Budget Strategy and Outlook 2021-22
| Box 8.3 | Australian Government changes to state shares of GST |
In 2018, the Productivity Commission (PC) released a report on its Inquiry into Horizontal Fiscal Equalisation (HFE), the basis for determining states’ shares of GST revenue. The purpose of the Inquiry was to investigate how GST distribution influences productivity, efficiency and economic growth.
One of the key drivers of the Inquiry was the Western Australian Government’s claim that it carried a disproportionate burden in funding the federation because of its enhanced ability to raise mining royalties.
The Australian Government subsequently legislated changes to HFE in 2018 with the aim of improving the resilience of the HFE system against economic shocks and to reduce volatility.
Among the changes, states will no longer receive GST revenue to equalise them to the same standard as the fiscally strongest state. Instead states will be equalised to a ‘similar standard’. Effectively, this will see states being equalised to the second strongest state.
Most states, including Queensland, did not support the changes when they were announced. Queensland maintains that the purpose of HFE is to ensure that all states have equal opportunity to provide a high-level of service to Australians no matter where they live. As such, if a state’s capacity to raise own-source revenue increases, it should not need as much GST revenue to achieve this aim.
However, under the Australian Government’s changes, the fiscally strongest state will now retain a greater share of GST revenue at the expense of all other states.
The Australian Government’s changes are being implemented between 2019–20 and 2026–27. Changes only impacted Western Australia and the Northern Territory in the first 2 years, with all states impacted for the first time in 2021–22.
During the implementation and transition period (until end of 2026–27), states are protected from the adverse impacts of the changes by a ‘no worse off’ guarantee. Under the guarantee, the Australian Government will ensure that all states receive at least as much GST revenue as they would have under the previous system.
Queensland, like several other states, is concerned that these changes will ultimately lead to a fundamental reshaping of states’ fiscal capacities.
Under the Australian Government’s changes, Western Australia will benefit from heightened mining royalties without losing GST revenue. This will allow it to deliver more services, accrue less debt and implement lower taxes.
The Australian Government’s payments under the ‘no worse off’ guarantee are estimated to total $7.6 billion over the forward estimates. When the guarantee expires at the end of 2026–27, this cost will be borne by states unless the Australian Government responds appropriately.
158
Budget Strategy and Outlook 2021-22
In attempting to fix a perceived problem, the Australian Government’s unilateral changes could result in a substantial distortion of HFE and create a funding issue that states will need to grapple with in the future.
The Queensland Government, along with other states, will continue to engage with the Australian Government in advance of 2026–27 to provide greater certainty and fairness in relation to future GST payments in order to inform future state budgets.
| 8.5 | Payments to Queensland for specific purposes |
In 2021–22, Queensland expects to receive $15.350 billion in payments for specific purposes, $167 million (1.1 per cent) less than in 2020–21.
| Table 8.1 | Estimated payments to Queensland for specific purposes1 |
| | | | | | | | | | | | |
| | | 2019–20 | | | 2020–21 | | | 2021–22 | |
| | | Actual | | | Est. Act. | | | Budget | |
| | | $ million | | | $ million | | | $ million | |
Skills and Workforce Development National Specific Purpose Payment | | | 309 | | | | 315 | | | | 320 | |
National Health Reform funding2 | | | 5,392 | | | | 5,473 | | | | 5,814 | |
Quality Schools funding3 | | | 5,017 | | | | 5,155 | | | | 5,630 | |
National Housing and Homelessness funding | | | 321 | | | | 328 | | | | 334 | |
National Partnership payments (incl. DRFA) | | | 2,612 | | | | 4,247 | | | | 3,253 | |
Total payments for specific purposes | | | 13,651 | | | | 15,518 | | | | 15,350 | |
Notes:
| 1. | Numbers may not add due to rounding. |
| 2. | Includes funding for the COVID-19 public health response of $345.3 million in 2019–20, $229.7 million in 2020–21 and $83.2 million in 2021–22. |
| 3. | Quality Schools funding includes payments for government schools (exclusive of GST) and non-government schools (inclusive of GST). |
Sources: 2021–22 Federal Budget Paper No. 3, 2020–21 Queensland Budget Paper No. 2 and Queensland Treasury estimates.
Payments for specific purposes comprise funding for National Health Reform, Quality Schools, National Housing and Homelessness, the Skills and Workforce Development National Specific Purpose Payment (SPP) and National Partnership (NP) payments.
In 2021–22, National Health Reform funding, which accounts for 37.9 per cent of the total payments for specific purposes, is estimated to increase by $341 million (6.2 per cent) from 2020–21 in line with expected growth in hospital activity.
159
Budget Strategy and Outlook 2021-22
National Health Reform funding from 2019–20 to 2021–22 includes funding for the COVID-19 public health response ($345.3 million in 2019–20, $229.7 million in 2020–21 and $83.2 million in 2021–22). The COVID-19 public health response funding in 2019–20 included contracted payments made to private hospitals, which were covered 100 per cent by the Australian Government.
Queensland projections of National Health Reform funding differ from the projections contained in the 2021–22 Federal Budget, as Australian Government projections assume higher activity growth than projected in service agreements between the Queensland Department of Health and Hospital and Health Services. Actual National Health Reform payments vary from estimates provided in budget papers as they are based on actual public hospital activity delivered each year.
Quality Schools funding, which accounts for 36.7 per cent of the total payments for specific purposes, is estimated to increase by $475 million (9.2 per cent) to $5.630 billion in 2021–22.
National Housing and Homelessness funding is estimated to increase by $6 million (1.8 per cent) in 2021–22 due to additional funding allocated by the Australian Government in the 2021–22 Federal Budget to support social and community service workers in the housing and homelessness sectors. This funding is subject to further negotiation with the Australian Government.
The Skills and Workforce Development SPP is expected to increase by $5 million (1.6 per cent) in 2021–22 compared to 2020–21. The Australian Government and state and territory governments are currently working towards finalising a new National Skills Agreement to replace the National Agreement for Skills and Workforce Development.
NP payments (including Disaster Recovery Funding Arrangements (DRFA)), which account for 21.2 per cent of the total payments for specific purposes, are estimated to decrease by
$994 million (23.4 per cent) in 2021–22 compared to 2020–21. A significant proportion of NP payments is allocated to infrastructure, DRFA and community services (refer to Chart 8.4).
The reduction in payments for specific purposes between 2020–21 and 2021–22 is mainly due to:
| • | | an additional back payment in 2020–21 from the DisabilityCare Australia Fund for reimbursement of state expenditure on the National Disability Insurance Scheme in previous years |
| • | | significant Australian Government funding payments for roads infrastructure in 2020–21, including $400 million for the National Land Transport Network as part of the Inland Rail agreement, stimulus packages and other Australian Government payments accelerated in 2020–21 |
| • | | one-year funding for the JobTrainer Fund in 2020–21. In the 2021–22 Federal Budget, the Australian Government announced an extension to the JobTrainer Fund over 2 years, with matched contributions expected from states and territories1 |
| • | | additional funding in 2020–21 to Queensland to assist with costs associated with the provision of remote housing. |
| 1 | Funding not included in 2021-22, as subject to negotiation of agreement |
160
Budget Strategy and Outlook 2021-22
| Chart 8.4 | National Partnership Payments by sector, 2021–221 |
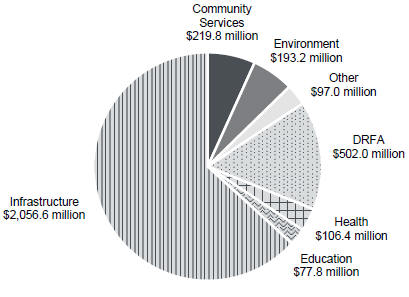
Note:
| 1. | Excludes Australian Government funding to local government and payments direct to Queensland Government departments for Australian Government own-purpose expenditure. |
Sources: 2021–22 Federal Budget Paper No. 3 and Queensland Treasury estimates.
| 8.5.1 | Projections of payments for specific purposes to Queensland |
Across the forward estimates, total payments for specific purposes are expected to steadily increase, with average growth of approximately 3.7 per cent between 2021–22 and 2024–25.
While increases in overall funding are welcome, having those payments tied to specific purposes and Australian Government criteria does impact states’ capacity to respond to local needs, reduces states’ budget flexibility, adds administrative costs, and impacts on the achievement of state policy outcomes and priorities. This negative impact is amplified when funding is conditional on states’ matching Australian Government funding, unrealistic timeframes, national price benchmarks and competing priorities.
Under the Addendum to the National Health Reform Agreement, the Australian Government will fund 45 per cent of efficient growth in hospital activity subject to a national growth cap of 6.5 per cent per annum. National Health Reform funding for Queensland is expected to increase broadly in-line with the conditions set by the Australian Government.
Growth in Quality Schools funding for Queensland is expected to average 4.5 per cent between 2021–22 and 2024–25 as a result of enrolment growth and increased funding per student. Queensland is expecting to receive $9.321 billion for state schools and $14.894 billion (including GST) for non-government schools from 2021–22 to 2024–25.
161
Budget Strategy and Outlook 2021-22
Subject to further negotiations with the Australian Government, funding under the National Housing and Homelessness Agreement is expected to increase in 2021–22 and 2022–23 due to additional funding to support social and community service workers in the housing and homelessness sectors.
Under the Intergovernmental Agreement on Federal Financial Relations, the Australian Government provides time-limited funding to states and territories through NP payments to support the delivery of specific projects, facilitate reforms or reward states that deliver on reforms or achieve service delivery improvements.
However, over time, some NPs have been extended beyond their intended time-limited purpose. NPs were never intended, and are not considered the optimal way, to fund ongoing community service needs.
Conversely, when NP agreements expire, states have been left with limited opportunities to deal with the expiring NP as the final decision on continued funding is made through the Australian Government’s budget process. The expiry of many large NPs over the last few years, such as the National Partnership on Remote Housing, which has required Queensland to invest approximately $100 million a year, has highlighted this risk.
Unilateral termination by the Australian Government of funding for essential programs, with little or no notice, impacts on states’ ability to plan, budget and continue delivering essential services to communities. Early indication as to the continuation, lapse or other treatment of funding for an expiring agreement is necessary to enable states to effectively manage their service delivery responsibilities.
There are 14 agreements1 expected to expire in 2020–21:
| • | | Improving trachoma control services for Indigenous Australians |
| • | | Encouraging more clinical trials in Australia |
| • | | Expansion of the BreastScreen Australia program |
| • | | Rheumatic fever strategy |
| • | | Public dental services for adults |
| • | | National Infection Control Training Fund |
| • | | North Queensland strata title inspection scheme |
| • | | COVID-19 domestic and family violence responses |
| • | | On-farm emergency water infrastructure rebate |
| • | | National varroa mite eradication program |
| • | | Implementing water reform in the Murray-Darling Basin |
| • | | Small business regulatory reform |
| • | | Remote self-isolation facilities. |
| 1 | Includes any expiring schedules to Federation Funding Agreements. |
162
Budget Strategy and Outlook 2021-22
Of these expiring agreements, the National Infection Control Training Fund and Remote self-isolation facilities have no funding allocated beyond 2020–21 in the 2021–22 Federal Budget.
National funding was allocated in the 2021–22 Federal Budget to continue support in the remaining 12 policy areas, however state funding allocations are yet to be determined and/or funding is to be provided under yet to be negotiated funding agreements.
The 2021–22 Federal Budget provides for a one-year extension for Public Dental Services for Adults to 2021–22. Queensland is expecting $21.7 million under the extension. While this funding is welcomed, short-term extensions create significant uncertainty for the sector and for Queenslanders who use these services. Queensland continues to advocate for a long-term funding arrangement from the Australian Government for this agreement.
The 2021–22 Federal Budget also committed funding over the forward estimates for Essential Vaccines ($18.7 million from 2020–21 to 2024–25), indicating broad support for the program’s continuation.
A further 17 agreements are expected to expire in 2021–22. Of note, the current National Partnership Agreement on Universal Access to Early Childhood Education only covers service delivery to 31 December 2021.
The 2021–22 Federal Budget also announced $1.6 billion nationally over 4 years from 2021–22 and then $589 million per year (indexed) to provide an ongoing Australian Government funding contribution to preschool. Funding for the 2022 to 2025 preschool years will be delivered through a new 4-year funding agreement to be negotiated with states and territories.
| 8.6 | State-local government financial relations |
The Queensland Government allocates considerable funding in the Queensland Budget to support local governments across the state. The Queensland Government acknowledges the shared responsibilities in serving the people of Queensland and the critical role local governments play in supporting their local communities.
In 2021–22, the Queensland Government will provide a total of $1.447 billion in grants to local governments.
This includes current, capital and asset grants to local government authorities and Indigenous councils, as well as Australian Government grants paid through the state to local governments.
Grants to local governments are delivered through numerous Queensland Government departments and agencies for a variety of purposes, including through the programs discussed below.
Significant stimulus delivered in response to the COVID-19 pandemic included the COVID Works for Queensland program and the Unite and Recover Community Stimulus Package. These initiatives have assisted Queenslanders in the ongoing economic recovery.
163
Budget Strategy and Outlook 2021-22
As part of the 2021–22 Queensland Budget, the Works for Queensland program received an additional $200 million and the SEQ Community Stimulus Program received an additional $150 million in funding, to enable investment in new infrastructure and community assets that create jobs in local communities.
A summary of grant programs that are exclusively available to local governments are listed in Table 8.2.
| Table 8.2 | Grant programs exclusively available to local governments |
| | | | |
Program name | | Description | | Total funding
( from 2015–16
to 2024–25) |
| Works for Queensland | | Supports local governments in regional areas to undertake job creating maintenance and minor infrastructure works. | | $900 million1 |
| COVID Works for Queensland | | Supports all local governments to respond to and recover from the COVID-19 pandemic to deliver job creating new infrastructure, maintenance or minor works projects. | | $200 million |
| South East Queensland (SEQ) Community Stimulus Program | | Supports South East Queensland local governments to fast-track investment in new infrastructure and community assets that create jobs and deliver economic stimulus to local communities. | | $150 million2 |
| Unite and Recover Community Stimulus Package | | Supports SEQ local governments to recover from the COVID-19 pandemic by fast-tracking investment in new infrastructure and community assets that create jobs and deliver economic stimulus to local communities. | | $50 million |
| Transport Infrastructure Development Scheme | | Provides targeted investment in regional local government transport infrastructure. Provides funding for critical infrastructure in regional | | $700 million |
| Building our Regions | | areas to support economic development, including generating jobs. | | $418.3 million3 |
| Local Government Grants | | Provides funding for priority infrastructure projects that | | $286.5 million4 |
| and Subsidies Program | | will enhance sustainable and liveable communities. | | |
| Coastal Hazard Adaptation | | Assists coastal local governments to prepare plans and | | $15 million |
| Program – QCoast2100 | | strategies for addressing the impact of climate change. | | |
| Queensland Water Regional Alliances Program | | Assists regional councils to collaborate and improve the efficiency and administration of water infrastructure. | | $6 million |
In addition to the above grant programs, the Queensland Government has signed the National Partnership Agreement on Disaster Risk Reduction, which is a 5-year partnership between the Australian Government and the states to support disaster mitigation projects and build resilience to natural disasters. This fund is administered by the Queensland Reconstruction Authority (QRA) and replaces the Queensland Disaster Resilience Fund.
| 1 | Total funding of $1 billion for Works for Queensland referenced in other sections of this budget paper relate to a longer time period. |
| 2 | Total funding of $200 million for SEQ Community Stimulus Program referenced in other sections of this budget paper relate to a longer time period. |
| 3 | Figure includes $70 million in new funding for Building our Regions Round 6. |
| 4 | Funding is ongoing. Figure is based on current projections. |
164
Budget Strategy and Outlook 2021-22
The QRA also administers the Disaster Recovery Funding Arrangements which is a joint funding initiative of the Queensland and Australian Governments to provide disaster relief and recovery payments to help communities recover following the effects of natural disasters. Under these arrangements the government administers significant funding (over $700 million) to provide disaster relief and assist with reconstruction of local government infrastructure damaged during natural disasters. The amount of funding administered is dependent on the final number and value of claims submitted.
The Queensland Government also understands there are added challenges faced by Indigenous councils, which are often located in very remote areas of the state, to ensure their communities have access to essential services and critical infrastructure. To address these challenges, the government has allocated substantial funding to specifically support Indigenous councils and their communities.
A summary of grant programs available to Indigenous councils and their communities are listed in Table 8.3.
Table 8.3 Grant programs to support Indigenous councils and their communities
| | | | |
Program name | | Description | | Total funding
(from 2015–16
to 2024–25) |
Indigenous Councils Critical Infrastructure Program | | Contributes to the cost of water, wastewater and solid waste infrastructure in Indigenous communities. | | $120 million |
Major Infrastructure Program | | Deliver environmental health and other infrastructure upgrades within the Torres Strait Island Regional Council, Torres Shire Council and Northern Peninsula | | $15 million |
State Government Financial Aid | | Area Regional Council areas. A financial contribution (in lieu of rates) to meet the costs incurred by Indigenous councils in the provision of local government services. | | $354.4 million1 |
Indigenous Local Government Sustainability Program (2016–18) | | Assisted Indigenous councils to increase their capacity, capability and sustainability. | | $8.2 million |
| 1 | Funding is ongoing. Figure is based on current projections. |
165
Budget Strategy and Outlook 2021-22
| 9 | Public Non-Financial Corporations Sector |
Features
| • | | Entities in the Public Non-financial Corporations (PNFC) Sector provide essential services such as electricity supply and distribution, bulk water supply, rail services and port services. The Queensland Government has a strong commitment to keeping these assets in public ownership, and expects these businesses to operate commercially and efficiently and to work towards continually improving services to Queenslanders. |
| • | | The government is supporting over $3.7 billion of infrastructure investment through the PNFC Sector in 2021–22. This includes over $2.24 billion on electricity infrastructure, $900 million on rail infrastructure, $320 million on water infrastructure and $240 million on port infrastructure. |
| • | | In 2020–21, the PNFC Sector is forecast to generate $419 million of dividends, although forecasts highlight declines in electricity sector revenues due to regulatory determinations and market dynamics. The reductions in network and wholesale prices are leading to lower electricity prices for Queenslanders. In addition, because the government owns these assets, dividends generated by government-owned corporations (GOCs) form part of consolidated revenue used to fund a range of government services. |
| • | | The government is delivering significant energy policy initiatives including the $2 billion Queensland Renewable Energy and Hydrogen Jobs Fund to enable energy GOCs to increase investment in commercial renewable energy and hydrogen projects, along with supporting infrastructure, including in partnership with the private sector. This represents a $1.5 billion increase to the existing $500 million Renewable Energy Fund. |
| • | | The government has committed $145 million to establish 3 Queensland Renewable Energy Zones (REZs) across Queensland. For the Northern Queensland REZ, the government is investing $40 million to upgrade transmission lines south of Cairns, enabling Neoen’s $370 million Kaban Green Power Hub to proceed and supporting 250 construction jobs. |
| • | | The government is delivering lower electricity prices for Queensland households and businesses. Over the period from 2017–18 to 2021–22, electricity bills for the typical regional Queensland household have fallen by over 17 per cent. In June 2021, the Queensland Competition Authority released its Final Determination for regulated regional electricity prices in 2021–22, with an average household expected to receive a 7.3 per cent reduction in their electricity bill in 2021–22, and average small and large businesses both expected to receive reductions of up to 3.7 per cent. |
| • | | Queensland Rail continues to work with external partners to progress significant new rail infrastructure including the Cross River Rail project, European Train Control Systems, new stations, and train stabling and station accessibility upgrades. |
166
Budget Strategy and Outlook 2021-22
| • | | Major port projects continuing in 2021–22 include the $232 million Townsville Channel Capacity Upgrade which will widen the existing sea channels and improve freight export and import opportunities for North Queensland. Planning is also underway for significant infrastructure upgrades at the Ports North Cairns Marine Precinct to support the Cairns marine industry, diversify the local economy and take advantage of emerging defence-related opportunities. |
| • | | Construction of the Rookwood Weir and associated infrastructure like roads and bridges is significantly progressed, jointly funded by the Queensland Government and Australian Government, and on track for completion in 2023. This project will grow agricultural production along the Fitzroy River and will ultimately enhance the security of urban and industrial water supplies for Gladstone and Capricorn Coast centres. |
Entities comprising the Public Non-financial Corporations (PNFC) Sector provide vital services such as electricity supply and distribution, water supply, and rail and port services.
Queensland government-owned corporations (GOCs), declared by regulation to be GOCs under the Government Owned Corporations Act 1993 (GOC Act), comprise a large share of the PNFC Sector. The sector also comprises commercialised statutory entities, including Queensland Rail, Queensland Bulk Water Supply Authority (trading as Seqwater), local water boards and other public corporations (such as Stadiums Queensland).
GOCs are accountable for their financial performance and are required to be commercial and efficient organisations. These requirements are legislated under the GOC Act, and similar provisions are made in the enabling legislation of Queensland Rail and Seqwater. The entities incur costs and bear commercial risks in the delivery of their services or products, and generate a commercial rate of return from the sale of these services or products.
Returns from the PNFC Sector contribute to consolidated revenue and are used to pay for various government services. A portion of PNFC revenue may arise from community service obligation (CSO) payments from the government. Such payments are used to subsidise particular services so they can be offered to the community at prices lower than would otherwise be possible if full cost recovery and normal margins were applied.
A key example is the CSO paid to Energy Queensland Limited (EQL) to provide electricity in regional Queensland at prices based on the costs of supply in South East Queensland, in accordance with the government’s Uniform Tariff Policy. This ensures that electricity prices in regional Queensland are much lower than would otherwise be the case.
The commercial nature of these entities ensures debt is self-supporting, and net worth continues to grow over the forward estimates. The Queensland Government’s ongoing commitment to maintaining public ownership of the entities in the PNFC Sector guarantees all Queenslanders benefit from their performance.
167
Budget Strategy and Outlook 2021-22
| Table 9.1 | Key financial aggregates1 |
| | | | | | | | | | | | | | | | | | | | | | | | | | | | |
| | | 2019–20 | | | 2020–21 | | | 2020–21 | | | 2021–22 | | | 2022–23 | | | 2023–24 | | | 2024–25 | |
| | | Outcome | | | Budget | | | Est. Act. | | | Projection | | | Projection | | | Projection | | | Projection | |
| | | $ million | | | $ million | | | $ million | | | $ million | | | $ million | | | $ million | | | $ million | |
Revenue | | | 13,589 | | | | 12,607 | | | | 12,418 | | | | 12,237 | | | | 11,958 | | | | 11,750 | | | | 11,967 | |
Expenses | | | 12,662 | | | | 11,981 | | | | 11,413 | | | | 11,463 | | | | 11,190 | | | | 11,070 | | | | 11,247 | |
Net Operating Balance | | | 927 | | | | 626 | | | | 1,006 | | | | 774 | | | | 768 | | | | 680 | | | | 720 | |
PNFA2 | | | 3,156 | | | | 3,460 | | | | 3,491 | | | | 3,713 | | | | 3,654 | | | | 3,297 | | | | 3,327 | |
Assets | | | 70,840 | | | | 70,887 | | | | 70,012 | | | | 71,678 | | | | 72,904 | | | | 74,092 | | | | 75,194 | |
Borrowing with QTC | | | 38,894 | | | | 39,967 | | | | 40,225 | | | | 40,655 | | | | 40,782 | | | | 40,978 | | | | 41,369 | |
Leases and other similar arrangements | | | 492 | | | | 468 | | | | 448 | | | | 405 | | | | 372 | | | | 338 | | | | 302 | |
Securities and derivatives | | | 1,315 | | | | 529 | | | | 68 | | | | 245 | | | | 142 | | | | 129 | | | | 134 | |
Notes:
| 1. | Numbers may not add due to rounding. |
| 2. | PNFA: Purchases of non-financial assets. |
| 9.1.1 | Electricity networks |
The government owns 2 electricity network businesses that are responsible for transmitting safe, reliable electricity to consumers across the state (Powerlink and Energy Queensland Limited).
Powerlink
Powerlink owns, develops, operates and maintains the electricity transmission network in Queensland. Its network spans approximately 1,700 km from north of Cairns to the New South Wales border, and comprises 15,338 km of transmission lines and 147 substations.
Powerlink’s role in the electricity supply chain is to transmit high voltage electricity through its transmission grid to the distribution networks.
Powerlink also transmits electricity to high-usage industrial customers such as rail companies, mines and mineral processing facilities, and to New South Wales via the Queensland/New South Wales interconnector transmission line.
Energy Queensland Limited (EQL)
EQL owns and operates the low-voltage distribution network that transmits electricity from Powerlink’s transmission network to households and businesses across Queensland. EQL includes a number of operating subsidiary businesses.
Ergon Energy Network and Ergon Energy Retail provide distribution network and customer retail services respectively in regional Queensland, while Energex provides distribution network services to customers within South East Queensland.
168
Budget Strategy and Outlook 2021-22
Yurika is also involved in a range of other service delivery functions including demand management services, large-scale connections, microgrid solutions, the provision of contestable metering services and telecommunications infrastructure. Yurika is focused on pursuing strategic investments in unregulated markets to provide greater choice to commercial and industrial customers, and to provide EQL with an enhanced ability to respond to emerging trends.
Network revenues
Revenues for the network businesses are largely derived from network services that are regulated by the Australian Energy Regulator (AER). The AER determines these revenues on a 5-yearly basis, based on the businesses’ proposals and its view of the reasonable benchmark efficient costs for a network business.
In January 2021, Powerlink submitted its revenue proposal to the AER for the 2022–27 period. The AER will publish draft and final decisions in October 2021 and April 2022, respectively.
Similarly, Energex and Ergon Energy Network, as electricity distribution providers, have their distribution charges for each 5-year period determined by the AER. The AER published its final decision in June 2020 for the 2020–25 regulatory control period, leading to significant electricity bill reductions for the average Queensland residential household and small business.
This AER revenue determination also led to a reduction in revenue and earnings for EQL relative to the previous AER regulatory period (2015–20), driven largely by a reduction in the allowable return on capital and a focus on reduced operating expenditure.
| 9.1.2 | Electricity generation |
Queensland is in a strong position to deliver reliable and affordable energy through significant baseload and renewable generation capacity.
Queensland continues to operate Australia’s youngest and most efficient fleet of coal-fired generators and an increasing number of large-scale renewable projects. This includes assets owned by government-owned generators – CleanCo, CS Energy, and Stanwell.
In March 2020, CleanCo announced it will build, own and operate the 102.6 megawatt (MW) Karara Wind Farm. In addition, the generators have entered into new long-term power purchase agreements with several wind and solar farms. With these investments, government-owned generators now own or support over 2,000 MW of renewable energy generation across Queensland.
The GOCs will play a key role in helping to deliver the government’s 50 per cent Queensland Renewable Energy Target by 2030.
CleanCo
CleanCo is the newest publicly owned energy generator in Queensland, owning and operating a portfolio of low and no emissions generation assets across Queensland. Following the transfer of a strategic low-emissions generation portfolio from Stanwell and CS Energy in late-2019, CleanCo has been an active participant in the National Electricity Market.
169
Budget Strategy and Outlook 2021-22
In addition to its foundation portfolio, in 2020, CleanCo committed to support a further 930 MW in renewable generation capacity. This will be achieved by 3 power purchase agreements in the Darling Downs and Far North Queensland and the 102.6 MW Karara Wind Farm in the Darling Downs, which the company will build, own and operate. As a result, CleanCo is well-progressed to meet its mandate to support 1,000 MW of new renewable energy generation capacity in Queensland by 2025 and deliver the government’s Renewables 400 reverse auction – involving CleanCo supporting 400 MW of new clean energy capacity at MacIntyre Wind Farm.
CS Energy
CS Energy is a major supplier of electricity across Queensland, with a portfolio of around 3,500 MW of installed capacity under management, including the Callide B and Kogan Creek Power Stations, and the Callide C Power Station, which it operates and has a 50 per cent ownership interest in. CS Energy is also a party to the Gladstone Interconnection and Power Pooling Agreement, and trades output of the Gladstone Power Station that exceeds the electricity requirements of the Boyne Island aluminium smelter
Since 2020, CS Energy has entered multiple agreements to purchase electricity from renewable energy generators, including with Moura, Warwick, Hughenden, and Columboola solar farms. CS Energy also provides retail services to large commercial and industrial customers throughout Queensland and has a 50/50 joint venture with Alinta Energy to supply electricity to residential and small business customers in South East Queensland. In partnership with Japan’s IHI Corporation, CS Energy will undertake a feasibility study into establishing a renewable hydrogen demonstration plant next to Kogan Creek Power Station near Chinchilla.
On 25 May 2021, a fire occurred at the Callide C Power Station. The cause of the incident is subject to an investigation.
Stanwell
Stanwell is a major supplier of electricity across Queensland, with a portfolio of around 3,300 MW of installed capacity from its 3 coal-fired power stations in Queensland. Stanwell also sells electricity directly to large commercial and industrial customers in Queensland, New South Wales, the Australian Capital Territory, and Victoria, and earns revenue from coking coal exported from Curragh Mine.
In 2020, Stanwell entered a long-term agreement to offtake 348 MW of renewable energy from the Clarke Creek Wind Farm. The wind farm is located around 150 km north-west of Rockhampton in Central Queensland, with construction commencing in 2021.
Notable ongoing feasibility investigations for Stanwell include: a hydrogen export facility in Gladstone as part of a consortium with Japan’s Iwatani Corporation; and partnering with Vast Solar to undertake a feasibility study into a concentrated solar thermal power plant to be located at Mount Isa, providing a potential long-term solution to lower cost power supply in the region. Stanwell is also assessing market responses to its expression of interest calling for renewable energy project opportunities.
170
Budget Strategy and Outlook 2021-22
Box 9.1 Renewable energy
Affordable and reliable energy supply is crucial to Queensland’s economic prosperity. Queensland’s clean energy policies underpin affordable and reliable energy, while supporting increased investment, jobs and economic growth. This includes the 50 per cent Queensland Renewable Energy Target by 2030 which will reduce emissions, help address climate change, create jobs and diversify the state’s economy.
Since 2015, 44 large-scale renewable energy projects have become operational, financially committed, or are under construction in Queensland. This represents around $10 billion in investment and more than 7,000 construction jobs. Once all projects are operational, Queensland will have more than 9,100 MW of small-scale and large-scale renewable energy capacity.
At the end of 2020, Queensland reached a significant milestone, at which point renewables were supplying over 20 per cent of our electricity demand. This significant investment in renewables is testament to Queensland’s world-class renewable energy resources. It is critical that Queensland continues to leverage this competitive advantage to support further investment and economic growth across the state, and to underpin the transition to a sustainable energy future.
In recognition of the crucial role the GOCs will play in Queensland’s energy transformation, the government has established the $2 billion Queensland Renewable Energy and Hydrogen Jobs Fund for energy GOCs to increase investment in commercial renewable energy and hydrogen projects, along with supporting infrastructure, including in partnership with the private sector. This will advance the State towards the renewable energy target, create jobs, and further establish Queensland as a leader in renewable energy and green-energy based economic development.
New GOC investment in renewables will complement the State���s existing portfolio of baseload generation assets, which will be critical to ensure security of electricity supply through Queensland’s energy transformation and support a growing manufacturing and resources sector.
The Queensland Government’s Economic Recovery Plan also included a commitment of $145 million to establish 3 Renewable Energy Zones across northern, central and southern Queensland. In these zones, the government will undertake strategic network investments, streamline the development of new renewable energy projects and work to match industrial energy demand with cheap, clean renewable energy.
9.1.3 Rail
Queensland Rail is an integrated, publicly owned rail operator, responsible for the delivery of passenger transport in South East Queensland, long distance passenger services in rural and regional Queensland and provision of third-party access to networks for freight transport across the state.
171
Budget Strategy and Outlook 2021-22
The majority of services are delivered under a Rail Transport Services Contract (TSC) with the government, represented by the Department of Transport and Main Roads. The Rail TSC provides funding for rail infrastructure, Citytrain (South East Queensland passenger services) and Traveltrain (regional passenger services).
In 2021–22, Queensland Rail will support the delivery of significant new rail infrastructure, including the Cross River Rail project by the Cross River Rail Delivery Authority and other transformational rail infrastructure projects to increase rail service delivery for the State’s growing population. These investments will support local manufacturing supply chains, as well as creating and maintaining jobs in regional areas.
Queensland has a large network of ports that are owned and run by GOCs along its coastline. These businesses, Gladstone Ports Corporation (GPC), North Queensland Bulk Ports Corporation (NQBP), Port of Townsville Limited (POTL), and Far North Queensland Ports Corporation (trading as Ports North), own and operate a range of assets from small facilities serving local communities to large, world class multi-user and multi-cargo ports, which have public and privately owned import and export facilities.
Queensland’s ports play an essential role in the state’s supply chain networks and economy, and their efficient operation is key to economic growth, job creation and sustainable development across the state.
Government-owned ports in regional areas will remain committed to supporting local communities recovering from the impacts of COVID-19 with Ports North expected to provide approximately $10 million in ongoing fee and rent relief to Far North Queensland’s tourism industry operators over the period from February 2020 to June 2022.
Government-owned ports will work with government on the ‘Backing Queensland Maritime Jobs’ initiative to create a new coastal shipping service, providing economic stimulus to regional Queensland and fostering growth and skills of a local maritime workforce.
Other port GOC projects continuing throughout 2021–22 include:
| • | | the $232 million Channel Capacity Upgrade at the Port of Townsville |
| • | | ongoing works at Gladstone Port Corporation’s RG Tanna Coal Terminal |
| • | | upgrading facilities at the Cairns Marine Precinct |
| • | | preparing Master Plans for the Ports of Cairns and Mourilyan to inform future capital investment in the Precinct |
| • | | working with proponents in Gladstone and Townsville to identify and progress potential Hydrogen opportunities at the respective ports. |
172
Budget Strategy and Outlook 2021-22
Box 9.2 Queensland’s hydrogen future
Queensland has the potential to lead the nation in the future production of hydrogen for both the domestic and export markets, with the development of this sector offering significant industry development and job opportunities across regional Queensland. Queensland is already providing direct investment in state-of-the-art training facilities to attract new workers to the industry, and supporting partnerships between Queensland GOCs and the private sector.
Queensland GOCs are leading research, development, and commercialisation opportunities for hydrogen production. The port and energy GOCs are ideally positioned to apply their skills, experience, and infrastructure towards advancing Queensland’s hydrogen future.
Various domestic and international opportunities are currently being explored by Queensland GOCs, including in partnership with other key stakeholders, such as:
| • | | POTL and Origin Energy signed a memorandum of understanding in April 2021 for the development of a hydrogen facility in Townsville. This includes investigating the potential expansion of POTL land, construction of a new berth and supporting infrastructure |
| • | | Stanwell announced the formation of a consortium with Japanese energy company, Iwatani Corporation, in November 2020 to progress studies and planning for a potential new renewable hydrogen export facility at Gladstone Port. This commitment follows Stanwell’s completion of its Central Queensland hydrogen concept study in 2020 |
| • | | CS Energy and IHI Corporation Japan announced a partnership in February 2021 to assess the feasibility of establishing a renewable hydrogen demonstration plant next to CS Energy’s Kogan Creek Power Station near Chinchilla. The concept includes the co-location of a solar farm, battery, hydrogen electrolyser and a hydrogen fuel cell. The focus of this project is a hydrogen electrolyser being powered by behind-the-meter solar energy, which would make it one of the few truly green hydrogen projects in Australia |
| • | | in March 2021, GPC signed a memorandum of understanding with Sumitomo Australia, Gladstone Regional Council, Australian Gas Infrastructure Group, and Central Queensland University to establish a Gladstone H2 Ecosystem which will enable parties to work together to identify and progress hydrogen opportunities in the region. |
These are important steps towards the government’s plan to build Queensland’s hydrogen industry and highlights the key role that regional Queensland will play in the hydrogen supply chain, with the potential to create thousands of regional jobs in the process.
The efforts of these GOCs will complement the role of the newly-established Queensland Hydrogen Taskforce to fast-track the planning, development, production, domestic use and export of hydrogen from Queensland.
173
Budget Strategy and Outlook 2021-22
The 2 largest entities in the Queensland bulk water supply industry are the Queensland Bulk Water Supply Authority (trading as Seqwater) and Sunwater Limited (Sunwater). Other water entities in the PNFC Sector include the Gladstone Area Water Board and Mount Isa Water Board.
Seqwater
Seqwater is responsible for supplying safe, secure and reliable bulk drinking water for people across South East Queensland. Its assets and operations are spread across a large geographic area from the New South Wales border to the base of the Toowoomba ranges and as far north as Gympie. Seqwater provides essential flood mitigation services and manages 7 water supply schemes which provide irrigation services.
Dams play a vital role in South East Queensland’s water supply. Seqwater has an ongoing Dam Improvement Program (DIP) to ensure the safety and reliability of its dams and compliance with dam safety guidelines into the future.
Key projects for Seqwater in 2021–22 include:
| • | | construction of the South West Pipeline to connect Beaudesert to the South East Queensland Water Grid to ensure a reliable long-term water supply |
| • | | further works at the Mount Crosby East Bank Water Treatment Plant, including refurbishment of water treatment plant filters and upgrading the substation to improve flood resilience |
| • | | planning activities for the Somerset Dam safety upgrade |
| • | | preparatory work for the Toowoomba to Warwick Pipeline. |
Drought conditions have seen a steady decline in South East Queensland dam levels since 2018, with Seqwater continuing to operate in a drought response mode. This includes utilising the Gold Coast Desalination Plant and South East Queensland Water Grid to preserve dam levels as well as continuing the water saving campaign to reduce water consumption. Further drought response measures may be required through 2021–22 if dam levels continue to fall.
Sunwater
Sunwater is the government’s major bulk water supply business for regions outside of South East Queensland. It supplies untreated bulk water to approximately 5,000 customers across the industrial, mining, urban and irrigation customer segments. Sunwater provides this through an extensive regional asset base, owning and managing water infrastructure assets with a replacement value of around $14 billion.
Dam safety is a major focus for Sunwater, as it is for all bulk water suppliers. Like Seqwater, Sunwater has an ongoing DIP to ensure the safety and reliability of its dams and compliance with dam safety guidelines into the future. The DIP is an essential works program and a key determinant of Sunwater’s financial performance over time.
174
Budget Strategy and Outlook 2021-22
Key projects for Sunwater in 2021–22 include:
| • | | progressing planning for the Paradise Dam improvement project to identify the optimal option to enhance the dam to meet future extreme weather events |
| • | | progressing planning for the Burdekin Falls Dam improvement project |
| • | | continuing investigations into potentially raising Burdekin Falls Dam |
| • | | continuing work to deliver efficiency improvements to the Mareeba-Dimbulah Water Supply Scheme. |
| 9.2 | Finances and performance |
| 9.2.1 | Earnings before interest and tax |
Total PNFC Sector earnings before interest and tax (EBIT) for 2020–21 of $2.717 billion are consistent with the $2.715 billion forecast at the 2020–21 Queensland Budget. Across the forward estimates, PNFC Sector EBIT is expected to increase to $2.851 billion by 2021–22 and decline to $2.085 billion by 2024–25, with a similar trend reflected across all sectors except ports.
The electricity network sector EBIT is estimated to fall by around one-third in 2020–21 (compared to 2019–20 levels) and remain lower over the forward estimates, driven by EQL’s regulated revenue determinations for the 2020–25 period and, to a lesser extent, by Powerlink’s upcoming regulated revenue determination for the 2022–2027 period (currently under review by the AER).
From 2021–22, electricity generation EBIT is forecast to decline year-on-year with wholesale price expectations remaining subdued over the forward estimates. Low and sustained wholesale electricity prices are expected over the forward estimates in Queensland and the broader National Electricity Market, driven by the increased penetration of renewable energy.
While recent and planned investments in renewable energy projects by Queensland GOCs will complement the portfolio of existing baseload assets, given the broader market forces, earnings from Queensland generation GOCs are expected to be generally lower over this period.
Port sector EBIT is forecast to trend upwards over the forward estimates, reflecting the various long-term revenue contracts supported by completion of revenue generating capital expansions.
Water sector EBIT in 2020–21 is expected to be $180 million higher than forecast at the 2020–21 Budget, due to deferred expensing of DIP works, as well accounting adjustments to reflect Sunwater’s specific liability for the 2011 South East Queensland Floods class action following a settlement agreement. Over the forward estimates, earnings are supported by the upwards trend associated with the South East Queensland bulk water price path, offset by expenses from Sunwater’s DIP.
175
Budget Strategy and Outlook 2021-22
| Table 9.2 | Earnings before interest and tax1 |
| | | | | | | | | | | | | | | | | | | | | | | | | | | | |
| | | 2019–20
Outcome
$ million | | | 2020–21
Budget
$ million | | | 2020–21
Est. Act.
$ million | | | 2021–22
Projection
$ million | | | 2022–23
Projection
$ million | | | 2023–24
Projection
$ million | | | 2024–25
Projection
$ million | |
Electricity Networks | | | 1,795 | | | | 1,179 | | | | 1,198 | | | | 1,276 | | | | 1,241 | | | | 1,185 | | | | 1,144 | |
Electricity Generation | | | (469 | ) | | | 572 | | | | 425 | | | | 478 | | | | 333 | | | | 119 | | | | 62 | |
Rail | | | 255 | | | | 301 | | | | 296 | | | | 335 | | | | 337 | | | | 294 | | | | 292 | |
Ports | | | 159 | | | | 192 | | | | 195 | | | | 209 | | | | 222 | | | | 245 | | | | 259 | |
Water | | | 255 | | | | 517 | | | | 697 | | | | 598 | | | | 595 | | | | 479 | | | | 435 | |
Other2 | | | (90 | ) | | | (45 | ) | | | (95 | ) | | | (45 | ) | | | (92 | ) | | | (100 | ) | | | (107 | ) |
Total PNFC Sector | | | 1,905 | | | | 2,715 | | | | 2,717 | | | | 2,851 | | | | 2,636 | | | | 2,222 | | | | 2,085 | |
Notes:
| 1. | Numbers may not add due to rounding. |
| 2. | Includes other public corporations. |
Entities in the PNFC Sector use debt financing as a source of funds for asset renewal and capital investments, and to maintain an optimal capital structure. Borrowings also include derivative liabilities associated with hedging activities undertaken by the GOCs.
PNFC Sector entities are required to take a prudent and sound approach to debt management, including the establishment of borrowing arrangements which are appropriate to the business risk of the organisation. These arrangements consider the appropriateness of the proposed capital expenditure program, together with the implications of borrowings on key financial and performance related indicators.
Importantly, PNFC sector entity asset values are a relevant factor in considering overall PNFC sector entity borrowings. On average, for 2020-21, PNFC sector entities borrow around 58 per cent of their asset values.
For the PNFC Sector as a whole, increases in borrowings are more than offset by increases in the value of total assets over time, with the ratio of borrowings to total assets falling to around 56 per cent by 2024-25.
Public ownership of electricity, port, rail and water infrastructure provides the Queensland Government with opportunities to achieve better outcomes for all Queenslanders. In the electricity sector, through public ownership, the government can put downward pressure on electricity prices by ensuring a safe and reliable supply of electricity while creating new jobs across the industry. The government monitors gearing levels of the GOCs to target metrics consistent with an investment grade credit rating and comparable with similar entities in their respective sectors.
176
Budget Strategy and Outlook 2021-22
Total PNFC Sector borrowings for 2020–21 are estimated to be $40.742 billion, or $222 million less than forecast at the 2020–21 Budget. The decrease is primarily due to a reduction in the value of derivative positions held by GOCs in the electricity generation sector, with falling wholesale electricity prices having a favourable price impact on liabilities.
Over the forward estimates, total PNFC Sector borrowings will remain relatively stable over the forward estimates, increasing to $41.806 billion by 2024–25, primarily driven by higher capital expenditure in the rail and electricity network sectors, and partly offset by reduced borrowings in the electricity generation sector (from unwinding of derivative positions and/or principal debt repayment) and water sector.
Borrowings in the water sector are largely attributable to Seqwater, which currently holds $9.426 billion of debt. This debt balance is the result of the large investment in water infrastructure in response to the Millennium Drought and the associated price path. Seqwater’s forecast borrowings reduce across the forward estimates, with price path debt repayment forecast to commence in 2021–22.
Port sector borrowings are forecast to increase modestly to $1.160 billion by 2024–25, with increases to fund major capital works and infrastructure projects by the Port of Townsville and Ports North.
| | | | | | | | | | | | | | | | | | | | | | | | | | | | |
| | | 2019–20 | | | 2020–21 | | | 2020–21 | | | 2021–22 | | | 2022–23 | | | 2023–24 | | | 2024–25 | |
| | | Outcome | | | Budget | | | Est. Act. | | | Projection | | | Projection | | | Projection | | | Projection | |
| | | $ million | | | $ million | | | $ million | | | $ million | | | $ million | | | $ million | | | $ million | |
Electricity Networks | | | 23,050 | | | | 23,830 | | | | 24,010 | | | | 24,255 | | | | 24,322 | | | | 24,454 | | | | 24,637 | |
Electricity Generation | | | 2,655 | | | | 1,845 | | | | 1,409 | | | | 1,571 | | | | 1,440 | | | | 1,450 | | | | 1,431 | |
Rail | | | 3,746 | | | | 4,093 | | | | 4,087 | | | | 4,412 | | | | 4,683 | | | | 4,898 | | | | 5,102 | |
Ports | | | 1,086 | | | | 1,090 | | | | 1,085 | | | | 1,113 | | | | 1,151 | | | | 1,160 | | | | 1,160 | |
Water | | | 9,985 | | | | 9,937 | | | | 9,982 | | | | 9,796 | | | | 9,553 | | | | 9,345 | | | | 9,346 | |
Other2 | | | 178 | | | | 169 | | | | 168 | | | | 158 | | | | 147 | | | | 138 | | | | 130 | |
Total PNFC Sector3 | | | 40,700 | | | | 40,964 | | | | 40,742 | | | | 41,306 | | | | 41,296 | | | | 41,445 | | | | 41,806 | |
Total Assets | | | 70,840 | | | | 70,887 | | | | 70,012 | | | | 71,678 | | | | 72,904 | | | | 74,092 | | | | 75,194 | |
Notes:
| 1. | Numbers may not add due to rounding. |
| 2. | Includes other public corporations. |
| 3. | Total PNFC Sector comprises borrowing with QTC, leases and other similar arrangements, and securities and derivatives. |
177
Budget Strategy and Outlook 2021-22
| 9.2.3 | Returns to government |
PNFC Sector entities provide returns to government by way of dividends and tax equivalent payments.
Dividends
Dividends generated by the PNFC Sector form part of consolidated revenue used to fund a range of government services. The GOC Act provides for the payment of dividends, with the dividend policies of GOCs determined by government. Each year, GOC boards make a dividend recommendation for government consideration.
Total PNFC Sector dividends for 2020–21 are expected to be $419 million, or $211 million less than forecast at the 2020–21 Budget, with increases in the electricity networks and water sectors more than offset by decreases in the electricity generation sector.
In the water sector, higher dividends in 2020–21 from Sunwater are due to deferred expensing of DIP works, while in the electricity generation sector, lower dividends correspond primarily to declining profitability from subdued wholesale electricity prices.
Over the forward estimates, lower expected profits translate into lower dividends, with decreases in the electricity networks and generation sectors from 2021–22 only partly offset by increases in the ports sector. Total PNFC Sector dividends are expected to rise to $568 million in 2021–22 then decline year-on-year to $456 million by 2024–25.
Electricity network dividends are expected to fall to $129 million in 2020–21, from $532 million in 2019–20, due to the AER’s revenue determination leading to an expected fall in EQL’s earnings, with a modest recovery thereafter.
Electricity generation dividends are lower in 2020–21 and 2021–22 relative to previous years, with the entry of significant volumes of renewables boosting supply into the grid and putting sustained downward pressure on wholesale electricity prices. Lower wholesale prices driven by the influx of renewable generation impacts all generators in the sector.
Given the soft market outlook, dividends from the GOC generation sector have not been assumed in the later years of the forward estimates. In addition, the recent incident at Callide Power Station is expected to reduce returns to government from CS Energy in 2020–21, although it is too early to ascertain any longer-term implications.
Ports sector dividends are forecast to increase over the forward estimates in line with earnings.
In the water sector, dividends are expected to be modest over the forward estimates due to the repayment of price path debt by Seqwater and DIP costs. At this stage, only the Mount Isa and Gladstone Area Water Boards are forecasting dividends from 2021–22.
178
Budget Strategy and Outlook 2021-22
| | | | | | | | | | | | | | | | | | | | | | | | | | | | |
| | | 2019–20 | | | 2020–21 | | | 2020–21 | | | 2021–22 | | | 2022–23 | | | 2023–24 | | | 2024–25 | |
| | | Outcome | | | Budget | | | Est. Act. | | | Projection | | | Projection | | | Projection | | | Projection | |
| | | $ million | | | $ million | | | $ million | | | $ million | | | $ million | | | $ million | | | $ million | |
Electricity Networks | | | 532 | | | | 106 | | | | 129 | | | | 188 | | | | 186 | | | | 165 | | | | 150 | |
Electricity Generation | | | 305 | | | | 278 | | | | 23 | | | | 98 | | | | .. | | | | .. | | | | .. | |
Rail | | | 119 | | | | 142 | | | | 141 | | | | 162 | | | | 204 | | | | 167 | | | | 153 | |
Ports | | | 110 | | | | 97 | | | | 101 | | | | 111 | | | | 121 | | | | 136 | | | | 144 | |
Water | | | 5 | | | | 8 | | | | 26 | | | | 10 | | | | 11 | | | | 10 | | | | 9 | |
Other2 | | | 15 | | | | .. | | | | .. | | | | .. | | | | .. | | | | .. | | | | .. | |
Total PNFC Sector | | | 1,086 | | | | 630 | | | | 419 | | | | 568 | | | | 523 | | | | 477 | | | | 456 | |
Notes:
| 1. | Numbers may not add due to rounding. |
| 2. | Includes other public corporations. |
Tax equivalent payments
Tax equivalent payments (TEPs) are paid by PNFC Sector entities to recognise the benefits derived because they are not liable to pay Australian Government tax. The primary objective of the payment is to promote competitive neutrality through a uniform application of income tax laws between the government-owned businesses and their private sector counterparts.
In line with the trend in earnings growth, TEPs are expected to increase from $379 million in 2020–21 to $444 million in 2021–22, and then decrease year-on-year to $285 million by 2024–25.
| Table 9.5 | Tax equivalent payments1 |
| | | | | | | | | | | | | | | | | | | | | | | | | | | | |
| | | 2019–20 | | | 2020–21 | | | 2020–21 | | | 2021–22 | | | 2022–23 | | | 2023–24 | | | 2024–25 | |
| | | Outcome | | | Budget | | | Est. Act. | | | Projection | | | Projection | | | Projection | | | Projection | |
| | | $ million | | | $ million | | | $ million | | | $ million | | | $ million | | | $ million | | | $ million | |
Electricity Networks | | | 358 | | | | 158 | | | | 159 | | | | 195 | | | | 198 | | | | 191 | | | | 187 | |
Electricity Generation | | | 232 | | | | 163 | | | | 117 | | | | 117 | | | | 68 | | | | 17 | | | | 13 | |
Rail | | | 55 | | | | 51 | | | | 40 | | | | 71 | | | | 56 | | | | 27 | | | | 11 | |
Ports | | | 56 | | | | 50 | | | | 50 | | | | 55 | | | | 60 | | | | 66 | | | | 68 | |
Water | | | 12 | | | | 4 | | | | 6 | | | | 5 | | | | 6 | | | | 5 | | | | 5 | |
Other2 | | | 3 | | | | 5 | | | | 5 | | | | 1 | | | | 1 | | | | .. | | | | .. | |
Total PNFC Sector | | | 716 | | | | 431 | | | | 379 | | | | 444 | | | | 387 | | | | 306 | | | | 285 | |
Notes:
| 1. | Numbers may not add due to rounding. |
| 2. | Includes other public corporations. |
179
Budget Strategy and Outlook 2021-22
Competitive Neutrality Fees
Competitive Neutrality policy requires that public sector businesses, including GOCs, should not have a competitive advantage (or disadvantage) over the private sector solely due to their government ownership. A key application of this policy is the competitive neutrality fee (CNF).
The CNF is applied to a GOC’s cost of debt to neutralise any cost of funds advantage by way of government ownership on the basis of GOCs’ ability to borrow funds at a lower rate than private sector competitors given the government’s credit strength.
In general, changes in CNF payments reflect movements in borrowing amounts, interest rate spreads and the entity’s stand-alone credit rating.
CNF payments by the PNFC Sector are expected to be $187 million in 2020–21, increasing year-on-year to 2024–25, primarily due to higher payments by EQL in accordance with an increase to its borrowings to fund capital expenditure. CNF payments by other sectors are largely unchanged over the forward estimates.
| Table 9.6 | Competitive neutrality fee payments1 |
| | | | | | | | | | | | | | | | | | | | | | | | | | | | |
| | | 2019–20 | | | 2020–21 | | | 2020–21 | | | 2021–22 | | | 2022–23 | | | 2023–24 | | | 2024–25 | |
| | | Outcome | | | Budget | | | Est. Act. | | | Projection | | | Projection | | | Projection | | | Projection | |
| | | $ million | | | $ million | | | $ million | | | $ million | | | $ million | | | $ million | | | $ million | |
Electricity Networks | | | 106 | | | | 118 | | | | 130 | | | | 150 | | | | 159 | | | | 166 | | | | 162 | |
Electricity Generation | | | 16 | | | | 15 | | | | 15 | | | | 14 | | | | 11 | | | | 10 | | | | 10 | |
Rail | | | 33 | | | | 27 | | | | 27 | | | | 25 | | | | 24 | | | | 27 | | | | 31 | |
Ports | | | 10 | | | | 10 | | | | 10 | | | | 10 | | | | 9 | | | | 8 | | | | 8 | |
Water | | | 5 | | | | 4 | | | | 4 | | | | 4 | | | | 5 | | | | 6 | | | | 6 | |
Total PNFC Sector | | | 170 | | | | 175 | | | | 187 | | | | 203 | | | | 209 | | | | 216 | | | | 217 | |
Notes:
| 1. | Numbers may not add due to rounding. |
| 9.2.4 | Community service obligation and rail transport services contract payments |
For public policy reasons, the government can direct GOCs to perform activities that are not in their commercial interest (for example, discounting rural irrigation water prices to stimulate the regional economy). In these situations, the government can compensate the GOC through the payment of a community service obligation (CSO) for the cost of delivering the uncommercial part of the good or service.
In line with the Queensland Government’s Uniform Tariff Policy, a CSO payment is provided to EQL to compensate its retail subsidiary, Ergon Energy, for the increased costs of operating in regional Queensland. This subsidy is provided to ensure Queenslanders, regardless of their geographic location, pay a similar price for their electricity.
180
Budget Strategy and Outlook 2021-22
Seqwater and Sunwater also own and operate water supply schemes, where irrigation prices for some schemes are set below the level necessary to recover the costs of supply. The government provides a CSO to offset the reduced revenue.
Similarly, TSC payments are made to Queensland Rail to deliver rail passenger services at non-commercial (subsidised) prices for commuter and tourism markets.
Total PNFC Sector CSO and TSC payments for 2020–21 are expected to be $2.414 billion, in line with the $2.434 billion forecast at the 2020–21 Budget. Over the forward estimates, CSO and TSC payments are expected to increase year-on-year to $2.725 billion by 2024–25. This trend is largely driven by TSC payments, which is due to a mix of factors such as changes in patronage, escalation of service delivery costs, progression of capital works and operational readiness activities to support Cross River Rail, and growth in the number of rail services offered.
Relative to 2020–21, water CSO payments are forecast to increase over the forward estimates, due to the government’s election commitment to discount rural irrigation water prices for Sunwater and Seqwater customers for the next 3 years. There is no CSO forecast in 2024–25 because irrigation prices have not yet been set beyond 2023–24.
| Table 9.7 | Community service obligation payments and transport services contracts1 |
| | | | | | | | | | | | | | | | | | | | | | | | | | | | |
| | | 2019–20 | | | 2020–21 | | | 2020–21 | | | 2021–22 | | | 2022–23 | | | 2023–24 | | | 2024–25 | |
| | | Outcome | | | Budget | | | Est. Act. | | | Projection | | | Projection | | | Projection | | | Projection | |
| | | $ million | | | $ million | | | $ million | | | $ million | | | $ million | | | $ million | | | $ million | |
Electricity Networks | | | 498 | | | | 454 | | | | 454 | | | | 502 | | | | 505 | | | | 490 | | | | 486 | |
Rail | | | 1,794 | | | | 1,959 | | | | 1,940 | | | | 2,074 | | | | 2,131 | | | | 2,163 | | | | 2,238 | |
Water | | | 9 | | | | 21 | | | | 21 | | | | 35 | | | | 27 | | | | 26 | | | | .. | |
Total PNFC Sector | | | 2,302 | | | | 2,434 | | | | 2,414 | | | | 2,612 | | | | 2,663 | | | | 2,679 | | | | 2,725 | |
Notes:
| 1. | Numbers may not add due to rounding. |
Levels of GOC debt and equity are managed by the government to maintain an optimal and efficient capital structure. Corporations may apply different target capital structures to optimise value and support business operations. Equity movements account for changes in contributed equity and special dividends.
Total PNFC Sector equity withdrawals for 2020–21 are expected to be $332 million, in contrast to expected injections of $167 million forecast at the 2020–21 Budget. The variation is primarily due to adjustments in the electricity networks and generation sectors.
In the electricity networks sector, equity adjustments are made to maintain the gearing ratios of these businesses over time. Powerlink will receive $40 million from 2021–22 to upgrade transmission lines to support the development of Neoen’s Kaban Green Power Hub.
181
Budget Strategy and Outlook 2021-22
In the electricity generation sector, equity movements primarily relate to the $250 million in funding allocated to CleanCo for its Karara Wind Farm. Other notable equity movements include a $206 million special dividend from Queensland Treasury Holdings in 2020–21 and the $2 billion in funding from the Queensland Renewable Energy and Hydrogen Jobs Fund (with $1 billion of this equity funding allocated over the forward estimates).
Queensland Rail is expected to receive an equity injection of $35 million in 2022–23 to support its capital program, while Sunwater is expected to receive an equity injection of $100 million in 2023–24 to contribute toward essential dam safety upgrades at Burdekin Falls Dam.
Over the forward estimates, Port of Townsville will receive $105 million of contributed equity for the Channel Capacity Upgrade project. The Queensland Government has further committed $28 million to upgrade facilities at the Ports North-owned Cairns Marine Precinct.
Gladstone Ports Corporation (GPC), under a project agreement with the Australian Government, is to receive $10 million for developing new export infrastructure at the Port of Bundaberg, subject to completing project delivery milestones over 2021–22 and 2022–23.
GPC is also supporting the implementation of the Queensland Government’s $21 million Maritime Jobs and Coastal Shipping election commitment through both a funding commitment and the completion of a business case into a potential new portainer crane at Gladstone, subject to approval by shareholding Ministers.
Sunwater is expected to receive a $2.9 million equity injection in 2022–23, to be passed onto the Southern Downs Regional Council as capital grant funding, to upgrade infrastructure at Leslie Dam.
| Table 9.8 | Equity movements1 |
| | | | | | | | | | | | | | | | | | | | | | | | | | | | |
| | | 2019–20 | | | 2020–21 | | | 2020–21 | | | 2021–22 | | | 2022–23 | | | 2023–24 | | | 2024–25 | |
| | | Outcome | | | Budget | | | Est. Act. | | | Projection | | | Projection | | | Projection | | | Projection | |
| | | $ million | | | $ million | | | $ million | | | $ million | | | $ million | | | $ million | | | $ million | |
Electricity Networks | | | (67 | ) | | | (80 | ) | | | (177 | ) | | | (50 | ) | | | (70 | ) | | | (70 | ) | | | (85 | ) |
Electricity Generation | | | (5 | ) | | | 43 | | | | 3 | | | | 145 | | | | 105 | | | | — | | | | — | |
Rail | | | — | | | | — | | | | — | | | | — | | | | 35 | | | | — | | | | — | |
Ports | | | 30 | | | | 76 | | | | 45 | | | | 35 | | | | 23 | | | | 20 | | | | — | |
Water | | | (3 | ) | | | — | | | | — | | | | — | | | | 3 | | | | 100 | | | | — | |
Other2 | | | 323 | | | | 128 | | | | (202 | ) | | | 350 | | | | 365 | | | | 270 | | | | 100 | |
Total PNFC Sector | | | 279 | | | | 167 | | | | (332 | ) | | | 480 | | | | 461 | | | | 320 | | | | 15 | |
Notes:
| 1. | Numbers may not add due to rounding. Bracketed numbers represent equity returns from the PNFC Sector to the General Government Sector. |
| 2. | Includes other public corporations such as Stadiums Queensland and Queensland Treasury Holdings, and indicative funding allocations for Queensland Renewable Energy Zones and the Queensland Renewable Energy and Hydrogen Jobs Fund. |
182
Budget Strategy and Outlook 2021-22
| 10 | Uniform Presentation Framework |
This chapter contains detailed financial statements for the Queensland Public Sector prepared under the Uniform Presentation Framework (UPF) first agreed to at the Premier’s conference in 1991.
The UPF has been reviewed a number of times, most significantly following the release in October 2007 of the Australian Accounting Standards Board’s (AASB) accounting standard, AASB 1049 Whole of Government and General Government Sector Financial Reporting. The standard aims to harmonise Government Finance Statistics (GFS) and Generally Accepted Accounting Principles (GAAP) with the objective of improving the clarity and transparency of government financial statements. The UPF was reviewed most recently in February 2019 following the 2015 update to the Australian GFS Framework.
In addition, this chapter provides:
| • | | a time series for the General Government Sector using the revised UPF |
| • | | details of General Government Sector grant revenue and expenses |
| • | | details of General Government Sector dividend and income tax equivalent income |
| • | | data on General Government Sector expenses and purchases of non-financial assets by function |
| • | | details of taxation revenue collected by the General Government Sector |
| • | | background information on the revised UPF and disclosure differences arising from it including the conceptual basis and sector definitions, along with a list of reporting entities. |
| 10.2 | Uniform Presentation Framework financial information |
The tables on the following pages present operating statements, balance sheets and cash flow statements prepared on the harmonised basis for the General Government, Public Non-financial Corporations (PNFC) and Non-financial Public Sectors.
Budgeted financial information for the Public Financial Corporations sector is not required by the UPF.
183
Budget Strategy and Outlook 2021-22
| Table 10.1 | General Government Sector Operating Statement1 |
| | | | | | | | | | | | | | | | | | | | | | | | | | | | |
| | | 2019–20 2020–21 2020–21 2021–22 2022–23 2023–24 | | | 2024–25 | |
| | | Outcome | | | Budget | | | Est.Actual | | | Budget | | | Projection | | | Projection | | | Projection | |
| | | $ million | | | $ million | | | $ million | | | $ million | | | $ million | | | $ million | | | $ million | |
Revenue from Transactions | | | | | | | | | | | | | | | | | | | | | | | | | | | | |
Taxation revenue | | | 14,585 | | | | 14,330 | | | | 15,907 | | | | 17,399 | | | | 17,397 | | | | 17,731 | | | | 18,608 | |
Grants revenue | | | 27,641 | | | | 29,094 | | | | 31,582 | | | | 31,935 | | | | 33,513 | | | | 35,344 | | | | 36,354 | |
Sales of goods and services | | | 5,618 | | | | 5,975 | | | | 6,068 | | | | 6,062 | | | | 6,091 | | | | 6,365 | | | | 6,209 | |
Interest income | | | 2,076 | | | | 1,882 | | | | 1,901 | | | | 2,537 | | | | 2,591 | | | | 2,622 | | | | 2,702 | |
Dividend and income tax equivalent income | | | 1,929 | | | | 1,179 | | | | 916 | | | | 1,142 | | | | 1,072 | | | | 962 | | | | 937 | |
Other revenue | | | 5,915 | | | | 3,788 | | | | 4,023 | | | | 4,589 | | | | 5,046 | | | | 5,383 | | | | 5,557 | |
Total Revenue from Transactions | | | 57,764 | | | | 56,249 | | | | 60,396 | | | | 63,664 | | | | 65,711 | | | | 68,408 | | | | 70,367 | |
| | | | | | | |
Less Expenses from Transactions | | | | | | | | | | | | | | | | | | | | | | | | | | | | |
Employee expenses | | | 25,660 | | | | 26,470 | | | | 26,284 | | | | 27,474 | | | | 28,598 | | | | 29,337 | | | | 30,344 | |
Superannuation expenses | | | | | | | | | | | | | | | | | | | | | |
Superannuation interest cost | | | 354 | | | | 246 | | | | 246 | | | | 373 | | | | 398 | | | | 400 | | | | 393 | |
Other superannuation expenses | | | 3,183 | | | | 3,231 | | | | 3,116 | | | | 3,156 | | | | 3,234 | | | | 3,307 | | | | 3,355 | |
Other operating expenses | | | 17,087 | | | | 16,956 | | | | 17,102 | | | | 17,963 | | | | 17,273 | | | | 17,614 | | | | 17,576 | |
Depreciation and amortisation | | | 4,033 | | | | 4,251 | | | | 4,234 | | | | 4,356 | | | | 4,509 | | | | 4,677 | | | | 4,829 | |
Other interest expenses | | | 1,486 | | | | 1,725 | | | | 1,567 | | | | 1,667 | | | | 1,880 | | | | 2,085 | | | | 2,241 | |
Grants expenses | | | 11,695 | | | | 12,003 | | | | 11,649 | | | | 12,160 | | | | 12,260 | | | | 11,957 | | | | 11,476 | |
Total Expenses from Transactions | | | 63,498 | | | | 64,881 | | | | 64,199 | | | | 67,148 | | | | 68,151 | | | | 69,376 | | | | 70,214 | |
| | | | | | | |
Equals Net Operating Balance | | | (5,734 | ) | | | (8,633 | ) | | | (3,803 | ) | | | (3,485 | ) | | | (2,440 | ) | | | (968 | ) | | | 153 | |
| | | | | | | |
Plus Other economic flows—included in operating result | | | (5,015 | ) | | | 4,146 | | | | 8,742 | | | | 195 | | | | 228 | | | | 262 | | | | 254 | |
| | | | | | | |
Equals Operating Result | | | (10,749 | ) | | | (4,486 | ) | | | 4,939 | | | | (3,290 | ) | | | (2,212 | ) | | | (707 | ) | | | 407 | |
| | | | | | | |
Plus Other economic flows—other movements in equity | | | 2,976 | | | | 2,294 | | | | 6,020 | | | | 1,773 | | | | 1,801 | | | | 1,883 | | | | 2,185 | |
| | | | | | | |
Equals Comprehensive Result—Total Change In Net Worth | | | (7,773 | ) | | | (2,192 | ) | | | 10,960 | | | | (1,517 | ) | | | (411 | ) | | | 1,177 | | | | 2,592 | |
| | | | | | | |
KEY FISCAL AGGREGATES | | | | | | | | | | | | | | | | | | | | | | | | | | | | |
| | | | | | | |
Net Operating Balance | | | (5,734 | ) | | | (8,633 | ) | | | (3,803 | ) | | | (3,485 | ) | | | (2,440 | ) | | | (968 | ) | | | 153 | |
| | | | | | | |
Less Net Acquisition of Non-financial Assets | | | | | | | | | | | | | | | | | | | | | | | | | | | | |
Purchases of non-financial assets | | | 6,291 | | | | 7,572 | | | | 6,965 | | | | 7,800 | | | | 7,786 | | | | 7,275 | | | | 7,041 | |
Less Sales of non-financial assets | | | 230 | | | | 255 | | | | 206 | | | | 240 | | | | 187 | | | | 253 | | | | 190 | |
Less Depreciation | | | 4,033 | | | | 4,251 | | | | 4,234 | | | | 4,356 | | | | 4,509 | | | | 4,677 | | | | 4,829 | |
Plus Change in inventories | | | 107 | | | | 19 | | | | 48 | | | | 9 | | | | (8 | ) | | | (4 | ) | | | 29 | |
Plus Other movements in non-financial assets | | | 1,289 | | | | 1,724 | | | | 1,783 | | | | 1,266 | | | | 857 | | | | 319 | | | | 181 | |
Equals Total Net Acquisition of Non-financial Assets | | | 3,424 | | | | 4,808 | | | | 4,356 | | | | 4,480 | | | | 3,939 | | | | 2,661 | | | | 2,232 | |
Equals Fiscal Balance | | | (9,158 | ) | | | (13,440 | ) | | | (8,159 | ) | | | (7,965 | ) | | | (6,379 | ) | | | (3,630 | ) | | | (2,079 | ) |
Note:
| 1. | Numbers may not add due to rounding. |
184
Budget Strategy and Outlook 2021-22
| Table 10.2 | Public Non-financial Corporations Sector Operating Statement1 |
| | | | | | | | | | | | | | | | | | | | | | | | | | | | |
| | | 2019–20 | | | 2020–21 | | | 2020–21 | | | 2021–22 | | | 2022–23 | | | 2023–24 | | | 2024–25 | |
| | | Outcome | | | Budget | | | Est.Actual | | | Budget | | | Projection | | | Projection | | | Projection | |
| | | $ million | | | $ million | | | $ million | | | $ million | | | $ million | | | $ million | | | $ million | |
Revenue from Transactions | | | | | | | | | | | | | | | | | | | | | | | | | |
Grants revenue | | | 646 | | | | 577 | | | | 598 | | | | 711 | | | | 619 | | | | 588 | | | | 558 | |
Sales of goods and services | | | 12,359 | | | | 11,610 | | | | 11,436 | | | | 11,161 | | | | 10,924 | | | | 10,779 | | | | 10,989 | |
Interest income | | | 87 | | | | 70 | | | | 56 | | | | 58 | | | | 62 | | | | 68 | | | | 75 | |
Dividend and income tax equivalent income | | | 14 | | | | 13 | | | | 15 | | | | — | | | | — | | | | — | | | | — | |
Other revenue | | | 482 | | | | 337 | | | | 313 | | | | 306 | | | | 353 | | | | 315 | | | | 345 | |
Total Revenue from Transactions | | | 13,589 | | | | 12,607 | | | | 12,418 | | | | 12,237 | | | | 11,958 | | | | 11,750 | | | | 11,967 | |
| | | | | | | |
Less Expenses from Transactions | | | | | | | | | | | | | | | | | | | | | | | | | | | | |
Employee expenses | | | 2,087 | | | | 2,196 | | | | 2,156 | | | | 2,211 | | | | 2,279 | | | | 2,359 | | | | 2,437 | |
Superannuation expenses | | | | | | | | | | | | | | | | | | | | | | | | | | | | |
Superannuation interest cost | | | (5 | ) | | | — | | | | — | | | | — | | | | — | | | | — | | | | — | |
Other superannuation expenses | | | 237 | | | | 228 | | | | 230 | | | | 241 | | | | 251 | | | | 260 | | | | 269 | |
Other operating expenses | | | 5,129 | | | | 4,437 | | | | 4,110 | | | | 3,996 | | | | 3,726 | | | | 3,551 | | | | 3,657 | |
Depreciation and amortisation | | | 2,719 | | | | 2,916 | | | | 2,777 | | | | 2,882 | | | | 2,945 | | | | 3,049 | | | | 3,104 | |
Other interest expenses | | | 1,776 | | | | 1,745 | | | | 1,732 | | | | 1,661 | | | | 1,573 | | | | 1,515 | | | | 1,467 | |
Grants expenses | | | (19 | ) | | | 24 | | | | 24 | | | | 24 | | | | 25 | | | | 25 | | | | 25 | |
Other property expenses | | | 737 | | | | 435 | | | | 383 | | | | 448 | | | | 391 | | | | 310 | | | | 289 | |
Total Expenses from Transactions | | | 12,662 | | | | 11,981 | | | | 11,413 | | | | 11,463 | | | | 11,190 | | | | 11,070 | | | | 11,247 | |
| | | | | | | |
Equals Net Operating Balance | | | 927 | | | | 626 | | | | 1,006 | | | | 774 | | | | 768 | | | | 680 | | | | 720 | |
| | | | | | | |
Plus Other economic flows—included in operating result | | | (944 | ) | | | (15 | ) | | | (400 | ) | | | 13 | | | | (96 | ) | | | (255 | ) | | | (353 | ) |
| | | | | | | |
Equals Operating Result | | | (17 | ) | | | 611 | | | | 605 | | | | 787 | | | | 672 | | | | 424 | | | | 367 | |
| | | | | | | |
Plus Other economic flows—other movements in equity | | | (651 | ) | | | (319 | ) | | | (580 | ) | | | 288 | | | | 474 | | | | 402 | | | | 132 | |
| | | | | | | |
Equals Comprehensive Result—Total Change In Net Worth | | | (668 | ) | | | 292 | | | | 26 | | | | 1,075 | | | | 1,146 | | | | 827 | | | | 498 | |
| | | | | | | |
KEY FISCAL AGGREGATES | | | | | | | | | | | | | | | | | | | | | | | | | | | | |
| | | | | | | |
Net Operating Balance | | | 927 | | | | 626 | | | | 1,006 | | | | 774 | | | | 768 | | | | 680 | | | | 720 | |
| | | | | | | |
Less Net Acquisition of Non-financial Assets | | | | | | | | | | | | | | | | | | | | | | | | | | | | |
Purchases of non-financial assets | | | 3,156 | | | | 3,460 | | | | 3,491 | | | | 3,713 | | | | 3,654 | | | | 3,297 | | | | 3,327 | |
Less Sales of non-financial assets | | | 36 | | | | 44 | | | | 41 | | | | 68 | | | | 37 | | | | 31 | | | | 23 | |
Less Depreciation | | | 2,719 | | | | 2,916 | | | | 2,777 | | | | 2,882 | | | | 2,945 | | | | 3,049 | | | | 3,104 | |
Plus Change in inventories | | | 50 | | | | 37 | | | | 13 | | | | 4 | | | | 2 | | | | 26 | | | | 17 | |
Plus Other movements in non-financial assets | | | 170 | | | | 120 | | | | 91 | | | | 106 | | | | 135 | | | | 135 | | | | 129 | |
Equals Total Net Acquisition of Non-financial Assets | | | 621 | | | | 656 | | | | 776 | | | | 872 | | | | 809 | | | | 377 | | | | 347 | |
Equals Fiscal Balance | | | 306 | | | | (30 | ) | | | 230 | | | | (98 | ) | | | (41 | ) | | | 302 | | | | 373 | |
Note:
| 1. | Numbers may not add due to rounding. |
185
Budget Strategy and Outlook 2021-22
| Table 10.3 | Non-financial Public Sector Operating Statement1 |
| | | | | | | | | | | | | | | | | | | | | | | | | | | | | | |
| | | 2019–20 | | | 2020–21 | | | 2020–21 | | | 2021–22 | | | 2022–23 | | | 2023–24 | | | 2024–25 | |
| | | | | Outcome | | | Budget | | | Est.Actual | | | Budget | | | Projection | | | Projection | | | Projection | |
| | | | | $ million | | | $ million | | | $ million | | | $ million | | | $ million | | | $ million | | | $ million | |
Revenue from Transactions | | | | | | | | | | | | | | | | | | | | | |
Taxation revenue | | | 14,254 | | | | 14,024 | | | | 15,589 | | | | 17,062 | | | | 17,052 | | | | 17,379 | | | | 18,254 | |
Grants revenue | | | 27,674 | | | | 29,115 | | | | 31,605 | | | | 31,951 | | | | 33,528 | | | | 35,353 | | | | 36,363 | |
Sales of goods and services | | | 15,596 | | | | 14,956 | | | | 14,863 | | | | 14,320 | | | | 14,314 | | | | 14,542 | | | | 14,607 | |
Interest income | | | 2,140 | | | | 1,921 | | | | 1,939 | | | | 2,578 | | | | 2,634 | | | | 2,671 | | | | 2,752 | |
Dividend and income tax equivalent income | | | 141 | | | | 130 | | | | 133 | | | | 129 | | | | 162 | | | | 179 | | | | 196 | |
Other revenue | | | 6,351 | | | | 4,124 | | | | 4,335 | | | | 4,894 | | | | 5,397 | | | | 5,697 | | | | 5,900 | |
Total Revenue from Transactions | | | 66,156 | | | | 64,271 | | | | 68,464 | | | | 70,934 | | | | 73,088 | | | | 75,821 | | | | 78,074 | |
| | | | | | | |
Less Expenses from Transactions | | | | | | | | | | | | | | | | | | | | | | | | | | | | |
Employee expenses | | | 27,629 | | | | 28,544 | | | | 28,319 | | | | 29,561 | | | | 30,750 | | | | 31,569 | | | | 32,654 | |
Superannuation expenses | | | | | | | | | | | | | | | | | | | | | | | | | | | | |
Superannuation interest cost | | | 349 | | | | 246 | | | | 246 | | | | 373 | | | | 398 | | | | 400 | | | | 393 | |
Other superannuation expenses | | | 3,421 | | | | 3,459 | | | | 3,346 | | | | 3,397 | | | | 3,485 | | | | 3,567 | | | | 3,624 | |
Other operating expenses | | | 19,768 | | | | 18,757 | | | | 18,564 | | | | 19,049 | | | | 18,290 | | | | 18,555 | | | | 18,635 | |
Depreciation and amortisation | | | 6,752 | | | | 7,167 | | | | 7,012 | | | | 7,238 | | | | 7,453 | | | | 7,726 | | | | 7,933 | |
Other interest expenses | | | 3,070 | | | | 3,265 | | | | 3,095 | | | | 3,107 | | | | 3,226 | | | | 3,366 | | | | 3,466 | |
Grants expenses | | | 11,062 | | | | 11,471 | | | | 11,099 | | | | 11,489 | | | | 11,681 | | | | 11,403 | | | | 10,952 | |
Total Expenses from Transactions | | | 72,049 | | | | 72,908 | | | | 71,680 | | | | 74,213 | | | | 75,283 | | | | 76,587 | | | | 77,657 | |
| | | | | | | |
Equals Net Operating Balance | | | (5,893 | ) | | | (8,637 | ) | | | (3,216 | ) | | | (3,279 | ) | | | (2,195 | ) | | | (766 | ) | | | 417 | |
| | | | | | | |
Plus Other economic flows—included in operating result | | | (6,033 | ) | | | 4,051 | | | | 7,812 | | | | 118 | | | | 62 | | | | (63 | ) | | | (184 | ) |
| | | | | | | |
Equals Operating Result | | | (11,926 | ) | | | (4,586 | ) | | | 4,595 | | | | (3,161 | ) | | | (2,133 | ) | | | (829 | ) | | | 233 | |
| | | | | | | |
Plus Other economic flows—other movements in equity | | | 4,153 | | | | 2,394 | | | | 6,364 | | | | 1,644 | | | | 1,722 | | | | 2,006 | | | | 2,359 | |
| | | | | | | |
Equals Comprehensive Result—Total Change In Net Worth | | | (7,773 | ) | | | (2,192 | ) | | | 10,960 | | | | (1,517 | ) | | | (411 | ) | | | 1,177 | | | | 2,592 | |
| | | | | | | |
KEY FISCAL AGGREGATES | | | | | | | | | | | | | | | | | | | | | | | | | | | | |
| | | | | | | |
Net Operating Balance | | | (5,893 | ) | | | (8,637 | ) | | | (3,216 | ) | | | (3,279 | ) | | | (2,195 | ) | | | (766 | ) | | | 417 | |
Less Net Acquisition of Non-financial Assets | | | | | | | | | | | | | | | | | | | | | | | | | | | | |
Purchases of non-financial assets | | | 9,467 | | | | 11,032 | | | | 10,456 | | | | 11,513 | | | | 11,440 | | | | 10,572 | | | | 10,368 | |
Less Sales of non-financial assets | | | 266 | | | | 300 | | | | 247 | | | | 308 | | | | 223 | | | | 284 | | | | 213 | |
Less Depreciation | | | 6,752 | | | | 7,167 | | | | 7,012 | | | | 7,238 | | | | 7,453 | | | | 7,726 | | | | 7,933 | |
Plus Change in inventories | | | 156 | | | | 55 | | | | 61 | | | | 13 | | | | (6 | ) | | | 22 | | | | 46 | |
Plus Other movements in non-financial assets | | | 1,460 | | | | 1,844 | | | | 1,874 | | | | 1,372 | | | | 992 | | | | 454 | | | | 310 | |
Equals Total Net Acquisition of Non-financial Assets | | | 4,065 | | | | 5,464 | | | | 5,132 | | | | 5,352 | | | | 4,748 | | | | 3,039 | | | | 2,579 | |
Equals Fiscal Balance | | | (9,958 | ) | | | (14,101 | ) | | | (8,348 | ) | | | (8,631 | ) | | | (6,943 | ) | | | (3,805 | ) | | | (2,162 | ) |
Note:
| 1. | Numbers may not add due to rounding. |
186
Budget Strategy and Outlook 2021-22
| Table 10.4 | General Government Sector Balance Sheet1 |
| | | | | | | | | | | | | | | | | | | | | | | | | | | | |
| | | 2019–20
Outcome
$ million | | | 2020–21
Budget $
million | | | 2020–21
Est.Actual
$ million | | | 2021–22
Budget $
million | | | 2022–23
Projection
$ million | | | 2023–24
Projection
$ million | | | 2024–25
Projection
$ million | |
Assets | | | | | | | | | | | | | | | | | | | | | | | | | | | | |
Financial Assets | | | | | | | | | | | | | | | | | | | | | | | | | | | | |
Cash and deposits | | | 1,205 | | | | 1,005 | | | | 951 | | | | 860 | | | | 797 | | | | 747 | | | | 713 | |
Advances paid | | | 1,280 | | | | 1,415 | | | | 1,357 | | | | 1,545 | | | | 1,644 | | | | 1,609 | | | | 1,530 | |
Investments, loans and placements | | | 29,580 | | | | 34,851 | | | | 38,466 | | | | 39,319 | | | | 40,131 | | | | 40,885 | | | | 41,634 | |
Receivables | | | 4,490 | | | | 4,459 | | | | 4,198 | | | | 3,305 | | | | 3,956 | | | | 4,038 | | | | 4,238 | |
Equity | | | | | | | | | | | | | | | | | | | | | | | | | | | | |
Investments in other public sector entities | | | 21,560 | | | | 21,852 | | | | 21,782 | | | | 22,857 | | | | 24,003 | | | | 24,830 | | | | 25,328 | |
Investments—other | | | 163 | | | | 164 | | | | 161 | | | | 161 | | | | 161 | | | | 161 | | | | 161 | |
Total Financial Assets | | | 58,278 | | | | 63,745 | | | | 66,917 | | | | 68,047 | | | | 70,694 | | | | 72,271 | | | | 73,605 | |
| | | | | | | |
Non-financial Assets | | | | | | | | | | | | | | | | | | | | | | | | | | | | |
Land and other fixed assets | | | 223,280 | | | | 235,537 | | | | 237,808 | | | | 243,243 | | | | 248,251 | | | | 252,414 | | | | 255,764 | |
Other non-financial assets | | | 6,928 | | | | 6,965 | | | | 6,972 | | | | 6,920 | | | | 7,007 | | | | 7,198 | | | | 7,476 | |
Total Non-financial Assets | | | 230,207 | | | | 242,503 | | | | 244,780 | | | | 250,163 | | | | 255,259 | | | | 259,612 | | | | 263,240 | |
| | | | | | | |
| Total Assets | | | 288,485 | | | | 306,247 | | | | 311,697 | | | | 318,210 | | | | 325,953 | | | | 331,883 | | | | 336,845 | |
| | | | | | | |
Liabilities | | | | | | | | | | | | | | | | | | | | | | | | | | | | |
Payables | | | 5,729 | | | | 4,470 | | | | 4,672 | | | | 4,673 | | | | 4,720 | | | | 4,771 | | | | 4,829 | |
Superannuation liability | | | 27,808 | | | | 27,475 | | | | 23,758 | | | | 22,686 | | | | 21,653 | | | | 20,291 | | | | 18,505 | |
Other employee benefits | | | 8,327 | | | | 8,532 | | | | 8,339 | | | | 8,514 | | | | 8,695 | | | | 8,910 | | | | 9,133 | |
Advances received | | | 1,845 | | | | 1,506 | | | | 1,505 | | | | 1,432 | | | | 1,119 | | | | 1,018 | | | | 868 | |
Borrowing with QTC | | | 37,570 | | | | 53,501 | | | | 47,102 | | | | 57,240 | | | | 67,110 | | | | 73,265 | | | | 77,761 | |
Leases and other similar arrangements | | | 6,499 | | | | 7,565 | | | | 7,779 | | | | 7,603 | | | | 7,471 | | | | 7,780 | | | | 7,623 | |
Securities and derivatives | | | 198 | | | | 198 | | | | 198 | | | | 198 | | | | 198 | | | | 198 | | | | 198 | |
Other liabilities | | | 6,779 | | | | 11,463 | | | | 13,653 | | | | 12,690 | | | | 12,223 | | | | 11,711 | | | | 11,396 | |
Total Liabilities | | | 94,754 | | | | 114,708 | | | | 107,006 | | | | 115,037 | | | | 123,190 | | | | 127,944 | | | | 130,313 | |
| | | | | | | |
Net Worth | | | 193,731 | | | | 191,539 | | | | 204,691 | | | | 203,174 | | | | 202,763 | | | | 203,939 | | | | 206,532 | |
| | | | | | | | | | | | | | | | | | | | | | | | | | | | |
Net Financial Worth | | | (36,476 | ) | | | (50,963 | ) | | | (40,089 | ) | | | (46,989 | ) | | | (52,496 | ) | | | (55,673 | ) | | | (56,708 | ) |
Net Financial Liabilities | | | 58,036 | | | | 72,815 | | | | 61,871 | | | | 69,847 | | | | 76,499 | | | | 80,503 | | | | 82,036 | |
Net Debt | | | 14,046 | | | | 25,499 | | | | 15,808 | | | | 24,750 | | | | 33,326 | | | | 39,019 | | | | 42,573 | |
Notes:
| 1. | Numbers may not add due to rounding. |
187
Budget Strategy and Outlook 2021-22
| Table 10.5 | Public Non-financial Corporations Sector Balance Sheet1 |
| | | | | | | | | | | | | | | | | | | | | | | | | | | | |
| | | 2019–20
Outcome
$ million | | | 2020–21
Budget
$ million | | | 2020–21
Est.Actual
$ million | | | 2021–22
Budget
$ million | | | 2022–23
Projection
$ million | | | 2023–24
Projection
$ million | | | 2024–25
Projection
$ million | |
Assets | | | | | | | | | | | | | | | | | | | | | | | | | | | | |
Financial Assets | | | | | | | | | | | | | | | | | | | | | | | | | | | | |
Cash and deposits | | | 889 | | | | 945 | | | | 941 | | | | 784 | | | | 791 | | | | 874 | | | | 992 | |
Advances paid | | | 1,491 | | | | 1,216 | | | | 1,236 | | | | 1,214 | | | | 950 | | | | 897 | | | | 796 | |
Investments, loans and placements | | | 1,787 | | | | 845 | | | | 233 | | | | 308 | | | | 217 | | | | 221 | | | | 232 | |
Receivables | | | 1,484 | | | | 1,495 | | | | 1,486 | | | | 1,572 | | | | 1,518 | | | | 1,571 | | | | 1,614 | |
Equity | | | | | | | | | | | | | | | | | | | | | | | | | | | | |
Investments—other | | | 279 | | | | 9 | | | | 9 | | | | 9 | | | | 9 | | | | 9 | | | | 9 | |
Total Financial Assets | | | 5,930 | | | | 4,510 | | | | 3,906 | | | | 3,887 | | | | 3,485 | | | | 3,573 | | | | 3,643 | |
| | | | | | | |
Non-financial Assets | | | | | | | | | | | | | | | | | | | | | | | | | | | | |
Land and other fixed assets | | | 63,522 | | | | 64,960 | | | | 64,667 | | | | 66,328 | | | | 67,941 | | | | 68,971 | | | | 69,892 | |
Other non-financial assets | | | 1,388 | | | | 1,417 | | | | 1,440 | | | | 1,463 | | | | 1,478 | | | | 1,548 | | | | 1,659 | |
Total Non-financial Assets | | | 64,910 | | | | 66,377 | | | | 66,107 | | | | 67,791 | | | | 69,419 | | | | 70,519 | | | | 71,551 | |
| | | | | | | |
Total Assets | | | 70,840 | | | | 70,887 | | | | 70,012 | | | | 71,678 | | | | 72,904 | | | | 74,092 | | | | 75,194 | |
| | | | | | | |
Liabilities | | | | | | | | | | | | | | | | | | | | | | | | | | | | |
Payables | | | 2,210 | | | | 1,718 | | | | 1,453 | | | | 1,640 | | | | 1,609 | | | | 1,616 | | | | 1,617 | |
Superannuation liability | | | (152 | ) | | | (149 | ) | | | (152 | ) | | | (152 | ) | | | (152 | ) | | | (152 | ) | | | (152 | ) |
Other employee benefits | | | 911 | | | | 923 | | | | 914 | | | | 940 | | | | 955 | | | | 970 | | | | 986 | |
Deposits held | | | 13 | | | | 13 | | | | 13 | | | | 13 | | | | 13 | | | | 13 | | | | 13 | |
Advances received | | | 6 | | | | 5 | | | | 5 | | | | 4 | | | | 4 | | | | 3 | | | | 2 | |
Borrowing with QTC | | | 38,894 | | | | 39,967 | | | | 40,225 | | | | 40,655 | | | | 40,782 | | | | 40,978 | | | | 41,369 | |
Leases and other similar arrangements | | | 492 | | | | 468 | | | | 448 | | | | 405 | | | | 372 | | | | 338 | | | | 302 | |
Securities and derivatives | | | 1,315 | | | | 529 | | | | 68 | | | | 245 | | | | 142 | | | | 129 | | | | 134 | |
Other liabilities | | | 8,183 | | | | 8,152 | | | | 8,043 | | | | 7,857 | | | | 7,964 | | | | 8,154 | | | | 8,382 | |
Total Liabilities | | | 51,871 | | | | 51,626 | | | | 51,017 | | | | 51,608 | | | | 51,688 | | | | 52,049 | | | | 52,654 | |
| | | | | | | |
Net Worth | | | 18,969 | | | | 19,261 | | | | 18,995 | | | | 20,070 | | | | 21,216 | | | | 22,043 | | | | 22,541 | |
| | | | | | | | | | | | | | | | | | | | | | | | | | | | |
Net Financial Worth | | | (45,941 | ) | | | (47,116 | ) | | | (47,112 | ) | | | (47,721 | ) | | | (48,203 | ) | | | (48,476 | ) | | | (49,010 | ) |
Net Debt | | | 36,552 | | | | 37,975 | | | | 38,349 | | | | 39,017 | | | | 39,354 | | | | 39,468 | | | | 39,801 | |
Notes:
| 1. | Numbers may not add due to rounding. |
188
Budget Strategy and Outlook 2021-22
| Table 10.6 | Non-financial Public Sector Balance Sheet1 |
| | | | | | | | | | | | | | | | | | | | | | | | | | | | |
| | | 2019–20
Outcome
$ million | | | 2020–21
Budget $
million | | | 2020–21
Est.Actual
$ million | | | 2021–22
Budget $
million | | | 2022–23
Projection
$ million | | | 2023–24
Projection
$ million | | | 2024–25
Projection
$ million | |
| | | | | | | |
Assets | | | | | | | | | | | | | | | | | | | | | | | | | | | | |
Financial Assets | | | | | | | | | | | | | | | | | | | | | | | | | | | | |
Cash and deposits | | | 2,094 | | | | 1,949 | | | | 1,892 | | | | 1,644 | | | | 1,588 | | | | 1,621 | | | | 1,705 | |
Advances paid | | | 1,274 | | | | 1,410 | | | | 1,352 | | | | 1,540 | | | | 1,641 | | | | 1,607 | | | | 1,527 | |
Investments, loans and placements | | | 31,366 | | | | 35,696 | | | | 38,699 | | | | 39,628 | | | | 40,348 | | | | 41,105 | | | | 41,866 | |
Receivables | | | 4,669 | | | | 5,145 | | | | 5,121 | | | | 4,037 | | | | 4,599 | | | | 4,798 | | | | 5,066 | |
Equity | | | | | | | | | | | | | | | | | | | | | | | | | | | | |
Investments in other public sector entities | | | 2,592 | | | | 2,592 | | | | 2,788 | | | | 2,788 | | | | 2,788 | | | | 2,788 | | | | 2,788 | |
Investments—other | | | 442 | | | | 173 | | | | 170 | | | | 171 | | | | 171 | | | | 171 | | | | 171 | |
Total Financial Assets | | | 42,438 | | | | 46,964 | | | | 50,023 | | | | 49,807 | | | | 51,134 | | | | 52,090 | | | | 53,123 | |
| | | | | | | |
Non-financial Assets | | | | | | | | | | | | | | | | | | | | | | | | | | | | |
Land and other fixed assets | | | 286,800 | | | | 300,496 | | | | 302,474 | | | | 309,570 | | | | 316,192 | | | | 321,385 | | | | 325,655 | |
Other non-financial assets | | | 1,236 | | | | 1,228 | | | | 1,222 | | | | 1,107 | | | | 1,000 | | | | 953 | | | | 958 | |
Total Non-financial Assets | | | 288,037 | | | | 301,724 | | | | 303,696 | | | | 310,677 | | | | 317,192 | | | | 322,338 | | | | 326,613 | |
| | | | | | | |
Total Assets | | | 330,475 | | | | 348,688 | | | | 353,719 | | | | 360,484 | | | | 368,326 | | | | 374,428 | | | | 379,736 | |
| | | | | | | |
Liabilities | | | | | | | | | | | | | | | | | | | | | | | | | | | | |
Payables | | | 6,676 | | | | 5,421 | | | | 5,607 | | | | 5,520 | | | | 5,500 | | | | 5,624 | | | | 5,706 | |
Superannuation liability | | | 27,656 | | | | 27,326 | | | | 23,606 | | | | 22,534 | | | | 21,501 | | | | 20,139 | | | | 18,353 | |
Other employee benefits | | | 9,238 | | | | 9,456 | | | | 9,253 | | | | 9,453 | | | | 9,650 | | | | 9,880 | | | | 10,119 | |
Deposits held | | | 13 | | | | 13 | | | | 13 | | | | 13 | | | | 13 | | | | 13 | | | | 13 | |
Advances received | | | 354 | | | | 289 | | | | 268 | | | | 218 | | | | 169 | | | | 120 | | | | 72 | |
Borrowing with QTC | | | 76,464 | | | | 93,467 | | | | 87,327 | | | | 97,896 | | | | 107,892 | | | | 114,243 | | | | 119,130 | |
Leases and other similar arrangements | | | 6,991 | | | | 8,033 | | | | 8,227 | | | | 8,009 | | | | 7,843 | | | | 8,118 | | | | 7,925 | |
Securities and derivatives | | | 1,505 | | | | 720 | | | | 259 | | | | 436 | | | | 333 | | | | 320 | | | | 325 | |
Other liabilities | | | 7,847 | | | | 12,425 | | | | 14,467 | | | | 13,231 | | | | 12,662 | | | | 12,031 | | | | 11,561 | |
Total Liabilities | | | 136,743 | | | | 157,149 | | | | 149,028 | | | | 157,310 | | | | 165,563 | | | | 170,489 | | | | 173,205 | |
| | | | | | | |
Net Worth | | | 193,731 | | | | 191,539 | | | | 204,691 | | | | 203,174 | | | | 202,763 | | | | 203,939 | | | | 206,532 | |
| | | | | | | | | | | | | | | | | | | | | | | | | | | | |
Net Financial Worth | | | (94,305 | ) | | | (110,185 | ) | | | (99,005 | ) | | | (107,503 | ) | | | (114,429 | ) | | | (118,399 | ) | | | (120,081 | ) |
Net Financial Liabilities | | | 96,897 | | | | 112,777 | | | | 101,793 | | | | 110,291 | | | | 117,217 | | | | 121,187 | | | | 122,869 | |
Net Debt | | | 50,592 | | | | 63,467 | | | | 54,151 | | | | 63,760 | | | | 72,674 | | | | 78,481 | | | | 82,367 | |
Notes:
| 1. | Numbers may not add due to rounding. |
189
Budget Strategy and Outlook 2021-22
| Table 10.7 | General Government Sector Cash Flow Statement1 |
| | | | | | | | | | | | | | | | | | | | | | | | | | | | |
| | | 2019–20
Outcome
$ million | | | 2020–21
Budget
$ million | | | 2020–21
Est.Actual
$ million | | | 2021–22
Budget
$ million | | | 2022–23
Projection
$ million | | | 2023–24
Projection
$ million | | | 2024–25
Projection
$ million | |
Cash Receipts from Operating Activities | | | | | | | | | | | | | | | | | | | | | | | | | | | | |
Taxes received | | | 13,870 | | | | 13,749 | | | | 15,326 | | | | 18,657 | | | | 17,396 | | | | 17,730 | | | | 18,606 | |
Grants and subsidies received | | | 28,841 | | | | 27,948 | | | | 30,444 | | | | 31,906 | | | | 33,009 | | | | 35,317 | | | | 36,204 | |
Sales of goods and services | | | 6,055 | | | | 6,245 | | | | 6,508 | | | | 6,312 | | | | 6,383 | | | | 6,634 | | | | 6,537 | |
Interest receipts | | | 1,997 | | | | 2,017 | | | | 2,036 | | | | 2,535 | | | | 2,589 | | | | 2,620 | | | | 2,700 | |
Dividends and income tax equivalents | | | 2,756 | | | | 1,690 | | | | 1,669 | | | | 897 | | | | 1,030 | | | | 1,006 | | | | 958 | |
Other receipts | | | 7,048 | | | | 5,011 | | | | 5,213 | | | | 5,730 | | | | 6,169 | | | | 6,390 | | | | 6,607 | |
Total Operating Receipts | | | 60,567 | | | | 56,661 | | | | 61,196 | | | | 66,038 | | | | 66,576 | | | | 69,696 | | | | 71,612 | |
| | | | | | | |
Cash Payments for Operating Activities | | | | | | | | | | | | | | | | | | | | | | | | | | | | |
Payments for employees | | | (29,332 | ) | | | (30,442 | ) | | | (30,078 | ) | | | (31,442 | ) | | | (32,742 | ) | | | (33,635 | ) | | | (34,746 | ) |
Payments for goods and services | | | (19,019 | ) | | | (19,128 | ) | | | (19,247 | ) | | | (20,402 | ) | | | (19,270 | ) | | | (19,595 | ) | | | (19,520 | ) |
Grants and subsidies | | | (10,928 | ) | | | (11,993 | ) | | | (11,631 | ) | | | (12,100 | ) | | | (12,135 | ) | | | (11,912 | ) | | | (11,431 | ) |
Interest paid | | | (1,460 | ) | | | (1,679 | ) | | | (1,514 | ) | | | (1,600 | ) | | | (1,809 | ) | | | (2,007 | ) | | | (2,161 | ) |
Other payments | | | (8 | ) | | | — | | | | — | | | | — | | | | — | | | | — | | | | — | |
Total Operating Payments | | | (60,747 | ) | | | (63,243 | ) | | | (62,471 | ) | | | (65,544 | ) | | | (65,957 | ) | | | (67,149 | ) | | | (67,857 | ) |
| | | | | | | |
Net Cash Inflows from Operating Activities | | | (180 | ) | | | (6,581 | ) | | | (1,275 | ) | | | 493 | | | | 619 | | | | 2,547 | | | | 3,755 | |
| | | | | | | |
Cash Flows from Investments in Non-Financial Assets | | | | | | | | | | | | | | | | | | | | | | | | | | | | |
Purchases of non-financial assets | | | (6,291 | ) | | | (7,572 | ) | | | (6,965 | ) | | | (7,800 | ) | | | (7,786 | ) | | | (7,275 | ) | | | (7,041 | ) |
Sales of non-financial assets | | | 230 | | | | 255 | | | | 206 | | | | 240 | | | | 187 | | | | 253 | | | | 190 | |
Net Cash Flows from Investments in Non-financial Assets | | | (6,061 | ) | | | (7,316 | ) | | | (6,759 | ) | | | (7,561 | ) | | | (7,599 | ) | | | (7,023 | ) | | | (6,851 | ) |
| | | | | | | |
Net Cash Flows from Investments in Financial Assets for Policy Purposes | | | (941 | ) | | | (305 | ) | | | 34 | | | | (636 | ) | | | (555 | ) | | | (277 | ) | | | 72 | |
| | | | | | | |
Net Cash Flows from Investments in Financial Assets for Liquidity Purposes | | | 4,391 | | | | (822 | ) | | | (859 | ) | | | (821 | ) | | | (799 | ) | | | (750 | ) | | | (741 | ) |
| | | | | | | |
Receipts from Financing Activities | | | | | | | | | | | | | | | | | | | | | | | | | | | | |
Advances received (net) | | | (847 | ) | | | (337 | ) | | | (341 | ) | | | (69 | ) | | | (311 | ) | | | (99 | ) | | | (148 | ) |
Borrowing (net) | | | 2,975 | | | | 15,162 | | | | 8,946 | | | | 8,501 | | | | 8,582 | | | | 5,552 | | | | 3,880 | |
Net Cash Flows from Financing Activities | | | 2,128 | | | | 14,825 | | | | 8,605 | | | | 8,433 | | | | 8,271 | | | | 5,453 | | | | 3,732 | |
| | | | | | | |
Net Increase/(Decrease) in Cash held | | | (663 | ) | | | (201 | ) | | | (254 | ) | | | (91 | ) | | | (62 | ) | | | (50 | ) | | | (34 | ) |
| | | | | | | |
Net cash from operating activities | | | (180 | ) | | | (6,581 | ) | | | (1,275 | ) | | | 493 | | | | 619 | | | | 2,547 | | | | 3,755 | |
Net cash flows from investments in non-financial assets | | | (6,061 | ) | | | (7,316 | ) | | | (6,759 | ) | | | (7,561 | ) | | | (7,599 | ) | | | (7,023 | ) | | | (6,851 | ) |
Surplus/(Deficit) | | | (6,241 | ) | | | (13,898 | ) | | | (8,033 | ) | | | (7,067 | ) | | | (6,980 | ) | | | (4,475 | ) | | | (3,096 | ) |
| | | | | | | | | | | | | | | | | | | | | | | | | | | | |
| | | | | | | |
Derivation of ABS GFS Cash Surplus/Deficit | | | | | | | | | | | | | | | | | | | | | | | | | | | | |
Cash surplus/(deficit) | | | (6,241 | ) | | | (13,898 | ) | | | (8,033 | ) | | | (7,067 | ) | | | (6,980 | ) | | | (4,475 | ) | | | (3,096 | ) |
Acquisitions under finance leases and similar arrangements | | | (1,263 | ) | | | (1,571 | ) | | | (1,632 | ) | | | (1,088 | ) | | | (752 | ) | | | (137 | ) | | | — | |
ABS GFS Cash Surplus/(Deficit) Including Finance Leases and Similar Arrangements | | | (7,503 | ) | | | (15,468 | ) | | | (9,665 | ) | | | (8,155 | ) | | | (7,732 | ) | | | (4,612 | ) | | | (3,096 | ) |
Note:
| 1. | Numbers may not add due to rounding. |
190
Budget Strategy and Outlook 2021-22
Table 10.8 Public Non-financial Corporations Sector Cash Flow Statement1
| | | | | | | | | | | | | | | | | | | | | | | | | | | | |
| | | 2019–20
Outcome
$ million | | | 2020–21
Budget
$ million | | | 2020–21
Est.Actual
$ million | | | 2021–22
Budget
$ million | | | 2022–23
Projection
$ million | | | 2023–24
Projection
$ million | | | 2024–25
Projection
$ million | |
Cash Receipts from Operating Activities | | | | | | | | | | | | | | | | | | | | | | | | | | | | |
Grants and subsidies received | | | 643 | | | | 589 | | | | 610 | | | | 681 | | | | 609 | | | | 575 | | | | 547 | |
Sales of goods and services | | | 14,582 | | | | 13,155 | | | | 13,126 | | | | 12,674 | | | | 12,533 | | | | 12,270 | | | | 12,495 | |
Interest receipts | | | 88 | | | | 70 | | | | 56 | | | | 58 | | | | 62 | | | | 68 | | | | 75 | |
Dividends and income tax equivalents | | | 14 | | | | 13 | | | | 15 | | | | — | | | | — | | | | — | | | | — | |
Other receipts | | | 373 | | | | 232 | | | | 232 | | | | 206 | | | | 236 | | | | 197 | | | | 231 | |
Total Operating Receipts | | | 15,701 | | | | 14,059 | | | | 14,039 | | | | 13,620 | | | | 13,439 | | | | 13,110 | | | | 13,348 | |
| | | | | | | |
Cash Payments for Operating Activities | | | | | | | | | | | | | | | | | | | | | | | | | | | | |
Payments for employees | | | (2,219 | ) | | | (2,406 | ) | | | (2,396 | ) | | | (2,426 | ) | | | (2,514 | ) | | | (2,604 | ) | | | (2,690 | ) |
Payments for goods and services | | | (6,307 | ) | | | (5,788 | ) | | | (5,649 | ) | | | (5,593 | ) | | | (5,096 | ) | | | (4,778 | ) | | | (4,899 | ) |
Grants and subsidies | | | (263 | ) | | | (67 | ) | | | (24 | ) | | | (24 | ) | | | (25 | ) | | | (25 | ) | | | (25 | ) |
Interest paid | | | (1,771 | ) | | | (1,736 | ) | | | (1,711 | ) | | | (1,645 | ) | | | (1,573 | ) | | | (1,515 | ) | | | (1,467 | ) |
Other payments | | | (1,471 | ) | | | (973 | ) | | | (1,000 | ) | | | (869 | ) | | | (824 | ) | | | (818 | ) | | | (806 | ) |
Total Operating Payments | | | (12,030 | ) | | | (10,969 | ) | | | (10,781 | ) | | | (10,557 | ) | | | (10,033 | ) | | | (9,740 | ) | | | (9,888 | ) |
| | | | | | | |
Net Cash Inflows from Operating Activities | | | 3,671 | | | | 3,089 | | | | 3,259 | | | | 3,063 | | | | 3,407 | | | | 3,370 | | | | 3,459 | |
| | | | | | | |
Cash Flows from Investments in Non-Financial Assets | | | | | | | | | | | | | | | | | | | | | | | | | | | | |
Purchases of non-financial assets | | | (3,156 | ) | | | (3,460 | ) | | | (3,491 | ) | | | (3,713 | ) | | | (3,654 | ) | | | (3,297 | ) | | | (3,327 | ) |
Sales of non-financial assets | | | 36 | | | | 44 | | | | 41 | | | | 68 | | | | 37 | | | | 31 | | | | 23 | |
Net Cash Flows from Investments in Non-financial Assets | | | (3,120 | ) | | | (3,416 | ) | | | (3,449 | ) | | | (3,644 | ) | | | (3,617 | ) | | | (3,265 | ) | | | (3,304 | ) |
| | | | | | | |
Net Cash Flows from Investments in Financial Assets for Policy Purposes | | | 707 | | | | 195 | | | | 79 | | | | (68 | ) | | | 194 | | | | (17 | ) | | | 16 | |
| | | | | | | |
Net Cash Flows from Investments in Financial Assets for Liquidity Purposes | | | (29 | ) | | | (15 | ) | | | (18 | ) | | | (12 | ) | | | (12 | ) | | | (12 | ) | | | (13 | ) |
| | | | | | | |
Receipts from Financing Activities | | | | | | | | | | | | | | | | | | | | | | | | | | | | |
Advances received (net) | | | 5 | | | | (1 | ) | | | (1 | ) | | | (1 | ) | | | (1 | ) | | | (1 | ) | | | (1 | ) |
Borrowing (net) | | | 733 | | | | 1,030 | | | | 1,276 | | | | 380 | | | | 73 | | | | 143 | | | | 336 | |
Dividends paid | | | (1,799 | ) | | | (1,071 | ) | | | (1,071 | ) | | | (419 | ) | | | (568 | ) | | | (523 | ) | | | (477 | ) |
Deposits received (net) | | | (1 | ) | | | — | | | | — | | | | — | | | | — | | | | — | | | | — | |
Other financing (net) | | | 19 | | | | 243 | | | | (22 | ) | | | 543 | | | | 531 | | | | 390 | | | | 100 | |
Net Cash Flows from Financing Activities | | | (1,043 | ) | | | 202 | | | | 182 | | | | 503 | | | | 36 | | | | 9 | | | | (41 | ) |
| | | | | | | |
Net Increase/(Decrease) in Cash held | | | 186 | | | | 55 | | | | 52 | | | | (157 | ) | | | 7 | | | | 83 | | | | 118 | |
| | | | | | | |
Net cash from operating activities | | | 3,671 | | | | 3,089 | | | | 3,259 | | | | 3,063 | | | | 3,407 | | | | 3,370 | | | | 3,459 | |
Net cash flows from investments in non-financial assets | | | (3,120 | ) | | | (3,416 | ) | | | (3,449 | ) | | | (3,644 | ) | | | (3,617 | ) | | | (3,265 | ) | | | (3,304 | ) |
Dividends paid | | | (1,799 | ) | | | (1,071 | ) | | | (1,071 | ) | | | (419 | ) | | | (568 | ) | | | (523 | ) | | | (477 | ) |
Surplus/(Deficit) | | | (1,248 | ) | | | (1,397 | ) | | | (1,262 | ) | | | (1,001 | ) | | | (779 | ) | | | (419 | ) | | | (321 | ) |
| | | | | | | |
Derivation of ABS GFS Cash Surplus/Deficit | | | | | | | | | | | | | | | | | | | | | | | | | | | | |
Cash surplus/(deficit) | | | (1,248 | ) | | | (1,397 | ) | | | (1,262 | ) | | | (1,001 | ) | | | (779 | ) | | | (419 | ) | | | (321 | ) |
Acquisitions under finance leases and similar arrangements | | | (54 | ) | | | (14 | ) | | | (9 | ) | | | (5 | ) | | | (18 | ) | | | (17 | ) | | | (16 | ) |
ABS GFS Cash Surplus/(Deficit) Including Finance Leases and Similar Arrangements | | | (1,302 | ) | | | (1,412 | ) | | | (1,271 | ) | | | (1,006 | ) | | | (798 | ) | | | (436 | ) | | | (337 | ) |
Note:
| 1. | Numbers may not add due to rounding. |
191
Budget Strategy and Outlook 2021-22
| Table 10.9 | Non-financial Public Sector Cash Flow Statement1 |
| | | | | | | | | | | | | | | | | | | | | | | | | | | | |
| | | 2019–20
Outcome
$ million | | | 2020–21
Budget
$ million | | | 2020–21
Est.Actual
$ million | | | 2021–22
Budget
$ million | | | 2022–23
Projection
$ million | | | 2023–24
Projection
$ million | | | 2024–25
Projection
$ million | |
| | | | | |
Cash Receipts from Operating Activities | | | | | | | | | | | | | | | | | | | | | |
Taxes received | | | 13,543 | | | | 13,444 | | | | 15,010 | | | | 18,321 | | | | 17,051 | | | | 17,378 | | | | 18,253 | |
Grants and subsidies received | | | 28,875 | | | | 27,982 | | | | 30,496 | | | | 31,910 | | | | 33,013 | | | | 35,315 | | | | 36,201 | |
Sales of goods and services | | | 18,222 | | | | 16,407 | | | | 16,630 | | | | 15,702 | | | | 15,828 | | | | 15,921 | | | | 16,053 | |
Interest receipts | | | 2,061 | | | | 2,057 | | | | 2,074 | | | | 2,575 | | | | 2,632 | | | | 2,669 | | | | 2,750 | |
Dividends and income tax equivalents | | | 81 | | | | 137 | | | | 139 | | | | 122 | | | | 145 | | | | 171 | | | | 189 | |
Other receipts | | | 7,441 | | | | 5,241 | | | | 5,444 | | | | 5,926 | | | | 6,393 | | | | 6,555 | | | | 6,830 | |
Total Operating Receipts | | | 70,223 | | | | 65,267 | | | | 69,792 | | | | 74,556 | | | | 75,061 | | | | 78,008 | | | | 80,277 | |
| | | | | | | |
Cash Payments for Operating Activities | | | | | | | | | | | | | | | | | | | | | | | | | | | | |
Payments for employees | | | (31,432 | ) | | | (32,726 | ) | | | (32,353 | ) | | | (33,744 | ) | | | (35,130 | ) | | | (36,111 | ) | | | (37,309 | ) |
Payments for goods and services | | | (22,875 | ) | | | (21,916 | ) | | | (21,903 | ) | | | (22,714 | ) | | | (21,259 | ) | | | (21,355 | ) | | | (21,427 | ) |
Grants and subsidies | | | (10,581 | ) | | | (11,505 | ) | | | (11,081 | ) | | | (11,428 | ) | | | (11,557 | ) | | | (11,358 | ) | | | (10,907 | ) |
Interest paid | | | (3,041 | ) | | | (3,210 | ) | | | (3,021 | ) | | | (3,024 | ) | | | (3,156 | ) | | | (3,289 | ) | | | (3,388 | ) |
Other payments | | | (571 | ) | | | (473 | ) | | | (521 | ) | | | (508 | ) | | | (502 | ) | | | (501 | ) | | | (509 | ) |
Total Operating Payments | | | (68,500 | ) | | | (69,830 | ) | | | (68,879 | ) | | | (71,419 | ) | | | (71,604 | ) | | | (72,614 | ) | | | (73,539 | ) |
| | | | | | | |
Net Cash Inflows from Operating Activities | | | 1,723 | | | | (4,563 | ) | | | 913 | | | | 3,137 | | | | 3,457 | | | | 5,394 | | | | 6,737 | |
| | | | | | | |
Cash Flows from Investments in Non-Financial Assets | | | | | | | | | | | | | | | | | | | | | | | | | | | | |
Purchases of non-financial assets | | | (9,467 | ) | | | (11,032 | ) | | | (10,456 | ) | | | (11,513 | ) | | | (11,440 | ) | | | (10,572 | ) | | | (10,368 | ) |
Sales of non-financial assets | | | 266 | | | | 300 | | | | 247 | | | | 308 | | | | 223 | | | | 284 | | | | 213 | |
Net Cash Flows from Investments in Non-financial Assets | | | (9,201 | ) | | | (10,732 | ) | | | (10,208 | ) | | | (11,205 | ) | | | (11,216 | ) | | | (10,288 | ) | | | (10,155 | ) |
| | | | | | | |
Net Cash Flows from Investments in Financial Assets for Policy Purposes | | | (916 | ) | | | (143 | ) | | | (99 | ) | | | (183 | ) | | | (94 | ) | | | 42 | | | | 86 | |
| | | | | | | |
Net Cash Flows from Investments in Financial Assets for Liquidity Purposes | | | 4,362 | | | | (837 | ) | | | (877 | ) | | | (832 | ) | | | (811 | ) | | | (762 | ) | | | (754 | ) |
| | | | | | | |
Receipts from Financing Activities | | | | | | | | | | | | | | | | | | | | | | | | | | | | |
Advances received (net) | | | (64 | ) | | | (62 | ) | | | (86 | ) | | | (47 | ) | | | (47 | ) | | | (47 | ) | | | (47 | ) |
Borrowing (net) | | | 3,708 | | | | 16,192 | | | | 10,221 | | | | 8,881 | | | | 8,655 | | | | 5,695 | | | | 4,217 | |
Deposits received (net) | | | (1 | ) | | | — | | | | — | | | | — | | | | — | | | | — | | | | — | |
Other financing (net) | | | (88 | ) | | | — | | | | (65 | ) | | | — | | | | — | | | | — | | | | — | |
Net Cash Flows from Financing Activities | | | 3,555 | | | | 16,130 | | | | 10,069 | | | | 8,835 | | | | 8,608 | | | | 5,648 | | | | 4,170 | |
| | | | | | | |
Net Increase/(Decrease) in Cash held | | | (477 | ) | | | (145 | ) | | | (202 | ) | | | (249 | ) | | | (56 | ) | | | 33 | | | | 84 | |
| | | | | | | |
Net cash from operating activities | | | 1,723 | | | | (4,563 | ) | | | 913 | | | | 3,137 | | | | 3,457 | | | | 5,394 | | | | 6,737 | |
Net cash flows from investments in non-financial assets | | | (9,201 | ) | | | (10,732 | ) | | | (10,208 | ) | | | (11,205 | ) | | | (11,216 | ) | | | (10,288 | ) | | | (10,155 | ) |
Surplus/(Deficit) | | | (7,478 | ) | | | (15,295 | ) | | | (9,295 | ) | | | (8,068 | ) | | | (7,759 | ) | | | (4,894 | ) | | | (3,417 | ) |
| | | | | | | |
Derivation of ABS GFS Cash Surplus/Deficit | | | | | | | | | | | | | | | | | | | | | | | | | | | | |
Cash surplus/(deficit) | | | (7,478 | ) | | | (15,295 | ) | | | (9,295 | ) | | | (8,068 | ) | | | (7,759 | ) | | | (4,894 | ) | | | (3,417 | ) |
Acquisitions under finance leases and similar arrangements | | | (1,316 | ) | | | (1,585 | ) | | | (1,641 | ) | | | (1,093 | ) | | | (770 | ) | | | (154 | ) | | | (16 | ) |
ABS GFS Cash Surplus/(Deficit) Including Finance Leases and Similar Arrangements | | | (8,794 | ) | | | (16,880 | ) | | | (10,937 | ) | | | (9,161 | ) | | | (8,530 | ) | | | (5,048 | ) | | | (3,433 | ) |
Note:
| 1. | Numbers may not add due to rounding. |
192
Budget Strategy and Outlook 2021-22
10.3 General Government Sector time series
Data presented in Table 10.10 provides a time series from 2008–09 to 2019–20 for the General Government Sector on the key fiscal aggregates used by the government to measure financial performance. These aggregates have been backcast (as far as possible) to comply with AASB 1049 Whole of Government and General Government Sector Financial Reporting.
193
Budget Strategy and Outlook 2021-22
Table 10.10 General Government Sector Time Series1
| | | | | | | | | | | | | | | | | | | | | | | | | | | | | | | | | | | | | | | | | | | | | | | | |
| | | 2008–09 | | | 2009–10 | | | 2010–11 | | | 2011–12 | | | 2012–13 | | | 2013–14 | | | 2014–15 | | | 2015–16 | | | 2016–17 | | | 2017–18 | | | 2018–19 | | | 2019–20 | |
| | | Actual | | | Actual | | | Actual | | | Actual | | | Actual | | | Actual | | | Actual | | | Actual | | | Actual | | | Actual | | | Actual | | | Actual | |
| | | $ million | | | $ million | | | $ million | | | $ million | | | $ million | | | $ million | | | $ million | | | $ million | | | $ million | | | $ million | | | $ million | | | $ million | |
Revenue from Transactions | | | | | | | | | | | | | | | | | | | | | | | | | | | | | | | | | | | | | | | | | | | | | | | | |
Taxation revenue | | | 8,866 | | | | 9,375 | | | | 9,981 | | | | 10,608 | | | | 10,937 | | | | 11,840 | | | | 12,598 | | | | 12,547 | | | | 12,919 | | | | 13,244 | | | | 14,165 | | | | 14,585 | |
Grant revenue | | | 17,481 | | | | 20,205 | | | | 20,338 | | | | 22,652 | | | | 18,322 | | | | 21,740 | | | | 23,583 | | | | 23,740 | | | | 27,384 | | | | 27,966 | | | | 28,307 | | | | 27,641 | |
Sales of goods and services | | | 3,648 | | | | 3,961 | | | | 4,172 | | | | 5,002 | | | | 5,087 | | | | 5,039 | | | | 5,443 | | | | 5,712 | | | | 5,642 | | | | 5,884 | | | | 5,783 | | | | 5,618 | |
Interest income | | | 1,482 | | | | 2,204 | | | | 2,368 | | | | 2,485 | | | | 2,644 | | | | 2,460 | | | | 2,470 | | | | 2,543 | | | | 2,351 | | | | 2,389 | | | | 2,191 | | | | 2,076 | |
Dividend and income tax equivalent income | | | 1,180 | | | | 949 | | | | 1,232 | | | | 1,112 | | | | 1,351 | | | | 1,975 | | | | 2,554 | | | | 2,661 | | | | 2,675 | | | | 2,920 | | | | 2,784 | | | | 1,929 | |
Other revenue | | | 4,421 | | | | 3,033 | | | | 3,921 | | | | 3,942 | | | | 3,415 | | | | 3,650 | | | | 3,322 | | | | 3,577 | | | | 5,223 | | | | 5,685 | | | | 6,598 | | | | 5,915 | |
Total Revenue | | | 37,078 | | | | 39,727 | | | | 42,013 | | | | 45,801 | | | | 41,755 | | | | 46,705 | | | | 49,970 | | | | 50,780 | | | | 56,194 | | | | 58,087 | | | | 59,828 | | | | 57,764 | |
Expenses from Transactions | | | | | | | | | | | | | | | | | | | | | | | | | | | | | | | | | | | | | | | | | | | | | | | | |
Employee expenses | | | 14,310 | | | | 15,566 | | | | 16,826 | | | | 18,250 | | | | 18,130 | | | | 17,816 | | | | 18,592 | | | | 20,045 | | | | 21,258 | | | | 22,681 | | | | 24,019 | | | | 25,660 | |
Superannuation expenses | | | | | | | | | | | | | | | | | | | | | | | | | | | | | | | | | | | | | | | | | | | | | | | | |
Superannuation interest costs | | | 858 | | | | 1,320 | | | | 1,240 | | | | 1,216 | | | | 923 | | | | 963 | | | | 878 | | | | 767 | | | | 514 | | | | 667 | | | | 653 | | | | 354 | |
Other superannuation expenses | | | 2,012 | | | | 2,051 | | | | 2,171 | | | | 2,301 | | | | 2,420 | | | | 2,277 | | | | 2,319 | | | | 2,507 | | | | 2,661 | | | | 2,741 | | | | 3,012 | | | | 3,183 | |
Other operating expenses | | | 7,300 | | | | 7,568 | | | | 8,646 | | | | 9,497 | | | | 12,817 | | | | 13,108 | | | | 14,539 | | | | 14,811 | | | | 15,578 | | | | 17,259 | | | | 16,480 | | | | 17,087 | |
Depreciation and amortisation | | | 2,496 | | | | 2,501 | | | | 2,507 | | | | 2,777 | | | | 2,902 | | | | 3,060 | | | | 3,137 | | | | 2,921 | | | | 3,068 | | | | 3,326 | | | | 3,451 | | | | 4,033 | |
Other interest expenses | | | 599 | | | | 803 | | | | 1,125 | | | | 1,659 | | | | 1,940 | | | | 2,200 | | | | 2,328 | | | | 2,220 | | | | 1,722 | | | | 1,614 | | | | 1,581 | | | | 1,486 | |
Grant expenses | | | 9,525 | | | | 9,790 | | | | 10,963 | | | | 10,327 | | | | 7,182 | | | | 6,792 | | | | 7,758 | | | | 6,841 | | | | 8,568 | | | | 8,048 | | | | 9,647 | | | | 11,695 | |
Total Expenses | | | 37,099 | | | | 39,599 | | | | 43,479 | | | | 46,028 | | | | 46,312 | | | | 46,217 | | | | 49,551 | | | | 50,112 | | | | 53,369 | | | | 56,337 | | | | 58,843 | | | | 63,498 | |
Net Operating Balance | | | (21 | ) | | | 128 | | | | (1,466 | ) | | | (226 | ) | | | (4,558 | ) | | | 488 | | | | 420 | | | | 668 | | | | 2,825 | | | | 1,750 | | | | 985 | | | | (5,734 | ) |
OTHER KEY AGGREGATES | | | | | | | | | | | | | | | | | | | | | | | | | | | | | | | | | | | | | | | | | | | | | | | | |
Purchases of non-financial assets | | | 6,772 | | | | 8,959 | | | | 8,237 | | | | 7,971 | | | | 7,001 | | | | 6,323 | | | | 4,635 | | | | 4,044 | | | | 4,620 | | | | 5,126 | | | | 5,764 | | | | 6,291 | |
Net acquisition of non-financial assets | | | 4,349 | | | | 6,665 | | | | 5,583 | | | | 5,241 | | | | 3,389 | | | | 3,087 | | | | 992 | | | | 1,164 | | | | 2,265 | | | | 2,337 | | | | 3,192 | | | | 3,424 | |
Fiscal Balance | | | (4,371 | ) | | | (6,537 | ) | | | (7,049 | ) | | | (5,467 | ) | | | (7,947 | ) | | | (2,599 | ) | | | (572 | ) | | | (497 | ) | | | 560 | | | | (587 | ) | | | (2,207 | ) | | | (9,158 | ) |
Cash Surplus/(Deficit) | | | (2,866 | ) | | | (5,341 | ) | | | (5,880 | ) | | | (4,951 | ) | | | (8,585 | ) | | | (3,213 | ) | | | (105 | ) | | | 866 | | | | 1,448 | | | | 337 | | | | 302 | | | | (6,241 | ) |
Net Worth | | | 184,277 | | | | 175,588 | | | | 177,875 | | | | 170,745 | | | | 172,963 | | | | 166,492 | | | | 171,933 | | | | 188,099 | | | | 194,988 | | | | 195,038 | | | | 200,861 | | | | 193,731 | |
Net Debt | | | (19,251 | ) | | | (13,354 | ) | | | (9,542 | ) | | | (5,720 | ) | | | 2,399 | | | | 5,208 | | | | 5,749 | | | | 653 | | | | (355 | ) | | | (509 | ) | | | (198 | ) | | | 14,046 | |
Borrowing2 | | | 10,308 | | | | 15,916 | | | | 24,593 | | | | 29,517 | | | | 37,878 | | | | 41,368 | | | | 43,105 | | | | 35,486 | | | | 33,240 | | | | 31,520 | | | | 32,202 | | | | 44,267 | |
Notes:
| | 1. | Numbers may not add due to rounding. |
| | 2. | Borrowing in 2013–14 includes bank overdraft of $1.434 billion. |
Source: Report on State Finances for Queensland 2009–10 to 2019–20. (Numbers have been recast for changes to UPF presentation.)
194
Budget Strategy and Outlook 2021-22
| 10.4 | Other General Government Uniform Presentation Framework data |
Data in the following tables is presented in accordance with the UPF.
Tables 10.11 and 10.12 provide details of General Government Sector current and capital grant revenue and expenses.
Table 10.11 General Government Sector grant revenue1
| | | | | | | | |
| | | 2020–21 | | | 2021–22 | |
| | | Est. Act. | | | Budget | |
| | | $ million | | | $ million | |
Current grant revenue | | | | | | | | |
Current grants from the Commonwealth | | | | | | | | |
General purpose grants | | | 14,839 | | | | 15,647 | |
Specific purpose grants | | | 9,868 | | | | 9,636 | |
Specific purpose grants for on-passing | | | 3,631 | | | | 3,753 | |
Total current grants from the Commonwealth | | | 28,338 | | | | 29,035 | |
Other contributions and grants | | | 346 | | | | 329 | |
Total current grant revenue | | | 28,684 | | | | 29,364 | |
Capital grant revenue | | | | | | | | |
Capital grants from the Commonwealth | | | | | | | | |
Specific purpose grants | | | 2,865 | | | | 2,538 | |
Total capital grants from the Commonwealth | | | 2,865 | | | | 2,538 | |
Other contributions and grants | | | 34 | | | | 34 | |
Total capital grant revenue | | | 2,899 | | | | 2,571 | |
Total grant revenue | | | 31,582 | | | | 31,935 | |
Note:
| 1. | Numbers may not add due to rounding. |
195
Budget Strategy and Outlook 2021-22
| Table 10.12 | General Government Sector grant expenses1 |
| | | | | | | | |
| | | 2020–21 | | | 2021–22 | |
| | | Est. Act | | | Budget | |
| | | $ million | | | $ million | |
Current grant expense | | | | | | | | |
Private and Not-for-profit sector | | | 2,807 | | | | 2,842 | |
Private and Not-for-profit sector on-passing | | | 3,145 | | | | 3,485 | |
Local Government | | | 368 | | | | 372 | |
Local Government on-passing | | | 505 | | | | 281 | |
Grants to other sectors of Government | | | 2,515 | | | | 2,682 | |
Other | | | 514 | | | | 366 | |
Total current grant expense | | | 9,854 | | | | 10,028 | |
Capital grant expense | | | | | | | | |
Private and Not-for-profit sector | | | 519 | | | | 496 | |
Local Government | | | 1,070 | | | | 1,447 | |
Grants to other sectors of Government | | | 30 | | | | 50 | |
Other | | | 177 | | | | 139 | |
Total capital grant expense | | | 1,796 | | | | 2,132 | |
Total grant expense | | | 11,649 | | | | 12,160 | |
Note:
| 1. | Numbers may not add due to rounding. |
| 10.4.2 | Dividend and income tax equivalent income |
Table 10.13 provides details of the source of dividend and income tax equivalent income in the General Government Sector.
| Table 10.13 | General Government Sector dividend and income tax equivalent income1 |
| | | | | | | | |
| | | 2020–21 | | | 2021–22 | |
| | | Est. Act. | | | Budget | |
| | | $ million | | | $ million | |
Dividend and Income Tax Equivalent income from PNFC sector | | | 798 | | | | 1,012 | |
Dividend and Income Tax Equivalent income from PFC sector | | | 118 | | | | 129 | |
Total Dividend and Income Tax Equivalent income | | | 915 | | | | 1,141 | |
Note:
| 1. | Numbers may not add due to rounding. |
196
Budget Strategy and Outlook 2021-22
| 10.4.3 | Expenses by function |
Table 10.14 provides details of General Government Sector expenses by function.
| Table 10.14 | General Government Sector expenses by function1 |
| | | | | | | | | | | | | | | | | | | | | | | | |
| | | 2020–21 | | | 2020–21 | | | 2021–22 | | | 2022–23 | | | 2023–24 | | | 2024–25 | |
| | | Budget | | | Est. Act. | | | Budget | | | Projection | | | Projection | | | Projection | |
| | | $ million | | | $ million | | | $ million | | | $ million | | | $ million | | | $ million | |
General public services | | | 5,723 | | | | 5,330 | | | | 5,352 | | | | 5,754 | | | | 5,605 | | | | 5,716 | |
Public order and safety | | | 5,953 | | | | 6,074 | | | | 6,313 | | | | 6,164 | | | | 6,384 | | | | 6,713 | |
Economic affairs | | | 2,442 | | | | 2,213 | | | | 2,217 | | | | 2,165 | | | | 1,933 | | | | 1,869 | |
Environmental protection | | | 791 | | | | 848 | | | | 875 | | | | 843 | | | | 787 | | | | 758 | |
Housing and community amenities | | | 1,084 | | | | 1,064 | | | | 1,162 | | | | 1,205 | | | | 1,103 | | | | 1,088 | |
Health | | | 20,184 | | | | 20,222 | | | | 21,214 | | | | 21,322 | | | | 22,003 | | | | 22,729 | |
Recreation, culture and religion | | | 856 | | | | 805 | | | | 941 | | | | 775 | | | | 767 | | | | 760 | |
Education | | | 15,586 | | | | 15,470 | | | | 16,803 | | | | 17,442 | | | | 18,048 | | | | 18,297 | |
Social protection | | | 5,282 | | | | 5,132 | | | | 5,001 | | | | 5,106 | | | | 5,336 | | | | 5,459 | |
Transport | | | 6,980 | | | | 7,041 | | | | 7,273 | | | | 7,374 | | | | 7,410 | | | | 6,824 | |
Total Expenses | | | 64,881 | | | | 64,199 | | | | 67,149 | | | | 68,149 | | | | 69,377 | | | | 70,214 | |
Note:
| 1. | Numbers may not add due to rounding. |
| 10.4.4 | Purchases of non-financial assets by function |
Table 10.15 provides details of General Government Sector purchases of non-financial assets by function.
| Table 10.15 | General Government Sector purchases of non-financial assets by function1 |
| | | | | | | | | | | | | | | | | | | | | | | | |
| | | 2020–21 | | | 2020–21 | | | 2021–22 | | | 2022–23 | | | 2023–24 | | | 2024–25 | |
| | | Budget | | | Est. Act. | | | Budget | | | Projection | | | Projection | | | Projection | |
| | | $ million | | | $ million | | | $ million | | | $ million | | | $ million | | | $ million | |
General public services | | | 209 | | | | 215 | | | | 169 | | | | 71 | | | | 37 | | | | 27 | |
Public order and safety | | | 629 | | | | 469 | | | | 596 | | | | 446 | | | | 309 | | | | 221 | |
Economic affairs | | | 24 | | | | 31 | | | | 53 | | | | 59 | | | | 45 | | | | 30 | |
Environmental protection | | | 42 | | | | 43 | | | | 45 | | | | 27 | | | | 29 | | | | 18 | |
Housing and community amenities | | | 480 | | | | 391 | | | | 438 | | | | 219 | | | | 251 | | | | 259 | |
Health | | | 993 | | | | 792 | | | | 1,141 | | | | 1,216 | | | | 722 | | | | 439 | |
Recreation, culture and religion | | | 103 | | | | 101 | | | | 118 | | | | 70 | | | | 33 | | | | 25 | |
Education | | | 1,631 | | | | 1,242 | | | | 1,417 | | | | 1,019 | | | | 742 | | | | 520 | |
Social protection | | | 51 | | | | 42 | | | | 24 | | | | 37 | | | | 31 | | | | 10 | |
Transport | | | 3,410 | | | | 3,640 | | | | 3,800 | | | | 4,622 | | | | 5,077 | | | | 5,492 | |
Total Purchases | | | 7,572 | | | | 6,965 | | | | 7,800 | | | | 7,786 | | | | 7,275 | | | | 7,041 | |
Note:
| 1. | Numbers may not add due to rounding. |
197
Budget Strategy and Outlook 2021-22
Table 10.16 provides details of taxation revenue collected by the General Government Sector.
| Table 10.16 | General Government Sector taxes1 |
| | | | | | | | |
| | | 2020–21 | | | 2021–22 | |
| | | Est. Act. | | | Budget | |
| | | $ million | | | $ million | |
Taxes on employers’ payroll and labour force | | | 4,192 | | | | 4,484 | |
Taxes on property | | | | | | | | |
Land taxes | | | 1,493 | | | | 1,617 | |
Stamp duties on financial and capital transactions | | | 3,693 | | | | 4,598 | |
Other | | | 1,193 | | | | 1,259 | |
Taxes on the provision of goods and services | | | | | | | | |
Taxes on gambling | | | 1,565 | | | | 1,553 | |
Taxes on insurance | | | 1,117 | | | | 1,182 | |
Taxes on use of goods and performance of activities | | | | | | | | |
Motor vehicle taxes | | | 2,655 | | | | 2,706 | |
Total Taxation Revenue | | | 15,907 | | | | 17,399 | |
Note:
| 1. | Numbers may not add due to rounding. |
| 10.5 | Contingent liabilities |
Contingent liabilities represent items that are not included in the budget as significant uncertainty exists as to whether the government would sacrifice future economic benefits in respect of these items. Nevertheless, such contingencies need to be recognised and managed wherever possible in terms of their potential impact on the government’s financial position in the future.
The state’s quantifiable and non-quantifiable contingent liabilities are detailed in the 2019–20 Report on State Finances – whole-of-government financial statements (note 43).
A summary of the state’s quantifiable contingent liabilities as at 30 June 2020 is provided in Table 10.17.
| Table 10.17 | Contingent liabilities |
| | | | |
| | | 2019–20 | |
| | | $ million | |
Nature of contingent liability | | | |
Guarantees and indemnities | | | 13,217 | |
Other | | | 155 | |
Total | | | 13,371 | |
198
Budget Strategy and Outlook 2021-22
| 10.6 | Background and interpretation of Uniform Presentation Framework |
As mentioned in the introduction to this chapter, the UPF was reviewed in 2007 following release of the accounting standard, AASB 1049 Whole of Government and General Government Sector Financial Reporting.
This standard aims to harmonise GFS and GAAP with the objective of improving the clarity and transparency of government financial statements.
| 10.6.1 | Accrual Government Finance Statistics Framework |
The GFS reporting framework, developed by the Australian Bureau of Statistics (ABS), is based on international statistics standards (the International Monetary Fund Manual on Government Finance Statistics and the United Nations System of National Accounts). This allows comprehensive assessments to be made of the economic impact of government.
The accrual GFS framework is based on an integrated recording of stocks and flows. Stocks refers to a unit’s holdings of assets and liabilities at a point in time, while flows represent the movement in the stock of assets and liabilities between 2 points in time. Flows comprise 2 separate types, transactions and other economic flows. Transactions come about from mutually agreed interactions between units or within a single unit. Other economic flows would include revaluations and destruction or discovery of assets that do not result from a transaction.
In GFS operating statements, other economic flows, being outside of the control of government, are excluded and do not affect the net operating balance or fiscal balance.
| 10.6.2 | Generally Accepted Accounting Principles |
In addition to the GFS framework, public sector entities were previously required to report at year end against AAS 31 Financial Reporting by Government, which meant complying with the Accounting Standards issued by the AASB.
| 10.6.3 | Harmonisation under AASB 1049 |
This dual reporting regime caused confusion for financial report users and the Financial Reporting Council asked the AASB to develop a framework harmonising GAAP and GFS and to issue an Australian accounting standard for a single set of government reports.
In the development of AASB 1049, the AASB adopted the following approaches:
| • | | adoption of GAAP definition, recognition and measurement principles in almost all cases |
| • | | amending presentation requirements to encompass a comprehensive result that retains GAAP classification system but overlays it with a transaction and other economic flows classification system based on GFS |
| • | | expanding the disclosure requirements to incorporate key fiscal aggregates required by GFS. |
199
Budget Strategy and Outlook 2021-22
| 10.6.4 | Revisions to the Uniform Presentation Framework |
Following the introduction of AASB 1049, the Australia, state and territory governments consider that the UPF will continue to be an important framework for ensuring comparability of financial information across jurisdictions. The UPF continues to apply to financial statements produced by government in budgets, mid-year budget updates and final budget outcome reports, whereas the accounting standard applies only to outcome reports.
Aligning the framework with the AASB 1049 was not intended to create a UPF that complies with all the reporting requirements of AASB 1049. For example, the UPF does not include the same level of detail in relation to disclosure requirements of AASB 1049. Instead, the revised UPF allows jurisdictions to utilise the framework as the base set of statements and add additional relevant information to comply with AASB 1049.
| 10.7 | Sector classification |
GFS data is presented by institutional sector, distinguishing between the General Government Sector and the PNFC Sector.
Budget reporting focuses on the General Government Sector, which provides regulatory services, and goods and services of a non-market nature that are provided at less than cost or at no cost. These services are largely financed by general revenue (Australian Government grants and state taxation). This service comprises government departments, their commercialised business units/shared service providers and certain statutory bodies.
The PNFC Sector comprises bodies that provide mainly market goods and services that are of non-regulatory and non-financial nature. PNFCs are financed through sales to customers of their goods and services and may be supplemented by explicit government subsidy to satisfy community service obligations. In general, PNFCs are largely distinguishable from the governments that own them. Examples of PNFCs include the energy entities and Queensland Rail.
Together, the General Government Sector and the PNFC Sector comprise the Non-financial Public Sector.
Further discussion of the GFS framework of reporting, including definitions of GFS terms, can be obtained from the webpage of the ABS at www.abs.gov.au.
200
Budget Strategy and Outlook 2021-22
The reporting entities included in the General Government and the PNFC sectors in these budget papers are included below.
Departments
Agriculture and Fisheries
Children, Youth Justice and Multicultural Affairs
Communities, Housing and Digital Economy
Education
Employment, Small Business and Training
Energy and Public Works
Environment and Science
Justice and Attorney-General
Premier and Cabinet
Public Safety Business Agency (abolished 1 July 2021)
Queensland Corrective Services
Queensland Fire and Emergency Services
Queensland Health
Queensland Police Service
Queensland Treasury
Regional Development, Manufacturing and Water Resources
Seniors, Disability Services and Aboriginal and Torres Strait Islander Partnerships
State Development, Infrastructure, Local Government and Planning
Tourism, Innovation and Sport
Transport and Main Roads
201
Budget Strategy and Outlook 2021-22
Commercialised Business Units
CITEC
Economic Development Queensland
QBuild
QFleet
RoadTek
Shared Service Providers
Corporate Administration Agency
Queensland Shared Services
202
Budget Strategy and Outlook 2021-22
Other General Government entities
Board of the Queensland Museum
Crime and Corruption Commission
Cross River Rail Delivery Authority
Electoral Commission of Queensland
Gold Coast Waterways Authority
Health and Wellbeing Queensland
Hospital and Health Services
Cairns and Hinterland
Central Queensland
Central West
Children’s Health Queensland
Darling Downs
Gold Coast
Mackay
Metro North
Metro South
North West
South West
Sunshine Coast
Torres and Cape
Townsville
West Moreton
Wide Bay
Legal Aid Queensland
Legislative Assembly
Library Board of Queensland
Motor Accident Insurance Commission
Nominal Defendant
Office of the Governor
Office of the Health Ombudsman
Office of the Information Commissioner
Office of the Inspector-General Emergency Management
Office of the Ombudsman
Prostitution Licensing Authority
Public Service Commission
Queensland Art Gallery Board of Trustees
Queensland Audit Office
Queensland Building and Construction Commission
Queensland Curriculum and Assessment Authority
Queensland Family and Child Commission
Queensland Human Rights Commission
Queensland Mental Health Commission
Queensland Performing Arts Trust
Queensland Racing Integrity Commission
Queensland Reconstruction Authority
Queensland Rural and Industry Development Authority
Residential Tenancies Authority
South Bank Corporation TAFE Queensland
The Council of the Queensland Institute of Medical Research
The Public Trustee of Queensland
Tourism and Events Queensland
Trade and Investment Queensland
203
Budget Strategy and Outlook 2021-22
| 10.8.2 | Public Non-financial Corporations |
CleanCo Queensland Ltd
CS Energy Limited
Energy Queensland Limited
Far North Queensland Ports Corporations Limited
Gladstone Area Water Board
Gladstone Ports Corporation Limited
Mount Isa Water Board
North Queensland Bulk Ports Corporation Limited
Port of Townsville Limited
Powerlink Queensland
Queensland Bulk Water Supply Authority (SEQ Water)
Queensland Rail
Queensland Treasury Holdings Pty Ltd
Stadiums Queensland
Stanwell Corporation Limited
Sunwater Limited
204
Budget Strategy and Outlook 2021-22
| Appendix A: | Concessions statement |
Context
The Queensland Government provides a wide range of concessions across a variety of services and products. Concessions include targeted discounts, rebates and subsidies for Queenslanders and Queensland businesses based on eligibility criteria (e.g. factors such as age, income, special-needs, location, or business characteristics), as well as broader concession arrangements to reduce prices paid by consumers for transport, electricity and water services.
The majority of Queenslanders benefit from at least one Queensland Government concession and, in many cases, may benefit from multiple concessions each year. For example, aged pensioners are eligible for a number of Queensland Government concessions, such as discounts on their council rates, water, gas and electricity bills, and vehicle registration fees, as well as subsidised optometry and dental services.
In the context of the COVID-19 crisis and the resulting impacts on economic activity, businesses and households across the state, the Queensland Government introduced a wide variety of concessions providing support for individuals, households and businesses which reduce the cost of living or the cost of doing business.
Some of these concessions were time-limited, given the need for targeted and temporary relief to support Queensland businesses and households during the crisis. As a result, the level of some concessions is expected to reduce materially compared with that provided in 2020–21, given the ongoing economic recovery now underway across the state means that ongoing provision of a range of specific COVID-19 related concessions is no longer necessary.
Details of these concessions, including appropriate references to those implemented as temporary measures in the context of COVID-19, are outlined in the Concessions Statement.
Further information on the eligibility requirements and benefits of a range of government concessions can be found by visiting https://www.qld.gov.au/ and searching for “concessions”.
Focus
This statement highlights the cost and nature of concessions provided by the Queensland Government. It covers: concessions that are direct budget outlays (e.g. fee subsidy payments); and concessions that are revenue foregone through fees and charges set at a lower rate than applies to the wider community and other businesses or, in the case of broader concessions, deliver services to all consumers at less than the full cost of service provision.
Section A.2 sets out the specific concessions provided by the Queensland Government by agency. Section A.3 sets out the concessions provided by government-owned corporations (GOCs) and is separated into concessions by GOC, concessional leases (industry, commercial and community) by GOC and COVID-19-related measures by GOC. Within each agency or GOC, concessions are listed in descending order of value.
205
Budget Strategy and Outlook 2021-22
As highlighted in Chart A.1, the total value of all concessions is estimated to be $6.148 billion in 2021–22. This is a slight decrease from the 2020–21 estimated actual concessions of $6.181 billion. However, importantly, this 2020–21 figure included approximately $160 million worth of shorter-term COVID-19 related support measures, many of which are no longer required given Queensland’s economic recovery is now well underway.
Excluding these targeted COVID-19 response measures from the previous financial year, the Queensland Government’s overall concessions provided to Queenslanders have increased by nearly $120 million between 2020–21 and 2021–22.
| Chart A.1 | Total concessions value by year1 |
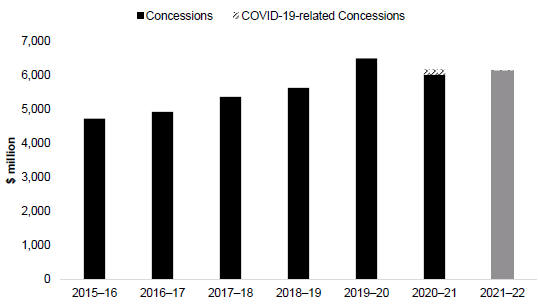
Note:
| 1. | All years to 2018–19 are estimated actuals, 2019–20 is an actual (due to the timing of the 2020–21 Budget, an actual figure was calculated for that year), 2020–21 is an estimated actual and 2021–22 is the budgeted amount. |
Explanation of scope
For the purposes of this document, concessions include:
| • | | discounts, rebates and subsidies to improve access to, and the affordability of, a range of services for individuals, families or businesses based on eligibility criteria (e.g. relating to factors such as age, income, special needs, location, or business characteristics) |
| • | | concessional prices for government services, where the price charged to all consumers, including businesses, is less than the full cost of service provision. |
206
Budget Strategy and Outlook 2021-22
Both General Government and Public Non–financial Corporations (PNFC) Sector concessions are included in this statement. Where a payment is made from a General Government Sector agency to a PNFC entity for a concession arrangement, the expenditure is reported against the General Government Sector agency only to avoid double counting.
To be included in this statement, concessions must meet the minimum materiality threshold of estimated expenditure or revenue foregone of $50,000 in 2021–22.
Varying methods have been used to estimate the cost of concessions, depending on the nature of the concessions, including:
| • | | direct budget outlay cost (e.g. direct subsidy or rebate payments or government’s contribution in the case of items such as rental subsidies) |
| • | | revenue foregone (e.g. concessional fees and charges) |
| • | | cost of goods and services provided. |
For the purposes of illustration, the document often uses averages to demonstrate the potential value of the concession to recipients. However, averages are not reflective of individual circumstances, meaning the actual dollar value of the concession to individual recipients may vary from person to person or business to business.
The Concessions Statement does not include tax expenditures (e.g. tax exemptions, reduced tax rates, tax rebates and deductions). Information on tax expenditures can be found in Appendix B – Tax Expenditure Statement.
207
Budget Strategy and Outlook 2021-22
| Table A.1.1 | Concession by entity1 |
| | | | | | | | |
Concession by Entity | | 2020–21
Est. Act.
$ million | | | 2021–22
Estimate
$ million | |
Agency | | | | | | | | |
Department of Agriculture and Fisheries | | | 57.4 | | | | 49.5 | |
Department of Communities, Housing and Digital Economy | | | 517.3 | | | | 519.2 | |
Department of Education | | | 140.2 | | | | 145.4 | |
Department of Employment, Small Business and Training | | | 521.0 | | | | 525.5 | |
Department of Energy and Public Works | | | 481.4 | | | | 537.6 | |
Department of Environment and Science | | | 3.7 | | | | 2.0 | |
Department of Justice and Attorney–General | | | 130.4 | | | | 110.6 | |
Department of Regional Development, Manufacturing and Water | | | 22.3 | | | | 36.6 | |
Department of Resources | | | 46.8 | | | | 3.2 | |
Department of Seniors, Disability Services, and Aboriginal and Torres Strait Islander Partnerships | | | 449.7 | | | | 423.1 | |
Department of State Development, Infrastructure, Local Government and Planning | | | 3.7 | | | | 0.1 | |
Department of Tourism, Innovation and Sport | | | 1.4 | | | | 0.4 | |
Department of Transport and Main Roads | | | 3,345.9 | | | | 3,330.5 | |
Queensland Fire and Emergency Services | | | 10.9 | | | | 11.0 | |
Queensland Health | | | 299.9 | | | | 311.0 | |
Total Agency | | | 6,032.0 | | | | 6,005.7 | |
| | |
Government-owned corporations | | | | | | | | |
Energy Queensland | | | 31.0 | | | | 38.9 | |
Far North Queensland Ports Corporation Limited | | | 8.6 | | | | 3.7 | |
Gladstone Ports Corporation Limited | | | 42.6 | | | | 39.6 | |
North Queensland Bulk Ports Corporation Limited | | | 1.7 | | | | 1.6 | |
Port of Townsville Limited | | | 7.0 | | | | 6.3 | |
Queensland Rail Limited | | | 8.1 | | | | 2.1 | |
Seqwater | | | 0.4 | | | | .. | |
Sunwater Limited | | | 49.8 | | | | 50.4 | |
Total Government-owned corporations | | | 149.2 | | | | 142.6 | |
| | |
Total all entities | | | 6,181.2 | | | | 6,148.3 | |
Note: Numbers may not add due to rounding.
208
Budget Strategy and Outlook 2021-22
| Table A.2.1 | Department of Agriculture and Fisheries |
| | | | | | | | |
Concession | | 2020–21
Est. Act.
$ million | | | 2021–22
Estimate
$ million | |
Primary Industry Productivity Enhancement Scheme (PIPES) | | | 26.3 | | | | 26.3 | |
Drought Relief Assistance Scheme1 | | | 15.8 | | | | 8.2 | |
Drought Carry-on Finance Loan Scheme | | | — | | | | 3.6 | |
Drought Ready and Recovery Finance Loan Scheme | | | — | | | | 3.6 | |
Drought Preparedness Grant Scheme | | | — | | | | 2.0 | |
Emergency Drought Assistance Loan Scheme | | | — | | | | 1.9 | |
Vessel Tracking Rebate Scheme2 | | | 0.5 | | | | 1.7 | |
Farm Management Grants Program | | | — | | | | 1.0 | |
Business Counselling3 | | | 0.7 | | | | 0.7 | |
Back to Work in Agriculture Incentive Scheme4 | | | 0.2 | | | | 0.5 | |
COVID-19 Jobs Support Loan Scheme3 | | | 13.2 | | | | — | |
Rent Relief Assistance3 | | | 0.6 | | | | — | |
Small Business Advisory Service3 | | | 0.1 | | | | — | |
Total | | | 57.4 | | | | 49.5 | |
Notes:
| 1. | The variance is due to improving seasonal conditions compared with the extreme drought of previous years. |
| 2. | The variance is due to the anticipated increase in applications in the final year 2021–22. |
| 3. | This item is part of the Queensland Government response to COVID-19. |
| 4. | The scheme commenced on 2 October 2020 and was extended statewide. The scheme is still open to ensure that an incentive program is available during the peak winter harvest period in Queensland. |
Primary Industry Productivity Enhancement Scheme (PIPES)
PIPES is administered by the Queensland Rural and Industry Development Authority (QRIDA) and provides concessional rates of interest on loans to eligible primary producers in need of financial assistance. First Start Loans and Sustainability Loans of up to $2 million and $1.3 million, respectively, support applicants to enter primary production and to improve productivity and sustainability.
The average concessional interest rate for new lending is 1.65 per cent. The amounts shown in the above table represent the fair values of the interest rate concessions pertaining to loans issued in the PIPES portfolio in each of the financial years shown.
209
Budget Strategy and Outlook 2021-22
Drought Relief Assistance Scheme
As part of the Drought Assistance and Reform Package, the Drought Relief Assistance Scheme provides freight subsidies of up to 50 per cent and emergency water infrastructure rebates of up to 50 per cent to eligible applicants, up to a maximum of between $20,000 and $50,000 per property, per financial year. These concessions are only available to currently drought declared producers that do not access the new drought preparedness measures. Free financial counselling is being provided via the Rural Financial Counselling Service for producers and related small business owners.
Drought Carry-on Finance Loan Scheme
As part of the Drought Assistance and Reform Package, the Drought Carry-on Finance Loan Scheme will provide a concessional loan to eligible primary producers of up to $250,000 for carry-on finance during drought. These loans would be available where the $50,000 available from the Emergency Drought Assistance Loan Scheme is insufficient to assist the producer manage drought conditions.
The concession is calculated on the basis of a commercial reference rate of 4.31 per cent per annum and an average concessional interest rate for new lending of 1.65 per cent per annum. The amount shown in the above table represents the fair value of the interest rate concessions pertaining to loans in the financial year shown. This concession is new in 2021–22.
Drought Ready and Recovery Finance Loan Scheme
As part of the Drought Assistance and Reform Package, the Drought Ready and Recovery Finance Loan Scheme will provide a concessional loan of up to $250,000 for eligible primary producers to undertake measures identified in their Farm Business Resilience Plan that will improve the drought preparedness of producers’ property. The concession is calculated on the basis of a commercial reference rate of 4.31 per cent per annum and an average concessional interest rate for new lending of 1.65 per cent per annum. The amount shown in the above table represents the fair values of the interest rate concessions pertaining to loans in the financial year shown. This concession is new in 2021–22.
Drought Preparedness Grant Scheme
As part of the Drought Assistance and Reform Package, the Drought Preparedness Grants Scheme will provide a rebate to eligible primary producers of up to $50,000 for on-farm capital improvements identified in their farm business resilience plan to improve the drought preparedness of the producers’ property. This concession is new in 2021–22.
Emergency Drought Assistance Loan Scheme
As part of the Drought Assistance and Reform Package, the Emergency Drought Assistance Loan Scheme will provide an interest free concessional loan to eligible primary producers of up to $50,000 as emergency finance for carry-on activities like paying wages or creditors during drought. The concession is calculated at a rate of 4.31 per cent per annum on the basis a commercial reference rate of this amount and no interest being charged on the loan. The amount shown in the above table represents the fair values of the interest rate concessions pertaining to loans in the financial year shown. This concession is new in 2021–22.
210
Budget Strategy and Outlook 2021-22
Vessel Tracking Rebate Scheme
This initiative is designed to assist commercial fishers by providing rebates up to $970 per eligible vessel before 30 June 2022, to offset the cost of purchasing and installing approved vessel tracking units.
Farm Management Grants Program
As part of the Drought Assistance and Reform Package, the Farm Management Grants Program will provide a rebate of 50 per cent to a maximum of $2,500 to eligible primary producers for the cost of developing a farm business resilience plan for their property. The Queensland Government has allocated $1 million, which is anticipated to be matched by the Australian Government. This concession is new in 2021–22.
Business Counselling
Free and confidential small and rural business financial counselling is provided to assist business owners who are experiencing or at risk of financial hardship due to the impacts of COVID-19 on their business. The support assists clients to better understand their financial position, access financial assistance, identify long-term recovery options, implement plans and access broader professional advice and support. The service is run through the Rural Financial Counselling Services in Queensland. On average, a benefit of approximately $950 is received in financial counselling services per client. This service is available until 30 June 2021 and the program will be finalised in 2021–22.
Back to Work in Agriculture Incentive Scheme
The Back to Work in Agriculture Incentive Scheme is a pilot scheme to encourage eligible Queenslanders to meet short-term labour shortage demands in agriculture, which includes payments of up to $1,500 to assist with accommodation and transport costs associated with travelling and staying in remote locations. Phase one focused on the Wide Bay and Darling Downs and it was extended statewide in December 2020.
COVID-19 Jobs Support Loan Scheme
COVID-19 Jobs Support Loans were administered by QRIDA and provided concessional loans to assist Queensland businesses and non-profit organisations financially impacted by COVID-19 to retain employees and maintain their operations.
Concessional loans were provided of up to 50 per cent of an eligible entity’s annual wage expense, to a maximum of $250,000. A fixed interest rate of 2.5 per cent per annum applies to loans except for the first year when the loan is repayment free and no interest is charged. The next 2 years are interest only, followed by principal and interest repayments over the remaining term of the loan.
The amounts shown in the above table represent the fair values of the interest rate concessions pertaining to loans issued in each of the financial years. The value of the concession is the difference between the fair value at the market rate and the nominal value at the concessional rate. This measure ceased in 2020–21.
211
Budget Strategy and Outlook 2021-22
Rent Relief Assistance
The waiving of rent has been provided to businesses who hold a lease on government premises and have been impacted by the COVID-19 pandemic. This measure ceased in 2020–21.
Small Business Advisory Service
The Small Business Advisory Service provided free advice to small businesses who were not successful in obtaining a loan under the COVID-19 Jobs Support Loan Scheme, and were subject to closure or highly impacted by the COVID-19 pandemic shutdown restrictions, to adapt and sustain their operations and build resilience. The average value of the concession was $1,350. This measure ceased in 2020–21.
212
Budget Strategy and Outlook 2021-22
| Table A.2.2 | Department of Communities, Housing and Digital Economy |
| | | | | | | | |
Concession | | 2020–21
Est. Act.
$ million | | | 2021–22
Estimate
$ million | |
Government managed housing rental rebate | | | 460.0 | | | | 461.9 | |
National Rental Affordability Scheme | | | 28.3 | | | | 26.6 | |
Home Assist Secure | | | 22.5 | | | | 22.9 | |
Queensland Performing Arts Trust - Arts Concessional Entry Fees1 | | | 1.5 | | | | 3.0 | |
Queensland Museum - Arts Concessional Entry Fee2 | | | 1.4 | | | | 1.7 | |
Arts Queensland - Discount on Property Lease Rentals3 | | | 0.8 | | | | 0.9 | |
Rental Bond Loans | | | 0.6 | | | | 0.7 | |
Queensland Art Gallery - Arts Concessional Entry Fees4 | | | 0.4 | | | | 0.5 | |
Queensland Performing Arts Trust - Venue Hire Rebates1 | | | 0.3 | | | | 0.4 | |
Arts Queensland - Venue Hire Rebates | | | 0.3 | | | | 0.3 | |
State Library of Queensland - Venue Hire Rebates | | | 0.3 | | | | 0.3 | |
COVID-19 Relief - Arts Queensland - Property Lease Rental Relief5 | | | 0.4 | | | | — | |
COVID-19 Relief - Queensland Museum - Additional Concessions5 | | | 0.3 | | | | — | |
COVID-19 Relief - Queensland Performing Arts Trust - Additional Concessions5 | | | 0.2 | | | | — | |
Non-Government Managed Housing6 | | | — | | | | — | |
Total | | | 517.3 | | | | 519.2 | |
Notes:
| 1. | Variance between 2020–21 Estimated Actual and 2021–22 Estimate is primarily due to reopening of venues and increased patronage. |
| 2. | Variance between 2020–21 Estimated Actual and 2021–22 Estimate is due to higher visitation being expected due to reopening of venues and increased patronage. |
| 3. | Variance between 2020–21 Estimated Actual and 2021–22 Estimate is primarily due to reopening of venues and increased leasing space following revitalisation works. |
| 4. | Variance between 2020–21 Estimated Actual and 2021–22 Estimate is due to Concessional entry fees which varies depending on the number and nature of ticketed exhibitions in the year. |
| 5. | This item is part of the government response to COVID-19. |
| 6. | The value of this concession arrangement cannot be easily quantified. |
Government Managed Housing Rental Rebate
The Government Managed Housing Rental Rebate targets low income families and individuals and represents the difference between the estimated rents that would be payable in the private market and rent that is charged by the government based on household income.
Assistance is provided to approximately 54,300 households. The estimated average yearly subsidy per household for 2021–22 is $8,504.
213
Budget Strategy and Outlook 2021-22
National Rental Affordability Scheme
The National Rental Affordability Scheme (NRAS) is an Australian Government initiative, delivered in partnership with the Queensland Government, to increase the supply of new affordable rental housing. The scheme provides financial incentives to investors to build well located dwellings and rent them to eligible low to moderate income households, at a discounted rate at least 20 per cent below market rent.
Under the scheme, the concession to the tenant is provided by the property owner. Due to the nature of the arrangement, the overall value of the concession to the tenant cannot be quantified. In 2021–22, the government has allocated $26.6 million for the payment of financial incentives to NRAS investors who are then required to discount rents to tenants.
Home Assist Secure
Home Assist Secure provides free safety related information and referrals, and subsidised assistance to eligible clients unable to undertake or pay for critical maintenance services without assistance. To be considered for assistance, home owners or tenants over the age of 60 or of any age with disability must hold a Pensioner Concession Card and be unable to complete the work themselves. In addition, they must be unable to access assistance from other services.
Labour costs (up to $500 per household per year) for the assistance provided are subsidised by Home Assist Secure while the balance of the costs (including the materials) are met by the client. Clients can also receive a one-off subsidy of $80 for the cost of materials for security related work (Security Hardware Subsidy).
Home Assist Secure targets homeowners and those in rental housing who are over 60 years of age or have disability, and who require assistance to remain living in their home. In 2021–22, it is estimated that over 40,000 households will be assisted.
Queensland Performing Arts Trust – Arts Concessional Entry Fees
Concessional entry fees are offered for specific Queensland Performing Arts Trust productions and to provide support for other not-for-profit theatre companies to enable tickets to be sold at concessional prices. The level of concession provided varies depending on the number and size of events being held each year.
Queensland Museum – Arts Concessional Entry Fee
Queensland Museum provides concessional entry fees to seniors, students, children, families and a variety of concession card holders for ticketed exhibitions at Queensland Museum and Sciencentre, and for general entry to Cobb & Co Museum in Toowoomba, Workshops Rail Museum in Ipswich and the Museum of Tropical Queensland in Townsville. Concessions are also provided to targeted groups, such as schools, to encourage visits to museums. The level of concession provided varies depending on the venue and the event.
Arts Queensland – Discount on Property Lease Rentals
Property lease rentals are provided to arts and cultural organisations at a discount from market rental rates at the Judith Wright Arts Centre, Festival House and Bulmba-ja arts centre. Further discounts on specialist rehearsal and gallery space are provided as negotiated at the time of entering the lease and dependent on the individual arts or cultural organisation and its funding.
214
Budget Strategy and Outlook 2021-22
Rental Bond Loans
The government provides interest-free rental bond loans to people who cannot afford to pay a full bond to move into private rental accommodation, thereby reducing the need for more costly, subsidised housing assistance, through 2 products:
| 1. | Bond Loans: equivalent to a maximum amount of 4 weeks rent |
| 2. | Bond Loan Plus: equivalent to a maximum amount of 6 weeks rent. |
The interest-free bond loan targets low-income households and can stabilise tenancies, prevent households from entering the cycle of homelessness and engaging with fringe, high interest credit providers. The concession represents the interest saving for the client on the bond loan.
In 2021–22, $27 million in bond loans and bond loan plus may be advanced to an estimated 25,000 clients.
Queensland Art Gallery – Arts Concessional Entry Fees
Queensland Art Gallery’s ticket prices are set to ensure that they are affordable and to maximise attendance, with additional concessions provided to seniors, students, children, families, and a variety of concession card holders. The purpose of the Queensland Art Gallery Arts entry fees concession is to contribute to the cultural, social and intellectual development of Queenslanders, and encourage diverse audiences.
Queensland Performing Arts Trust – Venue Hire Rebates
Venue hire rebates are offered to government funded cultural organisations, charitable organisations, government departments and educational institutions. Organisations currently receiving discounts are Queensland Symphony Orchestra, Opera Queensland, Queensland Theatre Company and Queensland Ballet.
Arts Queensland – Venue Hire Rebates
Venue hire rebates support Queensland Government funded arts organisations and professional artists to develop and present new work at the Judith Wright Arts Centre (formerly the Judith Wright Centre of Contemporary Arts) and Bulmba-ja arts centre (formerly the Cairns Centre of Contemporary Arts).
State Library of Queensland – Venue Hire Rebates
State Library of Queensland provides venue hire concessions to targeted community and non-profit groups, including cultural and charitable organisations and educational institutions, in order to support events and programs directly linked to State Library of Queensland’s services, programs, and activities.
COVID-19 Relief – Arts Queensland – Property Lease Rental Relief
Property lease rental relief is provided to arts and cultural organisations in response to impacts of COVID-19. This concession has now ceased for 2021–22.
COVID-19 Relief – Queensland Museum – Additional Concessions
Due to COVID-19 and in accordance with Queensland Government policy, rental relief was provided to arts tenants. This concession has now ceased for 2021–22.
215
Budget Strategy and Outlook 2021-22
COVID-19 Relief – Queensland Performing Arts Trust – Additional Concessions
Additional concession charges were waived to provide support for other not-for-profit theatre companies due to the COVID-19 shutdown measures. The level of assistance provided varied depending on the number and size of events. This concession has now ceased for 2021–22.
Non-Government Managed Housing
The government provides contributions to social housing providers, including capital grants, granted land or properties, or recurrent funding, to assist in improving housing affordability and access to social housing.
Due to the nature of the arrangement, particularly varying rents charged by providers based on individual circumstances of each household, the overall value of the concession provided by the government cannot be easily quantified.
Rents charged for social housing managed by the providers are based on between 25 per cent and 30 per cent of a household’s assessable income or the market rent, whichever is lower, which substantially reduces accommodation costs for eligible individuals and families. Many of these families may also be eligible for Commonwealth Rent Assistance to assist in the cost of their accommodation.
216
Budget Strategy and Outlook 2021-22
| Table A.2.3 | Department of Education |
| | | | | | | | |
Concession | | 2020–21
Est. Act.
$ million | | | 2021–22
Estimate
$ million | |
Textbook and Resource Allowance1 | | | 67.7 | | | | 71.0 | |
School Transport Assistance for Students with Disability2 | | | 43.9 | | | | 45.7 | |
Living Away from Home Allowance Scheme | | | 8.1 | | | | 8.1 | |
Tuition Fee Exemptions/Waivers - Dependants of International Students3 | | | 7.3 | | | | 7.4 | |
Non-State Schools Transport Assistance Scheme4 | | | 6.2 | | | | 6.3 | |
Dalby State High School - Bunya Campus Residential Facility | | | 2.6 | | | | 2.6 | |
Western Cape Student Residential College, Weipa | | | 1.3 | | | | 1.3 | |
Spinifex State College - Mount Isa Student Residential Facility | | | 1.2 | | | | 1.2 | |
Distance Education - Information and Communication Technology Subsidy Scheme | | | 1.1 | | | | 1.1 | |
Distance Education - Non-Government Student Fee Subsidy | | | 0.7 | | | | 0.7 | |
Plant Registration - Amusement Devices5 | | | 0.1 | | | | — | |
Total | | | 140.2 | | | | 145.4 | |
Notes:
| 1. | The increase between 2020–21 Estimated Actual and 2021–22 Estimate is due to enrolment growth and CPI indexation. |
| 2. | The increase between 2020–21 Estimated Actual and 2021–22 Estimate is due to anticipated increases in the number of students assisted. |
| 3. | The increase between 2020–21 Estimated Actual and 2021–22 Estimate is due to CPI indexation. |
| 4. | The increase between 2020–21 Estimated Actual and 2021–22 Estimate is due to CPI indexation. |
| 5. | This item is part of the Queensland Government response to COVID-19. |
Textbook and Resource Allowance
The Textbook and Resource Allowance is available for all parents/caregivers of secondary school age students attending state and non-government schools, and children registered in home education of equivalent age, to assist with the cost of textbooks and learning resources. In schools, parents may assign this allowance to the school to reduce the fees associated with participating in the school’s textbook and resource scheme. For children registered for home education, the allowance is paid directly to the parent.
In 2021, the rates per annum are $130 for students in Years 7 to 10 and $281 for students in Years 11 and 12.
School Transport Assistance for Students with Disability
The School Transport Assistance Program for Students with Disability assists eligible state school students whose disability impacts on their parents’ or carers’ ability to arrange their safe travel to and from school. This assistance includes co-ordinated service delivery in specially contracted taxis or minibuses, payment of fares on bus, ferry, tram and train, or an allowance for parents who make private travel arrangements for their children to school or a transport meeting point.
217
Budget Strategy and Outlook 2021-22
The benefit level is to a maximum of $400 per week, per student, however in exceptional circumstances higher amounts may be approved. A separate scheme is in place for students with disability attending non-state schools (refer to the ‘Non-State Schools Transport Assistance Scheme’).
Living Away from Home Allowance Scheme
The Living Away from Home Allowance Scheme provides financial assistance to support geographically isolated families. The scheme assists with the costs of children required to live away from home to attend school. This concession is available to Queensland students attending both state and non-state schools.
The benefits available for eligible students in 2021 are:
| • | | Remote Area Tuition Allowance – assistance is available for primary students of up to $3,873 per annum and for secondary students of up to $5,576 per annum |
| • | | Remote Area Travel Allowance – available where the distance from the family home to the boarding location is at least 50km. Benefit levels depend on the distance travelled and range from $146 to a maximum of $1,786 per annum |
| • | | Remote Area Allowance – assistance of $2,435 per annum is available to students attending the campus of a Queensland state high school and undertaking an approved agriculture course in lieu of Years 11 and 12 |
| • | | Remote Area Disability Supplement – available to students with disability who incur additional costs associated with living away from home to attend school. Benefits are up to $7,921 per student, per annum. |
Tuition Fee Exemptions/Waivers – Dependants of International Students
International students who meet the approved exemption criteria and wish to enrol their child in Preparatory (Prep) Year to Year 12 of schooling are exempt from paying dependant tuition fees. The exemption only applies for the duration of the main temporary visa holder’s (parent) course of study in Queensland. A dependant student (Prep to Year 12) of a temporary visa holder may also be eligible for a tuition fee waiver in certain circumstances, including financial hardship.
The estimated average amount exempted or waived per student is $8,315 for the 2021–22 financial year.
Non-State Schools Transport Assistance Scheme
The Non-State Schools Transport Assistance Scheme directly assists families through the provision of funding towards the transport costs incurred for eligible students enrolled in non-state schools.
Under the Scheme, payments are made twice a year to the families of students enrolled in non-state schools located beyond the Brisbane City Council area where bus fare expenses are above the annual Queensland Catholic Education Commission set weekly threshold amount. In 2021, the weekly threshold is $40 per family, or $30 for families with a current Health Care Card, Pensioner Concession Card or Veterans’ Affairs Card.
218
Budget Strategy and Outlook 2021-22
The program also assists families of eligible students with disability enrolled in non-state schools. The level of assistance provided is dependent on the type of transport needed and travel assistance already provided by the Department of Transport and Main Roads (DTMR). For families using taxi travel, the benefit level is to a maximum of $300 per week, inclusive of any assistance provided through DTMR’s Taxi Subsidy Scheme.
Dalby State High School – Bunya Campus Residential Facility
The Dalby State High School - Bunya Campus Residential Facility provides affordable residential accommodation for secondary school students in a boarding facility. The concession particularly targets secondary school students from rural and remote communities, however, any secondary age student is eligible. Students accommodated at the residential facility are enrolled at Dalby State High School and participate in agricultural education programs.
Western Cape Student Residential College, Weipa
The Western Cape College - Student Residential College provides a residential schooling option for students from the Torres Strait and Cape York. This college provides an option that is more familiar for students from remote locations with the intent to increase participation and retention of secondary students in schooling. The concession targets students from the Torres Strait and Cape York seeking secondary education when their home community does not provide secondary schooling.
Spinifex State College – Mount Isa Student Residential Facility
The Spinifex State College – Mount Isa Student Residential Facility provides an affordable residential facility in Mount Isa for students from the north-western area of the state whose home community does not provide secondary schooling. The funding meets the cost of wages for the residential college, increasing the affordability of the accommodation rates charged to students.
Distance Education – Information and Communication Technology Subsidy Scheme
The Distance Education – Information and Communication Technology Subsidy Scheme provides assistance to students enrolled in a school of distance education that are geographically isolated or in the medical category.
The scheme provides $250 per annum to assist with purchasing, replacing or upgrading computer hardware for students in the distance/geographically isolated and medical categories, and $500 per annum to assist students in the distance/geographically isolated category to meet the costs of broadband internet access and download charges for the home classroom. Eligible students also receive access to free software licences.
Distance Education – Non-Government Student Fee Subsidy
Distance Education – Non-Government Student Fee Subsidy is available to students who are enrolled in non-government schools and also choose to access distance education subjects. It provides an average annual subsidy of approximately $1,560 per distance education subject enrolment.
219
Budget Strategy and Outlook 2021-22
This subsidises approximately 50 per cent of the total average cost per annum of providing a subject through distance education for non-government school students. The concession contributes towards the state continuing to make distance education available to non-government schools and ensuring the widest possible subject choice for students, while recovering a proportion of the teaching and overhead costs.
Plant Registration – Amusement Devices
The refund of plant item registration fees for amusement devices was available to owners of amusement devices who paid registration fees for the 2020 year. The refund was provided to support businesses with amusement devices who were impacted by the COVID-19 pandemic and were unable to operate their devices at the shows and fairs that are the main source of income for the mobile amusement device industry throughout this year.
The registration fee was dependent on the class of amusement device, however fees range from $185.30 to $396.50. This concession ceased during 2020–21.
| Table A.2.4 | Department of Employment, Small Business and Training |
| | | | | | | | |
Concession | | 2020–21
Est. Act.
$ million | | | 2021–22
Estimate
$ million | |
Vocational Education and Training (VET) - Certificate 3 Guarantee Tuition Fee Subsidy1 | | | 241.7 | | | | 240.5 | |
User Choice - Apprentice and Trainee Training Subsidy1 | | | 202.0 | | | | 207.0 | |
VET - Higher Level Skills Tuition Fee Subsidy | | | 75.0 | | | | 75.0 | |
Travel and Accommodation Subsidy | | | 2.3 | | | | 3.0 | |
Total | | | 521.0 | | | | 525.5 | |
Notes:
| 1. | The variance is due to the demand driven nature of the programs. |
Vocational Education and Training (VET) – Certificate 3 Guarantee Tuition Fee Subsidy
The Vocational Education and Training (VET) Certificate 3 Guarantee Tuition Fee Subsidy provides a government subsidy to allow eligible Queenslanders to obtain their first post-school Certificate III qualification to help them gain a job or to improve their employment status, including pathways for disadvantaged learners and Queensland school students (VET in Schools).
The subsidy is available to pre-approved private and public registered training organisations to subsidise tuition fees paid by students undertaking eligible vocational education and training qualifications (primarily Certificate III qualifications).
The value of this subsidy for each qualification ranges from $472 to $6,650, depending on student eligibility and qualification subsidised. The average subsidy value is $3,060.
User Choice – Apprentice and Trainee Training Subsidy
The User Choice - Apprentice and Trainee Training Subsidy program provides government funding towards the costs of training and assessment for eligible Queensland apprentices and trainees, or complementary pathways leading to apprenticeship outcomes.
220
Budget Strategy and Outlook 2021-22
The subsidy is available to pre-approved public and private registered training organisations to subsidise tuition fees to reduce the cost of nationally recognised entry level training for apprentices and trainees. The program provides greater flexibility for apprentices, trainees and their employers to select a preferred registered training organisation and to negotiate the type of training to meet their specific needs.
The value of this subsidy for each qualification ranges from $1,180 to $50,720, depending on student eligibility and qualification subsidised. The average subsidy value is $9,845.
VET – Higher Level Skills Tuition Fee Subsidy
The VET Higher Level Skills Tuition Fee Subsidy provides a government subsidy to eligible students and employers to undertake a priority Certificate IV, diploma or advanced diploma qualification or industry endorsed skill set. This program assists individuals to gain employment in a critical occupation, career advancement in a priority industry or transition to university to continue their studies.
The subsidy is available to pre-approved private and public registered training organisations to subsidise tuition fees paid by students undertaking eligible vocational education and training qualifications at Certificate IV or above.
The value of this subsidy for each qualification ranges from $1,175 to $10,370, depending on student eligibility and qualification subsidised. The average subsidy value is $4,384.
Travel and Accommodation Subsidy
The Travel and Accommodation Subsidy provides financial assistance to Queensland apprentices and trainees for travel expenses incurred in attending off the job training at a registered training organisation. To be eligible, apprentices must attend the closest registered training organisation that offers the required qualification and travel a minimum of 100km return from their usual place of residence to the registered training organisation. The subsidy provides for:
| • | | return land travel to the registered training organisation of 21 cents per km for distances between 100km—649km, increasing to 26 cents per km for distances of 650km or more |
| • | | a return economy air ticket to the location of the registered training organisation if necessary |
| • | | cost of ferry travel if necessary |
| • | | accommodation assistance of $30 per day for overnight stay within Queensland and $72 for interstate travellers, if it is necessary to live away from their usual place of residence to attend training. |
221
Budget Strategy and Outlook 2021-22
| Table A.2.5 | Department of Energy and Public Works |
| | | | | | | | |
Concession | | 2020–21
Est. Act.
$ million | | | 2021–22
Estimate
$ million | |
Energy Queensland - Uniform Tariff Policy (Excluding Isolated Systems)1 | | | 388.0 | | | | 452.0 | |
Energy Queensland - Uniform Tariff Policy for Isolated Systems2 | | | 66.0 | | | | 50.5 | |
Extending Existing Drought Relief Arrangements - Electricity Charge Scheme3 | | | 15.0 | | | | 15.0 | |
Electricity Tariff Adjustment Scheme4 | | | — | | | | 9.1 | |
Non-residential Buildings - Subsidised Rents5 | | | 5.7 | | | | 6.1 | |
Origin Energy - Uniform Tariff Policy | | | 3.0 | | | | 3.0 | |
Affordable Energy Plan - Energy Savers Program6 | | | 2.6 | | | | 1.9 | |
Commercial Rent Relief7 | | | 0.9 | | | | — | |
Daintree Area Scheme8 | | | 0.2 | | | | — | |
Total | | | 481.4 | | | | 537.6 | |
Notes:
| 1. | The non-isolated CSO will increase as a result of decisions made by the Australian Energy Regulator on Energy Queensland Limited’s regulated revenue allowance for Ergon Energy relative to Energex, and the Queensland Competition Authority’s determination to lower retail electricity tariffs in regional Queensland for 2021–22. |
| 2. | The reduction is due to a reduction in the cost to serve isolated communities and is forecast to reduce in 2021–22. This may be offset by a reduction in retail revenue following the determination made by the Queensland Competition Authority to lower retail electricity tariffs in regional Queensland for 2021–22. |
| 3. | Expenditure is dependent on the extent of drought conditions, the number of registered eligible parties in drought declared areas and customers seeking a rebate for fixed charges of their electricity accounts. |
| 4. | This is a new initiative for 2021–22 targeted to regional businesses to provide eligible customers with individually tailored transitional rebates to help offset the phase-out of obsolete electricity tariffs. |
| 5. | The value of this concession excludes the amount provided under the COVID-19 Commercial Rent Relief concession. |
| 6. | Estimates based on participant implementation rates reported by Queensland Rural and Industry Development Authority for month ending 30 April 2021 as program moves toward closure in 2021–22. |
| 7. | This item is part of the Queensland Government response to COVID-19. |
| 8. | This concession is not planned to continue in the 2021–22 financial year. |
Energy Queensland – Uniform Tariff Policy (Excluding Isolated Systems)
The Energy Queensland - Uniform Tariff Policy (Excluding Isolated Systems) ensures that, where possible, all Queensland non-market electricity customers of a similar type pay a similar price for electricity regardless of where they live. As the notified prices do not reflect the full cost of electricity supply for most remote and regional Queenslanders, a subsidy is provided.
The community service obligation (CSO) payment to the regional retailer Energy Queensland covers the difference between the revenue earned by charging customers notified prices and the actual costs in the regional areas (due to differences in network costs and energy losses).
222
Budget Strategy and Outlook 2021-22
Energy Queensland – Uniform Tariff Policy for Isolated Systems
The Energy Queensland - Uniform Tariff Policy for Isolated Systems ensures that, where possible, all Queensland non-market electricity customers of a similar type pay a similar price for electricity regardless of where they live. Energy Queensland owns and operates 33 isolated power stations which supply electricity to remote and isolated Queensland communities.
Energy Queensland retails electricity to these customers at the notified prices, and the government provides funding to the retailer to cover the difference between the revenue earned and the cost of supplying electricity to these customers.
Extending Existing Drought Relief Arrangements – Electricity Charge Scheme
Drought Relief Arrangements provide relief to farming customers from fixed charges for electricity accounts that are used to pump water for farm or irrigation purposes during periods of drought. The concessions can vary depending on the shires that are drought declared and the number of eligible customers.
Electricity Tariff Adjustment Scheme
The Electricity Tariff Adjustment Scheme targets support to regional business electricity connections due to the phase-out of obsolete electricity tariffs from 30 June 2021. This initiative provides eligible customers with individually tailored transitional rebates to help offset the removal of obsolete tariffs and incentivise a pathway to self-sufficiency over time. Eligible businesses will receive a subsidy payment for up to 9 years.
Non-residential Buildings – Subsidised Rents
Accommodation is provided to 40 community, education, arts, and not-for-profit organisations in government-owned non-residential buildings. Tenures for the occupancies are by way of leases, licences, or month to month arrangements. Rents paid by the organisations are often below independently assessed market rent levels. Subsidised rental arrangements are provided to 25 properties comprising a total floor area of approximately 30,632 square metres. The total subsidy is calculated by deducting the actual amount paid by the occupants from the total estimated annual market rent for the office space.
Origin Energy – Uniform Tariff Policy
The Origin Energy - Uniform Tariff Policy ensures that, where possible, all Queensland non-market electricity customers of a similar type pay a similar price for electricity, regardless of where they live. Origin Energy retails electricity to approximately 5,450 Queensland non-market customers in the Goondiwindi, Texas and Inglewood areas who are supplied electricity through the New South Wales Essential Energy distribution network.
The government provides a rebate to these customers, via a CSO payment to Origin Energy, to ensure they pay a similar price for electricity in Queensland. Therefore, the CSO amount depends on the relative difference between Queensland and New South Wales retail electricity tariffs for non-market customers.
223
Budget Strategy and Outlook 2021-22
Affordable Energy Plan – Energy Savers Program
The Business Energy Savers Program, an initiative under the Affordable Energy Plan, provides free energy audits for agricultural customers and large business customers, and co-contributions to fund energy efficiency upgrades. It includes an extension of the existing Energy Savers Plus Program (for agricultural businesses) and the Large Customer Adjustment Program (for large electricity users).
Under the expanded Energy Savers Plus Program, 180 audits for agricultural customers have been completed. In addition to this, co-contribution grants of up to $20,000 have been made available to assist businesses in implementing the recommendations for the audit. The free energy audits have identified up to $3 million in annual energy saving opportunities for a range of farming businesses.
Under the expanded Large Customer Adjustment Program (and preceding Trial) 21 audits of large customers have been completed and co-contribution of up to 50 per cent of implementation costs, capped at up to $250,000, are being made available to eligible customers to help encourage them to implement the audit recommendations. The free energy audits have identified up to $1.3 million in annual energy saving opportunities for a range of farming businesses.
Commercial Rent Relief
As part of the government response to COVID-19, rent relief has been provided for private commercial tenants of government buildings.
Daintree Area Scheme
In response to the pandemic, the COVID-19 Daintree Area Scheme aims to support the Daintree community by providing financial assistance to households, small businesses and non-profit organisations operating from off-grid premises in the area. Payments available under this scheme include $200 for households and $500 for small businesses and non-profit organisations.
| Table A.2.6 | Department of Environment and Science |
| | | | | | | | |
Concession | | 2020–21
Est. Act.
$ million | | | 2021–22
Estimate
$ million | |
Queensland Parks and Wildlife Service - Tour Fee and Access Permits | | | 1.6 | | | | 2.0 | |
COVID-19 Relief - Queensland Parks and Wildlife Service - National Park and State Forest Rent Relief1 | | | 0.6 | | | | — | |
COVID-19 Relief - Queensland Parks and Wildlife Service - Fee Relief to Commercial Tour Operators1 | | | 1.4 | | | | — | |
COVID-19 Relief - Queensland Parks and Wildlife Service - Waiver of Commercial Whale Watching Operator Fees1 | | | 0.1 | | | | — | |
Total | | | 3.7 | | | | 2.0 | |
Notes:
| 1. | This item is part of the Queensland Government response to COVID-19. |
224
Budget Strategy and Outlook 2021-22
Queensland Parks and Wildlife Service – Tour Fee and Access Permits
Admission and ranger guided tour fee concessions are available at several attractions for children, pensioners and educational purposes. Vehicle access permit concessions are available in the Cooloola Recreation Area, Bribie, Moreton (Mulgumpin) and Fraser (K’gari) Islands. Camping concessions are available in all national park and state forest camping areas for educational purposes and children under 5 years of age.
COVID-19 Relief – Queensland Parks and Wildlife Service – National Park and State Forest Rent Relief
The Queensland Government supported Queensland’s economic recovery from COVID-19 by providing rent relief to commercial tenant holding leases in national parks and state forests to December 2020.
COVID-19 Relief – Queensland Parks and Wildlife Service – Fee Relief to Commercial Tour Operators
The Queensland Government assisted Queensland tourism through waiving of daily activity and passenger fees for commercial tour operators operating in protected areas and state forests to March 2021.
COVID-19 Relief – Queensland Parks and Wildlife Service – Waiver of Commercial Whale Watching Operator Fees
The Queensland Government supported tourism operators impacted by COVID-19 through waiving of annual Commercial Whale Watching Fees for the 2020 season.
225
Budget Strategy and Outlook 2021-22
| Table A.2.7 | Department of Justice and Attorney-General |
| | | | | | | | |
Concession | | 2020–21
Est. Act.
$ million | | | 2021–22
Estimate
$ million | |
Public Trustee of Queensland - Concessions | | | 39.5 | | | | 41.7 | |
Court Services - Civil Court1 | | | 34.3 | | | | 29.8 | |
Queensland Civil and Administrative Tribunal | | | 22.7 | | | | 26.6 | |
Blue Card - Volunteer Applicants | | | 9.1 | | | | 9.4 | |
Body Corporate and Community Management - Dispute Resolution | | | 2.6 | | | | 2.6 | |
Liquor Gaming and Fair Trading - Rural Hotel Concessions | | | 0.4 | | | | 0.4 | |
Registry of Births, Deaths and Marriages - Fee Waivers | | | 0.1 | | | | 0.1 | |
Liquor Gaming and Fair Trading - License Fees2 | | | 21.3 | | | | — | |
Liquor Gaming and Fair Trading - Rent Relief Scheme2 | | | 0.3 | | | | — | |
Court Services - Rent Relief Scheme2 | | | 0.1 | | | | — | |
Total | | | 130.4 | | | | 110.6 | |
Notes:
| 1. | The ongoing impacts of COVID-19 have resulted in increased expenses coupled with a decline in court fee revenue which is impacting the Estimated Actual for 2020–21. It is anticipated that this revenue will normalise in 2021–22, thereby reducing the overall estimated concession for 2021–22. |
| 2. | This item is part of the Queensland Government response to COVID-19. |
Public Trustee of Queensland – Concessions
The Public Trustee of Queensland (the Public Trustee) is a self-funded organisation and uses a scale of fees which is designed to reflect a fair cost for the services provided.
In addition, the Public Trustee provides funding to the Public Guardian and financial assistance under the Civil Law Legal Aid Scheme administered by Legal Aid Queensland, to enable these organisations to provide services to the people of Queensland.
The Public Trustee has established a safety net limit on the annual fees payable by certain clients which provides for a rebate of fees for some clients with limited assets. The rebate is applied to clients such as financial administration clients with impaired capacity, or estate administration clients of limited means. The Public Trustee also provides Will making services at no cost for all Queenslanders.
Court Services – Civil Court
The Supreme, District and Magistrates Courts hear civil disputes between 2 or more parties (people or organisations) where one party sues the other, usually to obtain compensation, or seek some other remedy. These disputes may involve anything from defamation to outstanding debts. Civil Court Fees are prescribed under the Uniform Civil Procedure (Fees) Regulation 2009 for proceedings commenced in civil matters and are set below full cost recovery to ensure that civil remedies are accessible to all Queenslanders.
226
Budget Strategy and Outlook 2021-22
The ongoing impacts of COVID-19 have resulted in increased expenses coupled with a decline in court fee revenue which is impacting the Estimated Actual for 2020–21. It is anticipated that this revenue will normalise in 2021–22, reducing the overall estimated concession for 2021–22.
Queensland Civil and Administrative Tribunal
The Queensland Civil and Administrative Tribunal (QCAT) is an independent tribunal which makes decisions and resolves disputes across a wide range of jurisdictions for the community. Fees for these services are set below cost recovery to ensure services are accessible, fair and inexpensive. QCAT provides human rights services with no application fees for matters in relation to guardianship and administration of adults, children and young people and anti-discrimination.
Blue Card – Volunteer Applicants
Individuals providing child-related services or conducting child-related activities in regulated service environments are required to undergo an assessment of their police and relevant disciplinary information, and if approved, are issued with a blue card. A blue card is valid for 3 years unless cancelled or suspended earlier. Since the inception of the blue card system in 2001, the government has met the cost of blue card assessment for volunteer applicants.
Body Corporate and Community Management – Dispute Resolution
The Office of the Commissioner for Body Corporate and Community Management provides a dispute resolution service to parties unable to resolve disputes themselves. The service consists of conciliation, with the aim of achieving a voluntary agreement, and adjudication, which results in a formal order. The service is delivered below full cost recovery so as to not restrict access to justice due to affordability reasons. The commissioner has the discretion to waive application fees on the grounds of financial hardship.
Liquor Gaming and Fair Trading – Rural Hotel Concessions
The Office of Liquor and Gaming Regulation licenses hotels and clubs under the Liquor Act 1992. Under the Liquor (Rural Hotels Concession) Amendment Act 2019, the Rural Hotels Concession
provides licence fee relief to establishments in remote communities by reducing the base licence fees for hotels and community clubs with no more than 2,000 members, for eligible licences from July 2019.
Registry of Births, Deaths and Marriages – Fee Waivers
The Registry of Births, Deaths and Marriages waives the fees for certificates provided to disadvantaged groups in the Queensland Community (e.g. Indigenous, homeless, domestic and family violence victims, etc.) and those impacted by major emergencies (e.g. natural disasters such as cyclones and bushfires).
Liquor Gaming and Fair Trading – License Fees
The Liquor Regulation 2002 and the Wine Regulation 2009 were amended to waive liquor and wine licence fees for the 2020–21 licence period and ceases thereafter.
Liquor Gaming and Fair Trading – Rent Relief Scheme
Rental relief was provided and represents revenue foregone. The rent relief measure ceased on 30 September 2020.
227
Budget Strategy and Outlook 2021-22
Court Services – Rent Relief Scheme
Rent relief was provided and represents revenue foregone. The rent relief measure ceased on 31 December 2020.
| Table A.2.8 | Department of Regional Development, Manufacturing and Water |
| | | | | | | | |
Concession | | 2020–21
Est. Act.
$ million | | | 2021–22
Estimate
$ million | |
Sunwater Rural Irrigation Water Price Subsidy | | | 12.5 | | | | 26.0 | |
Cloncurry Pipeline Water Supply Subsidy | | | 6.2 | | | | 6.3 | |
Seqwater Bulk Water Rural Irrigation Water Price Subsidy | | | 2.2 | | | | 2.8 | |
Extending Existing Drought Relief Arrangements - Water Licence Fee Waiver | | | 1.4 | | | | 1.5 | |
Total | | | 22.3 | | | | 36.6 | |
Sunwater Rural Irrigation Water Price Subsidy
As the owner of Sunwater, the government decides how much of Sunwater’s costs are to be recovered through irrigation prices. Currently, Sunwater’s irrigation water prices for some schemes are set below the level necessary to recover the cost of supplying water to the irrigators.
Government funding is provided to Sunwater to offset the reduced revenue and to ensure that increases in water prices paid by rural irrigation customers to recover costs are gradual.
For 3 years from 2021–22 Sunwater will will also receive additional funding to implement a 15 per cent discount on Sunwater irrigation prices. This discount will increase to 50 per cent for horticulture irrigation, with the balance of the discount to be delivered through a 35 per cent rebate administered by Queensland Rural and Industry Development Authority (QRIDA).
Cloncurry Pipeline Water Supply Subsidy
North West Queensland Water Pipeline Limited (NWQWP), a Sunwater Limited (Sunwater) subsidiary, owns and operates the Cloncurry Pipeline between the Ernest Henry Mine and Cloncurry. The pipeline guarantees Cloncurry Shire Council’s long-term water supply and supports industrial development in the region. The government provides funding to NWQWP to ensure the pipeline remains commercially viable to operate while providing an affordable and safe water supply to Cloncurry.
Seqwater Bulk Water Rural Irrigation Water Price Subsidy
As the owner of Seqwater, the government decides how much of Seqwater’s costs are to be recovered through irrigation prices. Currently, Seqwater’s irrigation water prices for some schemes are set below the level necessary to recover the cost of supplying water to the irrigators.
Government funding is provided to Seqwater to offset the reduced revenue and to ensure that increases in water prices paid by rural irrigation customers to recover costs are gradual.
For 3 years from 2021–22 Seqwater will receive additional funding to implement a 15 per cent discount on Seqwater irrigation prices. This discount will increase to 50 per cent for horticulture irrigation, with the balance of the discount to be delivered through a 35 per cent rebate administered by QRIDA.
228
Budget Strategy and Outlook 2021-22
Extending Existing Drought Relief Arrangements – Water Licence Fee Waiver
As part of the government’s drought assistance package, fees associated with an annual water licence invoice and applications for stock or domestic water licences will be waived for 2021–22.
The waiver is available to producers who hold leases in drought-declared areas and to those who have an individually droughted property.
| Table A.2.9 | Department of Resources |
| | | | | | | | |
Concession | | 2020–21
Est. Act.
$ million | | | 2021–22
Estimate
$ million | |
Extending Existing Drought Relief Arrangements - Land Rental Rebates | | | 2.1 | | | | 3.2 | |
Rent Relief Scheme - Land Rent Waivers1 | | | 32.2 | | | | — | |
Backing Explorers (Resources Sector) Waiver1 | | | 9.8 | | | | — | |
Tourism Leases, Licences and Permits1 | | | 2.7 | | | | — | |
Total | | | 46.8 | | | | 3.2 | |
Notes:
| 1. | This item is part of the Queensland Government response to COVID-19. |
Extending Existing Drought Relief Arrangements – Land Rental Rebates
As part of the government’s drought assistance package, Category 11 Grazing and Primary Production landholders under the Land Act 1994 are eligible for a rent rebate. The rebate is available to lessees, other than those on minimum rent that are in a drought declared local government area and to individually drought declared properties. In addition to this rebate, drought declared landholders will be granted a hardship deferral for required rent payments.
Rent Relief Scheme – Land Rent Waivers
As part of the Queensland Government’s commitment to support small business during the COVID-19 pandemic, $33.9 million for land rent relief was applied to Land Act 1994 lessees, licensees or permit to occupy holders who conducted a business on state land for the period 1 April to 30 September 2020.
A further rent waiver of $14.1 million for Land Act tenure holders adversely affected by the economic conditions caused by COVID-19 was approved for the period 1 October to 31 December 2020.
Backing Explorers (Resources Sector) Waiver
As part of the Queensland Government’s commitment to maintaining a strong resources sector during the COVID-19 pandemic, a 6-month rent waiver of $6.3 million for exploration permits and authority to prospect (petroleum and gas) was approved for holders whose rent was due within the period of 1 April to 30 September 2020. A further 6-month waiver of $6.6 million was approved for the period 1 October 2020 to 31 March 2021.
Under this arrangement the payment of annual rent and mining and petroleum exploration tenures, as well as the payment of the fee that is charged to holders of an authority to prospect that apply for a special amendment to their work program, were waived during the period 1 April 2020 to 31 March 2021.
229
Budget Strategy and Outlook 2021-22
Tourism Leases, Licences and Permits
Certain Land Act 1994 leases, licences and permits for tourism purposes had their rent waived for the period 1 April 2020 to 30 September 2020 in response to the impact of COVID-19 on the tourism industry.
In August 2020, the government approved an extension to the waiver until 21 March 2021. This will result in further foregone revenue of $2.7 million, which will arise from the further rent waiver until 31 March 2021 for operating tourism leases, licences and permits in rental category 13.1.
| Table A.2.10 | Department of Seniors, Disability Services and Aboriginal and Torres Strait Islander Partnerships |
| | | | | | | | |
Concession | | 2020–21
Est. Act.
$ million | | | 2021–22
Estimate
$ million | |
Electricity Rebate Scheme1 | | | 210.2 | | | | 228.5 | |
Electricity Asset Ownership Dividend | | | 106.9 | | | | 100.0 | |
Pensioner Rate Subsidy Scheme | | | 56.3 | | | | 57.4 | |
South East Queensland Pensioner Water Subsidy Scheme | | | 19.3 | | | | 19.7 | |
Home Energy Emergency Assistance Scheme | | | 10.0 | | | | 10.0 | |
Reticulated Natural Gas Rebate Scheme | | | 2.6 | | | | 2.6 | |
Electricity Life Support Concession Scheme1 | | | 2.3 | | | | 2.5 | |
Medical Cooling and Heating Electricity Concession Scheme1 | | | 2.1 | | | | 2.4 | |
Electricity Rebate - COVID-19 - Residential Household Utility Assistance | | | 40.0 | | | | — | |
Package & Small / Medium business Power Bill Relief Package2 | | | | | | | | |
Total | | | 449.7 | | | | 423.1 | |
Notes:
| 1. | Electricity price rebates are adjusted annually according to the Queensland Competition Authority’s (QCA) price determination for general household electricity tariff (Tariff 11). For 2021–22, the QCA determined Tariff 11 will decrease by 7.3 per cent. However, the Queensland Government has determined existing rebate values will not be decreased and will continue to apply in 2021–22. |
| 2. | This item is part of the Queensland Government response to COVID-19. |
Electricity Rebate Scheme
The Electricity Rebate Scheme provides a rebate of up to approximately $341 per annum, to assist with the cost of domestic electricity supply to the home of eligible holders of a Pensioner Concession Card, a Queensland Seniors Card, Commonwealth Health Care Card and asylum seekers or a Department of Veterans’ Affairs Gold Card (who receive a War Widow/er Pension or special rate Totally or Permanently Incapacitated Pension).
Electricity Asset Ownership Dividend
The Electricity Asset Ownership Dividend is providing Queensland households with a $50 electricity rebate in 2021–22. This will be the fifth dividend since 2017–18 and will be credited on residential customers’ bills.
230
Budget Strategy and Outlook 2021-22
Pensioner Rate Subsidy Scheme
The Pensioner Rate Subsidy Scheme offers a 20 per cent subsidy (up to a maximum of $200 per annum) to lessen the impact of local government rates and charges on pensioners, thereby assisting them to continue to live in their own homes.
South East Queensland Pensioner Water Subsidy Scheme
The South East Queensland (SEQ) Pensioner Water Subsidy Scheme provides a subsidy of up to $120 per annum to eligible pensioner property owners in the SEQ Water Grid to lessen the impact of water prices. This subsidy is in addition to the Pensioner Rate Subsidy Scheme.
Home Energy Emergency Assistance Scheme
The Home Energy Emergency Assistance Scheme provides emergency assistance of up to $720 once in a 2-year period to assist low income households experiencing a short-term financial crisis and who are unable to pay their current electricity and/or reticulated natural gas account. It is not a requirement for the claimant to hold a concession card.
Reticulated Natural Gas Rebate Scheme
The Reticulated Natural Gas Rebate Scheme provides a rebate of up to approximately $76 per annum to assist with the cost of reticulated natural gas supplied to the home of eligible holders of a Pensioner Concession Card, Queensland Seniors Card or a Department of Veterans’ Affairs Gold Card (who receive the War Widow/er Pension or special rate Totally or Permanently Incapacitated Pension).
Electricity Life Support Concession Scheme
The Electricity Life Support Concession Scheme is aimed at assisting seriously ill people who use home-based life support systems by providing a rebate of up to approximately $694 per annum for users of oxygen concentrators and a rebate of up to approximately $465 per annum for users of kidney dialysis machines to meet their electricity costs. The concession is paid quarterly and is subject to the patient being medically assessed in accordance with Queensland Health eligibility criteria.
Medical Cooling and Heating Electricity Concession Scheme
The Medical Cooling and Heating Electricity Concession Scheme provides a rebate of up to approximately $341 per annum for eligible concession card holders with a medical condition who have dependence on air conditioning to regulate body temperature.
Electricity Rebate – COVID-19 - Residential Household Utility Assistance Package & Small / Medium Business Power Bill Relief Package
Electricity rebates provided as a COVID-19 response initiative during the pandemic have included a $200 rebate for Residential Household Relief and a $500 rebate for small to medium enterprises. Funding in 2020–21 of $40M has been provided to continue payments for late applicants to the scheme.
231
Budget Strategy and Outlook 2021-22
| Table A.2.11 | Department of State Development, Infrastructure, Local Government and Planning |
| | | | | | | | |
Concession | | 2020–21
Est. Act.
$ million | | | 2021–22
Estimate
$ million | |
COVID-19 Rent Relief (Economic Development Queensland)1 | | | 3.7 | | | | 0.1 | |
Total | | | 3.7 | | | | 0.1 | |
Notes:
| 1. | This item is part of the Queensland Government response to COVID-19. |
COVID-19 Rent Relief (Economic Development Queensland)
As part of the government’s COVID-19 support, rent relief is being provided for businesses with leases with Economic Development Queensland.
| Table A.2.12 | Department of Tourism, Innovation and Sport |
| | | | | | | | |
Concession | | 2020–21
Est. Act.
$ million | | | 2021–22
Estimate
$ million | |
Queensland Recreation Centres - Concessional Usage Rates | | | 0.3 | | | | 0.4 | |
COVID-19 Advance Queensland Valley Precinct Rent Relief1 | | | 1.1 | | | | — | |
Total | | | 1.4 | | | | 0.4 | |
Notes:
| 1. | This item is part of the Queensland Government response to COVID-19. |
Queensland Recreation Centres – Concessional Usage Rates
Concessional usage rates are offered to clients who meet the strategic objectives of Activate! Queensland, including not-for-profit sport and recreation organisations, Queensland schools and Queensland state sporting organisations, for the use of Queensland Recreation Centres, at Currimundi and Tallebudgera. These concessional rates provide a discount between 6.2 per cent to 18.1 per cent of the full charge to approximately 40,000 recipients.
COVID-19 Advance Queensland Valley Precinct Rent Relief
As part of the government’s COVID-19 support, rent relief was provided for businesses which rent space at the Advance Queensland Valley Precinct to 31 December 2020.
232
Budget Strategy and Outlook 2021-22
| Table A.2.13 | Department of Transport and Main Roads |
| | | | | | | | |
Concession | | 2020–21
Est. Act.
$ million | | | 2021–22
Estimate
$ million | |
General Public Transport Concessions (South East Queensland)1 | | | 1,739.2 | | | | 1,701.7 | |
Rail Network and Infrastructure Funding2 | | | 728.4 | | | | 807.0 | |
General Public Transport Concessions (Regional Queensland)3 | | | 306.0 | | | | 264.6 | |
Vehicle and Boat Registration Concessions | | | 188.0 | | | | 194.3 | |
School Transport Assistance Scheme4 | | | 151.0 | | | | 147.0 | |
TransLink Transport Concessions (South East Queensland)5 | | | 49.5 | | | | 69.3 | |
Rail Concession Scheme | | | 39.4 | | | | 40.4 | |
Livestock and Regional Freight Contracts | | | 40.3 | | | | 38.0 | |
Other Transport Concessions (Regional Queensland) and Taxi Subsidies | | | 24.7 | | | | 27.1 | |
Mount Isa Line Incentive Scheme | | | 20.0 | | | | 20.0 | |
COVID-19 Relief Measures - Transport Services6 | | | 42.9 | | | | 12.9 | |
Practical Driving Test | | | 4.0 | | | | 4.1 | |
Designated Public Transport Concessions for Seniors Card Holders | | | 4.0 | | | | 4.1 | |
COVID-19 Relief Measures - Rent Relief6 | | | 8.5 | | | | — | |
Total | | | 3,345.9 | | | | 3,330.5 | |
Notes:
| 1. | The decrease is due to an increase in fare revenue from patronage increases expected as part of recovery from COVID-19 in 2021–22 offset by increased rail costs for driver training and Cross River Rail readiness. |
| 2. | The increase is due to additional costs for delivery and operational readiness for Cross River Rail. |
| 3. | The decrease is due to an expected increase in fare revenue from increased patronage on TravelTrain, heritage rail services and Kuranda Scenic Railway. |
| 4. | The decrease is due to an expected reduction in cleaning costs in 2021–22 associated with COVID-19. |
| 5. | The increase is reflective of an expected increase in patronage for concession eligible passengers as part of recovery from COVID-19. |
| 6. | This item is part of the Queensland Government response to COVID-19. |
General Public Transport Concessions (South East Queensland)
The General Public Transport Concessions (South East Queensland) represents the direct funding contribution that government makes towards the cost of operating public transport services within South East Queensland. This contribution effectively reduces the ticket price paid by all public transport users on bus, rail and ferry services, increasing the affordability of these services.
Rail Network and Infrastructure Funding
Rail network and infrastructure funding ensures that the state supported rail network is safe, reliable and fit for purpose. The contract also provides funding to Queensland Rail to support major capital projects and related asset strategies. The funding provided via this contract directly benefits customers of the state supported rail network, including both freight and passengers. Without this funding, rail access charges (including public transport fares) would be significantly higher for all users of the rail network.
233
Budget Strategy and Outlook 2021-22
General Public Transport Concessions (Regional Queensland)
The General Public Transport Concessions (Regional Queensland) represents the financial contribution that the government provides across a range of transport services in regional Queensland. The impact of this contribution benefits all public transport users through reduced transport fares. This concession covers:
| • | | TravelTrain (excluding the ‘Rail Concession Scheme’ for eligible pensioners, veterans and seniors) |
| • | | subsidies for Kuranda Scenic Railway |
| • | | subsidies for Heritage Rail Services |
| • | | subsidies for the Rail XPT Service (Sydney-Brisbane) and Savannahlander (Atherton Tableland) |
| • | | subsidies for air services to remote and rural communities within the state |
| • | | subsidies for regional bus and ferry operators (excluding concessional top up amounts and School Transport Assistance Scheme related amounts) |
| • | | subsidies for long distance coach services to rural and remote communities within the state. |
Vehicle and Boat Registration Concessions
A Special Interest Vehicle (SIV) registration concession is offered for motor vehicles that have low use associated with vintage and historic and street rod car club events. A 12-month registration fee for a 6-cylinder SIV concession reduces from $538.65 to $95.85. A concession is also available for specific purposes such as water, mineral or oil exploration and bee keeping.
Eligible primary producers also receive registration concessions for their heavy vehicles, reducing their registration fees by 50 to 75 per cent. For example, a primary producer’s 12-month registration fee for a two-axle truck with a Gross Vehicle Mass over 12 tonne reduces from $993.00 to $496.50. Other motor vehicle registration concessions are also provided to local governments, charitable and community service organisations, and people living in remote areas. Vessel registration concessions may be provided to accredited surf lifesaving clubs and schools.
Registration concessions for light and heavy motor vehicles and recreational boats are provided to a range of groups, including holders of the Pensioner Concession Card, Queensland Seniors Card and to those assessed by the Department of Veterans’ Affairs as meeting the necessary degree of incapacity or impairment.
These concessions are aimed at improving access to travel for pensioners, seniors and persons with a disability by providing a reduced rate of registration fees. For most eligible card holders, a concession for a family 4-cylinder vehicle would reduce the 12-month registration fee from $340.20 to $170.10. For a recreational boat up to and including 4.5 metres in length, the concession reduces the registration charge from $91.85 to $45.90.
School Transport Assistance Scheme
The School Transport Assistance Scheme assists students that do not have a school in their local area or who are from defined low income groups with travel costs. The scheme provides funding to reduce the cost of travelling to school on bus, rail and/or ferry services, with allowances for private vehicle transport in certain circumstances.
234
Budget Strategy and Outlook 2021-22
A typical concession would be to fully fund the cost of travel from home to the nearest state primary or high school where no local primary or high school is available (for example, from Bargara to Bundaberg High School).
TransLink Transport Concessions (South East Queensland)
The TransLink Transport Concessions (South East Queensland) are provided by the government to ensure access and mobility for Queenslanders who require assistance because of age, disability or fixed low income.
Passengers entitled to receive public transport concessions include holders of a Pensioner Concession Card, Veterans’ Affairs Gold Card, Seniors Card (all states and territories), Companion Card, Vision Impairment Travel Pass, Total Permanent Incapacitated (TPI) Veteran Travel Pass, children, secondary and tertiary students, Newstart and Youth Allowance (Job Seeker) recipients, asylum seekers and White Card Holders. Under current fare arrangements, approved concession groups receive at least a 50 per cent discount when compared to the same applicable adult fare.
Rail Concession Scheme
The Queensland Rail Concession Scheme improves the affordability of long distance and urban rail services for eligible pensioners, veterans, seniors and current/past rail employees with 25 years of service. Assistance for long distance rail services is provided through discounted fares and free travel vouchers. For TravelTrain (long distance rail) services, depending on the service, the concession may be for free travel for up to 4 trips per year for Queensland pensioners (subject to availability of seats and payment of an administration fee).
Livestock and Regional Freight Contracts
The Livestock and Regional Freight Contracts provide funding to support the movement of cattle (via rail only) and freight (via road and rail) to and from regional areas of Queensland. The funding provided directly benefits the cattle industry and enables regional Queensland communities to maintain employment and directly benefits those communities who are reliant on rail freight services by reducing the cost of these freight services for users.
Other Transport Concessions (Regional Queensland) and Taxi Subsidies
Other transport concessions (Regional Queensland) and taxi subsidies are provided by the government to ensure access and mobility for Queenslanders who require assistance because of age, disability or fixed low income.
Passengers entitled to receive public transport concessions include holders of a Pensioner Concession Card, Veterans’ Affairs Gold Card, Seniors Card (all states and territories), Companion Card, Vision Impairment Travel Pass, TPI Veteran Travel Pass, children, secondary and tertiary students, Newstart and Youth Allowance (Job Seeker) recipients, asylum seekers and White Card holders. The Taxi Subsidy Scheme aims to improve the mobility of persons with severe disabilities by providing a 50 per cent concession fare up to a maximum subsidy of $25 per trip.
235
Budget Strategy and Outlook 2021-22
Mount Isa Line Incentive Scheme
In recognition of the importance the Mount Isa Line plays in facilitating the transportation of freight from pit to port, from 2019–20, the Queensland Government is paying $20 million per annum to eligible freight users under the 4-year $80 million Mount Isa Line Incentive Scheme.
This payment reduces below rail access costs to further promote rail for freight, as well as supporting continued development of the North West Minerals Province.
COVID-19 Relief Measures – Transport Services
Transport services COVID-19 relief measures provided by the government include:
| • | | funding assistance to support passenger transport aviation providers, ferry service operators and regional bus operators in Queensland |
| • | | financial assistance for the personalised transport industry |
| • | | waiving of learner licence renewal fees due to the cancellation of practical driving tests |
| • | | waiving vehicle registration cancellation fees, number plate fees and, in most cases, the costs associated with vehicle inspections on re-registration. |
Practical Driving Test
As part of the state’s driver licensing arrangements, applicants for new licences are required to undertake a practical driving test. The total cost to pre-book driver examinations and to perform the practical driver assessment is not fully recovered by the fee charged ($61.45 (inc. GST) as at 1 July 2021), providing a direct concession to applicants.
Designated Public Transport Concessions for Seniors Card Holders
Designated Public Transport Concessions for Seniors Card Holders allows visitors from interstate, who hold a state or territory Seniors Card, to access public transport concessions within Queensland and is fully funded by the Queensland Government.
COVID-19 Relief Measures – Rent Relief
As part of the government’s response to COVID-19, rent relief was provided for tenants who rent space at Department of Transport and Main Roads-owned properties to 31 December 2020.
| Table A.2.14 | Queensland Fire and Emergency Services |
| | | | | | | | |
Concession | | 2020–21
Est. Act.
$ million | | | 2021–22
Estimate
$ million | |
Emergency Management Levy Concession | | | 10.5 | | | | 11.0 | |
COVID-19 Advertising Rental Abatement1 | | | 0.4 | | | | — | |
Total | | | 10.9 | | | | 11.0 | |
Notes:
| 1. | This item is part of the Queensland Government response to COVID-19. |
236
Budget Strategy and Outlook 2021-22
Emergency Management Levy Concession
The Emergency Management Levy (EML) is applied to all prescribed Queensland property via council rates to ensure there is a secure funding base for fire and emergency services when Queenslanders are at risk during emergencies such as floods, cyclones, storms as well as fire and accidents. A 20 per cent discount is available on the EML for a property that is the owner’s principal place of residence and where the owner holds a Commonwealth Pensioner Concession Card or a Repatriation Health Card (Gold Card).
COVID-19 Advertising Rental Abatement
To support Queensland’s economic recovery from the impacts of COVID-19, the Queensland Fire and Emergency Services (QFES) provided rental abatement of up to 120 days on rental rates for billboard advertising located on QFES buildings.
| Table A.2.15 | Queensland Health |
| | | | | | | | |
Concession | | 2020–21
Est. Act.
$ million | | | 2021–22
Estimate
$ million | |
Oral Health Scheme | | | 175.7 | | | | 175.7 | |
Patient Travel Subsidy Scheme1 | | | 84.0 | | | | 94.8 | |
Medical Aids Subsidy Scheme2 | | | 28.7 | | | | 28.7 | |
Spectacle Supply Scheme | | | 9.9 | | | | 10.0 | |
Hospital Car Parking Concession Scheme3 | | | 1.6 | | | | 1.8 | |
Total | | | 299.9 | | | | 311.0 | |
Notes:
| 1. | The Queensland Government allocated $94.8 million to support Queenslanders to travel to their appointments in 2020–21. Due to the increased utilisation of telehealth options, there has been no increase in the budget in 2021–22. The impacts of COVID-19 on the health service, together with travel restrictions and an increase in telehealth services, have reduced the need for patients to travel for appointments. |
| 2. | 2021–22 should see a return to normal operation and statistics reflective of the true demand that exists for MASS services pending the COVID-19 vaccine rollout. |
| 3. | Actual expenditure varies slightly from year to year in response to demand by eligible patients, the value of parking tickets and the level of subsidy provided, at each site. |
Oral Health Scheme
The Oral Health Scheme provides free dental care to eligible clients and their dependants who possess a current Health Care Card, Pensioner Concession Card, Queensland Seniors Card or Commonwealth Seniors Card. The average value of a course of treatment for eligible clients is approximately $600 for general care, $1,600 for treatment involving dentures, and $250 for emergency dental care. In rural and remote areas where no private dental practitioner exists, access to dental care for the general public is provided at a concessional rate, generally 15 per cent to 20 per cent less than average private dental fees.
Patient Travel Subsidy Scheme
The Patient Travel Subsidy Scheme (PTSS) provides financial assistance to patients travelling for specialist medical services that are not available locally.
237
Budget Strategy and Outlook 2021-22
The PTSS provides a financial subsidy toward the cost of travel and accommodation for patients and, in some cases, an approved escort when patients are required to travel more than 50 kilometres from their nearest public hospital or public health facility to access specialist medical services
Patients receive fully subsidised commercial transport for the most clinically appropriate cost-effective mode or will be subsidised at the economy/government discount rate (less GST). A mileage subsidy of 30 cents per kilometre is paid where patients travel by private car.
Accommodation subsidies are $60 per person per night for the patient and approved escort if they stay in commercial accommodation, or a subsidy of $10 per person per night if staying with family or friends.
Medical Aids Subsidy Scheme
The Medical Aids Subsidy Scheme (MASS) provides access to subsidy funding assistance for the provision of a range of aids and equipment to eligible Queensland residents with permanent and established conditions or disabilities. Aids and equipment are provided primarily to assist people to live at home therefore avoiding premature or inappropriate residential care or hospitalisation.
Subsidies vary based on service category and clinical criteria and are provided to assist with the costs of communication aids, continence aids, daily living aids, medical grade footwear, mobility aids, orthoses and oxygen. The scheme provided approximately 55,000 occasions of service to approximately 36,000 clients during 2019–20.
COVID-19 continues to affect 2020–21 however, as the year progresses, there is a gradual return to normal operations. Client numbers are expected to increase to 38,000 with approximately 57,000 occasions of service.
Spectacle Supply Scheme
The Spectacle Supply Scheme (SSS) provides eligible Queensland residents with free access to a comprehensive range of basic spectacles every 2 years including bifocals and trifocals. Applicants must be holders of eligible concession cards and be deemed by a prescriber to have a clinical need for spectacles.
The SSS provides around 90,000 items each year to approximately 70,000 clients (some clients require more than one pair of spectacles due to clinical need). The average cost of services provided to applicants is approximately $122 per item, including the costs of administering the scheme through the Medical Aids Subsidy Scheme.
Hospital Car Parking Concession Scheme
The Hospital Car Parking Concession Scheme supports Hospital and Health Services (HHSs) to provide affordable car parking for eligible patients and their carers at 14 Queensland public hospitals with paid parking. Car parking concessions are available to eligible patients and their carers who attend hospital frequently or for an extended period of time; patients and their carers with special needs who require assistance; and patients and carers experiencing financial hardship.
The scheme provides access to discounted parking with an average discount of approximately 54 per cent of the commercial cost of parking. In 2020–21, approximately 335,000 patients and carers will benefit from the scheme receiving access to 482,000 concessions.
238
Budget Strategy and Outlook 2021-22
A.3 Concessions by Government-owned corporation
| Table A.3.1 | Energy Queensland |
| | | | | | | | |
Concession | | 2020–21
Est. Act.
$ million | | | 2021–22
Estimate
$ million | |
Regulated Service Charges—Ergon Energy | | | 16.8 | | | | 22.5 | |
Regulated Service Charges—Energex | | | 14.1 | | | | 16.4 | |
Total | | | 30.9 | | | | 38.9 | |
Regulated Service Charges – Ergon Energy
Under Schedule 8 of the Electricity Regulation 2006, service charges for a range of services provided by Ergon Energy Corporation Limited (Ergon Energy) to energy retailers, for example disconnection and reconnection of supply, are capped. The maximum amount Ergon Energy is able to charge for these services is, on average, less than the value which the Australian Energy Regulator ascribes to the provision of these services by Ergon Energy, resulting in a concession provided to energy retailers and in turn, to households.
Regulated Service Charges – Energex
Under Schedule 8 of the Electricity Regulation 2006, charges for a range of services provided by Energex Limited (Energex) to energy retailers, for example disconnection and reconnection of supply, are capped. The maximum amount Energex is able to charge for these services is, on average, less than the value which the Australian Energy Regulator ascribes to the provision of these services by Energex, resulting in a concession provided to energy retailers and in turn, to households.
Table A.3.2 Gladstone Ports Corporation Limited
| | | | | | | | |
Concession | | 2020–21
Est. Act.
$ million | | | 2021–22
Estimate
$ million | |
Concessional Port Charges | | | 39.3 | | | | 36.6 | |
Total | | | 39.3 | | | | 36.6 | |
Concessional Port Charges
The Gladstone Ports Corporation Limited (GPC) is subject to a number of long-term major industry contracts where port charges are significantly lower than market rates. These historical contracts were entered into to support various industries and government initiatives from time to time. The amounts shown are estimates of the revenue foregone by GPC as a result of being unable to charge commercial rates.
239
Budget Strategy and Outlook 2021-22
Table A.3.3 Sunwater Limited
| | | | | | | | |
Concession | | 2020–21
Est. Act.
$ million | | | 2021–22
Estimate
$ million | |
Water Supply Contracts | | | 49.8 | | | | 50.4 | |
Total | | | 49.8 | | | | 50.4 | |
Water Supply Contracts
Sunwater has a number of historic non-commercial water supply contracts that benefit specific entities (including local governments). The amount shown represents the difference between the estimated revenue under these contracts and that which could be recovered under a full cost allocation model.
Table A.3.4 Concessional Leases (Industry, Commercial and Community) By Entity
| | | | | | | | |
Concession | | 2020–21
Est. Act.
$ million | | | 2021–22
Estimate
$ million | |
Port of Townsville Limited | | | 6.1 | | | | 6.3 | |
Gladstone Ports Corporation Limited | | | 2.9 | | | | 3.0 | |
Queensland Rail Limited | | | 2.1 | | | | 2.1 | |
Far North Queensland Ports Corporation Limited | | | 1.6 | | | | 1.6 | |
North Queensland Bulk Ports Corporation Limited | | | 1.6 | | | | 1.6 | |
Total | | | 14.3 | | | | 14.6 | |
Concessional Leases (Industry, Commercial and Community)
The above government-owned corporation entities provide leases to various community organisations, local councils, government departments and industry participants at below commercial rates. The amounts shown are estimates of the revenue foregone by not charging commercial rates.
240
Budget Strategy and Outlook 2021-22
Table A.3.5 COVID-19-Related Measures by Entity
| | | | | | | | |
Concession | | 2020–21
Est. Act.
$ million | | | 2021–22
Estimate
$ million | |
Far North Queensland Ports Corporation Limited | | | 7.0 | | | | 2.1 | |
Queensland Rail Limited | | | 6.0 | | | | — | |
Port of Townsville Limited | | | 0.9 | | | | — | |
Gladstone Ports Corporation Limited | | | 0.4 | | | | — | |
Seqwater | | | 0.4 | | | | — | |
North Queensland Bulk Ports Corporation Limited | | | 0.1 | | | | — | |
Energy Queensland | | | 0.1 | | | | — | |
Total | | | 14.9 | | | | 2.1 | |
COVID-19-Related Measures (Industry, Commercial and Community)
As part of the Queensland Government’s COVID-19 response, the above government-owned businesses provided relief measures to support community organisations and businesses adversely affected by COVID-19.
Relief measures include temporary reductions to commercial leases, fees and other charges. The amounts shown are estimates of the revenue foregone by not charging commercial rates. To be included in the above table, concessions must meet the minimum materiality threshold of estimated revenue foregone of $50,000. Some government-owned businesses provided COVID-19 relief measures below this threshold including Sunwater, CS Energy, Stanwell and CleanCo.
241
Budget Strategy and Outlook 2021-22
Appendix B: Tax expenditure statement
Context
Governments employ a range of policy tools to achieve social and economic objectives. These include the use of direct budgetary outlays, regulatory mechanisms and taxation.
This Tax Expenditure Statement (TES) details revenue forgone as a result of Queensland Government decisions relating to the provision of tax exemptions or concessions. The TES is designed to improve transparency in the use of tax expenditures and increase public understanding of the fiscal process.
Tax expenditures are reductions in tax revenue that result from the use of the taxation system as a policy tool to deliver government policy objectives. Tax expenditures are provided through a range of measures, including:
| • | | tax exemptions, rebates or deductions |
| • | | the application of reduced tax rates to certain groups or sectors of the community |
| • | | provisions, which defer payment of a tax liability to a future period. |
Labelling an exemption or concession as a tax expenditure does not necessarily imply any judgement as to its appropriateness. It merely makes the amount of the exemption or concession explicit and thereby facilitates its scrutiny as part of the annual budget process.
COVID-19 and implications for tax expenditure
The impact of the COVID-19 pandemic on Queensland businesses has been significant and the Queensland Government moved quickly to introduce substantial tax relief measures to support Queensland businesses, particularly small to medium businesses. These initiatives were primarily aimed at supporting the cashflow and viability of Queensland businesses, landlords, tenants, and the state’s pubs and clubs.
The key relief measures fell under 3 categories:
| • | | direct refunds, holidays, rebates or waivers of tax liabilities – refunds, holidays and waivers of payroll tax liabilities; and a 25 per cent rebate and waiver of foreign surcharge on land tax |
| • | | deferrals of tax liabilities – various deferrals of payroll tax, land tax, gaming machine tax and lotteries tax |
| • | | exemptions – eligible JobKeeper payments were exempted from payroll tax. |
The impact of these measures has resulted in a significant increase in forgone revenue, most notably in 2019–20, although some measures continue to impact revenue in 2020–21.
242
Budget Strategy and Outlook 2021-22
Methodology
Revenue forgone approach
The method used almost exclusively by governments to quantify the value of their tax expenditures is the revenue forgone approach. This method estimates the revenue forgone through use of the concession by applying the benchmark rate of taxation to the volume of activities or assets affected by the concession.
One of the deficiencies of the revenue forgone approach is that effects on taxpayer behaviour resulting from tax expenditures are not factored into the estimate. Consequently, the aggregation of costings for individual tax expenditure items presented in the TES will not necessarily provide an accurate estimate of the total level of assistance provided through tax expenditures.
Additionally, while total COVID-19 relief is included in the TES, some relief was treated as a grant expense, for example in relation to rebates of already-paid tax liabilities. In these cases, the associated tax expenditure did not reduce revenues.
Measuring tax expenditures requires the identification of:
| • | | concessionally taxed components of the benchmark tax base such as a specific activity or class of taxpayer |
| • | | a benchmark tax rate to apply to the concessionally taxed components of the tax base. |
Defining the tax benchmark
The most important step in the preparation of a TES is the establishment of a benchmark for each tax included in the statement. The benchmark provides a basis against which each tax concession can be evaluated. The aim of the benchmark is to determine which concessions are tax expenditures as opposed to structural elements of the tax. The key features of a tax benchmark are:
| • | | any specific accounting conventions applicable to the tax |
| • | | the deductibility of compulsory payments |
| • | | any provisions to facilitate administration |
| • | | provisions relating to any fiscal obligations. |
By definition, tax expenditures are those tax concessions not included as part of the tax benchmark.
Identification of benchmark revenue bases and rates requires a degree of judgement and is not definitive. Furthermore, data limitations mean that the tax expenditures are approximations and are not exhaustive. This statement does not include estimates of revenue forgone from exemptions or concessions provided to government agencies. Very small exemptions or concessions are also excluded.
243
Budget Strategy and Outlook 2021-22
The tax expenditure statement
This year’s statement includes estimates of tax expenditures in 2019–20 and 2020–21 for payroll tax, land tax, duties, the waste disposal levy and gambling taxes. A summary of the major tax expenditures valued on the basis of revenue forgone is presented in Table B.1. Not all expenditures can be quantified at this time. Accordingly, the total value of tax expenditures should be considered as indicative only.
244
Budget Strategy and Outlook 2021-22
| Table B.1 | Tax expenditure summary1 |
| | | | | | | | |
| | | 2019–202
$ million | | | 2020–21
$ million | |
Payroll tax | | | | | | | | |
Exemption threshold | | | 898 | | | | 882 | |
Graduated tax scale | | | 41 | | | | 41 | |
Deduction scheme | | | 436 | | | | 429 | |
Regional discount | | | 90 | | | | 88 | |
COVID-19 relief3 | | | 254 | | | | 233 | |
Section 14 exemptions | | | 747 | | | | 748 | |
Local government | | | 165 | | | | 168 | |
Education | | | 189 | | | | 193 | |
Hospitals (excluding public hospitals) | | | 61 | | | | 62 | |
Charities | | | 331 | | | | 325 | |
Apprentice and trainee exemption | | | 57 | | | | 56 | |
Apprentice and trainee rebate | | | 27 | | | | 27 | |
Employee growth rebate | | | 0 | | | | 12 | |
Total payroll tax | | | 2,549 | | | | 2,516 | |
Land tax | | | | | | | | |
Liability threshold4 | | | 794 | | | | 859 | |
Graduated land tax scale | | | 1,430 | | | | 1,523 | |
Principal place of residence exemption | | | 301 | | | | 319 | |
Primary production exemption | | | 123 | | | | 133 | |
Part 6 Divisions 2 and 3 exemptions not included elsewhere5 | | | 151 | | | | 152 | |
Land developers’ concession | | | 21 | | | | 20 | |
COVID-19 relief3 | | | 181 | | | | 60 | |
Total land tax | | | 3,000 | | | | 3,066 | |
Duties | | | | | | | | |
Transfer duty | | | | | | | | |
Home concession | | | 381 | | | | 527 | |
First home concession | | | 216 | | | | 294 | |
First home vacant land | | | 21 | | | | 63 | |
AFAD exemption/ex gratia | | | 8 | | | | 6 | |
Insurance duty | | | | | | | | |
WorkCover | | | 70 | | | | 70 | |
Health insurance | | | 466 | | | | 488 | |
Compulsory third party (CTP)6 | | | 86 | | | | 89 | |
Total duties | | | 1,248 | | | | 1,537 | |
245
Budget Strategy and Outlook 2021-22
| | | | | | | | |
Queensland waste levy | | | | | |
Exempt waste – general | | | 127 | | | | 129 | |
Approved exemptions | | | 72 | | | | 88 | |
Approved discounts | | | 13 | | | | 14 | |
Total waste levy | | | 212 | | | | 231 | |
Taxes on gambling | | | | | | | | |
Gaming machine taxes | | | 85 | | | | 121 | |
Casino taxes | | | 7 | | | | 6 | |
Total gambling tax | | | 92 | | | | 127 | |
Total | | | 7,101 | | | | 7,477 | |
| | | | | | | | |
Notes:
| 1. | Numbers may not add due to rounding. |
| 2. | 2019–20 estimates may have been revised since the 2020–21 Queensland Budget. |
| 3. | Significant relief was provided after revenue had already been accrued and therefore the funding provided for these measures were treated as refunds via grant expenses. This expense, along with any interest cost of deferred payments, has not been included in this table. |
| 4. | Land tax is payable only on the value of taxable land above a threshold, depending on ownership structure. |
| 5. | Applicable, but not limited to; religious bodies, public benevolent institutions, and other exempt charitable institutions. |
| 6. | CTP duty is levied at a rate of 10 cents per policy. |
246
Budget Strategy and Outlook 2021-22
Discussion of individual taxes
Payroll tax
The benchmark tax base for payroll tax is assumed to be all taxable wages, salaries and supplements (including employer superannuation contributions) paid in Queensland, as defined in the Payroll Tax Act 1971.
Payroll tax exemption threshold
From 1 July 2019, employers who employ in Queensland with an annual Australian payroll of $1.3 million or less are exempt from payroll tax. On the basis of November 2020 average weekly adult total earnings, the new threshold corresponded to businesses with payrolls equivalent to employing approximately 15 full-time equivalent employees. This exemption is designed to assist small and medium sized businesses.
Graduated payroll tax scale
Queensland employers with Australian payrolls between $1.3 million and $6.5 million are liable for payroll tax at a rate of 4.75 per cent, and those with payrolls above $6.5 million are liable at a rate of 4.95 per cent. The benchmark tax rate for payroll tax is assumed to be 4.95 per cent.
Deduction scheme
Queensland employers with Australian payrolls between $1.3 million and $6.5 million benefit from a deduction of $1.3 million, which reduces by $1 for every $4 by which the annual payroll exceeds $1.3 million, with no deduction for employers or groups that have annual payroll in excess of $6.5 million.
Regional discount
Employers who are based in regional Queensland and pay over 85 per cent of taxable wages to regional areas may be entitled to a discount on the rate of payroll tax imposed on their taxable wages. The discounted payroll tax rates for regional businesses are 3.75 per cent for employers who pay $6.5 million or less in Australian taxable wages, or 3.95 per cent for employers who pay more than $6.5 million in Australian taxable wages.
COVID-19 relief – payroll tax
In response to the COVID-19 pandemic, a number of payroll tax relief measures were implemented to assist Queensland businesses that resulted in forgone revenue in 2019–20 and 2020–21, including:
| • | | A 3-month payroll tax holiday for small businesses |
| • | | Exemption from payroll tax of the subsidised component of the Australian Government’s JobKeeper payment |
| • | | A 2-month payroll tax waiver for small businesses. |
247
Budget Strategy and Outlook 2021-22
Section 14 exemptions
A number of organisations are provided with exemptions from payroll tax under Section 14 of the Payroll Tax Act 1971. The activities for which estimates have been calculated are wages paid by charities for employees working in hospitals, non-tertiary private educational institutions and for other qualifying exempt purposes, and for local governments (excluding commercial activities).
Apprentice and trainee exemptions
Most apprentice and trainee wages are exempt from payroll tax. To be eligible the employee must sign a training contract with their employer to undertake an apprenticeship or traineeship declared under the Further Education and Training Act 2014.
Apprentice and trainee rebate
In addition to being exempt wages for payroll tax, a rebate can be claimed that reduces the overall payroll tax liability of an employer. The rebate is calculated by multiplying 50 per cent of the apprentice and trainee wages by the applicable payroll tax rate for each return period.
Employment growth rebate
For 2019–20 and 2020–21, a payroll tax rebate of up to $20,000 is available to eligible employers who demonstrate a net employment increase in the number of new Queensland full-time positions over a full financial year. The rebates are calculated as part of annual returns due in July of each year, with the 2019–20 rebate reflected as a tax expenditure in 2020–21.
Land tax
The benchmark tax base is assumed to be all freehold land within Queensland. The benchmark tax rate for land tax is either the top rate of land tax applicable in Queensland (excluding surcharges) in each financial year, or the effective rate under the graduated scale of land tax rates.
Liability threshold
Land tax is payable on the value of taxable land equal to or above a threshold which depends on the land’s ownership. The threshold for companies, trusts and absentees is $350,000 and for resident individuals the threshold is $600,000.
Graduated land tax scale
A graduated (concessional) scale of land tax rates is applicable to land holdings with a taxable value of less than $10 million for resident individuals and companies, trustees and absentees. The benchmark rates used for estimating the tax expenditures were 2.25 per cent for individuals, 2.5 per cent for absentees and 2.75 per cent for companies and trustees.
Principal place of residence exemption
Land owned by resident individuals as their principal place of residence is excluded from the estimate of taxable land value in calculating land tax.
248
Budget Strategy and Outlook 2021-22
Primary production deduction
The taxable value of land owned by a resident individual, trustee or some absentees and companies does not include all or part of their land that is used for the business of agriculture, pasturage or dairy farming.
Part 6 Divisions 2 and 3 exemptions (not elsewhere included)
A number of land tax exemptions are granted in Part 6 Divisions 2 and 3 of the Land Tax Act 2010 to eligible organisations. These include, but are not limited to, public benevolent institutions, religious institutions and other exempt charitable institutions, retirement villages, trade unions and showgrounds.
Land developers’ concession
Land tax payable by land developers is calculated on the basis that the unimproved value of undeveloped land subdivided in the previous financial year and which remains unsold at 30 June of that year is 60 per cent of the Valuer-General’s value. This concession is outlined in Section 30 of the Land Tax Act 2010.
COVID-19 relief – land tax
In response to the COVID-19 pandemic, a number of relief measures were implemented to assist landowners and tenants that resulted in forgone revenue in 2019–20 and 2020–21, including:
| • | | a 25 per cent rebate on the 2019–20 and 2020–21 land tax liability for eligible land owners that provided commensurate rent relief to COVID-19 impacted tenants, or that are unable to secure tenants due to COVID-19. |
| • | | the waiver of the 2 per cent foreign land tax surcharge in 2019–20. |
Duties
Home concession
A concessional rate of duty applies to purchases of a principal place of residence. A one per cent concessional rate applies on dutiable values up to $350,000, rather than the normal schedule of rates between 1.5 per cent and 3.5 per cent. For properties valued over $350,000, the scheduled rates of transfer duty apply on the excess.
First home concession
Where a purchaser has not previously owned a residence in Queensland or elsewhere, the purchaser of a home receives a more generous concession on duty. This concession comprises a rebate in addition to the home concession on properties (this concession may not be applicable if the purchase price is less than the full market value of the property). The size of the rebate depends on the value of the property. A full concession is provided to purchases of a first principal place of residence valued up to $500,000, phasing out at $550,000.
First home vacant land concession
A first home concession is available for the purchase of certain vacant land up to the value of $400,000, with a full concession available on certain vacant land up to the value of $250,000.
249
Budget Strategy and Outlook 2021-22
Additional foreign acquirer duty exemption
An Australian-based foreign corporation or trust whose commercial activities involve significant development by adding to the supply of housing stock in Queensland, where such development is primarily residential, may be eligible for ex-gratia relief from the additional 7 per cent additional foreign acquirer duty.
Insurance duty
The benchmark tax base is assumed to be all premiums for general insurance policies (not for life insurance). The benchmark tax rate is 9 per cent.
Queensland Waste Levy
The Queensland Waste Levy is payable by landfill operators on waste disposed to landfill, except waste generated and disposed in the non-levy zone. The benchmark levy rate was $75 per tonne from July 2020 to December 2020 and $80 per tonne from January 2021 to June 2021 (higher for regulated wastes).
General levy exemptions exist for particular wastes, such as those from declared disasters and severe local weather events. Also, levy exemptions are available on application for other particular wastes, such as waste from charitable recycling organisations and community clean-up events. Levy discounts of 50 per cent are available on application for residue wastes from particular recycling activities.
Gambling taxes
Gaming machine tax concessions for licensed clubs
The benchmark tax base is assumed to be all gaming machines operated by licensed clubs and hotels in Queensland. The benchmark tax rate is assumed to be the highest marginal tax rate (as is applied to hotels) that actually applied in each financial year.
A progressive tax rate scale applies to gaming machines operated by licensed clubs. The tax rate is calculated monthly on the gaming machine taxable metered win and the top tax rate is only applied to the portion of gaming machine revenue where the monthly metered win exceeds $1.4 million for any licensed club.
Casino tax concessions
The benchmark tax base is assumed to be all casinos operating in Queensland. The benchmark tax rate is assumed to be the highest tax rate that is actually applied in each financial year.
A tax rate of 20 per cent of gross revenue applies for standard transactions in the Brisbane and Gold Coast casinos. A concessional tax rate of 10 per cent applies for gross revenue from standard transactions in the Cairns and Townsville casinos. The tax rate applicable to gaming machines in casinos is 30 per cent of gross revenue in the Brisbane and Gold Coast casinos, and 20 per cent in the Cairns and Townsville casinos.
In addition, concessional rates of 10 per cent also apply for revenue from high rollers table game play in all casinos. A GST credit is provided to casinos that approximates a reduction in the above tax rates of 9.09 per cent.
250
Budget Strategy and Outlook 2021-22
| Appendix | C: Revenue and expense assumptions and sensitivity analysis |
The 2021–22 Queensland Budget, similar to all other jurisdictions, is based in part on assumptions made about parameters, both internal and external to Queensland, which can impact directly on economic and fiscal forecasts.
The sensitivity of revenue and expense forecasts to movements in underlying assumptions is particularly relevant given the almost unprecedented uncertainty in global and national economic conditions and key economic parameters in the context of the COVID-19 crisis.
The forward estimates in the 2021–22 Budget are framed on a no-policy-change basis. That is, the expenditure and revenue policies in place at the time of the budget (including those announced in the budget) are applied consistently throughout the forward estimates period.
Table C.1 shows the main components of taxation and royalty revenue, and the forecast revenues for each component across the forward estimates.
| Table C.1 | Taxation and royalty revenue1 |
| | | | | | | | | | | | | | | | | | | | | | | | |
| | | 2019–20 | | | 2020–21 | | | 2021–22 | | | 2022–23 | | | 2023–24 | | | 2024–25 | |
| | | Actual | | | Est. Act. | | | Budget | | | Projection | | | Projection | | | Projection | |
| | | $ million | | | $ million | | | $ million | | | $ million | | | $ million | | | $ million | |
Payroll tax | | | 4,211 | | | | 4,192 | | | | 4,484 | | | | 4,741 | | | | 5,011 | | | | 5,263 | |
Transfer duty | | | 3,041 | | | | 3,693 | | | | 4,598 | | | | 4,100 | | | | 3,796 | | | | 4,040 | |
Other duties | | | 1,583 | | | | 1,771 | | | | 1,830 | | | | 1,839 | | | | 1,917 | | | | 1,999 | |
Gambling taxes and levies | | | 1,258 | | | | 1,565 | | | | 1,553 | | | | 1,606 | | | | 1,672 | | | | 1,730 | |
Land tax | | | 1,406 | | | | 1,493 | | | | 1,617 | | | | 1,686 | | | | 1,802 | | | | 1,931 | |
Motor vehicle registration | | | 1,910 | | | | 1,987 | | | | 2,044 | | | | 2,103 | | | | 2,169 | | | | 2,242 | |
Other taxes | | | 1,175 | | | | 1,206 | | | | 1,273 | | | | 1,322 | | | | 1,365 | | | | 1,403 | |
Total taxation revenue | | | 14,585 | | | | 15,907 | | | | 17,399 | | | | 17,397 | | | | 17,731 | | | | 18,608 | |
Royalties | | | | | | | | | | | | | | | | | | | | | | | | |
Coal | | | 3,517 | | | | 1,745 | | | | 2,048 | | | | 2,550 | | | | 2,778 | | | | 2,943 | |
Petroleum2 | | | 466 | | | | 298 | | | | 632 | | | | 551 | | | | 618 | | | | 625 | |
Other royalties3 | | | 549 | | | | 479 | | | | 487 | | | | 466 | | | | 485 | | | | 480 | |
Land rents | | | 154 | | | | 146 | | | | 174 | | | | 177 | | | | 179 | | | | 182 | |
Total royalties and land rents | | | 4,686 | | | | 2,667 | | | | 3,341 | | | | 3,743 | | | | 4,060 | | | | 4,229 | |
Notes:
| 1. | Numbers may not add due to rounding. |
| 2. | Includes liquefied natural gas (LNG). |
| 3. | Includes base and precious metal and other mineral royalties. |
251
Budget Strategy and Outlook 2021-22
This appendix outlines the assumptions underlying the revenue and expense estimates, and analyses the sensitivity of the estimates to changes in key economic and other assumptions. This analysis is provided to enhance the level of transparency and accountability of the government.
The following discussion provides details of some of the key assumptions, estimates and risks associated with revenue and expenditure forecasts. Where a direct link can be established, the indicative impact on forecasts resulting from a movement in those variables is provided.
Taxation revenue assumptions and revenue risks
The rate of growth in tax revenues is dependent on a range of factors linked to the rate of growth in economic activity in the state. Some taxes are closely related to activity in specific sectors of the economy, whilst others are broadly related to the general rate of economic growth, employment, inflation or wages.
A change in the level of economic activity, resulting from economic growth differing from forecast growth, would impact upon a broad range of taxation receipts.
Wages and employment growth – payroll tax collections
Wages and employment growth have a direct impact on payroll tax collections. In 2021–22, wages in Queensland are forecast to increase by 21⁄4 per cent, while employment is forecast to rise 3 per cent in 2021–22.
The composition of the payroll tax base is also important as businesses in sectors such as tourism, retail and hospitality are often outside the tax base because they are below a threshold. A one percentage point variation in either Queensland wages growth or employment would change payroll tax collections by approximately $45 million in 2021–22.
Transfer duty estimates
Transfer duty collections in 2021–22 are expected to increase by 24.5 per cent compared with 2020–21 estimated actuals, supported by continued strength in residential housing transactions and further growth in dwelling prices.
Across the 3 years ending 2024–25, an annual average decline of around 4 per cent is expected in total transfer duty, primarily reflecting a moderation in the level of activity in the residential sector beyond 2021–22.
A one percentage point variation in either the average value of property transactions or the volume of transactions would change transfer duty collections by approximately $46 million in 2021–22.
252
Budget Strategy and Outlook 2021-22
Royalty assumptions and revenue risks
Table C.2 below provides the 2021–22 Budget assumptions regarding coal royalties, which represent the bulk of Queensland’s royalty revenue.
| Table C.2 | Coal royalty assumptions |
| | | | | | | | | | | | | | | | | | | | |
| | | 2020–21 | | | 2021–22 | | | 2022–23 | | | 2023–24 | | | 2024–25 | |
| | | Est. Act. | | | Budget | | | Projection | | | Projection | | | Projection | |
Tonnages—crown export1 coal (Mt) | | | 186 | | | | 186 | | | | 206 | | | | 218 | | | | 228 | |
Exchange rate US$ per A$2 | | | 0.75 | | | | 0.76 | | | | 0.75 | | | | 0.75 | | | | 0.75 | |
Year average coal prices (US$ per tonne)3 | | | | | | | | | | | | | | | | | | | | |
Hard coking | | | 116 | | | | 130 | | | | 140 | | | | 143 | | | | 145 | |
Semi-soft | | | 95 | | | | 104 | | | | 109 | | | | 110 | | | | 111 | |
Thermal | | | 71 | | | | 76 | | | | 74 | | | | 74 | | | | 74 | |
Year average oil price | | | | | | | | | | | | | | | | | | | | |
Brent (US$ per barrel)4 | | | 41 | | | | 60 | | | | 58 | | | | 60 | | | | 60 | |
Notes:
| 1. | Excludes coal produced for domestic consumption and coal where royalties are not paid to the government, that is, private royalties. The 2021–22 estimate for domestic coal volume is approximately 23.4 million tonnes (Mt) and private coal is 14.9 Mt. |
| 3. | Price for highest quality coking and thermal coal. Lower quality coal can be sold below this price with indicative average prices for 2021–22 as follows: hard coking US$122/t and thermal US$71/t. |
| 4. | Published Brent oil prices are lagged by 4 months to better align with royalty revenue. |
Exchange rate and commodity prices and volumes
Estimates of mining royalties are sensitive to movements in the A$-US$ exchange rate and commodity prices and volumes.
Contracts for the supply of commodities are generally written in US dollars. Accordingly, a change in the exchange rate impacts on the Australian dollar price of commodities and, therefore, expected royalty collections.
Potential impact on coal royalty revenue1
For each one cent movement in the A$-US$ exchange rate in 2021–22, the impact on royalty revenue would be approximately $44 million.
A one per cent variation in export coking and thermal coal volumes would lead to a change in royalty revenue of approximately $21 million. A one million tonne (Mt) variation would lead to a change in royalty revenue of approximately $10 million.
A one per cent variation in the average price of export coal would lead to a change in royalty revenue of approximately $33 million.
| 1 | Sensitivities represent the estimated change to royalty revenue accruing over the 2021–22 return period. |
253
Budget Strategy and Outlook 2021-22
Parameters influencing Australian Government GST payments to Queensland
The 2021–22 Budget incorporates estimates of GST revenue grants to Queensland based on Australian Government estimates of national GST collections and Queensland Treasury assumptions of Queensland’s share. The estimates of collections are primarily determined by the value of national consumption subject to GST.
Since the Australian Government payments are based on the amount actually collected, it is the Queensland Budget that bears the risks of fluctuations in GST collections. As with all other tax estimates, there is a risk of lower collections than estimated if national economic growth and consumption are weaker than expected.
Due to the complexities associated with the GST base, the information provided in the Australian Government Budget Papers is insufficient to prepare indicative estimates of the sensitivity of GST forecasts to key variables.
Sensitivity of expenditure estimates and expenditure risks
Public sector wage costs
Salaries and wages form a large proportion of General Government Sector operating expenses.
Increases in salaries and wages are negotiated through enterprise bargaining agreements.
The 2021–22 Budget and forward estimates reflect growth in full-time equivalent and wage increases consistent with existing agreements and expectations of future bargaining agreements where outcomes are yet to be finalised.
Interest rates
The General Government Sector has a total debt servicing cost forecast at $1.667 billion in 2021–22. The current average duration of General Government Sector borrowing with the Queensland Treasury Corporation (QTC) is 6.7 years. The majority of General Government Sector debt is held under fixed interest rates and, therefore, the impact of interest rate variations on debt servicing costs in 2021–22 would be relatively modest, with the impact occurring progressively across the forward estimates.
Actuarial estimates of superannuation and long service leave
Liabilities for superannuation and long service leave are estimated by the State Actuary with reference to, among other things, assumed rates of investment returns, salary growth, inflation and the discount rate. These liabilities are therefore subject to changes in these parameters. Similarly, the long service leave liabilities are subject to the risk that the actual rates of employee retention will vary from those assumed in the liability calculation.
254
Budget Strategy and Outlook 2021-22
Appendix D: Fiscal aggregates and indicator
Table D1 Key Fiscal Aggregates
| | | | | | | | | | | | | | | | | | | | | | | | | | | | | | | | | | | | | | | | | | | | | | | | |
| | | 2013–14
Actual1
$ million | | | 2014–15
Actual1
$ million | | | 2015–16
Actual1
$ million | | | 2016–17
Actual1
$ million | | | 2017–18
Actual1
$ million | | | 2018–19
Actual1
$ million | | | 2019–20
Actual1
$ million | | | 2020–21
Est. Act.
$ million | | | 2021–22
Projection
$ million | | | 2022–23
Projection
$ million | | | 2023–24
Projection
$ million | | | 2024–25
Projection
$ million | |
General Government | | | | | | | | | | | | | | | | | | | | | | | | | | | | | | | | | | | | | | | | | | | | | | | | |
Total revenue | | | 46,705 | | | | 49,970 | | | | 50,780 | | | | 56,194 | | | | 58,087 | | | | 59,828 | | | | 57,764 | | | | 60,396 | | | | 63,664 | | | | 65,711 | | | | 68,408 | | | | 70,367 | |
Tax revenue | | | 11,840 | | | | 12,598 | | | | 12,547 | | | | 12,919 | | | | 13,244 | | | | 14,165 | | | | 14,585 | | | | 15,907 | | | | 17,399 | | | | 17,397 | | | | 17,731 | | | | 18,608 | |
Total expenses | | | 46,217 | | | | 49,551 | | | | 50,112 | | | | 53,369 | | | | 56,337 | | | | 58,843 | | | | 63,498 | | | | 64,199 | | | | 67,148 | | | | 68,151 | | | | 69,376 | | | | 70,214 | |
Employee expenses | | | 17,816 | | | | 18,592 | | | | 20,045 | | | | 21,258 | | | | 22,681 | | | | 24,019 | | | | 25,660 | | | | 26,284 | | | | 27,474 | | | | 28,598 | | | | 29,337 | | | | 30,344 | |
Net operating balance | | | 488 | | | | 420 | | | | 668 | | | | 2,825 | | | | 1,750 | | | | 985 | | | | (5,734 | ) | | | (3,803 | ) | | | (3,485 | ) | | | (2,440 | ) | | | (968 | ) | | | 153 | |
Capital purchases | | | 6,323 | | | | 4,635 | | | | 4,044 | | | | 4,620 | | | | 5,126 | | | | 5,764 | | | | 6,291 | | | | 6,965 | | | | 7,800 | | | | 7,786 | | | | 7,275 | | | | 7,041 | |
Net capital purchases | | | 3,085 | | | | 996 | | | | 1,163 | | | | 2,265 | | | | 2,337 | | | | 3,192 | | | | 3,424 | | | | 4,356 | | | | 4,480 | | | | 3,939 | | | | 2,661 | | | | 2,232 | |
Fiscal balance | | | (2,597 | ) | | | (576 | ) | | | (495 | ) | | | 560 | | | | (587 | ) | | | (2,207 | ) | | | (9,158 | ) | | | (8,159 | ) | | | (7,965 | ) | | | (6,379 | ) | | | (3,630 | ) | | | (2,079 | ) |
Borrowing with QTC | | | 39,864 | | | | 41,343 | | | | 34,200 | | | | 31,358 | | | | 29,256 | | | | 29,468 | | | | 37,570 | | | | 47,102 | | | | 57,240 | | | | 67,110 | | | | 73,265 | | | | 77,761 | |
Leases and similar arrangements2 | | | 1,503 | | | | 1,761 | | | | 1,286 | | | | 1,882 | | | | 2,142 | | | | 2,612 | | | | 6,499 | | | | 7,779 | | | | 7,603 | | | | 7,471 | | | | 7,780 | | | | 7,623 | |
Securities and Derivatives | | | 1 | | | | (0 | ) | | | (0 | ) | | | (0 | ) | | | 122 | | | | 121 | | | | 198 | | | | 198 | | | | 198 | | | | 198 | | | | 198 | | | | 198 | |
Net debt | | | 5,208 | | | | 5,749 | | | | 654 | | | | (355 | ) | | | (509 | ) | | | (198 | ) | | | 14,046 | | | | 15,808 | | | | 24,750 | | | | 33,326 | | | | 39,019 | | | | 42,573 | |
| | | | | | | | | | | | |
Non-financial Public Sector | | | | | | | | | | | | | | | | | | | | | | | | | | | | | | | | | | | | | | | | | | | | | | | | |
Total revenue | | | 53,502 | | | | 56,178 | | | | 57,393 | | | | 64,855 | | | | 66,164 | | | | 68,329 | | | | 66,156 | | | | 68,464 | | | | 70,934 | | | | 73,088 | | | | 75,821 | | | | 78,074 | |
Capital purchases | | | 9,313 | | | | 7,811 | | | | 6,852 | | | | 7,291 | | | | 7,643 | | | | 8,460 | | | | 9,467 | | | | 10,456 | | | | 11,513 | | | | 11,440 | | | | 10,572 | | | | 10,368 | |
Borrowing with QTC | | | 70,668 | | | | 73,256 | | | | 71,160 | | | | 69,107 | | | | 66,964 | | | | 67,576 | | | | 76,464 | | | | 87,327 | | | | 97,896 | | | | 107,892 | | | | 114,243 | | | | 119,130 | |
Leases and similar arrangements2 | | | 1,752 | | | | 1,802 | | | | 1,316 | | | | 1,882 | | | | 2,142 | | | | 2,612 | | | | 6,991 | | | | 8,227 | | | | 8,009 | | | | 7,843 | | | | 8,118 | | | | 7,925 | |
Securities and Derivatives | | | 216 | | | | 175 | | | | 446 | | | | 895 | | | | 405 | | | | 720 | | | | 1,505 | | | | 259 | | | | 436 | | | | 333 | | | | 320 | | | | 325 | |
Notes:
| 1. | With the implementation of the latest GFS Manual (AGFS15), some categories have been restated to ensure comparability. |
| 2. | Approximately $2.2 billion increase in General Government and $2.6 billion in NFPS in 2019-20 on adoption of the new lease accounting standard AASB 16. |
255
Budget Strategy and Outlook 2021-22
Table D2 Key Fiscal Indicators
| | | | | | | | | | | | | | | | | | | | | | | | | | | | | | | | | | | | | | | | | | | | | | | | |
| | | 2013–14
Actual1
% | | | 2014–15
Actual1
% | | | 2015–16
Actual1
% | | | 2016–17
Actual1
% | | | 2017–18
Actual1
% | | | 2018–19
Actual1
% | | | 2019–20
Actual1
% | | | 2020–21
Est. Act.
% | | | 2021–22
Projection
% | | | 2022–23
Projection
% | | | 2023–24
Projection
% | | | 2024–25
Projection
% | |
General Government | | | | | | | | | | | | | | | | | | | | | | | | | | | | | | | | | | | | | | | | | | | | | | | | |
Revenue/GSP | | | 16.1 | | | | 16.9 | | | | 16.8 | | | | 17.1 | | | | 16.5 | | | | 16.3 | | | | 16.0 | | | | 16.4 | | | | 16.1 | | | | 15.8 | | | | 15.7 | | | | 15.4 | |
Tax/GSP | | | 4.1 | | | | 4.3 | | | | 4.2 | | | | 3.9 | | | | 3.8 | | | | 3.9 | | | | 4.0 | | | | 4.3 | | | | 4.4 | | | | 4.2 | | | | 4.1 | | | | 4.1 | |
Own source revenue/GSP | | | 8.6 | | | | 8.9 | | | | 8.9 | | | | 8.8 | | | | 8.6 | | | | 8.6 | | | | 8.3 | | | | 7.8 | | | | 8.0 | | | | 7.8 | | | | 7.6 | | | | 7.4 | |
Expenses/GSP | | | 16.0 | | | | 16.8 | | | | 16.6 | | | | 16.2 | | | | 16.0 | | | | 16.0 | | | | 17.6 | | | | 17.4 | | | | 17.0 | | | | 16.4 | | | | 15.9 | | | | 15.3 | |
Employee expenses/GSP | | | 6.2 | | | | 6.3 | | | | 6.6 | | | | 6.5 | | | | 6.5 | | | | 6.5 | | | | 7.1 | | | | 7.1 | | | | 7.0 | | | | 6.9 | | | | 6.7 | | | | 6.6 | |
Net operating balance/GSP | | | 0.2 | | | | 0.1 | | | | 0.2 | | | | 0.9 | | | | 0.5 | | | | 0.3 | | | | (1.6 | ) | | | (1.0 | ) | | | (0.9 | ) | | | (0.6 | ) | | | (0.2 | ) | | | 0.0 | |
Capital purchases/GSP | | | 2.2 | | | | 1.6 | | | | 1.3 | | | | 1.4 | | | | 1.5 | | | | 1.6 | | | | 1.7 | | | | 1.9 | | | | 2.0 | | | | 1.9 | | | | 1.7 | | | | 1.5 | |
Net cash inflows from operating activities/Netcash flows from investments in non-financial assets | | | 45.9 | | | | 97.5 | | | | 122.9 | | | | 134.2 | | | | 107.0 | | | | 105.5 | | | | (3.0 | ) | | | (18.9 | ) | | | 6.5 | | | | 8.1 | | | | 36.3 | | | | 54.8 | |
Fiscal balance/GSP | | | (0.9 | ) | | | (0.2 | ) | | | (0.2 | ) | | | 0.2 | | | | (0.2 | ) | | | (0.6 | ) | | | (2.5 | ) | | | (2.2 | ) | | | (2.0 | ) | | | (1.5 | ) | | | (0.8 | ) | | | (0.5 | ) |
Total borrowings/GSP | | | 14.3 | | | | 14.6 | | | | 11.7 | | | | 10.1 | | | | 9.0 | | | | 8.8 | | | | 12.3 | | | | 14.9 | | | | 16.5 | | | | 18.0 | | | | 18.6 | | | | 18.7 | |
Total Borrowings/Revenue | | | 88.6 | | | | 86.3 | | | | 69.9 | | | | 59.2 | | | | 54.3 | | | | 53.8 | | | | 76.6 | | | | 91.2 | | | | 102.2 | | | | 113.8 | | | | 118.8 | | | | 121.6 | |
Lease and other liabilities/revenue | | | 3.2 | | | | 3.5 | | | | 2.5 | | | | 3.3 | | | | 3.7 | | | | 4.4 | | | | 11.3 | | | | 12.9 | | | | 11.9 | | | | 11.4 | | | | 11.4 | | | | 10.8 | |
Net debt/revenue | | | 11.2 | | | | 11.5 | | | | 1.3 | | | | (0.6 | ) | | | (0.9 | ) | | | (0.3 | ) | | | 24.3 | | | | 26.2 | | | | 38.9 | | | | 50.7 | | | | 57.0 | | | | 60.5 | |
| | | | | | | | | | | | |
Revenue growth | | | 11.9 | | | | 7.0 | | | | 1.6 | | | | 10.7 | | | | 3.4 | | | | 3.0 | | | | (3.5 | ) | | | 4.6 | | | | 5.4 | | | | 3.2 | | | | 4.1 | | | | 2.9 | |
Tax growth | | | 8.3 | | | | 6.4 | | | | (0.4 | ) | | | 3.0 | | | | 2.5 | | | | 7.0 | | | | 3.0 | | | | 9.1 | | | | 9.4 | | | | (0.0 | ) | | | 1.9 | | | | 4.9 | |
Expenses growth | | | (0.2 | ) | | | 7.2 | | | | 1.1 | | | | 6.5 | | | | 5.6 | | | | 4.4 | | | | 7.9 | | | | 1.1 | | | | 4.6 | | | | 1.5 | | | | 1.8 | | | | 1.2 | |
Employee expenses growth | | | (1.7 | ) | | | 4.4 | | | | 7.8 | | | | 6.1 | | | | 6.7 | | | | 5.9 | | | | 6.8 | | | | 2.4 | | | | 4.5 | | | | 4.1 | | | | 2.6 | | | | 3.4 | |
| | | | | | | | | | | | |
Non-Financial Public Sector | | | | | | | | | | | | | | | | | | | | | | | | | | | | | | | | | | | | | | | | | | | | | | | | |
Capital purchases/GSP | | | 3.2 | | | | 2.6 | | | | 2.3 | | | | 2.2 | | | | 2.2 | | | | 2.3 | | | | 2.6 | | | | 2.8 | | | | 2.9 | | | | 2.8 | | | | 2.4 | | | | 2.3 | |
Total borrowings/GSP | | | 25.1 | | | | 25.5 | | | | 24.1 | | | | 21.9 | | | | 19.8 | | | | 19.3 | | | | 23.5 | | | | 25.9 | | | | 27.0 | | | | 27.9 | | | | 28.1 | | | | 27.8 | |
Total Borrowings/Revenue | | | 135.8 | | | | 133.9 | | | | 127.1 | | | | 110.8 | | | | 105.1 | | | | 103.8 | | | | 128.4 | | | | 139.9 | | | | 149.9 | | | | 158.8 | | | | 161.8 | | | | 163.2 | |
Net financial liabilities/revenue | | | 129.8 | | | | 125.2 | | | | 127.4 | | | | 111.2 | | | | 111.5 | | | | 114.9 | | | | 146.5 | | | | 138.1 | | | | 145.5 | | | | 151.0 | | | | 151.1 | | | | 149.2 | |
Notes:
| 1. | With the implementation of the latest GFS Manual (AGFS15), some categories have been restated to ensure comparability. GSP figures reflect 2019-20 ABS National Accounts: State Accounts. |
256
Queensland Budget 2021–22 Budget Strategy and Outlook Budget Paper No.2

Queensland Budget 2021–22
Budget Strategy and Outlook Budget Paper No. 2
budget.qld.gov.au

CAPITAL STATEMENT
BUDGET PAPER NO. 3
2021–22 Queensland Budget Papers
1. Budget Speech
2. Budget Strategy and Outlook
3. Capital Statement
Service Delivery Statements
Appropriation Bills
Budget Highlights
Regional Action Plans
The budget papers are available online at budget.qld.gov.au
© The State of Queensland (Queensland Treasury) 2021
Copyright
This publication is protected by the Copyright Act 1968
Licence
This document is licensed by the State of Queensland (Queensland Treasury) under a Creative Commons Attribution (CC BY 4.0) International licence.

In essence, you are free to copy, communicate and adapt this publication, as long as you attribute the work to the State of Queensland (Queensland Treasury). To view a copy of this licence, visit http://creativecommons.org/licenses/by/4.0/
Attribution
Content from this publication should be attributed to:
© The State of Queensland (Queensland Treasury)—2021–22 Queensland Budget
 Translating and interpreting assistance
The Queensland Government is committed to providing accessible services to Queenslanders from all cultural and linguistic backgrounds. If you have difficulty in understanding this publication, you can contact us on telephone (07) 3035 3503 and we will arrange an interpreter to effectively communicate the report to you.
Capital Statement
Budget Paper No. 3
ISSN 1445-4890 (Print)
ISSN 1445-4904 (Online)
Capital Statement 2021-22

State Budget
2021–22
Capital Statement
Budget Paper No. 3
Capital Statement 2021-22
Contents
| | | | | | |
1 | | Approach and highlights | | | 1 | |
| |
Features | | | 1 | |
| | |
1.1 | | Introduction | | | 3 | |
1.2 | | Capital planning and optimisation | | | 4 | |
1.3 | | Key capital projects and programs | | | 6 | |
| | |
2 | | 2021–22 Capital program overview | | | 15 | |
| | |
2.1 | | Introduction | | | 15 | |
2.2 | | Capital purchases | | | 16 | |
2.3 | | Capital grants | | | 20 | |
| | |
3 | | Capital outlays by entity | | | 24 | |
| | |
3.1 | | Agriculture and Fisheries | | | 24 | |
3.2 | | Children, Youth Justice and Multicultural Affairs | | | 27 | |
3.3 | | Communities, Housing and Digital Economy | | | 29 | |
3.4 | | Education | | | 36 | |
3.5 | | Employment, Small Business and Training | | | 51 | |
3.6 | | Energy and Public Works | | | 54 | |
3.7 | | Environment and Science | | | 63 | |
3.8 | | Justice and Attorney-General | | | 66 | |
3.9 | | Legislative Assembly of Queensland | | | 68 | |
3.10 | | Premier and Cabinet | | | 69 | |
3.11 | | Queensland Corrective Services | | | 71 | |
3.12 | | Queensland Fire and Emergency Services | | | 73 | |
3.13 | | Queensland Health | | | 76 | |
3.14 | | Queensland Police Service | | | 86 | |
3.15 | | Queensland Treasury | | | 89 | |
3.16 | | Regional Development, Manufacturing and Water | | | 90 | |
Capital Statement 2021-22
| | | | | | |
3.17 | | Resources | | | 98 | |
3.18 | | Seniors, Disability Services and Aboriginal and Torres Strait Islander Partnerships | | | 99 | |
3.19 | | State Development, Infrastructure, Local Government and Planning | | | 101 | |
3.20 | | Tourism, Innovation and Sport | | | 106 | |
3.21 | | Transport and Main Roads | | | 109 | |
| | | | | | |
Appendix A: | | Entities included in capital outlays 2021–22 | | | 129 | |
Appendix B: | | Key concepts and coverage | | | 132 | |
Appendix C: | | Capital purchases by entity by region 2021–22 | | | 133 | |
Capital Statement 2021-22
Features
| • | | The Queensland Government is committed to delivering productivity-enhancing economic and social infrastructure. This will support the economic recovery and unlock the productive capacity that will drive sustainable economic growth, increased employment and higher quality of life. |
| • | | The 2021–22 capital program will deliver jobs in the short term and economic growth over the long term. The capital investment delivered by this Budget builds on the Palaszczuk Government’s infrastructure commitments outlined in Queensland’s Economic Recovery Plan to support the state’s recovery from the impacts of COVID-19. |
| • | | This Budget continues to deliver on the Government’s $50 billion Infrastructure Guarantee, with total commitments of $52.216 billion over 4 years. These investments will be critical to lowering business input costs, as well as improving regional connectivity and access to essential services, such as health care and education. Over the 10 years to 2024–25, the government will have supported over $110 billion in infrastructure works. |
| • | | The capital program directly supports around 46,500 construction-related jobs in 2021–22, including 29,800 jobs outside of the Greater Brisbane region. |
| • | | In 2021–22, the government will invest $14.688 billion in capital across the state, including $6.902 billion in transformative transport infrastructure such as $1.517 billion to continue construction work on Cross River Rail and substantial ongoing investment to fund major upgrades to the M1 Pacific Motorway, the Bruce Highway and inland freight routes. |
| • | | Capital expenditure to support the delivery of health services is $1.352 billion in 2021–22. The government is providing $265 million to build 7 satellite hospitals to enable our acute hospitals to safely manage patients via alternative models of care across South East Queensland. The satellite hospitals will also provide virtual health opportunities including a range of rapid access consultations, care co-ordination, remote monitoring and patient literacy services. |
| • | | The government is also investing $283.7 million in 2021–22 as part of the $979 million Building Better Hospitals commitment. This program is a key priority to help address growing demand by enhancing public hospital capacity and services in the South East Queensland growth corridor. |
| • | | The government will invest $1.521 billion in 2021–22 to support students and teachers, and to ensure that Queensland’s state schools and training assets are world-class and continue to meet demand. Investment in new schools is being facilitated through the $2.6 billion Building Future Schools Program, while the $1 billion Great Schools, Great Future commitment is helping provide new classrooms and facilities at existing schools to meet growing enrolments. |
| • | | To help enhance the productive capacity of Queensland’s businesses, industries, communities and regions, the government will invest $2.745 billion in 2021–22 to |
1
Capital Statement 2021-22
| | maintain and upgrade energy and water assets to support the ongoing delivery of safe, secure, reliable and cost-effective energy and water across the state. |
| • | | Delivery of the Rookwood Weir will be co-funded with the Australian Government and will add up to 86,000 megalitres of extra water supply for the Central Queensland region. The project will grow agricultural production along the Fitzroy River and enhance the security of urban and industrial water supplies for Gladstone and Capricorn Coast centres. |
| • | | The government is committing $1.813 billion, including $502.6 million in 2021–22, to accelerate the supply of social housing and upgrade the existing social housing portfolio in line with the Queensland Housing Strategy 2017–2027, with 2,480 new homes either delivered or commenced and a further 6,365 to commence over the next 4 years. |
| • | | A key element of the government’s capital program is providing grants to local governments and non-government organisations to support their work within communities across Queensland. In total, the government will provide $2.082 billion in capital grants in 2021–22. This includes a new $200 million commitment to the government’s Works for Queensland program, which is supporting jobs and providing economic stimulus to local economies, and brings the total funding for this program to $1 billion. |
2
Capital Statement 2021-22
Consistent with the Queensland Government’s Economic Recovery Plan , the 2021–22 Capital Statement outlines the State’s investment in critical infrastructure across Queensland that will drive the ongoing economic recovery, deliver jobs in the short term, and improve productivity and business competitiveness over the long term.
The Capital Statement presents an overview of the Queensland Government’s proposed capital outlays for 2021–22 and articulates the State’s infrastructure delivery program.
The 2021–22 capital program will deliver productive infrastructure investment across a range of asset classes, regions and sectors. This includes major investments in roads and transport infrastructure, clean energy, water security, ports, as well as upgrades to major arts, sporting and entertainment venues.
Key programs such as Works for Queensland and Building our Regions will provide additional benefits to regional Queensland through direct funding for infrastructure and maintenance programs that support jobs.
The $14.688 billion of investment outlined in the 2021–22 Capital Statement is estimated to support around 46,500 jobs, with 29,800 of these jobs located outside of the Greater Brisbane region.
Importantly, maintaining a strong capital program will ensure Queensland’s economic recovery continues to gather momentum by building Queensland’s productive capacity to drive sustainable economic and employment growth, supporting a better quality of life for all Queenslanders.
3
Capital Statement 2021-22
| 1.2 | Capital planning and optimisation |
The Queensland Government’s well-established and coordinated infrastructure planning frameworks underpin the development of major capital investment.
These frameworks guide the delivery of a capital program that reflects the most appropriate, cost-effective approach to address the service needs and infrastructure challenges facing Queensland. They contribute to infrastructure investment that supports our recovery from the impacts of COVID-19, builds economic resilience and future prosperity, and advances the long-term objectives of the Government and its Economic Recovery Plan.
Key planning and optimisation elements of Queensland’s infrastructure framework include the State Infrastructure Strategy, the Queensland Government Infrastructure Pipeline, the Project Assessment Framework for evaluating investment proposals, the Business Case Development Framework which guides agencies through development of major infrastructure proposals, and the Queensland Transport and Roads Investment Program which forms a significant proportion of the capital program.
The Queensland Government Infrastructure Pipeline
The Queensland Government publishes a forward program of capital works, formerly known as the State Infrastructure Plan: Part B. This has evolved to become the Queensland Government Infrastructure Pipeline, which will detail the State’s forward program of capital works.
This will provide greater visibility of a credible pipeline of future opportunities to the State’s partners in the infrastructure industry.
State Infrastructure Strategy (SIS) and Regional Infrastructure Plans (RIPs)
The Queensland Government is committed to continually improving its approach to infrastructure planning to create prosperous communities, local jobs and more liveable, resilient regions and to attract private investment. With Queensland’s infrastructure needs transforming due to population growth, changing demographics, emerging technology, the impacts of COVID-19 and other factors, it presents an opportunity to develop a new SIS supported by 7 RIPs.
The SIS and RIPs will provide a clear vision for infrastructure in Queensland, build on Queensland’s Economic Recovery Plan, and respond to current and emerging challenges across Queensland. The RIPs will enable a more place-based approach that better reflects the unique strengths and opportunities of each region, provide confidence to industry to attract private sector investment and create local jobs.
Both the SIS and the RIPs are being developed through targeted engagement with key stakeholders who will help shape the future of Queensland. A draft SIS will be delivered in late 2021 with the RIPs to be delivered progressively from late 2021 into 2022.
Further details on the SIS and RIPs are available at https://www.statedevelopment.qld.gov.au/industry/infrastructure/infrastructure-planning-and-policy/state-infrastructure-strategy.
Project Assessment Framework (PAF)
The PAF is used across the Queensland Government to ensure a common and rigorous approach to assessing projects at critical stages in their development lifecycle.
4
Capital Statement 2021-22
Led and maintained by Queensland Treasury, the PAF is applied by government departments in the evaluation of infrastructure projects, public private partnerships and other proposals for the acquisition of services.
Further details on the PAF are available at https://www.treasury.qld.gov.au/.
Business Case Development Framework (BCDF)
The BCDF supports the implementation of the PAF by providing agencies with detailed guidance and tools to complete assessment and assurance of infrastructure proposals. The BCDF informs the progression of project proposals through the first 3 stages of the PAF: Stage 1 Strategic Assessment of Service Requirement, Stage 2 Preliminary Evaluation and Stage 3 Business Case Development. This ensures that major infrastructure proposals are thoroughly assessed to provide a firm basis for Government investment decisions. The BCDF reflects the guidance materials and templates established by the former Building Queensland and is maintained and supported by the Department of State Development, Infrastructure, Local Government and Planning.
Further details on the BCDF are available at
https://www.statedevelopment.qld.gov.au/industry/infrastructure.
Queensland Transport and Investment Program (QTRIP)
QTRIP is a 4-year program released annually outlining current and planned investments in transport infrastructure. QTRIP spans road, rail, bus, cycling and marine infrastructure on freight, commuter and recreational networks. QTRIP includes works for the Department of Transport and Main Roads, Queensland Rail and Gold Coast Waterways Authority.
The program of works detailed in QTRIP represents a $27.5 billion1 investment over the 4 financial years from 2021–22. QTRIP is developed in accordance with funding allocations identified by the Queensland Government and Australian Government in their annual budgets, which align to both governments’ policy objectives and agendas.
The strategic intent of QTRIP is shaped by state infrastructure planning processes (formerly State Infrastructure Plan, now the State Infrastructure Strategy) and specific transport strategies and plans developed in accordance with state legislation.
Further details on QTRIP are available at https://www.tmr.qld.gov.au/About-us/Corporate-information/Publications/Queensland-Transport-and-Roads-Investment-Program.
| 1 | Total QTRIP investment is inclusive of both non-capital and capital components. |
5
Capital Statement 2021-22
| 1.3 | Key capital projects and programs |
Cross River Rail
Cross River Rail, a $6.888 billion project fully funded by the Queensland Government, is the largest transport project ever undertaken in Queensland. A new 10.2 kilometre rail line from Dutton Park to Bowen Hills, involving 5.9 kilometres of twin tunnels under the Brisbane River and CBD, 4 new high-capacity underground stations (at Boggo Road, Woolloongabba, Albert Street and Roma Street), 8 rebuilt above-ground stations (at Salisbury, Rocklea, Moorooka, Yeerongpilly, Yeronga, Fairfield, Dutton Park and Exhibition), and 3 new stations on the Gold Coast make up this transformative transport project.
The project will also introduce a new world-class signalling system, the European Train Control System (ETCS), which will allow trains to operate closer together, enabling trains to run more efficiently and with greater safety.
The Cross River Rail project is being delivered in partnership with the private sector through 3 major infrastructure packages of work: Tunnel, Stations and Development (TSD) with Pulse Consortium through a public private partnership; Rail, Integration and Systems (RIS) through an alliance model with Unity Alliance; and the ETCS package contracted to Hitachi Rail.
Each of Cross River Rail’s high-capacity stations will generate unique opportunities for urban renewal, economic development, the revitalisation of inner-city precincts and new employment opportunities.
Cross River Rail is into the second year of major construction, with excavation of the twin tunnels by the project’s 2 tunnel boring machines having commenced from the Woolloongabba worksite in February 2021.
Cross River Rail is estimated to support up to 7,700 full-time equivalent jobs and 450 new apprenticeship and traineeship opportunities during construction.
M1 Pacific Motorway upgrades
A safe, efficient and reliable M1 Pacific Motorway plays an important role in driving productivity and competitiveness across South East Queensland. The program of works, jointly funded by the Queensland and Australian Governments, is delivering major projects, such as the Varsity Lakes to Tugun upgrade, Eight Mile Plains to Daisy Hill upgrade, and the Yatala South (Exit 41) and Pimpama (Exit 49) interchange upgrades.
The 10 kilometre section of the M1 Pacific Motorway between Varsity Lakes and Tugun will be widened from 2 to a minimum of 3 lanes in both directions. Works will include improvements to entry and exit ramps at Burleigh, Tallebudgera and Palm Beach as well as widening of Tallebudgera Creek and Currumbin Creek bridges. The construction works commenced in May 2020 and are expected to be complete by the end of 2023. The indicative total estimated cost for the project is $1 billion.
The 8 kilometre section of the M1 Pacific Motorway between Eight Mile Plains and Daisy Hill will be widened in both directions to increase traffic flow and reduce travel time. Works will also include an extension of the South East Busway from Eight Mile Plains to Springwood, a new bus station and park ‘n’ ride at Rochedale and completion of the V1 Cycleway. The total estimated cost of this project is $750 million.
6
Capital Statement 2021-22
The Queensland and Australian Governments have also committed $1 billion to upgrades between Daisy Hill and Logan Motorway.
The M1 program of works is complemented by the jointly funded $1.531 billion Coomera Connector (Stage 1) project between Nerang and Coomera.
Bruce Highway upgrades
The Bruce Highway is Queensland’s major north-south freight and commuter corridor, connecting coastal population centres from Brisbane to Cairns over a distance of almost 1,700 kilometres. The Queensland Government will continue to work with the Australian Government to deliver the Bruce Highway Upgrade Program, aimed at improving safety, flood resilience and capacity along its length.
The 2021–22 capital program includes investment in several key projects on the Bruce Highway, improving safety and access and supporting jobs across the regions, including:
| • | | $1.065 billion to plan, preserve and construct the Rockhampton Ring Road. |
| • | | $1 billion to construct Cooroy to Curra (Section D). |
| • | | $932.2 million to widen the highway from 4 to 6 lanes between Caloundra Road and Sunshine Motorway. |
| • | | $662.5 million to upgrade the highway from 4 to 6 lanes between Caboolture-Bribie Island Road and Steve Irwin Way. |
| • | | $514.3 million to construct bridges and approaches on the Haughton River Floodplain, south of Giru between Horseshoe Lagoon and Palm Creek. |
| • | | $500 million funding injection for the Bruce Highway, noting the Queensland Government’s priority for upgrades between Mackay and Proserpine, and between Gladstone and Rockhampton. |
| • | | $481 million to duplicate the highway from 2 to 4 lanes as part of the Cairns Southern Access Corridor (Stage 3), from Collinson Creek in Edmonton to the Wrights Creek area near Gordonvale. |
| • | | $301.3 million to upgrade the Bruce Highway at the Maroochydore Road and Mons Road interchanges. |
| • | | $230 million for the Townsville Ring Road (Stage 5) to duplicate the highway from 2 to 4 lanes between Vickers Bridge over Ross River and the Shaw Road interchange. |
| • | | $225 million for the Cairns Southern Access Corridor (Stage 5), Foster Road intersection upgrade. |
| • | | $163.3 million to upgrade the Bruce Highway at the Deception Bay Road interchange. |
| • | | $123.7 million to widen the highway from 4 to 6 lanes as part of the Cairns Southern Access Corridor (Stage 4), from Kate Street to Aumuller Street near the Port of Cairns and wharf precinct. |
Smithfield Bypass
The $164 million Smithfield Bypass project is a new bypass road to address congestion on the section of the Captain Cook Highway between McGregor Road and the intersection of Captain Cook Highway and the Cairns Western Arterial Road. A new bridge over Avondale Creek has
7
Capital Statement 2021-22
been completed. Major works are progressing to reconstruct the intersection of the Cairns Western Arterial Road and Captain Cook Highway to deliver a signalised T-intersection. Structural works for a new overpass bridge at McGregor Road roundabout have been completed, with remaining works continuing.
Rollingstock Expansion Program
To provide for expected increases in rail patronage over the next 10 years, the existing passenger fleet must expand to deliver extra services. The Department of Transport and Main Roads has commenced a Rollingstock Expansion Program with a $ 600 million commitment to procure 20 new 6-car passenger trains, which will be manufactured in the Maryborough region to support local jobs and regional supply chains, including in Rockhampton.
New Public Transport Ticketing System
The Queensland Government has committed $371.1 million for a new public transport ticketing system that will be delivered across public transport networks over a 4-year period. The system will add new customer facing functionality, including payment by contactless debit and credit cards, mobile phones and wearables, in addition to go card and paper tickets.
Building Better Hospitals
The Government’s Building Better Hospitals commitment is a key priority for Queensland Health which will help address growing demand by enhancing public hospital capacity and services in the South East Queensland growth corridor.
The program includes projects at 3 major South East Queensland hospitals with a combined value of $979 million:
| • | | Redevelopment of the Caboolture Hospital to support an additional 130 beds and refurbishment of critical clinical support services. |
| • | | Expansion of the Logan Hospital to deliver an additional 206 beds and treatment spaces, as well as expansion and refurbishment of the Logan Hospital Maternity Ward to provide additional inpatient beds, delivery rooms and special care nursery cots. |
| • | | Staged expansion of the Ipswich Hospital including new mental health facilities for adults and older persons, a 26-bed ward refurbishment, a Magnetic Resonance Imaging suite (delivered) to grow clinical capacity, and purchase of land and buildings from the Ipswich City Council to facilitate subsequent stages of the Ipswich Hospital Expansion program. |
Satellite Hospitals: Better Care, Closer to Home
The Government is providing $265 million in funding to deliver satellite hospitals to Bribie Island, Caboolture, Brisbane South, Pine Rivers, Gold Coast, Ipswich, and Redlands.
The Satellite Hospitals Program will enable our acute hospitals in South East Queensland to manage demand and free up capacity while continuing to safely manage patients via alternative models of care. The satellite hospitals will also provide virtual health opportunities including a range of rapid access consultations, care co-ordination, remote monitoring, and patient literacy services.
The final location and health services provided will be determined by the local Hospital and Health Services in consultation with the community. Planning for delivery of these hospitals is underway.
8
Capital Statement 2021-22
Building Future Schools
Through the $2.6 billion Building Future Schools Program, the Government is delivering new state schools in high-growth areas across Queensland, including 8 new schools which opened in 2020 and 5 new schools which opened in 2021. Three new schools are due to open in 2022 – primary schools in Caloundra South and North Maclean (Greenbank) and a special school in Coomera. This Budget includes $913.7 million for a further 10 new schools – 4 schools to open in 2023 (primary schools in Yarrabilba, Ripley and the Augustine Heights/Redbank Plains area, and a secondary school in Palmview) and 6 schools to open in 2024 (primary schools in Redland Bay, Bellbird Park and the Logan Reserve/Crestmead/Park Ridge area, and secondary schools in Springfield and the Collingwood Park/Redbank Plains and Logan Reserve/Park Ridge areas). A new primary school in Brisbane’s inner west is also due to open in 2024.
The Government’s $1 billion Great Schools, Great Future infrastructure commitment will provide existing Queensland schools with new classrooms and facilities to accommodate growing enrolments, new or upgraded school halls and performing arts centres, and renewal and refurbishment of school infrastructure, including fencing upgrades, outside school hours care upgrades, playgrounds and covered outdoor sports areas.
Housing and Homelessness Action Plan
The government is committing $1.908 billion over 4 years to support the Housing and Homelessness Action Plan 2021–25 which will be delivered as part of the Queensland Housing Strategy 2017–2027. A total of 2,480 new homes have been delivered or commenced under the strategy, with a further 6,365 new homes to commence over the next 4 years.
This includes $1.813 billion in capital funding and housing supply initiatives over 4 years to increase the supply of social housing and upgrade the existing social housing property portfolio. To support this, the Queensland Government has established a $1 billion Housing Investment Fund, a long-term fund that will deliver annual returns to support the ongoing delivery of social housing across the state. The Housing Investment Fund will provide the means to flexibly deliver projects and enable a mix of public housing, community housing, subsidised housing, homelessness accommodation, and mixed-use developments to be developed to support local need and site-specific opportunities.
Further details of this overall package can be found in the Budget Highlights section of the Department of Communities, Housing and Digital Economy Service Delivery Statement.
Building our Regions
Building our Regions supports local government infrastructure projects in regional Queensland communities that create flow-on economic development opportunities and jobs. These projects span Queensland from Torres Strait Island in the far north to Goondiwindi near the southern border, and from Boulia in the north west to Fraser Coast in the east. This includes a wide range of infrastructure project types which deliver enduring economic benefits and improved liveability in regional communities.
The Department of State Development, Local Government, Infrastructure and Planning is responsible for delivering Rounds 1-5 of the Building our Regions program, with approvals to date of $348.3 million in funding towards 264 infrastructure projects and 7 planning projects across 67 local governments in regional Queensland, supporting approximately 2,770 construction jobs.
9
Capital Statement 2021-22
This has leveraged further financial co-contributions of almost $539.3 million from local governments, the Australian Government and others, to create a total capital expenditure value of $887.6 million.
From 2021–22, a further $70 million in new funding will be provided to the Department of Regional Development, Manufacturing and Water to deliver Building Our Regions Round 6, bringing total funding for the program to $418.3 million.
Works for Queensland
The Works for Queensland program will be boosted with an additional $200 million to deliver on the Government’s election commitment over 6 years from 2021–22, bringing the total program funding to $1 billion. The program will support local governments outside South East Queensland by funding job-creating maintenance and minor infrastructure projects relating to assets owned or controlled by local governments.
In 2021–22, $148 million will be delivered towards Works for Queensland projects. As at 31 March 2021, councils have estimated more than 21,000 jobs being supported by the first 3 rounds of the program.
Disaster Resilience Program
As the most disaster impacted state in Australia, it is imperative to help local Queensland communities better prepare for future natural disasters. Increasing the resilience of infrastructure and investing in innovative programs to lessen the impacts of natural disasters means that communities can recover more quickly after a natural disaster strikes.
The Queensland Resilience and Risk Reduction Fund, as part of the National Partnership Agreement, jointly funded with the Australian Government will allocate $65.5 million over 5 years to improve safety and disaster resilience across the state. With $14.4 million to be delivered in 2021–22 to support disaster mitigation projects and build resilience to natural disasters. The fund will be administered by the Queensland Reconstruction Authority.
The Queensland Reconstruction Authority will also continue to administer a suite of targeted measures aimed at promoting disaster recovery and resilience from recent significant disaster events, including the $100 million Betterment Fund to improve the resilience of infrastructure damaged by the monsoon flooding event of early 2019 under the joint Australian Government-State Disaster Recovery Funding Arrangements. The programs are being delivered over 3 years to 2021–22.
Southern Queensland Correctional Precinct - Stage 2
$320 million of the $654 million total for the expansion of Southern Queensland Correctional Precinct is budgeted for 2021–22, with construction having commenced in early 2021. A number of major benefits will be achieved through the construction of a new 1,000 bed correctional centre, including the delivery of over 400 jobs in the region. During peak periods of construction it will support up to 900 jobs.
This new facility, with a therapeutic health-centred operating model, will help address substance addiction and mental health issues. Further, it will enable Queensland Corrective Services and Queensland Health to provide rehabilitation and treatment in a world-class correctional facility.
The new facility will ease overcrowding across Queensland’s correctional services system and deliver a safer environment for staff and the prison population.
10
Capital Statement 2021-22
Cairns Convention Centre
The Queensland Government is investing a total of $176 million in the refurbishment and expansion of the Cairns Convention Centre, including $172.2 million of capital expenditure. This investment ensures the existing centre remains a world-class venue that is ideal for business and community events.
The 10,000 square metre expansion includes a large undercover, tropically planted forecourt, expanded main entry lobby, new event spaces enabling the centre to host concurrent events and a multi-function space with external decks and spectacular views over Trinity Inlet.
The expanded centre will form a key infrastructure asset assisting with the post-COVID-19 recovery of the tourism industry in Cairns and far-north Queensland. The expansion is targeted for completion in the second half of 2022.
New Performing Arts Venue at the Queensland Performing Arts Centre (QPAC)
The Queensland Government has committed to deliver a new $175 million state-of -the-art theatre for Brisbane, investing $150 million over four years from 2018–19. This investment in a new theatre follows the recommendations of the detailed business case for a 1,500 seat theatre collocated with QPAC on the Playhouse Green site. The Queensland Performing Arts Trust will also contribute $25 million towards the new venue.
QPAC, which schedules over 1,300 performances annually, with a record 1.5 million people attending in 2017–18, was nearing full capacity, prior to COVID-19. This new venue will make QPAC the largest performing arts centre in Australia, with five venues and the potential to welcome an extra 300,000 visitors per year. This transformational infrastructure project will bolster Queensland’s cultural vibrancy, support the local arts sector and drive cultural tourism.
Construction of the new theatre is scheduled for completion at the end of 2022.
Stadiums and sport facilities
The government will continue the delivery of 3 stadiums across the state.
Harrup Park in Mackay will become a hub for marquee cricket and AFL events with Stage One of the development progressing. In South East Queensland, the Ballymore Precinct will undergo a major redevelopment transforming it into a home for the National Rugby Training Centre, women’s rugby, the Pacific Pathways Program, Queensland Reds and Queensland Rugby Union and a mid-tier venue for other local sporting teams. $20 million has been allocated to these projects in 2021–22.
On the Sunshine Coast $20 million has been allocated to the redevelopment of the Sunshine Coast Stadium at Bokarina. This funding is subject to federal government funding.
$48 million is allocated in 2021–22 to support local sport and recreation and community organisations to improve facilities to increase participation, in alignment with the Activate! Queensland 2019–2029 strategy. Capital improvement works at Queensland Government venues will also continue with $17 million to finalise works at the 3 Queensland Active Precincts as identified under this strategy.
CleanCo’s Karara Wind Farm
In 2020, Queensland’s publicly-owned clean energy generator, CleanCo, announced it will build, own, and operate the $250 million 102.6MW Karara Wind Farm in the Darling Downs. Karara is
11
Capital Statement 2021-22
part of the 1,026MW MacIntyre Wind Farm Precinct being developed by Acciona Australia, with a project value of around $2 billion. In addition to owning and operating the Karara Wind Farm, CleanCo will purchase 400 megawatts of renewable energy capacity from the MacIntyre Wind Farm, delivering the Government’s Renewables 400 program.
Construction of the precinct is expected to commence in 2021–22 and be fully operational by 2024. The precinct is set to provide up to 400 local jobs during construction, with an additional 240 jobs for construction of the 64km transmission line, and 14 full-time jobs once in operation. Together with CleanCo’s involvement, the local spend during construction is expected to exceed $500 million, delivering significant economic benefits for the Darling Downs region.
CleanCo’s announcement is an historic achievement for Queensland and demonstrates the government’s ongoing commitment to renewable generation in Queensland.
Port of Townsville Channel Capacity Upgrade
The Townsville Channel Capacity Upgrade (TCCU), which commenced in 2019–20, has continued with the completion of 2.2 kilometres of protective rock wall where dredged material from the channel widening will be placed. This forms the boundary of a new reclamation area, providing an additional 62 hectares of land for port operations. The TCCU, the largest infrastructure project in the port’s history, will widen the shipping channel to allow access for larger vessels and facilitate future trade growth in the region.
The TCCU project is jointly funded by the Queensland and Australian Governments and the Port of Townsville Limited (POTL), and forms part of the Townsville City Deal signed in December 2016. The total project cost of the TCCU project is $232 million with the Queensland Government contributing $105 million, the Australian Government committing $75 million and POTL funding the remainder.
The TCCU project remains on track for completion by 2024 and will continue to support the local economy and jobs, with the detailed business case estimating 120 jobs would be supported during construction and 245 jobs after construction.
Cairns Marine Precinct investment
The government has committed $30 million for capital works to upgrade facilities at the Ports North-owned Cairns Marine Precinct and fund a business case for the future development of the precinct. The investment, which is forecast to deliver up to 150 new jobs during construction, will help diversify the Cairns economy and take advantage of emerging defence-related opportunities for the precinct as an Australian Navy Regional Maintenance Centre. This will ensure that the Port of Cairns continues to be the leading maintenance, repair and overhaul facility in Northern Australia.
The business case and port master planning work, expected to be completed in the second half of 2021, are vital steps in determining long-term infrastructure requirements. Total capital infrastructure expenditure of up to $150 million may be required and future contributions from the Australian Government will be sought.
Haughton Pipeline – Stage 2
The Queensland Government will contribute $195 million to the Townville City Council for Stage 2 of the Haughton Pipeline, which will connect to earlier stages of the project and ultimately improve water security for the region.
12
Capital Statement 2021-22
This project will also provide much needed economic stimulus by supporting hundreds of full-time equivalent jobs for the region.
Rookwood Weir
Sunwater and its construction partners have identified an opportunity to raise the crest height of the Rookwood Weir, adding up to 86,000 megalitres of supply to Central Queensland. Supported and co-funded by the Queensland and Australian Governments, the project will provide for significant agricultural growth along the Fitzroy River near Rockhampton and enhance the security of urban and industrial water supplies for Gladstone and Capricorn Coast communities.
Early works for construction of the weir commenced in November 2020 and in-river works commenced in April 2021. The weir is due to be completed by mid-2023, weather permitting. In parallel, road upgrades to Thirsty Creek Road and the Capricorn Highway at the Gogango Intersection were completed last year, and the new Riverslea Bridge was completed this year and has recently been handed over to the Rockhampton Regional Council.
The market response to the first stage of the water sale tender process (completed by Sunwater in December 2020) was strong and resulted in contracts for 30,000 megalitres of water for agricultural use. Additional tender processes will be held in 2022 for the remaining agricultural water.
The project has created over 100 regional jobs to date, including through essential road and bridge upgrades that support the project. The construction of the weir itself is expected to provide a further 200 jobs, with 140 of those jobs sourced locally and apprentices and trainees are expected to make up 15 per cent of construction hours.
The Queensland Government’s funding commitment toward this critical piece of water infrastructure for Central Queensland is $183.6 million. This commitment has been matched by the Australian Government which is co-funding the project under the National Water Infrastructure Development Fund.
Dam Improvement Program
Dams play a vital role in Queensland’s water supply. Both Sunwater and Seqwater are delivering Dam Improvement Programs (DIP) to ensure their dams continue to operate safely during extreme weather events.
Sunwater and Seqwater have budgeted over $30 million for DIP projects in 2021–22, including for construction activities and early project planning work. These projects will ensure Queensland dams meet required safety standards, deliver significant investment into the Queensland economy and support jobs.
DIP projects scheduled to be completed in 2021–22 include the Ewen Maddock Dam Upgrade Stage 2A and Paradise Dam Essential Works.
In 2021–22, Sunwater and Seqwater will continue to progress detailed business cases, investigating upgrade options for Somerset Dam, Paradise Dam and Burdekin Falls Dam. The Burdekin Falls Dam business case will also investigate the feasibility and demand for raising the dam to support economic growth in the region.
13
Capital Statement 2021-22
South West Pipeline
The $95.2 million South West Pipeline is a 27-kilometre pipeline that will connect Beaudesert to the South East Queensland Water Grid and further improve long term water security for the Scenic Rim.
The South West Pipeline is the second stage of the Beaudesert Water Supply Upgrade, building on the improvements to the Beaudesert Water Treatment Plant which were completed in 2020.
Construction of the South West Pipeline is expected to be completed in late 2022. It will be the biggest addition to the SEQ Water Grid since completion of the Northern Pipeline Interconnector in 2012.
Southern Downs Drought Resilience Package
The Queensland Government is funding critical infrastructure to address the water security of the Southern Downs region, which continues to experience prolonged drought conditions.
As part of a total commitment of $19.3 million towards critical works to extend Warwick’s water supply over the next 2 years, the 2021–22 Budget outlines capital expenditure of $8.1 million for Seqwater to undertake preparatory work for the Toowoomba to Warwick Pipeline, and $7.6 million to construct new groundwater bores, upgrade critical infrastructure and unlock new water sources to extend the existing supply.
14
Capital Statement 2021-22
| 2 | 2021-22 Capital program overview |
In this Budget, the Queensland Government has allocated a total of $14.688 billion in 2021–22 to provide productivity-enhancing economic infrastructure, essential social infrastructure and a broad range of capital works projects and programs across the state.
This investment will help create jobs, support Queensland businesses and grow the economy, including in Queensland’s vital regional areas. The 2021–22 capital program is estimated to directly support around 46,500 jobs across the state.
The 2021–22 capital works program comprises $12.606 billion of purchases of non-financial assets (PNFA) and acquisitions of non-financial assets under finance leases, and $2.082 billion of capital grants expenses.
Importantly, the 2021–22 capital program also demonstrates the government’s commitment to rebuilding and growing the state’s regions, with $8.987 billion, or around 61.2% of the capital program in 2021–22 to be spent outside of the Greater Brisbane region (Brisbane and Redlands, Logan and Ipswich), supporting an estimated 29,800 jobs across those regions.
The Government’s capital program includes a range of critical infrastructure projects in the port, rail, water and energy sectors being delivered through the state’s Public Non-financial Corporations (PNFC) sector (that is, commercial entities of government, including government-owned corporations).
Capital purchases by the PNFC sector in 2021–22 total $3.7 billion and almost one quarter of the total capital program.
15
Capital Statement 2021-22
The Queensland Government is continuing to provide the essential economic and social infrastructure needed to support economic growth, deliver essential services and ensure ongoing improvements in the quality of life enjoyed by Queensland’s growing population.
The 2021–22 capital program is comprised of $12.606 billion of PNFA and acquisitions of non-financial assets under finance leases.
Capital purchases in 2021–22, categorised according to purpose, are outlined in Chart 1. Transport continues to account for the largest share of purchases, followed by energy, health, housing and community services, and education and training.
| Chart 1 | Capital purchases by purpose 2021–22 |
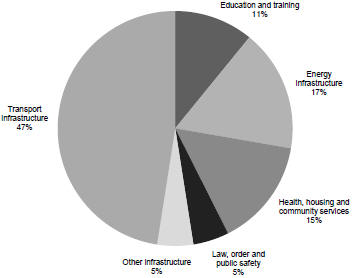
16
Capital Statement 2021-22
Table 2 outlines the capital purchases by Queensland Government entity, including the 2020–21 year (estimated actual) and the Budget for 2021–22. Transport and Main Roads has the largest proportion of total capital purchases.
| Table 1 | Capital purchases by Queensland Government entity1,2 |
| | | | | | | | |
Entity | | 2020–21
Est. Actual
$‘000 | | | 2021–22
Budget
$‘000 | |
Agriculture and Fisheries | | | 21,381 | | | | 26,025 | |
Children, Youth Justice and Multicultural Affairs | | | 111,458 | | | | 41,131 | |
Communities, Housing and Digital Economy | | | 428,518 | | | | 442,743 | |
Education | | | 1,191,005 | | | | 1,446,629 | |
Employment, Small Business and Training | | | 124,019 | | | | 77,688 | |
Energy and Public Works | | | | | | | | |
Energy and Public Works | | | 156,011 | | | | 134,416 | |
Energy Generation Sector | | | 435,668 | | | | 473,001 | |
Energy Transmission and Distribution | | | 1,772,558 | | | | 1,775,379 | |
Environment and Science | | | 95,740 | | | | 57,243 | |
Justice and Attorney-General | | | 38,454 | | | | 34,714 | |
Legislative Assembly of Queensland | | | 13,253 | | | | 7,882 | |
Premier and Cabinet | | | 183 | | | | 860 | |
Public Safety Business Agency | | | 27,251 | | | | — | |
Queensland Corrective Services | | | 106,379 | | | | 364,247 | |
Queensland Fire and Emergency Services | | | 65,653 | | | | 58,702 | |
Queensland Health3 | | | 1,473,329 | | | | 1,351,814 | |
Queensland Police Service | | | 148,235 | | | | 156,057 | |
Queensland Treasury | | | 791 | | | | — | |
Regional Development, Manufacturing and Water | | | | | | | | |
Regional Development, Manufacturing and Water | | | 43,275 | | | | 142,600 | |
Water Distribution and Supply | | | 288,013 | | | | 328,498 | |
Resources | | | 85,442 | | | | 12,140 | |
Seniors, Disability Services and Aboriginal and Torres Strait Islander Partnerships | | | 13,015 | | | | 7,572 | |
State Development, Infrastructure, Local Government and Planning | | | 81,291 | | | | 90,583 | |
Tourism, Innovation and Sport | | | 75,050 | | | | 51,378 | |
Transport and Main Roads | | | | | | | | |
Transport and Main Roads | | | 3,618,829 | | | | 3,763,888 | |
Port Authorities | | | 224,436 | | | | 244,188 | |
Queensland Rail | | | 774,817 | | | | 900,417 | |
Cross River Rail Delivery Authority | | | 1,351,005 | | | | 1,512,914 | |
Other agencies4 | | | 22,410 | | | | 4,250 | |
Other adjustments5 | | | 9,347 | | | | 249,114 | |
Anticipated contingency reserve6 | | | (700,000 | ) | | | (1,150,000 | ) |
| | | | | | | | |
Total Capital Purchases | | | 12,096,816 | | | | 12,606,073 | |
| | | | | | | | |
17
Capital Statement 2021-22
| | | | | | | | |
Total Capital Purchases Breakdown | | 2020–21
Est. Actual
$‘000 | | | 2021–22
Budget
$‘000 | |
Consisting of: | | | | | | | | |
Purchases of non-financial assets per Non-financial Public Sector Cash | | | | | | | | |
Flow Statement (BP2 Table 10.9) | | | 10,455,542 | | | | 11,512,925 | |
New finance leases | | | 1,641,274 | | | | 1,093,148 | |
| | | | | | | | |
Total Capital Purchases | | | 12,096,816 | | | | 12,606,073 | |
| | | | | | | | |
Notes:
| 1. | Includes all associated statutory bodies. |
| 2. | Numbers may not add due to rounding. |
| 3. | Queensland Health’s 2020–21 estimated actual expenditure includes $532.1 million which relates to the lease recognition of the Herston Surgical, Treatment and Rehabilitation Service project under the accounting standards and does not reflect a cash capital purchase. |
| 4. | Includes other government entities with non-material capital programs. |
| 5. | Representing inter-agency eliminations, movements in capital payable and receivable, funds held centrally and other accounting adjustments to align with Uniform Presentation Framework Statements. |
| 6. | Contingency recognises that on a whole-of-government basis, there is likely to be under spending, resulting in a carry-over of capital allocations. |
18
Capital Statement 2021-22
Table 2 shows capital purchases by Regional Action Plan (RAP) region and statistical area. The government’s commitment to supporting growth in Queensland’s vital regional areas is highlighted by the fact that $5.21 billion (around 59%) of capital purchases in 2021-22 will be spent outside of Greater Brisbane (Brisbane and Redlands, Logan and Ipswich).
| Table 2 | Capital purchases by RAP region and statistical area for 2021–221,2 |
| | | | | | | | | | | | | | |
Regional Action Plan Region | | Capital
Purchases
$‘000 | | | Statistical
Area | | Capital
Purchases
$‘000 | |
Brisbane and Redlands | | | 3,753,772 | | | | 301 | | | Brisbane East | | | 275,823 | |
| | | | | | | 302 | | | Brisbane North | | | 317,590 | |
| | | | | | | 303 | | | Brisbane South | | | 536,844 | |
| | | | | | | 304 | | | Brisbane West | | | 214,868 | |
| | | | | | | 305 | | | Inner Brisbane | | | 2,408,647 | |
Ipswich | | | 869,917 | | | | 310 | | | Ipswich | | | 869,917 | |
Wide Bay | | | 772,876 | | | | 319 | | | Wide Bay | | | 772,876 | |
Darling Downs | | | 593,950 | | | | 307 | | | Darling Downs Maranoa | | | 402,155 | |
| | | | | | | 317 | | | Toowoomba | | | 191,795 | |
Gold Coast | | | 1,131,454 | | | | 309 | | | Gold Coast | | | 1,131,454 | |
Logan | | | 607,036 | | | | 311 | | | Logan Beaudesert | | | 607,036 | |
Mackay | | | 573,313 | | | | 312 | | | Mackay | | | 573,313 | |
Outback Qld3 | | | 534,730 | | | | 315 | | | Outback | | | 568,981 | |
Far North Qld3 | | | 825,057 | | | | 306 | | | Cairns | | | 790,806 | |
Central Qld | | | 882,602 | | | | 308 | | | Central Qld | | | 882,602 | |
Sunshine Coast | | | 614,962 | | | | 316 | | | Sunshine Coast | | | 614,962 | |
Moreton Bay | | | 758,575 | | | | 313 | | | Moreton Bay North | | | 509,618 | |
| | | | | | | 314 | | | Moreton Bay South | | | 248,957 | |
Townsville | | | 687,829 | | | | 318 | | | Townsville | | | 687,829 | |
| | | | | | | | | | | | | | |
Total Capital Purchases | | | | | | | | | | | | | 12,606,073 | |
| | | | | | | | | | | | | | |
Notes:
| 1. | Numbers may not add due to rounding. |
| 2. | The anticipated capital contingency reserve and other adjustments have been spread across statistical areas proportionate to capital spends. |
| 3. | $34,251,000 capital purchases in Outback statistical area belongs to the Far North Qld region. |
19
Capital Statement 2021-22
The Queensland Government provides grants for capital purposes to a range of organisations and private individuals.
Total capital grants are expected to be $2.082 billion in 2021–22, with Chart 2 below outlining the capital grants to local governments (LG) and non-government organisations (NGOs).
| Chart 2 | Capital grants by purpose and recipient |
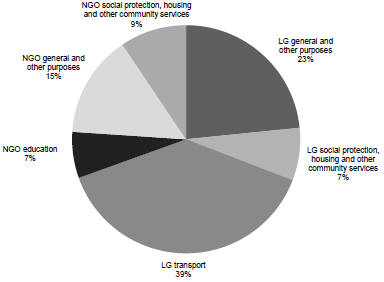
20
Capital Statement 2021-22
Table 3 shows the planned expenditure on capital grants by Queensland Government entity for 2021–22. The Department of State Development, Infrastructure, Local Government and Planning has the highest proportion of capital grants.
| Table 3 | Expenditure on capital grants by Queensland Government entity1,2 |
| | | | | | | | |
Entity | | 2020–21
Est. Actual
$‘000 | | | 2021–22
Budget
$‘000 | |
Agriculture and Fisheries | | | 500 | | | | 1,500 | |
Children, Youth Justice and Multicultural Affairs | | | — | | | | 3,500 | |
Communities, Housing and Digital Economy | | | 106,645 | | | | 185,330 | |
Education | | | 103,585 | | | | 140,838 | |
Employment, Small Business and Training | | | 32,400 | | | | 34,616 | |
Environment and Science | | | 2,835 | | | | 3,848 | |
Premier and Cabinet | | | 1,000 | | | | 11,300 | |
Queensland Fire and Emergency Services | | | 897 | | | | 897 | |
Queensland Treasury | | | 176,842 | | | | 122,700 | |
Regional Development, Manufacturing and Water | | | 27,415 | | | | 28,000 | |
Resources | | | 45,237 | | | | — | |
Seniors, Disability Services and Aboriginal and Torres Strait Islander Partnerships | | | 918 | | | | 5,605 | |
State Development, Infrastructure, Local Government and Planning | | | 761,046 | | | | 1,009,386 | |
Tourism, Innovation and Sport | | | 142,049 | | | | 138,938 | |
Transport and Main Roads | | | | | | | | |
Transport and Main Roads | | | 330,079 | | | | 476,397 | |
Cross River Rail Delivery Authority | | | — | | | | 4,180 | |
Other agencies | | | 1,559 | | | | 1,000 | |
Other adjustments3 | | | 33,016 | | | | 39,562 | |
Anticipated contingency reserve | | | — | | | | (125,735 | ) |
| | | | | | | | |
Total capital grants | | | 1,766,023 | | | | 2,081,862 | |
| | | | | | | | |
Notes:
| 1. | Includes associated statutory bodies. |
| 2. | Numbers may not add due to rounding. |
| 3. | Includes assets transferred, funds held centrally and other technical accounting adjustments. |
21
Capital Statement 2021-22
Table 4 shows expenditure on capital grants by RAP region and statistical area. The government’s commitment to support growth in Queensland’s vital regional areas is highlighted by the fact that $1.612 billion (around 77.4%) of capital grants in 2021–22 will be spent outside of Greater Brisbane (Brisbane and Redlands, Logan and Ipswich).
| Table 4 | Capital grants by RAP region and statistical area for 2021–221,2 |
| | | | | | | | | | | | | | |
Regional Action Plan Region | | Grants
$‘000 | | | Statistical Area | | Grants
$‘000 | |
Brisbane and Redlands | | | 305,311 | | | | 301 | | | Brisbane East | | | 51,250 | |
| | | | | | | 302 | | | Brisbane North | | | 43,884 | |
| | | | | | | 303 | | | Brisbane South | | | 79,918 | |
| | | | | | | 304 | | | Brisbane West | | | 33,343 | |
| | | | | | | 305 | | | Inner Brisbane | | | 96,916 | |
Ipswich | | | 83,948 | | | | 310 | | | Ipswich | | | 83,948 | |
Wide Bay | | | 110,576 | | | | 319 | | | Wide Bay | | | 110,576 | |
Darling Downs | | | 168,941 | | | | 307 | | | Darling Downs Maranoa | | | 132,709 | |
| | | | | | | 317 | | | Toowoomba | | | 36,232 | |
Gold Coast | | | 131,589 | | | | 309 | | | Gold Coast | | | 131,589 | |
Logan | | | 80,848 | | | | 311 | | | Logan Beaudesert | | | 80,848 | |
Mackay | | | 98,614 | | | | 312 | | | Mackay | | | 98,614 | |
Outback Qld3 | | | 237,069 | | | | 315 | | | Outback | | | 404,483 | |
Far North Qld3 | | | 337,921 | | | | 306 | | | Cairns | | | 170,507 | |
Central Qld | | | 90,198 | | | | 308 | | | Central Qld | | | 90,198 | |
Sunshine Coast | | | 114,671 | | | | 316 | | | Sunshine Coast | | | 114,671 | |
Moreton Bay | | | 96,926 | | | | 313 | | | Moreton Bay North | | | 54,515 | |
| | | | | | | 314 | | | Moreton Bay South | | | 42,411 | |
Townsville | | | 225,250 | | | | 318 | | | Townsville | | | 225,250 | |
| | | | | | | | | | | | | | |
Total Capital Grants | | | | | | | | | | | | | 2,081,862 | |
| | | | | | | | | | | | | | |
Notes:
| 1. | Numbers may not add due to rounding. |
| 2. | The adjustments referred to in Table 4 have been spread across statistical areas proportionate to allocation of grants. |
| 3. | $167,414,000 capital grants in Outback statistical area belongs to the Far North Qld region. |
Chart 3 shows the distribution of the total 2021–22 capital program (capital purchases and capital grants) across the geographical regions of Queensland, as classified for Budget Paper 3 purposes.
22
Capital Statement 2021-22
Chart 3 Map of 2021–22 capital program by Queensland regions
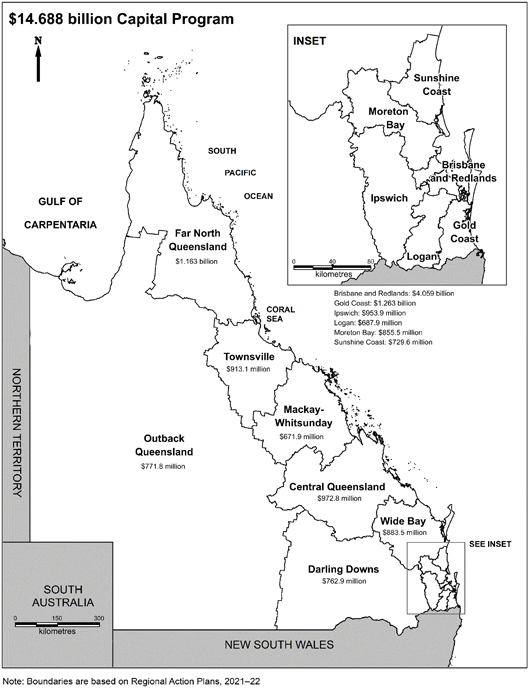
23
Capital Statement 2021-22
| 3 | Capital outlays by entity |
| 3.1 | AGRICULTURE AND FISHERIES |
Department of Agriculture and Fisheries
Capital purchases and grants for the Department of Agriculture and Fisheries, reporting to the Minister for Agricultural Industry Development and Fisheries and Minister for Rural Communities are $25.2 million for 2021-22. The department’s capital program is focused on developing and upgrading research facilities to deliver outcomes for agriculture, biosecurity, fisheries and forestry.
The department has facilities located throughout rural and regional Queensland. These require continual minor works, mechanical items and plant equipment upgrades to keep them operating effectively.
Program Highlights (Property, Plant and Equipment)
| • | | $5.6 million to continue upgrades to the department’s research and operational facilities through the research facilities development, scientific equipment and minor works programs. |
| • | | $4.7 million to finalise long-term decisions on the future of assets formerly held by the Queensland Agricultural Training Colleges, including a new Central Queensland Smart Cropping Centre at Emerald. |
| • | | $2 million for new and replacement heavy plant and equipment including trucks, tractors, irrigators, all-terrain vehicles and other machinery. |
| • | | $1.2 million to upgrade infrastructure and equipment to support horticulture productivity and profitability. |
| • | | $954,000 million to continue to upgrade and refurbish existing facilities at Toowoomba, which will enhance service delivery and improve operational efficiency. |
| • | | $816,000 to continue to replace vessels and marine equipment for fisheries research and regulatory functions. |
| • | | $790,000 to continue to upgrade of fruit handling laboratories enabling scientists to provide research services to the expanding and new horticultural industries at Mareeba. |
| • | | $418,000 to continue the mid-life refit of the Queensland Boating and Fisheries Patrol vessel the KI Ross. |
24
Capital Statement 2021-22
Program Highlights (Capital Grants)
| • | | $1 million to finalise long-term decisions on the future of assets formerly held by the Queensland Agricultural Training Colleges. |
| • | | $500,000 is provided as a contribution towards the upgrade of adoption facilities at the Young Animal Protection Society in Cairns. |
Queensland Racing Integrity Commission
Capital purchases for the Queensland Racing Integrity Commission, reporting to the Minister for Local Government, Minister for Racing and Minister for Multicultural Affairs are $2.3 million for 2021-22.
Program Highlights (Property, Plant and Equipment)
| • | | $1.1 million for software upgrades to the licensing system and laboratory information management system. |
| • | | $908,000 for upgrades to laboratory equipment to support drug testing services. |
| • | | $300,000 for other technical equipment replacements. |
Agriculture and Fisheries
| | | | | | | | | | | | | | | | | | | | |
Project | | Statistical
Area | | | Total
Estimated
Cost
$‘000 | | | Expenditure
to
30-06-21
$‘000 | | | Budget
2021-22
$‘000 | | | Post
2021-22
$‘000 | |
DEPARTMENT OF AGRICULTURE AND FISHERIES | | | | | | | | | | | | | | | | | | | | |
Property, Plant and Equipment | | | | | | | | | | | | | | | | | | | | |
Assets formerly held by Queensland | | | 308 | | | | 5,850 | | | | | | | | 4,650 | | | | 1,200 | |
Agricultural Training Colleges | | | | | | | | | | | | | | | | | | | | |
Computer equipment | | | 305 | | | | | | | | | | | | 4,290 | | | | Ongoing | |
Scientific equipment | | | Various | | | | | | | | | | | | 2,242 | | | | Ongoing | |
Heavy plant and equipment | | | Various | | | | | | | | | | | | 2,031 | | | | Ongoing | |
Research facilities development | | | Various | | | | | | | | | | | | 1,957 | | | | Ongoing | |
Other property, plant and equipment | | | Various | | | | | | | | | | | | 2,372 | | | | Ongoing | |
Minor works | | | Various | | | | | | | | | | | | 1,356 | | | | Ongoing | |
Smart Farms Initiative | | | 310 | | | | 2,000 | | | | | | | | 1,200 | | | | 800 | |
Upgrade and refurbishment of
existing facilities in Toowoomba | | | 317 | | | | 13,572 | | | | 12,346 | | | | 954 | | | | 272 | |
Vessels and marine equipment | | | Various | | | | | | | | | | | | 816 | | | | Ongoing | |
Upgrade to Mareeba research facility | | | 306 | | | | 890 | | | | 100 | | | | 790 | | | | | |
Mid-life refit of the patrol vessel KI
Ross | | | 302 | | | | 1,633 | | | | 1,215 | | | | 418 | | | | | |
Ecosciences and Health and Food
Sciences Precincts fitout | | | 303 | | | | | | | | | | | | 325 | | | | Ongoing | |
25
Capital Statement 2021-22
| | | | | | | | | | | | | | | | | | |
Project | | Statistical
Area | | Total
Estimated
Cost
$‘000 | | | Expenditure
to
30-06-21
$‘000 | | | Budget
2021-22
$‘000 | | | Post
2021-22
$‘000 | |
Software purchases and
development | | 305 | | | | | | | | | | | 300 | | | | Ongoing | |
| | | | | | | | | | | | | | | | | | |
Total Property, Plant and Equipment | | | | | | | | | | | | | 23,701 | | | | | |
| | | | | | | | | | | | | | | | | | |
Capital Grants | | | | | | | | | | | | | | | | | | |
Assets formerly held by Queensland
Agricultural Training Colleges | | 308 | | | 4,000 | | | | | | | | 1,000 | | | | 3,000 | |
Young Animal Protection Society
capital grant | | 306 | | | 1,000 | | | | 500 | | | | 500 | | | | | |
| | | | | | | | | | | | | | | | | | |
Total Capital Grants | | | | | | | | | | | | | 1,500 | | | | | |
| | | | | | | | | | | | | | | | | | |
QUEENSLAND RACING INTEGRITY COMMISSION | | | | | | | | | | | | | | | | | | |
Property, Plant and Equipment | | | | | | | | | | | | | | | | | | |
Racing Science Centre laboratory
technology upgrades | | 305 | | | | | | | | | | | 908 | | | | Ongoing | |
Registration and licensing
environment | | 305 | | | 3,595 | | | | 2,595 | | | | 800 | | | | 200 | |
Other asset replacement | | Various | | | | | | | | | | | 300 | | | | Ongoing | |
Laboratory Information Management
System | | 305 | | | 316 | | | | | | | | 316 | | | | | |
| | | | | | | | | | | | | | | | | | |
Total Property, Plant and Equipment | | | | | | | | | | | | | 2,324 | | | | | |
| | | | | | | | | | | | | | | | | | |
| | | | | |
TOTAL AGRICULTURE AND FISHERIES (PPE) | | | | | | | | | | | | | 26,025 | | | | | |
| | | | | | | | | | | | | | | | | | |
| | | | | |
TOTAL AGRICULTURE AND FISHERIES (CG) | | | | | | | | | | | | | 1,500 | | | | | |
| | | | | | | | | | | | | | | | | | |
26
Capital Statement 2021-22
| 3.2 | CHILDREN, YOUTH JUSTICE AND MULTICULTURAL AFFAIRS |
Department of Children, Youth Justice and Multicultural Affairs
The capital works program for the Department of Children, Youth Justice and Multicultural Affairs is $41.1 million in 2021-22. These funds provide the infrastructure and systems to support children, young people and families to be safe and help prevent and respond to crime, violence, abuse and neglect.
Total capital grants for the portfolio are $3.5 million. These funds seek to improve outcomes for people from culturally and linguistically diverse backgrounds and assist in building safe, caring and connected communities.
Program Highlights (Property, Plant and Equipment)
| • | | $16.3 million in 2021-22 of a total $150 million to complete the construction of West Moreton Youth Detention centre—a new 32 bed youth detention centre at Wacol. |
| • | | $9.5 million to conduct ongoing program renewal and minor works to Youth Detention centres and Youth Justice service centres. |
| • | | $5.8 million to fit out and upgrade office accommodation and Child Safety service centres to better manage service demands, population growth and make the most effective use of resources. |
| • | | $4.5 million in 2021-22 of a total $5 million for a short term remand centre. |
| • | | $2 million to enhance and develop information systems and ICT programs to provide additional system functionality, information security, and provide contemporary technology to improve service delivery. |
| • | | $1.6 million to upgrade Small Group Homes, Therapeutic Residential Care Homes and Child Safe Houses to accommodate legislative requirements or fit for purpose improvements. |
| • | | $1.5 million for annual essential capital replacement to replace IT infrastructure that is at end of life. |
Program Highlights (Capital Grants)
| • | | $3.5 million capital grant contribution to establish a Holocaust Museum and Education Centre in Brisbane to honour victims of the Holocaust and support students and the broader community to explore and understand the impact of racism. |
27
Capital Statement 2021-22
| | | | | | | | | | | | | | | | | | | | |
| Children, Youth Justice and Multicultural Affairs | | | | |
Project | | Statistical
Area | | | Total
Estimated
Cost
$‘000 | | | Expenditure
to 30-06-21
$‘000 | | | Budget
2021-22
$‘000 | | | Post
2021-22
$‘000 | |
DEPARTMENT OF CHILDREN, YOUTH JUSTICE AND MULTICULTURAL AFFAIRS | | | | | |
Property, Plant and Equipment | | | | | | | | | | | | | | | | | | | | |
Youth Justice Services
| | | | | | | | | | | | | | | | | | | | |
West Moreton Youth Detention | | | 310 | | | | 150,000 | | | | 133,738 | | | | 16,262 | | | | | |
Centre - 32 bed construction project | | | | | | | | | | | | | | | | | | | | |
Youth Justice facilities | | | Various | | | | | | | | | | | | 9,546 | | | | Ongoing | |
Short term remand centre | | | 316 | | | | 5,000 | | | | 500 | | | | 4,500 | | �� | | | |
| | | | | | | | | | | | | | | | | | | | |
Sub-total Youth Justice Services | | | | | | | | | | | | | | | 30,308 | | | | | |
| | | | | | | | | | | | | | | | | | | | |
Child and Family Services | | | | | | | | | | | | | | | | | | | | |
Office accommodation and Child Safety service centres | | | Various | | | | | | | | | | | | 5,783 | | | | Ongoing | |
Residential care facilities | | | Various | | | | | | | | | | | | 1,580 | | | | Ongoing | |
| | | | | | | | | | | | | | | | | | | | |
Sub-total Child and Family Services | | | | | | | | | | | | | | | 7,363 | | | | | |
| | | | | | | | | | | | | | | | | | | | |
Information, Innovation and Recovery | | | | | | | | | | | | | | | | | | | | |
Information system enhancements | | | Various | | | | | | | | | | | | 2,000 | | | | Ongoing | |
Information technology | | | Various | | | | | | | | | | | | 1,460 | | | | Ongoing | |
infrastructure replacement | | | | | | | | | | | | | | | | | | | | |
| | | | | | | | | | | | | | | | | | | | |
Sub-total Information, Innovation and Recovery | | | | | | | | | | | | | | | 3,460 | | | | | |
| | | | | | | | | | | | | | | | | | | | |
Total Property, Plant and Equipment | | | | | | | | | | | | | | | 41,131 | | | | | |
| | | | | | | | | | | | | | | | | | | | |
Capital Grants | | | | | | | | | | | | | | | | | | | | |
Multicultural Affairs | | | | | | | | | | | | | | | | | | | | |
Holocaust Museum | | | 305 | | | | 3,500 | | | | | | | | 3,500 | | | | | |
| | | | | | | | | | | | | | | | | | | | |
Total Capital Grants | | | | | | | | | | | | | | | 3,500 | | | | | |
| | | | | | | | | | | | | | | | | | | | |
TOTAL CHILDREN, YOUTH JUSTICE AND MULTICULTURAL AFFAIRS (PPE) | | | | | | | | | | | | | | | 41,131 | | | | | |
| | | | | | | | | | | | | | | | | | | | |
TOTAL CHILDREN, YOUTH JUSTICE AND MULTICULTURAL AFFAIRS (CG) | | | | | | | | | | | | | | | 3,500 | | | | | |
| | | | | | | | | | | | | | | | | | | | |
28
Capital Statement 2021-22
| 3.3 | COMMUNITIES, HOUSING AND DIGITAL ECONOMY |
The Communities, Housing and Digital Economy portfolio includes the Department of Communities, Housing and Digital Economy together with Arts Queensland, and statutory bodies reporting to the Minister for Communities and Housing and Minister for Digital Economy and Minister for the Arts. The portfolio’s capital program for 2021-22 is $442.7 million. The portfolio’s capital grants for 2021-22 is $185.3 million.
The Housing and Homelessness Action Plan 2021-2025 provides $1.908 billion over 4 years to boost housing supply and increase housing and homelessness support across Queensland. This includes $1.813 billion of expenditure over 4 years to increase the supply of social housing and upgrade the existing social housing property portfolio; including $502.6 million in 2021-22. Further details of this overall package can be found in the Budget Highlights section of the Department of Communities, Housing and Digital Economy Service Delivery Statement.
Department of Communities, Housing and Digital Economy
Total capital purchases for the Department of Communities, Housing and Digital Economy are $435.7 million in 2021-22. Total capital grants for the department are $185.3 million in 2021-22.
Program Highlights (Property, Plant and Equipment)
| • | | $281.4 million to deliver 467 social housing dwellings, commence construction of 393 dwellings and upgrade existing social housing dwellings. |
| • | | $84.2 million to build a new performing arts venue at the Queensland Performing Arts Centre, benefiting Queensland artists and audiences. |
| • | | $40.8 million to deliver 47 social housing dwellings in Aboriginal and Torres Strait Islander communities and purchase 6 dwellings for use as temporary accommodation to support the transfer of social housing to home ownership on Aboriginal and Torres Strait Islander land, and upgrade existing social housing dwellings. |
| • | | $7.7 million to continue the upgrade and construction program for neighbourhood and community centres and other key social infrastructure, including $3.2 million for the Cairns (Lyons St) Diversionary Centre Expansion, $2.6 million for general property upgrades, $1.3 million to continue design and construction of a new neighbourhood and community centre in Ripley and $635,000 to complete construction of the Wilsonton neighbourhood and community centre. |
| • | | $7.7 million to address Stage 2 of urgent and unavoidable critical infrastructure renewal works at the Queensland Cultural Centre. |
29
Capital Statement 2021-22
| • | | $4.4 million to deliver priority infrastructure projects across State owned arts and cultural facilities through the Arts Infrastructure Investment Fund. |
| • | | $3.3 million for cladding remediation works on the Gallery of Modern Art, the State Library of Queensland and the Queensland Museum. |
| • | | $1.3 million to renew the Central Energy Plant critical infrastructure at the Queensland Cultural Centre. |
Program Highlights (Capital Grants)
| • | | $90.7 million to deliver 118 social housing dwellings, purchase 27 dwellings, commence construction of 301 dwellings and upgrade existing social housing dwellings. |
| • | | $89.6 million to deliver 17 social housing dwellings in Aboriginal and Torres Strait Islander communities and upgrade existing social housing dwellings. |
| • | | $3.5 million towards the construction of the new Rockhampton Art Gallery. |
| • | | $1.5 million contribution towards the ongoing construction of the Yarrabilba Hive. |
CITEC
CITEC has capital purchases of $1 million in 2021-22, for hardware replacement.
Library Board of Queensland
The Library Board of Queensland has capital purchases of $2.2 million in 2021-22, to purchase heritage and reference collections, intangible assets in the form of digital collections, and replace information technology equipment.
Program Highlights (Property, Plant and Equipment)
| • | | $838,000 to replace information technology equipment. |
| • | | $595,000 to acquire new items for the digital collection. |
| • | | $465,000 to acquire new items for the heritage collection. |
| • | | $349,000 to acquire new items for the information collection. |
Queensland Art Gallery
The Queensland Art Gallery has capital purchases of $2.8 million in 2021-22, for acquiring art for the gallery’s collection, as well as life-cycle replacement of other property, plant and equipment assets.
Program Highlights (Property, Plant and Equipment)
| • | | $2.5 million to acquire art for the gallery’s collection. |
| • | | $300,000 to replace other property, plant and equipment. |
30
Capital Statement 2021-22
Queenstand Performing Arts Trust
The Queensland Performing Arts Trust has capital purchases of $1 million in 2021-22, for the life-cycle replacement of operational property, plant and equipment assets such as theatre equipment, food and beverage equipment, and information technology systems.
Communities, Housing and Digital Economy
| | | | | | | | | | | | | | | | | | | | |
Project | | Statistical
Area | | | Total
Estimated
Cost
$‘000 | | | Expenditure
to
30-06-21
$‘000 | | | Budget
2021-22
$‘000 | | | Post
2021-22
$‘000 | |
DEPARTMENT OF COMMUNITIES, HOUSING AND DIGITAL ECONOMY | | | | | | | | | | | | | |
Property, Plant and Equipment | | | | | | | | | | | | | | | | | | | | |
Housing and Homelessness Services | | | | | | | | | | | | | | | | | | | | |
Construct social housing | | | | | | | | | | | | | | | | | | | | |
Brisbane - East | | | 301 | | | | | | | | | | | | 5,079 | | | | Ongoing | |
Brisbane - North | | | 302 | | | | | | | | | | | | 5,285 | | | | Ongoing | |
Brisbane - South | | | 303 | | | | | | | | | | | | 14,165 | | | | Ongoing | |
Brisbane Inner City | | | 305 | | | | | | | | | | | | 2,798 | | | | Ongoing | |
Cairns | | | 306 | | | | | | | | | | | | 26,373 | | | | Ongoing | |
Darling Downs - Maranoa | | | 307 | | | | | | | | | | | | 2,567 | | | | Ongoing | |
Central Queensland | | | 308 | | | | | | | | | | | | 5,735 | | | | Ongoing | |
Gold Coast | | | 309 | | | | | | | | | | | | 12,485 | | | | Ongoing | |
Ipswich | | | 310 | | | | | | | | | | | | 13,935 | | | | Ongoing | |
Logan - Beaudesert | | | 311 | | | | | | | | | | | | 16,172 | | | | Ongoing | |
Mackay | | | 312 | | | | | | | | | | | | 7,309 | | | | Ongoing | |
Moreton Bay - North | | | 313 | | | | | | | | | | | | 13,071 | | | | Ongoing | |
Moreton Bay - South | | | 314 | | | | | | | | | | | | 5,785 | | | | Ongoing | |
Queensland - Outback | | | 315 | | | | | | | | | | | | 1,912 | | | | Ongoing | |
Sunshine Coast | | | 316 | | | | | | | | | | | | 9,297 | | | | Ongoing | |
Toowoomba | | | 317 | | | | | | | | | | | | 3,416 | | | | Ongoing | |
Townsville | | | 318 | | | | | | | | | | | | 24,325 | | | | Ongoing | |
Wide Bay | | | 319 | | | | | | | | | | | | 8,756 | | | | Ongoing | |
| | | | | | | | | | | | | | | | | | | | |
Sub-total Construct social housing | | | | | | | | | | | | | | | 178,465 | | | | | |
| | | | | | | | | | | | | | | | | | | | |
Upgrade existing social housing | | | | | | | | | | | | | | | | | | | | |
Brisbane - East | | | 301 | | | | | | | | | | | | 1,854 | | | | Ongoing | |
Brisbane - North | | | 302 | | | | | | | | | | | | 3,022 | | | | Ongoing | |
Brisbane - South | | | 303 | | | | | | | | | | | | 2,025 | | | | Ongoing | |
Brisbane - West | | | 304 | | | | | | | | | | | | 139 | | | | Ongoing | |
Brisbane Inner City | | | 305 | | | | | | | | | | | | 5,518 | | | | Ongoing | |
31
Capital Statement 2021-22
Communities Housing and Digital Economy
| | | | | | | | | | | | | | | | | | | | |
Project | | Statistical
Area | | | Total
Estimated
Cost
$‘000 | | | Expenditure
to
30-06-21
$‘000 | | | Budget
2021-22
$‘000 | | | Post
2021-22
$‘000 | |
Cairns | | | 306 | | | | | | | | | | | | 30,253 | | | | Ongoing | |
Darling Downs - Maranoa | | | 307 | | | | | | | | | | | | 1,075 | | | | Ongoing | |
Central Queensland | | | 308 | | | | | | | | | | | | 6,046 | | | | Ongoing | |
Gold Coast | | | 309 | | | | | | | | | | | | 3,076 | | | | Ongoing | |
Ipswich | | | 310 | | | | | | | | | | | | 3,727 | | | | Ongoing | |
Logan - Beaudesert | | | 311 | | | | | | | | | | | | 4,950 | | | | Ongoing | |
Mackay | | | 312 | | | | | | | | | | | | 1,692 | | | | Ongoing | |
Moreton Bay - North | | | 313 | | | | | | | | | | | | 2,998 | | | | Ongoing | |
Moreton Bay - South | | | 314 | | | | | | | | | | | | 284 | | | | Ongoing | |
Queensland - Outback | | | 315 | | | | | | | | | | | | 12,881 | | | | Ongoing | |
Sunshine Coast | | | 316 | | | | | | | | | | | | 5,908 | | | | Ongoing | |
Toowoomba | | | 317 | | | | | | | | | | | | 301 | | | | Ongoing | |
Townsville | | | 318 | | | | | | | | | | | | 5,694 | | | | Ongoing | |
Wide Bay | | | 319 | | | | | | | | | | | | 2,696 | | | | Ongoing | |
Statewide | | | Various | | | | | | | | | | | | 190 | | | | Ongoing | |
| | | | | | | | | | | | | | | | | | | | |
Sub-total Upgrade existing social housing | | | | | | | | 94,329 | | | | | |
| | | | | | | | | | | | | | | | | | | | |
| | | | | |
Purchase of existing properties
Cairns | | | 306 | | | | | | | | | | | | 2,609 | | | | Ongoing | |
| | | | | | | | | | | | | | | | | | | | |
Sub-total Purchase of existing properties | | | | | | | | 2,609 | | | | | |
| | | | | | | | | | | | | | | | | | | | |
| | | | | |
Social housing land aquisition | | | | | | | | | | | | | | | | | | | | |
Brisbane - East | | | 301 | | | | | | | | | | | | 960 | | | | Ongoing | |
Brisbane - North | | | 302 | | | | | | | | | | | | 1,440 | | | | Ongoing | |
Brisbane - South | | | 303 | | | | | | | | | | | | 4,940 | | | | Ongoing | |
Cairns | | | 306 | | | | | | | | | | | | 1,100 | | | | Ongoing | |
Darling Downs - Maranoa | | | 307 | | | | | | | | | | | | 400 | | | | Ongoing | |
Central Queensland | | | 308 | | | | | | | | | | | | 740 | | | | Ongoing | |
Gold Coast | | | 309 | | | | | | | | | | | | 11,500 | | | | Ongoing | |
Ipswich | | | 310 | | | | | | | | | | | | 10,920 | | | | Ongoing | |
Logan - Beaudesert | | | 311 | | | | | | | | | | | | 8,243 | | | | Ongoing | |
Mackay | | | 312 | | | | | | | | | | | | 480 | | | | Ongoing | |
Moreton Bay - North | | | 313 | | | | | | | | | | | | 320 | | | | Ongoing | |
Moreton Bay - South | | | 314 | | | | | | | | | | | | 320 | | | | Ongoing | |
Sunshine Coast | | | 316 | | | | | | | | | | | | 960 | | | | Ongoing | |
Toowoomba | | | 317 | | | | | | | | | | | | 1,720 | | | | Ongoing | |
Townsville | | | 318 | | | | | | | | | | | | 1,660 | | | | Ongoing | |
Wide Bay | | | 319 | | | | | | | | | | | | 640 | | | | Ongoing | |
Statewide | | | Various | | | | | | | | | | | | 500 | | | | Ongoing | |
| | | | | | | | | | | | | | | | | | | | |
Sub-total Social housing land aquisition | | | | | | | | | | | | | | | 46,843 | | | | | |
| | | | | | | | | | | | | | | | | | | | |
Other plant and equipment | | | Various | | | | | | | | | | | | 3,787 | | | | Ongoing | |
32
Capital Statement 2021-22
| | | | | | | | | | | | | | | | | | | | |
| Communities Housing and Digital Economy | |
Project | | Statistical
Area | | | Total
Estimated
Cost
$‘000 | | | Expenditure
to
30-06-21
$‘000 | | | Budget
2021-22
$‘000 | | | Post
2021-22
$‘000 | |
Sub-total Housing and Homelessness Services | | | | | | | | 326,033 | | | | | |
| | | | | | | | | | | | | | | | | | | | |
Community Services | | | | | | | | | | | | | | | | | | | | |
Calms (Lyons St) Diversionary
Centre Expansion | | | 306 | | | | 4,000 | | | | 800 | | | | 3,200 | | | | | |
Ripley Neighbourhood Centre | | | 310 | | | | 4,100 | | | | 730 | | | | 1,270 | | | | 2,100 | |
Wilsonton Neighbourhood Centre | | | 307 | | | | 3,800 | | | | 3,165 | | | | 635 | | | | | |
Office accommodation, fixtures and fittings | | | Various | | | | | | | | | | | | 302 | | | | Ongoing | |
General property upgrades | | | Various | | | | | | | | | | | | 2,596 | | | | Ongoing | |
| | | | | | | | | | | | | | | | | | | | |
Sub-total Community Services | | | | | | | | | | | | | | | 8,003 | | | | | |
| | | | | | | | | | | | | | | | | | | | |
Customer and Digital Services Other property, plant and equipment | | | Various | | | | | | | | | | | | 905 | | | | Ongoing | |
| | | | | | | | | | | | | | | | | | | | |
Sub-total Customer and Digital Services | | | | | | | | | | | | | | | 905 | | | | | |
| | | | | | | | | | | | | | | | | | | | |
Arts Queensland | | | | | | | | | | | | | | | | | | | | |
New Performing Arts Venue at1 QPAC | | | 305 | | | | 150,000 | | | | 35,646 | | | | 84,200 | | | | 30,154 | |
Queensland Cultural Centre critical infrastructure asset renewal | | | 305 | | | | 15,370 | | | | 14,090 | | | | 1,280 | | | | | |
Arts Infrastructure Investment Fund—Stage 2 2021 to 2024 | | | 305 | | | | 13,125 | | | | | | | | 4,375 | | | | 8,750 | |
Queensland Cultural Centre cladding remediation works | | | 305 | | | | 3,250 | | | | | | | | 3,250 | | | | | |
Queensland Cultural Centre critical infrastructure works - Stage 2 2021 to 2025 | | | 305 | | | | 30,280 | | | | | | | | 7,650 | | | | 22,630 | |
| | | | | | | | | | | | | | | | | | | | |
Sub-total Arts Queensland | | | | | | | | | | | | | | | 100,755 | | | | | |
| | | | | | | | | | | | | | | | | | | | |
Total Property, Plant and Equipment | | | | | | | | | | | | | | | 435,696 | | | | | |
| | | | | | | | | | | | | | | | | | | | |
Capital Grants | | | | | | | | | | | | | | | | | | | | |
Housing and Homelessness Services | | | | | | | | | | | | | | | | | | | | |
Brisbane - East | | | 301 | | | | | | | | | | | | 750 | | | | Ongoing | |
Brisbane - North | | | 302 | | | | | | | | | | | | 2,340 | | | | Ongoing | |
Brisbane - South | | | 303 | | | | | | | | | | | | 5,806 | | | | Ongoing | |
Brisbane Inner City | | | 305 | | | | | | | | | | | | 4,520 | | | | Ongoing | |
Cairns | | | 306 | | | | | | | | | | | | 69,376 | | | | Ongoing | |
Central Queensland | | | 308 | | | | | | | | | | | | 2,008 | | | | Ongoing | |
Gold Coast | | | 309 | | | | | | | | | | | | 5,866 | | | | Ongoing | |
33
Capital Statement 2021-22
| | | | | | | | | | | | | | | | | | | | |
| Communities Housing and Digital Economy | |
Project | | Statistical
Area | | | Total
Estimated
Cost
$‘000 | | | Expenditure
to 30-06-21
$‘000 | | | Budget
2021-22
$‘000 | | | Post
2021-22
$‘000 | |
Ipswich | | | 310 | | | | | | | | | | | | 4,610 | | | | Ongoing | |
Logan - Beaudesert | | | 311 | | | | | | | | | | | | 4,170 | | | | Ongoing | |
Mackay | | | 312 | | | | | | | | | | | | 460 | | | | Ongoing | |
Moreton Bay - North | | | 313 | | | | | | | | | | | | 6,102 | | | | Ongoing | |
Moreton Bay - South | | | 314 | | | | | | | | | | | | 1,650 | | | | Ongoing | |
Queensland - Outback | | | 315 | | | | | | | | | | | | 9,172 | | | | Ongoing | |
Sunshine Coast | | | 316 | | | | | | | | | | | | 10,905 | | | | Ongoing | |
Toowoomba | | | 317 | | | | | | | | | | | | 2,041 | | | | Ongoing | |
Townsville | | | 318 | | | | | | | | | | | | 5,587 | | | | Ongoing | |
Wide Bay | | | 319 | | | | | | | | | | | | 10,059 | | | | Ongoing | |
Statewide | | | Various | | | | | | | | | | | | 34,908 | | | | Ongoing | |
| | | | | | | | | | | | | | | | | | | | |
Sub-total Housing and Homelessness Services | | | | | | | | 180,330 | | | | | |
| | | | | | | | | | | | | | | | | | | | |
Community Services Yarrabilba Hive | | | 311 | | | | 2,600 | | | | 1,100 | | | | 1,500 | | | | | |
| | | | | | | | | | | | | | | | | | | | |
Sub-total Community Services | | | | | | | | | | | | | | | 1,500 | | | | | |
| | | | | | | | | | | | | | | | | | | | |
Arts Queensland | | | | | | | | | | | | | | | | | | | | |
New Rockhampton Art Gallery | | | 308 | | | | 8,000 | | | | 4,500 | | | | 3,500 | | | | | |
| | | | | | | | | | | | | | | | | | | | |
Sub-total Arts Queensland | | | | | | | | | | | | | | | 3,500 | | | | | |
| | | | | | | | | | | | | | | | | | | | |
Total Capital Grants | | | | | | | | | | | | | | | 185,330 | | | | | |
| | | | | | | | | | | | | | | | | | | | |
CITEC | | | | | | | | | | | | | | | | | | | | |
Property, Plant and Equipment | | | | | | | | | | | | | | | | | | | | |
Hardware replacement | | | 305 | | | | | | | | | | | | 500 | | | | Ongoing | |
Hardware replacement | | | 310 | | | | | | | | | | | | 500 | | | | Ongoing | |
| | | | | | | | | | | | | | | | | | | | |
Total Property, Plant and Equipment | | | | | | | | | | | | | | | 1,000 | | | | | |
| | | | | | | | | | | | | | | | | | | | |
LIBRARY BOARD OF QUEENSLAND | | | | | | | | | | | | | | | | | | | | |
Property, Plant and Equipment | | | | | | | | | | | | | | | | | | | | |
Information technology equipment | | | 305 | | | | | | | | | | | | 838 | | | | Ongoing | |
Digital collection | | | 305 | | | | | | | | | | | | 595 | | | | Ongoing | |
Heritage collection | | | 305 | | | | | | | | | | | | 465 | | | | Ongoing | |
Information collection | | | 305 | | | | | | | | | | | | 349 | | | | Ongoing | |
| | | | | | | | | | | | | | | | | | | | |
Total Property, Plant and Equipment | | | | | | | | | | | | | | | 2,247 | | | | | |
| | | | | | | | | | | | | | | | | | | | |
34
Capital Statement 2021-22
| | | | | | | | | | | | | | | | | | | | |
| Communities, Housing and Digital Economy | |
Project | | Statistical
Area | | | Total
Estimated
Cost
$‘000 | | | Expenditure
to
30-06-21
$‘000 | | | Budget
2021-22
$‘000 | | | Post
2021-22
$‘000 | |
QUEENSLAND ART GALLERY | | | | | | | | | | | | | | | | | | | | |
Property, Plant and Equipment | | | | | | | | | | | | | | | | | | | | |
Acquisitions for the Queensland Art Gallery’s collection | | | 305 | | | | | | | | | | | | 2,500 | | | | Ongoing | |
Ongoing replacement of plant and equipment | | | 305 | | | | | | | | | | | | 300 | | | | Ongoing | |
| | | | | | | | | | | | | | | | | | | | |
Total Property, Plant and Equipment | | | | | | | | | | | | | | | 2,800 | | | | | |
| | | | | | | | | | | | | | | | | | | | |
QUEENSLAND PERFORMING ARTS TRUST | | | | | | | | | | | | | | | | | | | | |
Property, Plant and Equipment | | | | | | | | | | | | | | | | | | | | |
Property, plant and equipment | | | 305 | | | | | | | | | | | | 1,000 | | | | Ongoing | |
| | | | | | | | | | | | | | | | | | | | |
Total Property, Plant and Equipment | | | | | | | | | | | | | | | 1,000 | | | | | |
| | | | | | | | | | | | | | | | | | | | |
TOTAL COMMUNITIES, HOUSING AND DIGITAL ECONOMY (PPE) | | | | | | | | | | | | | | | 442,743 | | | | | |
TOTAL COMMUNITIES, HOUSING AND DIGITAL ECONOMY (CG) | | | | | | | | | | | | | | | 185,330 | | | | | |
Note:
| 1. | The Total Estimated Cost of $175 million includes a State contribution of $150 million and a contribution by the Queensland Performing Arts Trust of $25 million. |
35
Capital Statement 2021-22
Total capital purchases for the Education portfolio (including the Department of Education and related entities) are $1.447 billion in 2021-22. Total capital grants for the portfolio are $140.8 million in 2021-22.
Department of Education
The 2021-22 capital purchases of $1.447 billion include $1.383 billion for the construction and refurbishment of school educational facilities and early childhood education and care services. Capital works planning targets government priorities through consideration of population growth and shifts, changes in educational needs and addressing high-priority needs for student and staff health and safety.
Program Highlights (Property, Plant and Equipment)
| • | | $527.1 million for the Building Future Schools Program to deliver world class learning environments for students. |
| • | | $496.4 million for the provision of additional facilities at existing state schools experiencing strong enrolment growth. |
| • | | $84 million to replace and enhance facilities at existing schools. |
| • | | $61.2 million as part of the School Halls Program and $10.2 million for the Shovel Ready Program under the Great Schools Great Future election commitment to boost education infrastructure investment across Queensland over the next 4 years. |
| • | | $53.9 million for air-conditioning installation and replacement in state schools under the Cooler Cleaner Schools Program. |
| • | | $39.3 million for the Advancing Clean Energy Schools program to upgrade and install solar and energy efficiency measures in Queensland state schools. |
| • | | $17.3 million to link industry and local high schools to provide students with pathways into rewarding careers and confidently transition into the world of work under the Local Schools Local Jobs election commitment. |
Program Highlights (Capital Grants)
| • | | $116.7 million is provided for the non-state schooling sector and student hostels. |
| • | | $24.1 million is provided for racing infrastructure projects that contribute to the growth and sustainability of the Queensland racing industry. |
36
Capital Statement 2021-22
| | | | | | | | | | | | | | | | | | | | |
| Education | |
Project | | Statistical
Area | | | Total
Estimated
Cost
$‘000 | | | Expenditure
to 30-06-21
$‘000 | | | Budget
2021-22
$‘000 | | | Post
2021-22
$‘000 | |
DEPARTMENT OF EDUCATION | | | | | | | | | | | | | | | | | | | | |
Property, Plant and Equipment | | | | | | | | | | | | | | | | | | | | |
Education Capital Works Program | | | | | | | | | | | | | | | | | | | | |
New schools in 2023 and 20241 | | | Various | | | | 858,892 | | | | | | | | 124,463 | | | | 734,429 | |
New primary school in Brisbane’s Inner West | | | 304 | | | | 61,245 | | | | 432 | | | | 940 | | | | 59,873 | |
New special school in Coomera | | | 309 | | | | 40,165 | | | | 11,245 | | | | 22,378 | | | | 6,542 | |
New primary school in North Maclean (Greenbank) | | | 311 | | | | 61,993 | | | | 22,523 | | | | 20,294 | | | | 19,176 | |
New primary school in Caloundra South | | | 316 | | | | 57,890 | | | | 13,323 | | | | 31,971 | | | | 12,596 | |
Brisbane South State Secondary College | | | 305 | | | | 131,412 | | | | 124,730 | | | | 6,682 | | | | | |
Gainsborough State School - Stage 2 | | | 309 | | | | 15,566 | | | | | | | | 15,566 | | | | | |
Palmview State Primary School - Stage 2 | | | 316 | | | | 13,339 | | | | | | | | 2,223 | | | | 11,116 | |
Palmview State Special School - Stage 2 | | | 316 | | | | 18,347 | | | | | | | | 18,347 | | | | | |
Baringa State Secondary College - Stage 2 | | | 316 | | | | 21,263 | | | | | | | | 8,505 | | | | 12,758 | |
Calliope State High School - Stage 2 | | | 308 | | | | 12,696 | | | | 868 | | | | 11,828 | | | | | |
Fortitude Valley State Secondary College | | | 305 | | | | 122,200 | | | | 92,882 | | | | 29,318 | | | | | |
Foxwell State Secondary College - Stage 2 | | | 309 | | | | 37,928 | | | | 11,327 | | | | 26,601 | | | | | |
Lee Street State Special School - Stage 2 | | | 313 | | | | 15,064 | | | | 10,289 | | | | 4,775 | | | | | |
Mango Hill State Secondary College - Stage 2 | | | 314 | | | | 22,926 | | | | 8,365 | | | | 14,561 | | | | | |
Ripley Valley State School - Stage 2 | | | 310 | | | | 9,033 | | | | 3,911 | | | | 5,122 | | | | | |
Ripley Valley State Secondary College - Stage 2 | | | 310 | | | | 17,058 | | | | 8,049 | | | | 9,009 | | | | | |
Yarrabilba State Secondary College - Stage 2 | | | 311 | | | | 28,642 | | | | 12,991 | | | | 15,651 | | | | | |
Local Schools Local Jobs | | | | | | | | | | | | | | | | | | | | |
New skills development and training facilities | | | | | | | | | | | | | | | | | | | | |
37
Capital Statement 2021-22
| | | | | | | | | | | | | | | | | | | | |
| Education | |
Project | | Statistical
Area | | | Total
Estimated
Cost
$‘000 | | | Expenditure
to
30-06-21
$‘000 | | | Budget
2021-22
$‘000 | | | Post
2021-22
$‘000 | |
Aviation High | | | 305 | | | | 740 | | | | | | | | 252 | | | | 488 | |
Bentley Park College | | | 306 | | | | 444 | | | | | | | | 252 | | | | 192 | |
Chinchilla State High School | | | 307 | | | | 2,072 | | | | | | | | 252 | | | | 1,820 | |
Mabel Park State High School | | | 311 | | | | 2,664 | | | | 222 | | | | 2,442 | | | | | |
Rockhampton State High School | | | 308 | | | | 1,850 | | | | | | | | 370 | | | | 1,480 | |
Sunnybank State High School | | | 303 | | | | 2,220 | | | | | | | | 263 | | | | 1,957 | |
Tara Shire State College | | | 307 | | | | 1,480 | | | | | | | | 252 | | | | 1,228 | |
Upgrade skills development and training facilities | | | | | | | | | | | | | | | | | | | | |
Bowen State High School | | | 312 | | | | 1,036 | | | | | | | | 252 | | | | 784 | |
Caboolture State High School | | | 313 | | | | 740 | | | | 185 | | | | 555 | | | | | |
Clermont State High School | | | 312 | | | | 962 | | | | | | | | 252 | | | | 710 | |
Clifton State High School | | | 307 | | | | 1,036 | | | | | | | | 252 | | | | 784 | |
Cloncurry State School P-12 | | | 315 | | | | 370 | | | | | | | | 370 | | | | | |
Dalby State High School | | | 307 | | | | 1,850 | | | | | | | | 434 | | | | 1,416 | |
Dysart State High School | | | 312 | | | | 666 | | | | | | | | 252 | | | | 414 | |
Gladstone State High School | | | 308 | | | | 1,480 | | | | | | | | 252 | | | | 1,228 | |
Glenala State High School | | | 310 | | | | 1,665 | | | | | | | | 252 | | | | 1,413 | |
Home Hill State High School | | | 318 | | | | 370 | | | | | | | | 252 | | | | 118 | |
Kingaroy State High School | | | 319 | | | | 1,184 | | | | | | | | 252 | | | | 932 | |
Longreach State High School | | | 315 | | | | 1,924 | | | | | | | | 252 | | | | 1,672 | |
Mackay Northern Beaches State High School | | | 312 | | | | 888 | | | | | | | | 252 | | | | 636 | |
38
Capital Statement 2021-22
| | | | | | | | | | | | | | | | | | | | |
| Education | |
Project | | Statistical
Area | | | Total
Estimated
Cost
$‘000 | | | Expenditure
to
30-06-21
$‘000 | | | Budget
2021-
22
$‘000 | | | Post
2021-22
$‘000 | |
Pimlico State High School | | | 318 | | | | 1,036 | | | | | | | | 252 | | | | 784 | |
Roma State College | | | 307 | | | | 1,110 | | | | | | | | 252 | | | | 858 | |
St George State High School | | | 307 | | | | 2,220 | | | | 27 | | | | 565 | | | | 1,628 | |
Thuringowa State High School | | | 318 | | | | 888 | | | | | | | | 252 | | | | 636 | |
Woodcrest State College | | | 310 | | | | 1,665 | | | | | | | | 333 | | | | 1,332 | |
Woree State High School | | | 306 | | | | 725 | | | | 3 | | | | 252 | | | | 470 | |
School Halls Program | | | | | | | | | | | | | | | | | | | | |
New hall facility | | | | | | | | | | | | | | | | | | | | |
Ayr State High School | | | 318 | | | | 5,175 | | | | | | | | 252 | | | | 4,923 | |
Beenleigh State High School | | | 311 | | | | 10,800 | | | | | | | | 5,520 | | | | 5,280 | |
Buderim Mountain State School | | | 316 | | | | 4,500 | | | | | | | | 252 | | | | 4,248 | |
Burnside State High School | | | 316 | | | | 9,630 | | | | | | | | 260 | | | | 9,370 | |
Capalaba State College | | | 301 | | | | 7,200 | | | | | | | | 3,680 | | | | 3,520 | |
Chancellor State College | | | 316 | | | | 7,650 | | | | | | | | 1,019 | | | | 6,631 | |
Deception Bay State School | | | 313 | | | | 4,500 | | | | | | | | 252 | | | | 4,248 | |
Gladstone Central State School | | | 308 | | | | 5,175 | | | | | | | | 252 | | | | 4,923 | |
Miami State High School | | | 309 | | | | 9,000 | | | | | | | | 874 | | | | 8,126 | |
Noosa District State High School - Pomona Campus | | | 316 | | | | 5,175 | | | | | | | | 252 | | | | 4,923 | |
Oakey State High School | | | 307 | | | | 5,175 | | | | | | | | 252 | | | | 4,923 | |
Oakleigh State School | | | 305 | | | | 4,500 | | | | | | | | 252 | | | | 4,248 | |
Palm Beach Currumbin State High School | | | 309 | | | | 9,000 | | | | | | | | 4,600 | | | | 4,400 | |
Pimlico State High School | | | 318 | | | | 9,900 | | | | | | | | 566 | | | | 9,334 | |
Pittsworth State High 10School | | | 307 | | | | 5,625 | | | | | | | | 252 | | | | 5,373 | |
39
Capital Statement 2021-22
| | | | | | | | | | | | | | | | | | | | |
| Education | |
Project | | Statistical
Area | | | Total
Estimated
Cost
$‘000 | | | Expenditure
to
30-06-21
$‘000 | | | Budget
2021-
22
$‘000 | | | Post
2021-22
$‘000 | |
Rochedale State High School | | | 303 | | | | 10,801 | | | | | | | | 770 | | | | 10,031 | |
Seven Hills State School | | | 305 | | | | 7,200 | | | | | | | | 252 | | | | 6,948 | |
Thuringowa State High School | | | 318 | | | | 5,175 | | | | | | | | 252 | | | | 4,923 | |
Toogoolawah State High School | | | 310 | | | | 5,175 | | | | | | | | 1,672 | | | | 3,503 | |
Townsville Community Learning Centre - A State Special School | | | 318 | | | | 5,175 | | | | | | | | 612 | | | | 4,563 | |
Trinity Bay State High School | | | 306 | | | | 10,351 | | | | 59 | | | | 405 | | | | 9,887 | |
Urangan Point State School | | | 319 | | | | 5,175 | | | | | | | | 252 | | | | 4,923 | |
Urangan State High School | | | 319 | | | | 9,630 | | | | | | | | 260 | | | | 9,370 | |
Warwick State High School | | | 307 | | | | 5,175 | | | | | | | | 252 | | | | 4,923 | |
Wilston State School Upgrade existing hall facility | | | 305 | | | | 7,200 | | | | | | | | 252 | | | | 6,948 | |
Caloundra State School | | | 316 | | | | 2,880 | | | | | | | | 931 | | | | 1,949 | |
Clifton State High School | | | 307 | | | | 2,484 | | | | | | | | 478 | | | | 2,006 | |
Glenala State High School | | | 310 | | | | 4,500 | | | | | | | | 532 | | | | 3,968 | |
Kilcoy State High School | | | 313 | | | | 4,770 | | | | | | | | 1,541 | | | | 3,229 | |
Nerang State High School | | | 309 | | | | 4,500 | | | | | | | | 532 | | | | 3,968 | |
Redlynch State College - Junior Campus | | | 306 | | | | 2,880 | | | | | | | | 252 | | | | 2,628 | |
Redlynch State College - Senior Campus | | | 306 | | | | 3,375 | | | | | | | | 252 | | | | 3,123 | |
Sandgate District State High School | | | 302 | | | | 4,500 | | | | | | | | 462 | | | | 4,038 | |
St George State High School | | | 307 | | | | 5,175 | | | | | | | | 612 | | | | 4,563 | |
The Hall State School | | | 308 | | | | 4,501 | | | | | | | | 1,454 | | | | 3,047 | |
40
Capital Statement 2021-22
| | | | | | | | | | | | | | | | | | | | |
| Education | |
Project | | Statistical
Area | | | Total
Estimated
Cost
$‘000 | | | Expenditure
to
30-06-21
$‘000 | | | Budget
2021-22
$‘000 | | | Post
2021-22
$‘000 | |
Toolooa State High School | | | 308 | | | | 2,880 | | | | | | | | 252 | | | | 2,628 | |
Woree State School | | | 306 | | | | 1,530 | | | | | | | | 252 | | | | 1,278 | |
Albany Creek State High School - Additional classrooms | | | 314 | | | | 13,064 | | | | | | | | 7,176 | | | | 5,888 | |
Ambrose State School - Amenities upgrades | | | 308 | | | | 585 | | | | | | | | 585 | | | | | |
Aratula State School - Amenities upgrades | | | 310 | | | | 720 | | | | | | | | 720 | | | | | |
Ashwell State School - Amenities upgrades | | | 310 | | | | 675 | | | | | | | | 675 | | | | | |
Aspley Special School - Additional classrooms | | | 302 | | | | 10,488 | | | | | | | | 4,600 | | | | 5,888 | |
Aurukun State School - Administration upgrades | | | 315 | | | | 2,220 | | | | | | | | 2,220 | | | | | |
Bald Hills State School - Administration upgrades | | | 302 | | | | 740 | | | | 148 | | | | 592 | | | | | |
Balmoral State High School - Additional classrooms | | | 305 | | | | 9,430 | | | | 361 | | | | 9,069 | | | | | |
Balmoral State High School - Administration upgrades | | | 305 | | | | 5,400 | | | | 65 | | | | 5,335 | | | | | |
Beenleigh Special School - Additional classrooms | | | 311 | | | | 15,456 | | | | | | | | 3,956 | | | | 11,500 | |
Bellbird Park State Secondary College - Additional classrooms | | | 310 | | | | 15,622 | | | | 1,460 | | | | 14,162 | | | | | |
Bellevue Park State School - Additional classrooms | | | 309 | | | | 4,876 | | | | | | | | 1,950 | | | | 2,926 | |
Bli Bli State School - Amenities upgrades | | | 316 | | | | 450 | | | | | | | | 450 | | | | | |
Bluewater State School - Amenities upgrades | | | 318 | | | | 1,200 | | | | 40 | | | | 1,160 | | | | | |
Bohlevale State School - School security fence | | | 318 | | | | 651 | | | | | | | | 651 | | | | | |
Bracken Ridge State High School - Additional classrooms | | | 302 | | | | 10,764 | | | | | | | | 2,177 | | | | 8,587 | |
Bray Park State High School - Additional classrooms | | | 314 | | | | 7,544 | | | | 6,709 | | | | 835 | | | | | |
Brisbane Central State School - Additional classrooms | | | 305 | | | | 14,025 | | | | 8,258 | | | | 5,767 | | | | | |
Brisbane South State Secondary | | | 303 | | | | 5,579 | | | | 1,457 | | | | 4,122 | | | | | |
College - Stage 1 sports fields | | | | | | | | | | | | | | | | | | | | |
41
Capital Statement 2021-22
| | | | | | | | | | | | | | | | | | | | |
Project | | Statistical
Area | | | Total
Estimated
Cost
$‘000 | | | Expenditure
to
30-06-21
$‘000 | | | Budget
2021-22
$‘000 | | | Post
2021-22
$‘000 | |
Brookstead State School - Amenities upgrades | | | 307 | | | | 1,040 | | | | | | | | 1,040 | | | | | |
Bundaberg South State School - School security fence | | | 319 | | | | 409 | | | | | | | | 409 | | | | | |
Buranda State School - Additional classrooms | | | 303 | | | | 3,657 | | | | 226 | | | | 3,431 | | | | | |
Bwgcolman Community School - Administration upgrades | | | 318 | | | | 3,150 | | | | 197 | | | | 2,953 | | | | | |
Bwgcolman Community School - Learning space upgrades | | | 318 | | | | 370 | | | | | | | | 370 | | | | | |
Caboolture State High School - Additional classrooms | | | 313 | | | | 12,512 | | | | | | | | 9,660 | | | | 2,852 | |
Cairns West State School - Amenities upgrades | | | 306 | | | | 600 | | | | 120 | | | | 480 | | | | | |
Calamvale Community College - Additional classrooms | | | 303 | | | | 6,481 | | | | 853 | | | | 5,628 | | | | | |
Calamvale Special School - Additional classrooms | | | 303 | | | | 11,868 | | | | | | | | 3,588 | | | | 8,280 | |
Capella State School - Administration upgrades | | | 308 | | | | 1,620 | | | | | | | | 1,620 | | | | | |
Centenary State High School - Additional classrooms | | | 304 | | | | 7,452 | | | | 883 | | | | 6,569 | | | | | |
Centenary State High School - Rectification of the sports hall | | | 304 | | | | 303 | | | | | | | | 303 | | | | | |
Claremont Special School - Additional classrooms | | | 310 | | | | 12,972 | | | | | | | | 2,944 | | | | 10,028 | |
Clifford Park Special School - Additional classrooms | | | 317 | | | | 4,140 | | | | 1,472 | | | | 2,668 | | | | | |
Clifford Park Special School - Relocation of Denise Kable Centre | | | 317 | | | | 8,648 | | | | 997 | | | | 7,651 | | | | | |
Coen Campus of Cape York Aboriginal Australian Academy - Amenities upgrades | | | 315 | | | | 880 | | | | 13 | | | | 867 | | | | | |
Coolum State High School - Additional classrooms | | | 316 | | | | 16,652 | | | | | | | | 10,267 | | | | 6,385 | |
Coombabah State High School - Additional classrooms | | | 309 | | | | 12,972 | | | | | | | | 5,189 | | | | 7,783 | |
Cranbrook State School - School security fence | | | 318 | | | | 651 | | | | | | | | 651 | | | | | |
42
Capital Statement 2021-22
| | | | | | | | | | | | | | | | | | |
| Education | |
Project | | Statistical
Area | | Total
Estimated
Cost
$‘000 | | | Expenditure
to
30-06-21
$‘000 | | | Budget
2021-22
$‘000 | | | Post
2021-22
$‘000 | |
Darling Point Special School - Additional classrooms | | 301 | | | 12,880 | | | | | | | | 5,520 | | | | 7,360 | |
Deception Bay North State School - Amenities upgrades | | 313 | | | 400 | | | | | | | | 400 | | | | | |
Eagle Junction State School - Additional classrooms | | 305 | | | 7,268 | | | | 3,449 | | | | 3,819 | | | | | |
Edge Hill State School - Administration upgrades | | 306 | | | 4,680 | | | | | | | | 4,680 | | | | | |
Emerald State School - Administration upgrades | | 308 | | | 1,620 | | | | | | | | 1,620 | | | | | |
Enoggera State School-Additional classrooms | | 304 | | | 6,532 | | | | | | | | 3,496 | | | | 3,036 | |
FamilyLinQ-School-based hub2 | | Various | | | 7,826 | | | | | | | | 4,300 | | | | 3,526 | |
Fernbrooke State School - Additional classrooms | | 310 | | | 2,668 | | | | 321 | | | | 2,347 | | | | | |
Flagstone State School - Additional classrooms | | 311 | | | 6,900 | | | | | | | | 4,140 | | | | 2,760 | |
Freshwater State School - Learning space upgrades | | 306 | | | 355 | | | | 5 | | | | 350 | | | | | |
Geebung Special School - Additional classrooms | | 302 | | | 7,268 | | | | | | | | 3,680 | | | | 3,588 | |
Gin Gin State High School - Administration upgrades | | 319 | | | 2,250 | | | | | | | | 2,250 | | | | | |
Glenala State High School - Additional classrooms | | 310 | | | 7,544 | | | | | | | | 4,600 | | | | 2,944 | |
Glenview State School - Administration upgrades | | 316 | | | 4,500 | | | | | | | | 4,500 | | | | | |
Goodna Special School - Additional classrooms | | 310 | | | 15,640 | | | | | | | | 4,140 | | | | 11,500 | |
Gowrie State School - Learning space upgrades | | 307 | | | 370 | | | | 65 | | | | 305 | | | | | |
Gracemere State School - Amenities upgrades | | 308 | | | 270 | | | | | | | | 270 | | | | | |
Grantham State School - Amenities upgrades | | 307 | | | 1,040 | | | | | | | | 1,040 | | | | | |
Gumdale State School-Additional classrooms | | 301 | | | 6,440 | | | | 757 | | | | 5,683 | | | | | |
Hamilton State School-Additional classrooms | | 305 | | | 4,305 | | | | 3,780 | | | | 525 | | | | | |
43
Capital Statement 2021-22
| | | | | | | | | | | | | | | | | | |
| Education | |
Project | | Statistical
Area | | Total
Estimated
Cost
$‘000 | | | Expenditure
to
30-06-21
$‘000 | | | Budget
2021-22
$‘000 | | | Post
2021-22
$‘000 | |
Heatley Secondary College - New commercial kitchen | | 318 | | | 860 | | | | | | | | 292 | | | | 568 | |
Hervey Bay State High School - Additional classrooms | | 319 | | | 4,968 | | | | 1,637 | | | | 3,331 | | | | | |
Highfields State School - Administration upgrades | | 317 | | | 2,700 | | | | | | | | 2,700 | | | | | |
Indooroopilly State School - Administration upgrades | | 304 | | | 3,600 | | | | | | | | 3,600 | | | | | |
Ipswich State High School - Additional classrooms | | 310 | | | 23,460 | | | | | | | | 5,060 | | | | 18,400 | |
Junction Park State School - Amenities upgrades | | 303 | | | 400 | | | | | | | | 400 | | | | | |
Kallangur State School-Additional classrooms | | 314 | | | 7,899 | | | | 461 | | | | 6,306 | | | | 1,132 | |
Kawana Waters State College - Additional classrooms | | 316 | | | 5,980 | | | | | | | | 4,140 | | | | 1,840 | |
Kilcoy State School - Amenities upgrades | | 313 | | | 400 | | | | | | | | 400 | | | | | |
Kirwan State School - Administration upgrades | | 318 | | | 1,800 | | | | 80 | | | | 1,720 | | | | | |
Lawnton State School - Additional classrooms | | 314 | | | 7,659 | | | | 1,119 | | | | 6,540 | | | | | |
Lockhart State School - Additional facilities | | 315 | | | 2,823 | | | | 781 | | | | 2,042 | | | | | |
Logan City Special School - Additional classrooms | | 311 | | | 2,116 | | | | 559 | | | | 1,557 | | | | | |
Mabel Park State High School - Additional classrooms | | 311 | | | 17,388 | | | | 2,974 | | | | 14,414 | | | | | |
MacGregor State School - Amenities upgrades | | 303 | | | 280 | | | | | | | | 280 | | | | | |
Mackay Northern Beaches State High School - Additionalclassrooms | | 312 | | | 6,164 | | | | | | | | 4,324 | | | | 1,840 | |
Mackenzie State Special School - Additional classrooms | | 303 | | | 6,072 | | | | 3,885 | | | | 2,187 | | | | | |
Malanda State High School - Additional classrooms | | 306 | | | 10,580 | | | | | | | | 4,600 | | | | 5,980 | |
Mango Hill State School - Additional classrooms | | 314 | | | 11,040 | | | | 3,766 | | | | 7,274 | | | | | |
Manly State School-Additional classrooms | | 301 | | | 9,292 | | | | | | | | 2,024 | | | | 7,268 | |
44
Capital Statement 2021-22
| | | | | | | | | | | | | | | | | | |
| Education | |
Project | | Statistical
Area | | Total
Estimated
Cost
$‘000 | | | Expenditure
to
30-06-21
$‘000 | | | Budget
2021-22
$‘000 | | | Post
2021-22
$‘000 | |
Mansfield State High School - Additional classrooms | | 303 | | | 15,640 | | | | | | | | 9,660 | | | | 5,980 | |
Mansfield State School-Additional classrooms | | 303 | | | 7,773 | | | | 6,217 | | | | 1,556 | | | | | |
Mareeba State High School - Amenities upgrades | | 306 | | | 800 | | | | | | | | 800 | | | | | |
Maroon Outdoor Education Centre - Upgraded septic system | | 310 | | | 550 | | | | | | | | 550 | | | | | |
Marsden State High School - Additional classrooms | | 311 | | | 16,836 | | | | 10,768 | | | | 6,068 | | | | | |
Marsden State School - Additional classrooms | | 311 | | | 10,120 | | | | 1,475 | | | | 8,645 | | | | | |
Mary Valley State College - Improved water supply | | 319 | | | 275 | | | | | | | | 275 | | | | | |
Middle Park State School-School security fence | | 304 | | | 520 | | | | | | | | 520 | | | | | |
Milton State School-Additional classrooms | | 305 | | | 1,225 | | | | 583 | | | | 642 | | | | | |
Mitchelton Special School - Additional classrooms | | 304 | | | 8,280 | | | | 1,548 | | | | 6,614 | | | | 118 | |
Miriam Vale State School - Amenities upgrades | | 308 | | | 960 | | | | | | | | 960 | | | | | |
Mooloolaba State School - Additional classrooms | | 316 | | | 6,781 | | | | 1,086 | | | | 5,695 | | | | | |
Moranbah East State School - Additional classrooms | | 312 | | | 5,704 | | | | | | | | 1,242 | | | | 4,462 | |
Morayfield State School-School security fence | | 313 | | | 471 | | | | | | | | 471 | | | | | |
Mossman State High School - Improved water supply | | 306 | | | 495 | | | | | | | | 495 | | | | | |
Mount Isa Central State School - School security fence | | 315 | | | 333 | | | | | | | | 333 | | | | | |
Mount Marrow State School - Amenities upgrades | | 310 | | | 675 | | | | | | | | 675 | | | | | |
Mudgeeraba Special School - Additional classrooms | | 309 | | | 11,960 | | | | | | | | 5,980 | | | | 5,980 | |
New Farm State School - Additional classrooms | | 305 | | | 17,287 | | | | 7,238 | | | | 10,049 | | | | | |
Noosa District State High School - Pomona Campus - Administration upgrades | | 316 | | | 525 | | | | 204 | | | | 321 | | | | | |
45
Capital Statement 2021-22
| | | | | | | | | | | | | | | | | | |
| Education | |
Project | | Statistical
Area | | Total
Estimated
Cost
$‘000 | | | Expenditure
to
30-06-21
$‘000 | | | Budget
2021-22
$‘000 | | | Post
2021-22
$‘000 | |
North Arm State School - Administration upgrades | | 316 | | | 4,500 | | | | | | | | 4,500 | | | | | |
Numinbah Valley State School - Amenities upgrades | | 309 | | | 400 | | | | | | | | 400 | | | | | |
Nursery Road State Special School-Additional classrooms | | 303 | | | 7,912 | | | | 5,167 | | | | 2,745 | | | | | |
Oakey State High School - Classroom refurbishment | | 307 | | | 555 | | | | 37 | | | | 518 | | | | | |
Oakey State High School - Learning space upgrades | | 307 | | | 444 | | | | 37 | | | | 407 | | | | | |
Ormeau Woods State High School - Additional classrooms | | 309 | | | 9,002 | | | | 2,424 | | | | 6,578 | | | | | |
Pacific Pines State High School - Additional classrooms | | 309 | | | 23,920 | | | | 1,109 | | | | 22,811 | | | | | |
Palm Beach State School - Additional classrooms | | 309 | | | 9,752 | | | | 2,500 | | | | 7,252 | | | | | |
Park Ridge State High School - Additional classrooms | | 311 | | | 11,132 | | | | | | | | 6,440 | | | | 4,692 | |
Park Ridge State School - Administration upgrades | | 311 | | | 3,478 | | | | 1,480 | | | | 1,998 | | | | | |
Parke State School-Amenities upgrades | | 319 | | | 900 | | | | | | | | 900 | | | | | |
Parkhurst State School - Administration upgrades | | 308 | | | 5,400 | | | | | | | | 5,400 | | | | | |
Peak Crossing State School - Administration upgrades | | 310 | | | 1,837 | | | | 230 | | | | 1,607 | | | | | |
Picnic Creek State School - Additional classrooms | | 309 | | | 10,212 | | | | 909 | | | | 9,303 | | | | | |
Pine Rivers Special School - Additional classrooms | | 314 | | | 8,924 | | | | 8,129 | | | | 795 | | | | | |
Pine Rivers Special School - Additional classrooms and administration centre | | 314 | | | 13,524 | | | | | | | | 8,791 | | | | 4,733 | |
Proserpine State High School - Additional classrooms | | 312 | | | 3,450 | | | | | | | | 3,450 | | | | | |
Redcliffe State High School - Learning space upgrades | | 313 | | | 740 | | | | 333 | | | | 407 | | | | | |
Redland District Special School - Additional classrooms | | 301 | | | 8,280 | | | | 4,229 | | | | 4,051 | | | | | |
46
Capital Statement 2021-22
| | | | | | | | | | | | | | | | | | |
| Education | |
Project | | Statistical
Area | | Total
Estimated
Cost
$‘000 | | | Expenditure
to
30-06-21
$‘000 | | | Budget
2021-22
$‘000 | | | Post
2021-22
$‘000 | |
Rochedale State School - Additional classrooms | | 303 | | | 13,984 | | | | | | | | 4,195 | | | | 9,789 | |
Rockhampton North Special School - Additional classrooms | | 308 | | | 14,628 | | | | | | | | 7,314 | | | | 7,314 | |
Rockhampton State High School - School security fence | | 308 | | | 651 | | | | | | | | 651 | | | | | |
Rosella Park School - Additional classrooms | | 308 | | | 8,740 | | | | 1,268 | | | | 7,472 | | | | | |
Rosewood State High School - Additional classrooms | | 310 | | | 6,440 | | | | | | | | 1,868 | | | | 4,572 | |
Spinifex State College - Mount Isa - Student residential amenitie supgrades | | 315 | | | 320 | | | | | | | | 320 | | | | | |
Spinifex State College - Mount Isa - Senior Campus-Amenitiesupgrades | | 315 | | | 352 | | | | 16 | | | | 336 | | | | | |
Spinifex State College - Mount Isa - Senior Campus-School security fence | | 315 | | | 651 | | | | | | | | 651 | | | | | |
Springfield Central State School - Additional classrooms | | 310 | | | 8,556 | | | | 1,511 | | | | 7,045 | | | | | |
Southport Special School - Bus and taxi set down | | 309 | | | 550 | | | | 11 | | | | 539 | | | | | |
Southport State High School - Replacement building-Fire rectification | | 309 | | | 4,895 | | | | 2,021 | | | | 2,874 | | | | | |
Stretton State College - Additional classrooms | | 303 | | | 10,011 | | | | 2,319 | | | | 7,692 | | | | | |
Sunnybank Special School - Additional classrooms | | 303 | | | 7,544 | | | | | | | | 4,416 | | | | 3,128 | |
Sunset State School - Amenities upgrades | | 315 | | | 400 | | | | | | | | 400 | | | | | |
Tagai State College - Thursday Island Primary Campus - Amenities upgrades | | 315 | | | 1,360 | | | | 96 | | | | 1,264 | | | | | |
Taigum State School - Additional classrooms | | 302 | | | 2,392 | | | | | | | | 719 | | | | 1,673 | |
Tannum Sands State School - Amenities upgrades | | 308 | | | 480 | | | | | | | | 480 | | | | | |
47
Capital Statement 2021-22
| | | | | | | | | | | | | | | | | | |
| Education | |
Project | | Statistical
Area | | Total
Estimated
Cost
$‘000 | | | Expenditure
to
30-06-21
$‘000 | | | Budget
2021-22
$‘000 | | | Post
2021-22
$‘000 | |
Taroom State School-Amenities upgrades | | 308 | | | 1,200 | | | | 274 | | | | 926 | | | | | |
The Gap State High School - Additional classrooms | | 304 | | | 11,316 | | | | 5,741 | | | | 5,575 | | | | | |
Toolooa State High School - Additional classrooms | | 308 | | | 7,176 | | | | | | | | 1,656 | | | | 5,520 | |
Toowong State School-Additional classrooms | | 305 | | | 6,938 | | | | 5,763 | | | | 1,175 | | | | | |
Toowoomba West Special School - Additional classrooms | | 317 | | | 2,852 | | | | 397 | | | | 2,455 | | | | | |
Toowoomba West Special School - Administration upgrades | | 317 | | | 3,600 | | | | | | | | 3,600 | | | | | |
Townsville Community Learning | | 318 | | | 6,992 | | | | 334 | | | | 6,658 | | | | | |
Centre-A State Special School - Additional classrooms | | | | | | | | | | | | | | | | | | |
Urangan State High School - School security fence | | 319 | | | 959 | | | | | | | | 959 | | | | | |
Victoria Point State High School - Additional classrooms | | 301 | | | 8,648 | | | | | | | | 2,594 | | | | 6,054 | |
Virginia State School - Amenities upgrades | | 302 | | | 800 | | | | | | | | 800 | | | | | |
Walloon State School - Additional classrooms | | 310 | | | 4,784 | | | | | | | | 1,410 | | | | 3,374 | |
Warwick East State School - Structural rectification of heritage building | | 307 | | | 968 | | | | 624 | | | | 344 | | | | | |
Waterford West State School - Additional classrooms | | 311 | | | 6,900 | | | | | | | | 4,140 | | | | 2,760 | |
Watson Road State School - School security fence | | 303 | | | 456 | | | | | | | | 456 | | | | | |
West End State School - Additional classrooms - Stage 2 | | 305 | | | 28,915 | | | | 9,105 | | | | 19,810 | | | | | |
Wilsonton State High School - Additional classrooms | | 317 | | | 15,180 | | | | 1,409 | | | | 13,771 | | | | | |
Windsor State School - Additional classrooms | | 305 | | | 7,696 | | | | 6,867 | | | | 829 | | | | | |
Wishart State School - Additional classrooms | | 303 | | | 5,888 | | | | | | | | 1,380 | | | | 4,508 | |
Wishart State School - Additional classrooms in existing building | | 303 | | | 1,472 | | | | 220 | | | | 1,252 | | | | | |
48
Capital Statement 2021-22
| | | | | | | | | | | | | | | | | | |
| Education | |
Project | | Statistical
Area | | Total
Estimated
Cost
$‘000 | | | Expenditure
to
30-06-21
$‘000 | | | Budget
2021-22
$‘000 | | | Post
2021-22
$‘000 | |
Woongarra State School - Wastewater and water service | | 319 | | | 550 | | | | 22 | | |
| 528
140,838 |
| | | | |
Wooloowin State School - Additional classrooms | | 305 | | | 8,924 | | | | | | | | 5,359 | | | | 3,565 | |
Yarrabilba State School - Additional classrooms | | 311 | | | 19,320 | | | | 827 | | | | 18,493 | | | | | |
Yeppoon State High School - Additional classrooms | | 308 | | | 8,786 | | | | 1,578 | | | | 7,208 | | | | | |
Yeronga State School-Additional classrooms | | 303 | | | 8,004 | | | | 1,164 | | | | 6,840 | | | | | |
Yugumbir State School-School security fence | | 311 | | | 531 | | | | | | | | 531 | | | | | |
Advancing Clean Energy Schools | | Various | | | 151,290 | | | | 90,673 | | | | 39,287 | | | | 21,330 | |
Air conditioning installation and replacement as part of the Cooler Cleaner Schools Program | | Various | | | 269,023 | | | | 138,070 | | | | 53,938 | | | | 77,015 | |
General and minor works | | Various | | | | | | | | | | | 139,492 | | | | Ongoing | |
Land acquisition | | Various | | | | | | | | | | | 120,905 | | | | Ongoing | |
School infrastructure enhancement | | Various | | | | | | | | | | | 24,000 | | | | Ongoing | |
School Subsidy Scheme | | Various | | | | | | | | | | | 9,100 | | | | Ongoing | |
Shovel Ready Program-Various minor works | | Various | | | 38,250 | | | | 1,700 | | | | 10,200 | | | | 26,350 | |
| | | | | | | | | | | | | | | | | | |
Sub-total Education Capital Works Program | | | | | | | | 1,376,323 | | | | | |
| | | | | | | | | | | | | | | | | | |
Early Childhood Education and Care Capital Works Program | | | | | | | | | | | | | | | | | | |
General and minor works | | Various | | | | | | | | | | | 6,600 | | | | Ongoing | |
| | | | | | | | | | | | | | | | | | |
Sub-total Early Childhood Education and Care Capital Works Program | | | | 6,600 | | | | | |
| | | | | | | | | | | | | | | | | | |
Plant and Equipment | | | | | | | | | | | | | | | | | | |
Education plant and equipment | | Various | | | | | | | | | | | 60,028 | | | | Ongoing | |
Office of Industrial Relations plant and equipment | | Various | | | | | | | | | | | 3,678 | | | | Ongoing | |
| | | | | | | | | | | | | | | | | | |
Sub-total Plant and Equipment | | | | | | | | | | | | | 63,706 | | | | | |
| | | | | | | | | | | | | | | | | | |
Total Property, Plant and Equipment | | | | | | | | | | | | | 1,446,629 | | | | | |
| | | | | | | | | | | | | | | | | | |
Capital Grants | | | | | | | | | | | | | | | | | | |
Capital grants-Education | | Various | | | | | | | | | | | 116,708 | | | | Ongoing | |
Racing Infrastructure Fund | | Various | | | 129,270 | | | | 63,842 | | | | 21,530 | | | | 43,898 | |
Country Racing Program | | Various | | | 15,600 | | | | 10,400 | | | | 2,600 | | | | 2,600 | |
| | | | | | | | | | | | | | | | | | |
| | | | | | | | | | | | | | | | | | |
Total Capital Grants | | | | | | | | | | | | | 140,838 | | | | | |
| | | | | | | | | | | | | | | | | | |
49
Capital Statement 2021-22
| | | | | | | | | | | | | | | | | | |
| Education | |
Project | | Statistical
Area | | Total
Estimated
Cost
$‘000 | | | Expenditure
to
30-06-21
$‘000 | | | Budget
2021-22
$‘000 | | | Post
2021-22
$‘000 | |
TOTAL EDUCATION (PPE) | | | | | | | | | | | | | | | | | | |
| | | | | | | | | | | | | | | | |
| | | | | | | | | | | | | 1,446,629 | | | | | |
| | | | | | | | | | | | | | | | | | |
TOTAL EDUCATION (CG) | | | | | | | | | | | | | 140,838 | | | | | |
| | | | | | | | | | | | | | | | | | |
Notes:
| 1. | Refers to funding allocated in the 2021-22 Budget for 4 new schools to open in 2023 (new primary schools in Yarrabilba, Ripley and the Augustine Heights/Redbank Plains area, and a new secondary school in Palmview) and 6 new schools to open in 2024 (primary schools in Redland Bay, Bellbird Park and the Logan Reserve/Crestmead/Park Ridge area, and secondary schools in Springfield and the Collingwood Park/Redbank Plains and Logan Reserve/Park Ridge areas). Funding for a new primary school in Brisbane’s inner-west, which will also open in 2024, was announced in the 2020-21 Budget and is listed separately. |
| 2. | Site for the school-based hub is yet to be determined. |
50
Capital Statement 2021-22
| 3.5 | EMPLOYMENT, SMALL BUSINESS AND TRAINING |
Total capital purchases for the Employment, Small Business and Training portfolio, including TAFE Queensland, are $77.7 million in 2021-22. Total capital grants for the portfolio are $34.6 million in 2021-22.
Department of Employment, Small Business and Training
The 2021-22 capital program for the Department of Employment, Small Business and Training of $88.4 million includes $47.8 million of the $100 million Equipping TAFE for Our Future program. The Equipping TAFE for our Future program seeks to build on the outcomes of the Advancing our Training Infrastructure commitment. It supports training requirements of emerging industries whilst strengthening the productivity of existing industries as Queensland transitions from the impacts of COVID-19.
The capital program also includes $5 million of capital grants for construction of a Renewable Energy Training Facility, second stage of the Queensland Apprenticeship Centre at Beenleigh, incorporating a Hydrogen Training Centre of Excellence, and Revitalising TAFE campuses across Australia initiative, jointly funded with the Australian Government. The capital program includes a further $28.2 million for the Annual Training Infrastructure Program to renew and revitalise training infrastructure across the State, to improve accessibility to the necessary skills and training required to boost labour market productivity and aid economic recovery.
Program Highlights (Property, Plant and Equipment)
| • | | $18.2 million for the commencement and delivery of Equipping TAFE for our Future projects including Eagle Farm Robotics and Advanced Manufacturing Centre, Bundamba Metal Trades, Manufacturing and Robotics Centre, Bohle Advanced Manufacturing Skills Labratory and Bowen Agricultural Centre of Excellence. |
| • | | $7.5 million for the delivery of the Revitalising TAFE campuses across Australia initiative. Projects include Coomera Marine Centre of Excellence, Mount Isa upgrade to engineering and trade workshops and Alexandra Hills electro-engineering upgrades. |
Program Highlights (Capital Grants)
| • | | $3 million in 2021-22 of $17 million for completion of the Renewable Energy Training Facility. |
| • | | $2 million in 2021-22 of $20 million for completion of the Hydrogen Training Centre of Excellence at Queensland Apprenticeship Centre Beenleigh. |
| • | | $29.6 million for Equipping TAFE for our Future projects including fit out at the new Robina TAFE Campus, the Training Centre of Excellence as the first stage |
51
Capital Statement 2021-22
of the Central Queensland University Rockhamptom Campus consolidation and Mackay Ooralea Trade Training Centre Expansion by Central Queensland University.
| | | | | | | | | | | | | | | | | | | | |
| Employment, Small Business and Training | |
Project | | Statistical
Area | | | Total
Estimated
Cost
$‘000 | | | Expenditure
to 30-06-21
$‘000 | | | Budget
2021-22
$‘000 | | | Post
2021-22
$‘000 | |
DEPARTMENT OF EMPLOYMENT, SMALL BUSINESS AND TRAINING | | | | | | | | | | | | | | | | | | | | |
Property, Plant and Equipment | | | | | | | | | | | | | | | | | | | | |
Equipping TAFE for Our Future | | | | | | | | | | | | | | | | | | | | |
Bundamba Metal Trades, Manufacturing and Robotics Centre | | | 310 | | | | 7,000 | | | | | | | | 3,325 | | | | 3,675 | |
Bowen Agricultural Centre of Excellence | | | 318 | | | | 3,400 | | | | 255 | | | | 3,145 | | | | | |
Eagle Farm Robotics and Advanced Manufacturing Centre | | | 302 | | | | 28,900 | | | | | | | | 2,168 | | | | 26,732 | |
Cannonvale Aquaculture Training Centre | | | 312 | | | | 2,000 | | | | 150 | | | | 1,850 | | | | | |
Mooloolaba Cyber Security Training Operation Centre | | | 316 | | | | 2,000 | | | | 150 | | | | 1,850 | | | | | |
Bohle Advanced Manufacturing Skills Lab | | | 318 | | | | 3,600 | | | | | | | | 1,710 | | | | 1,890 | |
Bundaberg Agriculture and Horticulture Centre | | | 319 | | | | 3,350 | | | | | | | | 1,591 | | | | 1,759 | |
Hervey Bay Nursing and Allied Health Upgrades | | | 319 | | | | 1,200 | | | | 90 | | | | 1,110 | | | | | |
Toowoomba Rural Centre of Excellence | | | 317 | | | | 1,000 | | | | 75 | | | | 925 | | | | | |
Cairns Advanced Manufacturing Hub | | | 306 | | | | 3,600 | | | | | | | | 270 | | | | 3,330 | |
Cairns Cyber Security Training Operation Centre | | | 306 | | | | 2,000 | | | | | | | | 150 | | | | 1,850 | |
Bundaberg Maker Space Revitalising TAFE | | | 319 | | | | 1,000 | | | | | | | | 75 | | | | 925 | |
Revitalising TAFE - Coomera Marine Centre of Excellence | | | 309 | | | | 11,082 | | | | 5,820 | | | | 5,262 | | | | | |
Revitalising TAFE - Statewide Trade Modernisation - Mount Isa | | | 318 | | | | 1,500 | | | | 250 | | | | 1,250 | | | | | |
Revitalising TAFE - Statewide Trade Modernisation - Alexandra Hills | | | 301 | | | | 1,208 | | | | 250 | | | | 958 | | | | | |
52
Capital Statement 2021-22
| | | | | | | | | | | | | | | | | | | | |
| Employment, Small Business and Training | |
Project | | Statistical
Area | | | Total
Estimated
Cost
$‘000 | | | Expenditure
to 30-06-21
$‘000 | | | Budget
2021-22
$‘000 | | | Post 2021-
22 $‘000 | |
Hills | | | | | | | | | | | | | | | | | | | | |
Annual Training Investment Program | | | 302 | | | | | | | | | | | | 28,169 | | | | Ongoing | |
| | | | | | | | | | | | | | | | | | | | |
Total Property, Plant and Equipment | | | | | | | | | | | | | | | 53,808 | | | | | |
| | | | | | | | | | | | | | | | | | | | |
Capital Grants | | | | | | | | | | | | | | | | | | | | |
Equipping TAFE for our Future | | | | | | | | | | | | | | | | | | | | |
New Robina Campus fitout | | | 309 | | | | 10,000 | | | | | | | | 10,000 | | | | | |
Central Queensland University Rockhampton Campus Consolidation and Training Centre | | | 308 | | | | 8,400 | | | | 400 | | | | 8,000 | | | | | |
Mackay Ooralea Trade Training Centre Expansion | | | 312 | | | | 7,500 | | | | | | | | 7,500 | | | | | |
Southbank Cyber Security Training Operation Centre | | | 303 | | | | 2,000 | | | | 150 | | | | 1,850 | | | | | |
Yarrabilba Community TAFE Learning Centre (CTLC) | | | 311 | | | | 1,500 | | | | 113 | | | | 1,387 | | | | | |
Southbank Robotics Lab | | | 303 | | | | 950 | | | | 71 | | | | 879 | | | | | |
Renewable Energy Training Facility | | | 302 | | | | 17,000 | | | | 14,000 | | | | 3,000 | | | | | |
Hydrogen Apprenticeships Centre | | | 311 | | | | 20,000 | | | | 18,000 | | | | 2,000 | | | | | |
| | | | | | | | | | | | | | | | | | | | |
Total Capital Grants | | | | | | | | | | | | | | | 34,616 | | | | | |
| | | | | | | | | | | | | | | | | | | | |
TAFE QUEENSLAND | | | | | | | | | | | | | | | | | | | | |
Property, Plant and Equipment | | | | | | | | | | | | | | | | | | | | |
Training and operational equipment acquisition, replacement and modernisation | | | Various | | | | | | | | | | | | 8,682 | | | | Ongoing | |
Product development | | | Various | | | | | | | | | | | | 1,000 | | | | Ongoing | |
One Network | | | Various | | | | | | | | | | | | 960 | | | | Ongoing | |
Identity Access Management build | | | Various | | | | 1,500 | | | | | | | | 1,500 | | | | | |
Contact Centre technology refresh | | | Various | | | | 1,499 | | | | 43 | | | | 1,456 | | | | | |
ICT program of work | | | Various | | | | | | | | | | | | 1,282 | | | | Ongoing | |
Robina Campus fitout and equipment | | | 309 | | | | 9,335 | | | | 335 | | | | 9,000 | | | | | |
| | | | | | | | | | | | | | | | | | | | |
Total Property, Plant and Equipment | | | | | | | | | | | | | | | 23,880 | | | | | |
| | | | | | | | | | | | | | | | | | | | |
TOTAL EMPLOYMENT, SMALL BUSINESS AND TRAINING (PPE) | | | | 77,688 | | | | | |
| | | | | | | | | | | | | | | | | | | | |
TOTAL EMPLOYMENT, SMALL BUSINESS AND TRAINING (CG) | | | | 34,616 | | | | | |
| | | | | | | | | | | | | | | | | | | | |
53
Capital Statement 2021-22
| 3.6 | ENERGY AND PUBLIC WORKS |
The Energy and Public Works portfolio includes the Department of Energy and Public Works, energy government-owned corporations, and statutory bodies reporting to the Minister for Energy, Renewables and Hydrogen and Minister for Public Works and Procurement. The portfolio’s capital program for 2021-22 is $2.383 billion.
Department of Energy and Public Works
Total capital purchases for the Department of Energy and Public Works are $134.4 million in 2021-22.
Program Highlights (Property, Plant and Equipment)
| • | | $73.6 million for the expansion and refurbishment of the Cairns Convention Centre to capitalise on the national and international convention centre markets. |
| • | | $44.6 million for a capital and upgrade program to deliver safe and improved employee housing in regional and remote locations across the State, including Aboriginal and Torres Strait Islander communities, thereby enabling key government workers including police, teachers, health professionals to deliver essential frontline services to Queenslanders. |
CleanCo Queensland Limited
Total capital expenditure planned for 2021-22 is $222 million. The capital program is focused on overhauls, maintenance and upgrades of generator units and establishing trading and enterprise resource planning systems.
Program Highlights (Property, Plant and Equipment)
| • | | $144.9 million to develop the Karara Wind Farm. |
| • | | $24.6 million to develop Kogan North Gas Fields. |
| • | | $17.1 million for scheduled major overhaul of existing infrastructure at Wivenhoe W1 Power Station. |
| • | | $5.6 million for scheduled major overhaul of existing infrastructure at Swanbank E Power Station. |
CS Energy Limited
Total capital expenditure planned for 2021-22 is $80.8 million. This reflects CS
Energy’s continued commitment to ongoing reliability and efficiency of generation plant at its power station sites.
54
Capital Statement 2021-22
Highlights (Property, Plant and Equipment)
| • | | $53.6 million for overhauls, enhancements and refurbishments to existing infrastructure at Callide Power Station, including $43.5 million at Callide B. |
| • | | $16.5 million for overhauls, enhancements and refurbishments to existing infrastructure at Kogan Creek Power Station. |
| • | | $8.3 million to support the diversification of CS Energy’s portfolio to Future Energy Investments. |
| • | | $2.4 million for developments and refurbishments to Kogan Creek Mine. |
Energy Queensland Limited
Total capital expenditure planned for 2021-22 is $1.536 billion and forms part of Energy Queensland’s commitment to providing safe, secure and highly reliable electricity to supply to all Queensland customers. Energy Queensland is focused on safety, efficiency, asset management and network capability. The capital program aims to improve and reinforce electricity supplies across Queensland to meet customer needs, especially to cover periods of peak and minimum electricity demand.
Program Highlights (Property, Plant and Equipment)
| • | | $39.9 million to establish five community-scale, grid-connected battery energy storage systems throughout the state. |
| • | | $30.3 million to replace the ageing 66kV powerline between Childers and Gayndah. |
| • | | $17.5 million to continue work on the redevelopment of the Greenslopes depot. |
| • | | $11.8 million to replace 66kV outdoor switchgear at Garbutt substation. |
| • | | $8 million to continue the upgrade of Mackay’s Tennyson Street substation. |
| • | | $7 million to continue the upgrade of Kilcoy’s substation. |
Powerlink Queensland
Total capital expenditure planned for 2021-22 is $239.5 million. Powerlink Queensland is the high voltage electricity transmission entity for Queensland. It is predominately focussed on replacement of aged equipment and assets to ensure continued reliable supply of electricity.
Program Highlights (Property, Plant and Equipment)
| • | | $37 million towards the Kidston Hydro 275kV Transmission Network Connection. |
| • | | $8.8 million to replace aged primary plant at Bouldercombe Substation near Rockhampton. |
55
Capital Statement 2021-22
| • | | $7.3 million to replace the soon to be obsolete energy management system providing real time monitoring of the transmission network. |
| • | | $5.1 million to replace aged secondary systems at Nebo Substation south west of Mackay. |
| • | | $4.2 million to replace aged secondary systems at the Gladstone South Substation. |
Stanwell Corporation Limited
Total capital expenditure planned for 2021-22 is $170.2 million. This reflects Stanwell’s continued commitment to ongoing reliability and efficiency of generation plant at its power station sites.
Program Highlights (Property, Plant and Equipment)
| • | | $31.8 million for overhaul of generation assets and statutory inspections of infrastructure at Stanwell Power Station. |
| • | | $20.9 million for sustaining and refurbishing existing infrastructure and auxiliary systems at Tarong Power Station. |
| • | | $16.1 million to replace and refurbish handling equipment and infrastructure at Meandu Mine. |
| • | | $14.9 million to overhaul the turbine systems at Stanwell Power Station. |
| | | | | | | | | | | | | | | | | | |
| Energy and Public Works | |
Project | | Statistical
Area | | Total
Estimated
Cost
$‘000 | | | Expenditure
to
30-06-21
$‘000 | | | Budget
2021-22
$‘000 | | | Post
2021-22
$‘000 | |
DEPARTMENT OF ENERGY AND PUBLIC WORKS | | | | | | | | | | | | | | | | | | |
Property, Plant and Equipment | | | | | | | | | | | | | | | | | | |
Cairns Convention Centre expansion and refurbishment | | 306 | | | 172,171 | | | | 98,592 | | | | 73,579 | | | | | |
Thomas Dixon Centre refurbishment | | 305 | | | 82,407 | | | | 80,709 | | | | 1,698 | | | | | |
Government Employee Housing | | Various | | | | | | | | | | | 44,626 | | | | Ongoing | |
Office Accommodation Program | | Various | | | | | | | | | | | 12,655 | | | | Ongoing | |
Building works and capital replacements | | Various | | | | | | | | | | | 500 | | | | Ongoing | |
Other property, plant and equipment | | Various | | | | | | | | | | | 1,358 | | | | Ongoing | |
| | | | | | | | | | | | | | | | | | |
Total Property, Plant and Equipment | | | | | | | | | | | | | 134,416 | | | | | |
| | | | | | | | | | | | | | | | | | |
56
Capital Statement 2021-22
| | | | | | | | | | | | | | | | | | | | |
| Energy and Public Works | |
Project | | Statistical
Area | | | Total
Estimated
Cost
$‘000 | | | Expenditure
to
30-06-21
$‘000 | | | Budget
2021-22
$‘000 | | | Post
2021-22
$‘000 | |
| CLEANCO QUEENSLAND LIMITED | | | | | | | | | | | | | | | |
| Property, Plant and Equipment | | | | | | | | | | | | | | | |
Karara Wind Farm development | | | 307 | | | | 250,000 | | | | 1,000 | | | | 144,912 | | | | 104,088 | |
Kogan North Gas Fields development | | | 307 | | | | | | | | | | | | 24,556 | | | | Ongoing | |
Wivenhoe major overhauls | | | 310 | | | | | | | | | | | | 17,084 | | | | Ongoing | |
Wivenhoe other projects | | | 310 | | | | | | | | | | | | 9,450 | | | | Ongoing | |
Swanbank E major overhaul | | | 310 | | | | | | | | | | | | 5,649 | | | | Ongoing | |
Swanbank E other projects | | | 310 | | | | | | | | | | | | 9,510 | | | | Ongoing | |
Kareeya Hydro other projects | | | 306 | | | | | | | | | | | | 4,190 | | | | Ongoing | |
Barron Gorge Hydro other projects | | | 306 | | | | | | | | | | | | 1,488 | | | | Ongoing | |
Koombooloomba Dam other projects | | | 306 | | | | | | | | | | | | 128 | | | | Ongoing | |
Other corporate projects | | | 305 | | | | | | | | | | | | 5,060 | | | | Ongoing | |
| | | | | | | | | | | | | | | | | | | | |
Total Property, Plant and Equipment | | | | | | | | | | | | | | | 222,027 | | | | | |
| | | | | | | | | | | | | | | | | | | | |
CS ENERGY LIMITED | | | | | | | | | | | | | | | | | | | | |
Property, Plant and Equipment | | | | | | | | | | | | | | | | | | | | |
Callide Power Station enhancements, | | | 308 | | | | | | | | | | | | 53,575 | | | | Ongoing | |
overhauls and refurbishment | | | | | | | | | | | | | | | | | | | | |
Kogan Creek Power Station | | | 307 | | | | | | | | | | | | 16,548 | | | | Ongoing | |
enhancements, overhauls and refurbishment | | | | | | | | | | | | | | | | | | | | |
Kogan Creek Mine developments | | | 307 | | | | | | | | | | | | 2,422 | | | | Ongoing | |
and refurbishment | | | | | | | | | | | | | | | | | | | | |
Future Energy Investments | | | 305 | | | | | | | | | | | | 8,262 | | | | Ongoing | |
| | | | | | | | | | | | | | | | | | | | |
Total Property, Plant and Equipment | | | | | | | | | | | | | | | 80,807 | | | | | |
| | | | | | | | | | | | | | | | | | | | |
ENERGY QUEENSLAND LIMITED | | | | | | | | | | | | | | | | | | | | |
Property, Plant and Equipment | | | | | | | | | | | | | | | | | | | | |
System Connections | | | | | | | | | | | | | | | | | | | | |
Network Connections - Ergon Energy | | | Various | | | | | | | | | | | | 62,876 | | | | Ongoing | |
Network Connections - Brisbane | | | Various | | | | | | | | | | | | 44,155 | | | | Ongoing | |
Network Connections - Gold Coast | | | 309 | | | | | | | | | | | | 8,418 | | | | Ongoing | |
57
Capital Statement 2021-22
| | | | | | | | | | | | | | | | | | | | |
| Energy and Public Works | |
Project | | Statistical
Area | | | Total
Estimated
Cost
$‘000 | | | Expenditure
to
30-06-21
$‘000 | | | Budget
2021-22
$‘000 | | | Post
2021-22
$‘000 | |
Network Connections - Ipswich | | | 310 | | | | | | | | | | | | 4,760 | | | | Ongoing | |
Network Connections - Sunshine Coast | | | 316 | | | | | | | | | | | | 13,592 | | | | Ongoing | |
Replacements | | | | | | | | | | | | | | | | | | | | |
Replace transformers & Switchgear at Black Mountain | | | 316 | | | | 10,750 | | | | 5,300 | | | | 2,136 | | | | 3,314 | |
Replace 66kV outdoor switchgear at Garbutt | | | 318 | | | | 28,609 | | | | 1,500 | | | | 11,832 | | | | 15,277 | |
M028 Childers - Gayndah - aged line rebuild | | | 319 | | | | 75,860 | | | | 1,561 | | | | 30,250 | | | | 44,049 | |
Kilcoy Substation Upgrade | | | 313 | | | | 16,280 | | | | 5,822 | | | | 6,977 | | | | 3,481 | |
Howard Substation Refurbishment | | | 319 | | | | 11,301 | | | | 9,120 | | | | 954 | | | | 1,227 | |
Glenore Grove Substation Upgrade | | | 310 | | | | 7,710 | | | | 4,745 | | | | 2,893 | | | | 72 | |
Emerald Cornet Substation Upgrade | | | 308 | | | | 5,145 | | | | 2,769 | | | | 908 | | | | 1,468 | |
Dysart Substation Upgrade | | | 312 | | | | 14,580 | | | | 12,742 | | | | 1,838 | | | | | |
Charters Towers Substation Upgrade | | | 318 | | | | 5,360 | | | | 3,849 | | | | 1,511 | | | | | |
Mackay Tennyson Street Substation Upgrade | | | 312 | | | | 27,990 | | | | 19,976 | | | | 8,014 | | | | | |
Surfers Paradise Substation Upgrade | | | 309 | | | | 8,142 | | | | 1,889 | | | | 6,253 | | | | | |
Yarranlea Substation Upgrade | | | 307 | | | | 11,610 | | | | 9,557 | | | | 2,053 | | | | | |
Richlands Substation Upgrade | | | 310 | | | | 6,640 | | | | 5,233 | | | | 1,407 | | | | | |
Redcliffe Substation Upgrade | | | 313 | | | | 9,740 | | | | 8,653 | | | | 1,087 | | | | | |
Network Replacement | | | | | | | | | | | | | | | | | | | | |
Network replacement - Wide Bay - Energex | | | 319 | | | | | | | | | | | | 2,411 | | | | Ongoing | |
Network replacement - Brisbane | | | Various | | | | | | | | | | | | 79,056 | | | | Ongoing | |
Network replacement - Gold Coast | | | 309 | | | | | | | | | | | | 18,427 | | | | Ongoing | |
Network replacement - Ipswich | | | 310 | | | | | | | | | | | | 10,478 | | | | Ongoing | |
Network replacement - Sunshine Coast | | | 316 | | | | | | | | | | | | 26,201 | | | | Ongoing | |
Network replacement - Wide Bay - Ergon | | | 319 | | | | | | | | | | | | 42,110 | | | | Ongoing | |
58
Capital Statement 2021-22
| | | | | | | | | | | | | | | | | | |
| ENERGY and Public Works | |
Project | | Statistical
Area | | Total
Estimated
Cost
$‘000 | | | Expenditure
to
30-06-21
$‘000 | | | Budget
2021-22
$‘000 | | | Post
2021-22
$‘000 | |
Network replacement - Townsville | | 318 | | | | | | | | | | | 84,221 | | | | Ongoing | |
Network replacement - Toowoomba | | 317 | | | | | | | | | | | 42,110 | | | | Ongoing | |
Network replacement - Outback Queensland | | 315 | | | | | | | | | | | 84,221 | | | | Ongoing | |
Network replacement - Mackay | | 312 | | | | | | | | | | | 84,221 | | | | Ongoing | |
Network replacement - Central Queensland | | 308 | | | | | | | | | | | 21,055 | | | | Ongoing | |
Network replacement - Darling Downs | | 307 | | | | | | | | | | | 21,055 | | | | Ongoing | |
Network replacement - Cairns | | 306 | | | | | | | | | | | 84,221 | | | | Ongoing | |
Augmentation | | | | | | | | | | | | | | | | | | |
Cannonvale-Jubilee Pocket 66kV Reinforcement | | 312 | | | 17,820 | | | | 250 | | | | 5,085 | | | | 12,485 | |
Gracemere Substation Network Augmentation | | 308 | | | 10,900 | | | | 8,473 | | | | 2,427 | | | | | |
Network augmentation - Wide Bay | | 319 | | | | | | | | | | | 10,855 | | | | Ongoing | |
Network augmentation - Townsville | | 318 | | | | | | | | | | | 21,711 | | | | Ongoing | |
Network augmentation - Toowoomba | | 317 | | | | | | | | | | | 10,855 | | | | Ongoing | |
Network augmentation - Outback Queensland | | 315 | | | | | | | | | | | 21,711 | | | | Ongoing | |
Network augmentation - Mackay | | 312 | | | | | | | | | | | 21,711 | | | | Ongoing | |
Network augmentation - Central Queensland | | 308 | | | | | | | | | | | 5,428 | | | | Ongoing | |
Network augmentation - Darling Downs | | 307 | | | | | | | | | | | 5,428 | | | | Ongoing | |
Network augmentation - Cairns | | 306 | | | | | | | | | | | 21,711 | | | | Ongoing | |
Network augmentation - Brisbane | | Various | | | | | | | | | | | 37,608 | | | | Ongoing | |
Network augmentation - Gold Coast | | 309 | | | | | | | | | | | 16,885 | | | | Ongoing | |
Network augmentation - Ipswich | | 310 | | | | | | | | | | | 6,841 | | | | Ongoing | |
59
Capital Statement 2021-22
| | | | | | | | | | | | | | | | | | |
| ENERGY and Public Works | |
Project | | Statistical
Area | | Total
Estimated
Cost
$‘000 | | | Expenditure
to
30-06-21
$‘000 | | | Budget
2021-22
$‘000 | | | Post
2021-22
$‘000 | |
Network augmentation - Sunshine Coast | | 316 | | | | | | | | | | | 20,443 | | | | Ongoing | |
Non-Regulated | | | | | | | | | | | | | | | | | | |
Yurika digital platform | | 305 | | | | | | | | | | | 700 | | | | Ongoing | |
Ergon Energy Retail Information Communications and Technology | | 305 | | | | | | | | | | | 6,883 | | | | Ongoing | |
Metering Dynamics | | 305 | | | | | | | | | | | 44,727 | | | | Ongoing | |
Yurika Infrastructure Services Build, Own, Operate and Maintain | | Various | | | | | | | | | | | 30,120 | | | | Ongoing | |
Grid Scale Battery Storage Project | | Various | | | 40,000 | | | | 60 | | | | 39,940 | | | | | |
Other Isolated Systems Capital Work | | Various | | | | | | | | | | | 27,856 | | | | Ongoing | |
ICT | | | | | | | | | | | | | | | | | | |
Digital office capital expenditure - Energy Queensland | | Various | | | | | | | | | | | 136,600 | | | | Ongoing | |
Alternative Control Services | | | | | | | | | | | | | | | | | | |
Customer initiated works - Ergon Energy | | Various | | | | | | | | | | | 62,733 | | | | Ongoing | |
Customer initiated works - Brisbane | | Various | | | | | | | | | | | 42,019 | | | | Ongoing | |
Customer initiated works - Gold Coast | | 309 | | | | | | | | | | | 18,470 | | | | Ongoing | |
Customer initiated works - Ipswich | | 310 | | | | | | | | | | | 7,367 | | | | Ongoing | |
Customer initiated works - Sunshine Coast | | 316 | | | | | | | | | | | 8,013 | | | | Ongoing | |
Customer initiated works - Wide Bay | | 319 | | | | | | | | | | | 3,898 | | | | Ongoing | |
Non-System | | | | | | | | | | | | | | | | | | |
Cairns operational depot development | | 306 | | | 41,053 | | | | 21,053 | | | | 3,500 | | | | 16,500 | |
Vehicles - Ergon Energy | | Various | | | | | | | | | | | 24,527 | | | | Ongoing | |
Vehicles - Energex | | Various | | | | | | | | | | | 14,290 | | | | Ongoing | |
Maryborough Depot Development - Stage 1 | | 319 | | | 20,452 | | | | 679 | | | | 6,300 | | | | 13,473 | |
Greenslopes depot development | | 303 | | | 31,846 | | | | 14,358 | | | | 17,488 | | | | | |
Rockhampton and Townsville Operational Technology Hosting Facility | | Various | | | 26,245 | | | | 20,725 | | | | 5,520 | | | | | |
Property and buildings program - Energex funded | | Various | | | | | | | | | | | 1,738 | | | | Ongoing | |
Property - minor program - Ergon funded | | Various | | | | | | | | | | | 4,554 | | | | Ongoing | |
60
Capital Statement 2021-22
| | | | | | | | | | | | | | | | | | |
| ENERGY and Public Works | |
Project | | Statistical
Area | | Total
Estimated
Cost
$‘000 | | | Expenditure
to
30-06-21
$‘000 | | | Budget
2021-22
$‘000 | | | Post
2021-22
$‘000 | |
Tools and equipment - Ergon Energy | | Various | | | | | | | | | | | 5,900 | | | | Ongoing | |
Tools and Equipment - Energex | | Various | | | | | | | | | | | 2,300 | | | | Ongoing | |
| | | | | | | | | | | | | | | | | | |
Total Property, Plant and Equipment | | | | | | | | | | | | | 1,535,843 | | | | | |
| | | | | | | | | | | | | | | | | | |
POWERLINK QUEENSLAND | | | | | | | | | | | | | | | | | | |
Property, Plant and Equipment | | | | | | | | | | | | | | | | | | |
Kidston Hydro 275kV Transmission Network Connection | | Various | | | 258,200 | | | | 13,315 | | | | 37,033 | | | | 207,852 | |
Mackay Substation replacement | | 312 | | | 29,145 | | | | 27,257 | | | | 1,794 | | | | 94 | |
Callide A and Calvale 132kV network reinvestment | | 308 | | | 22,500 | | | | 20,997 | | | | 616 | | | | 887 | |
Gin Gin Substation rebuild | | 319 | | | 37,109 | | | | 34,460 | | | | 2,066 | | | | 583 | |
Calvale and Callide B secondary systems replacement | | 308 | | | 20,072 | | | | 15,631 | | | | 1,270 | | | | 3,171 | |
Bouldercombe primary plant replacement | | 308 | | | 40,400 | | | | 17,707 | | | | 8,828 | | | | 13,865 | |
Nebo primary plant replacement | | 312 | | | 25,470 | | | | 17,940 | | | | 3,169 | | | | 4,361 | |
Nebo secondary systems replacement | | 312 | | | 28,630 | | | | 16,987 | | | | 5,091 | | | | 6,552 | |
Total non-prescribed transmission network connections | | Various | | | | | | | | | | | 20,003 | | | | Ongoing | |
Total other projects | | Various | | | | | | | | | | | 144,757 | | | | Ongoing | |
Gladstone South Secondary Systems Replacement | | 308 | | | 20,800 | | | | 2,508 | | | | 4,183 | | | | 14,109 | |
Ross 275kV Primary Plant Replacement | | 318 | | | 21,100 | | | | 4,505 | | | | 3,471 | | | | 13,124 | |
Advanced Energy Management System Replacement | | 302 | | | 50,400 | | | | 33,401 | | | | 7,255 | | | | 9,744 | |
| | | | | | | | | | | | | | | | | | |
Total Property, Plant and Equipment | | | | | | | | | | | | | 239,536 | | | | | |
| | | | | | | | | | | | | | | | | | |
STANWELL CORPORATION LIMITED | | | | | | | | | | | | | | | | | | |
Property, Plant and Equipment | | | | | | | | | | | | | | | | | | |
Stanwell Power Station - overhauls | | 308 | | | | | | | | | | | 31,834 | | | | Ongoing | |
Stanwell Power Station - Turbine overhauls | | 308 | | | | | | | | | | | 14,935 | | | | Ongoing | |
61
Capital Statement 2021-22
| | | | | | | | | | | | | | | | | | | | |
| ENERGY and Public Works | |
Project | | Statistical
Area | | | Total
Estimated
Cost
$‘000 | | | Expenditure
to 30-06-21
$‘000 | | | Budget
2021-22
$‘000 | | | Post 2021-
22 $‘000 | |
Stanwell Power Station - Other Sustaining Projects | | | 308 | | | | | | | | | | | | 12,982 | | | | Ongoing | |
Stanwell Power Station - Ash Storage Project | | | 308 | | | | 14,267 | | | | 47 | | | | 10,647 | | | | 3,573 | |
Stanwell Power Station - Generator Stators | | | 308 | | | | 20,767 | | | | 1,840 | | | | 4,000 | | | | 14,927 | |
Tarong Power Station - Overhauls | | | 319 | | | | | | | | | | | | 242 | | | | Ongoing | |
Tarong Power Station - ash off take project | | | 319 | | | | 11,627 | | | | 9,415 | | | | 2,212 | | | | | |
Tarong Power Station - other sustaining projects | | | 319 | | | | | | | | | | | | 20,936 | | | | Ongoing | |
Tarong Power Station - Low Temperature Reheater Replacement | | | 319 | | | | 10,124 | | | | 100 | | | | 3,400 | | | | 6,624 | |
Tarong Power Station - Control System Upgrade | | | 319 | | | | | | | | | | | | 948 | | | | Ongoing | |
Tarong Power Station - Generator Stators | | | 319 | | | | | | | | | | | | 4,200 | | | | Ongoing | |
Meandu Mine - Truck & Shovel Replacement Program | | | 319 | | | | | | | | | | | | 5,274 | | | | Ongoing | |
Meandu Mine - Dozer Replacement Program | | | 319 | | | | | | | | | | | | 14,563 | | | | Ongoing | |
Meandu Mine - Minor Works | | | 319 | | | | | | | | | | | | 16,117 | | | | Ongoing | |
Meandu Mine - Development Program | | | 319 | | | | | | | | | | | | 14,138 | | | | Ongoing | |
ICT - Hardware and Software Upgrades | | | 305 | | | | | | | | | | | | 10,230 | | | | Ongoing | |
ICT - Five Minute Settlement | | | 305 | | | | | | | | | | | | 2,277 | | | | Ongoing | |
Other Capital Projects | | | 305 | | | | | | | | | | | | 1,232 | | | | Ongoing | |
| | | | | | | | | | | | | | | | | | | | |
Total Property, Plant and Equipment | | | | | | | | | | | | | | | 170,167 | | | | | |
| | | | | | | | | | | | | | | | | | | | |
TOTAL ENERGY AND PUBLIC WORKS (PPE) | | | | | | | | | | | | | | | 2,382,796 | | | | | |
| | | | | | | | | | | | | | | | | | | | |
62
Capital Statement 2021-22
| 3.7 | ENVIRONMENT AND SCIENCE |
Department of Environment and Science
In 2021-22, the Environment and Science portfolio has a capital program of $61.1 million including $57.2 million in capital purchases and $3.8 million in capital grants. The capital program for the Department of Environment and Science reflects the department’s contribution towards achieving a better Queensland through protecting and restoring our environment.
Program Highlights (Property, Plant and Equipment)
| • | | $5.6 million towards delivery of buildings and park infrastructure to support visitor recreation, management and access of parks and recreation areas jointly managed by Traditional Owners and the department. |
| • | | $4.3 million invested in high priority land acquisitions for the expansion of the protected area land portfolio. |
| • | | $3.8 million towards the replacement of major vessels for marine parks management. |
| • | | $3.8 million capital grant for urgent remedial conservation works at Newstead House. |
| • | | $3.5 million to construct the Eastern Yalanjiwarra Culture and Tourism Hub and Visitor Centre at Daintree National Park. |
| • | | $2.1 million to deliver the final tranche of the Government Science Platform. |
| • | | $1.8 million for the redevelopment of visitor facilities, including the camping area and visitor centre at Girraween National Park. |
| • | | $1.6 million to upgrade walking trails on Magnetic Island National Park. |
| • | | $1.5 million for system enhancements to maintain the integrity of waste and resource recovery data. |
| • | | $1.5 million to replace remote area solar power systems at work bases in high priority parks. |
| • | | $1.5 million for enhancement of fire management capability on parks and forests estate. |
| • | | $1.4 million to upgrade visitor infrastructure at Bowling Green Bay National Park. |
| • | | $1 million to acquire land to enhance environmental protection of Great Barrier Reef islands. |
63
Capital Statement 2021-22
| • | | $909,000 towards a major upgrade of Central Station day use area on Fraser Island (K’Gari). |
| | | | | | | | | | | | | | | | | | |
| Environment and Science | |
Project | | Statistical
Area | | Total
Estimated
Cost
$’000 | | | Expenditure
to
30/06/2020
$’000 | | | Budget
2021-22
$’000 | | | Post
020-21
$’000 | |
DEPARTMENT OF ENVIRONMENT AND SCIENCE | | | | | | | | | | | | | | | | | | |
Property, Plant and Equipment | | | | | | | | | | | | | | | | | | |
Buildings and infrastructure | | | | | | | | | | | | | | | | | | |
Joint Management Program | | Various | | | | | | | | | | | 5,601 | | | | Ongoing | |
Daintree National Park - Eastern Yalanjiwarra Culture and Tourism Hub and Visitor Centre | | 306 | | | 3,500 | | | | | | | | 3,500 | | | | | |
Girraween National Park visitor facilities upgrade | | 307 | | | 3,329 | | | | 249 | | | | 1,830 | | | | 1,250 | |
Magnetic Island National Park trails network | | 318 | | | 3,110 | | | | 500 | | | | 1,610 | | | | 1,000 | |
Remote area power systems | | Various | | | 6,010 | | | | 3,051 | | | | 1,459 | | | | 1,500 | |
Bowling Green Bay National Park visitor facilities upgrade | | 318 | | | 1,925 | | | | 320 | | | | 1,425 | | | | 180 | |
Fraser Island (K’Gari) dingo fences | | 319 | | | 2,000 | | | | | | | | 1,000 | | | | 1,000 | |
Fraser Island (K’Gari) - Central Station day use area upgrade | | 319 | | | 4,197 | | | | 1,088 | | | | 909 | | | | 2,200 | |
Crater Lakes National Park walking track upgrade | | 306 | | | 3,450 | | | | | | | | 850 | | | | 2,600 | |
Whitsunday Islands National Park - Ngaro walking track additional facilities and track extension | | 312 | | | 3,700 | | | | | | | | 700 | | | | 3,000 | |
Carnarvon National Park visitor facilities upgrade | | 308 | | | 2,397 | | | | | | | | 667 | | | | 1,730 | |
Girringun National Park - Wallaman Falls visitor facilities upgrade | | 318 | | | 2,000 | | | | | | | | 600 | | | | 1,400 | |
Raine Island beacon conservation | | 315 | | | 562 | | | | | | | | 562 | | | | | |
Daisy Hill Conservation Park Action Plan visitor facilities upgrade | | 311 | | | 2,000 | | | | | | | | 500 | | | | 1,500 | |
Conondale National Park - | | 316 | | | 2,000 | | | | | | | | 500 | | | | 1,500 | |
Booloumba Creek visitor facilities upgrade | | | | | | | | | | | | | | | | | | |
Great Barrier Reef Investment Marine Park reef trails | | Various | | | 2,500 | | | | 300 | | | | 450 | | | | 1,750 | |
64
Capital Statement 2021-22
| | | | | | | | | | | | | | | | | | |
| Environment and Science | |
Project | | Statistical
Area | | Total
Estimated
Cost
$’000 | | | Expenditure
to
30/06/2020
$’000 | | | Budget
2021-22
$’000 | | | Post
020-21
$’000 | |
Mount Archer National Park - Zamia walking track upgrade | | 308 | | | 565 | | | | 150 | | | | 415 | | | | | |
Bunya Mountains National Park visitor facilities upgrade | | 319 | | | 900 | | | | | | | | 400 | | | | 500 | |
Boodjamulla (Lawn Hill) National Park - Riversleigh World Heritage Site and day use area upgrade | | 315 | | | 395 | | | | 171 | | | | 224 | | | | | |
Management and access facilities - parks and forests | | Various | | | | | | | | | | | 6,023 | | | | Ongoing | |
Recreation and visitor facilities - parks and forests | | Various | | | | | | | | | | | 5,984 | | | | Ongoing | |
Plant and equipment | | | | | | | | | | | | | | | | | | |
Marine parks major vessel replacements | | Various | | | 9,384 | | | | 4,348 | | | | 3,768 | | | | 1,268 | |
Parks and forests fire management | | Various | | | 6,800 | | | | 5,300 | | | | 1,500 | | | | | |
Enhanced Air Quality Monitoring equipment | | Various | | | 1,220 | | | | 601 | | | | 396 | | | | 223 | |
General plant and equipment | | Various | | | | | | | | | | | 5,117 | | | | Ongoing | |
Systems development | | | | | | | | | | | | | | | | | | |
Government Science Platform | | Various | | | 7,727 | | | | | | | | 2,138 | | | | 5,589 | |
Waste management systems | | Various | | | 6,500 | | | | | | | | 1,500 | | | | 5,000 | |
Enhanced Air Quality Monitoring systems | | Various | | | 1,050 | | | | 200 | | | | 500 | | | | 350 | |
General systems development Land | | Various | | | | | | | | | | | 1,795 | | | | Ongoing | |
Protected Area Strategy land acquisitions and management | | Various | | | 16,000 | | | | 7,280 | | | | 4,320 | | | | 4,400 | |
Great Barrier Reef Investment Island Arks project | | Various | | | 4,000 | | | | 2,000 | | | | 1,000 | | | | 1,000 | |
| | | | | | | | | | | | | | | | | | |
Total Property, Plant and Equipment | | | | | | | | | | | | | 57,243 | | | | | |
| | | | | | | | | | | | | | | | | | |
Capital Grants | | | | | | | | | | | | | | | | | | |
Newstead House Capital Works Program | | 305 | | | 5,492 | | | | | | | | 3,848 | | | | 1,644 | |
| | | | | | | | | | | | | | | | | | |
Total Capital Grants | | | | | | | | | | | | | 3,848 | | | | | |
| | | | | | | | | | | | | | | | | | |
TOTAL ENVIRONMENT AND SCIENCE (PPE) | | | | | | | | | | | | | 57,243 | | | | | |
| | | | | | | | | | | | | | | | | | |
TOTAL ENVIRONMENT AND SCIENCE (CG) | | | | | | | | | | | | | 3,848 | | | | | |
| | | | | | | | | | | | | | | | | | |
65
Capital Statement 2021-22
| 3.8 | JUSTICE AND ATTORNEY-GENERAL |
The 2021-22 capital acquisitions budget for Justice and Attorney-General (including the Department of Justice and Attorney-General, Public Trustee of Queensland and the Crime and Corruption Commission) is $34.7 million.
Department of Justice and Attorney-General
The Department of Justice and Attorney-General capital acquisitions budget for 2021-22 is $19.7 million.
Program Highlights (Property, Plant and Equipment)
| • | | $7.4 million to expand and upgrade existing audio-visual capacity in the justice system, which includes video conferencing and in-custody court appearances. |
| • | | $6.9 million to continue the ongoing program of minor capital works in courthouses. |
Crime and Corruption Commission
The Crime and Corruption Commission’s 2021-22 capital acquisition budget is $2.3 million.
Program Highlights (Property, Plant and Equipment)
| • | | $1.4 million to replace computer and other information technology equipment and purchase computer software. |
| • | | $870,000 to replace vehicles. |
Public Trustee of Queensland
The 2021-22 capital budget is $12.7 million. This capital budget will enable the Public Trustee of Queensland to continue to provide a wide range of efficient services to the Queensland community, as well as continuing to maintain appropriate workplace health and safety standards for customers and staff.
Program Highlights (Property, Plant and Equipment)
| • | | $9.7 million in right of use assets for office accommodation lease. |
| • | | $3 million for refurbishment of existing regional office premises. |
66
Capital Statement 2021-22
| | | | | | | | | | | | | | | | | | |
| ENERGY and Attorney-General | |
Project | | Statistical
Area | | Total
Estimated
Cost
$‘000 | | | Expenditure
to
30-06-21
$‘000 | | | Budget
2021-22
$‘000 | | | Post
2021-22
$‘000 | |
DEPARTMENT OF JUSTICE AND ATTORNEY-GENERAL | | | | | | | | | | | | | | | | | | |
Property, Plant and Equipment | | | | | | | | | | | | | | | | | | |
Expansion and upgrade of existing audio visual capacity in the justicesystem | | Various | | | | | | | | | | | 7,436 | | | | Ongoing | |
Courthouses - minor capital works | | Various | | | | | | | | | | | 6,925 | | | | Ongoing | |
Minor capital works - software | | 305 | | | | | | | | | | | 2,495 | | | | Ongoing | |
Leasehold improvements | | Various | | | | | | | | | | | 994 | | | | Ongoing | |
Queensland Courts information systems | | 305 | | | | | | | | | | | 795 | | | | Ongoing | |
Other acquisitions of property, plant and equipment | | Various | | | | | | | | | | | 1,081 | | | | Ongoing | |
| | | | | | | | | | | | | | | | | | |
Total Property, Plant and Equipment | | | | | | | | | | | | | 19,726 | | | | | |
| | | | | | | | | | | | | | | | | | |
CRIME AND CORRUPTION COMMISSION | | | | | | | | | | | | | | | | | | |
Property, Plant and Equipment | | | | | | | | | | | | | | | | | | |
Other plant and equipment and computer software | | 305 | | | | | | | | | | | 1,396 | | | | Ongoing | |
Vehicle replacements | | 305 | | | | | | | | | | | 870 | | | | Ongoing | |
| | | | | | | | | | | | | | | | | | |
Total Property, Plant and Equipment | | | | | | | | | | | | | 2,266 | | | | | |
| | | | | | | | | | | | | | | | | | |
PUBLIC TRUSTEE OF QUEENSLAND | | | | | | | | | | | | | | | | | | |
Property, Plant and Equipment Finance lease | | 305 | | | 9,722 | | | | | | | | 9,722 | | | | | |
Major office refurbishments - South Queensland Region | | 309 | | | 1,000 | | | | | | | | 1,000 | | | | | |
Major office refurbishments - Central Queensland Region | | 308 | | | 1,000 | | | | | | | | 1,000 | | | | | |
Major office refurbishments - North Queensland Region | | 306 | | | 1,000 | | | | | | | | 1,000 | | | | | |
| | | | | | | | | | | | | | | | | | |
Total Property, Plant and Equipment | | | | | | | | | | | | | 12,722 | | | | | |
| | | | | | | | | | | | | | | | | | |
TOTAL JUSTICE AND ATTORNEY-GENERAL (PPE) | | | | | | | | | | | | | 34,714 | | | | | |
| | | | | | | | | | | | | | | | | | |
67
Capital Statement 2021-22
| 3.9 | LEGISLATIVE ASSEMBLY OF QUEENSLAND |
Legislative Assembly of Queensland
The total planned 2021-22 capital expenditure for the Legislative Assembly of Queensland is $7.9 million. Major capital projects include continuation of an upgrade to critical building infrastructure and services supporting the Parliamentary Annexe, the ongoing electorate office accommodation improvement program, and replacement of precinct information technology network infrastructure.
| | | | | | | | | | | | | | | | | | |
| Legislative Assembly of Queensland | |
Project | | Statistical
Area | | Total
Estimated
Cost
$‘000 | | | Expenditure
to
30-06-21
$‘000 | | | Budget
2021-22
$‘000 | | | Post
2021-22
$‘000 | |
LEGISLATIVE ASSEMBLY OF QUEENSLAND | | | | | | | | | | | | | | | | | | |
Property, Plant and Equipment | | | | | | | | | | | | | | | | | | |
Critical infrastructure and services upgrade program | | 305 | | | 14,493 | | | | 9,631 | | | | 4,862 | | | | | |
Electorate office accommodation improvement program | | Various | | | | | | | | | | | 600 | | | | Ongoing | |
Information technology network infrastructure | | 305 | | | | | | | | | | | 700 | | | | Ongoing | |
Building management and security system upgrade | | 305 | | | 386 | | | | | | | | 386 | | | | | |
Other property, plant and equipment | | 305 | | | | | | | | | | | 1,334 | | | | Ongoing | |
| | | | | | | | | | | | | | | | | | |
Total Property, Plant and Equipment | | | | | | | | | | | | | 7,882 | | | | | |
| | | | | | | | | | | | | | | | | | |
TOTAL LEGISLATIVE ASSEMBLY OF QUEENSLAND (PPE) | | | | | | | | | | | | | 7,882 | | | | | |
| | | | | | | | | | | | | | | | | | |
68
Capital Statement 2021-22
The Department of the Premier and Cabinet (including Ministerial Offices and Office of the Leader of the Opposition) has planned capital purchases of $860,000 and capital grants of $11.3 million in 2021-22.
Department of the Premier and Cabinet
Program Highlights (Property, Plant and Equipment)
| • | | $560,000 for ongoing upgrades and maintenance of departmental ICT systems and other minor works. |
| • | | $300,000 for ongoing upgrades and maintenance of existing Ministerial Services ICT systems. |
Program Highlights (Capital Grants)
| • | | $6.3 million out of a total of $6.8 million for the Far North Queensland film studio, a multi-purpose film studio in Cairns. |
| • | | $4.5 million out of a total of $5 million for the Gold Coast television hub, a multi-purpose facility for scripted and unscripted television production and post-production that can be utilised according to the needs of productions. |
| • | | $500,000 out of a total $4 million for the Queensland Remembers Grants Program to support ex-service organisations and not-for-profit organisations that provide services to veterans to upgrade their buildings, facilities and equipment. |
| | | | | | | | | | | | | | | | | | |
| Premier and Cabinet | |
Project | | Statistical
Area | | Total
Estimated
Cost
$‘000 | | | Expenditure
to
30-06-21
$‘000 | | | Budget
2021-22
$‘000 | | | Post
2021-22
$‘000 | |
DEPARTMENT OF THE PREMIER AND CABINET | | | | | | | | | | | | | | | | | | |
Property, Plant and Equipment | | | | | | | | | | | | | | | | | | |
Departmental ICT systems and other minor works | | 305 | | | | | | | | | | | 560 | | | | Ongoing | |
Ministerial Offices and Office of the Leader of the Opposition - ICTinfrastructure | | 305 | | | | | | | | | | | 300 | | | | Ongoing | |
| | | | | | | | | | | | | | | | | | |
Total Property, Plant and Equipment | | | | | | | | | | | | | 860 | | | | | |
| | | | | | | | | | | | | | | | | | |
Capital Grants | | | | | | | | | | | | | | | | | | |
Screen Queensland - Far North Queensland film studio | | 306 | | | 6,800 | | | | 500 | | | | 6,300 | | | | | |
69
Capital Statement 2021-22
| | | | | | | | | | | | | | | | | | |
| Premier and Cabinet | |
Project | | Statistical
Area | | Total
Estimated
Cost
$‘000 | | | Expenditure
to
30-06-21
$‘000 | | | Budget
2021-22
$‘000 | | | Post
2021-
22
$‘000 | |
Screen Queensland - Gold Coast television hub | | 309 | | | 5,000 | | | | 500 | | | | 4,500 | | | | | |
Queensland Remembers Grants Program | | Various | | | 4,000 | | | | | | | | 500 | | | | 3,500 | |
| | | | | | | | | | | | | | | | | | |
Total Capital Grants | | | | | | | | | | | | | 11,300 | | | | | |
| | | | | | | | | | | | | | | | | | |
TOTAL PREMIER AND CABINET (PPE) | | | | | | | | | | | | | 860 | | | | | |
| | | | | | | | | | | | | | | | | | |
TOTAL PREMIER AND CABINET (CG) | | | | | | | | | | | | | 11,300 | | | | | |
| | | | | | | | | | | | | | | | | | |
70
Capital Statement 2021-22
| 3.11 | QUEENSLAND CORRECTIVE SERVICES |
Queensland Corrective Services capital program for 2021-22 of $364.2 million will primarily focus on correctional centre expansion and enhancements.
Queensland Corrective Services
Program Highlights (Property, Plant and Equipment)
| • | | $320 million of $654 million to continue the expansion of Southern Queensland Correctional Precinct with a new 1,000 bed correctional centre focusing on health and rehabilitation to reduce reoffending. |
| • | | $20.6 million of $241 million to complete the construction of an additional 398 beds at Capricornia Correctional Centre. |
| • | | $8 million to install additional bunk beds in high security correctional centres across Queensland to manage the increasing prison population. |
| • | | $5 million of $13.6 million to upgrade the intercom system at the Woodford Correctional Centre. |
| • | | $2.5 million of $3 million to continue refurbishment of the Princess Alexandra Hospital Secure Unit. |
| • | | $7.5 million to acquire other property, plant and equipment. |
| | | | | | | | | | | | | | | | | | |
| Queensland Corrective Services | |
Project | | Statistical
Area | | Total
Estimated
Cost
$‘000 | | | Expenditure
to
30-06-21
$‘000 | | | Budget
2021-22
$‘000 | | | Post
2021-22
$‘000 | |
QUEENSLAND CORRECTIVE SERVICES | | | | | | | | | | | | | | | | | | |
Property, Plant and Equipment | | | | | | | | | | | | | | | | | | |
Queensland Corrective Services | | | | | | | | | | | | | | | | | | |
Major works - correctional centres | | | | | | | | | | | | | | | | | | |
Southern Queensland Correctional Precinct - Stage 2 | | 310 | | | 653,978 | | | | 43,811 | | | | 320,000 | | | | 290,167 | |
Capricornia Correctional Centre expansion | | 308 | | | 241,000 | | | | 220,383 | | | | 20,617 | | | | | |
| | | | | | | | | | | | | | | | | | |
Sub-total Major works - correctional centres | | | | | | | | 340,617 | | | | | |
| | | | | | | | | | | | | | | | | | |
Correctional centre enhancements | | | | | | | | | | | | | | | | | | |
Woodford Correctional Centre - intercoms | | 313 | | | 13,600 | | | | 1,954 | | | | 5,000 | | | | 6,646 | |
Princess Alexandra Hospital Secure Unit | | 303 | | | 3,000 | | | | 471 | | | | 2,529 | | | | | |
71
Capital Statement 2021-22
| | | | | | | | | | | | | | | | | | |
| Queensland Corrective Services | |
Project | | Statistical
Area | | Total
Estimated
Cost
$‘000 | | | Expenditure
to
30-06-21
$‘000 | | | Budget
2021-22
$‘000 | | | Post
2021-22
$‘000 | |
Double Up Bunk Beds | | Various | | | 8,000 | | | | | | | | 8,000 | | | | | |
| | | | | | | | | | | | | | | | | | |
Sub-total Correctional centre enhancements | | | | | | | | 15,529 | | | | | |
| | | | | | | | | | | | | | | | | | |
Other acquisitions of property, plant and equipment | | | | | | | | | | | | | | | | | | |
Brisbane Correctional Centre laundry | | 310 | | | 3,000 | | | | 2,400 | | | | 600 | | | | | |
Other acquisitions of property, plant and equipment | | Various | | | | | | | | | | | 7,501 | | | | Ongoing | |
| | | | | | | | | | | | | | | | | | |
Sub-total Other acquisitions of property, plant and equipment | | | | 8,101 | | | | | |
| | | | | | | | | | | | | | | | | | |
Sub-total Queensland Corrective Services | | | | | | | | | | | | | 364,247 | | | | | |
| | | | | | | | | | | | | | | | | | |
Total Property, Plant and Equipment | | | | | | | | | | | | | 364,247 | | | | | |
| | | | | | | | | | | | | | | | | | |
TOTAL QUEENSLAND CORRECTIVE SERVICES (PPE) | | | | | | | | | | | | | 364,247 | | | | | |
| | | | | | | | | | | | | | | | | | |
72
Capital Statement 2021-22
| 3.12 | QUEENSLAND FIRE AND EMERGENCY SERVICES |
Queensland Fire and Emergency Services
The 2021-22 Queensland Fire and Emergency Services (QFES) capital program of $58.7 million in capital purchases and $897,000 in capital grants supports the provision of fire and rescue and emergency management services throughout Queensland. The program will fund fire and emergency services facilities, fire appliances, and essential operational equipment and information systems.
Following the disestablishment of the Public Safety Business Agency, the Queensland Police Service will provide information and communications technology systems and equipment to QFES to support the delivery of essential frontline public safety services to Queensland communities.
Program Highlights (Property, Plant and Equipment)
| • | | $30.5 million for replacement and new fire and rescue and rural fire appliances. |
| • | | $8.2 million to continue the replacement of the Maryborough regional QFES headquarters and auxiliary fire and rescue station. |
| • | | $4.9 million to complete the replacement of the auxiliary fire and rescue stations at Gracemere, Longreach, Rainbow Beach and Rosewood. |
| • | | $3.3 million to continue the replacement of the permanent fire and rescue station at Loganlea. |
| • | | $3.2 million for operational equipment, including protective clothing, specialist and field-portable scientific analysis and detection equipment, compressors for self-contained breathing apparatus, swiftwater rescue craft, battery powered rescue equipment, accommodation shelters, satellite communications hardware for deployable disaster response, and slip-on units and trailers. |
| • | | $2 million to complete the auxiliary fire and rescue station relocation and upgrade at Mossman. |
| • | | $2 million to continue the new permanent fire and rescue station at Mount Cotton. |
| • | | $2 million for minor capital works across the State, including upgrades of fire and rescue station amenities. |
| • | | $1.8 million to complete the replacement QFES complex at Maleny. |
| • | | $600,000 to continue the replacement QFES mechanical workshop at Pinkenba. |
| • | | $200,000 for rural operations land purchases. |
73
Capital Statement 2021-22
Program Highlights (Capital Grants)
| • | | $712,000 for State Emergency Service capital grants. |
| • | | $185,000 for Rural Fire Brigade capital grants. |
| | | | | | | | | | | | | | | | | | |
| Queensland Fire and Emergency Services | |
Project | | Statistical
Area | | Total
Estimated
Cost
$‘000 | | | Expenditure
to
30-06-21
$‘000 | | | Budget
2021-22
$‘000 | | | Post
2021-22
$‘000 | |
QUEENSLAND FIRE AND EMERGENCY SERVICES | | | | | | | | | | | | | | | | | | |
Property, Plant and Equipment | | | | | | | | | | | | | | | | | | |
Buildings | | | | | | | | | | | | | | | | | | |
Gracemere replacement auxiliary fire and rescue station | | 308 | | | 2,210 | | | | 1,714 | | | | 496 | | | | | |
Loganlea replacement permanent fire and rescue station | | 311 | | | 4,000 | | | | 152 | | | | 3,348 | | | | 500 | |
Longreach replacement auxiliary fire and rescue station | | 315 | | | 4,430 | | | | 2,700 | | | | 1,730 | | | | | |
Maleny replacement QFES complex | | 316 | | | 3,900 | | | | 2,142 | | | | 1,758 | | | | | |
Maryborough replacement regional QFES headquarters andauxiliary fire and rescue station | | 319 | | | 12,100 | | | | 376 | | | | 8,224 | | | | 3,500 | |
Mossman auxiliary fire and rescue station relocation and upgrade | | 306 | | | 2,001 | | | | 51 | | | | 1,950 | | | | | |
Mount Cotton new permanent fire and rescue station | | 311 | | | 7,200 | | | | 1,800 | | | | 2,000 | | | | 3,400 | |
Pinkenba replacement QFES mechanical workshop | | 302 | | | 9,000 | | | | 525 | | | | 600 | | | | 7,875 | |
Rainbow Beach replacement auxiliary fire and rescue station | | 319 | | | 2,500 | | | | 950 | | | | 1,550 | | | | | |
Rosewood replacement auxiliary fire and rescue station | | 310 | | | 2,000 | | | | 900 | | | | 1,100 | | | | | |
Minor works | | Various | | | | | | | | | | | 2,024 | | | | Ongoing | |
| | | | | | | | | | | | | | | | | | |
Sub-total Buildings | | | | | | | | | | | | | 24,780 | | | | | |
| | | | | | | | | | | | | | | | | | |
Land | | | | | | | | | | | | | | | | | | |
Rural operations land purchases | | Various | | | | | | | | | | | 200 | | | | Ongoing | |
Plant and Equipment | | | | | | | | | | | | | | | | | | |
Fire and rescue appliances | | Various | | | | | | | | | | | 18,000 | | | | Ongoing | |
Rural fire appliances | | Various | | | | | | | | | | | 12,500 | | | | Ongoing | |
Operational equipment | | Various | | | | | | | | | | | 3,222 | | | | Ongoing | |
74
Capital Statement 2021-22
| | | | | | | | | | | | | | | | | | |
| Queensland Fire and Emergency Services | |
Project | | Statistical
Area | | Total
Estimated
Cost
$‘000 | | | Expenditure
to
30-06-21
$‘000 | | | Budget
2021-22
$‘000 | | | Post
2021-22
$‘000 | |
Total Property, Plant and Equipment | | | | | | | | | | | | | 58,702 | | | | | |
| | | | | | | | | | | | | | | | | | |
Capital Grants | | | | | | | | | | | | | | | | | | |
Rural Fire Brigades | | Various | | | | | | | | | | | 185 | | | | Ongoing | |
State Emergency Service | | Various | | | | | | | | | | | 712 | | | | Ongoing | |
| | | | | | | | | | | | | | | | | | |
Total Capital Grants | | | | | | | | | | | | | 897 | | | | | |
| | | | | | | | | | | | | | | | | | |
TOTAL QUEENSLAND FIRE AND EMERGENCY SERVICES (PPE) | | | | | | | | | | | | | 58,702 | | | | | |
| | | | | | | | | | | | | | | | | | |
TOTAL QUEENSLAND FIRE AND EMERGENCY SERVICES (CG) | | | | | | | | | | | | | 897 | | | | | |
| | | | | | | | | | | | | | | | | | |
75
Capital Statement 2021-22
The Queensland public healthcare system comprises the Department of Health, Queensland Ambulance Service (QAS), the Council of the Queensland Institute of Medical Research (QIMR Berghofer), the Queensland Mental Health Commission, the Office of the Health Ombudsman, Health and Wellbeing Queensland and 16 independent Hospital and Health Services. The total capital investment program in 2021-22 for Queensland Health, including QIMR, is $1.352 billion.
Queensland Health and Hospital and Health Services
The Queensland Health Capital Program delivers built infrastructure and digital technologies to enable the delivery of safe, high quality health services to Queenslanders. The built infrastructure, equipment and technology requirements of Queensland Health are driven by clinical services planning and models of care.
Over the next 10 years, the demand on Queensland’s public health system is projected to increase significantly, and the Queensland Health Capital Program is positioned to respond to these pressures with innovative approaches to managing existing assets, leveraging emerging healthcare technology, and utilising contemporary building practices and enhanced design processes.
Queensland Health also uses a strategic approach to forward planning which considers the needs of all Queenslanders, plus efficiencies that can be leveraged across the State-wide network. This ensures healthcare infrastructure and equipment programs are delivered to the right place, at the right time, for Queensland communities.
In addition to investment in Queensland Health owned capital infrastructure, Queensland Health is also committed to partnering with the private sector to drive better access to healthcare in areas of high demand. Through partnership and innovation with Mater, Queensland Health will expand its access to beds through the investment of $177 million in the expansion at Mater Public Hospital Springfield.
Program Highlights (Property, Plant and Equipment)
In 2021-22, Queensland Health will continue to invest in health infrastructure, capital works and purchases across a broad range of areas including hospitals, ambulance stations and vehicles, health technology, research and scientific services, mental health services, staff accommodation, and ICT.
$283.7 million as part of the Building Better Hospitals program including:
| • | | $103.5 million for the Caboolture Hospital Redevelopment to support an additional 130 beds and refurbishment of critical clinical support services. |
76
Capital Statement 2021-22
| | • | | $92.4 million for the Ipswich Hospital Expansion Stage 1A which includes redevelopment of the hospital including new mental health facilities for adults and older persons, 26 bed ward refurbishment and a Magnetic Resonance Imaging suite to grow clinical capacity. |
| • | | $79.5 million for the Logan Hospital Expansion which will deliver an additional 206 beds/bed alternatives with a vertical expansion of Building 3 and targeted refurbishment of other key locations. |
| • | | $10.5 million including $2.2 million of funding from the Metro South Hospital and Health Service for the Logan Hospital Maternity Services Upgrade with the refurbishment to deliver six additional maternity inpatient beds, five extra birthing suites, an expanded special care nursery with 10 additional cots, and the installation of birthing pools suitable for water birthing. |
$233.6 million under the Sustaining Capital Program will be distributed across Hospital and Health Services and Department of Health for a range of capital works projects, minor capital projects and replacement of health technology equipment. The program will enhance and optimise existing infrastructure to ensure facilities and equipment are fit for purpose. The program seeks to address legislative compliance (including fire safety and food safety), essential services (including electricity, water supply and sewerage), major plant and systems (including air-conditioners, chillers, lifts and infrastructure and call systems) and major building elements (including foundations, floors, walls and roofs).
$105 million in 2021-22 as part of the $265 million Satellite Hospitals Program to deliver satellite hospitals to Bribie Island, Caboolture, Brisbane South, Pine Rivers, Gold Coast, Ipswich, and Redlands. The Satellite Hospitals Program will enable our acute hospitals in Southeast Queensland to manage demand and free up capacity while continuing to safely manage patients via alternative models of care. The satellite hospitals will also provide virtual health opportunities including a range of rapid access consults, care co-ordination, remote monitoring, and patient literacy services.
$66.4 million as part of the Advancing Queensland’s Health Infrastructure Program to continue essential upgrades to health facilities and supporting infrastructure across Queensland, including repurposing of the Nambour Hospital, redevelopment of the Atherton Hospital, including the emergency department and operating theatres, and staged refurbishment of the Thursday Island Hospital and Primary Health Care Centre.
$50.2 million as part of the Rural and Regional Infrastructure Package for construction of a new mental health facility at Cairns Hospital, a purpose-built Sarina Hospital and staff accommodation, staff accommodation projects across the State,
77
Capital Statement 2021-22
and for the replacement of the Mer (Murray) Island Primary Health Care Centre.
$43 million for an expansion of the Gold Coast University Hospital to deliver a Secure Mental Health Rehabilitation Unit.
$40.3 million in hospital parking projects to meet increasing demand for parking, including:
| • | | $18.1 million for the new multi-storey car park at Caboolture Hospital, providing approximately 1,080 parking spaces in a mix of multi-storey and at grade facilities, accessible parking spaces, electric vehicle charging bays and motorcycle parking. Combined with other car spaces around the site, there will be approximately 1,640 spaces in total. |
| • | | $15.3 million for the construction of an eight level carpark on the Logan Hospital site, delivering 1,506 parking bays, and construction of a linkway bridge to Building 3 following the expansion of the Logan Hospital. |
| • | | $5.5 million for the construction of new multi-level car park for Redland Hospital. |
| • | | $1.4 million for the commencement of a new multi-storey car park at The Prince Charles Hospital. |
$20 million for the Building Rural and Remote Health Program will address aging infrastructure at Camooweal, St George, Morven, Charleville and Blackwater and provide a safe, compliant and contemporary environment for the communities’ health services.
$16.3 million for the redevelopment of the Redland Hospital site to meet the growing needs of the community and reduce pressure on other facilities in the region.
$15 million for the purchase of the preferred site for the proposed Bundaberg Hospital Redevelopment and associated project costs to enable detailed site planning in preparation for the first stage of the project.
$15 million for the Staff Accommodation Program to renew and replace existing healthcare staff accommodation pressures in Torres and Cape and North West Hospital and Health Services.
$12.4 million for the Windorah Primary Healthcare Centre replacement to provide contemporary and safe health services to the Windorah community, and address safety and compliance concerns with the existing facility.
$11.4 million for the Fraser Coast Mental Health Service Enhancement, providing a new adult acute mental health inpatient unit at Hervey Bay Hospital and sub-acute older persons mental health unit refurbishment at Maryborough Hospital.
78
Capital Statement 2021-22
$5.9 million for the Toowoomba Day Surgery Theatre to construct a two-theatre day surgery unit at the Baillie Henderson Hospital Campus, which is the endorsed site for the proposed Toowoomba Hospital Redevelopment.
$3.5 million for the redevelopment of the Moura Multi-Purpose Healthcare Service, including renewal and upgrading of aged care facilities with provision for future demand.
$2 million for the Woorabinda Multi-Purpose Health Service to increase from four residential aged care beds to 14, including the upgrade of the laundry facilities and the construction of a new kitchen.
$120.5 million will be invested in ICT to support the safe and efficient provision of health services that enable the successful delivery of health care and business services across Queensland. This investment will assist the transformation of healthcare delivery and mitigate the risk of digital infrastructure failure. Digital enhancements will also improve equity of service at rural and remote sites.
$17.3 million will be allocated by Hospital and Health Services for capital projects across Queensland in 2021-22. Projects include:
| • | | $8.4 million for the Kingaroy Hospital Redevelopment which will increase patient treatment spaces from 46 to 66, improving the hospital’s role as a hub for trauma, paediatric, obstetric, rehabilitation and mental health services in the region. |
| • | | $1.4 million to extend existing information technology services and develop new information technology services at the Sunshine Coast University Hospital. |
| • | | $1 million for a dedicated access road to the Logan Hospital Maternity Services Unit to provide a more accessible entry to the unit for patients presenting. |
| • | | $899,000 for refurbishment of a Birthing Suite at Weipa Hospital to reintroduce a high quality and holistic maternity service to address inequity in healthcare access and improve neonatal and maternal outcomes for isolated and Aboriginal and Torres Strait Islander community members who live and work in this region. |
$50.4 million has been allocated to other acquisitions of property, plant and equipment across the state, including:
| • | | $17 million for the Queensland Health Emission Reduction Program to support Queensland Health’s state-wide energy efficiency projects. |
| • | | $11.1 million for the Queen Elizabeth II Jubilee Hospital 24 Bed Interim Demand Strategy project for the re-establishment of a 24 bed ward on level 5 of the hospital. |
79
Capital Statement 2021-22
$5.5 million for the delivery of a second Computed Tomography (CT) scanner for the Robina Hospital to address the increased demand for procedures and emergency CT studies.
Queensland Ambulance Service
In 2021-22, the QAS will invest $61.8 million in capital purchases to support essential frontline services to provide the highest possible quality pre-hospital emergency and non-emergency care and services to the community. In implementing its capital program, the QAS will review opportunities for co-location and integration with health services, thus improving the close linkages and working relationships between public hospitals, as well as other emergency management infrastructure.
Program Highlights (Property, Plant and Equipment)
| • | | $8.3 million to progress the planning and construction phases for new ambulance stations at Caloundra South, Petrie (Lawnton), Morayfield, Ormeau, Ripley, the new Burdell ambulance station and Local Ambulance Service Network office, and a replacement ambulance station at North Rockhampton. |
| • | | $9.9 million for redevelopment of the Cairns Ambulance Station and Operations Centre, Southport Ambulance Station and Gold Coast Operations Centre, and refurbishment of the Rockhampton Ambulance Station and Operations Centre. |
| • | | $5 million investment in minor works at various existing stations to improve functionality, amenities and prolong useful life. |
| • | | $1.5 million investment in the acquisition of strategically located land to accommodate future expansion of services aligned with identified growth areas. |
| • | | $29 million to commission 136 new and replacement ambulance vehicles including the continued rollout of power assisted stretchers and $1.5 million for the fit-out of Emergency Response Vehicles. |
| • | | $5 million investment in information and communication technology for software development projects to enhance patient care and service delivery. |
| • | | $1.6 million in operational equipment to support frontline services. |
Council of the Queensland Institute of Medical Research
The QIMR Berghofer capital program in 2021-22 will invest $5.7 million for the acquisition of new and/or replacement state-of-the-art scientific equipment and research facilities.
80
Capital Statement 2021-22
| | | | | | | | | | | | | | | | | | |
| Queensland Health | |
Project | | Statistical
Area | | Total
Estimated
Cost
$‘000 | | | Expenditure
to 30-06-21
$‘000 | | | Budget
2021-22
$‘000 | | | Post
2021-22
$‘000 | |
QUEENSLAND HEALTH AND HOSPITAL AND HEALTH SERVICES | | | | | | | | | |
Property, Plant and Equipment1 | | | | | | | | | | | | | | | | | | |
Hospital and Health Services | | | | | | | | | | | | | | | | | | |
Alcohol and Other Drug Community Treatment Program | | Various | | | 51,000 | | | | 300 | | | | 3,500 | | | | 47,200 | |
Advancing Queensland Health Infrastructure Program | | 305 | | | 240,000 | | | | 103,304 | | | | 66,375 | | | | 70,321 | |
Building Better Hospitals | | | | | | | | | | | | | | | | | | |
Caboolture Hospital2 redevelopment—Stage 1 | | 313 | | | 352,900 | | | | 85,116 | | | | 103,450 | | | | 164,334 | |
Ipswich Hospital expansion -2 Stage 1A | | 310 | | | 146,300 | | | | 38,321 | | | | 92,398 | | | | 15,581 | |
Logan Hospital expansion2 | | 311 | | | 460,871 | | | | 34,104 | | | | 79,511 | | | | 347,256 | |
Logan Hospital Maternity3 Services upgrade | | 311 | | | 15,600 | | | | 3,618 | | | | 8,301 | | | | 3,681 | |
Building Rural and Remote Health Program | | Various | | | 70,000 | | | | | | | | 20,000 | | | | 50,000 | |
Bundaberg Hospital detailed business case and land acquisition | | 319 | | | 21,655 | | | | 6,523 | | | | 15,000 | | | | 132 | |
Business Case Program | | 305 | | | | | | | | | | | 33,535 | | | | Ongoing | |
Caboolture Hospital multi-storey car park | | 313 | | | 46,610 | | | | 7,134 | | | | 18,120 | | | | 21,356 | |
Cairns Hospital Emergency Department expansion | | 306 | | | 30,000 | | | | 2,729 | | | | 7,700 | | | | 19,571 | |
Cairns Hospital 11 additional beds Block D4 ward fitout | | 306 | | | 4,450 | | | | 2,398 | | | | 2,052 | | | | | |
Cairns Hybrid Theatre | | 306 | | | 4,531 | | | | 3,790 | | | | 741 | | | | | |
Community Health and Hospitals | | Various | | | 127,430 | | | | 8,508 | | | | 40,628 | | | | 78,294 | |
Dakabin Family and Community Place | | 314 | | | 8,056 | | | | 250 | | | | 7,806 | | | | | |
Enhancing Regional Hospitals Program Roma Hospital redevelopment | | 307 | | | 116,598 | | | | 113,854 | | | | 466 | | | | 2,278 | |
Fraser Coast Mental Health Project | | 319 | | | 39,610 | | | | 4,183 | | | | 11,364 | | | | 24,063 | |
Gold Coast Secure Mental Health Rehabilitation Unit | | 309 | | | 105,544 | | | | 2,167 | | | | 43,022 | | | | 60,355 | |
Ipswich Hospital upgrade | | 310 | | | 22,000 | | | | 310 | | | | 6,000 | | | | 15,690 | |
Kirwan Health Campus | | 318 | | | 40,000 | | | | 50 | | | | 150 | | | | 39,800 | |
81
Capital Statement 2021-22
| | | | | | | | | | | | | | | | | | |
| Queensland Health | |
Project | | Statistical
Area | | Total
Estimated
Cost
$‘000 | | | Expenditure
to 30-06-21
$‘000 | | | Budget
2021-22
$‘000 | | | Post
2021-22
$‘000 | |
Logan Hospital multi-storey car park | | 311 | | | 61,920 | | | | 29,504 | | | | 15,259 | | | | 17,157 | |
Mackay Community Mental Health refurbishment | | 312 | | | 6,000 | | | | | | | | 1,200 | | | | 4,800 | |
Master planning studies | | Various | | | | | | | | | | | 2,352 | | | | Ongoing | |
Moura Multi-Purpose Healthcare Service | | 308 | | | 7,200 | | | | | | | | 3,500 | | | | 3,700 | |
Proserpine Hospital Acute Primary Care Clinic upgrade | | 312 | | | 5,000 | | | | | | | | 1,200 | | | | 3,800 | |
Queensland Children’s Hospital Resilience Project | | 305 | | | 8,647 | | | | 7,473 | | | | 873 | | | | 301 | |
Redland Hospital car park | | 301 | | | 34,465 | | | | 1,993 | | | | 5,500 | | | | 26,972 | |
Redland Hospital expansion -4 Stage 1 | | 301 | | | 32,000 | | | | 735 | | | | 16,265 | | | | 15,000 | |
Rockhampton Drug Rehabilitation and Treatment Facility | | 308 | | | 16,264 | | | | 10,113 | | | | 5,708 | | | | 443 | |
Rockhampton Hospital Cardiac Hybrid Theatre | | 308 | | | 18,200 | | | | 100 | | | | 2,400 | | | | 15,700 | |
Rockhampton Hospital Mental Health Ward Expansion | | 308 | | | 6,000 | | | | 160 | | | | 2,800 | | | | 3,040 | |
Rural and Regional Infrastructure Package | | | | | | | | | | | | | | | | | | |
Cairns Hospital Mental Health Unit | | 306 | | | 70,000 | | | | 9,153 | | | | 29,496 | | | | 31,351 | |
Mer (Murray) Island Building replacement | | 315 | | | 7,000 | | | | 2,925 | | | | 2,500 | | | | 1,575 | |
Sarina Hospital redevelopment5 | | 312 | | | 21,500 | | | | 1,734 | | | | 16,773 | | | | 2,993 | |
Staff Accommodation Program | | Various | | | 13,150 | | | | 11,685 | | | | 1,465 | | | | | |
Rural and Regional Renal Program | | 305 | | | 9,320 | | | | 175 | | | | 7,183 | | | | 1,962 | |
Satellite Hospitals Program | | Various | | | 265,000 | | | | 200 | | | | 105,000 | | | | 159,800 | |
Staff Accommodation Program | | Various | | | 15,000 | | | | | | | | 15,000 | | | | | |
Sunshine Coast University Hospital | | 316 | | | 1,872,151 | | | | 1,812,477 | | | | 39,913 | | | | 19,761 | |
Sunshine Coast University Hospital Patient Access and Coordination Hub | | 316 | | | 5,000 | | | | 150 | | | | 4,850 | | | | | |
Sustaining Capital Program6 | | Various | | | | | | | | | | | 233,640 | | | | Ongoing | |
The Prince Charles Hospital Carpark | | 302 | | | 81,940 | | | | 723 | | | | 1,424 | | | | 79,793 | |
Toowoomba Day Surgery Theatre | | 307 | | | 42,000 | | | | | | | | 5,900 | | | | 36,100 | |
Townsville University Hospital Hybrid Theatre | | 318 | | | 17,000 | | | | | | | | 530 | | | | 16,470 | |
82
Capital Statement 2021-22
| | | | | | | | | | | | | | | | | | | | |
| Queensland Health | |
Project | | Statistical
Area | | | Total
Estimated
Cost
$‘000 | | | Expenditure
to 30-06-21
$‘000 | | | Budget
2021-22
$‘000 | | | Post
2021-22
$‘000 | |
Townsville University Hospital upgrades | | | 318 | | | | 8,000 | | | | 20 | | | | 410 | | | | 7,570 | |
Windorah Primary Health Care | | | 308 | | | | 12,400 | | | | | | | | 12,400 | | | | | |
Woorabindah Multi-Purpose Health Service | | | 308 | | | | 12,500 | | | | | | | | 2,000 | | | | 10,500 | |
Yeronga Child and Youth Community Hub | | | 303 | | | | 7,835 | | | | 200 | | | | 500 | | | | 7,135 | |
| | | | | | | | | | | | | | | | | | | | |
Sub-total Hospital and Health Services | | | | | | | | | | | | | | | 1,096,160 | | | | | |
| | | | | | | | | | | | | | | | | | | | |
Other Acquisitions of Property, Plant and Equipment | | | | | | | | | | | | | | | | | | | | |
Building works capital project management | | | 305 | | | | | | | | | | | | 850 | | | | Ongoing | |
Cairns Health Innovation Centre7 land acquisition | | | 306 | | | | 15,000 | | | | 200 | | | | 1,000 | | | | 13,800 | |
Cladding Investigation and Remediation Program | | | 305 | | | | 27,300 | | | | 12,055 | | | | 4,000 | | | | 11,245 | |
Mareeba Hospital new CT scanner | | | 306 | | | | 5,000 | | | | 2,384 | | | | 2,616 | | | | | |
Queen Elizabeth II Jubilee Hospital Interim Demand Strategy | | | 303 | | | | 12,100 | | | | 1,035 | | | | 11,065 | | | | | |
Queensland Health Emission Reduction Program | | | 305 | | | | 30,000 | | | | 3,000 | | | | 17,000 | | | | 10,000 | |
Robina Hospital second CT scanner | | | 309 | | | | 5,650 | | | | 170 | | | | 5,480 | | | | | |
State-wide General Chemistry and Immunoassay Replacement and Automation Project | | | 305 | | | | 16,511 | | | | 7,097 | | | | 7,913 | | | | 1,501 | |
Varsity Lake Day hospital equipment | | | 309 | | | | 1,000 | | | | 500 | | | | 500 | | | | | |
| | | | | | | | | | | | | | | | | | | | |
Sub-total Other Acquisitions of Property, Plant and Equipment | | | | 50,424 | | | | | |
| | | | | | | | | | | | | | | | | | | | |
Information Communication and Technology | | | | | | | | | | | | | | | | | | | | |
Information communication and technology Darling Downs | | | 305 | | | | | | | | | | | | 120,488 | | | | Ongoing | |
Kingaroy redevelopment8 | | | 319 | | | | 14,000 | | | | 5,559 | | | | 8,441 | | | | | |
Murgon nurses’ quarters | | | 319 | | | | 250 | | | | | | | | 250 | | | | | |
| | | | | | | | | | | | | | | | | | | | |
Sub-total Darling Downs | | | | | | | | | | | | | | | 8,691 | | | | | |
| | | | | | | | | | | | | | | | | | | | |
Metro North | | | | | | | | | | | | | | | | | | | | |
Caboolture Hospital Mental Health Short Stay Unit | | | 313 | | | | 5,400 | | | | 5,224 | | | | 176 | | | | | |
83
Capital Statement 2021-22
| | | | | | | | | | | | | | | | | | | | |
| Queensland Health | |
Project | | Statistical
Area | | | Total
Estimated
Cost
$‘000 | | | Expenditure
to 30-06-21
$‘000 | | | Budget
2021-22
$‘000 | | | Post
2021-22
$‘000 | |
Consumables and Prosthetics Tracking and Revenue business case | | | 305 | | | | 2,522 | | | | 950 | | | | 1,572 | | | | | |
| | | | | | | | | | | | | | | | | | | | |
Sub-total Metro North | | | | | | | | | | | | | | | 1,748 | | | | | |
| | | | | | | | | | | | | | | | | | | | |
Metro South | | | | | | | | | | | | | | | | | | | | |
Capital projects | | | 311 | | | | 1,297 | | | | | | | | 1,297 | | | | | |
Logan Hospital Maternity access road | | | 311 | | | | 3,048 | | | | 1,650 | | | | 1,020 | | | | 378 | |
Logan Hospital Maternity services3 upgrade | | | 311 | | | | 2,275 | | | | 37 | | | | 2,238 | | | | | |
| | | | | | | | | | | | | | | | | | | | |
Sub-total Metro South | | | | | | | | | | | | | | | 4,555 | | | | | |
| | | | | | | | | | | | | | | | | | | | |
Sunshine Coast | | | | | | | | | | | | | | | | | | | | |
Sunshine Coast University | | | 316 | | | | 55,900 | | | | 54,535 | | | | 1,365 | | | | | |
Hospital Group 4 ICT Project | | | | | | | | | | | | | | | | | | | | |
| | | | | | | | | | | | | | | | | | | | |
Sub-total Sunshine Coast | | | | | | | | | | | | | | | 1,365 | | | | | |
| | | | | | | | | | | | | | | | | | | | |
Torres and Cape | | | | | | | | | | | | | | | | | | | | |
Weipa birthing suite | | | 315 | | | | 899 | | | | | | | | 899 | | | | | |
| | | | | | | | | | | | | | | | | | | | |
Sub-total Torres and Cape | | | | | | | | | | | | | | | 899 | | | | | |
| | | | | | | | | | | | | | | | | | | | |
Queensland Ambulance Service | | | | | | | | | | | | | | | | | | | | |
Burdell new station and Townsville LASN Office | | | 318 | | | | 6,000 | | | | | | | | 500 | | | | 5,500 | |
Cairns Ambulance Station and Operations Centre redevelopment | | | 306 | | | | 10,415 | | | | 784 | | | | 1,350 | | | | 8,281 | |
Caloundra South new ambulance station | | | 316 | | | | 5,500 | | | | 30 | | | | 300 | | | | 5,170 | |
Petrie (Lawnton) new station | | | 314 | | | | 5,000 | | | | | | | | 500 | | | | 4,500 | |
Morayfield new ambulance station | | | 313 | | | | 4,000 | | | | | | | | 500 | | | | 3,500 | |
North Rockhampton Ambulance Station replacement | | | 308 | | | | 5,500 | | | | | | | | 1,000 | | | | 4,500 | |
Ormeau new ambulance station | | | 309 | | | | 4,500 | | | | 217 | | | | 3,000 | | | | 1,283 | |
Ripley new ambulance station and Local Ambulance Service Networks Office | | | 310 | | | | 5,000 | | | | 115 | | | | 2,500 | | | | 2,385 | |
Rockhampton Ambulance Station and Operations Centre refurbishment | | | 308 | | | | 7,000 | | | | 1,476 | | | | 5,524 | | | | | |
84
Capital Statement 2021-22
| | | | | | | | | | | | | | | | | | | | |
| Queensland Health | |
Project | | Statistical
Area | | | Total
Estimated
Cost
$‘000 | | | Expenditure
to 30-06-21
$‘000 | | | Budget
2021-22
$‘000 | | | Post 2021-
22 $‘000 | |
Southport Ambulance Station and Gold Coast Operations Centreredevelopment | | | 309 | | | | 10,240 | | | | 686 | | | | 3,000 | | | | 6,554 | |
Minor works | | | 305 | | | | | | | | | | | | 5,000 | | | | Ongoing | |
Strategic land acquisitions | | | 305 | | | | | | | | | | | | 1,500 | | | | Ongoing | |
Ambulance vehicle purchases | | | 305 | | | | | | | | | | | | 30,500 | | | | Ongoing | |
Information systems development | | | 305 | | | | | | | | | | | | 5,000 | | | | Ongoing | |
Operational equipment | | | 305 | | | | | | | | | | | | 1,600 | | | | Ongoing | |
| | | | | | | | | | | | | | | | | | | | |
Sub-total Queensland Ambulance Service | | | | | | | | | | | | | | | 61,774 | | | | | |
| | | | | | | | | | | | | | | | | | | | |
Total Property, Plant and Equipment | | | | | | | | | | | | | | | 1,346,104 | | | | | |
| | | | | | | | | | | | | | | | | | | | |
COUNCIL OF THE QUEENSLAND INSTITUTE OF MEDICAL RESEARCH | | | | | | | | | | | | | | | | | | | | |
Property, Plant and Equipment | | | | | | | | | | | | | | | | | | | | |
Other scientific equipment 9 | | | 305 | | | | | | | | | | | | 5,710 | | | | Ongoing | |
| | | | | | | | | | | | | | | | | | | | |
Total Property, Plant and Equipment | | | | | | | | | | | | | | | 5,710 | | | | | |
| | | | | | | | | | | | | | | | | | | | |
TOTAL QUEENSLAND HEALTH (PPE) | | | | | | | | | | | | | | | 1,351,814 | | | | | |
| | | | | | | | | | | | | | | | | | | | |
Notes:
| 1. | Total estimated cost may include both non-capital and capital components of project expenditure. |
| 2. | Total estimated cost includes funding of $3 million from South East Queensland—Planning for Growth. |
| 3. | Total funding for the Logan Hospital Maternity Services Update is $18.9 million including funding of $2.3 million from Metro South Hospital and Health Service and $1 million from minor capital projects and acquisitions. |
| 4. | Total funding for the Redland Hospital Expansion Stage 1 is $62 million including funding of $30 million from Community Health and Hospitals. |
| 5. | Total funding for Sarina Hospital Redevelopment is $31.5 million including funding of $10 million from Mackay Hospital and Health Service. |
| 6. | Amount is net of non capital component of project expenditure. |
| 7. | The acquisition of land for the Cairns Health Innovation Centre may occur earlier than planned with settlement possible in the 2021-22 year. |
| 8. | Total funding for Kingaroy Hospital Redevelopment is $92.5 million including funding of $14 million from Darling Downs Hospital and Health Service. |
| 9. | The QIMR Berghofer capital program in 2021-22 will invest $5.7 million for the acquisition of new and/or replacement state-of-the-art scientific equipment and research facilities. |
85
Capital Statement 2021-22
| 3.14 | QUEENSLAND POLICE SERVICE |
Queensland Police Service
The 2021-22 Queensland Police Service capital program of $156.1 million supports quality frontline services throughout Queensland. The program will fund police facilities, motor vehicles, vessels, information and communication technology and other essential equipment.
Program Highlights (Property, Plant and Equipment)
| • | | $40.6 million for new and replacement police service vehicles. |
| • | | $12.9 million to complete the replacement police facilities at Beaudesert, Biloela, Burketown, Nambour and Pormpuraaw. |
| • | | $11.3 million to progress the upgrades of the Cairns, Dalby and Warwick police facilities. |
| • | | $11.3 million for information and communications technology. |
| • | | $10.5 million for Camera Detected Offence Program equipment. |
| • | | $10.2 million for minor capital works and other plant and equipment across the state. |
| • | | $8.1 million to progress the new Cairns West and Ripley police facilities, complete the new Pimpama police facility and commence planning for the new Rosewood police facility. |
| • | | $7.6 million for the Public Safety Network. |
| • | | $7.2 million to progress the replacement police facilities at Cooroy, Cunnamulla and Woree. |
| • | | $6.5 million to complete the upgrade of the Aurukun police facility and commence the upgrades of the Mackay and Maryborough police facilities. |
| • | | $6 million for upgrades and replacements to air conditioning and closed circuit cameras at police facilities across the state. |
| • | | $5.5 million for new and replacement police service vessels. |
| • | | $4 million to support Queensland Ambulance Service information systems development. |
| • | | $4 million for aircraft maintenance. |
| • | | $3.7 million for Queensland Fire and Emergency Services information and communications systems and equipment. |
86
Capital Statement 2021-22
| • | | $2.7 million for mobile capability and the development of new applications for QLiTE mobile tablet devices. |
| • | | $2 million for land acquisitions. |
| • | | $1.7 million to progress the replacement police facilities at Clermont, Dayboro and Kirwan and the water police facility at Hervey Bay. |
| • | | $300,000 for other departmental information systems development. |
| | | | | | | | | | | | | | | | | | | | |
| Queensland Police Service | |
Project | | Statistical
Area | | | Total
Estimated
Cost
$‘000 | | | Expenditure
to
30-06-21
$‘000 | | | Budget
2021-22
$‘000 | | | Post
2021-22
$‘000 | |
QUEENSLAND POLICE SERVICE | | | | | | | | | | | | | | | | | | | | |
Property, Plant and Equipment | | | | | | | | | | | | | | | | | | | | |
Buildings/ General Works | | | | | | | | | | | | | | | | | | | | |
Aurukun police facility upgrade | | | 315 | | | | 6,700 | | | | 457 | | | | 6,243 | | | | | |
Beaudesert replacement police facility | | | 311 | | | | 7,095 | | | | 5,461 | | | | 1,634 | | | | | |
Biloela replacement police facility | | | 308 | | | | 4,950 | | | | 1,100 | | | | 3,850 | | | | | |
Burketown replacement police facility | | | 315 | | | | 2,000 | | | | 200 | | | | 1,800 | | | | | |
Cairns police facility upgrade | | | 306 | | | | 17,412 | | | | 3,022 | | | | 7,390 | | | | 7,000 | |
Cairns West new police facility | | | 306 | | | | 2,300 | | | | | | | | 2,200 | | | | 100 | |
Clermont replacement police facility | | | 312 | | | | 3,500 | | | | | | | | 50 | | | | 3,450 | |
Cooroy replacement police facility | | | 316 | | | | 4,000 | | | | 50 | | | | 1,000 | | | | 2,950 | |
Cunnamulla replacement police facility | | | 315 | | | | 13,000 | | | | 20 | | | | 200 | | | | 12,780 | |
Dalby police facility upgrade | | | 307 | | | | 11,500 | | | | 250 | | | | 3,410 | | | | 7,840 | |
Dayboro replacement police facility | | | 314 | | | | 4,000 | | | | | | | | 500 | | | | 3,500 | |
Hervey Bay replacement water police facility | | | 319 | | | | 3,800 | | | | | | | | 1,000 | | | | 2,800 | |
Kirwan replacement police facility | | | 318 | | | | 30,000 | | | | | | | | 200 | | | | 29,800 | |
Mackay police facility upgrade | | | 312 | | | | 4,000 | | | | | | | | 50 | | | | 3,950 | |
Maryborough police facility upgrade | | | 319 | | | | 4,000 | | | | | | | | 200 | | | | 3,800 | |
Nambour replacement police facility | | | 316 | | | | 8,300 | | | | 5,060 | | | | 3,240 | | | | | |
Pimpama new police facility | | | 309 | | | | 6,084 | | | | 746 | | | | 5,338 | | | | | |
Pormpuraaw replacement police facility | | | 315 | | | | 7,300 | | | | 4,928 | | | | 2,372 | | | | | |
87
Capital Statement 2021-22
| | | | | | | | | | | | | | | | | | |
| Queensland Police Service | |
Project | | Statistical
Area | | Total
Estimated
Cost
$‘000 | | | Expenditure
to
30-06-21
$‘000 | | | Budget
2021-22
$‘000 | | | Post
2021-22
$‘000 | |
Ripley new police facility | | 310 | | | 25,000 | | | | 200 | | | | 500 | | | | 24,300 | |
Rosewood new police facility | | 310 | | | 4,000 | | | | | | | | 50 | | | | 3,950 | |
Warwick police facility upgrade | | 307 | | | 15,000 | | | | 40 | | | | 500 | | | | 14,460 | |
Woree replacement police facility | | 306 | | | 11,423 | | | | 203 | | | | 6,000 | | | | 5,220 | |
| | | | | | | | | | | | | | | | | | |
Sub-total Buildings/ General Works | | | | | | | | | | | | | 47,727 | | | | | |
| | | | | | | | | | | | | | | | | | |
Land | | | | | | | | | | | | | | | | | | |
Land acquisition | | Various | | | | | | | | | | | 2,000 | | | | Ongoing | |
Plant and Equipment | | | | | | | | | | | | | | | | | | |
QGAir aircraft maintenance | | Various | | | | | | | | | | | 4,022 | | | | Ongoing | |
Air conditioning plant replacement program | | Various | | | | | | | | | | | 4,000 | | | | Ongoing | |
Closed circuit camera upgrades in various police facilities | | Various | | | | | | | | | | | 2,000 | | | | Ongoing | |
Minor works | | Various | | | | | | | | | | | 6,000 | | | | Ongoing | |
New and replacement vehicles | | Various | | | | | | | | | | | 40,587 | | | | Ongoing | |
Vessel management program | | Various | | | | | | | | | | | 5,500 | | | | Ongoing | |
Camera Detected Offence Program | | Various | | | | | | | | | | | 10,483 | | | | Ongoing | |
Mobile capability | | Various | | | | | | | | | | | 2,720 | | | | Ongoing | |
Queensland Ambulance Service information systems development | | Various | | | | | | | | | | | 3,955 | | | | Ongoing | |
Queensland Fire and Emergency | | Various | | | | | | | | | | | 3,721 | | | | Ongoing | |
Services information andcommunications systems and equipment | | | | | | | | | | | | | | | | | | |
Information and communication technology | | Various | | | | | | | | | | | 11,255 | | | | Ongoing | |
Public Safety Network | | 305 | | | | | | | | | | | 7,583 | | | | Ongoing | |
Other departmental information systems development | | Various | | | | | | | | | | | 300 | | | | Ongoing | |
Other plant and equipment | | Various | | | | | | | | | | | 4,204 | | | | Ongoing | |
| | | | | | | | | | | | | | | | | | |
Total Property, Plant and Equipment | | | | | | | | | | | | | 156,057 | | | | | |
| | | | | | | | | | | | | | | | | | |
TOTAL QUEENSLAND POLICE SERVICE (PPE) | | | | | | | | | | | | | 156,057 | | | | | |
| | | | | | | | | | | | | | | | | | |
88
Capital Statement 2021-22
Queensland Treasury
Queensland Treasury has capital grants of $122.7 million for 2021-22.
Program Highlights (Capital Grants)
| • | | $122.7 million through the Queensland First Home Owners’ Grant to assist first home buyers to enter the housing market. |
| | | | | | | | | | | | | | | | | | | | |
| Queensland Treasury | |
Project | | Statistical
Area | | | Total
Estimated
Cost
$‘000 | | | Expenditure
to
30-06-21
$‘000 | | | Budget
2021-22
$‘000 | | | Post
2021-22
$‘000 | |
QUEENSLAND TREASURY | | | | | | | | | | | | | | | | | | | | |
Capital Grants | | | | | | | | | | | | | | | | | | | | |
Queensland First Home Owners’ | | | Various | | | | | | | | | | | | 122,700 | | | | Ongoing | |
Grant | | | | | | | | | | | | | | | | | | | | |
| | | | | | | | | | | | | | | | | | | | |
Total Capital Grants | | | | | | | | | | | | | | | 122,700 | | | | | |
| | | | | | | | | | | | | | | | | | | | |
TOTAL QUEENSLAND TREASURY (CG) | | | | | | | | | | | | | | | 122,700 | | | | | |
| | | | | | | | | | | | | | | | | | | | |
89
Capital Statement 2021-22
| 3.16 | REGIONAL DEVELOPMENT, MANUFACTURING AND WATER |
The Regional Development, Manufacturing and Water portfolio includes the Department of Regional Development, Manufacturing and Water, Gladstone Area Water Board, Mount Isa Water Board, Seqwater, and Sunwater Limited. In 2021-22 the portfolio’s capital program includes capital purchases of $471.1 million and capital grants of $28 million.
Department of Regional Development, Manufacturing and Water
The Department of Regional Development, Manufacturing and Water has capital purchases of $142.6 million and capital grants of $28 million in 2021-22.
Program Highlights (Property, Plant and Equipment)
| • | | $140 million, as part of a $367.2 million investment to construct Rookwood Weir, to enhance agricultural and industrial development and to supplement urban water supplies in the Fitzroy Basin and Central Queensland. The project is delivered in partnership with the Australian Government, through the National Water Infrastructure Development Fund. |
Program Highlights (Capital Grants)
| • | | $15 million for the Emu Swamp Dam project to construct a water storage and distribution system to support expanded agriculture in the Granite Belt area. The project is delivered in partnership with the Australian Government, through the National Water Infrastructure Development Fund. In addition to the Southern Downs Drought Resilience Package, this project also aims to increase water availability in the Southern Downs region. |
| • | | $10 million as part of the $70 million Building our Regions (Round 6) for regional water infrastructure projects that deliver regional and economic development opportunities, support local industry growth, generate new sustainable jobs, and improve liveability in Queensland’s regional communities. |
Gladstone Area Water Board
Total capital expenditure planned for 2021-22 is $25.7 million, and is focused on continuing and improving the effective and safe operation of Gladstone Area Water Board’s infrastructure and investigating long-term water security options.
Program Highlights (Property, Plant and Equipment)
| • | | $4.2 million to complete construction of the $10.8 million new fish hatchery to replenish fish stocks in Awoonga Dam and meet regulatory requirements. |
90
Capital Statement 2021-22
| • | | $2.4 million to complete construction of a new pump station to increase capacity and supply water to Gladstone Regional Council reservoir (Kirkwood Reservoir). |
| • | | $2 million for continuation of the Gladstone Fitzroy Pipeline and associated infrastructure preparatory works to ensure that, subject to Government approval, construction is able to commence in the shortest possible time should drought conditions persist. |
| • | | $272,000 to complete construction of an emergency shelter at Awoonga Dam to provide a muster point for local residents in the event of a flood. |
Mount Isa Water Board
Total capital expenditure planned for 2021-22 is $5.7 million, and is focused on continuing and improving the cost-efficient, reliable and safe operation of Mount Isa Water Board’s bulk water infrastructure.
Program Highlights (Property, Plant and Equipment)
| • | | $2.6 million to renew the high-voltage yard and electro-mechanical equipment in Fred Haigh Pump Station to improve operational reliability and efficiency. |
| • | | $556,000 to renew pumps in the Lake Moondarra Deep Well Pump Station which will improve reliability and energy efficiency. |
| • | | $386,000 on construction of diesel backup functionality to improve reliability of Mount Isa City Council potable water supply. |
| • | | $358,000 on upgrades to chlorine dose equipment to renew outdated chlorination facilities. |
Seqwater
Total capital expenditure planned for 2021-22 is $198.7 million. The capital program is focused on the continuation of a safe, secure and reliable water supply for South East Queensland, as well as providing essential flood mitigation services and managing catchment health. Seqwater has facilities located throughout South East Queensland. These require minor works and renewals, as well as upgrades and compliance driven works to ensure effective operation.
Program Highlights (Property, Plant and Equipment)
| • | | $75.3 million to commence construction of the South West Pipeline to connect the Beaudesert region to the South East Queensland Water Grid and improve water security. |
| • | | $8.1 million to undertake preparatory work for the Toowoomba to Warwick Pipeline, as part of the $19.3 million Southern Downs Drought Resilience |
91
Capital Statement 2021-22
| | Package. The pipeline is currently estimated to cost $219 million with a targeted completion in 2023-24. |
| • | | $15.8 million to improve flood resilience at the Mount Crosby East Bank Water Treatment Plant including a new substation. |
| • | | $12.5 million to continue refurbishment and upgrade of 20 filters at the Mount Crosby East Bank Water Treatment Plant to improve capacity and reliability. |
| • | | $9.8 million to remobilise additional production capacity at the Western Corridor Recycled Water Scheme to supply industrial customers. |
| • | | $8.9 million to replace the reverse osmosis membranes at the Gold Coast Desalination Plant to maintain drought resilient water supply for the South East Queensland Water Grid. |
Sunwater Limited
Total capital expenditure planned for 2021-22 is $98.4 million. The capital program is focused on enhancing Sunwater’s dam infrastructure to meet extreme weather conditions and to provide a reliable water supply to regional Queensland as well as investing in innovative digital technology to drive collaboration and efficiency.
Program Highlights (Property, Plant and Equipment)
| • | | $12.5 million to continue planning and investigatory work for the Paradise Dam improvement project to comply with dam safety standards for extreme weather events. |
| • | | $5.6 million to create new allocations in the Mareeba-Dimbulah Water Supply Scheme by reducing water losses and improving efficiency. The project is delivered in partnership with the Australian Government, through the National Water Infrastructure Development Fund. |
| • | | $4.5 million to investigate the feasibility of raising Burdekin Falls Dam to increase storage capacity and water supply in the Burdekin and surrounding regions. |
| • | | $1.7 million to continue planning works for the Burdekin Falls Dam improvement project to comply with dam safety standards for extreme weather events. |
92
Capital Statement 2021-22
| | | | | | | | | | | | | | | | | | |
| Regional Development, Manufacturing and Water | |
Project | | Statistical
Area | | Total
Estimated
Cost
$‘000 | | | Expenditure
to
30-06-21
$‘000 | | | Budget
2021-22
$‘000 | | | Post
2021-22
$‘000 | |
DEPARTMENT OF REGIONAL DEVELOPMENT, MANUFACTURING AND WATER | |
Property, Plant and Equipment | | | | | | | | | | | | | | | | | | |
Rookwood Weir1 | | 308 | | | 332,861 | | | | 171,661 | | | | 140,000 | | | | 21,200 | |
Other property, plant and equipment | | Various | | | | | | | | | | | 2,600 | | | | Ongoing | |
| | | | | | | | | | | | | | | | | | |
Total Property, Plant and Equipment | | | | | | | | | | | | | 142,600 | | | | | |
| | | | | | | | | | | | | | | | | | |
Capital Grants2 | | | | | | | | | | | | | | | | | | |
Building our Regions (Round 6) | | Various | | | 70,000 | | | | | | | | 10,000 | | | | 60,000 | |
Emu Swamp Dam project | | 307 | | | 42,000 | | | | 21,000 | | | | 15,000 | | | | 6,000 | |
Southern Downs Drought Resilience Package | | 307 | | | 7,640 | | | | | | | | 3,000 | | | | 4,640 | |
| | | | | | | | | | | | | | | | | | |
Total Capital Grants | | | | | | | | | | | | | 28,000 | | | | | |
| | | | | | | | | | | | | | | | | | |
GLADSTONE AREA WATER BOARD | | | | | | | | | | | | | | | | | | |
Property, Plant and Equipment | | | | | | | | | | | | | | | | | | |
Awoonga Dam conduit inspection | | 308 | | | 1,502 | | | | 549 | | | | 953 | | | | | |
Awoonga Dam emergency muster shelter | | 308 | | | 1,667 | | | | 1,395 | | | | 272 | | | | | |
Awoonga Dam Fish Hatchery | | 308 | | | 10,840 | | | | 6,639 | | | | 4,201 | | | | | |
Boyne Island Reservoir access and roof replacement | | 308 | | | 913 | | | | 412 | | | | 501 | | | | | |
Boynedale and Four Mile Scrub walking track | | 308 | | | 1,122 | | | | 121 | | | | 1,001 | | | | | |
Emergency staircases -136 Goondoon Street | | 308 | | | 1,018 | | | | 89 | | | | 929 | | | | | |
Flowmeter replacements | | 308 | | | 897 | | | | 189 | | | | 708 | | | | | |
Gladstone Fitzroy Pipeline -planning | | 308 | | | 4,750 | | | | 2,750 | | | | 2,000 | | | | | |
Gladstone Water Treatment Plant filter replacement | | 308 | | | 2,501 | | | | 551 | | | | 1,950 | | | | | |
Gladstone Water Treatment Plant - plant 2 switchboard replacement | | 308 | | | 572 | | | | 308 | | | | 264 | | | | | |
Kirkwood Pump Station (connection to Gladstone Regional Council Kirkwood reservoir) | | 308 | | | 6,192 | | | | 3,825 | | | | 2,367 | | | | | |
Office refurbishment -136 Goondoon Street | | 308 | | | 567 | | | | 2 | | | | 565 | | | | | |
Program of smaller capital works projects | | 308 | | | | | | | | | | | 8,267 | | | | Ongoing | |
93
Capital Statement 2021-22
| | | | | | | | | | | | | | | | | | |
| Regional Development, Manufacturing and Water | |
Project | | Statistical
Area | | Total
Estimated
Cost
$‘000 | | | Expenditure
to
30-06-21
$‘000 | | | Budget
2021-22
$‘000 | | | Post
2021-22
$‘000 | |
Right of use lease assets | | 308 | | | | | | | | | | | 853 | | | | Ongoing | |
Upgrade Calliope Booster Pump Station | | 308 | | | 1,102 | | | | 232 | | | | 870 | | | | | |
| | | | | | | | | | | | | | | | | | |
Total Property, Plant and Equipment | | | | | | | | | | | | | 25,701 | | | | | |
| | | | | | | | | | | | | | | | | | |
MOUNT ISA WATER BOARD | | | | | | | | | | | | | | | | | | |
Property, Plant and Equipment | | | | | | | | | | | | | | | | | | |
Chlorine dose equipment upgrade | | 315 | | | 1,162 | | | | 804 | | | | 358 | | | | | |
Fred Haigh pump station electro-mechanical overhaul | | 315 | | | 7,970 | | | | 1,067 | | | | 2,639 | | | | 4,264 | |
Lake Moondarra Deep Well pump station pumps renewal | | 315 | | | 1,125 | | | | 169 | | | | 556 | | | | 400 | |
Mount Isa City Council supply -diesel backup | | 315 | | | 1,628 | | | | 1,242 | | | | 386 | | | | | |
Other asset enhancements -less than $250,000 | | 315 | | | | | | | | | | | 714 | | | | Ongoing | |
Other asset renewals -less than $250,000 | | 315 | | | | | | | | | | | 325 | | | | Ongoing | |
Other plant and equipment -less than $250,000 | | 315 | | | | | | | | | | | 201 | | | | Ongoing | |
Second pathogen disinfection system | | 315 | | | 1,765 | | | | | | | | 252 | | | | 1,513 | |
Security upgrade | | 315 | | | 1,450 | | | | | | | | 256 | | | | 1,194 | |
| | | | | | | | | | | | | | | | | | |
Total Property, Plant and Equipment | | | | | | | | | | | | | 5,687 | | | | | |
| | | | | | | | | | | | | | | | | | |
SEQWATER | | | | | | | | | | | | | | | | | | |
Property, Plant and Equipment | | | | | | | | | | | | | | | | | | |
Ewen Maddock Dam safety upgrade - stage 2A | | 316 | | | 17,941 | | | | 17,841 | | | | 100 | | | | | |
Gold Coast Desalination Plant reverse osmosis membranereplacement | | 309 | | | 16,086 | | | | 7,196 | | | | 8,890 | | | | | |
Information and communication technology capital program | | 310 | | | | | | | | | | | 8,437 | | | | Ongoing | |
Lake Macdonald Dam safety upgrade - planning | | 316 | | | 127,278 | | | | 21,551 | | | | 2,000 | | | | 103,727 | |
94
Capital Statement 2021-22
| | | | | | | | | | | | | | | | | | |
| Regional Development, Manufacturing and Water | |
Project | | Statistical
Area | | Total
Estimated
Cost
$‘000 | | | Expenditure
to
30-06-21
$‘000 | | | Budget
2021-22
$‘000 | | | Post
2021-22
$‘000 | |
Mount Crosby East Bank substation and enabling works | | 310 | | | 35,600 | | | | 4,909 | | | | 15,800 | | | | 14,891 | |
Mount Crosby East Bank Water Treatment Plant filtration upgrade | | 310 | | | 37,777 | | | | 25,277 | | | | 12,500 | | | | | |
Mount Crosby Weir Bridge structure upgrade | | 310 | | | 22,660 | | | | 567 | | | | 632 | | | | 21,461 | |
Non-infrastructure capital works | | 310 | | | | | | | | | | | 3,878 | | | | Ongoing | |
Other infrastructure projects - Brisbane East | | 301 | | | | | | | | | | | 3,913 | | | | Ongoing | |
Other infrastructure projects - Brisbane North | | 302 | | | | | | | | | | | 3,721 | | | | Ongoing | |
Other infrastructure projects - Brisbane South | | 303 | | | | | | | | | | | 1,017 | | | | Ongoing | |
Other infrastructure projects - Brisbane West | | 304 | | | | | | | | | | | 1,710 | | | | Ongoing | |
Other infrastructure projects - Gold Coast | | 309 | | | | | | | | | | | 2,380 | | | | Ongoing | |
Other infrastructure projects - Ipswich | | 310 | | | | | | | | | | | 18,144 | | | | Ongoing | |
Other infrastructure projects - Logan-Beaudesert | | 311 | | | | | | | | | | | 2,807 | | | | Ongoing | |
Other infrastructure projects - Moreton Bay South | | 314 | | | | | | | | | | | 1,393 | | | | Ongoing | |
Other infrastructure projects - Sunshine Coast | | 316 | | | | | | | | | | | 14,912 | | | | Ongoing | |
Other infrastructure projects - Toowoomba | | 317 | | | | | | | | | | | 750 | | | | Ongoing | |
Other infrastructure projects - Wide Bay | | 319 | | | | | | | | | | | 244 | | | | Ongoing | |
Somerset Dam safety upgrade - planning | | 310 | | | 21,128 | | | | 18,848 | | | | 2,280 | | | | | |
South West Pipeline | | 311 | | | 95,200 | | | | 18,030 | | | | 75,300 | | | | 1,870 | |
Toowoomba to Warwick Pipeline - planning | | 307 | | | 8,100 | | | | | | | | 8,100 | | | | | |
Western Corridor Recycled Water Scheme -industrial customers | | 310 | | | 9,837 | | | | | | | | 9,837 | | | | | |
| | | | | | | | | | | | | | | | | | |
Total Property, Plant and Equipment | | | | | | | | | | | | | 198,745 | | | | | |
| | | | | | | | | | | | | | | | | | |
95
Capital Statement 2021-22
| | | | | | | | | | | | | | | | | | | | |
| Regional Development, Manufacturing and Water | |
Project | | Statistical
Area | | | Total
Estimated
Cost
$‘000 | | | Expenditure
to
30-06-21
$‘000 | | | Budget
2021-22
$‘000 | | | Post
2021-22
$‘000 | |
SUNWATER LIMITED | | | | | | | | | | | | | | | | | | | | |
Property, Plant and Equipment | | | | | | | | | | | | | | | | | | | | |
Burdekin Falls Dam raising project - planning | | | 318 | | | | 17,120 | | | | 12,620 | | | | 4,500 | | | | | |
Burdekin Falls Dam improvement project - planning | | | 318 | | | | 17,232 | | | | 14,790 | | | | 1,721 | | | | 721 | |
Burdekin groundwater management | | | 318 | | | | 11,152 | | | | 520 | | | | 5,624 | | | | 5,008 | |
Coolmunda Dam improvement project - planning | | | 307 | | | | 6,101 | | | | 2,110 | | | | 3,402 | | | | 589 | |
Digital enterprise business systems - non-infrastructure | | | Various | | | | 47,471 | | | | 21,708 | | | | 12,480 | | | | 13,283 | |
Eungella Water Pipeline increased pumping capacity - planning | | | 318 | | | | 10,859 | | | | 530 | | | | 2,000 | | | | 8,329 | |
Mareeba-Dimbulah Water Supply Scheme efficiency improvementproject | | | 306 | | | | 30,840 | | | | 25,282 | | | | 5,558 | | | | | |
Non-routine capital works - bulk water infrastructure | | | Various | | | | | | | | | | | | 208 | | | | Ongoing | |
Non-routine capital works - industrial pipelines | | | Various | | | | | | | | | | | | 4,145 | | | | Ongoing | |
Non-routine capital works - irrigation systems | | | Various | | | | | | | | | | | | 8,096 | | | | Ongoing | |
Non-infrastructure capital works | | | Various | | | | | | | | | | | | 7,447 | | | | Ongoing | |
Paradise Dam improvement project - planning | | | 319 | | | | 32,030 | | | | 19,530 | | | | 12,500 | | | | | |
Paradise Dam essential works | | | 319 | | | | 105,500 | | | | 96,500 | | | | 9,000 | | | | | |
Potential commercial projects - planning | | | Various | | | | | | | | | | | | 14,100 | | | | Ongoing | |
Potential economic development projects - planning | | | Various | | | | | | | | | | | | 1,250 | | | | Ongoing | |
Right of use leased assets | | | Various | | | | | | | | | | | | 1,434 | | | | Ongoing | |
Teemburra Dam improvement project - planning | | | 312 | | | | 10,490 | | | | 3,310 | | | | 4,900 | | | | 2,280 | |
| | | | | | | | | | | | | | | | | | | | |
Total Property, Plant and Equipment | | | | | | | | | | | | | | | 98,365 | | | | | |
| | | | | | | | | | | | | | | | | | | | |
| | | | | | | | | | | | | | | | | | | | |
| | | | | | | | | | | | | | | | | | | | |
TOTAL REGIONAL DEVELOPMENT, MANUFACTURING AND WATER (PPE) | | | | | | | | | | | | | | | 471,098 | | | | | |
| | | | | | | | | | | | | | | | | | | | |
TOTAL REGIONAL DEVELOPMENT, MANUFACTURING AND WATER (CG) | | | | | | | | | | | | | | | 28,000 | | | | | |
| | | | | | | | | | | | | | | | | | | | |
| | | | | | | | | | | | | | | | | | | | |
96
Capital Statement 2021-22
| | | | | | | | | | |
| Regional Development, Manufacturing and Water |
Notes:
| | 1. | The total capital expenditure component of the project is $347.9 million, which includes $15 million in centrally-held funding. The total project value of $367.2 million is inclusive of operating expenditure. |
| | 2. | Capital grants for the Department of Regional Development, Manufacturing and Water excludes a $3.2 million capital grant from the department to Sunwater, which provides part of the funding source for Sunwater expenditure of $5.6 million in 2021-22, towards the Mareeba-Dimbulah Water Supply Scheme efficiency improvement project. |
97
Capital Statement 2021-22
Department of Resources
Total capital purchases for the Resources portfolio for 2021-22 is $12.1 million.
The department’s capital investment program will support the management of disclaimed mine sites and maintenance of the State’s stock route network. It also includes investment in digital solutions to support the vast datasets used to stimulate economic development in Queensland and other critical property, plant and equipment assets to support the department’s service delivery requirements.
| | | | | | | | | | | | | | | | | | |
| Resources | |
Project | | Statistical
Area | | Total
Estimated
Cost
$‘000 | | | Expenditure
to
30-06-21
$‘000 | | | Budget
2021-22
$‘000 | | | Post
2021-22
$‘000 | |
DEPARTMENT OF RESOURCES | | | | | | | | | | | | | | | | | | |
Property, Plant and Equipment | | | | | | | | | | | | | | | | | | |
Systems development | | 305 | | | | | | | | | | | 2,344 | | | | Ongoing | |
Abandoned mines - Care and maintenance, risk mitigation,remediation and consultation | | Various | | | 2,855 | | | | 1,825 | | | | 1,030 | | | | | |
Stock route network | | Various | | | | | | | | | | | 800 | | | | Ongoing | |
Other property, plant and equipment | | Various | | | | | | | | | | | 7,966 | | | | Ongoing | |
| | | | | | | | | | | | | | | | | | |
Total Property, Plant and Equipment | | | | | | | | | | | | | 12,140 | | | | | |
| | | | | | | | | | | | | | | | | | |
TOTAL RESOURCES (PPE) | | | | | | | | | | | | | 12,140 | | | | | |
| | | | | | | | | | | | | | | | | | |
98
Capital Statement 2021-22
| 3.18 | SENIORS, DISABILITY SERVICES AND ABORIGINAL AND TORRES STRAIT ISLANDER PARTNERSHIPS |
Department of Seniors, Disability Services and Aboriginal and Torres Strait Islander Partnerships
The capital works program for the Department of Seniors, Disability Services and Aboriginal and Torres Strait Islander Partnerships is $7.6 million in 2021-22. The total capital grants program for the department is $5.6 million in 2021-22.
Capital works investment is primarily within the Disability Services portfolio and capital grants relate to Aboriginal and Torres Strait Islander Partnerships programs.
Program highlights (Property, Plant and Equipment)
| • | | $6.1 million to advance the provision of infrastructure in relation to robust and secure accommodation for complex clients with challenging behaviours. The projects within this program of work are major upgrades of 2 robust villas, upgrade of 2 Brian Parker Place (a disability accommodation dwelling) and the construction of a new purpose-built duplex in Wacol. |
| • | | $570,000 for accommodation and business solutions to support the implementation of the initiative to legally recognise Torres Strait Islander traditional child rearing practice. |
| • | | $500,000 to continue upgrading, improving and modifying accommodation facilities for people with an intellectual or cognitive disability who exhibit extremely challenging behaviours. |
| • | | $402,000 to refurbish office spaces and minor property, plant and equipment. |
Program Highlights (Capital Grants)
| • | | $2.8 million each for the construction and completion of 2 splash parks in discrete communities. |
99
Capital Statement 2021-22
| | | | | | | | | | | | | | | | | | |
| Seniors, Disability Services and Aboriginal and Torres Strait Islander Partnerships | |
Project | | Statistical
Area
Estimated | | Total
Cost
$‘000 | | | Expenditure
to
30-06-21
$‘000 | | | Budget
2021-
22
$‘000 | | | Post
2021-22
$‘000 | |
DEPARTMENT OF SENIORS, DISABILITY SERVICES AND ABORIGINAL AND TORRES STRAIT ISLANDER PARTNERSHIPS | |
Property, Plant and Equipment | | | | | | | | | | | | | | | | | | |
Disability Services | | | | | | | | | | | | | | | | | | |
Wacol FDS transition accommodation | | 304 | | | 6,450 | | | | 350 | | | | 6,100 | | | | | |
General property upgrades | | Various | | | | | | | | | | | 500 | | | | Ongoing | |
Aboriginal and Torres Strait Islander Partnerships | | | | | | | | | | | | | | | | | | |
Legal Recognition of Torres Strait Islander Traditional Child Rearing Practice | | Various | | | 570 | | | | | | | | 570 | | | | | |
Other Property, Plant and Equipment | | | | | | | | | | | | | | | | | | |
Office accommodation | | Various | | | | | | | | | | | 402 | | | | Ongoing | |
| | | | | | | | | | | | | | | | | | |
Total Property, Plant and Equipment | | | | | | | | | | | | | 7,572 | | | | | |
| | | | | | | | | | | | | | | | | | |
Capital Grants | | | | | | | | | | | | | | | | | | |
Aboriginal and Torres Strait Islander Partnerships | | | | | | | | | | | | | | | | | | |
Splash Park - discrete community (Far North Queensland) | | 306 | | | 3,000 | | | | 187 | | | | 2,813 | | | | | |
Splash Park - discrete community (North Queensland) | | 318 | | | 3,000 | | | | 208 | | | | 2,792 | | | | | |
| | | | | | | | | | | | | | | | | | |
Total Capital Grants | | | | | | | | | | | | | 5,605 | | | | | |
| | | | | | | | | | | | | | | | | | |
TOTAL SENIORS, DISABILITY SERVICES AND ABORIGINAL AND TORRES STRAIT ISLANDER PARTNERSHIPS (PPE) | | | | 7,572 | | | | | |
| | | | | | | | | | | | | | | | | | |
TOTAL SENIORS, DISABILITY SERVICES AND ABORIGINAL AND TORRES STRAIT ISLANDER PARTNERSHIPS (CG) | | | | 5,605 | | | | | |
| | | | | | | | | | | | | | | | | | |
100
Capital Statement 2021-22
| 3.19 | STATE DEVELOPMENT, INFRASTRUCTURE, LOCAL GOVERNMENT AND PLANNING |
In 2021-22, the State Development, Infrastructure, Local Government and Planning portfolio, including Economic Development Queensland, South Bank Corporation and the Queensland Reconstruction Authority, has capital purchases of $90.6 million and capital grants of $1.009 billion.
Department of State Development, Infrastructure, Local Government and Planning
The Department of State Development, Infrastructure, Local Government and Planning has capital purchases of $4 million and capital grants of $494.6 million in 2021-22.
Program Highlights (Capital Grants)
| • | | $148 million as part of the $1 billion Works for Queensland program to support local governments in regional Queensland undertake job-creating maintenance and minor infrastructure works. |
| • | | $85 million towards the $195 million Haughton Pipeline Stage 2 water security initiative for Townsville. |
| • | | $80 million as part of the $200 million COVID Works for Queensland program to support local governments to undertake job-creating maintenance and minor infrastructure projects. |
| • | | $30.6 million for the Building our Regions program (Rounds 1-5) to provide funding for critical infrastructure in regional areas of the State, while also generating jobs, fostering economic development and improving the liveability of regional communities. |
| • | | $30.3 million as part of the $120 million Indigenous Councils Critical Infrastructure Program to support Indigenous councils to implement projects and infrastructure works relating to critical water, wastewater and solid waste assets, and provide a basis for the long-term strategic management of essential assets. |
| • | | $25 million for the Local Government Grants and Subsidies Program which provides funding for priority infrastructure projects to meet identified community needs and to support projects that will enhance sustainable and liveable communities. |
| • | | $25 million for the Resources Community Infrastructure Fund to support the post-COVID recovery of regional communities by improving economic and social infrastructure across Queensland’s resources communities. |
101
Capital Statement 2021-22
| • | | $25 million towards the $200 million South East Queensland Community Stimulus Program to fast track South East Queensland councils’ investment in new infrastructure and community assets that creates jobs and delivers economic stimulus. |
| • | | $20 million towards the $50 million Unite and Recover Community Stimulus Package to fast track investment in new infrastructure and community assets that creates jobs and delivers economic stimulus. |
Economic Development Queensland
In 2021-22, Economic Development Queensland has capital purchases of $79.9 million.
Program Highlights (Property, Plant and Equipment)
| • | | $29.5 million for the urban renewal development at Northshore Hamilton. |
| • | | $15.2 million for the development of the Oxley Priority Development Area. |
| • | | $10.6 million for the Carseldine Urban Village development. |
| • | | $9.5 million for the proposed Cairns Regional Industrial Estate development. |
| • | | $6.2 million for the development at Sunshine Coast Industrial Park -Stage 2. |
| • | | $5.0 million for the development of the Yeronga Priority Development Area. |
Queensland Reconstruction Authority
In 2021-22, the Queensland Reconstruction Authority has capital grants of $514.7 million to support the Queensland Government’s program of infrastructure renewal and recovery within disaster-affected communities, and to help build disaster resilience across Queensland.
Program Highlights (Capital Grants)
| • | | $481.4 million for Natural Disaster Relief and Recovery Arrangements and Disaster Recovery Funding Arrangements will be paid to Local Government Authorities for reconstruction, betterment and other projects relating to natural disaster events between 2018 and 2021. These programs are jointly funded by the Queensland Government and the Australian Government. |
| • | | $14.4 million for the Queensland Resilience and Risk Reduction Fund, as part of a National Partnership Agreement, jointly funded with the Australian Government, to support disaster mitigation projects and build resilience to natural disasters. |
| • | | $12.2 million as part of the $32 million for Recovery and Resilience Grants program to support Queensland communities, funded by the Australian Government. |
102
Capital Statement 2021-22
| • | | $5.7 million towards rebuilding the Proserpine Entertainment Centre following Severe Tropical Cyclone Debbie. |
South Bank Corporation
In 2021-22, South Bank Corporation has budgeted capital works expenditure of $6.6 million to enhance the South Bank Parklands, the Corporation’s commercial assets, and the Brisbane Convention and Exhibition Centre.
| | | | | | | | | | | | | | | | | | |
| State Development, Infrastructure, Local Government and Planning | |
| | | | | |
Project | | Statistical
Area | | Total
Estimated
Cost
$‘000 | | | Expenditure
to
30-06-21
$‘000 | | | Budget
2021-22
$‘000 | | | Post
2021-22
$‘000 | |
DEPARTMENT OF STATE DEVELOPMENT, INFRASTRUCTURE, LOCAL GOVERNMENT AND PLANNING | |
| | | | | |
Property, Plant and Equipment | | | | | | | | | | | | | | | | | | |
State development area acquisitions | | 318 | | | 12,329 | | | | 8,400 | | | | 3,929 | | | | | |
Other plant and equipment | | 305 | | | | | | | | | | | 70 | | | | Ongoing | |
| | | | | | | | | | | | | | | | | | |
Total Property, Plant and Equipment | | | | | | | | | | | | | 3,999 | | | | | |
| | | | | | | | | | | | | | | | | | |
Capital Grants | | | | | | | | | | | | | | | | | | |
Works for Queensland | | Various | | | 1,000,000 | | | | 552,000 | | | | 148,000 | | | | 300,000 | |
Haughton Pipeline Stage 2 | | 318 | | | 195,000 | | | | 7,500 | | | | 85,000 | | | | 102,500 | |
COVID Works for Queensland | | Various | | | 200,000 | | | | 120,000 | | | | 80,000 | | | | | |
Building our Regions (Rounds 1-5) | | Various | | | 330,610 | | | | 284,791 | | | | 30,619 | | | | 15,200 | |
Indigenous Councils Critical Infrastructure Program | | Various | | | 120,000 | | | | 67,338 | | | | 30,338 | | | | 22,324 | |
Local Government Grants and Subsidies Program | | Various | | | | | | | | | | | 25,049 | | | | Ongoing | |
Resources Community Infrastructure Fund | | Various | | | 100,000 | | | | | | | | 25,000 | | | | 75,000 | |
South East Queensland Community Stimulus Program | | Various | | | 200,000 | | | | | | | | 25,000 | | | | 175,000 | |
Unite and Recover Community Stimulus Package | | Various | | | 50,000 | | | | 30,000 | | | | 20,000 | | | | | |
Community Infrastructure Investment Partnership | | Various | | | 15,000 | | | | 4,000 | | | | 8,000 | | | | 3,000 | |
Roma Street Parklands | | 305 | | | | | | | | | | | 7,643 | | | | Ongoing | |
Hinchinbrook Harbour new sewage plant | | 318 | | | 6,433 | | | | 1,133 | | | | 2,500 | | | | 2,800 | |
Cunnamulla artesian hot springs and river walk experience | | 315 | | | 4,996 | | | | 1,500 | | | | 2,500 | | | | 996 | |
103
Capital Statement 2021-22
| | | | | | | | | | | | | | | | | | |
| State Development, Infrastructure, Local Government and Planning | |
Project | | Statistical
Area | | Total
Estimated
Cost
$‘000 | | | Expenditure
to
30-06-21
$‘000 | | | Budget
2021-22
$‘000 | | | Post
2021-22
$‘000 | |
Northern Peninsula Area water supply system - replacement of asbestos cement pipelines | | 315 | | | 5,000 | | | | 3,583 | | | | 1,417 | | | | | |
Northern Peninsula Area water supply system - water supply rectification and repair program of works | | 315 | | | 4,000 | | | | 1,333 | | | | 1,333 | | | | 1,334 | |
Ayr water supply infrastructure project - Stage 2 | | 318 | | | 10,000 | | | | 9,000 | | | | 1,000 | | | | | |
Kuranda Skyrail and infrastructure levy | | 306 | | | | | | | | | | | 744 | | | | Ongoing | |
Palm Island rising main project | | 318 | | | 2,000 | | | | 1,500 | | | | 500 | | | | | |
| | | | | | | | | | | | | | | | | | |
Total Capital Grants | | | | | | | | | | | | | 494,643 | | | | | |
| | | | | | | | | | | | | | | | | | |
| | | | | |
ECONOMIC DEVELOPMENT QUEENSLAND | | | | | | | | | | | | | | | | | | |
| | | | | |
Property, Plant and Equipment | | | | | | | | | | | | | | | | | | |
Northshore Hamilton | | 302 | | | 363,604 | | | | 72,627 | | | | 29,464 | | | | 261,513 | |
Oxley Priority Development Area | | 310 | | | 32,038 | | | | 14,295 | | | | 15,215 | | | | 2,528 | |
Carseldine Urban Village | | 302 | | | 39,158 | | | | 28,521 | | | | 10,637 | | | | | |
Cairns Regional Industrial Estate | | 306 | | | 31,500 | | | | 500 | | | | 9,500 | | | | 21,500 | |
Sunshine Coast Industrial Park - Stage 2 | | 316 | | | 31,218 | | | | 1,518 | | | | 6,200 | | | | 23,500 | |
Yeronga Priority Development Area | | 303 | | | 27,448 | | | | 14,194 | | | | 5,049 | | | | 8,205 | |
Gold Coast Health and Knowledge Precinct | | 309 | | | 32,762 | | | | 25,617 | | | | 1,435 | | | | 5,710 | |
Gladstone State Development Area | | 308 | | | 18,916 | | | | 7,316 | | | | 1,000 | | | | 10,600 | |
Clinton Industrial Estate | | 308 | | | 20,114 | | | | 1,364 | | | | 500 | | | | 18,250 | |
Salisbury Plains Industrial Precinct | | 312 | | | 9,100 | | | | 2,100 | | | | 500 | | | | 6,500 | |
Yeerongpilly Green | | 303 | | | 70,118 | | | | 55,983 | | | | 237 | | | | 13,898 | |
Townsville Regional Industrial Estate | | 318 | | | 8,125 | | | | 4,625 | | | | 200 | | | | 3,300 | |
| | | | | | | | | | | | | | | | | | |
Total Property, Plant and Equipment | | | | | | | | | | | | | 79,937 | | | | | |
| | | | | | | | | | | | | | | | | | |
| | | | | |
QUEENSLAND RECONSTRUCTION AUTHORITY | | | | | | | | | | | | | | | | | | |
| | | | | |
Capital Grants | | | | | | | | | | | | | | | | | | |
Disaster Recovery Funding Arrangements (Local Government Authorities) | | Various | | | | | | | | | | | 481,421 | | | | Ongoing | |
104
Capital Statement 2021-22
| | | | | | | | | | | | | | | | | | |
| State Development, Infrastructure, Local Government and Planning | |
Project | | Statistical
Area | | Total
Estimated
Cost
$‘000 | | | Expenditure
to
30-06-21
$‘000 | | | Budget
2021-22
$‘000 | | | Post
2021-22
$‘000 | |
Queensland Resilience and Risk Reduction Fund | | Various | | | 65,507 | | | | 10,482 | | | | 14,411 | | | | 40,614 | |
Recovery and Resilience Grants | | Various | | | 32,000 | | | | 4,200 | | | | 12,200 | | | | 15,600 | |
Proserpine Entertainment Centre | | 312 | | | 13,726 | | | | 8,026 | | | | 5,700 | | | | | |
Queensland Disaster Resilience Fund | | Various | | | 8,600 | | | | 7,589 | | | | 1,011 | | | | | |
| | | | | | | | | | | | | | | | | | |
Total Capital Grants | | | | | | | | | | | | | 514,743 | | | | | |
| | | | | | | | | | | | | | | | | | |
| | | | | |
SOUTH BANK CORPORATION | | | | | | | | | | | | | | | | | | |
| | | | | |
Property, Plant and Equipment | | | | | | | | | | | | | | | | | | |
Parklands enhancements and replacements | | 305 | | | | | | | | | | | 3,021 | | | | Ongoing | |
Brisbane Convention and Exhibition Centre enhancements andreplacements | | 305 | | | | | | | | | | | 3,000 | | | | Ongoing | |
Investment properties - other enhancements and replacements | | 305 | | | | | | | | | | | 430 | | | | Ongoing | |
Car park upgrades and replacements | | 305 | | | | | | | | | | | 196 | | | | Ongoing | |
| | | | | | | | | | | | | | | | | | |
Total Property, Plant and Equipment | | | | | | | | | | | | | 6,647 | | | | | |
| | | | | | | | | | | | | | | | | | |
| | |
TOTAL STATE DEVELOPMENT, INFRASTRUCTURE, LOCAL GOVERNMENT AND PLANNING (PPE) | | | | 90,583 | | | | | |
| | | | | | | | | | | | | | | | | | |
TOTAL STATE DEVELOPMENT, INFRASTRUCTURE, LOCAL GOVERNMENT AND PLANNING (CG) | | | | 1,009,386 | | | | | |
| | | | | | | | | | | | | | | | | | |
105
Capital Statement 2021-22
| 3.20 | TOURISM, INNOVATION AND SPORT |
Department of Tourism, Innovation and Sport
Total capital purchases for the Department of Tourism, Innovation and Sport are estimated to be $27.4 million in 2021-22. Total Capital Grants for the department are estimated to be $138.9 million in 2021-22.
Program Highlights (Property, Plant and Equipment)
| • | | $14.6 million to enhance existing State-owned sport and active recreation facilities at the Gold Coast, Sunshine Coast and Townsville, to deliver quality experiences that inspire physical activity. |
| • | | $9.9 million for a 94 kilometre walking and mountain biking trail from Palm Cove to Port Douglas, with public and eco-accommodation facilities. |
Program Highlights (Capital Grants)
| • | | $26.6 million to encourage Queenslanders to be more active, more often as well as working to increase health and wellbeing outcomes across the state in line with key government priorities. |
| • | | $20 million towards stage 1 of the redevelopment of the Sunshine Coast Stadium at Bokarina. |
| • | | $15 million to build resilient businesses, regions and communities by creating sustainable new jobs and increasing visitor expenditure through investment in tourism infrastructure that supports COVID-19 recovery. |
| • | | $15 million towards the redevelopment of the Ballymore Stadium in Herston to create a new Queensland Rugby Union high-performance centre. |
| • | | $12.6 million to deliver modular infrastructure solutions in high need communities that improves accessibility and activity, including support for female participation. |
Stadiums Queensland
Stadiums Queensland’s 2021-22 capital outlay of $24 million represents the capital investment required to assist in ensuring that Queensland’s major sports and entertainment facilities continue to provide world-class fan experiences, support high performance development and facilitate community participation in sport and physical activity.
106
Capital Statement 2021-22
| | | | | | | | | | | | | | | | | | |
| Tourism Innovation and Sport | |
Project | | Statistical
Area | | Total
Estimated
Cost
$‘000 | | | Expenditure
to
30-06-21
$‘000 | | | Budget
2021-22
$‘000 | | | Post
2021-22
$‘000 | |
DEPARTMENT OF TOURISM, INNOVATION AND SPORT | | | | | | | | | | | | | | | | | | |
Property, Plant and Equipment | | | | | | | | | | | | | | | | | | |
Queensland Active Precincts | | Various | | | 38,009 | | | | 23,432 | | | | 14,577 | | | | | |
Wangetti Trail | | 306 | | | 30,448 | | | | 430 | | | | 9,900 | | | | 20,118 | |
Sport and recreation - Queensland recreation centres | | Various | | | | | | | | | | | 2,400 | | | | Ongoing | |
Specialised Training Equipment | | 303 | | | 550 | | | | | | | | 550 | | | | | |
| | | | | | | | | | | | | | | | | | |
Total Property, Plant and Equipment | | | | | | | | | | | | | 27,427 | | | | | |
| | | | | | | | | | | | | | | | | | |
| | | | | |
Capital Grants | | | | | | | | | | | | | | | | | | |
Local community sporting infrastructure | | Various | | | 43,000 | | | | 2,400 | | | | 26,600 | | | | 14,000 | |
Sunshine Coast Stadium | | 316 | | | 20,000 | | | | | | | | 20,000 | | | | | |
Growing Tourism Infrastructure Fund 2020 | | Various | | | 24,740 | | | | 9,740 | | | | 15,000 | | | | | |
Ballymore Precinct stage 1 redevelopment | | 305 | | | 15,000 | | | | | | | | 15,000 | | | | | |
Active Community Infrastructure - Round 1 | | Various | | | 25,430 | | | | 12,785 | | | | 12,645 | | | | | |
Sport Infrastructure Program | | Various | | | 28,753 | | | | | | | | 8,726 | | | | 20,027 | |
Growing Tourism Infrastructure Fund | | Various | | | 30,609 | | | | 24,826 | | | | 5,783 | | | | | |
Great Barrier Reef Arena development project | | 312 | | | 10,000 | | | | 5,000 | | | | 5,000 | | | | | |
Allied Health and Wellbeing Centre (Clem Jones Centre) | | 301 | | | 5,000 | | | | 250 | | | | 4,750 | | | | | |
Townsville Sailing Club | | 318 | | | 4,000 | | | | | | | | 4,000 | | | | | |
Year of Indigenous Tourism | | Various | | | 6,400 | | | | 3,109 | | | | 3,291 | | | | | |
Attracting Tourism Fund | | Various | | | 15,880 | | | | 12,772 | | | | 3,108 | | | | | |
Surf Lifesaving Infrastructure | | Various | | | 6,000 | | | | 3,000 | | | | 3,000 | | | | | |
Outback Tourism Infrastructure Fund | | Various | | | 7,796 | | | | 5,931 | | | | 1,865 | | | | | |
Wangetti Trail (Mowbray North) | | 306 | | | 5,443 | | | | 3,630 | | | | 1,813 | | | | | |
Great Barrier Reef Island Resorts Rejuvenation Program | | Various | | | 22,397 | | | | 20,605 | | | | 1,792 | | | | | |
2019 Monsoon Disaster Recovery - sporting infrastructure | | Various | | | 12,131 | | | | 11,122 | | | | 1,009 | | | | | |
AFL Grand Final legacy | | Various | | | 4,000 | | | | 1,000 | | | | 1,000 | | | | 2,000 | |
Community use of schools | | Various | | | 2,650 | | | | 1,650 | | | | 1,000 | | | | | |
Townsville Skate Park (Harold Phillips Park) | | 318 | | | 1,000 | | | | 100 | | | | 900 | | | | | |
107
Capital Statement 2021-22
| | | | | | | | | | | | | | | | | | |
| Tourism Innovation and Sport | |
Project | | Statistical
Area | | Total
Estimated
Cost
$‘000 | | | Expenditure
to
30-06-21
$‘000 | | | Budget
2021-22
$‘000 | | | Post
2021-22
$‘000 | |
School Sport Infrastructure Program | | Various | | | 2,860 | | | | 2,030 | | | | 750 | | | | 80 | |
Whitsunday Sports Park | | 312 | | | 2,100 | | | | 1,365 | | | | 735 | | | | | |
Sport Female Facilities Program | | Various | | | 15,000 | | | | 14,650 | | | | 350 | | | | | |
Get Playing Places and Spaces | | Various | | | 28,129 | | | | 27,878 | | | | 251 | | | | | |
Footy Facilities Fund | | Various | | | 1,276 | | | | 1,076 | | | | 200 | | | | | |
Sports grant funding boost | | Various | | | 7,659 | | | | 7,509 | | | | 150 | | | | | |
Zillmere Sports Centre | | 302 | | | 6,241 | | | | 6,116 | | | | 125 | | | | | |
Get Playing Plus | | Various | | | 38,437 | | | | 38,362 | | | | 75 | | | | | |
Advance Queensland | | 308 | | | 3,080 | | | | 3,060 | | | | 20 | | | | | |
| | | | | | | | | | | | | | | | | | |
Total Capital Grants | | | | | | | | | | | | | 138,938 | | | | | |
| | | | | | | | | | | | | | | | | | |
| | | | | |
STADIUMS QUEENSLAND | | | | | | | | | | | | | | | | | | |
| | | | | |
Property, Plant and Equipment | | | | | | | | | | | | | | | | | | |
Annual capital program | | Various | | | | | | | | | | | 18,733 | | | | Ongoing | |
Queensland Sport and Athletics Centre industry hub redevelopment | | 303 | | | 9,827 | | | | 4,609 | | | | 5,218 | | | | | |
| | | | | | | | | | | | | | | | | | |
Total Property, Plant and Equipment | | | | | | | | | | | | | 23,951 | | | | | |
| | | | | | | | | | | | | | | | | | |
TOTAL TOURISM, INNOVATION AND SPORT (PPE) | | | | | | | | | | | | | 51,378 | | | | | |
| | | | | | | | | | | | | | | | | | |
TOTAL TOURISM, INNOVATION AND SPORT (CG) | | | | | | | | | | | | | 138,938 | | | | | |
| | | | | | | | | | | | | | | | | | |
108
Capital Statement 2021-22
| 3.21 | TRANSPORT AND MAIN ROADS |
In 2021-22, total capital purchases for the Transport and Main Roads portfolio are $6.902 billion including capital grants of $480.6 million. The portfolio includes the Department of Transport and Main Roads, Queensland Rail, Cross River Rail Delivery Authority, Far North Queensland Ports Corporation Limited, Gladstone Ports Corporation Limited, North Queensland Bulk Ports Corporation Limited, Port of Townsville Limited, RoadTek and the Gold Coast Waterways Authority.
Department of Transport and Main Roads
In 2021-22, capital purchases total $4.206 billion towards infrastructure investment across the State. The Department of Transport and Main Roads is committed to creating a single integrated transport network accessible to everyone. Further detail on Department of Transport and Main Roads future program of work is provided in the Queensland Transport and Roads Investment Program.
Program Highlights (Property, Plant and Equipment)
| • | | $200 million towards upgrading 10 kilometres of the Pacific Motorway between Varsity Lakes and Tugun, at a total estimated cost of $1 billion, funded in partnership with the Australian Government. |
| • | | $180 million towards providing a new 26 kilometre, 4-lane divided highway between the existing Bruce Highway interchange at Woondum, south of Gympie and Curra, at a total estimated cost of $1 billion, funded in partnership with the Australian Government. |
| • | | $135 million towards upgrading 8 kilometres of the Pacific Motorway between Eight Mile Plains and Daisy Hill, at a total estimated cost of $750 million, funded in partnership with the Australian Government. |
| • | | $119 million towards ongoing accessibility upgrades for the New Generation Rollingstock fleet to comply with disability standards. |
| • | | $115 million towards construction of the Coomera Connector (Stage 1) between Coomera and Nerang, at a total estimated cost of $1.53 billion, funded in partnership with the Australian Government. |
| • | | $107.7 million towards a new public transport ticketing system across the state, at a total estimated cost of $371.1 million. |
| • | | $105.9 million towards upgrading the Bruce Highway from 4 to 6 lanes between Caboolture-Bribie Island Road and Steve Irwin Way (Exit 163), at a total estimated cost of $662.5 million, funded in partnership with the Australian Government. |
109
Capital Statement 2021-22
| • | | $98.3 million towards duplicating from 2 to 4 lanes the Bruce Highway (Cairns Southern Access Corridor Stage 3) from Edmonton to Gordonvale, at a total estimated cost of $481 million, funded in partnership with the Australian Government. |
| • | | $86.3 million towards fitting existing New Generation Rollingstock with new European Train Control System signalling, at a total estimated cost of $255 million. |
| • | | $79.1 million towards upgrading the Maroochydore Road and Mons Road interchanges on the Bruce Highway, at a total estimated cost of $301.3 million, funded in partnership with the Australian Government. |
| • | | $65 million towards construction of the Townsville Ring Road (Stage 5) project to duplicate the existing ring road between Vickers Bridge and Shaw Road, at a total estimated cost of $230 million, funded in partnership with the Australian Government. |
| • | | $45 million towards upgrading Deception Bay Road interchange with the Bruce Highway, at a total estimated cost of $163.3 million, funded in partnership with the Australian Government. |
| • | | $42.5 million towards Mackay Northern Access Upgrade project on the Bruce Highway from Ron Camm Bridge to the Mackay Ring Road (Stage 1), at a total estimated cost of $120.4 million, funded in partnership with the Australian Government. |
| • | | $40.1 million towards constructing bridges and approaches on the Bruce Highway (Haughton River Floodplain) south of Giru between Horseshoe Lagoon and Palm Creek, at a total estimated cost of $514.3 million, funded in partnership with the Australian Government. |
| • | | $36.6 million towards constructing a 4-lane duplication of Mount Lindesay Highway between Stoney Camp Road and Chambers Flat Road interchanges at Munruben, at a total estimated cost of $75 million, funded in partnership with the Australian Government. |
| • | | $36.1 million towards constructing a new 2-lane rural highway to connect Peak Downs Highway west of Walkerston to the Mackay Ring Road near Paget, at a total estimated cost of $150 million, funded in partnership with the Australian Government. |
| • | | $35 million towards constructing Rockhampton Ring Road to link the Bruce Highway through Rockhampton extending from the Capricorn Highway (Nelson Street), to Rockhampton—Yeppoon Road/Bruce Highway intersection, at a total estimated cost of $1.065 billion, funded in partnership with the Australian Government. |
110
Capital Statement 2021-22
Program Highlights (Capital Grants)
| • | | $70 million for Transport Infrastructure Development Scheme to local governments, including Aboriginal and Torres Strait Islander community assistance. |
| • | | $27.1 million towards Black Spot Program to reduce the risk of crashes. |
| • | | $17.1 million for the Queensland School Bus Upgrade Scheme to provide funding to eligible school bus operators to assist with the purchase of new buses or buses that are less than 5 years old. |
| • | | $12.1 million towards development of the cycle network throughout Queensland. |
| • | | $8.8 million towards constructing a roundabout at Beckmans Road and Cooroy -Noosa Road, at a total estimated cost of $9.8 million. |
Far North Queensland Ports Corporation Limited
In 2021-22, Far North Queensland Ports Corporation Limited has allocated $38.3 million towards new and continuing development within its ports in Far North Queensland.
Program Highlights (Property, Plant and Equipment)
| • | | $24.5 million towards further development of the Cairns Marine Precinct, at a total estimated cost of $28.3 million. |
Gladstone Ports Corporation Limited
In 2021-22, Gladstone Ports Corporation Limited has allocated $118.5 million towards ongoing development of the Port of Gladstone, and additional works at the Port of Bundaberg and the Port of Rockhampton.
Program Highlights (Property, Plant and Equipment)
| • | | $44.1 million to continue upgrades at the RG Tanna Coal Terminal at the Port of Gladstone. |
| • | | $14.1 million towards port services projects including Clinton Bypass Channel Widening. |
| • | | $11.7 million towards information system projects, including human resource information system, payroll upgrade, information system infrastructure lifecycle enhancement, port management information system and service enhancement project and enterprise resourcing planning replacement. |
111
Capital Statement 2021-22
Gold Coast Waterways Authority
In 2021-22, the Gold Coast Waterways Authority has allocated $10.7 million to improve management of, and provide better access to, the Gold Coast Waterway, canals and rivers and to deliver the Spit Works Program.
Program Highlights (Property, Plant and Equipment)
| • | | $6.4 million to deliver the Spit Works Program, including the Marine Stadium pontoon and jetty, and Muriel Henchman boat ramp and carparking facilities. |
| • | | $2.1 million to purchase a new work vessel and improvements to the Sand Bypass System. |
| • | | $1.2 million to provide boating infrastructure such as upgrades to public boat ramps and pontoons. |
| • | | $940,000 to improve access and safety by dredging navigation channels and to improve accessibility and quality of waterways information. |
North Queensland Bulk Ports Corporation Limited
In 2021-22, North Queensland Bulk Ports Corporation Limited has allocated $18.8 million to continue port planning and development initiatives to meet industry requirements for export facilities.
Program Highlights (Property, Plant and Equipment)
| • | | $4.2 million to replace Wharf 5 approach decks at the Port of Mackay, at a total estimated cost of $4.2 million. |
| • | | $3.2 million to replace Middle Breakwater fuel line supports, at a total estimated cost of $3.5 million. |
| • | | $2.5 million towards Mackay Tug Berth Facilities Stage 1, at a total estimated cost of $6.1 million. |
Port of Townsville Limited
In 2021-22, Port of Townsville Limited has allocated $68.6 million towards ongoing development at the Port of Townsville.
Program Highlights (Property, Plant and Equipment)
| • | | $65.3 million to continue the capital dredging and reclamation works to widen the shipping channels for access by larger vessels, at a total estimated cost of $232 million. |
112
Capital Statement 2021-22
Queensland Rail
In 2021-22, $900.4 million is allocated towards capital purchases for Queensland Rail.
Program Highlights (Property, Plant and Equipment)
$541.7 million is provided towards projects that will grow or enhance the Queensland Rail network including:
| • | | $151.2 million towards implementing the European Train Control System Level 2 in the Brisbane Inner City Network. |
| • | | $79.3 million towards constructing Clapham Yard Stabling at Moorooka. |
| • | | $50.3 million towards station accessibility upgrades at Albion, Auchenflower, Banyo, Bundamba, Buranda, Burpengary, Cannon Hill, Dakabin, East Ipswich, Lindum, Morningside, Southbank and Wooloowin train stations. |
| • | | $38.8 million towards upgrading vehicle and pedestrian access at Mayne Yard. |
| • | | $27.2 million towards providing additional park ‘n’ ride facilities at Lindum, Salisbury, and Springfield Central train stations. |
| • | | $24.9 million towards Mount Isa Line capacity and resilience improvements. |
$358.7 million to replace, renew and upgrade rail infrastructure, rollingstock, buildings, facilities, and other network assets including:
| • | | $142.5 million to invest in the South East Queensland network including rollingstock, operational facilities, track infrastructure, civil structures and signalling. |
| • | | $168.6 million to invest in the regional network including rollingstock, operational facilities, track infrastructure, civil structures and signalling. |
| • | | $47.6 million for business enabling investment on corporate, property and ICT works across Queensland. |
Queensland Rail is also progressing a Regional Station Accessibility Upgrade Program, comprising approximately $51 million over the Forward Estimates. The program will provide enhanced station accessibility as well as other customer, employee and safety improvements. Initial priorities for investment include Rockhampton and Maryborough West stations, and feasibility planning for Bundaberg station.
Cross River Rail Delivery Authority
In 2021-22, $1.517 billion is allocated towards the construction of Cross River Rail, a new 10.2 kilometre rail line from Dutton Park to Bowen Hills which includes 5.9kilometres of twin tunnels under the Brisbane River and CBD
113
Capital Statement 2021-22
| | | | | | | | | | | | | | | | | | | | |
| Transport and Main Roads | |
Project | | Statistical
Area | | | Total
Estimated
Cost
$‘000 | | | Expenditure
to
30-06-21
$‘000 | | | Budget
2021-22
$‘000 | | | Post
2021-22
$‘000 | |
DEPARTMENT OF TRANSPORT AND MAIN ROADS | | | | | | | | | | | | | | | | | | | | |
| | | | | |
Property, Plant and Equipment | | | | | | | | | | | | | | | | | | | | |
South Coast Region | | | | | | | | | | | | | | | | | | | | |
Coomera Connector (Stage 1),1 Coomera to Nerang, construct additional lanes | | | 309 | | | | 1,530,500 | | | | 30,500 | | | | 115,000 | | | | 1,385,000 | |
Cunningham Highway (Ipswich -2 Warwick), 2020 Disaster Recovery Funding Arrangements reconstruction works | | | 310 | | | | 84,276 | | | | 2,758 | | | | 8,518 | | | | 73,000 | |
Gold Coast Light Rail (Stage 3),3 Broadbeach South to Burleigh Heads, construct light rail | | | 309 | | | | 1,044,000 | | | | 77,240 | | | | 113,840 | | | | 852,920 | |
Gold Coast Line Train Stations,4 funding commitment | | | 309 | | | | 120,000 | | | | 11,380 | | | | 3,000 | | | | 105,620 | |
Greenbank bus facility, upgrade park ‘n’ ride | | | 311 | | | | 21,000 | | | | 15,055 | | | | 3,363 | | | | 2,582 | |
Loganlea train station relocation5 | | | 311 | | | | 95,076 | | | | 400 | | | | 1,200 | | | | 93,476 | |
Mount Lindesay Highway6 (Brisbane to Beaudesert), Stoney Camp Road to Chambers Flat Road, construct additional lanes | | | 311 | | | | 75,000 | | | | 7,789 | | | | 36,600 | | | | 30,611 | |
Mount Lindesay Highway (Brisbane to Beaudesert), Johanna Street to South Street (Jimboomba), duplication | | | 311 | | | | 53,000 | | | | 200 | | | | 6,300 | | | | 46,500 | |
Nerang—Murwillumbah Road,7 various locations, safety treatments | | | 309 | | | | 33,937 | | | | 3,834 | | | | 20,103 | | | | 10,000 | |
Pacific Motorway, Daisy Hill to8 Logan Motorway, funding commitment | | | 311 | | | | 1,000,000 | | | | 12,200 | | | | 4,000 | | | | 983,800 | |
Pacific Motorway, Eight Mile Plains to Daisy Hill, upgrade | | | Various | | | | 750,000 | | | | 175,384 | | | | 135,000 | | | | 439,616 | |
Pacific Motorway, Exit 41,9 upgrade interchange | | | 309 | | | | 82,137 | | | | 14,126 | | | | 58,100 | | | | 9,911 | |
114
Capital Statement 2021-22
| | | | | | | | | | |
| Transport and Main Roads |
Project | | Statistical
Area | | Total
Estimated
Cost
$‘000 | | Expenditure
to
30-06-21
$‘000 | | Budget
2021-22
$‘000 | | Post
2021-22
$‘000 |
Pacific Motorway, Exit 45 north off-ramp, upgrade interchange | | 309 | | 20,000 | | 1,000 | | 11,500 | | 7,500 |
Pacific Motorway, Exit 49,9 upgrade interchange | | 309 | | 110,768 | | 5,324 | | 8,500 | | 96,944 |
Pacific Motorway, Varsity Lakes10 (Exit 85) to Tugun (Exit 95) upgrade, widen to 6 lanes | | 309 | | 1,000,000 | | 243,540 | | 200,000 | | 556,460 |
Other construction | | Various | | 45,862 | | | | 45,862 | | |
| | | | | | | | | | |
Sub-total South Coast Region | | | | | | 770,886 | | |
| | | | | | | | | | |
Metropolitan Region | | | | | | | | | | |
Centenary Bridge Upgrade | | 304 | | 244,000 | | 18,292 | | 18,675 | | 207,033 |
Cleveland - Redland Bay Road11 (Cleveland), Anita Street to Magnolia Parade, duplicate to 4 lanes | | 301 | | 97,000 | | 6,456 | | 14,644 | | 75,900 |
Gateway Motorway, Bracken12 Ridge to Pine River upgrade, funding commitment | | 302 | | 1,000,000 | | 3,000 | | 3,600 | | 993,400 |
Gympie Arterial Road and9 Strathpine Road (Bald Hills), improve intersection | | 302 | | 30,000 | | 6,337 | | 9,000 | | 14,663 |
Linkfield Road Overpass13 upgrade | | 302 | | 125,000 | | 3,268 | | 5,732 | | 116,000 |
Moggill Sub-Arterial Road and9 Brookfield Road (Kenmore), upgrade intersection | | 304 | | 25,000 | | 500 | | 1,500 | | 23,000 |
Mount Lindesay Arterial Road14 (Beaudesert Road) and Illaweena Street, upgrade intersection | | 303 | | 30,000 | | 778 | | 1,200 | | 28,022 |
Northern Transitway, bus priority works | | 302 | | 72,000 | | 8,953 | | 24,277 | | 38,770 |
Other construction | | Various | | 107,329 | | | | 107,329 | | |
| | | | | | | | | | |
Sub-total Metropolitan Region | | | | | | 185,957 | | |
| | | | | | | | | | |
| | | | | |
North Coast Region | | | | | | | | | | |
Beerburrum to Nambour Rail Upgrade (Stage 1) | | 316 | | 550,791 | | 43,696 | | 29,409 | | 477,686 |
Bells Creek Arterial Road, Caloundra Road to Bells Creek interchange, funding commitment | | 316 | | 35,000 | | 3,500 | | 14,000 | | 17,500 |
115
Capital Statement 2021-22
| | | | | | | | | | |
| Transport and Main Roads |
Project | | Statistical
Area | | Total
Estimated
Cost
$‘000 | | Expenditure
to
30-06-21
$‘000 | | Budget
2021-22
$‘000 | | Post
2021-22
$‘000 |
Bruce Highway (Brisbane - Gympie), Caboolture - Bribie Island Road interchange to Steve Irwin Way | | 313 | | 662,500 | | 68,611 | | 105,909 | | 487,980 |
Bruce Highway (Brisbane - Gympie), Caloundra Road to Sunshine Motorway, upgrade | | 316 | | 932,217 | | 828,530 | | 31,000 | | 72,687 |
Bruce Highway (Brisbane - Gympie), Deception Bay Interchange Upgrade | | 313 | | 163,300 | | 50,663 | | 45,000 | | 67,637 |
Bruce Highway (Brisbane - Gympie), Maroochydore Roadand Mons Road Interchanges Upgrade | | 316 | | 301,250 | | 149,232 | | 79,094 | | 72,924 |
Bruce Highway (Brisbane -12 Gympie), Pine River to Dohles Rocks Road interchange, funding commitment | | Various | | 1,098,000 | | 7,355 | | 7,225 | | 1,083,420 |
Caboolture - Bribie Island Road15 upgrade program | | 313 | | 30,400 | | 9,054 | | 4,096 | | 17,250 |
Morayfield Road and Beerburrum7 Road, various locations, improve intersections | | 313
314 | | 28,800
30,000 | | 22,259
14,314 | | 6,541
10,686 | | 5,000 |
Redcliffe Road (Anzac Avenue), Gympie Road and Dayboro Road (Petrie), improve intersection | | | | | | | | | | |
Strathpine - Samford Road7 (Eatons Crossing Road and Mount Samson Road), improve intersection and route safety | | 314 | | 57,000 | | 1,428 | | 6,600 | | 48,972 |
Sunshine Motorway, Mooloolah River Interchange Upgrade (Stage 1) | | 316 | | 320,000 | | | | 4,000 | | 316,000 |
Other construction | | Various | | 121,671 | | | | 121,671 | | |
| | | | | | | | | | |
Sub-total North Coast Region | | | | | | | | 465,231 | | |
| | | | | | | | | | |
| | | | | |
| Southern Queensland Region | | | | | | | | | | |
116
Capital Statement 2021-22
| | | | | | | | | | |
| Transport and Main Roads |
Project | | Statistical
Area | | Total
Estimated
Cost
$‘000 | | Expenditure
to
30-06-21
$‘000 | | Budget
2021-22
$‘000 | | Post
2021-22
$‘000 |
Bruce Highway (Cooroy to Curra) Section D, construction | | 319 | | 1,000,000 | | 115,694 | | 180,000 | | 704,306 |
Bruce Highway (Gympie - Benaraby), various locations, upgrade culverts | | 319 | | 43,980 | | | | 7,656 | | 36,324 |
Bruce Highway (Gympie - Maryborough), Gootchie Road to Sheehans Road, widen pavement and improve safety | | 319 | | 26,647 | | 1,227 | | 4,226 | | 21,194 |
Bruce Highway (Gympie - Maryborough), Tiaro Bypass, construct bypass | | 319 | | 107,000 | | 5,102 | | 2,533 | | 99,365 |
Bruce Highway (Maryborough - Gin Gin), Saltwater Creek, upgrade bridges and floodways | | 319 | | 103,000 | | 12,585 | | 31,733 | | 58,682 |
Cunningham Highway (Ipswich - Warwick), Eight Mile intersection upgrade | | 307 | | 25,000 | | 3,580 | | 15,008 | | 6,412 |
Isis Highway (Bundaberg -7 Childers), various locations, improve safety | | 319 | | 41,818 | | 800 | | 4,000 | | 37,018 |
Mundubbera - Durong Road, John16 Peterson Bridge (Boyne River), replace bridge | | 319 | | 25,000 | | 1,782 | | 8,600 | | 14,618 |
Torbanlea - Pialba Road, various16 locations, upgrade intersections and floodways | | 319 | | 30,000 | | 2,707 | | 7,264 | | 20,029 |
Other construction | | Various | | 250,726 | | | | 250,726 | | |
| | | | | | | | | | |
Sub-total Southern Queensland Region | | | | | | | | 511,746 | | |
| | | | | | | | | | |
| | | | | |
Central Queensland Region | | | | | | | | | | |
Bruce Highway (Bowen - Ayr), Bowen Connection Road to Champion Street intersection, widen pavement | | 312 | | 22,000 | | 4,467 | | 8,733 | | 8,800 |
Bruce Highway (Gin Gin - Benaraby), Charnwood Road to Palm Creek, improve safety | | 308 | | 24,000 | | | | 2,700 | | 21,300 |
Bruce Highway (Mackay - Proserpine), Hampden to Kuttabul, rehabilitate and widen | | 312 | | 36,960 | | 15,173 | | 8,730 | | 13,057 |
117
Capital Statement 2021-22
| | | | | | | | | | |
| Transport and Main Roads |
Project | | Statistical
Area | | Total
Estimated
Cost
$‘000 | | Expenditure
to
30-06-21
$‘000 | | Budget
2021-22
$‘000 | | Post
2021-22
$‘000 |
Bruce Highway (Mackay - Proserpine), Jumper Creek, upgrade flood immunity | | 312 | | 23,000 | | 1,264 | | 1,636 | | 20,100 |
Bruce Highway (Proserpine - Bowen), Emu Creek to Drays Road, various locations, widen formation | | 312 | | 38,820 | | 9,308 | | 14,630 | | 14,882 |
Bruce Highway (Proserpine - Bowen), Ten Mile Creek to Yeates Creek, improve safety | | 312 | | 44,070 | | 2,634 | | 11,740 | | 29,696 |
Bruce Highway (Rockhampton - St Lawrence), Neilsen Avenue to Plentiful Creek, improve safety | | 308 | | 21,250 | | 5,252 | | 9,000 | | 6,998 |
Gavial - Gracemere Road (Lawrie14 Street), widen to 4 lanes and upgrade intersections | | 308 | | 35,000 | | 3,000 | | 20,000 | | 12,000 |
Mackay Northern Access Upgrade, construct additional lanes | | 312 | | 120,350 | | 70,923 | | 42,500 | | 6,927 |
Mackay Port Access, Bruce Highway to Mackay - Slade Point Road, construct new 2 lane road | | 312 | | 350,000 | | 4,170 | | 4,888 | | 340,942 |
Mackay Ring Road (Stage 1),17 construct | | 312 | | 497,375 | | 352,991 | | 17,212 | | 127,172 |
Peak Downs Highway (Clermont -18 Nebo), Wuthung Road to Caval Ridge Mine, widen and strengthen pavement | | 312 | | 35,000 | | 7,222 | | 16,663 | | 11,115 |
Rockhampton Northern Access Upgrade | | 308 | | 158,001 | | 135,251 | | 22,750 | | |
Rockhampton - Yeppoon Road,16 Yeppoon Road Upgrade | | 308 | | 80,000 | | 1,000 | | 10,000 | | 69,000 |
Rockhampton Ring Road, plan, preserve and construct | | 308 | | 1,065,000 | | 63,051 | | 35,000 | | 966,949 |
Walkerston Bypass | | 312 | | 150,000 | | 26,277 | | 36,060 | | 87,663 |
Other construction | | Various | | 374,390 | | | | 374,390 | | |
| | | | | | | | | | |
Sub-total Central Queensland Region | | | | | | | | 636,632 | | |
| | | | | | | | | | |
| | | | | |
North Queensland Region | | | | | | | | | | |
Aramac - Torrens Creek Road,19 pave and seal | | 315 | | 20,000 | | 5,000 | | 11,500 | | 3,500 |
Bruce Highway (Ayr - Townsville), Haughton River Floodplain upgrade, construct bridges and approaches | | 318 | | 514,335 | | 278,824 | | 40,072 | | 195,439 |
118
Capital Statement 2021-22
| | | | | | | | | | |
| Transport and Main Roads |
Project | | Statistical
Area | | Total
Estimated
Cost
$‘000 | | Expenditure
to
30-06-21
$‘000 | | Budget
2021-22
$‘000 | | Post
2021-22
$‘000 |
Bruce Highway, Cairns Southern Access Corridor (Stage 3), Edmonton to Gordonvale, duplicate from 2 to 4 lanes | | 306 | | 481,000 | | 167,864 | | 98,281 | | 214,855 |
Bruce Highway, Cairns Southern Access Corridor (Stage 4), Kate Street to Aumuller Street, widen to 6 lanes | | 306 | | 123,700 | | 109,375 | | 8,510 | | 5,815 |
Bruce Highway, Cairns Southern Access Corridor (Stage 5), Foster Road, upgrade intersection | | 306 | | 225,000 | | 100 | | 2,000 | | 222,900 |
Burdekin River Bridge,20 rehabilitation program | | 318 | | 96,931 | | 49,391 | | 3,500 | | 44,040 |
Cairns Ring Road (Cairns CBD to Smithfield), construct additional lanes | | 306 | | 359,000 | | 3,001 | | 13,999 | | 342,000 |
Cairns Southern Access Cycleway,21 construct cycleway | | 306 | | 24,029 | | 3,536 | | 10,016 | | 10,477 |
Cairns Western Arterial Road, Redlynch Connector Road to Captain Cook Highway, duplication | | 306 | | 300,000 | | | | 10,000 | | 290,000 |
Captain Cook Highway, Smithfield Bypass | | 306 | | 164,000 | | 122,882 | | 31,341 | | 9,777 |
Cloncurry - Dajarra Road, widen19 and seal | | 315 | | 20,000 | | 5,000 | | 8,000 | | 7,000 |
Flinders Highway (Julia Creek -16 Cloncurry), Scrubby Creek, strengthen pavement and widen floodway | | 315 | | 32,651 | | 1,952 | | 18,000 | | 12,699 |
Flinders Highway (Townsville -16 Charters Towers), Townsville to Mingela Range (Package 1 and 2), construct overtaking lanes | | 318 | | 22,980 | | 600 | | 4,000 | | 18,380 |
Garbutt - Upper Ross Road (Riverway Drive), Stage 2, Allambie Lane to Dunlop Street, duplicate to 4 lanes | | 318 | | 95,000 | | 905 | | 2,598 | | 91,497 |
119
Capital Statement 2021-22
| | | | | | | | | | | | | | | | | | |
| Transport and Main Roads | |
Project | | Statistical
Area | | | Total
Estimated
Cost
$‘000 | | | Expenditure
to
30-06-21
$‘000 | | | Budget
2021-22
$‘000 | | Post
2021-22
$‘000 | |
Gregory Developmental Road19 (Charters Towers - The Lynd), Marble Creek to Christmas Creek, widen pavement | | | 318 | | | | 25,000 | | | | 1,995 | | | 10,700 | | | 12,305 | |
Kennedy Developmental Road16 (The Lynd - Hughenden), progressive sealing | | | 315 | | | | 50,000 | | | | 16,554 | | | 8,000 | | | 25,446 | |
Kennedy Highway (Cairns -19 Mareeba), Kuranda Range, Intelligent Transport System | | | 306 | | | | 30,000 | | | | 7,000 | | | 12,000 | | | 11,000 | |
Kennedy Highway (Mareeba -19 Atherton), targeted road safety improvements | | | 306 | | | | 37,500 | | | | 11,520 | | | 17,980 | | | 8,000 | |
Peninsula Developmental Road22 (Coen - Weipa), Archer River Crossing, construct bridge | | | 315 | | | | 32,351 | | | | 1,280 | | | 9,000 | | | 22,071 | |
Townsville Connection Road (Idalia), University Road to Bowen Road Bridge, improve safety | | | 318 | | | | 46,400 | | | | 50 | | | 1,300 | | | 45,050 | |
Townsville Northern Access23 Intersections Upgrade | | | 318 | | | | 99,768 | | | | 11,035 | | | 29,110 | | | 59,623 | |
Townsville Ring Road (Stage 5) | | | 318 | | | | 230,000 | | | | 28,116 | | | 65,010 | | | 136,874 | |
Other construction | | | Various | | | | 249,942 | | | | | | | 249,942 | | | | |
| | | | | | | | | | | | | | | | | | |
Sub-total North Queensland Region | | | | | | | | | | | | | | 664,859 | | | | |
| | | | | | | | | | | | | | | | | | |
| | | | | |
Statewide | | | | | | | | | | | | | | | | | | |
Bruce Highway (Pine River - Cairns), Road Operations Improvements | | | Various | | | | 56,000 | | | | 18,229 | | | 27,330 | | | 10,441 | |
Marine Safety Minor Works | | | Various | | | | | | | | | | | 6,730 | | | Ongoing | |
New Generation Rollingstock24 | | | Various | | | | 4,155,705 | | | | 1,492,629 | | | 118,999 | | | 2,544,077 | |
New Generation Rollingstock, European Train Control System fitment, install new signalling | | | Various | | | | 255,000 | | | | 50,000 | | | 86,340 | | | 118,660 | |
Rollingstock Expansion Program, construct new rollingstock | | | 319 | | | | 600,000 | | | | 35,000 | | | 16,000 | | | 549,000 | |
Transport Corridor Acquisition Fund | | | Various | | | | | | | | | | | 39,500 | | | Ongoing | |
Other construction | | | Various | | | | 53,434 | | | | | | | 53,434 | | | | |
120
Capital Statement 2021-22
| | | | | | | | | | |
| Transport and Main Roads |
Project | | Statistical
Area | | Total
Estimated
Cost
$‘000 | | Expenditure
to
30-06-21
$‘000 | | Budget
2021-22
$‘000 | | Post
2021-22
$‘000 |
Sub-total Statewide | | | | | | | | 348,333 | | |
| | | | | | | | | | |
Other Property, Plant and Equipment | | | | | | | | | | |
Corporate buildings | | Various | | | | | | 8,000 | | Ongoing |
Information Technology | | Various | | | | | | 18,557 | | Ongoing |
New Public Transport Ticketing System | | Various | | 371,060 | | 226,380 | | 107,678 | | 37,002 |
Plant and equipment | | Various | | | | | | 11,354 | | Ongoing |
| | | | | | | | | | |
Sub-total Other Property, Plant and Equipment | | | | 145,589 | | |
| | | | | | | | | | |
Total Property, Plant and Equipment | | | | | | | | 3,729,233 | | |
| | | | | | | | | | |
Capital Grants | | | | | | | | | | |
Active Transport Rail Trails | | Various | | 14,138 | | 4,490 | | 1,525 | | 8,123 |
Alma Bay to Horseshoe Bay (Magnetic Island), upgrade various roads | | 318 | | 7,000 | | 2,100 | | 4,900 | | |
Beckmans Road and Cooroy - Noosa25 Road, construct roundabout | | 316 | | 9,810 | | 1,000 | | 8,810 | | |
Black Spot Program | | Various | | | | | | 27,125 | | Ongoing |
Bridges Renewal Program26 | | Various | | | | | | 19,500 | | Ongoing |
Bus Stop Shelter Program | | Various | | 20,000 | | 12,679 | | 4,000 | | 3,321 |
Cycling Program | | Various | | | | | | 12,148 | | Ongoing |
Eastern Transitway | | 303 | | 30,000 | | 10,538 | | 8,600 | | 10,862 |
Heavy Vehicle Safety and27 Productivity | | Various | | | | | | 11,489 | | Ongoing |
Other Passenger Transport Grants | | Various | | | | | | 3,816 | | Ongoing |
Passenger Transport Accessible Infrastructure Program | | Various | | | | | | 5,252 | | Ongoing |
Queensland school bus upgrades | | Various | | | | | | 17,149 | | Ongoing |
Roads of Strategic Importance Initiative (Australian Government Funding) | | Various | | 79,800 | | 22,925 | | 27,370 | | 29,505 |
School Transport Infrastructure Program | | Various | | 17,932 | | 14,302 | | 3,423 | | 207 |
South Brisbane bike network | | 305 | | 10,000 | | 2,500 | | 2,500 | | 5,000 |
Transport Infrastructure Development Scheme | | Various | | | | | | 70,000 | | Ongoing |
Urban Congestion Fund (Australian Government Funding) | | Various | | 392,790 | | 19,155 | | 86,145 | | 287,490 |
Wheelchair Accessible Taxi | | Various | | 20,890 | | 10,218 | | 5,254 | | 5,418 |
121
Capital Statement 2021-22
| | | | | | | | | | |
| Transport and Main Roads |
Project | | Statistical
Area | | Total
Estimated
Cost
$‘000 | | Expenditure
to
30-06-21
$‘000 | | Budget
2021-22
$‘000 | | Post
2021-22
$‘000 |
Sustainability Funding | | | | | | | | | | |
Yarrabah Jetty, design and construct | | 306 | | 11,510 | | 7,312 | | 2,231 | | 1,967 |
Other capital grants | | Various | | 155,160 | | | | 155,160 | | |
| | | | | | | | | | |
Total Capital Grants | | | | | | | | 476,397 | | |
| | | | | | | | | | |
| | | | | |
FAR NORTH QUEENSLAND PORTS CORPORATION LIMITED | | | | | | | | | | |
Property, Plant and Equipment | | | | | | | | | | |
Cairns marine precinct | | 306 | | 28,317 | | 3,400 | | 24,483 | | 434 |
Cairns shipping development project - fine sediment offset | | 306 | | 3,753 | | 1,705 | | 1,030 | | 1,018 |
General cargo consolidation | | 306 | | | | | | 4,002 | | Ongoing |
Mourilyan lease acquisitions | | 306 | | 3,289 | | 1,289 | | 1,000 | | 1,000 |
Plant, equipment and minor works | | 306 | | | | | | 3,646 | | Ongoing |
Site decontamination at Cityport Precinct 5 | | 306 | | 4,900 | | 650 | | 2,150 | | 2,100 |
Tingira street subdivision development | | 306 | | | | | | 2,000 | | Ongoing |
| | | | | | | | | | |
Total Property, Plant and Equipment | | | | | | | | 38,311 | | |
| | | | | | | | | | |
| | | | | |
GLADSTONE PORTS CORPORATION LIMITED | | | | | | | | | | |
| | | | | |
Property, Plant and Equipment | | | | | | | | | | |
RG Tanna Coal Terminal Projects | | | | | | | | | | |
Conveyor life extension | | 308 | | | | | | 2,620 | | Ongoing |
Process Control Systems, stockpile management and upgrades | | 308 | | | | | | 41,450 | | Ongoing |
Auckland Point berth 1 projects | | 308 | | | | | | 8,490 | | Ongoing |
Auckland Point berth 3 projects | | 308 | | | | | | 1,350 | | Ongoing |
Barney Point projects | | 308 | | | | | | 1,750 | | Ongoing |
Environment projects | | 308 | | | | | | 500 | | Ongoing |
Fisherman’s landing projects | | 308 | | | | | | 3,280 | | Ongoing |
Information systems projects | | 308 | | | | | | 11,684 | | Ongoing |
Marine pilot services projects | | 308 | | | | | | 580 | | Ongoing |
Marina projects | | 308 | | | | | | 5,951 | | Ongoing |
Plant, equipment and minor works | | 308 | | | | | | 8,143 | | Ongoing |
Port Alma projects | | 308 | | | | | | 1,446 | | Ongoing |
Port of Bundaberg conveyor project | | 319 | | 12,000 | | 4,084 | | 7,916 | | |
122
Capital Statement 2021-22
| | | | | | | | | | |
| Transport and Main Roads |
Project | | Statistical
Area | | Total
Estimated
Cost
$‘000 | | Expenditure
to
30-06-21
$‘000 | | Budget
2021-22
$‘000 | | Post
2021-22
$‘000 |
Port of Bundaberg projects | | 319 | | | | | | 2,100 | | Ongoing |
Port services projects | | 308 | | | | | | 14,130 | | Ongoing |
Quarry projects | | 308 | | | | | | 3,250 | | Ongoing |
Right-of-Use lease assets | | 308 | | | | | | 2,572 | | Ongoing |
SL1 (Ship loader) replacement | | 308 | | 32,870 | | 202 | | 1,250 | | 31,418 |
| | | | | | | | | | |
Total Property, Plant and Equipment | | | | | | | | 118,462 | | |
| | | | | | | | | | |
| | | | | |
GOLD COAST WATERWAYS AUTHORITY | | | | | | | | | | |
Property, Plant and Equipment | | | | | | | | | | |
Boating Infrastructure Program | | 309 | | 11,986 | | 2,400 | | 1,220 | | 8,366 |
Navigation Access and Safety | | 309 | | 3,950 | | 1,945 | | 940 | | 1,065 |
Plant, equipment and minor works | | 309 | | 7,529 | | 2,420 | | 2,090 | | 3,019 |
Spit Masterplan infrastructure | | 309 | | 12,055 | | 5,650 | | 6,405 | | |
| | | | | | | | | | |
Total Property, Plant and Equipment | | | | | | | | 10,655 | | |
| | | | | | | | | | |
| | | | | |
NORTH QUEENSLAND BULK PORTS CORPORATION LIMITED | | | | | | | | | | |
| | | | | |
Property, Plant and Equipment | | | | | | | | | | |
Abbot Point General Development | | 312 | | | | | | 325 | | Ongoing |
Abbot Point security access gate (Eastern Access Road) | | 312 | | 1,786 | | 1,486 | | 300 | | |
Business improvement | | 312 | | | | | | 263 | | Ongoing |
Harbour Road Upgrade (Middle Breakwater) | | 312 | | 1,300 | | | | 1,300 | | |
Hay Point General Development | | 312 | | | | | | 120 | | Ongoing |
Ken White Avenue Refurbishment | | 312 | | 2,200 | | | | 200 | | 2,000 |
Louisa Creek Acquisition Program | | 312 | | | | | | 1,052 | | Ongoing |
Mackay Port Development General | | 312 | | | | | | 475 | | Ongoing |
Mackay Tug Berth Facilities Stage 1 | | 312 | | 6,076 | | 3,576 | | 2,500 | | |
Mackay water network enhancements | | 312 | | 1,912 | | 462 | | 950 | | 500 |
Middle Breakwater fuel line supports replacement | | 312 | | 3,450 | | 250 | | 3,200 | | |
Pilotage Upgrade and Replacements | | 312 | | 562 | | 146 | | 130 | | 286 |
Transformer project enterprise resource planning implementation | | 312 | | 4,443 | | 3,070 | | 1,373 | | |
Upgrade of Hay Point Vessel Traffic Services building | | 312 | | 1,898 | | 1,648 | | 250 | | |
123
Capital Statement 2021-22
| | | | | | | | | | |
| Transport and Main Roads |
Project | | Statistical
Area | | Total
Estimated
Cost
$‘000 | | Expenditure
to
30-06-21
$‘000 | | Budget
2021-22
$‘000 | | Post
2021-22
$‘000 |
Weipa Port Development General | | 315 | | | | | | 195 | | Ongoing |
Wharf 1 Laydown Area Upgrade | | 312 | | 2,025 | | 25 | | 2,000 | | |
Wharf 5 approaches | | 312 | | 4,200 | | | | 4,200 | | |
| | | | | | | | | | |
Total Property, Plant and Equipment | | | | | | | | 18,833 | | |
| | | | | | | | | | |
| | | | | |
PORT OF TOWNSVILLE LIMITED | | | | | | | | | | |
| | | | | |
Property, Plant and Equipment | | | | | | | | | | |
Channel capacity upgrade | | 318 | | 232,000 | | 75,667 | | 65,323 | | 91,010 |
Plant, equipment and minor works | | 318 | | | | | | 1,419 | | Ongoing |
Road network upgrades | | 318 | | | | | | 1,000 | | Ongoing |
Wharf facilities upgrades | | 318 | | | | | | 840 | | Ongoing |
| | | | | | | | | | |
Total Property, Plant and Equipment | | | | | | | | 68,582 | | |
| | | | | | | | | | |
| | | | | |
QUEENSLAND RAIL | | | | | | | | | | |
| | | | | |
Property, Plant and Equipment | | | | | | | | | | |
Growth - Externally Led | | | | | | | | | | |
Breakfast Creek Bridge, realign28 track | | 305 | | 42,180 | | 15,192 | | 13,430 | | 13,558 |
Bridge Pier Protection28 | | Various | | 3,991 | | 1,351 | | 1,087 | | 1,553 |
Clapham Yard Stabling28 | | 303 | | 292,560 | | 11,737 | | 79,278 | | 201,545 |
European Train Control System29 Level 2 | | Various | | 646,352 | | 294,552 | | 151,200 | | 200,600 |
Other European Train Control System Level 2 - Inner City | | Various | | | | | | 21,870 | | Ongoing |
Inner City Signalling Upgrades28 | | 305 | | 35,240 | | 4,495 | | 12,837 | | 17,908 |
Mayne Yard Accessibility28 | | 305 | | 114,153 | | 53,323 | | 38,761 | | 22,069 |
Mayne Yard Relocations28 | | 305 | | 24,255 | | 10,455 | | 7,847 | | 5,953 |
Moolabin Power Upgrade28 | | 303 | | 17,516 | | 3,496 | | 6,409 | | 7,611 |
Other rail network enhancements | | Various | | | | | | 7,030 | | Ongoing |
Station Upgrades Fairfield to28 Salisbury | | 303 | | 57,464 | | 14,646 | | 18,891 | | 23,927 |
Third Track between Roma Street28 and Exhibition Station | | 305 | | 12,136 | | 4,191 | | 3,055 | | 4,890 |
Lindum train station, construct park30 ‘n’ ride | | 301 | | 5,000 | | 247 | | 236 | | 4,517 |
Salisbury train station, construct31 park ‘n’ ride | | 303 | | 14,500 | | 6,066 | | 4,449 | | 3,985 |
124
Capital Statement 2021-22
| | | | | | | | | | |
| Transport and Main Roads |
Project | | Statistical
Area | | Total
Estimated
Cost
$‘000 | | Expenditure
to
30-06-21
$‘000 | | Budget
2021-22
$‘000 | | Post
2021-22
$‘000 |
Springfield Central train station,30 construct park ‘n’ ride | | 310 | | 44,500 | | 15,517 | | 22,493 | | 6,490 |
Other park ‘n’ rides | | 313 | | | | | | 8,188 | | Ongoing |
| | | | | | | | | | |
Sub-total Growth - Externally Led | | | | | | | | 397,061 | | |
| | | | | | | | | | |
Growth - Internally Led | | | | | | | | | | |
Mount Isa Line, capacity and32 resilience improvements | | 315 | | 50,000 | | 9,497 | | 24,854 | | 15,649 |
Albion Station Upgrade | | 305 | | 16,840 | | 1,130 | | 1,912 | | 13,798 |
Auchenflower Station Upgrade | | 305 | | 40,000 | | 20,091 | | 12,121 | | 7,788 |
Banyo Station Upgrade | | 302 | | 29,519 | | 613 | | 2,441 | | 26,465 |
Bundamba Station Upgrade | | 310 | | 31,600 | | 531 | | 461 | | 30,608 |
Buranda Station Upgrade | | 303 | | 34,251 | | 3,027 | | 4,723 | | 26,501 |
Burpengary Station Upgrade | | 313 | | 29,400 | | 531 | | 439 | | 28,430 |
Cannon Hill Station Upgrade | | 303 | | 26,700 | | 16,412 | | 7,964 | | 2,324 |
Dakabin Station Upgrade | | 314 | | 41,899 | | 38,927 | | 2,957 | | 15 |
East Ipswich Station Upgrade | | 310 | | 37,663 | | 21,379 | | 6,311 | | 9,973 |
Lindum Station Upgrade | | 301 | | 35,200 | | 531 | | 497 | | 34,172 |
Morningside Station Upgrade | | 305 | | 38,300 | | 531 | | 528 | | 37,241 |
South Bank Station Upgrade | | 305 | | 24,819 | | 4,783 | | 9,317 | | 10,719 |
Wooloowin Station Upgrade | | 305 | | 43,200 | | 531 | | 577 | | 42,092 |
Other train station upgrades | | Various | | | | | | 6,580 | | Ongoing |
Other Rail Growth Projects | | Various | | | | | | 63,003 | | Ongoing |
| | | | | | | | | | |
Sub-total Growth - Internally Led | | | | | | | | 144,685 | | |
| | | | | | | | | | |
| | | | | |
South East Queensland Network | | | | | | | | | | |
Maintenance of above rail assets -33 South East Queensland rail network | | Various | | | | | | 11,724 | | Ongoing |
Maintenance of below rail assets -34 South East Queensland rail network | | Various | | | | | | 107,508 | | Ongoing |
Maintenance of system wide below35 rail assets - Queensland Rail network | | Various | | | | | | 23,260 | | Ongoing |
| | | | | | | | | | |
Sub-total South East Queensland Network | | | | 142,492 | | |
| | | | | | | | | | |
| | | | | |
Regional Network | | | | | | | | | | |
Maintenance of above rail assets -36 Regional Network | | Various | | | | | | 59,650 | | Ongoing |
Maintenance of below rail assets -37 Western Region rail systems | | Various | | | | | | 20,525 | | Ongoing |
125
Capital Statement 2021-22
| | | | | | | | | | |
| Transport and Main Roads |
Project | | Statistical
Area | | Total
Estimated
Cost
$‘000 | | Expenditure
to
30-06-21
$‘000 | | Budget
2021-22
$‘000 | | Post
2021-22
$‘000 |
Maintenance of below rail assets -38 North Coast Line | | Various | | | | | | 38,275 | | Ongoing |
Maintenance of below rail assets - Townsville - Mount Isa Rail Line | | Various | | | | | | 16,290 | | Ongoing |
Maintenance of below rail assets -39 West Moreton rail system | | Various | | | | | | 33,872 | | Ongoing |
| | | | | | | | | | |
Sub-total Regional Network | | | | | | | | 168,612 | | |
| | | | | | | | | | |
Enterprise | | | | | | | | | | |
Customer Experience | | Various | | | | | | 7,964 | | Ongoing |
Enterprise assets | | Various | | | | | | 15,837 | | Ongoing |
Enterprise other | | Various | | | | | | 9,143 | | Ongoing |
Information and Technology | | Various | | | | | | 14,349 | | Ongoing |
Safety and Risk | | Various | | | | | | 274 | | Ongoing |
| | | | | | | | | | |
Sub-total Enterprise | | | | | | | | 47,567 | | |
| | | | | | | | | | |
| | | | | | | | | | |
| | | | | | | | | | |
Total Property, Plant and Equipment | | | | | | | | 900,417 | | |
| | | | | | | | | | |
| | | | | |
ROADTEK | | | | | | | | | | |
Property, Plant and Equipment | | | | | | | | | | |
Construction plant works | | Various | | | | | | 24,000 | | Ongoing |
| | | | | | | | | | |
Total Property, Plant and Equipment | | | | | | | | 24,000 | | |
| | | | | | | | | | |
| | | | | |
CROSS RIVER RAIL DELIVERY AUTHORITY | | | | | | | | | | |
| | | | | |
Property, Plant and Equipment | | | | | | | | | | |
Cross River Rail | | 305 | | 6,725,804 | | 3,404,662 1,512,914 | | 1,808,228 |
| | | | | | | | | | |
Total Property, Plant and Equipment | | | | | | | | 1,512,914 | | |
| | | | | | | | | | |
| | | | | |
Capital Grants | | | | | | | | | | |
Cross River Rail - Third party returnable works | | 305 | | 162,196 | | 80,529 | | 4,180 | | 77,487 |
| | | | | | | | | | |
Total Capital Grants | | | | | | | | 4,180 | | |
| | | | | | | | | | |
TOTAL TRANSPORT AND MAIN ROADS (PPE) | | | | | | | | | | |
| | | | | | | | | | |
| | | | | | | | 6,421,407 | | |
| | | | | | | | | | |
TOTAL TRANSPORT AND MAIN ROADS (CG) | | | | | | | | | | |
| | | | | | | | | | |
| | | | | | | | 480,577 | | |
| | | | | | | | | | |
126
Capital Statement 2021-22
Notes:
| 1. | Jointly funded by the Queensland Government and Australian Government (including contribution under its Major Project Business Case Fund). |
| 2. | Eligible projects under the Natural Disaster Program are jointly funded by the Australian Government and Queensland Government. The funding is provided to Transport and Main Roads through the Queensland Reconstruction Authority. |
| 3. | Total project cost is subject to finalisation of contract negotiations. This project is jointly funded by the Australian Government, Queensland Government and City of Gold Coast |
| 4. | Queensland Government commitment for 3 new Gold Coast railway stations at Pimpama, Helensvale North and Worongary/Merrimac. Project cost and timing subject to further planning. |
| 5. | Jointly funded by the Australian Government (part of its Urban Congestion Fund) and Queensland Government, including contributions from Department of Transport and Main Roads and Queensland Rail. |
| 6. | Jointly funded by the Queensland Government (part of its Economic Recovery Strategy: Unite and recover for Queensland Jobs) and the Australian Government (part of its Urban Congestion Fund). |
| 7. | Funded through the Queensland Government’s High Risk Roads Initiative, as part of the Targeted Road Safety Program. |
| 8. | Project cost, scope and timing subject to further planning. |
| 9. | Jointly funded by the Queensland Government and Australian Government (part of its Urban Congestion Fund). |
| 10. | Jointly funded by the Queensland and Australian Governments (the Queensland Government contribution includes $30 million from the State Infrastructure Fund). |
| 11. | Partly funded through the Queensland Government’s Economic Recovery Strategy: Unite and recover for Queensland Jobs. This is part of a package of works to upgrade Cleveland - Redland Bay Road. |
| 12. | This program also includes planning for the Gympie Arterial Road (between Strathpine Road and Gateway Motorway) and a new road along the North South Urban Arterial corridor (known as Moreton Connector) between Dohles Rocks Road and Anzac Avenue. |
| 13. | Part of the Australian Government’s Bruce Highway Upgrade Program, jointly funded by the Australian Government and Queensland Government. |
| 14. | Funded through the Queensland Government’s Economic Recovery Strategy: Unite and recover for Queensland Jobs. |
| 15. | Includes funding for Old Toorbul Point Road intersection signalisation. |
| 16. | Jointly funded by the Queensland Government and Australian Government (part of its Roads of Strategic Importance initiative). |
| 17. | This project includes works between the intersection of Bruce Highway and Bald Hill Road. |
| 18. | Part of the Australian Government’s Northern Australia Roads Program, jointly funded by the Australian Government and Queensland Government. |
| 19. | Jointly funded by the Queensland Government and Australian Government (part of its Roads Infrastructure Stimulus Package). |
| 20. | Includes an agreed contribution from Queensland Rail. |
| 21. | This cycleway project is funded as part of the Bruce Highway - Cairns Southern Access Stage 2 (Robert Road to Foster Road) project. |
| 22. | Part of the Cape York Region Package Stage 2, jointly funded by the Queensland Government and Australian Government (part of its Roads of Strategic Importance initiative). |
| 23. | This funding does not include $7.88 million of interim early works that were completed in 2018-19. |
| 24. | This project is being delivered under a Public Private Partnership arrangement (PPP). |
| 25. | Partly funded through the Queensland Government’s Economic Recovery Strategy: Unite and recover for Queensland Jobs. |
| 26. | Part of the Australian Government’s Bridges Renewal Program, jointly funded by the Australian Government and Local Government Authorities. |
| 27. | Part of the Australian Government’s Heavy Vehicle Safety and Productivity Program, jointly funded by the Australian Government and Queensland Government. |
| 28. | This project is being delivered by Cross River Rail Delivery Authority. |
| 29. | The project is being delivered by Cross River Rail Delivery Authority and Department of Transport and Main Roads with support from Queensland Rail. |
| 30. | Jointly delivered by Queensland Rail and Department of Transport and Main Roads. |
127
Capital Statement 2021-22
| 31. | This project includes a Department of Transport and Main Roads land component and is jointly delivered by Queensland Rail and Department of Transport and Main Roads. |
| 32. | The works relate to increased structural gauge, waterway resilience and track renewal. |
| 33. | The works relate to maintenance of stations, platforms and rollingstock in the South East Queensland rail network. |
| 34. | The works relate to renewal, improvement, replacement and upgrade of track infrastructure in the South East Queensland rail network. |
| 35. | The works relate to renewal, replacement and upgrade of track infrastructure across Queensland Rail’s Network. |
| 36. | The works relate to maintenance of rollingstock, stations, yards and locomotives in the Regional Queensland rail network. |
| 37. | The works relate to renewal, improvement, replacement and upgrade of the Western Regional rail systems. |
| 38. | The works relate to renewal, replacement and upgrade of track infrastructure on the North Coast Line. |
| 39. | The works relate to renewal, improvement, replacement and upgrade of rail infrastructure on West Moreton system. |
All Projects - Total estimated cost is inclusive of both non-capital and capital components of project expenditure.
128
Capital Statement 2021-22
| Appendix A: | Entities included in capital outlays 2021–22 |
Agriculture and Fisheries
| | • | | Department of Agriculture and Fisheries |
| | • | | Queensland Racing Integrity Commission |
Children, Youth Justice and Multicultural Affairs
| | • | | Department of Children, Youth Justice and Multicultural Affairs |
Communities, Housing and Digital Economy
| | • | | Department of Communities, Housing and Digital Economy |
| | • | | Library Board of Queensland |
| | • | | Queensland Performing Arts Trust |
Education
| | • | | Department of Education |
Employment, Small Business and Training
| | • | | Department of Employment, Small Business and Training |
Energy and Public Works
| | • | | Department of Energy and Public Works |
| | • | | CleanCo Queensland Limited |
| | • | | Energy Queensland Limited |
| | • | | Stanwell Corporation Limited |
Environment and Science
| | • | | Department of Environment and Science |
Justice and Attorney-General
| | • | | Department of Justice and Attorney-General |
129
Capital Statement 2021-22
| | • | | Crime and Corruption Commission |
| | • | | Public Trustee of Queensland |
Legislative Assembly of Queensland
| | • | | Legislative Assembly of Queensland |
Premier and Cabinet
| | • | | Department of the Premier and Cabinet |
Queensland Corrective Services
| | • | | Queensland Corrective Services |
Queensland Fire and Emergency Services
| | • | | Queensland Fire and Emergency Services |
Queensland Health
| | • | | Queensland Health and Hospital and Health Services |
| | • | | Council of the Queensland Institute of Medical Research |
Queensland Police Service
| | • | | Queensland Police Service |
Queensland Treasury
Regional Development, Manufacturing and Water
| | • | | Department of Regional Development, Manufacturing and Water |
| | • | | Gladstone Area Water Board |
Resources
| | • | | Department of Resources |
Seniors, Disability Services and Aboriginal and Torres Strait Islander Partnerships
| | • | | Department of Seniors, Disability Services and Aboriginal and Torres Strait Islander Partnerships |
State Development, Infrastructure, Local Government and Planning
| | • | | Department of State Development, Infrastructure, Local Government and Planning |
| | • | | Economic Development Queensland |
| | • | | Queensland Reconstruction Authority |
130
Capital Statement 2021-22
Tourism, Innovation and Sport
| | • | | Department of Tourism, Innovation and Sport |
Transport and Main Roads
| | • | | Department of Transport and Main Roads |
| | • | | Far North Queensland Ports Corporation Limited |
| | • | | Gladstone Ports Corporation Limited |
| | • | | Gold Coast Waterways Authority |
| | • | | North Queensland Bulk Ports Corporation Limited |
| | • | | Port of Townsville Limited |
| | • | | Cross River Rail Delivery Authority |
131
Capital Statement 2021-22
| Appendix B: | Key concepts and coverage |
Coverage of the capital statement
Under accrual output budgeting, capital is the stock of assets including property, plant and equipment and intangible assets that any agency owns and/or controls and uses in the delivery of services, as well as capital grants made to other entities. The following definitions are applicable throughout this document:
| • | | capital purchases – property, plant and equipment outlays as per the financial statements excluding asset sales, depreciation and revaluations |
| • | | capital grants – capital grants to other entities and individuals (excluding grants to other government departments and statutory bodies) |
| • | | right of use assets – property, plant and equipment to which government agencies have a right to use through lease or similar arrangements. |
Capital contingency
Consistent with the approach adopted in previous years, a capital contingency reserve has been included. This reserve recognises that while agencies budget to fully use their capital works allocation, circumstances such as project lead-in times, project management constraints, unexpected weather conditions and capacity constraints such as the supply of labour and materials may prevent full usage. On a whole-of-government basis, there is likely to be underspending, resulting in a carry-over of capital allocations.
Estimated jobs supported by capital works
The $14.688 billion capital works program in 2021–22 is estimated to directly support around 46,500 jobs, equating to around 40,700 full-time equivalent jobs. The estimate of jobs supported by the Government’s capital works program in 2021–22 is based on Queensland Treasury’s Guidelines for estimating the full-time equivalent (FTE) jobs directly supported by the construction component of the capital works program.
The estimate of jobs supported by the capital works program is presented both in terms of FTEs and total jobs. Further, in some cases, jobs estimates quoted for specific projects throughout the Capital Statement and in other Budget papers may reflect other approaches, including proponents’ estimates or project specific information, rather than the methodology in the Queensland Treasury Guidelines for estimating jobs supported by capital works.
132
Capital Statement 2021-22
| Appendix C: | Capital purchases by entity by region 2021-221 |
| | | | | | | | | | | | | | | | | | | | | | | | |
| | | Brisbane and Redlands | |
| | | East | | | North | | | South | | | West | | | Inner City | | | Sub total | |
Entity2 | | $‘000 | | | $‘000 | | | $‘000 | | | $‘000 | | | $‘000 | | | $‘000 | |
| | | | | | |
Agriculture and Fisheries | | | 344 | | | | 510 | | | | 2,033 | | | | 11 | | | | 7,625 | | | | 10,523 | |
| | | | | | |
Children, Youth Justice and Multicultural Affairs | | | 651 | | | | 612 | | | | 1,019 | | | | 525 | | | | 789 | | | | 3,596 | |
| | | | | | |
Communities, Housing and Digital Economy | | | 8,284 | | | | 10,114 | | | | 21,741 | | | | 454 | | | | 116,092 | | | | 156,685 | |
| | | | | | |
Education | | | 51,682 | | | | 39,432 | | | | 104,845 | | | | 50,265 | | | | 133,478 | | | | 379,702 | |
| | | | | | |
Employment, Small Business and Training | | | 1,661 | | | | 30,996 | | | | 1,098 | | | | 565 | | | | 851 | | | | 35,171 | |
| | | | | | |
Energy and Public Works | | | 54,837 | | | | 72,010 | | | | 83,987 | | | | 64,381 | | | | 232,116 | | | | 507,331 | |
| | | | | | |
Environment and Science | | | 6,324 | | | | 1,361 | | | | 2,268 | | | | 1,168 | | | | 1,758 | | | | 12,879 | |
| | | | | | |
Justice and Attorney-General | | | 775 | | | | 728 | | | | 1,213 | | | | 625 | | | | 16,218 | | | | 19,559 | |
| | | | | | |
Legislative Assembly of Queensland | | | — | | | | — | | | | — | | | | — | | | | 7,282 | | | | 7,282 | |
| | | | | | |
Premier and Cabinet | | | — | | | | — | | | | — | | | | — | | | | 860 | | | | 860 | |
| | | | | | |
Queensland Corrective Services | | | 731 | | | | 687 | | | | 3,673 | | | | 589 | | | | 887 | | | | 6,567 | |
| | | | | | |
Queensland Fire and Emergency Services | | | 1,697 | | | | 2,192 | | | | 2,653 | | | | 1,366 | | | | 2,056 | | | | 9,964 | |
| | | | | | |
Queensland Health | | | 65,444 | | | | 13,325 | | | | 31,391 | | | | 10,208 | | | | 329,038 | | | | 449,406 | |
| | | | | | |
Queensland Police Service | | | 4,757 | | | | 4,463 | | | | 7,435 | | | | 3,828 | | | | 13,346 | | | | 33,829 | |
| | | | | | |
Regional Development, Manufacturing and Water | | | 5,042 | | | | 4,781 | | | | 2,783 | | | | 2,620 | | | | 14,099 | | | | 29,325 | |
| | | | | | |
Resources | | | 375 | | | | 353 | | | | 688 | | | | 303 | | | | 2,800 | | | | 4,519 | |
| | | | | | |
Seniors, Disability Services and Aboriginal and Torres Strait Islander Partnerships | | | 69 | | | | 65 | | | | 109 | | | | 6,156 | | | | 84 | | | | 6,483 | |
| | | | | | |
State Development, Infrastructure, Local Government and Planning | | | — | | | | 40,101 | | | | 5,286 | | | | — | | | | 6,717 | | | | 52,104 | |
| | | | | | |
Tourism, Innovation and Sport | | | 2,878 | | | | 1,508 | | | | 14,071 | | | | 645 | | | | 8,532 | | | | 27,634 | |
| | | | | | |
Transport and Main Roads | | | 89,782 | | | | 116,860 | | | | 288,602 | | | | 86,352 | | | | 1,685,912 | | | | 2,267,508 | |
| | | | | | |
Other Agencies3 | | | 201 | | | | 188 | | | | 314 | | | | 162 | | | | 243 | | | | 1,108 | |
| | | | | | |
Anticipated Capital Contingency Reserve and Other Adjustments4 | | | — | | | | — | | | | — | | | | — | | | | — | | | | — | |
| | | | | | |
Funds Allocated | | | 275,823 | | | | 317,590 | | | | 536,844 | | | | 214,868 | | | | 2,408,647 | | | | 3,753,772 | |
Notes
| 1. | Numbers may not add due to rounding and allocations of adjustments. |
| 2. | Includes all associated statutory bodies. |
| 3. | Includes other government entities with non-material capital programs. |
| 4. | The anticipated contingency reserve and other adjustments have been spread across statistical areas proportionate to capital spends. |
133
Capital Statement 2021-22
| | | | | | | | | | | | | | | | | | | | | | | | |
| | | | | | | | | Darling Downs | | | | |
| | | Ipswich | | | Wide
Bay | | | DD
Maranoa | | | Toowoomba | | | Sub total | | | Gold Coast | |
Entity2 | | $‘000 | | | $‘000 | | | $‘000 | | | $‘000 | | | $‘000 | | | $‘000 | |
| | | | | | |
Agriculture and Fisheries | | | 1,562 | | | | 684 | | | | 546 | | | | 1,335 | | | | 1,881 | | | | 37 | |
| | | | | | |
Children, Youth Justice and Multicultural Affairs | | | 17,244 | | | | 812 | | | | 349 | | | | 429 | | | | 778 | | | | 1,724 | |
| | | | | | |
Communities, Housing and Digital Economy | | | 30,941 | | | | 12,579 | | | | 4,886 | | | | 5,695 | | | | 10,581 | | | | 28,095 | |
| | | | | | |
Education | | | 107,098 | | | | 44,460 | | | | 22,586 | | | | 51,380 | | | | 73,966 | | | | 207,866 | |
| | | | | | |
Employment, Small Business and Training | | | 4,383 | | | | 3,651 | | | | 376 | | | | 1,388 | | | | 1,764 | | | | 16,121 | |
| | | | | | |
Energy and Public Works | | | 91,121 | | | | 242,563 | | | | 236,833 | | | | 92,846 | | | | 329,679 | | | | 103,157 | |
| | | | | | |
Environment and Science | | | 2,185 | | | | 4,116 | | | | 2,608 | | | | 956 | | | | 3,564 | | | | 3,838 | |
| | | | | | |
Justice and Attorney-General | | | 1,169 | | | | 966 | | | | 416 | | | | 511 | | | | 927 | | | | 3,053 | |
| | | | | | |
Legislative Assembly of Queensland | | | — | | | | — | | | | — | | | | — | | | | — | | | | — | |
| | | | | | |
Premier and Cabinet | | | — | | | | — | | | | — | | | | — | | | | — | | | | — | |
| | | | | | |
Queensland Corrective Services | | | 321,702 | | | | 911 | | | | 392 | | | | 482 | | | | 874 | | | | 1,936 | |
| | | | | | |
Queensland Fire and Emergency Services | | | 3,656 | | | | 11,888 | | | | 909 | | | | 1,118 | | | | 2,027 | | | | 4,490 | |
| | | | | | |
Queensland Health | | | 135,248 | | | | 51,880 | | | | 13,163 | | | | 8,355 | | | | 21,518 | | | | 103,555 | |
| | | | | | |
Queensland Police Service | | | 7,713 | | | | 7,124 | | | | 6,459 | | | | 3,133 | | | | 9,592 | | | | 17,921 | |
| | | | | | |
Regional Development, Manufacturing and Water | | | 73,210 | | | | 23,151 | | | | 12,108 | | | | 1,494 | | | | 13,602 | | | | 14,259 | |
| | | | | | |
Resources | | | 566 | | | | 468 | | | | 862 | | | | 408 | | | | 1,270 | | | | 995 | |
| | | | | | |
Seniors, Disability Services and Aboriginal and Torres Strait Islander Partnerships | | | 105 | | | | 87 | | | | 37 | | | | 46 | | | | 83 | | | | 184 | |
| | | | | | |
State Development, Infrastructure, Local Government and Planning | | | 15,215 | | | | — | | | | — | | | | — | | | | — | | | | 1,435 | |
| | | | | | |
Tourism, Innovation and Sport | | | 1,207 | | | | 998 | | | | 430 | | | | 528 | | | | 958 | | | | 3,311 | |
| | | | | | |
Transport and Main Roads | | | 117,458 | | | | 421,521 | | | | 127,827 | | | | 35,265 | | | | 163,092 | | | | 699,805 | |
| | | | | | |
Other Agencies3 | | | 302 | | | | 250 | | | | 108 | | | | 132 | | | | 240 | | | | 531 | |
| | | | | | |
Anticipated Capital Contingency Reserve and Other Adjustments4 | | | — | | | | — | | | | — | | | | — | | | | — | | | | — | |
| | | | | | |
Funds Allocated | | | 869,917 | | | | 772,876 | | | | 402,155 | | | | 191,795 | | | | 593,950 | | | | 1,131,454 | |
Notes
| 1. | Numbers may not add due to rounding and allocations of adjustments. |
| 2. | Includes all associated statutory bodies. |
| 3. | Includes other government entities with non-material capital programs. |
| 4. | The anticipated contingency reserve and other adjustments have been spread across statistical areas proportionate to capital spends. |
134
Capital Statement 2021-22
| | | | | | | | | | | | | | | | | | | | | | | | |
| | | Logan - | | | Mackay - | | | Outback and Far North Queensland | | | Central | |
| | | Beaudesert | | | Whitsunday | | | Outback | | | Cairns | | | Sub total | | | Queensland | |
Entity2 | | $‘000 | | | $‘000 | | | $‘000 | | | $‘000 | | | $‘000 | | | $‘000 | |
| | | | | | |
Agriculture and Fisheries | | | 119 | | | | 163 | | | | 1,021 | | | | 2,113 | | | | 3,134 | | | | 4,841 | |
| | | | | | |
Children, Youth Justice and Multicultural Affairs | | | 2,954 | | | | 2,669 | | | | 924 | | | | 1,284 | | | | 2,208 | | | | 1,245 | |
| | | | | | |
Communities, Housing and Digital Economy | | | 29,933 | | | | 9,763 | | | | 14,927 | | | | 63,947 | | | | 78,874 | | | | 12,889 | |
| | | | | | |
Education | | | 155,174 | | | | 30,288 | | | | 18,710 | | | | 42,750 | | | | 61,460 | | | | 77,092 | |
| | | | | | |
Employment, Small Business and Training | | | 1,021 | | | | 2,356 | | | | 241 | | | | 1,161 | | | | 1,402 | | | | 662 | |
| | | | | | |
Energy and Public Works | | | 13,512 | | | | 173,311 | | | | 143,041 | | | | 231,646 | | | | 374,687 | | | | 208,448 | |
| | | | | | |
Environment and Science | | | 2,608 | | | | 3,049 | | | | 1,340 | | | | 7,857 | | | | 9,197 | | | | 3,754 | |
| | | | | | |
Justice and Attorney-General | | | 1,128 | | | | 559 | | | | 266 | | | | 1,819 | | | | 2,085 | | | | 1,731 | |
| | | | | | |
Legislative Assembly of Queensland | | | — | | | | 200 | | | | 200 | | | | — | | | | 200 | | | | — | |
| | | | | | |
Premier and Cabinet | | | — | | | | — | | | | — | | | | — | | | | — | | | | — | |
| | | | | | |
Queensland Corrective Services | | | 1,063 | | | | 527 | | | | 251 | | | | 772 | | | | 1,023 | | | | 21,307 | |
| | | | | | |
Queensland Fire and Emergency Services | | | 7,814 | | | | 1,222 | | | | 2,312 | | | | 3,740 | | | | 6,052 | | | | 2,096 | |
| | | | | | |
Queensland Health | | | 144,485 | | | | 32,189 | | | | 9,216 | | | | 58,333 | | | | 67,549 | | | | 50,486 | |
| | | | | | |
Queensland Police Service | | | 8,545 | | | | 3,525 | | | | 12,247 | | | | 20,607 | | | | 32,854 | | | | 8,333 | |
| | | | | | |
Regional Development, Manufacturing and Water | | | 79,748 | | | | 5,713 | | | | 6,075 | | | | 6,749 | | | | 12,824 | | | | 166,766 | |
| | | | | | |
Resources | | | 546 | | | | 431 | | | | 289 | | | | 397 | | | | 686 | | | | 614 | |
| | | | | | |
Seniors, Disability Services and Aboriginal and Torres Strait Islander Partnerships | | | 101 | | | | 50 | | | | 24 | | | | 73 | | | | 97 | | | | 66 | |
| | | | | | |
State Development, Infrastructure, Local Government and Planning | | | — | | | | 500 | | | | — | | | | 9,500 | | | | 9,500 | | | | 1,500 | |
| | | | | | |
Tourism, Innovation and Sport | | | 1,165 | | | | 577 | | | | 275 | | | | 10,745 | | | | 11,020 | | | | 755 | |
| | | | | | |
Transport and Main Roads | | | 200,209 | | | | 347,048 | | | | 398,215 | | | | 383,616 | | | | 781,831 | | | | 382,903 | |
| | | | | | |
Other Agencies3 | | | 292 | | | | 145 | | | | 69 | | | | 212 | | | | 281 | | | | 189 | |
| | | | | | |
Anticipated Capital Contingency Reserve and Other Adjustments4 | | | — | | | | — | | | | — | | | | — | | | | — | | | | — | |
| | | | | | |
Funds Allocated | | | 607,036 | | | | 573,313 | | | | 568,981 | | | | 790,806 | | | | 1,359,787 | | | | 882,602 | |
Notes
| 1. | Numbers may not add due to rounding and allocations of adjustments. |
| 2. | Includes all associated statutory bodies. |
| 3. | Includes other government entities with non-material capital programs. |
| 4. | The anticipated contingency reserve and other adjustments have been spread across statistical areas proportionate to capital spends. |
135
Capital Statement 2021-22
| | | | | | | | | | | | | | | | | | | | | | | | |
| | | | | | Moreton Bay | | | | | | | |
| | | Sunshine | | | Moreton | | | Moreton | | | | | | | | | | |
| | | Coast | | | Bay North | | | Bay South | | | Sub total | | | Townsville | | | Totals1 | |
Entity2 | | $‘000 | | | $‘000 | | | $‘000 | | | $‘000 | | | $‘000 | | | $‘000 | |
| | | | | | |
Agriculture and Fisheries | | | 1,121 | | | | 203 | | | | 285 | | | | 488 | | | | 1,472 | | | | 26,025 | |
| | | | | | |
Children, Youth Justice and Multicultural Affairs | | | 5,591 | | | | 694 | | | | 794 | | | | 1,488 | | | | 822 | | | | 41,131 | |
| | | | | | |
Communities, Housing and Digital Economy | | | 16,789 | | | | 16,805 | | | | 6,745 | | | | 23,550 | | | | 32,064 | | | | 442,743 | |
| | | | | | |
Education | | | 138,571 | | | | 48,439 | | | | 77,906 | | | | 126,345 | | | | 44,607 | | | | 1,446,629 | |
| | | | | | |
Employment, Small Business and Training | | | 2,972 | | | | 748 | | | | 640 | | | | 1,388 | | | | 6,797 | | | | 77,688 | |
| | | | | | |
Energy and Public Works | | | 93,059 | | | | 17,650 | | | | 11,170 | | | | 28,820 | | | | 217,108 | | | | 2,382,796 | |
| | | | | | |
Environment and Science | | | 2,817 | | | | 1,546 | | | | 1,321 | | | | 2,867 | | | | 6,369 | | | | 57,243 | |
| | | | | | |
Justice and Attorney-General | | | 1,239 | | | | 827 | | | | 707 | | | | 1,534 | | | | 764 | | | | 34,714 | |
| | | | | | |
Legislative Assembly of Queensland | | | — | | | | — | | | | — | | | | — | | | | 200 | | | | 7,882 | |
| | | | | | |
Premier and Cabinet | | | — | | | | — | | | | — | | | | — | | | | — | | | | 860 | |
| | | | | | |
Queensland Corrective Services | | | 1,169 | | | | 5,780 | | | | 667 | | | | 6,447 | | | | 721 | | | | 364,247 | |
| | | | | | |
Queensland Fire and Emergency Services | | | 4,468 | | | | 1,808 | | | | 1,546 | | | | 3,354 | | | | 1,671 | | | | 58,702 | |
| | | | | | |
Queensland Health | | | 66,683 | | | | 171,095 | | | | 34,858 | | | | 205,953 | | | | 22,862 | | | | 1,351,814 | |
| | | | | | |
Queensland Police Service | | | 11,836 | | | | 5,068 | | | | 4,832 | | | | 9,900 | | | | 4,885 | | | | 156,057 | |
| | | | | | |
Regional Development, Manufacturing and Water | | | 18,816 | | | | 1,204 | | | | 2,422 | | | | 3,626 | | | | 30,058 | | | | 471,098 | |
| | | | | | |
Resources | | | 601 | | | | 401 | | | | 343 | | | | 744 | | | | 700 | | | | 12,140 | |
| | | | | | |
Seniors, Disability Services and Aboriginal and Torres Strait Islander Partnerships | | | 111 | | | | 74 | | | | 63 | | | | 137 | | | | 68 | | | | 7,572 | |
| | | | | | |
State Development, Infrastructure, Local Government and Planning | | | 6,200 | | | | — | | | | — | | | | — | | | | 4,129 | | | | 90,583 | |
| | | | | | |
Tourism, Innovation and Sport | | | 1,280 | | | | 854 | | | | 730 | | | | 1,584 | | | | 889 | | | | 51,378 | |
| | | | | | |
Transport and Main Roads | | | 285,267 | | | | 272,628 | | | | 121,537 | | | | 394,165 | | | | 360,600 | | | | 6,421,407 | |
| | | | | | |
Other Agencies3 | | | 320 | | | | 214 | | | | 183 | | | | 397 | | | | 198 | | | | 4,250 | |
| | | | | | |
Anticipated Capital Contingency Reserve and Other Adjustments4 | | | — | | | | — | | | | — | | | | — | | | | — | | | | (900,886 | ) |
| | | | | | |
Funds Allocated | | | 614,962 | | | | 509,618 | | | | 248,957 | | | | 758,575 | | | | 687,829 | | | | 12,606,073 | |
Notes
| 1. | Numbers may not add due to rounding and allocations of adjustments. |
| 2. | Includes all associated statutory bodies. |
| 3. | Includes other government entities with non-material capital programs. |
| 4. | The anticipated contingency reserve and other adjustments have been spread across statistical areas proportionate to capital spends. |
136
Capital Statement 2021-22
Queensland Budget 2021–22 Capital Statement Budget Paper No.3

Queensland Budget 2021–22
Capital Statement Budget Paper No.3
budget.qld.gov.au