EXHIBIT (c)(vii)
Queensland’s Budget Papers for 2022-23
FORWARD-LOOKING STATEMENTS
This exhibit contains forward-looking statements. Statements that are not historical facts, including statements about the State of Queensland’s (the “State” or “Queensland”) beliefs and expectations, are forward-looking statements. These statements are based on current plans, budgets, estimates and projections and therefore you should not place undue reliance on them. The words “believe”, “may”, “will”, “should”, “estimate”, “continue”, “anticipate”, “intend”, “expect”, “forecast” and similar words are intended to identify forward-looking statements. Forward-looking statements speak only as of the date they are made, and neither the Queensland Treasury Corporation nor the State undertake any obligation to update publicly any of them in light of new information or future events.
Forward-looking statements are based on current plans, estimates and projections and, therefore, undue reliance should not be placed on them. Although the Queensland Treasury Corporation and the State believe that the beliefs and expectations reflected in such forward-looking statements are reasonable, no assurance can be given that such beliefs and expectations will prove to have been correct. Forward-looking statements involve inherent risks and uncertainties. We caution you that actual results may differ materially from those contained in any forward-looking statements.
A number of important factors could cause actual results to differ materially from those expressed in any forward-looking statement. Factors that could cause the actual outcomes to differ materially from those expressed or implied in forward-looking statements include:
| • | the international and Australian economies, and in particular the rates of growth (or contraction) of the State’s major trading partners; |
| • | the effects, both internationally and in Australia, of any subsequent economic downturn, as well as the effect of ongoing economic, banking and sovereign debt risk; |
| • | the effect of natural disasters, epidemics and geopolitical events, such as the novel coronavirus (COVID-19) pandemic and the Russia-Ukraine conflict; |
| • | increases or decreases in international and Australian domestic interest rates; |
| • | changes in the State’s domestic consumption; |
| • | changes in the State’s labor force participation and productivity; |
| • | downgrades in the credit ratings of the State and Australia; |
| • | changes in the rate of inflation in the State; |
| • | changes in environmental and other regulation; and |
| • | changes in the distribution of revenue from the Commonwealth of Australia Government to the State. |
(c)(vii)-1
QUEENSLAND BUDGET 2022–23
BUDGET SPEECH
BUDGET PAPER NO. 1

2022–23 Queensland Budget Papers
1. Budget Speech
2. Budget Strategy and Outlook
3. Capital Statement
4. Budget Measures
Service Delivery Statements
Appropriation Bills
Budget Highlights
Regional Action Plans
© The State of Queensland (Queensland Treasury) 2022
Copyright
This publication is protected by the Copyright Act 1968
Licence
This document is licensed by the State of Queensland (Queensland Treasury) under a Creative Commons Attribution (CC BY 4.0) International licence.

In essence, you are free to copy, communicate and adapt this publication, as long as you attribute the work to the State of Queensland (Queensland Treasury). To view a copy of this licence, visit http://creativecommons.org/licenses/by/4.0/
Attribution
Content from this publication should be attributed to:
© The State of Queensland (Queensland Treasury) - 2022–23 Queensland Budget

Translating and interpreting assistance
The Queensland Government is committed to providing accessible services to Queenslanders from all cultural and linguistic backgrounds. If you have difficulty in understanding this publication, you can contact us on telephone (07) 3035 3503 and we will arrange an interpreter to effectively communicate the report to you.
Budget Speech
Budget Paper No. 1
ISSN 1445-4890 (Print)
ISSN 1445-4904 (Online)
Appropriation Bill 2022
The Honourable Cameron Dick MP
Treasurer
Minister for Trade and Investment
Speaker,
The budget that I deliver today delivers good jobs.
It provides better services.
And it supports Queensland’s great lifestyle.
It is a budget that marks our state’s emergence from the sacrifice and resilience shown by Queenslanders during a pandemic that has shaken and disrupted us like nothing before.
A pandemic whose impacts have been felt in our homes, our businesses, our schools, and our hospitals.
Notwithstanding these challenges, the great resilience of Queenslanders won through, built on perseverance, discipline and hard work.
And that has allowed this Budget to build on our extraordinary economic standing.
An extraordinary economic standing that sees Queensland, on almost every indicator we have seen this year, outperforming the rest of Australia.
It is a budget that puts health care first.
It is a budget to propel us from times of tremendous disruption and turbulence towards a brighter horizon.
A new era is dawning for Queensland.
We are taking advantage of global shifts, like decarbonisation and digitalisation, to realise opportunities in our traditional and emerging industries and to help create more jobs.
We are building the infrastructure for tomorrow.
We are providing better services for all Queenslanders.
And we are doing all of this, without compromising our cherished lifestyle.
The starter’s gun has sounded on the maroon, decade-long race towards the Brisbane 2032 Olympic and Paralympic Games.
And the decade beyond.
Our nation leading response to COVID-19 underpins the greatest ever investment in Queensland’s future.
Page 1 of 19
HEALTH
Despite the lockdowns and isolation, Queenslanders have rightly rallied behind our frontline workers.
Day after day, shift after shift, they continue to be at the forefront of our response to the COVID-19 pandemic.
They put themselves in harm’s way, treating thousands afflicted with severe virus symptoms and comforting their families.
Doctors, nurses, paramedics, and health workers continue to give Queenslanders the very best care, because they care.
Under pop-up tents, in all kinds of weather conditions, they have administered millions of PCR tests.
In the middle of the night, they have transported patients struggling to find their breath, to receive world class health care.
For our health workers, their daily routine involves multiple changes of personal protective equipment, surgical masks, respirators, gloves, goggles, glasses, face shields, gowns, and aprons.
Their daily ordeal has saved countless lives.
To pay tribute to their service, we must make sure our health system has the infrastructure, technology and resources it needs to meet the future demands of a growing state.
These demands, and the pressures they create, are not confined to Queensland.
As in many parts of the world, healthcare is facing short and long-term challenges.
The short-term challenges range from rising emergency department presentations to forced postponement of non-urgent elective surgeries to accommodate COVID-19 related priority care.
The outbreak of influenza A has also made its presence felt, which is why Queensland became the first Australian state to provide free flu vaccines.
There is also an increasing prevalence of complex and chronic illness.
An estimated 4 out of 5 Australians aged 65 and over have at least one chronic illness.
Rising private health insurance premiums are also placing additional pressure on our public hospital network.
Across Queensland the level of private health insurance coverage is near the lowest level seen for the last 20 years.
Page 2 of 19
There are now more Queenslanders without any form of private health insurance than at any other period, with 3.1 million Queenslanders uninsured.
Of those who do still have private insurance, less than 40 per cent have a policy which covers all hospital admissions.
That means, less than one in 4 Queenslanders have private cover for all hospital admissions.
Over the longer term there are also pressures associated with a growing and ageing population.
Queensland has the fastest population growth of all states and territories.
By 2036, our current population of 5.24 million is expected to increase by around 20 per cent, or over one million new Queenslanders.
And the number of Queenslanders aged over 65 is projected to grow from 865,000 to 1.3 million people in 2036, an increase of 50 per cent.
Demands on our health system can never be addressed by cuts to frontline services.
That is why the Palaszczuk Labor Government will always put health care first.
Today, I am pleased to announce that this year’s Budget will deliver a record commitment of $23.6 billion for frontline health services and high-quality healthcare infrastructure.
Today, our government commits $9.8 billion for a funding program to expand the capacity of Queensland’s health system, the biggest hospital building program in the history of Queensland.
That commitment will deliver 2,200 additional overnight hospital beds.
There will be new hospitals in Bundaberg, Toowoomba and at Coomera.
There will be hospital expansions in Cairns, Townsville, Robina, Mackay, Redcliffe, Ipswich and Hervey Bay.
Metropolitan Hospitals like the Princess Alexandra Hospital, the QEII Hospital, the Prince Charles Hospital and Logan Hospital will all be expanded.
And in an Australian-first, a comprehensive Queensland Cancer Centre will be built at the Royal Brisbane and Women’s Hospital.
In addition, our government will reallocate $229.7 million of existing funding to increase bed capacity under the Accelerated Infrastructure Delivery Program over the next 2 years.
This program will deliver 289 beds across 7 projects in the Metro South, Gold Coast, West Moreton, and Cairns and Hinterland Hospital and Health Services.
Page 3 of 19
In total, this budget provides for an additional 2,509 beds across the state.
New ambulance stations will be delivered at Caloundra South, Lawnton, Morayfield, Ormeau, and Ripley, along with redeveloped stations at Southport, Pimpama and Toowoomba.
From the election of our government until today:
| • | the number of nurses in Queensland has increased by 10,638, or 38.1 per cent; |
| • | the number of doctors has increased by 3,106, or 39.2 per cent; and |
| • | the number of ambulance officers has increased by 1,103, or 29.7 per cent. |
We will deliver 9,475 jobs for frontline staff – including doctors and nurses, paramedics and allied health professionals – across this term of government.
This is a record budget for health.
Every year, the health budget grows.
But this year, the increase is much more than just the usual.
We have listened to stakeholders in the health system, who tell us that they need greater budget certainty to plan and deliver high quality health care.
They have told us that if we can give them that certainty, they will find smarter and better ways to deliver healthcare.
They have spoken.
And our government has listened.
This year, for the first time, we are providing a sustained, long-term uplift to Queensland Health funding across the forward estimates.
This means that total budget funding for Queensland Health will grow by $8.5 billion over the forward estimates
This is the largest total uplift in budgeted health expenditure in the history of Queensland.
Not only are we substantially increasing the funding to Queensland Health, we are also improving how we fund Queensland Health.
Prevention of illness, early intervention, and new models of care that help patients stay out of hospital in the first place, are all activities that are front and centre when it comes to the work of our Hospital and Health Services.
That is why, in this budget, we are freeing up our hospitals to put even greater focus on outcomes, not just activity.
There will, of course, be accountability for funds spent.
There are no blank cheques.
Page 4 of 19
Because every dollar matters.
But very importantly, Queensland Health will have much greater flexibility on how to invest state-provided funds on achieving outcomes.
MENTAL HEALTH
The pandemic has painted a stark picture of the importance of mental health care.
It is a picture that became even clearer with the release of the report by the parliamentary Mental Health Select Committee earlier this month.
I thank the members of that committee, particularly the Chair, the Member for Greenslopes Joe Kelly, and all those who made submissions to this important inquiry.
The issues caused by mental health seep insidiously into so many other areas of life, from substance abuse and domestic violence to homelessness and unemployment.
And it affects every part of our state.
There is no community that is spared its impact.
To all those who made submissions to the Committee, to all those dealing with the challenge of mental illness, to all those who have lost a loved one to mental illness, we hear you.
And now we will act.
Our government will not leave behind those Queenslanders and their families living with the challenge of mental illness.
Our record health budget will commit an additional $1.6 billion for mental health services over 5 years, together with $28.5 million in capital funding, to support plans that focus on addressing issues around mental health, addiction, substance abuse and suicide.
It will focus on rehabilitation care, additional community care units, adolescent day programs and Step-Up Step-Down services to help people transition from hospital or avoid hospital admission in the first instance.
This is the biggest ever investment in mental health services in Queensland.
But in order to deliver this funding, we must have a sustainable funding model.
To that end, our government will introduce a 0.25 per cent mental health levy on businesses with annual taxable Australian wages of over $10 million from 1 January 2023.
Businesses with annual wages over $100 million will pay an additional 0.5 per cent levy.
Treasury modelling indicates this levy will only apply to around one per cent of all Queensland businesses.
Page 5 of 19
By the end of the forward estimates, the mental health levy will generate $425 million each year, a sustainable and ongoing source of funding to assist Queenslanders in need.
Our record health budget also aims to give First Nations people and others living in rural and remote parts of Queensland access to the best possible health care.
In this Budget our government commits almost $1 billion over 7 years for a Building Rural and Remote Healthcare Program to replace ageing health infrastructure in rural and remote parts of the state.
This will ensure Queenslanders living in these areas can receive adequate and contemporary health care.
This investment builds on our government’s proud legacy of delivering new or renewed hospitals and health clinics across our state, including major new hospitals at Roma and Kingaroy.
We will also make sure the Royal Flying Doctor Service, born in our state, is adequately resourced to provide aeromedical evacuations throughout our regions for the seriously injured or those requiring urgent medical attention.
Budget funding of $334 million over 10 years will enable the RFDS to take care of those in need, no matter where they live.
We will also allocate an additional $60.3 million towards Brisbane Airport Corporation’s new aeromedical infrastructure upgrade that will feature new patient transfer facilities and state-of-the-art hangars for fixed and rotary wing aircraft.
GOOD JOBS
Since our health response to COVID-19 enabled Queensland to start accelerating away from the pandemic last year, there is one statistic where Queensland has consistently led the nation.
The creation of new jobs.
Since March 2020, our job creation has tracked in line with the combined number of jobs created in the 2 largest states, New South Wales and Victoria.
Last week’s Labour Force data from the Australian Bureau of Statistics shows that figure is now 206,000 new Queensland jobs created since March 2020.
That May Labour Force data also showed something quite remarkable.
In the month of May, 46,600 new jobs were created in our state.
We are one in 5 Australians, but in the month of May, Queensland created 3 out of every 4 new Australian jobs.
Page 6 of 19
That nation leading jobs growth is something our government will continue to pursue relentlessly.
As Queensland’s economy continues to gather speed, our government is actively seeking to identify and support the industries that will deliver the well-paying, secure, highly skilled jobs of the future.
That means jobs in hydrogen and renewables, critical minerals, advanced manufacturing, resource recovery, biomedical technology, aerospace, defence, tourism and the innovation, creative and design industries.
We are determined to maintain Queensland’s traditional role as Australia’s energy powerhouse.
More than that, Queensland is rapidly becoming a global energy superpower through investment in our state’s renewable energy future, helping us to deliver more jobs in more industries.
Later this year, our government will deliver our Energy Plan, setting out the next steps on our journey from national to global leadership.
Embracing decarbonisation does not need to come at the expense of the economy or jobs.
To the contrary, it presents the opportunity for us to be a home to more energy-intensive heavy industry, including traditional and advanced manufacturing.
Queensland can supply the world with new economy minerals and manufacture the equipment it needs to tackle climate change, while supporting our growing workforce to acquire new skills.
By investing in renewable generation now, Queensland can leverage our world class renewable resources to deliver a reliable and efficient energy system.
This will also give Queensland manufacturing a strong competitive advantage to attract investment in low emissions manufacturing and to help enhance the competitiveness of our exporters.
Since 2015, 50 large-scale renewable energy projects have been committed, commenced, or constructed in Queensland.
These projects will support almost 8,000 construction jobs, most of them in regional Queensland.
Importantly, they will produce 5,774 megawatts of clean energy.
That represents more than 13.8 million tonnes of avoided emissions each year.
And we are only just beginning.
Large-scale pumped hydroelectric storage will be an essential part of this transformation.
Page 7 of 19
The Budget commits $48 million over 2 years to advance early works on the Borumba Pumped Hydro Energy Storage project and will also support further investigation into other prospective pumped hydro storage sites across Queensland.
Our reputation as a resource powerhouse is growing, with strong global demand for new economy materials like vanadium and cobalt as key inputs for the world’s decarbonisation technologies.
At least $10 million from the $520 million Invested in Queensland program will support Queensland’s first vanadium processing plant in Townsville.
We are committing $15 million to support the National Battery Testing Centre in Brisbane, a facility that gives prospective battery manufacturers the opportunity to calibrate and certify their products.
Building on our strong economic recovery and outlook, we are focused on achieving even more export growth to generate additional jobs and greater economic benefits for Queensland.
Our dynamic, diversified, and growing economy, highly skilled workforce, pro-growth, pro-business environment and advanced infrastructure offer businesses the best climate to expand and prosper.
On the back of a global pandemic, as economies look to recoup and recover, the importance of trade and investment has never been stronger.
That is why our government will invest an extra $150 million to deliver a new 10-year trade and investment strategy.
This strategy will ensure we continue to support our exporters as they reach for new markets, and boost sales where they are already currently trading.
Queensland’s Workforce Summit held in March with business and community leaders highlighted that our emerging and traditional industries must be sustained by a skilled workforce.
Our government will have more to say on our Workforce Strategy later this year, but we will continue to invest in our workforce, and provide greater opportunities for disadvantaged jobseekers, through our Skilling Queenslanders for Work and Back to Work programs.
We will keep providing training opportunities to upskill workers for more secure, well-paid existing jobs and future jobs.
While the pandemic has significantly impacted tourism, hospitality and international education, other sectors like mining, agriculture and the construction sector continue to power our economy.
This budget aims to ensure ongoing success in those sectors performing well, and speed up recovery in others.
Page 8 of 19
Our government keeps its promises.
We promised the people of Queensland we would not raise their taxes.
And the people of Queensland will not pay one dollar of the revenue measures I announce in this budget.
And we promised the coal companies, we would freeze their royalties until 30 June 2022.
We will keep that promise.
This will mean that, for a decade, multinational coal companies have benefited from royalty arrangements that have been frozen by successive Queensland Governments.
Few industries in the world have enjoyed such a long period without change.
But from 1 July, the 10-year freeze comes to an end.
It is time for new arrangements to be implemented.
Arrangements that reflect coal prices in excess of $500 per tonne, not the $150 per tonne for which the existing royalties were designed.
Three new progressive royalty tiers will be introduced.
20 per cent for prices above $175 per tonne, 30 per cent for prices above $225 per tonne and 40 per cent for prices above $300 per tonne.
Each of these new tiers applies only on the margin, so at a coal price of $302 per tonne, the 40 per cent rate would only apply to the last $2.
We know the foreign shareholders of coal companies won’t like these changes.
But they can rest easy.
We are not increasing the rates that apply at the existing tiers, as the former LNP Government did in 2012, during an industry downturn.
The new regime is forecast to deliver an additional $1.2 billion in royalties over the forward estimates, 30 per cent less than was forecast through the changes made by the former LNP Government in 2012.
All of that $1.2 billion, and more, will be going into regional Queensland.
We will build a new hospital for Moranbah.
We will expand Mackay Hospital, Townsville Hospital, and Cairns Hospital.
More beds in hospitals at Rockhampton, at Hervey Bay, and at Sarina.
Page 9 of 19
And we will deliver 2 new major hospitals, in Bundaberg and Toowoomba.
And we will continue to back the future of the resources industry.
To support the future of our resources sector, $68.5 million over 5 years will be invested through the Queensland Resources Industry Development Plan.
That includes a further $17.5 million to encourage exploration and make new mineral discoveries.
Alongside resources, we will be working with other industries because we want advanced manufacturing to flourish, to grow and to create jobs.
Our $350 million Industry Partnership Program is designed to unlock our advanced manufacturing potential in hydrogen, biofutures, biomedical, defence, aerospace, space, and resource recovery.
To help small and medium sized manufacturers build advanced manufacturing capability in our regions, the budget commits $50 million to the Made in Queensland and Manufacturing Hubs Grant programs.
Our agricultural sector, with its heart in regional Queensland, is continuing to diversify with potential growth opportunities in high-value horticulture, seafood, and livestock.
Our Drought Assistance and Reform Package of up to $79.6 million over the forward estimates will support regions affected by drought, while $150 million over 3 years will be available to help farmers prepare, manage, and recover from the impacts of drought.
Few sectors have felt the impacts of the COVID-19 pandemic more than Queensland’s tourism sector.
Yet there is growing optimism about tourism’s future.
This sentiment was tangible when the first cruise ship returned to the Port of Brisbane just weeks ago, with 1,500 passengers who embarked on day trips around South East Queensland.
With both domestic and international borders open, visitors are returning but we are doubling efforts to accelerate the sector’s recovery and growth.
This Budget commits up to $66.4 million over 4 years for an action plan to help our tourism operators rebound even more strongly, particularly in regional communities.
Our tourism sector has endured challenge after challenge.
Before COVID, it was a series of natural disasters, including the fires that tore through so many parts of our state, including the Scenic Rim.
Page 10 of 19
As the then Minister responsible for the Queensland Reconstruction Authority, I went into the Lamington National Park.
I saw first-hand the destruction of our iconic Binna Burra Lodge.
While I was there, Steve Noakes, the Chair of Binna Burra, dragged the iconic dinner bell from the wreckage, as a symbol of hope that Binna Burra could be rebuilt.
As a result of today’s budget, we are taking the next step forward so that the bell of Binna Burra will ring again.
$18 million will be donated to the Binna Burra foundation to help rebuild this iconic lodge.
In addition, we will also invest $2 million for improvements at Lamington National Park, working closely with O’Reilly’s.
Binna Burra and O’Reilly’s are just 2 of countless Queensland small and medium businesses that have done it tough, year after year.
Through their hard work and sacrifice, they have been an integral part of our economic recovery, and for that they deserve to be supported.
Our approach has always been to keep business costs low through competitive tax arrangements, making Queensland an attractive place to invest.
Targeted regulatory reform has been a key part of our COVID-19 response, enabling businesses to grow.
Today, through this budget, we will provide payroll tax relief to more than 12,000 small and medium-sized Queensland businesses.
This will be achieved by increasing the payroll tax deductions to businesses with annual Australian taxable wages between $1.3 million and $10.4 million.
Currently, the deduction phases out above $1.3 million at a rate of 25 cents per dollar of wages, or one dollar for every 4 dollars of wages.
We will reduce that phase out rate to 14.3 cents per dollar of wages, or one dollar for every 7 dollars of wages.
Put simply, we are increasing the number of businesses who will now be eligible for a deduction from payroll tax, and we will significantly increase the deduction available to businesses already getting it.
This means a business with $6.5 million of taxable wages will see over $26,000 extra each year in its bank account.
Page 11 of 19
BETTER SERVICES
Speaker, the Queensland Government interacts with hundreds of thousands of people every day.
Often during some of the most difficult times in their lives.
As we grow and transform, we must remember that we live in a community, not just an economy.
That means we need to ensure all Queenslanders benefit fairly from our growth and prosperity regardless of where they live or who they are.
This is particularly true for our most valuable resource.
Our children.
That’s why the Palaszczuk Government’s record education and training budget of $19.6 billion will set the next generation of Queenslanders up for a productive career in whatever field they choose.
No matter what background they are from.
This budget takes our total investment in our Building Future Schools commitment to $3 billion.
We have already opened 21 schools since 2015, and today we are announcing another 5 for 2025 and 2026.
More schools are currently under construction, and this budget commits a further $390 million to build 5 new schools where they are needed most.
Primary schools in Caboolture West, Caloundra South, Ripley Valley, Greater Flagstone and Bahrs Scrub.
It also includes another $742 million for additional and renewed infrastructure in our existing state schools, and $20 million to upgrade school playgrounds and tuckshops.
Our government has rightfully acknowledged the extraordinary dedication and service of our health workers.
However, teachers, principals and school staff are among the unsung heroes of this ongoing pandemic.
They have exemplified Queensland’s fighting spirit with their response to COVID-19, followed by the SEQ floods earlier this year.
They have adapted and embraced technology to encourage home learning under extraordinary circumstances.
Page 12 of 19
They have restructured activities and classrooms and school timetables to keep students as safe as possible.
They are deserving of our heartfelt thanks.
Teachers are the engine room of our education system which is why we have created an additional 7,165 teacher and teacher aide positions since 2015.
The budget provides for 675 more teachers and nearly 200 more teacher aides in 2022–23.
We will continue to invest in students with a disability to make sure they get ease of access to the best education services possible.
Funding of $80.6 million over 3 years will support the transition of a new resourcing model for students with a disability.
Providing even better and fairer services is also about making sure we continue to protect our most vulnerable Queenslanders.
Particularly children and young people who have been harmed or who may be at risk of harm.
This Budget supports child protection services with $2.2 billion in funding over 5 years.
We recognise vulnerable young people in care face many challenges as they transition to adulthood.
We want to see them succeed, to get a qualification and to find work.
That is why we are committing to providing additional support to young people leaving care.
From 2023–24, we will be extending availability of the foster care allowance for carers of young people who remain living with them, up to the age of 21.
Those aged 18 to 21 years leaving non-family-based care will also be mentored and supported financially by non-government organisations to live independently.
Our government recognises that the pandemic, along with required periods of isolation, has impacted on mental health, including exacerbating loneliness.
The Budget commits $126 million over 4 years and $19 million ongoing to help address social isolation and support our invaluable Neighbourhood and Community Centres throughout Queensland.
This follows from the work of another important parliamentary inquiry led by the Member for Mansfield, Corinne McMillan.
In a state where the Premier, Governor, Chief Justice and Police Commissioner are all women, it is no surprise that the Palaszczuk Government is committed to ensuring women and girls have equal rights and access to opportunities.
Page 13 of 19
Women and girls should feel safe and valued.
We want women to have opportunities to succeed in economic, social, and cultural endeavours.
The Queensland Women’s Strategy will underpin this important work.
We are focused on securing better outcomes for women who have been victims of domestic violence.
This Budget commits $363 million over 5 years and $61.3 million ongoing for an historic overhaul of laws and practices to better protect Queensland women from domestic and family violence.
And hold perpetrators to account through legislation to criminalise coercive control.
A further $19.2 million over 4 years will go towards specialist women in custody and domestic and sexual violence support services, and programs for women in custody.
Queensland has the best police service in Australia.
The men and women of the Queensland Police Service work tirelessly around the clock, sometimes placing themselves in dangerous situations to keep us safe.
Population shifts, the way we live and work, and the demands of a growing state all require careful consideration in how we plan for police resourcing needs.
That’s why we are delivering more police with more resources through budget spending of $2.9 billion.
The biggest increase in police resourcing in 30 years will continue as we deliver on our commitment to see an additional 2,025 police personnel engaged by 2025.
We will make sure they have the facilities, stations, vehicles, and equipment they need through a $174.6 million capital program to support the frontline against crime.
I know many families and individuals outside of this building, all over Queensland, are working hard to cope with cost-of-living pressures.
This is often a week-to-week proposition compounded by a feeling of uncertainty.
We understand the impact the rising cost of fuel and groceries is having on Queenslanders, especially on those with low incomes.
That is why we continue to provide a wide range of concessions to help with transport, housing, healthcare, education, water, and energy costs.
This will amount to $6.8 billion over the next financial year.
That is a rise of 10 per cent on last year, benefiting millions of Queensland households.
Page 14 of 19
Because Queenslanders own the state’s power assets, earlier this year we announced Queensland households would receive $50 off their power bills
As part of the budget, that is being increased to $175, at a cost of $385 million.
It takes the total value of asset ownership dividends Queenslanders have received over the past 4 years to $575 per household, a program costing $1.2 billion.
The Palaszczuk Queensland Government is also taking substantial action to support Queenslanders facing the challenge of accessing housing.
The 2021-22 Budget included $1.9 billion for the Queensland Housing and Homelessness Action Plan 2021–2025, a plan also supported by returns from the $1 billion Housing Investment Fund.
Under the plan, the government will deliver 7,400 new dwelling commencements.
We are working on strategies to unlock development and increase the supply of housing in Priority Development Areas with $150 million in budget funding over the next 3 years.
A further $50 million will be allocated to the Growth Acceleration Fund, so we can speed up economic recovery, increase construction activity and support jobs.
This budget builds on our housing investment, with $29.8 million over 4 years and $10 million per year ongoing to support initiatives to address youth homelessness.
Speaker, housing affordability affects all parts of the country.
It is pleasing to see the new Federal Labor Government has a dedicated Minister for Housing as part of the Prime Minister’s Cabinet.
We look forward to working with them, and other states, to support delivery of quality, affordable housing for all Queenslanders.
GREAT LIFESTYLE
Speaker, Queensland has always been one of the best places in Australia to live, work and raise a family.
And our government intends to keep it that way.
We are the destination of choice for so many, given our stunning beaches, theme parks, hinterland, reefs, rainforests, and outback.
Net interstate migration to Queensland was the highest of all Australian states and territories in 2020-21 reaching a record quarterly increase of more than 16,600 in the September quarter 2021.
Page 15 of 19
While there are clear economic benefits to interstate migration, this Budget invests in measures to protect and enhance our lifestyle through this period of growth.
That includes investment in roads, rail, bus, cycleways, and marine infrastructure to improve the way people travel.
Front and centre is a $59 billion capital investment across Queensland over 4 years.
Of the $15.5 billion capital program for 2022-23, $9.8 billion, or 63.3 per cent, will be spent outside Greater Brisbane.
This vital capital works investment will better connect communities and businesses while driving economic activity.
Our capital program will support 48,000 jobs in 2022–23.
Protecting our lifestyle and protecting our environment are not mutually exclusive.
Our diverse natural environment is not only the envy of other Australian states, but the world.
As such, it is forever linked to our economic fortune.
We must look after it and this Budget does just that.
The Palaszczuk Government commits $262.5 million over the forward estimates to our 10-year strategy to better manage our protected areas, including our magnificent national parks and Great Barrier Reef.
We are investing almost $40 million to help protect our threatened species, including one of Queensland’s most loved native animals, the koala.
This funding will continue the work of our strategy to boost their numbers in South East Queensland and restore key habitats.
Our single biggest economic opportunity – hosting the 2032 Olympic and Paralympic Games – gives us a once-in-a lifetime opportunity to put Queensland on the world map.
The 10-year runway of investment and infrastructure, built in time for the Games, will deliver benefits for generations to come.
But it’s about more than concrete and construction.
It is a chance to unite Queenslanders behind an aspirational plan for our future.
We have already seen tremendous interest in the Youfor2032 campaign to set potential young Olympians on a path to glory.
And community interest is high around taking up volunteering opportunities for the games.
Page 16 of 19
We are investing $59.3 million over the forward estimates to support the Brisbane 2032 Taskforce as it leads 2032 Olympic and Paralympic Games activities across government.
This will support preparation of the 2032 Games Legacy Program and inform design of Games infrastructure, including venues and athlete’s villages.
Our best Queensland athletes will be supported through a $31.4 million contribution over 2 years to extend the 2032 High Performance Strategy.
And to create further pathways to Brisbane 2032, and encourage sports participation, $100 million will establish a schools program to deliver new and upgraded sports infrastructure across Queensland.
ECONOMIC UPDATE
Speaker, the Palaszczuk Government has never relied on hope or wishful thinking to get through tough times and secure better outcomes for all Queenslanders, whether they live in Weipa or Woodridge.
Our response to the COVID-19 crisis has been no accident.
It has been a response informed by sound, responsible economic and fiscal management geared towards recovery and growth.
While the pandemic is not over, Queensland’s economic recovery is well advanced.
By the March quarter 2022, Queensland’s domestic economy was 7.8 per cent larger than it was pre-COVID, much stronger than the 6.9 per cent growth in the rest of Australia.
206,000 extra Queenslanders have found jobs since the start of the pandemic, as many as New South Wales and Victoria combined.
Our unemployment rate of 4.0 per cent in May, is well below its pre-COVID rate of 5.8 per cent.
Our focus on regional jobs is also delivering great outcomes for Queenslanders.
Mackay has the lowest unemployment rate in Queensland at 2.4 per cent.
The Australian Bureau of Statistics tells us Queensland created 1,500 new jobs each and every day for the month of May.
The value of Queensland’s overseas merchandise exports totalled $99 billion in the 12 months to April 2022.
This is 72.3 per cent higher than the corresponding period a year ago, and the State’s highest 12-month total on record.
Our strong economic recovery stood the state in good stead when faced with a range of economic challenges earlier this year.
Page 17 of 19
The Omicron outbreak, major flooding in South East Queensland, and the global impact of the Russian invasion of Ukraine.
These shocks have all impacted the supply side of the economy and have exacerbated inflationary pressures.
In spite of this, the Queensland economy is forecast to grow by 3 per cent in 2021–22, and then average ongoing growth of 23⁄4 per cent per annum over the rest of the forward estimates.
This growth means even more jobs for Queenslanders.
Year-average employment is forecast to grow by an exceptional 43⁄4 per cent in 2021–22, the strongest rate of jobs growth in 15 years.
Employment is then expected to grow by a further 3 per cent in 2022–23.
Reflecting this strong jobs’ growth, the state’s unemployment rate is expected to remain around its current low level for the duration of the forward estimates.
Responsible management of our finances, growing jobs and growing the economy, is recognised by rating agencies.
Queensland retains the equal highest credit rating among all states with S&P Global.
FISCAL OUTLOOK
Our nation’s 4 largest governments – the Australian Government, the New South Wales Government, the Victorian Government and the Queensland Government – all went into deficit to respond to COVID-19.
At last budget, we were the first of those governments to announce a return to surplus.
Today I am pleased to announce that Queensland will be the first of those governments to deliver a surplus.
Today, I can announce that we will achieve a surplus of $1.9 billion for the 2021-22 Financial Year.
That compares to a projected deficit of $1.4 billion at the Budget Update in December, and a projected deficit of $3.4 billion at the time of last year’s budget.
I am also pleased to announce that this financial year our net debt will be reduced by $6.146 billion compared to the forecast in December last year.
Page 18 of 19
CONCLUSION
Speaker, much has changed from when I stood here to deliver last year’s budget.
We are back in black.
We have a new Federal Government.
Queensland can proudly call itself a future Olympic and Paralympic Games Host.
And we are one-up in this year’s State of Origin series.
But the challenges facing the world have changed as well.
From rising tensions in our region to the war in Ukraine, the rising spectre of global inflation, and labour and supply chain constraints, Queensland is not immune to these external disruptions.
But one thing remains constant.
And that is the commitment of the Palaszczuk Labor Government to deliver for the people of Queensland.
To deliver good jobs.
To deliver better services.
And to preserve and protect the great lifestyle of the place we all call home, the most wonderful place on earth:
Queensland.
I commend the Bill to the House.
Page 19 of 19
Queensland Budget 2022–23 Budget Speech Budget Paper No.1

Queensland Budget 2022–23
Budget Speech Budget Paper No.1
QUEENSLAND BUDGET 2022–23
BUDGET STRATEGY AND OUTLOOK
BUDGET PAPER NO. 2
2022–23 Queensland Budget Papers
1. Budget Speech
2. Budget Strategy and Outlook
3. Capital Statement
4. Budget Measures
Service Delivery Statements
Appropriation Bills
Budget Highlights
Regional Action Plans
© The State of Queensland (Queensland Treasury) 2022
Copyright
This publication is protected by the Copyright Act 1968
Licence
This document is licensed by the State of Queensland (Queensland Treasury) under a Creative Commons Attribution (CC BY 4.0) International licence.

In essence, you are free to copy, communicate and adapt this publication, as long as you attribute the work to the State of Queensland (Queensland Treasury). To view a copy of this licence, visit http://creativecommons.org/licenses/by/4.0/
Attribution
Content from this publication should be attributed to:
© The State of Queensland (Queensland Treasury) - 2022–23 Queensland Budget
Translating and interpreting assistance
The Queensland Government is committed to providing accessible services to Queenslanders from all cultural and linguistic backgrounds. If you have difficulty in understanding this publication, you can contact us on telephone (07) 3035 3503 and we will arrange an interpreter to effectively communicate the report to you.
Budget Strategy and Outlook
Budget Paper No. 2
ISSN 1445-4890 (Print)
ISSN 1445-4904 (Online)
Budget Strategy and Outlook 2022-23

State Budget
2022–23
Budget Strategy and Outlook
Budget Paper No. 2
Budget Strategy and Outlook 2022-23
Contents
Overview | 1 | |||||
1 | Queensland’s budget priorities | 8 | ||||
1.1 | Advancing Queensland’s health system | 9 | ||||
1.2 | Good jobs, better services, great lifestyle | 12 | ||||
1.3 | More jobs in more industries – Queensland’s economic strategy | 12 | ||||
1.4 | Better services | 23 | ||||
1.5 | Protecting Queenslanders’ lifestyle | 26 | ||||
2 | Economic performance and outlook | 32 | ||||
2.1 | International conditions | 33 | ||||
2.2 | National conditions | 35 | ||||
2.3 | Key assumptions | 36 | ||||
2.4 | Queensland conditions and outlook | 36 | ||||
2.5 | Risks to the outlook | 58 | ||||
3 | Fiscal strategy and outlook | 61 | ||||
3.1 | Fiscal outlook | 62 | ||||
3.2 | Key fiscal aggregates | 67 | ||||
4 | Revenue | 80 | ||||
4.1 | 2021–22 estimated actual | 81 | ||||
4.2 | 2022–23 Budget and outyears | 82 | ||||
4.3 | Budget initiatives | 85 | ||||
4.4 | Revenue by operating statement category | 87 | ||||
Budget Strategy and Outlook 2022-23
5 | Expenses | 115 | ||||
5.1 | 2021–22 estimated actual | 115 | ||||
5.2 | 2022–23 Budget and outyears | 116 | ||||
5.3 | Expenses by operating statement category | 117 | ||||
5.4 | Operating expenses by purpose | 125 | ||||
6 | Balance sheet and cash flows | 127 | ||||
6.1 | Overview | 128 | ||||
6.2 | Balance sheet | 128 | ||||
6.3 | Cash flows | 135 | ||||
7 | Intergovernmental financial relations | 136 | ||||
7.1 | Federal financial arrangements | 137 | ||||
7.2 | Australian Government funding to all states and territories | 140 | ||||
7.3 | Australian Government funding to Queensland | 140 | ||||
7.4 | Payments to Queensland for specific purposes | 142 | ||||
7.5 | State–local government financial relations | 146 | ||||
8 | Public Non-financial Corporations Sector | 149 | ||||
8.1 | Context | 150 | ||||
8.2 | Finances and performance | 157 | ||||
9 | Uniform Presentation Framework | 165 | ||||
9.1 | Context | 165 | ||||
9.2 | Uniform Presentation Framework financial information | 165 | ||||
9.3 | General Government Sector time series | 175 | ||||
9.4 | Other General Government Sector Uniform Presentation Framework data | 177 | ||||
9.5 | Contingent liabilities | 181 | ||||
Budget Strategy and Outlook 2022-23
9.6 | Background and interpretation of Uniform Presentation Framework | 181 | ||||
9.7 | Sector classification | 183 | ||||
9.8 | Reporting entities | 184 | ||||
Appendix A: Concessions statement | 188 | |||||
Focus | 189 | |||||
Explanation of scope | 189 | |||||
A.1 Concessions summary | 191 | |||||
A.2 Concessions by agency | 192 | |||||
A.3 Concessions by government-owned corporation | 218 | |||||
Appendix B: Tax expenditure statement | 220 | |||||
Context | 220 | |||||
Methodology | 221 | |||||
The tax expenditure statement | 222 | |||||
Discussion of individual taxes | 224 | |||||
Appendix C: Revenue and expense assumptions and sensitivity analysis | 229 | |||||
Taxation revenue assumptions and revenue risks | 230 | |||||
Royalty assumptions and revenue risks | 231 | |||||
Parameters influencing Australian Government GST payments to Queensland | 232 | |||||
Sensitivity of expenditure estimates and expenditure risks | 232 | |||||
Appendix D: Fiscal aggregates and indicators | 233 | |||||
Budget Strategy and Outlook 2022-23
Overview
Queensland led the nation in its health response and economic recovery from COVID-19, with the state’s domestic economy growing much faster than the rest of Australia. Queensland has created significantly more jobs than any other jurisdiction since the onset of the pandemic.
Queensland families, communities, businesses and the state’s economy have also continued to show resilience and strength in the face of the Omicron outbreak, devastating floods and increasing global geopolitical uncertainty across the first half of 2022.
Building on the rapid and strong recovery from the COVID-19 crisis, the 2022–23 Queensland Budget will help further enhance employment opportunities for all Queenslanders, foster and support private sector investment and growth, maintain Queensland’s enviable lifestyle, and deliver record levels of infrastructure investment and funding for essential services.
To drive these outcomes, this year’s Budget provides substantial capital investment and funding in areas such as health, energy transformation, social and economic infrastructure, education, family services, justice and policing, protecting the environment and reducing the cost of living.
This includes a $59.126 billion infrastructure investment program over the 4 years to 2025–26 to enhance the state’s productive capacity, improve service delivery and sustain jobs across all regions of the state.
Importantly, the Budget also provides $6.8 billion in concessions (including subsidies, discounts and rebates) to individuals and families to ease cost of living pressures and reduce costs for business.
In line with the Queensland Government’s economic strategy, this investment will continue to drive improved economic, employment and social outcomes for all Queenslanders over coming years and decades, as Queensland sets its sights on the milestone of hosting the Brisbane 2032 Olympic and Paralympic Games.
Queensland’s strong economy and labour market performance is also supporting an enhanced fiscal outlook, consistent with the government’s fiscal principles to drive improved fiscal performance over the medium term. The 2022–23 Budget presents a lower net debt burden compared to the 2021–22 Budget Update, expenses growth that continues to be lower than revenue growth, and an expectation that, over time, operational cash surpluses will be making a growing and material contribution towards the funding of investment in non-financial assets.
Queensland’s budget priorities
Queensland’s nation-leading response to COVID-19 has underpinned the state’s strong economic and labour market recovery.
While Queensland continues to transition from recovery to a focus on creating more, productive jobs in more industries across Queensland, the 2022–23 Queensland Budget still puts the health of Queenslanders first.
1
Budget Strategy and Outlook 2022-23
This budget provides a record $23.6 billion in 2022–23 for the Queensland health system to help meet growing demand. This includes operating funding of $22.044 billion for health and ambulance services, a 5.6 per cent increase from 2021–22. This significant boost to health funding will support thousands of additional frontline staff including doctors, nurses and paramedics.
The Mental Health Select Committee has recommended that the Queensland Government increase funding for mental health services and create a dedicated funding stream for mental health. This Budget provides $1.645 billion in operating funding over 5 years for improved mental health services. To fund the enhancements to mental health services, the Queensland Government will introduce a mental health levy to provide a sustainable funding source for the additional mental health related services and investment.
This budget also commits to a transformational investment of $9.785 billion over the next 6 years to boost health system capacity. The substantial capital investment in health is part of a $59.126 billion capital program over 4 years to 2025–26, estimated to support around 48,000 construction jobs across the state in 2022–23, which will provide the essential social and economic infrastructure needed for the state’s growing population.
Queensland is leveraging off the momentum of its strong recovery from COVID-19 and driving a growing economy through 3 priorities: more jobs in more industries; better services; and protecting Queenslanders’ lifestyle.
More jobs in more industries - The government’s economic strategy will build on Queensland’s traditional strengths and comparative advantages to support the creation of more employment opportunities and well-paid high-value jobs in traditional, emerging and new industries across all regions of the state.
This includes opportunities to drive a growing, innovative economy and create jobs in industries such as new energy, new economy minerals, advanced manufacturing including defence and biomedical products, agriculture, tourism, research and education services, and creative and design industries. The 2022–23 Budget contains a provision for the Queensland Energy Plan - to be released later in 2022 - which will chart a course to ensure a sustainable and affordable energy future for the state.
By getting the state’s economic settings and enablers right, the economic strategy will underpin the enhanced competitiveness and productivity of Queensland businesses so they can take advantage of these opportunities, enabling them to grow, invest, innovate, export and employ.
These key enablers of a thriving economy include: expanded trade opportunities, a larger skilled workforce, enhanced innovation and digitalisation, continued investment in public and private infrastructure, strengthened Environmental, Social and Governance credentials, and a competitive investment environment.
To enhance Queensland’s trade opportunities, a new Queensland Trade and Investment Strategy will be backed by $150 million over 10 years, while flagship industry development programs under the $3.34 billion Queensland Jobs Fund will continue to facilitate investment and enable Queensland businesses and industries to prosper.
2
Budget Strategy and Outlook 2022-23
Better services – A growing economy will allow the government to continue investing in critical health, education, social and justice services, thereby increasing living standards for all Queenslanders. These services also help provide the skills and wellbeing needed to enable individuals to participate in the economy and their community.
To support quality learning and education outcomes, this budget provides $19.6 billion for education and training in 2022–23, including significant investments in new schools, upgraded campus facilities, and additional classrooms at schools experiencing increased enrolment.
The Queensland Government is also committed to supporting vulnerable Queenslanders across the state by meeting increased demand for child protection services, delivering the Youth Justice Strategy, strengthening social services, and enhancing women’s economic security and safety.
As Queensland continues its transition from recovery to ongoing growth and prosperity, these priorities will ensure every Queenslander shares in the benefits of the state’s thriving economy.
Protecting our Queensland lifestyle - The economic strategy will deliver a growing economy in a balanced way, by protecting Queensland’s great lifestyle, alleviating cost of living pressures, investing in transport infrastructure and taking care of the environment.
This will position Queensland to showcase its great lifestyle at the Brisbane 2032 Olympic and Paralympic Games. In addition to the direct benefits and jobs from Brisbane 2032, the event will create ongoing benefits through increased trade and investment activity.
Cost-of-living pressures, including higher inflation, are being experienced around the world. This Budget provides $6.8 billion in concessions for Queenslanders in 2022–23, including $385 million for a $175 Cost of Living Rebate on Queensland households’ power bills to provide support for households. The Budget also includes $200 million over 3 years in growth infrastructure to unlock housing supply, including $150 million for the Catalyst Infrastructure Fund.
The 2022–23 Queensland Budget also includes a range of initiatives to protect the natural environment that underpins the state’s economy and supports the quality of life of Queenslanders. This includes $262.5 million over 4 years to continue delivery of Queensland’s Protected Area Strategy 2020–2030, providing conservation and carbon positive outcomes.
Economic outlook
Queensland’s economy and labour market has outperformed the rest of the nation since the onset of the COVID-19 pandemic, including the largest rise in employment in the country, with 206,000 more Queenslanders employed in May 2022 than before the pandemic.
Strong demand, particularly for goods, combined with severe supply chain disruptions saw global inflationary pressures surge in the latter half of 2021.
Surges in Omicron variant cases, major flooding in South East Queensland and the Russian invasion of Ukraine and subsequent global sanctions have all impacted the supply side of the Queensland economy in the first half of 2022 and exacerbated inflationary pressures.
In particular, the overall economic impact of the floods in February/March 2022 is estimated to be around $1 billion or 1⁄4 percentage point of Queensland’s Gross State Product.
3
Budget Strategy and Outlook 2022-23
Despite these shocks, Queensland’s domestic economy continued to grow in the first quarter of 2022, to be 7.8 per cent higher than its pre-pandemic level, maintaining its stronger performance compared with the major southern states since the onset of the COVID-19 crisis.
While Queensland has recently experienced subdued population growth, the state has seen elevated levels of interstate migration which has helped support overall activity. In net terms, more than 40,000 people moved from interstate to Queensland over the year to September quarter 2021 and this momentum is expected to have carried through to the final quarter of 2021.
On balance, after rising 2.0 per cent in 2020–21, the Queensland economy is forecast to grow solidly, by a further 3 per cent, in 2021–22 and then average 23⁄4 per cent per annum growth over the rest of the forward estimates.
Consistent with the ongoing robust growth in domestic activity, year-average employment is forecast to grow by 43⁄4 per cent in 2021–22, its strongest growth in 15 years, followed by further solid employment growth of 3 per cent in 2022–23.
After falling to 41⁄2 per cent in 2021–22, the state’s unemployment rate is forecast to remain low across the rest of the forward estimates, between 4 and 41⁄4 per cent, as sustained employment growth and a pick-up in wages growth keep the participation rate elevated.
Reflecting higher housing costs, global oil prices and ongoing supply chain disruptions, consumer price inflation in Brisbane is forecast to remain elevated in the medium term, in particular in 2021–22 and 2022–23. Inflation is then expected to return to within the RBA’s target band for national inflation of 2 to 3 per cent over the remainder of the forward estimates. This reflects a combination of factors, including the gradual easing of global supply chain constraints and a slowing in growth of fuel and food prices as global oil prices return to more sustainable levels and agricultural production recovers from the impacts of recent floods.
The key risks to the outlook are centred around global geopolitics and potential ongoing impacts of the pandemic, as well as the global and national inflationary and interest rate settings.
In particular, there is a risk that any extended conflict in Ukraine could result in a decline in global growth and have negative implications for Queensland over the medium term. The International Monetary Fund and World Bank have both downgraded their latest global growth forecasts, partly as a result of this conflict.
4
Budget Strategy and Outlook 2022-23
| Overview Table 1 | Queensland economic forecasts/projections1 |
| Actuals | Forecasts | Projections | ||||||||||||||||||||||
| 2020–21 | 2021–22 | 2022–23 | 2023–24 | 2024–25 | 2025–26 | |||||||||||||||||||
Gross state product2 | 2.0 | 3 | 23⁄4 | 23⁄4 | 23⁄4 | 23⁄4 | ||||||||||||||||||
Employment3 | 2.4 | 43⁄4 | 3 | 11⁄2 | 11⁄2 | 11⁄2 | ||||||||||||||||||
Unemployment rate4 | 6.8 | 41⁄2 | 4 | 41⁄4 | 41⁄4 | 41⁄4 | ||||||||||||||||||
Inflation5 | 2.1 | 51⁄4 | 33⁄4 | 21⁄2 | 21⁄2 | 21⁄2 | ||||||||||||||||||
Wage Price Index | 1.6 | 21⁄2 | 31⁄2 | 31⁄2 | 31⁄2 | 31⁄2 | ||||||||||||||||||
Population | 1 | 11⁄4 | 11⁄2 | 11⁄2 | 11⁄2 | 11⁄2 | ||||||||||||||||||
Notes:
| 1. | Unless otherwise stated, all figures are annual percentage changes. |
| 2. | Chain volume measure (CVM), 2019–20 reference year. |
| 3. | Comparable through the year seasonally adjusted employment growth rates to the June quarter are 9.9 per cent, 41⁄4 per cent, 11⁄4 per cent, 2 per cent, 11⁄2 per cent and 11⁄2 per cent, from June quarter 2021 to June quarter 2026 respectively. |
| 4. | Per cent, year-average. |
| 5. | Brisbane, per cent, year-average. |
Sources: ABS Annual State Accounts, National, State and Territory Population, Labour Force, Wage Price Index, Consumer Price Index, and Queensland Treasury.
Fiscal outlook
The Queensland Government’s fiscal strategy continues to be framed by the Fiscal Principles that are guiding progress towards improved fiscal performance over the medium term.
The 2022–23 Budget presents a lower net debt burden compared to the 2021–22 Budget Update, expenses growth that continues to be lower than revenue growth, and an expectation that, over time, operational cash surpluses will be making a growing and material contribution towards the funding of investment in non-financial assets.
Despite the economic impacts in early 2022 from Omicron, devastating floods and the Russian invasion of Ukraine, Queensland is still positioned for strong economic growth.
Improving economic conditions since mid-2020 are translating into stronger revenue performance. Despite volatility in some revenue lines, revenue is expected to remain elevated over the forward estimates compared to the 2021–22 Budget Update.
The additional revenue in the 2022–23 Budget is being directed towards measures that address the increasing demand for key services. Over the 5 years to 2025–26, revenue is expected to grow at 4.5 per cent on average per annum, compared to 4.1 per cent for expenses.
A substantial net operating surplus of $1.915 billion is expected for 2021–22, driven by the revenue impacts of the temporary surge in coal and oil prices and increase in housing activity. As these factors unwind, the net operating position reverts to a modest deficit across 2022–23 and 2023–24 and is then expected to return to surplus from 2024–25 consistent with previous forecasts.
5
Budget Strategy and Outlook 2022-23
Adjustments to the levels of government spending in the 2022–23 Budget are targeted to meet increasing demand for services in key sectors such as health, education and child safety. This Budget also includes substantial commitments to reduce the cost of living for Queenslanders, and significant investments to support trade development, enhance digitalisation and facilitate and attract investment and employment growth in traditional and emerging industries.
The government’s public infrastructure investment over 4 years maintains a focus on enhancing productive capacity, supporting service delivery and sustaining jobs.
The capital program continues to meet government’s $50 billion infrastructure guarantee and to ensure a continual pipeline of key priority projects. The 4-year program from 2022–23 to 2025–26 amounts to $59.126 billion. Over the 11 years to 2025–26, the government will have supported over $138 billion in infrastructure works.
Forecast borrowings have been progressively revised downwards since the 2020–21 Budget due to prudent fiscal management. General government borrowings are expected to be $3.618 billion lower by 2024–25 than forecast in the 2021–22 Budget Update, and almost $4.480 billion lower than forecast in the 2021–22 Budget.
This has had a positive impact on the outlook for the general government net debt to revenue ratio. Compared to the 2021–22 Budget Update, the ratio is expected to be 6 percentage points lower by 2024–25. The improvement is even larger relative to the 2021–22 Budget estimate, with the net debt to revenue ratio for 2024–25 sitting 17 percentage points lower.
| Overview Table 2 | Key fiscal aggregates1 |
| 2020–21 | 2021–22 | 2021–22 | 2022–23 | 2023–24 | 2024–25 | 2025–26 | ||||||||||||||||||||||
| Outcome | Budget | Est. Act. | Budget | Projection | Projection | Projection | ||||||||||||||||||||||
| $ million | $ million | $ million | $ million | $ million | $ million | $ million | ||||||||||||||||||||||
General Government Sector |
| |||||||||||||||||||||||||||
Revenue | 62,732 | 63,664 | 72,735 | 73,886 | 75,034 | 76,728 | 78,019 | |||||||||||||||||||||
Expenses | 63,669 | 67,149 | 70,820 | 74,915 | 76,116 | 76,591 | 77,836 | |||||||||||||||||||||
Net operating balance | (937 | ) | (3,485 | ) | 1,915 | (1,029 | ) | (1,083 | ) | 137 | 183 | |||||||||||||||||
PNFA2 | 6,835 | 7,800 | 7,533 | 8,478 | 9,106 | 9,439 | 9,264 | |||||||||||||||||||||
Fiscal balance | (5,015 | ) | (7,965 | ) | (2,386 | ) | (5,635 | ) | (5,631 | ) | (5,008 | ) | (3,969 | ) | ||||||||||||||
Borrowings | 54,078 | 65,041 | 58,215 | 66,459 | 74,224 | 81,102 | 87,284 | |||||||||||||||||||||
Net debt | 11,360 | 24,750 | 11,390 | 19,772 | 27,603 | 33,667 | 39,214 | |||||||||||||||||||||
Notes:
| 1. | Numbers may not add due to rounding. Bracketed numbers represent negative amounts. |
| 2. | PNFA: Purchases of non-financial assets. |
6
Budget Strategy and Outlook 2022-23
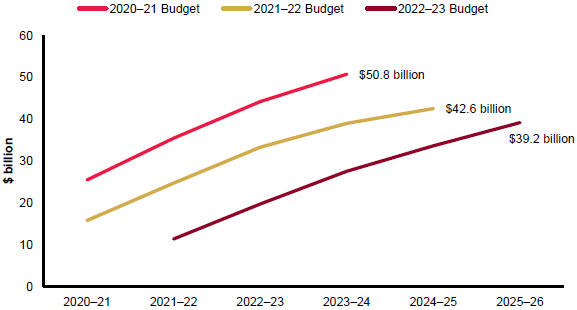
General Government Sector net debt has improved over the forward estimates and over successive budgets.
The 2020–21 Budget forecast net debt in 2023–24 to reach $50.8 billion. In this Budget, for the same year net debt is forecast to almost halve to be $27.6 billion.
By 2025–26, net debt is forecast to be $39.2 billion, more than $11 billion lower and reflecting 2 additional years of managing the state’s finances.
Chart 1 highlights the substantially improved net debt position and outlook compared with the outlook at the time of the 2020–21 Budget and 2021–22 Budget.
| Overview Chart 1 | Net General Government Sector debt forecasts by budget |
7
Budget Strategy and Outlook 2022-23
| 1 | Queensland’s budget priorities |
Features
| • | Queensland is leveraging the benefit of its strong health response to drive recovery and a growing economy through 3 priorities: more jobs in more industries; better services; and protecting Queenslanders’ lifestyle. |
| • | Queensland has led the nation and the world in its response to COVID-19, and the state has shown resilience in the face of the recent floods. This strong health and economic response has seen 206,000 more Queenslanders employed as at May 2022 than before COVID-19, the largest increase in Australia. |
| • | Protecting the health of Queenslanders remains vital to the state’s future. The 2022–23 Queensland Budget provides a record $23.6 billion in 2022–23 for the health system, including operating funding of $22.044 billion for health and ambulance services, an increase of 5.6 per cent from 2021–22. |
| • | Health commitments include a transformational $9.785 billion capital boost to build around 2,200 additional hospital beds over the next 6 years, as well as $1.645 billion over 5 years for mental health services. This investment will support thousands of additional frontline staff including doctors, nurses and paramedics. |
| • | This boost to health infrastructure is part of a $59.126 billion capital program over 4 years to 2025–26 which is expected to support 48,000 construction jobs in 2022–23. |
| • | Building on the state’s traditional strengths and with 2032, the year of the Olympic and Paralympic Games as a focus, the economic strategy will drive the creation of more productive jobs in more industries across Queensland. |
| • | There are opportunities to drive a growing, innovative economy across industries including new energy, new economy minerals, advanced manufacturing, biomedical products, agriculture, tourism, research and education services, and creative and design industries. The 2022–23 Budget contains a provision for the Queensland Energy Plan which will chart a course to a sustainable and affordable energy future. |
| • | Queensland’s economic strategy will focus on the enablers of a thriving economy including expanded trade opportunities, a larger skilled workforce, enhanced innovation and digitalisation, continued investment in public and private infrastructure, strengthened Environment, Social and Governance credentials, and a competitive investment environment. To enhance Queensland’s trade opportunities, a new Queensland Trade and Investment Strategy will be backed by $150 million over 10 years. |
| • | A growing economy will allow the government to deliver better services across the state, including in education, justice and social services. |
| • | This growing economy will also be delivered while protecting Queensland’s great lifestyle and alleviating cost of living pressures. The Budget includes $6.8 billion in concessions for Queenslanders in 2022–23, including $385 million for a $175 Cost of Living Rebate to help manage electricity costs. The Budget also includes $200 million over 3 years in growth infrastructure to unlock housing supply. |
| • | As Queensland continues its remarkable transition from recovery, these Budget priorities will make sure every Queenslander shares in the benefits of a thriving economy. |
8
Budget Strategy and Outlook 2022-23
| 1.1 | Advancing Queensland’s health system |
As Queensland continues to transition from recovery, the 2022–23 Queensland Budget still puts the health of Queenslanders first.
Like in many parts of the world, the Queensland healthcare system is facing unprecedented challenges including rising presentations to emergency departments, forced postponement of non-urgent elective surgeries in response to COVID-19 surges and a redirection of available public hospital beds into COVID-19 dedicated wards.
The government is continuing to provide record investments in the health system to meet these unprecedented challenges and ensure the delivery of first-class health services to Queenslanders.
| Box 1.1 | Increasing health expenditure |
Queensland continues to experience very strong ongoing demand for public hospital services such as emergency departments, mental health, specialist outpatients and elective surgery. Data for the period June 2015 to June 2021 indicates the number of admitted hospitalisations in Queensland’s public hospitals has increased by 40 per cent, at an annual average growth rate of 5.8 per cent.
Despite these demands, Queensland’s health performance remains strong, supported by record health budgets, with a focus on recruiting frontline staff, meeting increased demand for health services, and continuing to protect the state from COVID-19.
Since 2015–16, Queensland Health’s operating budget has increased from $14.183 billion to $22.044 billion in the 2022–23 Queensland Budget. Faced with responding to the COVID-19 pandemic, the government has grown the Queensland Health budget by over 19 per cent over the last 3 years.
This investment has focused on supporting the health frontline by employing more staff in Queensland Health and the Queensland Ambulance Service. Between March 2015 and March 2022:
| • | the number of nurses increased by 10,638 (or 38.1 per cent) |
| • | the number of doctors increased by 3,106 (or 39.2 per cent) |
| • | the number of ambulance officers increased by 1,103 (or 29.7 per cent). |
Queensland Health Capacity Expansion
The number of available hospital beds has also increased by 1,350 between June 2015 and June 2022. There are also 869 beds in the pipeline for delivery over coming years. Building on this, the 2022–23 Queensland Budget makes a significant investment to protect the health of Queenslanders through world-class health facilities across the state.
9
Budget Strategy and Outlook 2022-23
An additional $9.785 billion has been provided to Queensland Health for a range of projects to expand system capacity over the next 6 years ($5.708 billion over the forward estimates). With early works commencing in 2022–23, this will deliver around 2,200 additional overnight beds at 15 facilities by 2028, through the following projects:
| • | Cairns Hospital expansion |
| • | New Toowoomba Hospital |
| • | New Coomera Hospital |
| • | Robina expansion |
| • | Mackay Hospital expansion |
| • | Princess Alexandra Hospital expansion |
| • | Further Logan Hospital expansion |
| • | QEII Hospital expansion |
| • | New Queensland Cancer Centre |
| • | The Prince Charles Hospital expansion |
| • | Redcliffe Hospital expansion |
| • | Townsville University Hospital expansion |
| • | Ipswich Hospital expansion |
| • | New Bundaberg Hospital |
| • | Hervey Bay Hospital expansion |
In total, the 2022–23 Budget will increase the number of hospital beds in the pipeline from 869 to 3,378. Further detail on these projects is available in the Better Health and Hospitals Plan.
The 2022–23 Queensland Budget folds remaining funds from the $2 billion Hospital Building Fund, established as part of the 2021–22 Budget, into this program. Projects originally funded through the Hospital Building Fund remain funded and will continue to be delivered.
Supporting Mental Health
In any one year, one in 5 Queenslanders will experience mental illness, including substance use disorders. State-funded mental health services have a critical role in providing treatment, care and support for Queenslanders experiencing severe mental illness and substance misuse issues. However, the system is impacted by some key challenges, including increasing service demand, workforce constraints and the continuing impact of COVID-19.
The Mental Health Select Committee, in its report to Parliament – Report No. 1, 57th Parliament – Inquiry into the opportunities to improve mental health outcomes for Queenslanders – identified significant opportunities to improve the mental health and wellbeing of Queenslanders, including:
| • | greater involvement of people with lived experience in the system |
| • | greater use of health data to inform service delivery |
| • | expanded GP and other community-based mental health services |
| • | greater support services in schools |
| • | expanding alternative entry points and emergency department diversion services |
| • | utilising health practitioners’ full scope of practice. |
10
Budget Strategy and Outlook 2022-23
The Chair’s Foreword in the Report acknowledged it would be rare to find someone in our community who has not been impacted by one or more of: mental ill-health, suicidality and alcohol and other drugs issues. The Committee received 164 written submissions, heard evidence from 243 witnesses and conducted 11 site visits across Brisbane, Hervey Bay, Gold Coast, Yarrabah and Cairns.
Queensland Health advised the Committee that it spent an estimated $1.35 billion on mental health in 2020–21 and a further $139 million on alcohol and other drug (AOD) services. Even so, the Committee considered it was evident that to reform Queensland’s mental health and AOD system, a substantial increase in investment is required.
The Committee’s first recommendation included recommending that the Queensland Government:
| • | increase funding and expenditure for mental health and alcohol and other drugs services in Queensland |
| • | creates a dedicated funding stream for mental health and alcohol and other drug services and explores all options to create it. |
In the 2022–23 Budget, the Queensland Government is providing an additional $1.645 billion in operating funding plus an additional $28.5 million in capital funding to support a new 5-year plan, the Better Care Together: a plan for Queensland’s state-funded mental health alcohol and other drug services, and to meet Queensland’s obligations under the National Agreement on Mental Health and Suicide Prevention.
This funding will support new beds for adolescent, young adult, adult, perinatal, eating disorder and older person mental health services. It also supports beds for new crisis response services and will provide more than 1,000 new staff to operationalise this plan. Additional funding is also being provided to support enhanced provision of psychological supports to be delivered by non-government providers.
To fund the enhancements to mental health services, the Queensland Government will introduce a mental health levy to provide a sustainable funding source for the additional mental health related services and investment (see Chapter 4 for more detail).
11
Budget Strategy and Outlook 2022-23
| 1.2 | Good jobs, better services, great lifestyle |
While the Queensland Government continues to put the health of people first, Queensland is leveraging the momentum of its strong recovery to grow the economy and enhance the quality of life of all Queenslanders through 3 priorities.
More jobs in more industries – Queensland will take advantage of global shifts and build on its strengths to realise opportunities in traditional and emerging industries that support good, secure jobs. By focusing on critical economic settings and enablers, the Queensland Government’s economic strategy will improve the competitiveness and productivity of Queensland businesses so that they can take advantage of opportunities to drive a growing, innovative economy and job creation.
Better services – Growing the economy will give government the capacity to deliver better and fairer services. These services will improve the lives of Queenslanders while also enhancing the opportunity for all Queenslanders to benefit from participation in the economy and community.
Protecting Queenslanders’ lifestyle – A growing economy will also be achieved while protecting Queensland’s great lifestyle through addressing the cost of living, investing in the infrastructure needed to support the state’s growing population and taking care of the environment.
| 1.3 | More jobs in more industries – Queensland’s economic strategy |
Queensland’s economic strategy will create more good, secure jobs in more industries across the state by providing the environment for Queensland businesses to be competitive, attract private investment and thrive as the world changes.
It recognises the opportunities possible for Queensland in global shifts such as a lower emissions global economy, demand for Environmental, Social and Governance credentials, increasing digitalisation and supply chain diversification.
These opportunities leverage Queensland’s economic strengths and comparative advantages to drive a growing, innovative economy and job creation across the state. This will occur across a range of traditional and emerging industries and sectors, including: new energy, new economy minerals, advanced manufacturing, biomedical products, agriculture, tourism, research and education services, and creative and design industries.
To facilitate and support the private sector growth and investment needed to maximise the benefits of these opportunities, the economic strategy is underpinned by a focus on enablers that will enhance the state’s competitiveness and productivity, including expanded trade opportunities, a larger skilled workforce, enhanced innovation and digitalisation, continued investment in public and private infrastructure, strengthened Environment, Social and Governance credentials, and a competitive investment environment.
12
Budget Strategy and Outlook 2022-23
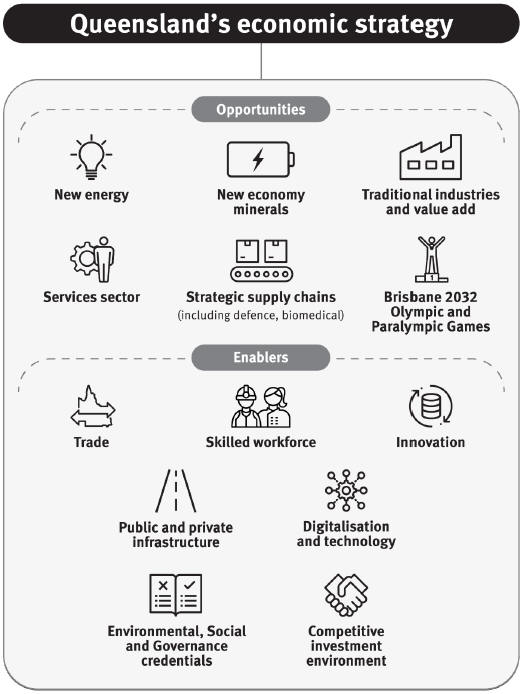
13
Budget Strategy and Outlook 2022-23
| 1.3.1 | Industry and business opportunities to create more jobs |
Queensland has a diverse and resilient economy with competitive advantages and economic strengths across regions and industries such as agriculture, mining, tourism, and the services sector. These industries will remain important to the Queensland economy, while emerging industries will provide opportunities to diversify and grow.
In an increasingly competitive environment where investors have multiple locations to choose from, having a broad investment facilitation and assistance program enhances the state’s attractiveness as a place to do business. The Queensland Government established the $3.34 billion Queensland Jobs Fund to capture future opportunities in traditional and emerging industries. Each program in the Queensland Jobs Fund has a targeted set of objectives. These programs include:
| • | Industry Partnership Program – $350 million to grow and create jobs across priority industry sectors |
| • | Backing Queensland Business Investment Fund – to provide direct investment in Queensland business and industry |
| • | Queensland Renewable Energy and Hydrogen Jobs Fund – $2 billion to allow energy government-owned corporations (GOCs) to increase ownership of renewable energy and hydrogen projects, and supporting infrastructure, including in partnership with the private sector |
| • | Building Acceleration Fund – to invest in catalyst infrastructure projects |
| • | Made in Queensland – to help small and medium sized manufacturers to increase international competitiveness, productivity and innovation |
| • | Manufacturing Hubs – to assist manufacturers to become more productive and create the jobs of the future |
| • | Hydrogen Industry Development Fund – to drive investment and accelerate development of hydrogen projects |
| • | Queensland Recycling Modernisation Fund – to support industry infrastructure expansions or upgrades (a joint initiative with the Australian Government) |
| • | Invested in Queensland program – to boost job creation and supply chain opportunities by supporting major private sector investment. |
The 2022–23 Queensland Budget also includes further investments targeted to assist the state’s businesses and industries to realise economic opportunities in traditional and emerging sectors.
New energy
Queensland is well placed to deliver more renewable, reliable and competitively priced energy for domestic and international markets, continuing the state’s role as an energy leader. The 2022–23 Queensland Budget contains a provision for the Queensland Energy Plan, which will chart a course to ensure a sustainable and affordable energy future for the state. Specific initiatives will be finalised as part of the release of the Queensland Energy Plan later in 2022.
14
Budget Strategy and Outlook 2022-23
Queensland’s renewable sector has continued to grow since the Queensland Government established a 50 per cent renewable energy target by 2030. More than 20 per cent of electricity used in Queensland is now met by renewables with 50 large-scale renewable energy projects operating, under construction or financially committed since 2015.
This equates to some $11 billion of investment, supporting 7,900 construction jobs and producing 5,774 megawatts (MW) of clean energy such as wind and solar, with more than 13.8 million tonnes of avoided emissions each year.
The 2022–23 Queensland Budget continues to support Queensland’s energy transformation. Through the $2 billion Queensland Renewable Energy and Hydrogen Jobs Fund, the government has committed $192.5 million for Stanwell’s investment in the 252 MW Wambo Wind Farm, and $43.9 million to support Stanwell and CS Energy hydrogen projects.
In addition, GOCs are retaining 2021–22 dividends for critical infrastructure and growth initiatives, supporting continued renewable energy, storage and strategic network investments across Queensland. This recognises the need to capitalise businesses to undertake strategically important investment in transformational growth opportunities, and the government’s commitment to public ownership for the benefit of all Queenslanders.
CS Energy is investing $150 million to deliver the 100 MW Chinchilla battery, and Stanwell is investing $207 million to deliver a 150 MW battery at Tarong.
The 2022–23 Queensland Budget delivers up to $10 million for a pilot to improve supply and storage of energy in regional communities through local solutions such as microgrids.
Queensland is also investing to deliver the new large-scale pumped hydro energy storage capacity essential for Queensland’s energy future. In 2021–22, $22 million was committed over 2 years to undertake a detailed feasibility study for a pumped hydro energy storage project at Borumba and concept studies for other sites.
This Budget allocates up to $48 million more for pumped hydro energy storage investments, including $13 million to fast-track a final investment decision on the proposed Borumba pumped hydro energy storage project and $35 million towards feasibility work on a second pumped hydro energy project.
These investments will further strengthen the supply of affordable, reliable and clean energy across Queensland, while also supporting regional jobs and investment.
| Box 1.2 | Hydrogen |
The Queensland Renewable Energy and Hydrogen Jobs Fund will directly support the state’s potential to be at the forefront of Australia’s hydrogen industry, and facilitate future production and supply of renewable hydrogen for both domestic and export markets over the next decade and beyond. This underlines the possibility of significant industry development, supply chain and employment opportunities being generated across regional Queensland.
15
Budget Strategy and Outlook 2022-23
In 2021–22, CS Energy announced it is part of a partnership demonstrating the production of renewable hydrogen to power Queensland’s heavy transport sector. A $28.9 million allocation from the Queensland Renewable Energy and Hydrogen Jobs Fund will support CS Energy’s partnership with Queensland energy company Senex to build the Kogan Renewable Hydrogen Project, including a demonstration plant and refuelling facilities near Chinchilla.
Once operational, the project will produce up to 50,000 kilograms of renewable hydrogen per annum and includes a potential refueller network.
Also in 2021–22, Stanwell, as part of a world-class consortium including Iwatani Corporation, Kawasaki Heavy Industries, Kansai Electric Power Company and Marubeni, and Australian energy infrastructure business, APA Group, commenced a $10 million feasibility study into the development of the Central Queensland Hydrogen Project (CQ-H2) near Gladstone Port.
CQ-H2 is a cornerstone opportunity for Queensland, with the project seeking to commercialise the production and liquefaction of renewable hydrogen and large-scale export to Japan. In 2022–23, the project will progress detailed feasibility and engineering design work into the development of a large-scale electrolyser and liquefaction facility in Central Queensland.
In demonstrating the government’s commitment to this project, Stanwell has been allocated an additional $15 million towards the Front-End Engineering Design Study for the project.
Queensland’s port-based GOCs (Gladstone Port Corporation Limited, North Queensland Bulk Ports Corporation Limited, Port of Townsville Limited) are continuing to plan for the development of hydrogen export facilities, primarily in the ports of Gladstone, Hay Point, Abbot Point and Townsville.
The port-based GOCs have various commercial agreements with private consortiums seeking to progress hydrogen export facilities and will continue to actively work with them and other state agencies to investigate and plan for the infrastructure required to facilitate their respective developments.
New economy minerals
Working with industry and stakeholders, the Queensland Government is developing a Queensland Resources Industry Development Plan that will establish a 30-year vision for Queensland’s resources industry, to ensure it continues to grow and diversify. The government is committing $68.5 million over 5 years to implement the package.
Expansion of Queensland’s resources sector will be driven by the production of new economy minerals needed for global decarbonisation technologies. The International Energy Agency estimates that total mineral demand for clean energy technologies will double between 2020 and 2040 under current energy policies that are either in place or announced. Concerted efforts to transition to global net zero emissions by 2050 would require 6 times more mineral inputs in 2040 compared with 2020.
Queensland will produce and deliver many of the new economy minerals the world needs like copper, vanadium and cobalt used to make renewable energy and electrification technologies. Queensland also has the genuine potential for downstream processing capability from extraction to manufacturing.
16
Budget Strategy and Outlook 2022-23
| Box 1.3 | New economy minerals and batteries |
The Queensland Resources Industry Development Plan aims to fast track new economy minerals production and processing. The government is committing $68.5 million over 5 years to implement the package, including an additional $17.5 million over 4 years to enhance the Collaborative Exploration Initiative, to make more mineral discoveries in Queensland.
Through the $520 million Invested in Queensland program, at least $10 million will be put towards building a new common-user processing plant in Townsville with a focus on vanadium, a critical battery mineral.
The Queensland Government will partner with the Australian Government to create a local Battery Manufacturing Precinct in Queensland. This initiative is backed by a $100 million equity investment by the Australian Government. The Queensland Government’s Buy Queensland Procurement Policy will also support demand for local battery manufacturing.
In recognition of the potential opportunities in the battery supply chain, the government will also invest $5 million in a Queensland Battery Industry Development Strategy. The Strategy will identify where Queensland has potential to value-add to battery minerals in the state.
This strategy will also be backed by up to $15 million in 2022–23 to support scaling-up of the National Battery Testing Centre, subject to contractual arrangements being finalised. This will position Queensland to be Australia’s gateway for battery innovation.
Advanced manufacturing
Future opportunities in Queensland’s advanced manufacturing sector align with Queensland’s traditional areas of economic strength, including value-adding and export opportunities in the resources and agricultural sectors. There are also emerging opportunities in industries such as defence, given the need to strengthen sovereign capability, and in the supply of high-value goods and services in biomedicine and health.
Building Queensland’s advanced manufacturing capabilities will help secure reliable domestic supplies of essential products and support Queensland’s economic resilience in the face of future global disruptions. However, for such projects to be sustainable they must be internationally competitive.
The government’s Industry Roadmaps and initiatives such as the $3.34 billion Queensland Jobs Fund will grow and create jobs in advanced manufacturing and priority sectors. Developed with industry, 10-year roadmaps in sectors such as hydrogen, biofutures, biomedical, defence, aerospace and resource recovery are driving innovation-led jobs for the future.
Defence – The defence roadmap is being realised through cutting-edge projects such as Boeing’s ‘MQ-28A Ghost Bat’ unmanned aircraft, which is set to be produced and assembled in Queensland, subject to defence orders. This facility, to be built in Toowoomba’s Wellcamp Aerospace and Defence Precinct, is expected to support around 300 construction jobs, with at least 70 high-skilled advanced manufacturing jobs to be created once the facility is operational.
17
Budget Strategy and Outlook 2022-23
Biomedical – Biomedical technology projects, like the new facility to produce Vaxxas’ needle-free vaccines, support the Queensland Government’s aim to make the state a globally competitive Asia-Pacific biomedical hub. This facility is expected to employ up to 110 high-skilled biomedical experts when operating in early 2023. This could grow to more than 139 new jobs over 5 years.
In addition, the 2022–23 Queensland Budget commits $50 million over 2 years to continue the Made in Queensland and Manufacturing Hubs Grant programs. These programs help small and medium sized manufacturers across the state to increase their international competitiveness and build advanced manufacturing capability in Queensland’s regions.
Agriculture
Agriculture is a traditional economic strength, employing 69,100 Queenslanders and with 84 per cent of Queensland’s agricultural economic output originating from regional Queensland. Diversification and value-chain innovation will provide major opportunities to grow the industry in areas such as high-value horticulture, seafood, livestock and other value-added products.
This will be backed by a Low Emissions Agriculture Roadmap as well as an AgTech Roadmap currently under development in collaboration with industry and other stakeholders.
The Budget also continues to deliver support to drought affected regions through the delivery of the Drought Assistance and Reform Package of up to $79.6 million over 4 years, and $150 million over 3 years for drought preparedness and emergency loans to help primary producers prepare, manage, recover and mitigate the impacts of drought.
The Budget is also supporting industry sustainability with up to $45.9 million over 5 years in new biosecurity funding, including $37.1 million over 5 years for fire ant suppression, up to $7.8 million over 4 years (and $1.5 million) ongoing towards the National Biosecurity System and $1 million in 2022–23 for the Queensland Feral Pest Initiative Round 7.
Tourism
Tourism is an important part of many regional Queensland economies and communities. Prior to the pandemic, 147,000 Queenslanders were employed in the sector in 2018–19, including in South East Queensland, tropical North Queensland, the Whitsundays and Fraser Coast.
Recognising the importance of the sector, the Queensland Government provided more than $1 billion to support tourism and hospitality operators during the COVID-19 pandemic. With the reopening of domestic and international borders, tourism has started to recover, led by domestic tourism.
The most recent data from Tourism Research Australia indicates that domestic tourism in Queensland has largely recovered to pre-pandemic levels, while the recovery in international tourism is progressing. The number of short-term international arrivals to Queensland has increased strongly since late 2021, however it remains well below pre-pandemic levels.
The ongoing return of domestic and international tourists to Queensland will drive industry growth and the government will continue working with industry to realise future opportunities, culminating in delivery of the Brisbane 2032 Olympic and Paralympic Games (Brisbane 2032).
To support tourism operators and regional communities, this Budget commits up to $66.4 million over 4 years to support initiatives for tourism recovery and growth.
18
Budget Strategy and Outlook 2022-23
Research and education, creative and design services
Research, education and training services directly employed 221,100 Queenslanders in 2021. These sectors also provide the training and education to increase the skills of the state’s broader workforce.
These industries are also an important part of Queensland’s innovation ecosystem. They develop the ideas and technologies for future Queensland businesses, products and services and apply overseas innovation to domestic applications. The easing of COVID-19 restrictions and the opening of international borders will support recovery of international education.
The government directly supports scientific research in Queensland through funding assistance and financial incentives, with this support creating a collaborative network of institutes and precincts across the state.
Reflecting this, the government has launched 3 regional science and innovation hubs in the first half of 2022 that aim to provide people living in regional Queensland with opportunities for skills development and establish local networks that will drive growth, development and capability in the science sector and innovation economy throughout the state’s regions.
The government’s Production Attraction Strategy continues to deliver outcomes for Queensland’s thriving film and screen industry. Building on this momentum, the 2022–23 Queensland Budget provides $13.8 million over 6 years to deliver a new film studio in Far North Queensland which will attract more local and international productions.
| 1.3.2 | Economic settings and enablers |
Ensuring the state remains a competitive and attractive destination for investment and talent is essential for a growing economy that creates good, secure jobs. By optimising the state’s economic settings and enablers, Queensland’s economy will be more flexible and resilient, and able to respond to new challenges and opportunities.
In particular, the economic strategy will be focused on facilitating trade opportunities, a skilled workforce, innovation, infrastructure, digitalisation and technology, Environment, Social and Governance credentials, and a competitive investment environment.
Trade
Trade is essential for Queensland as a trade-oriented economy, with one in 4 jobs across the state directly dependent on interstate or international trade. The state’s exports were worth $67.5 billion in 2020–21, accounting for 18.4 per cent of Gross State Product.
Queensland can leverage its international reputation, strong trade relationships and opportunities like Brisbane 2032 to promote and grow exports. A new Queensland Trade and Investment Strategy will be backed by a $150 million investment over 10 years to deliver new specialist staff, export clusters and trade delegations targeted to the state’s high value opportunities and markets.
Through facilitation services and industry development programs under the $3.34 billion Queensland Jobs Fund, the Queensland Government is helping attract investment and support Queensland businesses to take their products and services to the world.
19
Budget Strategy and Outlook 2022-23
Investment attraction initiatives, such as the Invested in Queensland program, aim to unlock the potential of investment projects in Queensland, accelerate the expansion and scale-up of local production capabilities, and create more jobs across the state.
Skilled workforce
Developing home-grown skills and attracting new talent will support both emerging industries that are growing and traditional industries that are constantly adapting to remain competitive. This is a challenge with industries and businesses across the state currently facing labour and skill shortages. Quality, responsive training is essential to position Queensland to compete internationally.
Investments in skills and training such as through Skilling Queenslanders for Work, will keep creating opportunities for Queenslanders to upskill, reskill and prepare for high value, highly skilled future job opportunities, helping to deliver higher incomes for Queenslanders.
In the 2021–22 Budget, the government provided $320 million over 4 years and $80 million ongoing to extend the Skilling Queenslanders for Work program, which assists up to 15,000 Queenslanders facing disadvantage in the labour market each year. Permanent funding for Skilling Queenslanders for Work has embedded the program into the core business of the state.
Queensland’s Workforce Summit, held in March 2022, brought together the community, industry and government to build innovative solutions that support a ready workforce for future opportunities.
Queensland’s Workforce Strategy will focus on how the Queensland Government can support development of a dynamic workforce, noting current challenges are being faced nationally. All levels of government and industry have a responsibility to contribute to solutions, including the Australian Government which has policy responsibility for tertiary education and migration which are critical to future outcomes.
Based on outcomes from the Summit, Queensland’s Workforce Strategy will focus on promoting local opportunities to address labour shortages, maximising participation, supporting school-to-work transitions, developing emerging and innovative models of training, attracting and retaining staff, and seizing future opportunities for skills in rapidly growing sectors.
Measures announced at the Summit include $15 million for the VET Emerging Industries initiative to develop flexible industry strategies and a Growing Workforce Participation Fund pilot to help employers to hire more diverse Queenslanders.
The Queensland Government’s commitment to skills and training remains a priority with more than $1.2 billion invested to continue delivering high quality training and creating career pathways for Queenslanders.
Innovation
Widespread creation and diffusion of innovative ideas, technologies and practices will support Queensland businesses to improve productivity, profitability and competitiveness, as well as deliver new products and services into global markets.
20
Budget Strategy and Outlook 2022-23
The government has a strong history of promoting innovation through investments such as the $755 million Advance Queensland initiative. To date, Advance Queensland has funded more than 140 programs during its lifetime, helping to establish new industries that will underpin a growing economy. These programs include the Industry Research Fellowships Program which has helped partner researchers with industry, and The Precinct innovation hub that has connected Queensland start-ups, investors, and mentors to drive innovation.
The state’s innovation ecosystem has also been enhanced by the establishment of a new leadership and engagement model. The new Queensland Chief Entrepreneur is working with government to connect the innovation ecosystem, support capital pathways and maximise the economic opportunity for Queensland from Brisbane 2032. The Innovation Advisory Council, established in 2021, will support the Queensland Chief Entrepreneur by attracting investment and providing a platform for setting new direction on priority outcomes.
New initiatives to foster and accelerate innovation across industries are being developed to further the innovation agenda and economic development across the state. To support the translation of research and innovation into improved healthcare outcomes, this Budget provides up to $35.5 million in additional funding over 4 years to support the $80 million expansion of the Translational Research Institute.
Public and private infrastructure
The delivery of productive infrastructure, including digital connectivity, will make it easier to do business in Queensland, facilitate greater mobility of labour and improve supply chains, as well as enabling better services to be delivered across the state and supporting Queensland’s great lifestyle.
As part of a $59.126 billion capital program over 4 years to 2025–26, $15.510 billion in 2022–23 will directly support around 48,000 jobs during the construction phase, including 31,100 jobs outside of greater Brisbane. Many more jobs will also be indirectly supported through the increased economic activity and connectivity generated by this infrastructure investment.
The government’s commitment to facilitate and deliver the critical infrastructure needed for a growing Queensland is outlined further in sections 1.4 and 1.5.
Environment, Social and Governance credentials
In the context of the continuing transition to a lower emissions global economy, maintenance and enhancement of the state’s Environment, Social and Governance (ESG) credentials will be critical to support Queensland’s competitiveness.
Realising Queensland’s future Energy Plan will demonstrate the pathway to meeting the Queensland Renewable Energy Target. This will further bolster the state’s ESG credentials, as will continued targeted investment in social services and justice reforms that strengthen communities and support vulnerable Queenslanders.
In tandem with Queensland’s institutional stability, the state’s financial management is a recognised strength. Queensland has a prudent approach of long-term planning and transparency, and exceptional debt and liquidity management that has contributed to its strong ESG credentials, being awarded an ESG rating of AA by MSCI in July 2021. Maintaining this strong position will be vital for attracting future investment.
21
Budget Strategy and Outlook 2022-23
Competitive investment environment
Maintaining a competitive business environment attracts investment and supports the establishment and expansion of industry and businesses across the state.
The government has implemented a range of regulatory reforms as part of its response to the COVID-19 pandemic, making it easier for businesses to recover, invest and employ. There will continue to be a focus on reducing the regulatory burden and compliance costs for business, including by improving the provision of information to businesses, removing duplication and reducing compliance and reporting requirements.
This complements existing industry attraction and facilitation services that assist businesses to establish or expand in Queensland. These include identifying suitable site options, streamlining approvals, advising on the development approval process and facilitating introductions to service providers.
Investment schemes under the $3.34 billion Queensland Jobs Fund further strengthen Queensland’s competitive position. The Strategic Investment Scheme provides tailored assistance packages to support large-scale projects and the Investment Support Scheme incentivises businesses to invest in Queensland through a rebate program for payroll tax and other state-managed taxes.
The government is also introducing a new Significant Investment Facilitation approach to enhance cross-government coordination of the most significant investment opportunities, which will deliver more timely and successful outcomes.
In recognition of the important role that small to medium businesses play in the Queensland economy, the government is providing payroll tax relief to small and medium businesses across the state, through adjustments to the existing payroll tax deduction framework from
1 January 2023.
This targeted payroll support measure will help to minimise the cost pressures on eligible businesses and provide confidence to those businesses to employ additional Queenslanders to take advantage of economic opportunities emerging across the state.
The reform is estimated to benefit over 12,000 Queensland businesses and will save a business paying $6.5 million in annual taxable wages over $26,000 in payroll tax each year.
In addition, the 2022–23 Queensland Budget commits funding of $39.1 million over 4 years and $12.6 million ongoing to permanently fund Small Business Grants and the Mentoring for Growth program. Further, the permanent appointment of the Queensland Small Business Commissioner allows the government to continue to provide small businesses with ready access to support, information and advice, and will reduce the time and costs associated with resolving disputes.
22
Budget Strategy and Outlook 2022-23
| Box 1.4 | Productivity |
A more productive economy improves the living standards of all Queenslanders and allows real wages to grow.
While many factors influence productivity, the government can play an important role through robust policy and regulatory settings and the efficient delivery of services.
The Queensland Government is progressing its productivity reform agenda by:
| • | developing productivity-enhancing reforms and initiatives across a broad range of priority areas, including: |
| • | investments in better services such as health, mental health and education that will improve social and economic participation |
| • | infrastructure that improves mobility and supply chain connectivity through the government’s capital program of $59.126 billion over 4 years to 2025–26. |
| • | ensuring new and existing regulations are necessary, fit-for-purpose and well designed |
| • | identifying and progressing regulatory reforms where regulation may impede investment in new industries and technologies |
| • | improving the way regulators administer and enforce regulation to reduce the regulatory burden on business and the community |
| • | working with the Queensland Small Business Commissioner to identify regulatory reform priorities to support small business. |
| 1.4 | Better services |
Queensland’s investment in the provision of health, education, justice and social services will raise living standards, provide the skills and wellbeing for individuals and households to participate in the economy, and help achieve a fairer environment that drives job creation.
| 1.4.1 | Enhancing education and digital services |
Access to quality learning and education is essential for young Queenslanders to thrive and participate in the state’s growing economy. Since March 2015 there has been a 13.75 per cent increase in the numbers of teachers in state schools. Overall, the 2022–23 Queensland Budget provides $19.6 billion for education and training statewide in 2022–23.
The 2022–23 Queensland Budget includes $389.5 million for new primary schools to open in 2025 and 2026 in Caboolture West, Caloundra South, Ripley Valley, Greater Flagstone and Bahrs Scrub, $20 million over 2 years to upgrade school playgrounds and tuckshop facilities, and $118.6 million over 2 years for additional classrooms at schools experiencing increases in enrolment.
This investment builds on the government’s $1 billion Great Schools, Great Future infrastructure commitment and brings total investment under the Building Future Schools Program to $3 billion since 2015.
23
Budget Strategy and Outlook 2022-23
This Budget also includes additional funding of $80.6 million over 3 years to support the transition to a new resourcing model for students with disability, and $13.3 million in 2022–23 to expand the Share the Dignity in Queensland Schools initiative, which provides free period packs to all state schools, outdoor education centres and student residential facilities.
To improve the delivery of education services to young people in the youth justice system, additional funding of $27.6 million over 5 years and $6.5 million per year ongoing is also provided to increase the teacher to student ratio for education staff working in Queensland’s 3 youth detention centres.
Digitalisation benefits Queensland households and businesses and is a catalyst for skills development, creating and communicating knowledge, innovation and service delivery.
Adoption of technology enables businesses to expand their delivery of goods and services to new customers and markets and increase their competitiveness. Households also gain access to more channels to purchase goods and services, and can improve access to services, such as education and telehealth.
Recognising that telecommunications is an Australian Government responsibility, the Queensland Government still plays a critical role in enhancing the growth of the digital economy in Queensland and its economic benefit by investing in essential infrastructure and skills development.
The government previously announced up to $190 million over 5 years to make internet speeds 200 times faster for all Queensland state schools. This partnership with Telstra includes $110 million for exchange upgrades, benefitting communities and businesses in hundreds of regional and remote areas.
Digitalisation also improves the delivery of government services. This Budget includes $126.9 million over 5 years to digitise Queensland Courts and the Queensland Civil and Administrative Tribunal and $30.4 million over 4 years to upgrade Queensland Corrective Services’ Integrated Offender Management System.
| 1.4.2 | Supporting communities and keeping Queenslanders safe |
The Queensland Government is committed to supporting vulnerable Queenslanders, with substantial funding commitments in the 2022–23 Queensland Budget including:
| • | Child Protection Services – $2.2 billion over 5 years and $500 million per year ongoing for out of home care services in response to significant, ongoing pressures arising from an increase in demand in the child protection system |
| • | Youth Justice Investment – $78.8 million over 4 years and $18.9 million per year ongoing from 2025–26 to continue the Youth Justice Strategy reforms |
| • | Strengthening Social Services in Queensland – $125.6 million over 4 years and $19 million per year ongoing to strengthen the community and social services sector with a focus on elevating the role and function of neighbourhood and community centres and to support delivery of the government’s response to the Parliamentary Inquiry into Social Isolation and Loneliness |
24
Budget Strategy and Outlook 2022-23
| Box 1.5 | Parliamentary Inquiry into Social Isolation and Loneliness |
The government is delivering on its commitment to address social isolation and loneliness.
On 27 May 2021, the Legislative Assembly agreed to a motion that the Community Support and Services Committee inquire into and report on social isolation and loneliness in Queensland. The Committee issued its report, which contained 14 recommendations, on
6 December 2021, and the government tabled its final response on 6 June 2022.
The government response supported, or supported in principle, all of the recommendations of the Committee.
The 2022–23 Budget includes a significant investment to support this response, providing $51.8 million to increase existing neighbourhood and community centre base operational funding, ensuring the ongoing viability and maximum benefit from this important part of our social services infrastructure. The Inquiry report highlighted the invaluable role that neighbourhood and community centres play in promoting social inclusion and reducing loneliness.
This Budget also provides $4 million over 4 years for a new Innovation Fund that will support the delivery of community-led responses to local issues, with a focus on responding to the causes and impacts of social isolation and loneliness.
Additional funding of $2.1 million has also been provided to support activities recommended by the inquiry report, including to support the further development of plans and initiatives to address social isolation and loneliness, and development of training and resources to support workers and volunteers in the community and social services sector.
This forms part of the government’s total funding of $125.6 million over 4 years and $19 million ongoing to strengthen social services in Queensland.
The government is also protecting communities and keeping Queenslanders safe through the $2.878 billion provided in 2022–23 for policing services. The government is continuing to provide an additional 2,025 police personnel by 2025, which is the biggest increase in police resourcing in almost 30 years.
This Budget also includes $174.6 million to fund the police capital program, including facilities, motor vehicles, vessels and other essential equipment, to support quality frontline police services.
Women’s economic security and safety is an important focus of the government’s 5-year Queensland Women’s Strategy 2022–27. The strategy provides a framework for improving outcomes for women and girls, supporting them to freely participate and succeed in economic, social and cultural opportunities.
25
Budget Strategy and Outlook 2022-23
The 2022–23 Queensland Budget commits $363 million over 5 years and $61.3 million ongoing as part of the Queensland Government response to the Queensland Women’s Safety and Justice Taskforce Hear her voice – Report one – Addressing coercive control and domestic family violence in Queensland, for system-wide reform and criminalising coercive control. A further $19.2 million is provided over 4 years for specialist domestic, family and sexual violence support services and programs for women in custody.
| 1.5 | Protecting Queenslanders’ lifestyle |
Queensland’s strong economy and enviable lifestyle have made the state a destination of choice for Australians, with net interstate migration in Queensland the highest of all states and territories during 2020–21. Net interstate migration rose even higher in the September quarter 2021, to an annual change of 40,600 persons, the highest annual change since the December quarter 1994 and well above the next highest state of Western Australia with 6,100 persons.
The 2022–23 Queensland Budget continues to invest in protecting the environment and maintaining Queensland’s great way of life while Queenslanders and Queensland businesses realise the opportunities of a growing economy.
| 1.5.1 | Cost of living support |
The current global inflationary environment is driving up the cost of living around the world. This is the result of a combination of factors, including the easing of COVID-19 restrictions supporting strong domestic demand, COVID-related disruptions to global supply chains and geo-political instability driving a surge in commodity prices.
While Queensland’s housing prices remain broadly less expensive than in many of the other states and territories, Queensland has also experienced significant inflationary pressures.
The 2022–23 Queensland Budget is progressing several initiatives that will provide short-term and long-term solutions to reduce cost of living pressures.
26
Budget Strategy and Outlook 2022-23
| Box 1.6 | Concessions, subsidies and discounts |
The Queensland Government provides a significant range of concessions, subsidies, discounts and rebates every year which help reduce transport, housing, healthcare, education, water and energy costs for millions of Queensland households.
In 2022–23, the value of these concessions is $6.786 billion, an increase of more than 10 per cent from 2021–22.
This includes a total of $385 million in 2022–23 to support Queensland households with a $175 Cost of Living Rebate, with the government having allocated a total of $1.185 billion to provide households with a total of $575 in direct financial assistance through electricity bill rebates since April 2018.
Since the Palaszczuk Government’s first budget in 2015–16, total government spending on concessions has increased by 44 per cent. This increase has, on average, outpaced inflation by 1.4 per cent per annum.
As part of the government’s commitment to address housing affordability challenges, the government managed housing rental rebate supports approximately 54,700 low income households and has increased from $363.1 million in 2015–16 to $541.3 million in 2022–23.
General Transport Concessions for bus, rail and ferry services have risen from $1.357 billion in 2015–16 to $2.140 billion in 2022–23. Energy concessions help provide affordable power to households and businesses and have increased from $689.5 million in 2015–16 to $1.336 billion in 2022–23. Significant concessions provided in the 2022–23 Budget include:
| • | $153.9 million for the School Transport Assistance Scheme, which provides funding for low-income households to reduce the costs of travelling to school |
| • | $180.7 million for the Oral Health Scheme, providing free dental care to eligible clients and their dependents |
| • | $195.8 million for Vehicle and Boat Registration Concessions available to a range of groups, including Queensland Seniors Card holders, to reduce registration fees |
| • | $799.1 million in rail network and infrastructure funding to ensure the safety and reliability of the rail network and reduce access charges for users |
| • | $245.7 million for the User Choice Training Subsidy which helps fund training and assessment costs for Queensland apprentices and trainees |
| • | $201.2 million for the Certificate 3 Guarantee Tuition Fee Subsidy, which supports eligible Queenslanders to obtain their first post-school Certificate III qualification. |
These concessions make a real difference to the lives of Queenslanders. For example, in 2022–23 a retired couple in their seventies living in their own home in South East Queensland with no dependents, both with a Queensland Seniors Card and on the pension, will receive concessions including a $372 electricity rebate, a $120 South East Queensland water subsidy, $200 for council rates and $81 for reticulated natural gas.
27
Budget Strategy and Outlook 2022-23
They will also receive a reduction of around $174 on the annual registration of their small 4 cylinder car, and a $175 Cost of Living Rebate on their electricity bill. In total they save $1,122 on these concessions. In addition, they are entitled to discounted travel on public transport, saving 50 per cent on fares.
A low-income family in social housing with 2 children in senior high school could be eligible for around $10,600 in Queensland Government concessions in 2022–23, including up to $590 in school textbook and resources allowance, a $175 Cost of Living Rebate on their electricity bill and an average rental benefit of around $9,900.
Housing affordability is a national issue requiring action from all levels of government.
Finding appropriate and affordable housing has become more challenging for many Australians in light of the exceptionally strong performance of the housing market in recent times.
The resulting higher prices, record low rental vacancy rates, and increased rents underscore the need for well-targeted government support and action.
| Box 1.7 | Housing affordability |
The Queensland Government is committed to ensuring policy and regulatory settings support the delivery of quality housing at an accessible price for all Queenslanders, including through investments in affordable and social housing, an effective planning system, and direct support for home buyers.
Queensland’s $15,000 Queensland First Home Owners’ Grant is one of the most generous in Australia and is available for properties up to a value of $750,000, enabling more first home buyers to get into the market while also boosting housing supply.
Queensland’s transfer duty settings are also highly competitive, with lower effective rates of duty than other states and territories for most home values and providing generous concessions for first home buyers worth up to $15,925.
Increased supply of land and development opportunities support more affordable housing. The Queensland Government is planning and supporting the delivery of new land supply and homes across Queensland communities through a broad range of initiatives, including through progressing a new legislative framework for Priority Growth Areas that will better integrate land use and infrastructure planning.
The 2022–23 Queensland Budget builds on existing actions with funding of:
| • | $150 million over 3 years to increase the Catalyst Infrastructure Fund (subject to a minimum co-investment by developers) to unlock development and increase the supply of housing in the state’s Priority Development Areas |
| • | $50 million over 3 years, $35 million held centrally, for the Growth Acceleration Fund to support the delivery of priority trunk infrastructure in the Caboolture West growth area and other targeted growth areas in South East Queensland |
28
Budget Strategy and Outlook 2022-23
| • | $10 million over 2 years to support the Growth Areas Team to address land supply, population growth and property development challenges across South East Queensland. |
The Queensland Government is backing the largest concentrated investment in social housing in Queensland’s history, with $1.9 billion in funding over 4 years under the Housing and Homelessness Action Plan 2021–2025. This is supported by returns from the $1 billion Housing Investment Fund, a long-term fund with returns to drive new supply to support current and future social and affordable housing needs.
Under the Action Plan, the Queensland Government will deliver 7,400 new dwelling commencements across Queensland.
The 2022–23 Queensland Budget builds on this investment with further targeted support to address youth homelessness across Queensland, with $29.8 million over 4 years and $10 million per year ongoing. This will deliver new frontline service initiatives that provide housing with support for young people as they work toward social and economic independence. This is a key action under the Queensland Housing and Homelessness Action Plan 2021–2025.
| 1.5.2 | Transport infrastructure that keeps pace with population |
Over $7.3 billion is budgeted for transport portfolio capital investment in 2022–23, such as road, rail, port, bus, cycling and marine infrastructure to meet the needs of the growing population and mitigate risks, such as traffic congestion.
Critical projects include the Cross River Rail Project to improve travel across South East Queensland, construction of the Coomera Connector Stage 1 and Gold Coast Light Rail Stage 3 and priority upgrades to the Pacific Motorway.
The 2022–23 capital program also includes investment in several key projects on the Bruce Highway, improving safety and supporting jobs across the regions, including:
| • | $1.065 billion to plan, preserve and construct the Rockhampton Ring Road |
| • | $1 billion to construct Cooroy to Curra (Section D) |
| • | $662.5 million to upgrade the highway from 4 to 6 lanes between Caboolture-Bribie Island Road and Steve Irwin Way |
| • | $500 million funding injection for the Bruce Highway, noting the Queensland Government’s priority for upgrades between Mackay and Proserpine, and between Gladstone and Rockhampton |
| • | $481 million to duplicate the highway from 2 to 4 lanes as part of the Cairns Southern Access Corridor (Stage 3), from Collinson Creek in Edmonton to the Wrights Creek area near Gordonvale |
| • | $350 million for the Mackay Port Access upgrade, to improve access to the Port of Mackay while addressing urban congestion in North Mackay |
29
Budget Strategy and Outlook 2022-23
| • | $336 million to increase the flood immunity, safety and efficiency of the Bruce Highway and future-proof the road to cater for growing traffic volumes at Tiaro. |
These investments will connect businesses and regions across the state, mobilise people and goods, help enhance the state’s productivity, and drive economic activity and job creation.
| 1.5.3 | Towards the Brisbane 2032 Olympic and Paralympic Games |
The announcement of Queensland as the host of Brisbane 2032 presents Queensland with the opportunity to showcase the state on the global stage and leave a legacy that will define the state for decades to come. In addition to the direct benefits and jobs from Brisbane 2032, the event will create ongoing benefits through increased trade and investment activity.
The 10-year horizon to Brisbane 2032 provides for the state to effectively progress planning, design and delivery of critical infrastructure which will both support South East Queensland’s long-term growth and enable successful delivery of Brisbane 2032. The Queensland Government continues to work closely with Games Partners, including the Australian Government, on funding arrangements for Brisbane 2032 as part of this critical planning work.
The establishment of the Organising Committee for the Brisbane 2032 Olympic and Paralympic Games (OCOG) in December 2021 and inaugural meeting of the OCOG Board in April 2022 were important milestones for Brisbane 2032. A key priority for the OCOG Board is securing third party funding arrangements so its responsibilities for delivering Brisbane 2032 are achieved on a cost neutral basis.
To support effective planning for Brisbane 2032, the government is investing $59.3 million over 4 years and $4.7 million per year ongoing for the Brisbane 2032 Taskforce to lead activities across the Queensland Government. This will support preparation of the 2032 Games Legacy Program and planning and design of infrastructure to support delivery of Brisbane 2032, including venues and athletes’ villages. It will also support priority transport projects being delivered in South East Queensland to manage growth in the region and support the Games transport task.
The 2022–23 Queensland Budget provides $31.4 million over 2 years from 2023–24 to extend the 2032 High Performance Strategy to help prepare elite Queensland athletes to achieve world class success at Paris 2024 and leading up to Brisbane 2032.
A further $100 million over 4 years is being invested to establish the Go for Gold Fund (School Sports Infrastructure). This program will deliver new and upgraded sports infrastructure for schools across the state, with a focus on encouraging sports participation.
| 1.5.4 | Protecting Queensland’s environment |
Queensland has a diverse natural environment that underpins the economy and allows Queenslanders to enjoy recreational activities, events and sports that support wellbeing.
To ensure protection of this valuable space, the government has committed $262.5 million over 4 years to continue delivery of Queensland’s Protected Area Strategy 2020–2030, providing conservation and carbon positive outcomes. This 10-year plan is directly supporting the growth, better management and sustainability of the state’s protected areas.
30
Budget Strategy and Outlook 2022-23
Resource recovery and recycling policies and initiatives, with an investment of $291.8 million over 4 years, will contribute to implementation of waste management plans, expand resource recovery programs and support environmental activities.
Queensland has also committed to the target of zero net emissions by 2050, consistent with the national commitment to this target. The Budget also provides an additional $14 million over 2 years for a community-based pilot program to reduce emissions by partnering with local government and industry.
Biodiversity is an invaluable part of Queensland’s environmental heritage. To ensure that Queensland’s precious wildlife remains protected, the government is providing $14.7 million over 4 years and $1 million per year ongoing to continue the Saving Queensland’s Threatened Species Program.
A further $24.6 million over 4 years and $1 million per year ongoing will also be invested into continuing implementation of the South East Queensland Koala Conservation Strategy 2020–2025, including an increased commitment to the South East Queensland Wildlife Hospitals that help rescue and rehabilitate sick and injured koalas.
Recognising its significant environmental and economic importance, the Queensland Government continues to invest in the protection of the Great Barrier Reef. Last year, the Queensland Government committed $270.1 million over 5 years to 2025–2026 to continue the Queensland Reef Water Quality Program, which funds a range of projects working with industry, agricultural producers and communities. The government is also working with councils and the urban development industry to better manage urban run-off.
31
Budget Strategy and Outlook 2022-23
| 2 | Economic performance and outlook |
Features
| • | The rollout of COVID-19 vaccines and substantial fiscal and monetary stimulus supported a strong rebound in global and national economic growth in 2021. However, the Queensland economy and labour market has outperformed the rest of the nation. |
| • | Strong demand, particularly for goods, combined with severe supply chain disruptions saw global inflationary pressures surge in the latter half of that year. This has prompted central banks, including the Reserve Bank of Australia, to begin monetary policy tightening from the historically low settings in place during the pandemic, to dampen excessive demand while allowing supply chains to hopefully regularise. |
| • | Surges in Omicron variant cases in early 2022, major flooding in South East Queensland, and the Russian invasion of Ukraine and subsequent global sanctions have all impacted the supply side of the economy and exacerbated inflationary pressures. |
| • | The Omicron outbreaks in early 2022 impacted activity and the Queensland economy through widespread initial impacts on labour supply, feeding into some supply chain disruptions. However, Queensland’s domestic economic activity still rose in the first quarter of 2022, to be 7.8 per cent higher than its pre-pandemic level, and maintained its stronger performance compared with the major southern states during the COVID-19 crisis. |
| • | The overall economic impact of the floods in February/March 2022, estimated to be around $1 billion, or 1⁄4 percentage point of Queensland’s Gross State Product (GSP), is expected to be relatively limited compared with previous major natural disasters as key mining and agriculture regions outside of South East Queensland were mostly unaffected. |
| • | Despite Queensland recently experiencing subdued population growth, the state has seen elevated levels of net interstate migration to Queensland during the pandemic, which has helped support overall population growth and activity. |
| • | On balance, after rising 2.0 per cent in 2020–21, the Queensland economy is now forecast to grow by a further 3 per cent in 2021–22, slightly slower than the 31⁄4 per cent expected at the time of the 2021–22 Budget Update, reflecting the combined impacts of the 3 major shocks experienced in the first half of 2022. |
| • | Queensland’s GSP growth is then forecast to average 23⁄4 per cent per annum over the rest of the forward estimates, driven mainly by continued growth in the domestic economy. |
| • | Consistent with the ongoing robust growth in domestic activity, in year-average terms employment is forecast to grow by 43⁄4 per cent in 2021–22—its strongest rate in 15 years—followed by further solid growth of 3 per cent in 2022–23. |
| • | After falling to 41⁄2 per cent in 2021–22, the state’s unemployment rate is forecast to remain low across the rest of the forward estimates, between 4 and 41⁄4 per cent, as sustained employment growth and a pick-up in wages growth keep the participation rate elevated. |
32
Budget Strategy and Outlook 2022-23
| 2.1 | International conditions |
The global economy has undergone immense change since last year’s Budget, including a range of key factors impacting significantly on global economic conditions since the 2021–22 Budget Update in December 2021.
At the time of the 2021–22 Budget there were clear signs that the global economic recovery from COVID-19 had begun, with the ongoing rollout of vaccines and substantial fiscal and monetary stimulus programs supporting strong rebounds in sentiment and economic activity. The International Monetary Fund’s (IMF) latest estimate indicates global growth rebounded by 6.1 per cent in 2021, following the COVID-19 driven fall of 3.1 per cent in 2020.
Throughout 2021 it became evident that inflationary pressures were building in many advanced economies, with regions including the United States and Europe recording their highest annual inflation in more than 40 years. Strong demand, particularly for goods, combined with severe supply chain disruptions, contributed to elevated inflationary outcomes.
Russia’s invasion of Ukraine and ongoing impacts of COVID-19 in China, with several cities in China re-entering strict COVID-19 lockdowns, have exacerbated global supply chain disruptions, adding further upward pressure to global inflation. Russia’s and Ukraine’s positions as significant producers and exporters of various commodities, including crude oil, natural gas, coal, iron ore and wheat, have contributed to sharp global price rises for these commodities (Chart 2.1).
| Chart 2.1 | Commodity price growth (January 2020 to May 2022)1 |
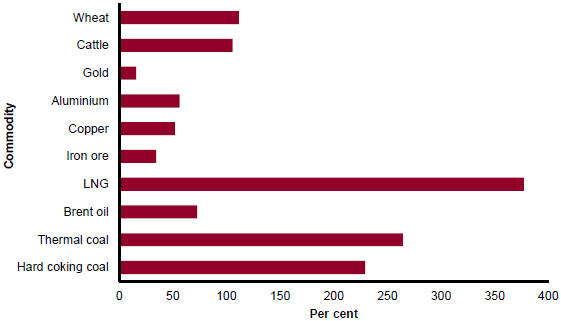
Note:
| 1. | Percentage change, in A$ terms. |
Sources: Refinitiv, Platts and Meat and Livestock Australia.
33
Budget Strategy and Outlook 2022-23
While these inflationary pressures were initially thought to be largely transitory in nature, it became increasingly evident that they had become more embedded in the global economy and central banks responded. As a result, there has been a global move to sharply raise interest rates, with many central banks beginning to normalise monetary policy from the historically low ‘emergency’ settings in place during the pandemic.
Reflecting the inflationary pressures and rising interest rates, along with Russia’s invasion of Ukraine and its subsequent spillover effects to broader economic activity, the IMF in April 2022 revised down its most recent forecasts for global growth to 3.6 per cent in both 2022 (down from 4.4 per cent) and 2023 (down from 3.8 per cent). Echoing similar sentiments as the IMF, more recently, the World Bank also downgraded its global growth outlook in 2022 (to 2.9 per cent, down from 4.1 per cent) and 2023 (to 3.0 per cent, down from 3.2 per cent).
In response to the strongest inflation in the country in more than 40 years, the rise in interest rates in the United States has been amongst the most aggressive. The United States 2 year Treasury bond yield has risen around 300 basis points since the beginning of September 2021, to be near its highest levels since 2007.
The IMF downgraded its forecast for United States Gross Domestic Product (GDP) growth by 0.3 percentage point in both 2022 and 2023, partly reflecting the expected impacts of higher interest rates. While employment and labour force participation in the United States have yet to return to pre-pandemic levels, the country’s labour market is very tight, with the unemployment rate having fallen to 3.6 per cent and job vacancies remaining at a near record high level.
In China, the IMF expect GDP growth to slow from 8.1 per cent in 2021 to 4.4 per cent in 2022 and 5.1 per cent in 2023, with growth in 2022 impacted by extended COVID-19 lockdowns in major cities including Shanghai and Beijing.
The IMF has also revised down the Euro area and United Kingdom’s (UK) GDP growth forecasts in 2022 by at least a full percentage point each, largely reflecting both jurisdictions’ heavy dependence on Russian energy. The war in Ukraine is expected to be a major drag on Euro area growth in 2022, while Russia and Ukraine’s economies are forecast to contract by 8.5 per cent and 35 per cent respectively in 2022.
The IMF forecast that India’s GDP growth will slow from 8.9 per cent in 2021 to 8.2 per cent in 2022 and 6.9 per cent in 2023. These moderations in part reflect weaker domestic demand due to higher oil prices weighing on private consumption and investment.
Aggregate GDP growth of Queensland’s major trading partners (4.2 per cent in 2022 and 4.3 per cent in 2023) is expected to be slightly stronger than the global average. This primarily reflects key trading partners such as China and India (which combined represented around 38 per cent of Queensland’s merchandise exports in 2020–21) both being expected to record stronger economic growth across 2022 and 2023 than the global average.
However, there are substantial risks to the global economic outlook, largely centred around the resolution of the conflict in Ukraine (and related sanctions) as well as global central banks’ ability to curtail some of the strongest inflation outcomes in decades. The impact on global demand from an aggressive and synchronised rise in global interest rates is a risk to the medium-term outlook.
34
Budget Strategy and Outlook 2022-23
Additionally, there remains ongoing risks associated with the COVID-19 pandemic. In particular, the recent lockdowns of major cities in China highlight the ongoing risks to health and economic activity, as well as flow-on impacts to global supply chains. Despite China’s restrictions on the importation of Australian coal and other commodities, China remained Queensland’s largest goods export market in 2020–21, representing 24 per cent of total merchandise exports.
| 2.2 | National conditions |
The Australian economy rebounded by 4.8 per cent in 2021 following the 2.2 per cent decline in GDP in 2020 as a result of the COVID-19 pandemic. Australia’s economy has performed well since the onset of the pandemic compared with most other countries, supported by the relative success in containing outbreaks of the virus, significant fiscal and monetary policy support, and more recently, elevated commodity prices.
Strong rebounds in household consumption and dwelling investment were the main contributors to the rebound in Australia’s economic growth in 2021. Substantial fiscal and monetary stimulus, including national and state level support enabling employers and employees to remain engaged throughout the pandemic, assisted the rebound in consumption.
In the dwelling sector, investment in alterations and additions was particularly strong, rising 17.8 per cent in 2021 to a record level. The pandemic driven increase in work-from-home arrangements, combined with the inability to travel overseas and record low interest rates, resulted in many Australians choosing to invest substantially in their own homes.
The economic recovery is continuing in 2022, with GDP up a further 0.8 per cent in March quarter 2022. This recovery has been underpinned by high vaccination rates, accumulated savings throughout the pandemic, increased wealth due to higher housing and equity prices, record amounts of construction work in the pipeline and a strong labour market.
The national labour market has proved resilient throughout the pandemic. The unemployment rate has averaged 3.9 per cent in the 3 months to May 2022, its lowest level since the inception of the monthly series in 1978, while employment has surged to beyond its pre-COVID level and the participation rate is at a record high.
However, the pace of recovery in the labour market has differed across states and territories. Stronger health outcomes and rising commodity prices have seen employment in Queensland and Western Australia in May 2022 increase 206,000 persons and 94,200 persons respectively since March 2020, combining for 59 per cent of nation-wide employment growth over the period.
In contrast, the extended lockdowns enforced in New South Wales and Victoria throughout September quarter 2021 hindered the recoveries in those states, with employment up 134,000 and 72,600 persons respectively since March 2020.
Similar to other advanced economies, Australia experienced a build-up of inflationary pressures throughout 2021. Australia’s annual headline consumer inflation rose to 5.1 per cent in March quarter 2022, the highest rate since 1995, excluding the impact of the introduction of the goods and services tax (GST) in 2000–01.
35
Budget Strategy and Outlook 2022-23
The stronger than anticipated inflation outcomes have brought forward the timing and number of expected cash rate increases in the second half of 2022 and throughout 2023. The capacity of Australian households to absorb the impact of higher interest rates, given the currently elevated levels of household debt, provides near-term uncertainty for the national economic outlook.
| 2.3 | Key assumptions |
Key assumptions underpinning the economic forecasts include:
| • | the RBA to continue its monetary policy normalisation over the course of 2022 and 2023 |
| • | the A$ exchange rate to move toward its assumed medium-term anchor of around US$0.75 |
| • | Brent oil prices to remain elevated in 2022 but ease towards US$75 per barrel by the end of 2024 |
| • | the Brisbane residential property price cycle to peak in June quarter 2022 and ease over the following 2 years, before growing again toward the end of the forward estimates |
| • | according to the Bureau of Meteorology, the present La Niña weather pattern, which is resulting in substantial rainfall across eastern Australia, is expected to fade by early winter. Thereafter, average seasonal rainfall is assumed for the remainder of the 2022 and 2023 seasons |
| • | Queensland Health will continue to prioritise management of the COVID-19 pandemic as well as the transition to the endemic phase, with a focus on progressive resumption to planned care, responding to strong demand for services and a return to pre-pandemic access to services |
| • | in line with 2022–23 Federal Budget assumptions, Australia’s international borders are expected to remain open to migrants and fully vaccinated tourists. This is expected to support further recovery in population growth, boost overseas tourism and education exports, and assist in filling skills gaps, but also increase tourism imports as Queenslanders return to overseas travel. |
| 2.4 | Queensland conditions and outlook |
At the time of the 2021–22 Budget Update in December 2021, the state’s economy and labour market were in a strong position and had outperformed the rest of the nation, underpinned by strong growth in household spending and dwelling investment.
In December quarter 2021, Queensland’s domestic economy, as measured by state final demand, was 6.9 per cent higher than its pre-pandemic level in March quarter 2020, much stronger than the 5.1 per cent increase in the rest of Australia. In addition, employment in Queensland in December 2021 was more than 128,400 persons higher than pre-COVID levels and the unemployment rate had fallen to 4.6 per cent, the lowest in almost 13 years.
36
Budget Strategy and Outlook 2022-23
Since then, surges in Omicron variant cases in early 2022, major flooding in South East Queensland, and the Russian invasion of Ukraine and subsequent global sanctions have all impacted the supply side of the economy and further exacerbated the inflationary pressures that were emerging in the latter half of 2021.
The Omicron outbreaks in early 2022 impacted activity and the Queensland economy differently from previous COVID-19 outbreaks, with widespread initial impacts on labour supply feeding into some supply chain disruptions. However, Queensland’s overall domestic economic activity still rose in March quarter 2022, to be 7.8 per cent higher than the pre-pandemic level, and maintained its stronger performance compared with the major southern states during the COVID-19 crisis (Chart 2.2).
| Chart 2.2 | Growth in state/domestic final demand1 |
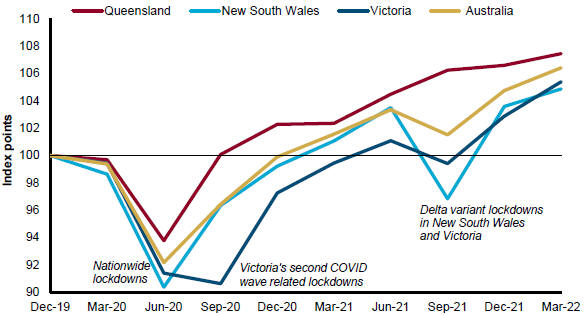
Note:
| 1. | Seasonally adjusted, chain volume measure, index points, December quarter 2019 = 100. |
Source: ABS National Accounts.
The overall economic impact of the floods in February/March 2022 is expected to be relatively limited compared with some previous major natural disasters in Queensland, as key mining and agriculture regions outside of South East Queensland were largely unaffected. Queensland Treasury estimates the impact on economic output in 2021–22 to likely be around $1 billion, or 1⁄4 percentage point of Queensland’s GSP (see Box 2.1).
The impacts of the Russian invasion of Ukraine and associated sanctions are still evolving and remain highly uncertain. As a commodity exporter sharing several key markets with Russia, Queensland is expected to initially benefit from the higher commodity prices, which should support domestic income and spending. However, the broader impacts of any lower global growth induced by the conflict will likely have negative implications for the Queensland economy over the medium to longer term.
37
Budget Strategy and Outlook 2022-23
Offsetting some of the negative impacts of these major developments on the Queensland economy has been the high level of net interstate migration to Queensland, which is supporting overall population growth. In net terms, more than 40,000 people moved from interstate to Queensland over the year to September quarter 2021, a period which included the Delta variant lockdowns in New South Wales and Victoria. This momentum is expected to have carried through to the final quarter of 2021.
In addition, with the reopening of the international border, net overseas migration is expected to gradually recover in 2022 and 2023 and support activity, including by increasing labour supply in the context of the current tight labour market.
This population growth has supported jobs growth in the state. May 2022 Labour Force data showed that employment in Queensland had grown a further 77,700 persons in the first 5 months of 2022, taking the total increase in employment since pre-COVID March 2020 to 206,000 persons. The unemployment rate had fallen from a pre-COVID rate of 5.8 per cent to 4.0 per cent in May, at the same time as the state’s participation rate had increased from 65.5 per cent to 67.2 per cent.
On balance, after rising 2.0 per cent in 2020–21, the Queensland economy is now forecast to grow by a further 3 per cent in 2021–22, slightly slower than the 31⁄4 per cent expected at the time of the 2021–22 Budget Update, reflecting the combined impacts of the 3 major shocks experienced in the first half of 2022.
Further solid growth of 23⁄4 per cent is forecast for 2022–23 as the dwelling construction boom regains momentum and overseas services exports rebound from the impacts of the pandemic and related travel restrictions of the past 2 years.
Queensland’s GSP growth is then expected to average 23⁄4 per cent per annum over the remainder of the forward estimates, driven mainly by continued growth in the domestic economy.
Consistent with this ongoing robust growth in domestic activity, in year-average terms employment is forecast to grow by 43⁄4 per cent in 2021–22 and 3 per cent in 2022–23. Employment growth is expected to ease to around 11⁄2 per cent per annum later in the forward estimates, as the state’s dwelling construction cycle matures.
After falling to 41⁄2 per cent in 2021–22, the state’s unemployment rate is forecast to remain low across the remainder of the forward estimates, between 4 and 41⁄4 per cent, as sustained employment growth and a pick-up in wages growth keep the participation rate elevated at an estimated 661⁄2 per cent in 2021–22, and 663⁄4 per cent in both 2022–23 and 2023–24.
Reflecting higher housing costs, global oil prices and ongoing supply chain disruptions, consumer price inflation in Brisbane is forecast to remain elevated in the medium term, averaging 51⁄4 per cent in 2021–22 and 33⁄4 per cent in 2022–23, before returning to within the RBA’s target band for national inflation of 2 to 3 per cent over the remainder of the forward estimates.
38
Budget Strategy and Outlook 2022-23
| Table 2.1 | Queensland economic forecasts/projections1 |
| Actuals | Forecasts | Projections | ||||||||||||||||||||||
| 2020–21 | 2021–22 | 2022–23 | 2023–24 | 2024–25 | 2025–26 | |||||||||||||||||||
Gross state product2 | 2.0 | 3 | 23⁄4 | 23⁄4 | 23⁄4 | 23⁄4 | ||||||||||||||||||
Employment3 | 2.4 | 43⁄4 | 3 | 11⁄2 | 11⁄2 | 11⁄2 | ||||||||||||||||||
Unemployment rate4 | 6.8 | 41⁄2 | 4 | 41⁄4 | 41⁄4 | 41⁄4 | ||||||||||||||||||
Inflation5 | 2.1 | 51⁄4 | 33⁄4 | 21⁄2 | 21⁄2 | 21⁄2 | ||||||||||||||||||
Wage Price Index | 1.6 | 21⁄2 | 31⁄2 | 31⁄2 | 31⁄2 | 31⁄2 | ||||||||||||||||||
Population | 1.0 | 11⁄4 | 11⁄2 | 11⁄2 | 11⁄2 | 11⁄2 | ||||||||||||||||||
Notes:
| 1. | Unless otherwise stated, all figures are annual percentage changes. |
| 2. | Chain volume measure (CVM), 2019–20 reference year. |
| 3. | Comparable through the year seasonally adjusted employment growth rates to the June quarter are 9.9 per cent, 41⁄4 per cent, 11⁄4 per cent, 2 per cent, 11⁄2 per cent and 11⁄2 per cent, from June quarter 2021 to June quarter 2026 respectively. |
| 4. | Per cent, year-average. |
| 5. | Brisbane, per cent, year-average. |
Sources: ABS Annual State Accounts, National, State and Territory Population, Labour Force, Wage Price Index, Consumer Price Index, and Queensland Treasury.
| Box 2.1 | Economic impacts of the SEQ floods |
Intense weather events, particularly floods and cyclones, are, unfortunately, an integral part of the Queensland climate. In addition to the potential for tragic loss of life, these events can cause substantial damage to private property and public infrastructure, as well as considerable losses to economic output, including substantial impacts on mining and agricultural production in some cases.
The severe flooding events experienced across the South East corner of the state in late February and early March of 2022 resulted in substantial damage to assets and infrastructure such as roads, business premises and residential property.
However, since this event mainly occurred in South East Queensland, its impact on the state’s mining sector has been minimal. In addition, while the Wide Bay and Lockyer Valley regions saw substantial impacts on their agriculture and horticulture sectors, the overall impact in these industries has not been as significant to the statewide economy as seen in some previous disasters.
The impacts on overall economic output (as measured by GSP) from this latest event is estimated to be substantially less than for some other major natural disasters over recent decades. The impact on economic output in 2021–22 is estimated to be approximately $1 billion, or around 1⁄4 percentage point of Queensland’s GSP.
39
Budget Strategy and Outlook 2022-23
In addition to agriculture, other key sectors impacted in the regions include construction, tourism (including accommodation and hospitality) and a wide range of other services industries, such as wholesale trade, retail trade, transport and sectors related to recreational and entertainment activities. In some cases, this lost economic activity will likely be partly recouped over time as people defer their expenditure. In other key sectors, such as agriculture and tourism, this is likely to be more of a permanent loss of economic output.
In comparison, the 2010–11 floods and Severe Tropical Cyclone Yasi resulted in flooded coal mines, extensive damage to rail transport and port operations, reduction in sugar, horticulture, and other crop harvests, as well as severely impacting tourism across the state. That event significantly reduced economic output, estimated at the time to be equal to around 21⁄4 percentage points of GSP.
Similarly, the impact of Severe Tropical Cyclone Debbie, which saw coal rail lines shut for an extended period and major damage to tourism infrastructure in the Whitsundays, was estimated to be around 3⁄4 percentage point of GSP, spread across 2016–17 and 2017–18.
Financial impacts of the 2022 floods on the 2022–23 Queensland Budget, including the costs to rebuild damaged roads and local government infrastructure, as well as assisting individuals, families and businesses impacted by the disasters, are addressed in Chapter 3.
| 2.4.1 | Household consumption |
Following the nationwide lockdowns in 2020, a combination of factors, such as strong labour market conditions, substantial government stimulus and acceleration in asset prices, placed household balance sheets in a strong position and elevated savings. As shown by Chart 2.3, these improvements in household income and wealth led real household consumption in Queensland to generally strengthen over this period, and by the end of 2021 was 6.8 per cent above pre-pandemic levels.
The Omicron variant outbreaks in early 2022 and related supply chain disruptions, as well as rising inflationary pressures and temporary impacts from the severe flooding events in South East Queensland, weighed on household spending intentions and constrained consumption growth in March quarter 2022. However, strong outcomes in the first half of 2021–22 are still expected to lead to year-average growth of around 31⁄4 per cent in that year.
Since the start of the pandemic, there has been a shift towards increased spending on some discretionary items such as recreation, clothing and footwear, and household furnishings and equipment, while border closures and virus restrictions had severely reduced Queenslander’s spending on transport services. The recent reopening of the international borders, which will allow Queenslanders to again travel and spend overseas, is expected to result in a re-adjustment of the composition of expenditure seen during the COVID-19 crisis over the rest of 2022 and into 2023.
Driven by sustained growth in labour income, a lagged impact of the terms of trade boom, a pick-up in population growth and further strong growth in dwelling construction, real consumption growth in Queensland is expected to remain solid at around 23⁄4 per cent in 2022–23.
As monetary policy tightens and the dwelling construction cycle matures, consumption growth is expected ease to around 21⁄4 per cent in 2023–24.
40
Budget Strategy and Outlook 2022-23
| Chart 2.3 | Queensland’s1 key household income indicators (labour income2, share prices3, dwelling prices4) and household consumption5 |
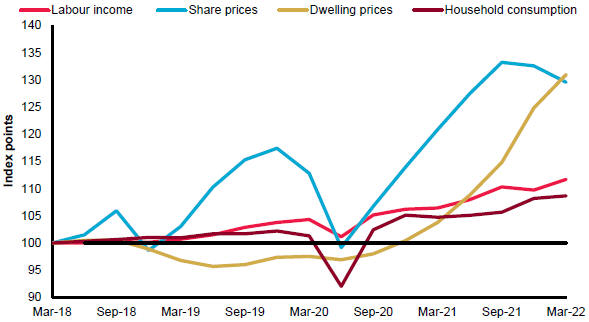
Notes:
| 1. | Index points, March quarter 2018 = 100. |
| 2. | Seasonally adjusted nominal compensation of employees deflated by the household consumption deflator. |
| 3. | ASX200 Accumulation Index deflated by the household consumption deflator. |
| 4. | ABS Residential Property Price Index, Brisbane, deflated by the household consumption deflator. |
| 5. | Chain volume measure, quarterly, seasonally adjusted. |
Sources: ABS National Accounts, Residential Property Price Indexes and Refinitiv.
| 2.4.2 | Dwelling investment |
Dwelling investment rebounded strongly from the pandemic-induced low during the nationwide lockdowns in June quarter 2020, rising 30.6 per cent over the year to June quarter 2021. The boom in dwelling investment was evenly split between the construction of new dwellings and renovation activity.
Renovation activity in Queensland has more than doubled to record levels since 2013, with households having preferred to improve existing homes rather than build new homes. In 2015 and 2016, renovation activity accounted for around one third of dwelling investment in Queensland. However, more recently in 2020 and 2021, renovation activity has risen to almost half of all dwelling investment, just below new and used construction.
41
Budget Strategy and Outlook 2022-23
The combination of record low interest rates, indications by the RBA that rates would remain low for an extended period and generous government incentives underpinned the boom in dwelling investment. Measures such as the Queensland Government’s reaffirmed commitment to the $15,000 First Home Owners’ Grant program and the $5,000 Regional Home Building Boost Grant, along with the Australian Government’s First Home Loan Deposit Scheme and HomeBuilder Grant (which ended in March 2021), underpinned strong growth in residential construction and continue to support activity.
Reflecting this strong demand, there was a record $10.6 billion of residential work in the pipeline in December quarter 2021, easily eclipsing the previous record in 2016 during the inner-city apartment boom in Brisbane (Chart 2.4). However, despite the record amount of work in the pipeline, dwelling investment fell in December quarter 2021 and March quarter 2022 (although remains elevated). This suggests that prevailing labour and material shortages, along with the recent severe flooding in South East Queensland, have partially constrained construction output in the near term.
Dwelling investment in Queensland is expected to grow strongly, by 10 per cent in 2021–22, with pandemic-related supply chain issues pushing a substantial portion of work in the pipeline into 2022–23, where dwelling investment is expected to grow a further 10 per cent. As the current backlog of work is completed, the anticipated further interest rate increases are expected to begin tempering dwelling construction activity from 2023–24 onwards.
| Chart 2.4 | Queensland’s dwelling investment1 and residential work in the pipeline2 |
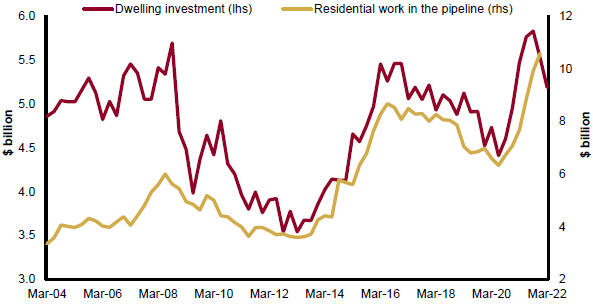
Notes:
| 1. | Quarterly, chain volume measures, seasonally adjusted. |
| 2. | Quarterly, nominal, original. December quarter 2021 data the latest available. |
Sources: ABS National Accounts and Building Activity.
42
Budget Strategy and Outlook 2022-23
| Box 2.2 | Housing and rental market dynamics |
Population dynamics impacting the housing and rental markets
Despite the easing of overall population growth, strong net interstate migration and higher population growth in some key regions has contributed to the strength of activity in the housing and residential construction sector.
Exacerbating the housing market challenges, rental vacancy rates are at historic lows across many Queensland regions, with a similar phenomenon apparent nationally. The sharp decrease in the rental vacancy rate, along with strong house price growth, has seen rents also rise sharply across Australia and Queensland.
According to SQM Research, the residential rental vacancy rate in Brisbane dropped to 0.7 per cent in May 2022, the lowest in decades. The vacancy rate in Brisbane has been on a downward trend since the end of 2016. However, this trend accelerated during the COVID-19 pandemic.
These trends have also been consistent across most of Queensland’s key regions. As of May 2022, Cairns (0.5 per cent), Central Queensland (0.4 per cent), North Queensland (0.8 per cent), Southern Queensland (0.4 per cent), Sunshine Coast (0.6 per cent), Toowoomba (0.3 per cent) and the Gold Coast (various sub-regions between 0.6 per cent and 0.3 per cent) all had vacancy rates fall below one per cent.
During the pandemic, growth in the rental stock in Brisbane slowed significantly before declining, which along with continued population growth, caused rental vacancies to fall sharply. A recent speech by Luci Ellis, an Assistant Governor of the Reserve Bank, highlighted survey data which showed that the average household size has fallen since the pandemic began. This is likely to be a key factor driving the very low rental vacancy rates across Queensland.
There are several hypotheses which may explain how the pandemic has lowered the average household size and consequently increased demand for rentals and decreased the supply of rental stock. These potential factors include (but are not limited to);
| • | The surge in first home buyers during the pandemic (partially driven by a switching of expenditure to housing due to reduced travel, etc.) would have seen a larger than normal number of young people formerly living with their parents moving into their own homes, potentially turning rental stock into an owner-occupier dwelling without an offsetting reduction in rental demand. |
| • | Lockdowns, restrictions and increased working from home arrangements greatly increased the amount of time people spent at home and, therefore, the desire for more space at home. For example, people may have turned a spare bedroom or granny flat into an office instead of renting it out, reducing rental stock without reducing rental demand. |
43
Budget Strategy and Outlook 2022-23
| • | People living or renting with others (share houses) may wish to be less crowded due a range of reasons including COVID-19 health concerns or the need to establish effective working from home arrangements in their dwellings. This is likely to have incentivised renters to reduce the number of people in their share house, or people to move into larger or separate dwellings. Recent survey data from the RBA shows a sharp decline during the pandemic in the proportion of Australian households which are share houses. |
| • | Additionally, the substantial take-up of HomeBuilder resulted in large scale renovations on family homes, some of which may have required people to move out of their homes into rentals while renovations progress, increasing demand for rentals without an offsetting increase in supply of rental stock. |
Data from the 2021 Census of Population and Housing, due to be released by the ABS from late June 2022 onwards, will provide useful insights on the specific changes in housing formation and the factors influencing these trends.
| 2.4.3 | Business investment |
The onset of the COVID-19 pandemic saw an initial sharp decline in business investment in Queensland, falling by 10.3 per cent during the year to March quarter 2021. Since then, the general trend in business investment has been upward, with an increase of 10.7 per cent in the year to March quarter 2022. This recovery was supported by strong levels of business confidence and low interest rates.
While business confidence has fallen from the exceptionally high levels of a year ago, it remains well above its long-run average level, while profitability and capacity utilisation remain strong.
Engineering construction, which primarily involves longer-term projects, held up well during the past 2 years and a considerable pipeline of committed work is yet to be done. Survey measures of business investment intentions have been revised higher while other leading indicators such as non-residential building approvals also remain strong. Finally, the prevailing tight labour market may also encourage firms to substitute capital for labour.
Underpinned by these factors and in line with the ongoing global and national recovery from the COVID-19 crisis, business investment is expected to continue to grow over the forecast horizon, despite the expected increases in interest rates.
| 2.4.4 | Public final demand |
Public final demand has grown strongly in recent years, averaging 4.8 per cent growth over the 6 years to 2020–21. In addition to the Queensland Government’s substantial response to the COVID-19 pandemic, public final demand growth has been supported by a range of initiatives, including the National Disability Insurance Scheme, the NBN, substantial investment in roads and the Cross River Rail project.
State and local general government investment has made a significant contribution to the domestic economy since the start of the pandemic, rising by 7.7 per cent over the 2 years to March quarter 2022.
44
Budget Strategy and Outlook 2022-23
Growth in public final demand is expected to remain solid in 2021–22, driven by the construction of the Cross River Rail project and the ongoing rollout of spending measures implemented in response to COVID-19 to help support and stimulate the Queensland economy.
The 2022–23 Budget continues the commitment, consistent with the government’s economic strategy, to provide the support, investment and reform needed to drive the transition from recovery to sustainable strong economic growth across the state.
The government’s statewide response to COVID-19 provided $15.2 billion in support to businesses, workers and communities, while the $59.126 billion 4-year capital program outlined in this Budget will continue the essential productivity-enhancing economic and social infrastructure required to support ongoing growth and job creation.
| 2.4.5 | Overseas exports and imports |
Queensland’s exports of goods and services are estimated to have grown by 3⁄4 per cent in real terms in 2021–22, driven by a strong rebound in agricultural exports. Exports of goods and services are forecast to grow by 4 per cent in both 2022–23 and 2023–24, as international tourism and education exports recover from the COVID-19 induced lows.
Queensland’s imports of goods and services are estimated to grow by 6 per cent in 2021–22, as the strong domestic economy encouraged goods imports. Overseas imports are forecast to grow strongly in both 2022–23 and 2023–24, as Queenslanders return towards pre-COVID levels of international travel.
Although real exports are estimated to rise modestly in 2021–22, nominal exports are expected to almost double to over $125 billion, supported by record high coal prices, elevated prices for oil (with LNG contract prices linked to oil prices), and strong growth in nominal metals and beef exports. The strong growth in nominal exports is expected to flow through to strong income growth in 2021–22, supporting domestic activity. As prices moderate, nominal exports are expected to moderate over the forward estimates but remain above 2019–20 levels.
Coal
Queensland’s coal export volumes have held up well despite restrictions on Chinese coal imports from October 2020. By November 2021, almost 90 per cent of the reduction in Queensland export tonnages to China had been offset by increased exports to other countries, including India (up 17.2 million tonnes (Mt) to 58.1 Mt), Japan (up 11.5 Mt to 47.8 Mt) and South Korea (up 8.9 Mt to 32.7 Mt).
Sustained exceptionally high prices for both metallurgical and thermal coal in late 2021, and so far in 2022, have tempered demand for coal, causing export tonnages to fall between December 2021 and April 2022 by 7.9 Mt (or 9.4 per cent) compared with the same period a year earlier.
Despite this easing in export tonnages, the value of Queensland overseas coal exports has more than doubled over the past year, to $52.3 billion in the 12 months to April 2022. This has been driven by substantial increases in the prices for all 3 major types of coal, which are all near historic highs. Global supply issues due to COVID-19, and more recently Russia’s invasion of Ukraine, combined with recovering global demand have resulted in the record price spike.
45
Budget Strategy and Outlook 2022-23
Since September 2021, the spot price for benchmark premium hard coking coal has averaged around US$432 per tonne, well above the historical average of around US$150 per tonne across the 7 years prior to the onset of COVID-19. Similarly, the spot price for benchmark thermal coal since September 2021 has averaged around US$159 per tonne, compared with the pre-COVID historical average of around US$60 per tonne.
As a result of the sustained higher prices in recent months, combined with some supply disruptions due to Omicron in early 2022, Queensland’s coal export volumes are estimated to have fallen by 33⁄4 per cent in 2021–22 (Chart 2.5). As coal prices return to more sustainable levels, Queensland’s coal exports are forecast to recover modestly in 2022–23 (up by 3⁄4 per cent) and then grow more strongly in 2023–24 (up by 61⁄2 per cent).
Restrictions on Chinese coal imports are assumed to remain in place over the forecast period. However, as noted above, Queensland’s coal exporters have been successful in finding alternative markets and have benefitted substantially from surging prices.
Looking further ahead, the volume of Queensland’s coal exports is projected to continue to grow solidly in 2024–25 and 2025–26, especially hard coking coal, supported by continued industrial production growth in emerging markets.
| Chart 2.5 | Queensland coal exports1 |
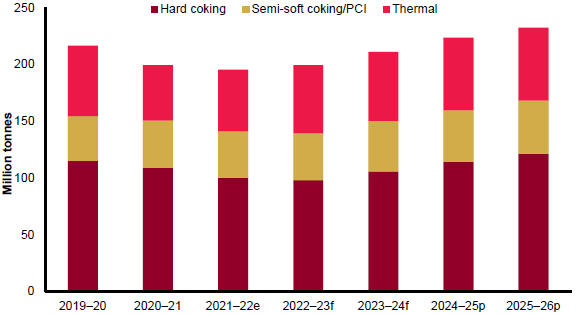
| 1. | 2019–20 and 2020–21 are actuals; 2021–22 is estimated actual. |
Sources: Unpublished ABS trade data and Queensland Treasury.
LNG
The volume of Queensland’s LNG exports is estimated to grow by a further 31⁄4 per cent to 23.7 million tonnes in 2021–22, as another colder than expected winter in the northern hemisphere boosted demand for gas.
46
Budget Strategy and Outlook 2022-23
The majority of Queensland’s LNG exports are sold under long-term contracts linked to global oil prices, with several months lag. Global oil prices rebounded throughout 2021 as the unwinding of global production cuts was outpaced by a faster than anticipated recovery in global oil consumption. As a result, the prices for Queensland’s LNG exports have rebounded sharply, which is expected to nearly double the value of LNG exports in 2021–22.
The Russian invasion of Ukraine sparked concerns about an oil supply shortfall in the market, which saw the Brent crude oil price rise above US$100 per barrel in February and peak at nearly US$140 per barrel in early March 2022. While numerous moves by the United States to boost global oil supply appear to have helped reduce market concerns to a degree, oil prices remain elevated above US$100 per barrel throughout April to June, which will push the value of LNG exports even higher in 2022–23.
Queensland’s record LNG export volumes are expected to moderate only slightly in 2022–23, as sanctions on Russian gas exports cause the US to divert cargos from Asia to supply the tight European gas market, which in turn will tighten supply in Asia and maintain strong demand for Queensland’s LNG.
Metals
The impact of COVID-19 on Queensland industrial metals production was minimal, although miners benefited from higher prices, and export volumes are forecast to be relatively stable across the forecast period. After modest growth in 2020–21, Queensland’s metals exports are estimated to have fallen by 11⁄4 per cent in 2021–22, driven by a decline in exports of lead (down by 111⁄4 per cent) and zinc (down by 6 per cent), more than offsetting an increase in copper exports (up by 5 per cent).
A rebound in zinc exports (up by 71⁄4 per cent) and a modest recovery in aluminium (including bauxite and alumina) exports (up by 21⁄2 per cent) are forecast to drive growth in metals exports by 21⁄4 per cent in 2022–23.
Metals exports are then forecast to be relatively flat over 2023–24 and 2024–25.
Agriculture
The volume of agriculture exports fell by around 7 per cent in 2020–21, driven by a sharp decline in beef exports, as improved rainfall encouraged producers to retain stock for breeding purposes. This follows dry conditions in previous years that had incentivised high production and depleted herd numbers. Reflecting the improved growing conditions, agriculture exports in Queensland are expected to return to growth in 2021–22, driven by cotton and other crop exports.
Beef exports are expected to grow modestly in 2021–22, as re-stocking and feeder demand at the saleyards contribute to record high domestic cattle prices, thereby making export prices relatively less competitive. Queensland beef production is likely to rebound in 2022, as new stock from spring 2020 and autumn 2021 reach processor weights, while processing rates are expected to remain steady due to some improvement in rainfall across key supply regions.
47
Budget Strategy and Outlook 2022-23
There is continued strong interest in Australian beef internationally, and with improving supply of processor-ready cattle, exports of beef are expected to grow modestly over the medium term. Australian beef will also enjoy greater access to the high value export market in the UK, following signing of the Australia-United Kingdom Free Trade Agreement in 2021.
Queensland cotton exports are expected to increase significantly in 2021–22, driven by high global prices and with favourable growing conditions resulting in a substantial increase in the area of cotton planted. Cotton exports are forecast to remain elevated in 2022–23, as the La Niña weather system, which delivered above average rainfall in cropping regions, sustains strong production.
Supply constraints in key sugar producing countries such as Brazil have led to elevated international prices and a reduction in global sugar stocks. Queensland’s sugar exports are forecast to grow by 51⁄4 per cent in 2022–23, in response to these elevated global prices. Exports are expected to decline slightly in the following years as global prices moderate.
Services exports
The closure of international borders in early 2020 resulted in a collapse in international tourist and student arrivals, with overall services exports falling by $6.4 billion (43.7 per cent or equating to 1.8 per cent of GSP) during 2020.
The impact on overseas tourism spending was immediate, with a decline of $4 billion (79 per cent) during 2020. The impact on spending by international students was more gradual (down by $1.2 billion or 21.2 per cent) as many students were already in Australia and able to continue their studies.
The reopening of international borders should lead to a reversal of these trends over time. However, the recovery is expected to be gradual over the forecast horizon, as it will take some time for confidence to return to the international tourism market and for international transport capacity to recover.
Short-term international arrivals have increased substantially since late 2021 as the international border has reopened. In the 4 months to April 2022 however, international arrivals to Queensland had only recovered to 15.5 per cent of their pre-COVID levels during the same period in 2019. While it is expected the inflow of new international students will recover relatively rapidly, after several years of no inflows, it will take some time for total overall enrolments to return to pre-COVID trend levels.
Imports
Overseas goods imports rebounded strongly in 2020–21, driven by the significant rebound in economic activity following the easing of COVID-19 restrictions. This growth is expected to continue in the coming years, in line with solid domestic activity.
48
Budget Strategy and Outlook 2022-23
However, overseas services imports remained significantly constrained by the pandemic, with international travel bans in place for most of 2020 and 2021 preventing most Australians from travelling abroad. Ahead of the pandemic, spending by Queenslanders abroad on personal (non-education) travel totalled $8.5 billion in 2019. This fell to only $1.7 billion in 2020, a decline of $6.8 billion or 80.1 per cent.
In year-average terms, Queensland’s overseas imports (goods and services) are forecast to rise by 6 per cent in 2021–22 and 12 per cent in 2022–23 as overseas travel begins ramping back up to pre-pandemic levels.
| 2.4.6 | Labour market |
Queensland’s labour market has continued to perform exceptionally in the recovery from the COVID-19 crisis but this has also resulted in a very tight labour market throughout 2021–22. The job vacancy rate (the number of job vacancies as a proportion of the labour force) rose to a record high of 2.7 per cent in March quarter 2022, while the employment to population ratio reached 64.5 per cent in May 2022, its highest level since early 2009.
The unemployment rate has fallen to 4.0 per cent in May 2022, as it had in March 2022, to be at its lowest level since December 2008.
Driven by the state’s strong recovery from the COVID-19 induced downturn in mid-2020, employment in May 2022 was 206,000 persons (8.0 per cent) above its pre-COVID level of March 2020, the largest rise of any state or territory.
This strong jobs recovery has also benefitted the youth (15-24 years) labour market, driving the year-average youth unemployment rate down from 14.5 per cent in March 2020 to 10.1 per cent in May 2022, its lowest since September 2009.
In addition, the spread of the Omicron variant in early 2022 resulted in the proportion of people working fewer hours than usual due to ‘illness or injury or sick leave’ rising to 6.1 per cent in January 2022 and remaining materially higher than the 5-year pre-COVID average (of around 3.0 per cent) in February to May 2022. This exacerbated the labour supply issues already being felt across the state.
The severe flooding in South East Queensland and the Darling Downs in late February/early March further reduced available labour supply in the first 2 weeks of March. In March, there were 280,700 persons in Queensland who worked fewer hours than usual due to ‘bad weather or plant breakdown’, equating to 10.3 per cent of total employment in the month.
In comparison, during the previous significant flooding event in January 2011, 9.3 per cent of employed persons in Queensland worked fewer hours than usual due to ‘bad weather or plant breakdown’. Hours worked recovered strongly in April and May, rising by 3.3 and 2.3 per cent, to be 3.9 per cent above the pre-flood level in February 2022.
Strong jobs growth so far in 2021–22 is expected to result in year-average employment growth of 43⁄4 per cent (Queensland’s strongest employment growth since 2006–07), before growth moderates somewhat to 3 per cent in 2022–23. Beyond 2022–23, as the economy returns to more sustainable growth rates, employment growth is expected to move broadly in line with population growth, at 11⁄2 per cent per annum through to 2025–26 (Chart 2.6).
49
Budget Strategy and Outlook 2022-23
This strong employment growth is expected to see Queensland’s participation rate rise from an estimated 661⁄2 per cent in 2021–22 to 663⁄4 per cent in both 2022–23 and 2023–24. The participation rate is then expected to moderate slightly to 661⁄2 per cent in 2024–25 and 2025–26.
Queensland’s exceptional employment growth and tight labour market has pushed the unemployment rate down to an estimated 41⁄2 per cent in 2021–22. The unemployment rate is forecast to fall further in 2022–23, averaging 4 per cent across the year, which would be Queensland’s lowest year-average unemployment rate since 2007–08. In 2023–24, as employment grows broadly in line with population, the unemployment rate is forecast to increase slightly to 41⁄4 per cent and remain at that level in 2024–25 and 2025–26.
| Chart 2.6 | Employment growth and unemployment rate, Queensland1 |
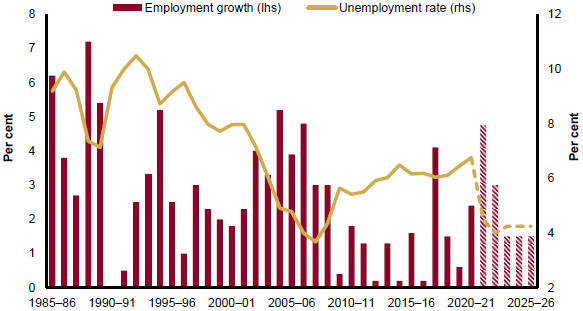
Note:
| 1. | Original, year-average. 2021–22 is estimated actual; 2022–23 and 2023–24 are forecasts; and 2024–25 and 2025–26 are projections. |
Sources: ABS Labour Force and Queensland Treasury.
Regional labour markets
Employment in many regions of the state has rebounded strongly since the COVID-19 pandemic.
Employment in South East Queensland has risen 7.0 per cent in the year ended April 2022, led by the Gold Coast (up 35,600 persons, or 10.6 per cent), supported by elevated internal migration and construction activity.
Moreton Bay – North (up 11.3 per cent), Logan–Beaudesert (up 10.5 per cent), Moreton Bay – South (up 6.0 per cent), Ipswich (up 5.7 per cent) and the Sunshine Coast (up 4.7 per cent) also recorded strong employment growth during the period.
50
Budget Strategy and Outlook 2022-23
Meanwhile, Queensland’s regions have also generally recovered well from the COVID-19 pandemic, with key sectors supported by high commodity prices, solid domestic tourism, improved rainfall and the strong dwelling sector.
Employment in regional Queensland grew 1.9 per cent in the year ended April 2022, with Townsville (up 8.8 per cent) and Cairns (up 5.6 per cent) recording the strongest employment growth.
The average unemployment rate across regional Queensland fell 2.1 percentage points to 5.1 per cent in the year to April 2022.
The average regional unemployment rate in the year ended March 2022 of 5.0 per cent was regional Queensland’s lowest unemployment rate since mid-2009, with Cairns (4.4 per cent), Townsville (3.2 per cent) and Wide Bay (6.7 per cent) all recording their lowest unemployment rates in more than a decade in March or April 2022.
Further, the resources-rich Mackay–Isaac–Whitsunday region recorded the lowest unemployment rate in the state, at only 2.4 per cent in April 2022.
| Box 2.3 | Participation and unemployment rate trends |
The decision to seek work and therefore participate in the labour force is strongly influenced by the likelihood of finding employment. Reflecting the “encouraged worker effect”, robust employment growth can lead to a higher participation rate, as prevailing labour market conditions make potential workers more confident of securing work.
A key driver of high labour force growth is population growth, including net interstate and overseas migration. Historically, periods of strong employment growth have coincided with high migration, as interstate and overseas residents relocate to Queensland to pursue better employment opportunities.
As a result, periods of strong jobs growth in Queensland do not always translate directly into a falling unemployment rate. Instead, employment growth encourages rising participation, including via migration, with many new labour force participants not finding work immediately. Additionally, many new participants may be entering the labour market for the first time or may be re-entering the labour force after a long time.
The strong recovery in Queensland’s labour market from the initial COVID-19 shutdowns in early to mid-2020 has highlighted aspects of the encouraged worker effect. Over the 2 years between May 2020 and May 2022, employment in Queensland increased by 408,500 persons. At the same time, the participation rate increased by 5.6 percentage points, reflecting exceptionally strong growth in the labour force by 323,500 persons.
As a result, because the participation rate is now 1.7 percentage points higher than its pre-crisis level, the unemployment rate of 4.0 per cent in May 2022, while only marginally higher than the national average, is still slightly higher than some other states where employment growth and the increase in the participation rate has not been as strong.
51
Budget Strategy and Outlook 2022-23
Chart 2.7 highlights the extent to which labour force growth in Queensland has moved in line with employment growth over time, thereby tempering changes in the unemployment rate at times, despite strong jobs growth.
These trends highlight that the unemployment rate is an imperfect measure of labour market performance, and should be considered alongside other metrics, including employment growth and the participation rate.
| Chart 2.7 | Growth in Employment and the Labour Force, Queensland1 |
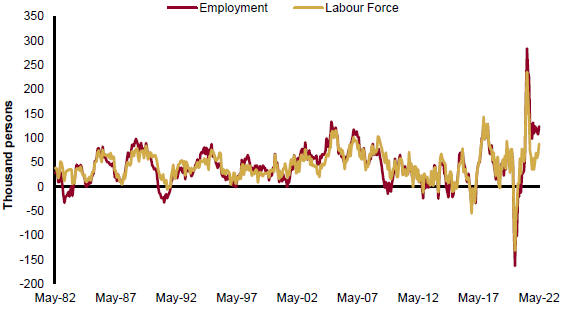
Note:
| 1. | Seasonally adjusted, Monthly, annual difference, thousand persons. |
Source: ABS Labour Force Survey
| 2.4.7 | Prices and wages |
Annual growth in Brisbane’s consumer price index (CPI) has been stronger than anticipated at the time of the 2021–22 Budget Update.
Brisbane’s CPI strengthened to 2.1 per cent in 2020–21, up from 1.2 per cent during the height of the COVID-19 pandemic in 2019–20, to record the strongest increase since 2013–14. However, inflationary pressures have continued to build in 2021–22, with CPI rising by 6.0 per cent over the year to March quarter 2022, the strongest annual increase since 2001, following the introduction of the GST.
52
Budget Strategy and Outlook 2022-23
While price increases have been broad-based, the acceleration in Brisbane’s annual CPI growth has been primarily driven by sharp rises in housing and automotive fuel prices. Strong demand for housing construction in addition to labour and material shortages have resulted in new dwelling purchase costs for owner-occupiers rising by 22.8 per cent over the year to March quarter 2022, while record low vacancy rates have also seen Brisbane rents rise faster than most other capital cities. Together, these housing components contributed 2.0 percentage points to Brisbane’s 6.0 per cent annual rise in the CPI in March quarter 2022.
Meanwhile, global oil prices rose sharply in early 2022, caused by Russia’s invasion of Ukraine impacting global supply at a time when the ongoing easing of COVID-19 restrictions was strengthening global oil demand. Prices are likely to remain elevated in the near term as the global economy continues to recover and uncertainty remains about Russia’s invasion of Ukraine.
While housing and automotive fuel have been the key drivers of headline consumer inflation, more recently food prices have also begun to surge. While COVID-19-related supply chain disruptions and high transport and fertiliser costs have contributed to various food price increases, the impact on production from severe flooding in Queensland and New South Wales in March quarter 2022 has also been a significant factor.
Brisbane’s CPI growth is expected to average 51⁄4 per cent in 2021–22. If realised, this would be the strongest year-average increase in Brisbane’s CPI since 2000–01. Beyond 2021–22, the gradual resolution of global supply chain issues is expected to ease price pressures for building materials, slowing growth in new dwelling purchase costs for owner-occupiers. This, in combination with slowing growth in automotive fuel and food prices as global oil prices normalise and agricultural production recovers from the impacts of the early 2022 floods, is expected to result in CPI growth moderating to 33⁄4 per cent in 2022–23 and 21⁄2 per cent in 2023–24. A slower than expected resolution to material and labour supply issues within the construction industry, as well as the global oil price remaining elevated for longer, are risks to the outlook for CPI growth.
Queensland’s wage price index (WPI) accelerated to 2.5 per cent over the year to March quarter 2022, up from an average of 1.6 per cent in 2020–21. Queensland’s WPI is expected to strengthen to 21⁄2 per cent in 2021–22. and strengthen further to 31⁄2 per cent over the remainder of the forecast period.
| Box 2.4 | Impacts of surging inflation |
Global trends
Consumer price inflation began to accelerate in many economies in 2021. This acceleration was driven by both demand and supply side factors, with significant fiscal and monetary stimulus in response to the COVID-19 pandemic driving an increased demand for goods (as lockdowns reduced consumers’ ability to spend on services) at the same time that global supply chains were severely strained as a result of the pandemic.
More recently, Russia’s invasion of Ukraine and developments in China, with several major cities re-entering strict COVID-19 lockdowns, have exacerbated global supply chain disruptions, adding further upward pressure on global inflation.
53
Budget Strategy and Outlook 2022-23
At 5.1 per cent over the year to March quarter 2022, annual CPI growth in Australia is at its highest in more than 2 decades. However, it is still considerably lower than many other advanced economies (Chart 2.8).
Annual inflation is at or near multi-decade highs across a range of advanced economies, including:
| • | United States – 8.6 per cent in May |
| • | Canada – 6.8 per cent in April |
| • | Euro area – 8.1 per cent in May |
| • | United Kingdom – 9.0 per cent in April |
| • | New Zealand – 6.9 per cent in March quarter 2022 |
While inflation outcomes in some Asian countries have been more subdued than in western economies, they have also accelerated in early 2022.
Reflecting higher inflation expectations and the near-term likelihood of a period of central bank monetary tightening across many countries, global interest rates have also risen sharply in recent months.
| Chart 2.8 | Annual consumer price inflation by jurisdiction1 |
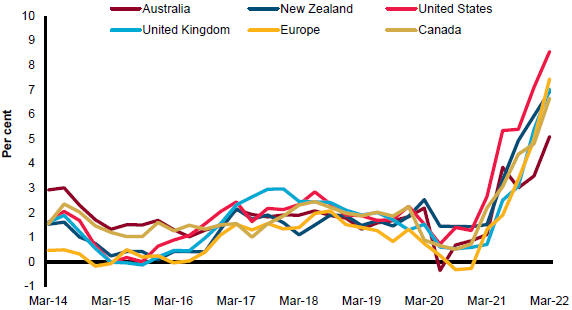
Note:
| 1. | Australia and New Zealand data is a quarterly average, all other data is to the last month of each quarter. |
Source: Refinitiv.
54
Budget Strategy and Outlook 2022-23
Global drivers
While global government stimulus and supply chain disruptions have been key factors contributing to these elevated rates of inflation, the surge in oil prices flowing through to higher automotive fuel prices has also been a significant contributor globally.
The price of Brent crude oil hit a low of US$5.62 per barrel during the height of the pandemic in April 2020. The gradual reopening of the global economy saw the price return to pre-COVID levels over the following year. More recently, the implementation of sanctions following Russia’s invasion of Ukraine has added further upward pressure on oil prices, given Russia being one of the world’s largest oil producing and exporting countries. The price of crude oil recently hit a high of US$140 per barrel in early March 2022, the highest since July 2008.
Rising global oil prices have flowed through to automotive fuel prices in Brisbane, with the ABS’ measure of automotive fuel prices rising 36.7 per cent over the year to March quarter 2022, the strongest annual increase in more than 40 years. Despite only accounting for around 4 per cent of the Brisbane CPI basket, the annual price increase saw the component contribute 1.2 percentage points to annual growth in Brisbane’s headline CPI.
The Australian Government’s 6-month cut to the fuel excise will reduce the price of automotive fuel somewhat in the June and September quarters of 2022 with fuel prices expected to remain elevated while consumer demand remains high and the war is ongoing in Ukraine. While the main impacts on current measured inflation stems from rising oil prices, sustained higher input costs for business may also be passed on to consumers through other goods and services.
The prices of many other commodities have also surged in recent weeks and months, with many of these impacts exacerbated by the Russia-Ukraine conflict. Spot prices for hard coking and thermal coal have risen sharply to record highs, with the already tight global market impacted by the reluctance of buyers to purchase Russia’s coal.
Going forward, these commodity/input price rises may flow through to higher production costs and therefore consumer prices. Recently tightened COVID-19 restrictions in multiple regions of China (consistent with the country’s COVID-19 suppression strategy), including the major centres of Shanghai and Beijing, have raised concerns that global supply chains will be placed under further pressure in the near term, adding additional upward pressure to consumer prices.
Domestic trends
The cost of constructing a new dwelling or renovating in Queensland has surged since the onset of the COVID-19 pandemic and has been a key contributor to the recent acceleration in Brisbane’s annual CPI growth.
Dwelling construction costs have risen due to increased demand for housing (in part driven by the increased use of work-from-home arrangements) while labour and materials supply shortages within the housing construction industry and associated supply chains have also placed upward pressure on prices.
The latest CPI data showed Brisbane new dwelling purchase by owner-occupier costs (a measure of construction costs for new dwellings) rose 22.8 per cent over the year to March quarter 2022, the strongest annual price increase since the inception of the series in 1998.
55
Budget Strategy and Outlook 2022-23
Given current economic conditions, sharp construction price rises are expected to continue for several quarters. This is reflected in the value of Queensland residential building work in the pipeline currently being at a record high level, labour market conditions being expected to remain strong, and labour and materials supply shortages being expected to linger while the global pandemic and Russia-Ukraine conflict continue.
While labour supply issues may ease in the medium term, global supply chain issues are expected to persist for some time. Further, demand for housing is expected to remain robust, supported by a resumption of overseas migration, low rental vacancy rates and continued use of work-from-home arrangements.
The existing inflationary pressures in the residential construction sector will be exacerbated by the recent South East Queensland flooding event, driving demand for already scarce materials and labour. It is estimated that 4,355 buildings suffered moderate or severe damage (at least 250 mm of water over the floorboards).
Supply disruptions due to COVID-19 and flooding in production areas of New South Wales and Queensland in early March have also resulted in sharp price increases for various foods more recently. In particular, fruit (up 5.2 per cent), vegetables (up 6.9 per cent) and meat and seafoods (up 5.3 per cent) recorded sharp price increases in March quarter 2022.
However, these specific price pressures are expected to be temporary as the impacts of supply disruptions ease.
| 2.4.8 | Population |
While Queensland’s overall population growth slowed in 2020–21, net interstate migration and natural increase both grew in that year. However, international border restrictions curtailed net overseas migration.
The reopening of the international border in early 2022 is expected to drive a gradual recovery in overseas migration in 2022 and 2023, which is expected to reach pre-COVID levels later in the forward estimates as virus-related uncertainties dissipate, and travel logistics normalise over time.
Since the pandemic began, state border restrictions have had little impact on net interstate migration, with exemptions available for those wanting to move interstate. Queensland’s net interstate migration throughout 2020–21 was the highest of any jurisdiction in Australia, consistent with the long-term trend of Queensland being a substantial net recipient of interstate migrants.
Queensland’s relative success in controlling the spread of COVID-19 would have reduced concerns related to health outcomes or the risk of extensive lockdowns for those people wanting to move to Queensland. In addition, fundamentals that historically drive interstate migration, such as employment opportunities and housing affordability, had remained favourable in Queensland, particularly in comparison with New South Wales and Victoria, traditionally the dominant sources of interstate migrants to Queensland.
As a result, during the lengthy Delta variant lockdowns in New South Wales and Victoria, net interstate migration in Queensland rose to more than 16,600 persons in September quarter 2021, the highest quarterly increase on record across any state or territory in Australia.
56
Budget Strategy and Outlook 2022-23
Interstate migration is expected to have persisted at elevated levels in December quarter 2021 and, following some temporary impacts from Omicron and the South East Queensland floods in the first quarter of 2022, return to pre-COVID levels over time. According to Australian Government forecasts, in net terms, more than 88,000 people are expected to move from interstate to Queensland over the 4 years to 2025–26.
A slight elevation in the birth rate in the first 3 quarters of 2021 provided an upside to the population rise attributed to natural increase in Queensland, and this momentum is expected to be maintained in the near term. Following this, birth and death rates are expected to return to pre-pandemic levels over the remainder of the forward estimates.
Reflecting this combination of factors, after slowing to 1.0 per cent in 2020–21, Queensland’s overall population growth is forecast to pick up to 11⁄4 per cent in 2021–22, strengthen to 11⁄2 per cent in 2022–23 and stay at that rate over the rest of the forward estimates, in line with the expected return of international travel.
| Box 2.5 | Population growth |
The impacts of the COVID-19 pandemic, particularly related to the international border closures, have led to slower national and Queensland population growth rates compared with historical standards (Chart 2.9).
Reflecting these factors, Queensland’s overall population growth slowed to only 1.0 per cent in 2020–21, compared with average growth of around 1.7 per cent over the previous 4 years.
Despite this, Queensland remained the most attractive jurisdiction to live, with the strongest population growth of any state or territory during the recovery from the COVID-19 crisis. This was predominantly driven by strong growth in net interstate migration and highlights the importance of Queensland’s strong health response and therefore the relative success it had in containing the spread of the virus until the majority of the population was vaccinated.
The latest Australia Bureau of Statistics (ABS) data show that Queensland’s population grew to around 5.24 million persons as at 30 September 2021, to be 1.1 per cent higher over the year; much stronger than national growth of only 0.3 per cent over the same period.
Queensland was responsible for 83.8 per cent of total national population growth over the year and increased its share of the national population to 20.4 per cent, up from 20.2 per cent.
Recent population growth has been driven by strong interstate migration
Net interstate migration to Queensland over the year to September quarter 2021 totalled 40,620 persons, the highest annual net interstate migration since 1994. New South Wales and Victoria accounted for 90 per cent of net interstate migration over the year.
While COVID-19 impacts, including international travel restrictions, have resulted in a temporary loss of net overseas migration, and impacted overall population growth in the short term, Queensland’s overall population is expected to continue to grow strongly over the medium term, as net overseas migration returns to more normal pre-COVID levels.
57
Budget Strategy and Outlook 2022-23
Reflecting these trends, Queensland’s population growth is forecast to rebound to 11⁄4 per cent in 2021–22, before strengthening further to 11⁄2 per cent in 2022–23 and stay at that rate of growth over the rest of the forward estimates (see population forecasts above).
As at 30 June 2021, approximately 1.4 million people lived in local government areas (LGAs) outside of South East Queensland, accounting for 26.6 per cent of the state’s population.
Population growth varied across Queensland regions, with some regional LGAs growing faster than the state average, including Fraser Coast, Gympie and Livingstone.
| Chart 2.9 | Population growth, Queensland1 |
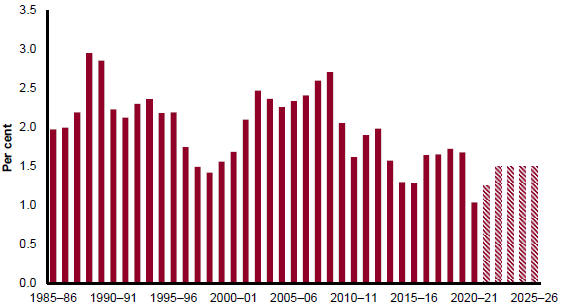
Note:
| 1. | Annual percentage change. 2021–22 to 2023–24 are forecasts; 2024–25 and 2025–26 are projections. |
Sources: ABS National, State and Territory Population and Queensland Treasury.
| 2.5 | Risks to the outlook |
The key risks to the outlook are centred around global geopolitics, potential ongoing impacts of the pandemic, as well as the global and national inflationary and interest rate environment.
In addition to ongoing geopolitical risks associated with Australia’s trade relationship and tensions with China, the Russian invasion of Ukraine and resulting sanctions has raised global unrest, pushed up global commodity prices at a time when inflation rates remain elevated, and disrupted international trade and financial linkages.
Queensland has limited direct trade and financial links with either Ukraine or Russia and could be expected to benefit from the higher commodity prices in the short term.
58
Budget Strategy and Outlook 2022-23
However, there is a risk that any extended conflict could result in a decline in global growth and have negative implications for Queensland over the medium term. The IMF has already downgraded its global growth forecast in its April World Economic Outlook, partly as a result of this conflict.
Risks associated with the COVID-19 pandemic also remain. The world, including Queensland, remains vulnerable to any new variants of COVID-19 that may be more virulent.
Recent lockdowns of major cities in China due to COVID-19 outbreaks poses a risk to Chinese, and global, economic growth and this could exacerbate already significant supply chain bottlenecks during a period when commodity and consumer prices are rising strongly.
During the pandemic, considerable fiscal and monetary support was provided to cushion the economy from the economic fallout. This support is being unwound as economies recover. So far, this process has proceeded relatively smoothly.
It is expected that both global and Australian interest rates will rise significantly over the forecast horizon. While a gradual increase in interest rates is not expected to derail economic recovery, a sudden rise in inflation expectations or other inflationary shock may generate more rapid monetary tightening by central banks with adverse impacts on growth.
59
Budget Strategy and Outlook 2022-23
| Table 2.2 | Queensland economic forecasts1, by component |
| Actuals 2020–21 | 2021–22 | Forecasts 2022–23 | 2023–24 | |||||||||||||
Economic output2 | ||||||||||||||||
Household consumption | 4.9 | 31⁄4 | 23⁄4 | 21⁄4 | ||||||||||||
Dwelling investment | 10.1 | 10 | 10 | -33⁄4 | ||||||||||||
New and used | 5.3 | 133⁄4 | 133⁄4 | -103⁄4 | ||||||||||||
Alterations and additions | 19.7 | 6 | 53⁄4 | 41⁄2 | ||||||||||||
Business investment | -4.2 | 71⁄4 | �� | 33⁄4 | 31⁄4 | |||||||||||
Non–dwelling construction | -8.6 | 11 | 41⁄2 | 51⁄4 | ||||||||||||
Machinery and equipment | -2.7 | 3 | 13⁄4 | 21⁄4 | ||||||||||||
Private final demand | 4.3 | 41⁄2 | 31⁄2 | 13⁄4 | ||||||||||||
Public final demand | 2.9 | 51⁄2 | 31⁄2 | 4 | ||||||||||||
State Final Demand | 3.9 | 43⁄4 | 31⁄2 | 21⁄2 | ||||||||||||
Overseas goods and services exports | -15.9 | 3⁄4 | 4 | 4 | ||||||||||||
Overseas goods and services imports | -2.6 | 6 | 12 | 101⁄2 | ||||||||||||
Gross state product | 2.0 | 3 | 23⁄4 | 23⁄4 | ||||||||||||
Employment3 | 2.4 | 43⁄4 | 3 | 11⁄2 | ||||||||||||
Unemployment rate4 | 6.8 | 41⁄2 | 4 | 41⁄4 | ||||||||||||
Inflation5 | 2.1 | 51⁄4 | 33⁄4 | 21⁄2 | ||||||||||||
Wage Price Index | 1.6 | 21⁄2 | 31⁄2 | 31⁄2 | ||||||||||||
Population | 1.0 | 11⁄4 | 11⁄2 | 11⁄2 | ||||||||||||
Notes:
| 1. | Unless otherwise stated, all figures are annual percentage changes. |
| 2. | CVM, 2019–20 reference year. The comparable nominal GSP growth rates are 1.3 per cent in 2020–21, 22 per cent in 2021–22, 2 per cent in 2022–23 and -13⁄4 per cent in 2023–24. The exceptionally strong growth in 2021–22 largely reflects the impact of surging commodity prices on nominal exports. |
| 3. | The comparable through the year employment growth rates to the June quarter (seasonally adjusted) are 9.9 per cent, 41⁄4 per cent, 11⁄4 per cent and 2 per cent from June quarter 2021 to June quarter 2024, respectively. |
| 4. | Per cent, year-average. |
| 5. | Brisbane, per cent, year-average. |
Sources: ABS Annual State Accounts, National, State and Territory Population, Labour Force, Wage Price Index, Consumer Price Index and Queensland Treasury.
60
Budget Strategy and Outlook 2022-23
| 3 | Fiscal strategy and outlook |
Features
| • | Improving economic conditions since mid-2020 are expected to lead to a strong rebound in revenue in 2021–22, with revenue remaining elevated over the forward estimates compared to the 2021–22 Budget Update. |
| • | The government is directing this additional revenue towards measures that address the increasing demand for key services, including a significant boost to funding of the health system and investment in strategies to unlock the growth potential of the Queensland economy to support job creation. |
| • | Additional funding to support service delivery and economic priorities are being managed within the revenue uplift. Revenue uplifts arising from short-term factors, such as unusually high commodity prices and housing activity, are being directed to the restoration of fiscal buffers and investment in longer-term growth initiatives. |
| • | A General Government Sector operating surplus of $1.915 billion is forecast in 2021–22, an improvement of $5.4 billion compared to the $3.485 billion deficit forecast in the previous Budget. |
| • | The financial recovery from the impact of COVID-19 remains on track, with the operating position expected to regain a surplus in 2024–25. |
| • | The General Government Sector ratio of net debt to revenue has improved with a drop to 16 per cent in 2021–22, a 10 percentage point reduction compared to the 2021–22 Budget Update. This follows progressive reductions in forecasts of the net debt to revenue ratio since the 2021–22 Budget. |
| • | General Government Sector borrowings are expected to be $3.618 billion lower by 2024–25 than forecast in the 2021–22 Budget Update, and $4.480 billion lower than forecast in the 2021–22 Budget. |
| • | Queensland is expected to deliver a lower General Government Sector net debt to revenue ratio than New South Wales or Victoria in 2022–23. Queensland’s ratio of 27 per cent compares to 78 per cent for New South Wales and 145 per cent for Victoria. |
| • | Steady improvements towards medium-term fiscal goals will limit the legacy impacts of the COVID-19 crisis and ensure debt levels remain sustainable. |
| • | Throughout the pandemic crisis and recovery, Queensland’s credit ratings with S&P Global (AA+) and Moody’s (Aa1) have remained stable while Fitch has upgraded Queensland’s rating (from AA to AA+). Sound financial management supports the credit rating and provides the capacity to respond to future economic and financial shocks, including the long-term impact of the pandemic. |
| • | Queensland experienced significant flood events during the 2021–22 disaster season. Disaster related expenditure over the 5 years to 2025–26 is significant but will be partially offset by Commonwealth payments under disaster funding arrangements. |
61
Budget Strategy and Outlook 2022-23
| 3.1 | Fiscal outlook |
The improving economic conditions since mid-2020 are expected to lead to a strong rebound in revenue in 2021–22, particularly from royalties and transfer duty. While some components of the revenue uplift are expected to be temporary, resulting from exceptionally high commodity prices and housing activity, revenue is expected to remain elevated over the forward estimates compared to the 2021–22 Budget Update.
In the 2022–23 Queensland Budget, the government has ensured that additional funding generated from the economic recovery is targeted to meet increasing demand for key services. This Budget provides a significant investment to boost the health system including record funding for health services and a transformative capital injection to grow the system’s bed capacity. Increased funding is also provided in response to significant, ongoing pressures arising from an increase in demand in the child protection system.
The government also remains committed to initiatives to support jobs and economic growth, with this 2022–23 Budget continuing to invest in initiatives to unlock the potential of the Queensland economy.
While additional funding is needed to support service delivery needs and economic priorities, expense requirements are being managed within the envelope of revenue increases, in line with fiscal principles. Over the 4 years to 2024–25, revenue has increased by $20.764 billion since the 2021–22 Budget Update, compared to increased expenses of $16.533 billion. The General Government Sector operating position has improved significantly in 2021–22 since the 2021–22 Budget Update and remains on track to regain an operating surplus in 2024–25.
In turn, General Government Sector borrowings are expected to be $3.618 billion lower by 2024–25 than forecast in the 2021–22 Budget Update, and $4.480 billion lower than forecast in the 2021–22 Budget. Forecast borrowings have been progressively revised downwards since the 2020–21 Budget as a result of prudent management of revenue improvements from unusually high commodity prices and the economic recovery. Compared to 2020–21 Budget estimates, forecast borrowings in 2023–24 have been revised down by $14.395 billion.
Reflecting the significant opportunities to improve the mental health and wellbeing of Queenslanders, as identified by the Mental Health Select Committee, the 2022–23 Budget is also supported by the introduction of the mental health levy on large businesses which will provide an ongoing sustainable mental health funding mechanism. At the same time, payroll tax relief will be provided to support small and medium businesses.
In addition, further progressive rates will be introduced for coal royalties to ensure the State receives an appropriate return on the State’s resources during periods of extremely high prices. Chapter 4 provides further detail on new revenue measures.
62
Budget Strategy and Outlook 2022-23
| 3.1.1 | Fiscal Principles |
In the 2021–22 Queensland Budget, the government set out its medium-term strategy for fiscal recovery, including a new Charter of Fiscal Responsibility (the Charter) which set out renewed fiscal principles and objective measures to support the restoration of fiscal buffers. An update on progress towards achievement of medium-term goals is outlined below.
Fiscal Principle 1 – Stabilise the General Government Sector net debt to revenue ratio at sustainable levels in the medium term, and target reductions in the net debt to revenue ratio in the long term.
Ensuring debt is stabilised at a sustainable level is key to restoring the state’s capacity to invest in infrastructure and respond to future external shocks.
Since the development of the new Charter, significant progress has been made against the objective measure of fiscal recovery in Fiscal Principle 1. The general government ratio of net debt to revenue has been revised down to 16 per cent in 2021–22, a 10 percentage point reduction compared to the 2021–22 Budget Update. By 2024–25, the ratio is forecast to reach 44 per cent, compared to 50 per cent in the 2021–22 Budget Update and 61 per cent in the 2021–22 Budget (Chart 3.1). This follows a steady reduction in forecasts for the General Government net debt to revenue ratio in successive budget updates since the 2020–21 Budget.
| Chart 3.1 | Ratio of general government net debt to revenue |
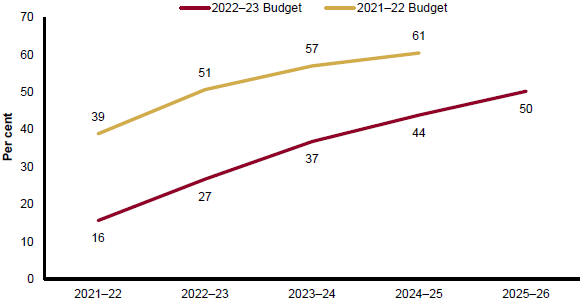
63
Budget Strategy and Outlook 2022-23
The progressive reduction in net debt forecasts has resulted from the prudent management of revenue increases. This includes ensuring that short-term revenue uplifts from factors such as exceptionally high commodity prices support the restoration of fiscal buffers and investment in longer-term growth initiatives, while increased demand for key government services is managed within the broader trajectory of the economic recovery.
The government’s commitment to investing in social and economic infrastructure to support the state’s growing population and the ongoing recovery from COVID-19 and recent flood events, means the ratio increases over the forward estimates. Continued prudent management will ensure the debt increases resulting from the pandemic are minimised and the level at which net debt is stabilised in the medium term is sustainable.
Queensland’s net debt to revenue ratio of 27 percent in 2022–23 compares favourably with that of its peers. The net det to revenue ratio in 2022–23 is 78 per cent for New South Wales (2021–22 Half-Yearly Review) and 145 per cent for Victoria (2022–23 Budget).
Fiscal Principle 2 – Ensure that average annual growth in General Government Sector expenditure in the medium term is below the average annual growth in General Government Sector revenue to deliver fiscally sustainable operating surpluses.
Fiscal Principle 2 provides a broad measure of expense growth management. Maintaining a lower rate of expenses growth than revenue growth will ensure the restoration of an operating surplus and assist debt stabilisation.
Revenue growth over the forward estimates is forecast to be relatively volatile, with a large increase (15.9 per cent) expected in 2021–22 driven by a substantial increase in royalties and transfer duty. Growth is expected to moderate in 2022–23 to 1.6 per cent as key commodity prices and housing activity return to more normal levels.
Over the 5 years to 2025–26, revenue is expected to grow at 4.5 per cent on average per annum, compared to 4.1 per cent for expenses. An operating surplus is expected to be regained in 2024–25, consistent with previous forecasts.
Fiscal Principle 3 – Target continual improvements in net operating surpluses to ensure that, in the medium term, net cash flows from investments in non-financial assets (capital) will be funded primarily from net cash inflows from operating activities. The capital program will focus on supporting a productive economy, jobs, and ensuring a pipeline of infrastructure that responds to population growth.
Maintaining a capital program that will support services and jobs and enhance the productive capacity of the economy remains a government priority. The government continued a substantial capital program through the pandemic and its $50 billion infrastructure guarantee will ensure a continual pipeline of key priority projects. A capital program of $59.126 billion is planned over the 4 years to 2025–26. A commitment to a large capital program while stabilising debt at a sustainable level will require the capital program to be largely funded through operating cash surpluses rather than borrowings.
64
Budget Strategy and Outlook 2022-23
Volatility in revenue growth over 2021–22 and 2022–23 combined with the profile of capital expenditure, which is uneven by nature, means a degree of volatility can be expected in the outcomes for Fiscal Principle 3 on an individual year basis. As the budget position improves, the proportion of capital funded through operating cash is expected to generally trend upwards, taking year-on-year volatility into account.
This volatility is apparent in current estimates for Fiscal Principle 3, with particularly strong revenue growth in 2021–22 resulting in operating cash exceeding that needed to fund net cash flows from investments in non-financial assets (Chart 3.2). While the proportion will then decrease in 2022–23, it is expected to gradually rise over the forward estimates as the operating position improves.
| Chart 3.2 | Share of General Government Sector investments in non-financial assets funded from operating cash surpluses |
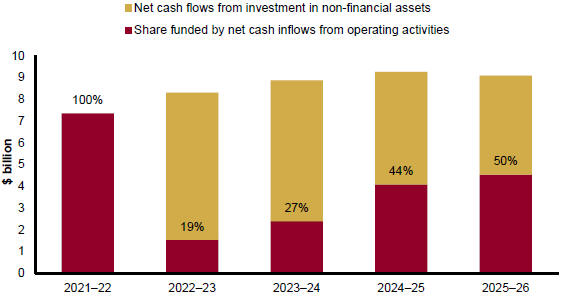
Fiscal Principle 4 – Maintain competitive taxation by ensuring that, on a per capita basis, Queensland has lower taxation than the average of other states.
This principle directly measures Queensland’s competitiveness relative to other jurisdictions, providing a meaningful indication of the comparative impact of Queensland’s tax regime and policies.
Based on the latest available outcomes, Queensland’s taxation per capita was $647 less than the average of other jurisdictions in 2020–21. On average, Queenslanders paid $1,067 less tax than New South Wales residents and $492 less than Victorian residents.
Using the latest forecasts, Queensland’s taxation per capita of $3,535 in 2022–23 compares favourably to the average of other jurisdictions of $4,363 per capita. Chart 3.3 demonstrates that Queensland is expected to maintain a highly competitive tax environment.
65
Budget Strategy and Outlook 2022-23
| Chart 3.3 | Taxation per capita, Queensland and other states and territories |
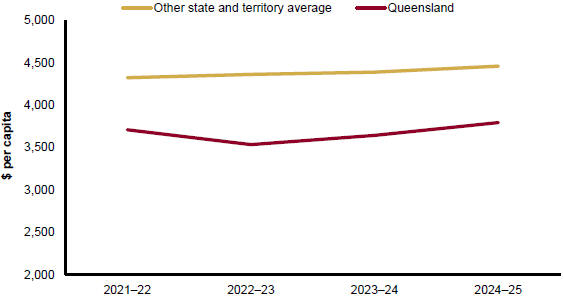
Fiscal Principle 5 – Target the full funding of long-term liabilities such as superannuation and workers’ compensation in accordance with actuarial advice.
The full funding of superannuation and other long-term liabilities is a long-standing Queensland Government priority and a key element of Queensland’s financial management. The commitment to this principle has continued through the economic and fiscal recovery from the COVID-19 crisis, and it remains part of the long-term fiscal strategy.
The actuarial investigation of the Defined Benefit Fund as at 30 June 2021 found it to be in surplus. As at 30 June 2021, WorkCover Queensland was fully funded.
66
Budget Strategy and Outlook 2022-23
| 3.2 | Key fiscal aggregates |
The key fiscal aggregates for the 2022–23 Queensland Budget are outlined in Table 3.1.
| Table 3.1 | Key fiscal aggregates1 |
| 2020–21 Outcome $ million | 2021–22 Budget $ million | 2021–22 Est. Act. $ million | 2022–23 Budget $ million | 2023–24 Projection $ million | 2024–25 Projection $ million | 2025–26 Projection $ million | ||||||||||||||||||||||
General Government Sector |
| |||||||||||||||||||||||||||
Revenue | 62,732 | 63,664 | 72,735 | 73,886 | 75,034 | 76,728 | 78,019 | |||||||||||||||||||||
Expenses | 63,669 | 67,148 | 70,820 | 74,915 | 76,116 | 76,591 | 77,836 | |||||||||||||||||||||
Net operating balance | (937 | ) | (3,485 | ) | 1,915 | (1,029 | ) | (1,083 | ) | 137 | 183 | |||||||||||||||||
PNFA2 | 6,835 | 7,800 | 7,533 | 8,478 | 9,106 | 9,439 | 9,264 | |||||||||||||||||||||
Fiscal balance | (5,015 | ) | (7,965 | ) | (2,386 | ) | (5,635 | ) | (5,631 | ) | (5,008 | ) | (3,969 | ) | ||||||||||||||
Borrowings | 54,078 | 65,041 | 58,215 | 66,459 | 74,224 | 81,102 | 87,284 | |||||||||||||||||||||
Net debt | 11,360 | 24,750 | 11,390 | 19,772 | 27,603 | 33,667 | 39,214 | |||||||||||||||||||||
Notes:
| 1. | Numbers may not add due to rounding. Bracketed numbers represent negative amounts. |
| 2. | PNFA: Purchases of non-financial assets. |
| 3.2.1 | Net operating balance |
Table 3.2 compares the General Government Sector net operating balance forecasts for the previous budget with the 2022–23 Budget forecasts.
| Table 3.2 | General Government Sector – net operating balance forecasts |
| 2021–22 $ million | 2022–23 $ million | 2023–24 $ million | 2024–25 $ million | 2025–26 $ million | ||||||||||||||||
2021–22 Budget | (3,485 | ) | (2,440 | ) | (969 | ) | 153 | — | ||||||||||||
2022–23 Budget | 1,915 | (1,029 | ) | (1,083 | ) | 137 | 183 | |||||||||||||
67
Budget Strategy and Outlook 2022-23
Since the 2021–22 Budget, the General Government Sector net operating balance has improved substantially in 2021–22, from a deficit of $3.485 billion to a surplus of $1.915 billion. This large improvement recognises that a portion of the $ 9.071 billion revenue uplift since the 2021–22 Budget results from temporary factors and has been responsibly directed towards an improved operating position and the reinstatement of fiscal buffers. While additional expenses are necessary to meet increasing demand for services, these have been managed within the revenue envelope resulting from broader trends in the economic recovery, with expenses increasing by $3.671 billion in 2021–22 compared to the 2021–22 Budget. This ensures increased expenses remain sustainable.
As the impact of temporary factors on revenue begin to unwind in 2022–23 and disaster-related expenses increase, the operating position is expected to return to a deficit but improves by $1.411 billion compared to the 2021–22 Budget estimate. Consistent with previous forecasts, the operating position is expected to regain a surplus in 2024–25 and 2025–26, with average revenue growth of 4.5 per cent per annum over the 5 years to 2025–26 comparing to 4.1 per cent average expense growth.
Table 3.3 provides a breakdown of the changes in the net operating balance since the 2021–22 Budget Update.
68
Budget Strategy and Outlook 2022-23
| Table 3.3 | Reconciliation of net operating balance, 2021–22 Budget Update to 2022–23 Budget1 |
| 2021–22 $ million | 2022–23 $ million | 2023–24 $ million | 2024–25 $ million | |||||||||||||
2021–22 Budget Update net operating balance | (1,492 | ) | (2,397 | ) | (559 | ) | 158 | |||||||||
Taxation revisions2 | 1,010 | 364 | 173 | 490 | ||||||||||||
Royalty and land rent revisions2 | 2,879 | 3,001 | 790 | 821 | ||||||||||||
GST revisions | 433 | 1,414 | 1,109 | 1,026 | ||||||||||||
Revenue measures3 | — | 929 | 539 | 568 | ||||||||||||
Expense measures4 | (971 | ) | (2,699 | ) | (3,596 | ) | (3,586 | ) | ||||||||
Natural disaster revisions (DRFA)5 | (117 | ) | (1,081 | ) | 543 | (76 | ) | |||||||||
Net flows from PNFC and PFC entities6 | (367 | ) | 270 | 573 | 302 | |||||||||||
Australian Government funding revisions7 | (20 | ) | (225 | ) | (278 | ) | 92 | |||||||||
Other parameter adjustments8 | 560 | (605 | ) | (377 | ) | 342 | ||||||||||
2022–23 Budget net operating balance | 1,915 | (1,029 | ) | (1,083 | ) | 137 | ||||||||||
Notes:
| 1. | Numbers may not add due to rounding. Numbers indicate the impact on the operating balance. A number in brackets indicates a negative impact on the operating balance. |
| 2. | Taxation, Royalty and land rent revisions exclude impact of revenue measures. |
| 3. | Reflects the operating balance impact of government revenue measures since 2021–22 Budget Update. Refer to Budget Measures (Budget Paper 4) for details. |
| 4. | Reflects the operating balance impact of government expense measures since the 2021–22 Budget Update. Refer to Budget Paper 4 for details. Natural disaster payments are not included in Expense measures above, however these are included in Budget Paper 4 Expense measures. |
| 5. | Net impact of Disaster Recovery Funding Arrangements. |
| 6. | Represents revisions to dividends and tax equivalent payments from, and community service obligations (CSOs) and Transport Service Contract payments to, Public Non-financial Corporations and Public Financial Corporations, net of CSO and TSC expense measures. |
| 7. | Represents the net impact of funding provided by the Australian Government primarily for Specific Purpose Payments and National Partnership payments and excludes funding for disaster recovery expenses. |
| 8. | Refers to adjustments largely of a non-policy nature, primarily changes in interest paid on borrowings, depreciation, swaps, lapses and deferrals. |
The recovery in Queensland’s net operating balance compares favourably with continued larger deficits in other states. While Queensland expects net operating deficits in 2022–23 and 2023–24, these are far narrower than the most recent available forecasts for Victoria (2022–23 Budget). Queensland’s deficits also follow a surplus in 2021–22, compared to significant deficits of $19.5 billion for New South Wales (2021–22 Half-Yearly Review) and $17.6 billion for Victoria.
69
Budget Strategy and Outlook 2022-23
Impact of disaster recovery on the net operating balance
With Queensland experiencing significant flood events in the 2021–22 disaster season, related expenses and the impact of Commonwealth payments for Disaster Recovery Funding Arrangements (DRFA) have materially affected the net operating balance. Box 3.1 details the financial impact of the flood events and initiatives to support community recovery and resilience. Table 3.4 details the impact of disaster expenses and DRFA on the net operating balance. This demonstrates that Queensland would have achieved a net operating surplus in 4 of the 5 years of estimates had revenue and expenses not been affected by disasters.
| Table 3.4 | Impact of disaster funding on the net operating balance1,2 |
| 2021–22 $ million | 2022–23 $ million | 2023–24 $ million | 2024–25 $ million | 2025–26 $ million | ||||||||||||||||
Net Operating Balance | 1,915 | (1,029 | ) | (1,083 | ) | 137 | 183 | |||||||||||||
less Disaster revenue | 527 | 517 | 1,451 | 361 | — | |||||||||||||||
add Disaster expenses | 712 | 1,714 | 1,172 | 532 | 37 | |||||||||||||||
Underlying Net Operating Balance | 2,100 | 168 | (1,362 | ) | 308 | 220 | ||||||||||||||
Disaster capital expenditure | 35 | 184 | 282 | 208 | — | |||||||||||||||
Notes:
| 1. | Numbers may not add due to rounding. |
| 2. | The disaster revenues and expenditure shown above include estimates from events prior to 2021–22 and so exceed estimates for those occurring in the summer of 2021–22. |
70
Budget Strategy and Outlook 2022-23
| Box 3.1 | 2021–22 Disaster Season |
The summer of 2021–22 has seen multiple devastating flood events which impacted more than half the state. Tragically, lives have been lost and thousands of individuals, families, businesses, primary producers, schools and other organisations have been directly affected.
Of Queensland’s 77 local government areas, 66 have been activated for the joint State-Commonwealth DRFA assistance in response to these disasters.
Early indications suggest the cost of recovery and reconstruction from the repeated flooding to be funded under the DRFA will be more than $3 billion. The broader impact of the floods on the Queensland economy is discussed in Chapter 2.
To support initial recovery, several extraordinary measures were immediately made available through the jointly funded DRFA, including personal hardship assistance for individuals and families. At the end of May 2022, more than $22 million has been distributed under the hardship scheme, benefiting just over 96,000 people. For lower income earners without insurance, the Structural Assistance Grant has been raised to $50,000 to help make homes safe and secure.
For primary producers, small businesses, non-profit organisations and sporting clubs, $558.5 million in grants were made available following the South East Queensland floods to assist with clean-up and reinstatement. A further $30 million is open for Councils to assist with clean-up in their regions and 23 Councils have each received a $1 million injection to assist with urgent recovery and clean-up works. This will be followed by reimbursements to Councils and agencies across all affected areas for costs incurred in counter-disaster operations, such as sandbagging, and the restoration of essential public assets including roads and bridges.
A $721 million joint State and Australian Government package is assisting ongoing recovery with a focus on the health and wellbeing of communities, accommodation options, sustaining medium size businesses and tourism, restoring the environment, repairing community and recreational assets, supporting community development with flexible funding grants and community and industry officers and ensuring our essential public assets can be built back better.
The innovative $741 million Resilient Homes Fund is jointly funded by the Queensland and Australian Governments through the DRFA. It is available for homeowners to bolster resilience across 37 council areas through providing grants to rebuild with flood resilient materials or home raising, or for the voluntary buy-back of homes at high risk of repeated flooding.
While the impact of the recent flooding events will be felt for many years, efforts to build resilience and support community recovery mean that Queensland will be better placed to handle future disasters.
71
Budget Strategy and Outlook 2022-23
| 3.2.2 | Revenue |
Revenue is expected to rebound strongly in line with the substantially improving economic conditions since mid-2020. In 2021–22, total General Government Sector revenue is expected to be 15.9 per cent higher than 2020–21 and $9.071 billion (14.2 per cent) higher than estimated in the 2021–22 Budget (Chart 3.4). The strong uplift in 2021–22 compared to 2020–21 primarily reflects the impact of a temporary surge in coal and oil prices across 2021, increasing royalties and land rents by $6.472 billion, and a $3.251 billion (20.0 per cent) increase in taxation revenue, driven largely by transfer duty.
More modest revenue growth is expected in 2022–23 of 1.6 per cent. Royalties are expected to decline as coal and oil prices return to more sustainable levels while overall revenue growth is supported by GST revenue, driven largely by growth in the national GST pool. Taxation revenue is expected to decline by 3.4 per cent in 2022–23 due to lower transfer duty as elevated levels of property transactions moderate, then grow by an average of 5.1 per cent per annum over the 3 years to 2025–26.
On average over the 5 years to 2025–26, revenue is expected to grow by 4.5 per cent per annum.
In total over the 4 years to 2024–25, improving economic conditions and the temporary uplift to royalties means that General Government Sector revenue is forecast to be $20.764 billion higher than forecast in the 2021–22 Budget Update.
| Chart 3.4 | Comparison of revenue forecasts |
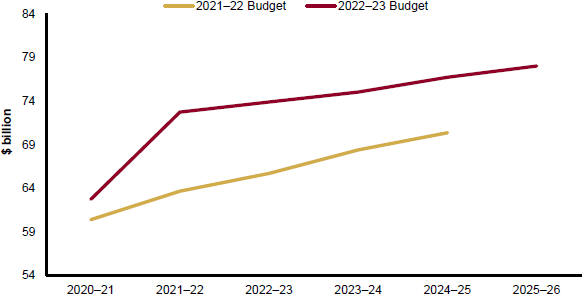
Revenue measures have been introduced in the 2022–23 Queensland Budget to provide sustainable funding to support the delivery of essential government services and to provide appropriate tax relief. In net terms, new measures are expected to increase revenue by $2.620 billion over the 4 years to 2025–26. Key measures include:
72
Budget Strategy and Outlook 2022-23
| • | a mental health levy to meet increasing demands for mental health services. The levy, to apply to payroll tax liabilities arising on or after 1 January 2023, will be applied to large employers, or groups of employers, with annual Australian taxable wages over $10 million, including an additional levy applied to taxable wages over $100 million, providing a sustainable funding source for mental health services |
| • | substantial payroll tax relief for small and medium businesses by increasing the payroll tax deductions available for liabilities arising on or after 1 January 2023 and an extension of the 50 per cent payroll tax rebate for wages paid to apprentices and trainees for 12 months to 30 June 2023 |
| • | 3 additional progressive coal royalty rates will apply from 1 July 2022, ensuring royalty returns to the state appropriately reflect the use of valuable natural resources during future period of high coal prices |
| • | a 5 per cent racing levy will be applied to the betting tax rate as part of a broader package of changes to funding arrangements for the racing industry |
| • | retirement visa holders will be exempt from additional foreign acquirer duty for purchases of their principal place of residence on or after 1 January 2023. |
Further detail on revenues is provided in Chapter 4.
| 3.2.3 | Expenses |
Expenses in the 2022–23 Queensland Budget reflect the government���s commitment to deliver better services aimed at improving the lives of Queenslanders, supporting the state’s growing population and unlocking further economic and employment growth. Improving economic conditions mean that additional expenses can be met well within the envelope of revenue improvements, preserving budgetary performance while meeting service delivery demands.
On average, General Government Sector expenses are forecast to increase by 4.1 per cent per annum over the 5 years to 2025–26. This is lower than the forecast average annual increases in revenue of 4.5 per cent over the same period and is consistent with Fiscal Principle 2.
Key new initiatives in the 2022–23 Budget include:
| • | increased funding of $6.784 billion over 4 years to support the ongoing growth in demand for health and ambulance services |
| • | additional funding of $1.645 billion over 5 years for Queensland Health’s new 5-year plan for Queensland’s state funded mental health, alcohol and other drug services as well as the suicide prevention system of care and support. This builds on existing funding for mental health, alcohol and other drugs services in Queensland. While Queensland Health advised the Mental Health Select Committee that it spent an estimated $1.35 billion on mental health in 2020–21 and a further $139 million on alcohol and other drug services, mental health expenditure is complex and a whole of Government responsibility with multiple Government agencies providing mental health services |
| • | funding of $2.2 billion over 5 years and $500 million per year ongoing for out of home care services in response to ongoing pressures arising from an increase in demand in the child protection system |
73
Budget Strategy and Outlook 2022-23
| • | $964.2 million over 5 years for Queensland’s Resource Recovery Sector Transformation, including implementation of the South East Queensland Waste Management Plan, Regional Waste Management Plans, payments to councils to reduce the household impact of the waste levy as well as statewide programs and regulatory activities |
| • | increased funding of $263 million over 4 years and $77 million per annum ongoing to support kindergarten funding reform to reduce out-of-pocket expenses for families, increase disability funding and implement educational need funding for children in Queensland attending a kindergarten. |
Salaries and wages form a large proportion of General Government Sector expenses. Increases in salaries and wages are negotiated through enterprise bargaining agreements. With several key public sector enterprise bargaining agreements nominally expiring during 2022, the government is committed to participating in good faith bargaining to establish wage increases for the next period, considering the prevailing economic environment. The 2022–23 Budget and forward estimates reflect growth in full-time equivalent public sector employees and wage increases consistent with existing agreements and expectations of future bargaining agreements where outcomes are yet to be finalised.
The Queensland Government’s Savings and Debt Plan, announced on 9 July 2020, targeted savings of $3 billion over 4 years to 2023–24. Through specific measures and agency savings efforts, this target has been fully met and adjustments to agency appropriation made.
Incorporating the achievement of these ongoing savings in the 2022–23 Queensland Budget supports the management of expenses over the forward estimates and the return to surplus by 2024–25. As noted in the Queensland Audit Office’s State Finances 2021 report, individual departments are responsible for identifying and implementing measures to achieve the targeted savings. These savings are being achieved without reducing services and in line with the Queensland Government’s commitment to employment security.
Several workstreams were established to identify cross-agency opportunities under the Savings and Debt Plan, including for Accommodation, Advertising, Marketing and Communications, Data and ICT, Workforce, Government Corporate Support, Grants Administration and Procurement. Cross-government work will continue to focus on opportunities for public sector improvement and efficiency in service delivery.
Further detail on expenses is provided in Chapter 5.
74
Budget Strategy and Outlook 2022-23
| 3.2.4 | Investment |
The Queensland Government provides essential infrastructure and capital works to support productivity, connect industries and meet the state’s increasing service needs. In the 2022–23 Queensland Budget, the government is investing in the social and economic infrastructure needed to support the state’s growing population and ensure the ongoing recovery from COVID-19 and recent flood events. The government continues to deliver on the $50 billion Infrastructure Guarantee, with a total 4-year capital program of $59.126 billion in the 2022–23 Budget.
The 2022–23 Budget continues to put the health of Queenslanders first, with a capital expenditure boost of $ 9.785 billion over 6 years to expand capacity, delivering around 2,200 additional overnight beds across the Queensland health system.
Key capital investments in 2022–23 include:
| • | $7.309 billion investment in transport infrastructure. This includes $1.290 billion to continue construction work on Cross River Rail, $270.2 million to commence Stage 3 of Gold Coast Light Rail, and substantial ongoing investment to fund major upgrades to the M1 Pacific Motorway, the Bruce Highway and the rail network through the Logan and Gold Coast Faster Rail project |
| • | $1.555 billion to ensure that Queensland’s state schools and training assets are world-class and continue to meet demand. Investment in new schools is being facilitated through the $3 billion Building Future Schools Fund |
| • | $441.3 million in 2022–23 for the delivery of new social homes and upgrades of existing dwellings for vulnerable Queenslanders, as part of the 4 year $1.908 billion Housing and Homelessness Action Plan 2021–2025. |
Further information about the government’s capital program is provided in Chapter 6 and the Capital Statement (Budget Paper 3).
75
Budget Strategy and Outlook 2022-23
| 3.2.5 | Borrowings |
Australian governments at all levels increased borrowings to combat the COVID-19 crisis, as did Queensland’s. However, progressive reductions in forecast debt will limit legacy impacts in Queensland and ensure debt levels remain sustainable. The Queensland Government has acted prudently to limit debt increases. Temporary revenue uplifts in 2021–22 and 2022–23, largely driven by factors such as the surge in commodity prices, have assisted in improving the debt position. The Queensland Future Fund (QFF) – Debt Retirement Fund (DRF) has also been implemented to strengthen the state’s balance sheet.
General Government Sector net debt is forecast to be $19.772 billion at 30 June 2023, $13.555 billion lower than forecast in the 2021–22 Budget. The net debt to revenue ratio in that year is estimated at 27 per cent and is expected to reach 50 per cent by 2025–26. In comparison, 2020–21 Budget forecasts suggested a net debt burden of 50 per cent would be reached during 2021–22.
By 2024–25, Queensland’s forecast net debt of $ 33.667 billion compares to $103.008 billion for New South Wales (2021–22 Half-Yearly Review) and $154.844 billion for Victoria (2022–23 Budget). As shown in Chart 3.5, general government net debt as a share of revenue is also expected to be far lower in Queensland than in New South Wales and Victoria across the forward estimates.
| Chart 3.5 | State comparison of General Government Sector net debt to revenue |
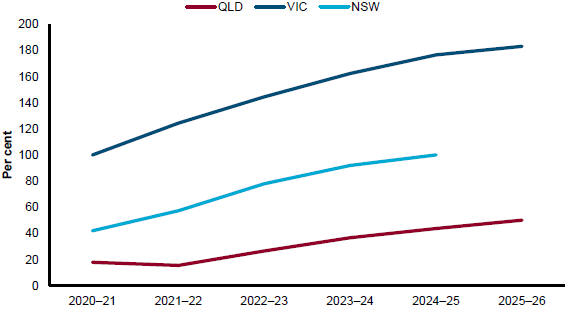
76
Budget Strategy and Outlook 2022-23
Total General Government Sector borrowings are expected to be $8.321 billion lower at 30 June 2023 than forecast in the 2021–22 Budget and remain $4.480 billion lower by 30 June 2025. General Government Sector borrowings also compare well to interstate peers (Chart 3.6). Queensland’s forecast borrowings of $81 billion in 2024–25 are far lower than those of New South Wales ($161 billion, 2021–22 Half-Yearly Review) and Victoria ($187 billion, 2022–23 Budget).
| Chart 3.6 | Interstate comparison of General Government Sector borrowings |
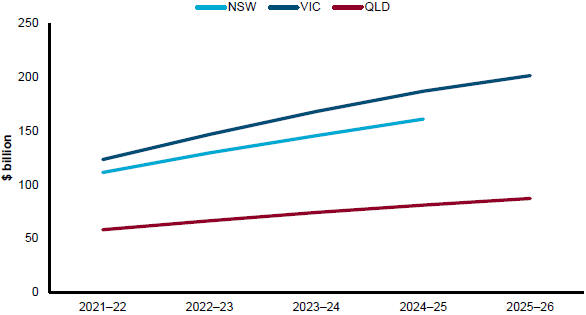
Debt servicing costs are also expected to remain manageable, with General Government Sector interest expenses expected to be around 2.5 per cent of revenue in 2022–23. While General Government Sector interest expenses are expected to rise over the forward estimates period, the 2025–26 estimate of 3.7 per cent remains well below the peak of 4.7 per cent in 2013–14 (Chart 3.7). The continued reduction in overall forecast debt levels helps to reduce the impact of future interest rate rises.
77
Budget Strategy and Outlook 2022-23
| Chart 3.7 | General Government Sector ratio of borrowing costs to revenue |
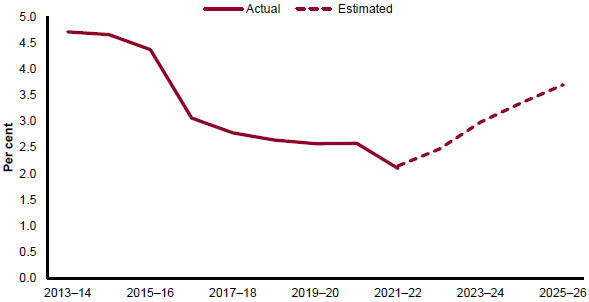
Queensland’s credit ratings
Throughout the pandemic crisis and recovery, Queensland’s credit rating has remained stable with S&P Global (AA+) and Moody’s (Aa1), while Fitch has upgraded Queensland’s rating (from AA to AA+). These ratings outcomes are supported by prudent and effective management of pandemic impacts and the government’s commitment to restoring a strong budgetary performance and stabilising the level of borrowings. The establishment of the QFF – DRF demonstrated a commitment to active debt management and supports Queensland’s credit continuing to rate strongly.
In December 2021, Moody’s affirmed Queensland’s rating at Aa1 (stable). Moody’s assessment recognises that while Queensland has experienced significant economic and revenue disruptions from the pandemic, its credit profile is underpinned by a strong institutional framework as well as the strong revenue recovery in 2021–22 and resultant lower borrowing requirements.
Fitch upgraded Queensland’s rating from AA (stable) to AA+ (stable) in December 2021, reflecting the diversity and underlying strength of Queensland’s economy, and Fitch’s expectations of Australia’s improving macroeconomic environment. Fitch expects strong financial management and the commitment to restore operating surpluses to keep debt levels manageable.
S&P Global affirmed Queensland’s AA+ (stable) rating in February 2022, reflecting an expectation that the impact of COVID-19 on Queensland’s budgetary performance will be temporary and will improve as the economy continues to recover and the budget is effectively managed. S&P Global also notes that debt levels compare well to similarly-rated peers.
78
Budget Strategy and Outlook 2022-23
The maintenance or improvement in Queensland’s rating contrasts with New South Wales and Victoria, which have both had credit rating downgrades over the course of the pandemic. Victoria’s Aaa rating with Moody’s was downgraded to Aa1 in 2021, then Aa2 in 2022, and their AAA rating with S&P Global was downgraded 2 notches to AA in 2020. New South Wales have also been downgraded by S&P Global, from AAA to AA+ in 2020.
The credit rating of the state impacts the rate at which new and refinanced borrowings are made, which affects the overall cost of borrowing. Sound financial management supports the credit rating and provides the capacity to respond to future economic and financial shocks, including the long-term impact of the pandemic.
| 3.2.6 | Emerging Fiscal Pressures |
Beyond general uncertainties related to budget parameter assumptions and the ongoing impact of the COVID-19 pandemic, key emerging fiscal issues include:
| • | Native Title Compensation Settlement: the government has a potential liability with respect to compensation arising from acts that have extinguished or impaired native title since 1975 |
| • | impacts of Australian Government changes to state shares of GST: risks to the longer-term outlook for Queensland’s GST revenue resulting from the changes made to the system of GST revenue distribution by the Australian Government in 2018. Further information on GST arrangements is provided in Chapter 4 |
| • | expiring agreements: Queensland’s fiscal position is exposed to decisions made by the Australian Government, including not renewing funding for National Partnership payments (NPs) where there are ongoing community service needs that must be met. Further information on expiring agreements is provided in Chapter 7 |
| • | adverse weather events are likely to occur in future with the resulting damage expected to impact on the delivery of State initiatives, noting disaster-related expenses are shared with the Australian Government under DRFA |
| • | challenges arising from the transformation of Queensland’s energy system away from a reliance on coal-fired generation, requiring significant new investment in renewable generation, storage and network infrastructure to support a secure and reliable electricity system |
| • | additional water infrastructure, and upgrades to existing infrastructure, will be required over the next decade to meet future water demand, provide drought contingency, and ensure the safety and reliability of Queensland’s dams in line with dam safety guidelines into the future. |
79
Budget Strategy and Outlook 2022-23
| 4 | Revenue |
Features
| • | The COVID-19 pandemic and resulting economic impacts substantially reduced the state’s revenues across 2019–20 and 2020–21 compared with pre-pandemic forecasts in the 2019–20 Mid-Year Fiscal and Economic Review. However, in line with the substantially improving economic conditions since mid-2020, revenue is expected to rebound strongly in 2021–22 and remain at relatively elevated levels over the forward estimates. |
| • | Total key revenues of taxes, royalties and GST are expected to be $10.067 billion (29.4 per cent) higher in 2021–22 than they were in 2020–21. |
| • | However, some key revenues are expected to be volatile over the forecast period. The substantial increases in royalties and transfer duty in 2021–22, due to high coal and oil prices and the housing boom respectively, are expected to unwind from 2022–23 onwards, as commodity prices and housing activity normalises. |
| • | General Government Sector revenue is estimated to total $72.735 billion in 2021–22, up $10.003 billion (15.9 per cent) compared with 2020–21 and $9.071 billion (14.2 per cent) higher than estimated in the 2021–22 Queensland Budget. The substantial upward revision to 2021–22 revenue from the 2021–22 Budget estimates is largely driven by: |
| • | a $5.794 billion increase in royalties and land rents, reflecting the unprecedented surge in coal and oil prices across early 2022 |
| • | a $2.101 billion increase in taxation revenue, reflecting much stronger than expected domestic activity, particularly the strength of residential property transactions. |
| • | In 2022–23, General Government Sector revenue is estimated to total $73.886 billion, an increase of $1.151 billion (1.6 per cent) compared with 2021–22. |
| • | This moderate growth largely reflects an expected $1.302 billion decline in royalties and land rents, as the temporary surge in coal and oil prices begins to unwind and prices begin to return to levels consistent with medium-term expectations. |
| • | This is expected to be more than offset by an increase in GST revenue, reflecting an increase in the GST pool as the national economy continues to recover as well as Queensland receiving an increased share of the GST pool compared to 2021–22. |
| • | Australian Government payments to Queensland in 2022–23 are expected to total $34.925 billion, an increase of $1.907 billion (5.8 per cent) compared with payments in 2021–22. This increase is primarily driven by the increase in GST revenue. |
| • | Total revenues are expected to grow at an average annual rate of 1.8 per cent over the 4 years to 2025–26, or 4.5 per cent over the 5 years to 2025–26. |
| • | A number of measures are being introduced in the 2022–23 Queensland Budget to provide sustainable funding for mental health and other key services, as well as the racing industry. These measures will also provide tax relief for small to medium employers and businesses that employ apprentices and trainees, as well as removing additional foreign acquirer duty for foreign retirement visa holders buying a principal place of residence. |
80
Budget Strategy and Outlook 2022-23
| • | An increase in royalty rates at higher coal prices will provide a fairer return to Queenslanders from this resource, especially if very high prices continue. |
| • | Importantly, Queensland is maintaining its competitive tax status, with per capita state tax estimated to be $647 below the average of other states and territories in 2020–21. |
| 4.1 | 2021–22 estimated actual |
General Government Sector revenue is estimated to be $72.735 billion in 2021–22, $9.071 billion (14.2 per cent) higher than forecast at the time of the 2021–22 Queensland Budget.
The substantial upward revision to 2021–22 revenue from the 2021–22 Budget estimates is largely driven by:
| • | a $5.794 billion increase in royalties and land rents, reflecting the unprecedented surge in coal and oil prices across early 2022 |
| • | a $2.101 billion increase in taxation revenue, reflecting much stronger than expected domestic activity, particularly the strength of residential property transactions. |
The substantial increase in General Government Sector revenue expected in 2021–22 represents growth of 15.9 per cent compared with 2020–21. This is the strongest rate of growth in General Government Sector revenue since 2008–09, reflecting the combination of factors outlined above.
Total key revenues of taxation, GST, and royalties are estimated to be 29.4 per cent higher in 2021–22 compared to 2020–21.
However, there is expected to be volatility in some key revenues over the forecast period. In particular, the substantial increase in royalties and transfer duty in 2021–22, due to the exceptionally high coal and oil prices and the housing boom respectively, are both expected to unwind from 2022–23 onwards as key commodity prices and housing activity normalise.
81
Budget Strategy and Outlook 2022-23
| 4.2 | 2022–23 Budget and outyears |
General Government Sector revenue is forecast to increase by $1.151 billion (1.6 per cent) in 2022–23, to be $73.886 billion, as outlined in Table 4.1. This modest revenue increase is due to:
| • | a $1.302 billion fall in royalties and land rents reflecting the expectation that the currently elevated prices for coal and oil return to levels more consistent with medium-term expectations |
| • | this is more than offset by a $1.998 billion increase in GST revenue reflecting growth in the national GST pool and an increase in the share of the pool. |
As a result, total key revenues (taxes, GST and royalties) are forecast to remain stable in 2022–23 (growing by less than 0.1 per cent), and then decline by 3.2 percent in 2023–24 as royalty revenue normalises.
Chart 4.1 examines the growth in revenue across the 3 key revenue streams and the share of growth attributable to each key revenue item.
| Chart 4.1 | Growth in key revenues1 |
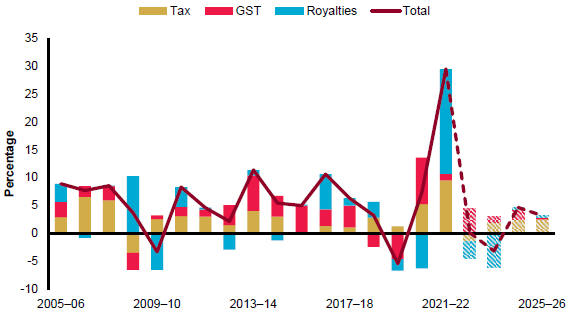
Note:
| 1. | Annual contribution to growth in key revenues. Total is the annual growth of the sum of the 3 categories. |
While taxation revenue is forecast to be $658.2 million (3.4 per cent) lower in 2022–23 than in 2021–22, taxation revenue is forecast to grow by 6.2 per cent per annum on average over the period 2020–21 to 2025–26. This is slightly above the average growth of 4.5 per cent in the decade to 2019–20, reflecting in part the benefit of higher house prices on stamp duty in the recent housing cycle.
82
Budget Strategy and Outlook 2022-23
Royalties and land rents are expected to decline by 14.3 per cent in 2022–23, and then decline by a further 34.7 per cent in 2023–24. This reflects the expectation that coal and oil prices will return from recently elevated levels to reach more sustainable levels in 2023.
Royalties and land rents are then expected to grow by 2.7 per cent in 2024–25 and 2025–26, primarily reflecting an expected increase in coal export volumes over time.
Queensland’s GST revenue is estimated to grow by 12.6 per cent in 2022–23 and is forecast to continue to grow on average by 5.0 per cent per annum over the 4 years ending 2025–26.
This increase in expected GST revenue is largely driven by growth in the national GST pool. The 2022–23 Federal Budget forecast the GST pool to grow by 9.1 per cent in 2022–23 and around 4.5 per cent per annum on average over the 3 years ending 2025–26, reflecting the expected ongoing growth in taxable consumption. However, growth in Queensland’s estimated GST share is estimated to be somewhat lower than this due to the impacts in later years of the recent higher Queensland royalties revenue on Queensland’s future GST share.
Reflecting this combination of factors and changes in key revenues, total General Government revenue growth is expected to average 4.5 per cent per annum over the 5 years to 2025–26.
The more-steady growth in overall revenue forecast in 2023–24 and beyond reflects the expected return to more normal economic conditions and activity levels over the forecast period.
Table 4.1 details Queensland’s total General Government Sector revenue by component across the forward estimates period.
83
Budget Strategy and Outlook 2022-23
| Table 4.1 | General Government Sector revenue1 |
| 2020–21 | 2021–22 | 2021–22 | 2022–23 | 2023–24 | 2024–25 | 2025–26 | ||||||||||||||||||||||
| Actual | Budget | Est. Act | Budget | Projection | Projection | Projection | ||||||||||||||||||||||
| $ million | $ million | $ million | $ million | $ million | $ million | $ million | ||||||||||||||||||||||
Taxation revenue | 16,249 | 17,399 | 19,500 | 18,842 | 19,700 | 20,785 | 21,905 | |||||||||||||||||||||
Sales of goods and services | 6,063 | 6,062 | 6,032 | 6,181 | 6,521 | 6,253 | 6,316 | |||||||||||||||||||||
Interest income | 1,948 | 2,537 | 2,561 | 2,847 | 2,910 | 2,984 | 3,037 | |||||||||||||||||||||
Grants revenue | ||||||||||||||||||||||||||||
GST revenue | 15,419 | 15,616 | 15,813 | 17,811 | 18,270 | 19,039 | 19,200 | |||||||||||||||||||||
Australian government and other grants and contributions | 14,147 | 13,749 | 14,903 | 14,561 | 15,633 | 15,936 | 16,403 | |||||||||||||||||||||
Australian Government capital grants, other grants and contributions | 3,447 | 2,571 | 2,661 | 2,870 | 3,877 | 3,300 | 3,115 | |||||||||||||||||||||
Dividend and income tax equivalent income | ||||||||||||||||||||||||||||
Dividends | 831 | 659 | 193 | 928 | 973 | 718 | 729 | |||||||||||||||||||||
Income tax equivalent income | 480 | 482 | 479 | 572 | 599 | 514 | 466 | |||||||||||||||||||||
Other revenue | ||||||||||||||||||||||||||||
Royalties and land rents | 2,662 | 3,341 | 9,135 | 7,832 | 5,112 | 5,251 | 5,392 | |||||||||||||||||||||
Other | 1,485 | 1,248 | 1,459 | 1,442 | 1,440 | 1,948 | 1,455 | |||||||||||||||||||||
Total revenue | 62,732 | 63,664 | 72,735 | 73,886 | 75,034 | 76,728 | 78,019 | |||||||||||||||||||||
Note:
| 1. | Numbers may not add due to rounding. |
The major sources of total General Government Sector revenue in 2022–23 are grants revenue, which includes GST revenue and Australian Government Grants and other grants and contributions (47.7 per cent), and taxation revenue (25.5 per cent).
Chart 4.2 illustrates the expected composition of General Government Sector revenue in 2022–23.
84
Budget Strategy and Outlook 2022-23
| Chart 4.2 | Revenue by operating statement category, 2022–231,2 |

Notes:
| 1. | Numbers may not add up to 100 per cent due to rounding. |
| 2. | Chart prepared in line with Operating Statement categories. ‘Other revenue’ includes royalties and land rents, which comprise 10.6 per cent of total revenues. |
| 4.3 | Budget initiatives |
A number of revenue measures have been announced as part of the 2022–23 Queensland Budget, including specific measures aimed at providing sustainable funding to support the delivery of mental health and other essential government services, and to fund the racing industry.
Other revenue related measures in this Budget will provide payroll tax relief for thousands of small and medium Queensland businesses, support businesses across the state that employ apprentices and trainees, and provide foreign acquisition duty relief for foreign buyers who are retirement visa holders when purchasing their principal place of residence.
Mental health levy
A mental health levy will be introduced to meet increasing demands for mental health services. The levy, to apply to payroll tax liabilities arising on or after 1 January 2023, will be applied to large employers, or groups of employers, with annual Australian taxable wages over $10 million, including an additional levy applied to taxable wages over $ 100 million, providing a sustainable funding source for mental health services. More information on the mental health levy can be found in Box 4.1.
85
Budget Strategy and Outlook 2022-23
Payroll tax relief for small to medium employers
Substantial payroll tax relief will be provided for many small and medium businesses, by increasing the payroll tax deductions available to employers, or groups of employers, with annual Australian taxable wages of between $1.3 million and $10.4 million. These changes are proposed to apply to payroll tax liabilities arising on or after 1 January 2023. More information on this measure can be found in Box 4.2.
Racing levy
To ensure ongoing sustainable funding of Queensland’s racing industry, a 5 per cent racing levy will be applied to the betting tax rate and bonus bets will be incorporated into the calculation of betting tax for liabilities arising on or after 1 December 2022. Taxing bonus bets will bring Queensland into line with betting tax arrangements in all other jurisdictions, other than Tasmania. The proportion of betting tax revenue allocated to the racing industry will also increase from the current 35 per cent to 80 per cent.
More information on this measure can be found in Box 4.4.
Progressive coal royalty rates
To ensure that during future periods of high coal prices the royalty return to the state is appropriate in line with the usage of the state’s valuable natural resources, 3 additional progressive coal royalty rates will apply. The new tiers will apply on that part of the average price per tonne of the coal sold, disposed of or used on or after 1 July 2022 as follows: 20 per cent for prices exceeding A$175, 30 per cent for prices exceeding A$225, and 40 per cent for prices exceeding A$300. More information on this measure can be found in Box 4.6.
Foreign retirement visa holders buying their homes
Retirement visa holders will be exempt from additional foreign acquirer duty for purchases of their principal place of residence on or after 1 January 2023. This change will ensure that, subject to conditions, holders of retirement visas who purchase a home will not be subject to a surcharge rate of duty, and only duty at standard concessional rates will apply to eligible transactions.
Payroll tax rebate for apprentices and trainees
The 50 per cent payroll tax rebate for wages paid to apprentices and trainees will be extended for 12 months until 30 June 2023. In addition to apprentice and trainee wages generally being exempt from payroll tax, this rebate will provide additional support to employment in the ongoing recovery from COVID-19, in particular supporting youth employment and businesses who employ trainees and apprentices.
86
Budget Strategy and Outlook 2022-23
| 4.4 | Revenue by operating statement category |
| 4.4.1 | Taxation revenue |
Chart 4.3 outlines the composition of estimated state taxation revenue for 2022–23, with the largest sources being payroll tax and transfer duty, together representing 52.9 per cent of the state’s total taxation revenue.
Payroll tax generally has a relatively stable base, with its growth usually driven by the underlying strength of the economy. Transfer duty can be variable, reflecting residential and non-residential market conditions.
Land tax growth can also reflect variability in the property market but is generally more stable than most other tax lines due to the relatively stable base and the effect of assessments being based on 3-year averages of land values.
| Chart 4.3 | State taxation by tax category, 2022–231 |
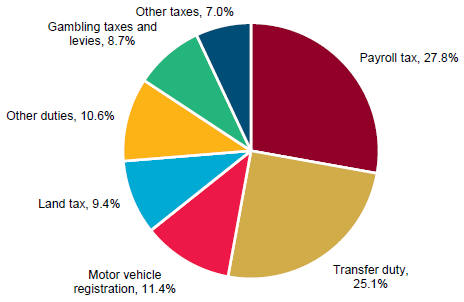
Note:
| 1. | Percentages may not add to 100 per cent due to rounding. ‘Other duties’ includes vehicle registration duty, insurance duty and other minor duties. ‘Other taxes’ includes the emergency management levy, waste disposal levy, guarantee fees and other minor taxes. |
Table 4.2 shows the main components of taxation revenue and the forecast revenues for each component across the forward estimates.
Total taxation revenue is expected to grow by 20.0 per cent in 2021–22. Improved taxation receipts in 2021–22 are primarily being driven by strong growth in transfer duty, payroll tax and land tax.
87
Budget Strategy and Outlook 2022-23
The growth in transfer duty reflects the combined impacts of significant increases in transaction volumes and the strong growth in dwelling prices over the year, as well as a recovery in collections from large and non-residential transactions. The strong growth in payroll tax reflects the strong labour market conditions in Queensland. The performance of the property market has also resulted in significant increases in land valuations that are flowing through to land tax collections.
Taxation revenue is expected to decline by 3.4 per cent in 2022–23 due to lower transfer duty as property transactions moderate from their elevated levels of activity, along with a slowing of turnover in large transactions from their 2021–22 levels.
Total taxation revenue is forecast to grow on average by around 5.1 per cent per annum across the 3 years ending 2025–26.
88
Budget Strategy and Outlook 2022-23
| Table 4.2 | State taxation revenue1 |
| 2020–21 | 2021–22 | 2022–23 | 2023–24 | 2024–25 | 2025–26 | |||||||||||||||||||
| Actual | Est. Act | Budget | Projection | Projection | Projection | |||||||||||||||||||
| $ million | $ million | $ million | $ million | $ million | $ million | |||||||||||||||||||
Payroll tax | 4,166 | 4,957 | 5,242 | 5,766 | 6,022 | 6,289 | ||||||||||||||||||
Duties | ||||||||||||||||||||||||
Transfer | 3,954 | 6,028 | 4,722 | 4,442 | 4,757 | 5,233 | ||||||||||||||||||
Vehicle registration | 662 | 684 | 645 | 665 | 685 | 712 | ||||||||||||||||||
Insurance2 | 1,095 | 1,249 | 1,311 | 1,376 | 1,444 | 1,503 | ||||||||||||||||||
Other duties3 | 31 | 32 | 32 | 33 | 33 | 35 | ||||||||||||||||||
Total duties | 5,742 | 7,994 | 6,711 | 6,515 | 6,919 | 7,482 | ||||||||||||||||||
Gambling taxes and levies | ||||||||||||||||||||||||
Gaming machine tax | 821 | 816 | 819 | 843 | 869 | 903 | ||||||||||||||||||
Health services levy | 121 | 112 | 109 | 117 | 127 | 132 | ||||||||||||||||||
Lotteries taxes | 359 | 366 | 372 | 383 | 395 | 410 | ||||||||||||||||||
Wagering taxes | 157 | 160 | 201 | 247 | 254 | 261 | ||||||||||||||||||
Casino taxes and levies | 107 | 114 | 124 | 139 | 143 | 149 | ||||||||||||||||||
Keno tax | 22 | 21 | 22 | 22 | 23 | 23 | ||||||||||||||||||
Total gambling taxes and levies | 1,586 | 1,589 | 1,646 | 1,752 | 1,810 | 1,879 | ||||||||||||||||||
Other taxes | ||||||||||||||||||||||||
Land tax | 1,524 | 1,603 | 1,773 | 2,019 | 2,268 | 2,365 | ||||||||||||||||||
Motor vehicle registration | 2,011 | 2,074 | 2,152 | 2,232 | 2,315 | 2,401 | ||||||||||||||||||
Emergency management levy | 581 | 599 | 624 | 649 | 676 | 704 | ||||||||||||||||||
Waste disposal levy | 303 | 331 | 339 | 407 | 420 | 433 | ||||||||||||||||||
Guarantee fees | 292 | 307 | 320 | 323 | 317 | 314 | ||||||||||||||||||
Other taxes4 | 44 | 46 | 36 | 37 | 38 | 39 | ||||||||||||||||||
Total taxation revenue | 16,249 | 19,500 | 18,842 | 19,700 | 20,785 | 21,905 | ||||||||||||||||||
Notes:
| 1. | Numbers may not add due to rounding. |
| 2. | Includes duty on accident insurance premiums. |
| 3. | Includes duty on life insurance premiums. |
| 4. | Includes the statutory insurance scheme levy and nominal defendant levy. |
89
Budget Strategy and Outlook 2022-23
Payroll tax
Payroll tax collections have improved substantially in line with the strong rebound in economic and labour market conditions in Queensland following the initial COVID-19 crisis in mid-2020. Payroll tax is expected to be 19.0 per cent higher in 2021–22 compared to 2020–21, reflecting the lower base in 2020–21 due to COVID-19 relief measures, and strong growth in employment and a strengthening of wages growth in 2021–22.
Payroll tax is expected to grow by 5.8 per cent in 2022–23 and average annual growth of around 6.1 per cent is forecast over the 4 years ending 2025–26. This is broadly in line with the expected ongoing solid employment and wage growth over the forward years and also reflects the impact of the mental health levy.
As outlined earlier, the 50 per cent payroll tax rebate for wages paid to apprentices and trainees will be extended for 12 months until 30 June 2023.
| Box 4.1 | Supporting mental health services |
The Mental Health Select Committee, in its report to Parliament – Report No. 1, 57th Parliament – Inquiry into the opportunities to improve mental health outcomes for Queenslanders – identified significant opportunities to improve the mental health and wellbeing of Queenslanders, including:
| • | greater involvement of people with lived experience in the system |
| • | greater use of health data to inform service delivery |
| • | expanded GP and other community-based mental health services |
| • | greater support services in schools |
| • | expanding alternative entry points and emergency department diversion services |
| • | utilising health practitioners’ full scope of practice. |
Queensland Health advised the Committee that it spent an estimated $ 1.35 billion on mental health in 2020–21 and a further $ 139 million on alcohol and other drug (AOD) services. Even so, the Committee considered it was evident that to reform Queensland’s mental health and AOD system, a substantial increase in investment is required.
In the 2022–23 Queensland Budget, the government is providing an additional $1.645 billion in operating funding plus an additional $28.5 million in capital funding to support initiatives under a new 5-year plan Better Care Together: a plan for Queensland’s state-funded mental health, alcohol and other drug services, and to meet Queensland’s obligations under the National Agreement on Mental Health and Suicide Prevention.
To fund the enhancements to mental health services, and to provide ongoing sustainable funding for this critical element of the state’s health system, a mental health levy will be applied to payroll tax liabilities arising on or after 1 January 2023, but will only be applicable to large employers, or groups of employers, with annual Australian taxable wages over $10 million and an additional levy applied to Australian taxable wages over $100 million.
90
Budget Strategy and Outlook 2022-23
The mental health levy will be applied as follows:
| • | a 0.25 per cent levy on the annual Australian taxable wages of employers, or groups of employers above $10 million |
| • | an additional 0.5 per cent levy on the annual Australian taxable wages of employers, or groups of employers, above $100 million. |
Given this reform is a specific levy, as distinct from a change in tax rates, the levy will only apply to the portion of the wages above the respective taxable wage amounts (i.e. on a marginal basis).
The levy is estimated to provide annual revenue of $425 million by 2025–26. The revenue raised from the levy will be utilised as a funding source for future expenditure on mental health and associated services and investment.
Queensland’s payroll tax exemption threshold of $1.3 million threshold is one of the highest thresholds of all states and territories, meaning that most small businesses would not be liable for payroll tax. Additionally, the standard rate of 4.75 per cent is one of the lowest tax rates compared to other jurisdictions, and there is a one percentage point discount for eligible regional employers.
There is also a deduction available for employers between the exemption threshold of $1.3 million and the current deduction threshold of $6.5 million that reduces the amount of tax payable between this wage range.
| Box 4.2 | Tax relief for small and medium businesses |
Small and medium businesses are the backbone of Queensland’s economy and comprise more than 99 per cent of businesses operating across the state.
Many small and medium enterprises have been severely impacted over the past few years, due to the COVID-19 pandemic and the related health and border restriction measures, as well as natural disasters.
A number of these businesses are also experiencing higher input costs and constraints to grow their operation and workforce, given the tight national labour market and ongoing global supply chain disruptions.
In recognition of the important role that small to medium businesses play in the Queensland economy, the government is providing payroll tax relief to small and medium businesses across the state, through adjustments to the existing payroll tax deduction framework from 1 January 2023.
This targeted payroll support measure will help to minimise the cost pressures on eligible businesses and provide confidence to those businesses to employ additional Queenslanders to take advantage of economic opportunities that are emerging strongly across the state.
Under the current regime, employers, or groups of employers, with annual Australian taxable wages between $ 1.3 million and $6.5 million can claim a deduction from their taxable wages, which phases out at a rate of $1 for every $4 of taxable wages above the $1.3 million threshold.
91
Budget Strategy and Outlook 2022-23
The deduction will be extended from the current ceiling of $6.5 million in annual Australian taxable wages up to $10.4 million, reflecting an increase in the phase out rate of the deduction from $1 for every $4 to a rate of $1 for every $7 of taxable wages above the $1.3 million threshold.
This reform is estimated to benefit over 12,000 Queensland businesses and will save a business paying $6.5 million in annual taxable wages over $26,000 in payroll tax each year (Table 4.3).
| Table 4.3 | Tax savings for indicative annual taxable wages |
Annual taxable wages ($) | Tax saving1 ($) | |
2,000,000 | 3,563 | |
4,000,000 | 13,741 | |
6,000,000 | 23,920 | |
6,500,000 | 26,464 | |
8,000,000 | 16,971 | |
10,000,000 | 2,829 |
Note:
| 1. | This represents a full 12 month saving, noting that this policy will only be implemented for a part year in 2022–23. Based on standard tax rates. |
Duties
Transfer duty
Transfer duty is charged on ‘dutiable transactions’, including transfers of land in Queensland or Queensland business assets.
The Queensland Government offers extensive concessions for the transfer of land where the property is purchased as a home. This means eligible home buyers pay a one per cent concessional rate on the first $350,000 of dutiable value, rather than the normal scheduled rates of between 1.5 per cent and 3.5 per cent.
If a first home buyer purchases a property up to $500,000 they will pay no duty, with reduced rates available up to $550,000.
Transfer duty is estimated to be 52.5 per cent higher in 2021–22 compared with 2020–21, driven by substantial increases in prices and transaction volumes. This reflects strong activity in the residential housing sector since mid-2020, with transactions in all components of the residential market (investors, principal place of residence and first home buyers) showing significant growth, although first home activity has slowed following expiry of the Homebuilder grant.
As shown in Chart 4.4, residential transactions have grown strongly since the peak of the emergency health restrictions required to control the initial spread of COVID-19 in April 2020.
92
Budget Strategy and Outlook 2022-23
| Chart 4.4 | Residential property transactions by concession type (monthly) |
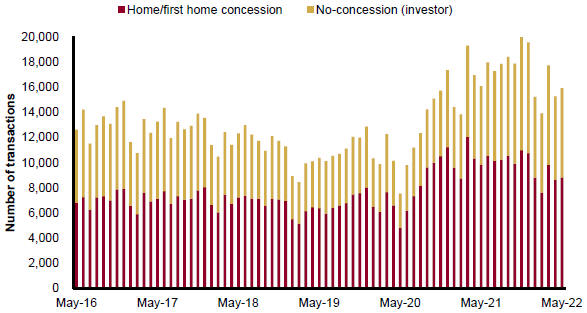
The level of transfer duty collections in 2022–23 is expected to unwind somewhat as residential housing market activity declines but is still forecast to remain well above previous levels. Residential transaction volumes, which exceeded 207,000 in the 12 months to May 2022 compared to an average of around 149,000 in the previous 5 years, are expected to moderate following the recent surge in activity and in the context of expected future interest rate increases.
As a result, transfer duty is forecast to decline by 21.7 per cent in 2022–23 and by a further 5.9 per cent in 2023–24. However, transfer duty revenue in those years is still expected to remain well above 2019–20 and 2020–21 levels.
After moderating in the near term, transfer duty from the non-residential sector is forecast to grow steadily over subsequent years, supporting a return to overall growth in 2024–25 and 2025–26.
Vehicle registration duty
Vehicle registration duty applies to applications to register or transfer a vehicle. Duty is imposed on the dutiable value, with the applicable rate dependent on the type of vehicle. An additional amount of registration duty is imposed on applications to register or transfer vehicles (other than special vehicles or heavy vehicles) with a dutiable value of more than $100,000.
Revenue from vehicle registration duty in 2021–22 is expected to be 3.4 per cent higher than in 2020–21, driven by the continued strength in vehicle sales in line with the high levels of broader consumption expenditure experienced as part of the recovery from COVID-19.
Vehicle registration duty is expected to decline by 5.7 per cent in 2022–23, reflecting a return to more normal levels of vehicle transactions as the impact of COVID-19 stimulus measures and the expenditure switching from overseas travel restrictions abates. Vehicle registration duty is then forecast to grow by around 3.3 per cent per annum.
93
Budget Strategy and Outlook 2022-23
Land tax
Land tax is imposed on the taxable value of a landowner’s aggregated holdings of freehold land owned in Queensland, as at midnight on 30 June each year. The landowner’s home and some other specified types of landholdings are exempt.
Individuals other than absentees are generally liable for land tax if the total taxable value of the freehold land owned by that person as at 30 June is equal to or greater than $600,000. Companies, trustees and absentees are liable for land tax if the total taxable value of the freehold land owned as at 30 June is equal to or greater than $350,000.
Land tax is expected to grow by 5.2 per cent in 2021–22 and 10.6 per cent in 2022–23, with the 2022–23 forecast driven by the impact of the solid land value growth expected in line with the current strength of the residential property market. The impact of 3-year averaging of land valuations has moderated the uplift in 2022–23 but additional value growth is expected in the next valuation, resulting in further land tax growth in 2023–24.
Average annual growth of 10.1 per cent is forecast for land tax over the 3 years ending 2025–26, reflecting the flow-on impact of recent and expected ongoing increases in land valuations due to the strength of the residential and non-residential property market.
| Box 4.3 | Queensland’s competitive land tax settings |
Despite the recent increases in land values around the nation, the current threshold and exemptions in Queensland ensures that most landowners won’t have a land tax liability, and those with small investment property holdings generally have only a minimal land tax liability.
The thresholds at which land tax becomes payable in Queensland are among the most generous in Australia. For individuals, the land tax-free threshold of $600,000 is the second highest in the country.
The generosity of Queensland’s land tax thresholds is even more apparent when the threshold is put in the context of land values. Queensland’s threshold is competitive having regard to its comparative average dwelling and associated land values. Several other jurisdictions have land tax thresholds that are a much lower proportion of average prices.
Depending on the ownership and use of the land, a range of exemptions may be available meaning the value of exempt parcels is excluded from the total taxable value, reducing the amount you pay.
In particular, the key exemption is for the principal place of residence (the dwelling you live in), meaning that most Queensland homeowners have no liability for land tax. In addition, land tax in Queensland is subject to a system of 3-year averaging of the land value, which helps further reduce the impacts of increasing land values on the tax payable by landholders.
On a comparative basis, landowners in Queensland may be liable for much lower land tax than in other states. For example, an indicative landowner with taxable holdings of $4.5 million in Queensland, would pay $2,698 less than in NSW, $9,975 less than in Victoria and at least $1,300 less than in Western Australia.
94
Budget Strategy and Outlook 2022-23
Gambling taxes and levies
A range of gambling activities are subject to state taxes and levies. Total gambling tax and levy collections are only expected to be 0.2 per cent higher in 2021–22 compared with 2020–21. This largely reflects the moderation in collections from their elevated levels in 2020–21 as they rebounded from the COVID-19 related weakness on gambling activity in 2019–20.
Total gambling tax and levy collections are expected to grow by 3.6 per cent in 2022–23, largely due to the half year impact of the new racing levy. Average annual growth of 4.5 per cent is forecast for gambling tax revenue over the 3 years ending 2025–26.
| Box 4.4 | Sustainable funding of the racing industry |
On 6 June 2022, the government announced a new funding model to ensure ongoing sustainable funding for Queensland’s racing industry.
The new model recognises the significant changes that have occurred in the wagering market through the growth in online betting and will ensure all wagering operators are making an appropriate contribution to the future of the racing industry.
The changes will support 125 racing clubs across Queensland, particularly country racing clubs which play an important role in regional communities. Across the state, 85 communities host a race meeting which is their largest or second largest event each year.
Key elements of the reform are outlined below:
| • | applying a 5 per cent racing levy additional to the betting tax |
| • | taxing bonus bets or free bets |
| • | hypothecating 80 per cent of total betting tax revenue to Racing Queensland. |
The 5 per cent racing levy and taxing of bonus bets are expected to raise an additional $80 million per year. Taxing bonus bets will bring Queensland into line with betting tax arrangements in all other jurisdictions, other than Tasmania.
All additional revenue raised through the levy and taxing bonus bets will be allocated to Queensland’s racing industry.
Raising the share of betting tax revenue allocated to the racing industry from the current 35 per cent to 80 per cent will provide certainty for the industry and the 6,500 direct jobs it supports by replacing a range of existing funding streams, including short-term government funding programs.
Long term funding certainty will provide the opportunity to increase prize money, enhance infrastructure and provide better training facilities.
The new funding arrangements will be implemented through amendments to the Betting Tax Act 2018. Subject to the passage of legislative amendments, it is proposed that the changes will take effect from 1 December 2022.
95
Budget Strategy and Outlook 2022-23
Waste disposal levy
The waste disposal levy commenced on 1 July 2019 and applies to 39 local government areas, covering more than 90 per cent of the state’s waste generation and population. The levy is paid by landfill operators on waste disposed to landfill. Exemptions from the levy exist for particular waste, such as waste from declared disasters, waste donations to charitable recyclers and lawfully managed and transported asbestos.
The levy commenced at $75 per tonne for general waste and increased by $5 per tonne per annum in its first 3 years of operation. The first annual increase of $5 per tonne was deferred by 6 months to 1 January 2021 to provide financial relief from the impacts of COVID-19.
To help Queensland reach its waste recovery targets, changes to the waste levy will commence from 1 July 2022. These include dividing the existing levy zone into metropolitan and regional levy areas, which will have different annual levy rate increases for each levy area. Additionally, changes to levy exemptions for particular types of waste will take effect from 1 July 2023.
Revenue from the waste disposal levy is estimated to be $331 million in 2021–22, 9.1 per cent higher than in 2020–21. Revenue is forecast to grow by 2.3 per cent in 2022–23 reflecting regulated levy rate increases.
Seventy per cent of proceeds from the waste levy will be used for resource recovery and other programs that reduce the impact of waste and protect the environment and local communities.
Queensland’s competitive tax status
Maintaining the competitiveness of Queensland’s tax system is critical to provide a competitive advantage to business and to moderate the tax burden on citizens.
Maintaining a competitive tax regime is also fundamental to the Queensland Government’s economic strategy and its commitment to creating more jobs in more industries and maintaining a competitive investment environment.
Importantly, as Chart 4.5 shows, taxation per capita in Queensland was lower in 2020–21 than the average taxation per capita in the other states and territories, highlighting the ongoing competitiveness of Queensland’s taxation regime.
Based on the latest available actuals data from states and territories, Queensland’s taxation per capita in 2020–21 was $647 less than the average of other jurisdictions.
On average, Queenslanders paid $1,067 less tax than New South Wales residents and $492 less than Victorian residents, as highlighted in Chart 4.5.
96
Budget Strategy and Outlook 2022-23
| Chart 4.5 | Taxation per capita, 2020–21 |
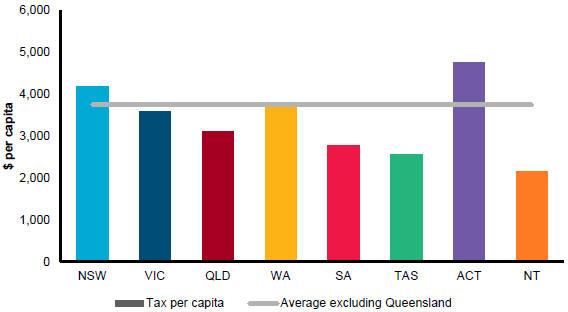
Sources: ABS Government Finance Statistics and ABS National, State and Territory Population.
Other measures of tax competitiveness include estimates by the Commonwealth Grants Commission (CGC) of Queensland’s tax effort compared with other jurisdictions, and each state or territory’s taxation revenue as a proportion of the respective size of its economy.
The CGC’s revenue raising effort ratios are an indicator of the extent to which governments burden their revenue bases, with a lower ratio indicating a relatively lower taxation burden imposed by state taxes.
The CGC’s 2022 update assessed that Queensland’s tax effort in 2020–21 (latest available CGC estimate, based on 2020–21 data and using total tax revenue effort for CGC assessed taxes) was 1.6 per cent below the national average.
The third measure of tax competitiveness (that is, taxation as a share of GSP) also confirms that Queensland’s taxes are highly competitive, being below the average of the other states and territories, and significantly lower than the major southern states.
Table 4.4 summarises the estimates of these 3 measures compared with other states and territories and demonstrates that the Queensland tax system is very competitive.
97
Budget Strategy and Outlook 2022-23
| Table 4.4 | Tax competitiveness, 2020–21 |
| NSW | VIC | Qld | WA | SA | TAS | ACT4 | NT | Avg5 | ||||||||||||||||||||||||||||
Taxation per capita1 ($) | 4,168 | 3,593 | 3,101 | 3,722 | 2,769 | 2,560 | 4,763 | 2,152 | 3,748 | |||||||||||||||||||||||||||
Taxation effort2 (%) | 102.2 | 97.9 | 98.4 | 99.8 | 93.8 | 90.7 | 148.9 | 76.1 | 100.0 | |||||||||||||||||||||||||||
Taxation % of GSP3 (%) | 5.3 | 5.0 | 4.4 | 2.8 | 4.2 | 4.0 | 4.7 | 2.1 | 4.5 | |||||||||||||||||||||||||||
Notes:
| 1. | 2020–21 data (latest available actuals). Sources: ABS Government Finance Statistics and ABS National, State and Territory Population. |
| 2. | 2020–21 data (latest available). Source: Commonwealth Grants Commission 2022 Update—total tax revenue effort for assessed taxes (payroll, transfer duty, land tax, insurance duty and motor vehicle taxes). Revenue raising effort ratios are an indicator of the extent to which governments burden their revenue bases. |
| 3. | 2020–21 data (latest available). Sources: ABS Annual State Accounts and ABS Government Finance Statistics |
| 4. | Figures include municipal rates. |
| 5. | Weighted average of states and territories, excluding Queensland (aside from taxation effort, which is the average of all states). |
Tax expenditures
Tax expenditures are reductions in taxation revenue that result from the use of the tax system as a policy tool to deliver government policy objectives. Tax expenditures are provided through a range of concessions, including tax exemptions, reduced tax rates, tax rebates, tax deductions and provisions which defer payment of a tax liability to a future period.
The substantial tax relief provided by the Queensland Government to Queensland businesses and property owners in response to the COVID-19 crisis resulted in significant tax expenditures in both 2019–20 and 2020–21. The Queensland Government continued to provide tax relief and concessions through a range of measures in 2021–22.
The Tax Expenditure Statement (Appendix B) provides details of tax expenditure arrangements provided by the Queensland Government.
| 4.4.2 | Grants revenue |
Grants revenue is comprised of Australian Government grants (including GST), grants from the community and industry, and other miscellaneous grants.
A 5.6 per cent increase in total grants revenue is forecast for 2022–23, primarily driven by increases in GST revenue but partially offset by decreases in Australian Government grants (Table 4.5).
98
Budget Strategy and Outlook 2022-23
| Table 4.5 | Grants revenue1,2 |
2020–21 Actual $ million | 2021–22 Est. Act $ million | 2022–23 Budget $ million | 2023–24 Projection $ million | 2024–25 Projection $ million | 2025–26 Projection $ million | |||||||||||||||||||
Current grants | ||||||||||||||||||||||||
GST revenue grants3 | 15,419 | 15,813 | 17,811 | 18,270 | 19,039 | 19,200 | ||||||||||||||||||
Australian Government grants | 13,834 | 14,611 | 14,261 | 15,300 | 15,646 | 16,110 | ||||||||||||||||||
Other grants and contributions | 312 | 292 | 301 | 333 | 290 | 293 | ||||||||||||||||||
Total current grants | 29,566 | 30,716 | 32,372 | 33,903 | 34,975 | 35,603 | ||||||||||||||||||
Capital grants | ||||||||||||||||||||||||
Australian Government capital grants | 3,420 | 2,594 | 2,854 | 3,857 | 3,265 | 3,115 | ||||||||||||||||||
Other grants and contributions | 27 | 66 | 17 | 20 | 35 | 0 | ||||||||||||||||||
Total capital grants | 3,447 | 2,661 | 2,870 | 3,877 | 3,300 | 3,115 | ||||||||||||||||||
Total Australian Government payments | 32,674 | 33,018 | 34,925 | 37,427 | 37,950 | 38,424 | ||||||||||||||||||
Total grants revenue | 33,013 | 33,376 | 35,242 | 37,780 | 38,275 | 38,718 | ||||||||||||||||||
Notes:
| 1. | Numbers may not add due to rounding. |
| 2. | Amounts in this table may differ to those outlined in Chapter 9 due to different classification treatments. |
| 3. | Includes entitlements to payments associated with the ‘no worse off’ guarantee as part of the Australian Government changes to the GST distribution. |
GST revenue
Improvements in the national GST pool, along with an increase in Queensland’s share of the pool, have been the key drivers of stronger forecasts for Queensland’s GST revenue.
Queensland’s GST revenue in 2021–22 is expected to be 2.6 per cent higher than 2020–21, with this growth primarily driven by Queensland receiving a larger share of the GST pool, with the GST pool being slightly larger (growing by less than one per cent) compared with 2020–21.
Queensland’s GST revenue is expected to grow a further 12.6 per cent in 2022–23 compared with 2021–22. This increase in GST revenue is primarily due to:
| • | the Australian Government forecasting particularly strong 9.1 per cent growth in the national GST pool in 2022–23 |
| • | the Commonwealth Grants Commission recommending to the Australian Government that Queensland should receive a larger share of GST in 2022–23 compared with 2021–22. |
99
Budget Strategy and Outlook 2022-23
GST revenue is forecast to continue to grow over the forward estimates, by 2.6 per cent in 2023–24, 4.2 per cent in 2024–25 and 0.85 per cent in 2025–26. This reflects the Australian Government’s forecast growth in the GST pool over the forward estimates, which is partially offset by the expectation that Queensland’s share of the GST pool will decline over this period due to the recent increases in Queensland’s mining royalty revenue.
Revisions to the GST pool
The Australian Government’s national GST pool forecasts were upgraded in the 2022–23 Federal Budget, to be $13.4 billion higher across the 4 years to 2024–25 compared with 2021–22 Federal Budget estimates.
The 2022–23 Federal Budget stated that increases in GST receipts largely reflect upgrades to consumption subject to GST and flow-on impacts from strong private dwelling investment.
The 2022–23 Federal Budget also indicated that expected increases in employment and wages are expected to flow through to higher nominal consumption, while the strength of private dwelling investment, combined with near-term supply chain shortages, has driven up prices in the construction sector, thereby flowing through to overall GST collections.
Chart 4.6 compares GST revenue pool forecasts published in the 2020–21 and 2021–22 Federal Budgets.
| Chart 4.6 | Australian Government forecast of national GST revenue pool1 |
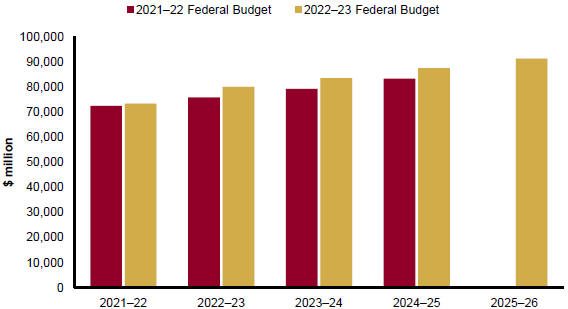
Note
| 1. | The 2021–22 Federal Budget estimates are limited to the 2024–25 financial year. |
100
Budget Strategy and Outlook 2022-23
GST – Queensland’s assessed fiscal capacity
In early 2022, the Australian Government accepted the CGC’s recommendation that Queensland requires a larger share of GST revenue in 2022–23 compared to 2021–22.
The CGC’s recommendation that Queensland receive an increased share of the GST pool was driven by the following factors:
| • | mining revenue – a decrease in the value of coal production in 2020–21, combined with an increase in the value of iron ore production in Western Australia, reduced Queensland’s relative capacity to raise mining revenue |
| • | population growth – Queensland’s population growth rate was faster in 2020–21 than in 2017–18, thereby increasing Queensland’s assessed need for new infrastructure. |
The increase in Queensland’s share of the GST pool as a result of these factors was partially offset by the following factors:
| • | wages expense – wage growth in Queensland was lower than the national average between 2017–18 and 2020–21, decreasing the state’s GST share |
| • | Commonwealth payments – Queensland’s share of payments, particularly for infrastructure and health expenses was higher in 2020–21 compared to 2017–18, thereby decreasing Queensland’s GST share |
| • | capital improvements and cost of construction in 2020–21 compared to 2017–18 – Queensland’s total urban transport investment increased faster than growth in the GST pool and cost of construction grew less than the national average, thereby decreasing Queensland’s GST share. |
However, on balance, given the impacts of these range of factors, the CGC recommended that Queensland’s GST share should increase in 2022–23 relative to 2021–22.
Importantly, states and territories’ shares of GST revenue fluctuate over time based on the CGC’s assessment of their fiscal capacity and expenditure needs. Some key drivers of changes to Queensland’s and all states’ shares of GST are factors that are not Queensland specific, including the impacts of changes in royalty revenue from iron ore in Western Australia and transfer duty collections in New South Wales.
| Box 4.5 | Impacts of Australian Government changes to state shares of GST |
Queensland faces substantial risks in its longer-term outlook for GST revenue (i.e. beyond the forward estimates period outlined in this Budget) from the changes made to the system of Horizontal Fiscal Equalization (HFE) by the Australian Government in 2018.
The Australian Government legislated changes to HFE with the proposed aim of improving the resilience of the HFE system against economic shocks and to reduce volatility in GST revenues to states and territories.
101
Budget Strategy and Outlook 2022-23
As a result of the changes, states will no longer receive GST revenue to equalise them to the same standard as the fiscally strongest state. Instead, states will be equalised to a ‘similar standard’ – in effect being the stronger of New South Wales or Victoria.
However, under the Australian Government’s changes, Western Australia (which has been the fiscally strongest state over the long term) will now retain a much greater share of GST revenue at the expense of all other states once the ‘no worse off’ guarantee expires in 2026–27.
At a time when all other states and territories are facing fiscal challenges and are recovering from the substantial fiscal impacts of COVID, Western Australia is estimated to have a net operating surplus in every year from 2020–21 to 2025–26 of between $1.5 billion and $5.8 billion, partially reflecting these Australian Government changes to GST.
These changes are now leading to a real and fundamental reshaping of states’ fiscal capacities.
Under the Australian Government’s changes, Western Australia is benefiting from its heightened iron ore mining royalties without appropriate adjustments being made to its share of GST revenue.
The Commonwealth’s own estimates for payments under the ‘no worse off’ guarantee are estimated to total almost $15 billion over the forward estimates as a consequence of this. When the guarantee expires at the end of 2026–27, this cost will be borne by the states other than Western Australia.
The Queensland Government is continuing to engage with the Australian Government in advance of 2026–27 to provide greater certainty and fairness in relation to future GST payments. This will be critical to inform future state budgets.
A review of the changes is scheduled to be undertaken by the Australian Productivity Commission prior to the expiry of the ‘no worse off’ guarantee.
Queensland considers this review needs to be prioritised, with a clear emphasis on the long-term fiscal impacts of the changes, to ensure the review informs further consideration of the Australian Government’s changes and to ensure Queensland continues to receive its fair share of GST revenue over the longer term.
Australian Government payments
Australian Government payments to Queensland in 2022–23 are expected to total $34.925 billion, representing an increase of $1.907 billion (5.8 per cent) compared to payments in 2021–22. This increase is attributable to a 12.6 per cent increase in GST.
Chapter 7 provides a detailed overview of Federal-State financial arrangements, including Australian Government payments to Queensland.
Other grants and contributions
Other grants and contributions are funds received from other state and local government agencies, other bodies and individuals.
102
Budget Strategy and Outlook 2022-23
The main sources of contributions are those received from private enterprise and community groups to fund research projects and community services and contributed assets and goods and services received for a nominal amount. Contributions exclude Australian Government grants and user charges.
Other grants and contributions comprise only a small share of total grant revenue (0.9 per cent in 2022–23).
| 4.4.3 | Royalty revenue |
The state earns royalties from the extraction of coal, base and precious metals, bauxite, petroleum and gas, mineral sands and other minerals. Royalties ensure a share of the proceeds of the extraction of non-renewable resources are returned to the community. Land rents are also earned from pastoral holdings, and mining and petroleum leases.
There is a high degree of uncertainty associated with estimates of commodity prices, which can have significant impacts on royalty revenue. Risks to commodity export volumes, in particular coal, also have the potential to impact Queensland’s royalty estimates, although changes to export volumes may in turn impact prices.
The Revenue and Expense Assumptions and Sensitivity Analysis (Appendix C) outlines key parameter assumptions, and the sensitivity of coal royalty estimates to individual changes in price, volume and exchange rate parameters.
Coal and oil prices have risen substantially since the 2021–22 Queensland Budget, providing a short-term boost to revenues. However, the recent spike in prices is primarily driven by a range of short-term supply side factors and disruptions. As such, prices are expected to return to more sustainable levels in 2023, but the timing and extent of the decline remains uncertain. Forecast royalties and land rents are detailed in Table 4.6.
| Table 4.6 | Royalties and land rents1 |
| 2020–21 Actual $ million | 2021–22 Est. Act $ million | 2022–23 Budget $ million | 2023–24 Projection $ million | 2024–25 Projection $ million | 2025–26 Projection $ million | |||||||||||||||||||
Coal | 1,740 | 7,290 | 5,480 | 3,297 | 3,539 | 3,699 | ||||||||||||||||||
Petroleum2 | 298 | 1,185 | 1,626 | 1,116 | 1,025 | 996 | ||||||||||||||||||
Other royalties3 | 499 | 483 | 538 | 505 | 488 | 494 | ||||||||||||||||||
Land rents | 126 | 176 | 190 | 193 | 198 | 203 | ||||||||||||||||||
Total royalties and land rents | 2,662 | 9,135 | 7,832 | 5,112 | 5,251 | 5,392 | ||||||||||||||||||
Notes:
| 1. | Numbers may not add due to rounding. |
| 2. | Includes liquefied natural gas (LNG). |
| 3. | Includes base and precious metal and other mineral royalties. |
103
Budget Strategy and Outlook 2022-23
| Box 4.6 | Progressive coal royalty rates |
Coal royalties are designed to ensure all Queenslanders receive a fair and appropriate return on the state’s valuable and limited natural resources.
The royalty rate for coal is determined based on the average price per tonne of coal sold, disposed of or used in a royalty return period.
Since 1 October 2012, the highest marginal royalty rate applicable to Queensland coal royalties has been a rate of 15 per cent, payable on that part of the average price per tonne exceeding A$150.
Given the exceptional surge in coal prices experienced across 2021 and early 2022, with spot metallurgical coal prices reaching as high as around A$900 per tonne, the current royalty structure does not provide a fair return to Queenslanders during periods of such high prices.
To ensure Queenslanders receive a fair return on the use of the state’s valuable and limited natural resources in periods of high prices, the government is introducing 3 new tiers to the coal royalty structure, with effect for coal sold, disposed of or used on or after 1 July 2022:
| 1. | an additional tier with a rate of 20 per cent on that part of the average price per tonne that is more than A$175 but not more than A$225 |
| 2. | a further tier with a rate of 30 per cent on that part of the average price per tonne that that is more than A$225 but not more than A$300 |
| 3. | a further tier with a rate of 40 per cent on that part of the average price per tonne that is more than A$300. |
This is estimated to generate additional royalty revenue of around $1.2 billion over the 4 years ending 2025–26. However, a substantial proportion (around $765 million) will be in 2022–23, as coal prices are expected to return to longer run prices over the next year.
The addition of the new tiers is not expected to have any material impacts on the coal industry or viability of producers, given the increases are applied only at relatively high prices.
Based on unit export values over the past 10 years, average hard coking coal prices have only been higher than A $175 per tonne around half the time, while average thermal coal prices have only been above A $175 per tonne around 2.5 per cent of the time over this period (based on monthly averages, only observed in 3 months over the 10 year period ending February 2022) (Chart 4.7).
The increased return to Queenslanders received during future periods of high prices will help enable the provision of essential infrastructure and services to meet the needs of Queenslanders across all regions of the state.
Historical changes in coal royalty rates and tiers
It is also important to recognise that coal companies have experienced a long period of stability in terms of the royalty regime, without any changes to royalty rates or price tiers in Queensland over almost a decade since October 2012, despite prices rising substantially over that time.
This follows a range of changes to the royalty regime prior to that period, with at least 6 major changes made to coal royalty rates over the previous 20 years.
104
Budget Strategy and Outlook 2022-23
This included the introduction in 2008 of a second tier with a new top rate of 10 percent over A$100 per tonne, and in 2012 the introduction of a 3 tier system of 7 per cent up to A$100 per tonne, 12.5 per cent above A$100 up to A$150 per tonne, and 15 percent above A$150 per tonne.
However, prices have increased substantially over the last few decades, from well under A$100 per tonne in the 1990s, with an underlying persistent upward trend in prices over time, including previous periods of exceptionally high prices.
As such, the changes being made are timely and appropriate to ensure the state’s coal royalty regime continues to provide a fair return to Queenslanders during future periods of high prices.
Chart 4.7 outlines the extent to which major changes have been made to the coal royalty rates since the 1990s.
| Chart 4.7 | Historical average coal prices |
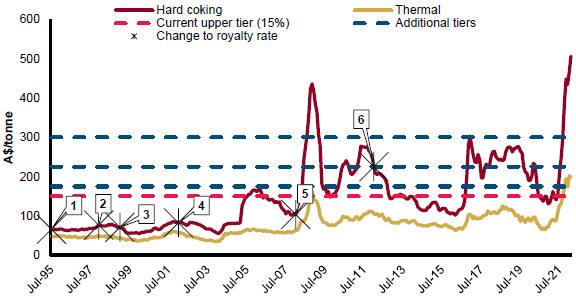
Notes:
| 1. | 1994: standard rate of 7 per cent of value for exports. |
| 2. | 1997–98: base special royalty (BSR) was introduced for certain mines. Where BSR applied, the coal royalty rate was 5 per cent, with 7 per cent applying to any excess tonnage. |
| 3. | 1999: standard 7 per cent royalty applied from 1 July 2000 (no reduction where BSR paid). BSR was reduced to $3.00 per tonne (ending June 2000). |
| 4. | 2002: deductions for rail freight and road haulage ceased to apply. |
| 5. | 2008: additional tier added, with rate of 7 per cent applied up to A$100 per tonne, and a 10 per cent rate applied over A$100 per tonne. |
| 6. | 2012: further changes to tier structure: 7 per cent applied to a value of up to A$100 per tonne, 12.5 per cent to values from over A$100 to A$150 per tonne, and 15 per cent to values above A$150 per tonne. |
Source: ABS International Trade in Goods and Services (unpublished)
105
Budget Strategy and Outlook 2022-23
Coal royalties
A large proportion of Queensland’s royalties and land rents comes from coal mining and the majority of this revenue is attributable to the hard-coking coal used in global steel production.
The lower level of royalties collected from thermal coal mining compared with hard-coking coal reflects the smaller volume of thermal coal mined in Queensland, the lower values per tonne of thermal coal and the 3-tiered coal royalty rate system, where lower value coal is subject to a lower average royalty rate. In 2021, coking coal represented almost 75 per cent of coal exported from Queensland.
Coal royalties are expected to total $7.290 billion in 2021–22. The increase has been driven by significant increases in global coal prices, which have been reflected in price rises for Queensland coal exports. On a year-average basis, the premium hard coking coal price is estimated to be US$364 per tonne in 2021–22, an increase of more than 200 per cent on 2020–21.
A key driver of the recent surge in coal prices has been China’s strong demand for coal from other exporters (due to its reduced importation of Australian coal), which appears to have temporarily distorted global market dynamics, leading to a shortage in supply.
Coal prices have also been impacted as a result of European buyers reducing their purchases of Russian coal following the commencement of the Russia-Ukraine conflict.
COVID-19 and weather-related supply shortages are also impacting prices. Significant weather events globally included:
| • | weeks of heavy rain in September and October 2021 affecting coal mines in Mongolia and China |
| • | heavy rains and mudslides crippled various coal infrastructure in Canada |
| • | heavy rains in Indonesia in late 2021 which delayed shipments. |
In addition, a number of weather events impacted on Australian supply. For example, heavy rainfall linked to La Niña weather conditions disrupted Australian supply, especially in New South Wales, leading to a declaration of force majeure in March 2022 at the Port Kembla Coal Terminal (72km south of Sydney).
In addition, there have been some coal mine closures, for example:
| • | Moranbah North (supplying metallurgical coal) was temporarily closed after an incident in late March 2022 (operations restarted on 31 May 2022) |
| • | Gregory coal mine (supplying metallurgical coal) reopening was delayed after an incident in September 2021 (operations expected to resume in September quarter 2022) |
| • | Curragh coal mine (supplying metallurgical and thermal coal) was temporarily closed in November 2021 (mine reopened after 3 weeks). |
The above events caused considerable disruption, which along with labour constraints resulted in tighter supply putting additional upward pressure on prices.
This has been further exacerbated by restocking demand due to power plants/steel mills drawing down their stockpiles of coal.
106
Budget Strategy and Outlook 2022-23
However, the primary factors and disruptions that have driven the recent spike in global coal prices are expected to be temporary in nature. COVID-19 and weather-related issues are expected to subside, resulting in an easing of the supply constraints and thus lessening the upward pressure on coal prices.
Further, China has begun to reduce its coal import volumes and rely more on its own domestic supply, driven by the recent slowdown in the Chinese economy. This is expected to moderate the global market distortions currently impacting prices.
In addition, prices of steel products globally have grown more slowly than prices for coal. For example, across the year ending 31 May 2022, average steel rebar prices were around 19 per cent higher than the previous year while the average price of steel products was around 21 per cent higher. In comparison, over the year ending 31 May 2022, average premium hard coking spot prices were around 221 per cent higher than the previous year.
The slower growth in steel prices will potentially lead to reduced profit margins for steel producers, given metallurgical coal is a key input into steel making. This implies that the current high hard coking coal prices are not sustainable in the longer term and downward pressure on coal prices is expected in the near term.
Current forecasts assume no Queensland coal is being exported to China over the forward estimates, however any changes to the current trade relationship with China could lead to the price of coal unwinding sharply. Developments in the Russia/Ukraine conflict could also lead to a significant downward risk to coal prices in the future.
The above commentary is supported by analysis from the Office of the Chief Economist for the Australian Government’s Department of Industry, Science, Energy and Resources1 which made several points in regard to metallurgical coal prices.
| • | A series of weather disruptions affecting coal mines in Mongolia and China resulted in upward price movements in late 2021, with the largest effect following weeks of heavy rains in September and October. |
| • | Non-weather supply disruptions have also picked up early in 2022, with infrastructure bottlenecks constraining output in Russia, and COVID impacts starting to affect output from Australia. On top of this, the Russian invasion of Ukraine sent prices to new records in March. |
| • | It is expected that disruptions will ease on some fronts over the remainder of 2022, allowing prices to start correcting. Over the outlook period, hard coking coal prices are expected to ease back from a war-affected peak of around US$460 a tonne in the March quarter 2022, to reach US$172 a tonne by the March quarter 2023. Prices are then expected to stabilise at around US$150 a tonne towards the end of the outlook period. |
While the issues discussed above indicate that coal prices are expected to decline significantly in time, the precise timing and magnitude of such a decline is not known. Treasury has taken an appropriately conservative approach to its coal forecasts and assumed prices will normalise in 2023.
| 1 | Australian Government (Department of Industry, Science, Energy and Resources, Office of the Chief Economist - Resources and Energy Quarterly March 2022, 2022 www.industry.gov.au/req accessed 6 June 2022 |
107
Budget Strategy and Outlook 2022-23
Given the expectation of substantially lower coal prices over subsequent years compared with the prices seen in late 2021 and the first half of 2022, coal royalty revenue is forecast to decline by almost 25 per cent in 2022–23 and by a further 40 per cent in 2023–24.
This largely reflects an expected 43.4 per cent fall in 2022–23 in hard coking coal prices (to US$206 per tonne) and a further fall in prices in 2023–24 (returning to US$160 per tonne).
Coal royalty revenue is forecast to grow by 7.3 per cent in 2024–25 and by a further 4.5 per cent in 2025–26 with crown export coal tonnages1 forecast to gradually increase over this period. This largely reflects the continued recovery in global economic activity from the COVID-19 pandemic.
Chart 4.8 shows coal export tonnage forecasts compared to the 2021–22 Queensland Budget outlook. This highlights that coal export tonnages have been revised downwards by around 4 per cent over the 4 years ending 2024–25, driven by the supply side issues discussed earlier and softer global demand.
Queensland’s coal export volumes have held up well despite restrictions on Chinese coal imports from October 2020. By November 2021, almost 90 per cent of the reduction in Queensland export tonnages to China had been offset by increased exports to India (up 17.2 million tonnes (Mt) to 58.1 Mt), Japan (up 11.5 Mt to 47.8 Mt) and South Korea (up 8.9 Mt to 32.7 Mt).
However, sustained exceptionally high prices for both metallurgical and thermal coal in late 2021 and so far in 2022 have tempered global demand for coal, resulting in a decline in export tonnages since late 2021. Coal export volumes peaked at 225 Mt in 2018–19. This is not expected to be reached again until 2025–26.
| 1 | Excludes coal where royalties are not paid to the Queensland Government, that is, private royalties. |
108
Budget Strategy and Outlook 2022-23
| Chart 4.8 | Export coal tonnages1 |
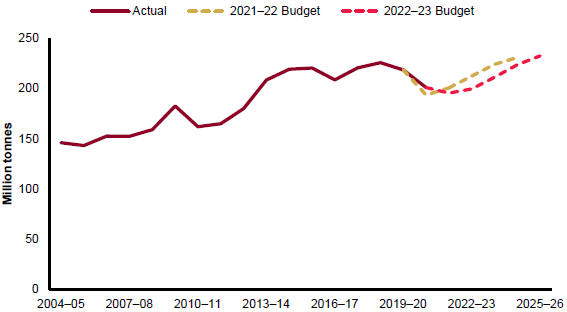
Note:
| 1. | Includes coal exports where royalties are not paid to the government, i.e. private royalties. This will not align with tonnages presented in Appendix C which exclude private royalties. |
Source: Unpublished ABS trade data and Queensland Treasury
Chart 4.9 shows hard coking coal price forecasts compared to the average quarterly price forecasts from the latest Consensus Economics forecasts, as well as forecasts from AME and the Department of Industry, Science, Energy and Resources’ (Australian Government) Office of the Chief Economist (OCE).
This comparison shows that the expected sharp decline in coal prices from current levels is broadly consistent with the expectations of other key forecasters that global coal prices will be substantially lower over coming quarters and years.
109
Budget Strategy and Outlook 2022-23
| Chart 4.9 | Coking coal price forecasts |
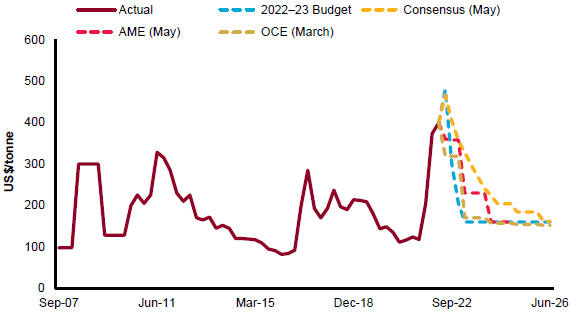
Sources: Consensus Economics, AME, OCE and Queensland Treasury.
An ongoing risk to coal export volumes over the medium to longer term is that Japan and South Korea have committed to achieving net zero CO2 emissions by 2050, while China has committed to achieve this by 2060. This may lead to an earlier reduction in thermal coal consumption in these countries than previously expected. In addition, South East Asia is generally moving away from coal fired power due to limited finances to fund coal fired power projects.
However, as outlined above, the majority of Queensland’s coal exports are metallurgical coal, with thermal coal only representing around 26 per cent of total coal exports in terms of volumes and 17 per cent in terms of values (based on 2021 export data).
Petroleum royalties
Compared to coal, petroleum royalties make up a smaller share of total royalties, though petroleum royalties have grown strongly as the export industry has matured.
Oil prices factor strongly into petroleum royalty forecasts. Most of the LNG produced in Queensland is sold under long-term contracts linked to oil prices, while the production level of the 3 major LNG plants is expected to be relatively stable across the forward estimates.
In 2021–22, revenue from petroleum and gas royalties are estimated to total $1.185 billion, 87.7 per cent higher than forecast at the 2021–22 Queensland Budget.
110
Budget Strategy and Outlook 2022-23
This is driven by the recent surge in oil prices, which rose from a low of US$6 per barrel on 21 April 2020 to over US$100 per barrel in 2022. Across 2021–22, the average (lagged) 1 price of oil is expected to increase to US$77 per barrel.
This also reflects 2021–22 being the first full year under the new volume-based royalty model, which replaced the previous wellhead model in October 2020.
The faster than expected recovery in the global economy has seen oil consumption grow at a faster rate than oil production, drawing down inventories and boosting oil prices to elevated levels, even prior to the Russian invasion of Ukraine. However, the commencement of the Russia-Ukraine conflict exacerbated the upward pressure on global oil prices, which increased from US$103 per barrel on 23 February 2022 (the day before the invasions) to a peak of nearly US$140 per barrel in early March 2022.
Reflecting the persistent elevated prices, the average (lagged) price of oil across 2022–23 is expected to increase to US$96 per barrel. As a result, petroleum royalties are forecast to grow by a further 37.1 per cent in 2022–23.
Oil production is expected to overtake oil consumption in 2022, which should put downward pressure on prices. Therefore, oil prices are expected to moderate from current levels over the forecast period reaching US$75 per barrel from September quarter 2024 onwards.
Reflecting the expected return to more sustainable oil prices, petroleum royalty revenue is expected to decline by 31.3 per cent in 2023–24, followed by falls of 8.2 per cent in 2024–25, and 2.8 per cent in 2025–26.
Other royalties
Other royalties include revenue from metals mined in Queensland such as copper, lead and zinc, and other minerals including bauxite.
Revenue from other royalties is estimated to total $483 million in 2021–22, 3.1 per cent lower than in 2020–21. This is largely driven by higher shipping costs, partially driven by COVID-19 related disruptions, which can be deducted from the mining revenue that is subject to royalty.
Revenue from Other royalties are expected to grow by 11.2 per cent in 2022–23 driven by a rise in bauxite royalties as bauxite volumes and values increase.
Other royalties are expected to decline by 6.0 per cent in 2023–24 and then by a further 3.4 per cent in 2024–25 because of declining prices across major base and precious metals.
| 1 | Published Brent oil prices are lagged by 4 months to better align with royalty revenue. |
111
Budget Strategy and Outlook 2022-23
Land rents
Revenue from land rents derived from mining and petroleum leases and pastoral holdings is estimated to total $176 million in 2021–22, an increase of 39.4 per cent compared with 2020–21. This primarily reflects a rebound from low land rents collected in 2020–21 driven by the write down in revenue from rents during the COVID-19 crisis due to the government’s relief measures.
Revenue from land rents is forecast to grow by a further 7.9 per cent in 2022–23 reflecting higher rental valuations.
Revenue from land rents is then expected to grow modestly.
| 4.4.4 | Sale of goods and services |
Sales of goods and services revenue comprises the cost recovery from the Queensland Government providing goods or services. Table 4.7 provides a breakdown of the categories of goods and services captured in terms of these revenues.
| Table 4.7 | Sales of goods and services1 |
| 2020–21 Actual $ million | 2021–22 Est. Act. $ million | 2022–23 Budget $ million | 2023–24 Projection $ million | 2024–25 Projection $ million | 2025–26 Projection $ million | |||||||||||||||||||
Fee for service activities | 2,552 | 2,769 | 2,750 | 2,798 | 2,641 | 2,671 | ||||||||||||||||||
Public transport: South East Queensland | 209 | 215 | 275 | 363 | 414 | 415 | ||||||||||||||||||
Rent revenue | 530 | 534 | 572 | 598 | 610 | 624 | ||||||||||||||||||
Sale of land inventory | 48 | 102 | 119 | 110 | 48 | 26 | ||||||||||||||||||
Hospital fees | 819 | 877 | 886 | 892 | 899 | 906 | ||||||||||||||||||
Transport and traffic fees | 492 | 504 | 523 | 538 | 554 | 572 | ||||||||||||||||||
Other sales of goods and services | 1,413 | 1,031 | 1,055 | 1,223 | 1,086 | 1,101 | ||||||||||||||||||
Total | 6,063 | 6,032 | 6,181 | 6,521 | 6,253 | 6,316 | ||||||||||||||||||
Note:
1. Numbers may not add due to rounding. |
| |||||||||||||||||||||||
The government provides substantial concessions in the form of discounts, rebates and subsidies to improve access to and the affordability of a range of services for individuals or families, based on eligibility criteria relating to factors such as age, income and special needs or disadvantage.
Appendix A provides details of the concession arrangements provided by the Queensland Government.
112
Budget Strategy and Outlook 2022-23
Fee for service activities
Examples of major items of fee for service activities across the General Government Sector include:
| • | recoverable works carried out by the Department of Transport and Main Roads and the commercialised arm of the department |
| • | fees charged by TAFE colleges |
| • | fees charged by CITEC to commercial clients for information brokerage services. |
Other sales of goods and services
Revenue is also raised from a variety of other types of sales of goods and services. These include revenue from public transport ticketing arrangements, rent or lease of government property, hospital fees, transport and traffic fees, title registration fees and other licences and permits.
| 4.4.5 | Interest income |
Interest income primarily comprises interest earned on investments, including those held to support debt, superannuation and insurance liabilities.
Interest income is estimated to total $2.561 billion in 2021–22, 0.9 per cent higher than expected at the 2021–22 Budget, and 31.5 per cent higher than received in 2020–21. The increase in interest income in 2021–22 largely reflects the first full year earnings from the Queensland Future Fund (QFF)—Debt Retirement Fund (DRF).
Interest income is forecast to grow on average by around 4.3 per cent across the 4 years ending 2025–26.
| 4.4.6 | Dividend and income tax equivalent income |
Revenue from dividend and income tax equivalent income is estimated to total $672 million in 2021–22, $639 million (48.7 per cent) lower than in 2020–21, and $470 million (41.2 per cent) lower than expected at the time of the 2021–22 Queensland Budget. These movements are primarily due to the government decision to allow the government-owned corporations (GOCs) to retain their dividends of around $580 million for 2021–22.
Dividend and income tax equivalent income is forecast to rebound in 2022–23, followed by more moderate growth of 4.8 per cent in 2023–24. This is driven by a return to normal GOC dividend policy from 2022–23.
Dividend and income tax equivalent income is forecast to fall by 21.6 per cent in 2024–25 and 3.0 per cent in 2025–26. The declines primarily reflect lower forecast profits in the electricity generation sector, with the entry of renewables boosting supply into the grid placing downward pressure on wholesale electricity prices.
Trends in dividends and income tax equivalent income are discussed in more detail in Chapter 8.
113
Budget Strategy and Outlook 2022-23
| 4.4.7 | Other revenue |
Other revenue, including royalty revenue, accounts for 12.6 per cent of total General Government Sector revenue in 2022–23 (see Table 4.8). Royalties and land rents account for 10.6 per cent of total revenue in 2022–23 and are discussed in detail in Section 4.4.3.
The major fines included in this category include speeding, red light, mobile phone and seatbelt camera detected offences and tolling offences.
This revenue is forecast to grow by 43.6 per cent in 2022–23, partly driven by the increase in penalties for high-risk driving offences, including mobile phone and seatbelt offences, and the planned rollout of additional detection cameras.
After providing for the cost of administration, funds raised from these initiatives are allocated to allowable road safety initiatives in accordance with the legislation. Such initiatives include road funding to improve the safety of the sections of state-controlled roads where accidents happen most frequently, road safety education and awareness programs and road accident injury rehabilitation programs.
Revenue not elsewhere classified includes assets contributed to the state and payments received for works delivered on behalf of GOCs.
| Table 4.8 | Other revenue1 |
| 2020–21 Actual $ million | 2021–22 Est. Act. $ million | 2022–23 Budget $ million | 2023–24 Projection $ million | 2024–25 Projection $ million | 2025–26 Projection $ million | |||||||||||||||||||
Royalties and land rents | 2,662 | 9,135 | 7,832 | 5,112 | 5,251 | 5,392 | ||||||||||||||||||
Fines and forfeitures | 450 | 530 | 762 | 775 | 786 | 788 | ||||||||||||||||||
Revenue not elsewhere classified | 1,036 | 929 | 681 | 664 | 1,162 | 668 | ||||||||||||||||||
Total other revenue | 4,148 | 10,594 | 9,275 | 6,552 | 7,199 | 6,848 | ||||||||||||||||||
Note:
1. Numbers may not add due to rounding. | ||||||||||||||||||||||||
114
Budget Strategy and Outlook 2022-23
| 5 | Expenses |
Features
| • | Expenses for 2022–23 are estimated to be $74.915 billion, an increase of $4.095 billion on 2021–22. The increase is due to the Queensland Government’s significant boost to the health system (including mental health services), school based education initiatives, support for child protection services and the response to the Queensland Women’s Safety and Justice Taskforce Hear her voice – Report one – Addressing coercive control and domestic family violence in Queensland, a significant disaster recovery, resilience and reconstruction program and a $175 Cost of Living Rebate on Queensland households’ power bills at a cost of $385 million. |
| • | Beyond 2022–23, growth in General Government Sector expenses is expected to moderate. |
| • | Total expenses are projected to grow at an average annual rate of 4.1 per cent over the 5 years to 2025–26, below average annual revenue growth of 4.5 per cent over the same period. |
| • | In 2022–23, the major areas of expenditure are in the key frontline services of health and education, which together constitute approximately 54.3 per cent of General Government Sector expenses. |
This chapter provides an overview of General Government Sector expenses for the forecast 2022–23 budget year and projections for 2023–24 to 2025–26. The forward estimates are based on the economic projections outlined in Chapter 2.
| 5.1 | 2021–22 estimated actual |
General Government Sector expenses in 2021–22 are estimated at $70.820 billion. The increase compared to 2020–21 is due in large part to the ongoing COVID-19 health response and business support grants and payments to non-government schools and local councils. Following the rollout of the vaccines and lifting of border restrictions, Queensland is transitioning to the post COVID-19 phase in 2022–23.
In 2021–22, General Government Sector expenses are estimated to be $1.093 billion higher than the 2021–22 Budget Update.
The increase in expenses since the 2021–22 Budget Update is largely driven by:
| • | advance payments being made to councils in relation to revenue collected from the waste disposal levy |
| • | the Australian Government’s advance payment of financial assistance grants to local governments in 2021–22 for the 2022–23 financial year |
115
Budget Strategy and Outlook 2022-23
| • | the response to pressures arising from the increase in demand for out-of-home care services in the child protection system |
| • | a range of school education related initiatives and increased funding under the National School Reform Agreement and associated Bilateral Agreement |
| • | disaster relief payments including personal hardship, primary producer and small business payments following the significant 2021–22 disaster season under the Disaster Recovery Funding Arrangements (DRFA) in partnership with the Australian Government. |
| 5.2 | 2022–23 Budget and outyears |
| Table 5.1 | General Government Sector expenses1 |
| 2020–21 Outcome $ million | 2021–22 Est. Act. $ million | 2022–23 Budget $ million | 2023–24 Projection $ million | 2024–25 Projection $ million | 2025–26 Projection $ million | |||||||||||||||||||
Employee expenses | 26,501 | 27,931 | 30,076 | 31,253 | 32,665 | 33,657 | ||||||||||||||||||
Superannuation interest costs | 246 | 378 | 655 | 633 | 655 | 653 | ||||||||||||||||||
Other superannuation expenses | 3,073 | 3,421 | 3,493 | 3,676 | 3,811 | 3,983 | ||||||||||||||||||
Other operating expenses | 16,335 | 19,002 | 19,805 | 19,493 | 18,868 | 18,935 | ||||||||||||||||||
Depreciation and amortisation | 4,187 | 4,474 | 4,652 | 4,806 | 4,985 | 5,190 | ||||||||||||||||||
Other interest expenses | 1,619 | 1,563 | 1,826 | 2,242 | 2,576 | 2,887 | ||||||||||||||||||
Grants expenses | 11,709 | 14,051 | 14,407 | 14,013 | 13,030 | 12,530 | ||||||||||||||||||
Total Expenses | 63,669 | 70,820 | 74,915 | 76,116 | 76,591 | 77,836 | ||||||||||||||||||
Note:
1. Numbers may not add due to rounding. | ||||||||||||||||||||||||
General Government Sector expenses of $74.915 billion in 2022–23 represent an increase of $4.095 billion (or 5.8 per cent) over 2021–22. Key initiatives contributing to the growth in expenditure in 2022–23 include:
| • | additional funding for Queensland’s health system to meet the ongoing growth in demand for public hospital and health services, including mental health services |
| • | funding for a range of school education related initiatives, funding to support kindergartens, and additional funding under the National School Reform Agreement and associated Bilateral Agreement |
| • | a significant disaster relief program of works under the DRFA following the South East Queensland Rainfall and Flooding 22 February – 5 April 2022 event, in partnership with the Australian Government |
| • | $385 million to provide a $175 Cost of Living Rebate on Queensland households’ power bills |
116
Budget Strategy and Outlook 2022-23
| • | responding to ongoing pressures arising from an increase in demand in the child protection system |
| • | delivering the Queensland Government’s response to the Queensland Women’s Safety and Justice Taskforce Hear her voice – Report one – Addressing coercive control and domestic family violence. |
Growth in General Government Sector expenses is expected to moderate over the remaining forward estimates as the government remains committed to its Fiscal Principle 2 and return to operating surplus by 2024–25.
| 5.3 | Expenses by operating statement category |
As outlined in Chart 5.1, employee and superannuation expenses account for 45.7 per cent of total General Government Sector expenses. Other operating expenses (26.5 per cent) follows, reflecting non-labour costs of providing goods and services to government and non-government recipients including transport service contract payments and repairs and maintenance.
| Chart 5.1 | Expenses by operating statement category, 2022–23 |
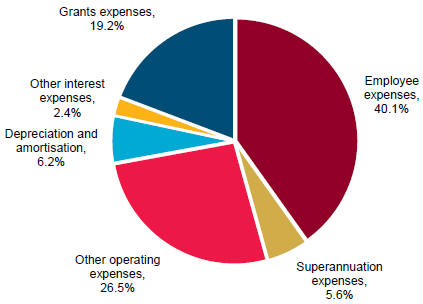
Chart 5.2 compares 2022–23 budget and 2021–22 estimated actual expenses by operating statement category.
117
Budget Strategy and Outlook 2022-23
| Chart 5.2 | Expenses by operating statement category – 2022–23 budget estimate and 2021–22 estimated actual |
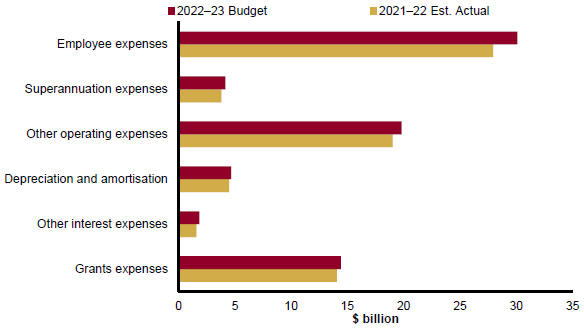
| 5.3.1 | Employee expenses |
Employee expenses include salaries and wages, annual leave and long service leave.
In 2022–23, employee expenses are expected to be $30.076 billion, $2.145 billion or 7.7 per cent higher than the 2021–22 estimated actual.
Employee expenses growth over the forward estimates is broadly in line with population growth, government election commitments towards supporting frontline services, and wages policy. Wage increases are assumed to be consistent with existing agreements and an allowance for future bargaining agreements.
With several key public sector bargaining agreements nominally expiring during 2022, the Government is committed to participating in good faith bargaining to establish wage increases for the next period, taking into account the prevailing economic environment. Previous and current public sector enterprise bargaining agreements were established based on a public sector wages policy, including 2.5 per cent per annum wage increases. Chart 5.3 compares the cumulative growth in wages policy since 2015–16 with the Brisbane Consumer Price Index. Public sector wage growth exceeded cost of living increases over that period. Over the six years to 2020–21, wages under the wages policy increased by 16 per cent, whereas inflation rose by 11 per cent.
While wage increases were deferred in 2020 due to the financial pressures of the COVID-19 pandemic, all affected public sector agreements incorporated an additional 2.5 per cent wage increase at a later date to ensure there was no ongoing impact for public sector employees.
118
Budget Strategy and Outlook 2022-23
| Chart 5.3 | Comparison of cumulative growth – wages policy and Brisbane CPI |
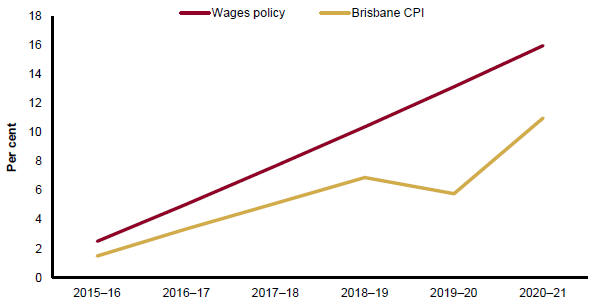
Sources: ABS Consumer Price Index and Queensland Treasury
Full-time equivalents
The government is delivering on its commitment to revitalise frontline service delivery. This has contributed to full time equivalents (FTE) increasing 40,692.28 FTE (or 20.44 per cent) from 2014–15 to 2021–22.
Between March 2015 and March 2022:
| • | teachers increased by 5,788 (or 13.75 per cent) |
| • | teacher aides increased by 1,377 (or 14.78 per cent) |
| • | nurses increased by 10,638 (or 38.10 per cent) |
| • | health practitioners increased by 5,077 (or 51.38 per cent) |
| • | doctors increased by 3,106 (or 39.16 per cent) |
| • | ambulance officers increased by 1,103 (or 29.71 per cent) |
| • | police officers increased by 733 (or 6.52 per cent) |
| • | firefighters increased by 204 (or 8.49 per cent). |
As at March 2022, 91.59 per cent of public servants are engaged in frontline and frontline support roles, with 20,339 FTE in corporate service roles.
The government is also committed to ensuring that public service staff are located where there is demand. Around 47 per cent of FTE are located outside Greater Brisbane, of which around 96 per cent are engaged in frontline and frontline support roles. Regional Action Plans show increases in key service delivery occupations across the regions.
119
Budget Strategy and Outlook 2022-23
FTE are estimated to increase by around 8,175 in 2022–23, driven principally by increases in health, education and other frontline services, including police and child safety.
In keeping with Savings and Debt Plan goals, total sector FTE levels continue to be actively managed through approved agency FTE caps. Unutilised FTE positions have been reallocated to resource new priority functions through the whole-of-government pool of unallocated FTE (FTE Pool), where they cannot be managed within an agency’s existing FTE levels. The FTE Pool has been fully utilised to support the setting of FTE levels for 2022–23.
Temporary restrictions on non-frontline recruitment activity have ceased, giving agencies flexibility to manage within approved FTE caps. Central oversight of external recruitment to senior executive service positions will continue to ensure close management of the senior executive cohort.
The Public Service Commission publishes a bi-annual Queensland Public Sector Workforce Profile, which includes specific reporting of agencies listed in Table 5.2. The March 2022 workforce profile reports a total of 239,737.20 FTE for these agencies, an increase of 3,253.90 FTE since September 2021. The increase reflects growth of 2,776.94 FTE frontline and frontline support roles and 476.96 FTE non-frontline roles. It is noted that the reporting basis of the workforce profile reflects active FTE engaged at March 2022 while FTE levels reported in Table 5.2 reflect approved funded FTE positions for the financial year.
120
Budget Strategy and Outlook 2022-23
| Table 5.2 | Funded Controlled FTE positions by Department1 |
| 2021–22 Adjusted Budget3 | 2021–22 Est. Act. | 2022–23 Budget4 | ||||||||||
Agriculture and Fisheries | 2,108 | 2,108 | 2,108 | |||||||||
Children, Youth Justice and Multicultural Affairs | 5,286 | 5,280 | 5,384 | |||||||||
Communities, Housing and Digital Economy | 3,590 | 3,573 | 3,518 | |||||||||
Education | 75,706 | 75,676 | 76,774 | |||||||||
Electoral Commission of Queensland | 76 | 76 | 81 | |||||||||
Employment, Small Business and Training | 4,576 | 4,566 | 4,778 | |||||||||
Energy and Public Works | 2,319 | 2,303 | 2,303 | |||||||||
Environment and Science | 2,841 | 2,839 | 2,863 | |||||||||
Justice and the Attorney-General | 3,628 | 3,634 | 3,792 | |||||||||
Office of the Inspector-General Emergency Management | 22 | 22 | 22 | |||||||||
Premier and Cabinet | 455 | 450 | 474 | |||||||||
Public Service Commission | 64 | 64 | 64 | |||||||||
Queensland Audit Office | 191 | 191 | 191 | |||||||||
Queensland Corrective Services | 6,599 | 6,597 | 6,606 | |||||||||
Queensland Fire and Emergency Services | 3,809 | 3,808 | 3,901 | |||||||||
Queensland Health | 99,266 | 99,480 | 105,686 | |||||||||
Queensland Police Service | 16,920 | 16,923 | 17,548 | |||||||||
Queensland Treasury | 1,291 | 1,278 | 1,258 | |||||||||
Regional Development, Manufacturing and Water | 586 | 589 | 602 | |||||||||
Resources | 1,550 | 1,531 | 1,425 | |||||||||
Seniors, Disability Services, and Aboriginal and Torres Strait Islander Partnerships | 1,961 | 1,959 | 1,903 | |||||||||
State Development, Infrastructure, Local Government and Planning | 993 | 986 | 974 | |||||||||
The Public Trustee of Queensland | 637 | 637 | 606 | |||||||||
Tourism, Innovation and Sport | 467 | 463 | 472 | |||||||||
Transport and Main Roads | 7,489 | 7,488 | 7,498 | |||||||||
Other2 | 40 | 135 | — | |||||||||
Total | 242,470 | 242,656 | 250,831 | |||||||||
Notes:
1. Departmental FTE can also be found in the Service Delivery Statements (SDS). 2. Other relates to whole-of-government unallocated FTE pool established in the 2021–22 Budget. The FTE pool has been fully utilised to support resourcing of approved functions in the 2022–23 Budget. 3. Adjusted Budget reflects movements of FTE following Machinery of Government changes only. 4. In addition to the FTE positions outlined above, a Norfolk Island Taskforce has been established to support Queensland’s delivery of services on Norfolk Island and the implementation of the Intergovernmental Partnership Agreement on State Service Delivery to Norfolk Island. This includes up to 28 FTE across Queensland Health, the Department of Education and the Department of the Premier and Cabinet. These FTE are fully funded by the Australian Government. |
| |||||||||||
121
Budget Strategy and Outlook 2022-23
| 5.3.2 | Superannuation expenses |
The superannuation interest cost represents the imputed interest on the government’s accruing defined benefit superannuation liabilities.
In determining the state’s defined benefit superannuation liabilities, Australian Accounting Standards Board (AASB) 119 Employee Benefits requires the discounting of future benefit obligations using yield rates on government bonds net of investment tax. Interest costs are calculated on a net liability approach by applying the discount rate to both the gross liability and superannuation plan assets.
Superannuation interest costs are dependent on the applicable discount rates at the beginning of the year. Rate increases in 2021–22 are resulting in higher superannuation interest cost in 2022–23.
Bond yields are forecast to rise over the forward estimates increasing superannuation interest costs by $277 million in 2022–23. The impact on superannuation interest costs from rising government bond yields in the latter part of the forward estimates is largely offset by the declining defined benefit superannuation liability. The obligations of the defined benefit scheme, which is closed to new members, will decline over time as members leave.
Other superannuation expenses represent employer superannuation contributions to accumulated superannuation and the current service cost of the state’s defined benefit obligation (or the increase in the present value of the defined benefit obligation resulting from employee service in the current period).
| 5.3.3 | Other operating expenses |
Other operating expenses comprise the non-labour costs of providing goods and services including services to government and non-government organisations, repairs and maintenance, consultancies, contractors, electricity, communications and marketing.
The Queensland Government provides additional funding to departments each year to enable appropriate indexation of service delivery arrangements with community services sector organisations in recognition of increasing costs. The non-government organisation indexation rate, on which this funding is calculated, is 2.88 per cent in 2022–23.
In 2022–23, other operating expenses are expected to be $19.805 billion, an increase of $803 million, or 4.2 per cent, compared to the 2021–22 estimated actual.
The increase in other operating expenses is driven mainly by:
| • | school education-related initiatives and additional funding under the National School Reform Agreement and associated Bilateral Agreement |
| • | the $175 Cost of Living Rebate on Queensland households’ power bills, at a cost of $385 million in 2022–23 |
| • | ongoing pressures arising from increased demand for out-of-home care services within the child protection system |
122
Budget Strategy and Outlook 2022-23
| • | an increase in transport funding including higher Transport Service Contract payments to Queensland Rail. |
The growth in other operating expenses in 2022–23 is partly offset by lower health expenditure as the need for the COVID-19 response and quarantine services largely conclude in 2021–22.
Other operating expenses are expected to decline from 2023–24, partly reflecting the $385 million Cost of Living Rebate payment made in 2022–23 and a reduction in project works as the Cross River Rail project draws closer to completion.
| 5.3.4 | Depreciation and amortisation |
Depreciation and amortisation expenses is an estimate of the progressive consumption of the state’s assets through normal usage, wear and tear and obsolescence. Growth in this expense category primarily reflects the increasing investment in state infrastructure and asset revaluations.
| 5.3.5 | Other interest expenses |
Other interest expenses include interest paid on borrowings, finance leases and similar arrangements to acquire capital assets and infrastructure such as roads and government buildings.
Other interest expenses are estimated to increase $ 263 million in 2022–23 to $1.826 billion compared to $1.563 billion in 2021–22 as borrowing with QTC increases to fund the larger capital program.
Other interest expenses are estimated to be lower in 2021–22 and 2022–23 compared to 2021–22 Budget Update due to the improved net cash flows from operating activities from upward revisions to taxation and royalty revenue.
Rising interest rates result in higher interest costs from 2023–24 compared to the 2021–22 Budget Update.
| 5.3.6 | Grants expenses |
Current grants include grants and subsidies to the community (such as non-state schools, hospitals, benevolent institutions and local governments) and personal benefit payments. Community Service Obligations are provided where Public Non-financial Corporations (PNFCs) are required to provide non-commercial services or services at non-commercial prices for the benefit of the community (for further details refer to Chapter 8).
Capital grants also represent transfers to the PNFC Sector, local governments, not-for-profit institutions and other non-government entities, such as business and households (including the Queensland First Home Owners’ Grant and non-state schools) for capital purposes.
Table 5.3 provides a breakdown of grants by category and recipient type.
123
Budget Strategy and Outlook 2022-23
| Table 5.3 | Grant expenses1 |
2020–21 Outcome $ million | 2021–22 Est. Act. $ million | 2022–23 Budget $ million | ||||||||||
Current | ||||||||||||
Grants to local government2 | 716 | 1,663 | 325 | |||||||||
Grants to private and not-for-profit organisations | ||||||||||||
State funding for non-state schools | 754 | 819 | 829 | |||||||||
Australian Government funding for non-state schools | 3,176 | 3,627 | 3,818 | |||||||||
Other | 1,852 | 2,558 | 2,783 | |||||||||
Grants to other sectors of government | ||||||||||||
Community service obligations to PNFCs | 474 | 551 | 659 | |||||||||
Other payments to PNFCs | 68 | 120 | 87 | |||||||||
Other (includes payments to NDIA) | 2,101 | 2,039 | 2,141 | |||||||||
Other | 433 | 449 | 839 | |||||||||
Total current grants | 9,574 | 11,826 | 11,481 | |||||||||
Capital | ||||||||||||
Grants to local government | 1,048 | 1,266 | 1,956 | |||||||||
State funding for non-state schools | 102 | 118 | 120 | |||||||||
Grants to private and not-for-profit organisations | 492 | 422 | 449 | |||||||||
Payments to PNFCs | 43 | 20 | 65 | |||||||||
Queensland First Home Owners’ Grants | 183 | 145 | 96 | |||||||||
Other | 267 | 254 | 241 | |||||||||
Total capital grants | 2,135 | 2,225 | 2,927 | |||||||||
Total current and capital grants | 11,709 | 14,051 | 14,407 | |||||||||
Notes:
| 1. | Numbers may not add due to rounding. |
| 2. | Current grants to local governments decrease in 2022–23 compared to 2021–22 due to the advance payment by the Australian Government of Financial Assistance Grants for the 2022–23 financial year on-passed to local councils, and payments made in relation to waste disposal levy in 2021–22. |
In 2021–22, grants expenses are estimated to total $14.051 billion, $2.342 billion or 20 per cent higher than 2020–21. This increase is mainly due to:
| • | payments being made to local councils in 2021–22 in relation to revenue collected from the waste disposal levy |
| • | Australian Government’s advance payment of financial assistance grants to local governments in 2021–22 for the 2022–23 financial year |
| • | higher Australian Government grants on-passed to non-government schools |
| • | disaster relief payments including personal hardship payments under the DRFA in partnership with the Australian Government, following the 2021–22 disaster season |
124
Budget Strategy and Outlook 2022-23
| • | COVID-19 Business Support Grants program (incorporating Tourism and Hospitality Sector Hardship grants) to support Queensland businesses impacted by the August 2021 COVID-19 lockdowns. |
In 2022–23, total grant expenses are estimated to be $14.407 billion, $356 million higher than 2021–22. This increase is mainly due to:
| • | the significant cost of recovery, reconstruction and resilience programs under the DRFA in partnership with the Australian Government, following the substantial flooding in South East Queensland in 2021–22. Further details are discussed in Chapter 3. |
| • | higher Australian Government grants on-passed to non-government schools |
| • | higher CSO payments to Energy Queensland Limited to ensure that, where possible, all Queensland electricity customers of a similar type pay a similar price for electricity, regardless of where they live. |
These higher grants in 2022–23 are partly offset by the Australian Government again making advance payment of the 2022–23 Financial Assistance Grants to local councils in 2021–22, the COVID-19 Business Support grants program expiring in 2022 and substantial waste levy payments made to local councils in 2021–22.
| 5.4 | Operating expenses by purpose |
Chart 5.4 indicates the proportion of expenditure by major purpose classification for the 2022–23 Budget. Health accounts for the largest share of expenses (30 per cent) followed by Education (24.3 per cent).
In 2022–23, the substantial disaster relief payments under the DRFA increase the Social protection, housing and other community services function’s relative share of total General Government Sector expenses comparative to most other expenditure classification by purpose.
Excluding disaster payments, the health and education functions account for 55.6 per cent of the total General Government Sector expenses in 2022–23.
125
Budget Strategy and Outlook 2022-23
| Chart 5.4 | General Government Sector expenses by purpose, 2022–23 |
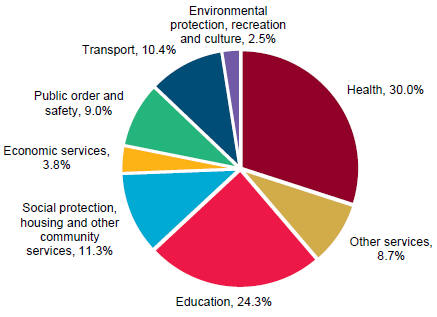
126
Budget Strategy and Outlook 2022-23
| 6 | Balance sheet and cash flows |
Features
| • | General Government Sector net debt at 30 June 2022 is forecast to be $11.390 billion. This is less than half of what was expected at the time of the 2021–22 Queensland Budget and $6.146 billion lower than the 2021–22 Budget Update. |
| • | Net debt in the General Government Sector is expected to be lower in every year of the forward estimates compared to estimates in the 2021–22 Budget and is projected to be $39.214 billion by 30 June 2026. |
| • | By 2024–25, Queensland’s forecast net debt of $33.667 billion is around one fifth of the latest available estimate of $154.844 billion for Victoria (2022–23 Budget) and around one third of $103.008 billion (latest estimate, 2021–22 Half-Yearly Review) for New South Wales. |
| • | Forecast borrowings have been progressively revised down since the 2021–22 Budget consistent with prudent management of revenue improvements from unusually high commodity prices and economic recovery from the pandemic. |
| • | As the Queensland Government continues to support jobs and economic growth, borrowings will grow over the forward estimates but is still expected to be $4.48 billion lower by 2024–25 than at the time of the 2021–22 Budget, and is expected to be $14.395 billion lower by 2023–24 than at the time of the 2020–21 Budget. |
| • | The capital program over the 4 years to 2025–26 totals $59.126 billion. The profile of the capital program over the forward estimates reflects the government’s responses to ongoing growth and recovery and resilience measures. |
| • | The forward estimates include $5.708 billion of the $9.785 billion investment in the major Queensland Health Capacity Expansion program. |
| • | The Non-financial Public Sector (NFPS) capital program for the period 2022–23 to 2025–26 comprises $49.451 billion of purchases of non-financial assets (PNFA) and $8.078 billion of capital grant expenses as well as acquisitions of non-financial assets under finance leases and similar arrangements of $1.597 billion. |
| • | Positive NFPS operating cash flows of $26.584 billion are projected from 2022–23 to 2025–26. This will contribute to job creating infrastructure by partially funding the expected $49.451 billion or 53.8 per cent of PNFA over the same period. |
| • | The net worth of the state has increased in 2021–22 by nearly $11 billion compared to the 2021–22 Budget expectations. The increase is due to the improved operating position, increases in the value of non-financial assets and investments. |
127
Budget Strategy and Outlook 2022-23
| 6.1 | Overview |
The balance sheet shows the projected assets, liabilities and net worth of the General Government Sector as at 30 June each year. A resilient balance sheet provides the government with the capacity to respond to immediate financial and economic events, such as those brought about by the prolonged COVID-19 variant outbreaks and the severity of recent natural disasters.
With a strong balance sheet supporting the government’s targeted response to these events, the economy continues to recover and grow and to assist Queenslanders in their time of need.
The cash flow statement shows the expected cash flows of the General Government Sector during each financial year of the forward estimates. While the operating statement is reported in accrual terms—that is, when revenues and expenses are recognised—the cash flow statement is reported in cash terms—that is, when revenues are received, and payments are made.
The largest differences between cash and accrual accounting relate to depreciation and defined benefit superannuation.
| 6.2 | Balance sheet |
Table 6.1 summarises the key balance sheet aggregates for the General Government Sector.
| Table 6.1 | General Government Sector – summary of budgeted balance sheet1 |
| 2021–22 Budget $ million | 2021–22 Est. Act. $ million | 2022–23 Budget $ million | 2023–24 Projection $ million | 2024–25 Projection $ million | 2025–26 Projection $ million | |||||||||||||||||||
Financial assets | 68,047 | 71,422 | 76,000 | 79,258 | 81,025 | 82,713 | ||||||||||||||||||
Non-financial assets | 250,163 | 255,104 | 261,316 | 267,523 | 274,301 | 280,154 | ||||||||||||||||||
Total assets | 318,210 | 326,526 | 337,316 | 346,781 | 355,326 | 362,867 | ||||||||||||||||||
Borrowings | 65,041 | 58,215 | 66,459 | 74,224 | 81,102 | 87,284 | ||||||||||||||||||
Advances | 1,432 | 847 | 1,745 | 2,714 | 2,736 | 2,793 | ||||||||||||||||||
Superannuation liability | 22,686 | 24,810 | 24,069 | 22,484 | 21,106 | 20,076 | ||||||||||||||||||
Other provisions and liabilities | 25,877 | 28,721 | 28,790 | 28,345 | 28,356 | 28,477 | ||||||||||||||||||
Total liabilities | 115,037 | 112,592 | 121,062 | 127,767 | 133,300 | 138,629 | ||||||||||||||||||
Net worth | 203,174 | 213,934 | 216,254 | 219,014 | 222,026 | 224,237 | ||||||||||||||||||
Net financial worth | (46,989 | ) | (41,170 | ) | (45,062 | ) | (48,509 | ) | (52,275 | ) | (55,916 | ) | ||||||||||||
Net financial liabilities | 69,847 | 61,473 | 67,517 | 72,848 | 77,733 | 82,416 | ||||||||||||||||||
Net debt | 24,750 | 11,390 | 19,772 | 27,603 | 33,667 | 39,214 | ||||||||||||||||||
Note: | ||||||||||||||||||||||||
| 1. | Numbers may not add due to rounding. |
128
Budget Strategy and Outlook 2022-23
| 6.2.1 | Financial assets |
The major categories of financial assets are investments, loans and placements and investments in other public sector entities. Investments, loans and placements incorporate investments held to meet future liabilities, including superannuation and insurance, as well as investments relating to the Queensland Future Fund (QFF) – Debt Retirement Fund (DRF) which have a positive impact on the state’s ratings metrics. The General Government Sector holds the equity in the state’s public enterprises, principally the shareholding in government-owned corporations (GOCs) but also Public Financial Corporations like Queensland Treasury Corporation (QTC), in much the same manner as the parent or holding company in a group of companies.
Total financial assets of $71.422 billion are estimated for 2021–22, $3.375 billion higher than published in the 2021–22 Budget. Investments, loans and placements have increased by $5.946 billion since the 2021–22 Budget, predominantly due to positive market value adjustments on financial assets in 2020–21 and investing to support Queensland’s energy transformation and deliver affordable, reliable and clean energy for Queenslanders.
This is partially offset by a deterioration in the value of investments in GOCs, largely driven by unrealised market value effects of hedging contracts, the impact of which is expected to reverse as these contracts unwind in subsequent years.
As the value of GOCs recover along with dividends receivable, total financial assets are expected to increase by $4.578 billion to $ 76 billion by 30 June 2023. Further increases in the value of public enterprises and expected returns on investments, mean financial assets will continue to grow over the forward estimates and are projected to be $82.713 billion by 30 June 2026.
Chart 6.1 shows forecast General Government Sector financial assets by category at 30 June 2023.
129
Budget Strategy and Outlook 2022-23
| Chart 6.1 | Forecast General Government Sector financial assets by category, at 30 June 2023 |
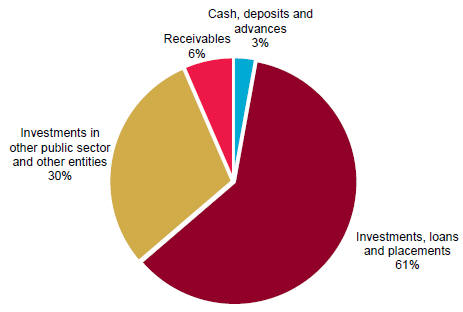
| 6.2.2 | Non-financial assets |
General Government Sector non-financial assets are estimated to be $255.104 billion at 30 June 2022, $4.941 billion higher than expected in the 2021–22 Budget.
Non-financial assets in 2022–23 are expected to increase by a further $6.212 billion to be $261.316 billion at 30 June 2023.
Total non-financial assets at 30 June 2023 consist primarily of land and other fixed assets of $254.571 billion, the majority of which are roads, schools, hospitals and other infrastructure. Other non-financial assets of $6.745 billion held by the state include prepayments and deferred income tax assets relating to GOCs.
General Government Sector capital expenditure for 2022–23 is forecast to be $11.405 billion, which comprises $8.478 billion of PNFA and $2.927 billion of capital grant expenses. In addition, acquisitions of non-financial assets under finance leases and similar arrangements are forecast to be $809 million, bringing the total General Government Sector capital program for 2022–23 to $12.214 billion.
Over the 4 years to 2025–26, General Government Sector capital expenditure is forecast to be $44.463 billion, which comprises $36.287 billion of PNFA and $8.176 billion of capital grant expenses. Acquisitions of non-financial assets under finance leases and similar arrangements are forecast to be $1.319 billion, bringing the total General Government Sector capital program over the period to $45.782 billion.
130
Budget Strategy and Outlook 2022-23
Over the forward estimates, the government will spend $5.708 billion as part of the Queensland Health Capacity Expansion program, invest approximately an additional $1 billion for construction of new schools and critical infrastructure upgrades, and continue its substantial ongoing investment in transformative transport infrastructure to support population growth as the region plans for the delivery of the Brisbane 2032 Olympic and Paralympic Games.
The finance leases and similar arrangements are mainly in relation to Public Private Partnerships (PPPs). PPPs totalling $2.570 billion over the period 2021–22 to 2025–26 includes the Tunnel, Stations and Development components of Cross River Rail.
The current estimate of the capital program over the 4 years to 2025–26 is $59.126 billion. The PNFA by the NFPS over this period are forecast to be $49.451 billion. With capital grant expenses of $8.078 billion, this brings total capital expenditure to $57.529 billion. In addition to this, acquisitions of non-financial assets under finance leases and similar arrangements of $1.597 billion bring the total capital program over the period to $59.126 billion.
| 6.2.3 | Liabilities |
General Government Sector
Total General Government Sector liabilities are estimated to be $112.592 billion at 30 June 2022, a decrease of $2.445 billion since 2021–22 Budget, predominantly due to lower than expected borrowings offset in part by higher superannuation estimates and higher insurance provisions rolling forward from 30 June 2021.
Total liabilities are expected to increase by $8.470 billion in 2022–23 to be $121.062 billion. General Government Sector borrowing with QTC will increase by $8.402 billion in 2022–23, to be $58.853 billion. This is $8.257 billion lower than the comparable 2021–22 Budget estimate for 2022–23. General Government Sector borrowing with QTC is then forecast to grow over the forward estimates as the state invests in job creating infrastructure projects.
By 2024–25, borrowing with QTC is expected to reach $73.338 billion, $4.423 billion lower than expected in the 2021–22 Budget. In 2025–26, total borrowing with QTC will increase by $7.284 billion to $80.622 billion.
The defined benefit superannuation liability is projected to be $24.810 billion at 30 June 2022, $2.124 billion higher than expected in the 2021–22 Budget. This is predominantly due to a change in actuarial assumptions. By 30 June 2023 the superannuation liability is projected to be $24.069 billion and is expected to continue to decline over the forward estimates as bond rates continue to recover, and members of the defined benefit fund retire. The fund has been closed to new entrants since 2008.
The composition of the General Government Sector’s forecast liabilities at 30 June 2023 is illustrated in Chart 6.2.
131
Budget Strategy and Outlook 2022-23
| Chart 6.2 | Forecast General Government Sector liabilities by category, at 30 June 2023 |
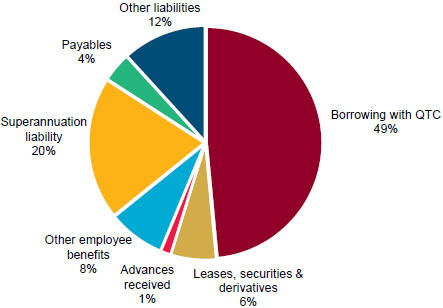
Non-financial Public Sector borrowing
The NFPS is a consolidation of the General Government and PNFC sectors, with transactions between these sectors eliminated.
PNFC debt is primarily held by GOCs and is supported by income-generating assets including key pieces of economic infrastructure.
NFPS borrowing is expected to be $106.774 billion by 30 June 2022, roughly in line with expectations in the 2021–22 Budget. Within the NFPS borrowing, derivative liabilities are estimated to be $5.841 billion higher than expected in the 2021–22 Budget. This increase largely relates to the electricity GOCs, due to movements in the value of hedging contracts entered into prior to an upward shift in market conditions. These liabilities are expected to reverse as these contracts unwind in subsequent years as electricity is delivered.
132
Budget Strategy and Outlook 2022-23
| Box 6.1 | Improvement in NFPS debt |
Since the 2020–21 Budget, there has been a continued improvement in debt requirements. This has occurred over a period when the government committed to prioritising health outcomes throughout the COVID-19 pandemic and supported the state’s economic recovery response.
Chart 6.3 shows how in 2023–24, borrowings for the NFPS are $13.004 billion lower than forecast at the time of the 2020–21 Budget.
Since the 2020–21 Budget, over the period 2019–20 to 2023–24, the lower borrowing requirements have resulted in a lower interest expense cost of more than $210 million.
| Chart 6.3 | Non-financial Public Sector borrowings by budget |
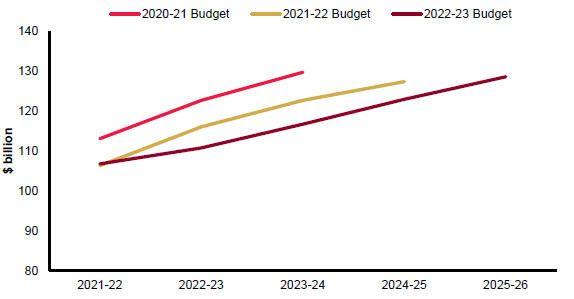
Table 6.2 provides the total NFPS borrowing projections to 2025–26 where it is expected to reach $128.595 billion as the state continues to invest in job creating infrastructure, partially funded through operating cash flows.
| Table 6.2 | Non-financial Public Sector borrowings 2021–22 to 2025–261 |
| 2021–22 Est. Act. $ million | 2022–23 Budget $ million | 2023–24 Projection $ million | 2024–25 Projection $ million | 2025–26 Projection $ million | ||||||||||||||||
Borrowing with QTC | 92,599 | 100,553 | 107,847 | 114,632 | 121,533 | |||||||||||||||
Leases and other similar arrangements | 7,898 | 7,711 | 8,076 | 7,975 | 6,812 | |||||||||||||||
Securities and derivatives | 6,277 | 2,521 | 795 | 352 | 251 | |||||||||||||||
Total borrowings | 106,774 | 110,786 | 116,719 | 122,958 | 128,595 | |||||||||||||||
Note:
| 1. | Numbers may not add due to rounding. |
133
Budget Strategy and Outlook 2022-23
| 6.2.4 | Net debt |
Net debt is the sum of borrowing and advances received, less the sum of cash and deposits, advances paid and investments, loans and placements.
Net debt excludes certain assets and liabilities, such as superannuation and insurance liabilities. However, it still indicates the soundness of the government’s fiscal position, as high levels of net debt will require servicing through interest payments and limit flexibility to adjust expenditure.
Net debt for the General Government Sector in 2021–22 is estimated to be $11.390 billion, $13.360 billion lower than expected in the 2021–22 Budget. The lower net debt is predominantly the result of improved operating cash flows in 2021–22, and lower net debt rolling forward from the 2020–21 outcome.
Net debt is lower in every year than estimated in the 2021–22 Budget and by 2024–25 is estimated to be $8.906 billion lower than the 2021–22 Budget.
| 6.2.5 | Net financial liabilities |
Net financial liabilities are total liabilities, less financial assets other than equity instruments in other public sector entities. This measure is broader than net debt as it includes other significant liabilities rather than just borrowings (for example, accrued employee liabilities such as superannuation and long service leave entitlements).
The net financial liabilities of the General Government Sector for 2021–22 are estimated to be $61.473 billion and estimated to increase by $6.044 billion by 30 June 2023. This increase is commensurate with the expected increase in borrowings to invest in infrastructure to deliver economic growth and better services for Queenslanders, offset in part by an increase in investments, loans and placements and receivables.
| 6.2.6 | Net worth |
The net worth, or equity, of the state is the amount by which the state’s assets exceed its liabilities. This is the value of the investment held on behalf of the people of Queensland by public sector entities.
Changes in the state’s net worth occur for several reasons including:
| • | operating surpluses (deficits) that increase (decrease) the government’s equity |
| • | revaluation of assets and liabilities as required by accounting standards |
| • | movements in the net worth of the state’s investments in the PNFC and Public Financial Corporations sectors |
| • | gains or losses on disposal of assets – where the selling price of an asset is greater (less) than its value in an agency’s accounts, the resultant profit (loss) affects net worth. |
General Government Sector net worth was $209.625 billion at 30 June 2021. It is expected to increase to $213.934 billion in 2021–22, nearly $11 billion higher than expected in the 2021–22 Budget.
134
Budget Strategy and Outlook 2022-23
Net Worth has increased in 2021–22 with the improved operating position, increases in the value of non-financial assets and investments
The net worth of the NFPS is projected to steadily grow over the forward estimates to be $224.237 billion by 2025–26.
| 6.3 | Cash flows |
The cash flow statement provides the cash surplus (deficit) measure, which comprises the net cash flows from operating activities plus the net cash flows from investments in non-financial assets (or physical capital).
The General Government Sector cash surplus for 2021–22 is estimated to be $1.323 billion, which is $8.390 billion higher than the deficit forecast at the time of the 2021–22 Budget. This is largely due to an improved operating position driven by the prudent management of revenue improvements from unusually high commodity prices and the economic recovery.
After net investments in non-financial assets of $8.301 billion, a cash deficit of $6.763 billion is forecast for 2022–23. As revenues continue to improve in line with the forecast economic recovery, net cash flows from operating activities increase over the forward estimates, contributing to the government’s investment in non-financial assets and alleviating the need to fund these investments completely through borrowing.
Net cash flows from investments in financial assets for policy purposes include net cash flows from disposal or return of equity, net equity injections into GOCs and concessional loans and advances. Cash flows from the injection of equity to the PNFC and Public Financial Corporations sector are the primary driver of net outflows of $1.858 billion over the period from 2022–23 to 2025–26.
Net cash flows from investments in financial assets for liquidity purposes represent net investment in financial assets to cover liabilities such as superannuation, other employee entitlements and insurance.
Total General Government Sector PNFA of $8.478 billion are budgeted for 2022–23. Over the period from 2022–23 to 2025–26, General Government Sector PNFA are expected to total $36.287 billion as Queensland invests substantially in economic growth, energy transformation, health, education, roads and rail infrastructure to provide better services and a great lifestyle for Queenslanders as it prepares for the Brisbane 2032 Olympic and Paralympic Games.
135
Budget Strategy and Outlook 2022-23
| 7 | Intergovernmental financial relations |
Features
| • | The federal financial relations framework recognises that coordinated action and clear lines of responsibility for funding and service delivery are crucial for maximising economic and social outcomes and to strategically position the nation for the future. |
| • | One of the Australian Government’s key functions under this framework is providing funding to states to deliver services. |
| • | Australian Government payments represent approximately 47 per cent of all of Queensland’s General Government revenue in 2022–23. |
| • | The Australian Government estimates it will provide the Queensland Government with $34.925 billion in 2022–23 ($1.907 billion more than in 2021–22), comprising: |
| • | $16.399 billion1 in payments for specific purposes ($243 million more than 2021–22) |
| • | $715 million in other Australian Government grants, including payments direct to Queensland Government agencies for Australian Government own-purpose expenditure ($333 million less than 2021–22) |
| • | $17.811 billion in payments for general purposes ($1.998 billion more than 2021–22). |
Further detail is provided in Chapter 4.
| • | The 2022–23 Federal Budget defined payments to Queensland for specific purposes in 2022–23 include: |
| • | $6.030 billion for National Health Reform funding |
| • | $6.094 billion for Quality Schools funding2 |
| • | $3.606 billion for National Partnership (NP) payments (including the Infrastructure Investment Program, Disaster Recovery Funding Arrangements (DRFA) and DisabilityCare Australia Fund) |
| • | $342 million for National Housing and Homelessness funding |
| • | $328 million for National Skills and Workforce Development funding. |
| • | NP payments to Queensland will be lower in 2022–23 primarily due to: |
| • | cessation of the temporary COVID-19 business support grant program in 2021–22 |
| • | expected reduction in HomeBuilder grant payments due to the program drawing to a close towards the end of 2022–23. |
| 1 | Total payments for specific purposes may not add due to rounding. |
| 2 | Quality Schools funding includes payments for government schools (exclusive of GST) and non-government schools (inclusive of GST). |
136
Budget Strategy and Outlook 2022-23
| • | Queensland has 23 funding agreements expiring in 2021–22. While the 2022–23 Federal Budget allocated funding for 7 expiring agreements, 2 expiring agreements had no funding allocated beyond 2021–22. A funding renewal was not sought for the remaining 14 expiring agreements due to the short-term nature of the programs (e.g. temporary funding provided for COVID-19 measures and bushfire support). |
| • | The Queensland Government provides considerable assistance to local governments, recognising the important services they provide to the community. In 2022–23, the Queensland Government will provide a total of $2.280 billion in grants to local governments. |
| 7.1 | Federal financial arrangements |
The Australian Government has greater capacity to raise revenue than is required to meet its service delivery responsibilities. Conversely, states’ ability to raise revenue is less than required to meet their service delivery and infrastructure responsibilities. This vertical fiscal imbalance (VFI) requires the sharing of revenue between the Australian Government and states.
In 2020–21, the Australian Government collected 70.7 per cent of government revenue nationally, while states collected 23 per cent with local governments responsible for the balance at 6.3 per cent1. Chart 7.1 illustrates the revenue and expense disparity between the different levels of government.
| 1 | ABS Government Finance Statistics. |
137
Budget Strategy and Outlook 2022-23
| Chart 7.1 | Own-source revenue and expenses by levels of government, 2020–211,2 |
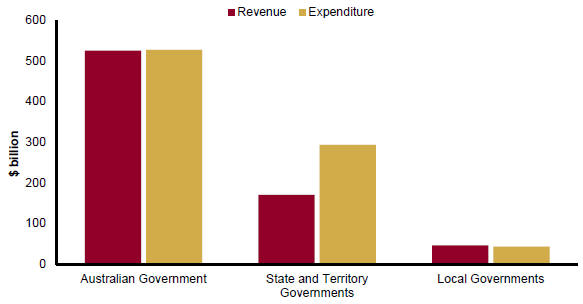
Notes:
| 1. | Revenue calculated as total revenue minus grant revenue. |
| 2. | Expenses calculated as total expenses minus grant expenses. |
Source: ABS Government Finance Statistics.
In Australia, VFI is addressed through a system of intergovernmental payments from the Australian Government to the states. The Australian Government makes 2 types of payments in this regard:
| • | general revenue assistance payments (largely GST revenue) which can be used by states for any purpose (‘untied’ funding) |
| • | payments for specific purposes (‘tied’ funding) such as National Specific Purpose Payments (SPPs), which are a contribution toward states’ service delivery priorities, and National Partnership (NP) payments, which represent funding to support the delivery of specific Australian Government priorities, outputs or projects and to facilitate or incentivise reforms. |
Given the Australian Government’s significant revenue raising capability, states are heavily reliant on these intergovernmental transfers to provide essential services and infrastructure.
The remainder of this chapter focuses on payments for specific purposes. Detail on GST revenue is provided in Chapter 4.
138
Budget Strategy and Outlook 2022-23
| Box 7.1 | Effective federal financial relations – positioning Queensland for the future |
| • | The federal financial relations framework recognises that coordinated action and clear lines of responsibility for funding and service delivery are crucial for maximising economic and social outcomes and to strategically position the nation for the future. |
| • | Combined effort is required to address Queensland’s needs and priorities—to transform the energy sector, ensure sustainable service delivery in areas such as health, housing and skills, and to successfully deliver international events like the Brisbane 2032 Olympic and Paralympic Games. |
| • | The Australian, state and territory governments are strategically planning to support the least-cost transition to a reliable, accessible and affordable renewable energy sector. With all levels of government agreeing to achieve zero net emissions by 2050, Queensland is progressing with material and measured investment in transmission, generation, storage and hydrogen infrastructure to secure critical policy outcomes. There are clear opportunities for the Australian Government to support these investments and accelerate energy projects critical to energy transformation. |
| • | Health services are a large and growing cost for the Australian, state and territory governments. The COVID-19 pandemic caused significant disruption to health systems and states and territories are bearing financial risks under the current funding arrangement. The Queensland Government will work closely with the Australian Government to address short-term funding issues and embed long-term fiscal sustainability in the Queensland and national health systems. |
| • | The pressure on accessing safe, secure and affordable housing is a matter of national interest as it underpins social, economic and public health outcomes. This is particularly relevant as the Australian Government and state and territory governments begin to review the National Housing and Homelessness Agreement (NHHA)—the key agreement that defines their roles in funding and providing housing and homelessness services. The review is critical to ensure sustainable investment to meet national and local needs. Through the review, the Queensland Government will seek to secure future funding arrangements that account for the pressures on the state’s housing market, specifically in regional and remote areas. |
| • | The Queensland Government will re-engage with the Australian Government regarding negotiation of a new National Skills Agreement. Through this process, the Queensland Government is focused on ensuring Queenslanders can access high quality and relevant training to address state priorities, local economic needs and sector skills shortages, including in emerging industries. |
| • | Brisbane 2032 offers a significant opportunity to showcase Queensland and Australia. The Queensland Government is committed to working with the Australian Government, International Olympic Committee and Games Partners to best position Queensland to successfully deliver this major international sporting and cultural event in 2032. |
139
Budget Strategy and Outlook 2022-23
| 7.2 | Australian Government funding to all states and territories |
Across all states, the Australian Government estimates it will provide funding of $166.433 billion in 2022–23, which is $995.6 million (or 0.6 per cent) less than in 2021–22, comprising:
| • | $83.885 billion in payments as shares of general revenue assistance (i.e. GST revenue) ($8.326 billion more than in 2021–22) |
| • | $81.646 billion in payments for specific purposes ($9.288 billion less than in 2021–22) including: |
| - | $28.139 billion in National Health Reform funding, including $934.1 million in COVID-19 public health response funding |
| - | $26.413 billion in Quality Schools funding |
| - | $1.645 billion in National Housing and Homelessness funding |
| - | $23.844 billion in National Partnership payments (e.g. Infrastructure Investment Program, National Water Grid Fund, DisabilityCare Australia Fund and Preschool Reform Agreement) |
| - | $1.606 billion in National Skills and Workforce Development funding. |
| • | $901.9 million in other payments to states, including: |
| - | $816.8 million for certain royalty payments to Western Australia |
| - | $42.7 million to Western Australia to compensate for reduced royalties |
| - | $42.4 million for municipal services to the Australian Capital Territory. |
Australian Government payments for specific purposes may not fully fund all underlying programs. Some require states to provide matching contributions (e.g. JobTrainer Fund) or other, financial or in-kind contributions. This reduces budget flexibility for states, particularly where it is not a Queensland Government priority or in cases where the Australian Government dictates specific conditions related to the funding.
| 7.3 | Australian Government funding to Queensland |
It is estimated the Australian Government will provide the Queensland Government with $34.925 billion in 2022–23 ($1.907 billion more than in 2021–22).
Australian Government funding is estimated to account for 47 per cent of Queensland’s total General Government Sector revenue sources in 2022–23 (shown in Chart 7.2). The proportion of Queensland’s revenue derived from Australian Government funding has grown significantly from 35 per cent at the time of the introduction of the GST in 2000.
140
Budget Strategy and Outlook 2022-23
| Chart 7.2 | General Government Sector revenue sources, Queensland 2022–231,2 |
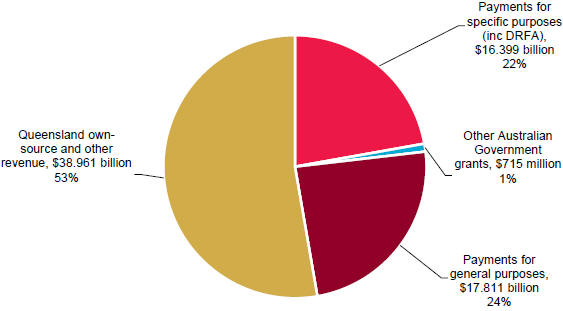
Notes:
| 1. | Queensland own-source and other revenue figure includes taxation revenue, sales of goods and services, royalties and land rents. |
| 2. | Queensland Treasury estimates. Other Australian Government grants include payments direct to Queensland Government agencies for Australian Government own-purpose expenditure. |
Sources: 2022–23 Federal Budget Paper No. 3 and Queensland Treasury estimates.
141
Budget Strategy and Outlook 2022-23
| 7.4 | Payments to Queensland for specific purposes |
In 2022–23, Queensland expects to receive $16.399 billion 1 in payments for specific purposes, $243 million (1.5 per cent) more than in 2021–22.
| Table 7.1 | Estimated payments of Australian Government grants1 |
| 2020��21 Actual $ million | 2021–22 Est. Act. $ million | 2022–23 Budget $ million | ||||||||||
Payments for specific purposes | ||||||||||||
Skills and Workforce Development funding | 315 | 321 | 328 | |||||||||
National Health Reform funding2 | 5,510 | 5,879 | 6,030 | |||||||||
Quality Schools funding3 | 5,226 | 5,785 | 6,094 | |||||||||
National Housing and Homelessness funding | 328 | 334 | 342 | |||||||||
National Partnership payments (incl. DRFA) | 4,588 | 3,837 | 3,606 | |||||||||
Total payments for specific purposes | 15,967 | 16,157 | 16,399 | |||||||||
Other Australian Government grants4 | 1,287 | 1,048 | 715 | |||||||||
Total payments for specific purposes and other Australian Government grants | 17,254 | 17,205 | 17,114 | |||||||||
Notes:
| 1. | Numbers may not add due to rounding. |
| 2. | Includes funding for the COVID-19 public health response of $267 million in 2020–21 and $220.3 million in 2021–22. |
| 3. | Quality Schools funding includes payments for government schools (exclusive of GST) and non-government schools (inclusive of GST). |
| 4. | Includes direct Australian Government payments to Queensland agencies for Australian Government own-purpose expenditure (e.g. financial assistance grants to local government and funding to Hospital and Health Services). |
Sources: 2022–23 Federal Budget Paper No. 3 and Queensland Treasury estimates.
Payments for specific purposes comprise funding for National Health Reform, Quality Schools, National Housing and Homelessness, the Skills and Workforce Development National Specific Purpose Payment (SPP) and National Partnership (NP) payments.
In 2022–23, National Health Reform funding, which accounts for 36.8 per cent of the total payments for specific purposes, is estimated to increase by $150 million (2.6 per cent) from 2021–22. The low increase in 2022–23 is due to the inclusion of COVID-19 public health response funding in 2021–22 ($ 220.3 million). If the impact of the COVID-19 health response funding in 2021–22 is removed, National Health Reform funding is expected to increase by $370.6 million (6.5 per cent) from 2021–22.
| 1 | Queensland Treasury estimates. |
142
Budget Strategy and Outlook 2022-23
Queensland Government projections of National Health Reform funding differ from the projections contained in the 2022–23 Federal Budget as Australian Government projections assume higher activity growth than projected in service agreements between the Queensland Department of Health and Hospital and Health Services. Actual National Health Reform payments vary from estimates provided in budget papers as they are based on actual public hospital activity delivered each year.
Quality Schools funding, which accounts for 37.2 per cent of the total payments for specific purposes, is estimated to increase by $309 million (5.3 per cent) to $6.094 billion in 2022–23.
National Housing and Homelessness funding is estimated to increase by $7 million (2.2 per cent) in 2022–23, which includes additional temporary funding allocated by the Australian Government to support social and community service workers wages in the housing and homelessness sectors.
Skills and Workforce Development funding is expected to increase by $7 million (2.3 per cent) in 2022–23 compared to 2021–22. Given its high priority in a tight labour market, the Australian Government and state and territory governments are working towards finalising a new National Skills Agreement to replace the Skills and Workforce Development SPP.
NP payments (including DRFA), which account for 22 per cent of the total payments for specific purposes, are estimated to decrease by $231 million (6.0 per cent) in 2022–23 compared to 2021–22. A significant proportion of NP payments is allocated to infrastructure, DRFA and community services (refer to Chart 7.3).
The reduction in NP payments between 2021–22 and 2022–23 is mainly due to the:
| • | cessation of the temporary COVID-19 business support grant program in 2021–22 |
| • | expected reduction in HomeBuilder grant payments due to the program drawing to a close towards the end of 2022–23. |
143
Budget Strategy and Outlook 2022-23
| Chart 7.3 | National Partnership Payments by sector, 2022–231 |
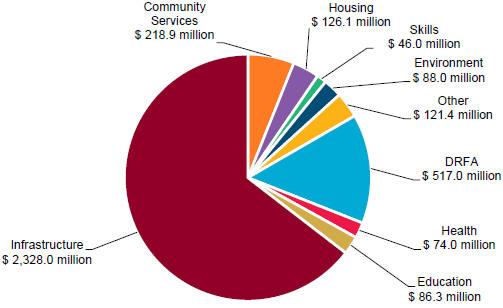
Note:
| 1. | Excludes Australian Government funding to local government and payments direct to Queensland Government agencies for Australian Government own-purpose expenditure. |
Sources: 2022–23 Federal Budget Paper No. 3 and Queensland Treasury estimates.
Other Australian Government grants include payments direct to Queensland Government agencies for Australian Government own-purpose expenditure. In 2022–23, Queensland expects to receive $715 million in other Australian Government grants, $333 million (31.8 per cent) less than in 2021–22. The decrease is mainly due to the Australian Government’s bring forward of financial assistance grants to local governments from 2022–23 to 2021–22.
| 7.4.1 | Projections of payments for specific purposes to Queensland |
Across the forward estimates, total payments for specific purposes are expected to steadily increase, with average growth of approximately 3.1 per cent between 2022–23 and 2025–26.
While increases in overall funding are timely, payments tied to specific purposes and Australian Government criteria restricts Queensland’s capacity to respond to local needs, reduces state budget flexibility, adds administrative costs, and impacts on the achievement of policy outcomes and priorities. This negative impact is amplified when funding is conditional on Queensland matching Australian Government funding, unrealistic timeframes, rudimentary national price benchmarks and misalignment with state priorities.
144
Budget Strategy and Outlook 2022-23
Under the National Health Reform Agreement, the Australian Government will fund 45 per cent of efficient growth in hospital activity subject to a national growth cap of 6.5 per cent per annum. The COVID-19 pandemic continues to put pressure on the state’s health system as it responds to increased demand, deferred care and ongoing workforce challenges. If growth in hospital activity exceeds 6.5 per cent, the state risks assuming a significantly larger financial burden to address these challenges.
Growth in Quality Schools funding for Queensland is expected to average 3.9 per cent between 2022–23 and 2025–26 in line with enrolment growth and increased funding per student. Queensland is expecting to receive $9.690 billion for state schools and $16.230 billion (including GST) for non-government schools from 2022–23 to 2025–26.
| 7.4.2 | Expiring agreements |
Under the Intergovernmental Agreement on Federal Financial Relations, the Australian Government provides time-limited funding to states and territories through NP payments to support the delivery of specific projects, facilitate reforms or reward states that deliver on nominated reforms or service delivery improvements.
Over time, some NPs have been extended beyond their intended time-limited purpose to continue funding services. NPs were never intended, and are not considered the optimal way, to fund ongoing community service needs.
Expiring NP agreements that support long standing and effective services or programs leave states with limited opportunities to appropriately manage consequences as final funding decisions are made through the Australian Government’s budget process. The expiry of many large NPs over the last few years, such as the National Partnership on Remote Housing, which has required Queensland to invest approximately $100 million a year, highlights this risk. Early indication from the Australian Government as to the continuation, lapse or other treatment of funding for an expiring agreement is necessary to enable states to effectively manage their service delivery responsibilities.
There are 23 agreements1 expected to expire in 2021–22. At the 2022–23 Federal Budget, the Australian Government allocated funding beyond 2021–22 for 7 expiring agreements:
| • | universal access to early childhood education – replaced by the Preschool Reform Agreement with funding from 2021–22 to 2025–26 |
| • | public dental services for adults – funding extended to 2022–23 |
| • | national bowel cancer screening program – funding extended to 2023–24 |
| • | family law information sharing program (schedule A) – national funding allocated over 3 years from 2022–23 to continue the program, with state allocations yet to be finalised |
| • | family law information sharing program (schedule B) – national funding allocated over 3 years from 2022–23 to continue the program, with state allocations yet to be finalised |
| • | national tropical weeds eradication program – funding extended to 2023–24 |
| • | national exotic fruit fly in Torres Strait eradication program – funding extended to 2026–27. |
| 1 | Includes any expiring schedules to Federation Funding Agreements. |
145
Budget Strategy and Outlook 2022-23
The 2022–23 Federal Budget did not allocate funding beyond 2021–22 for 2 expiring and important funding agreements – Project Agreement for Phase 2 of the Queensland Government’s Household Resilience Program and Project Agreement for Yellow Crazy Ant Control – Wet Tropics of Queensland.
A funding extension or renewal was not sought for the remaining 14 expiring agreements due to the short-term nature of the programs. These include temporary funding provided for the COVID-19 business support grant program, legal assistance for bushfire support, wildlife and habitat bushfire recovery and COVID-19 legal assistance funding.
| 7.5 | State–local government financial relations |
The Queensland Government allocates considerable funding in the 2022–23 Queensland Budget to support local governments across the state. This recognises the critical role local governments play in supporting their local communities.
In 2022–23, the Queensland Government will provide a total of $2.280 billion in grants to local governments.
This includes current and capital grants to local government authorities and Indigenous councils, as well as Australian Government grants paid through the state to local governments.
Grants to local governments are delivered through numerous Queensland Government departments and agencies for a variety of purposes, including through the programs discussed below.
Significant stimulus delivered in response to the COVID-19 pandemic included the COVID Works for Queensland program and the Unite and Recover Community Stimulus Package. These initiatives have assisted Queenslanders in the ongoing economic recovery.
A summary of Queensland Government grant programs that have been made exclusively available to local governments are listed in Table 7.2.
146
Budget Strategy and Outlook 2022-23
| Table 7.2 | Grant programs exclusively available to local governments |
Program name | Description | Total funding (from 2015–16 to 2025–26) | ||
| Works for Queensland | Supports local governments in regional areas to undertake job creating maintenance and minor infrastructure works. | $970 million1 | ||
| COVID Works for Queensland | Supports all local governments to respond to and recover from the COVID-19 pandemic to deliver job creating new infrastructure, maintenance or minor works projects. | $200 million | ||
| South East Queensland (SEQ) Community Stimulus Program | Supports South East Queensland local governments to fast-track investment in new infrastructure and community assets that create jobs and deliver economic stimulus to local communities. | $190 million2 | ||
| Unite and Recover Community Stimulus Package | Supports SEQ local governments to recover from the COVID-19 pandemic by fast-tracking investment in new infrastructure and community assets that create jobs and deliver economic stimulus to local communities. | $50 million | ||
| Transport Infrastructure Development Scheme | Provides targeted investment in regional local government transport infrastructure. | $770 million | ||
| Building our Regions | Provides funding for critical infrastructure in regional areas to support economic development, including generating jobs. | $418.3 million | ||
| Local Government Grants and Subsidies Program | Provides funding for priority infrastructure projects that will enhance sustainable and liveable communities. | $318.9 million3 | ||
| Coastal Hazard Adaptation Program – QCoast2100 | Assists coastal local governments to prepare plans and strategies for addressing the impact of climate change. | $15 million | ||
| Queensland Water Regional Alliances Program | Assists regional councils to collaborate and improve the efficiency and administration of water infrastructure. | $15 million | ||
Notes:
| 1. | Total funding of $1 billion out to 2026–27 |
| 2. | Total funding of $200 million out to 2026–27 |
| 3. | Funding is ongoing. Figure is based on current projections. |
In addition to the above grant programs, the Queensland Government has signed the National Partnership Agreement on Disaster Risk Reduction, which is a 5-year partnership between the Australian Government and the states to support disaster mitigation projects and build resilience to natural disasters. This fund is administered by the Queensland Reconstruction Authority (QRA) and replaces the Queensland Disaster Resilience Fund.
The QRA also administers the Disaster Recovery Funding Arrangements which is a joint funding initiative of the Queensland and Australian Governments to provide disaster relief and recovery payments to help communities recover following the effects of natural disasters. Under these arrangements the government administers significant funding (close to $1.7 billion in expenditure expected in 2022–23) including to provide disaster relief and assist with reconstruction of local government infrastructure damaged during natural disasters. The amount of funding administered is dependent on the final number and value of claims submitted.
The Queensland Government also understands there are added challenges faced by Indigenous councils to ensure their communities have access to essential services and critical infrastructure.
147
Budget Strategy and Outlook 2022-23
To address these challenges, the government has allocated substantial funding to specifically support Indigenous councils and their communities.
A summary of grant programs that have been made available to Indigenous councils and their communities are listed in Table 7.3.
| Table 7.3 | Grant programs to support Indigenous councils and their communities |
Program name | Description | Total funding (from 2015–16 to 2025–26) | ||
| Indigenous Councils Critical Infrastructure Program | Contributes to the cost of water, wastewater and solid waste infrastructure in Indigenous communities. | $120 million | ||
| Major Infrastructure Program | Deliver environmental health and other infrastructure upgrades within the Torres Strait Island Regional Council, Torres Shire Council and Northern Peninsula Area Regional Council areas. | $15 million | ||
| State Government Financial Aid | A financial contribution (in lieu of rates) to meet the costs incurred by Indigenous councils in the provision of local government services. | $387.8 million1 | ||
| Indigenous Local Government Sustainability Program (2016–18) | Assisted Indigenous councils to increase their capacity, capability and sustainability. | $7.7 million |
Note:
| 1. | Funding is ongoing. Figure is based on current projections |
148
Budget Strategy and Outlook 2022-23
| 8 | Public Non-financial Corporations Sector |
Features
| • | Entities in the Public Non-financial Corporations (PNFC) Sector provide essential services such as electricity supply and distribution, bulk water supply, rail services, and port services. The Queensland Government has a strong commitment to maintaining public ownership of our assets, and expects these businesses to operate commercially and efficiently, and to work towards continually improving services to Queenslanders. |
| • | The PNFC Sector is expected to achieve earnings before interest and tax (EBIT) of $3.519 billion in 2022–23, representing a $1.525 billion increase from 2021–22. While PNFC Sector earnings in 2021–22 are expected to be lower compared to the 2021–22 Budget, sector-wide earnings are forecast to increase from 2022–23 with an improvement in the performance of the electricity sector. |
| • | PNFC Sector borrowings for 2021–22 are around $7.260 billion higher than forecast at the 2021–22 Queensland Budget. This is mainly due to movements in the value of electricity hedging contracts entered into prior to an upward shift in market conditions. Movements over the forward estimates are primarily due to the accounting treatment of short-term financial contracts held by energy government-owned corporations (GOCs). |
| • | In 2021–22, the government is supporting businesses to invest for the future, with total dividends of around $580 million to be retained by GOCs (including the Queensland Investment Corporation) for investment in critical infrastructure and growth initiatives. This decision recognises the need to capitalise businesses to undertake strategically important investment in transformational growth opportunities and government’s commitment to public ownership for the benefit of all Queenslanders. |
| • | Since 2020, Queensland Government generators have announced ownership and offtake agreements in renewable energy projects which will add almost 3 gigawatts of clean energy to Queensland. In 2021–22, Stanwell and CS Energy also announced they are progressing large-scale batteries at Tarong and Chinchilla respectively, to support the continued uptake of renewable energy across Queensland. |
| • | The Queensland Government has allocated $385 million in 2022–23 to support all households facing cost of living pressures, with each Queensland household to receive a $175 Cost of Living rebate on their electricity bill in 2022–23. Including previous Asset Ownership Dividends and the COVID-19 Utility Rebate, this will be the government’s sixth rebate provided since 2018, with the government having allocated a total of $1.185 billion to provide households with a total of $575 in rebates. |
| • | These payments complement the government’s longstanding commitment that all Queenslanders pay a similar price for electricity no matter where they live, under the Uniform Tariff Policy (UTP). To support the UTP, the government provides an annual Community Service Obligation Payment, costing $635 million in 2022–23. |
149
Budget Strategy and Outlook 2022-23
| • | Queensland Rail continues to work with external partners to progress significant new rail infrastructure including the Cross River Rail project, implementation of the European Train Control System to improve operational efficiency, new stations and station accessibility upgrades and additional train stabling capacity. |
| • | Major port projects continuing in 2022–23 include the Channel Capacity Upgrade at the Port of Townsville to improve freight export and import opportunities for North Queensland. Planning will also continue on expanding the Cairns Marine Precinct with a Common User Facility to enable the maintenance, repair, and overhaul of more and larger ships in Cairns. |
| • | Through state-owned businesses Seqwater and Sunwater, the Queensland Government is delivering additional water supply, fortifying the flood resilience of water infrastructure and ensuring the ongoing safety and reliability of dams. This includes continued construction of the $367.2 million Rookwood Weir, the $125.4 million Mount Crosby Flood Resilience Program and $95.2 million South West Pipeline project, as well as delivery of the Toowoomba to Warwick Pipeline estimated at more than $300 million. $54.2 million will also be invested in 2022–23 for planning and early works on improvements to Paradise, Burdekin Falls, Somerset and Lake Macdonald Dams. |
| 8.1 | Context |
Entities comprising the PNFC Sector provide vital services such as electricity supply and distribution, water supply, and rail and port services.
Queensland GOCs, declared by regulation under the Government Owned Corporations Act 1993 (GOC Act), comprise a large share of the PNFC Sector. The sector also comprises commercialised statutory entities, including Queensland Rail, Queensland Bulk Water Supply Authority (trading as Seqwater), local water boards, and other public corporations (such as Stadiums Queensland).
GOCs are accountable for their financial performance and are required to be commercial and efficient organisations. These requirements are legislated under the GOC Act with similar provisions made in the enabling legislation of Queensland Rail and Seqwater. The entities incur costs and bear commercial risks in the delivery of their services or products and generate a commercial rate of return from the sale of these services or products to sustain ongoing investment and performance.
Returns from the PNFC Sector contribute to consolidated revenue and are used to pay for various government services.
Community Service Obligation (CSO) payments are used to subsidise particular services so they can be offered to the community at prices lower than would otherwise be possible if full cost recovery and normal margins were applied.
A key example is the CSO paid to Energy Queensland Limited (EQL) to provide electricity in regional Queensland at prices based on the costs of supply in South East Queensland, in accordance with the government’s Uniform Tariff Policy. This policy ensures that electricity prices in regional Queensland are much lower than would otherwise be the case.
150
Budget Strategy and Outlook 2022-23
The commercial nature of PNFC Sector entities ensures debt is self-supporting and net worth continues to grow over the forward estimates. The Queensland Government’s ongoing commitment to maintaining public ownership of the entities in the PNFC Sector guarantees all Queenslanders benefit from their performance. Public ownership of electricity, port, rail and water infrastructure provides the Queensland Government with opportunities to support strategic investment in key sectors of a growing economy to achieve better outcomes for all Queenslanders.
| Table 8.1 | Key financial aggregates1 |
| 2020–21 Outcome $ million | 2021–22 Budget $ million | 2021–22 Est. Act. $ million | 2022–23 Budget $ million | 2023–24 Projection $ million | 2024–25 Projection $ million | 2025–26 Projection $ million | ||||||||||||||||||||||
Revenue | 13,240 | 12,237 | 13,750 | 13,589 | 13,744 | 13,572 | 13,774 | |||||||||||||||||||||
Expenses | 12,078 | 11,463 | 13,212 | 12,389 | 12,349 | 12,479 | 12,710 | |||||||||||||||||||||
Net Operating Balance | 1,162 | 774 | 538 | 1,199 | 1,395 | 1,093 | 1,064 | |||||||||||||||||||||
PNFA2 | 3,157 | 3,713 | 3,055 | 3,334 | 3,025 | 3,266 | 3,538 | |||||||||||||||||||||
Assets | 71,543 | 71,678 | 75,962 | 74,953 | 75,398 | 75,905 | 76,774 | |||||||||||||||||||||
Borrowings | 41,558 | 41,305 | 48,566 | 44,334 | 42,501 | 41,863 | 41,318 | |||||||||||||||||||||
Notes:
| 1. | Numbers may not add due to rounding. |
| 2. | PNFA: Purchases of non-financial assets. |
| 8.1.1 | Electricity networks |
The government owns 2 electricity network businesses which are responsible for transporting safe, reliable electricity to consumers across the state (Powerlink and Energy Queensland).
Powerlink
Powerlink owns, develops, operates and maintains the electricity transmission network in Queensland. Its network spans approximately 1,700 km from north of Cairns to the New South Wales border and comprises 15,345 km of transmission lines and 147 substations.
Powerlink’s role in the electricity supply chain is to transmit high voltage electricity through its transmission grid to the distribution networks.
Powerlink also transmits electricity to high-usage industrial customers such as rail companies, mines and mineral processing facilities, and to New South Wales via the Queensland/New South Wales interconnector transmission line.
151
Budget Strategy and Outlook 2022-23
Energy Queensland Limited
Energy Queensland Limited (EQL) owns and operates the low-voltage distribution network that transmits electricity from Powerlink’s transmission network to households and businesses across Queensland. EQL includes a number of operating subsidiary businesses, including Ergon Energy Network, Ergon Energy Retail, Energex, and Yurika.
In regional Queensland, Ergon Energy Network and Ergon Energy Retail provide distribution network and customer retail services, respectively, while in South East Queensland, Energex provides distribution network services to customers.
Yurika is involved in a range of other service delivery functions including demand management services, large-scale connections, microgrid solutions, the provision of contestable metering services and telecommunications infrastructure. Yurika is focused on pursuing strategic investments in unregulated markets to provide greater choice to commercial and industrial customers, and to provide EQL with an enhanced ability to respond to emerging trends.
Network revenues
Revenues for the network businesses are largely derived from network services that are regulated by the Australian Energy Regulator (AER). The AER determines these revenues on a 5-yearly basis, based on the businesses’ proposals and its view of the reasonable benchmark efficient costs for a network business.
In April 2022, the AER published its transmission determination for Powerlink for the 2022–27 period, which is supporting a reduction in network costs charged in 2022–23 electricity bills for the typical residential and small business customer.
Similarly, in June 2020, the AER published its distribution determination for Energex and Ergon Energy Network (as electricity distribution providers) for the 2020–25 period, also leading to lower network costs for average Queensland residential households and small businesses.
| 8.1.2 | Electricity generation |
Queensland is in a strong position to deliver reliable and affordable energy through significant baseload and renewable generation capacity.
Queensland continues to operate Australia’s youngest and most efficient fleet of coal-fired generators and an increasing number of large-scale renewable projects. This includes assets owned by our publicly-owned generators – CleanCo, CS Energy, and Stanwell.
In 2022–23, construction will commence on CleanCo’s 102.6 megawatt (MW) Karara Wind Farm in the Darling Downs. Construction will also commence or continue on new wind and solar farms across Queensland with which our generators have entered long-term power purchase agreements. Since 2020, Queensland Government generators have announced ownership and offtake agreements in renewable energy projects which will add almost 3 gigawatts of clean energy to Queensland.
The GOCs will play a key role in helping to deliver the government’s 50 per cent Queensland Renewable Energy Target by 2030.
152
Budget Strategy and Outlook 2022-23
CleanCo
CleanCo is the newest publicly-owned energy generator in Queensland, owning and operating a portfolio of low and no emissions generation assets. Following the transfer of a strategic low-emissions generation portfolio from Stanwell and CS Energy in late 2019, CleanCo has been an active participant in the National Electricity Market.
In addition to its foundation portfolio, since 2020, CleanCo has committed to support a further 1,100 MW in new renewable generation capacity. This will be achieved by power agreements with wind and solar farms in the Darling Downs, Western Downs, and Far North Queensland, and through CleanCo’s 102.6 MW Karara Wind Farm which it will build, own and operate.
CleanCo is also supporting the sustainable energy goals of major commercial customers, including BHP and Coles, by entering long-term agreements to supply firm renewable energy.
CS Energy
CS Energy is a major supplier of electricity across Queensland, with a portfolio of around 3,500 MW of installed capacity under management, including the Callide B and Kogan Creek Power Stations, and the Callide C Power Station, which it operates and has a 50 per cent ownership interest in. CS Energy is also a party to the Gladstone Interconnection and Power Pooling Agreement, and trades output of the Gladstone Power Station that exceeds the electricity requirements of the Boyne Island Aluminium Smelter.
Since 2020, CS Energy has entered multiple agreements to purchase electricity from renewable energy generators, including with Moura, Warwick, Hughenden, and Columboola solar farms. CS Energy also provides retail services to large commercial and industrial customers throughout Queensland and has a 50/50 joint venture with Alinta Energy to supply electricity to residential and small business customers in South East Queensland.
In 2021–22, CS Energy announced its partnership with Senex Energy to develop the Kogan Renewable Hydrogen Project near Chinchilla. Through the Queensland Renewable Energy and Hydrogen Jobs Fund, CS Energy has been allocated $28.9 million towards this project.
Stanwell
Stanwell is a major supplier of electricity across Queensland, with a portfolio of around 3,300 MW of installed capacity from its 3 coal-fired power stations in Queensland. Stanwell sells electricity directly to large commercial and industrial customers in Queensland and interstate, and earns revenue from coking coal exported from Curragh Mine.
In 2020, Stanwell entered a long-term agreement to offtake 348 MW of renewable energy from the Clarke Creek Wind Farm in Central Queensland, with construction commencing in 2022–23. In 2022, Stanwell also announced an offtake agreement with the Blue Grass Solar Farm near Chinchilla in the Western Downs.
153
Budget Strategy and Outlook 2022-23
Through the Queensland Renewable Energy and Hydrogen Fund, Stanwell has been allocated $192.5 million towards its investment in the 252 MW Wambo Wind Farm, which it will develop in partnership with global renewables developer, Cubico. Stanwell will own 50 per cent of the wind farm and offtake the remaining 50 per cent through a power agreement. Construction of the wind farm is expected to commence in 2022 and be operational by 2024.
Stanwell is also progressing feasibility work on a large-scale hydrogen export facility in Gladstone as part of a consortium with several Japanese companies (including Iwatani Corporation) and Australian energy infrastructure business, APA Group. Stanwell has been allocated $15 million from the Queensland Renewable Energy and Hydrogen Jobs Fund to support the project.
| Box 8.1 | Renewable Energy and Storage |
The Queensland Government continues to drive investment in our state’s renewable energy future, including through the $2 billion Queensland Renewable Energy and Hydrogen Jobs Fund (the Fund). Investments through the Fund will help decarbonise the state’s energy system and demonstrate Queensland’s attractiveness to domestic and international investors to drive economic growth.
This Fund is enabling Queensland’s energy GOCs to invest in commercial renewable energy and hydrogen projects, and supporting infrastructure, including in partnership with the private sector. The Fund is demonstrating our commitment to drive investment and economic growth across Queensland, building the infrastructure and creating the jobs that will transform the state’s energy system and achieve our 50 per cent Queensland Renewable Energy Target by 2030 and net zero emissions by 2050. Queensland is leveraging its competitive advantage of a natural abundance of world-class wind and solar resources, as it harnesses that potential to make the state a renewable energy and hydrogen leader.
New GOC investment in renewables will complement the state’s existing portfolio of baseload generation assets, which will be critical to ensure security of electricity supply through Queensland’s energy transformation and support a growing manufacturing and resources sector.
With an allocation from the Fund, Stanwell is investing $192.5 million in the 252 MW Wambo Wind Farm near Dalby. Stanwell’s investment includes a 50 per cent direct equity stake in the project, and an offtake agreement for the remaining renewable energy generation. The project is being delivered in partnership with global renewables developer Cubico, and will support up to 200 jobs during construction and up to 20 ongoing operations and maintenance jobs.
Through projects like this, we are strengthening our commitment to maintain public ownership of generation.
Queensland is also investing to deliver the energy storage capacity essential to support Queensland’s energy transformation and deliver affordable, reliable and clean energy for Queenslanders.
154
Budget Strategy and Outlook 2022-23
In 2021–22, $22 million was committed over 2 years to undertake a feasibility study for a pumped hydro energy storage project at Borumba and concept studies for other sites. This Budget allocates up to $48 million more for pumped hydro energy storage investments, including $13 million to fast-track a final investment decision on the proposed Borumba pumped hydro energy storage project and $35 million towards feasibility work on a second pumped hydro energy project.
To support the continued uptake of renewable energy across Queensland, CS Energy is investing $150 million to deliver the 100 MW Chinchilla battery, and Stanwell is investing $207 million to deliver a 150 MW battery at Tarong.
These investments will further strengthen the supply of affordable, reliable and clean energy across Queensland, while also supporting regional jobs and investment.
| 8.1.3 | Rail |
Queensland Rail is an integrated, publicly-owned rail operator, responsible for the delivery of passenger transport in South East Queensland, long distance passenger services in rural and regional Queensland and provision of third-party access to networks for freight transport across the state.
The majority of services are delivered under a Rail Transport Services Contract (TSC) with the government, represented by the Department of Transport and Main Roads. The Rail TSC provides funding for rail infrastructure, Citytrain (South East Queensland passenger services) and Traveltrain (regional passenger services).
In 2022–23, Queensland Rail will support the delivery of significant new rail infrastructure, including the Cross River Rail project by the Cross River Rail Delivery Authority and other transformational rail infrastructure projects to increase rail service delivery for the state’s growing population. These investments will support local manufacturing supply chains, as well as supporting jobs in regional areas.
| 8.1.4 | Ports |
Queensland has a large network of ports that are owned and run by GOCs along its coastline. These businesses, Gladstone Ports Corporation (GPC), North Queensland Bulk Ports Corporation, Port of Townsville Limited, and Far North Queensland Ports Corporation (trading as Ports North), own and operate a range of assets from small facilities serving local communities to large, world class multi-user and multi-cargo ports, which have public and privately owned import and export facilities.
Queensland’s ports play an essential role in the state’s supply chain networks and economy, and their efficient operation is key to economic growth, job creation and sustainable development across the state.
Since 2020, government-owned ports have provided support to local communities affected by COVID-19 and remain committed to implementing appropriate measures to respond to the impacts of COVID-19 on staff, businesses and communities.
155
Budget Strategy and Outlook 2022-23
Other port GOC projects occurring throughout 2022–23 include:
| • | the continuation of the $232 million Channel Capacity Upgrade at the Port of Townsville |
| • | ongoing refurbishments and construction of the $63.9 million replacement shiploader for GPC’s RG Tanna Coal Terminal |
| • | expansion of the Cairns Marine Precinct with delivery of 2 new wharves as part of a $32 million early works package and working with the Australian Government to progress a major Common User Facility following a $150 million commitment by the Queensland Government |
| • | working with proponents in Gladstone, Townsville and major ports to identify and progress potential hydrogen opportunities at the respective ports. |
| 8.1.5 | Water |
The 2 largest entities in the Queensland bulk water supply industry are the Queensland Bulk Water Supply Authority (trading as Seqwater) and Sunwater Limited (Sunwater). Other water entities in the PNFC Sector include the Gladstone Area Water Board and Mount Isa Water Board.
Seqwater
Seqwater is responsible for supplying safe, secure and reliable bulk drinking water for people across South East Queensland. Its assets and operations are spread across a large geographic area from the New South Wales border to the base of the Toowoomba ranges and as far north as Gympie. Seqwater provides essential flood mitigation services and manages 7 water supply schemes which provide irrigation services.
Dams play a vital role in South East Queensland’s water supply and flood mitigation. Seqwater has an ongoing Dam Improvement Program (DIP) to ensure the safety and reliability of its dams and compliance with dam safety guidelines into the future.
Key projects for Seqwater in 2022–23 include:
| • | completion of the South West Pipeline to connect Beaudesert to the South East Queensland Water Grid to ensure a reliable long-term water supply |
| • | further investment into the Mount Crosby Flood Resilience Program including replacement and relocation of the existing East Bank electrical substation, construction of a new two-lane road bridge adjacent to the Mount Crosby Weir, and electrical infrastructure upgrades at the East Bank Pump Station |
| • | delivery of the Toowoomba to Warwick Pipeline to provide Warwick and surrounding communities a reliable drought contingency |
| • | planning activities for the Somerset Dam improvement project. |
156
Budget Strategy and Outlook 2022-23
Sunwater
Sunwater is the government’s major bulk water supply business for regions outside of South East Queensland. It supplies untreated bulk water to approximately 5,000 customers across the industrial, mining, urban and irrigation customer segments. Sunwater provides this through an extensive regional asset base, owning and managing water infrastructure assets with a replacement value of around $14 billion.
Dam safety is a major focus for Sunwater, as it is for all bulk water suppliers. Like Seqwater, Sunwater has an ongoing DIP to ensure the safety and reliability of its dams and compliance with dam safety guidelines into the future. The DIP is an essential works program and a key determinant of Sunwater’s financial performance over time.
Key projects for Sunwater in 2022–23 include:
| • | continuing planning and commencing early works for the Paradise Dam improvement project to enhance the dam to meet future extreme weather events |
| • | continuing planning for the Burdekin Falls Dam improvement project |
| • | continuing investigations into potentially raising Burdekin Falls Dam |
| • | continuing work to deliver efficiency improvements to the Mareeba-Dimbulah Water Supply Scheme |
| • | continuing construction of Rookwood Weir. |
| 8.2 | Finances and performance |
| 8.2.1 | Earnings before interest and tax |
Estimated Total PNFC Sector EBIT of $1.994 billion for 2021–22 is $857 million lower than forecast at the 2021–22 Queensland Budget. Across the forward estimates, PNFC Sector EBIT is expected to increase to $3.581 billion by 2023–24 and decline to $2.585 billion by 2025–26.
The electricity network sector EBIT is estimated to fall slightly in 2022–23 (compared to 2021–22 levels) and remain so over the forward estimates, driven by EQL’s regulated revenue determinations for the 2020–25 period and Powerlink’s regulated revenue determination for the 2022–2027 period.
For 2021–22, the electricity generation sector is no longer forecasting a positive EBIT, primarily reflecting movements in the value of hedging contracts entered into prior to recent market price volatility. Generators enter appropriate hedging contracts to provide earnings certainty, including on the Australian Securities Exchange. These adjustments are expected to be temporary with profitability expected to return from 2022–23, providing opportunities for new investment to support Queensland’s energy transformation, and improved returns to the state.
Port sector EBIT in 2021–22 aligns with the 2021–22 Queensland Budget and is forecast to trend upwards over the forward estimates, reflecting the various long-term revenue contracts with customers and is supported by cost recoveries from the completion of revenue generating capital expansions.
157
Budget Strategy and Outlook 2022-23
Water sector EBIT in 2021–22 also aligns with the 2021–22 Queensland Budget but is forecast to trend downwards over the forward estimates, due to Sunwater’s delivery of its substantial DIP.
Stadiums Queensland, a major contributor to the ‘Other’ PNFC sector, operates and maintains the state’s portfolio of major sporting stadiums and high performance and community venues. Earnings will be offset by expenses over the forward estimates as venues are improved and maintained to a contemporary standard in the lead up to the Brisbane 2032 Olympic and Paralympic Games.
| Table 8.2 | Earnings before interest and tax1 |
| 2020–21 Outcome $ million | 2021–22 Budget $ million | 2021–22 Est. Act. $ million | 2022–23 Budget $ million | 2023–24 Projection $ million | 2024–25 Projection $ million | 2025–26 Projection $ million | ||||||||||||||||||||||
Electricity Networks | 1,455 | 1,276 | 1,382 | 1,312 | 1,184 | 1,138 | 1,306 | |||||||||||||||||||||
Electricity Generation | 229 | 478 | (457 | ) | 1,067 | 1,472 | 797 | 422 | ||||||||||||||||||||
Rail | 342 | 335 | 281 | 312 | 266 | 341 | 332 | |||||||||||||||||||||
Ports | 217 | 209 | 206 | 219 | 243 | 258 | 261 | |||||||||||||||||||||
Water | 680 | 598 | 598 | 594 | 474 | 443 | 331 | |||||||||||||||||||||
Other2 | (97 | ) | (45 | ) | (15 | ) | 15 | (58 | ) | (64 | ) | (66 | ) | |||||||||||||||
Total PNFC sector | 2,826 | 2,851 | 1,994 | 3,519 | 3,581 | 2,913 | 2,585 | |||||||||||||||||||||
Notes:
| 1. | Numbers may not add due to rounding. |
| 2. | Includes other public corporations. |
| 8.2.2 | Borrowings |
Entities in the PNFC Sector use debt financing as a source of funds for asset renewal and capital investments, and to maintain an optimal capital structure. Borrowings also include derivative liabilities associated with hedging activities undertaken by GOCs.
PNFC Sector entities are required to take a prudent and sound approach to debt management, including the establishment of borrowing arrangements which are appropriate to the business risk of the organisation. These arrangements consider the appropriateness of the proposed capital expenditure program, together with the implications of borrowings on key financial and performance related indicators.
Importantly, PNFC Sector entity asset values are a relevant factor in considering overall PNFC Sector borrowings. On average, for 2022–23, PNFC Sector entities borrow around 55 per cent of their asset values.
For the PNFC Sector as a whole, increases in borrowings are more than offset by increases in the value of total assets over time, with the ratio of borrowings to total assets falling to around 54 per cent by 2025–26.
158
Budget Strategy and Outlook 2022-23
Total PNFC Sector borrowings for 2021–22 is estimated at $48.566 billion, or around $7.260 billion higher than forecast at the 2021–22 Budget. Movements over the forward estimates are primarily due to the accounting treatment of short-term financial contracts held by energy GOCs.
Borrowings in the water sector are largely attributable to Seqwater, which currently holds $9.185 billion of debt. This debt balance is the result of the large investment in water infrastructure in response to the Millennium Drought and the associated price path. Seqwater’s forecast borrowings reduce across the forward estimates, with price path debt forecast to be repaid by 2027–28.
Port sector borrowings are forecast to increase modestly to $1.125 billion by 2025–26, with increases to fund major capital works and infrastructure projects by the Port of Townsville and Ports North.
| Table 8.3 | Borrowings and total assets1 |
| 2020–21 Outcome $ million | 2021–22 Budget $ million | 2021–22 Est. Act. $ million | 2022–23 Budget $ million | 2023–24 Projection $ million | 2024–25 Projection $ million | 2025–26 Projection $ million | ||||||||||||||||||||||
Electricity Networks | 23,738 | 24,413 | 23,907 | 24,361 | 24,477 | 24,590 | 24,587 | |||||||||||||||||||||
Electricity Generation | 2,756 | 1,397 | 9,533 | 4,817 | 2,987 | 2,474 | 2,194 | |||||||||||||||||||||
Rail | 3,829 | 4,410 | 4,130 | 4,401 | 4,569 | 4,622 | 4,663 | |||||||||||||||||||||
Ports | 1,084 | 1,115 | 1,056 | 1,064 | 1,106 | 1,125 | 1,125 | |||||||||||||||||||||
Water | 9,983 | 9,812 | 9,782 | 9,543 | 9,224 | 8,922 | 8,627 | |||||||||||||||||||||
Other2 | 168 | 158 | 158 | 147 | 138 | 130 | 122 | |||||||||||||||||||||
Total PNFC sector | 41,558 | 41,305 | 48,566 | 44,334 | 42,501 | 41,863 | 41,318 | |||||||||||||||||||||
Total Assets | 71,543 | 71,678 | 75,962 | 74,953 | 75,398 | 75,905 | 76,774 | |||||||||||||||||||||
Notes:
| 1. | Numbers may not add due to rounding. |
| 2. | Includes other public corporations. |
159
Budget Strategy and Outlook 2022-23
| 8.2.3 | Returns to government |
PNFC Sector entities provide returns to government by way of dividends and tax equivalent payments.
Dividends
Dividends generated by the PNFC Sector form part of consolidated revenue used to fund a range of government services. The GOC Act provides for the payment of dividends, with the dividend policies of GOCs determined by government. Each year, GOC boards make a dividend recommendation for government consideration.
Total PNFC Sector dividends for 2021–22 are expected to be $193 million, or $375 million less than forecast at the 2021–22 Queensland Budget. This outcome reflects the government’s decision to allow the energy, ports, and water GOCs to retain 2021–22 dividends otherwise payable for reinvestment in critical infrastructure and growth initiatives. In the energy sector, this will include investment in new energy assets to support the energy transformation and put downward pressure on electricity prices through supporting increased supply and storage. This decision recognises the government’s commitment to public ownership, and the potential to leverage investment opportunities to grow our businesses and deliver future revenue benefits for Queenslanders.
Over the forward estimates, the PNFC Sector is expected to deliver cumulative dividends of $2.854 billion, with annual dividends increasing to 2023–24 and declining thereafter, to $588 million by 2025–26.
Electricity network dividends are expected to fall to $134 million in 2024–25, due to the AER’s revenue determination leading to an expected fall in EQL’s and Powerlink’s earnings, with a modest recovery thereafter.
The electricity generation sector is forecast to provide dividends from 2022–23, with dividends increasing to 2023–24 and declining to 2025–26. This trend reflects earnings growth of these businesses, with the current wholesale market environment supporting returns in the next couple of years, and a return to more stable levels over the forward estimates. As the energy transformation accelerates, the entry of significant volumes of renewables will continue to boost supply into the grid and put sustained downward pressure on wholesale electricity prices. Lower wholesale prices driven by the influx of renewable generation impacts all generators in the sector.
Ports sector dividends are forecast to increase over the forward estimates in line with earnings.
In the water sector, dividends are expected to be modest over the forward estimates due to the repayment of debt by Seqwater and DIP costs. Only the Mount Isa and Gladstone Area Water Boards are forecasting dividends over the forward estimates.
160
Budget Strategy and Outlook 2022-23
| Table 8.4 | Dividends1 |
| 2020–21 Outcome $ million | 2021–22 Budget $ million | 2021–22 Est. Act. $ million | 2022–23 Budget $ million | 2023–24 Projection $ million | 2024–25 Projection $ million | 2025–26 Projection $ million | ||||||||||||||||||||||
Electricity Networks | 308 | 188 | — | 233 | 156 | 134 | 230 | |||||||||||||||||||||
Electricity Generation | 108 | 98 | — | 284 | 405 | 113 | 38 | |||||||||||||||||||||
Rail | 183 | 162 | 180 | 168 | 152 | 191 | 163 | |||||||||||||||||||||
Ports | 111 | 111 | — | 118 | 133 | 142 | 142 | |||||||||||||||||||||
Water | 25 | 10 | 13 | 12 | 13 | 13 | 15 | |||||||||||||||||||||
Total PNFC sector | 735 | 568 | 193 | 815 | 859 | 592 | 588 | |||||||||||||||||||||
Note:
| 1. | Numbers may not add due to rounding. |
Tax equivalent payments
Tax equivalent payments (TEPs) are paid by PNFC Sector entities to recognise the benefits derived because they are not liable to pay Australian Government tax. The primary objective of the payment is to promote competitive neutrality through a uniform application of income tax laws between government-owned businesses and their private sector counterparts.
In line with the trend in earnings growth, TEPs are expected to increase from $427 million in 2021–22 to $550 million in 2023–24, and then decrease to $406 million by 2025–26.
| Table 8.5 | Tax equivalent payments1 |
| 2020–21 Outcome $ million | 2021–22 Budget $ million | 2021–22 Est. Act. $ million | 2022–23 Budget $ million | 2023–24 Projection $ million | 2024–25 Projection $ million | 2025–26 Projection $ million | ||||||||||||||||||||||
Electricity Networks | 197 | 195 | 199 | 156 | 123 | 131 | 178 | |||||||||||||||||||||
Electricity Generation | 108 | 117 | 85 | 219 | 307 | 195 | 121 | |||||||||||||||||||||
Rail | 54 | 71 | 65 | 81 | 47 | 58 | 32 | |||||||||||||||||||||
Ports | 51 | 55 | 60 | 61 | 67 | 69 | 67 | |||||||||||||||||||||
Water | 8 | 5 | 18 | 6 | 7 | 7 | 8 | |||||||||||||||||||||
Other2 | 22 | 1 | — | — | 1 | 1 | — | |||||||||||||||||||||
Total PNFC sector | 441 | 444 | 427 | 524 | 550 | 460 | 406 | |||||||||||||||||||||
Notes:
| 1. | Numbers may not add due to rounding. |
| 2. | Includes other public corporations. |
161
Budget Strategy and Outlook 2022-23
Competitive neutrality fees
Competitive neutrality policy requires that public sector businesses, including GOCs, should not have a competitive advantage (or disadvantage) over the private sector solely due to their government ownership. A key application of this policy is the competitive neutrality fee (CNF).
The CNF is applied to a GOC’s cost of debt to neutralise any cost of funds advantage by way of government ownership on the basis of GOCs’ ability to borrow funds at a lower rate than private sector competitors, given the government’s credit strength.
In general, changes in CNF payments reflect movements in borrowing amounts, interest rate spreads and the entity’s stand-alone credit rating.
CNF payments by the PNFC Sector are expected to be $205 million in 2021–22, increasing to $221 million in 2023–24 before decreasing to $212 million in 2025–26. Total CNF is primarily driven by the electricity networks sector with payments by EQL increasing to 2023–24, in accordance with an increase to its borrowings to fund capital expenditure. CNF payments by other sectors are largely unchanged over the forward estimates.
| Table 8.6 | Competitive neutrality fee payments1 |
| 2020–21 Outcome $ million | 2021–22 Budget $ million | 2021–22 Est. Act. $ million | 2022–23 Budget $ million | 2023–24 Projection $ million | 2024–25 Projection $ million | 2025–26 Projection $ million | ||||||||||||||||||||||
Electricity Networks | 129 | 150 | 152 | 165 | 168 | 159 | 154 | |||||||||||||||||||||
Electricity Generation | 15 | 14 | 14 | 12 | 12 | 14 | 14 | |||||||||||||||||||||
Rail | 31 | 25 | 25 | 28 | 28 | 30 | 31 | |||||||||||||||||||||
Ports | 10 | 10 | 9 | 8 | 7 | 8 | 8 | |||||||||||||||||||||
Water | 4 | 4 | 4 | 5 | 5 | 4 | 4 | |||||||||||||||||||||
Total PNFC sector | 190 | 203 | 205 | 218 | 221 | 215 | 212 | |||||||||||||||||||||
Note:
| 1. | Numbers may not add due to rounding. |
| 8.2.4 | Community service obligation and rail transport services contract payments |
For public policy reasons, the government can direct GOCs to perform activities that are not in their commercial interest (for example, discounting rural irrigation water prices to stimulate the regional economy). In these situations, the government can compensate the GOC through the payment of a CSO for the cost of delivering the uncommercial part of the good or service.
162
Budget Strategy and Outlook 2022-23
In line with the Queensland Government’s Uniform Tariff Policy, a CSO payment is provided to EQL to compensate its retail subsidiary, Ergon Energy, for the increased costs of operating in regional Queensland. This subsidy is provided to ensure Queenslanders, regardless of their geographic location, pay a similar price for their electricity. The one-off increase in the forecast CSO cost for 2022–23 is due to regulated revenue under-recoveries in previous years being recovered in 2022–23.
Seqwater and Sunwater also own and operate water supply schemes, where irrigation prices for some schemes are set below the level necessary to recover the costs of supply. The government provides a CSO to offset the reduced revenue.
Similarly, TSC payments are made to Queensland Rail to deliver rail passenger services at non-commercial (subsidised) prices for commuter and tourism markets.
Total PNFC Sector CSO and TSC payments for 2021–22 are expected to be $2.564 billion, in line with the $2.612 billion forecast at the 2021–22 Budget. Over the forward estimates, CSO and TSC payments are expected to increase to $2.844 billion by 2025–26. This trend is largely driven by TSC payments, which is due to a mix of factors such as changes in patronage, escalation of service delivery costs, progression of capital works and operational readiness activities to support Cross River Rail, and growth in the number of rail services offered.
Water CSO payments are forecast to peak in 2021–22, due to commencement of the government’s rural irrigation water price discount for Sunwater and Seqwater customers for the 3 years to 2023–24, before decreasing over the forward estimates as prices transition towards cost recovery. There is no CSO forecast in 2024–25 because irrigation prices have not yet been set beyond 2023–24.
| Table 8.7 | Community service obligation payments and transport services contracts1 |
| 2020–21 | 2021–22 | 2021–22 | 2022–23 | 2023–24 | 2024–25 | 2025–26 | ||||||||||||||||||||||
| Outcome | Budget | Est. Act. | Budget | Projection | Projection | Projection | ||||||||||||||||||||||
| $ million | $ million | $ million | $ million | $ million | $ million | $ million | ||||||||||||||||||||||
Electricity Networks | 454 | 502 | 525 | 635 | 514 | 505 | 505 | |||||||||||||||||||||
Rail | 1,912 | 2,074 | 2,013 | 2,153 | 2,233 | 2,320 | 2,332 | |||||||||||||||||||||
Water | 20 | 35 | 26 | 24 | 23 | 7 | 7 | |||||||||||||||||||||
Total PNFC sector | 2,386 | 2,612 | 2,564 | 2,812 | 2,770 | 2,832 | 2,844 | |||||||||||||||||||||
Note:
| 1. | Numbers may not add due to rounding. |
| 8.2.5 | Equity movements |
Levels of GOC debt and equity are managed by the government to maintain an optimal and efficient capital structure. Corporations may apply different target capital structures to optimise value and support business operations. Equity movements account for changes in contributed equity and special dividends.
163
Budget Strategy and Outlook 2022-23
In 2021–22, total PNFC Sector equity withdrawals are expected to be $87 million, with Powerlink delivering a $170 million special dividend offsetting equity contribution across the PNFC Sector. This compares to a $453 million equity contribution forecast at the 2021–22 Budget, with the difference due to the timing of funding requirements for approved allocations from the Queensland Renewable Energy and Hydrogen Jobs Fund.
In the electricity networks sector, equity adjustments are made to maintain the gearing ratios of these businesses over time, including special dividends. In 2021–22, Powerlink received $40 million from the Queensland Renewable Energy Zone allocation to upgrade transmission lines and support the connection of Neoen’s Kaban Green Power Hub to the electricity grid.
In the electricity generation sector, equity movements primarily relate to allocations from the Queensland Renewable Energy and Hydrogen Jobs Fund for investments in renewables, storage, and hydrogen, and CleanCo’s investment in the Karara Wind Farm.
In the ports sector, Port of Townsville is receiving $30 million in 2022–23 for the Channel Capacity Upgrade, with Ports North continuing works to upgrade facilities at the Cairns Marine Precinct. In 2022–23, GPC is forecast to receive $7 million from the Australian Government for the Hinkler Regional Deal, and potentially a further $7.7 million, subject to negotiation of an updated project agreement and completion of delivery milestones. GPC also received $5 million in 2021–22 for a co-contribution from the Australian Government for the Auckland Hill Harbour Outlook Economic Development project under the Regional Recovery Partnerships Program.
In 2022–23, Sunwater is receiving $2.9 million to upgrade infrastructure at Leslie Dam to access water when the dam is very low. Sunwater is also forecast to receive $100 million in 2023–24 towards dam improvements at Burdekin Falls Dam (subject to conditions).
| Table 8.8 | Equity movements1 |
| 2020–21 | 2021–22 | 2021–22 | 2022–23 | 2023–24 | 2024–25 | 2025–26 | ||||||||||||||||||||||
| Outcome | Budget | Est. Act. | Budget | Projection | Projection | Projection | ||||||||||||||||||||||
| $ million | $ million | $ million | $ million | $ million | $ million | $ million | ||||||||||||||||||||||
Electricity Networks | (97 | ) | (90 | ) | (130 | ) | (70 | ) | (70 | ) | (180 | ) | (257 | ) | ||||||||||||||
Electricity Generation | — | 145 | 17 | 370 | 422 | 158 | 200 | |||||||||||||||||||||
Rail | (8 | ) | — | (5 | ) | 36 | — | — | — | |||||||||||||||||||
Ports | 45 | 35 | 26 | 37 | 20 | — | — | |||||||||||||||||||||
Water | — | — | — | 3 | 100 | — | — | |||||||||||||||||||||
Other2 | (202 | ) | 363 | 4 | 43 | 143 | 310 | 603 | ||||||||||||||||||||
Total PNFC sector | (262 | ) | 453 | (87 | ) | 418 | 615 | 288 | 546 | |||||||||||||||||||
Notes:
| 1. | Numbers may not add due to rounding. Bracketed numbers represent equity returns from the PNFC Sector to the General Government Sector. |
| 2. | Includes other public corporations such as Stadiums Queensland and Queensland Treasury Holdings, and funding allocations for Queensland Renewable Energy Zones and the Queensland Renewable Energy and Hydrogen Jobs Fund. |
164
Budget Strategy and Outlook 2022-23
| 9 | Uniform Presentation Framework |
| 9.1 | Context |
This chapter contains detailed financial statements for the Queensland Public Sector prepared under the Uniform Presentation Framework (UPF) first agreed to at the Premiers’ conference in 1991.
The UPF has been reviewed a number of times, more significantly following the release in October 2007 of the Australian Accounting Standards Board’s (AASB) accounting standard, AASB 1049 Whole of Government and General Government Sector Financial Reporting. The standard aims to harmonise Government Finance Statistics (GFS) and Generally Accepted Accounting Principles (GAAP) with the objective of improving the clarity and transparency of government financial statements. The UPF was reviewed more recently in February 2019 following the 2015 update to the Australian GFS Framework.
In addition, this chapter provides:
| • | a time series for the General Government Sector using the revised UPF |
| • | details of General Government Sector grant revenue and expenses |
| • | details of General Government Sector dividend and income tax equivalent income |
| • | data on General Government Sector expenses and purchases of non-financial assets by function |
| • | details of taxation revenue collected by the General Government Sector |
| • | contingent liabilities |
| • | background information on the revised UPF and disclosure of differences arising from it including the conceptual basis and sector definitions, along with a list of reporting entities. |
| 9.2 | Uniform Presentation Framework financial information |
The tables on the following pages present operating statements, balance sheets and cash flow statements prepared on the harmonised basis for the General Government Sector, Public Non-financial Corporations (PNFC) Sector and Non-financial Public Sector.
Budgeted financial information for the Public Financial Corporations Sector is not required by the UPF.
165
Budget Strategy and Outlook 2022-23
| Table 9.1 | General Government Sector Operating Statement1 |
| 2020–21 | 2021–22 | 2021–22 | 2022–23 | 2023–24 | 2024–25 | 2025–26 | ||||||||||||||||||||||
| Outcome | Budget | Est.Actual | Budget | Projection | Projection | Projection | ||||||||||||||||||||||
| $ million | $ million | $ million | $ million | $ million | $ million | $ million | ||||||||||||||||||||||
Revenue from Transactions | ||||||||||||||||||||||||||||
Taxation revenue | 16,249 | 17,399 | 19,500 | 18,842 | 19,700 | 20,785 | 21,905 | |||||||||||||||||||||
Grants revenue | 33,013 | 31,935 | 33,376 | 35,242 | 37,780 | 38,275 | 38,718 | |||||||||||||||||||||
Sales of goods and services | 6,063 | 6,062 | 6,032 | 6,181 | 6,521 | 6,253 | 6,316 | |||||||||||||||||||||
Interest income | 1,948 | 2,537 | 2,561 | 2,847 | 2,910 | 2,984 | 3,037 | |||||||||||||||||||||
Dividend and income tax equivalent income | 1,310 | 1,142 | 672 | 1,499 | 1,572 | 1,232 | 1,195 | |||||||||||||||||||||
Other revenue | 4,148 | 4,589 | 10,594 | 9,275 | 6,552 | 7,199 | 6,848 | |||||||||||||||||||||
Total Revenue from Transactions | 62,732 | 63,664 | 72,735 | 73,886 | 75,034 | 76,728 | 78,019 | |||||||||||||||||||||
Less Expenses from Transactions | ||||||||||||||||||||||||||||
Employee expenses | 26,501 | 27,474 | 27,931 | 30,076 | 31,253 | 32,665 | 33,657 | |||||||||||||||||||||
Superannuation expenses |
| |||||||||||||||||||||||||||
Superannuation interest cost | 246 | 373 | 378 | 655 | 633 | 655 | 653 | |||||||||||||||||||||
Other superannuation expenses | 3,073 | 3,156 | 3,421 | 3,493 | 3,676 | 3,811 | 3,983 | |||||||||||||||||||||
Other operating expenses | 16,335 | 17,963 | 19,002 | 19,805 | 19,493 | 18,868 | 18,935 | |||||||||||||||||||||
Depreciation and amortisation | 4,187 | 4,356 | 4,474 | 4,652 | 4,806 | 4,985 | 5,190 | |||||||||||||||||||||
Other interest expenses | 1,619 | 1,667 | 1,563 | 1,826 | 2,242 | 2,576 | 2,887 | |||||||||||||||||||||
Grants expenses | 11,709 | 12,160 | 14,051 | 14,407 | 14,013 | 13,030 | 12,530 | |||||||||||||||||||||
Total Expenses from Transactions | 63,669 | 67,148 | 70,820 | 74,915 | 76,116 | 76,591 | 77,836 | |||||||||||||||||||||
Equals Net Operating Balance | (937 | ) | (3,485 | ) | 1,915 | (1,029 | ) | (1,083 | ) | 137 | 183 | |||||||||||||||||
Plus Other economic flows—included in operating result | 9,787 | 195 | 567 | 1 | 375 | 288 | 266 | |||||||||||||||||||||
Equals Operating Result | 8,850 | (3,290 | ) | 2,482 | (1,028 | ) | (707 | ) | 426 | 448 | ||||||||||||||||||
Plus Other economic flows—other movements in equity | 7,044 | 1,773 | 1,827 | 3,348 | 3,467 | 2,586 | 1,763 | |||||||||||||||||||||
Equals Comprehensive Result—Total Change In Net Worth | 15,894 | (1,517 | ) | 4,309 | 2,320 | 2,760 | 3,012 | 2,211 | ||||||||||||||||||||
KEY FISCAL AGGREGATES | ||||||||||||||||||||||||||||
Net Operating Balance | (937 | ) | (3,485 | ) | 1,915 | (1,029 | ) | (1,083 | ) | 137 | 183 | |||||||||||||||||
Less Net Acquisition of Non-financial Assets | ||||||||||||||||||||||||||||
Purchases of non-financial assets | 6,835 | 7,800 | 7,533 | 8,478 | 9,106 | 9,439 | 9,264 | |||||||||||||||||||||
Less Sales of non-financial assets | 216 | 240 | 183 | 177 | 242 | 181 | 182 | |||||||||||||||||||||
Less Depreciation | 4,187 | 4,356 | 4,474 | 4,652 | 4,806 | 4,985 | 5,190 | |||||||||||||||||||||
Plus Change in inventories | 46 | 9 | 3 | 42 | (35 | ) | 27 | 77 | ||||||||||||||||||||
Plus Other movements in non-financial assets | 1,599 | 1,266 | 1,422 | 914 | 526 | 844 | 182 | |||||||||||||||||||||
Equals Total Net Acquisition of Non-financial Assets | 4,078 | 4,480 | 4,302 | 4,606 | 4,548 | 5,145 | 4,151 | |||||||||||||||||||||
Equals Fiscal Balance | (5,015 | ) | (7,965 | ) | (2,386 | ) | (5,635 | ) | (5,631 | ) | (5,008 | ) | (3,969 | ) | ||||||||||||||
Note:
| 1. | Numbers may not add due to rounding. |
166
Budget Strategy and Outlook 2022-23
| Table 9.2 | Public Non-financial Corporations Sector Operating Statement1 |
| 2020–21 | 2021–22 | 2021–22 | 2022–23 | 2023–24 | 2024–25 | 2025–26 | ||||||||||||||||||||||
| Outcome | Budget | Est.Actual | Budget | Projection | Projection | Projection | ||||||||||||||||||||||
| $ million | $ million | $ million | $ million | $ million | $ million | $ million | ||||||||||||||||||||||
Revenue from Transactions |
| |||||||||||||||||||||||||||
Grants revenue | 615 | 711 | 734 | 851 | 663 | 637 | 631 | |||||||||||||||||||||
Sales of goods and services | 12,199 | 11,161 | 12,656 | 12,211 | 12,419 | 12,517 | 12,730 | |||||||||||||||||||||
Interest income | 65 | 58 | 52 | 56 | 67 | 88 | 97 | |||||||||||||||||||||
Dividend and income tax equivalent income | 15 | — | — | — | — | — | — | |||||||||||||||||||||
Other revenue | 345 | 306 | 308 | 471 | 594 | 329 | 316 | |||||||||||||||||||||
Total Revenue from Transactions | 13,240 | 12,237 | 13,750 | 13,589 | 13,744 | 13,572 | 13,774 | |||||||||||||||||||||
Less Expenses from Transactions | ||||||||||||||||||||||||||||
Employee expenses | 2,123 | 2,211 | 2,241 | 2,471 | 2,546 | 2,613 | 2,672 | |||||||||||||||||||||
Superannuation expenses | ||||||||||||||||||||||||||||
Superannuation interest cost | (3 | ) | — | — | — | — | — | — | ||||||||||||||||||||
Other superannuation expenses | 249 | 241 | 229 | 244 | 256 | 265 | 272 | |||||||||||||||||||||
Other operating expenses | 4,895 | 3,996 | 5,832 | 4,576 | 4,282 | 4,278 | 4,400 | |||||||||||||||||||||
Depreciation and amortisation | 2,640 | 2,882 | 2,859 | 2,924 | 3,080 | 3,243 | 3,326 | |||||||||||||||||||||
Other interest expenses | 1,691 | 1,661 | 1,606 | 1,622 | 1,605 | 1,592 | 1,612 | |||||||||||||||||||||
Grants expenses | 24 | 24 | 14 | 24 | 24 | 24 | 18 | |||||||||||||||||||||
Other property expenses | 457 | 448 | 431 | 528 | 555 | 464 | 410 | |||||||||||||||||||||
Total Expenses from Transactions | 12,078 | 11,463 | 13,212 | 12,389 | 12,349 | 12,479 | 12,710 | |||||||||||||||||||||
Equals Net Operating Balance | 1,162 | 774 | 538 | 1,199 | 1,395 | 1,093 | 1,064 | |||||||||||||||||||||
Plus Other economic flows—included in operating result | (466 | ) | 13 | (456 | ) | 138 | (101 | ) | (327 | ) | (598 | ) | ||||||||||||||||
Equals Operating Result | 696 | 787 | 82 | 1,337 | 1,294 | 766 | 466 | |||||||||||||||||||||
Plus Other economic flows—other movements in equity | (1,010 | ) | 288 | (876 | ) | 816 | 590 | 352 | 575 | |||||||||||||||||||
Equals Comprehensive Result—Total Change In Net Worth | (315 | ) | 1,075 | (793 | ) | 2,153 | 1,884 | 1,118 | 1,041 | |||||||||||||||||||
KEY FISCAL AGGREGATES | ||||||||||||||||||||||||||||
Net Operating Balance | 1,162 | 774 | 538 | 1,199 | 1,395 | 1,093 | 1,064 | |||||||||||||||||||||
Less Net Acquisition of Non-financial Assets | ||||||||||||||||||||||||||||
Purchases of non-financial assets | 3,157 | 3,713 | 3,055 | 3,334 | 3,025 | 3,266 | 3,538 | |||||||||||||||||||||
Less Sales of non-financial assets | 69 | 68 | 37 | 33 | 24 | 24 | 34 | |||||||||||||||||||||
Less Depreciation | 2,640 | 2,882 | 2,859 | 2,924 | 3,080 | 3,243 | 3,326 | |||||||||||||||||||||
Plus Change in inventories | — | 4 | 33 | 16 | (1 | ) | 7 | 9 | ||||||||||||||||||||
Plus Other movements in non-financial assets | 77 | 106 | 80 | 105 | 306 | 96 | 95 | |||||||||||||||||||||
Equals Total Net Acquisition of Non-financial Assets | 525 | 872 | 272 | 498 | 225 | 103 | 282 | |||||||||||||||||||||
Equals Fiscal Balance | 637 | (98 | ) | 266 | 701 | 1,170 | 990 | 782 | ||||||||||||||||||||
Note:
| 1. | Numbers may not add due to rounding. |
167
Budget Strategy and Outlook 2022-23
| Table 9.3 | Non-financial Public Sector Operating Statement1 |
2020–21 Outcome $ million | 2021–22 Budget $ million | 2021–22 Est.Actual $ million | 2022–23 Budget $ million | 2023–24 Projection $ million | 2024–25 Projection $ million | 2025–26 Projection $ million | ||||||||||||||||||||||
Revenue from Transactions |
| |||||||||||||||||||||||||||
Taxation revenue | 15,906 | 17,062 | 19,157 | 18,481 | 19,336 | 20,427 | 21,548 | |||||||||||||||||||||
Grants revenue | 33,020 | 31,951 | 33,401 | 35,263 | 37,795 | 38,289 | 38,732 | |||||||||||||||||||||
Sales of goods and services | 15,667 | 14,320 | 15,908 | 15,519 | 16,191 | 16,082 | 16,390 | |||||||||||||||||||||
Interest income | 2,007 | 2,578 | 2,609 | 2,899 | 2,973 | 3,067 | 3,129 | |||||||||||||||||||||
Dividend and income tax equivalent income | 150 | 129 | 51 | 161 | 162 | 180 | 201 | |||||||||||||||||||||
Other revenue | 4,478 | 4,894 | 10,900 | 9,744 | 7,144 | 7,525 | 7,161 | |||||||||||||||||||||
Total Revenue from Transactions | 71,228 | 70,934 | 82,027 | 82,066 | 83,600 | 85,572 | 87,161 | |||||||||||||||||||||
Less Expenses from Transactions |
| |||||||||||||||||||||||||||
Employee expenses | 28,498 | 29,561 | 30,044 | 32,414 | 33,666 | 35,145 | 36,193 | |||||||||||||||||||||
Superannuation expenses |
| |||||||||||||||||||||||||||
Superannuation interest cost | 243 | 373 | 378 | 655 | 633 | 655 | 653 | |||||||||||||||||||||
Other superannuation expenses | 3,322 | 3,397 | 3,650 | 3,738 | 3,932 | 4,076 | 4,255 | |||||||||||||||||||||
Other operating expenses | 18,610 | 19,049 | 22,046 | 21,499 | 21,017 | 20,449 | 20,671 | |||||||||||||||||||||
Depreciation and amortisation | 6,827 | 7,238 | 7,333 | 7,576 | 7,887 | 8,228 | 8,516 | |||||||||||||||||||||
Other interest expenses | 3,114 | 3,107 | 2,959 | 3,228 | 3,621 | 3,949 | 4,282 | |||||||||||||||||||||
Grants expenses | 11,125 | 11,489 | 13,356 | 13,601 | 13,390 | 12,432 | 11,932 | |||||||||||||||||||||
Total Expenses from Transactions | 71,739 | 74,213 | 79,766 | 82,710 | 84,147 | 84,933 | 86,502 | |||||||||||||||||||||
Equals Net Operating Balance | (511 | ) | (3,279 | ) | 2,260 | (644 | ) | (547 | ) | 639 | 659 | |||||||||||||||||
Plus Other economic flows—included in operating result | 8,872 | 118 | (59 | ) | 69 | 204 | (219 | ) | (589 | ) | ||||||||||||||||||
Equals Operating Result | (8,361 | ) | (3,161 | ) | 2,201 | (575 | ) | (342 | ) | 420 | 69 | |||||||||||||||||
Plus Other economic flows—other movements in equity | 7,532 | 1,644 | 2,108 | 2,895 | 3,102 | 2,592 | 2,142 | |||||||||||||||||||||
Equals Comprehensive Result—Total Change In Net Worth | 15,894 | (1,517 | ) | 4,309 | 2,320 | 2,760 | 3,012 | 2,211 | ||||||||||||||||||||
KEY FISCAL AGGREGATES |
| |||||||||||||||||||||||||||
Net Operating Balance | (511 | ) | (3,279 | ) | 2,260 | (644 | ) | (547 | ) | 639 | 659 | |||||||||||||||||
Less Net Acquisition of Non-financial Assets |
| |||||||||||||||||||||||||||
Purchases of non-financial assets | 10,007 | 11,513 | 10,588 | 11,812 | 12,131 | 12,705 | 12,802 | |||||||||||||||||||||
Less Sales of non-financial assets | 272 | 308 | 220 | 211 | 266 | 204 | 216 | |||||||||||||||||||||
Less Depreciation | 6,827 | 7,238 | 7,333 | 7,576 | 7,887 | 8,228 | 8,516 | |||||||||||||||||||||
Plus Change in inventories | 46 | 13 | 35 | 59 | (36 | ) | 34 | 86 | ||||||||||||||||||||
Plus Other movements in non-financial assets | 1,676 | 1,372 | 1,503 | 1,020 | 831 | 941 | 278 | |||||||||||||||||||||
Equals Total Net Acquisition of Non-financial Assets | 4,630 | 5,352 | 4,573 | 5,104 | 4,774 | 5,248 | 4,433 | |||||||||||||||||||||
Equals Fiscal Balance | (5,141 | ) | (8,631 | ) | (2,313 | ) | (5,749 | ) | (5,321 | ) | (4,609 | ) | (3,774 | ) | ||||||||||||||
Note:
| 1. | Numbers may not add due to rounding. |
168
Budget Strategy and Outlook 2022-23
| Table 9.4 | General Government Balance Sheet1 |
| 2020–21 Outcome $ million | 2021–22 Budget $ million | 2021–22 Est.Actual $ million | 2022–23 Budget $ million | 2023–24 Projection $ million | 2024–25 Projection $ million | 2025–26 Projection $ million | ||||||||||||||||||||||
Assets | ||||||||||||||||||||||||||||
Financial Assets | ||||||||||||||||||||||||||||
Cash and deposits | 1,072 | 860 | 981 | 757 | 683 | 625 | 563 | |||||||||||||||||||||
Advances paid | 1,339 | 1,545 | 1,426 | 1,408 | 1,389 | 1,346 | 1,258 | |||||||||||||||||||||
Investments, loans and placements | 41,742 | 39,319 | 45,265 | 46,267 | 47,263 | 48,200 | 49,043 | |||||||||||||||||||||
Receivables | 5,521 | 3,305 | 3,284 | 4,947 | 5,418 | 5,230 | 5,186 | |||||||||||||||||||||
Equity | ||||||||||||||||||||||||||||
Investments in other public sector entities | 21,429 | 22,857 | 20,302 | 22,455 | 24,340 | 25,458 | 26,499 | |||||||||||||||||||||
Investments—other | 165 | 161 | 164 | 165 | 165 | 165 | 165 | |||||||||||||||||||||
Total Financial Assets | 71,267 | 68,047 | 71,422 | 76,000 | 79,258 | 81,025 | 82,713 | |||||||||||||||||||||
Non-financial Assets | ||||||||||||||||||||||||||||
Land and other fixed assets | 243,075 | 243,243 | 248,729 | 254,571 | 260,287 | 266,760 | 272,290 | |||||||||||||||||||||
Other non-financial assets | 7,390 | 6,920 | 6,375 | 6,745 | 7,236 | 7,541 | 7,863 | |||||||||||||||||||||
Total Non-financial Assets | 250,464 | 250,163 | 255,104 | 261,316 | 267,523 | 274,301 | 280,154 | |||||||||||||||||||||
| Total Assets | 321,731 | 318,210 | 326,526 | 337,316 | 346,781 | 355,326 | 362,867 | |||||||||||||||||||||
Liabilities | ||||||||||||||||||||||||||||
Payables | 4,725 | 4,673 | 4,926 | 4,965 | 4,917 | 4,952 | 4,992 | |||||||||||||||||||||
Superannuation liability | 27,322 | 22,686 | 24,810 | 24,069 | 22,484 | 21,106 | 20,076 | |||||||||||||||||||||
Other employee benefits | 8,914 | 8,514 | 9,220 | 9,615 | 9,845 | 10,191 | 10,618 | |||||||||||||||||||||
Advances received | 1,435 | 1,432 | 847 | 1,745 | 2,714 | 2,736 | 2,793 | |||||||||||||||||||||
Borrowing2 | 54,078 | 65,041 | 58,215 | 66,459 | 74,224 | 81,102 | 87,284 | |||||||||||||||||||||
Other liabilities | 15,633 | 12,690 | 14,575 | 14,210 | 13,583 | 13,213 | 12,867 | |||||||||||||||||||||
Total Liabilities | 112,106 | 115,037 | 112,592 | 121,062 | 127,767 | 133,300 | 138,629 | |||||||||||||||||||||
Net Worth | 209,625 | 203,174 | 213,934 | 216,254 | 219,014 | 222,026 | 224,237 | |||||||||||||||||||||
|
|
|
|
|
|
|
|
|
|
|
|
|
| |||||||||||||||
Net Financial Worth | (40,839 | ) | (46,989 | ) | (41,170 | ) | (45,062 | ) | (48,509 | ) | (52,275 | ) | (55,916 | ) | ||||||||||||||
Net Financial Liabilities | 62,268 | 69,847 | 61,473 | 67,517 | 72,848 | 77,733 | 82,416 | |||||||||||||||||||||
Net Debt | 11,360 | 24,750 | 11,390 | 19,772 | 27,603 | 33,667 | 39,214 | |||||||||||||||||||||
Notes:
| ||||||||||||||||||||||||||||
1. Numbers may not add due to rounding. 2. Borrowing line comprised of: |
| |||||||||||||||||||||||||||
Borrowing with QTC | 46,153 | 57,240 | 50,451 | 58,853 | 66,415 | 73,338 | 80,622 | |||||||||||||||||||||
Leases and other similar arrangements | 7,704 | 7,603 | 7,544 | 7,385 | 7,589 | 7,544 | 6,442 | |||||||||||||||||||||
Securities and derivatives | 220 | 198 | 220 | 220 | 220 | 220 | 220 | |||||||||||||||||||||
|
|
|
|
|
|
|
|
|
| �� |
|
|
| |||||||||||||||
| 54,078 | 65,041 | 58,215 | 66,459 | 74,224 | 81,102 | 87,284 | ||||||||||||||||||||||
169
Budget Strategy and Outlook 2022-23
| Table 9.5 | Public Non-financial Corporations Sector Balance Sheet1 |
| 2020–21 Outcome $ million | 2021–22 Budget $ million | 2021–22 Est.Actual $ million | 2022–23 Budget $ million | 2023–24 Projection $ million | 2024–25 Projection $ million | 2025–26 Projection $ million | ||||||||||||||||||||||
Assets | ||||||||||||||||||||||||||||
Financial Assets | ||||||||||||||||||||||||||||
Cash and deposits | 1,159 | 784 | 925 | 1,162 | 1,618 | 1,650 | 1,681 | |||||||||||||||||||||
Advances paid | 1,135 | 1,214 | 608 | 1,554 | 2,572 | 2,643 | 2,749 | |||||||||||||||||||||
Investments, loans and placements | 1,345 | 308 | 6,123 | 2,914 | 1,320 | 989 | 935 | |||||||||||||||||||||
Receivables | 1,829 | 1,572 | 2,260 | 2,056 | 1,877 | 1,909 | 1,925 | |||||||||||||||||||||
Equity | ||||||||||||||||||||||||||||
Investments—other | 7 | 9 | 7 | 7 | 7 | 7 | 7 | |||||||||||||||||||||
Total Financial Assets | 5,474 | 3,887 | 9,922 | 7,693 | 7,394 | 7,199 | 7,296 | |||||||||||||||||||||
Non-financial Assets | ||||||||||||||||||||||||||||
Land and other fixed assets | 64,054 | 66,328 | 64,619 | 65,864 | 66,663 | 67,327 | 68,057 | |||||||||||||||||||||
Other non-financial assets | 2,014 | 1,463 | 1,420 | 1,396 | 1,342 | 1,379 | 1,421 | |||||||||||||||||||||
Total Non-financial Assets | 66,068 | 67,791 | 66,039 | 67,260 | 68,004 | 68,706 | 69,477 | |||||||||||||||||||||
Total Assets | 71,543 | 71,678 | 75,962 | 74,953 | 75,398 | 75,905 | 76,774 | |||||||||||||||||||||
Liabilities | ||||||||||||||||||||||||||||
Payables | 2,304 | 1,640 | 1,412 | 2,037 | 2,083 | 1,823 | 1,899 | |||||||||||||||||||||
Superannuation liability | (273 | ) | (152 | ) | (273 | ) | (273 | ) | (273 | ) | (273 | ) | (273 | ) | ||||||||||||||
Other employee benefits | 963 | 940 | 934 | 1,008 | 1,018 | 1,057 | 1,096 | |||||||||||||||||||||
Deposits held | 12 | 13 | 12 | 12 | 12 | 12 | 12 | |||||||||||||||||||||
Advances received | 5 | 4 | 106 | 4 | 3 | 2 | 2 | |||||||||||||||||||||
Borrowing2 | 41,558 | 41,305 | 48,566 | 44,334 | 42,501 | 41,863 | 41,318 | |||||||||||||||||||||
Other liabilities | 8,319 | 7,857 | 7,343 | 7,816 | 8,155 | 8,404 | 8,662 | |||||||||||||||||||||
Total Liabilities | 52,888 | 51,608 | 58,100 | 54,938 | 53,499 | 52,888 | 52,715 | |||||||||||||||||||||
Net Worth | 18,655 | 20,070 | 17,861 | 20,014 | 21,899 | 23,017 | 24,058 | |||||||||||||||||||||
|
|
|
|
|
|
|
|
|
|
|
|
|
| |||||||||||||||
Net Financial Worth | (47,414 | ) | (47,721 | ) | (48,178 | ) | (47,245 | ) | (46,105 | ) | (45,689 | ) | (45,419 | ) | ||||||||||||||
Net Debt | 37,936 | 39,017 | 41,029 | 38,720 | 37,006 | 36,594 | 35,967 | |||||||||||||||||||||
Notes:
| ||||||||||||||||||||||||||||
1. Numbers may not add due to rounding. 2. Borrowing line comprised of:
|
| |||||||||||||||||||||||||||
Borrowing with QTC | 39,747 | 40,655 | 42,148 | 41,700 | 41,431 | 41,294 | 40,910 | |||||||||||||||||||||
Leases and other similar arrangements | 454 | 405 | 354 | 326 | 488 | 430 | 370 | |||||||||||||||||||||
Securities and derivatives | 1,357 | 245 | 6,064 | 2,308 | 582 | 139 | 38 | |||||||||||||||||||||
|
|
|
|
|
|
|
|
|
|
|
|
|
| |||||||||||||||
| 41,558 | 41,305 | 48,566 | 44,334 | 42,501 | 41,863 | 41,318 | ||||||||||||||||||||||
170
Budget Strategy and Outlook 2022-23
| Table 9.6 | Non-financial Public Sector Balance Sheet1 |
| 2020–21 Outcome $ million | 2021–22 Budget $ million | 2021–22 Est.Actual $ million | 2022–23 Budget $ million | 2023–24 Projection $ million | 2024–25 Projection $ million | 2025–26 Projection $ million | ||||||||||||||||||||||
Assets | ||||||||||||||||||||||||||||
Financial Assets | ||||||||||||||||||||||||||||
Cash and deposits | 2,232 | 1,644 | 1,906 | 1,919 | 2,301 | 2,276 | 2,243 | |||||||||||||||||||||
Advances paid | 1,334 | 1,540 | 1,320 | 1,404 | 1,386 | 1,344 | 1,256 | |||||||||||||||||||||
Investments, loans and placements | 43,086 | 39,628 | 51,387 | 49,180 | 48,583 | 49,189 | 49,977 | |||||||||||||||||||||
Receivables | 6,418 | 4,037 | 4,954 | 5,761 | 5,998 | 6,102 | 6,017 | |||||||||||||||||||||
Equity | ||||||||||||||||||||||||||||
Investments in other public sector entities | 2,775 | 2,788 | 2,442 | 2,442 | 2,442 | 2,442 | 2,442 | |||||||||||||||||||||
Investments—other | 172 | 171 | 171 | 172 | 172 | 172 | 172 | |||||||||||||||||||||
Other financial assets | ||||||||||||||||||||||||||||
Total Financial Assets | 56,016 | 49,807 | 62,179 | 60,879 | 60,882 | 61,525 | 62,107 | |||||||||||||||||||||
Non-financial Assets | ||||||||||||||||||||||||||||
Land and other fixed assets | 307,128 | 309,570 | 313,347 | 320,434 | 326,949 | 334,086 | 340,346 | |||||||||||||||||||||
Other non-financial assets | 1,256 | 1,107 | 1,174 | 1,095 | 1,197 | 1,181 | 1,182 | |||||||||||||||||||||
Total Non-financial Assets | 308,385 | 310,677 | 314,521 | 321,530 | 328,146 | 335,267 | 341,528 | |||||||||||||||||||||
Total Assets | 364,401 | 360,484 | 376,701 | 382,408 | 389,028 | 396,792 | 403,635 | |||||||||||||||||||||
Liabilities | ||||||||||||||||||||||||||||
Payables | 6,150 | 5,520 | 5,798 | 5,811 | 5,756 | 5,791 | 5,851 | |||||||||||||||||||||
Superannuation liability | 27,049 | 22,534 | 24,537 | 23,796 | 22,211 | 20,833 | 19,803 | |||||||||||||||||||||
Other employee benefits | 9,877 | 9,453 | 10,154 | 10,623 | 10,863 | 11,247 | 11,714 | |||||||||||||||||||||
Deposits held | 12 | 13 | 12 | 12 | 12 | 12 | 12 | |||||||||||||||||||||
Advances received | 300 | 218 | 239 | 190 | 142 | 93 | 43 | |||||||||||||||||||||
Borrowing2 | 95,626 | 106,341 | 106,774 | 110,786 | 116,719 | 122,958 | 128,595 | |||||||||||||||||||||
Other liabilities | 15,762 | 13,231 | 15,253 | 14,936 | 14,312 | 13,832 | 13,379 | |||||||||||||||||||||
Total Liabilities | 154,775 | 157,310 | 162,767 | 166,154 | 170,014 | 174,766 | 179,398 | |||||||||||||||||||||
Net Worth | 209,625 | 203,174 | 213,934 | 216,254 | 219,014 | 222,026 | 224,237 | |||||||||||||||||||||
|
|
|
|
|
|
|
|
|
|
|
|
|
| |||||||||||||||
Net Financial Worth | (98,759 | ) | (107,503 | ) | (100,587 | ) | (105,276 | ) | (109,132 | ) | (113,241 | ) | (117,291 | ) | ||||||||||||||
Net Financial Liabilities | 101,534 | 110,291 | 103,029 | 107,717 | 111,573 | 115,683 | 119,732 | |||||||||||||||||||||
Net Debt | 49,287 | 63,760 | 52,412 | 58,485 | 64,603 | 70,255 | 75,174 | |||||||||||||||||||||
Notes:
| ||||||||||||||||||||||||||||
1. Numbers may not add due to rounding. 2. Borrowing line comprised of:
| ||||||||||||||||||||||||||||
Borrowing with QTC | 85,901 | 97,896 | 92,599 | 100,553 | 107,847 | 114,632 | 121,533 | |||||||||||||||||||||
Leases and other similar arrangements | 8,158 | 8,009 | 7,898 | 7,711 | 8,076 | 7,975 | 6,812 | |||||||||||||||||||||
Securities and derivatives | 1,567 | 436 | 6,277 | 2,521 | 795 | 352 | 251 | |||||||||||||||||||||
|
|
|
|
|
|
|
|
|
|
|
|
|
| |||||||||||||||
| 95,626 | 106,341 | 106,774 | 110,786 | 116,719 | 122,958 | 128,595 | ||||||||||||||||||||||
171
Budget Strategy and Outlook 2022-23
| Table 9.7 | General Government Sector Cash Flow Statement1 |
| 2020–21 Outcome $ million | 2021–22 Budget $ million | 2021–22 Est.Actual $ million | 2022–23 Budget $ million | 2023–24 Projection $ million | 2024–25 Projection $ million | 2025–26 Projection $ million | ||||||||||||||||||||||
Cash Receipts from Operating Activities | ||||||||||||||||||||||||||||
Taxes received | 15,882 | 18,657 | 20,758 | 18,840 | 19,698 | 20,783 | 21,904 | |||||||||||||||||||||
Grants and subsidies received | 31,226 | 31,906 | 33,915 | 34,382 | 37,484 | 38,252 | 38,901 | |||||||||||||||||||||
Sales of goods and services | 6,217 | 6,312 | 6,342 | 6,457 | 6,772 | 6,564 | 6,612 | |||||||||||||||||||||
Interest receipts | 2,077 | 2,535 | 2,587 | 2,844 | 2,907 | 2,982 | 3,035 | |||||||||||||||||||||
Dividends and income tax equivalents | 1,673 | 897 | 1,088 | 788 | 1,454 | 1,614 | 1,238 | |||||||||||||||||||||
Other receipts | 5,745 | 5,730 | 12,159 | 10,866 | 8,035 | 8,228 | 8,345 | |||||||||||||||||||||
Total Operating Receipts | 62,820 | 66,038 | 76,848 | 74,178 | 76,351 | 78,423 | 80,035 | |||||||||||||||||||||
Cash Payments for Operating Activities | ||||||||||||||||||||||||||||
Payments for employees | (30,320 | ) | (31,442 | ) | (31,705 | ) | (34,334 | ) | (35,835 | ) | (37,471 | ) | (38,696 | ) | ||||||||||||||
Payments for goods and services | (19,002 | ) | (20,402 | ) | (21,002 | ) | (22,258 | ) | (21,998 | ) | (21,386 | ) | (21,518 | ) | ||||||||||||||
Grants and subsidies | (11,709 | ) | (12,100 | ) | (13,971 | ) | (14,293 | ) | (13,967 | ) | (12,986 | ) | (12,484 | ) | ||||||||||||||
Interest paid | (1,568 | ) | (1,600 | ) | (1,495 | ) | (1,755 | ) | (2,161 | ) | (2,495 | ) | (2,808 | ) | ||||||||||||||
Other payments | (2 | ) | — | (1 | ) | — | — | — | — | |||||||||||||||||||
Total Operating Payments | (62,601 | ) | (65,544 | ) | (68,175 | ) | (72,640 | ) | (73,962 | ) | (74,338 | ) | (75,506 | ) | ||||||||||||||
Net Cash Inflows from Operating Activities | 219 | 493 | 8,674 | 1,538 | 2,389 | 4,085 | 4,529 | |||||||||||||||||||||
Cash Flows from Investments in Non-Financial Assets | ||||||||||||||||||||||||||||
Purchases of non-financial assets | (6,835 | ) | (7,800 | ) | (7,533 | ) | (8,478 | ) | (9,106 | ) | (9,439 | ) | (9,264 | ) | ||||||||||||||
Sales of non-financial assets | 216 | 240 | 183 | 177 | 242 | 181 | 182 | |||||||||||||||||||||
Net Cash Flows from Investments in Non-financial Assets | (6,619 | ) | (7,561 | ) | (7,351 | ) | (8,301 | ) | (8,864 | ) | (9,259 | ) | (9,082 | ) | ||||||||||||||
Net Cash Flows from Investments in Financial Assets for Policy Purposes | (33 | ) | (636 | ) | 60 | (478 | ) | (568 | ) | (313 | ) | (499 | ) | |||||||||||||||
Net Cash Flows from Investments in Financial Assets for Liquidity Purposes | (3,513 | ) | (821 | ) | (3,470 | ) | 1,321 | (924 | ) | (849 | ) | (832 | ) | |||||||||||||||
Receipts from Financing Activities | ||||||||||||||||||||||||||||
Advances received (net) | (410 | ) | (69 | ) | (584 | ) | 900 | 971 | 24 | 58 | ||||||||||||||||||
Borrowing (net) | 10,224 | 8,501 | 2,580 | 4,797 | 6,922 | 6,255 | 5,763 | |||||||||||||||||||||
Deposits received (net) | (1 | ) | — | — | — | — | — | — | ||||||||||||||||||||
Net Cash Flows from Financing Activities | 9,813 | 8,433 | 1,995 | 5,697 | 7,894 | 6,279 | 5,821 | |||||||||||||||||||||
Net Increase/(Decrease) in Cash held | (133 | ) | (91 | ) | (92 | ) | (223 | ) | (73 | ) | (57 | ) | (62 | ) | ||||||||||||||
Net cash from operating activities | 219 | 493 | 8,674 | 1,538 | 2,389 | 4,085 | 4,529 | |||||||||||||||||||||
Net cash flows from investments in non-financial assets | (6,619 | ) | (7,561 | ) | (7,351 | ) | (8,301 | ) | (8,864 | ) | (9,259 | ) | (9,082 | ) | ||||||||||||||
Surplus/(Deficit) | (6,401 | ) | (7,067 | ) | 1,323 | (6,763 | ) | (6,475 | ) | (5,174 | ) | (4,553 | ) | |||||||||||||||
|
|
|
|
|
|
|
|
|
|
|
|
|
| |||||||||||||||
Derivation of ABS GFS Cash Surplus/Deficit | ||||||||||||||||||||||||||||
Cash surplus/(deficit) | (6,401 | ) | (7,067 | ) | 1,323 | (6,763 | ) | (6,475 | ) | (5,174 | ) | (4,553 | ) | |||||||||||||||
Acquisitions under finance leases and similar arrangements | (1,547 | ) | (1,088 | ) | (1,251 | ) | (810 | ) | (344 | ) | (163 | ) | (2 | ) | ||||||||||||||
ABS GFS Cash Surplus/(Deficit) Including Finance Leases and Similar Arrangements | (7,948 | ) | (8,155 | ) | 72 | (7,573 | ) | (6,819 | ) | (5,337 | ) | (4,555 | ) | |||||||||||||||
Note:
| 1. | Numbers may not add due to rounding. |
172
Budget Strategy and Outlook 2022-23
| Table 9.8 | Public Non-financial Corporations Sector Cash Flow Statement1 |
| 2020–21 Outcome $ million | 2021–22 Budget $ million | 2021–22 Est.Actual $ million | 2022–23 Budget $ million | 2023–24 Projection $ million | 2024–25 Projection $ million | 2025–26 Projection $ million | ||||||||||||||||||||||
Cash Receipts from Operating Activities | ||||||||||||||||||||||||||||
Grants and subsidies received | 614 | 681 | 717 | 831 | 668 | 626 | 620 | |||||||||||||||||||||
Sales of goods and services | 13,555 | 12,674 | 14,140 | 14,112 | 14,290 | 14,206 | 14,431 | |||||||||||||||||||||
Interest receipts | 66 | 58 | 52 | 56 | 67 | 88 | 97 | |||||||||||||||||||||
Dividends and income tax equivalents | 15 | — | — | — | — | — | — | |||||||||||||||||||||
Other receipts | 182 | 206 | 257 | 321 | 512 | 248 | 236 | |||||||||||||||||||||
Total Operating Receipts | 14,433 | 13,620 | 15,166 | 15,319 | 15,537 | 15,168 | 15,384 | |||||||||||||||||||||
Cash Payments for Operating Activities | ||||||||||||||||||||||||||||
Payments for employees | (2,295 | ) | (2,426 | ) | (2,500 | ) | (2,641 | ) | (2,793 | ) | (2,839 | ) | (2,904 | ) | ||||||||||||||
Payments for goods and services | (5,931 | ) | (5,593 | ) | (7,813 | ) | (5,979 | ) | (5,704 | ) | (5,676 | ) | (5,733 | ) | ||||||||||||||
Grants and subsidies | (24 | ) | (24 | ) | (14 | ) | (24 | ) | (24 | ) | (24 | ) | (18 | ) | ||||||||||||||
Interest paid | (1,684 | ) | (1,645 | ) | (1,595 | ) | (1,610 | ) | (1,598 | ) | (1,588 | ) | (1,605 | ) | ||||||||||||||
Other payments | (1,002 | ) | (869 | ) | (866 | ) | (999 | ) | (983 | ) | (1,088 | ) | (963 | ) | ||||||||||||||
Total Operating Payments | (10,936 | ) | (10,557 | ) | (12,788 | ) | (11,253 | ) | (11,102 | ) | (11,214 | ) | (11,223 | ) | ||||||||||||||
Net Cash Inflows from Operating Activities | 3,497 | 3,063 | 2,378 | 4,066 | 4,435 | 3,954 | 4,162 | |||||||||||||||||||||
Cash Flows from Investments in Non-Financial Assets | ||||||||||||||||||||||||||||
Purchases of non-financial assets | (3,157 | ) | (3,713 | ) | (3,055 | ) | (3,334 | ) | (3,025 | ) | (3,266 | ) | (3,538 | ) | ||||||||||||||
Sales of non-financial assets | 69 | 68 | 37 | 33 | 24 | 24 | 34 | |||||||||||||||||||||
Net Cash Flows from Investments in Non-financial Assets | (3,088 | ) | (3,644 | ) | (3,018 | ) | (3,301 | ) | (3,001 | ) | (3,242 | ) | (3,504 | ) | ||||||||||||||
Net Cash Flows from Investments in Financial Assets for Policy Purposes | 262 | (68 | ) | 357 | (1,017 | ) | (1,088 | ) | (156 | ) | (291 | ) | ||||||||||||||||
Net Cash Flows from Investments in Financial Assets for Liquidity Purposes | 10 | (12 | ) | (1,169 | ) | 608 | 543 | 108 | (19 | ) | ||||||||||||||||||
Receipts from Financing Activities | ||||||||||||||||||||||||||||
Advances received (net) | (1 | ) | (1 | ) | (1 | ) | (1 | ) | (1 | ) | (1 | ) | (1 | ) | ||||||||||||||
Borrowing (net) | 806 | 380 | 2,163 | (415 | ) | (303 | ) | (204 | ) | (450 | ) | |||||||||||||||||
Dividends paid | (1,071 | ) | (419 | ) | (735 | ) | (192 | ) | (815 | ) | (895 | ) | (669 | ) | ||||||||||||||
Deposits received (net) | (1 | ) | — | — | — | — | — | — | ||||||||||||||||||||
Other financing (net) | (144 | ) | 543 | (209 | ) | 488 | 685 | 468 | 803 | |||||||||||||||||||
Net Cash Flows from Financing Activities | (411 | ) | 503 | 1,218 | (119 | ) | (433 | ) | (631 | ) | (317 | ) | ||||||||||||||||
Net Increase/(Decrease) in Cash held | 270 | (157 | ) | (234 | ) | 237 | 456 | 33 | 30 | |||||||||||||||||||
Net cash from operating activities | 3,497 | 3,063 | 2,378 | 4,066 | 4,435 | 3,954 | 4,162 | |||||||||||||||||||||
Net cash flows from investments in non-financial assets | (3,088 | ) | (3,644 | ) | (3,018 | ) | (3,301 | ) | (3,001 | ) | (3,242 | ) | (3,504 | ) | ||||||||||||||
Dividends paid | (1,071 | ) | (419 | ) | (735 | ) | (192 | ) | (815 | ) | (895 | ) | (669 | ) | ||||||||||||||
Surplus/(Deficit) | (662 | ) | (1,001 | ) | (1,375 | ) | 573 | 619 | (183 | ) | (12 | ) | ||||||||||||||||
Derivation of ABS GFS Cash Surplus/Deficit | ||||||||||||||||||||||||||||
Cash surplus/(deficit) | (662 | ) | (1,001 | ) | (1,375 | ) | 573 | 619 | (183 | ) | (12 | ) | ||||||||||||||||
Acquisitions under finance leases and similar arrangements | (18 | ) | (5 | ) | (10 | ) | (26 | ) | (223 | ) | (15 | ) | (14 | ) | ||||||||||||||
ABS GFS Cash Surplus/(Deficit) Including Finance Leases and Similar Arrangements | (680 | ) | (1,006 | ) | (1,385 | ) | 547 | 396 | (198 | ) | (26 | ) | ||||||||||||||||
Note:
| 1. | Numbers may not add due to rounding. |
173
Budget Strategy and Outlook 2022-23
| Table 9.9 | Non-financial Public Sector Cash Flow Statement1 |
| 2020–21 Outcome $ million | 2021–22 Budget $ million | 2021–22 Est.Actual $ million | 2022–23 Budget $ million | 2023–24 Projection $ million | 2024–25 Projection $ million | 2025–26 Projection $ million | ||||||||||||||||||||||
Cash Receipts from Operating Activities |
| |||||||||||||||||||||||||||
Taxes received | 15,549 | 18,321 | 20,416 | 18,480 | 19,335 | 20,426 | 21,547 | |||||||||||||||||||||
Grants and subsidies received | 31,233 | 31,910 | 33,928 | 34,392 | 37,494 | 38,255 | 38,904 | |||||||||||||||||||||
Sales of goods and services | 17,166 | 15,702 | 17,287 | 17,413 | 17,930 | 17,687 | 17,992 | |||||||||||||||||||||
Interest receipts | 2,136 | 2,575 | 2,634 | 2,896 | 2,970 | 3,065 | 3,127 | |||||||||||||||||||||
Dividends and income tax equivalents | 121 | 122 | 90 | 104 | 161 | 170 | 188 | |||||||||||||||||||||
Other receipts | 5,893 | 5,926 | 12,405 | 11,174 | 8,514 | 8,466 | 8,569 | |||||||||||||||||||||
Total Operating Receipts | 72,098 | 74,556 | 86,759 | 84,459 | 86,404 | 88,068 | 90,327 | |||||||||||||||||||||
Cash Payments for Operating Activities | ||||||||||||||||||||||||||||
Payments for employees | (32,489 | ) | (33,744 | ) | (34,076 | ) | (36,842 | ) | (38,495 | ) | (40,176 | ) | (41,464 | ) | ||||||||||||||
Payments for goods and services | (22,256 | ) | (22,714 | ) | (25,611 | ) | (25,064 | ) | (24,532 | ) | (23,966 | ) | (24,182 | ) | ||||||||||||||
Grants and subsidies | (11,128 | ) | (11,428 | ) | (13,276 | ) | (13,496 | ) | (13,335 | ) | (12,386 | ) | (11,886 | ) | ||||||||||||||
Interest paid | (3,061 | ) | (3,024 | ) | (2,882 | ) | (3,144 | ) | (3,534 | ) | (3,863 | ) | (4,196 | ) | ||||||||||||||
Other payments | (490 | ) | (508 | ) | (599 | ) | (501 | ) | (499 | ) | (533 | ) | (577 | ) | ||||||||||||||
Total Operating Payments | (69,424 | ) | (71,419 | ) | (76,443 | ) | (79,048 | ) | (80,395 | ) | (80,925 | ) | (82,306 | ) | ||||||||||||||
Net Cash Inflows from Operating Activities | 2,675 | 3,137 | 10,316 | 5,411 | 6,009 | 7,143 | 8,021 | |||||||||||||||||||||
Cash Flows from Investments in Non-Financial Assets | ||||||||||||||||||||||||||||
Purchases of non-financial assets | (10,007 | ) | (11,513 | ) | (10,588 | ) | (11,812 | ) | (12,131 | ) | (12,705 | ) | (12,802 | ) | ||||||||||||||
Sales of non-financial assets | 272 | 308 | 220 | 211 | 266 | 204 | 216 | |||||||||||||||||||||
Net Cash Flows from Investments in Non-financial Assets | (9,735 | ) | (11,205 | ) | (10,368 | ) | (11,602 | ) | (11,865 | ) | (12,501 | ) | (12,586 | ) | ||||||||||||||
Net Cash Flows from Investments in Financial Assets for Policy Purposes | (84 | ) | (183 | ) | (23 | ) | (60 | ) | 46 | 69 | 119 | |||||||||||||||||
Net Cash Flows from Investments in Financial Assets for Liquidity Purposes | (3,503 | ) | (832 | ) | (4,640 | ) | 1,929 | (381 | ) | (741 | ) | (851 | ) | |||||||||||||||
Receipts from Financing Activities | ||||||||||||||||||||||||||||
Advances received (net) | (55 | ) | (47 | ) | (57 | ) | (47 | ) | (47 | ) | (47 | ) | (48 | ) | ||||||||||||||
Borrowing (net) | 11,031 | 8,881 | 4,743 | 4,382 | 6,620 | 6,051 | 5,313 | |||||||||||||||||||||
Deposits received (net) | (1 | ) | — | — | — | — | — | — | ||||||||||||||||||||
Other financing (net) | (191 | ) | — | (297 | ) | — | — | — | — | |||||||||||||||||||
Net Cash Flows from Financing Activities | 10,783 | 8,835 | 4,389 | 4,335 | 6,573 | 6,004 | 5,266 | |||||||||||||||||||||
Net Increase/(Decrease) in Cash held | 137 | (249 | ) | (326 | ) | 13 | 382 | (25 | ) | (32 | ) | |||||||||||||||||
Net cash from operating activities | 2,675 | 3,137 | 10,316 | 5,411 | 6,009 | 7,143 | 8,021 | |||||||||||||||||||||
Net cash flows from investments in non-financial assets | (9,735 | ) | (11,205 | ) | (10,368 | ) | (11,602 | ) | (11,865 | ) | (12,501 | ) | (12,586 | ) | ||||||||||||||
Surplus/(Deficit) | (7,060 | ) | (8,068 | ) | (52 | ) | (6,191 | ) | (5,856 | ) | (5,357 | ) | (4,565 | ) | ||||||||||||||
Derivation of ABS GFS Cash Surplus/Deficit | ||||||||||||||||||||||||||||
Cash surplus/(deficit) | (7,060 | ) | (8,068 | ) | (52 | ) | (6,191 | ) | (5,856 | ) | (5,357 | ) | (4,565 | ) | ||||||||||||||
Acquisitions under finance leases and similar arrangements | (1,565 | ) | (1,093 | ) | (1,261 | ) | (835 | ) | (567 | ) | (178 | ) | (16 | ) | ||||||||||||||
ABS GFS Cash Surplus/(Deficit) Including Finance Leases and Similar Arrangements | (8,625 | ) | (9,161 | ) | (1,313 | ) | (7,026 | ) | (6,423 | ) | (5,536 | ) | (4,581 | ) | ||||||||||||||
Note:
| 1. | Numbers may not add due to rounding. |
174
Budget Strategy and Outlook 2022-23
| 9.3 | General Government Sector time series |
Data presented in Table 9.10 provides a time series from 2009–10 to 2020–21 for the General Government Sector on the key fiscal aggregates used by the government to measure financial performance. These aggregates have been backcast (as far as possible) to comply with AASB 1049 Whole of Government and General Government Sector Financial Reporting.
175
Budget Strategy and Outlook 2022-23
| Table 9.10 | General Government Sector Time Series1 |
| 2009–10 Actual $ million | 2010–11 Actual $ million | 2011–12 Actual $ million | 2012–13 Actual $ million | 2013-14 Actual $ million | 2014–15 Actual million | 2015-16 Actual $ million | 2016-17 Actual $ million | 2017-18 Actual $ million | 2018-19 Actual $ million | 2019-20 Actual $ Million | 2020-21 Actual $ Million | |||||||||||||||||||||||||||||||||||||
Revenue from Transactions | ||||||||||||||||||||||||||||||||||||||||||||||||
Taxation revenue | 9,375 | 9,981 | 10,608 | 10,937 | 11,840 | 12,598 | 12,547 | 12,919 | 13,244 | 14,165 | 14,585 | 16,249 | ||||||||||||||||||||||||||||||||||||
Grant revenue | 20,205 | 20,338 | 22,652 | 18,322 | 21,740 | 23,583 | 23,740 | 27,384 | 27,966 | 28,307 | 27,645 | 33,013 | ||||||||||||||||||||||||||||||||||||
Sales of goods and services | 3,961 | 4,172 | 5,002 | 5,087 | 5,039 | 5,443 | 5,712 | 5,642 | 5,884 | 5,783 | 5,618 | 6,063 | ||||||||||||||||||||||||||||||||||||
Interest income | 2,204 | 2,368 | 2,485 | 2,644 | 2,460 | 2,470 | 2,543 | 2,351 | 2,389 | 2,191 | 2,088 | 1,948 | ||||||||||||||||||||||||||||||||||||
Dividend and income tax equivalent income | 949 | 1,232 | 1,112 | 1,351 | 1,975 | 2,554 | 2,661 | 2,675 | 2,920 | 2,784 | 1,926 | 1,310 | ||||||||||||||||||||||||||||||||||||
Other revenue | 3,033 | 3,921 | 3,942 | 3,415 | 3,650 | 3,322 | 3,577 | 5,223 | 5,685 | 6,598 | 5,915 | 4,148 | ||||||||||||||||||||||||||||||||||||
Total Revenue | 39,727 | 42,013 | 45,801 | 41,755 | 46,705 | 49,970 | 50,780 | 56,194 | 58,087 | 59,828 | 57,778 | 62,732 | ||||||||||||||||||||||||||||||||||||
Expenses from Transactions | ||||||||||||||||||||||||||||||||||||||||||||||||
Employee expenses | 15,566 | 16,826 | 18,250 | 18,130 | 17,816 | 18,592 | 20,045 | 21,258 | 22,681 | 24,019 | 25,662 | 26,501 | ||||||||||||||||||||||||||||||||||||
Superannuation expenses | ||||||||||||||||||||||||||||||||||||||||||||||||
Superannuation interest costs | 1,320 | 1,240 | 1,216 | 923 | 963 | 878 | 767 | 514 | 667 | 653 | 354 | 246 | ||||||||||||||||||||||||||||||||||||
Other superannuation expenses | 2,051 | 2,171 | 2,301 | 2,420 | 2,277 | 2,319 | 2,507 | 2,661 | 2,741 | 3,012 | 3,183 | 3,073 | ||||||||||||||||||||||||||||||||||||
Other operating expenses | 7,568 | 8,646 | 9,497 | 12,817 | 13,108 | 14,539 | 14,811 | 15,578 | 17,259 | 16,480 | 17,085 | 16,335 | ||||||||||||||||||||||||||||||||||||
Depreciation and amortisation | 2,501 | 2,507 | 2,777 | 2,902 | 3,060 | 3,137 | 2,921 | 3,068 | 3,326 | 3,451 | 4,033 | 4,187 | ||||||||||||||||||||||||||||||||||||
Other interest expenses | 803 | 1,125 | 1,659 | 1,940 | 2,200 | 2,328 | 2,220 | 1,722 | 1,614 | 1,581 | 1,486 | 1,619 | ||||||||||||||||||||||||||||||||||||
Grant expenses | 9,790 | 10,963 | 10,327 | 7,182 | 6,792 | 7,758 | 6,841 | 8,568 | 8,048 | 9,647 | 11,702 | 11,709 | ||||||||||||||||||||||||||||||||||||
Total Expenses | 39,599 | 43,479 | 46,028 | 46,312 | 46,217 | 49,551 | 50,112 | 53,369 | 56,337 | 58,843 | 63,505 | 63,669 | ||||||||||||||||||||||||||||||||||||
Net Operating Balance | 128 | (1,466 | ) | (226 | ) | (4,558 | ) | 488 | 420 | 668 | 2,825 | 1,750 | 985 | (5,728 | ) | (937 | ) | |||||||||||||||||||||||||||||||
OTHER KEY AGGREGATES | ||||||||||||||||||||||||||||||||||||||||||||||||
Purchases of non-financial assets | 8,959 | 8,237 | 7,971 | 7,001 | 6,323 | 4,635 | 4,044 | 4,620 | 5,126 | 5,764 | 6,306 | 6,835 | ||||||||||||||||||||||||||||||||||||
Net acquisition of non-financial assets | 6,665 | 5,583 | 5,241 | 3,389 | 3,087 | 992 | 1,164 | 2,265 | 2,337 | 3,192 | 3,436 | 4,078 | ||||||||||||||||||||||||||||||||||||
Fiscal Balance | (6,537 | ) | (7,049 | ) | (5,467 | ) | (7,947 | ) | (2,599 | ) | (572 | ) | (497 | ) | 560 | (587 | ) | (2,207 | ) | (9,164 | ) | (5,015 | ) | |||||||||||||||||||||||||
Cash Surplus/(Deficit) | (5,341 | ) | (5,880 | ) | (4,951 | ) | (8,585 | ) | (3,213 | ) | (105 | ) | 866 | 1,448 | 337 | 302 | (6,228 | ) | (6,401 | ) | ||||||||||||||||||||||||||||
Net Worth | 175,588 | 177,875 | 170,745 | 172,963 | 166,492 | 171,933 | 188,099 | 194,988 | 195,038 | 200,861 | 195,646 | 209,625 | ||||||||||||||||||||||||||||||||||||
Net Debt | (13,354 | ) | (9,542 | ) | (5,720 | ) | 2,399 | 5,208 | 5,749 | 653 | (355 | ) | (509 | ) | (198 | ) | 14,036 | 11,360 | ||||||||||||||||||||||||||||||
Borrowing with QTC2 | 15,182 | 23,711 | 28,391 | 36,508 | 39,864 | 41,343 | 34,200 | 31,358 | 29,256 | 29,468 | 37,570 | 46,153 | ||||||||||||||||||||||||||||||||||||
Leases and similar arrangements | 274 | 508 | 637 | 734 | 882 | 1,126 | 1,370 | 1,503 | 2,142 | 2,612 | 6,485 | 7,704 | ||||||||||||||||||||||||||||||||||||
Borrowing with QTC (NFPS) | 50,745 | 52,521 | 60,205 | 67,116 | 70,668 | 73,256 | 71,160 | 69,107 | 66,964 | 67,576 | 76,464 | 85,901 | ||||||||||||||||||||||||||||||||||||
Leases and similar arrangements (NFPS) | 735 | 884 | 1,127 | 1,559 | 1,752 | 1,802 | 1,316 | 1,882 | 2,142 | 2,612 | 6,977 | 8,158 | ||||||||||||||||||||||||||||||||||||
Notes:
| 1. | Numbers may not add due to rounding. |
| 2. | Borrowing in 2013–14 includes bank overdraft of $1.434 billion. |
Source: Report on State Finances for Queensland 2010–11 to 2020–21. (Numbers have been recast for changes to UPF presentation.)
176
Budget Strategy and Outlook 2022-23
| 9.4 | Other General Government Sector Uniform Presentation Framework data |
Data in the following tables is presented in accordance with the UPF.
| 9.4.1 | Grants |
Tables 9.11 and 9.12 provide details of General Government Sector current and capital grant revenue and expenses.
| Table 9.11 | General Government Sector grant revenue1 |
| 2021–22 Est. Act. $ million | 2022–23 Budget $ million | |||||||
Current grant revenue | ||||||||
Current grants from the Commonwealth | ||||||||
General purpose grants | 15,848 | 17,841 | ||||||
Specific purpose grants | 10,257 | 10,265 | ||||||
Specific purpose grants for on-passing | 4,316 | 3,964 | ||||||
Total current grants from the Commonwealth | 30,422 | 32,070 | ||||||
Other contributions and grants | 294 | 302 | ||||||
Total current grant revenue | 30,716 | 32,372 | ||||||
Capital grant revenue | ||||||||
Capital grants from the Commonwealth | ||||||||
Specific purpose grants | 2,594 | 2,854 | ||||||
Total capital grants from the Commonwealth | 2,594 | 2,854 | ||||||
Other contributions and grants | 66 | 17 | ||||||
Total capital grant revenue | 2,661 | 2,870 | ||||||
Total grant revenue | 33,376 | 35,242 | ||||||
Note:
| 1. | Numbers may not add due to rounding. |
177
Budget Strategy and Outlook 2022-23
| Table 9.12 | General Government Sector grant expenses1 |
| 2021–22 Est. Act $ million | 2022–23 Budget $ million | |||||||
Current grant expense | ||||||||
Private and Not-for-profit sector | 3,354 | 3,590 | ||||||
Private and Not-for-profit sector on-passing | 3,649 | 3,840 | ||||||
Local Government | 974 | 178 | ||||||
Local Government on-passing | 689 | 146 | ||||||
Grants to other sectors of Government | 2,709 | 2,888 | ||||||
Other | 450 | 838 | ||||||
Total current grant expense | 11,826 | 11,481 | ||||||
Capital grant expense | ||||||||
Private and Not-for-profit sector | 540 | 569 | ||||||
Local Government | 1,266 | 1,956 | ||||||
Grants to other sectors of Government | 20 | 65 | ||||||
Other | 399 | 336 | ||||||
Total capital grant expense | 2,225 | 2,927 | ||||||
Total grant expense | 14,051 | 14,407 | ||||||
Note:
| 1. | Numbers may not add due to rounding. |
| 9.4.2 | Dividend and income tax equivalent income |
Table 9.13 provides details of the source of dividend and income tax equivalent income in the General Government Sector.
| Table 9.13 | General Government Sector dividend and income tax equivalent income1 |
| 2021–22 Est. Act. $ million | 2022–23 Budget $ million | |||||||
Dividend and Income Tax Equivalent income from PNFC sector | 620 | 1,338 | ||||||
Dividend and Income Tax Equivalent income from PFC sector | 51 | 160 | ||||||
Total Dividend and Income Tax Equivalent income | 671 | 1,499 | ||||||
Note:
| 1. | Numbers may not add due to rounding. |
178
Budget Strategy and Outlook 2022-23
| 9.4.3 | Expenses by function |
Table 9.14 provides details of General Government Sector expenses by function.
| Table 9.14 | General Government Sector expenses by function1 |
| 2021–22 Budget $ million | 2021–22 Est. Act. $ million | 2022–23 Budget $ million | 2023–24 Projection $ million | 2024–25 Projection $ million | 2025–26 Projection $ million | |||||||||||||||||||
General public services | 5,352 | 5,685 | 6,555 | 6,828 | 6,929 | 7,009 | ||||||||||||||||||
Public order and safety | 6,313 | 6,575 | 6,719 | 6,900 | 7,134 | 7,204 | ||||||||||||||||||
Economic affairs | 2,217 | 2,854 | 2,810 | 2,294 | 2,099 | 2,008 | ||||||||||||||||||
Environmental protection | 875 | 1,536 | 846 | 860 | 755 | 751 | ||||||||||||||||||
Housing and community amenities | 1,162 | 1,191 | 1,539 | 1,532 | 1,271 | 1,289 | ||||||||||||||||||
Health | 21,214 | 21,926 | 22,466 | 23,715 | 24,418 | 25,220 | ||||||||||||||||||
Recreation, culture and religion | 941 | 807 | 1,022 | 1,071 | 1,052 | 1,057 | ||||||||||||||||||
Education | 16,803 | 17,059 | 18,232 | 18,869 | 19,135 | 19,731 | ||||||||||||||||||
Social protection | 5,001 | 5,760 | 6,936 | 6,469 | 6,374 | 6,325 | ||||||||||||||||||
Transport | 7,273 | 7,427 | 7,791 | 7,577 | 7,424 | 7,242 | ||||||||||||||||||
Total Expenses | 67,148 | 70,820 | 74,915 | 76,116 | 76,591 | 77,836 | ||||||||||||||||||
Note:
| 1. | Numbers may not add due to rounding. |
| 9.4.4 | Purchases of non-financial assets by function |
Table 9.15 provides details of General Government Sector purchases of non-financial assets by function.
| Table 9.15 | General Government Sector purchases of non-financial assets by function1 |
| 2021–22 Budget $ million | 2021–22 Est. Act. $ million | 2022–23 Budget $ million | 2023–24 Projection $ million | 2024–25 Projection $ million | 2025–26 Projection $ million | |||||||||||||||||||
General public services | 69 | 147 | 223 | 157 | 374 | 376 | ||||||||||||||||||
Public order and safety | 596 | 451 | 766 | 543 | 290 | 201 | ||||||||||||||||||
Economic affairs | 53 | 34 | 47 | 60 | 23 | 27 | ||||||||||||||||||
Environmental protection | 45 | 60 | 46 | 54 | 102 | 116 | ||||||||||||||||||
Housing and community amenities | 438 | 296 | 371 | 339 | 324 | 121 | ||||||||||||||||||
Health | 1,241 | 820 | 1,222 | 2,028 | 2,019 | 2,634 | ||||||||||||||||||
Recreation, culture and religion | 118 | 130 | 140 | 99 | 82 | 53 | ||||||||||||||||||
Education | 1,417 | 1,205 | 1,321 | 1,082 | 801 | 561 | ||||||||||||||||||
Social protection | 24 | 11 | 65 | 110 | 77 | 62 | ||||||||||||||||||
Transport | 3,800 | 4,379 | 4,278 | 4,634 | 5,349 | 5,113 | ||||||||||||||||||
Total Purchases | 7,800 | 7,533 | 8,478 | 9,106 | 9,439 | 9,264 | ||||||||||||||||||
Note:
| 1. | Numbers may not add due to rounding. |
179
Budget Strategy and Outlook 2022-23
| 9.4.5 | Taxes |
Table 9.16 provides details of taxation revenue collected by the General Government Sector.
| Table 9.16 | General Government Sector taxes1 |
2021–22 Est. Act. $ million | 2022–23 Budget $ million | |||||||
Taxes on employers’ payroll and labour force | 4,957 | 5,242 | ||||||
Taxes on property | ||||||||
Land taxes | 1,603 | 1,773 | ||||||
Stamp duties on financial and capital transactions | 6,028 | 4,722 | ||||||
Other | 1,269 | 1,315 | ||||||
Taxes on the provision of goods and services | ||||||||
Taxes on gambling | 1,589 | 1,646 | ||||||
Taxes on insurance | 1,295 | 1,347 | ||||||
Taxes on use of goods and performance of activities | ||||||||
Motor vehicle taxes | 2,759 | 2,797 | ||||||
Total Taxation Revenue | 19,500 | 18,842 | ||||||
Note:
| 1. | Numbers may not add due to rounding. |
180
Budget Strategy and Outlook 2022-23
| 9.5 | Contingent liabilities |
Contingent liabilities represent items that are not included in the budget as significant uncertainty exists as to whether the government would sacrifice future economic benefits in respect of these items. Nevertheless, such contingencies need to be recognised and managed wherever possible in terms of their potential impact on the government’s financial position in the future.
The state’s quantifiable and non-quantifiable contingent liabilities are detailed in the 2020–21 Report on State Finances - whole-of-government financial statements (note 43).
A summary of the state’s quantifiable contingent liabilities as at 30 June 2021 is provided in Table 9.17.
| Table 9.17 | Contingent liabilities |
2020–21 $ million | ||||
Nature of contingent liability | ||||
Guarantees and indemnities | 13,497 | |||
Other | 172 | |||
Total | 13,669 | |||
| 9.6 | Background and interpretation of Uniform Presentation Framework |
As mentioned in the introduction to this chapter, the UPF was reviewed in 2007 following release of the accounting standard, AASB 1049 Whole of Government and General Government Sector Financial Reporting.
This standard aims to harmonise GFS and GAAP with the objective of improving the clarity and transparency of government financial statements.
| 9.6.1 | Accrual Government Finance Statistics Framework |
The GFS reporting framework, developed by the Australian Bureau of Statistics (ABS), is based on international statistics standards (the International Monetary Fund Manual on Government Finance Statistics and the United Nations System of National Accounts). This allows comprehensive assessments to be made of the economic impact of government.
The accrual GFS framework is based on an integrated recording of stocks and flows. Stocks refers to a unit’s holding of assets and liabilities at a point in time, while flows represent the movement in the stock of assets and liabilities between 2 points in time. Flows comprise 2 separate types, transactions and other economic flows. Transactions come about from mutually agreed interactions between units or within a single unit. Other economic flows would include revaluations and destruction or discovery of assets that do not result from a transaction.
181
Budget Strategy and Outlook 2022-23
In GFS operating statements, other economic flows, being outside the control of government, are excluded and do not affect the net operating balance or fiscal balance.
| 9.6.2 | General Accepted Accounting Principles |
In addition to the GFS framework, public sector entities were previously required to report at year end against AAS 31 Financial Reporting by Government, which meant complying with the Accounting Standards issued by the AASB.
| 9.6.3 | Harmonisation under AASB 1049 |
This dual reporting regime caused confusion for financial report users and the Financial Reporting Council asked the AASB to develop a framework harmonising GAAP and GFS and to issue an Australian accounting standard for a single set of government reports.
In the development of AASB 1049, the AASB adopted the following approaches:
| • | adoption of GAAP definition, recognition and measurement principles in almost all cases |
| • | amended presentation requirements to encompass a comprehensive result that retains GAAP classification system but overlays it with a transaction and other economic flows classification system based on GFS |
| • | expanding the disclosure requirements to incorporate key fiscal aggregates required by GFS. |
| 9.6.4 | Revisions to the Uniform Presentation Framework |
Following the introduction of AASB 1049, the Australian, state and territory governments consider that the UPF will continue to be an important framework for ensuring comparability of financial information across jurisdictions. The UPF continues to apply to financial statements produced by government in budget, mid-year budget updates and final budget outcome reports, whereas the accounting standard applies only to outcome reports.
Aligning the framework with the AASB 1049 was not intended to create a UPF that complies with all the reporting requirements of AASB 1049. For example, the UPF does not include the same level of detail in relation to disclosure requirements of AASB 1049. Instead, the revised UPF allows jurisdictions to utilise the framework as the base set of statements and add additional relevant information to comply with AASB 1049.
182
Budget Strategy and Outlook 2022-23
| 9.7 | Sector classification |
GFS data is presented by institutional sector, distinguishing between the General Government Sector and the PNFC Sector.
Budget reporting focuses on the General Government Sector, which provides regulatory services, and goods and services of a non-market nature that are provided at less than cost or at no cost. These services are largely financed by general revenue (Australian Government grants and state taxation). This service comprises government departments, their commercialised business units/shared service providers and certain statutory bodies.
The PNFC Sector comprises bodies that provide mainly market goods and services that are of non-regulatory and non-financial nature. PNFCs are financed through sales to customers of their goods and services and may be supplemented by explicit government subsidy to satisfy community service obligations. In general, PNFCs are largely distinguishable from the governments that own them. Examples of PNFCs include the energy entities and Queensland Rail.
Together, the General Government Sector and the PNFC Sector comprise the Non-financial Public Sector.
Further discussion of the GFS framework of reporting, including definitions of GFS terms, can be obtained from the website page of the ABS at www.abs.gov.au.
183
Budget Strategy and Outlook 2022-23
| 9.8 | Reporting entities |
The reporting entities included in the General Government and the PNFC sectors in these budget papers are included below:
| 9.8.1 | General Government |
Departments
Agriculture and Fisheries
Children, Youth Justice and Multicultural Affairs
Communities, Housing and Digital Economy
Education
Employment, Small Business and Training
Energy and Public Works
Environment and Science
Justice and Attorney-General
Premier and Cabinet
Queensland Corrective Services
Queensland Fire and Emergency Services
Queensland Health
Queensland Police Service
Queensland Treasury
Regional Development, Manufacturing and Water
Resources
Seniors, Disability Services and Aboriginal and Torres Strait Islander Partnerships
State Development, Infrastructure, Local Government and Planning
Tourism, Innovation and Sport
Transport and Main Roads
184
Budget Strategy and Outlook 2022-23
Commercialised Business Units
CITEC
Economic Development Queensland
QBuild
QFleet
RoadTek
Shared Service Providers
Corporate Administration Agency
Queensland Shared Services
185
Budget Strategy and Outlook 2022-23
Other General Government entities
Board of the Queensland Museum
Crime and Corruption Commission
Cross River Rail Delivery Authority
Electoral Commission of Queensland
Gold Coast Waterways Authority
Health and Wellbeing Queensland
Hospital and Health Services
Cairns and Hinterland
Central Queensland
Central West
Children’s Health Queensland
Darling Downs
Gold Coast
Mackay
Metro North
Metro South
North West
South West
Sunshine Coast
Torres and Cape
Townsville
West Moreton
Wide Bay
Legal Aid Queensland
Legislative Assembly
Library Board of Queensland
Motor Accident Insurance Commission
Nominal Defendant
Office of the Governor
Office of the Health Ombudsman
Office of the Information Commissioner
Office of the Inspector-General Emergency
Management
Office of the Ombudsman
Prostitution Licensing Authority
Public Service Commission
Queensland Art Gallery Board of Trustees
Queensland Audit Office
Queensland Building and Construction
Commission
Queensland Curriculum and Assessment
Authority
Queensland Family and Child Commission
Queensland Human Rights Commission
Queensland Mental Health Commission
Queensland Performing Arts Trust
Queensland Racing Integrity Commission
Queensland Reconstruction Authority
Queensland Rural and Industry Development
Authority
Residential Tenancies Authority
South Bank Corporation
TAFE Queensland
The Council of the Queensland Institute of
Medical Research
The Public Trustee of Queensland
Tourism and Events Queensland
Trade and Investment Queensland
186
Budget Strategy and Outlook 2022-23
| 9.8.2 | Public Non-financial Corporations |
Brisbane Organising Committee for the 2032 Olympic and Paralympic Games
CleanCo Queensland Ltd
CS Energy Limited
Energy Queensland Limited
Far North Queensland Ports Corporations Limited
Gladstone Area Water Board
Gladstone Ports Corporation Limited
Mount Isa Water Board
North Queensland Bulk Ports Corporation Limited
Port of Townsville Limited
Powerlink Queensland
Queensland Bulk Water Supply Authority (SEQ Water)
Queensland Rail
Queensland Treasury Holdings Pty Ltd
Stadiums Queensland
Stanwell Corporation Limited
Sunwater Limited
187
Budget Strategy and Outlook 2022-23
| Appendix A: | Concessions statement |
Queensland Government subsidies, discounts and rebates to ease cost of living pressures and support businesses
The current global inflationary environment is driving up costs for households and businesses. The Queensland Government is acutely aware of the impact that these recent inflationary pressures are likely to have on the cost of living for Queenslanders.
The Queensland Government provides a wide range of concessions including subsidies, rebates and discounts across a variety of services and products. These concessions provide Queenslanders with cost of living support for essentials like electricity, transport, health, housing, education, and training services. The importance of these concessions is underscored in the current environment characterised by high inflation and increasing living costs both in Australia and overseas.
As highlighted in Chart A.1, the total value of all concessions provided to Queenslanders is estimated to be $6.786 billion in 2022–23. This represents an increase of 10.3 per cent compared with estimated actual concessions of $6.152 billion in 2021–22.
| Chart A.1 | Total concessions value by year1 |
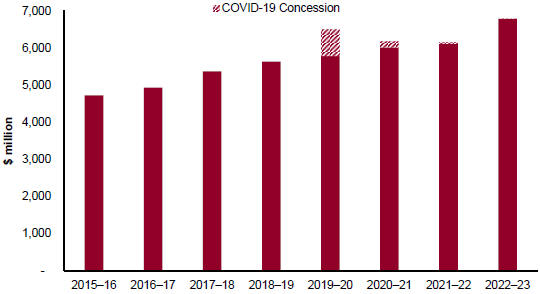
Note:
| 1. | All years to 2018–19 are estimated actuals, 2019–20 is an actual (due to the timing of the 2020–21 Budget, an actual figure was calculated for that year), 2020–21 and 2021–22 are estimated actuals and 2022–23 is the budgeted amount. |
188
Budget Strategy and Outlook 2022-23
Importantly, over the 7 years from 2015–16 to 2022–23, the growth in total concessions has outpaced inflation by 1.4 per cent on average each year. This has ensured that the real value of concessions available to Queenslanders has not only been maintained but has also grown over time. Further detail regarding Queensland Government cost of living support can be found in Chapter 1.
The majority of Queenslanders benefit from at least one Queensland Government concession and, in many cases, may benefit from multiple concessions each year. For example, aged pensioners are eligible for a number of Queensland Government concessions, such as discounts on their council rates, water, gas and electricity bills, and vehicle registration fees, as well as subsidised optometry and dental services.
Focus
This statement highlights the cost and nature of concessions provided by the Queensland Government. It covers concessions that are direct budget outlays (e.g. fee subsidy payments) and concessions that are revenue foregone through fees and charges set at a lower rate than what applies to the wider community and other businesses. In the case of broader concessions, it also includes concessions related to the delivery of services to consumers at less than the full cost of service provision.
Section A.2 sets out the specific concessions provided by the Queensland Government by agency. Section A.3 sets out the concessions provided by government-owned corporations (GOCs) and is separated into concessions by GOC, concessional leases (industry, commercial and community) by GOC and COVID-19-related measures by GOC. Within each agency or GOC, concessions are listed in descending order of value.
Explanation of scope
For the purposes of this document, concessions include:
| • | discounts, rebates and subsidies provided by the government that improve access to, and affordability of, a range of services for certain individuals, families or businesses based on eligibility criteria (e.g. relating to factors such as age, income, special needs, location or business characteristic) |
| • | concessions where all consumers, including businesses, of a particular good or service pay a price that is below the full cost of service provision (that is, no eligibility criteria is applied). |
Both General Government and Public Non–financial Corporations (PNFC) Sector concessions are included in this statement. Where a payment is made from a General Government Sector agency to a PNFC entity for a concession arrangement, the expenditure is reported against the General Government Sector agency only to avoid double counting.
To be included in this statement, concessions must meet the minimum materiality threshold of estimated expenditure or revenue foregone of $50,000 in either the budget year or the year prior.
189
Budget Strategy and Outlook 2022-23
Varying methods have been used to estimate the cost of concessions, depending on the nature of the concessions, including:
| • | direct budget outlay cost (e.g. direct subsidy or rebate payments or government’s contribution in the case of items such as rental subsidies) |
| • | revenue foregone (e.g. concessional fees and charges) |
| • | cost of goods and services provided. |
For the purposes of illustration, the document often uses averages to demonstrate the potential value of the concession to recipients. However, averages are not reflective of individual circumstances, meaning the actual dollar value of the concession to individual recipients may vary from person to person or business to business.
The Concessions Statement does not include tax expenditures (e.g. tax exemptions, reduced tax rates, tax rebates and deductions). Information on tax expenditures can be found in Appendix B.
190
Budget Strategy and Outlook 2022-23
| A.1 | Concessions summary |
| Table A.1.1 | Concession by entity1 |
Concession by entity | 2021–22 Est. Act. $ million | 2022–23 Estimate $ million | ||||||
Agency | ||||||||
Department of Agriculture and Fisheries | 25.7 | 25.3 | ||||||
Department of Communities, Housing and Digital Economy | 541.9 | 592.1 | ||||||
Department of Education | 147.3 | 155.3 | ||||||
Department of Employment, Small Business and Training | 504.5 | 514.9 | ||||||
Department of Energy and Public Works | 559.2 | 667.2 | ||||||
Department of Environment and Science | 3.2 | 1.7 | ||||||
Department of Justice and Attorney-General | 132.6 | 115.0 | ||||||
Department of Regional Development, Manufacturing and Water | 35.4 | 38.3 | ||||||
Department of Resources | 3.2 | 3.2 | ||||||
Department of Seniors, Disability Services and Aboriginal and Torres Strait Islander Partnerships | 420.2 | 725.0 | ||||||
Department of Tourism, Innovation and Sport | 1.6 | 1.6 | ||||||
Department of Transport and Main Roads | 3,350.3 | 3,477.2 | ||||||
Queensland Fire and Emergency Services | 10.9 | 11.3 | ||||||
Queensland Health | 284.8 | 319.3 | ||||||
Total Agency | 6,020.8 | 6,647.4 | ||||||
Government-owned corporations | ||||||||
Energy Queensland Limited | 27.7 | 28.5 | ||||||
Far North Queensland Ports Corporation Limited | 3.6 | 3.4 | ||||||
Gladstone Ports Corporation Limited | 39.7 | 43.5 | ||||||
North Queensland Bulk Ports Corporation Limited | 1.6 | 1.6 | ||||||
Port of Townsville Limited | 6.3 | 6.5 | ||||||
Queensland Rail | 2.1 | 2.2 | ||||||
Sunwater Limited | 50.4 | 52.5 | ||||||
Total government-owned corporations | 131.4 | 138.2 | ||||||
Total all entities | 6,152.2 | 6,785.6 | ||||||
Note:
| 1. | Numbers may not add due to rounding. |
191
Budget Strategy and Outlook 2022-23
| A.2 | Concessions by agency |
| Table A.2.1 | Department of Agriculture and Fisheries |
Concession | 2021–22 Est. Act. $ million | 2022–23 Estimate $ million | ||||||
Primary Industry Productivity Enhancement Scheme (PIPES) | 10.6 | 10.6 | ||||||
Drought Relief Assistance Scheme1 | 8.0 | 5.7 | ||||||
Drought Preparedness Grant Scheme2 | 2.0 | 3.0 | ||||||
Drought Carry-on Finance Loan Scheme3 | 0.6 | 2.0 | ||||||
Drought Ready and Recovery Finance Loan Scheme3 | 0.6 | 2.0 | ||||||
Emergency Drought Assistance Loan Scheme3 | 0.3 | 1.0 | ||||||
Farm Management Grants Program4 | 1.0 | 1.0 | ||||||
#pickqld bonus (formally the Back to Work in Agriculture Incentive Scheme)5 | 1.9 | — | ||||||
Business Counselling6 | 0.7 | — | ||||||
Total | 25.7 | 25.3 | ||||||
Notes:
| 1. | The variance is due to the reduced demand anticipated for this scheme as a result of improved seasonal conditions in many parts of Queensland. |
| 2. | This scheme commenced in November 2021. The initial year was not a full year of operation. |
| 3. | This scheme commenced in March 2022. The initial year was not a full year of operation. |
| 4. | The value of this concession includes Queensland Government funding only. The Australian Government also contributes towards the funding for this program. |
| 5. | This scheme was closed on 31 December 2021 to new applicants. |
| 6. | This item is part of the government response to COVID-19. |
Primary Industry Productivity Enhancement Scheme (PIPES)
PIPES is administered by the Queensland Rural and Industry Development Authority (QRIDA) and provides concessional rates of interest on loans to eligible primary producers in need of financial assistance. First Start Loans and Sustainability Loans of up to $2 million and $1.3 million, respectively, support applicants to enter primary production and to improve productivity and sustainability.
The average concessional interest rate for new lending is 2.8 per cent. The amounts in the above table represent the fair values of the interest rate concessions pertaining to loans issued in the PIPES portfolio in each of the financial years shown.
Drought Relief Assistance Scheme
As part of the Drought Assistance and Reform Package, the Drought Relief Assistance Scheme provides freight subsidies of up to 50 per cent and emergency water infrastructure rebates of up to 50 per cent to eligible applicants, up to a maximum of between $20,000 and $50,000 per property, per financial year. These concessions are only available to currently drought declared producers that do not access the new drought preparedness measures. Free financial counselling is being provided via the Rural Financial Counselling Service for producers and related small business owners.
192
Budget Strategy and Outlook 2022-23
Drought Preparedness Grant Scheme
As part of the Drought Assistance and Reform Package, the Drought Preparedness Grant Scheme provides a rebate to eligible primary producers of up to $50,000 for on-farm capital improvements identified in their Farm Business Resilience Plan to improve the drought preparedness of the producer’s property.
Drought Carry-on Finance Loan Scheme
As part of the Drought Assistance and Reform Package, the Drought Carry-on Finance Loan Scheme provides a concessional loan to eligible primary producers of up to $250,000 for carry-on finance during drought. These loans would be available where the $50,000 available from the Emergency Drought Assistance Loan Scheme is insufficient to assist the producer to manage drought conditions. The concession is calculated on the basis of a commercial reference rate of 5.21 per cent per annum and an average concessional interest rate for new lending of 2.7 per cent per annum. The amount shown in the above table represents the fair values of the interest rate concessions pertaining to loans in the financial year shown.
Drought Ready and Recovery Finance Loan Scheme
As part of the Drought Assistance and Reform Package, the Drought Ready and Recovery Finance Loan Scheme provides a concessional loan of up to $250,000 for eligible primary producers to undertake measures identified in their Farm Business Resilience Plan that will improve the drought preparedness of the producer’s property.
The concession is calculated on the basis of a commercial reference rate of 5.21 per cent per annum and an average concessional interest rate for new lending of 2.7 per cent per annum. The amount shown in the above table represents the fair values of the interest rate concessions pertaining to loans in the financial year shown.
Emergency Drought Assistance Loan Scheme
As part of the Drought Assistance and Reform Package, the Emergency Drought Assistance Loan Scheme provides an interest free concessional loan to eligible primary producers of up to $50,000 as emergency finance for carry-on activities like paying wages or creditors during drought. The concession is calculated at a rate of 5.21 per cent per annum on the basis of a commercial reference rate of this amount and no interest being charged on the loan. The amount shown in the above table represents the fair values of the interest rate concessions pertaining to loans in the financial year shown.
Farm Management Grants Program
As part of the Drought Assistance and Reform Package, the Farm Management Grants Program provides a rebate of 50 per cent to a maximum of $2,500 to eligible primary producers for the cost of developing a Farm Business Resilience Plan for their property.
193
Budget Strategy and Outlook 2022-23
#pickqld bonus (formally Back to Work in Agriculture Incentive Scheme)
The #pickqld bonus scheme was designed to meet short-term labour shortage demands in agriculture, with payments of up to $1,500 to encourage eligible workers to take up a job in agriculture. The incentive payment was provided to new workers to help fill the urgent and immediate agriculture workforce shortfall to deliver food security and maintain industry viability. This measure ceased in 2021–22.
Business Counselling
Free and confidential small and rural business financial counselling is provided to assist business owners who are experiencing or at risk of financial hardship due to the impacts of COVID-19 on their business. The support assists clients to better understand their financial position, access financial assistance, identify long-term recovery options, implement plans and access broader professional advice and support. The service is run through the Rural Financial Counselling Services in Queensland. On average, a benefit of approximately $950 is received in financial counselling services per client. This measure ceased in 2021–22 and is replaced by Small Business and Tourism Financial Counselling Programs which are the responsibility of the Department of Employment, Small Business and Training and the Department of Tourism, Innovation and Sport.
194
Budget Strategy and Outlook 2022-23
| Table A.2.2 | Department of Communities, Housing and Digital Economy |
Concession | 2021–22 Est. Act. $ million | 2022–23 Estimate $ million | ||||||
Government Managed Housing Rental Rebate1 | 486.0 | 541.3 | ||||||
Home Assist Secure | 22.9 | 23.2 | ||||||
National Rental Affordability Scheme2 | 26.6 | 20.3 | ||||||
Queensland Museum – Arts Concessional Entry Fee3 | 2.0 | 2.7 | ||||||
Rental Bond Loans4 | 1.0 | 1.2 | ||||||
Queensland Performing Arts Trust – Arts Concessional Entry Fees | 1.0 | 1.0 | ||||||
Arts Queensland – Discount on Property Lease Rentals5 | 0.6 | 0.8 | ||||||
Queensland Performing Arts Trust – Venue Hire Rebates | 0.5 | 0.5 | ||||||
Arts Queensland – Venue Hire Rebates | 0.4 | 0.4 | ||||||
Queensland Art Gallery – Arts Concessional Entry Fees6 | 0.5 | 0.4 | ||||||
State Library of Queensland – Venue Hire Rebates | 0.3 | 0.3 | ||||||
COVID-19 Relief – Queensland Museum – Additional Concessions7 | 0.1 | — | ||||||
Non-government Managed Housing8 | — | — | ||||||
Total | 541.9 | 592.1 | ||||||
Notes:
| 1. | The increase is due to an increase in private market rents based on prevailing conditions. |
| 2. | The variance is primarily due to a decrease in the number of incentives paid as the scheme winds down. The cessation of the scheme was a decision of the Australian Government. |
| 3. | The increase is due to higher visitation being expected due to reopening of venues and increased patronage. |
| 4. | The increase is primarily due to an increase in bond loans paid in 2022–23. |
| 5. | The increase is primarily due to reopening of venues and increased leasing space following revitalisation works. |
| 6. | The variance is due to concessional entry fees which varies depending on the number and nature of ticketed exhibitions in the year. |
| 7. | This item is part of the government response to COVID-19. |
| 8. | The value of this concession arrangement cannot be easily quantified. |
Government Managed Housing Rental Rebate
The Government Managed Housing Rental Rebate targets low-income families and individuals and represents the difference between the estimated rents that would be payable in the private market and rent that is charged by government based on household income.
Assistance is provided to approximately 54,700 households. The estimated average yearly subsidy per household for 2022–23 is $9,895.
Home Assist Secure
Home Assist Secure provides free safety related information and referrals, and subsidised assistance to eligible clients unable to undertake or pay for critical maintenance services without assistance. To be considered for assistance, homeowners or tenants over the age of 60 or of any age with a disability must hold a Pensioner Concession Card and be unable to complete the work themselves. In addition, they must be unable to access assistance from other services.
195
Budget Strategy and Outlook 2022-23
Labour costs (up to $500 per household per year) for the assistance provided are subsidised by Home Assist Secure while the balance of the costs (including the materials) are met by the client. Clients can also get a one-off subsidy of $80 for the cost of materials for security related work (Security Hardware Subsidy).
Home Assist Secure targets homeowners and those in rental housing who are over 60 years of age or have disability, and who require assistance to remain living in their home. In 2022–23, it is estimated that over 40,000 households will be assisted.
National Rental Affordability Scheme
The National Rental Affordability Scheme (NRAS) is an Australian Government initiative, delivered in partnership with the Queensland Government, to increase the supply of new affordable rental housing. The scheme provides financial incentives to investors to build well located dwellings and rent them to eligible low to moderate income households, at a discounted rate at least 20 per cent below market rent.
Under the scheme, the concession to the tenant is provided by the property owner. Due to the nature of the arrangement, the overall value of the concession to the tenant cannot be easily quantified. In 2022–23, the government has allocated $20.3 million for the payment of financial incentives to NRAS investors who are then required to discount rents to tenants.
Queensland Museum – Arts Concessional Entry Fee
Queensland Museum provides concessional entry fees to seniors, students, children, families and a variety of concession card holders for ticketed exhibitions at Queensland Museum and Sciencentre and for general entry to Cobb & Co Museum Toowoomba, the Workshops Rail Museum Ipswich and Museum of Tropical Queensland Townsville. Concessions are also provided to targeted groups, such as schools, to encourage visits to museums. The level of concession provided varies depending on the venue and the event.
Rental Bond Loans
The government provides interest-free rental bond loans to people who cannot afford to pay a full bond to move into private rental accommodation, thereby reducing the need for more costly, subsidised housing assistance, through 2 products:
| 1. | Bond Loans: equivalent to a maximum amount of 4 weeks rent, or |
| 2. | Bond Loan Plus: equivalent to a maximum amount of 6 weeks rent. |
The interest-free bond loan targets low-income households and can stabilise tenancies, preventing households from entering the cycle of homelessness and engaging with fringe, high interest credit providers. The concession represents the interest saving for the client on the bond loan. In 2022–23, $30.7 million in Bond Loans and Bond Loan Plus may be advanced to an estimated 25,000 clients.
Queensland Performing Arts Trust – Arts Concessional Entry Fees
Concessional entry fees are offered for specific Queensland Performing Arts Trust productions and to provide support for other not for profit theatre companies to enable tickets to be sold at concessional prices. The level of concession provided varies depending on the number and size of events being held each year.
196
Budget Strategy and Outlook 2022-23
Arts Queensland – Discount on Property Lease Rentals
Property lease rentals are provided to arts and cultural organisations at a discount from market rental rates at the Judith Wright Arts Centre, Festival House, and Bulmba-ja Arts Centre. Further discounts on specialist rehearsal and gallery space are given as negotiated at the time of entering the lease and dependent on the individual arts or cultural organisation and its funding.
Queensland Performing Arts Trust – Venue Hire Rebates
Venue hire rebates are offered to government-funded cultural organisations, charitable organisations, government departments and educational institutions. Organisations currently receiving discounts are Queensland Symphony Orchestra, Opera Queensland, Queensland Theatre Company and Queensland Ballet.
Arts Queensland – Venue Hire Rebates
Venue hire rebates support Queensland Government-funded arts organisations and professional artists to develop and present new work at the Judith Wright Arts Centre and Bulmba-ja Arts Centre.
Queensland Art Gallery – Arts Concessional Entry Fees
Queensland Art Gallery’s ticket prices are set to ensure that they are affordable and to maximise attendance, with additional concessions provided to seniors, students, children, families, and a variety of concession card holders. The purpose of the Queensland Art Gallery Arts entry fees concession is to contribute to the cultural, social, and intellectual development of Queenslanders, and encourage diverse audiences.
State Library of Queensland – Venue Hire Rebates
State Library of Queensland provides venue hire concessions to targeted community and non-profit groups including cultural and charitable organisations and educational institutions in order to support events and programs directly linked to State Library of Queensland’s services, programs, and activities.
COVID-19 Relief – Queensland Museum – Additional Concessions
Additional relief was provided where business hardship due to COVID-19 was proven. This concession has now ceased for 2022–23.
Non-government Managed Housing
The government provides contributions to social housing providers, including capital grants, granted land or properties, or recurrent funding, to assist in increasing housing affordability and access to social housing.
Due to the nature of the arrangement, particularly varying rents charged by providers based on individual circumstances of each household, the overall value of the concession provided by the government cannot be easily quantified.
Rents charged for social housing managed by the providers are based on between 25 per cent and 30 per cent of a household’s assessable income or the market rent, whichever is lower, which substantially reduces accommodation costs for eligible individuals and families. Many of
197
Budget Strategy and Outlook 2022-23
these families may also be eligible for Commonwealth Rent Assistance to assist in the cost of their accommodation.
| Table A.2.3 | Department of Education |
Concession | 2021–22 Est. Act. $ million | 2022–23 Estimate $ million | ||||||
Textbook and Resource Allowance1 | 72.6 | 76.4 | ||||||
School Transport Assistance for Students with Disability2 | 45.7 | 49.3 | ||||||
Living Away from Home Allowance Scheme | 8.1 | 8.1 | ||||||
Tuition Fee Exemptions/Waivers - Dependants of International Students3 | 7.4 | 7.5 | ||||||
Non-State Schools Transport Assistance Scheme4 | 6.5 | 7.1 | ||||||
Dalby State High School - Bunya Campus Residential Facility | 2.6 | 2.6 | ||||||
Western Cape Student Residential College, Weipa | 1.3 | 1.3 | ||||||
Spinifex State College - Mount Isa Student Residential Facility | 1.2 | 1.2 | ||||||
Distance Education - Information and Communication Technology Subsidy Scheme | 1.1 | 1.1 | ||||||
Distance Education - Non-Government Student Fee Subsidy5 | 0.8 | 0.7 | ||||||
Total | 147.3 | 155.3 | ||||||
Notes:
| 1. | The increase is due to enrolment growth and CPI indexation. |
| 2. | The increase reflects revised rates and increases in fuel costs. |
| 3. | The increase is due to CPI indexation. |
| 4. | The increase is due to CPI indexation and increased demand for assistance under the scheme. |
| 5. | The variance is due to a higher number of students utilising the service in 2021–22. |
Textbook and Resource Allowance
The Textbook and Resource Allowance is available for all parents/caregivers of secondary school age students attending state and non-government schools, and children registered in home education of equivalent age, to assist with the cost of textbooks and learning resources. In schools, parents may assign this allowance to the school to reduce the fees associated with participating in the school’s textbook and resource scheme. For children registered for home education, the allowance is paid directly to the parent.
In 2022, the rates per annum are $136 for students in Years 7 to 10 and $295 for students in Years 11 and 12.
School Transport Assistance for Students with Disability
The School Transport Assistance Program for Students with Disability assists eligible state school students whose disability impacts on their parents’ or carers’ ability to arrange their safe travel to and from school. This assistance includes coordinated service delivery in specially contracted taxis or minibuses, payment of fares on bus, ferry, tram and train, or an allowance for parents who make private travel arrangements for their children to school or a transport meeting point. The benefit level is to a maximum of $400 per week, per student, however in exceptional circumstances higher amounts may be approved. A separate scheme is in place for students with disability attending non-state schools (refer ‘Non-State Schools Transport Assistance Scheme’).
198
Budget Strategy and Outlook 2022-23
Living Away from Home Allowance Scheme
The Living Away from Home Allowance Scheme provides financial assistance to support geographically-isolated families. The scheme assists with the costs of children required to live away from home to attend school. This concession is available to Queensland students attending both state and non-state schools.
The benefits available for eligible students in 2022 are:
| • | Remote Area Tuition Allowance – assistance is available for primary students of up to $4,063 per annum and secondary students of up to $5,849 per annum for students who board at approved non-state schools |
| • | Remote Area Travel Allowance – available where the distance from the family home to the boarding location is at least 50km. Benefit levels depend on the distance travelled and range from $153 per annum to a maximum of $1,874 per annum |
| • | Remote Area Disability Supplement – available to students with disability who incur additional costs associated with living away from home to attend school. Benefits are up to $8,309 per student, per annum |
| • | Remote Area Allowance – assistance of $2,554 per annum is available to students attending the campus of a Queensland state high school and undertaking an approved agriculture course in lieu of Years 11 and 12. |
Tuition Fee Exemptions/Waivers – Dependants of International Students
International students who meet the approved exemption criteria and wish to enrol their child in Preparatory (Prep) Year to Year 12 of schooling are exempt from paying dependant tuition fees. The exemption only applies for the duration of the main temporary visa holder’s (parent) course of study in Queensland. A dependant student (Prep to Year 12) of a temporary visa holder may also be eligible for a tuition fee waiver in certain circumstances, including financial hardship.
The estimated average amount exempted or waived per student is $11,124 for the 2022–23 financial year.
Non-State Schools Transport Assistance Scheme
The Non-State Schools Transport Assistance Scheme directly assists families through the provision of funding towards the transport costs incurred for eligible students enrolled in non-state schools. Under the Scheme, payments are made twice a year to the families of students enrolled in non-state schools located beyond the Brisbane City Council area where bus and ferry fare expenses are above the annual Queensland Catholic Education Commission set weekly threshold amount. In 2022, the weekly threshold is $45 per family, or $35 for families with a current Health Care Card, Pensioner Concession Card or Veterans’ Affairs Card.
The program also assists families of eligible students with disability enrolled in non-state schools. The level of assistance provided is dependent on the type of transport needed and travel assistance already provided by the Department of Transport and Main Roads (DTMR). For families using taxi travel, the benefit level is to a maximum of $300 per week, inclusive of any assistance provided through DTMR’s Taxi Subsidy Scheme.
199
Budget Strategy and Outlook 2022-23
Dalby State High School – Bunya Campus Residential Facility
The Dalby State High School – Bunya Campus Residential Facility provides affordable residential accommodation for secondary school students in a boarding facility. The concession particularly targets secondary school students from rural and remote communities; however, any secondary age student is eligible. Students accommodated at the residential facility are enrolled at Dalby State High School and participate in agricultural education programs.
Western Cape Student Residential College, Weipa
The Western Cape College – Student Residential College provides a residential schooling option for students from the Torres Strait and Cape York. This college provides an option that is more familiar for students from remote locations with the intent to increase participation and retention of secondary students in schooling. The concession targets students from the Torres Strait and Cape York seeking secondary education when their home community does not provide secondary schooling.
Spinifex State College – Mount Isa Student Residential Facility
The Spinifex State College – Mount Isa Student Residential Facility provides an affordable residential facility in Mount Isa for students from the North Western area of the state whose home community does not provide secondary schooling. The funding meets the cost of wages for the residential college, increasing the affordability of the accommodation rates charged to students.
Distance Education – Information and Communication Technology Subsidy Scheme
The Distance Education – Information and Communication Technology Subsidy Scheme provides assistance to students enrolled in a school of distance education that are geographically isolated or in the medical category.
The scheme provides $400 per annum to assist with purchasing, replacing or upgrading computer hardware for students in the distance/geographically isolated and medical categories, and $500 per annum to assist students in the distance/geographically isolated category to meet the costs of broadband internet access and download charges for the home classroom. Eligible students also receive access to free software licences.
Distance Education – Non-Government Student Fee Subsidy
Distance Education – Non-Government Student Fee Subsidy is available to students who are enrolled in non-government schools and also choose to access distance education subjects. It provides an average annual subsidy of approximately $1,472 per distance education subject enrolment.
This subsidises approximately 50 per cent of the total average cost per annum of providing a subject through distance education for non-government school students. The concession contributes towards the state continuing to make distance education available to non-government schools ensuring the widest possible subject choice for students, while recovering a proportion of the teaching and overhead costs.
200
Budget Strategy and Outlook 2022-23
| Table A.2.4 | Department of Employment, Small Business and Training |
Concession | 2021–22 Est. Act. $ million | 2022–23 Estimate $ million | ||||||
User Choice - Apprentice and Trainee Training Subsidy1 | 210.2 | 245.7 | ||||||
Vocation Education and Training (VET) - Certificate 3 Guarantee Tuition Fee Subsidy1 | 216.3 | 201.2 | ||||||
VET - Higher Level Skills Tuition Fee Subsidy1 | 75.0 | 65.0 | ||||||
Travel and Accommodation Subsidy | 3.0 | 3.0 | ||||||
Total | 504.5 | 514.9 | ||||||
Note:
| 1. | The variance is due to the demand driven nature of the programs. |
User Choice – Apprentice and Trainee Training Subsidy
The User Choice – Apprentice and Trainee Training Subsidy program provides government funding towards the costs of training and assessment for eligible Queensland apprentices and trainees, or complementary pathways leading to apprenticeship outcomes.
The subsidy is available to pre-approved public and private registered training organisations to subsidise tuition fees to reduce the cost of nationally recognised entry level training for apprentices and trainees. The program provides greater flexibility for apprentices, trainees and their employers to select a preferred registered training organisation and to negotiate the type of training to meet their specific needs.
The value of this subsidy for each qualification ranges from $1,200 to $50,720, depending on student eligibility and qualification subsidised. The average subsidy value is $10,239.
Vocational Education and Training (VET) – Certificate 3 Guarantee Tuition Fee Subsidy
The Vocational Education and Training (VET) Certificate 3 Guarantee Tuition Fee Subsidy provides a government subsidy to allow eligible Queenslanders to obtain their first post-school Certificate 3 qualification to help them gain a job or to improve their employment status, including pathways for disadvantaged learners and Queensland school students (VET in Schools). The subsidy is available to pre-approved private and public registered training organisations to subsidise tuition fees paid by students undertaking eligible VET qualifications (primarily Certificate 3 qualifications).
The value of this subsidy for each qualification ranges from $480 to $6,780, depending on student eligibility and qualification subsidised. The average subsidy value is $3,173.
VET – Higher Level Skills Tuition Fee Subsidy
The VET Higher Level Skills Tuition Fee Subsidy provides a government subsidy to eligible students and employers to undertake a priority Certificate IV, diploma or advanced diploma qualification or industry endorsed skill set. This program assists individuals to gain employment in a critical occupation, career advancement in a priority industry or transition to university to continue their studies.
201
Budget Strategy and Outlook 2022-23
The subsidy is available to pre-approved private and public registered training organisations to subsidise tuition fees paid by students undertaking eligible VET qualifications at Certificate IV or above.
The value of this subsidy for each qualification ranges from $1,200 to $10,566, depending on student eligibility and qualification subsidised. The average subsidy value is $4,514.
Travel and Accommodation Subsidy
The Travel and Accommodation Subsidy provides financial assistance to Queensland apprentices and trainees for travel expenses incurred in attending off-the-job training at a registered training organisation. To be eligible, apprentices must attend the closest registered training organisation that offers the required qualification and travel a minimum of 100km return from their usual place of residence to the registered training organisation. The subsidy provides for:
| • | return land travel to the registered training organisation of 21 cents per km for distances between 100km—649km, increasing to 26 cents per km for distances of 650km or more |
| • | a return economy air ticket to the location of the registered training organisation if necessary |
| • | cost of ferry travel if necessary |
| • | accommodation assistance of $30 per day for overnight stay within Queensland and $72 for interstate travellers, if it is necessary to live away from their usual place of residence to attend training. |
202
Budget Strategy and Outlook 2022-23
| Table A.2.5 | Department of Energy and Public Works |
Concession | 2021–22 Est. Act. $ million | 2022–23 Estimate $ million | ||||||
Uniform Tariff Policy - Energy Queensland (Excluding Isolated Systems)1 | 459.3 | 568.6 | ||||||
Uniform Tariff Policy - Energy Queensland (Isolated Systems)2 | 65.3 | 66.6 | ||||||
Drought Relief from Electricity Charge Scheme3 | 15.0 | 15.0 | ||||||
Electricity Tariff Adjustment Scheme4 | 9.1 | 7.7 | ||||||
Non-residential Buildings - Subsidised Rents | 6.1 | 6.0 | ||||||
Uniform Tariff Policy - Origin Energy5 | 3.0 | 3.3 | ||||||
Affordable Energy Plan - Business Energy Savers Program6 | 1.4 | — | ||||||
Total | 559.2 | 667.2 | ||||||
Notes:
| 1. | The increase is due to network prices reducing in South East Queensland and increasing in regional Queensland. This is caused by the amounts of regulated revenue collected by Energex and Ergon Energy differing to their forecasts in 2020–21, due to the challenges in forecasting the impact of COVID-19 in that year. |
| 2. | The increase is a result of fuel cost increases offsetting expected reductions from asset write-downs in previous years. |
| 3. | Expenditure is dependent on the extent of drought conditions, the number of registered eligible parties in drought declared areas and customers seeking a rebate for fixed charges of their electricity accounts. |
| 4. | This was a new initiative for 2021–22 targeted to regional businesses facing significant bill impacts due to the phase out of obsolete electricity tariffs. The scheme is designed to help customers transition over a 9- year period with rebate amounts fixed at the start of the program, and reducing each year. The cost of the scheme will decrease each year as payments and the number of participants reduce. |
| 5. | The increase is due to regulated tariffs in regional Queensland increasing relative to prices in regional New South Wales. |
| 6. | This program ended in 2021–22. |
Uniform Tariff Policy – Energy Queensland (Excluding Isolated Systems)
The Uniform Tariff Policy ensures that, where possible, all Queensland non-market electricity customers of a similar type pay a similar price for electricity regardless of where they live. As the notified prices do not reflect the full cost of electricity supply for most remote and regional Queenslanders, a subsidy is provided through a community service obligation (CSO) payment.
The CSO payment is provided to the regional retailer, Ergon Energy, through Energy Queensland, and covers the difference between the revenue earned by charging customers notified prices and the actual costs in the regional areas (due to differences in network costs and energy losses).
Uniform Tariff Policy – Energy Queensland (Isolated Systems)
The Uniform Tariff Policy ensures that, where possible, all Queensland non-market electricity customers of a similar type pay a similar price for electricity regardless of where they are located. As the notified prices do not reflect the full cost of electricity supply for most regional and remote Queenslanders, a subsidy is provided through a CSO payment.
203
Budget Strategy and Outlook 2022-23
Energy Queensland, through the regional retailer Ergon Energy, owns and operates 33 isolated power systems which supply electricity in remote and isolated communities, and provides retail electricity services to customers in those communities at notified electricity prices. This CSO payment is provided to Ergon Energy, through Energy Queensland, and covers the difference between the revenue earned by charging customers notified prices and the actual cost of operating the isolated power systems.
Drought Relief from Electricity Charge Scheme
The Drought Relief from Electricity Charges Scheme provides farmers and irrigators with relief from fixed charges for electricity accounts that are used to pump water for farm or irrigation purposes during periods of drought. The concessions can vary depending on the shires that are drought declared and the number of eligible customers.
Electricity Tariff Adjustment Scheme
The Electricity Tariff Adjustment Scheme provides targeted support to regional businesses materially impacted by the phase-out of obsolete electricity tariffs from 30 June 2021. This initiative provides eligible customers with individually-tailored transitional rebates to help offset the removal of obsolete tariffs and incentivise a pathway to self-sufficiency over time. Eligible businesses will receive a subsidy payment for up to 9 years.
Non-residential Buildings – Subsidised Rents
Accommodation is provided to 34 community, education, arts and not-for-profit organisations in government-owned non-residential buildings. Tenures for the occupancies are by way of leases, licences or month to month arrangements. Rents paid by the organisations are often below independently assessed market rent levels. Subsidised rental arrangements are provided to 23 properties comprising a total floor area of approximately 30,727m2. The total subsidy is calculated by deducting the actual amount paid by the occupants from the total estimated annual market rent for the office space.
Uniform Tariff Policy – Origin Energy
The Uniform Tariff Policy ensures that, where possible, all Queensland non-market electricity customers of a similar type pay a similar price for electricity regardless of where they are located. As the notified prices do not reflect the full cost of electricity supply for most regional and remote Queenslanders, a subsidy is provided through a CSO payment.
Origin Energy retails electricity to approximately 5,450 Queensland nonmarket customers in the Goondiwindi, Texas and Inglewood areas who are supplied electricity through the New South Wales Essential Energy distribution network. The government provides a subsidy to these customers, via a CSO payment to Origin Energy, to ensure they pay a similar price for electricity as other Queenslanders. Therefore, the CSO amount depends on the relative difference between Queensland and New South Wales retail electricity tariffs for non-market customers.
204
Budget Strategy and Outlook 2022-23
Affordable Energy Plan – Business Energy Savers Program
The Business Energy Savers Program was an initiative under the Affordable Energy Plan that provided free energy audits for agricultural customers and large business customers, and co-contributions to fund energy efficiency upgrades. It included an extension of the existing Energy Savers Plus Program (for agricultural businesses) and the Large Customer Adjustment Program (for large electricity users).
Under the expanded Energy Savers Plus Program, 180 audits for agricultural customers were completed. Co-contribution grants of up to $20,000 were made available to assist businesses in implementing the recommendations for the audit. The free energy audits identified up to $3 million in annual energy saving opportunities for a range of farming businesses.
The Large Customer Adjustment Program (and preceding Trial) completed 21 audits of large customers and contributed up to 50 per cent of implementation costs to eligible customers to help them implement audit recommendations. The free energy audits identified up to $1.3 million in annual energy saving opportunities for a range of farming businesses.
| Table A.2.6 | Department of Environment and Science |
Concession | 2021–22 Est. Act. $ million | 2022–23 Estimate $ million | ||||||
Queensland Parks and Wildlife Service - Tour Fee and Access Permits1 | 2.1 | 1.7 | ||||||
COVID-19 Relief - Queensland Parks and Wildlife Service - Fee Relief to Commercial Tour Operators2 | 1.0 | — | ||||||
COVID-19 Relief - Queensland Parks and Wildlife Service - Waiver of Commercial Whale Watching Operator Fees2 | 0.1 | — | ||||||
Total | 3.2 | 1.7 | ||||||
Notes:
| 1. | The variance is primarily due to additional discounts for visitor entrance fees for the David Fleay Wildlife Park, which were temporarily offered in 2021–22 whilst site redevelopment works were undertaken. |
| 2. | This item is part of the government response to COVID-19. |
Queensland Parks and Wildlife Service – Tour Fee and Access Permits
Admission and ranger guided tour fee concessions are available at several attractions for children, pensioners and educational purposes. Vehicle access permit concessions are available in the Cooloola Recreation Area, Bribie, Moreton (Mulgumpin) and K’gari (Fraser) Islands. Camping concessions are available in all National Park and State Forest camping areas for educational purposes and children under 5 years of age.
COVID-19 Relief – Queensland Parks and Wildlife Service – Fee Relief to Commercial Tour Operators
The Queensland Government is assisting Queensland tourism through waiving of daily activity and passenger fees for commercial tour operators operating in Protected Areas and State Forests to June 2022.
205
Budget Strategy and Outlook 2022-23
COVID-19 Relief – Queensland Parks and Wildlife Service – Waiver of Commercial Whale Watching Operator Fees
The Queensland Government is supporting tourism operators impacted by COVID-19 through waiving of annual Commercial Whale Watching Fees for the 2021 season.
| Table A.2.7 | Department of Justice and Attorney-General |
Concession | 2021–22 Est. Act. $ million | 2022–23 Estimate $ million | ||||||
Public Trustee of Queensland - Concessions | 41.3 | 42.6 | ||||||
Court Services - Civil Court | 29.5 | 30.2 | ||||||
Queensland Civil and Administrative Tribunal | 26.6 | 27.2 | ||||||
Blue Card - Volunteer Applicants | 10.6 | 11.0 | ||||||
Body Corporate and Community Management - Dispute Resolution | 2.7 | 3.4 | ||||||
Liquor Gaming and Fair Trading - Rural Hotel Concessions | 0.4 | 0.4 | ||||||
Registry of Births, Deaths and Marriages - Fee Waivers | 0.1 | 0.2 | ||||||
Liquor Gaming and Fair Trading - License Fees1 | 21.3 | — | ||||||
Liquor Gaming and Fair Trading - Fee Waivers1 | 0.1 | — | ||||||
Total | 132.6 | 115.0 | ||||||
Note:
| 1. | This item is part of the government response to COVID-19. |
Public Trustee of Queensland – Concessions
The Public Trustee of Queensland (the Public Trustee) is a self-funded organisation and uses a scale of fees which is designed to reflect a fair cost for the services provided.
The Public Trustee has established a safety net limit on the annual fees payable by certain customers which provides for a rebate of fees for some customers with limited assets. The rebate is applied to customers such as financial administration customers with impaired capacity, or estate administration customers of limited means. The Public Trustee also provides Will making services at no cost for all Queenslanders.
In addition, the Public Trustee provides funding to the Public Guardian and financial assistance under the Civil Law Legal Aid Scheme administered by Legal Aid Queensland, to enable these organisations to provide services to the people of Queensland.
Court Services – Civil Court
The Supreme, District and Magistrates Courts hear civil disputes between 2 or more parties (people or organisations) where one party sues the other, usually to obtain compensation, or seek some other remedy. These disputes may involve anything from defamation to outstanding debts. Civil Court Fees are prescribed under the Uniform Civil Procedure (Fees) Regulation 2009 for proceedings commenced in civil matters and are set below full cost recovery to ensure that civil remedies are accessible to all Queenslanders.
206
Budget Strategy and Outlook 2022-23
Queensland Civil and Administrative Tribunal
The Queensland Civil and Administrative Tribunal (QCAT) is an independent tribunal which makes decisions and resolves disputes across a wide range of jurisdictions for the community. Fees for these services are set below cost recovery to ensure services are accessible, fair and inexpensive. QCAT provides human rights services with no application fees for matters in guardianship and administration of adults, children and young people and anti-discrimination.
Blue Card – Volunteer Applicants
Individuals providing child-related services or conducting child-related activities in regulated service environments are required to undergo an assessment of their police record and relevant disciplinary information, and if approved, are issued with a blue card. A blue card is valid for 3 years unless cancelled or suspended earlier.
The Queensland Government has met the cost of blue card assessment for volunteer applicants since the inception of the blue card system in 2001. This is to ensure children can continue to receive services and participate in activities which are essential to their development and wellbeing, in a safe and supportive environment.
Body Corporate and Community Management – Dispute Resolution
The Office of the Commissioner for Body Corporate and Community Management provides a dispute resolution service to parties unable to resolve disputes themselves. The service consists of conciliation, with the aim of achieving a voluntary agreement, and adjudication, which results in a formal order. The service is delivered below full cost recovery so as to not restrict access to justice due to affordability reasons. The commissioner has the discretion to waive application fees on the grounds of financial hardship.
Liquor Gaming and Fair Trading – Rural Hotel Concessions
The Office of Liquor and Gaming Regulation licenses hotels and clubs under the Liquor Act 1992. Under the Liquor (Rural Hotels Concession) Amendment Act 2019, the Rural Hotels Concession provides licence fee relief to establishments in remote communities by reducing the base licence fees for hotels and community clubs with no more than 2,000 members, for eligible licences from July 2019.
Registry of Births, Deaths and Marriages – Fee Waivers
The Registry of Births, Deaths and Marriages waives the fees for certificates provided to disadvantaged groups in the Queensland Community (e.g. Indigenous, homeless, domestic and family violence victims, etc.) and those impacted by major emergencies (e.g. natural disasters such as cyclones and bushfires).
Liquor Gaming and Fair Trading – License Fees
The Liquor Regulation 2002 and the Wine Regulation 2009 were amended to waive liquor and wine licence fees for the 2020–21 and 2021–22 licence period and ceases thereafter.
207
Budget Strategy and Outlook 2022-23
Liquor Gaming and Fair Trading – Fee Waivers
In response to COVID-19 and international border closures, a waiver of renewal fees for inbound tourism operations where their business solely involves arranging/selling holiday packages to foreign tourists was provided. This fee waiver will cease on 30 June 2022.
| Table A.2.8 | Department of Regional Development, Manufacturing and Water |
Concession | 2021–22 Est. Act. $ million | 2022–23 Estimate $ million | ||||||
Sunwater Rural Irrigation Water Price Subsidy1 | 20.1 | 17.7 | ||||||
Horticulture Rural Irrigation Water Price Rebate Administered by the Queensland Rural and Industry Development Authority2 | 5.4 | 9.9 | ||||||
Cloncurry Pipeline Water Supply Subsidy3 | 6.3 | 6.6 | ||||||
Seqwater Rural Irrigation Water Price Subsidy | 2.2 | 2.1 | ||||||
Water Licence Fee Waiver4 | 0.9 | 1.5 | ||||||
Disaster relief arrangements - Annual Water Licence Fee Waiver5 | 0.5 | 0.5 | ||||||
Total | 35.4 | 38.3 | ||||||
Notes:
| 1. | The variance is due to prices paid by rural irrigation customers which gradually transition towards cost recovery. |
| 2. | The increase is due to an expected increase in the number of applications. |
| 3. | The increase is due to indexation and increased insurance costs. |
| 4. | The increase is to allow for a potential return to drier conditions which may lead to increased fee waivers. |
| 5. | New item for the 2022–23 Concessions Statement (not COVID-19-related). |
Sunwater Rural Irrigation Water Price Subsidy
Sunwater’s irrigation water prices for some schemes are set below the level necessary to recover the cost of supplying water to the irrigators.
Government funding is provided to Sunwater to offset the reduced revenue and to ensure that increases in water prices paid by rural irrigation customers to recover costs are gradual.
For 3 years from 2021–22 Sunwater will also receive funding to implement a 15 per cent discount on Sunwater irrigation prices. This discount increases to 50 per cent for horticulture irrigation, with the balance of the discount delivered through a 35 per cent rebate administered by the Queensland Rural and Industry Development Authority (QRIDA).
Horticulture Rural Irrigation Water Price Rebate administered by the Queensland Rural and Industry Development Authority
Payments to QRIDA to deliver an additional 35 per cent rebate on Sunwater and Seqwater irrigation water prices related to horticulture production for 3 years from 2021–22, bringing the total irrigation discount provided to 50 per cent for approved applicants.
Cloncurry Pipeline Water Supply Subsidy
North West Queensland Water Pipeline Limited (NWQWP), a Sunwater Limited (Sunwater) subsidiary, owns and operates the Cloncurry Pipeline between the Ernest Henry Mine and Cloncurry. The pipeline guarantees Cloncurry Shire Council’s long-term water supply and supports industrial development in the region. The government provides funding to NWQWP to
208
Budget Strategy and Outlook 2022-23
ensure the pipeline remains commercially viable to operate while providing an affordable and safe water supply to Cloncurry.
Seqwater Rural Irrigation Water Price Subsidy
Seqwater’s irrigation water prices for some schemes are set below the level necessary to recover the cost of supplying water to the irrigators.
Government funding is provided to Seqwater to offset the reduced revenue and to ensure that increases in water prices paid by rural irrigation customers to recover costs are gradual.
For 3 years from 2021–22 Seqwater will also receive funding to implement a 15 per cent discount on Seqwater irrigation prices. This discount increases to 50 per cent for horticulture irrigation, with the balance of the discount delivered through a 35 per cent rebate administered by the QRIDA.
Water Licence Fee Waiver
As part of the Drought Assistance and Reform Package, fees associated with an annual water licence invoice and applications for stock or domestic water licences will be waived for 2022–2023. The waiver is available to primary producers in drought declared areas and those who have an individually droughted property.
Disaster Relief Arrangements – Annual Water License Fee Waiver
Fees associated with annual water licences will be waived for 2022–23 for disaster declared areas. The waiver is available to landholders in local government areas where Category B of the Disaster Recovery Funding Arrangements for Disaster Assistance (Primary Producer) Loans or Disaster Assistance (Essential Working Capital) Loans Scheme for Small Business is activated.
| Table A.2.9 | Department of Resources |
Concession | 2021–22 Est. Act. $ million | 2022–23 Estimate $ million | ||||||
Land Rental Rebates | 3.2 | 3.2 | ||||||
Total | 3.2 | 3.2 | ||||||
Land Rental Rebates
As part of the Drought Assistance and Reform Package, Category 11 Grazing and Primary Production landholders under the Land Act 1994 are eligible for a rent rebate. The rebate is available to lessees, other than those on minimum rent, that are in a drought declared local government area and to individually drought declared properties. In addition to this rebate, drought declared landholders will be granted a hardship deferral for required rent payments.
209
Budget Strategy and Outlook 2022-23
| Table A.2.10 | Department of Seniors, Disability Services and Aboriginal and Torres Strait Islander Partnerships |
Concession | 2021–22 Est. Act. $ million | 2022–23 Estimate $ million | ||||||
Electricity Asset Ownership Dividend and Cost of Living Rebate1 | 100.0 | 385.0 | ||||||
Electricity Rebate Scheme2 | 225.0 | 243.0 | ||||||
Pensioner Rate Subsidy Scheme | 57.4 | 58.6 | ||||||
South East Queensland Pensioner Water Subsidy Scheme | 19.7 | 20.1 | ||||||
Home Energy Emergency Assistance Scheme | 10.0 | 10.0 | ||||||
Medical Cooling and Heating Electricity Concession Scheme2 | 2.4 | 2.9 | ||||||
Reticulated Natural Gas Rebate Scheme | 2.6 | 2.7 | ||||||
Electricity Life Support Concession Scheme2 | 2.5 | 2.7 | ||||||
Electricity Rebate - COVID-19 - Residential Household Utility Assistance Package & Small / Medium Business Power Bill Relief Package3 | 0.6 | — | ||||||
Total | 420.2 | 725.0 | ||||||
Notes:
| 1. | The increase is due to a $175 Cost of Living Rebate being provided in 2022–23, compared to the $50 Electricity Asset Ownership Dividend rebate administered in 2021–22. |
| 2. | Electricity rebates are adjusted annually according to the Queensland Competition Authority’s (QCA) price determination for general household electricity tariff (Tariff 11). For 2022–23, the QCA determined Tariff 11 will increase by 9.2 per cent. |
| 3. | This item is part of the government response to COVID-19. |
Electricity Asset Ownership Dividend and Cost of Living Rebate
In 2022–23, the Queensland Government has allocated $385 million to provide Queensland households with a Cost of Living Rebate of $175. This Cost of Living Rebate will be the sixth rebate provided through electricity bills since 2017–18 and will be credited on customers’ bills from September 2022, depending on individual billing cycles.
Electricity Rebate Scheme
The Electricity Rebate Scheme provides a rebate of up to approximately $372 per annum, to assist with the cost of domestic electricity supply to the home of eligible holders of a Pensioner Concession Card, a Queensland Seniors Card, Commonwealth Health Care Card, Department of Veterans’ Affairs Gold Card (who receive a War Widow/er Pension or special rate Totally or Permanently Incapacitated Pension) and asylum seekers.
Pensioner Rate Subsidy Scheme
The Pensioner Rate Subsidy Scheme offers a 20 per cent subsidy (up to a maximum of $200 per annum) to lessen the impact of local government rates and charges on pensioners, thereby assisting them to continue to live in their own homes.
South East Queensland Pensioner Water Subsidy Scheme
The South East Queensland (SEQ) Pensioner Water Subsidy Scheme provides a subsidy of up to $120 per annum to eligible pensioner property owners in the SEQ Water Grid to lessen the impact of water prices. This subsidy is in addition to the Pensioner Rate Subsidy Scheme.
210
Budget Strategy and Outlook 2022-23
Home Energy Emergency Assistance Scheme
The Home Energy Emergency Assistance Scheme provides emergency assistance of up to $720 once in a 2-year period to assist low income households experiencing a short-term financial crisis and who are unable to pay their current electricity and/or reticulated natural gas account. It is not a requirement for the claimant to hold a concession card.
Medical Cooling and Heating Electricity Concession Scheme
The Medical Cooling and Heating Electricity Concession Scheme provides a rebate of up to approximately $372 per annum for eligible concession card holders with a medical condition who have dependence on air conditioning to regulate body temperature.
Reticulated Natural Gas Rebate Scheme
The Reticulated Natural Gas Rebate Scheme provides a rebate of up to approximately $81 per annum to assist with the cost of reticulated natural gas supplied to the home of eligible holders of a Pensioner Concession Card, Queensland Seniors Card or a Department of Veterans’ Affairs Gold Card (who receive the War Widow/er Pension or special rate Totally or Permanently Incapacitated Pension).
Electricity Life Support Concession Scheme
The Electricity Life Support Concession Scheme is aimed at assisting seriously ill people who use home based life support systems by providing a rebate of up to approximately $758 per annum for users of oxygen concentrators and a rebate of up to approximately $508 per annum for users of kidney dialysis machines to meet their electricity costs. The concession is paid quarterly and is subject to the patient being medically assessed in accordance with Queensland Health eligibility criteria.
Electricity Rebate – COVID-19 – Residential Household Utility Assistance Package & Small / Medium Business Power Bill Relief Package
Electricity Rebates provided as a COVID-19 response initiative during the pandemic have included a $200 rebate for residential household relief and a $500 rebate for small to medium enterprises. Funding in 2021–22 of $633,000 has been provided to continue payments for late applicants to the scheme.
| Table A.2.11 | Department of Tourism, Innovation and Sport |
Concession | 2021–22 Est. Act. $ million | 2022–23 Estimate $ million | ||||||
Queensland Recreation Centres - Concessional Usage Rates | 1.6 | 1.6 | ||||||
Total | 1.6 | 1.6 | ||||||
Queensland Recreation Centres – Concessional Usage Rates
Concessional usage rates are offered to clients who meet the strategic objectives of the Activate! Queensland Strategy, including not-for-profit sport and recreation organisations, Queensland schools and Queensland state sporting organisations, for the use of Queensland Recreation Centres, at Currimundi and Tallebudgera.
211
Budget Strategy and Outlook 2022-23
| Table A.2.12 | Department of Transport and Main Roads |
Concession | 2021–22 Est. Act. $ million | 2022–23 Estimate $ million | ||||||
General Public Transport Concessions (South East Queensland)1 | 1,786.3 | 1,824.2 | ||||||
Rail Network and Infrastructure Funding | 780.5 | 799.1 | ||||||
General Public Transport Concessions (Regional Queensland)2 | 280.0 | 315.5 | ||||||
Vehicle and Boat Registration Concessions | 189.5 | 195.8 | ||||||
School Transport Assistance Scheme | 144.8 | 153.9 | ||||||
TransLink Transport Concessions (South East Queensland)3 | 46.6 | 75.6 | ||||||
Livestock and Regional Freight Contracts | 33.0 | 35.4 | ||||||
Rail Concession Scheme4 | 29.4 | 27.1 | ||||||
Other Transport Concessions (Regional Queensland) and Taxi Subsidies | 23.0 | 24.0 | ||||||
Mount Isa Line Below Rail Subsidy | 20.0 | 20.0 | ||||||
Designated Public Transport Concessions for Seniors Card Holders | 4.1 | 4.1 | ||||||
Practical Driving Test | 2.3 | 2.3 | ||||||
COVID-19 Relief Measures - Transport Services5 | 10.8 | 0.2 | ||||||
Total | 3,350.3 | 3,477.2 | ||||||
Notes:
| 1. | The increase is largely due to increased rail costs for Cross River Rail readiness and cleaning costs, offset by increased fare revenue from the expected return of patronage to the network. |
| 2. | The increase is due to an expected increase in patronage on TravelTrain, Local Fare Scheme and the new aviation contracts which commenced early 2022. |
| 3. | The increase is primarily due to the expectation of an increase in patronage in 2022–23. |
| 4. | The variance is due to the Citytrain rail concession being included in the TransLink Transport Concessions (South East Queensland), due to these concessions being included in the Rail Transport Service Contract from 2022–23. |
| 5. | This item is part of the government response to COVID-19. |
General Public Transport Concessions (South East Queensland)
The General Public Transport Concessions (South East Queensland) represents the direct funding contribution that government makes towards the cost of operating public transport services within South East Queensland. This contribution effectively reduces the ticket price paid by all public transport users on bus, rail and ferry services, increasing the affordability of these services.
Rail Network and Infrastructure Funding
Rail network and infrastructure funding ensures that the state-supported rail network is safe, reliable and fit-for-purpose. The contract also provides funding to Queensland Rail to support major capital projects and related asset strategies. The funding provided via this contract directly benefits customers of the state supported rail network, including both freight and passengers. Without this funding, rail access charges (including public transport fares) would be significantly higher for all users of the rail network.
212
Budget Strategy and Outlook 2022-23
General Public Transport Concessions (Regional Queensland)
The General Public Transport Concessions (Regional Queensland) represents the financial contribution that government provides across a range of transport services in regional Queensland. The impact of this contribution benefits all public transport users through reduced transport fares. This concession covers:
| • | subsidies for regional bus and ferry operators (excluding concessional top-up amounts and School Transport Assistance Scheme related amounts) |
| • | subsidies for air services to remote and rural communities within the state |
| • | subsidies for Kuranda Scenic Railway |
| • | TravelTrain (excluding the ‘Rail Concession Scheme’ for eligible pensioners, veterans and seniors) |
| • | subsidies for long distance coach services to rural and remote communities within the state |
| • | subsidies for Heritage Rail Services |
| • | subsidies for the Rail XPT Service (Sydney-Brisbane) and Savannahlander (Atherton Tableland). |
Vehicle and Boat Registration Concessions
Registration concessions for light and heavy motor vehicles and recreational boats are provided to a range of groups, including holders of the Pensioner Concession Card, Queensland Seniors Card and to those assessed by the Department of Veterans’ Affairs as meeting the necessary degree of incapacity or impairment. These concessions are aimed at improving access to travel for pensioners, seniors and persons with a disability by providing a reduced rate of registration fees. For most eligible card holders, a concession for a family 4-cylinder vehicle would reduce the 12-month registration fee from $348.70 to $174.35. For a recreational boat up to and including 4.5 metres in length, the concession reduces the registration charge from $94.15 to $47.05.
A Special Interest Vehicle (SIV) registration concession is offered for motor vehicles that have low use associated with vintage and historic and street rod car club events. A 12-month registration fee for a 6-cylinder SIV concession reduces from $552.10 to $98.25. A concession is also available for specific purposes such as water, mineral or oil exploration and bee keeping.
Eligible primary producers also receive registration concessions for their heavy vehicles, reducing their registration fees by 50 to 75 per cent. For example, a primary producer’s 12-month registration fee for a two-axle truck with a Gross Vehicle Mass over 12 tonne reduces from $1,013.30 to $506.65. Other motor vehicle registration concessions are also provided to local governments, charitable and community service organisations, and people living in remote areas. Vessel registration concessions may be provided to accredited surf lifesaving clubs and schools.
213
Budget Strategy and Outlook 2022-23
School Transport Assistance Scheme
The School Transport Assistance Scheme assists students that do not have a school in their local area or who are from defined low income groups with travel costs. The scheme provides funding to reduce the cost of travelling to school on bus, rail and/or ferry services, with allowances for private vehicle transport in certain circumstances. A typical concession would be to fully fund the cost of travel from home to the nearest state primary or high school where no local primary or high school is available (for example, from Bargara to Bundaberg High School).
TransLink Transport Concessions (South East Queensland)
The TransLink Transport Concessions (South East Queensland) are provided by the government to ensure access and mobility for Queenslanders who require assistance because of age, disability or fixed low income. Passengers entitled to receive public transport concessions include holders of a Pensioner Concession Card, Veterans’ Affairs Gold Card, Seniors Card (all states and territories), Companion Card, Vision Impairment Travel Pass, Total Permanent Incapacitated (TPI) Veteran Travel Pass, children, secondary and tertiary students, Newstart and Youth Allowance (Job Seeker) recipients, asylum seekers and White Card holders. Under current fare arrangements, approved concession groups receive at least a 50 per cent discount when compared to the same applicable adult fare.
Livestock and Regional Freight Contracts
The Livestock and Regional Freight Contracts provide funding to support the movement of cattle (via rail only) and freight (via road and rail) to and from regional areas of Queensland. The funding provided directly benefits the cattle industry and enables regional Queensland communities to maintain employment and directly benefits those communities who are reliant on rail freight services by reducing the cost of these freight services for users.
Rail Concession Scheme
The Queensland Rail Concession Scheme improves the affordability of long distance and urban rail services for eligible pensioners, veterans, seniors and current/past rail employees with 25 years of service. Assistance for long distance rail services is provided through discounted fares and free travel vouchers. For TravelTrain (long distance rail) services, depending on the service, the concession may be for free travel for up to 4 trips per year for Queensland pensioners (subject to availability of seats and payment of an administration fee).
Other Transport Concessions (Regional Queensland) and Taxi Subsidies
Other transport concessions (Regional Queensland) and taxi subsidies are provided by the government to ensure access and mobility for Queenslanders who require assistance because of age, disability or fixed low income. Passengers entitled to receive public transport concessions include holders of a Pensioner Concession Card, Veterans’ Affairs Gold Card, Seniors Card (all states and territories), Companion Card, Vision Impairment Travel Pass, TPI Veteran Travel Pass, children, secondary and tertiary students, Newstart and Youth Allowance (Job Seeker) recipients, asylum seekers and White Card holders. The Taxi Subsidy Scheme aims to improve the mobility of persons with severe disabilities by providing a 50 per cent concession fare up to a maximum subsidy of $30 per trip.
214
Budget Strategy and Outlook 2022-23
Mount Isa Line Below Rail Subsidy
In recognition of the importance the Mount Isa Line plays in facilitating the transportation of freight from pit to port, from 2019–20, the Queensland Government is paying $20 million per annum to eligible freight users under the 4-year $80 million Mount Isa Line Incentive Scheme. This payment reduces below rail access costs to further promote rail for freight, as well as supporting continued development of the North West Minerals Province.
Designated Public Transport Concessions for Seniors Card Holders
Designated Public Transport Concessions for Seniors Card holders allows visitors from interstate, who hold a state or territory Seniors Card, to access public transport concessions within Queensland and is fully funded by the Queensland Government.
Practical Driving Test
As part of the state’s driver licensing arrangements, applicants for new licences are required to undertake a practical driving test. The total cost to pre-book driver examinations and to perform the practical driver assessment is not fully recovered by the fee charged ($62.80 (including GST) as at 1 July 2022), providing a direct concession to applicants.
COVID-19 Relief Measures – Transport Services
Transport services COVID-19 relief measures provided by the government include:
| • | financial assistance for the personalised transport industry |
| • | waiving vehicle registration cancellation fees, number plate fees and, in most cases, the costs associated with vehicle inspections on re-registration |
| • | funding assistance to support passenger transport aviation providers, ferry service operators and regional bus operators in Queensland to 30 June 2022. |
| • | COVID-19 relief measures will be discontinued from early 2022–23. |
| Table A.2.13 | Queensland Fire and Emergency Services |
Concession | 2021–22 Est. Act. $ million | 2022–23 Estimate $ million | ||||||
Emergency Management Levy Concession | 10.9 | 11.3 | ||||||
Total | 10.9 | 11.3 | ||||||
Emergency Management Levy Concession
The Emergency Management Levy (EML) is applied to all prescribed Queensland property via council rates to ensure there is a secure funding base for fire and emergency services when Queenslanders are at risk during emergencies such as floods, cyclones and storms, as well as fire and accidents. A 20 per cent discount is available on the EML for a property that is the owner’s principal place of residence and where the owner holds a Commonwealth Pensioner Concession Card or a Repatriation Health Card (Gold Card).
215
Budget Strategy and Outlook 2022-23
| Table A.2.14 | Queensland Health |
Concession | 2021–22 Est. Act. $ million | 2022–23 Estimate $ million | ||||||
Oral Health Scheme1 | 175.2 | 180.7 | ||||||
Patient Travel Subsidy Scheme2 | 75.0 | 97.2 | ||||||
Medical Aids Subsidy Scheme3 | 23.2 | 29.5 | ||||||
Spectacle Supply Scheme | 9.8 | 10.1 | ||||||
Hospital Car Parking Concession Scheme4 | 1.6 | 1.8 | ||||||
Total | 284.8 | 319.3 | ||||||
Notes:
| 1. | The increase is primarily due to an escalation in state funding for the Oral Health Scheme. Australian Government funding available under the Federation Funding Agreement on Public Dental Services for Adults was extended in the 2022–23 Federal Budget and will be the same as recent years. |
| 2. | The increase is due to a reduction in patient travel and access to the PTSS due to COVID-19 travel restrictions and an increase in telehealth appointments 2021–22. |
| 3. | The increase is due to lower than expected demand for MASS services in 2021–22. |
| 4. | Actual expenditure varies slightly from year to year in response to demand by eligible patients, the value of parking tickets and the level of subsidy provided, at each site. |
Oral Health Scheme
The Oral Health Scheme provides free dental care to eligible clients and their dependants who possess a current Health Care Card, Pensioner Concession Card, Queensland Seniors Card or Commonwealth Seniors Card. The average value of a course of treatment for eligible clients is approximately $600 for general care, $1,600 for treatment involving dentures, and $250 for emergency dental care. In rural and remote areas where no private dental practitioner exists, access to dental care for the general public is provided at a concessional rate, generally 15 per cent to 20 per cent less than average private dental fees.
Patient Travel Subsidy Scheme
The Patient Travel Subsidy Scheme (PTSS) provides financial assistance to patients travelling for specialist medical services that are not available locally. The PTSS provides a financial subsidy toward the cost of travel and accommodation for patients and, in some cases, an approved escort when patients are required to travel more than 50 kilometres from their nearest public hospital or public health facility to access specialist medical services.
Patients receive fully subsidised commercial transport for the most clinically appropriate cost-effective mode or will be subsidised at the economy/government discount rate (less GST). A mileage subsidy of 30 cents per kilometre is paid where patients travel by private car. Accommodation subsidies are $60 per person, per night for the patient and approved escort if they stay in commercial accommodation, or a subsidy of $10 per person per night if staying with family or friends.
216
Budget Strategy and Outlook 2022-23
Medical Aids Subsidy Scheme
The Medical Aids Subsidy Scheme (MASS) provides access to subsidy funding assistance for the provision of a range of aids and equipment to eligible Queensland residents with permanent and established conditions or disabilities. Aids and equipment are provided primarily to assist people to live at home therefore avoiding premature or inappropriate residential care or hospitalisation.
Subsidies vary based on service category and clinical criteria and are provided to assist with the costs of communication aids, continence aids, daily living aids, medical grade footwear, mobility aids, orthoses and oxygen. Actual expenditure for 2021–22 reflects the continued impact of COVID-19 since 2020–21.
Based on demand in 2020–21 and current applications, the scheme is estimated to provide 52,000 occasions of service to approximately 40,000 clients in 2021–22. As COVID-19 restrictions continue to wind down, the scheme is estimated to provide approximately 63,000 occasions of service for 44,000 clients in 2022–23.
Spectacle Supply Scheme
The Spectacle Supply Scheme (SSS) provides eligible Queensland residents with free access to a comprehensive range of basic spectacles every 2 years including bifocals and trifocals. Applicants must be holders of eligible concession cards and be deemed by a prescriber to have a clinical need for spectacles. The SSS provides around 90,000 items each year to approximately 70,000 clients (some clients require more than one pair of spectacles due to clinical need). The average cost of services provided to applicants is approximately $122 per item, including the costs of administering the scheme through the Medical Aids Subsidy Scheme.
Hospital Car Parking Concession Scheme
The Hospital Car Parking Concession Scheme supports Hospital and Health Services (HHSs) to provide affordable car parking for eligible patients and their carers at 14 Queensland public hospitals with paid parking. Car parking concessions are available to eligible patients and their carers who attend hospital frequently or for an extended period of time; patients and their carers with special needs who require assistance; and patients and carers experiencing financial hardship. The scheme provides access to discounted parking with an average discount of approximately 54 per cent of the commercial cost of parking.
Actual expenditure for 2021–22 reflects the continued impact of COVID-19 since 2020–21. Based on demand in 2020–21 and current applications, the scheme will provide approximately 52,000 occasions of service to approximately 40,000 clients in 2021–22. In 2022–23, approximately 350,000 patients and carers will benefit from the scheme receiving access to over 500,000 concessions.
217
Budget Strategy and Outlook 2022-23
A.3 Concessions by government-owned corporation
| Table A.3.1 | Energy Queensland Limited |
Concession | 2021–22 Est. Act. $ million | 2022–23 Estimate $ million | ||||||
Regulated Service Charges—Ergon Energy | 14.7 | 14.9 | ||||||
Regulated Service Charges—Energex | 13.0 | 13.6 | ||||||
Total | 27.7 | 28.5 | ||||||
Regulated Service Charges – Ergon Energy
Under Schedule 8 of the Electricity Regulation 2006, service charges for a range of services provided by Ergon Energy Corporation Limited (Ergon Energy) to energy retailers, for example disconnection and reconnection of supply, are capped. The maximum amount Ergon Energy is able to charge for these services is, on average, less than the value which the Australian Energy Regulator ascribes to the provision of these services by Ergon Energy, resulting in a concession provided to energy retailers and in turn, to households.
Regulated Service Charges – Energex
Under Schedule 8 of the Electricity Regulation 2006, charges for a range of services provided by Energex Limited (Energex) to energy retailers, for example disconnection and reconnection of supply, are capped. The maximum amount Energex is able to charge for these services is, on average, less than the value which the Australian Energy Regulator ascribes to the provision of these services by Energex, resulting in a concession provided to energy retailers and in turn, to households.
| Table A.3.2 | Gladstone Ports Corporation Limited |
Concession | 2021–22 Est. Act. $ million | 2022–23 Estimate $ million | ||||||
Concessional Port Charges | 36.6 | 40.5 | ||||||
Total | 36.6 | 40.5 | ||||||
Concessional Port Charges
The Gladstone Ports Corporation Limited (GPC) is subject to a number of long-term major industry contracts where port charges are significantly lower than market rates. These historical contracts were entered into to support various industries and government initiatives from time to time. The amounts shown are estimates of the revenue foregone by GPC as a result of being unable to charge commercial rates.
218
Budget Strategy and Outlook 2022-23
| Table A.3.3 | Sunwater Limited |
Concession | 2021–22 Est. Act. $ million | 2022–23 Estimate $ million | ||||||
Water Supply Contracts | 50.4 | 52.5 | ||||||
Total | 50.4 | 52.5 | ||||||
Water Supply Contracts
Sunwater has a number of historic non-commercial water supply contracts that benefit specific entities (including local governments). The amount shown represents the difference between the estimated revenue under these contracts and that which could be recovered under a full cost allocation model.
| Table A.3.4 | Concessional Leases by Entity (Industry, Commercial and Community) |
Concession | 2021–22 Est. Act. $ million | 2022–23 Estimate $ million | ||||||
Port of Townsville Limited | 6.3 | 6.5 | ||||||
Gladstone Ports Corporation Limited | 3.0 | 3.0 | ||||||
Queensland Rail Limited | 2.1 | 2.2 | ||||||
Far North Queensland Ports Corporation Limited | 1.9 | 1.9 | ||||||
North Queensland Bulk Ports Corporation Limited | 1.6 | 1.6 | ||||||
Total | 14.9 | 15.2 | ||||||
Concessional Leases (Industry, Commercial and Community)
The above government-owned corporation entities provide leases to various community organisations, local councils, government departments and industry participants at below commercial rates. The amounts shown are estimates of the revenue foregone by not charging commercial rates.
| Table A.3.5 | COVID-19-Related Measures by Entity |
Concession | 2021–22 Est. Act. $ million | 2022–23 Estimate $ million | ||||||
Far North Queensland Ports Corporation Limited | 1.7 | 1.5 | ||||||
Gladstone Ports Corporation Limited | 0.1 | |||||||
Total | 1.8 | 1.5 | ||||||
COVID-19-Related Measures (Industry, Commercial and Community)
As part of the Queensland Government’s COVID-19 response, the above government-owned businesses provided relief measures to support community organisations and businesses adversely affected by COVID-19.
Relief measures include temporary reductions to commercial leases, fees and other charges. The amounts shown are estimates of the revenue foregone by not charging commercial rates. To be included in the above table, concessions must meet the minimum materiality threshold of estimated revenue foregone of $50,000.
219
Budget Strategy and Outlook 2022-23
Appendix B: Tax expenditure statement
Context
Governments employ a range of policy tools to achieve social and economic objectives. These include the use of direct budgetary outlays, regulatory mechanisms and taxation.
This Tax Expenditure Statement (TES) details revenue forgone as a result of Queensland Government decisions relating to the provision of tax exemptions or concessions. The TES is designed to improve transparency in the use of tax expenditures and increase public understanding of the fiscal process.
Tax expenditures are reductions in tax revenue that result from the use of the taxation system as a policy tool to deliver government policy objectives. Tax expenditures are provided through a range of measures, including:
| • | tax exemptions, rebates or deductions |
| • | the application of reduced tax rates to certain groups or sectors of the community |
| • | provisions, which defer payment of a tax liability to a future period. |
Labelling an exemption or concession as a tax expenditure does not necessarily imply any judgement as to its appropriateness. It merely makes the amount of the exemption or concession explicit and thereby facilitates its scrutiny as part of the annual budget process.
COVID-19 and implications for tax expenditure
The impact of the COVID-19 pandemic on Queensland businesses has been significant and the Queensland Government moved quickly to introduce substantial tax relief measures to support Queensland businesses, particularly small and medium businesses. These initiatives were primarily aimed at supporting the cashflow and viability of Queensland businesses, landlords, tenants, and the state’s pubs and clubs.
The key relief measures fell under 3 categories:
| • | direct refunds, holidays, rebates or waivers of tax liabilities – refunds, holidays and waivers of payroll tax liabilities; and a 25 per cent rebate and waiver of foreign surcharge on land tax |
| • | deferrals of tax liabilities – various deferrals of payroll tax, land tax, gaming machine tax and lotteries tax |
| • | exemptions – eligible JobKeeper payments were exempted from payroll tax. |
The impact of these measures has resulted in a significant increase in forgone revenue, most notably in 2019–20, although some measures continue to impact in 2020–21 and 2021–22.
220
Budget Strategy and Outlook 2022-23
Methodology
Revenue forgone approach
The method used almost exclusively by governments to quantify the value of their tax expenditures is the revenue forgone approach. This method estimates the revenue forgone through use of the concession by applying the benchmark rate of taxation to the volume of activities or assets affected by the concession.
One of the deficiencies of the revenue forgone approach is that effects on taxpayer behaviour resulting from tax expenditures are not factored into the estimate. Consequently, the aggregation of costings for individual tax expenditure items presented in the TES will not necessarily provide an accurate estimate of the total level of assistance provided through tax expenditures.
Additionally, while total COVID-19 relief is included in the TES, some relief was treated as a grant expense, for example in relation to rebates of already-paid tax liabilities. In these cases, the associated tax expenditure did not reduce revenues.
Measuring tax expenditures requires the identification of:
| • | a benchmark tax base |
| • | concessionally taxed components of the benchmark tax base such as a specific activity or class of taxpayer |
| • | a benchmark tax rate to apply to the concessionally taxed components of the tax base. |
Defining the tax benchmark
The most important step in the preparation of a TES is the establishment of a benchmark for each tax included in the statement. The benchmark provides a basis against which each tax concession can be evaluated. The aim of the benchmark is to determine which concessions are tax expenditures as opposed to structural elements of the tax. The key features of a tax benchmark are:
| • | the tax rate structure |
| • | any specific accounting conventions applicable to the tax |
| • | the deductibility of compulsory payments |
| • | any provisions to facilitate administration |
| • | provisions relating to any fiscal obligations. |
By definition, tax expenditures are those tax concessions not included as part of the tax benchmark.
Identification of benchmark revenue bases and rates requires a degree of judgement and is not definitive. Furthermore, data limitations mean that the tax expenditures are approximations and are not exhaustive. This statement does not include estimates of revenue forgone from exemptions or concessions provided to government agencies. Very small exemptions or concessions are also excluded.
221
Budget Strategy and Outlook 2022-23
The tax expenditure statement
This year’s statement includes estimates of tax expenditures in 2020–21 and 2021–22 for payroll tax, land tax, duties, the waste disposal levy and gambling taxes. A summary of the major tax expenditures valued on the basis of revenue forgone is presented in Table B.1. Not all expenditures can be quantified at this time. Accordingly, the total value of tax expenditures should be considered as indicative only.
| Table B.1 | Tax expenditure summary1 |
| 2020–212 $ million | 2021–22 $ million | |||||||
Payroll tax | ||||||||
Exemption threshold | 961 | 1,102 | ||||||
Graduated tax scale | 43 | 49 | ||||||
Deduction scheme | 440 | 505 | ||||||
Regional discount | 99 | 113 | ||||||
COVID-19 relief3 | 248 | 4 | ||||||
Section 14 exemptions | ||||||||
Local government | 169 | 194 | ||||||
Education | 211 | 242 | ||||||
Hospitals (excluding public hospitals) | 64 | 74 | ||||||
Charities | 364 | 418 | ||||||
Apprentice and trainee exemption | 68 | 78 | ||||||
Apprentice and trainee rebate | 32 | 37 | ||||||
Employee growth rebate | 13 | 19 | ||||||
Total payroll tax | 2,712 | 2,834 | ||||||
Land tax | ||||||||
Liability threshold4 | 830 | 848 | ||||||
Graduated land tax scale | 1,484 | 1,592 | ||||||
Principal place of residence exemption | 327 | 337 | ||||||
Primary production exemption | 137 | 168 | ||||||
Part 6 Divisions 2 and 3 exemptions (not included elsewhere)5 | 155 | 155 | ||||||
Land developers’ concession | 20 | 8 | ||||||
COVID-19 relief3 | 63 | 1 | ||||||
Total land tax | 3,015 | 3,110 | ||||||
222
Budget Strategy and Outlook 2022-23
Duties | ||||||||
Transfer duty | ||||||||
Home concession | 535 | 602 | ||||||
First home concession | 289 | 251 | ||||||
First home vacant land | 63 | 23 | ||||||
AFAD exemption/ex gratia | 8 | 11 | ||||||
Insurance duty | ||||||||
WorkCover | 71 | 79 | ||||||
Health insurance | 495 | 521 | ||||||
Compulsory third party (CTP)6 | 89 | 88 | ||||||
Total duties | 1,548 | 1,574 | ||||||
Queensland waste levy |
| |||||||
Exempt waste – general | 129 | 97 | ||||||
Approved exemptions | 88 | 94 | ||||||
Approved discounts | 14 | 8 | ||||||
Total waste levy | 231 | 199 | ||||||
Taxes on gambling | ||||||||
Gaming machine taxes | 125 | 127 | ||||||
Casino taxes | 10 | 11 | ||||||
Total gambling tax | 135 | 138 | ||||||
Total | 7,641 | 7,855 | ||||||
Notes:
| 1. | Numbers may not add due to rounding. |
| 2. | 2020–21 estimates may have been revised since the 2021–22 Queensland Budget. |
| 3. | The expense in 2020–21 predominantly related to substantial support provided through waivers and exemptions. A further ‘cashflow benefit’ was provided through deferrals, with some of this benefit flowing through to 2021–22. In relation to the deferrals, the estimated expense reflects the implied foregone interest on the deferred payments. |
| 4. | Land tax is payable only on the value of taxable land above a threshold, depending on ownership structure. |
| 5. | Applicable, but not limited to; religious bodies, public benevolent institutions, and other exempt charitable institutions. |
| 6. | CTP duty is levied at a rate of 10 cents per policy. |
223
Budget Strategy and Outlook 2022-23
Discussion of individual taxes
Payroll tax
The benchmark tax base for payroll tax is assumed to be all taxable wages, salaries and supplements (including employer superannuation contributions) paid in Queensland, as defined in the Payroll Tax Act 1971.
Payroll tax exemption threshold
From 1 July 2019, employers who employ in Queensland with an annual Australian payroll of $1.3 million or less are exempt from payroll tax. On the basis of November 2021 average weekly adult total earnings, the new threshold corresponded to businesses with payrolls equivalent to employing approximately 15 full-time equivalent employees. This exemption is designed to assist small and medium sized businesses.
Graduated payroll tax scale
Queensland employers with Australian payrolls between $1.3 million and $6.5 million are liable for payroll tax at a rate of 4.75 per cent, and those with payrolls above $6.5 million are liable at a rate of 4.95 per cent. The benchmark tax rate for payroll tax is assumed to be 4.95 per cent.
Deduction scheme
Queensland employers with Australian payrolls between $1.3 million and $6.5 million benefit from a deduction of $1.3 million, which reduces by $1 for every $4 by which the annual payroll exceeds $1.3 million, with no deduction for employers or groups that have annual payroll in excess of $6.5 million. (Note: as announced in this Budget, from 1 January 2023 the phase out of the deduction will be changed to $1 for every $7 by which the annual payroll exceeds $1.3 million).
Regional discount
Employers who are based in regional Queensland and pay over 85 per cent of taxable wages to regional areas may be entitled to a discount on the rate of payroll tax imposed on their taxable wages. The discounted payroll tax rates for regional businesses are 3.75 per cent for employers who pay $6.5 million or less in Australian taxable wages, or 3.95 per cent for employers who pay more than $6.5 million in Australian taxable wages.
224
Budget Strategy and Outlook 2022-23
COVID-19 relief – payroll tax
In response to the COVID-19 pandemic, a number of payroll tax relief measures were implemented to assist Queensland businesses that resulted in forgone revenue in 2020–21 and 2021–22. The specific support measures that impacted revenues in those 2 years include:
| • | exemption from payroll tax of the subsidised component of the Australian Government’s JobKeeper payment |
| • | the deferral of payroll tax liabilities from the 2020 calendar year over 4 payments ending in January 2022 |
| • | a 2-month payroll tax waiver for small businesses |
| • | a 6 month deferral of July or August 2021 payroll tax payments for tourism and hospitality businesses. |
Section 14 exemptions
A number of organisations are provided with exemptions from payroll tax under Section 14 of the Payroll Tax Act 1971. The activities for which estimates have been calculated are wages paid by charities for employees working in hospitals, non-tertiary private educational institutions and for other qualifying exempt purposes, and for local governments (excluding commercial activities).
Apprentice and trainee exemptions
Most apprentice and trainee wages are exempt from payroll tax. To be eligible the employee must sign a training contract with their employer to undertake an apprenticeship or traineeship declared under the Further Education and Training Act 2014.
Apprentice and trainee rebate
In addition to being exempt wages for payroll tax, a rebate can be claimed that reduces the overall payroll tax liability of an employer. The rebate is calculated by multiplying 50 per cent of the apprentice and trainee wages by the applicable payroll tax rate for each return period.
Employment growth rebate
For 2019–20 and 2020–21, a payroll tax rebate of up to $20,000 was available to eligible employers who demonstrated a net employment increase in the number of new Queensland full-time positions over a full financial year. The rebates were calculated as part of annual returns due in July of each year, with the 2019–20 rebate reflected as a tax expenditure in 2020–21.
225
Budget Strategy and Outlook 2022-23
Land tax
The benchmark tax base is assumed to be all freehold land within Queensland. As outlined below for each specific tax expenditure, the appropriate benchmark tax rate for land tax is either the top rate of land tax applicable in Queensland (excluding surcharges) in each financial year, or the effective rate under the graduated scale of land tax rates for revenue foregone.
Liability threshold
Land tax is payable on the value of taxable land equal to or above a threshold which depends on the land’s ownership. The threshold for companies, trusts and absentees is $350,000 and for resident individuals the threshold is $600,000.
Graduated land tax scale
A graduated (concessional) scale of land tax rates is applicable to land holdings with a taxable value of less than $10 million for resident individuals and companies, trustees and absentees. The benchmark rates used for estimating the tax expenditures were the highest rates applicable for different types of owners: 2.25 per cent for individuals, 2.5 per cent for absentees and 2.75 per cent for companies and trustees.
Principal place of residence exemption
Land owned by resident individuals as their principal place of residence is excluded from the estimate of taxable land value in calculating land tax. The benchmark rates used for estimating the tax expenditures were the effective rate under the graduated scale of land tax rates.
Primary production deduction
The taxable value of land owned by a resident individual, trustee or some absentees and companies does not include all or part of their land that is used for the business of agriculture, pasturage or dairy farming. The benchmark rates used for estimating the tax expenditures were the effective rate under the graduated scale of land tax rates.
Part 6 Divisions 2 and 3 exemptions (not included elsewhere)
A number of land tax exemptions are granted in Part 6 Divisions 2 and 3 of the Land Tax Act 2010 to eligible organisations. These include, but are not limited to, public benevolent institutions, religious institutions and other exempt charitable institutions, retirement villages, trade unions and showgrounds.
Land developers’ concession
Land tax payable by land developers is calculated on the basis that the unimproved value of undeveloped land subdivided in the previous financial year and which remains unsold at 30 June of that year is 60 per cent of the Valuer-General’s value. This concession is outlined in Section 30 of the Land Tax Act 2010.
226
Budget Strategy and Outlook 2022-23
COVID-19 relief – land tax
In response to the COVID-19 pandemic:
| • | A 25 per cent rebate on the 2020–21 land tax liability was available to eligible land owners that provided commensurate rent relief to COVID-19 impacted tenants, or that are unable to secure tenants due to COVID-19 |
| • | A 3-month deferral of 2020–21 land tax liability was automatically granted. |
Duties
Home concession
A concessional rate of duty applies to purchases of a principal place of residence. A one per cent concessional rate applies on dutiable values up to $350,000, rather than the normal schedule of rates between 1.5 per cent and 3.5 per cent. For properties valued over $350,000, the scheduled rates of transfer duty apply on the excess.
First home concession
Where a purchaser has not previously owned a residence in Queensland or elsewhere, the purchaser of a home receives a more generous concession on duty. This concession comprises a rebate in addition to the home concession on properties (this concession may not be applicable if the purchase price is less than the full market value of the property). The size of the rebate depends on the value of the property. A full concession is provided to purchases of a first principal place of residence valued up to $500,000, phasing out at $550,000.
First home vacant land concession
A first home concession is available for the purchase of certain vacant land up to the value of $400,000, with a full concession available on certain vacant land up to the value of $250,000.
Additional foreign acquirer duty exemption
An Australian-based foreign corporation or trust whose commercial activities involve significant development by adding to the supply of housing stock in Queensland, where such development is primarily residential, may be eligible for ex-gratia relief from the additional 7 per cent additional foreign acquirer duty.
Insurance duty
The benchmark tax base is assumed to be all premiums for general insurance policies (not for life insurance). The benchmark tax rate is 9 per cent.
227
Budget Strategy and Outlook 2022-23
Queensland Waste Levy
The Queensland Waste Levy is payable by landfill operators on waste disposed to landfill, except waste generated and disposed in the non-levy zone. The levy rate was $85 per tonne from July 2021 to June 2022 (higher for regulated wastes).
General levy exemptions exist for particular wastes, such as those from declared disasters and severe local weather events. Also, levy exemptions are available on application for other particular wastes, such as waste from charitable recycling organisations and community clean-up events.
Levy discounts of 50 per cent are available on application for residue wastes from particular recycling activities. 70 per cent of proceeds from the waste levy will be used for waste programs, environmental priorities and community purposes.
Gambling taxes
Gaming machine tax concessions for licensed clubs
The benchmark tax base is assumed to be all gaming machines operated by licensed clubs and hotels in Queensland. The benchmark tax rate is assumed to be the highest marginal tax rate (as is applied to hotels) that actually applied in each financial year.
A progressive tax rate scale applies to gaming machines operated by licensed clubs. The tax rate is calculated monthly on the gaming machine taxable metered win and the top tax rate is only applied to the portion of gaming machine revenue where the monthly metered win exceeds $1.4 million for any licensed club.
Casino tax concessions
The benchmark tax base is assumed to be all casinos operating in Queensland. The benchmark tax rate is assumed to be the highest tax rate that is actually applied in each financial year.
A tax rate of 20 per cent of gross revenue applies for standard transactions in the Brisbane and Gold Coast casinos. A concessional tax rate of 10 per cent applies for gross revenue from standard transactions in the Cairns and Townsville casinos. The tax rate applicable to gaming machines in casinos is 30 per cent of gross revenue in the Brisbane and Gold Coast casinos, and 20 per cent in the Cairns and Townsville casinos.
In addition, concessional rates of 10 per cent also apply for revenue from high rollers table game play in all casinos. A GST credit is provided to casinos that approximates a reduction in the above tax rates of 9.09 per cent.
228
Budget Strategy and Outlook 2022-23
Appendix C: Revenue and expense assumptions and sensitivity analysis
The 2022–23 Queensland Budget, similar to all other jurisdictions, is based in part on assumptions made about parameters, both internal and external to Queensland, which can impact directly on economic and fiscal forecasts.
The sensitivity of revenue and expense forecasts to movements in underlying assumptions is particularly relevant given the almost unprecedented uncertainty in global and national economic conditions and key economic parameters in the context of the COVID-19 pandemic, as well as other recent global and domestic developments that have impacted key revenues.
The forward estimates in the 2022–23 Queensland Budget are framed on a no-policy-change basis. That is, the expenditure and revenue policies in place at the time of the budget (including those announced in the budget) are applied consistently throughout the forward estimates period.
Table C.1 shows the main components of taxation and royalty revenue, and the forecast revenues for each component across the forward estimates.
| Table C.1 | Taxation and royalty revenue1 |
| 2020–21 | 2021–22 | 2022–23 | 2023–24 | 2024–25 | 2025–26 | |||||||||||||||||||
| Actual | Est. Act. | Budget | Projection | Projection | Projection | |||||||||||||||||||
| $ million | $ million | $ million | $ million | $ million | $ million | |||||||||||||||||||
Payroll tax | 4,166 | 4,957 | 5,242 | 5,766 | 6,022 | 6,289 | ||||||||||||||||||
Transfer duty | 3,954 | 6,028 | 4,722 | 4,442 | 4,757 | 5,233 | ||||||||||||||||||
Other duties | 1,788 | 1,966 | 1,989 | 2,074 | 2,162 | 2,249 | ||||||||||||||||||
Gambling taxes and levies | 1,586 | 1,589 | 1,646 | 1,752 | 1,810 | 1,879 | ||||||||||||||||||
Land tax | 1,524 | 1,603 | 1,773 | 2,019 | 2,268 | 2,365 | ||||||||||||||||||
Motor vehicle registration | 2,011 | 2,074 | 2,152 | 2,232 | 2,315 | 2,401 | ||||||||||||||||||
Other taxes | 1,220 | 1,283 | 1,318 | 1,416 | 1,450 | 1,489 | ||||||||||||||||||
Total taxation revenue | 16,249 | 19,500 | 18,842 | 19,700 | 20,785 | 21,905 | ||||||||||||||||||
Royalties | ||||||||||||||||||||||||
Coal | 1,740 | 7,290 | 5,480 | 3,297 | 3,539 | 3,699 | ||||||||||||||||||
Petroleum2 | 298 | 1,185 | 1,626 | 1,116 | 1,025 | 996 | ||||||||||||||||||
Other royalties3 | 499 | 483 | 538 | 505 | 488 | 494 | ||||||||||||||||||
Land rents | 126 | 176 | 190 | 193 | 198 | 203 | ||||||||||||||||||
Total royalties and land rents | 2,662 | 9,135 | 7,832 | 5,112 | 5,251 | 5,392 | ||||||||||||||||||
Notes:
| 1. | Numbers may not add due to rounding. |
| 2. | Includes liquefied natural gas (LNG). |
| 3. | Includes base and precious metal and other mineral royalties. |
229
Budget Strategy and Outlook 2022-23
The remainder of this chapter outlines the key assumptions, estimates and risks associated with key revenue and expenditure forecasts.
Taxation revenue assumptions and revenue risks
The rate of growth in tax revenues is dependent on a range of factors linked to the rate of growth in economic activity in the state. Some taxes are closely related to activity in specific sectors of the economy, whilst others are broadly related to the general rate of economic growth, employment, inflation or wages.
Therefore, any change in the level of economic activity compared with that reflected in the economic forecasts outlined in this paper, would impact a broad range of taxation receipts.
Wages and employment growth – payroll tax collections
Wages and employment growth have a direct impact on payroll tax collections. In 2022–23, wages in Queensland are forecast to increase by 31⁄2 per cent, while employment is forecast to rise 3 per cent in 2022–23.
The composition of the payroll tax base is also important as businesses in sectors such as tourism, retail and hospitality are often outside the tax base because they are below a threshold.
A one percentage point variation in either Queensland wages growth or employment would change payroll tax collections by approximately $52 million in 2022–23.
Transfer duty estimates
Transfer duty collections in 2022–23 are expected to decrease by 21.7 per cent compared with 2021–22 estimated actuals and by a further 5.9 per cent in 2023–24. This is primarily because turnover is expected to decline from the currently high levels.
After moderating in the near term, transfer duty from the non-residential sector is forecast to grow steadily over the forward estimates, supporting a return to overall transfer duty growth in 2024–25 and 2025–26.
A one percentage point variation in either the average value of property transactions or the volume of transactions would change transfer duty collections by approximately $47 million in 2022–23.
230
Budget Strategy and Outlook 2022-23
Royalty assumptions and revenue risks
Table C.2 below provides the 2022–23 Budget assumptions regarding coal royalties, which represent the bulk of Queensland’s royalty revenue.
| Table C.2 | Coal royalty assumptions |
| 2020–21 | 2021–22 | 2022–23 | 2023–24 | 2024–25 | 2025–26 | |||||||||||||||||||
| Actual | Est. Act. | Budget | Projection | Projection | Projection | |||||||||||||||||||
Tonnages—crown export1 coal (Mt) | 193 | 187 | 196 | 209 | 222 | 231 | ||||||||||||||||||
Exchange rate US$ per A$2 | 0.75 | 0.73 | 0.74 | 0.75 | 0.75 | 0.75 | ||||||||||||||||||
Year average coal prices (US$ per tonne)3 |
| |||||||||||||||||||||||
Hard coking | 117 | 364 | 206 | 160 | 160 | 160 | ||||||||||||||||||
Semi-soft | 95 | 252 | 148 | 123 | 123 | 123 | ||||||||||||||||||
Thermal | 69 | 140 | 128 | 90 | 90 | 90 | ||||||||||||||||||
Year average oil price | ||||||||||||||||||||||||
Brent (US$ per barrel)4 | 41 | 77 | 96 | 78 | 75 | 75 | ||||||||||||||||||
Notes:
| 1. | Excludes coal produced for domestic consumption and where royalties are not paid to the government (private royalties). The 2022–23 estimated domestic coal volume is approximately 24.4 Mt and private coal is 5.2 Mt. |
| 2. | Year-average. |
| 3. | Estimated year-average contract prices for highest quality coking and thermal coal. Lower quality coal can be sold below this price with indicative average prices for 2022–23 as follows: hard coking US$177/t and thermal US$118/t. |
| 4. | Published Brent oil prices are lagged by 4 months to better align with royalty revenue. |
Exchange rate and commodity prices and volumes
Estimates of mining royalties are sensitive to movements in the A$-US$ exchange rate and commodity prices and volumes.
Contracts for the supply of commodities are generally written in US dollars. Accordingly, a change in the exchange rate impacts on the Australian dollar price of commodities and, therefore, expected royalty collections.
Potential impact on coal royalty revenue1
For each one cent movement in the A$-US$ exchange rate in 2022–23, the impact on royalty revenue would be approximately $145 million.
A one per cent variation in export coking and thermal coal volumes would lead to a change in royalty revenue of approximately $54 million. A one million tonne (Mt) variation would lead to a change in royalty revenue of approximately $27 million.
A one per cent variation in the average price of export coal would lead to a change in royalty revenue of approximately $107 million.
| 1 | Sensitivities represent the estimated change to royalty revenue accruing over the 2022–23 return period. |
231
Budget Strategy and Outlook 2022-23
Parameters influencing Australian Government GST payments to Queensland
The 2022–23 Budget incorporates estimates of GST revenue grants to Queensland based on 2022–23 Federal Budget estimates of national GST collections and Queensland Treasury assumptions of Queensland’s share. The estimates of collections are primarily determined by the value of national consumption subject to GST.
Since the Australian Government payments are based on the amount actually collected, it is the Queensland Budget that bears the risks of fluctuations in GST collections. As with all other tax estimates, there is a risk of lower collections than estimated if national economic growth and consumption are weaker than expected.
Due to the complexities associated with the GST base, the information provided in the federal budget papers is insufficient to prepare indicative estimates of the sensitivity of GST forecasts to key variables.
Sensitivity of expenditure estimates and expenditure risks
Public sector wage costs
Salaries and wages form a large proportion of General Government Sector operating expenses. Increases in salaries and wages are negotiated through enterprise bargaining agreements.
The 2022–23 Budget and forward estimates reflect growth in full-time equivalent public sector employees and wage increases consistent with existing agreements, the government’s wages policy, and expectations of future bargaining agreements where outcomes are yet to be finalised. A one percentage point increase in wage rates above expectation would increase employee expenses by around $300 million per annum.
Interest rates
The General Government Sector has a total debt servicing cost forecast at $1.826 billion in 2022–23. The current average duration of General Government Sector borrowing with the Queensland Treasury Corporation (QTC) is 6.6 years. The majority of General Government Sector debt is held under fixed interest rates and, therefore, the impact of interest rate variations on debt servicing costs in 2022–23 would be relatively modest, with the impact occurring progressively across the forward estimates.
Actuarial estimates of superannuation and long service leave
Liabilities for superannuation and long service leave are estimated by the State Actuary with reference to, among other things, assumed rates of investment returns, salary growth, inflation and the discount rate. These liabilities are therefore subject to changes in these parameters. Similarly, the long service leave liabilities are subject to the risk that the actual rates of employee retention will vary from those assumed in the liability calculation.
232
Budget Strategy and Outlook 2022-23
Appendix D: Fiscal aggregates and indicators
| 2014–15 Actual1 $ million | 2015–16 Actual1 $ million | 2016–17 Actual1 $ million | 2017–18 Actual1 $ million | 2018–19 Actual1 $ million | 2019–20 Actual1 $ million | 2020–21 Actual1 $ million | 2021–22 Est. Act. $ million | 2022–23 Budget $ million | 2023–24 Projection $ million | 2024–25 Projection $ million | 2025-26 Projection $ million | |||||||||||||||||||||||||||||||||||||
General Government | ||||||||||||||||||||||||||||||||||||||||||||||||
Total revenue | 49,970 | 50,780 | 56,194 | 58,087 | 59,828 | 57,778 | 62,732 | 72,735 | 73,886 | 75,034 | 76,728 | 78,019 | ||||||||||||||||||||||||||||||||||||
Tax revenue | 12,598 | 12,547 | 12,919 | 13,244 | 14,165 | 14,585 | 16,249 | 19,500 | 18,842 | 19,700 | 20,785 | 21,905 | ||||||||||||||||||||||||||||||||||||
Total expenses | 49,551 | 50,112 | 53,369 | 56,337 | 58,843 | 63,505 | 63,669 | 70,820 | 74,915 | 76,116 | 76,591 | 77,836 | ||||||||||||||||||||||||||||||||||||
Employee expenses | 18,592 | 20,045 | 21,258 | 22,681 | 24,019 | 25,662 | 26,501 | 27,931 | 30,076 | 31,253 | 32,665 | 33,657 | ||||||||||||||||||||||||||||||||||||
Net operating balance | 420 | 668 | 2,825 | 1,750 | 985 | (5,728 | ) | (937 | ) | 1,915 | (1,029 | ) | (1,083 | ) | 137 | 183 | ||||||||||||||||||||||||||||||||
Capital purchases | 4,635 | 4,044 | 4,620 | 5,126 | 5,764 | 6,306 | 6,835 | 7,533 | 8,478 | 9,106 | 9,439 | 9,264 | ||||||||||||||||||||||||||||||||||||
Net capital purchases | 996 | 1,163 | 2,265 | 2,337 | 3,192 | 3,436 | 4,078 | 4,302 | 4,606 | 4,548 | 5,145 | 4,151 | ||||||||||||||||||||||||||||||||||||
Fiscal balance | (576 | ) | (495 | ) | 560 | (587 | ) | (2,207 | ) | (9,164 | ) | (5,015 | ) | (2,386 | ) | (5,635 | ) | (5,631 | ) | (5,008 | ) | (3,969 | ) | |||||||||||||||||||||||||
Borrowing with QTC | 41,343 | 34,200 | 31,358 | 29,256 | 29,468 | 37,570 | 46,153 | 50,451 | 58,853 | 66,415 | 73,338 | 80,622 | ||||||||||||||||||||||||||||||||||||
Leases and similar arrangements2 | 1,761 | 1,286 | 1,882 | 2,142 | 2,612 | 6,485 | 7,704 | 7,544 | 7,385 | 7,589 | 7,544 | 6,442 | ||||||||||||||||||||||||||||||||||||
Securities and derivatives | (0 | ) | (0 | ) | (0 | ) | 122 | 121 | 198 | 220 | 220 | 220 | 220 | 220 | 220 | |||||||||||||||||||||||||||||||||
Net debt | 5,749 | 654 | (355 | ) | (509 | ) | (198 | ) | 14,036 | 11,360 | 11,390 | 19,772 | 27,603 | 33,667 | 39,214 | |||||||||||||||||||||||||||||||||
Non-financial Public Sector | ||||||||||||||||||||||||||||||||||||||||||||||||
Total revenue | 56,178 | 57,393 | 64,855 | 66,164 | 68,329 | 66,171 | 71,228 | 82,027 | 82,066 | 83,600 | 85,572 | 87,161 | ||||||||||||||||||||||||||||||||||||
Capital purchases | 7,811 | 6,852 | 7,291 | 7,643 | 8,460 | 9,482 | 10,007 | 10,588 | 11,812 | 12,131 | 12,705 | 12,802 | ||||||||||||||||||||||||||||||||||||
Borrowing with QTC | 73,256 | 71,160 | 69,107 | 66,964 | 67,576 | 76,464 | 85,901 | 92,599 | 100,553 | 107,847 | 114,632 | 121,533 | ||||||||||||||||||||||||||||||||||||
Leases and similar arrangements2 | 1,802 | 1,316 | 1,882 | 2,142 | 2,612 | 6,977 | 8,158 | 7,898 | 7,711 | 8,076 | 7,975 | 6,812 | ||||||||||||||||||||||||||||||||||||
Securities and derivatives | 175 | 446 | 895 | 405 | 720 | 1,503 | 1,567 | 6,277 | 2,521 | 795 | 352 | 251 | ||||||||||||||||||||||||||||||||||||
Notes:
| 1. | With the implementation of the latest GFS Manual (AGFS15), some categories have been restated to ensure comparability. |
| 2. | Approximately $2.2 billion increase in General Government and $2.6 billion in NFPS in 2019-20 on adoption of the new lease accounting standard AASB 16. |
233
Budget Strategy and Outlook 2022-23
| 2014–15 | 2015–16 | 2016–17 | 2017–18 | 2018–19 | 2019–20 | 2020–21 | 2021–22 | 2022–23 | 2023–24 | 2024–25 | 2025-26 | |||||||||||||||||||||||||||||||||||||
| Actual1 | Actual1 | Actual1 | Actual1 | Actual1 | Actual1 | Actual1 | Est. Act. | Budget | Projection | Projection | Projection | |||||||||||||||||||||||||||||||||||||
| % | % | % | % | % | % | % | % | % | % | % | % | |||||||||||||||||||||||||||||||||||||
General Government | ||||||||||||||||||||||||||||||||||||||||||||||||
Revenue/GSP | 17.0 | 16.9 | 17.1 | 16.6 | 16.3 | 16.0 | 17.1 | 16.3 | 16.2 | 16.8 | 16.5 | 15.9 | ||||||||||||||||||||||||||||||||||||
Tax/GSP | 4.3 | 4.2 | 3.9 | 3.8 | 3.9 | 4.0 | 4.4 | 4.4 | 4.1 | 4.4 | 4.5 | 4.5 | ||||||||||||||||||||||||||||||||||||
Own source revenue/GSP | 9.0 | 9.0 | 8.8 | 8.6 | 8.6 | 8.3 | 8.1 | 8.8 | 8.5 | 8.3 | 8.3 | 8.0 | ||||||||||||||||||||||||||||||||||||
Expenses/GSP | 16.8 | 16.6 | 16.3 | 16.1 | 16.1 | 17.6 | 17.4 | 15.9 | 16.4 | 17.0 | 16.4 | 15.9 | ||||||||||||||||||||||||||||||||||||
Employee expenses/GSP | 6.3 | 6.7 | 6.5 | 6.5 | 6.6 | 7.1 | 7.2 | 6.3 | 6.6 | 7.0 | 7.0 | 6.9 | ||||||||||||||||||||||||||||||||||||
Net operating balance/GSP | 0.1 | 0.2 | 0.9 | 0.5 | 0.3 | (1.6 | ) | (0.3 | ) | 0.4 | (0.2 | ) | (0.2 | ) | 0.0 | 0.0 | ||||||||||||||||||||||||||||||||
Capital purchases/GSP | 1.6 | 1.3 | 1.4 | 1.5 | 1.6 | 1.7 | 1.9 | 1.7 | 1.9 | 2.0 | 2.0 | 1.9 | ||||||||||||||||||||||||||||||||||||
Net cash inflows from operating activities/net cash flows from investments in non-financial assets | 97.5 | 122.9 | 134.2 | 107.0 | 105.5 | (2.5 | ) | 3.3 | 118.0 | 18.5 | 26.9 | 44.1 | 49.9 | |||||||||||||||||||||||||||||||||||
Fiscal balance/GSP | (0.2 | ) | (0.2 | ) | 0.2 | (0.2 | ) | (0.6 | ) | (2.5 | ) | (1.4 | ) | (0.5 | ) | (1.2 | ) | (1.3 | ) | (1.1 | ) | (0.8 | ) | |||||||||||||||||||||||||
Total borrowings/GSP | 14.7 | 11.8 | 10.1 | 9.0 | 8.8 | 12.2 | 14.8 | 13.0 | 14.6 | 16.6 | 17.4 | 17.8 | ||||||||||||||||||||||||||||||||||||
Total Borrowings/revenue | 86.3 | 69.9 | 59.2 | 54.3 | 53.8 | 76.6 | 86.2 | 80.0 | 89.9 | 98.9 | 105.7 | 111.9 | ||||||||||||||||||||||||||||||||||||
Lease and other liabilities/revenue | 3.5 | 2.5 | 3.3 | 3.7 | 4.4 | 11.2 | 12.3 | 10.4 | 10.0 | 10.1 | 9.8 | 8.3 | ||||||||||||||||||||||||||||||||||||
Net debt/revenue | 11.5 | 1.3 | (0.6 | ) | (0.9 | ) | (0.3 | ) | 24.3 | 18.1 | 15.7 | 26.8 | 36.8 | 43.9 | 50.3 | |||||||||||||||||||||||||||||||||
Revenue growth | 7.0 | 1.6 | 10.7 | 3.4 | 3.0 | (3.4 | ) | 8.6 | 15.9 | 1.6 | 1.6 | 2.3 | 1.7 | |||||||||||||||||||||||||||||||||||
Tax growth | 6.4 | (0.4 | ) | 3.0 | 2.5 | 7.0 | 3.0 | 11.4 | 20.0 | (3.4 | ) | 4.6 | 5.5 | 5.4 | ||||||||||||||||||||||||||||||||||
Expenses growth | 7.2 | 1.1 | 6.5 | 5.6 | 4.4 | 7.9 | 0.3 | 11.2 | 5.8 | 1.6 | 0.6 | 1.6 | ||||||||||||||||||||||||||||||||||||
Employee expenses growth | 4.4 | 7.8 | 6.1 | 6.7 | 5.9 | 6.8 | 3.3 | 5.4 | 7.7 | 3.9 | 4.5 | 3.0 | ||||||||||||||||||||||||||||||||||||
Non-financial Public Sector | ||||||||||||||||||||||||||||||||||||||||||||||||
Capital purchases/GSP | 2.7 | 2.3 | 2.2 | 2.2 | 2.3 | 2.6 | 2.7 | 2.4 | 2.6 | 2.7 | 2.7 | 2.6 | ||||||||||||||||||||||||||||||||||||
Total borrowings/GSP | 25.6 | 24.2 | 21.9 | 19.9 | 19.4 | 23.5 | 26.1 | 23.9 | 24.3 | 26.1 | 26.4 | 26.3 | ||||||||||||||||||||||||||||||||||||
Total Borrowings/revenue | 133.9 | 127.1 | 110.8 | 105.1 | 103.8 | 128.4 | 134.3 | 130.2 | 135.0 | 139.6 | 143.7 | 147.5 | ||||||||||||||||||||||||||||||||||||
Net financial liabilities/revenue | 125.2 | 127.4 | 111.2 | 111.5 | 114.9 | 158.3 | 142.5 | 125.6 | 131.3 | 133.5 | 135.2 | 137.4 | ||||||||||||||||||||||||||||||||||||
Notes:
| 1. | With the implementation of the latest GFS Manual (AGFS15), some categories have been restated to ensure comparability. GSP figures reflect 2020-21 ABS National Accounts: State Accounts and Queensland Treasury forecasts. |
234
Queensland Budget 2022–23 Budget Strategy and Outlook Budget Paper No.2

Queensland Budget 2022–23
Budget Strategy and Outlook Budget Paper No.2
QUEENSLAND BUDGET 2022–23
CAPITAL STATEMENT
BUDGET PAPER NO. 3
2022–23 Queensland Budget Papers
1. Budget Speech
2. Budget Strategy and Outlook
3. Capital Statement
4. Budget Measures
Service Delivery Statements
Appropriation Bills
Budget Highlights
Regional Action Plans
© The State of Queensland (Queensland Treasury) 2022
Copyright
This publication is protected by the Copyright Act 1968
Licence
This document is licensed by the State of Queensland (Queensland Treasury) under a Creative Commons Attribution (CC BY 4.0) International licence.

In essence, you are free to copy, communicate and adapt this publication, as long as you attribute the work to the State of Queensland (Queensland Treasury). To view a copy of this licence, visit http://creativecommons.org/licenses/by/4.0/
Attribution
Content from this publication should be attributed to:
© The State of Queensland (Queensland Treasury)—2022–23 Queensland Budget
 Translating and interpreting assistance
The Queensland Government is committed to providing accessible services to Queenslanders from all cultural and linguistic backgrounds. If you have difficulty in understanding this publication, you can contact us on telephone (07) 3035 3503 and we will arrange an interpreter to effectively communicate the report to you.
Capital Statement
Budget Paper No. 3
ISSN 1445-4890 (Print)
ISSN 1445-4904 (Online)
Capital Statement 2022–23

State Budget
2022–23
Capital Statement
Budget Paper No. 3
Capital Statement 2022-23
Contents | ||||||
1 | Approach and highlights | 1 | ||||
| Features | 1 | |||||
1.1 | Introduction | 3 | ||||
1.2 | Queensland’s infrastructure frameworks | 4 | ||||
1.3 | Key capital projects and programs | 6 | ||||
2 | 2022–23 Capital program overview | 17 | ||||
2.1 | Introduction | 17 | ||||
2.2 | Capital purchases | 18 | ||||
2.3 | Capital grants | 22 | ||||
3 | Capital outlays by entity | 26 | ||||
3.1 | Agriculture and Fisheries | 26 | ||||
3.2 | Children, Youth Justice and Multicultural Affairs | 29 | ||||
3.3 | Communities, Housing and Digital Economy | 31 | ||||
3.4 | Education | 38 | ||||
3.5 | Employment, Small Business and Training | 50 | ||||
3.6 | Energy and Public Works | 53 | ||||
3.7 | Environment and Science | 62 | ||||
3.8 | Justice and Attorney-General | 66 | ||||
3.9 | Legislative Assembly of Queensland | 68 | ||||
3.10 | Premier and Cabinet | 69 | ||||
3.11 | Queensland Corrective Services | 71 | ||||
3.12 | Queensland Fire and Emergency Services | 73 | ||||
3.13 | Queensland Health | 77 | ||||
3.14 | Queensland Police Service | 88 | ||||
3.15 | Queensland Treasury | 91 | ||||
3.16 | Regional Development, Manufacturing and Water | 92 | ||||
Capital Statement 2022-23
3.17 | Resources | 99 | ||||
3.18 | Seniors, Disability Services and Aboriginal and Torres Strait Islander Partnerships | 100 | ||||
3.19 | State Development, Infrastructure, Local Government and Planning | 102 | ||||
3.20 | Tourism, Innovation and Sport | 108 | ||||
3.21 | Transport and Main Roads | 111 |
Appendix A: | Entities included in capital outlays 2022–23 | 136 | ||||
Appendix B: | Key concepts and coverage | 139 | ||||
Appendix C: | Capital purchases by entity by region 2022–23 | 140 |
Capital Statement 2022-23
| 1 | Approach and highlights |
Features
| • | The Queensland Government is committed to investing in productivity-enhancing economic and social infrastructure to ensure the state’s ongoing economic recovery from COVID-19 and enable the successful delivery of the Brisbane 2032 Olympic and Paralympic Games. This investment will harness the state’s natural endowments and productive capacity to drive sustainable economic growth, creating good jobs, better services and a great lifestyle for Queenslanders. |
| • | The 2022–23 Queensland Budget puts the health of Queenslanders first, delivering a $9.785 billion capital boost over 6 years to significantly expand health system capacity across the state and deliver around 2,200 additional overnight beds at 15 facilities. |
| • | This Budget continues to deliver on the Queensland Government’s $50 billion Infrastructure Guarantee, with total commitments of $59.126 billion over 4 years. These investments will improve regional connectivity and access to essential services, such as health care and education. Over the 11 years to 2025–26, the government will have supported over $138 billion in infrastructure works. |
| • | In 2022–23, the government will invest $15.510 billion in capital, directly supporting around 48,000 jobs. $9.824 billion, or 63.3 per cent, of this capital program will be invested outside of the Greater Brisbane region, supporting around 31,100 jobs. |
| • | Capital expenditure on transport infrastructure will total $7.309 billion in 2022–23. This includes $1.290 billion to continue construction work on Cross River Rail, $270.2 million to commence Stage 3 of Gold Coast Light Rail, and substantial ongoing investment to fund major upgrades to the M1 Pacific Motorway, the Bruce Highway and the rail network through the Logan and Gold Coast Faster Rail project. |
| • | The government will invest $1.555 billion in 2022–23 to support students and teachers, and to ensure that Queensland’s state schools and training assets are world-class and continue to meet demand. Investment in new schools is being facilitated through the $3 billion Building Future Schools Program. Existing schools will also receive new and upgraded infrastructure to address growing enrolments and renewal needs, building on the government’s $1 billion Great Schools, Great Future commitment. |
| • | The Queensland Government is continuing to secure the state’s energy future through investment in renewable energy, including through Powerlink’s $170 million agreement with Acciona and CleanCo to connect the MacIntyre Wind Farm in the Darling Downs to the electricity grid, $192.5 million for Stanwell to acquire a 50 per cent equity stake in the Wambo Wind Farm near Dalby and $28.9 million for CS Energy’s Kogan Renewable Hydrogen Project near Chinchilla, including $15 million for the demonstration plant. |
1
Capital Statement 2022-23
| • | Through state owned businesses Seqwater and Sunwater, the Queensland Government is delivering additional water supply where it is needed, fortifying the flood resilience of water infrastructure and ensuring the ongoing safety and reliability of dams. This includes continued construction of the $367.2 million Rookwood Weir, the $125.4 million Mount Crosby Flood Resilience Program and $95.2 million South West Pipeline project, as well as delivery of the Toowoomba to Warwick Pipeline estimated at more than $300 million. $54.2 million will also be invested in 2022–23 for planning and early works on improvements to Paradise, Burdekin Falls, Somerset and Lake Macdonald Dams. |
| • | The Queensland Government is backing the largest concentrated investment in social housing in Queensland’s history, with $1.908 billion in funding over 4 years under the Housing and Homelessness Action Plan 2021–2025. As part of this investment, the government is committing $441.3 million in 2022–23 for the delivery of new social homes and upgrades of existing dwellings for vulnerable Queenslanders. |
| • | A key element of the government’s capital program is providing grants to local governments and non-government organisations to support their work within communities across Queensland. In total, the government will provide $2.862 billion in capital grants in 2022–23, including $2.131 billion outside of the Greater Brisbane region. This includes more than $700 million to support the Queensland Government program of infrastructure renewal and recovery within disaster-affected communities. |
2
Capital Statement 2022-23
| 1.1 | Introduction |
The Capital Statement presents an overview of the Queensland Government’s infrastructure delivery program and proposed capital outlays for 2022–23.
The 2022–23 capital program will leverage opportunities to improve the liveability of our cities and regions and build a strong, sustainable and resilient Queensland. This includes a record investment in health infrastructure over the next 6 years, along with major investments in transport; justice and public safety; energy; education; arts, culture, recreation and tourism; water; as well as social and affordable housing.
Key programs such as Works for Queensland and Building our Regions will continue to provide additional benefits to regional Queensland through direct funding for infrastructure and maintenance programs.
The $15.510 billion of investment outlined in the 2022–23 Capital Statement is estimated to directly support around 48,000 jobs, with 31,100 of these jobs located outside of the Greater Brisbane region.
Maintaining a strong capital program ensures Queensland’s continued economic recovery, supporting good jobs, better services and a great lifestyle for Queenslanders.
3
Capital Statement 2022-23
| 1.2 | Queensland’s infrastructure frameworks |
The Queensland Government’s infrastructure frameworks focus on achieving robust capital planning, quality investment decisions and regional economic development.
In 2022–23, the capital program is being delivered in an economy that is emerging from the impacts of COVID-19, with the challenges of supply-chain disruption and heightened competition for materials and labour. The Queensland Government’s infrastructure frameworks will be critical to ensuring the development of a sustainable capital program that will support the state’s economic development, set the groundwork for future investments ahead of the Brisbane 2032 Olympic and Paralympic Games, and deliver necessary infrastructure to meet growing population needs.
State Infrastructure Strategy
The State Infrastructure Strategy (SIS) sets the statewide priorities for infrastructure, providing a framework for how the Queensland Government will plan and invest in infrastructure over the next 20 years. These statewide priorities will underpin portfolio and regional infrastructure planning. Developed with infrastructure providers and informed by industry and the community, this strategy aligns priorities across agencies while also seeking partnerships with other levels of government and the private sector. This strategy supports Queensland’s economic recovery over the longer-term, aligning with the Queensland Government’s COVID-19 Economic Recovery Plan.
State-significant priorities are profiled across 10 infrastructure classes, such as transport, energy and health, and a cross-government class that features cross-sectorial priorities. These priorities were developed in partnership with infrastructure providers, focusing on the goals of realising infrastructure opportunities and addressing challenges that Queensland will face into the future.
Regional Infrastructure Plans
Queensland is a diverse state and its different regions have different priorities. Supporting the SIS, the introduction of 7 Regional Infrastructure Plans (RIPs) recognises the significant role infrastructure plays in catalysing regional economic resilience and recovery, growth and liveability. Drawing on the SIS’s priorities, and complementing statutory regional plans, these plans are being developed in consultation with regional stakeholders (industry, peak bodies and local government) through a place-based approach to help prioritise regionally significant infrastructure needs.
The Queensland Government Infrastructure Pipeline
The Queensland Government Infrastructure Pipeline (QGIP) provides industry with visibility of the government’s infrastructure pipeline, creating confidence and enabling workforce planning. QGIP complements the SIS and RIPs and demonstrates the government’s commitment to delivering Queensland’s infrastructure needs.
4
Capital Statement 2022-23
Infrastructure Proposal Development Policy
The Infrastructure Proposal Development Policy (IPDP) sets the government’s objectives for planning and assessing major infrastructure, including:
| • | aligning agency infrastructure programs with whole-of-government objectives to maximise outcomes for the state |
| • | supporting agencies to mature their infrastructure planning and assessment capabilities |
| • | providing targeted assistance and assurance advice to agencies on major infrastructure proposal development |
| • | ensuring frameworks and systems are in place and applied to give government confidence in infrastructure investment decisions. |
Project Assessment Framework
The Project Assessment Framework (PAF) is used across the Queensland Government to ensure a common and rigorous approach to assessing projects at critical stages in their development lifecycle.
The PAF is administered by Queensland Treasury and applied by government departments to evaluate proposals for infrastructure projects and the procurement of goods and services. The PAF may also be used by other government entities when developing and implementing project assessment methodologies.
Business Case Development Framework
The Business Case Development Framework (BCDF) supports the implementation of the PAF by providing agencies with detailed guidance and tools to complete assessment and assurance of infrastructure proposals. The BCDF informs the development of proposals from early assessment stages through to the detailed business case stage; it is scalable and can be applied to all infrastructure proposals.
The BCDF ensures that major infrastructure proposals are thoroughly assessed to provide a firm basis for government investment decisions. The BCDF guidance materials and templates are published and maintained by the Department of State Development, Infrastructure, Local Government and Planning.
5
Capital Statement 2022-23
| 1.3 | Key capital projects and programs |
Queensland Health Capacity Expansion Program
As Queensland’s population expands, so does the demand on the health system. The Queensland Government is providing a significant capital boost of $9.785 billion over 6 years to deliver around 2,200 additional overnight beds at 15 facilities across the Queensland health system:
| • | Cairns Hospital expansion |
| • | New Toowoomba Hospital |
| • | New Coomera Hospital |
| • | Robina Hospital expansion |
| • | Mackay Hospital expansion |
| • | Princess Alexandra Hospital expansion |
| • | Further Logan Hospital expansion |
| • | QEII Hospital expansion |
| • | New Queensland Cancer Centre |
| • | The Prince Charles Hospital expansion |
| • | Redcliffe Hospital expansion |
| • | Townsville University Hospital expansion |
| • | Ipswich Hospital expansion |
| • | New hospital in Bundaberg |
| • | Hervey Bay Hospital expansion |
Accelerated Infrastructure Delivery Program
Queensland Health will also allocate $229.7 million over 2 years from the Sustaining Capital Program to immediately increase bed capacity across Queensland. The Accelerated Infrastructure Delivery Program will use off-site construction and standard designs to reduce time to commissioning, with 289 overnight beds across 7 projects to be delivered within the next 2 years.
Satellite Hospitals: Better Care, Closer to Home
The government is also providing $280 million in funding to deliver Satellite Hospitals in Bribie Island, Caboolture, Eight Mile Plains (Brisbane South), Kallangur (Pine Rivers), Tugun (Gold Coast), Ripley (Ipswich) and Redlands.
6
Capital Statement 2022-23
The Satellite Hospitals Program will assist acute hospitals in South East Queensland to manage demand and free up capacity while continuing to safely manage patients via alternative models of care. The satellite hospitals will also provide virtual health opportunities including a range of rapid access consultations, care co-ordination, remote monitoring, and patient literacy services.
Delivery of all 7 sites is underway.
Regional, rural and remote health infrastructure
To ensure Queenslanders continue to receive world-class health care no matter where they live, Queensland Health continues to invest in health infrastructure, capital works and projects across regional, rural and remote Queensland under the Queensland Health Capacity Expansion Program and Building Rural and Remote Program. Investments under these programs will create additional beds in regional areas and replace infrastructure to ensure new ways of working and models of care can be delivered right across Queensland.
| • | For the Mackay Hospital and Health Service, the replacement of the Moranbah Hospital will commence during 2022–23. Funding has also been allocated for expansion of the Mackay Hospital. |
| • | For the Torres and Cape and North West Hospital and Health Services, replacement of the Bamaga and Normanton Hospitals and Pormpuraaw Primary Health Care Centre will commence in 2022–23. |
| • | For Cairns and Hinterland Hospital and Health Service, replacement of the Cow Bay Primary Health Care Centre will commence in 2022–23. Funding has also been allocated for the Cairns Hospital expansion. |
| • | For Townsville Hospital and Health Service, funding has been allocated for the Townsville University Hospital expansion. |
| • | For the Wide Bay Hospital and Health Service, early works for the new Bundaberg Hospital and expansion of the Hervey Bay Hospital will commence during 2022–23. |
| • | For the Darling Downs Hospital and Health Service, work to replace the Tara Hospital will commence during 2022–23. Funding has been allocated for the new Toowoomba Hospital and redevelopment of the Toowoomba Ambulance Station and Operations Centre. |
Cross River Rail
Cross River Rail, which is funded via a capital contribution of $5.389 billion along with financing of $1.499 billion secured through a public private partnership, is the largest transport project ever undertaken in Queensland.
This transformative transport project involves a new 10.2 kilometre rail line from Dutton Park to Bowen Hills, 5.9 kilometres of twin tunnels under the Brisbane River and CBD, 4 new high -capacity underground stations (at Boggo Road, Woolloongabba, Albert Street and Roma Street), 8 rebuilt above-ground stations (at Salisbury, Rocklea, Moorooka, Yeerongpilly, Yeronga, Fairfield, Dutton Park and Exhibition), and 3 new stations on the Gold Coast.
The project will also support the introduction of a new world-class signalling system, the European Train Control System (ETCS), which will allow trains to operate closer together, enabling trains to run more efficiently and with greater safety.
7
Capital Statement 2022-23
The Cross River Rail project is being delivered in partnership with the private sector through 3 major infrastructure packages of work: Tunnel, Stations and Development (TSD) with Pulse Consortium through a public private partnership; Rail, Integration and Systems (RIS) through an alliance model with Unity Alliance; and the ETCS package through an alliance model with Hitachi Rail.
Each of Cross River Rail’s high-capacity stations will generate unique opportunities for urban renewal, economic development, inner-city precinct revitalisation and new employment.
Cross River Rail is into its third year of major construction, with work underway at 15 worksites across South East Queensland.
Cross River Rail is estimated to support up to 7,700 full-time equivalent jobs and 450 new apprenticeship and traineeship opportunities during construction.
Queensland Transport and Roads Investment Program
The Queensland Transport and Roads Investment Program (QTRIP) is a 4-year program released annually outlining current and planned investments in transport infrastructure. QTRIP spans road, rail, bus, cycling and marine infrastructure on freight, commuter and recreational networks. QTRIP includes works for the Department of Transport and Main Roads, Queensland Rail and the Gold Coast Waterways Authority.
The program of works detailed in QTRIP represents a $29.7 billion1 investment over the 4 years from 2022–23 to 2025–26. QTRIP is developed in accordance with funding allocations identified by the Queensland Government and Australian Government in their annual budgets, which align to both governments’ policy objectives and agendas.
The strategic intent of QTRIP is shaped by state infrastructure planning processes and specific transport strategies and plans developed in accordance with state legislation.
M1 Pacific Motorway upgrades and Coomera Connector
A safe, efficient and reliable M1 Pacific Motorway plays an important role in driving productivity and competitiveness across South East Queensland. The program of works, jointly funded by the Queensland and Australian Governments, is delivering major projects, such as the Varsity Lakes to Tugun upgrade, Eight Mile Plains to Daisy Hill upgrade, and the Yatala South (Exit 41) and Pimpama (Exit 49) interchange upgrades. The Queensland and Australian Governments have also committed $1 billion to upgrades between Daisy Hill and the Logan Motorway. The M1 program of works is complemented by the Queensland Government and Australian Government commitment of $2.163 billion (on a 50:50 basis) to plan and construct Coomera Connector Stage 1 (Second M1) between Coomera and Nerang. Coomera Connector (Stage 1) will provide an alternative route for the growing communities and commercial hubs of Helensvale and Coomera.
| 1 | Total QTRIP investment is inclusive of both non-capital and capital components. |
8
Capital Statement 2022-23
Bruce Highway upgrades
The Bruce Highway is Queensland’s major north-south freight and commuter corridor, connecting coastal population centres from Brisbane to Cairns over almost 1,700 kilometres. The Queensland Government will continue to work with the Australian Government to deliver the Bruce Highway Upgrade Program, aimed at improving safety, flood resilience and capacity along the length of the highway.
The 2022–23 capital program includes investment in several key projects on the Bruce Highway, improving safety and access and supporting jobs across the regions, including:
| • | $1.065 billion to plan, preserve and construct the Rockhampton Ring Road |
| • | $1 billion to construct Cooroy to Curra (Section D) |
| • | $662.5 million to upgrade the highway from 4 to 6 lanes between Caboolture-Bribie Island Road and Steve Irwin Way |
| • | $500 million funding injection for the Bruce Highway, noting the Queensland Government’s priority for upgrades between Mackay and Proserpine, and between Gladstone and Rockhampton |
| • | $481 million to duplicate the highway from 2 to 4 lanes as part of the Cairns Southern Access Corridor (Stage 3), from Collinson Creek in Edmonton to the Wrights Creek area near Gordonvale |
| • | $350 million for the Mackay Port Access upgrade, to improve access to the Port of Mackay while addressing urban congestion in North Mackay |
| • | $336 million to increase the flood immunity, safety and efficiency of the Bruce Highway and future-proof the road to cater for growing traffic volumes at Tiaro. |
Gold Coast Light Rail (Stage 3)
The Australian Government ($395.6 million contribution), Queensland Government ($713.3 million contribution) and City of Gold Coast ($110.1 million contribution) are co-funding the project, with a total project cost of $1.219 billion.
Stage 3 of Gold Coast Light Rail will connect to the existing Gold Coast Light Rail network (from Helensvale to Broadbeach South), delivering a 6.7-kilometre extension from Broadbeach South to Burleigh Heads and providing 8 additional stations.
Logan and Gold Coast Faster Rail (Kuraby to Beenleigh) upgrade
The Queensland Government and Australian Government have committed a total of $2.598 billion (on a 50:50 basis) for the Logan and Gold Coast Faster Rail (Kuraby to Beenleigh) upgrade.
South East Queensland has experienced significant growth over the last 2 decades. This growth is expected to continue with an extra 1.2 million people living in the region by 2036. To harness this growth and support our region’s thriving communities, the rail network must keep evolving so that it plays a bigger role in moving people around South East Queensland.
9
Capital Statement 2022-23
To support growing population and rail patronage demand between Brisbane, Logan and the Gold Coast, the number of Beenleigh and Gold Coast train services needs to be doubled over the next 20 years. The rail line between Kuraby and Beenleigh is a key capacity bottleneck on the rail corridor.
The Queensland Government, together with the Australian Government, is planning to increase the number of tracks between Kuraby and Beenleigh from 2 to 4 tracks, with modernised rail systems, station upgrades and level crossing removals. Currently, trains between Kuraby and Beenleigh share a single track in each direction, limiting the number of peak services that can run. All-stop Beenleigh trains currently need to be held to one side for about 4 minutes to allow Gold Coast express trains to pass through during peak periods.
Beerburrum to Nambour Rail Upgrade (Stage 1)
The Queensland Government and Australian Government have committed a total of $550.8 million (on a 30:70 basis) to deliver stage 1 of the Beerburrum to Nambour Rail Upgrade (B2N).
The B2N project covers about 40 kilometres of the North Coast Line and will provide additional track capacity and reliability, creating travel time savings and increasing passenger and freight services to the growing Sunshine Coast region.
Queensland Train Manufacturing Program (formerly Rollingstock Expansion Project)
To provide for expected increases in rail patronage over the next 10 years, the existing passenger fleet must expand to deliver extra services. The Queensland Government has committed $7.1 billion for the Queensland Train Manufacturing Program to build 65 new 6-car passenger trains at a purpose-built manufacturing facility at Torbanlea in the Maryborough region, subject to the outcomes of the competitive procurement process.
Smart Ticketing System (formerly New Public Transport Ticketing System)
The Queensland Government has committed $371.1 million for a new public transport ticketing system that will be delivered across public transport networks. The system will add new customer facing functionality, including payment by contactless debit and credit cards, mobile phones and wearables, in addition to go card and paper tickets.
Building Future Schools
Through the $3 billion Building Future Schools Program, the government is delivering new state schools in high-growth areas across Queensland, including 16 new schools which opened between 2020 and 2022. This Budget includes funding for 4 new schools to open in 2025 (primary schools in Caboolture West, Caloundra South, Ripley and the Greater Flagstone area) and one new school to open in 2026 (a primary school in Bahrs Scrub).
This Budget also includes increased funding to provide for new and upgraded infrastructure in existing schools, to address growing enrolments and renewal needs, building on the government’s $1 billion Great Schools, Great Future infrastructure commitment.
10
Capital Statement 2022-23
Housing and Homelessness Action Plan
The government is delivering the second year of its 4-year $1.908 billion investment as part of the Housing and Homelessness Action Plan 2021–25 under the Queensland Housing Strategy 2017–2027 to boost housing supply and increase housing and homelessness support across Queensland. This is supported by returns from the $1 billion Housing Investment Fund, a long-term fund with returns to drive new supply to support current and future social and affordable housing needs.
Under the Action Plan, the government will deliver 7,400 new dwelling commencements across Queensland, with the first 727 new dwellings expected to be commenced by 30 June 2022. The 2022–23 Budget includes $441.3 million in 2022–23 for the delivery of new social homes and upgrades to existing dwellings for vulnerable Queenslanders.
Government Employee Housing
In 2022–23, the government will invest $122.2 million to deliver safe and secure government employee housing, including in remote and regional communities, as part of its commitment to attract and retain key frontline staff. This program will include new accommodation for staff delivering critical services, replacement or refurbishment of residences at the end of their useful life to modern design standards and the upgrade of residences to ensure they remain fit -for -purpose and appropriate for employees.
Building our Regions
The Building our Regions program continues to support local government infrastructure projects in regional and remote Queensland communities. These projects, spanning the width and breadth of the state, provide much needed infrastructure that creates flow-on economic development opportunities, improved liveability and jobs for Queenslanders.
To date the program, delivered by the Department of State Development, Infrastructure, Local Government and Planning through Rounds 1–5, has approved over $348 million towards 271 projects across 67 local governments, supporting an estimated 2,770 jobs. This has leveraged further financial co-contributions of over $539.3 million from local governments, the Australian Government, and other organisations, with a total capital expenditure value of $887.6 million.
$70 million is available under Round 6, bringing the total to $418 million for the whole program. This round focuses on improving water supply and sewerage systems in local communities and is being delivered by the Department of Regional Development, Manufacturing and Water. In 2021–22, the Department of Regional Development, Manufacturing and Water approved 35 planning projects totalling $8.3 million, with a total capital expenditure of $9.4 million. Further construction projects under Round 6 are expected to be approved in 2022–23.
Works for Queensland
The $1 billion Works for Queensland program will continue to support local governments outside South East Queensland by funding job-creating maintenance and minor infrastructure projects relating to assets owned or controlled by local governments.
In 2022–23, $88.2 million will be delivered towards Works for Queensland projects. As at 31 March 2022, councils estimated more than 22,200 jobs have been supported by the first 4 rounds of the program.
11
Capital Statement 2022-23
Disaster Resilience Program
As one of the most disaster impacted states in Australia, it is imperative to help local Queensland communities better prepare for future natural disasters. Increasing the resilience of infrastructure and investing in innovative programs to lessen the impacts of natural disasters means that communities can recover more quickly after a natural disaster strikes.
The Queensland Resilience and Risk Reduction Fund, jointly funded with the Australian Government as part of the National Partnership Agreement, will allocate $65.5 million over 5 years to improve safety and disaster resilience across the state. The fund will be administered by the Queensland Reconstruction Authority, with $13.1 million to be delivered in 2022–23 to support disaster mitigation projects and build resilience to natural disasters.
The $10 million North Queensland Natural Disaster Mitigation Program, which is aimed at reducing disaster risk in cyclone prone, coastal areas, will commence delivery in 2022–23.
The Queensland Reconstruction Authority will also continue to administer targeted measures aimed at promoting disaster recovery and resilience including a suite of programs funded through the Australian Government’s Emergency Response Fund, which includes the National Flood Mitigation Infrastructure Program (Round 1 $9.9 million) and $75 million allocated for flood recovery and resilience after the 2022 South East Queensland floods. The Australian Government’s recovery and resilience grants from the 2019 Monsoon Trough Floods and the 2022 South East Queensland floods will also be administered.
Southern Queensland Correctional Precinct (Stage 2)
Construction of the new 1,500 bed facility commenced in early 2021, with construction of the main buildings currently underway. Construction of the prisoner accommodation and administration buildings will continue during 2022–23.
The project will provide significant economic flow on benefits to the Lockyer Valley region, including approximately 450 short-term construction-based employment opportunities, ongoing support of both existing and new industry jobs in the operational phase and potential ongoing supply chain opportunities for local businesses.
This new facility will implement a health and rehabilitation operating model, which will help to address complex prisoner needs such as mental health and substance abuse. It will also ease overcrowding across Queensland’s correctional services system and deliver a safer environment for staff, prisoners and the community.
Domestic and family violence courthouse improvements
In response to the Queensland Women’s Safety and Justice Taskforce, Hear her voice - Report one - Addressing coercive control and domestic and family violence in Queensland, the Queensland Government is committing to a range of domestic and family violence (DFV) courthouse capital upgrades to support enhanced delivery of DFV services at selected locations. These capital improvements to existing courthouse infrastructure will make facilities functional, client-centred and trauma-informed, and support the safety of victims of domestic and family violence attending court.
This includes $49.1 million over 4 years to complete DFV capital upgrades to Mackay, Ipswich, Cairns, Caboolture, Maroochydore, Toowoomba, Rockhampton and Brisbane courthouses, including new DFV courtrooms and safe rooms, reconfigured registry counters, public waiting
12
Capital Statement 2022-23
areas and interview rooms, improved stakeholder facilities, public amenities and security infrastructure, to maximise victim safety.
MacIntyre Wind Precinct
Construction of the MacIntyre Wind Precinct in the Darling Downs has commenced, and it will be Australia’s largest wind farm once completed in 2024.
The Precinct includes the 102.6-megawatt Karara Wind Farm which will be built, owned and operated by Queensland’s publicly owned renewable generator, CleanCo. As well as owning and operating the Karara Wind Farm, CleanCo will purchase 400 megawatts of renewable energy capacity from Acciona’s neighbouring 923.4-megawatt MacIntyre Wind Farm.
Works have also started to connect the Precinct to the electricity grid, with Queensland’s publicly owned transmission company, Powerlink, signing a $170 million agreement with Acciona and CleanCo to build 65 kilometres of new transmission line and 2 new switching stations.
Leveraging more than $2 billion in total new investment in Queensland, these projects will anchor Queensland’s Southern Renewable Energy Zone and create up to 620 construction jobs.
Wambo Wind Farm
Stanwell is developing the 252-megawatt Wambo Wind Farm near Dalby in partnership with global renewables developer, Cubico.
Consistent with our commitment to public ownership of generation assets in Queensland, Stanwell will acquire a 50 per cent equity stake in the wind farm. Stanwell has been allocated $192.5 million from the $2 billion Queensland Renewable Energy and Hydrogen Jobs Fund to fund this equity stake.
The Wambo Wind Farm will create more than 200 jobs during construction and 8 ongoing jobs. Construction is expected to commence in 2022, with the wind farm operational in 2024. With the MacIntyre Wind Precinct, these types of renewable energy projects will underpin Queensland’s pathway to 50 per cent renewables by 2030.
Kogan Renewable Hydrogen Project
CS Energy is demonstrating the production of renewable hydrogen and application to heavy transport industry through its Kogan Renewable Hydrogen Project, near Chinchilla on the Western Downs.
This project is being funded by an allocation from the $2 billion Queensland Renewable Energy and Hydrogen Jobs Fund, with the demonstration project expected to create 20 jobs during construction and produce 50,000 kilograms of renewable hydrogen each year once operational in 2023.
CS Energy recently appointed IHI Engineering Australia (a subsidiary of IHI Corporation, Japan) to construct the Kogan Renewable Hydrogen Project, further demonstrating the strong international partnerships that our energy government owned corporations are developing as Queensland continues on its path to becoming a renewable energy and hydrogen leader.
13
Capital Statement 2022-23
Port of Townsville Channel Capacity Upgrade
Delivery of the Townsville Channel Capacity Upgrade (TCCU), which commenced in early 2019, is ongoing with the dredging of the Platypus channel beginning on 15 March 2022. The TCCU, the largest infrastructure project in the port’s history, will widen the shipping channel to allow access for larger vessels and facilitate future trade growth in the region.
The TCCU project is jointly funded by the Queensland and Australian Governments and the Port of Townsville Limited (POTL), and forms part of the Townsville City Deal signed in December 2016. The total project cost of the TCCU project is $232 million with the Queensland Government contributing $105 million, the Australian Government committing $75 million and POTL funding the remainder.
The TCCU project will continue to support the local economy and jobs, with more than 1,500 people having worked on the project to date.
Port of Gladstone - Shiploader 1 Upgrade
The Queensland Government owned Gladstone Ports Corporation Limited (GPC) will invest $63.9 million to replace Shiploader 1, one of three shiploaders used to load bulk cargo onto seaborne vessels at the RG Tanna coal terminal at the Port of Gladstone.
The replacement shiploader, which secures the capacity of the terminal for another 25 years, will be built locally in Gladstone before being transferred a short distance to its new home for operation at the terminal.
A construction contract has been awarded and will include decommissioning of the old shiploader in a safe and sustainable manner. Design activities commenced in March 2022, with the replacement shiploader anticipated to be operational by around May 2024.
The project is estimated to create more than 200 local jobs which will benefit the region, including approximately 84 jobs in Gladstone. These jobs include boilermakers, riggers and scaffolders, painters, fitters, electricians and engineers. An estimated 60 per cent of the project spend will be in Queensland with the majority being spent in the Gladstone region.
Cairns Marine Precinct
The government owned corporation, Far North Queensland Ports Corporation Limited, is progressing the $32 million Cairns Marine Precinct early works, for infrastructure upgrades including the delivery of 2 new wharves at the Port of Cairns.
Further to this investment, the Queensland Government has committed $150 million to an expansion of the Cairns Marine Precinct with the development of a Common User Facility. The proposed Common User Facility will include a 5,000 tonne shiplift, 3 hardstand areas, 2 blast and paint sheds and a wet berth to cater for vessels up to 120 metres in length. The Queensland Government will now seek a cost sharing arrangement with the Australian Government.
These investments will help diversify the Cairns economy and take advantage of emerging commercial and defence-related opportunities for the precinct as an Australian Navy Regional Maintenance Centre. This will ensure that the Port of Cairns continues to be the leading maintenance, repair and overhaul facility in Northern Australia.
14
Capital Statement 2022-23
Haughton Pipeline (Stage 2)
The Queensland Government will contribute $195 million to the Townsville City Council for Stage 2 of the Haughton Pipeline, which will connect to earlier stages of the project and ultimately improve water security for the region.
Rookwood Weir
Construction of Rookwood Weir on the Fitzroy River is well underway, with the first water from the weir to be available in 2023, weather permitting. The project will add up to 86,000 megalitres of supply to Central Queensland.
The Queensland Government is investing $183.6 million, with the Australian Government co-funding the project under the National Water Grid Fund. The weir will provide for significant agricultural growth along the Fitzroy River near Rockhampton and enhance the security of urban and industrial water supplies for Gladstone and Capricorn Coast communities.
To date, the project has supported over 100 regional jobs through essential road and bridge upgrades, and the construction of the weir itself will support a further 200 jobs including 140 locally sourced contractors, with apprentices and trainees accounting for around 15 per cent of total construction hours.
Dam Improvement Program
To ensure state owned dams continue to operate safely during extreme weather events, both Sunwater and Seqwater are delivering significant investment through the Dam Improvement Program (DIP).
$54.2 million is budgeted in 2022–23 to continue planning for DIP projects including Paradise, Burdekin Falls, Somerset and Lake Macdonald Dams, which will deliver significant investment into the Queensland economy and support jobs.
The Burdekin Falls Dam improvement project also includes an assessment of the feasibility of raising the dam to support economic growth and long-term water security in North Queensland.
The Queensland Government is rebuilding Paradise Dam through the Paradise Dam improvement project. This is a $1.2 billion investment in dam safety, regional jobs and water security, supported by commitments of $600 million from the Queensland Government and $600 million from the Australian Government. Sunwater is currently progressing $97 million in design, planning and early works for the project, with $30.1 million to be spent in 2022–23. The Paradise Dam improvement project will secure long-term water security for the Bundaberg region, increase supply by 130,000 megalitres, support up to 250 jobs during construction, and keep downstream communities safe during extreme weather events.
South West Pipeline
The South West Pipeline project will construct a 24 kilometre pipeline connecting Beaudesert to the South East Queensland Water Grid, and a 3 kilometre pipeline that will allow Wyaralong Dam to supply the grid when demand triggers are met.
The project will deliver $95.2 million of investment into South East Queensland water security, supporting the region’s growing population and the Bromelton State Development Area. Up to 100 jobs will be supported during construction.
15
Capital Statement 2022-23
Construction works have commenced and are on track to be completed in 2022–23, with $38.3 million allocated to the project in 2022–23.
Southern Downs Drought Resilience Package
The Queensland Government has committed more than $300 million to the Toowoomba to Warwick Pipeline project which will provide Warwick and surrounding communities a reliable drought contingency, significantly improving regional water security.
As part of the Queensland Government’s $19.3 million Southern Downs Drought Resilience Package announced in the 2021–22 Budget, Seqwater undertook investigative and preparatory works for the pipeline. Following review of Seqwater’s findings, along with the outcomes of public consultation and other assessments, the Queensland Government committed to the pipeline to provide a contingent drought supply for Warwick while also providing permanent supply to Toowoomba satellite towns and ensuring there are no negative impacts to Toowoomba’s water security.
Seqwater are delivering the pipeline and in 2022–23 will continue approvals and early procurement processes to support pre-construction later in 2022–23 (subject to finalisation of discussions with councils) and construction in 2023–24 and 2024–25. The project will support 420 jobs during construction and the targeted 2025–26 completion date will ensure a contingent supply is in place for Warwick before local supplies are put at risk by potential future droughts.
The Queensland Government is committed to working with the Southern Downs and Toowoomba Regional councils on final funding and water security matters to see the pipeline delivered and to ensure it meets the needs of the councils.
Mount Crosby Flood Resilience Program
The 2022–23 Queensland Budget provides $23.6 million of investment into the Mount Crosby Flood Resilience Program.
This program will deliver a range of major works to improve the flood resilience of critical infrastructure located at Mount Crosby, including the replacement and relocation of the existing East Bank substation, construction of a new 2-lane road bridge adjacent to the Mount Crosby Weir, and upgrades to the East Bank Pump Station.
Enabling works for the new substation have already commenced, construction on the new $29.5 million road bridge will commence in late 2022, and further investment into the East Bank Pump Station upgrade project will be considered through the business case process.
16
Capital Statement 2022-23
| 2 | 2022–23 Capital program overview |
| 2.1 | Introduction |
In this Budget, the Queensland Government has allocated a total of $15.510 billion in 2022–23 to provide productivity-enhancing economic infrastructure, essential social infrastructure and a broad range of capital works projects and programs across the state.
This investment will help create jobs, support Queensland businesses and grow the economy, including in Queensland’s vital regional areas. The 2022–23 capital program is estimated to directly support around 48,000 jobs across the state.
The 2022–23 capital program comprises $12.648 billion of purchases of non-financial assets (PNFA) and acquisitions of non-financial assets under finance leases, and $2.862 billion of capital grants expenses.
Importantly, the 2022–23 capital program also demonstrates the government’s commitment to rebuilding and growing the state’s regions, with $9.824 billion (63.3 per cent) of the capital program in 2022–23 to be spent outside of the Greater Brisbane region (Brisbane and Redlands, Logan and Ipswich), supporting an estimated 31,100 jobs across those regions.
The government’s capital program includes a range of critical infrastructure projects in the port, rail, water and energy sectors being delivered through the state’s Public Non-financial Corporations (PNFC) sector (that is, commercial entities of government, including government owned corporations).
Capital purchases by the PNFC sector in 2022–23 total $3.3 billion.
17
Capital Statement 2022-23
| 2.2 | Capital purchases |
The Queensland Government is continuing to provide the essential economic and social infrastructure needed to support economic growth, deliver essential services and ensure ongoing improvements in the quality of life enjoyed by Queensland’s growing population.
The 2022–23 capital program includes $12.648 billion of PNFA and acquisitions of non-financial assets under finance leases.
Capital purchases in 2022–23, categorised according to purpose, are outlined in Chart 1. Transport continues to account for the largest share of purchases, followed by health, housing and community services, energy infrastructure and education and training.
| Chart 1 | Capital purchases by purpose 2022–23 |

18
Capital Statement 2022-23
Table 1 outlines the capital purchases by Queensland Government entity, including the 2021–22 year (estimated actual) and the Budget for 2022–23. Transport and Main Roads has the largest proportion of total capital purchases.
| Table 1 | Capital purchases by Queensland Government entity1,2 |
Entity | 2021–22 Est. actual $‘000 | 2022–23 Budget $‘000 | ||||||
Agriculture and Fisheries | 21,719 | 24,919 | ||||||
Children, Youth Justice and Multicultural Affairs | 32,942 | 49,249 | ||||||
Communities, Housing and Digital Economy | 342,819 | 453,946 | ||||||
Education | 1,263,124 | 1,457,070 | ||||||
Employment, Small Business and Training | 155,650 | 103,604 | ||||||
Energy and Public Works | ||||||||
Energy and Public Works | 145,107 | 188,416 | ||||||
Energy generation sector | 343,651 | 480,793 | ||||||
Energy transmission and distribution | 1,984,885 | 1,649,468 | ||||||
Environment and Science | 73,467 | 51,161 | ||||||
Justice and Attorney-General | 51,380 | 34,261 | ||||||
Legislative Assembly of Queensland | 15,382 | 43,561 | ||||||
Premier and Cabinet | 183 | 883 | ||||||
Queensland Corrective Services | 207,287 | 513,363 | ||||||
Queensland Fire and Emergency Services | 48,565 | 67,460 | ||||||
Queensland Health | 1,035,526 | 1,537,112 | ||||||
Queensland Police Service | 142,516 | 174,629 | ||||||
Queensland Treasury | 165,000 | — | ||||||
Regional Development, Manufacturing and Water | ||||||||
Regional Development, Manufacturing and Water | 109,900 | 119,507 | ||||||
Water distribution and supply | 264,662 | 252,710 | ||||||
Resources | 7,405 | 10,105 | ||||||
Seniors, Disability Services and Aboriginal and Torres Strait Islander Partnerships | 4,149 | 5,102 | ||||||
State Development, Infrastructure, Local Government and Planning | 261,503 | 178,603 | ||||||
Tourism, Innovation and Sport | 43,804 | 65,249 | ||||||
Transport and Main Roads | ||||||||
Transport and Main Roads | 4,171,771 | 4,551,424 | ||||||
Port authorities | 174,517 | 169,224 | ||||||
Queensland Rail | 752,026 | 797,149 | ||||||
Cross River Rail Delivery Authority | 1,391,242 | 1,212,087 | ||||||
Other agencies3 | 6,711 | 5,612 | ||||||
Other adjustments4 | (368,071 | ) | (48,976 | ) | ||||
Anticipated contingency reserve5 | (1,000,000 | ) | (1,500,000 | ) | ||||
|
|
|
| |||||
Total capital purchases | 11,848,822 | 12,647,691 | ||||||
|
|
|
| |||||
19
Capital Statement 2022-23
Total capital purchases breakdown | 2021–22 Est. actual $‘000 | 2022–23 Budget $‘000 | ||||||
Consisting of: | ||||||||
Purchases of non-financial assets per Non-financial Public Sector Cash Flow Statement (BP2 Table 9.9) | 10,588,027 | 11,812,335 | ||||||
New finance leases | 1,260,795 | 835,356 | ||||||
|
|
|
| |||||
Total capital purchases | 11,848,822 | 12,647,691 | ||||||
|
|
|
| |||||
Notes:
| 1. | Includes all associated statutory bodies. |
| 2. | Numbers may not add due to rounding. |
| 3. | Includes other government entities with non-material capital programs. |
| 4. | Representing inter-agency eliminations, movements in capital payable and receivable, funds held centrally and other accounting adjustments to align with Uniform Presentation Framework Statements. |
| 5. | Contingency recognises that on a whole-of-government basis, there is likely to be carry-over of capital allocations. |
20
Capital Statement 2022-23
Table 2 shows capital purchases by Regional Action Plan (RAP) region and statistical area. The government’s commitment to supporting growth in Queensland’s vital regional areas is highlighted by the fact that $7.693 billion (60.8 per cent) of capital purchases in 2022–23 will be spent outside of Greater Brisbane (Brisbane and Redlands, Logan and Ipswich).
| Table 2 | Capital purchases by RAP region and statistical area for 2022–231,2 |
Regional Action Plan region | Capital purchases $‘000 | Statistical area | Capital purchases $‘000 | |||||||||||
Brisbane and Redlands | 3,339,231 | 301 | Brisbane East | 251,448 | ||||||||||
| 302 | Brisbane North | 332,921 | ||||||||||||
| 303 | Brisbane South | 477,710 | ||||||||||||
| 304 | Brisbane West | 196,834 | ||||||||||||
| 305 | Inner Brisbane | 2,080,318 | ||||||||||||
Ipswich | 925,893 | 310 | Ipswich | 925,893 | ||||||||||
Wide Bay | 1,033,025 | 319 | Wide Bay | 1,033,025 | ||||||||||
Darling Downs | 549,793 | 307 | Darling Downs Maranoa | 333,279 | ||||||||||
| 317 | Toowoomba | 216,514 | ||||||||||||
Gold Coast | 1,433,626 | 309 | Gold Coast | 1,433,626 | ||||||||||
Logan | 689,478 | 311 | Logan Beaudesert | 689,478 | ||||||||||
Mackay-Whitsunday | 492,169 | 312 | Mackay | 492,169 | ||||||||||
Outback Queensland3 | 332,511 | 315 | Outback | 453,073 | ||||||||||
Far North Queensland3 | 826,853 | 306 | Cairns | 706,291 | ||||||||||
Central Queensland | 871,782 | 308 | Central Queensland | 871,782 | ||||||||||
Sunshine Coast | 669,164 | 316 | Sunshine Coast | 669,164 | ||||||||||
Moreton Bay | 714,771 | 313 | Moreton Bay North | 538,968 | ||||||||||
| 314 | Moreton Bay South | 175,803 | ||||||||||||
Townsville | 769,395 | 318 | Townsville | 769,395 | ||||||||||
|
| |||||||||||||
Total capital purchases | 12,647,691 | |||||||||||||
|
| |||||||||||||
Notes:
| 1. | Numbers may not add due to rounding. |
| 2. | The anticipated capital contingency reserve and other adjustments have been spread across statistical areas proportionate to capital spends. |
| 3. | $120,562,000 of capital purchases in Outback statistical area belong to the Far North Queensland RAP region. |
21
Capital Statement 2022-23
| 2.3 | Capital grants |
The Queensland Government provides capital grants to a range of organisations.
Total capital grants are expected to be $2.862 billion in 2022–23, with Chart 2 below outlining the capital grants to local governments (LG) and non-government organisations (NGOs).
| Chart 2 | Capital grants by purpose and recipient |
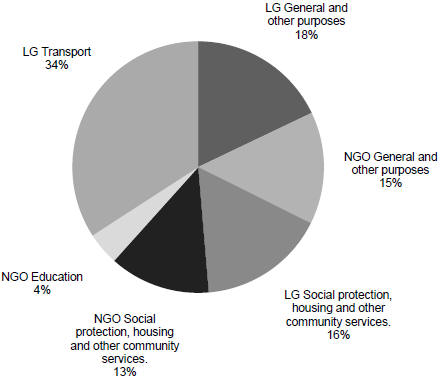
22
Capital Statement 2022-23
Table 3 shows the planned expenditure on capital grants by Queensland Government entity for 2022–23. State Development, Infrastructure, Local Government and Planning has the highest proportion of capital grants.
| Table 3 | Expenditure on capital grants by Queensland Government entity1,2 |
Entity | 2021–22 Est. actual $‘000 | 2022–23 Budget $‘000 | ||||||
Agriculture and Fisheries | — | 5,500 | ||||||
Children, Youth Justice and Multicultural Affairs | — | 2,500 | ||||||
Communities, Housing and Digital Economy | 109,199 | 134,896 | ||||||
Education | 136,979 | 149,832 | ||||||
Employment, Small Business and Training | 29,450 | 8,482 | ||||||
Energy and Public Works | — | 112,500 | ||||||
Environment and Science | 2,388 | 3,735 | ||||||
Premier and Cabinet | 973 | 16,100 | ||||||
Queensland Fire and Emergency Services | 1,251 | 1,712 | ||||||
Queensland Treasury | 386,082 | 218,998 | ||||||
Regional Development, Manufacturing and Water | 24,745 | 52,536 | ||||||
Seniors, Disability Services and Aboriginal and Torres Strait Islander Partnerships | 484 | 2,611 | ||||||
State Development, Infrastructure, Local Government and Planning | 833,935 | 1,046,671 | ||||||
Tourism, Innovation and Sport | 102,578 | 105,103 | ||||||
Transport and Main Roads | ||||||||
Transport and Main Roads | 519,905 | 501,877 | ||||||
Cross River Rail Delivery Authority | 4,180 | 77,487 | ||||||
Other agencies | 1,143 | 1,000 | ||||||
Other adjustments3 | 51,648 | 420,359 | ||||||
|
|
|
| |||||
Total capital grants | 2,204,940 | 2,861,899 | ||||||
|
|
|
| |||||
Notes:
| 1. | Includes associated statutory bodies. |
| 2. | Numbers may not add due to rounding. |
| 3. | Includes assets transferred, funds held centrally (including disaster recovery grants) and other technical accounting adjustments. |
23
Capital Statement 2022-23
Table 4 shows expenditure on capital grants by RAP region and statistical area. The government’s commitment to support growth in Queensland’s vital regional areas is highlighted by the fact that $2.131 billion (74.5 per cent) of capital grants in 2022–23 will be spent outside of Greater Brisbane (Brisbane and Redlands, Logan and Ipswich).
| Table 4 | Capital grants by RAP region and statistical area for 2022–231,2 |
Regional Action Plan region | Grants $‘000 | Statistical area | Grants $‘000 | |||||||||||
Brisbane and Redlands | 503,442 | 301 | Brisbane East | 57,620 | ||||||||||
| 302 | Brisbane North | 69,845 | ||||||||||||
| 303 | Brisbane South | 84,814 | ||||||||||||
| 304 | Brisbane West | 31,829 | ||||||||||||
| 305 | Inner Brisbane | 259,334 | ||||||||||||
Ipswich | 101,227 | 310 | Ipswich | 101,227 | ||||||||||
Wide Bay | 199,982 | 319 | Wide Bay | 199,982 | ||||||||||
Darling Downs | 271,285 | 307 | Darling Downs Maranoa | 190,358 | ||||||||||
| 317 | Toowoomba | 80,927 | ||||||||||||
Gold Coast | 240,328 | 309 | Gold Coast | 240,328 | ||||||||||
Logan | 125,930 | 311 | Logan Beaudesert | 125,930 | ||||||||||
Mackay-Whitsunday | 104,206 | 312 | Mackay | 104,206 | ||||||||||
Outback Queensland3 | 301,908 | 315 | Outback | 475,275 | ||||||||||
Far North Queensland3 | 395,540 | 306 | Cairns | 222,173 | ||||||||||
Central Queensland | 120,982 | 308 | Central Queensland | 120,982 | ||||||||||
Sunshine Coast | 150,272 | 316 | Sunshine Coast | 150,272 | ||||||||||
Moreton Bay | 119,900 | 313 | Moreton Bay North | 80,492 | ||||||||||
| 314 | Moreton Bay South | 39,408 | ||||||||||||
Townsville | 226,897 | 318 | Townsville | 226,897 | ||||||||||
|
| |||||||||||||
Total capital grants | 2,861,899 | |||||||||||||
|
| |||||||||||||
Notes:
| 1. | Numbers may not add due to rounding. |
| 2. | The adjustments referred to in Table 4 have been spread across statistical areas proportionate to allocation of grants. |
| 3. | $173,367,000 of capital grants in Outback statistical area belong to the Far North Queensland RAP region. |
Chart 3 shows the distribution of the total 2022–23 capital program (capital purchases and capital grants) across the geographical regions of Queensland, as classified for Budget Paper 3 purposes.
24
Capital Statement 2022-23
Chart 3 Map of 2022–23 capital program by Queensland regions
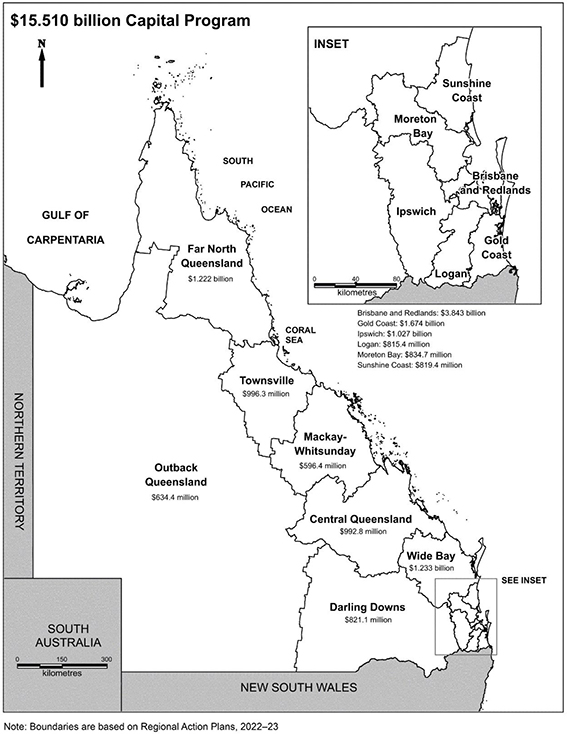
25
Capital Statement 2022-23
| 3 | Capital outlays by entity |
| 3.1 | AGRICULTURE AND FISHERIES |
Department of Agriculture and Fisheries
Capital purchases and grants for the Department of Agriculture and Fisheries, reporting to the Minister for Agricultural Industry Development and Fisheries and Minister for Rural Communities, are $27.5 million for 2022-23. The department’s capital program is focused on developing and upgrading research facilities to deliver outcomes for agriculture, biosecurity, fisheries and forestry.
The department has facilities located throughout rural and regional Queensland. These require continual minor works, mechanical items and plant equipment upgrades to keep them operating effectively.
Program Highlights (Property, Plant and Equipment)
| • | $4.7 million to continue upgrades to the department’s research and operational facilities through the research facilities development, scientific equipment and minor works programs. |
| • | $2.7 million to finalise long-term decisions on the future of assets formerly held by the Queensland Agricultural Training Colleges, including a new Central Queensland Smart Cropping Centre at Emerald. |
| • | $2.6 million for new and replacement heavy plant and equipment including trucks, tractors, irrigators, all-terrain vehicles and other machinery. |
| • | $2.5 million to continue the upgrade of fruit handling laboratories enabling scientists to provide research services to the expanding and new horticultural industries at Mareeba. |
| • | $1.4 million to upgrade the Wild Dog Barrier Fence. |
| • | $1.2 million to upgrade infrastructure and equipment to support horticulture productivity and profitability under the Queensland Smart Farm Initiative at Gatton. |
| • | $953,000 to replace fitout items at the EcoSciences and Health and Food Sciences precinct. |
| • | $600,000 to upgrade Longreach office accommodation. |
| • | $552,000 to continue to replace vessels and marine equipment for fisheries research and regulatory functions. |
26
Capital Statement 2022-23
Program Highlights (Capital Grants)
| • | $4 million to finalise long-term decisions on the future of assets formerly held by the Queensland Agricultural Training Colleges. |
| • | $1 million is provided as a contribution towards the upgrade of adoption facilities at the Young Animal Protection Society in Cairns. |
| • | $500,000 is provided as a contribution to the Queensland Country Women’s Association to continue minor works upgrades to infrastructure, including community halls. |
Queensland Racing Integrity Commission
Capital purchases for the Queensland Racing Integrity Commission, reporting to the Minister for Education, Minister for Industrial Relations and Minister for Racing, are $2.9 million for 2022-23.
Program Highlights (Property, Plant and Equipment)
| • | $2 million for upgrades to laboratory equipment to support drug testing services. |
| • | $625,000 for software upgrades to the licensing system and laboratory information management system. |
Agriculture and Fisheries
Project | Statistical Area | Total Estimated Cost $‘000 | Expenditure to 30-06-22 $‘000 | Budget 2022-23 $‘000 | Post 2022-23 $‘000 | |||||||||||||
DEPARTMENT OF AGRICULTURE AND FISHERIES |
| |||||||||||||||||
Property, Plant and Equipment | ||||||||||||||||||
Computer equipment | 305 | 3,187 | Ongoing | |||||||||||||||
Assets formerly held by Queensland Agricultural Training Colleges | 308 | 5,850 | 300 | 2,700 | 2,850 | |||||||||||||
Heavy plant and equipment | Various | 2,586 | Ongoing | |||||||||||||||
Upgrade to Mareeba research facility | 306 | 3,360 | 840 | 2,520 | ||||||||||||||
Scientific equipment | Various | 1,762 | Ongoing | |||||||||||||||
Research facilities development | Various | 1,796 | Ongoing | |||||||||||||||
Wild Dog Barrier Fence | 315 | 1,400 | Ongoing | |||||||||||||||
Minor works | Various | 1,327 | Ongoing | |||||||||||||||
Gatton Smart Farm Initiative | 317 | 2,000 | 1,200 | 800 | ||||||||||||||
Fitout of Ecosciences and Health and Food Sciences Precincts | 303 | 953 | Ongoing | |||||||||||||||
Other property, plant and equipment | Various | 673 | Ongoing | |||||||||||||||
Longreach office upgrade | 315 | 1,091 | 491 | 600 | ||||||||||||||
27
Capital Statement 2022-23
Agriculture and Fisheries
Project | Statistical Area | Total Estimated Cost $‘000 | Expenditure to 30-06-22 $‘000 | Budget 2022-23 $‘000 | Post 2022-23 $‘000 | |||||||||||||
Vessels and marine equipment | Various | 552 | Ongoing | |||||||||||||||
Maroochy research facility spillway upgrade | 316 | 300 | 300 | |||||||||||||||
Gatton research facility fire hydrant upgrade | 317 | 270 | 270 | |||||||||||||||
Tor Street Toowoomba complex fire hydrant upgrade | 317 | 600 | 450 | 150 | ||||||||||||||
|
| |||||||||||||||||
Total Property, Plant and Equipment | 21,976 | |||||||||||||||||
|
| |||||||||||||||||
Capital Grants | ||||||||||||||||||
Assets formerly held by Queensland Agricultural Training Colleges | 308 | 4,000 | 4,000 | |||||||||||||||
Young Animal Protection Society upgrade | 306 | 1,000 | 1,000 | |||||||||||||||
Queensland Country Women’s Association building restoration and renovation | Various | 1,000 | 500 | 500 | ||||||||||||||
|
| |||||||||||||||||
Total Capital Grants | 5,500 | |||||||||||||||||
|
| |||||||||||||||||
QUEENSLAND RACING INTEGRITY COMMISSION | ||||||||||||||||||
Property, Plant and Equipment | ||||||||||||||||||
Laboratory Information Management System | 305 | 325 | 325 | |||||||||||||||
Racing Science Centre laboratory technology upgrades | 305 | 2,018 | Ongoing | |||||||||||||||
Other asset replacement | Various | 300 | Ongoing | |||||||||||||||
Registration and licensing environment | Various | 3,329 | 3,029 | 300 | ||||||||||||||
|
| |||||||||||||||||
Total Property, Plant and Equipment | 2,943 | |||||||||||||||||
|
| |||||||||||||||||
TOTAL AGRICULTURE AND FISHERIES (PPE) | 24,919 | |||||||||||||||||
|
| |||||||||||||||||
TOTAL AGRICULTURE AND FISHERIES (CG) | 5,500 | |||||||||||||||||
|
| |||||||||||||||||
28
Capital Statement 2022-23
| 3.2 | CHILDREN, YOUTH JUSTICE AND MULTICULTURAL AFFAIRS |
Department of Children, Youth Justice and Multicultural Affairs
The capital purchases for the Department of Children, Youth Justice and Multicultural Affairs are $49.2 million in 2022-23. These funds provide the infrastructure and systems to support children, young people and families to be safe and help prevent and respond to crime, violence, abuse and neglect.
Total capital grants for the portfolio are $2.5 million in 2022-23. These funds are a contribution to the establishment of a Holocaust Museum and Education Centre in Brisbane.
Program Highlights (Property, Plant and Equipment)
| • | $27.8 million in 2022-23 of a total $63.7 million for Unify (Integrated Client Management System (ICMS) Replacement Program). The Unify program will strengthen information sharing and collaboration across Queensland Government, social services and justice sectors by delivering a contemporary case management system that will enable more streamlined processes, support staff and continuing service reforms while engaging with young people, families, carers and services. |
| • | $10.4 million to conduct ongoing program renewal and minor works to Youth Detention centres and Youth Justice service centres. |
| • | $8.4 million for Child and Family Services facilities, including fit out and upgrade of office accommodation and Child Safety service centres and upgrades to Residential Care properties. |
| • | $1.7 million for annual essential capital replacement of IT infrastructure that is at end of life. |
| • | $1 million to enhance and develop information systems and ICT programs to provide additional system functionality, information security and contemporary technology to improve service delivery. |
Program Highlights (Capital Grants)
| • | $2.5 million in 2022-23 of a total $3.5 million contribution to establish a Holocaust Museum and Education Centre in Brisbane to honour victims of the Holocaust and support students and the broader community to explore and understand the impact of racism. |
29
Capital Statement 2022-23
| Children, Youth Justice and Multicultural Affairs | ||||||||||||||||||
Project | Statistical Area | Total Estimated Cost $‘000 | Expenditure to 30-06-22 $‘000 | Budget 2022-23 $‘000 | Post 2022-23 $‘000 | |||||||||||||
DEPARTMENT OF CHILDREN, YOUTH JUSTICE AND MULTICULTURAL AFFAIRS |
| |||||||||||||||||
Property, Plant and Equipment | ||||||||||||||||||
Information Systems and Technology | ||||||||||||||||||
Unify (Integrated Client Management System replacement) Program | Various | 63,735 | 27,751 | 27,784 | 8,200 | |||||||||||||
Information technology infrastructure replacement | Various | 1,660 | Ongoing | |||||||||||||||
Information system enhancements | Various | 981 | Ongoing | |||||||||||||||
|
| |||||||||||||||||
Sub-total Information Systems and Technology | 30,425 | |||||||||||||||||
|
| |||||||||||||||||
Youth Justice Services | ||||||||||||||||||
Youth Justice facilities | Various | 10,436 | Ongoing | |||||||||||||||
|
| |||||||||||||||||
Sub-total Youth Justice Services | 10,436 | |||||||||||||||||
|
| |||||||||||||||||
Child and Family Services | ||||||||||||||||||
Child and Family Services facilities | Various | 8,388 | Ongoing | |||||||||||||||
|
| |||||||||||||||||
Sub-total Child and Family Services | 8,388 | |||||||||||||||||
|
| |||||||||||||||||
Total Property, Plant and Equipment | 49,249 | |||||||||||||||||
|
| |||||||||||||||||
Capital Grants | ||||||||||||||||||
Multicultural Affairs | ||||||||||||||||||
Holocaust Museum | 305 | 3,500 | 2,500 | 1,000 | ||||||||||||||
|
| |||||||||||||||||
Total Capital Grants | 2,500 | |||||||||||||||||
|
| |||||||||||||||||
TOTAL CHILDREN, YOUTH JUSTICE AND MULTICULTURAL AFFAIRS (PPE) | 49,249 | |||||||||||||||||
|
| |||||||||||||||||
TOTAL CHILDREN, YOUTH JUSTICE AND MULTICULTURAL AFFAIRS (CG) | 2,500 | |||||||||||||||||
|
| |||||||||||||||||
30
Capital Statement 2022-23
| 3.3 | COMMUNITIES, HOUSING AND DIGITAL ECONOMY |
The Communities, Housing and Digital Economy portfolio includes the Department of Communities, Housing and Digital Economy together with Arts Queensland, and statutory bodies reporting to the Minister for Communities and Housing and Minister for Digital Economy and Minister for the Arts.
The portfolio’s capital purchases for 2022-23 are $453.9 million. The portfolio’s capital grants for 2022-23 are $134.9 million.
The total capital program for Housing and Homelessness is $449.9 million in 2022-23, which includes $132.2 million in capital grants, and $8.6 million for other property, plant and equipment. The Housing and Homelessness Action Plan 2021-2025 provides $1.908 billion over 4 years to boost housing supply and increase housing and homelessness support across Queensland.
Department of Communities, Housing and Digital Economy
Total capital purchases for the Department of Communities, Housing and Digital Economy are $431.3 million in 2022-23. Total capital grants for the department are $134.9 million in 2022-23.
Program Highlights (Property, Plant and Equipment)
| • | $282 million to deliver social housing dwellings, commence and continue construction, and upgrade existing dwellings. |
| • | $27.1 million to deliver social housing dwellings in Aboriginal and Torres Strait Islander communities, commence and continue construction, and upgrade existing dwellings. |
| • | $67.9 million to continue construction of the new performing arts venue at the Queensland Performing Arts Centre, benefiting Queensland artists and audiences. |
| • | $15 million to continue the upgrade and construction program for neighbourhood and community centres and other key social infrastructure, including upgrades to existing neighbourhood and community centres, construction of replacement neighbourhood and community centres, expansion of the Lyons St Diversionary Centre, and design and construction of a new neighbourhood and community centre in Rockhampton. |
| • | $11.3 million to address Stage 2 of urgent and unavoidable critical infrastructure renewal works at the Queensland Cultural Centre. |
| • | $8.5 million for capital asset renewal works, compliance and safety improvements and amenities upgrades across the Queensland Cultural Centre. |
31
Capital Statement 2022-23
| • | $4.4 million to deliver priority infrastructure projects across state owned arts and cultural facilities. |
| • | $2.1 million to complete rectification of cladding remediation work at the Queensland Cultural Centre. |
| • | $1.4 million to reconfigure the Grey and Russell Street intersection, South Brisbane to enhance vehicular access to the Queensland Performing Arts Centre. |
| • | $1.3 million to deliver security enhancement measures across the Queensland Cultural Centre. |
Program Highlights (Capital Grants)
| • | $74.3 million to deliver social housing dwellings in Aboriginal and Torres Strait Islander communities, commence and continue construction, upgrade existing dwellings, and undertake land infrastructure development. |
| • | $57.9 million to deliver social housing dwellings, commence and continue construction, and upgrade existing dwellings. |
| • | $1.9 million towards the design and construction of the Atherton Neighbourhood and Community Centre. |
| • | $780,000 contribution towards the ongoing construction of the Yarrabilba Hive. |
CITEC
CITEC has capital purchases of $14.8 million in 2022-23 comprising right of use lease assets and hardware replacement.
Program Highlights (Property, Plant and Equipment)
| • | $11.2 million of right of use lease assets for mainframe and other information technology services. |
| • | $3.6 million for hardware replacement including $2.1 million for the Data Centre Re-location project and $1.5 million to replace information technology equipment. |
Library Board of Queensland
The Library Board of Queensland has capital purchases of $2 million in 2022-23, to purchase heritage collections, information collections, intangible assets in the form of digital collections, and replace information technology equipment.
Program Highlights (Property, Plant and Equipment)
| • | $1.4 million to acquire new items for the digital, heritage and information collections. |
| • | $688,000 to replace information technology equipment. |
32
Capital Statement 2022-23
Queensland Art Gallery
The Queensland Art Gallery has capital purchases of $2.8 million in 2022-23, for the acquisition of art for the gallery’s collection, as well as life-cycle replacement of other property, plant and equipment assets.
Program Highlights (Property, Plant and Equipment)
| • | $2.5 million to acquire art for the gallery’s collection. |
| • | $300,000 to replace other property, plant and equipment. |
Queensland Performing Arts Trust
The Queensland Performing Arts Trust will invest $2 million in the lifecycle replacement of operational property, plant and equipment assets, such as theatre equipment and food and beverage equipment.
Queensland Shared Services
Queensland Shared Services has capital purchases of $1 million in 2022-23, including $900,000 to implement optimisation projects and initiatives.
| Communities, Housing and Digital Economy | ||||||||||||||||||
Project | Statistical Area | Total Estimated Cost $‘000 | Expenditure to 30-06-22 $‘000 | Budget 2022-23 $‘000 | Post 2022-23 $‘000 | |||||||||||||
DEPARTMENT OF COMMUNITIES, HOUSING AND DIGITAL ECONOMY |
| |||||||||||||||||
Property, Plant and Equipment | ||||||||||||||||||
Housing and Homelessness Services | ||||||||||||||||||
Construct social housing | ||||||||||||||||||
Brisbane - East | 301 | 1,373 | Ongoing | |||||||||||||||
Brisbane - North | 302 | 3,300 | Ongoing | |||||||||||||||
Brisbane - South | 303 | 15,109 | Ongoing | |||||||||||||||
Brisbane Inner City | 305 | 13,472 | Ongoing | |||||||||||||||
Cairns | 306 | 25,848 | Ongoing | |||||||||||||||
Darling Downs - Maranoa | 307 | 1,554 | Ongoing | |||||||||||||||
Central Queensland | 308 | 6,922 | Ongoing | |||||||||||||||
Gold Coast | 309 | 14,328 | Ongoing | |||||||||||||||
Ipswich | 310 | 8,312 | Ongoing | |||||||||||||||
Logan - Beaudesert | 311 | 12,670 | Ongoing | |||||||||||||||
Mackay | 312 | 8,896 | Ongoing | |||||||||||||||
Moreton Bay - North | 313 | 9,069 | Ongoing | |||||||||||||||
Moreton Bay - South | 314 | 5,848 | Ongoing | |||||||||||||||
Queensland - Outback | 315 | 5,856 | Ongoing | |||||||||||||||
33
Capital Statement 2022-23
| Communities, Housing and Digital Economy | ||||||||||||||||||
Project | Statistical Area | Total Estimated Cost $‘000 | Expenditure to 30-06-22 $‘000 | Budget 2022-23 $‘000 | Post 2022-23 $‘000 | |||||||||||||
Sunshine Coast | 316 | 5,141 | Ongoing | |||||||||||||||
Toowoomba | 317 | 5,994 | Ongoing | |||||||||||||||
Townsville | 318 | 20,432 | Ongoing | |||||||||||||||
Wide Bay | 319 | 12,927 | Ongoing | |||||||||||||||
|
| |||||||||||||||||
Sub-total Construct social housing | 177,051 | |||||||||||||||||
|
| |||||||||||||||||
Upgrade existing social housing | ||||||||||||||||||
Brisbane - East | 301 | 2,844 | Ongoing | |||||||||||||||
Brisbane - North | 302 | 2,812 | Ongoing | |||||||||||||||
Brisbane - South | 303 | 2,212 | Ongoing | |||||||||||||||
Brisbane - West | 304 | 203 | Ongoing | |||||||||||||||
Brisbane Inner City | 305 | 7,562 | Ongoing | |||||||||||||||
Cairns | 306 | 25,747 | Ongoing | |||||||||||||||
Darling Downs - Maranoa | 307 | 1,910 | Ongoing | |||||||||||||||
Central Queensland | 308 | 4,337 | Ongoing | |||||||||||||||
Gold Coast | 309 | 4,817 | Ongoing | |||||||||||||||
Ipswich | 310 | 4,364 | Ongoing | |||||||||||||||
Logan - Beaudesert | 311 | 6,917 | Ongoing | |||||||||||||||
Mackay | 312 | 4,763 | Ongoing | |||||||||||||||
Moreton Bay - North | 313 | 3,673 | Ongoing | |||||||||||||||
Moreton Bay - South | 314 | 433 | Ongoing | |||||||||||||||
Queensland - Outback | 315 | 3,905 | Ongoing | |||||||||||||||
Sunshine Coast | 316 | 4,040 | Ongoing | |||||||||||||||
Toowoomba | 317 | 379 | Ongoing | |||||||||||||||
Townsville | 318 | 5,368 | Ongoing | |||||||||||||||
Wide Bay | 319 | 5,748 | Ongoing | |||||||||||||||
Statewide | Various | 1,095 | Ongoing | |||||||||||||||
|
| |||||||||||||||||
Sub-total Upgrade existing social housing | 93,129 | |||||||||||||||||
|
| |||||||||||||||||
Social housing land acquisition | ||||||||||||||||||
Brisbane - North | 302 | 4,500 | Ongoing | |||||||||||||||
Brisbane - South | 303 | 6,593 | Ongoing | |||||||||||||||
Cairns | 306 | 3,000 | Ongoing | |||||||||||||||
Darling Downs - Maranoa | 307 | 2,000 | Ongoing | |||||||||||||||
Central Queensland | 308 | 2,000 | Ongoing | |||||||||||||||
Gold Coast | 309 | 4,000 | Ongoing | |||||||||||||||
Ipswich | 310 | 2,000 | Ongoing | |||||||||||||||
Mackay | 312 | 2,000 | Ongoing | |||||||||||||||
Moreton Bay - North | 313 | 1,750 | Ongoing | |||||||||||||||
Moreton Bay - South | 314 | 1,750 | Ongoing | |||||||||||||||
Sunshine Coast | 316 | 3,000 | Ongoing | |||||||||||||||
34
Capital Statement 2022-23
| Communities, Housing and Digital Economy | ||||||||||||||||||
Project | Statistical Area | Total Estimated Cost $‘000 | Expenditure to 30-06-22 $‘000 | Budget 2022-23 $‘000 | Post 2022-23 $‘000 | |||||||||||||
Toowoomba | 317 | 1,000 | Ongoing | |||||||||||||||
Townsville | 318 | 2,000 | Ongoing | |||||||||||||||
Wide Bay | 319 | 2,000 | Ongoing | |||||||||||||||
Statewide | Various | 1,276 | Ongoing | |||||||||||||||
Other plant and equipment and intangibles | Various | 8,595 | Ongoing | |||||||||||||||
|
| |||||||||||||||||
Sub-total Housing and Homelessness Services | 317,644 | |||||||||||||||||
|
| |||||||||||||||||
Community Services | ||||||||||||||||||
Lyons Street Diversionary Centre expansion | 306 | 4,350 | 1,350 | 3,000 | ||||||||||||||
Rockhampton Neighbourhood Centre | 308 | 4,555 | 1,897 | 2,373 | 285 | |||||||||||||
Replacement of existing neighbourhood centres | Various | 4,393 | Ongoing | |||||||||||||||
Office accommodation, fixtures and fittings | Various | 807 | Ongoing | |||||||||||||||
Digitisation equipment | 303 | 400 | 400 | |||||||||||||||
General property upgrades | Various | 5,200 | Ongoing | |||||||||||||||
|
| |||||||||||||||||
Sub-total Community Services | 16,173 | |||||||||||||||||
|
| |||||||||||||||||
Customer and Digital Services | ||||||||||||||||||
Asset replacement for Smart Service Queensland | 305 | 600 | Ongoing | |||||||||||||||
|
| |||||||||||||||||
Sub-total Customer and Digital Services | 600 | |||||||||||||||||
|
| |||||||||||||||||
Arts Queensland | ||||||||||||||||||
New Performing Arts Venue at1 QPAC | 305 | 150,000 | 67,810 | 67,923 | 14,267 | |||||||||||||
Queensland Cultural Centre - capital works, asset upgrades and refurbishment projects | 305 | 53,700 | 8,550 | 45,150 | ||||||||||||||
Queensland Cultural Centre critical infrastructure works - Stage 2 2021 to 2025 | 305 | 30,280 | 6,028 | 11,302 | 12,950 | |||||||||||||
Arts Infrastructure Investment Fund - Stage 2 2021 to 2024 | 305 | 11,125 | 2,375 | 4,375 | 4,375 | |||||||||||||
Queensland Cultural Centre cladding remediation works | 305 | 3,250 | 1,187 | 2,063 | �� | |||||||||||||
Queensland Cultural Centre - security upgrades | 305 | 3,510 | 1,300 | 2,210 | ||||||||||||||
Realignment of Grey and Russell | 305 | 1,400 | 1,400 | |||||||||||||||
35
Capital Statement 2022-23
| Communities, Housing and Digital Economy | ||||||||||||||||||
Project | Statistical Area | Total Estimated Cost $‘000 | Expenditure to 30-06-22 $‘000 | Budget 2022-23 $‘000 | Post 2022-23 $‘000 | |||||||||||||
Street Intersection | ||||||||||||||||||
Sub-total Arts Queensland | 96,913 | |||||||||||||||||
|
| |||||||||||||||||
Total Property, Plant and Equipment | 431,330 | |||||||||||||||||
|
| |||||||||||||||||
Capital Grants | ||||||||||||||||||
Housing and Homelessness Services | ||||||||||||||||||
Brisbane - North | 302 | 594 | Ongoing | |||||||||||||||
Brisbane - South | 303 | 7,700 | Ongoing | |||||||||||||||
Cairns | 306 | 57,024 | Ongoing | |||||||||||||||
Central Queensland | 308 | 1,360 | Ongoing | |||||||||||||||
Gold Coast | 309 | 6,068 | Ongoing | |||||||||||||||
Logan - Beaudesert | 311 | 5,850 | Ongoing | |||||||||||||||
Moreton Bay - North | 313 | 1,779 | Ongoing | |||||||||||||||
Queensland - Outback | 315 | 2,122 | Ongoing | |||||||||||||||
Sunshine Coast | 316 | 10,867 | Ongoing | |||||||||||||||
Toowoomba | 317 | 2,067 | Ongoing | |||||||||||||||
Townsville | 318 | 1,889 | Ongoing | |||||||||||||||
Wide Bay | 319 | 11,920 | Ongoing | |||||||||||||||
Statewide | Various | 22,969 | Ongoing | |||||||||||||||
|
| |||||||||||||||||
Sub-total Housing and Homelessness Services | 132,209 | |||||||||||||||||
|
| |||||||||||||||||
Community Services | ||||||||||||||||||
Atherton Neighbourhood and Community Centre | 306 | 1,907 | 1,907 | |||||||||||||||
Yarrabilba Hive | 311 | 2,600 | 1,820 | 780 | ||||||||||||||
|
| |||||||||||||||||
Sub-total Community Services | 2,687 | |||||||||||||||||
|
| |||||||||||||||||
Total Capital Grants | 134,896 | |||||||||||||||||
|
| |||||||||||||||||
CITEC | ||||||||||||||||||
Property, Plant and Equipment | ||||||||||||||||||
Right of use lease assets | Various | 11,154 | 11,154 | |||||||||||||||
Hardware replacement | Various | 3,615 | Ongoing | |||||||||||||||
|
| |||||||||||||||||
Total Property, Plant and Equipment | 14,769 | |||||||||||||||||
|
| |||||||||||||||||
LIBRARY BOARD OF QUEENSLAND | ||||||||||||||||||
Property, Plant and Equipment | ||||||||||||||||||
Information technology equipment | 305 | 688 | Ongoing | |||||||||||||||
36
Capital Statement 2022-23
| Communities, Housing and Digital Economy | ||||||||||||||||||||
Project | Statistical Area | Total Estimated Cost $‘000 | Expenditure to 30-06-22 $‘000 | Budget 2022-23 $‘000 | Post 2022-23 $‘000 | |||||||||||||||
Digital collection | 305 | 595 | Ongoing | |||||||||||||||||
Heritage collection | 305 | 580 | Ongoing | |||||||||||||||||
Information collection | 305 | 184 | Ongoing | |||||||||||||||||
|
| |||||||||||||||||||
Total Property, Plant and Equipment | 2,047 | |||||||||||||||||||
|
| |||||||||||||||||||
QUEENSLAND ART GALLERY | ||||||||||||||||||||
Property, Plant and Equipment | ||||||||||||||||||||
Acquisitions for the Queensland Art Gallery’s collection | 305 | 2,500 | Ongoing | |||||||||||||||||
Ongoing replacement of plant and equipment | 305 | 300 | Ongoing | |||||||||||||||||
|
| |||||||||||||||||||
Total Property, Plant and Equipment | 2,800 | |||||||||||||||||||
|
| |||||||||||||||||||
QUEENSLAND PERFORMING ARTS TRUST |
| |||||||||||||||||||
Property, Plant and Equipment | ||||||||||||||||||||
Property, plant and equipment | 305 | 2,000 | Ongoing | |||||||||||||||||
|
| |||||||||||||||||||
Total Property, Plant and Equipment | 2,000 | |||||||||||||||||||
|
| |||||||||||||||||||
QUEENSLAND SHARED SERVICES | ||||||||||||||||||||
Property, Plant and Equipment | ||||||||||||||||||||
Optimisation projects and initiatives | 305 | 900 | Ongoing | |||||||||||||||||
Asset replacement | 305 | 100 | Ongoing | |||||||||||||||||
|
| |||||||||||||||||||
Total Property, Plant and Equipment | 1,000 | |||||||||||||||||||
|
| |||||||||||||||||||
TOTAL COMMUNITIES, HOUSING AND DIGITAL ECONOMY (PPE) |
| 453,946 | ||||||||||||||||||
|
| |||||||||||||||||||
TOTAL COMMUNITIES, HOUSING AND DIGITAL ECONOMY (CG) |
| 134,896 | ||||||||||||||||||
|
| |||||||||||||||||||
Note:
| 1. | The Total Estimated Cost of $175 million includes a State contribution of $150 million and a contribution by the Queensland Performing Arts Trust of $25 million. |
37
Capital Statement 2022-23
| 3.4 | EDUCATION |
Total capital purchases for the Education portfolio (including the Department of Education and related entities) are $1.457 billion in 2022-23. Total capital grants for the portfolio are $149.8 million in 2022-23.
Department of Education
The 2022-23 capital purchases of $1.457 billion include $1.371 billion for the construction and refurbishment of school educational facilities and early childhood education and care services. Capital works planning targets government priorities in line with population growth and shifts, changes in educational needs and high priority student and staff health and safety needs.
Program Highlights (Property, Plant and Equipment)
| • | $521.7 million for the Building Future Schools Program to deliver world class learning environments for students; including $117.5 million for new schools opening in 2023, $253.8 million for new schools opening in 2024 and $7.5 million for new schools opening in 2025 and 2026. |
| • | $327.1 million for the provision of additional facilities at existing state schools experiencing faster enrolment growth. |
| • | $263.8 million for critical infrastructure upgrades to replace and enhance facilities at existing schools; including $194.6 million for the Facilities Renewal, Special School Renewal, Contemporary Learning Environments and Discrete Indigenous Community Renewal programs. |
| • | $109.3 million as part of the School Halls program and $22.1 million as part of the Shovel Ready program under the Great Schools, Great Future election commitment to boost education infrastructure investment across Queensland. |
| • | $23.6 million to link industry and local high schools to provide students with pathways into rewarding careers and confidently transition into the world of work under the Local Schools, Local Jobs election commitment. |
Program Highlights (Capital Grants)
| • | $120.1 million is provided for the non-state schooling sector and student hostels. |
| • | $29.8 million is provided for racing infrastructure projects that contribute to the growth and sustainability of the Queensland racing industry. |
38
Capital Statement 2022-23
| Education | ||||||||||||||||||
Project | Statistical Area | Total Estimated Cost $‘000 | Expenditure to 30-06-22 $‘000 | Budget 2022-23 $‘000 | Post 2022-23 $‘000 | |||||||||||||
DEPARTMENT OF EDUCATION | ||||||||||||||||||
Property, Plant and Equipment | ||||||||||||||||||
Education Capital Works Program | ||||||||||||||||||
New schools in 20241 | Various | 578,064 | 7,354 | 239,918 | 330,792 | |||||||||||||
New schools in 2025 and 20262 | Various | 366,094 | 7,498 | 358,596 | ||||||||||||||
New primary school in Augustine Heights | 310 | 72,457 | 15,635 | 24,770 | 32,052 | |||||||||||||
New primary school in Brisbane’s inner west | 304 | 77,226 | 792 | 13,465 | 62,969 | |||||||||||||
New primary school in Ripley | 310 | 56,311 | 10,298 | 28,864 | 17,149 | |||||||||||||
New primary school in Yarrabilba | 311 | 58,703 | 15,135 | 29,542 | 14,026 | |||||||||||||
New secondary school in Palmview | 316 | 93,357 | 17,583 | 34,709 | 41,065 | |||||||||||||
Baringa State Secondary College - New secondary school | 316 | 99,791 | 62,225 | 24,673 | 12,893 | |||||||||||||
Coomera State Special School - New special school | 309 | 42,891 | 29,290 | 4,117 | 9,484 | |||||||||||||
Everleigh State School - New primary school | 311 | 57,294 | 37,581 | 11,506 | 8,207 | |||||||||||||
Gainsborough State School - New primary school | 309 | 51,989 | 37,604 | 9,979 | 4,406 | |||||||||||||
Mango Hill State Secondary College - New secondary school | 314 | 70,422 | 68,858 | 1,564 | ||||||||||||||
Albany Creek State High School - Additional classrooms | 314 | 13,064 | 2,015 | 8,287 | 2,762 | |||||||||||||
Aspley Special School - Additional classrooms | 302 | 14,720 | 4,325 | 7,796 | 2,599 | |||||||||||||
Aurukun State School - Administration upgrades | 315 | 2,220 | 555 | 1,665 | ||||||||||||||
Aviation High - New skills development and training facilities | 305 | 740 | 244 | 496 | ||||||||||||||
Ayr State High School - New hall facility | 318 | 5,175 | 994 | 2,174 | 2,007 | |||||||||||||
Balmoral State High School - Administration upgrades | 305 | 5,399 | 713 | 3,421 | 1,265 | |||||||||||||
Beenleigh Special School - Additional classrooms | 311 | 15,456 | 1,380 | 11,937 | 2,139 | |||||||||||||
Beenleigh State High School - New hall facility | 311 | 10,800 | 369 | 5,424 | 5,007 | |||||||||||||
39
Capital Statement 2022-23
| Education | ||||||||||||||||||
Project | Statistical Area | Total Estimated Cost $‘000 | Expenditure to 30-06-22 $‘000 | Budget 2022-23 $‘000 | Post 2022-23 $‘000 | |||||||||||||
Bell State School - Additional specialist classrooms | 307 | 403 | 403 | |||||||||||||||
Bellevue Park State School - Additional classrooms | 309 | 4,875 | 938 | 2,953 | 984 | |||||||||||||
Bowen State High School - New skills development and training facilities | 312 | 1,036 | 394 | 642 | ||||||||||||||
Bracken Ridge State High School - Additional classrooms | 302 | 10,764 | 1,257 | 7,130 | 2,377 | |||||||||||||
Bray Park State High School - Additional classrooms | 314 | 14,207 | 2,443 | 11,764 | ||||||||||||||
Bremer State High School - Additional specialist classrooms | 310 | 6,584 | 2,566 | 4,018 | ||||||||||||||
Brisbane South State Secondary College - Stage 1 sports fields | 303 | 6,989 | 2,008 | 4,981 | ||||||||||||||
Buderim Mountain State School - New hall facility | 316 | 4,500 | 270 | 2,200 | 2,030 | |||||||||||||
Burnside State High School - New hall facility | 316 | 9,630 | 900 | 4,072 | 4,658 | |||||||||||||
Bwgcolman Community School - Administration upgrades | 318 | 3,150 | 1,080 | 2,070 | ||||||||||||||
Caboolture State High School - Additional classrooms | 313 | 12,511 | 8,838 | 2,755 | 918 | |||||||||||||
Caboolture State High School - Upgrade skills development and training facilities | 313 | 1,110 | 555 | 555 | ||||||||||||||
Cairns State High School - Additional specialist classrooms | 306 | 606 | 606 | |||||||||||||||
Cairns State Special School - Additional classrooms | 306 | 9,141 | 2,190 | 6,951 | ||||||||||||||
Cairns West State School - Amenities upgrades | 306 | 840 | 309 | 531 | ||||||||||||||
Calamvale Special School - Additional classrooms | 303 | 18,587 | 2,015 | 12,429 | 4,143 | |||||||||||||
Calliope State High School - Additional classrooms | 308 | 12,696 | 7,176 | 4,140 | 1,380 | |||||||||||||
Caloundra State School - Upgrade existing hall facility | 316 | 3,225 | 630 | 1,463 | 1,132 | |||||||||||||
Capalaba State College - New hall facility | 301 | 7,200 | 225 | 3,393 | 3,582 | |||||||||||||
40
Capital Statement 2022-23
| Education | ||||||||||||||||||
Project | Statistical Area | Total Estimated Cost $‘000 | Expenditure to 30-06-22 $‘000 | Budget 2022-23 $‘000 | Post 2022-23 $‘000 | |||||||||||||
Capella State School - Administration upgrades | 308 | 1,620 | 593 | 1,027 | ||||||||||||||
Cavendish Road State High School - Site renewal | 303 | 1,433 | 1,433 | |||||||||||||||
Centenary Heights State High School - Additional classrooms | 317 | 9,102 | 2,453 | 6,649 | ||||||||||||||
Chancellor State College - New hall facility | 316 | 7,650 | 675 | 3,627 | 3,348 | |||||||||||||
Chinchilla State High School - New skills development and training facilities | 307 | 2,071 | 481 | 1,519 | 71 | |||||||||||||
Claremont Special School - Additional classrooms | 310 | 12,972 | 368 | 6,992 | 5,612 | |||||||||||||
Clermont State High School - New skills development and training facilities | 312 | 962 | 189 | 773 | ||||||||||||||
Clifton State High School - Upgrade existing hall facility | 307 | 2,484 | 572 | 1,243 | 669 | |||||||||||||
Clifton State High School - Upgrade skills development and training facilities | 307 | 1,036 | 183 | 853 | ||||||||||||||
Cloncurry State School P-12 - Upgrade skills development and training facilities | 315 | 370 | 111 | 259 | ||||||||||||||
Coolum State High School - Additional classrooms | 316 | 16,652 | 4,647 | 9,004 | 3,001 | |||||||||||||
Coombabah State High School - Additional classrooms | 309 | 9,982 | 1,105 | 6,658 | 2,219 | |||||||||||||
Dalby State High School - Upgrade skills development and training facilities | 307 | 2,024 | 117 | 1,386 | 521 | |||||||||||||
Darling Point Special School - Additional classrooms | 301 | 12,880 | 1,196 | 7,084 | 4,600 | |||||||||||||
Darra State School - Additional classrooms | 310 | 6,713 | 3,693 | 3,020 | ||||||||||||||
Deception Bay State High School - Additional classrooms | 313 | 7,336 | 3,356 | 3,980 | ||||||||||||||
Deception Bay State School - New hall facility | 313 | 4,500 | 675 | 2,486 | 1,339 | |||||||||||||
Dirranbandi P-10 State School - Additional specialist classrooms | 307 | 606 | 606 | |||||||||||||||
41
Capital Statement 2022-23
| Education | ||||||||||||||||||
Project | Statistical Area | Total Estimated Cost $‘000 | Expenditure to 30-06-22 $‘000 | Budget 2022-23 $‘000 | Post 2022-23 $‘000 | |||||||||||||
Dysart State High School - Upgrade skills development and training facilities | 312 | 666 | 111 | 555 | ||||||||||||||
Edge Hill State School - Administration upgrades | 306 | 4,680 | 1,657 | 2,207 | 816 | |||||||||||||
Emerald State High School - Additional classrooms | 308 | 8,167 | 3,700 | 4,467 | ||||||||||||||
Emerald State School - Administration upgrades | 308 | 1,620 | 630 | 990 | ||||||||||||||
Enoggera State School - Additional classrooms | 304 | 6,531 | 3,354 | 2,383 | 794 | |||||||||||||
Flagstone State School - Additional classrooms | 311 | 7,912 | 1,381 | 5,754 | 777 | |||||||||||||
Geebung Special School - Additional classrooms | 302 | 15,439 | 2,995 | 9,333 | 3,111 | |||||||||||||
Gin Gin State High School - Administration upgrades | 319 | 2,250 | 1,175 | 1,075 | ||||||||||||||
Gladstone Central State School - New hall facility | 308 | 5,175 | 450 | 2,457 | 2,268 | |||||||||||||
Gladstone State High School - Additional specialist classrooms | 308 | 9,731 | 3,154 | 6,577 | ||||||||||||||
Gladstone State High School - Upgrade skills development and training facilities | 308 | 1,480 | 74 | 1,125 | 281 | |||||||||||||
Glenala State High School - Additional classrooms | 310 | 7,544 | 514 | 6,563 | 467 | |||||||||||||
Glenala State High School - Upgrade existing hall facility | 310 | 4,500 | 462 | 2,625 | 1,413 | |||||||||||||
Glenala State High School - Upgrade skills development and training facilities | 310 | 1,665 | 586 | 863 | 216 | |||||||||||||
Glenview State School - Administration upgrades | 316 | 4,500 | 367 | 3,017 | 1,116 | |||||||||||||
Goodna Special School - Additional classrooms | 310 | 15,640 | 1,380 | 10,695 | 3,565 | |||||||||||||
Goondiwindi State High School - Additional specialist classrooms | 307 | 606 | 606 | |||||||||||||||
Gordonvale State High School - Additional specialist classrooms | 306 | 565 | 565 | |||||||||||||||
42
Capital Statement 2022-23
| Education | ||||||||||||||||||
Project | Statistical Area | Total Estimated Cost $‘000 | Expenditure to 30-06-22 $‘000 | Budget 2022-23 $‘000 | Post 2022-23 $‘000 | |||||||||||||
Heatley Secondary College - New commercial kitchen | 318 | 860 | 292 | 568 | ||||||||||||||
Highfields State School - Administration upgrades | 317 | 2,700 | 1,260 | 1,440 | ||||||||||||||
Holland Park State High School - Additional specialist classrooms | 303 | 11,770 | 2,883 | 8,887 | ||||||||||||||
Holland Park State High School - Site renewal | 303 | 1,905 | 1,905 | |||||||||||||||
Indooroopilly State School - Administration upgrades | 304 | 3,600 | 270 | 2,431 | 899 | |||||||||||||
Inglewood State School - Additional specialist classrooms | 307 | 606 | 606 | |||||||||||||||
Innisfail State College - Additional specialist classrooms | 306 | 364 | 364 | |||||||||||||||
Ipswich State High School - Additional classrooms | 310 | 25,848 | 1,952 | 17,020 | 6,876 | |||||||||||||
Kallangur State School - Additional classrooms | 314 | 7,899 | 1,208 | 5,067 | 1,624 | |||||||||||||
Kawana Waters State College - Additional classrooms | 316 | 5,979 | 3,815 | 1,623 | 541 | |||||||||||||
Kenmore South State School - Additional classrooms | 304 | 23,486 | 6,416 | 17,070 | ||||||||||||||
Kenmore State High School - Additional specialist classrooms | 304 | 4,893 | 2,307 | 2,586 | ||||||||||||||
Kepnock State High School - Additional specialist classrooms | 319 | 6,393 | 2,928 | 3,465 | ||||||||||||||
Keppel Sands State School - Additional specialist classrooms | 308 | 343 | 343 | |||||||||||||||
Kilcoy State High School - New hall facility | 313 | 4,770 | 315 | 2,317 | 2,138 | |||||||||||||
Kingaroy State High School - Upgrade skills development and training facilities | 319 | 1,184 | 111 | 1,073 | ||||||||||||||
Kingston State School - FamilyLinQ - school-based hub | 311 | 7,826 | 402 | 4,300 | 3,124 | |||||||||||||
Kirwan State School - Administration upgrades | 318 | 1,800 | 652 | 1,148 | ||||||||||||||
Lawnton State School - Additional classrooms | 314 | 9,035 | 7,007 | 1,521 | 507 | |||||||||||||
Longreach State High School - Upgrade skills development and training facilities | 315 | 2,302 | 112 | 1,752 | 438 | |||||||||||||
43
Capital Statement 2022-23
| Education | ||||||||||||||||||
Project | Statistical Area | Total Estimated Cost $‘000 | Expenditure to 30-06-22 $‘000 | Budget 2022-23 $‘000 | Post 2022-23 $‘000 | |||||||||||||
MacGregor State High School - Site renewal | 303 | 2,121 | 1,591 | 530 | ||||||||||||||
Mackay Northern Beaches State High School - Additional classrooms | 312 | 6,164 | 313 | 4,388 | 1,463 | |||||||||||||
Mackay Northern Beaches State High School - Upgrade skills development and training facilities | 312 | 889 | 167 | 722 | ||||||||||||||
Malanda State High School - Additional classrooms | 306 | 10,580 | 2,053 | 6,395 | 2,132 | |||||||||||||
Mango Hill State School - Additional classrooms | 314 | 3,726 | 1,840 | 1,886 | ||||||||||||||
Manly State School - Additional classrooms | 301 | 9,292 | 460 | 5,152 | 3,680 | |||||||||||||
Mansfield State High School - Additional classrooms | 303 | 16,206 | 2,015 | 10,643 | 3,548 | |||||||||||||
Marsden State School - Additional classrooms | 311 | 10,120 | 8,280 | 1,840 | ||||||||||||||
Miami State High School - New hall facility | 309 | 9,000 | 250 | 4,550 | 4,200 | |||||||||||||
Mitchelton Special School - Additional classrooms | 304 | 8,280 | 2,751 | 4,147 | 1,382 | |||||||||||||
Moranbah East State School - Additional classrooms | 312 | 5,704 | 414 | 5,290 | ||||||||||||||
Moranbah State High School - Additional classrooms | 312 | 7,437 | 3,398 | 4,039 | ||||||||||||||
Morayfield State High School - Additional classrooms | 313 | 11,871 | 2,693 | 9,178 | ||||||||||||||
Mount Gravatt State High School - Site renewal | 303 | 1,511 | 1,511 | |||||||||||||||
Mudgeeraba Special School - Additional classrooms | 309 | 12,533 | 3,854 | 6,509 | 2,170 | |||||||||||||
Nerang State High School - Upgrade existing hall facility | 309 | 4,499 | 226 | 2,222 | 2,051 | |||||||||||||
Nirimba State Primary School - New primary school | 316 | 54,006 | 41,410 | 7,558 | 5,038 | |||||||||||||
Noosa District State High School - Ponoma Campus - New hall facility | 316 | 5,175 | 450 | 2,457 | 2,268 | |||||||||||||
44
Capital Statement 2022-23
| Education | ||||||||||||||||||
Project | Statistical Area | Total Estimated Cost $‘000 | Expenditure to 30-06-22 $‘000 | Budget 2022-23 $‘000 | Post 2022-23 $‘000 | |||||||||||||
North Arm State School - Administration upgrades | 316 | 4,500 | 184 | 3,179 | 1,137 | |||||||||||||
Oakey State High School - New hall facility | 307 | 5,175 | 191 | 2,592 | 2,392 | |||||||||||||
Oakleigh State School - New hall facility | 305 | 4,500 | 360 | 2,153 | 1,987 | |||||||||||||
Pallara State School - Additional classrooms | 303 | 14,553 | 3,814 | 10,739 | ||||||||||||||
Palm Beach-Currumbin State High School - New hall facility | 309 | 9,001 | 249 | 4,551 | 4,201 | |||||||||||||
Palmview State Primary School - New primary school | 316 | 50,596 | 38,658 | 6,157 | 5,781 | |||||||||||||
Palmview State Special School - New special school | 316 | 48,377 | 34,445 | 8,680 | 5,252 | |||||||||||||
Park Ridge State High School - Additional classrooms | 311 | 11,132 | 4,552 | 4,935 | 1,645 | |||||||||||||
Park Ridge State School - Administration upgrades | 311 | 3,478 | 181 | 3,297 | ||||||||||||||
Parkhurst State School - Administration upgrades | 308 | 5,400 | 1,800 | 2,628 | 972 | |||||||||||||
Pimlico State High School - Additional specialist classrooms | 318 | 403 | 403 | |||||||||||||||
Pimlico State High School - New hall facility | 318 | 9,900 | 202 | 4,809 | 4,889 | |||||||||||||
Pimlico State High School - Upgrade skills development and training facilities | 318 | 1,036 | 52 | 984 | ||||||||||||||
Pine Rivers Special School - Additional classrooms | 314 | 13,524 | 2,344 | 8,385 | 2,795 | |||||||||||||
Pittsworth State High School - Additional specialist classrooms | 307 | 727 | 727 | |||||||||||||||
Pittsworth State High School - New hall facility | 307 | 5,624 | 164 | 3,171 | 2,289 | |||||||||||||
Proserpine State High School - Additional specialist classrooms | 312 | 606 | 606 | |||||||||||||||
Prospect Creek State School - Additional specialist classrooms | 308 | 525 | 525 | |||||||||||||||
Redlynch State College - Upgrade existing hall facility - Junior Campus | 306 | 2,880 | 28 | 1,854 | 998 | |||||||||||||
45
Budget Strategy and Outlook 2020-21
| Education | ||||||||||||||||||
Project | Statistical Area | Total Estimated Cost $‘000 | Expenditure to 30-06-22 $‘000 | Budget 2022-23 $‘000 | Post 2022-23 $‘000 | |||||||||||||
Redlynch State College - Upgrade existing hall facility - Senior Campus | 306 | 3,376 | 28 | 2,176 | 1,172 | |||||||||||||
Rochedale State High School - New hall facility | 303 | 10,800 | 362 | 5,428 | 5,010 | |||||||||||||
Rochedale State High School - Site renewal | 303 | 1,478 | 1,478 | |||||||||||||||
Rochedale State School - Additional classrooms | 303 | 10,120 | 4,095 | 4,519 | 1,506 | |||||||||||||
Rockhampton North Special School - Additional classrooms | 308 | 14,628 | 1,087 | 8,941 | 4,600 | |||||||||||||
Rockhampton Special School - Additional classrooms | 308 | 8,768 | 3,333 | 5,435 | ||||||||||||||
Rockhampton State High School - New skills development and training facilities | 308 | 1,850 | 707 | 1,143 | ||||||||||||||
Roma State College - Upgrade skills development and training facilities | 307 | 1,110 | 148 | 962 | ||||||||||||||
Rosewood State High School - Additional classrooms | 310 | 6,441 | 250 | 5,439 | 752 | |||||||||||||
Runcorn State High School - Site renewal | 303 | 2,329 | 1,747 | 582 | ||||||||||||||
Sandgate District State High School - Upgrade existing hall facility | 302 | 4,500 | 333 | 2,270 | 1,897 | |||||||||||||
Serviceton South State School - Additional classrooms | 310 | 5,408 | 3,008 | 2,400 | ||||||||||||||
Seven Hills State School - New hall facility | 305 | 7,200 | 216 | 3,632 | 3,352 | |||||||||||||
Spring Mountain State School - Additional classrooms | 310 | 20,689 | 5,122 | 15,567 | ||||||||||||||
Springsure State School - Additional specialist classrooms | 308 | 666 | 666 | |||||||||||||||
St George State High School - New hall facility | 307 | 5,175 | 236 | 2,568 | 2,371 | |||||||||||||
St George State High School - Upgrade skills development and training facilities | 307 | 2,220 | 90 | 1,704 | 426 | |||||||||||||
46
Capital Statement 2022-23
| Education | ||||||||||||||||||
Project | Statistical Area | Total Estimated Cost $‘000 | Expenditure to 30-06-22 $‘000 | Budget 2022-23 $‘000 | Post 2022-23 $‘000 | |||||||||||||
Sunnybank Special School - Additional classrooms | 303 | 7,544 | 4,240 | 2,478 | 826 | |||||||||||||
Sunnybank State High School - New skills development and training facilities | 303 | 2,220 | 793 | 1,201 | 226 | |||||||||||||
Sunnybank State High School - Site renewal | 303 | 2,804 | 2,103 | 701 | ||||||||||||||
Tagai State College - Thursday Island Primary Campus - Amenities upgrades | 315 | 800 | 400 | 400 | ||||||||||||||
Taigum State School - Additional classrooms | 302 | 7,440 | 3,370 | 4,070 | ||||||||||||||
Tara Shire State College - New skills development and training facilities | 307 | 1,480 | 141 | 1,071 | 268 | |||||||||||||
The Hall State School - New hall facility | 308 | 4,500 | 668 | 2,491 | 1,341 | |||||||||||||
Thuringowa State High School - New hall facility | 318 | 5,175 | 527 | 2,417 | 2,231 | |||||||||||||
Thuringowa State High School - Upgrade skills development and training facilities | 318 | 888 | 103 | 785 | ||||||||||||||
Toogoolawah State High School - New hall facility | 310 | 5,175 | 450 | 2,457 | 2,268 | |||||||||||||
Toolooa State High School - Additional classrooms | 308 | 7,176 | 276 | 6,900 | ||||||||||||||
Toolooa State High School - New hall facility | 308 | 2,881 | 273 | 1,695 | 913 | |||||||||||||
Toowoomba West Special School - Additional classrooms | 317 | 4,179 | 1,951 | 1,671 | 557 | |||||||||||||
Toowoomba West Special School - Administration upgrades | 317 | 3,600 | 2,250 | 1,350 | ||||||||||||||
Townsville Community Learning Centre - A State Special School - Additional classrooms | 318 | 6,992 | 5,352 | 1,640 | ||||||||||||||
Townsville Community Learning Centre - A State Special School - New hall facility | 318 | 5,175 | 227 | 2,573 | 2,375 | |||||||||||||
Trinity Bay State High School - New hall facility | 306 | 10,350 | 343 | 5,204 | 4,803 | |||||||||||||
47
Capital Statement 2022-23
| Education | ||||||||||||||||||
Project | Statistical Area | Total Estimated Cost $‘000 | Expenditure to 30-06-22 $‘000 | Budget 2022-23 $‘000 | Post 2022-23 $‘000 | |||||||||||||
Tully State High School - Additional classrooms | 306 | 2,168 | 2,168 | |||||||||||||||
Urangan Point State School - New hall facility | 319 | 5,175 | 361 | 2,503 | 2,311 | |||||||||||||
Urangan State High School - New hall facility | 319 | 9,630 | 752 | 4,617 | 4,261 | |||||||||||||
Victoria Point State High School - Additional classrooms | 301 | 8,648 | 846 | 5,318 | 2,484 | |||||||||||||
Walloon State School - Additional classrooms | 310 | 4,784 | 304 | 4,157 | 323 | |||||||||||||
Warwick State High School - New hall facility | 307 | 5,176 | 376 | 2,496 | 2,304 | |||||||||||||
Waterford West State School - Additional classrooms | 311 | 6,901 | 2,690 | 3,158 | 1,053 | |||||||||||||
Western Cape College - Weipa - Additional classrooms | 315 | 10,115 | 2,753 | 7,362 | ||||||||||||||
Whites Hill State College - Site renewal | 303 | 2,977 | 2,233 | 744 | ||||||||||||||
Wilston State School - New hall facility | 305 | 7,200 | 270 | 3,600 | 3,330 | |||||||||||||
Wishart State School - Additional classrooms | 303 | 5,888 | 129 | 4,508 | 1,251 | |||||||||||||
Woodcrest State College - Upgrade skills development and training facilities | 310 | 1,665 | 74 | 1,591 | ||||||||||||||
Wooloowin State School - Additional classrooms | 305 | 11,777 | 2,426 | 7,013 | 2,338 | |||||||||||||
Woree State School - New hall facility | 306 | 1,530 | 225 | 1,305 | ||||||||||||||
Yandina State School - Additional classrooms | 316 | 8,363 | 3,247 | 5,116 | ||||||||||||||
Yeppoon State High School - Additional classrooms | 308 | 8,786 | 8,528 | 258 | ||||||||||||||
Cooler Cleaner Schools program - air conditioning installation and replacement | Various | 276,415 | 199,400 | 40,515 | 36,500 | |||||||||||||
Discrete communities renewal | Various | 36,680 | 8,760 | 27,920 | ||||||||||||||
Facilities renewal | Various | 147,601 | Ongoing | |||||||||||||||
General and minor works | Various | 60,764 | Ongoing | |||||||||||||||
48
Capital Statement 2022-23
| Education | ||||||||||||||||||||
Project | Statistical Area | Total Estimated Cost $‘000 | Expenditure to 30-06-22 $‘000 | Budget 2022-23 $‘000 | Post 2022-23 $‘000 | |||||||||||||||
Land acquisition | Various | 65,467 | Ongoing | |||||||||||||||||
School infrastructure enhancement | Various | 25,000 | Ongoing | |||||||||||||||||
School playground and tuckshop upgrades | Various | 15,000 | 1,500 | 13,500 | ||||||||||||||||
School sports infrastructure | Various | 75,000 | 1,500 | 73,500 | ||||||||||||||||
School Subsidy Scheme | Various | 9,100 | Ongoing | |||||||||||||||||
Shovel Ready Program - Various minor works | Various | 46,750 | 11,900 | 22,100 | 12,750 | |||||||||||||||
Special school renewal3 | Various | 81,645 | 7,730 | 73,915 | ||||||||||||||||
|
| |||||||||||||||||||
Sub-total Education Capital Works Program | 1,370,764 | |||||||||||||||||||
|
| |||||||||||||||||||
Early Childhood Education and Care Capital Works Program |
| |||||||||||||||||||
General and minor works | Various | 600 | Ongoing | |||||||||||||||||
|
| |||||||||||||||||||
Sub-total Early Childhood Education and Care Capital Works Program |
| 600 | ||||||||||||||||||
|
| |||||||||||||||||||
Plant and Equipment | ||||||||||||||||||||
Education plant and equipment | Various | 80,028 | Ongoing | |||||||||||||||||
Office of Industrial Relations plant and equipment | Various | 5,678 | Ongoing | |||||||||||||||||
|
| |||||||||||||||||||
Sub-total Plant and Equipment | 85,706 | |||||||||||||||||||
|
| |||||||||||||||||||
Total Property, Plant and Equipment | 1,457,070 | |||||||||||||||||||
|
| |||||||||||||||||||
Capital Grants | ||||||||||||||||||||
Capital grants - Education | Various | 120,060 | Ongoing | |||||||||||||||||
Racing Infrastructure Fund | Various | 129,700 | 73,853 | 27,172 | 28,675 | |||||||||||||||
Country Racing Program | Various | 15,600 | 13,000 | 2,600 | ||||||||||||||||
|
| |||||||||||||||||||
Total Capital Grants | 149,832 | |||||||||||||||||||
|
| |||||||||||||||||||
TOTAL EDUCATION (PPE) | 1,457,070 | |||||||||||||||||||
|
| |||||||||||||||||||
TOTAL EDUCATION (CG) | 149,832 | |||||||||||||||||||
|
| |||||||||||||||||||
Notes:
| 1. | Refers to funding allocated in the 2021-22 Budget for new schools to open in 2024. |
| 2. | Refers to funding allocated in the 2022-23 Budget for 4 new schools to open in 2025 (primary schools in Caboolture West, Caloundra South, Ripley and the Flagstone area) and one new primary school to open in 2026 (in the Bahrs Scrub area). |
| 3. | Planning has commenced for infrastructure renewal at Red Hill Special School (both campuses), Ipswich Special School, Western Suburbs State Special School, Kuraby Special School, Woody Point Special School, and Maryborough Special School. |
49
Capital Statement 2022-23
| 3.5 | EMPLOYMENT, SMALL BUSINESS AND TRAINING |
In 2022-23, the Employment, Small Business and Training portfolio, including TAFE Queensland, has capital purchases of $103.6 million and capital grants of $8.5 million.
Department of Employment, Small Business and Training
The 2022-23 capital program for the Department of Employment, Small Business and Training of $84.5 million includes $34.8 million of capital purchases and $8.5 million of capital grants for the continued delivery of the Equipping TAFE for Our Future program. Additionally, $500,000 has been allocated for the finalisation of projects delivered in partnership with the Australian Government’s Revitalising TAFE Campuses Across Australia initiative.
A further $40.7 million is provided for the Annual Training Infrastructure Program to renew and revitalise training infrastructure across the state, to improve accessibility to the necessary skills and training required to boost labour market productivity and aid economic recovery.
Program Highlights (Property, Plant and Equipment)
| • | $34.8 million for the continued delivery of Equipping TAFE for Our Future projects including Eagle Farm Robotics and Advanced Manufacturing Centre, Bundamba Metal Trades, Manufacturing and Robotics Centre, Bohle Advanced Manufacturing Skills Laboratory, Bundaberg Agriculture and Horticulture Centre, Bundaberg Maker Space, Cairns Advanced Manufacturing Hub and Cairns Cyber Security Training Operations Centre and the commencement of Bohle Renewable Energy Centre. |
| • | $40.7 million for the delivery of the Annual Training Infrastructure Program includes building and fire compliance works and asset lifecycle condition upgrades for various TAFE locations across Queensland. The program focuses on improving safety, sustainability and resilience by the renewal and upgrades of roofs, roads, carparks, electrical works, building management and heating, ventilation and air conditioning systems. |
Program Highlights (Capital Grants)
| • | $8.5 million for the continued delivery of Equipping TAFE for Our Future grant projects including Central Queensland University Rockhampton Campus Consolidation and Training Centre and Mackay Ooralea Trade Training Centre Expansion. |
50
Capital Statement 2022-23
| Employment, Small Business and Training | ||||||||||||||||||||
Project | Statistical Area | Total Estimated Cost $‘000 | Expenditure to 30-06-22 $‘000 | Budget 2022-23 $‘000 | Post 2022-23 $‘000 | |||||||||||||||
DEPARTMENT OF EMPLOYMENT, SMALL BUSINESS AND TRAINING | ||||||||||||||||||||
Property, Plant and Equipment | ||||||||||||||||||||
Equipping TAFE for Our Future | ||||||||||||||||||||
Bohle Advanced Manufacturing Skills Lab | 318 | 3,600 | 720 | 2,880 | ||||||||||||||||
Bohle Renewable Energy Centre | 318 | 10,600 | 5,300 | 5,300 | ||||||||||||||||
Bundaberg Agriculture and Horticulture Centre | 319 | 3,350 | 670 | 2,680 | ||||||||||||||||
Bundaberg Maker Space | 319 | 1,000 | 75 | 925 | ||||||||||||||||
Bundamba Metal Trades, Manufacturing and Robotics Centre | 310 | 7,000 | 1,400 | 5,600 | ||||||||||||||||
Cairns Advanced Manufacturing Hub | 306 | 3,600 | 270 | 3,330 | ||||||||||||||||
Cairns Cyber Security Training Operation Centre | 306 | 2,000 | 150 | 1,850 | ||||||||||||||||
Eagle Farm Robotics and Advanced Manufacturing Centre | 302 | 28,900 | 2,168 | 12,282 | 14,450 | |||||||||||||||
Revitalising TAFE | ||||||||||||||||||||
Revitalising TAFE - Coomera Marine Centre of Excellence | 309 | 11,082 | 10,582 | 500 | ||||||||||||||||
Annual Training Infrastructure Program | Various | 40,664 | Ongoing | |||||||||||||||||
|
| |||||||||||||||||||
Total Property, Plant and Equipment | 76,011 | |||||||||||||||||||
|
| |||||||||||||||||||
Capital Grants | ||||||||||||||||||||
Equipping TAFE for Our Future | ||||||||||||||||||||
Central Queensland University Rockhampton Campus Consolidation and Training Centre | 308 | 8,400 | 4,418 | 3,982 | ||||||||||||||||
Mackay Ooralea Trade Training Centre Expansion | 312 | 7,500 | 3,000 | 4,500 | ||||||||||||||||
|
| |||||||||||||||||||
Total Capital Grants | 8,482 | |||||||||||||||||||
|
| |||||||||||||||||||
TAFE QUEENSLAND | ||||||||||||||||||||
Property, Plant and Equipment | ||||||||||||||||||||
Training and operational equipment acquisition, replacement and modernisation | ||||||||||||||||||||
Rolling replacement program | Various | 2,435 | Ongoing | |||||||||||||||||
Modernisation and reinvigoration projects | Various | 3,855 | Ongoing | |||||||||||||||||
51
Capital Statement 2022-23
| Employment, Small Business and Training | ||||||||||||||||||
Project | Statistical Area | Total Estimated Cost $‘000 | Expenditure to 30-06-22 $‘000 | Budget 2022-23 $‘000 | Post 2022-23 $‘000 | |||||||||||||
Great Barrier Reef International Marine College marine training vessel | 306 | 1,000 | 1,000 | |||||||||||||||
ICT program of work | ||||||||||||||||||
ICT hardware and equipment | Various | 8,709 | Ongoing | |||||||||||||||
Identity access management build | Various | 1,689 | 1,009 | 680 | ||||||||||||||
Educational planning system | Various | 2,562 | 1,685 | 877 | ||||||||||||||
Other ICT projects | Various | 920 | Ongoing | |||||||||||||||
Other | ||||||||||||||||||
Right of use assets | Various | 485 | 485 | |||||||||||||||
Product development | Various | 6,604 | Ongoing | |||||||||||||||
Aviation Australia capital program | Various | 1,220 | Ongoing | |||||||||||||||
|
| |||||||||||||||||
Total Property, Plant and Equipment | 27,593 | |||||||||||||||||
|
| |||||||||||||||||
TOTAL EMPLOYMENT, SMALL BUSINESS AND TRAINING (PPE) | 103,604 | |||||||||||||||||
|
| |||||||||||||||||
TOTAL EMPLOYMENT, SMALL BUSINESS AND TRAINING (CG) | 8,482 | |||||||||||||||||
|
| |||||||||||||||||
52
Capital Statement 2022-23
| 3.6 | ENERGY AND PUBLIC WORKS |
The Energy and Public Works Portfolio includes the Department of Energy and Public Works, energy government owned corporations, and statutory bodies reporting to the Minister for Energy, Renewables and Hydrogen and Minister for Public Works and Procurement.
The portfolio’s capital program for 2022-23 is $2.319 billion. The portfolio’s capital grants for 2022-23 are $112.5 million.
Department of Energy and Public Works
Total capital purchases for the Department of Energy and Public Works are $188.4 million in 2022-23. Total capital grants for the department are $112.5 million in 2022-23.
Program highlights (Property, Plant and Equipment)
| • | $122.2 million investment to deliver safe and secure government employee housing including in remote and regional communities as part of its commitment to attract and retain key frontline staff. This program will include new accommodation for staff delivering critical services, replacement or refurbishment of residences at the end of their useful life to modern design standards and the upgrade of residences to ensure they remain fit-for-purpose and appropriate for employees. |
| • | $46.1 million for the expansion and refurbishment of the Cairns Convention Centre to capitalise on the national and international convention centre markets. |
Program Highlights (Capital Grants)
| • | $112.5 million to eligible homeowners to repair, retrofit or raise their homes to incorporate flood resilient design and materials to reduce the impacts of future flood events. |
CleanCo Queensland Limited
Total capital expenditure planned for 2022-23 is $47.3 million. The capital program is focused on building the renewable and firming energy portfolio, maintaining existing assets, developing trading and reporting systems and refreshing server infrastructure.
Program Highlights (Property, Plant and Equipment)
| • | $16.9 million to develop the Karara Wind Farm. |
| • | $13.6 million to develop Kogan North Gas Fields. |
| • | $7.7 million to maintain existing assets including a major overhaul and related sustaining works at Wivenhoe Power Station. |
| • | $4.4 million to maintain existing assets including a steam turbine overhaul and related sustaining works at Swanbank E Power Station. |
53
Capital Statement 2022-23
CS Energy Limited
Total capital expenditure planned for 2022-23 is $133.4 million. This reflects CS Energy’s continued commitment to ongoing reliability and efficiency of generation plant at its power station sites.
Program Highlights (Property, Plant and Equipment)
| • | $45 million for overhauls and enhancements to, and refurbishment and rebuild of, existing infrastructure at Callide Power Station. |
| • | $37.4 million for investment in 100 megawatt battery storage at Chinchilla. |
| • | $30.3 million for overhauls, enhancements and refurbishment to existing infrastructure at Kogan Creek Power Station. |
| • | $8.6 million for the construction of a renewable hydrogen demonstration plant at Kogan in the Western Downs. |
Energy Queensland Limited
Total capital expenditure planned for 2022-23 is $1.410 billion and forms part of Energy Queensland’s commitment to providing safe, secure and highly reliable electricity to all Queensland customers. Energy Queensland is focused on safety, efficiency, asset management and network capability. The capital program aims to improve and reinforce electricity supplies across Queensland to meet customer needs, especially to cover periods of peak and minimum electricity demand.
Program Highlights (Property, Plant and Equipment)
| • | $19.6 million to continue the replacement of the ageing 66 kilovolt powerline between Childers and Gayndah. |
| • | $18.6 million to replace the ageing Kilkivan Substation. |
| • | $16.7 million to continue the upgrade of the 66 kilovolt Cannonvale to Jubilee Pocket powerline. |
| • | $5.7 million to establish a new 33 kilovolt powerline between Kilcoy and Woodford. |
| • | $5.4 million to replace ageing 11 kilovolt switchgear at Nudgee Substation. |
| • | $4.8 million to refurbish the East Bundaberg Substation. |
Powerlink Queensland
Total capital expenditure planned for 2022-23 is $239.7 million. Powerlink Queensland is the high voltage electricity transmission entity for Queensland. It is predominantly focused on replacement of aged equipment and assets to ensure continued reliable supply of electricity.
54
Capital Statement 2022-23
Program Highlights (Property, Plant and Equipment)
| • | $11.9 million to replace obsolete and ageing Dense Wave Division Multiplexing Network so that communications across the network are maintained. |
| • | $8.4 million to replace aged primary plant at Bouldercombe Substation near Rockhampton. |
| • | $6.3 million to replace the soon to be obsolete energy management system providing real time monitoring of the transmission network. |
| • | $6.2 million to replace aged primary plant at Lilyvale to ensure continued reliability of supply to the surrounding area. |
Stanwell Corporation Limited
Total capital expenditure planned for 2022-23 is $300.1 million. This reflects Stanwell’s commitment to delivering a balanced portfolio for the future, through ongoing investment in the reliability and efficiency of its generation plant, while supporting investment in renewable generation, energy storage and renewable hydrogen.
Program Highlights (Property, Plant and Equipment)
| • | $85.1 million for the 150 megawatt Southern Regional Energy Zone battery project. |
| • | $68.2 million for the Wambo Wind Farm. |
| • | $66.7 million to replace and refurbish existing infrastructure at Tarong Power Station and ensure the continued reliability of supply to Queensland and the National Electricity Market. |
| • | $50.4 million to replace and refurbish existing infrastructure at Stanwell Power Station to ensure the continued reliability of supply to Queensland and the National Electricity Market. |
| • | $21 million to replace and refurbish handling equipment and infrastructure, and develop future mining at Meandu Mine. |
| • | $6.7 million for the Central Queensland Hydrogen project (CQ-H2). |
55
Capital Statement 2022-23
| Energy and Public Works | ||||||||||||||||||
Project | Statistical Area | Total Estimated Cost $‘000 | Expenditure to 30-06-22 $‘000 | Budget 2022-23 $‘000 | Post 2022-23 $‘000 | |||||||||||||
DEPARTMENT OF ENERGY AND PUBLIC WORKS | ||||||||||||||||||
Property, Plant and Equipment | ||||||||||||||||||
Cairns Convention Centre expansion1 and refurbishment | 306 | 172,171 | 126,080 | 46,091 | ||||||||||||||
Thomas Dixon Centre refurbishment | 305 | 96,407 | 86,828 | 9,579 | ||||||||||||||
Government Employee Housing | Various | 122,248 | Ongoing | |||||||||||||||
Office Accommodation Program | Various | 8,640 | Ongoing | |||||||||||||||
Building works and capital replacements | Various | 500 | Ongoing | |||||||||||||||
Other property, plant and equipment | Various | 1,358 | Ongoing | |||||||||||||||
|
| |||||||||||||||||
Total Property, Plant and Equipment | 188,416 | |||||||||||||||||
|
| |||||||||||||||||
Capital Grants | ||||||||||||||||||
Resilient Homes Fund | Various | 375,000 | 112,500 | 262,500 | ||||||||||||||
|
| |||||||||||||||||
Total Capital Grants | 112,500 | |||||||||||||||||
|
| |||||||||||||||||
CLEANCO QUEENSLAND LIMITED | ||||||||||||||||||
Property, Plant and Equipment | ||||||||||||||||||
Wivenhoe overhauls | 310 | 3,065 | Ongoing | |||||||||||||||
Wivenhoe other projects | 310 | 4,606 | Ongoing | |||||||||||||||
Swanbank E overhauls | 310 | 572 | Ongoing | |||||||||||||||
Swanbank E other projects | 310 | 3,781 | Ongoing | |||||||||||||||
Karara Wind Farm development | 307 | 254,348 | 3,990 | 16,946 | 233,412 | |||||||||||||
Kogan North Gas Fields development | 307 | 13,628 | Ongoing | |||||||||||||||
Kareeya Hydro other projects | 306 | 2,022 | Ongoing | |||||||||||||||
Barron Gorge Hydro other projects | 306 | 1,051 | Ongoing | |||||||||||||||
Koombooloomba Dam other projects | 306 | 166 | Ongoing | |||||||||||||||
Other corporate projects | 305 | 1,481 | Ongoing | |||||||||||||||
|
| |||||||||||||||||
Total Property, Plant and Equipment | 47,318 | |||||||||||||||||
|
| |||||||||||||||||
CS ENERGY LIMITED | ||||||||||||||||||
Property, Plant and Equipment | ||||||||||||||||||
Kogan Renewable Hydrogen Demonstration Plant | 307 | 15,000 | 8,598 | 6,402 | ||||||||||||||
Chinchilla Battery | 307 | 109,077 | 25,393 | 37,363 | 46,321 | |||||||||||||
Brisbane headquarters - right of use lease | 305 | 9,062 | 9,062 | |||||||||||||||
56
Capital Statement 2022-23
| Energy and Public Works | ||||||||||||||||||
Project | Statistical Area | Total Estimated Cost $‘000 | Expenditure to 30-06-22 $‘000 | Budget 2022-23 $‘000 | Post 2022-23 $‘000 | |||||||||||||
Callide Power Station enhancements, overhauls, refurbishment and rebuild | 308 | 45,037 | Ongoing | |||||||||||||||
Kogan Creek Power Station enhancements, overhauls and refurbishment | 307 | 30,338 | Ongoing | |||||||||||||||
Kogan Creek Mine developments and refurbishment | 307 | 1,226 | Ongoing | |||||||||||||||
Upgrade of corporate information technology systems | 305 | 1,762 | Ongoing | |||||||||||||||
|
| |||||||||||||||||
Total Property, Plant and Equipment | 133,386 | |||||||||||||||||
|
| |||||||||||||||||
ENERGY QUEENSLAND LIMITED | ||||||||||||||||||
Property, Plant and Equipment | ||||||||||||||||||
System | ||||||||||||||||||
Connections | ||||||||||||||||||
Brisbane | Various | 46,260 | Ongoing | |||||||||||||||
Gold Coast | 309 | 8,954 | Ongoing | |||||||||||||||
Sunshine Coast | 316 | 14,177 | Ongoing | |||||||||||||||
Ergon Energy | Various | 77,795 | Ongoing | |||||||||||||||
Ipswich | 310 | 5,223 | Ongoing | |||||||||||||||
Replacements | ||||||||||||||||||
Network replacement | Various | 544,313 | Ongoing | |||||||||||||||
Surfers Paradise Substation upgrade | 309 | 7,342 | 6,088 | 1,110 | 144 | |||||||||||||
Emerald Comet Substation upgrade | 308 | 4,439 | 2,230 | 1,848 | 361 | |||||||||||||
Howard Substation refurbishment | 319 | 12,400 | 11,017 | 1,224 | 159 | |||||||||||||
Kilcoy Substation upgrade | 313 | 15,933 | 12,864 | 2,703 | 366 | |||||||||||||
Childers - Gayndah - aged line rebuild | 319 | 71,340 | 25,149 | 19,581 | 26,610 | |||||||||||||
Replace 66 kilovolt outdoor switchgear at Garbutt | 318 | 28,608 | 8,632 | 2,862 | 17,114 | |||||||||||||
Replace transformers and switchgear at Black Mountain | 319 | 10,750 | 7,082 | 2,021 | 1,647 | |||||||||||||
Kilkivan Substation replacement | 319 | 30,960 | 4,907 | 18,583 | 7,470 | |||||||||||||
57
Capital Statement 2022-23
| Energy and Public Works | ||||||||||||||||||
Project | Statistical Area | Total Estimated Cost $‘000 | Expenditure to 30-06-22 $‘000 | Budget 2022-23 $‘000 | Post 2022-23 $‘000 | |||||||||||||
Mossman Substation, transmission plant and sections of timber feeder replacement | 306 | 28,150 | 1,918 | 3,026 | 23,206 | |||||||||||||
East Bundaberg Substation refurbishment | 319 | 10,484 | 1,179 | 4,819 | 4,486 | |||||||||||||
Replace 11 kilovolt switchgear at West Toowoomba Substation | 317 | 14,360 | 2,913 | 4,807 | 6,640 | |||||||||||||
Kleinton Substation | 317 | 16,092 | 764 | 128 | 15,200 | |||||||||||||
Rockhampton Glenmore Substation refurbishment | 308 | 10,154 | 300 | 279 | 9,575 | |||||||||||||
New 33 kilovolt feeder (Kilcoy to Woodford) replacing Somerset Dam to Kilcoy feeder | 313 | 21,810 | 1,141 | 5,736 | 14,933 | |||||||||||||
Replace 11 kilovolt switchgear Nudgee Substation | 302 | 10,946 | 1,560 | 5,446 | 3,940 | |||||||||||||
Replace Isolators at Maleny Substation | 316 | 13,722 | 218 | 1,449 | 12,055 | |||||||||||||
Mount Crosby East Substation | 310 | 18,630 | 403 | 3,832 | 14,395 | |||||||||||||
Augmentation | ||||||||||||||||||
Network augmentation | ||||||||||||||||||
Brisbane | Various | 38,739 | Ongoing | |||||||||||||||
Gold Coast | 309 | 17,393 | Ongoing | |||||||||||||||
Ipswich | 310 | 7,047 | Ongoing | |||||||||||||||
Sunshine Coast | 316 | 21,057 | Ongoing | |||||||||||||||
Cairns | 306 | 17,330 | Ongoing | |||||||||||||||
Darling Downs | 307 | 4,332 | Ongoing | |||||||||||||||
Central Queensland | 308 | 4,332 | Ongoing | |||||||||||||||
Mackay | 312 | 17,330 | Ongoing | |||||||||||||||
Outback Queensland | 315 | 17,330 | Ongoing | |||||||||||||||
Toowoomba | 317 | 8,665 | Ongoing | |||||||||||||||
Townsville | 318 | 17,330 | Ongoing | |||||||||||||||
Wide Bay | 319 | 8,664 | Ongoing | |||||||||||||||
|
| |||||||||||||||||
Sub-total Network augmentation | 179,549 | |||||||||||||||||
|
| |||||||||||||||||
Cannonvale-Jubilee Pocket 66 kilovolt reinforcement | 312 | 27,459 | 2,772 | 16,659 | 8,028 | |||||||||||||
Gracemere Substation | 308 | 11,518 | 11,013 | 447 | 58 | |||||||||||||
58
Capital Statement 2022-23
| Energy and Public Works | ||||||||||||||||||||
Project | Statistical Area | Total Estimated Cost $‘000 | Expenditure to 30-06-22 $‘000 | Budget 2022-23 $‘000 | Post 2022-23 $‘000 | |||||||||||||||
Non-regulated | ||||||||||||||||||||
Ergon Energy Retail information communications and technology | 305 | 18,972 | Ongoing | |||||||||||||||||
Metering dynamics | 305 | 40,358 | Ongoing | |||||||||||||||||
Other isolated systems capital work | Various | 29,321 | Ongoing | |||||||||||||||||
Yurika infrastructure services build, own, operate and maintain | Various | 9,546 | Ongoing | |||||||||||||||||
ICT | ||||||||||||||||||||
Digital office capital expenditure - Energy Queensland | Various | 117,852 | Ongoing | |||||||||||||||||
Alternative control services | ||||||||||||||||||||
Gold Coast | 309 | 16,197 | Ongoing | |||||||||||||||||
Brisbane | Various | 36,847 | Ongoing | |||||||||||||||||
Ipswich | 310 | 6,460 | Ongoing | |||||||||||||||||
Sunshine Coast | 316 | 7,026 | Ongoing | |||||||||||||||||
Ergon Energy | Various | 52,383 | Ongoing | |||||||||||||||||
Wide Bay | 319 | 3,418 | Ongoing | |||||||||||||||||
Non-system | ||||||||||||||||||||
Tools and equipment - Energex | Various | 2,034 | Ongoing | |||||||||||||||||
Vehicles - Energex | Various | 22,406 | Ongoing | |||||||||||||||||
Vehicles - Ergon Energy | Various | 37,232 | Ongoing | |||||||||||||||||
Tools and equipment - Ergon | Various | 5,221 | Ongoing | |||||||||||||||||
Energy McLeod Street Depot redevelopment (stage 2) | 306 | 18,500 | 702 | 11,877 | 5,921 | |||||||||||||||
Property - minor program - Ergon funded | Various | 10,567 | Ongoing | |||||||||||||||||
Property and buildings program - Energex funded | Various | 2,032 | Ongoing | |||||||||||||||||
Maryborough Depot development | 319 | 7,005 | 190 | 6,030 | 785 | |||||||||||||||
Esk Depot redevelopment | 310 | 9,000 | 150 | 1,131 | 7,719 | |||||||||||||||
|
| |||||||||||||||||||
Total Property, Plant and Equipment | 1,409,741 | |||||||||||||||||||
|
| |||||||||||||||||||
POWERLINK QUEENSLAND | ||||||||||||||||||||
Property, Plant and Equipment | ||||||||||||||||||||
Strathmore transformer reinforcement | 312 | 24,300 | 17,334 | 3,183 | 3,783 | |||||||||||||||
59
Capital Statement 2022-23
| Energy and Public Works | ||||||||||||||||||
Project | Statistical Area | Total Estimated Cost $‘000 | Expenditure to 30-06-22 $‘000 | Budget 2022-23 $‘000 | Post 2022-23 $‘000 | |||||||||||||
Dense Wave Division Multiplexing Network replacement | Various | 33,800 | 11,687 | 11,912 | 10,201 | |||||||||||||
Lilyvale transformers replacement | 308 | 21,500 | 16,739 | 2,456 | 2,305 | |||||||||||||
Lilyvale selected primary plant replacement | 308 | 27,900 | 10,004 | 6,201 | 11,695 | |||||||||||||
Davies Creek to Bayview Heights 275 kilovolt refit | 306 | 42,000 | 1,164 | 1,671 | 39,165 | |||||||||||||
SEQ 275 kilovolt bus reactors | 311 | 30,000 | 430 | 1,250 | 28,320 | |||||||||||||
Kidston Hydro 275 kilovolt transmission network connection | 318 | 258,200 | 55,828 | 140,289 | 62,083 | |||||||||||||
Calvale and Callide B secondary systems replacement | 308 | 21,800 | 16,731 | 2,938 | 2,131 | |||||||||||||
Bouldercombe primary plant replacement | 308 | 40,400 | 26,833 | 8,396 | 5,171 | |||||||||||||
Nebo primary plant replacement | 312 | 26,800 | 19,421 | 2,496 | 4,883 | |||||||||||||
Nebo secondary systems replacement | 312 | 31,500 | 22,070 | 3,377 | 6,053 | |||||||||||||
Total other projects | Various | 43,897 | Ongoing | |||||||||||||||
Gladstone South secondary systems replacement | 308 | 20,800 | 9,340 | 533 | 10,927 | |||||||||||||
Ross 275 kilovolt primary plant replacement | 318 | 28,800 | 7,634 | 4,878 | 16,288 | |||||||||||||
Advanced energy management system replacement | 302 | 50,400 | 43,513 | 6,250 | 637 | |||||||||||||
|
| |||||||||||||||||
Total Property, Plant and Equipment | 239,727 | |||||||||||||||||
|
| |||||||||||||||||
STANWELL CORPORATION LIMITED | ||||||||||||||||||
Property, Plant and Equipment | ||||||||||||||||||
Tarong Power Station - overhauls | 319 | 44,060 | Ongoing | |||||||||||||||
Tarong Power Station - turbine overhauls | 319 | 3,575 | Ongoing | |||||||||||||||
Tarong Power Station - other sustaining projects | 319 | 14,637 | Ongoing | |||||||||||||||
Tarong Power Station - turbine rotor and blade replacement | 319 | 3,557 | 1,094 | 1,156 | 1,307 | |||||||||||||
Tarong Power Station - chimney and flue refurbishment | 319 | 2,880 | 30 | 1,338 | 1,512 | |||||||||||||
Tarong Power Station - cooling tower refurbishment | 319 | 4,216 | 115 | 1,925 | 2,176 | |||||||||||||
60
Capital Statement 2022-23
| Energy and Public Works | ||||||||||||||||||
Project | Statistical Area | Total Estimated Cost $‘000 | Expenditure to 30-06-22 $‘000 | Budget 2022-23 $‘000 | Post 2022-23 $‘000 | |||||||||||||
Stanwell Power Station - coal bunker refurbishment | 308 | 4,633 | 1,747 | 1,355 | 1,531 | |||||||||||||
Stanwell Power Station - generator rotor replacement | 308 | 3,163 | 1,208 | 1,955 | ||||||||||||||
Stanwell Power Station - overhauls | 308 | 27,232 | Ongoing | |||||||||||||||
Stanwell Power Station - turbine overhauls | 308 | 10,546 | Ongoing | |||||||||||||||
Stanwell Power Station - other sustaining projects | 308 | 5,754 | Ongoing | |||||||||||||||
Stanwell Power Station - ash storage project | 308 | 4,289 | Ongoing | |||||||||||||||
Wambo Wind Farm | 307 | 374,624 | 68,218 | 306,406 | ||||||||||||||
Central Queensland Hydrogen project (CQ-H2) | 308 | 15,308 | 1,000 | 6,718 | 7,590 | |||||||||||||
Southern Renewable Energy Zone battery storage | 319 | 206,890 | 5,686 | 85,117 | 116,087 | |||||||||||||
Meandu Mine - truck and shovel replacement program | 319 | 204 | Ongoing | |||||||||||||||
Meandu Mine - dozer replacement program | 319 | 4,154 | Ongoing | |||||||||||||||
Meandu Mine - minor works | 319 | 8,451 | Ongoing | |||||||||||||||
Meandu Mine - development program | 319 | 8,233 | Ongoing | |||||||||||||||
ICT - Hardware and software upgrades | 305 | 1,718 | Ongoing | |||||||||||||||
Other capital projects | 305 | 201 | Ongoing | |||||||||||||||
|
| |||||||||||||||||
Total Property, Plant and Equipment | | 300,089 | | |||||||||||||||
|
| |||||||||||||||||
TOTAL ENERGY AND PUBLIC WORKS (PPE) | 2,318,677 | |||||||||||||||||
|
| |||||||||||||||||
TOTAL ENERGY AND PUBLIC WORKS (CG) | 112,500 | |||||||||||||||||
|
| |||||||||||||||||
Note:
| 1. | The Queensland Government is investing a total of $176 million in the refurbishment and expansion of the Cairns Convention Centre, including $172.2 million of capital expenditure. |
61
Capital Statement 2022-23
| 3.7 | ENVIRONMENT AND SCIENCE |
Department of Environment and Science
In 2022-23, the Environment and Science portfolio has a capital program of $54.9 million including $51.2 million in capital purchases and $3.7 million in capital grants. The capital program of the Department of Environment and Science supports the department’s purpose of managing, protecting and restoring Queensland’s natural environment and heritage.
Government has set aside an additional $250 million over 4 years ($25 million in 2022-23), held centrally, for land acquisitions and capital works to support the Protected Area Strategy 2020-2030.
Program Highlights (Property, Plant and Equipment)
| • | $3 million to provide wongari (dingo) fencing at Orchid Beach on K’gari (Fraser Island) to protect visitors and residents. |
| • | $2.8 million to deliver the final tranche of the Government Science Platform. |
| • | $2.5 million to construct facilities in Queensland Recreation Areas. |
| • | $2.3 million for high priority land acquisitions for the expansion of the protected area land portfolio. |
| • | $1.8 million to upgrade visitor infrastructure at the Daisy Hill Conservation Park. |
| • | $1.6 million towards delivery of buildings and park infrastructure to support visitor recreation in as well as management of and access to parks and recreation areas jointly managed by Traditional Owners and the department. |
| • | $1.6 million towards the replacement of major vessels for marine parks management. |
| • | $1.5 million to provide ecotourism facilities as part of the Ngaro trail on Whitsunday Islands National Park. |
| • | $1.5 million to upgrade walking trails on Magnetic Island National Park. |
| • | $1.1 million to upgrade visitor infrastructure at Bunya Mountains National Park. |
| • | $1 million to enhance public boat moorings and improve visitor access to the Great Barrier Reef islands. |
| • | $1 million to acquire land to enhance environmental protection of the Great Barrier Reef islands. |
| • | $1 million to undertake capital works on property acquired as part of the expansion of the protected area land portfolio. |
62
Capital Statement 2022-23
Program Highlights (Capital Grants)
| • | $3.6 million for remedial conservation works at Newstead House. |
| Environment and Science | ||||||||||||||||||
Project | Statistical Area | Total Estimated Cost $‘000 | Expenditure to 30-06-22 $‘000 | Budget 2022-23 $‘000 | Post 2022-23 $‘000 | |||||||||||||
DEPARTMENT OF ENVIRONMENT AND SCIENCE | ||||||||||||||||||
Property, Plant and Equipment | ||||||||||||||||||
Buildings and infrastructure | ||||||||||||||||||
Recreation Areas Management | Various | 2,543 | Ongoing | |||||||||||||||
Daisy Hill Conservation Park Action Plan visitor facilities upgrade | 311 | 2,000 | 200 | 1,800 | ||||||||||||||
Joint management program | Various | 1,629 | Ongoing | |||||||||||||||
Whitsunday Islands National Park - Ngaro trail ecotourism facilities | 312 | 3,700 | 700 | 1,500 | 1,500 | |||||||||||||
K’gari (Fraser Island) Orchid Beach wongari (dingo) fences | 319 | 3,500 | 500 | 3,000 | ||||||||||||||
Magnetic Island National Park trails network | 318 | 3,115 | 1,309 | 1,456 | 350 | |||||||||||||
Bunya Mountains National Park visitor facilities upgrade | 319 | 2,950 | 1,100 | 1,850 | ||||||||||||||
Great Barrier Reef Investment Marine Park reef trails | Various | 2,500 | 750 | 1,000 | 750 | |||||||||||||
Protected Area Strategy - buildings and infrastructure | Various | 4,550 | 1,000 | 3,550 | ||||||||||||||
Sustainable power supply initiatives | Various | 4,575 | 3,775 | 800 | ||||||||||||||
K’gari (Fraser Island) - Central Station day use area upgrade | 319 | 4,197 | 1,997 | 800 | 1,400 | |||||||||||||
Conondale National Park - Booloumba Creek visitor facilities upgrade | 316 | 2,000 | 370 | �� | 630 | 1,000 | ||||||||||||
Girraween National Park visitor facilities upgrade | 307 | 2,350 | 1,000 | 600 | 750 | |||||||||||||
Crater Lakes National Park walking track upgrade | 306 | 3,300 | 850 | 500 | 1,950 | |||||||||||||
Girringun National Park - Wallaman Falls visitor facilities upgrade | 318 | 2,000 | 200 | 500 | 1,300 | |||||||||||||
63
Capital Statement 2022-23
| Environment and Science | ||||||||||||||||||
Project | Statistical Area | Total Estimated Cost $‘000 | Expenditure to 30-06-22 $‘000 | Budget 2022-23 $‘000 | Post 2022-23 $‘000 | |||||||||||||
Springbrook National Park visitor facilities upgrade | 309 | 4,770 | 1,120 | 500 | 3,150 | |||||||||||||
Daintree National Park - Eastern Yalanjiwarra Culture and Tourism Hub and Visitor Centre | 306 | 3,438 | 338 | 310 | 2,790 | |||||||||||||
Raine Island beacon conservation | 315 | 561 | 266 | 295 | ||||||||||||||
Parks and forests - fences, roads and firelines | Various | 1,471 | Ongoing | |||||||||||||||
Parks and forests - tracks and trails | Various | 1,445 | Ongoing | |||||||||||||||
Parks and forests - other management facilities | Various | 6,096 | Ongoing | |||||||||||||||
Parks and forests - other recreation and visitor facilities | Various | 4,402 | Ongoing | |||||||||||||||
Plant and equipment | ||||||||||||||||||
Marine parks major vessel replacements | Various | 6,562 | 4,944 | 1,618 | ||||||||||||||
Queensland Reef Water Quality monitoring equipment | Various | 1,412 | 406 | 1,006 | ||||||||||||||
Enhanced air quality monitoring equipment | Various | 1,048 | 825 | 223 | ||||||||||||||
General plant and equipment | Various | 5,723 | Ongoing | |||||||||||||||
Systems development | ||||||||||||||||||
Government Science Platform | Various | 7,727 | 2,138 | 2,799 | 2,790 | |||||||||||||
Waste management systems | Various | 6,500 | 1,600 | 4,900 | ||||||||||||||
Enhanced air quality monitoring systems | Various | 1,116 | 766 | 350 | ||||||||||||||
General systems development | Various | 1,795 | Ongoing | |||||||||||||||
Land | ||||||||||||||||||
Protected Area Strategy - land acquisitions | Various | 16,000 | 11,600 | 2,270 | 2,130 | |||||||||||||
Great Barrier Reef Investment Island Arks project | Various | 4,000 | 3,000 | 1,000 | ||||||||||||||
|
| |||||||||||||||||
Total Property, Plant and Equipment | 51,161 | |||||||||||||||||
|
| |||||||||||||||||
Capital Grants | ||||||||||||||||||
Newstead House capital works program | 305 | 5,492 | 1,848 | 3,644 | ||||||||||||||
64
Capital Statement 2022-23
| Environment and Science | ||||||||||||||||||||
Project | Statistical Area | Total Estimated Cost $‘000 | Expenditure to 30-06-22 $‘000 | Budget 2022-23 $‘000 | Post 2022-23 $‘000 | |||||||||||||||
Other capital grants | 306 | 491 | 400 | 91 | ||||||||||||||||
|
| |||||||||||||||||||
Total Capital Grants | 3,735 | |||||||||||||||||||
|
| |||||||||||||||||||
TOTAL ENVIRONMENT AND SCIENCE (PPE) |
| 51,161 | ||||||||||||||||||
|
| |||||||||||||||||||
TOTAL ENVIRONMENT AND SCIENCE (CG) |
| 3,735 | ||||||||||||||||||
|
| |||||||||||||||||||
65
Capital Statement 2022-23
| 3.8 | JUSTICE AND ATTORNEY-GENERAL |
The 2022-23 capital acquisitions budget for the Justice and Attorney-General portfolio (including the Department of Justice and Attorney-General, Public Trustee of Queensland and the Crime and Corruption Commission) is $34.3 million.
Department of Justice and Attorney-General
The Department of Justice and Attorney-General capital acquisitions budget for 2022-23 is $30.7 million.
Program Highlights (Property, Plant and Equipment)
| • | $13.6 million to continue the ongoing program of minor capital works in courthouses. |
| • | $5.8 million to expand and upgrade existing audio-visual capacity in the justice system, which includes video conferencing and in-custody court appearances. |
| • | $3.4 million to commence domestic and family violence courthouse improvements in Toowoomba, Cairns, Brisbane, Rockhampton, Maroochydore, Caboolture, Mackay and Ipswich. This forms part of the implementation of the Queensland Government’s response to the Queensland Women’s Safety and Justice Taskforce, Hear her voice—Report one—Addressing coercive control and domestic and family violence in Queensland. |
| • | $1.9 million to commence replacement of the Beaudesert courthouse. |
Crime and Corruption Commission
The Crime and Corruption Commission’s 2022-23 capital acquisition budget is $1.6 million.
Program Highlights (Property, Plant and Equipment)
| • | $649,000 to replace computer and other information technology equipment. |
| • | $951,000 to replace vehicles. |
Public Trustee of Queensland
The 2022-23 capital budget is $2 million. This capital budget will enable the Public Trustee of Queensland to continue to provide a wide range of efficient services to the Queensland community, as well as continuing to maintain appropriate workplace health and safety standards for customers and staff.
Program Highlights (Property, Plant and Equipment)
| • | $1 million to enhance and develop information systems. |
| • | $1 million for refurbishment of existing regional office premises. |
66
Capital Statement 2022-23
| Justice and Attorney-General | ||||||||||||||||||
Project | Statistical Area | Total Estimated Cost $‘000 | Expenditure to 30-06-22 $‘000 | Budget 2022-23 $‘000 | Post 2022-23 $‘000 | |||||||||||||
DEPARTMENT OF JUSTICE AND ATTORNEY-GENERAL | ||||||||||||||||||
Property, Plant and Equipment | ||||||||||||||||||
Domestic and family violence courthouse improvements | Various | 49,050 | 3,375 | 45,675 | ||||||||||||||
Beaudesert courthouse replacement | 311 | 21,446 | 1,924 | 19,522 | ||||||||||||||
Courthouses - minor capital works | Various | 13,637 | Ongoing | |||||||||||||||
Justice System - audio visual capacity expansion and upgrades | Various | 5,837 | Ongoing | |||||||||||||||
Minor capital works - software | 305 | 2,315 | Ongoing | |||||||||||||||
Leasehold improvements | Various | 1,648 | Ongoing | |||||||||||||||
Courthouses - information systems upgrades and replacements | 305 | 795 | Ongoing | |||||||||||||||
Other acquisitions of property, plant and equipment | Various | 1,130 | Ongoing | |||||||||||||||
|
| |||||||||||||||||
Total Property, Plant and Equipment | 30,661 | |||||||||||||||||
|
| |||||||||||||||||
CRIME AND CORRUPTION COMMISSION | ||||||||||||||||||
Property, Plant and Equipment | ||||||||||||||||||
Other plant and equipment | 305 | 649 | Ongoing | |||||||||||||||
Vehicle replacements | 305 | 951 | Ongoing | |||||||||||||||
|
| |||||||||||||||||
Total Property, Plant and Equipment | 1,600 | |||||||||||||||||
|
| |||||||||||||||||
PUBLIC TRUSTEE OF QUEENSLAND | ||||||||||||||||||
Property, Plant and Equipment | ||||||||||||||||||
Information systems development | 305 | 1,000 | 1,000 | |||||||||||||||
Other acquisitions of property, plant and equipment | Various | 1,000 | 1,000 | |||||||||||||||
|
| |||||||||||||||||
Total Property, Plant and Equipment | 2,000 | |||||||||||||||||
|
| |||||||||||||||||
TOTAL JUSTICE AND ATTORNEY-GENERAL (PPE) | 34,261 | |||||||||||||||||
|
| |||||||||||||||||
67
Capital Statement 2022-23
| 3.9 | LEGISLATIVE ASSEMBLY OF QUEENSLAND |
Legislative Assembly of Queensland
The 2022-23 capital purchases budget for the Legislative Assembly of Queensland is $43.6 million.
The most significant capital project includes necessary repairs and upgrades to the external facade of the Parliamentary Annexe, and the internal refurbishment of Members’ office and overnight accommodation rooms (levels 9-23).
Other capital projects include the installation of CCTV systems in Members’ electorate offices to improve security, the ongoing electorate office accommodation improvement program, and upgrades to information technology network infrastructure.
| Legislative Assembly of Queensland | ||||||||||||||||||
Project | Statistical Area | Total Estimated Cost $‘000 | Expenditure to 30-06-22 $‘000 | Budget 2022-23 $‘000 | Post 2022-23 $‘000 | |||||||||||||
LEGISLATIVE ASSEMBLY OF QUEENSLAND | ||||||||||||||||||
Property, Plant and Equipment | ||||||||||||||||||
Electorate office security upgrade (CCTV) | Various | 612 | 612 | |||||||||||||||
Critical infrastructure and services upgrade (stage 2) | 305 | 39,929 | 39,929 | |||||||||||||||
Electorate office accommodation improvement program | Various | 600 | Ongoing | |||||||||||||||
Information technology network infrastructure | 305 | 780 | Ongoing | |||||||||||||||
Other property, plant and equipment | 305 | 1,640 | Ongoing | |||||||||||||||
|
| |||||||||||||||||
Total Property, Plant and Equipment | 43,561 | |||||||||||||||||
|
| |||||||||||||||||
TOTAL LEGISLATIVE ASSEMBLY OF QUEENSLAND (PPE) | 43,561 | |||||||||||||||||
|
| |||||||||||||||||
68
Capital Statement 2022-23
| 3.10 | PREMIER AND CABINET |
The Department of the Premier and Cabinet (including Ministerial Offices and Office of the Leader of the Opposition) has planned capital purchases of $883,000 and capital grants of $16.1 million in 2022-23.
Department of the Premier and Cabinet
Program Highlights (Property, Plant and Equipment)
| • | $583,000 for ongoing upgrades and maintenance of existing Ministerial Services ICT systems and other minor works. |
| • | $300,000 for ongoing upgrades to and maintenance of departmental ICT systems and other minor works. |
Program Highlights (Capital Grants)
| • | $12.1 million of total $12.6 million for the Far North Queensland film studio, a multipurpose facility in Cairns. |
| • | $2.5 million of total $5 million for the Gold Coast production hub, a virtual production facility servicing film and television projects. |
| • | $1.5 million of total $4 million for the Queensland Remembers Grants Program, to support ex-service organisations and not-for-profit organisations that provide services to veterans to upgrade their buildings, facilities and equipment. |
| Premier and Cabinet | ||||||||||||||||||
Project | Statistical Area | Total Estimated Cost $‘000 | Expenditure to 30-06-22 $‘000 | Budget 2022-23 $‘000 | Post 2022-23 $‘000 | |||||||||||||
DEPARTMENT OF THE PREMIER AND CABINET | ||||||||||||||||||
Property, Plant and Equipment | ||||||||||||||||||
Departmental ICT systems and other minor works | 305 | 300 | Ongoing | |||||||||||||||
Ministerial Offices and Office of the Leader of the Opposition - ICT systems and other minor works | 305 | 583 | Ongoing | |||||||||||||||
|
| |||||||||||||||||
Total Property, Plant and Equipment | 883 | |||||||||||||||||
|
| |||||||||||||||||
Capital Grants | ||||||||||||||||||
Screen Queensland - Far North Queensland film studio | 306 | 12,600 | 500 | 12,100 | ||||||||||||||
Screen Queensland - Gold Coast production hub | 309 | 5,000 | 2,500 | 2,500 | ||||||||||||||
69
Capital Statement 2022-23
| Premier and Cabinet | ||||||||||||||||||
Project | Statistical Area | Total Estimated Cost $‘000 | Expenditure to 30-06-22 $‘000 | Budget 2022-23 $‘000 | Post 2022-23 $‘000 | |||||||||||||
Queensland Remembers Grants Program | Various | 4,000 | 686 | 1,500 | 1,814 | |||||||||||||
|
| |||||||||||||||||
Total Capital Grants | 16,100 | |||||||||||||||||
|
| |||||||||||||||||
TOTAL PREMIER AND CABINET (PPE) | 883 | |||||||||||||||||
|
| |||||||||||||||||
TOTAL PREMIER AND CABINET (CG) | 16,100 | |||||||||||||||||
|
| |||||||||||||||||
70
Capital Statement 2022-23
| 3.11 | QUEENSLAND CORRECTIVE SERVICES |
Queensland Corrective Services’ 2022-23 capital program of $513.4 million will primarily focus on correctional centre expansion and enhancements.
Queensland Corrective Services
Program Highlights (Property, Plant and Equipment)
| • | $454 million of total $861 million to increase the scope by 500 beds and continue the expansion of Southern Queensland Correctional Precinct. The new centre will be a modern, purpose-built facility with over 1,500 beds and will enable a focus on health and rehabilitation to reduce reoffending. |
| • | $41 million of total $77.8 million to progress infrastructure works and support ongoing maintenance and replacement programs. |
| • | $6.6 million of total $13.6 million to complete the upgrade of the intercom system at the Woodford Correctional Centre. |
| • | $3 million of total $8 million to install additional bunk beds in high security correctional centres across Queensland to manage the increasing prison population. |
| • | $1.3 million of total $3 million to complete the refurbishment of the Princess Alexandra Hospital Secure Unit. |
| Queensland Corrective Services | ||||||||||||||||||
Project | Statistical Area | Total Estimated Cost $‘000 | Expenditure to 30-06-22 $‘000 | Budget 2022-23 $‘000 | Post 2022-23 $‘000 | |||||||||||||
QUEENSLAND CORRECTIVE SERVICES | ||||||||||||||||||
Property, Plant and Equipment | ||||||||||||||||||
Queensland Corrective Services | ||||||||||||||||||
Major works - correctional centres | ||||||||||||||||||
Southern Queensland Correctional Precinct - Stage 2 over 1,500 beds | 310 | 860,978 | 203,811 | 454,000 | 203,167 | |||||||||||||
|
| |||||||||||||||||
Sub-total Major works - correctional centres | 454,000 | |||||||||||||||||
|
| |||||||||||||||||
Correctional centre enhancements | ||||||||||||||||||
Infrastructure works | Various | 77,770 | 40,950 | 36,820 | ||||||||||||||
Woodford Correctional Centre - intercoms | 313 | 13,600 | 6,954 | 6,646 | ||||||||||||||
71
Capital Statement 2022-23
| Queensland Corrective Services | ||||||||||||||||||
Project | Statistical Area | Total Estimated Cost $‘000 | Expenditure to 30-06-22 $‘000 | Budget 2022-23 $‘000 | Post 2022-23 $‘000 | |||||||||||||
Princess Alexandra Hospital Secure Unit | 303 | 3,040 | 1,774 | 1,266 | ||||||||||||||
Double up bunk beds | Various | 8,000 | 5,000 | 3,000 | ||||||||||||||
|
| |||||||||||||||||
Sub-total Correctional centre enhancements | 51,862 | |||||||||||||||||
|
| |||||||||||||||||
Other acquisitions of property, plant and equipment | ||||||||||||||||||
Other acquisitions of property, plant and equipment | Various | 7,501 | Ongoing | |||||||||||||||
|
| |||||||||||||||||
Sub-total Other acquisitions of property, plant and equipment | 7,501 | |||||||||||||||||
|
| |||||||||||||||||
Sub-total Queensland Corrective Services | 513,363 | |||||||||||||||||
|
| |||||||||||||||||
Total Property, Plant and Equipment | 513,363 | |||||||||||||||||
|
| |||||||||||||||||
TOTAL QUEENSLAND CORRECTIVE SERVICES (PPE) | 513,363 | |||||||||||||||||
|
| |||||||||||||||||
72
Capital Statement 2022-23
| 3.12 | QUEENSLAND FIRE AND EMERGENCY SERVICES |
Queensland Fire and Emergency Services
The 2022-23 Queensland Fire and Emergency Services (QFES) capital program of $67.5 million in capital purchases and $1.7 million in capital grants supports the provision of fire and rescue and emergency management services throughout Queensland. The program will fund fire and emergency services facilities, fire appliances, and essential operational equipment and information systems.
Through an agreed arrangement, the Queensland Police Service Frontline and Digital Division will provide information and communications technology systems and equipment to QFES to support the delivery of essential frontline public safety services to Queensland communities.
Program Highlights (Property, Plant and Equipment)
| • | $33.1 million for replacement and new fire and rescue and rural fire appliances. |
| • | $6.5 million for operational equipment including specialised firefighting, scientific analysis and detection, breathing apparatus, severe weather response, and rescue equipment. |
| • | $6 million to complete the construction of a new permanent fire and rescue station at Mount Cotton Road. |
| • | $5.1 million to complete the replacement of the Maryborough regional QFES headquarters and auxiliary fire and rescue station. |
| • | $4.9 million for land acquisitions and detailed design for replacement fire and rescue stations at Hervey Bay and South Townsville. |
| • | $2.6 million to commence construction of new permanent fire and rescue stations at Moreton Bay Central and Greater Springfield. |
| • | $2.6 million for the marine rescue vessel replacement program. |
| • | $2.3 million for minor capital works across the State, including upgrades of fire and rescue station amenities. |
| • | $1 million to complete the replacement of the permanent fire and rescue station at Loganlea. |
| • | $1 million to continue the replacement of the QFES mechanical workshop in South East Queensland. |
| • | $1 million to upgrade Rural Fire Service facilities. |
73
Capital Statement 2022-23
| • | $850,000 to commence replacement of the permanent and auxiliary fire and rescue stations at Airlie Beach and Drayton. |
| • | $200,000 to commence construction of a new permanent fire and rescue station at Caloundra South. |
| • | $200,000 for rural operations land purchases. |
| • | $100,000 to commence replacement of a permanent fire and rescue station at Gympie South. |
Program Highlights (Capital Grants)
| • | $1.2 million in capital grants for State Emergency Service. |
| • | $500,000 in capital grants for Rural Fire Brigades. |
| Queensland Fire and Emergency Services | ||||||||||||||||||
Project | Statistical Area | Total Estimated Cost $‘000 | Expenditure to 30-06-22 $‘000 | Budget 2022-23 $‘000 | Post 2022-23 $‘000 | |||||||||||||
QUEENSLAND FIRE AND EMERGENCY SERVICES | ||||||||||||||||||
Property, Plant and Equipment | ||||||||||||||||||
Buildings | ||||||||||||||||||
Airlie Beach replacement permanent and auxiliary fire and rescue station | 312 | 7,000 | 750 | 6,250 | ||||||||||||||
Caloundra South new permanent fire and rescue station | 316 | 6,500 | 200 | 6,300 | ||||||||||||||
Drayton replacement permanent and auxiliary fire and rescue station | 317 | 6,000 | 100 | 5,900 | ||||||||||||||
Greater Springfield new permanent fire and rescue station | 310 | 5,500 | 1,350 | 4,150 | ||||||||||||||
Gympie South replacement permanent fire and rescue station | 319 | 6,000 | 100 | 5,900 | ||||||||||||||
Loganlea replacement permanent fire and rescue station | 311 | 4,800 | 3,776 | 1,024 | ||||||||||||||
Maryborough replacement regional QFES headquarters and auxiliary fire and rescue station | 319 | 14,545 | 9,429 | 5,116 | ||||||||||||||
Moreton Bay Central new permanent fire and rescue station | 313 | 6,000 | 1,250 | 4,750 | ||||||||||||||
74
Capital Statement 2022-23
| Queensland Fire and Emergency Services | ||||||||||||||||||
Project | Statistical Area | Total Estimated Cost $‘000 | Expenditure to 30-06-22 $‘000 | Budget 2022-23 $‘000 | Post 2022-23 $‘000 | |||||||||||||
Mount Cotton Road new permanent fire and rescue station | 311 | 7,200 | 1,210 | 5,990 | ||||||||||||||
South East Queensland QFES replacement mechanical workshop | 302 | 9,000 | 387 | 1,000 | 7,613 | |||||||||||||
Rural Fire Service facilities program | Various | 1,000 | 1,000 | |||||||||||||||
Minor works | Various | 2,317 | Ongoing | |||||||||||||||
|
| |||||||||||||||||
Sub-total Buildings | 20,197 | |||||||||||||||||
|
| |||||||||||||||||
Land | ||||||||||||||||||
Rural operations land purchases | Various | 200 | Ongoing | |||||||||||||||
|
| |||||||||||||||||
Sub-total Land | 200 | |||||||||||||||||
|
| |||||||||||||||||
Strategic Land Acquisitions | ||||||||||||||||||
Hervey Bay replacement fire and rescue station land acquisition and detailed design | 319 | 1,700 | 1,700 | |||||||||||||||
South Townsville replacement fire and rescue station land acquisition and detailed design | 318 | 3,200 | 3,200 | |||||||||||||||
|
| |||||||||||||||||
Sub-total Strategic Land Acquisitions | 4,900 | |||||||||||||||||
|
| |||||||||||||||||
Plant and Equipment | ||||||||||||||||||
Fire and rescue appliances | Various | 19,316 | Ongoing | |||||||||||||||
Rural fire appliances | Various | 13,810 | Ongoing | |||||||||||||||
Operational equipment | Various | 6,487 | Ongoing | |||||||||||||||
Marine rescue vessel replacement program | Various | 5,100 | 300 | 2,550 | 2,250 | |||||||||||||
|
| |||||||||||||||||
Sub-total Plant and Equipment | 42,163 | |||||||||||||||||
|
| |||||||||||||||||
Total Property, Plant and Equipment | 67,460 | |||||||||||||||||
|
| |||||||||||||||||
Capital Grants | ||||||||||||||||||
State Emergency Service | Various | 1,212 | Ongoing | |||||||||||||||
Rural Fire Brigades | Various | 500 | Ongoing | |||||||||||||||
|
| |||||||||||||||||
Total Capital Grants | 1,712 | |||||||||||||||||
|
| |||||||||||||||||
75
Capital Statement 2022-23
| Queensland Fire and Emergency Services | ||||||||||||
Project | Statistical Area | Total Estimated Cost $‘000 | Expenditure to 30-06-22 $‘000 | Budget 2022-23 $‘000 | Post 2022-23 $‘000 | |||||||
| TOTAL QUEENSLAND FIRE AND EMERGENCY SERVICES (PPE) | 67,460 | |||||||||||
|
| |||||||||||
| TOTAL QUEENSLAND FIRE AND EMERGENCY SERVICES (CG) | 1,712 | |||||||||||
|
| |||||||||||
76
Capital Statement 2022-23
| 3.13 | QUEENSLAND HEALTH |
Queensland Health is comprised of the Department of Health, the Queensland Ambulance Service (QAS) and 16 independent Hospital and Health Services (HHSs) situated across the state. The remainder of the Queensland Health portfolio includes the Queensland Mental Health Commission, the Office of the Health Ombudsman, the Council of the Queensland Institute of Medical Research (QIMR Berghofer) and Health and Wellbeing Queensland.
The total capital investment program in 2022-23 for Queensland Health, including QIMR, is $1.537 billion.
Queensland Health and Hospital and Health Services
The Queensland Health Capital Program delivers built infrastructure and digital technologies to enable the delivery of safe, high-quality health services to Queenslanders. The built infrastructure, equipment and technology requirements of Queensland Health are driven by clinical services planning and models of care.
Over the next 15 years, the demand on Queensland’s public health system is projected to increase significantly. The Queensland Health Capital Program is positioned to respond to these pressures with innovative approaches to managing existing assets, leveraging emerging healthcare technology, and utilising contemporary building practices and enhanced design processes.
Queensland Health also uses a strategic approach to forward planning which considers the needs of all Queenslanders, including efficiencies that can be leveraged across the statewide network. This ensures healthcare infrastructure and equipment programs are delivered at the right place, at the right time, for Queensland communities.
Program Highlights (Property, Plant and Equipment)
In 2022-23, Queensland Health will continue to invest in health infrastructure, capital works and purchases across a broad range of areas including hospitals, ambulance stations and vehicles, health technology, research and scientific services, mental health services, staff accommodation, and ICT.
Hospital and health facility project highlights in 2022-23 include:
$9.785 billion for the Queensland Health Capacity Expansion Program to deliver around 2,200 additional overnight beds over 6 years (2022-23 to 2027-2028). This includes new hospitals in Bundaberg, Toowoomba and Coomera; a new Queensland Cancer Centre; expansions to hospitals in Cairns, Townsville, Robina, Mackay, Redcliffe, Ipswich and Hervey Bay as well as to the Princess Alexandra, QEII and The Prince Charles hospitals; and a further expansion of Logan Hospital.
77
Capital Statement 2022-23
$943.5 million over 7 years from the Sustaining Capital Program to replace ageing rural and regional health facilities and staff accommodation as part of the next stage of the Queensland Health Building Rural and Remote Health Program. Locations include Darling Downs, Cairns and Hinterland, Central Queensland, Mackay, North West, Torres and Cape, Townsville, West Moreton and Wide Bay Hospital and Health Services.
$229.7 million over 2 years from the Sustaining Capital Program to immediately increase bed capacity across South East Queensland under the Accelerated Infrastructure Delivery Program. The program will use off-site construction and standard designs to reduce time to commissioning with 289 overnight beds across 7 projects in West Moreton, Metro South, Cairns and Hinterland, and Gold Coast Hospital and Health Services, to be delivered within 2 years.
$21.8 million for new business cases to commence, including the replacement of the Forensic Pathology Facility; Residential Aged Care Facilities; condition assessment and compliance review; and long-stay complex patient accommodation.
$1.8 million for planning and initiatives under Better Care Together: a new 5-year plan for state funded mental health, alcohol and other drug services.
$270.3 million as part of the Building Better Hospitals program including:
| • | $161.3 million for the Logan Hospital Expansion to deliver an additional 206 beds and bed alternatives with a vertical expansion of Building 3 and targeted refurbishment of other key locations. |
| • | $82.9 million for the Caboolture Hospital Redevelopment to support an additional 130 beds and refurbishment of critical clinical support services. |
| • | $21.4 million for the Ipswich Hospital Expansion Stage 1A which includes redevelopment of the hospital including new mental health facilities for adults and older persons, 26 bed ward refurbishment and a Magnetic Resonance Imaging suite to grow clinical capacity. |
| • | $4.7 million ($5.5 million when including $0.8 million of funding from the Metro South Hospital and Health Service) for the Logan Hospital Maternity Services Upgrade with the refurbishment to deliver 6 additional maternity inpatient beds, 5 extra birthing suites, an expanded special care nursery with 10 additional cots, and the installation of birthing pools suitable for water birthing. |
$281.6 million under the Sustaining Capital Program will be distributed across Hospital and Health Services and the Department of Health for a range of minor capital projects, to efficiently replace and renew Queensland Health’s existing asset base to maintain business and service delivery. The program will seek to enhance, optimise, renew, and replace the asset base to ensure facilities and equipment are fit for purpose.
78
Capital Statement 2022-23
$139 million as part of the Satellite Hospitals Program to deliver satellite hospitals to Bribie Island, Caboolture, Eight Mile Plains (Brisbane South), Kallangur (Pine Rivers), Tugun (Gold Coast), Ripley (Ipswich), and Redlands. The Satellite Hospitals Program will assist acute hospitals in South East Queensland to manage demand and free up capacity while continuing to safely manage patients via alternative models of care. The satellite hospitals will also provide virtual health opportunities including a range of rapid access consultations, care co-ordination, remote monitoring, and patient literacy services. All 7 satellite hospital sites have been selected and delivery of these facilities is underway.
$63.9 million as part of the Rural and Regional Infrastructure Package for construction of a new mental health facility at Cairns Hospital, a purpose-built Sarina Hospital and staff accommodation, and for the replacement of the Mer (Murray) Island Primary Health Care Centre.
$46.7 million as part of the Advancing Queensland’s Health Infrastructure Program to continue essential upgrades to health facilities and supporting infrastructure across Queensland, including repurposing of the Nambour Hospital, redevelopment of the Atherton Hospital including the emergency department and operating theatres, and staged refurbishment of the Thursday Island Hospital and Primary Health Care Centre.
$45.5 million for an expansion of the Gold Coast University Hospital to deliver a Secure Mental Health Rehabilitation Unit.
$45 million in hospital parking projects to meet increasing demand for parking, including:
| • | $1.5 million for the planning of a new multi-storey car park at the Queen Elizabeth II Jubilee Hospital. |
| • | $17.5 million for construction of a new multi-storey car park at The Prince Charles Hospital. |
| • | $13.7 million for completion of a new multi-level car park for Redland Hospital. |
| • | $10.8 million for completion of the new multi-storey car park at Caboolture Hospital, providing approximately 1,080 parking spaces in a mix of multi-storey and at grade facilities, accessible parking spaces, electric vehicle charging bays and motorcycle parking. Combined with other car spaces around the site, there will be approximately 1,640 spaces in total. |
| • | $1.5 million for finalisation of the recently completed 8 level carpark on the Logan Hospital site, delivering 1,506 parking bays, and construction of a linkway bridge to Building 3 following the expansion of the Logan Hospital. |
$35.2 million for the Building Rural and Remote Health Program Phase 1 to address ageing infrastructure at Camooweal, St George, Morven, Charleville and Blackwater, and provide a safe and contemporary environment for the communities’ health services.
79
Capital Statement 2022-23
$21.9 million for the Toowoomba Day Surgery Theatre to construct a 2-theatre day surgery unit at the Baillie Henderson Hospital Campus.
$19.7 million for the Alcohol and Other Drug Community Treatment Program. The program will deliver a new 45 bed adult Alcohol and Other Drug Residential Rehabilitation Service in West Moreton, 28 bed adult Alcohol and Other Drug Residential Rehabilitation Service in Wide Bay and 10 bed youth Alcohol and Other Drug Residential Rehabilitation Service in Cairns.
$17 million for the Fraser Coast Mental Health Service Enhancement, providing a new adult acute mental health inpatient unit at Hervey Bay Hospital and sub-acute older persons mental health unit refurbishment at Maryborough Hospital.
$11.4 million for the Ipswich Hospital Upgrade to improve utilisation of space in the current hospital and address increased service demands on the emergency department, maternity and gynaecology services and renal dialysis and nephrology services.
$10.7 million for the Staff Accommodation Program to renew and replace existing healthcare staff accommodation in Torres and Cape and North West Hospital and Health Services.
$7.9 million for the Windorah Primary Healthcare Centre replacement to provide contemporary and safe health services to the Windorah community, and improve patient flow, model of care, security, storage and service delivery.
$6.8 million for the Woorabinda Multi-Purpose Health Service to increase from 4 residential aged care beds to 14, including the upgrade of the laundry facilities and the construction of a new kitchen.
$6.7 million for the redevelopment of the Moura Multi-Purpose Healthcare Service, including renewal and upgrading of aged care facilities with provision for future demand.
$110.6 million will be invested in ICT to support the safe and efficient provision of health services that enable the successful delivery of health care and business services across Queensland. This investment will assist the transformation of healthcare delivery and mitigate the risk of digital infrastructure failure. Digital enhancements will also improve equity of service at rural and remote sites.
$18.7 million will be allocated by Hospital and Health Services for capital projects across Queensland in 2022-23. Projects include:
| • | $13.4 million for digital works for the Caboolture Hospital Redevelopment project. |
| • | $2.5 million to extend existing information technology services and develop new information technology services at the Sunshine Coast University Hospital. |
80
Capital Statement 2022-23
| • | $2.0 million for completion of the refurbishment of the medical imaging facility at Bowen Hospital and the installation of a Computed Tomography (CT) scanner. |
| • | $0.8 million for a dedicated access road to the Logan Hospital Maternity Services Unit to provide a more accessible entry to the unit for patients presenting. |
$17 million has been allocated to other acquisitions of property, plant and equipment across the state, including:
| • | $11.5 million for the Queensland Health Emission Reduction Program to support Queensland Health’s statewide energy efficiency projects. |
| • | $4.2 million for the completion of the Statewide General Chemistry and Immunoassay Replacement and Automation Project. |
| • | $1.3 million for the completion of the installation of a second CT scanner for the Robina Hospital to address the increased demand for procedures and emergency CT studies. |
Queensland Ambulance Service
In 2022-23, the Queensland Ambulance Service (QAS) will invest $81.8 million in enabling critical infrastructure to support essential frontline services to provide timely, quality and appropriate patient focused pre-hospital emergency and non-emergency care and services to the community. In implementing its capital program, the QAS will review opportunities for co-location and integration with health services, thus improving the close linkages and working relationships between public hospitals, as well as other emergency management infrastructure. Highlights of the capital program include:
| • | $16.3 million to progress the planning and construction phases for new ambulance stations at Caloundra South, Lawnton, Morayfield and Ormeau, the new Ripley Ambulance Station and West Moreton District Office, replacement of the North Rockhampton Ambulance Station and Central Regional Office, the new Burdell Ambulance Station and the Townsville District Office. |
| • | $15.6 million for the planning, design and construction phases for the redevelopment of the Cairns Ambulance Station and Operations Centre, Southport Ambulance Station, Gold Coast Operations Centre, Pimpama Ambulance Station and Springwood Ambulance Station, and the completion of the refurbishment of the Rockhampton Ambulance Station and Operations Centre. |
| • | $5.0 million investment in minor works at various existing stations to improve functionality, amenities and prolong useful life. |
| • | $1.5 million investment in the acquisition of strategically located land to accommodate future expansion of services aligned with identified growth areas. |
81
Capital Statement 2022-23
| • | $33.5 million to commission ambulance vehicles, which includes $26 million to commission 130 new and replacement ambulance vehicles including the continued rollout of power assisted stretchers, $6 million for new enhancement vehicles and $1.5 million for the fit out of emergency response vehicles. |
| • | $2.0 million investment in information and communication technology for software development projects to enhance patient care and service delivery. |
| • | $7.9 million in operational equipment to support frontline services. |
Council of the Queensland Institute of Medical Research
The 2022-23 QIMR Berghofer capital program will invest $5.1 million for the acquisition of new and/or replacement state-of-the-art scientific equipment and research facilities.
| Queensland Health | ||||||||||||||||
Project | Statistical Area | Total Estimated Cost $‘000 | Expenditure to 30-06-22 $‘000 | Budget 2022-23 $‘000 | Post | |||||||||||
QUEENSLAND HEALTH AND HOSPITAL AND HEALTH SERVICES |
| |||||||||||||||
Property, Plant and Equipment1 | ||||||||||||||||
Hospital and Health Services | ||||||||||||||||
Alcohol and Other Drug Community Treatment Program | 305 | 51,000 | 1,907 | 19,700 | 29,393 | |||||||||||
Advancing Queensland Health Infrastructure Program | Various | 240,000 | 173,604 | 46,713 | 19,683 | |||||||||||
Better Care Together | 305 | 28,455 | 1,791 | 26,664 | ||||||||||||
Bowen Overall Program of Works | 312 | 3,700 | 500 | 3,200 | ||||||||||||
Building Better Hospitals | ||||||||||||||||
Caboolture Hospital2 Redevelopment Stage 1 | 313 | 352,900 | 152,969 | 82,895 | 117,036 | |||||||||||
Ipswich Hospital expansion2 (stage 1A) | 310 | 146,300 | 95,470 | 21,445 | 29,385 | |||||||||||
Logan Hospital expansion2 | 311 | 460,871 | 116,175 | 161,318 | 183,378 | |||||||||||
Logan Hospital Maternity3 Services Upgrade | 311 | 15,600 | 10,949 | 4,651 | ||||||||||||
Building Rural and Remote Health Program Phase 1 | Various | 94,660 | 3,683 | 35,200 | 55,777 | |||||||||||
Business Case Program | Various | 21,807 | Ongoing | |||||||||||||
Caboolture Hospital Multi-storey Car Park | 313 | 46,610 | 24,280 | 10,786 | 11,544 | |||||||||||
Cairns Hospital Emergency Department expansion | 306 | 30,000 | 6,811 | 20,400 | 2,789 | |||||||||||
82
Capital Statement 2022-23
| Queensland Health | ||||||||||||||||||
Project | Statistical Area | Total Estimated Cost $‘000 | Expenditure to 30-06-22 $‘000 | Budget 2022-23 $‘000 | Post 2022-23 $‘000 | |||||||||||||
Capacity Expansion Program | ||||||||||||||||||
Bundaberg Hospital early works package | 319 | 20,000 | 20,000 | |||||||||||||||
Coomera Hospital early works package | 309 | 20,000 | 20,000 | |||||||||||||||
Toowoomba Hospital early works package | 317 | 20,000 | 20,000 | |||||||||||||||
Rest of the program | Various | 9,725,000 | 25,300 | 9,699,700 | ||||||||||||||
Capital Infrastructure Projects - CHQ | 305 | 7,691 | 3,652 | 4,039 | ||||||||||||||
Cairns Hospital Research Education and Innovation Centre land acquisition | 306 | 11,000 | 1,151 | 9,849 | ||||||||||||||
Community Health and Hospitals4 | Various | 159,430 | 40,833 | 46,108 | 72,489 | |||||||||||||
Dakabin Family and Community Place | 314 | 8,056 | 304 | 7,752 | ||||||||||||||
Fraser Coast Mental Health Project | 319 | 39,610 | 16,996 | 17,000 | 5,614 | |||||||||||||
Gold Coast Secure Mental Health Rehabilitation Unit | 309 | 105,544 | 3,589 | 45,460 | 56,495 | |||||||||||||
Ipswich Hospital Upgrade | 310 | 22,000 | 3,374 | 11,398 | 7,228 | |||||||||||||
Kirwan Health Campus | 318 | 40,000 | 517 | 5,430 | 34,053 | |||||||||||||
Logan Hospital 28-bed Modular Ward | 311 | 4,540 | 65 | 3,275 | 1,200 | |||||||||||||
Logan Hospital Multi-level Car Park and Link Bridge | 311 | 61,920 | 44,736 | 1,516 | 15,668 | |||||||||||||
Mackay Community Mental Health refurbishment | 312 | 6,000 | 275 | 2,000 | 3,725 | |||||||||||||
Master planning studies | Various | 2,298 | Ongoing | |||||||||||||||
Moura Multi-Purpose Healthcare Service | 308 | 7,200 | 522 | 6,678 | ||||||||||||||
Proserpine Hospital Acute Primary Care Clinic upgrade | 312 | 5,000 | 750 | 3,000 | 1,250 | |||||||||||||
Queen Elizabeth II Jubilee Hospital Car Park | 303 | 29,810 | 1,500 | 28,310 | ||||||||||||||
Redland Hospital Multi-level Car Park | 301 | 34,465 | 11,089 | 13,661 | 9,715 | |||||||||||||
Rockhampton Drug Rehabilitation and Treatment Facility | 308 | 16,264 | 14,928 | 1,336 | ||||||||||||||
Rockhampton Hospital Cardiac Hybrid Theatre | 308 | 18,200 | 1,059 | 6,600 | 10,541 | |||||||||||||
83
Capital Statement 2022-23
| Queensland Health | ||||||||||||||||||
Project | Statistical Area | Total Estimated Cost $‘000 | Expenditure to 30-06-22 $‘000 | Budget 2022-23 $‘000 | Post 2022-23 $‘000 | |||||||||||||
Rockhampton Hospital Mental Health Ward Expansion | 308 | 6,000 | 300 | 5,700 | ||||||||||||||
Rural and Regional Infrastructure Package | ||||||||||||||||||
Cairns Hospital Mental Health Unit | 306 | 70,000 | 10,962 | 38,190 | 20,848 | |||||||||||||
Mer (Murray) Island building replacement | 315 | 7,000 | 1,966 | 5,034 | ||||||||||||||
Sarina Hospital redevelopment5 | 312 | 31,500 | 7,119 | 20,638 | 3,743 | |||||||||||||
Rural and Regional Renal Program | Various | 9,320 | 4,873 | 1,984 | 2,463 | |||||||||||||
Satellite Hospitals Program | Various | 280,000 | 90,682 | 139,917 | 49,401 | |||||||||||||
Staff Accommodation Program | Various | 21,104 | 1,666 | 10,737 | 8,701 | |||||||||||||
Sunshine Coast University Hospital | 316 | 1,872,151 | 1,833,449 | 18,948 | 19,754 | |||||||||||||
Sunshine Coast University Hospital Patient Access and Coordination Hub | 316 | 5,000 | 150 | 4,850 | ||||||||||||||
Sustaining Capital Program6 | Various | 281,620 | Ongoing | |||||||||||||||
The Prince Charles Hospital Carpark | 302 | 81,940 | 3,084 | 17,520 | 61,336 | |||||||||||||
Toowoomba Day Surgery Theatre | 317 | 42,000 | 4,850 | 21,874 | 15,276 | |||||||||||||
Townsville University Hospital Hybrid Theatre | 318 | 17,000 | 1,295 | 3,835 | 11,870 | |||||||||||||
Townsville University Hospital upgrades | 318 | 8,000 | 160 | 1,740 | 6,100 | |||||||||||||
Voluntary Assisted Dying ICT Solution | 305 | 6,930 | 795 | 6,135 | ||||||||||||||
Windorah Primary Health Care Centre | 315 | 12,400 | 3,631 | 7,921 | 848 | |||||||||||||
Woorabinda Multi-Purpose Health Service | 308 | 12,500 | 608 | 6,815 | 5,077 | |||||||||||||
Yeronga Child and Youth Community Hub | 303 | 7,835 | 212 | 408 | 7,215 | |||||||||||||
|
| |||||||||||||||||
Sub-total Hospital and Health Services | 1,293,272 | |||||||||||||||||
|
| |||||||||||||||||
Other Acquisitions of Property, Plant and Equipment | ||||||||||||||||||
Building works capital project management | 305 | 850 | Ongoing | |||||||||||||||
Cladding Investigation and Remediation Program | Various | 27,300 | 22,543 | 454 | 4,303 | |||||||||||||
Queensland Health Emission Reduction Program | Various | 30,000 | 5,817 | 11,542 | 12,641 | |||||||||||||
84
Capital Statement 2022-23
| Queensland Health | ||||||||||||||||||||
Project | Statistical Area | Total Estimated Cost $‘000 | Expenditure to 30-06-22 $‘000 | Budget 2022-23 $‘000 | Post 2022-23 $‘000 | |||||||||||||||
Robina Hospital Second CT Scanner | 309 | 5,650 | 2,968 | 1,341 | 1,341 | |||||||||||||||
State-wide General Chemistry and Immunoassay Replacement and Automation Project | 305 | 16,511 | 12,212 | 4,192 | 107 | |||||||||||||||
|
| |||||||||||||||||||
Sub-total Other Acquisitions of Property, Plant and Equipment | 18,379 | |||||||||||||||||||
|
| |||||||||||||||||||
Information Communication and Technology | ||||||||||||||||||||
Information Communication and Technology | 305 | 110,565 | Ongoing | |||||||||||||||||
|
| |||||||||||||||||||
Sub-total Information Communication and Technology | 110,565 | |||||||||||||||||||
|
| |||||||||||||||||||
Central West | ||||||||||||||||||||
New ROU lease7 | 315 | 601 | 601 | |||||||||||||||||
|
| |||||||||||||||||||
Sub-total Central West | 601 | |||||||||||||||||||
|
| |||||||||||||||||||
Mackay | ||||||||||||||||||||
Bowen Imaging Department (Inc.8 CT Scanner) | 312 | 2,000 | 2,000 | |||||||||||||||||
New ROU lease7 | 312 | 994 | 994 | |||||||||||||||||
|
| |||||||||||||||||||
Sub-total Mackay | 2,994 | |||||||||||||||||||
|
| |||||||||||||||||||
Metro North | ||||||||||||||||||||
Caboolture Hospital Redevelopment Project Digital | 313 | 20,000 | 3,470 | 13,391 | 3,139 | |||||||||||||||
|
| |||||||||||||||||||
Sub-total Metro North | 13,391 | |||||||||||||||||||
|
| |||||||||||||||||||
Metro South | ||||||||||||||||||||
Logan Hospital Maternity Access Road | 311 | 2,549 | 2,020 | 529 | ||||||||||||||||
Logan Hospital Maternity Services Upgrade | 311 | 2,275 | 1,437 | 838 | ||||||||||||||||
Capital projects | Various | 9,337 | 4,995 | 3,635 | 707 | |||||||||||||||
|
| |||||||||||||||||||
Sub-total Metro South | 5,002 | |||||||||||||||||||
|
| |||||||||||||||||||
Sunshine Coast | ||||||||||||||||||||
Sunshine Coast University Hospital Group 4 ICT Project | 316 | 66,300 | 62,636 | 2,517 | 1,147 | |||||||||||||||
Capital projects | Various | 4,092 | 584 | 3,508 | ||||||||||||||||
|
| |||||||||||||||||||
Sub-total Sunshine Coast | 6,025 | |||||||||||||||||||
|
| |||||||||||||||||||
Queensland Ambulance Service | ||||||||||||||||||||
Burdell New Station and Townsville District Office | 318 | 7,200 | 222 | 2,000 | 4,978 | |||||||||||||||
85
Capital Statement 2022-23
| Queensland Health | ||||||||||||||||||||
Project | Statistical Area | Total Estimated Cost $‘000 | Expenditure to 30-06-22 $‘000 | Budget 2022-23 $‘000 | Post 2022-23 $‘000 | |||||||||||||||
Cairns Ambulance Station and Operations Centre redevelopment | 306 | 14,415 | 796 | 3,444 | 10,175 | |||||||||||||||
Caloundra South New Ambulance Station | 316 | 5,500 | 90 | 1,000 | 4,410 | |||||||||||||||
Gold Coast Operations Centre Redevelopment (Coomera) | 309 | 11,490 | 1,319 | 9,681 | 490 | |||||||||||||||
Lawnton New Ambulance Station | 314 | 5,500 | 193 | 1,700 | 3,607 | |||||||||||||||
Morayfield New Ambulance Station | 313 | 6,200 | 301 | 1,200 | 4,699 | |||||||||||||||
North Rockhampton Replacement Ambulance Station and Regional Office | 308 | 5,500 | 90 | 1,500 | 3,910 | |||||||||||||||
Ormeau Ambulance Station | 309 | 6,500 | 426 | 4,500 | 1,574 | |||||||||||||||
Pimpama Ambulance Station redevelopment | 309 | 5,500 | 500 | 5,000 | ||||||||||||||||
Ripley New Ambulance Station and West Moreton District Office | 310 | 7,400 | 391 | 4,400 | 2,609 | |||||||||||||||
Rockhampton Ambulance Station and Operations Centre refurbishment | 308 | 7,700 | 6,866 | 834 | ||||||||||||||||
Southport Ambulance Station redevelopment | 309 | 14,000 | 600 | 13,400 | ||||||||||||||||
Springwood Ambulance Station redevelopment | 311 | 5,500 | 500 | 5,000 | ||||||||||||||||
Minor works | Various | 5,000 | Ongoing | |||||||||||||||||
Strategic land acquisitions | Various | 1,500 | Ongoing | |||||||||||||||||
Operational equipment | Various | 7,914 | Ongoing | |||||||||||||||||
Ambulance vehicle purchases | Various | 33,500 | Ongoing | |||||||||||||||||
Information systems development | Various | 2,000 | Ongoing | |||||||||||||||||
|
| |||||||||||||||||||
Sub-total Queensland Ambulance Service |
| 81,773 | ||||||||||||||||||
|
| |||||||||||||||||||
Total Property, Plant and Equipment | 1,532,002 | |||||||||||||||||||
|
| |||||||||||||||||||
COUNCIL OF THE QUEENSLAND INSTITUTE OF MEDICAL RESEARCH |
| |||||||||||||||||||
Property, Plant and Equipment | ||||||||||||||||||||
Other scientific equipment9 | 305 | 5,110 | Ongoing | |||||||||||||||||
|
| |||||||||||||||||||
Total Property, Plant and Equipment | 5,110 | |||||||||||||||||||
|
| |||||||||||||||||||
|
| |||||||||||||||||||
TOTAL QUEENSLAND HEALTH (PPE) |
| 1,537,112 | ||||||||||||||||||
|
| |||||||||||||||||||
86
Capital Statement 2022-23
Queensland Health
Notes:
| 1. | Total estimated cost may include both non-capital and capital components of project expenditure. |
| 2. | Total estimated cost includes funding of $3 million from South East Queensland - Planning for Growth. |
| 3. | Total funding for the Logan Hospital Maternity Services Update is $18.9 million including funding of $2.3 million from Metro South Hospital and Health Service and $1 million from minor capital projects and acquisitions. |
| 4. | Total estimated cost includes $32 million State Funding for the Redland Hospital Expansion Stage 1. |
| 5. | Total funding for Sarina Hospital Redevelopment is $31.5 million including funding of $10 million from Mackay Hospital and Health Service. |
| 6. | Includes Accelerated Infrastructure Delivery Program and Building Rural and Remote Health Program - Phase 2 and net of non-capital component of project expenditure. |
| 7. | Relates to the lease recognition under the accounting standards and does not reflect a capital purchase. |
| 8. | Total funding for the Bowen Imaging Department is $7 million including funding of $5 million from Community Health and Hospitals. |
| 9. | The QIMR Berghofer capital program in 2022-23 will invest $5.1 million for the acquisition of new and/or replacement state-of-the-art scientific equipment and research facilities. |
87
Capital Statement 2022-23
| 3.14 | QUEENSLAND POLICE SERVICE |
The 2022-23 Queensland Police Service capital program of $174.6 million will support the delivery of quality frontline services throughout Queensland. The program will fund police facilities, motor vehicles, aviation assets, vessels and other essential equipment.
Program Highlights (Property, Plant and Equipment)
| • | $49 million for new and replacement police service vehicles. |
| • | $23.2 million for the Public Safety Network. |
| • | $11.8 million to complete upgrades of the Aurukun, Cairns and Maryborough police facilities. |
| • | $11.8 million to continue upgrades of the Dalby, Mackay and Warwick police facilities. |
| • | $10.3 million for minor capital works and other plant and equipment across the state. |
| • | $10.3 million for information and communications technology. |
| • | $8.6 million for Camera Detected Offence Program equipment. |
| • | $7.2 million to continue the new police facilities at Ripley and Rosewood and complete the replacement police facility at Burketown. |
| • | $7.2 million to continue the replacement police facilities at Clermont, Cooroy, Cunnamulla, Dayboro and Kirwan. |
| • | $7 million to complete the expansion of the police facility at Woree and the new police facility at Cairns West. |
| • | $6 million for upgrades and replacements to air conditioning and closed circuit cameras at police facilities across the state. |
| • | $6 million for new and replacement police service vessels. |
| • | $4.1 million for aircraft maintenance. |
| • | $3.3 million for Queensland Ambulance Service information systems development. |
| • | $3.3 million for Queensland Fire and Emergency Services information and communications systems and equipment. |
| • | $2.7 million for mobile capability and the development of new applications for the QPS QLiTe mobile tablet devices. |
| • | $700,000 to commence the new police facility at Caloundra South and the replacement water police facility at Hervey Bay. |
| • | $500,000 to commence the replacement of police facilities at Longreach, Proserpine, Rainbow Beach and Winton, and residential accommodation at Mount Isa. |
88
Capital Statement 2022-23
| • | $200,000 to commence the replacement of the police facility at Hervey Bay and the multi-agency community safety facility at Palm Island. |
| Queensland Police Service | ||||||||||||||||||||
Project | Statistical Area | Total Estimated Cost $‘000 | Expenditure to 30-06-22 $‘000 | Budget 2022-23 $‘000 | Post 2022-23 $‘000 | |||||||||||||||
QUEENSLAND POLICE SERVICE | ||||||||||||||||||||
Property, Plant and Equipment | ||||||||||||||||||||
Buildings/ General Works | ||||||||||||||||||||
Aurukun police facility upgrade | 315 | 7,800 | 6,020 | 1,780 | ||||||||||||||||
Burketown replacement police facility | 315 | 2,000 | 1,034 | 966 | ||||||||||||||||
Cairns police facility upgrade | 306 | 17,412 | 11,099 | 6,313 | ||||||||||||||||
Cairns West new police facility | 306 | 2,050 | 1,046 | 1,004 | ||||||||||||||||
Caloundra South new police facility | 316 | 9,000 | 500 | 8,500 | ||||||||||||||||
Clermont replacement police facility | 312 | 3,500 | 20 | 1,680 | 1,800 | |||||||||||||||
Cooroy replacement police facility | 316 | 4,000 | 235 | 1,865 | 1,900 | |||||||||||||||
Cunnamulla replacement police facility | 315 | 13,000 | 67 | 550 | 12,383 | |||||||||||||||
Dalby police facility upgrade | 307 | 14,000 | 1,074 | 9,776 | 3,150 | |||||||||||||||
Dayboro replacement police facility | 314 | 4,000 | 155 | 1,980 | 1,865 | |||||||||||||||
Hervey Bay replacement police facility | 319 | 14,000 | 100 | 13,900 | ||||||||||||||||
Hervey Bay replacement water police facility | 319 | 3,800 | 200 | 3,600 | ||||||||||||||||
Kirwan replacement police facility | 318 | 30,000 | 120 | 1,080 | 28,800 | |||||||||||||||
Longreach replacement police facility | 315 | 13,800 | 100 | 13,700 | ||||||||||||||||
Mackay police facility upgrade | 312 | 4,000 | 50 | 1,050 | 2,900 | |||||||||||||||
Maryborough police facility upgrade | 319 | 4,000 | 320 | 3,680 | ||||||||||||||||
Mount Isa residential accommodation | 315 | 5,750 | 100 | 5,650 | ||||||||||||||||
Palm Island multi-agency community safety facility | 318 | 18,000 | 100 | 17,900 | ||||||||||||||||
Proserpine replacement police facility | 312 | 2,300 | 100 | 2,200 | ||||||||||||||||
Rainbow Beach replacement police facility | 319 | 2,300 | 100 | 2,200 | ||||||||||||||||
Ripley new police facility | 310 | 25,000 | 867 | 4,333 | 19,800 | |||||||||||||||
89
Capital Statement 2022-23
| Queensland Police Service | ||||||||||||||||||||
Project | Statistical Area | Total Estimated Cost $‘000 | Expenditure to 30-06-22 $‘000 | Budget 2022-23 $‘000 | Post 2022-23 $‘000 | |||||||||||||||
Rosewood new police facility | 310 | 4,000 | 125 | 1,875 | 2,000 | |||||||||||||||
Warwick police facility upgrade | 307 | 15,000 | 90 | 1,000 | 13,910 | |||||||||||||||
Winton replacement police facility | 315 | 4,600 | 100 | 4,500 | ||||||||||||||||
Woree police facility expansion | 306 | 9,223 | 3,178 | 6,045 | ||||||||||||||||
|
| |||||||||||||||||||
Sub-total Buildings/ General Works | 46,377 | |||||||||||||||||||
|
| |||||||||||||||||||
Land | ||||||||||||||||||||
Land acquisition | Various | 1,500 | Ongoing | |||||||||||||||||
|
| |||||||||||||||||||
Sub-total Land | 1,500 | |||||||||||||||||||
|
| |||||||||||||||||||
Plant and Equipment | ||||||||||||||||||||
QGAir aircraft maintenance | Various | 4,141 | Ongoing | |||||||||||||||||
Air conditioning plant replacement program | Various | 4,000 | Ongoing | |||||||||||||||||
Closed circuit camera upgrades in various police facilities | Various | 2,000 | Ongoing | |||||||||||||||||
Minor works | Various | 6,085 | Ongoing | |||||||||||||||||
New and replacement vehicles | Various | 48,981 | Ongoing | |||||||||||||||||
Vessel management program | Various | 5,959 | Ongoing | |||||||||||||||||
Camera Detected Offence Program | Various | 8,589 | Ongoing | |||||||||||||||||
Mobile capability | Various | 2,720 | Ongoing | |||||||||||||||||
Queensland Ambulance Service information systems development | Various | 3,255 | Ongoing | |||||||||||||||||
Queensland Fire and Emergency Services information and communications systems and equipment | Various | 3,276 | Ongoing | |||||||||||||||||
Information and communication technology | Various | 10,279 | Ongoing | |||||||||||||||||
Public Safety Network | 305 | 23,240 | Ongoing | |||||||||||||||||
Other plant and equipment | Various | 4,227 | Ongoing | |||||||||||||||||
|
| |||||||||||||||||||
Sub-total Plant and Equipment | 126,752 | |||||||||||||||||||
|
| |||||||||||||||||||
|
| |||||||||||||||||||
Total Property, Plant and Equipment | 174,629 | |||||||||||||||||||
|
| |||||||||||||||||||
|
| |||||||||||||||||||
TOTAL QUEENSLAND POLICE SERVICE (PPE) |
| 174,629 | ||||||||||||||||||
|
| |||||||||||||||||||
90
Capital Statement 2022-23
| 3.15 | QUEENSLAND TREASURY |
Queensland Treasury
Queensland Treasury has capital grants of $219 million for 2022-23.
Program Highlights (Capital Grants)
| • | $95.8 million through the Queensland First Home Owners’ Grant to assist first home buyers entering the housing market. |
| • | $123.2 million HomeBuilder grant provided by the Australian Government to eligible applicants towards building a new home, buying a new home or substantially renovating an existing home. The Queensland Government is delivering the HomeBuilder grant on behalf of the Australian Government. |
| Queensland Treasury | ||||||||||||||||||||
Project | Statistical Area | Total Estimated Cost $‘000 | Expenditure to 30-06-22 $‘000 | Budget 2022-23 $‘000 | Post 2022-23 $‘000 | |||||||||||||||
QUEENSLAND TREASURY | ||||||||||||||||||||
Capital Grants | ||||||||||||||||||||
Queensland First Home Owners’ Grant | Various | 95,790 | Ongoing | |||||||||||||||||
HomeBuilder grant (Australian Government) | Various | 364,290 | 241,082 | 123,208 | ||||||||||||||||
|
| |||||||||||||||||||
Total Capital Grants | 218,998 | |||||||||||||||||||
|
| |||||||||||||||||||
|
| |||||||||||||||||||
TOTAL QUEENSLAND TREASURY (CG) | 218,998 | |||||||||||||||||||
|
| |||||||||||||||||||
91
Capital Statement 2022-23
| 3.16 | REGIONAL DEVELOPMENT, MANUFACTURING AND WATER |
The Regional Development, Manufacturing and Water portfolio includes the Department of Regional Development, Manufacturing and Water, Gladstone Area Water Board, Mount Isa Water Board, Seqwater and Sunwater Limited. In 2022-23, the portfolio’s capital program includes capital purchases of $372.2 million and capital grants of $52.5 million.
Department of Regional Development, Manufacturing and Water
The Department of Regional Development, Manufacturing and Water has capital purchases of $119.5 million and capital grants of $52.5 million in 2022-23.
Program Highlights (Property, Plant and Equipment)
| • | $116.9 million, as part of a $367.2 million investment to construct Rookwood Weir, to provide for significant agricultural growth along the Fitzroy River near Rockhampton and enhance the security of urban and industrial water supplies for Gladstone and Capricorn Coast communities. The project is delivered in partnership with the Australian Government, through the National Water Grid Fund. |
Program Highlights (Capital Grants)
| • | $39 million as part of the $70 million Building our Regions program (Round 6) for regional water infrastructure projects that deliver regional and economic development opportunities, support local industry growth, generate new sustainable jobs, and improve liveability in Queensland’s regional communities. |
| • | $6 million for improvements to existing community infrastructure assets that form part of the $367.2 million investment to construct Rookwood Weir. The project is delivered in partnership with the Australian Government, through the National Water Grid Fund. |
| • | $3.8 million for the Southern Downs Drought Resilience Package to upgrade critical infrastructure and unlock new water sources in the Southern Downs region. |
| • | $2.4 million for the Warren’s Gully System capacity upgrade project to increase the peak flow capacity of the Warren’s Gully aquifer recharge and water distribution system. This project is delivered in partnership with the Australian Government, through the National Water Grid Fund. |
| • | $199.5 million over 3 years, held centrally and in most cases subject to business cases and matching Australian Government funding, has been allocated towards priority regional water infrastructure projects, including Cairns Water Security Program, Hughenden Water Bank, Lansdown Eco-Industrial Precinct (enabling infrastructure) and the Mt Morgan Pipeline. |
92
Capital Statement 2022-23
Gladstone Area Water Board
Total capital expenditure planned for 2022-23 is $23.4 million, and is focused on continuing and improving the effective, reliable and safe operation of Gladstone Area Water Board’s infrastructure.
Program Highlights (Property, Plant and Equipment)
| • | $2.3 million to continue planning and preparatory works for the Awoonga Dam spillway capacity upgrade to comply with dam safety standards for extreme weather events. |
| • | $2.3 million to replace the Golegumma pipeline which has reached the end of its design life to supply treated water to facilities at Awoonga Dam, including the caravan park, from Golegumma Reservoir and Gladstone Regional Council’s Wurdong Reservoir. |
| • | $1.1 million in planning for a new treated water pipeline connection at Aldoga to enable new customer connections. |
| • | $853,000 to replace roads at Awoonga Dam to ensure continued safe public and maintenance access. |
Mount Isa Water Board
Total capital expenditure planned for 2022-23 is $9.3 million, and is focused on continuing and improving the cost-efficient, reliable and safe operation of Mount Isa Water Board’s bulk water infrastructure.
Program Highlights (Property, Plant and Equipment)
| • | $3.8 million to renew the high-voltage yard and electro-mechanical equipment in Fred Haigh Pump Station to improve operational reliability and efficiency. |
| • | $1.5 million on works at Lake Julius, including access road renewal, high voltage line access track clearing and replacing power poles to increase bushfire resistance. |
| • | $321,000 on upgrades to chlorine dose equipment to renew outdated chlorination facilities. |
| • | $320,000 to renew pumps in the Lake Moondarra Deep Well Pump Station which will improve reliability and energy efficiency. |
Seqwater
Total capital expenditure planned for 2022-23 is $122.3 million. The capital program is focused on the continuation of a safe, secure and reliable water supply for South East Queensland, as well as providing essential flood mitigation services and managing catchment health. Seqwater has facilities located throughout South East Queensland.
93
Capital Statement 2022-23
These require minor works and renewals, as well as upgrades and compliance-driven works to ensure effective operation.
Program Highlights (Property, Plant and Equipment)
| • | $38.3 million to construct the South West Pipeline to connect the Beaudesert region to the South East Queensland Water Grid and improve water security. |
| • | $14.7 million to construct a new vehicle bridge to provide flood resilient access between Mount Crosby East and West Bank and improve structural performance and safety. |
| • | $6.5 million for enabling works and the construction of a new substation at Mount Crosby East Bank to improve flood resilience. |
| • | $4.6 million to continue planning and investigatory work for dam improvement projects to comply with dam safety standards for extreme weather events, including Somerset Dam and Lake Macdonald Dam. |
| • | $2.2 million to upgrade the critical electrical infrastructure at the Mount Crosby East Bank Water Treatment Plant pump station. |
Sunwater Limited
Total capital expenditure planned for 2022-23 is $97.7 million. The capital program is focused on enhancing Sunwater’s dam infrastructure to meet extreme weather conditions and to provide a reliable water supply to regional Queensland, as well as investing in innovative digital technology to drive collaboration and efficiency.
Program Highlights (Property, Plant and Equipment)
| • | $30.1 million of a total $97 million to progress design, planning and early works for the Paradise Dam improvement project. |
| • | $19.5 million to continue investigatory planning works for the Burdekin Falls Dam improvement project to comply with dam safety standards for extreme weather events. |
| • | $10 million to continue to investigate the feasibility of raising Burdekin Falls Dam to increase storage capacity and water supply in the Burdekin and surrounding regions. |
| • | $3.7 million to trial a rising groundwater management solution in the Burdekin Haughton area. |
| • | $1.5 million to develop infrastructure to access water held below the dead storage levels of Leslie Dam. |
94
Capital Statement 2022-23
| Regional Development, Manufacturing and Water | ||||||||||||||||
Project | Statistical Area | Total Estimated Cost $‘000 | Expenditure to 30-06-22 $‘000 | Budget 2022-23 $‘000 | Post 2022-23 $‘000 | |||||||||||
DEPARTMENT OF REGIONAL DEVELOPMENT, MANUFACTURING AND WATER | ||||||||||||||||
Property, Plant and Equipment | ||||||||||||||||
Rookwood Weir1 | 308 | 319,124 | 202,217 | 116,907 | ||||||||||||
Other property, plant and equipment | Various | 2,600 | Ongoing | |||||||||||||
|
| |||||||||||||||
Total Property, Plant and Equipment | 119,507 | |||||||||||||||
|
| |||||||||||||||
Capital Grants | ||||||||||||||||
Big Rocks Weir - planning | 318 | 6,000 | 5,000 | 1,000 | ||||||||||||
Building our Regions (Round 6) | Various | 70,000 | 1,000 | 39,000 | 30,000 | |||||||||||
Rookwood Weir1 | 308 | 25,737 | 19,737 | 6,000 | ||||||||||||
Southern Downs Drought Resilience Package | 307 | 7,640 | 3,820 | 3,820 | ||||||||||||
Warren’s Gully System capacity upgrade project | 318 | 4,760 | 1,190 | 2,380 | 1,190 | |||||||||||
Warwick recycled water for agriculture project (stage 3) | 307 | 481 | 145 | 336 | ||||||||||||
|
| |||||||||||||||
Total Capital Grants | 52,536 | |||||||||||||||
|
| |||||||||||||||
GLADSTONE AREA WATER BOARD | ||||||||||||||||
Property, Plant and Equipment | ||||||||||||||||
Aldoga treated water connection | 308 | 7,484 | 31 | 1,140 | 6,313 | |||||||||||
Awoonga Dam pipeline remediation | 308 | 4,624 | 65 | 814 | 3,745 | |||||||||||
Awoonga Dam roads replacement | 308 | 1,139 | 286 | 853 | ||||||||||||
Awoonga Dam Spillway capacity upgrade - planning | 308 | 8,844 | 353 | 2,294 | 6,197 | |||||||||||
Boyne Island Reservoir roof replacement | 308 | 3,627 | 427 | 3,200 | ||||||||||||
East End Pipeline replacement - planning | 308 | 3,389 | 210 | 545 | 2,634 | |||||||||||
Expansion of Boat Creek pump station - planning | 308 | 5,529 | 88 | 350 | 5,091 | |||||||||||
Flow meter replacements | 308 | 1,764 | 333 | 1,431 | ||||||||||||
Golegumma pipeline replacement | 308 | 2,610 | 310 | 2,300 | ||||||||||||
Program of smaller capital works projects | 308 | 7,438 | Ongoing | |||||||||||||
Queensland Alumina Limited raw water pipeline replacement | 308 | 3,086 | 328 | 2,029 | 729 | |||||||||||
95
Capital Statement 2022-23
| Regional Development, Manufacturing and Water | ||||||||||||||||||||
Project | Statistical Area | Total Estimated Cost $‘000 | Expenditure to 30-06-22 $‘000 | Budget 2022-23 $‘000 | Post 2022-23 $‘000 | |||||||||||||||
Right of use lease assets | 308 | 991 | 991 | |||||||||||||||||
|
| |||||||||||||||||||
Total Property, Plant and Equipment | 23,385 | |||||||||||||||||||
|
| |||||||||||||||||||
MOUNT ISA WATER BOARD | ||||||||||||||||||||
Property, Plant and Equipment | ||||||||||||||||||||
Chlorine dose equipment upgrade | 315 | 1,163 | 842 | 321 | ||||||||||||||||
Fred Haigh pump station electro-mechanical overhaul | 315 | 7,970 | 4,205 | 3,765 | ||||||||||||||||
Lake Julius access road renewal and high voltage line access road clearing | 315 | 687 | 687 | |||||||||||||||||
Lake Julius power pole replacement | 315 | 2,470 | 815 | 1,655 | ||||||||||||||||
Lake Moondarra Deep Well Pump Station pumps renewal | 315 | 900 | 580 | 320 | ||||||||||||||||
Second pathogen disinfection system | 315 | 1,765 | 251 | 1,514 | ||||||||||||||||
Site security upgrades | 315 | 1,450 | 243 | 500 | 707 | |||||||||||||||
Other asset enhancements | 315 | 515 | Ongoing | |||||||||||||||||
Other asset renewals | 315 | 635 | Ongoing | |||||||||||||||||
Other plant and equipment | 315 | 240 | Ongoing | |||||||||||||||||
|
| |||||||||||||||||||
Total Property, Plant and Equipment | 9,312 | |||||||||||||||||||
|
| |||||||||||||||||||
SEQWATER | ||||||||||||||||||||
Property, Plant and Equipment | ||||||||||||||||||||
Dayboro water source and treatment upgrade with pipeline grid connection | 314 | 20,314 | 184 | 20,130 | ||||||||||||||||
Information and communication technology capital program | 310 | 3,346 | Ongoing | |||||||||||||||||
Lake Macdonald Dam improvement2 project - planning | 316 | 127,278 | 21,199 | 687 | 105,392 | |||||||||||||||
Lowood Water Treatment Plant sludge capacity upgrade | 309 | 10,016 | 109 | 9,907 | ||||||||||||||||
Mount Crosby East Bank sub-station and enabling works | 310 | 32,570 | 13,755 | 6,466 | 12,349 | |||||||||||||||
Mount Crosby East Bank critical | 310 | 49,400 | 4,786 | 2,218 | 42,396 | |||||||||||||||
96
Capital Statement 2022-23
| Regional Development, Manufacturing and Water | ||||||||||||||||||||
Project | Statistical Area | Total Estimated Cost $‘000 | Expenditure to 30-06-22 $‘000 | Budget 2022-23 $‘000 | Post 2022-23 $‘000 | |||||||||||||||
electrical infrastructure upgrade | ||||||||||||||||||||
Mount Crosby Weir Bridge structure upgrade | 310 | 29,450 | 4,593 | 14,712 | 10,145 | |||||||||||||||
Mount Crosby West Bank Water Treatment Plant centrifuge installation | 310 | 13,935 | 875 | 217 | 12,843 | |||||||||||||||
Non-infrastructure capital works | 310 | 1,673 | Ongoing | |||||||||||||||||
Other infrastructure improvements - other infrastructure projects | Various | 13,622 | Ongoing | |||||||||||||||||
Other infrastructure improvements - water storage projects | Various | 6,305 | Ongoing | |||||||||||||||||
Other infrastructure improvements - water transport projects | Various | 6,326 | Ongoing | |||||||||||||||||
Other infrastructure improvements - water treatment projects | Various | 24,297 | Ongoing | |||||||||||||||||
Somerset Dam improvement project - planning | 310 | 31,107 | 25,754 | 3,871 | 1,482 | |||||||||||||||
South West Pipeline | 311 | 95,200 | 46,272 | 38,305 | 10,623 | |||||||||||||||
|
| |||||||||||||||||||
Total Property, Plant and Equipment | 122,338 | |||||||||||||||||||
|
| |||||||||||||||||||
SUNWATER LIMITED | ||||||||||||||||||||
Property, Plant and Equipment | ||||||||||||||||||||
Burdekin Falls Dam improvement project - planning | 318 | 38,838 | 19,338 | 19,500 | ||||||||||||||||
Burdekin Falls Dam raising project - planning | 318 | 29,148 | 19,148 | 10,000 | ||||||||||||||||
Burdekin groundwater management | 318 | 9,696 | 1,313 | 3,650 | 4,733 | |||||||||||||||
Enterprise data and analytics systems | 305 | 6,530 | 3,885 | 2,645 | ||||||||||||||||
Eungella Water Pipeline (stage 3) | 318 | 12,086 | 1,250 | 4,682 | 6,154 | |||||||||||||||
Leslie Dam dead storage access | 307 | 2,900 | 211 | 1,493 | 1,196 | |||||||||||||||
Non-infrastructure capital works | Various | 2,654 | Ongoing | |||||||||||||||||
Non-routine capital works - bulk water infrastructure | Various | 1,424 | Ongoing | |||||||||||||||||
Non-routine capital works - industrial pipelines | Various | 2,118 | Ongoing | |||||||||||||||||
Non-routine capital works - irrigation systems | Various | 6,386 | Ongoing | |||||||||||||||||
97
Capital Statement 2022-23
| Regional Development, Manufacturing and Water | ||||||||||||||||||||
Project | Statistical Area | Total Estimated Cost $‘000 | Expenditure to 30-06-22 $‘000 | Budget 2022-23 $‘000 | Post 2022-23 $‘000 | |||||||||||||||
Paradise Dam essential works | 319 | 98,701 | 97,700 | 1,001 | ||||||||||||||||
Paradise Dam improvement project - 3 planning and early works | 319 | 97,000 | 31,870 | 30,142 | 34,988 | |||||||||||||||
Bowen Basin pipeline augmentation and pump station | 312 | 9,465 | 2,883 | 5,413 | 1,169 | |||||||||||||||
Right of use leased assets | Various | 3,271 | 3,271 | |||||||||||||||||
Rocklea hydraulic laboratory expansion | 303 | 6,527 | 2,056 | 4,471 | ||||||||||||||||
|
| |||||||||||||||||||
Total Property, Plant and Equipment | 97,675 | |||||||||||||||||||
|
| |||||||||||||||||||
|
| |||||||||||||||||||
TOTAL REGIONAL DEVELOPMENT, MANUFACTURING AND WATER (PPE) |
| 372,217 | ||||||||||||||||||
|
| |||||||||||||||||||
|
| |||||||||||||||||||
TOTAL REGIONAL DEVELOPMENT, MANUFACTURING AND WATER (CG) |
| 52,536 | ||||||||||||||||||
|
| |||||||||||||||||||
Notes:
| 1. | The total capital expenditure component of the project is $347.9 million, which includes $319.1 million for Rookwood Weir, $25.7 million for enhancements required to existing community infrastructure (such as roads and bridges) to service and support the project, and $3 million in centrally-held funding. The total project value of $367.2 million is inclusive of operating expenditure. |
| 2. | The Lake Macdonald Dam improvement project budget in 2022-23 reflects the cost of the ongoing options assessment process. The $127.278 million total estimated cost reflects the previous total estimated cost for the project including construction costs. The total estimated cost will be revised following the completion of the options assessment and an investment decision on the preferred upgrade option. |
| 3. | This is the total estimated cost for planning and early works only. The total estimated cost of rebuilding Paradise Dam is $1.2 billion, which is supported by commitments of $600 million from the Queensland Government and $600 million from the Australian Government. |
98
Capital Statement 2022-23
| 3.17 | RESOURCES |
Department of Resources
The capital purchases budget for the Resources portfolio for 2022-23 is $10.1 million.
The department’s capital investment program will support maintenance of the state’s stock route network, investment in digital solutions to support the vast datasets used to stimulate economic development in Queensland and other critical property, plant and equipment assets to support the department’s service delivery requirements.
| Resources | ||||||||||||||||||||
Project | Statistical Area | Total Estimated Cost $‘000 | Expenditure to 30-06-22 $‘000 | Budget 2022-23 $‘000 | Post 2022-23 $‘000 | |||||||||||||||
DEPARTMENT OF RESOURCES | ||||||||||||||||||||
Property, Plant and Equipment | ||||||||||||||||||||
Systems development | Various | 3,389 | Ongoing | |||||||||||||||||
Stock route network | Various | 900 | Ongoing | |||||||||||||||||
Other property, plant and equipment | Various | 5,816 | Ongoing | |||||||||||||||||
|
| |||||||||||||||||||
Total Property, Plant and Equipment | 10,105 | |||||||||||||||||||
|
| |||||||||||||||||||
|
| |||||||||||||||||||
TOTAL RESOURCES (PPE) | 10,105 | |||||||||||||||||||
|
| |||||||||||||||||||
99
Capital Statement 2022-23
| 3.18 | SENIORS, DISABILITY SERVICES AND ABORIGINAL AND TORRES STRAIT ISLANDER PARTNERSHIPS |
Department of Seniors, Disability Services and Aboriginal and Torres Strait Islander Partnerships
The capital works program for the Department of Seniors, Disability Services and Aboriginal and Torres Strait Islander Partnerships is $5.1 million in 2022-23. The total capital grants program for the department is $2.6 million in 2022-23.
Capital works investment is primarily within the Disability Services portfolio and capital grants relate to an Aboriginal and Torres Strait Islander Partnerships program.
Program Highlights (Property, Plant and Equipment)
| • | $4.2 million to advance the provision of infrastructure in relation to robust and secure accommodation for complex clients with challenging behaviours. The funding in 2022-23 is predominately for the construction of a new purpose-built duplex in Wacol. |
| • | $500,000 to continue upgrading, improving and modifying accommodation facilities for people with an intellectual or cognitive disability who exhibit extremely challenging behaviours. |
Program Highlights (Capital Grants)
| • | $2.6 million for the construction and completion of a splash park on Thursday Island. |
| Seniors, Disability Services and Aboriginal and Torres Strait Islander Partnerships | ||||||||||||||||||||
Project | Statistical Area | Total Estimated Cost $‘000 | Expenditure to 30-06-22 $‘000 | Budget 2022-23 $‘000 | Post 2022-23 $‘000 | |||||||||||||||
DEPARTMENT OF SENIORS, DISABILITY SERVICES AND ABORIGINAL AND TORRES STRAIT ISLANDER PARTNERSHIPS |
| |||||||||||||||||||
Property, Plant and Equipment | ||||||||||||||||||||
Disability Services | ||||||||||||||||||||
Wacol FDS transition accommodation | 310 | 6,450 | 2,250 | 4,200 | ||||||||||||||||
General property upgrades | Various | 500 | Ongoing | |||||||||||||||||
Other Property, Plant and Equipment Minor capital works | Various | 402 | Ongoing | |||||||||||||||||
|
| |||||||||||||||||||
Total Property, Plant and Equipment | 5,102 | |||||||||||||||||||
|
| |||||||||||||||||||
Capital Grants | ||||||||||||||||||||
Aboriginal and Torres Strait Islander Partnerships | ||||||||||||||||||||
100
Capital Statement 2022-23
| Seniors, Disability Services and Aboriginal and Torres Strait Islander Partnerships | ||||||||||||||||||||
Project | Statistical Area | Total Estimated Cost $‘000 | Expenditure to 30-06-22 $‘000 | Budget 2022-23 $‘000 | Post 2022-23 $‘000 | |||||||||||||||
Splash Park - Thursday Island | 315 | 3,000 | 389 | 2,611 | ||||||||||||||||
|
| |||||||||||||||||||
Total Capital Grants | 2,611 | |||||||||||||||||||
|
| |||||||||||||||||||
|
| |||||||||||||||||||
TOTAL SENIORS, DISABILITY SERVICES AND ABORIGINAL AND TORRES STRAIT ISLANDER PARTNERSHIPS (PPE) |
| 5,102 | ||||||||||||||||||
|
| |||||||||||||||||||
|
| |||||||||||||||||||
TOTAL SENIORS, DISABILITY SERVICES AND ABORIGINAL AND TORRES STRAIT ISLANDER PARTNERSHIPS (CG) |
| 2,611 | ||||||||||||||||||
|
| |||||||||||||||||||
101
Capital Statement 2022-23
| 3.19 | STATE DEVELOPMENT, INFRASTRUCTURE, LOCAL GOVERNMENT AND PLANNING |
In 2022-23, the State Development, Infrastructure, Local Government and Planning portfolio, including Economic Development Queensland, South Bank Corporation and the Queensland Reconstruction Authority, has capital purchases of $178.6 million and capital grants of $1.047 billion.
Department of State Development, Infrastructure, Local Government and Planning
The Department of State Development, Infrastructure, Local Government and Planning has capital purchases of $5.7 million and capital grants of $342.2 million in 2022-23.
Program Highlights (Capital Grants)
| • | $88.2 million as part of the $1 billion Works for Queensland program to support local governments in regional Queensland undertaking job-creating maintenance and minor infrastructure works. |
| • | $50 million towards the $195 million Haughton Pipeline (stage 2) water security initiative for Townsville. |
| • | $46 million for the Resources Community Infrastructure Fund to support the post COVID-19 recovery of regional communities by improving economic and social infrastructure across Queensland’s resources communities. |
| • | $36.1 million for the Local Government Grants and Subsidies Program, which provides funding for priority infrastructure projects to meet identified community needs and supports projects that will create sustainable and liveable communities. |
| • | $24.8 million towards the $200 million South East Queensland Community Stimulus Program to fast track South East Queensland councils’ investment in new infrastructure and community assets that create jobs and deliver economic stimulus. |
| • | $22.3 million as part of the $120 million Indigenous Councils Critical Infrastructure Program to support Indigenous councils to implement projects and infrastructure works relating to critical water, wastewater and solid waste assets, and provide a basis for the long-term strategic management of essential assets. |
| • | $19.5 million for the Building our Regions program (Rounds 1-5) to provide funding for critical infrastructure in regional areas of the state, while also generating jobs, fostering economic development and improving the liveability of regional communities. |
| • | $12.2 million as part of the $25 million Regional Recovery Partnerships program to support recovery and growth through a package of targeted initiatives in Cairns, |
102
Capital Statement 2022-23
Gladstone and the Mackay-Isaac-Whitsunday region, funded by the Australian Government. |
| • | $9.9 million as part of the $200 million COVID-19 Works for Queensland program to support local governments in regional Queensland undertaking job-creating maintenance and minor infrastructure projects. |
Economic Development Queensland
In 2022-23, Economic Development Queensland has capital purchases of $163.1 million.
Program Highlights (Property, Plant and Equipment)
| • | $48.7 million for the development of the Gladstone State Development Area. |
| • | $35.8 million for the urban renewal development at Northshore Hamilton. |
| • | $20 million for the development of the Sunshine Coast Industrial Park (stage 2). |
| • | $15.8 million for the development of the Yeronga Priority Development Area. |
| • | $13.9 million for the development of the Currumbin Eco-Parkland. |
| • | $9.7 million for the development of the Oxley Priority Development Area. |
Queensland Reconstruction Authority
In 2022-23, the Queensland Reconstruction Authority has capital grants of $704.5 million to support the Queensland Government’s program of infrastructure renewal and recovery within disaster-affected communities, and to help build disaster resilience across Queensland.
Program Highlights (Capital Grants)
| • | $675.2 million for Disaster Recovery Funding Arrangements will be paid to local government authorities for reconstruction, betterment and other projects relating to natural disaster events between 2019 and 2022. This program is jointly funded by the Queensland Government and the Australian Government. |
| • | $13.1 million as part of the $65.5 million Queensland Resilience and Risk Reduction Fund to support disaster mitigation projects and build resilience to natural disasters over 5 years, jointly funded with the Australian Governement. |
| • | $7.2 million as part of the $28 million Recovery and Resilience Grants program to support the 14 local government areas hardest hit by the 2019 North Queensland Monsoon Trough, funded by the Australian Government. |
| • | $5.9 million as part of the $9.9 million National Flood Mitigation Infrastructure Program to deliver projects that assist communities to prepare for future flood events, funded by the Australian Government. |
103
Capital Statement 2022-23
| • | $3 million as part of the $10 million North Queensland Natural Disasters Mitigation Program to help councils in North and Far North Queensland reduce their disaster risk and assist in reducing the growth of insurance costs for residents, businesses and the community. |
South Bank Corporation
In 2022-23, the South Bank Corporation has budgeted capital works expenditure of $9.8 million to enhance the South Bank Parklands, the Corporation’s commercial assets and the Brisbane Convention and Exhibition Centre.
| State Development, Infrastructure, Local Government and Planning | ||||||||||||||||||||
Project | Statistical Area | Total Estimated Cost $‘000 | Expenditure to 30-06-22 $‘000 | Budget 2022-23 $‘000 | Post 2022-23 $‘000 | |||||||||||||||
DEPARTMENT OF STATE DEVELOPMENT, INFRASTRUCTURE, LOCAL GOVERNMENT AND PLANNING |
| |||||||||||||||||||
Property, Plant and Equipment | ||||||||||||||||||||
State development area acquisitions | 318 | 12,329 | 8,400 | 3,929 | ||||||||||||||||
Gladstone State Development Area (Targinnie) | 308 | 1,628 | 204 | 1,424 | ||||||||||||||||
Queensland Flight Test Range upgrades | 315 | 358 | 135 | 223 | ||||||||||||||||
Other plant and equipment | 305 | 70 | Ongoing | |||||||||||||||||
State development area property management | 318 | 50 | Ongoing | |||||||||||||||||
|
| |||||||||||||||||||
Total Property, Plant and Equipment | 5,696 | |||||||||||||||||||
|
| |||||||||||||||||||
Capital Grants | ||||||||||||||||||||
Works for Queensland | Various | 1,000,000 | 721,790 | 88,210 | 190,000 | |||||||||||||||
Haughton Pipeline (stage 2) | 318 | 195,000 | 7,500 | 50,000 | 137,500 | |||||||||||||||
Resources Community Infrastructure Fund | Various | 100,399 | 46,000 | 54,399 | ||||||||||||||||
Local Government Grants and Subsidies Program | Various | 36,089 | Ongoing | |||||||||||||||||
South East Queensland Community Stimulus Program | Various | 200,000 | 60,162 | 24,838 | 115,000 | |||||||||||||||
Indigenous Councils Critical Infrastructure Program | Various | 120,000 | 88,876 | 22,324 | 8,800 | |||||||||||||||
Building our Regions (Rounds 1-5) | Various | 329,510 | 296,285 | 19,475 | 13,750 | |||||||||||||||
Regional Recovery Partnerships program | Various | 24,650 | 2,165 | 12,150 | 10,335 | |||||||||||||||
COVID-19 Works for Queensland | Various | 200,000 | 190,112 | 9,888 | ||||||||||||||||
104
Capital Statement 2022-23
| State Development, Infrastructure, Local Government and Planning | ||||||||||||||||||||
Project | Statistical Area | Total Estimated Cost $‘000 | Expenditure to 30-06-22 $‘000 | Budget 2022-23 $‘000 | Post 2022-23 $‘000 | |||||||||||||||
Community Infrastructure Investment Partnership | Various | 15,000 | 4,440 | 6,960 | 3,600 | |||||||||||||||
Ayr water supply infrastructure project (stage 2) | 318 | 12,000 | 7,000 | 5,000 | ||||||||||||||||
Hinchinbrook Harbour new sewage plant | 306 | 6,433 | 69 | 3,819 | 2,545 | |||||||||||||||
Unite and Recover Community Stimulus Package | Various | 50,000 | 47,321 | 2,679 | ||||||||||||||||
Southport Spit | 309 | 27,208 | 23,395 | 2,554 | 1,259 | |||||||||||||||
Roma Street Parklands | 305 | 2,565 | Ongoing | |||||||||||||||||
Cunnamulla artesian hot springs and river walk experience | 315 | 4,996 | 2,720 | 2,276 | ||||||||||||||||
Northern Peninsula Area water supply system - replacement of asbestos cement pipelines | 315 | 5,000 | 2,916 | 2,084 | ||||||||||||||||
Splash parks in Mareeba and Douglas Shires | 315 | 3,000 | 900 | 2,100 | ||||||||||||||||
Northern Peninsula Area water supply system - water supply rectification and repair program of works | 315 | 4,000 | 2,666 | 1,334 | ||||||||||||||||
Logan City Council - digital infrastructure and connectivity | 303 | 2,500 | 1,250 | 1,000 | 250 | |||||||||||||||
Kuranda Skyrail and infrastructure levy | 306 | 744 | Ongoing | |||||||||||||||||
Royalties for the Regions | 315 | 85,788 | 85,688 | 100 | ||||||||||||||||
|
| |||||||||||||||||||
Total Capital Grants | 342,189 | |||||||||||||||||||
|
| |||||||||||||||||||
ECONOMIC DEVELOPMENT QUEENSLAND | ||||||||||||||||||||
Property, Plant and Equipment | ||||||||||||||||||||
Gladstone State Development Area | 308 | 79,759 | 9,059 | 48,650 | 22,050 | |||||||||||||||
Northshore Hamilton | 302 | 376,767 | 95,277 | 35,806 | 245,684 | |||||||||||||||
Sunshine Coast Industrial Park (stage 2) | 316 | 33,076 | 10,076 | 20,000 | 3,000 | |||||||||||||||
Yeronga Priority Development Area | 303 | 31,929 | 15,997 | 15,756 | 176 | |||||||||||||||
Currumbin Eco-Parkland | 309 | 15,000 | 1,115 | 13,885 | ||||||||||||||||
Oxley Priority Development Area | 310 | 36,084 | 25,060 | 9,730 | 1,294 | |||||||||||||||
Carseldine Urban Village | 302 | 39,540 | 31,879 | 7,661 | ||||||||||||||||
Yeerongpilly Green | 303 | 75,652 | 56,624 | 4,180 | 14,848 | |||||||||||||||
105
Capital Statement 2022-23
| State Development, Infrastructure, Local Government and Planning | ||||||||||||||||||||
Project | Statistical Area | Total Estimated Cost $‘000 | Expenditure to 30-06-22 $‘000 | Budget 2022-23 $‘000 | Post 2022-23 $‘000 | |||||||||||||||
Gold Coast Health and Knowledge Precinct | 309 | 39,970 | 27,130 | 3,710 | 9,130 | |||||||||||||||
Coolum Eco Industrial Park (stage 2) | 316 | 2,500 | 2,500 | |||||||||||||||||
Clinton Industrial Estate | 308 | 20,139 | 1,889 | 500 | 17,750 | |||||||||||||||
Salisbury Plains Industrial Precinct | 312 | 9,307 | 2,557 | 500 | 6,250 | |||||||||||||||
Townsville Regional Industrial Estate | 318 | 6,265 | 4,665 | 200 | 1,400 | |||||||||||||||
|
| |||||||||||||||||||
Total Property, Plant and Equipment | 163,078 | |||||||||||||||||||
|
| |||||||||||||||||||
QUEENSLAND RECONSTRUCTION AUTHORITY | ||||||||||||||||||||
Capital Grants | ||||||||||||||||||||
Disaster Recovery Funding Arrangements | Various | 675,241 | Ongoing | |||||||||||||||||
Queensland Resilience and Risk Reduction Fund | Various | 65,507 | 18,344 | 13,101 | 34,062 | |||||||||||||||
Recovery and Resilience Grants | Various | 28,000 | 7,800 | 7,200 | 13,000 | |||||||||||||||
National Flood Mitigation Infrastructure Program | Various | 9,900 | 2,970 | 5,940 | 990 | |||||||||||||||
North Queensland Natural Disasters Mitigation Program | Various | 10,000 | 3,000 | 7,000 | ||||||||||||||||
|
| |||||||||||||||||||
Total Capital Grants | 704,482 | |||||||||||||||||||
|
| |||||||||||||||||||
SOUTH BANK CORPORATION | ||||||||||||||||||||
Property, Plant and Equipment | ||||||||||||||||||||
South Bank Parklands enhancements and replacements | 305 | 4,654 | Ongoing | |||||||||||||||||
Safety related capital works | 305 | 3,085 | 3,085 | |||||||||||||||||
Brisbane Convention and Exhibition Centre enhancements and replacements | 305 | 1,000 | Ongoing | |||||||||||||||||
Car park upgrades and replacements | 305 | 790 | Ongoing | |||||||||||||||||
Investment properties - other enhancements and replacements | 305 | 300 | Ongoing | |||||||||||||||||
|
| |||||||||||||||||||
Total Property, Plant and Equipment | 9,829 | |||||||||||||||||||
|
| |||||||||||||||||||
106
Capital Statement 2022-23
| State Development, Infrastructure, Local Government and Planning | ||||||||||||||||||||
Project | Statistical Area | Total Estimated Cost $‘000 | Expenditure to 30-06-22 $‘000 | Budget 2022-23 $‘000 | Post 2022-23 $‘000 | |||||||||||||||
|
| |||||||||||||||||||
TOTAL STATE DEVELOPMENT, INFRASTRUCTURE, LOCAL GOVERNMENT AND PLANNING (PPE) | 178,603 | |||||||||||||||||||
|
| |||||||||||||||||||
|
| |||||||||||||||||||
TOTAL STATE DEVELOPMENT, INFRASTRUCTURE, LOCAL GOVERNMENT AND PLANNING (CG) | 1,046,671 | |||||||||||||||||||
|
| |||||||||||||||||||
107
Capital Statement 2022-23
| 3.20 | TOURISM, INNOVATION AND SPORT |
Department of Tourism, Innovation and Sport
Total capital purchases of $18.4 million are budgeted for the Department of Tourism, Innovation and Sport in 2022-23. Total capital grants of $105.1 million are budgeted for the department in 2022-23.
Program Highlights (Property, Plant and Equipment)
| • | $11.1 million to enhance existing state-owned sport and active recreation facilities at the Gold Coast, Sunshine Coast and Townsville, to deliver quality experiences that inspire physical activity. |
| • | $7.3 million for a 94 kilometre walking and mountain biking trail from Palm Cove to Port Douglas, with public and eco-accommodation facilities. |
Program Highlights (Capital Grants)
| • | $24.2 million to encourage Queenslanders to be more active, more often as well as working to increase health and wellbeing outcomes across the state in line with key government priorities. |
| • | $14.7 million to fund minor facility improvements that support increased opportunities for Queenslanders to participate in sport and active recreation. |
| • | $10 million towards stage one of the redevelopment of Sunshine Coast Stadium at Bokarina. |
| • | $9 million to progress the construction of the Quandamooka Art Museum and Performance Institute (QUAMPI) and auxiliary infrastructure for the recreational trail. |
| • | $8.9 million towards supporting field of play participation by enhancing facilities to meet local community level playing requirements. |
| • | $6.2 million to assist sport and active recreation organisations with the clean-up, repair or replacement of equipment and facilities damaged by the South East Queensland rainfall and flooding event in February 2022. |
Stadiums Queensland
Stadiums Queensland’s 2022-23 capital outlay of $46.9 million will ensure that Queensland’s major sports and entertainment facilities continue to provide world-class fan experiences, support high performance development, facilitate community participation in sport and physical activity, and remain contemporary to support the hosting of international events such as the 2023 FIFA Women’s World Cup.
108
Capital Statement 2022-23
| Tourism, Innovation and Sport | ||||||||||||||||||||
Project | Statistical Area | Total Estimated Cost $‘000 | Expenditure to 30-06-22 $‘000 | Budget 2022-23 $‘000 | Post 2022-23 $‘000 | |||||||||||||||
DEPARTMENT OF TOURISM, INNOVATION AND SPORT |
| |||||||||||||||||||
Property, Plant and Equipment | ||||||||||||||||||||
Queensland Active Precincts | Various | 77,490 | 35,932 | 11,086 | 30,472 | |||||||||||||||
Wangetti Trail | 306 | 30,448 | 3,094 | 7,300 | 20,054 | |||||||||||||||
|
| |||||||||||||||||||
Total Property, Plant and Equipment | 18,386 | |||||||||||||||||||
|
| |||||||||||||||||||
Capital Grants | ||||||||||||||||||||
Local community sporting infrastructure | Various | 42,856 | 15,134 | 24,179 | 3,543 | |||||||||||||||
Sport Minor Infrastructure Program | Various | 38,518 | 14,673 | 23,845 | ||||||||||||||||
Sunshine Coast Stadium | 316 | 20,000 | 10,000 | 10,000 | ||||||||||||||||
Minjerribah Futures program | Various | 13,252 | 824 | 9,010 | 3,418 | |||||||||||||||
Active Game Day Schools | Various | 9,726 | 875 | 8,851 | ||||||||||||||||
Sport and Recreation Recovery Grant | Various | 30,500 | 9,920 | 6,180 | 14,400 | |||||||||||||||
Sporting infrastructure | Various | 13,157 | 5,157 | 8,000 | ||||||||||||||||
Active Community Infrastructure - Round 1 | Various | 25,591 | 20,910 | 4,681 | ||||||||||||||||
FIFA Women’s World Cup 2023 | 305 | 6,000 | 3,000 | 3,000 | ||||||||||||||||
Allied Health and Wellbeing Centre (Clem Jones Centre) | 303 | 5,000 | 2,250 | 2,500 | 250 | |||||||||||||||
AFL Grand Final legacy | Various | 4,000 | 2,000 | 2,000 | ||||||||||||||||
Attracting Tourism Fund | Various | 11,750 | 9,944 | 1,806 | ||||||||||||||||
Growing Indigenous Tourism in Queensland Fund | Various | 6,400 | 4,600 | 1,800 | ||||||||||||||||
Wangetti Trail (Mowbray North) | 306 | 5,443 | 3,821 | 1,622 | ||||||||||||||||
School Sport Infrastructure Program | Various | 4,771 | 3,361 | 1,410 | ||||||||||||||||
Outback Tourism Infrastructure Fund | Various | 7,796 | 6,541 | 1,255 | ||||||||||||||||
Growing Tourism Infrastructure Fund | Various | 29,039 | 27,958 | 1,081 | ||||||||||||||||
Townsville skate park (Harold Phillips Park) | 318 | 1,000 | 100 | 900 | ||||||||||||||||
Surf Life Saving infrastructure | Various | 6,000 | 4,550 | 700 | 750 | |||||||||||||||
Townsville Sailing Club | 318 | 4,000 | 3,435 | 565 | ||||||||||||||||
Great Barrier Reef Arena Development Project | 312 | 10,000 | 9,500 | 500 | ||||||||||||||||
Growing Tourism Infrastructure Fund 2020 | Various | 25,190 | 24,690 | 500 | ||||||||||||||||
Great Barrier Reef Island Resorts Rejuvenation Program | Various | 22,397 | 21,935 | 462 | ||||||||||||||||
109
Capital Statement 2022-23
| Tourism, Innovation and Sport | ||||||||||||||||||||
Project | Statistical Area | Total Estimated Cost $‘000 | Expenditure to 30-06-22 $‘000 | Budget 2022-23 $‘000 | Post 2022-23 $‘000 | |||||||||||||||
Cardwell Tropical Mountain Bike Trail | Various | 491 | 300 | 191 | ||||||||||||||||
Various minor programs | Various | 4,080 | 2,000 | 2,080 | ||||||||||||||||
|
| |||||||||||||||||||
Total Capital Grants | 105,103 | |||||||||||||||||||
|
| |||||||||||||||||||
STADIUMS QUEENSLAND | ||||||||||||||||||||
Property, Plant and Equipment | ||||||||||||||||||||
Annual capital program | Various | 46,863 | Ongoing | |||||||||||||||||
|
| |||||||||||||||||||
Total Property, Plant and Equipment | 46,863 | |||||||||||||||||||
|
| |||||||||||||||||||
|
| |||||||||||||||||||
TOTAL TOURISM, INNOVATION AND SPORT (PPE) | 65,249 | |||||||||||||||||||
|
| |||||||||||||||||||
|
| |||||||||||||||||||
TOTAL TOURISM, INNOVATION AND SPORT (CG) | 105,103 | |||||||||||||||||||
|
| |||||||||||||||||||
110
Capital Statement 2022-23
| 3.21 | TRANSPORT AND MAIN ROADS |
In 2022-23, total capital purchases for the Transport and Main Roads portfolio are $7.309 billion including capital grants of $579.4 million. The portfolio includes the Department of Transport and Main Roads, Queensland Rail, Cross River Rail Delivery Authority, Far North Queensland Ports Corporation Limited, Gladstone Ports Corporation Limited, North Queensland Bulk Ports Corporation Limited, Port of Townsville Limited, RoadTek and the Gold Coast Waterways Authority.
Department of Transport and Main Roads
In 2022-23, capital purchases total $5.022 billion towards infrastructure investment across the state. The Queensland Government is committed to delivering an integrated, safe and efficient transport system that connects regional Queenslanders and other communities throughout the State.
Program Highlights (Property, Plant and Equipment)
| • | $270.2 million towards extending the Gold Coast Light Rail (Stage 3) from Broadbeach South to Burleigh Heads, at a total estimated cost of $1.219 billion, in partnership with the Australian Government and Gold Coast City Council. |
| • | $265 million towards constructing the Coomera Connector (Stage 1) between Coomera and Nerang, at a total estimated cost of $2.163 billion, in partnership with the Australian Government. |
| • | $184.9 million towards constructing new rollingstock in Maryborough, at a total estimated cost of $600 million. |
| • | $180 million towards upgrading the 10 kilometres of the Pacific Motorway (M1) between Varsity Lakes and Tugun, at a total estimated cost of $1 billion, in partnership with the Australian Government. |
| • | $180 million towards providing a new 26 kilometre, 4-lane divided highway between the existing Bruce Highway interchange at Woondum, south of Gympie and Curra, at a total estimated cost of $1 billion, in partnership with the Australian Government. |
| • | $128.3 million towards upgrading the Bruce Highway from 4 to 6 lanes between Caboolture-Bribie Island Road and Steve Irwin Way (Exit 163), at a total estimated cost of $662.5 million, in partnership with the Australian Government. |
| • | $117.4 million towards duplicating from 2 to 4 lanes on the Bruce Highway (Cairns Southern Access Corridor Stage 3) from Edmonton to Gordonvale, at a total estimated cost of $481 million, in partnership with the Australian Government. |
| • | $112.2 million towards ongoing accessibility modifications for New Generation Rollingstock to comply with disability standards. |
111
Capital Statement 2022-23
| • | $110 million towards upgrading the 8 kilometres of the Pacific Motorway (M1) between Eight Mile Plains and Daisy Hill, at a total estimated cost of $750 million, in partnership with the Australian Government. |
| • | $83.5 million towards duplication of a section of the Townsville Ring Road between Vickers Bridge and Shaw Road, at a total estimated cost of $230 million, in partnership with the Australian Government. |
| • | $78.7 million towards Smart Ticketing at a total estimated cost of $371.1 million. |
| • | $60 million towards new European Train Control System signalling for existing New Generation Rollingstock, at a total estimated cost of $374.1 million. |
| • | $59.4 million towards constructing a new 14.7 kilometre ring road to link the Bruce Highway through Rockhampton extending from the Capricorn Highway (Nelson Street), to Rockhampton-Yeppoon Road/Bruce Highway intersection, at a total estimated cost of $1.065 billion, in partnership with the Australian Government. |
| • | $56.5 million towards constructing the Walkerston Bypass to connect Peak Downs Highway west of Walkerston to the Mackay Ring Road near Paget, at a total estimated cost of $186.6 million, in partnership with the Australian Government. |
| • | $51.5 million towards upgrading both the Maroochydore Road and Mons Road interchanges on the Bruce Highway at Forest Glen, at a total estimated cost of $301.3 million, in partnership with the Australian Government. |
| • | $41.3 million towards upgrading sections on the North Coast rail line between Beerburrum train station and Nambour train station, at a total estimated cost of $550.8 million, in partnership with the Australian Government. |
| • | $33.7 million towards upgrading the intersection of the Bruce Highway at Deception Bay Road, at a total estimated cost of $163.3 million, in partnership with the Australian Government. |
| • | $31 million towards Logan and Gold Coast Faster Rail, at a total estimated cost of $2.598 billion, in partnership with the Australian Government. |
Program Highlights (Capital Grants)
| • | $70 million towards Transport Infrastructure Development Scheme to local governments, including Aboriginal and Torres Strait Islander community assistance. |
| • | $25 million towards upgrading the rail level crossing on Beams Road, Carseldine to reduce congestion and to address safety concerns. |
| • | $12.6 million towards development of the cycle network throughout Queensland. |
112
Capital Statement 2022-23
Far North Queensland Ports Corporation Limited
In 2022-23, Far North Queensland Ports Corporation Limited has allocated $9.2 million towards new and continuing development within its ports in Far North Queensland.
Program Highlights (Property, Plant and Equipment)
| • | $7.3 million towards further development of the Cairns Marine Precinct early works, at a total estimated cost of $32 million. |
| • | $839,000 towards the decontamination and demolition of Whites Shed at Cityport Precinct 5 and potential heritage protection requirements, at a total estimated cost of $3.5 million. |
Gladstone Ports Corporation Limited
In 2022-23, Gladstone Ports Corporation Limited has allocated $94.2 million towards ongoing development of the Port of Gladstone, and additional works at the Port of Bundaberg and the Port of Rockhampton.
Program Highlights (Property, Plant and Equipment)
| • | $13 million towards upgrades at the RG Tanna Coal Terminal at the Port of Gladstone including Shiploader 1 replacement, at a total estimated cost of $63.9 million. |
| • | $9.3 million towards Port of Bundaberg Multi User Infrastructure Facility conveyor project, at a total estimated cost of $18.8 million. This total estimated cost does not include contributions from private industry. |
| • | $6 million towards port services projects including East Shores 1C - Auckland Hill. |
Gold Coast Waterways Authority
In 2022-23, the Gold Coast Waterways Authority has allocated $12.5 million to improve management of, and provide better access to, the Gold Coast Waterway, canals and rivers and to deliver The Spit Works Program.
Program Highlights (Property, Plant and Equipment)
| • | $7 million to deliver The Spit Works Program, including the Marine Stadium pontoon and jetty, and Muriel Henchman boat ramp and carparking facilities. |
| • | $2.7 million to purchase a new work vessel and improvements to the Sand Bypass System. |
North Queensland Bulk Ports Corporation Limited
In 2022-23, North Queensland Bulk Ports Corporation Limited has allocated $9.8 million to continue port planning and development initiatives to meet industry requirements for
113
Capital Statement 2022-23
export facilities.
Program Highlights (Property, Plant and Equipment)
| • | $3.5 million to replace Middle Breakwater fuel line supports at the Port of Mackay, at a total estimated cost of $6.3 million. |
| • | $855,000 to undertake hydrogen studies, at a total estimated cost of $6 million. |
| • | $855,000 to improve the water distribution system at the Port of Mackay by constructing a new booster pump station including pumps, building, electrical and piping works, at a total estimated cost of $2.1 million. |
Port of Townsville Limited
In 2022-23, Port of Townsville Limited has allocated $56 million towards ongoing development at the Port of Townsville.
Program Highlights (Property, Plant and Equipment)
| • | $47.8 million to continue the capital dredging and reclamation works to widen the shipping channels for access by larger vessels, at a total estimated cost of $232 million. |
Queensland Rail
In 2022-23, $797.1 million is allocated towards capital purchases for Queensland Rail.
Program Highlights (Property, Plant and Equipment)
$450.4 million is provided towards projects that will grow or enhance the Queensland Rail network including:
| • | $136.9 million towards implementing the European Train Control System Level 2 in the Brisbane Inner City Network. |
| • | $67.6 million towards constructing Clapham Yard Stabling at Moorooka. |
| • | $47.7 million towards station accessibility upgrades at Albion, Auchenflower, Banyo, Bundamba, Buranda, Burpengary, Cannon Hill, East Ipswich, Lindum, and Morningside train stations. |
| • | $18.3 million towards upgrading vehicle and pedestrian access at Mayne Yard. |
| • | $14 million towards signalling integration works to enable delivery of the European Train Control System. |
$346.8 million to replace, renew and upgrade rail infrastructure, rollingstock, buildings, facilities, and other network assets including:
114
Capital Statement 2022-23
| • | $167.8 million to invest in the regional network including rollingstock, operational facilities, track infrastructure, civil structures and signalling. |
| • | $147.9 million to invest in the South East Queensland network including rollingstock, operational facilities, track infrastructure, civil structures and signalling. |
| • | $31.1 million for business enabling investment on corporate, property and ICT works across Queensland. |
Cross River Rail Delivery Authority
In 2022-23, $1.290 billion has been allocated to continue construction of the 10.2 kilometre rail line from Dutton Park to Bowen Hills, including 5.9 kilometres of twin tunnels under the Brisbane River and CBD, 4 new underground stations and 8 rebuilt above ground stations.
| Transport and Main Roads | ||||||||||||||||||||
Project | Statistical Area | Total Estimated Cost $‘000 | Expenditure to 30-06-22 $‘000 | Budget 2022-23 $‘000 | Post 2022-23 $‘000 | |||||||||||||||
DEPARTMENT OF TRANSPORT AND MAIN ROADS | ||||||||||||||||||||
Property, Plant and Equipment | ||||||||||||||||||||
South Coast District | ||||||||||||||||||||
Beaudesert - Beenleigh Road1 (Belivah), Armstrong Road to Stubbin Street, widen pavement | 311 | 10,000 | 1,313 | 6,387 | 2,300 | |||||||||||||||
Beaudesert - Beenleigh Road,2 Milne Street to Tallagandra Road, duplicate to four lanes | 311 | 10,000 | 1,591 | 7,529 | 880 | |||||||||||||||
Coomera Connector (Stage 1), Coomera to Nerang, construct new route | 309 | 2,162,700 | 165,547 | 265,000 | 1,732,153 | |||||||||||||||
Cunningham Highway (Ipswich -3 Warwick), 2020 Disaster Recovery Funding Arrangements reconstruction works | 310 | 84,276 | 8,731 | 20,545 | 55,000 | |||||||||||||||
Currumbin Creek - Tomewin Road3 (Part A), 2021 Disaster Recovery Funding Arrangements reconstruction works | 309 | 10,372 | 50 | 8,309 | 2,013 | |||||||||||||||
Gold Coast Light Rail (Stage 3),4 Broadbeach South to Burleigh Heads, construct light rail | 309 | 1,219,000 | 180,829 | 270,240 | 767,931 | |||||||||||||||
115
Capital Statement 2022-23
| Transport and Main Roads | ||||||||||
Project | Statistical Area | Total Estimated Cost $‘000 | Expenditure to 30-06-22 $‘000 | Budget 2022-23 $‘000 | Post 2022-23 $‘000 | |||||
Hope Island Road, Jabiru Island bridges (Coombabah Creek), rehabilitate bridges | 309 | 15,000 | 1,352 | 5,800 | 7,848 | |||||
Lamington National Park Road3 (Part A), 2021 Disaster Recovery Funding Arrangements reconstruction works | Various | 11,019 | 1,098 | 7,783 | 2,138 | |||||
Loganlea train station relocation5 | 311 | 95,076 | 2,613 | 16,317 | 76,146 | |||||
Mount Lindesay Highway6 (Brisbane - Beaudesert), Jimboomba to Beaudesert, various locations, improve intersections | 311 | 17,137 | 10,137 | 4,400 | 2,600 | |||||
Mount Lindesay Highway (Brisbane - Beaudesert), Johanna Street to South Street (Jimboomba), duplication | 311 | 53,000 | 6,500 | 21,100 | 25,400 | |||||
Mount Lindesay Highway7 (Brisbane - Beaudesert), Stoney Camp Road to Chambers Flat Road, construct additional lanes | 311 | 75,000 | 38,326 | 10,454 | 26,220 | |||||
Nerang - Murwillumbah Road,6 various locations, safety treatments | 309 | 41,072 | 13,937 | 20,000 | 7,135 | |||||
New Gold Coast Stations, design8 and construction | Various | 120,000 | 12,778 | 57,222 | 50,000 | |||||
Pacific Motorway, Daisy Hill to9 Logan Motorway, funding commitment | 311 | 1,000,000 | 26,200 | 33,800 | 940,000 | |||||
Pacific Motorway, Eight Mile Plains to Daisy Hill Upgrade | 311 | 750,000 | 327,982 | 110,000 | 312,018 | |||||
Pacific Motorway, Exit 41,2 upgrade interchange | 309 | 82,137 | 42,203 | 22,197 | 17,737 | |||||
Pacific Motorway, Exit 45 southbound off-ramp, upgrade interchange | 309 | 20,000 | 5,400 | 5,600 | 9,000 | |||||
Pacific Motorway, Exit 49,2 upgrade interchange | 309 | 110,768 | 12,763 | 27,700 | 70,305 | |||||
Pacific Motorway, Varsity Lakes (Exit 85) to Tugun (Exit 95) upgrade | 309 | 1,000,000 | 498,946 | 180,000 | 321,054 | |||||
116
Capital Statement 2022-23
| Transport and Main Roads | ||||||||||
Project | Statistical Area | Total Estimated Cost $‘000 | Expenditure to 30-06-22 $‘000 | Budget 2022-23 $‘000 | Post 2022-23 $‘000 | |||||
Tamborine - Oxenford Road,10 Howard Creek Causeway, upgrade flood immunity | 309 | 10,000 | 7,500 | 1,668 | 832 | |||||
Other construction | Various | 117,883 | 117,883 | |||||||
| ||||||||||
Sub-total South Coast District | 1,219,934 | |||||||||
| ||||||||||
Metropolitan District | ||||||||||
Brisbane Metro, Woolloongabba11 Station | 305 | 450,000 | 2,000 | 448,000 | ||||||
Centenary Bridge upgrade | 304 | 244,000 | 21,536 | 16,479 | 205,985 | |||||
Centenary Motorway and Logan1 Motorway, upgrade interchange | 310 | 15,000 | 1,650 | 11,827 | 1,523 | |||||
Chermside bus stop, construct southbound platform | 302 | 11,522 | 2,602 | 5,836 | 3,084 | |||||
Cleveland - Redland Bay Road,12 Anita Street to Magnolia Parade, duplicate to four lanes | 301 | 97,000 | 21,955 | 17,982 | 57,063 | |||||
Cleveland - Redland Bay Road,6 various locations, improve intersections | 301 | 11,140 | 3,740 | 5,000 | 2,400 | |||||
Gateway Motorway, Bracken13 Ridge to Pine River upgrade, funding commitment | 302 | 1,000,000 | 6,600 | 4,800 | 988,600 | |||||
Gympie Arterial Road and2 Strathpine Road (Bald Hills), improve intersection | 302 | 30,000 | 22,500 | 4,980 | 2,520 | |||||
Inner Northern Busway Enhancement, Roma Street, bus station improvement | 305 | 12,000 | 1,500 | 10,500 | ||||||
Ipswich - Cunningham Highway1 Connection Road (Brisbane Road), Chermside Road and Glebe Road, improve intersection | 310 | 10,000 | 2,150 | 4,200 | 3,650 | |||||
Linkfield Road Overpass14 upgrade | 302 | 125,000 | 3,944 | 2,400 | 118,656 | |||||
Moggill Sub - Arterial Road and2 Brookfield Road (Kenmore Roundabout), upgrade intersection | 304 | 25,000 | 542 | 2,458 | 22,000 | |||||
117
Capital Statement 2022-23
| Transport and Main Roads | ||||||||||
Project | Statistical Area | Total Estimated Cost $‘000 | Expenditure to 30-06-22 $‘000 | Budget 2022-23 $‘000 | Post 2022-23 $‘000 | |||||
Mount Lindesay Arterial Road1 (Beaudesert Road) and Illaweena Street, upgrade intersection | 303 | 30,000 | 2,562 | 15,000 | 12,438 | |||||
Northern Transitway, bus priority works | 302 | 72,000 | 27,916 | 18,868 | 25,216 | |||||
Veloway 1 (V1) Cycleway, O’Keefe Street, construct cycle bridge and approaches | 303 | 22,030 | 2,571 | 11,535 | 7,924 | |||||
Other construction | Various | 105,951 | 105,951 | |||||||
| ||||||||||
Sub-total Metropolitan District | 230,816 | |||||||||
| ||||||||||
North Coast District | ||||||||||
Beerburrum to Nambour Rail Upgrade (Stage 1) | 316 | 550,791 | 61,960 | 41,300 | 447,531 | |||||
Bells Creek Arterial Road, Caloundra Road to Bells Creek interchange, funding commitment | 316 | 35,000 | 12,250 | 22,750 | ||||||
Brisbane Valley Highway (Ipswich6 - Harlin), Warrego Highway to Fernvale, improve safety | 310 | 14,400 | 1,484 | 10,105 | 2,811 | |||||
Bruce Highway (Brisbane - Gympie), Caboolture - Bribie Island Road to Steve Irwin Way upgrade | 313 | 662,500 | 202,891 | 128,336 | 331,273 | |||||
Bruce Highway (Brisbane - Gympie), Deception Bay Road interchange upgrade | 313 | 163,300 | 109,309 | 33,697 | 20,294 | |||||
Bruce Highway (Brisbane - Gympie), Maroochydore Road and Mons Road Interchanges Upgrade | 316 | 301,250 | 228,321 | 51,489 | 21,440 | |||||
Bruce Highway (Brisbane -13 Gympie), Pine River to Dohles Rocks Road interchange, funding commitment | 314 | 1,098,000 | 18,281 | 7,050 | 1,072,669 | |||||
Caboolture - Bribie Island Road,15 upgrade program | 313 | 30,400 | 11,424 | 10,550 | 8,426 | |||||
Clontarf - Anzac Avenue (Elizabeth16 Avenue), construct active transport overpass | 313 | 19,000 | 1,850 | 9,650 | 7,500 | |||||
118
Capital Statement 2022-23
| Transport and Main Roads | ||||||||||
Project | Statistical Area | Total Estimated Cost $‘000 | Expenditure to 30-06-22 $‘000 | Budget 2022-23 $‘000 | Post 2022-23 $‘000 | |||||
D’Aguilar Highway (Kilcoy -10 Yarraman), Sandy Creek to Kilcoy, improve safety | 313 | 19,000 | 5,733 | 7,017 | 6,250 | |||||
Glasshouse Mountains Road10 (Steve Irwin Way), Beerwah to Landsborough, improve safety | 316 | 18,000 | 8,304 | 9,696 | ||||||
Kin Kin Road, Six Mile Creek,1 replace timber bridge | 316 | 18,000 | 4,195 | 10,805 | 3,000 | |||||
Mooloolaba Road and Sugar Road intersection, upgrade | 316 | 15,000 | 2,105 | 3,500 | 9,395 | |||||
Morayfield Road and Beerburrum6 Road, various locations, improve intersections | 313 | 36,600 | 27,391 | 7,045 | 2,164 | |||||
Mount Glorious Road and Samford6 - Mount Glorious Road, improve safety | 314 | 11,300 | 10,234 | 1,066 | ||||||
Strathpine - Samford Road, Eatons6 Crossing Road and Mount Samson Road intersection, improve safety | 314 | 57,000 | 6,095 | 16,000 | 34,905 | |||||
Sunshine Motorway, Mooloolah River Interchange Upgrade (Stage 1) | 316 | 320,000 | 8,500 | 25,000 | 286,500 | |||||
Other construction | Various | 154,085 | 154,085 | |||||||
| ||||||||||
Sub-total North Coast District | 549,141 | |||||||||
| ||||||||||
Wide Bay Burnett District | ||||||||||
Booral Road and Boundary Road (Urangan), intersection upgrade | 319 | 18,712 | 210 | 1,102 | 17,400 | |||||
Bruce Highway (Cooroy to Curra) Section D, construction | 319 | 1,000,000 | 418,081 | 180,000 | 401,919 | |||||
Bruce Highway (Gympie - Benaraby), various locations, upgrade culverts | 319 | 44,694 | 3,636 | 16,344 | 24,714 | |||||
Bruce Highway (Gympie - Maryborough), Gootchie Road to Sheehans Road, widen pavement and improve safety | 319 | 26,647 | 5,918 | 8,132 | 12,597 | |||||
Bruce Highway (Gympie - Maryborough), Tiaro Bypass, construct four lane bypass | 319 | 336,000 | 6,530 | 2,700 | 326,770 | |||||
119
Capital Statement 2022-23
| Transport and Main Roads | ||||||||||
Project | Statistical Area | Total Estimated Cost $‘000 | Expenditure to 30-06-22 $‘000 | Budget 2022-23 $‘000 | Post 2022-23 $‘000 | |||||
Bruce Highway (Maryborough - Gin Gin), Adies Road to Ringwood Road, widen pavement and improve safety | 319 | 12,840 | 1,555 | 7,741 | 3,544 | |||||
Bruce Highway (Maryborough - Gin Gin), Saltwater Creek and Deadmans Gully, flood immunity upgrades | 319 | 103,000 | 69,744 | 28,641 | 4,615 | |||||
Bruce Highway (Maryborough - Gin Gin), west of Apple Tree Creek, construct overtaking lanes | 319 | 13,400 | 5,514 | 4,156 | 3,730 | |||||
D’Aguilar Highway (Yarraman -6 Kingaroy), Alexander Lane to Bunya Highway, improve safety | 319 | 18,010 | 8,441 | 2,050 | 7,519 | |||||
Isis Highway (Bundaberg -6 Childers), various locations, improve safety | 319 | 41,818 | 3,359 | 10,002 | 28,457 | |||||
Maryborough - Hervey Bay Road17 and Pialba - Burrum Heads Road, upgrade intersection | 319 | 44,100 | 2,731 | 41,369 | ||||||
Monto - Mount Perry Road,16 upgrade existing gravel road | 319 | 10,600 | 3,349 | 7,251 | ||||||
Mundubbera - Durong Road, John18 Peterson Bridge (Boyne River), replace bridge | 319 | 25,000 | 13,337 | 7,304 | 4,359 | |||||
Torbanlea - Pialba Road, various18 locations, upgrade intersections and floodways | 319 | 30,000 | 5,507 | 21,387 | 3,106 | |||||
Other construction | 319 | 81,697 | 81,697 | |||||||
| ||||||||||
Sub-total Wide Bay Burnett District | 381,238 | |||||||||
| ||||||||||
Darling Downs District | ||||||||||
Cunningham Highway (Ipswich - Warwick), Eight Mile intersection upgrade | 307 | 25,000 | 14,003 | 4,615 | 6,382 | |||||
Cunningham Highway (Ipswich -17 Warwick), Tregony to Maryvale, safety treatments | 307 | 16,750 | 2,350 | 14,400 | ||||||
Gore Highway (Millmerran - Goondiwindi), Wyaga Creek, upgrade floodway | 307 | 45,240 | 200 | 7,080 | 37,960 | |||||
120
Capital Statement 2022-23
| Transport and Main Roads | ||||||||||
Project | Statistical Area | Total Estimated Cost $‘000 | Expenditure to 30-06-22 $‘000 | Budget 2022-23 $‘000 | Post 2022-23 $‘000 | |||||
Gore Highway (Pittsworth -18 Millmerran), various locations, rehabilitate pavement | 307 | 17,000 | 10,310 | 6,690 | ||||||
New England Highway6 (Toowoomba - Warwick), improve safety | 317 | 11,500 | 850 | 8,500 | 2,150 | |||||
Other construction | Various | 87,144 | 87,144 | |||||||
| ||||||||||
Sub-total Darling Downs District | 116,379 | |||||||||
| ||||||||||
South West District | ||||||||||
Quilpie - Adavale Road, various19 locations, upgrade seal and floodways | 315 | 6,763 | 5,440 | 1,323 | ||||||
Other construction | Various | 37,748 | 37,748 | |||||||
| ||||||||||
Sub-total South West District | 39,071 | |||||||||
| ||||||||||
Fitzroy District | ||||||||||
Bruce Highway (Gin Gin - Benaraby), Charnwood Road to Palm Creek, improve safety | 308 | 24,000 | 20,331 | 3,669 | ||||||
Bruce Highway (Gin Gin - Benaraby), Station Creek and Boyne River, upgrade bridges | 308 | 13,800 | 165 | 3,500 | 10,135 | |||||
Bruce Highway (Rockhampton - St Lawrence) and Bolsover Street, upgrade intersection | 308 | 40,000 | 1,936 | 2,500 | 35,564 | |||||
Bruce Highway (Rockhampton - St Lawrence), Neilsen Avenue to Plentiful Creek, improve safety | 308 | 21,250 | 19,230 | 2,020 | ||||||
Dawson Highway (Gladstone - Biloela), various locations, strengthen bridges and widen and rehabilitate pavement | 308 | 14,200 | 10,660 | 3,540 | ||||||
Gavial - Gracemere Road (Lawrie1 Street), widen to four lanes and upgrade intersections | 308 | 35,000 | 24,786 | 10,214 | ||||||
Rockhampton - Emu Park Road, upgrade overtaking lanes and improve safety | 308 | 19,000 | 2,000 | 7,000 | 10,000 | |||||
121
Capital Statement 2022-23
| Transport and Main Roads | ||||||||||
Project | Statistical Area | Total Estimated Cost $‘000 | Expenditure to 30-06-22 $‘000 | Budget 2022-23 $‘000 | Post 2022-23 $‘000 | |||||
Rockhampton - Yeppoon Road,18 Yeppoon Road upgrade | 308 | 80,000 | 5,131 | 25,000 | 49,869 | |||||
Rockhampton Ring Road | 308 | 1,065,000 | 104,041 | 59,449 | 901,510 | |||||
Other construction | 308 | 120,136 | 120,136 | |||||||
| ||||||||||
Sub-total Fitzroy District | 237,028 | |||||||||
| ||||||||||
Central West District | ||||||||||
Barcaldine - Aramac Road, widen16 and rehabilitate | 315 | 5,100 | 3,400 | 1,700 | ||||||
Other construction | 315 | 48,345 | 48,345 | |||||||
| ||||||||||
Sub-total Central West District | 50,045 | |||||||||
| ||||||||||
Mackay Whitsunday District | ||||||||||
Blue Mountain Road, Scrubby1 Creek and Hut Creek, replace timber bridges | 312 | 10,200 | 6,049 | 2,501 | 1,650 | |||||
Bruce Highway (Bowen - Ayr), Armstrong Creek overflow, construct northbound and southbound overtaking lanes | 312 | 13,480 | 7,631 | 1,440 | 4,409 | |||||
Bruce Highway (Bowen - Ayr), West Euri Road to Abbott Point Road, construct northbound and southbound overtaking lanes | 312 | 11,654 | 6,457 | 3,534 | 1,663 | |||||
Bruce Highway (Mackay - Proserpine), Jumper Creek, upgrade flood immunity | 312 | 23,000 | 3,362 | 12,500 | 7,138 | |||||
Bruce Highway (Proserpine - Bowen), Ten Mile Creek to Yeates Creek, improve safety | 312 | 44,070 | 17,302 | 15,000 | 11,768 | |||||
Mackay Northern Access Upgrade, construct additional lanes | 312 | 144,550 | 118,893 | 6,094 | 19,563 | |||||
Mackay Port Access, Bruce Highway to Mackay - Slade Point Road, construct new two lane road | 312 | 350,000 | 9,065 | 9,503 | 331,432 | |||||
Mackay Ring Road (Stage 1)20 | 312 | 497,375 | 360,314 | 15,000 | 122,061 | |||||
Peak Downs Highway (Clermont -21 Nebo), Wuthung Road to Caval Ridge Mine, widen and strengthen pavement | 312 | 35,000 | 22,087 | 5,892 | 7,021 | |||||
122
Capital Statement 2022-23
| Transport and Main Roads | ||||||||||
Project | Statistical Area | Total Estimated Cost $‘000 | Expenditure to 30-06-22 $‘000 | Budget 2022-23 $‘000 | Post 2022-23 $‘000 | |||||
Proserpine - Shute Harbour18 Road, Hamilton Plains, flood immunity upgrade | 312 | 21,000 | 1,144 | 2,500 | 17,356 | |||||
Walkerston Bypass | 312 | 186,600 | 44,976 | 56,543 | 85,081 | |||||
Other construction | 312 | 90,326 | 90,326 | |||||||
| ||||||||||
Sub-total Mackay Whitsunday District | 220,833 | |||||||||
| ||||||||||
Northern District | ||||||||||
Bruce Highway (Bowen - Ayr), Fredericksfield Road to Homestead Road, construct overtaking lanes | 318 | 10,435 | 1,252 | 5,645 | 3,538 | |||||
Burdekin River Bridge,22 rehabilitation program | 318 | 96,931 | 52,891 | 4,000 | 40,040 | |||||
Douglas - Garbutt Road6 (Townsville), various locations (Stage 1), improve intersections | 318 | 13,562 | 1,267 | 1,114 | 11,181 | |||||
Flinders Highway (Townsville -18 Charters Towers), Townsville to Mingela Range (Package 1 and 2), construct overtaking lanes | 318 | 33,390 | 3,241 | 13,881 | 16,268 | |||||
Garbutt - Upper Ross Road (Riverway Drive, Stage 2), Allambie Lane to Dunlop Street, duplicate to four lanes | 318 | 95,000 | 3,683 | 5,000 | 86,317 | |||||
Gregory Developmental Road18 (Charters Towers - The Lynd), Airport Drive to Lucky Springs Road, strengthen and widen pavement | 318 | 15,300 | 2,090 | 3,404 | 9,806 | |||||
Gregory Developmental Road10 (Charters Towers - The Lynd), Marble Creek to Christmas Creek, widen pavement | 318 | 25,000 | 12,331 | 9,169 | 3,500 | |||||
Townsville Connection Road (Idalia), University Road to Bowen Road Bridge (Stuart Drive), improve safety | 318 | 46,400 | 2,342 | 4,681 | 39,377 | |||||
Townsville Connection Road (Stuart Drive), Bowen Road Bridge (Idalia), duplicate bridge and approaches | 318 | 70,000 | 2,000 | 68,000 | ||||||
123
Capital Statement 2022-23
| Transport and Main Roads | ||||||||||
Project | Statistical Area | Total Estimated Cost $‘000 | Expenditure to 30-06-22 $‘000 | Budget 2022-23 $‘000 | Post 2022-23 $‘000 | |||||
Townsville Northern Access23 Intersections Upgrade | 318 | 99,768 | 58,853 | 20,649 | 20,266 | |||||
Townsville Ring Road (Stage 5) | 318 | 230,000 | 118,463 | 83,500 | 28,037 | |||||
Other construction | 318 | 79,800 | 79,800 | |||||||
| ||||||||||
Sub-total Northern District | 232,843 | |||||||||
| ||||||||||
North West District | ||||||||||
Flinders Highway (Hughenden -18 Richmond), upgrades, various locations | 315 | 33,835 | 1,250 | 32,585 | ||||||
Flinders Highway (Julia Creek -18 Cloncurry), Scrubby Creek, strengthen pavement and widen floodway | 315 | 42,650 | 3,629 | 27,799 | 11,222 | |||||
Kennedy Developmental Road18 (The Lynd - Hughenden), progressive sealing | 315 | 50,000 | 28,230 | 13,446 | 8,324 | |||||
Other construction | 315 | 45,061 | 45,061 | |||||||
| ||||||||||
Sub-total North West District | 87,556 | |||||||||
| ||||||||||
Far North District | ||||||||||
Bruce Highway (Ingham - Innisfail), Dallachy Road, install floodway | 306 | 11,000 | 1,349 | 1,048 | 8,603 | |||||
Bruce Highway (Ingham - Innisfail), Liverpool Creek to Aldridge Road (Cowley), realign and widen pavement | 306 | 24,900 | 2,380 | 6,150 | 16,370 | |||||
Bruce Highway (Ingham - Innisfail),24 Smiths Gap, construct southbound overtaking lane and fauna overpass | 306 | 30,724 | 12,644 | 14,520 | 3,560 | |||||
Bruce Highway, Cairns Southern Access Corridor (Stage 3), Edmonton to Gordonvale, construction | 306 | 481,000 | 356,850 | 117,398 | 6,752 | |||||
Bruce Highway, Cairns Southern Access Corridor (Stage 5), Foster Road, upgrade intersection | 306 | 225,000 | 2,287 | 3,750 | 218,963 | |||||
Cairns Ring Road (Cairns CBD to Smithfield) | 306 | 359,000 | 8,403 | 10,471 | 340,126 | |||||
124
Capital Statement 2022-23
| Transport and Main Roads | ||||||||||
Project | Statistical Area | Total Estimated Cost $‘000 | Expenditure to 30-06-22 $‘000 | Budget 2022-23 $‘000 | Post 2022-23 $‘000 | |||||
Cairns Southern Access Cycleway,25 construct cycleway | 306 | 24,029 | 10,551 | 2,937 | 10,541 | |||||
Cairns Western Arterial Road, Redlynch Connector Road to Captain Cook Highway, duplication | 306 | 300,000 | 9,057 | 18,200 | 272,743 | |||||
Captain Cook Highway (Cairns - 6 Mossman) (Section 2), improve safety | 306 | 21,667 | 11,240 | 4,094 | 6,333 | |||||
Gillies Range Road, various6 locations, improve safety | 306 | 19,314 | 9,908 | 4,734 | 4,672 | |||||
Gulf Developmental Road18 (Georgetown - Mount Garnet) (Package 1), strengthen and widen pavement | 315 | 12,318 | 3,162 | 7,327 | 1,829 | |||||
Kennedy Highway (Cairns - 6 Mareeba) (Section 6), road safety enhancement works | 306 | 12,826 | 1,899 | 9,027 | 1,900 | |||||
Kennedy Highway (Cairns -10 Mareeba), Kuranda Range, Intelligent Transport System | 306 | 35,000 | 12,130 | 12,870 | 10,000 | |||||
Kennedy Highway (Mareeba -10 Atherton), targeted road safety improvements | 306 | 37,500 | 29,500 | 1,000 | 7,000 | |||||
Peninsula Developmental Road26 (Coen - Weipa), Archer River Crossing southern approach, pave and seal | 315 | 11,462 | 3,550 | 5,113 | 2,799 | |||||
Peninsula Developmental Road26 (Coen - Weipa), Archer River Crossing, construct bridge | 315 | 44,867 | 5,107 | 25,308 | 14,452 | |||||
Peninsula Developmental Road26 (Coen - Weipa), Merluna to York Downs, pave and seal | 315 | 20,350 | 16,825 | 2,215 | 1,310 | |||||
Peninsula Developmental Road26 (Laura - Coen), Musgrave to Red Blanket (Part B), pave and seal | 315 | 11,073 | 2,423 | 4,053 | 4,597 | |||||
Peninsula Developmental Road26 (Laura - Coen), Yarraden to Three Sisters (Part A), pave and seal | 315 | 17,641 | 1,107 | 5,094 | 11,440 | |||||
125
Capital Statement 2022-23
| Transport and Main Roads | ||||||||||
Project | Statistical Area | Total Estimated Cost $‘000 | Expenditure to 30-06-22 $‘000 | Budget 2022-23 $‘000 | Post 2022-23 $‘000 | |||||
Yorkeys Knob, construct boat ramp and floating walkways | 306 | 12,033 | 5,108 | 6,225 | 700 | |||||
Other construction | Various | 70,148 | 70,148 | |||||||
| ||||||||||
Sub-total Far North District | 331,682 | |||||||||
| ||||||||||
Statewide | ||||||||||
Bruce Highway (Pine River - Cairns), Road Operations Improvements | Various | 56,000 | 35,415 | 10,144 | 10,441 | |||||
Logan and Gold Coast Faster Rail (Kuraby to Beenleigh) upgrade | 311 | 2,598,155 | 20,420 | 31,048 | 2,546,687 | |||||
Marine Safety minor works | Various | 17,550 | Ongoing | |||||||
New Generation Rollingstock4 | Various | 4,155,705 | 1,549,526 | 112,194 | 2,493,985 | |||||
New Generation Rollingstock,4 Automatic Train Operation and Platform Screen Doors fitment | Various | 275,700 | 15,032 | 80,990 | 179,678 | |||||
New Generation Rollingstock,4 European Train Control System fitment, install new signalling | Various | 374,084 | 108,773 | 60,000 | 205,311 | |||||
Queensland Train Manufacturing27 Program, construct new rollingstock | 319 | 600,000 | 30,779 | 184,873 | 384,348 | |||||
Transport Corridor Acquisition Fund | Various | 55,600 | Ongoing | |||||||
Other construction | Various | 110,707 | 110,707 | |||||||
| ||||||||||
Sub-total Statewide | 663,106 | |||||||||
| ||||||||||
Other Property, Plant and Equipment | ||||||||||
Corporate buildings | Various | 23,360 | Ongoing | |||||||
Information technology | Various | 33,262 | Ongoing | |||||||
Plant and Equipment | Various | 24,892 | Ongoing | |||||||
Smart Ticketing | Various | 371,060 | 269,658 | 78,702 | 22,700 | |||||
| ||||||||||
Sub-total Other Property, Plant and Equipment | 160,216 | |||||||||
| ||||||||||
Total Property, Plant and Equipment | 4,519,888 | |||||||||
| ||||||||||
Capital Grants | ||||||||||
Active Transport Rail Trails | Various | 17,682 | 5,249 | 1,175 | 11,258 | |||||
Alma Bay to Horseshoe Bay (Magnetic Island), upgrade various roads | 318 | 7,000 | 4,200 | 2,800 | ||||||
126
Capital Statement 2022-23
| Transport and Main Roads | ||||||||||
Project | Statistical Area | Total Estimated Cost $‘000 | Expenditure to 30-06-22 $‘000 | Budget 2022-23 $‘000 | Post 2022-23 $‘000 | |||||
Beams Road (Carseldine and28 Fitzgibbon), rail level crossing upgrade | 302 | 209,330 | 6,330 | 25,000 | 178,000 | |||||
Black Spot Program | Various | 21,208 | Ongoing | |||||||
Boundary Road (Coopers Plains), rail29 level crossing, funding commitment | 303 | 206,000 | 5,600 | 1,300 | 199,100 | |||||
Bridges Renewal Program30 | Various | 13,367 | Ongoing | |||||||
Brisbane Metro31 | 305 | 300,000 | 100,000 | 70,000 | 130,000 | |||||
Bus Stop Shelter Program | Various | 20,000 | 17,865 | 2,135 | ||||||
Cycling program | Various | 12,584 | Ongoing | |||||||
Eastern Transitway (Stage 1), bus priority works | 303 | 30,000 | 20,946 | 7,654 | 1,400 | |||||
Gold Coast Light Rail (Stage 3), Broadbeach South to Burleigh Heads, construct cycleway | 309 | 20,000 | 1,500 | 3,000 | 15,500 | |||||
Heavy Vehicle Safety and32 Productivity | Various | 9,777 | Ongoing | |||||||
Lansdown Eco-Industrial Precinct (Calcium), upgrade road and rail infrastructure | 318 | 12,000 | 2,400 | 2,400 | 7,200 | |||||
Passenger Transport Accessible Infrastructure Program | Various | 3,200 | Ongoing | |||||||
Other passenger transport grants | Various | 19,389 | Ongoing | |||||||
Roads of Strategic Importance Initiative | Various | 165,910 | 37,302 | 32,049 | 96,559 | |||||
School Bus Upgrade Program | Various | 11,747 | Ongoing | |||||||
School Transport Infrastructure Program | Various | 60,000 | 19,261 | 10,431 | 30,308 | |||||
Tewantin Bypass Stage 1, Cooroy -33 Noosa Road and Beckmans Road intersection upgrade | 316 | 9,810 | 5,906 | 3,904 | ||||||
Transport Infrastructure Development Scheme | Various | 70,000 | Ongoing | |||||||
Urban Congestion Fund | Various | 347,290 | 99,337 | 103,529 | 144,424 | |||||
Wheelchair accessible taxi sustainability funding | Various | 20,890 | 15,472 | 5,418 | ||||||
Zero Emissions Vehicle Strategy 2022-32 & Action Plan 2022-24 - charging infrastructure | Various | 10,000 | 4,000 | 6,000 | ||||||
Other capital grants | Various | 65,810 | 65,810 | |||||||
127
Capital Statement 2022-23
| Transport and Main Roads | ||||||||||||||||||||
Project | Statistical Area | Total Estimated Cost $‘000 | Expenditure to 30-06-22 $‘000 | Budget 2022-23 $‘000 | Post 2022-23 $‘000 | |||||||||||||||
Total Capital Grants | 501,877 | |||||||||||||||||||
|
| |||||||||||||||||||
FAR NORTH QUEENSLAND PORTS CORPORATION LIMITED | ||||||||||||||||||||
Property, Plant and Equipment | ||||||||||||||||||||
Cairns Marine Precinct early works | 306 | 32,000 | 10,303 | 7,279 | 14,418 | |||||||||||||||
Cairns shipping development project - fine sediment offset | 306 | 1,780 | 1,030 | 126 | 624 | |||||||||||||||
General cargo consolidation | 306 | 20,983 | 783 | 67 | 20,133 | |||||||||||||||
Mourilyan lease acquisitions | 306 | 2,289 | 1,289 | 335 | 665 | |||||||||||||||
Plant, equipment and minor works | 306 | 528 | Ongoing | |||||||||||||||||
Site decontamination at Cityport Precinct 5 | 306 | 3,500 | 1,000 | 839 | 1,661 | |||||||||||||||
|
| |||||||||||||||||||
Total Property, Plant and Equipment | 9,174 | |||||||||||||||||||
|
| |||||||||||||||||||
GLADSTONE PORTS CORPORATION LIMITED | ||||||||||||||||||||
Property, Plant and Equipment | ||||||||||||||||||||
RG Tanna Coal Terminal Projects Conveyor life extension | 308 | 1,782 | Ongoing | |||||||||||||||||
Process control systems, stockpile management and upgrades | 308 | 27,701 | Ongoing | |||||||||||||||||
Ship loader (SL1) replacement | 308 | 63,921 | 5,381 | 13,025 | 45,515 | |||||||||||||||
Auckland Point Central projects | 308 | 812 | Ongoing | |||||||||||||||||
Auckland Point projects | 308 | 7,300 | Ongoing | |||||||||||||||||
Barney Point projects | 308 | 1,624 | Ongoing | |||||||||||||||||
Fisherman’s landing projects | 308 | 1,832 | Ongoing | |||||||||||||||||
Information systems projects | 308 | 4,759 | Ongoing | |||||||||||||||||
Marina projects | 308 | 1,953 | Ongoing | |||||||||||||||||
Marine pilot services projects | 308 | 812 | Ongoing | |||||||||||||||||
Plant, equipment and minor works | 308 | 5,623 | Ongoing | |||||||||||||||||
Port Alma projects | 308 | 2,095 | Ongoing | |||||||||||||||||
Port of Bundaberg conveyor project34 | 319 | 18,760 | 7,311 | 9,298 | 2,151 | |||||||||||||||
Port of Bundaberg projects | 319 | 4,718 | Ongoing | |||||||||||||||||
Port services projects | 308 | 5,984 | Ongoing | |||||||||||||||||
Quarry projects | 308 | 609 | Ongoing | |||||||||||||||||
Right-of-use lease assets | 308 | 3,298 | 3,298 | |||||||||||||||||
Tug facility projects | 319 | 1,800 | 975 | 825 | ||||||||||||||||
128
Capital Statement 2022-23
| Transport and Main Roads | ||||||||||||||||||
Project | Statistical Area | Total Estimated Cost $‘000 | Expenditure to 30-06-22 $‘000 | Budget 2022-23 $‘000 | Post 2022-23 $‘000 | |||||||||||||
Total Property, Plant and Equipment | 94,200 | |||||||||||||||||
|
| |||||||||||||||||
GOLD COAST WATERWAYS AUTHORITY | ||||||||||||||||||
Property, Plant and Equipment | ||||||||||||||||||
Navigational Access and Safety Program, various locations, dredging navigation channels | 309 | 3,565 | 130 | 1,015 | 2,420 | |||||||||||||
Boating Infrastructure Program, various locations | 309 | 9,920 | 1,710 | 1,810 | 6,400 | |||||||||||||
Plant, equipment and minor works | 309 | 9,215 | 2,410 | 2,675 | 4,130 | |||||||||||||
Spit Masterplan (Southport), northern end of Main Beach, implement spit masterplan | 309 | 29,284 | 2,822 | 7,036 | 19,426 | |||||||||||||
|
| |||||||||||||||||
Total Property, Plant and Equipment | 12,536 | |||||||||||||||||
|
| |||||||||||||||||
NORTH QUEENSLAND BULK PORTS CORPORATION LIMITED | ||||||||||||||||||
Property, Plant and Equipment | ||||||||||||||||||
Abbot Point Port development - general works | 312 | 74 | Ongoing | |||||||||||||||
Armour rock stockpile | 312 | 1,050 | 114 | 936 | ||||||||||||||
Business improvement | 312 | 58 | Ongoing | |||||||||||||||
Cargo handling security and operational improvements | 312 | 1,000 | 570 | 430 | ||||||||||||||
5 yearly dredging at Hay Point | 312 | 5,640 | 228 | 5,412 | ||||||||||||||
5 yearly dredging at Mackay | 312 | 2,000 | 114 | 1,886 | ||||||||||||||
Hay Point Port development - general works | 312 | 142 | Ongoing | |||||||||||||||
Hydrogen trade studies | 312 | 6,000 | 855 | 5,145 | ||||||||||||||
Louisa Creek acquisition program | 312 | 600 | Ongoing | |||||||||||||||
Mackay Port development general | 312 | 684 | Ongoing | |||||||||||||||
Middle Breakwater fuel line supports replacement | 312 | 6,312 | 247 | 3,457 | 2,608 | |||||||||||||
Marine Offloading Facility dredging | 312 | 3,000 | 855 | 2,145 | ||||||||||||||
New Abbot Point Eastern Precinct Facility (stage 1) | 312 | 1,020 | 50 | 228 | 742 | |||||||||||||
Replacement of port security building | 312 | 1,650 | 199 | 1,451 | ||||||||||||||
Weipa Port development - general works | 315 | 85 | Ongoing | |||||||||||||||
129
Capital Statement 2022-23
| Transport and Main Roads | ||||||||||
Project | Statistical Area | Total Estimated Cost $‘000 | Expenditure to 30-06-22 $‘000 | Budget 2022-23 $‘000 | Post 2022-23 $‘000 | |||||
Harbour road upgrade (Middle Breakwater) | 312 | 1,900 | 570 | 1,330 | ||||||
Water distribution system improvements - new booster pump station (stage 2) | 312 | 2,052 | 552 | 855 | 645 | |||||
Northern Breakwater inner revetment upgrade | 312 | 1,600 | 142 | 1,458 | ||||||
| ||||||||||
Total Property, Plant and Equipment | 9,830 | |||||||||
| ||||||||||
PORT OF TOWNSVILLE LIMITED | ||||||||||
Property, Plant and Equipment | ||||||||||
Channel capacity upgrade | 318 | 232,000 | 112,920 | 47,793 | 71,287 | |||||
Other infrastructure and maintenance works | 318 | 6,270 | Ongoing | |||||||
Plant, equipment and minor works | 318 | 1,177 | Ongoing | |||||||
Road network upgrades | 318 | 377 | Ongoing | |||||||
Wharf facilities upgrades | 318 | 403 | Ongoing | |||||||
| ||||||||||
Total Property, Plant and Equipment | 56,020 | |||||||||
| ||||||||||
QUEENSLAND RAIL | ||||||||||
Property, Plant and Equipment | ||||||||||
Growth - Externally Led | ||||||||||
Breakfast Creek Bridge, realign35 track | 305 | 34,723 | 15,260 | 9,342 | 10,121 | |||||
Bridge pier protection35 | Various | 3,778 | 2,674 | 273 | 831 | |||||
Caboolture bus and rail36 interchange and precinct upgrade | 313 | 14,600 | 1,200 | 13,400 | ||||||
Clapham Yard Stabling35 | 303 | 301,356 | 62,628 | 67,552 | 171,176 | |||||
European Train Control System37 Level 2 | Various | 717,323 | 409,271 | 118,674 | 189,378 | |||||
Other European Train Control System Level 2 - Inner City | Various | 18,201 | Ongoing | |||||||
Station Upgrades Fairfield to35 Salisbury | 303 | 52,540 | 18,829 | 10,847 | 22,864 | |||||
Inner City signalling upgrades35 | 305 | 39,279 | 14,416 | 9,989 | 14,874 | |||||
Mayne Yard Relocations35 | 305 | 22,393 | 7,120 | 5,886 | 9,387 | |||||
Mayne Yard Accessibility35 | 305 | 96,827 | 60,352 | 18,348 | 18,127 | |||||
130
Capital Statement 2022-23
| Transport and Main Roads | ||||||||||
Project | Statistical Area | Total Estimated Cost $‘000 | Expenditure to 30-06-22 $‘000 | Budget 2022-23 $‘000 | Post 2022-23 $‘000 | |||||
Moolabin Power Upgrade35 | 303 | 18,075 | 3,748 | 820 | 13,507 | |||||
Other rail network enhancements | Various | 7,994 | Ongoing | |||||||
Other station and network improvements | Various | 883 | Ongoing | |||||||
Rail station access38 improvements | Various | 159,660 | 16,300 | 143,360 | ||||||
Third track between Roma Street35 and Exhibition Station | 305 | 7,150 | 4,618 | 865 | 1,667 | |||||
Signalling Integration Works | Various | 136,000 | 14,030 | 121,970 | ||||||
Bald Hills train station, construct36 park ‘n’ ride | 302 | 4,800 | 400 | 4,400 | ||||||
Lindum train station, Sibley Road,36 construct park ‘n’ ride | 301 | 4,999 | 219 | 2,075 | 2,705 | |||||
Narangba train station, construct36 park ‘n’ ride | 313 | 6,630 | 130 | 1,900 | 4,600 | |||||
Other park ‘n’ rides | Various | 14,303 | Ongoing | |||||||
| ||||||||||
Sub-total Growth - Externally Led | 319,882 | |||||||||
| ||||||||||
Growth - Internally Led | ||||||||||
Breakfast Creek Bridge Replacement | 305 | 2,000 | 2,000 | |||||||
Inner City Rail Corridor, upgrade signalling and interlocking | 305 | 1,500 | 1,500 | |||||||
Mount Isa Line, capacity and39 resilience improvements | 315 | 50,000 | 2,843 | 7,157 | 40,000 | |||||
Other Rail Growth | Various | 58,184 | Ongoing | |||||||
Wacol Yard Upgrade - Third Party Stabling | 310 | 5,907 | 7 | 5,900 | ||||||
Albion train station, Mawarra Street, upgrade station | 305 | 16,516 | 1,170 | 5,498 | 9,848 | |||||
Auchenflower train station, Auchenflower Terrace, upgrade station | 305 | 42,649 | 34,655 | 7,023 | 971 | |||||
Banyo train station, St Vincents Road, upgrade station | 302 | 28,449 | 2,700 | 3,380 | 22,369 | |||||
Bundamba train station, Mining Street, upgrade station | 310 | 33,999 | 2,146 | 7,593 | 24,260 | |||||
Buranda train station, Arne Street (Woolloongabba), upgrade station | 303 | 36,690 | 4,351 | 8,038 | 24,301 | |||||
Burpengary train station, Burpengary Road, upgrade station | 313 | 36,608 | 1,891 | 4,028 | 30,689 | |||||
131
Capital Statement 2022-23
| Transport and Main Roads | ||||||||||
Project | Statistical Area | Total Estimated Cost $‘000 | Expenditure to 30-06-22 $‘000 | Budget 2022-23 $‘000 | Post 2022-23 $‘000 | |||||
Cannon Hill train station, Barrack Road, upgrade station | 303 | 26,941 | 22,822 | 3,009 | 1,110 | |||||
East Ipswich train station, Merton Street, upgrade station | 310 | 35,300 | 30,320 | 417 | 4,563 | |||||
Lindum train station, Sibley Road, upgrade station | 301 | 34,546 | 3,505 | 5,177 | 25,864 | |||||
Morningside train station, Waminda Street, upgrade station | 305 | 41,416 | 2,444 | 3,539 | 35,433 | |||||
South Bank train station, Grey Street (South Brisbane), upgrade station | 305 | 26,634 | 15,708 | 8,040 | 2,886 | |||||
| ||||||||||
Sub-total Growth - Internally Led | 130,483 | |||||||||
| ||||||||||
South East Queensland Network | ||||||||||
Rail Network Maintenance40 Program, South East Queensland network, maintain above rail assets | Various | 89,009 | Ongoing | |||||||
Rail Network Maintenance41 Program, South East Queensland network, maintain below rail assets | Various | 58,906 | Ongoing | |||||||
| ||||||||||
Sub-total South East Queensland Network | 147,915 | |||||||||
| ||||||||||
Regional Network | ||||||||||
Maintenance of below rail assets - Townsville - Mount Isa Rail Line | Various | 16,318 | Ongoing | |||||||
Rail Network Maintenance42 Program, North Coast Line, maintain below rail assets | Various | 42,515 | Ongoing | |||||||
Rail Network Maintenance43 Program, Regional network, maintain above rail assets | Various | 65,186 | Ongoing | |||||||
Rail Network Maintenance44 Program, West Moreton, maintain below rail assets | Various | 16,984 | Ongoing | |||||||
Rail Network Maintenance45 Program, Western region, maintain below rail assets | Various | 26,763 | Ongoing | |||||||
| ||||||||||
Sub-total Regional Network | 167,766 | |||||||||
| ||||||||||
Enterprise | ||||||||||
132
Capital Statement 2022-23
| Transport and Main Roads | ||||||||||||||||||||
Project | Statistical Area | Total Estimated Cost $‘000 | Expenditure to 30-06-22 $‘000 | Budget 2022-23 $‘000 | Post 2022-23 $‘000 | |||||||||||||||
Enterprise Assets | Various | 19,267 | Ongoing | |||||||||||||||||
Enterprise Other | Various | 7,008 | Ongoing | |||||||||||||||||
Information and Technology | Various | 4,554 | Ongoing | |||||||||||||||||
Safety and Risk | Various | 274 | Ongoing | |||||||||||||||||
|
| |||||||||||||||||||
Sub-total Enterprise | 31,103 | |||||||||||||||||||
|
| |||||||||||||||||||
|
| |||||||||||||||||||
Total Property, Plant and Equipment | 797,149 | |||||||||||||||||||
|
| |||||||||||||||||||
ROADTEK | ||||||||||||||||||||
Property, Plant and Equipment | ||||||||||||||||||||
Construction plant works | Various | 19,000 | Ongoing | |||||||||||||||||
|
| |||||||||||||||||||
Total Property, Plant and Equipment | 19,000 | |||||||||||||||||||
|
| |||||||||||||||||||
CROSS RIVER RAIL DELIVERY AUTHORITY | ||||||||||||||||||||
Property, Plant and Equipment | ||||||||||||||||||||
Cross River Rail | 305 | 6,725,804 | 4,721,703 | 1,212,087 | 792,014 | |||||||||||||||
|
| |||||||||||||||||||
Total Property, Plant and Equipment | 1,212,087 | |||||||||||||||||||
|
| |||||||||||||||||||
Capital Grants | ||||||||||||||||||||
Cross River Rail - third party returnable works | 305 | 162,196 | 84,709 | 77,487 | ||||||||||||||||
|
| |||||||||||||||||||
Total Capital Grants | 77,487 | |||||||||||||||||||
|
| |||||||||||||||||||
|
| |||||||||||||||||||
TOTAL TRANSPORT AND MAIN ROADS (PPE) | 6,729,884 | |||||||||||||||||||
|
| |||||||||||||||||||
|
| |||||||||||||||||||
TOTAL TRANSPORT AND MAIN ROADS (CG) | 579,364 | |||||||||||||||||||
|
| |||||||||||||||||||
Notes:
| 1. | Funded through the Queensland Government’s Economic Recovery Strategy: Unite and Recover for Queensland Jobs. |
| 2. | Jointly funded by the Queensland Government and Australian Government (part of its Urban Congestion Fund). |
| 3. | Eligible projects under the Natural Disaster Program are jointly funded by the Australian Government and Queensland Government. The funding is provided to the Department of Transport and Main Roads through the Queensland Reconstruction Authority. |
| 4. | This project is being delivered as a public private partnership. |
| 5. | Jointly funded by the Australian Government (part of its Urban Congestion Fund) and Queensland Government, including contributions from Department of Transport and Main Roads and Queensland Rail. |
| 6. | Funded through the Queensland Government’s High Risk Roads Initiative, as part of the Targeted Road Safety Program. |
133
Capital Statement 2022-23
Transport and Main Roads
| 7. | Jointly funded by the Queensland Government (part of its Economic Recovery Strategy: Unite and Recover for Queensland Jobs) and the Australian Government (part of its Urban Congestion Fund). |
| 8. | Queensland Government commitment for three new Gold Coast railway stations at Pimpama, Hope Island and Merrimac. Project cost and timing subject to further planning. |
| 9. | Project cost, scope and timing subject to further planning. |
| 10. | Jointly funded by the Queensland Government and Australian Government (part of its Roads Infrastructure Stimulus Package). |
| 11. | Represents a funding commitment by the Australian Government, Queensland Government and Brisbane City Council, with project details subject to further planning. |
| 12. | Partly funded through the Queensland Government’s Economic Recovery Strategy: Unite and Recover for Queensland Jobs. This is part of a package of works to upgrade Cleveland - Redland Bay Road. |
| 13. | This commitment covers a program of works encompassing the Gateway Motorway (between Bracken Ridge and the Pine River) and the Bruce Highway (between the Gateway Motorway and Dohles Rocks Road interchange, including Dohles Rocks Road north-facing ramps (Northern Connections)). The program also includes planning for the Gympie Arterial Road (between Strathpine Road and Gateway Motorway) and planning for a new road along the North South Urban Arterial corridor (known as Moreton Connector) between Dohles Rocks Road and Anzac Avenue. |
| 14. | Part of the Australian Government’s Bruce Highway Upgrade Program, jointly funded by the Australian Government and Queensland Government. |
| 15. | Includes funding for Old Toorbul Point Road intersection signalisation. |
| 16. | Jointly funded by the Queensland Government and Australian Government (part of its Road Safety Program). |
| 17. | Jointly funded by the Australian Government and Queensland Government. Project details and timing subject to negotiation with the Australian Government. |
| 18. | Jointly funded by the Queensland Government and Australian Government (part of its Roads of Strategic Importance initiative). |
| 19. | Funded through the Queensland Government’s Transport Infrastructure Development Scheme. |
| 20. | Construction on the Mackay Ring Road is complete, with remaining workings associated with the Bald Hill Connection Road. |
| 21. | Part of the Australian Government’s Northern Australia Roads Program, jointly funded by the Australian Government and Queensland Government. |
| 22. | Includes an agreed contribution from Queensland Rail. |
| 23. | This funding does not include $7.88 million of interim early works that were completed in 2018-19. |
| 24. | This project includes delivery of a fauna crossing over the Bruce Highway. |
| 25. | This cycleway project is funded as part of the Bruce Highway - Cairns Southern Access Stage 2 (Robert Road to Foster Road) project. |
| 26. | Part of the Cape York Region Package Stage 2, jointly funded by the Queensland Government and Australian Government (part of its Roads of Strategic Importance initiative). |
| 27. | This forms part of the $7.1 billion to boost the state’s train manufacturing industry and build and operate 65 trains, subject to the outcomes of the competitive procurement process. |
| 28. | Jointly funded by the Queensland Government, Australian Government and Brisbane City Council. |
| 29. | Represents a funding commitment by the Queensland Government and Australian Government. Project cost, timing and funding arrangements subject to further planning and negotiation with Brisbane City Council and the Australian Government (in line with its 2022 Federal Election commitment). |
| 30. | Part of the Australian Government’s Bridges Renewal Program, jointly funded by the Australian Government and local government authorities. |
| 31. | Represents the Australian Government’s funding commitment towards Brisbane City Council’s Brisbane Metro project. |
| 32. | Part of the Australian Government’s Heavy Vehicle Safety and Productivity Program, jointly funded by the Australian Government and Queensland Government. |
| 33. | Partly funded through the Queensland Government’s Economic Recovery Strategy: Unite and Recover for Queensland Jobs. |
| 34. | Total project cost is expected to be $21.8 million including contributions of $3 million from industry. |
| 35. | This project is being delivered by Cross River Rail Delivery Authority. |
134
Capital Statement 2022-23
Transport and Main Roads
| 36. | Jointly delivered by Queensland Rail and Department of Transport and Main Roads. |
| 37. | The project is being delivered by Cross River Rail Delivery Authority and Department of Transport and Main Roads with support from Queensland Rail. |
| 38. | Rail station access improvements include Roma Street train station, Dutton Park train station, Boggo Road train station, Pimpama train station, Hope Island train station and Merrimac train station. |
| 39. | The works relate to increased structural gauge, waterway resilience and track renewal. |
| 40. | The works relate to maintenance of stations, platforms and rollingstock in the South East Queensland rail network. |
| 41. | The works relate to renewal, improvement, replacement and upgrade of track infrastructure in the South East Queensland rail network. |
| 42. | The works relate to renewal, replacement and upgrade of track infrastructure on the North Coast Line. |
| 43. | The works relate to maintenance of rollingstock, stations, yards and locomotives in the Regional Queensland rail network. |
| 44. | The works relate to renewal, improvement, replacement and upgrade of rail infrastructure on West Moreton system. |
| 45. | The works relate to renewal, improvement, replacement and upgrade of the Western Regional rail systems. |
Loganlea Station Accessibility Upgrade has been removed from Queensland Rail’s Budget Paper 3 as it is represented in the Department of Transport and Main Roads Budget Paper 3 as a jointly funded project to the total project cost of $95 million.
All projects - total estimated cost is inclusive of both non-capital and capital components of project expenditure.
135
Capital Statement 2022-23
| Appendices |
| Appendix A: | Entities included in capital outlays 2022–23 |
Agriculture and Fisheries
| • | Department of Agriculture and Fisheries |
| • | Queensland Racing Integrity Commission |
Children, Youth Justice and Multicultural Affairs
| • | Department of Children, Youth Justice and Multicultural Affairs |
Communities, Housing and Digital Economy
| • | Department of Communities, Housing and Digital Economy |
| • | CITEC |
| • | Library Board of Queensland |
| • | Queensland Art Gallery |
| • | Queensland Performing Arts Trust |
| • | Queensland Shared Services |
Education
| • | Department of Education |
Employment, Small Business and Training
| • | Department of Employment, Small Business and Training |
| • | TAFE Queensland |
Energy and Public Works
| • | Department of Energy and Public Works |
| • | CleanCo Queensland Limited |
| • | CS Energy Limited |
| • | Energy Queensland Limited |
| • | Powerlink Queensland |
| • | Stanwell Corporation Limited |
Environment and Science
| • | Department of Environment and Science |
136
Capital Statement 2022-23
Justice and Attorney-General
| • | Department of Justice and Attorney-General |
| • | Crime and Corruption Commission |
| • | Public Trustee of Queensland |
Legislative Assembly of Queensland
| • | Legislative Assembly of Queensland |
Premier and Cabinet
| • | Department of the Premier and Cabinet |
Queensland Corrective Services
| • | Queensland Corrective Services |
Queensland Fire and Emergency Services
| • | Queensland Fire and Emergency Services |
Queensland Health
| • | Queensland Health and Hospital and Health Services |
| • | Council of the Queensland Institute of Medical Research |
Queensland Police Service
| • | Queensland Police Service |
Queensland Treasury
| • | Queensland Treasury |
Regional Development, Manufacturing and Water
| • | Department of Regional Development, Manufacturing and Water |
| • | Gladstone Area Water Board |
| • | Mount Isa Water Board |
| • | Seqwater |
| • | SunWater Limited |
Resources
| • | Department of Resources |
Seniors, Disability Services and Aboriginal and Torres Strait Islander Partnerships
| • | Department of Seniors, Disability Services and Aboriginal and Torres Strait Islander Partnerships |
137
Capital Statement 2022-23
State Development, Infrastructure, Local Government and Planning
| • | Department of State Development, Infrastructure, Local Government and Planning |
| • | Economic Development Queensland |
| • | Queensland Reconstruction Authority |
| • | South Bank Corporation |
Tourism, Innovation and Sport
| • | Department of Tourism, Innovation and Sport |
| • | Stadiums Queensland |
Transport and Main Roads
| • | Department of Transport and Main Roads |
| • | Far North Queensland Ports Corporation Limited |
| • | Gladstone Ports Corporation Limited |
| • | Gold Coast Waterways Authority |
| • | North Queensland Bulk Ports Corporation Limited |
| • | Port of Townsville Limited |
| • | Queensland Rail |
| • | RoadTek |
| • | Cross River Rail Delivery Authority |
138
Capital Statement 2022-23
| Appendix B: | Key concepts and coverage |
Coverage of the capital statement
Under accrual output budgeting, capital is the stock of assets including property, plant and equipment and intangible assets that any agency owns and/or controls and uses in the delivery of services, as well as capital grants made to other entities. The following definitions are applicable throughout this document:
| • | capital purchases – property, plant and equipment outlays as per the financial statements excluding asset sales, depreciation and revaluations |
| • | capital grants – capital grants to other entities and individuals (excluding grants to other government departments and statutory bodies) |
| • | right of use assets – property, plant and equipment to which government agencies have a right to use through lease or similar arrangements. |
Capital contingency
Consistent with the approach adopted in previous years, a capital contingency reserve has been included. This reserve recognises that while agencies budget to fully use their capital works allocation, circumstances such as project lead-in times, project management constraints, unexpected weather conditions and capacity constraints such as the supply of labour and materials may prevent full usage. On a whole-of-government basis, there is likely to be underspending, resulting in a carry-over of capital allocations.
Estimated jobs supported by capital works
The $15.510 billion capital works program in 2022–23 is estimated to directly support around 48,000 jobs, equating to around 42,500 full-time equivalent jobs. The estimate of jobs supported by the Government’s capital works program in 2022–23 is based on Queensland Treasury’s Guidelines for estimating the full-time equivalent (FTE) jobs directly supported by the construction component of the capital works program.
The estimate of jobs supported by the capital works program is presented both in terms of FTEs and total jobs. Further, in some cases, jobs estimates quoted for specific projects throughout the Capital Statement and in other budget papers may reflect other approaches, including proponents’ estimates or project specific information, rather than the methodology in the Queensland Treasury Guidelines for estimating jobs supported by capital works.
139
Capital Statement 2022-23
| Appendix C: | Capital purchases by entity by region 2022–231 |
| Brisbane and Redlands | ||||||||||||||||||||||||
| East | North | South | West | Inner city | Sub total | |||||||||||||||||||
Entity2 | $‘000 | $‘000 | $‘000 | $‘000 | $‘000 | $‘000 | ||||||||||||||||||
Agriculture and Fisheries | 240 | 27 | 2,225 | 23 | 5,936 | 8,451 | ||||||||||||||||||
Children, Youth Justice and Multicultural Affairs | 1,473 | 1,380 | 2,298 | 1,183 | 1,782 | 8,116 | ||||||||||||||||||
Communities, Housing and Digital Economy | 5,223 | 11,559 | 25,892 | 8,189 | 135,211 | 186,074 | ||||||||||||||||||
Education | 55,109 | 61,962 | 120,298 | 58,652 | 61,714 | 357,735 | ||||||||||||||||||
Employment, Small Business and Training | 3,115 | 16,352 | 4,874 | 2,509 | 3,777 | 30,627 | ||||||||||||||||||
Energy and Public Works | 55,634 | 69,734 | 61,953 | 57,200 | 232,136 | 476,657 | ||||||||||||||||||
Environment and Science | 2,164 | 1,328 | 2,212 | 1,139 | 1,715 | 8,558 | ||||||||||||||||||
Justice and Attorney-General | 1,211 | 1,135 | 1,891 | 974 | 7,176 | 12,387 | ||||||||||||||||||
Legislative Assembly of Queensland | 82 | 79 | 79 | 73 | 42,422 | 42,735 | ||||||||||||||||||
Premier and Cabinet | — | — | — | — | 883 | 883 | ||||||||||||||||||
Queensland Corrective Services | 2,430 | 2,279 | 5,063 | 1,955 | 2,943 | 14,670 | ||||||||||||||||||
Queensland Fire and Emergency Services | 2,155 | 3,024 | 3,371 | 1,736 | 2,613 | 12,899 | ||||||||||||||||||
Queensland Health | 40,858 | 21,213 | 58,764 | 961 | 427,026 | 548,822 | ||||||||||||||||||
Queensland Police Service | 4,956 | 4,652 | 7,750 | 3,990 | 29,247 | 50,595 | ||||||||||||||||||
Regional Development, Manufacturing and Water | 3,954 | 2,836 | 4,970 | 2,820 | 4,289 | 18,869 | ||||||||||||||||||
Resources | 435 | 408 | 679 | 350 | 527 | 2,399 | ||||||||||||||||||
Seniors, Disability Services and Aboriginal and Torres Strait Islander Partnerships | 41 | 40 | 67 | 34 | 52 | 234 | ||||||||||||||||||
State Development, Infrastructure, Local Government and Planning | — | 43,467 | 19,936 | — | 9,899 | 73,302 | ||||||||||||||||||
Tourism, Innovation and Sport | 2,166 | 2,104 | 8,895 | 421 | 29,169 | 42,755 | ||||||||||||||||||
Transport and Main Roads | 100,731 | 129,866 | 204,585 | 78,519 | 1,336,259 | 1,849,960 | ||||||||||||||||||
Other Agencies3 | 265 | 249 | 414 | 213 | 321 | 1,462 | ||||||||||||||||||
Anticipated capital contingency reserve and other adjustments4 | ||||||||||||||||||||||||
Funds allocated | 251,448 | 332,921 | 477,710 | 196,834 | 2,080,318 | 3,339,231 | ||||||||||||||||||
Notes
| 1. | Numbers may not add due to rounding and allocations of adjustments. |
| 2. | Includes all associated statutory bodies. |
| 3. | Includes other government entities with non-material capital programs. |
| 4. | The anticipated contingency reserve and other adjustments have been spread across statistical areas proportionate to capital spends. |
140
Capital Statement 2022-23
Darling Downs | ||||||||||||||||||||||||
| Ipswich | Wide Bay | DD Maranoa | Toowoomba | Sub total | Gold Coast | |||||||||||||||||||
Entity2 | $‘000 | $‘000 | $‘000 | $‘000 | $‘000 | $‘000 | ||||||||||||||||||
Agriculture and Fisheries | 274 | 478 | 1,254 | 2,060 | 3,314 | 112 | ||||||||||||||||||
Children, Youth Justice and Multicultural Affairs | 6,280 | 1,832 | 788 | 969 | 1,757 | 6,381 | ||||||||||||||||||
Communities, Housing and Digital Economy | 16,195 | 21,931 | 6,004 | 8,038 | 14,042 | 25,814 | ||||||||||||||||||
Education | 177,884 | 54,753 | 40,824 | 29,423 | 70,247 | 131,936 | ||||||||||||||||||
Employment, Small Business and Training | 10,295 | 7,488 | 1,671 | 2,054 | 3,725 | 8,748 | ||||||||||||||||||
Energy and Public Works | 63,367 | 310,907 | 226,756 | 79,927 | 306,683 | 92,942 | ||||||||||||||||||
Environment and Science | 2,131 | 7,934 | 1,358 | 932 | 2,290 | 4,244 | ||||||||||||||||||
Justice and Attorney-General | 1,822 | 1,507 | 648 | 797 | 1,445 | 3,401 | ||||||||||||||||||
Legislative Assembly of Queensland | 67 | 54 | 54 | 48 | 102 | 91 | ||||||||||||||||||
Premier and Cabinet | — | — | — | — | — | — | ||||||||||||||||||
Queensland Corrective Services | 457,658 | 3,025 | 1,302 | 1,600 | 2,902 | 6,426 | ||||||||||||||||||
Queensland Fire and Emergency Services | 4,598 | 9,602 | 1,156 | 1,521 | 2,677 | 5,705 | ||||||||||||||||||
Queensland Health | 61,665 | 51,622 | 8,084 | 62,714 | 70,798 | 111,611 | ||||||||||||||||||
Queensland Police Service | 13,674 | 10,255 | 13,433 | 3,266 | 16,699 | 13,116 | ||||||||||||||||||
Regional Development, Manufacturing and Water | 50,018 | 34,614 | 4,143 | 81 | 4,224 | 4,728 | ||||||||||||||||||
Resources | 654 | 591 | 483 | 286 | 769 | 1,150 | ||||||||||||||||||
Seniors, Disability Services and Aboriginal and Torres Strait Islander Partnerships | 4,264 | 53 | 23 | 28 | 51 | 113 | ||||||||||||||||||
State Development, Infrastructure, Local Government and Planning | 9,730 | — | — | — | — | 17,595 | ||||||||||||||||||
Tourism, Innovation and Sport | 788 | 652 | 280 | 345 | 625 | 7,383 | ||||||||||||||||||
Transport and Main Roads | 157,525 | 641,913 | 65,693 | 48,767 | 114,460 | 1,167,007 | ||||||||||||||||||
Other Agencies3 | 399 | 330 | 142 | 175 | 317 | 701 | ||||||||||||||||||
Anticipated capital contingency reserve and other adjustments4 | ||||||||||||||||||||||||
Funds allocated | 925,893 | 1,033,025 | 333,279 | 216,514 | 549,793 | 1,433,626 | ||||||||||||||||||
Notes
| 1. | Numbers may not add due to rounding and allocations of adjustments. |
| 2. | Includes all associated statutory bodies. |
| 3. | Includes other government entities with non-material capital programs. |
| 4. | The anticipated contingency reserve and other adjustments have been spread across statistical areas proportionate to capital spends. |
141
Capital Statement 2022-23
| Logan - | Mackay - | Outback and Far North Queensland | Central | |||||||||||||||||||||
| Beaudesert | Whitsunday | Outback | Cairns | Sub total | Queensland | |||||||||||||||||||
Entity2 | $‘000 | $‘000 | $‘000 | $‘000 | $‘000 | $‘000 | ||||||||||||||||||
Agriculture and Fisheries | 41 | 549 | 2,287 | 3,354 | 5,641 | 3,758 | ||||||||||||||||||
Children, Youth Justice and Multicultural Affairs | 3,240 | 2,759 | 4,005 | 2,352 | 6,357 | 1,386 | ||||||||||||||||||
Communities, Housing and Digital Economy | 21,052 | 16,385 | 10,107 | 58,659 | 68,766 | 16,582 | ||||||||||||||||||
Education | 131,343 | 40,982 | 18,554 | 61,608 | 80,162 | 77,723 | ||||||||||||||||||
Employment, Small Business and Training | 4,531 | 2,246 | 1,070 | 9,544 | 10,614 | 2,939 | ||||||||||||||||||
Energy and Public Works | 14,676 | 145,364 | 116,282 | 187,680 | 303,962 | 179,338 | ||||||||||||||||||
Environment and Science | 3,856 | 3,791 | 781 | 2,654 | 3,435 | 1,685 | ||||||||||||||||||
Justice and Attorney-General | 3,682 | 871 | 415 | 1,676 | 2,091 | 1,540 | ||||||||||||||||||
Legislative Assembly of Queensland | 54 | 42 | 103 | 36 | 139 | 54 | ||||||||||||||||||
Premier and Cabinet | — | — | — | — | — | — | ||||||||||||||||||
Queensland Corrective Services | 3,530 | 1,749 | 834 | 2,562 | 3,396 | 2,290 | ||||||||||||||||||
Queensland Fire and Emergency Services | 10,148 | 2,303 | 740 | 2,275 | 3,015 | 2,033 | ||||||||||||||||||
Queensland Health | 178,410 | 43,984 | 54,067 | 111,445 | 165,512 | 51,436 | ||||||||||||||||||
Queensland Police Service | 7,204 | 6,400 | 5,297 | 18,592 | 23,889 | 4,673 | ||||||||||||||||||
Regional Development, Manufacturing and Water | 44,095 | 8,970 | 9,354 | 2,634 | 11,988 | 143,522 | ||||||||||||||||||
Resources | 631 | 363 | 549 | 458 | 1,007 | 510 | ||||||||||||||||||
Seniors, Disability Services and Aboriginal and Torres Strait Islander Partnerships | 62 | 31 | 15 | 45 | 60 | 40 | ||||||||||||||||||
State Development, Infrastructure, Local Government and Planning | — | 500 | 223 | — | 223 | 50,574 | ||||||||||||||||||
Tourism, Innovation and Sport | 760 | 377 | 180 | 7,852 | 8,032 | 493 | ||||||||||||||||||
Transport and Main Roads | 346,219 | 274,588 | 283,607 | 319,086 | 602,693 | 437,724 | ||||||||||||||||||
Other agencies3 | 385 | 191 | 91 | 279 | 370 | 250 | ||||||||||||||||||
Anticipated capital contingency reserve and other adjustments4 | ||||||||||||||||||||||||
Funds allocated | 689,478 | 492,169 | 453,073 | 706,291 | 1,159,364 | 871,782 | ||||||||||||||||||
Notes
| 1. | Numbers may not add due to rounding and allocations of adjustments. |
| 2. | Includes all associated statutory bodies. |
| 3. | Includes other government entities with non-material capital programs. |
| 4. | The anticipated contingency reserve and other adjustments have been spread across statistical areas proportionate to capital spends. |
142
Capital Statement 2022-23
| Moreton Bay | ||||||||||||||||||||||||
| Sunshine | Moreton | Moreton | ||||||||||||||||||||||
| Coast | Bay North | Bay South | Sub total | Townsville | Totals1 | |||||||||||||||||||
Entity2 | $‘000 | $‘000 | $‘000 | $‘000 | $‘000 | $‘000 | ||||||||||||||||||
Agriculture and Fisheries | 853 | 348 | 26 | 374 | 1,074 | 24,919 | ||||||||||||||||||
Children, Youth Justice and Multicultural Affairs | 2,348 | 2,642 | 1,339 | 3,981 | 4,812 | 49,249 | ||||||||||||||||||
Communities, Housing and Digital Economy | 13,792 | 15,568 | 8,951 | 24,519 | 28,794 | 453,946 | ||||||||||||||||||
Education | 170,237 | 50,567 | 60,275 | 110,842 | 53,226 | 1,457,070 | ||||||||||||||||||
Employment, Small Business and Training | 4,979 | 3,321 | 2,840 | 6,161 | 11,251 | 103,604 | ||||||||||||||||||
Energy and Public Works | 93,799 | 17,556 | 8,704 | 26,260 | 304,722 | 2,318,677 | ||||||||||||||||||
Environment and Science | 2,890 | 3,659 | 1,289 | 4,948 | 5,399 | 51,161 | ||||||||||||||||||
Justice and Attorney-General | 1,932 | 1,289 | 1,102 | 2,391 | 1,192 | 34,261 | ||||||||||||||||||
Legislative Assembly of Queensland | 79 | 54 | 54 | 108 | 36 | 43,561 | ||||||||||||||||||
Premier and Cabinet | — | — | — | — | — | 883 | ||||||||||||||||||
Queensland Corrective Services | 3,879 | 9,234 | 2,212 | 11,446 | 2,392 | 513,363 | ||||||||||||||||||
Queensland Fire and Emergency Services | 3,644 | 3,548 | 1,964 | 5,512 | 5,324 | 67,460 | ||||||||||||||||||
Queensland Health | 70,027 | 120,655 | 12,185 | 132,840 | 50,385 | 1,537,112 | ||||||||||||||||||
Queensland Police Service | 10,283 | 5,282 | 6,496 | 11,778 | 6,063 | 174,629 | ||||||||||||||||||
Regional Development, Manufacturing and Water | 6,848 | 661 | 3,290 | 3,951 | 40,390 | 372,217 | ||||||||||||||||||
Resources | 694 | 463 | 396 | 859 | 478 | 10,105 | ||||||||||||||||||
Seniors, Disability Services and Aboriginal and Torres Strait Islander Partnerships | 68 | 45 | 39 | 84 | 42 | 5,102 | ||||||||||||||||||
State Development, Infrastructure, Local Government and Planning | 22,500 | — | — | — | 4,179 | 178,603 | ||||||||||||||||||
Tourism, Innovation and Sport | 836 | 558 | 477 | 1,035 | 1,513 | 65,249 | ||||||||||||||||||
Transport and Main Roads | 341,006 | 369,244 | 85,454 | 454,698 | 342,091 | 6,729,884 | ||||||||||||||||||
Other agencies3 | 423 | 282 | 241 | 523 | 261 | 5,612 | ||||||||||||||||||
Anticipated capital contingency reserve and other adjustments4 | (1,548,976 | ) | ||||||||||||||||||||||
Funds allocated | 669,164 | 538,968 | 175,803 | 714,771 | 769,395 | 12,647,691 | ||||||||||||||||||
Notes
| 1. | Numbers may not add due to rounding and allocations of adjustments. |
| 2. | Includes all associated statutory bodies. |
| 3. | Includes other government entities with non-material capital programs. |
| 4. | The anticipated contingency reserve and other adjustments have been spread across statistical areas proportionate to capital spends. |
143
Queensland Budget 2022–23 Capital Statement Budget Paper No.3
Queensland Budget 2022–23
Capital Statement Budget Paper No.3
| QUEENSLAND BUDGET 2022-23 |
BUDGET MEASURES
BUDGET PAPER NO. 4
2022–23 Queensland Budget Papers
1. Budget Speech
2. Budget Strategy and Outlook
3. Capital Statement
4. Budget Measures
Service Delivery Statements
Appropriation Bills
Budget Highlights
Regional Action Plans
© The State of Queensland (Queensland Treasury) 2022
Copyright
This publication is protected by the Copyright Act 1968
Licence
This document is licensed by the State of Queensland (Queensland Treasury) under a Creative Commons Attribution (CC BY 4.0) International licence.

In essence, you are free to copy, communicate and adapt this publication, as long as you attribute the work to the State of Queensland (Queensland Treasury). To view a copy of this licence, visit http://creativecommons.org/licenses/by/4.0/
Attribution
Content from this publication should be attributed to:
© The State of Queensland (Queensland Treasury) - 2022–23 Queensland Budget

Translating and interpreting assistance
The Queensland Government is committed to providing accessible services to Queenslanders from all cultural and linguistic backgrounds. If you have difficulty in understanding this publication, you can contact us on telephone (07) 3035 3503 and we will arrange an interpreter to effectively communicate the report to you.
Budget Measures
Budget Paper No. 4
ISSN 1445-4890 (Print)
ISSN 1445-4904 (Online)
Budget Measures 2022-23

State Budget
2022–23
Budget Measures
Budget Paper No. 4
Budget Measures 2022-23
Contents
Key Features | 1 | |||||
1 | Introduction | 2 | ||||
1.1 | Explanation of scope and terms | 2 | ||||
1.2 | Overview | 3 | ||||
1.3 | Whole-of-Government Measures | 7 | ||||
1.4 | Government Indexation Policy | 10 | ||||
2 | Expense Measures | 28 | ||||
Introduction | 28 | |||||
Department of Agriculture and Fisheries | 29 | |||||
Department of Children, Youth Justice and Multicultural Affairs | 32 | |||||
Department of Communities, Housing and Digital Economy | 40 | |||||
Department of Education | 46 | |||||
Department of Employment, Small Business and Training | 53 | |||||
Department of Energy and Public Works | 56 | |||||
Department of Environment and Science | 59 | |||||
Department of Justice and Attorney-General | 63 | |||||
Department of Regional Development, Manufacturing and Water | 81 | |||||
Department of Resources | 87 | |||||
Department of Seniors, Disability Services and Aboriginal and Torres Strait Islander Partnerships | 89 | |||||
Department of State Development, Infrastructure, Local Government and Planning | 94 | |||||
Department of the Premier and Cabinet | 99 | |||||
Department of Tourism, Innovation and Sport | 102 | |||||
Department of Transport and Main Roads | 106 | |||||
Legislative Assembly of Queensland | 113 | |||||
Office of the Governor | 114 | |||||
Queensland Corrective Services | 115 | |||||
Budget Measures 2022-23
Queensland Fire and Emergency Services | 119 | |||
Queensland Health | 121 | |||
Queensland Police Service | 125 | |||
Queensland Treasury | 131 | |||
3 Capital Measures | 134 | |||
Introduction | 134 | |||
Department of Communities, Housing and Digital Economy | 135 | |||
Department of Education | 137 | |||
Department of Energy and Public Works | 139 | |||
Department of Environment and Science | 141 | |||
Department of Justice and Attorney-General | 142 | |||
Department of State Development, Infrastructure, Local Government and Planning | 146 | |||
Department of the Premier and Cabinet | 148 | |||
Department of Tourism, Innovation and Sport | 149 | |||
Department of Transport and Main Roads | 150 | |||
Legislative Assembly of Queensland | 152 | |||
Queensland Corrective Services | 153 | |||
Queensland Health | 155 | |||
Queensland Police Service | 159 | |||
4 Revenue Measures | 161 | |||
Introduction | 161 | |||
Department of Regional Development, Manufacturing and Water | 162 | |||
Department of Resources | 163 | |||
Queensland Health | 164 | |||
Queensland Treasury | 165 | |||
Budget Measures 2022-23
Key Features
| • | The 2022–23 Budget measures will support more jobs in more industries, deliver better services and protect Queenslanders’ lifestyle. |
| • | Queensland is leveraging the momentum of its strong recovery to focus on growing the economy and enhancing the quality of life of all Queenslanders. |
| • | To support the health system, the Budget will provide a transformational $9.785 billion capital boost to expand bed capacity over the next 6 years, $6.784 billion over 4 years to support the ongoing growth in health and ambulance services as well as $1.645 billion over 5 years for mental health services. |
| • | A growing economy will allow the government to deliver better services across the state, including in education, justice and social services. |
| • | To support the manufacturing sector to take advantage of new opportunities, the 2022–23 Budget commits to additional funding of $40 million over 2 years to continue the Made in Queensland program and an additional $10 million for the Manufacturing Hubs Grant program. |
| • | The government is also providing additional funding of $964.2 million over 5 years as part of the 10-year $2.1 billion Waste Package to support councils and industry to invest in infrastructure and will deliver programs to reduce waste, meet resource recovery targets, create jobs, and reduce impacts on households. |
| • | The Queensland Resources Industry Development Plan aims to fast track new economy minerals production and processing. As part of the $68.5 million package to support the plan, an additional $17.5 million over 4 years will be provided to enhance the Collaborative Exploration Initiative and support resource exploration companies to make more new economy mineral discoveries in Queensland. |
| • | The government is providing funding of $470.4 million ($464.5 million increased funding and $6 million met internally) over 4 years and $104.7 million per annum ongoing to continue the family support and child protection reforms through the Supporting Families Changing Futures program. |
| • | The Queensland Government is committing more than $3 billion over 4 years under Disaster Recovery Funding Arrangements in partnership with the Australian Government to support recovery from the 2021-22 disaster season. This includes $1.818 billion from the Resilient Homes Fund and Category C and D Extraordinary Packages. |
| • | The government’s cost of living support measures includes $6.786 billion in concessions for Queenslanders in 2022–23 including a $175 Cost of Living Rebate to help manage electricity costs. |
| • | The government is committing additional funding of $150 million over 3 years to increase the Catalyst Infrastructure Fund to unlock development and increase the supply of housing in the state’s Priority Development Areas. |
1
Budget Measures 2022-23
| 1 | Introduction |
The document provides a consolidated view of policy decisions with budgetary impacts made by the government since the 2021–22 Budget.
This document complements other budget papers, in particular Budget Paper No. 2 Budget Strategy and Outlook, Budget Paper No. 3 Capital Statement and the Service Delivery Statements.
This paper includes only new policy decisions and does not detail the full amount of additional funding being provided to agencies to deliver services and infrastructure. Other adjustments, including those that are parameter based and where the funding formula remains unchanged, are similarly excluded.
The total funding impact of new measures is summarised in Tables 1.3 to 1.5 at the conclusion of this chapter.
For details on the total funding available to agencies, refer to agencies’ Service Delivery Statements.
| 1.1 | Explanation of scope and terms |
Scope
This document includes measures with the following features:
| • | Sector. Only Queensland General Government Sector agencies are included. Measures involving government-owned corporations or other Public Non-financial Corporations Sector agencies are within scope only if the measures are being funded directly by the General Government Sector or if there is a flow through effect (for example, community service obligations). |
| • | Timeframe. Measures based on decisions made by the government since the 2021–22 Budget. |
| • | Type. Measures with budgetary impacts, in particular: |
| (i) | expense and capital measures with service delivery, capital enhancement, grant or subsidy impacts on the community and |
| (ii) | revenue measures involving a significant change in revenue policy, including changes in the tax rate. |
| • | Materiality. Minor measures or measures with non-significant community impact are not included in this document. |
| • | Technical initiatives or non-policy-based adjustments, such as parameter-based funding adjustments, are not included if the formula to calculate these adjustments has not changed, as they do not reflect changes in government policy. The main focus is on measures reflecting policy decisions that impact directly on the community through service delivery or other means. |
2
Budget Measures 2022-23
Funding basis
Tables in this document are presented on a net funding basis.
| • | Net funding refers to the impact that the funding of the measure has on appropriations from the Consolidated Fund or centrally held funds to the relevant General Government agency. The tables do not include funding directed to the measure from existing agency resources or other sources. |
| • | Amounts refer to additional funding being provided to agencies for a particular program or project, as a result of decisions by government since the 2021–22 Budget. The amount provided for a measure may differ from other budget papers, such as Budget Paper No. 3 Capital Statement, that may refer to total funding. |
| • | Where a measure involves material expenditure or revenue collections by more than one department, the measure is reported under each department involved. The addition of each individual department’s portion of a particular measure may not equate to the reported total whole-of-government figure due to the omission of some departments’ portions that did not meet Budget Paper 4’s materiality threshold (i.e. $250,000 over 5 years). |
| • | Amounts included in the tables relating to revenue measures represent the impact of the measure on government revenue (with a positive amount representing additional revenue). |
Tables 1.2 to 1.4 identify expense, capital and revenue measures separately, categorised as follows:
| • | up to and including 2021–22 Budget Update and |
| • | since the 2021–22 Budget Update. |
| 1.2 | Overview |
The following section presents selected measures relating to decisions taken since the 2021–22 Budget.
Health
Queensland continues to experience very strong ongoing demand for public hospital services, such as emergency departments, mental health, specialist outpatients and elective surgery. Despite these demands, Queensland’s health performance remains strong, supported by record health budgets, with a focus on recruiting frontline staff, meeting increased demand for health services, and continuing to protect the state from COVID-19.
The 2022–23 Budget sees an additional $9.785 billion being provided to Queensland Health for a range of projects to expand system capacity over the next 6 years. This will deliver around 2,200 additional overnight beds at 15 facilities, with:
| • | new hospitals at Bundaberg, Toowoomba and Coomera |
| • | a new Queensland Cancer Centre |
| • | expansions to hospitals in Cairns, Townsville, Robina, Mackay, Redcliffe, Ipswich and Hervey Bay as well as to the Princess Alexandra, QEII, and The Prince Charles hospitals |
| • | a further expansion of Logan Hospital. |
3
Budget Measures 2022-23
The 2022–23 Budget also provides an additional $6.784 billion over 4 years to help address the ongoing growth in demand for health and ambulance services. The funding will strengthen Queensland’s public health system to respond to the growing and evolving health care needs by supporting thousands of additional frontline staff including doctors, nurses and paramedics.
In addition, an extra $1.645 billion over 5 years plus an additional $28.5 million in capital funding is provided to improve mental health, alcohol and other drug services and for a range of initiatives to improve the suicide prevention system of care and support, which is to be funded by a new mental health levy proposed to commence from 1 January 2023.
These investments will support a range of additional services including new adolescent, young adult, adult, older person, perinatal, and eating disorder mental health beds, beds for new crisis response services and enhanced provision of psychosocial supports.
The Budget also provides an additional $333.7 million for Queensland Health to enter a new single 10-year Standing Offer Arrangement with the Royal Flying Doctor Service.
More jobs in more industries
Queensland will take advantage of global shifts and build on its strengths to realise opportunities in traditional and emerging industries. By focussing on critical economic settings and enablers, the Queensland Government’s economic strategy will improve the competitiveness and productivity of Queensland businesses so that they can leverage opportunities to drive growth and employment.
Relevant initiatives include:
| • | Queensland Resources Industry Development Plan: $68.5 million over 5 years to implement the Queensland Resources Industry Development Plan . The package includes an additional $17.5 million over 4 years to enhance the Collaborative Exploration Initiative to aid mineral discoveries in Queensland. Additional details of funding and initiatives can be found under section 1.3 – Whole-of-government Measures. |
| • | Driving growth and sustainability through manufacturing: $40 million and $10 million over 2 years to continue the Made in Queensland program and Manufacturing Hubs Grant program respectively. |
| • | Tourism Recovery and Development Initiatives: $66.4 million over 4 years ($4 million held centrally) to implement targeted initiatives for tourism recovery and growth that are focused on experience development, tourism infrastructure, ecotourism, events and First Nations tourism. |
| • | Queensland Trade and Investment Strategy 2022 – 2032: $150 million over 10 years is being committed to back a new Queensland Trade and Investment Strategy. The strategy will seek to leverage the profile of the 2032 Games to position Queensland as Australia’s most innovative and dynamic trading economy, with a view to creating high quality jobs and securing economic growth. |
Better Services
Growing the economy allows the government to deliver better and fairer services to improve the lives of Queenslanders while also enhancing the opportunity for all to benefit from participation in the economy and community.
4
Budget Measures 2022-23
| • | Child Protection Services – $2.2 billion over 5 years and $500 million per year ongoing for out of home care services in response to ongoing pressures arising from an increase in demand in the child protection system. |
| • | Achieving Justice System Efficiency – contemporary technology and infrastructure: total funding package of $246.8 million over 5 years and $27.4 million ongoing to deliver safe, fair and responsible communities via an efficient and effective justice system underpinned by contemporary technology and safe, accessible and functional infrastructure. This includes $71 million from 2024–25 to 2026–27 held centrally and $7 million per annum ongoing to be held centrally. |
| • | Family Support and Child Protections Reforms: $470.4 million over 4 years ($464.5 million increased funding and $6 million met internally) and $104.7 million per annum ongoing to continue the family support and child protection reforms through the Supporting Families Changing Futures program. This funding will support a number of programs including: |
| • | $183.5 million over 4 years and $45.9 million per annum ongoing for the Intensive Family Support services to continue early intervention support services for families and parents who are experiencing vulnerability and have more complex needs |
| • | $66.9 million over 4 years and $16.7 million per annum ongoing for the Aboriginal and Torres Strait Islander Family Wellbeing Services. |
| • | Youth Justice Investment: $78.8 million over 4 years ($77.2 million increased funding and $1.6 million being met internally) and $18.9 million per annum ongoing ($18.5 million new funding and $400,000 being met internally) for continuation of the Youth Justice Strategy reforms. |
| • | Strengthening Social Services in Queensland: $125.6 million over 4 years and $19 million ongoing to strengthen social services in Queensland. The funding will elevate the role and function of neighbourhood and community centres and support delivery of the government’s response to the Parliamentary Inquiry into Social Isolation and Loneliness. |
Protecting Queenslanders’ Lifestyle
Sustainable growth will be achieved while protecting the Queensland lifestyle through addressing the cost of living, investing in the social infrastructure needed to support the state’s growing population and taking care of the environment.
| • | Cost of Living Support: a $175 Cost of Living Rebate to help Queensland households manage rising electricity costs at a cost of $385 million. |
| • | Queensland’s Resource Recovery Sector Transformation: $964.2 million over 5 years as part of the 10-year $2.1 billion Waste Package to support councils and industry investing in infrastructure and deliver programs to reduce waste, meet resource recovery targets, create jobs, and reduce impacts on households. The transformation includes: |
| • | $672.4 million in 2021–22 for payments to councils to reduce the household impact of the waste levy over 4 years |
| • | $291.8 million over 4 years will contribute to implementation of waste management plans, expand resource recovery programs and support environmental activities. |
| • | Protected Area Strategy: $262.5 million over 4 years to continue the delivery of Queensland’s Protected Area Strategy 2020–2030, providing conservation and carbon positive outcomes. This 10-year plan is directly supporting the growth, better management and sustainability of the state’s protected areas. |
5
Budget Measures 2022-23
| • | Fire Ant Suppression Taskforce: $37.1 million over 5 years to establish a joint taskforce to oversee red imported fire ant suppression activities by local governments, industry and Queensland Government, including the provision of bait. This demonstrates to our partners, the Australian Government and other states and territories, Queensland’s commitment to the National Red Imported Fire Ant Eradication Program. |
The 2032 Olympic and Paralympic Games
The 2032 Olympic and Paralympic Games will provide Queensland with the opportunity to showcase the state on the global stage and leave a legacy that will define the state for decades to come. In addition to the direct benefits and jobs from Brisbane 2032, the event will create ongoing benefits through increased trade and investment activity.
The government is investing $59.3 million over 4 years and $4.7 million per year ongoing to support the Brisbane 2032 Taskforce to lead 2032 Olympic and Paralympic Games activities across the Queensland Government. This will support preparation of the 2032 Games Legacy Program as well as planning and design of infrastructure to support Brisbane 2032, including venues and athletes’ villages. It will also support priority transport projects being delivered in south east Queensland to manage growth in the region and support the 2032 Games transport task. The Budget provides $31.4 million over 2 years from 2023–24 to extend the 2032 High Performance Strategy to continue to help prepare elite Queensland athletes to achieve world class success at Paris 2024 and leading up to Brisbane 2032.
A further $100 million over 4 years is being invested to establish a program to deliver new and upgraded sports infrastructure for schools across the state, with a focus on encouraging sports participation.
6
Budget Measures 2022-23
| 1.3 | Whole-of-government measures |
Response to Hear her voice – Report One
The Queensland Government has committed $363 million over 5 years ($61.3 million per annum ongoing) for a package of reforms in response to the Queensland Women’s Safety and Justice Taskforce, Hear her voice – Report one - Addressing coercive control and domestic and family violence in Queensland. The reform package seeks to ensure victims are kept safe and perpetrators are held to account and includes:
| • | new laws and programs to recognise, prevent and punish coercive control including making coercive control a criminal offence |
| • | a Commission of Inquiry into police responses to domestic and family violence (DFV) |
| • | better support for women including expansion of High-Risk Teams, and trialling co-responder models so victims receive a joint response from police and DFV services |
| • | expansion of specialist DFV courts |
| • | a specific strategy for First Nations communities |
| • | increased funding for perpetrator programs to change behaviour and stop the cycle of violence |
| • | increased respectful relationships education to all Queensland children and young people. |
The reform package is summarised in Table 1.1 and additional details can be found in Chapter 2 Expense measures and in Chapter 3 Capital measures.
7
Budget Measures 2022-23
| Table 1.1 | Hear her voice - Report one response package |
| 2021-22 | 2022-23 | 2023-24 | 2024-25 | 2025-26 | Total | |||||||||||||||||||
| $million | $million | $million | $million | $million | $million | |||||||||||||||||||
Expense Measures | ||||||||||||||||||||||||
Systemic reforms across Queensland’s criminal justice system |
| |||||||||||||||||||||||
Strategy to address over-representation of First Nations peoples; and establish Office of the Chief First Nations Justice Officer | — | 2.4 | 2.3 | 2.2 | 2.3 | 9.3 | ||||||||||||||||||
Commission of Inquiry into policing responses to domestic and family violence (DFV) | 0.8 | 2.7 | — | — | — | 3.5 | ||||||||||||||||||
Raising awareness and understanding in the community and improving primary prevention |
| |||||||||||||||||||||||
State-wide communication and engagement strategy; and develop primary prevention plan | — | 2.6 | 5.4 | 4.5 | 3.7 | 16.3 | ||||||||||||||||||
Enhance implementation of respectful relationships education | — | 6.0 | 6.2 | 3.3 | — | 15.5 | ||||||||||||||||||
Respectful relationships education for young people not in formal education | — | 0.2 | 0.2 | 0.2 | — | 0.5 | ||||||||||||||||||
Improving service system responses | ||||||||||||||||||||||||
Develop 5-year DFV service system strategic investment plan | — | 0.8 | 0.4 | — | — | 1.2 | ||||||||||||||||||
Peak industry body for all specialist DFV services | — | 1.2 | 0.9 | 0.9 | 0.9 | 4.0 | ||||||||||||||||||
Integrated service system responses and high-risk teams in additional locations | — | 4.4 | 5.5 | 7.2 | 9.7 | 26.8 | ||||||||||||||||||
Holding perpetrators accountable to stop the violence |
| |||||||||||||||||||||||
Develop state-wide network of perpetrator intervention programs | — | 6.8 | 7.4 | 6.4 | 4.9 | 25.5 | ||||||||||||||||||
Improving police responses to DFV | ||||||||||||||||||||||||
Trial and evaluate mobile co-responder models | — | 0.8 | 6.0 | 8.0 | 8.0 | 22.9 | ||||||||||||||||||
DFV and coercive-control training and education | — | 4.0 | 4.8 | 4.3 | 4.4 | 17.5 | ||||||||||||||||||
Update operational policies, procedures and risk assessment processes | — | 2.2 | 1.5 | 1.6 | 1.6 | 6.8 | ||||||||||||||||||
Improving court responses | ||||||||||||||||||||||||
State-wide plan to improve safety for DFV victims when attending courts | — | 10.0 | 15.3 | 16.6 | 15.9 | 57.8 | ||||||||||||||||||
Specialist DFV courts - enhancement and continued roll out | — | 8.5 | 15.1 | 17.7 | 19.1 | 60.4 | ||||||||||||||||||
Court staff training, and judicial education | — | 0.3 | — | — | — | 0.3 | ||||||||||||||||||
Legislative reforms | — | 1.0 | 1.6 | — | — | 2.6 | ||||||||||||||||||
8
Budget Measures 2022-23
Monitoring, evaluation and governance | ||||||||||||||||||||||||
Whole-of-government monitoring and evaluation framework | — | 1.0 | 0.5 | 0.5 | — | 2.0 | ||||||||||||||||||
Deliver 4-phase implementation plan for the response | — | 0.7 | 1.7 | — | — | 2.4 | ||||||||||||||||||
Ongoing evaluation of key initiatives | 1.0 | 2.0 | 2.0 | 2.0 | 7.0 | |||||||||||||||||||
Enhance agencies data collection and reporting capabilities | — | 2.3 | 2.4 | 2.1 | 0.9 | 7.7 | ||||||||||||||||||
Independent implementation supervisor and secretariat | — | 0.8 | 0.8 | 0.8 | 0.8 | 3.3 | ||||||||||||||||||
Other DFV related initiatives | ||||||||||||||||||||||||
First Nations communities DFV initiatives | — | 0.8 | 0.8 | 0.8 | 0.8 | 3.0 | ||||||||||||||||||
Enhance the Queensland DFV Death Review process | — | 1.3 | 1.7 | 0.4 | — | 3.3 | ||||||||||||||||||
DFV homicide and suicide data set and monitoring framework | — | 0.4 | 0.5 | 0.3 | — | 1.2 | ||||||||||||||||||
|
|
|
|
|
|
|
|
|
|
|
| |||||||||||||
Sub Total - Expense Measures | 0.8 | 62.1 | 82.9 | 79.8 | 75.0 | 300.6 | ||||||||||||||||||
|
|
|
|
|
|
|
|
|
|
|
| |||||||||||||
Capital measures | ||||||||||||||||||||||||
Systemic reforms across Queensland’s criminal justice system |
| |||||||||||||||||||||||
Strategy to address over-representation of First Nations peoples; and establish Office of the Chief First Nations Justice Officer | — | 0.1 | — | — | — | 0.1 | ||||||||||||||||||
Improving court responses | ||||||||||||||||||||||||
State-wide plan to improve safety for DFV victims when attending courts | — | 3.4 | 6.3 | 20.0 | 19.4 | 49.1 | ||||||||||||||||||
Improving police responses to DFV | ||||||||||||||||||||||||
Trial and evaluate mobile co-responder models | — | 0.1 | — | — | — | 0.1 | ||||||||||||||||||
DFV and coercive-control training and education | — | 0.2 | — | — | — | 0.2 | ||||||||||||||||||
|
|
|
|
|
|
|
|
|
|
|
| |||||||||||||
Sub Total - Capital Measures | — | 3.8 | 6.3 | 20.0 | 19.4 | 49.5 | ||||||||||||||||||
|
|
|
|
|
|
|
|
|
|
|
| |||||||||||||
Total1,2,3 | 0.8 | 65.9 | 89.2 | 99.8 | 94.4 | 350.0 | ||||||||||||||||||
|
|
|
|
|
|
|
|
|
|
|
| |||||||||||||
Notes
| 1. | Figures shown are net additional funding, including funds held centrally, and may not sum due to rounding. |
| 2. | A further $12.9 million is being internally met by agencies. |
| 3. | $61.3 million per annum ongoing from 2026–27, including $2.8 million internally met. |
9
Budget Measures 2022-23
Queensland Resources Industry Development Plan
The government is committing $68.5 million over 5 years to implement the Queensland Resources Industry Development Plan (QRIDP). The package includes an additional $17.5 million over 4 years to enhance the Collaborative Exploration Initiative to aid mineral discoveries in Queensland.
Queensland’s resources industry has underpinned our state’s economic development and prosperity for more than a century. Key to the success of our resources industry has been its ability to evolve and diversify to meet the needs of Queensland and the wider global economy. The QRIDP is a 30-year vision for Queensland’s resources industry: to be a resilient, responsible and sustainable resources industry that grows as it transforms. It is a whole-of-government plan, with funding provided in this budget across 7 agencies as shown below, with further detail provided under each agency in Chapter 2 Expenses measures chapter.
| Table 1.2 | Queensland Resources Industry Development Plan package |
| 2022-23 $million | 2023-24 $million | 2024-25 $million | 2025-26 $million | 2026-27 $million | Total3 $million | |||||||||||||||||||
Department of Resources1 | 11.0 | 11.9 | 6.9 | 5.0 | 5.0 | 39.8 | ||||||||||||||||||
Department of Regional Development, Manufacturing and Water | 0.3 | 0.3 | — | — | — | 0.5 | ||||||||||||||||||
Department of State Development, Infrastructure, Local Government and Planning | 1.7 | 1.7 | 2.0 | 1.0 | 1.0 | 7.5 | ||||||||||||||||||
Department of Environment and Science | 0.7 | 0.7 | 0.7 | 0.7 | 0.7 | 3.5 | ||||||||||||||||||
Department of Employment, Small Business and Training | 1.6 | 1.3 | 0.2 | 0.2 | — | 3.3 | ||||||||||||||||||
Department of Justice and Attorney- General | 0.8 | 1.6 | 0.9 | — | — | 3.4 | ||||||||||||||||||
Department of Agriculture and Fisheries2 | — | — | — | — | — | — | ||||||||||||||||||
|
|
|
|
|
|
|
|
|
|
|
| |||||||||||||
Total3 | 16.2 | 17.4 | 10.7 | 6.9 | 6.7 | 58.0 | ||||||||||||||||||
|
|
|
|
|
|
|
|
|
|
|
| |||||||||||||
Notes:
| 1. | Figures shown are net additional funding and do not include existing funding of $5.1 million and a further $5 million internally met by the Department of Resources. |
| 2. | Funding of $0.4 million is being internally met by the Department of Agriculture and Fisheries. |
| 3. | Figures may not sum due to rounding. |
| 1.4 | Government Indexation Policy |
For the 2022–23 year, the government has set the Government Indexation Rate for fees and charges at 2.5 per cent. This is in line with government’s commitment to ease cost of living pressures and support the economic recovery from COVID-19.
10
Budget Measures 2022-23
| Table 1.3: | Expense measures since the 2021–22 Budget |
Expense measures up to and including 2021–22 Budget Update | 2021–22 $‘000 | 2022–23 $‘000 | 2023–24 $‘000 | 2024–25 $‘000 | 2025–26 $‘000 | |||||||||||||||
Department of Agriculture and Fisheries | ||||||||||||||||||||
Drought Assistance and Reform Package1 | — | 4,900 | 4,900 | 4,900 | 2,500 | |||||||||||||||
#PickQld Bonus | 1,980 | — | — | — | — | |||||||||||||||
Fire Ant Suppression Taskforce1 | 5,000 | — | — | — | — | |||||||||||||||
Pacific Australia Labour Mobility Scheme | — | — | — | — | — | |||||||||||||||
|
|
|
|
|
|
|
|
|
| |||||||||||
Portfolio Total | 6,980 | 4,900 | 4,900 | 4,900 | 2,500 | |||||||||||||||
|
|
|
|
|
|
|
|
|
| |||||||||||
Department of Children, Youth Justice and Multicultural Affairs | ||||||||||||||||||||
Family Support and Child Protection Reforms | — | 117,524 | 112,707 | 91,841 | 92,195 | |||||||||||||||
National Redress Scheme | — | 6,137 | 6,064 | 6,162 | 6,253 | |||||||||||||||
Child and Family Services—Child Safe Standards and Reportable Conduct Scheme | 218 | 227 | — | — | — | |||||||||||||||
|
|
|
|
|
|
|
|
|
| |||||||||||
Portfolio Total | 218 | 123,888 | 118,771 | 98,003 | 98,448 | |||||||||||||||
|
|
|
|
|
|
|
|
|
| |||||||||||
Department of Communities, Housing and Digital Economy | ||||||||||||||||||||
Neighbourhood and Community Centres | 557 | 619 | 619 | 619 | 619 | |||||||||||||||
Management and Matching of Donated Goods | — | 400 | 400 | 400 | 400 | |||||||||||||||
School Breakfast Program | — | 300 | 300 | 594 | 594 | |||||||||||||||
National Redress Scheme | — | 141 | 145 | 149 | 152 | |||||||||||||||
COVID-19 Support and Service Delivery Capacity and Capability1 | 1,394 | — | — | — | — | |||||||||||||||
Digitally Connected Regions | 1,919 | — | — | — | — | |||||||||||||||
Woodford Folk Festival | 1,000 | — | — | — | — | |||||||||||||||
|
|
|
|
|
|
|
|
|
| |||||||||||
Portfolio Total | 4,870 | 1,460 | 1,464 | 1,762 | 1,765 | |||||||||||||||
|
|
|
|
|
|
|
|
|
| |||||||||||
Department of Education | ||||||||||||||||||||
State Kindergarten Funding | — | 36,000 | 73,000 | 77,000 | 77,000 | |||||||||||||||
Early Childhood Education and Care—Regulation | — | 13,553 | 13,754 | 14,017 | 14,180 | |||||||||||||||
Youth Engagement Strategy | — | — | — | — | — | |||||||||||||||
|
|
|
|
|
|
|
|
|
| |||||||||||
Portfolio Total | — | 49,553 | 86,754 | 91,017 | 91,180 | |||||||||||||||
|
|
|
|
|
|
|
|
|
| |||||||||||
Department of Employment, Small Business and Training | ||||||||||||||||||||
Queensland Small Business Commissioner | — | 500 | 3,200 | 3,200 | 3,200 | |||||||||||||||
COVID-19 Business Support Grants | 400,000 | — | — | — | — | |||||||||||||||
COVID-19 Cleaning Rebate | 20,000 | — | — | — | — | |||||||||||||||
|
|
|
|
|
|
|
|
|
| |||||||||||
Portfolio Total | 420,000 | 500 | 3,200 | 3,200 | 3,200 | |||||||||||||||
|
|
|
|
|
|
|
|
|
| |||||||||||
Department of Energy and Public Works | ||||||||||||||||||||
Willows Sports Field1 | 14,500 | — | — | — | — | |||||||||||||||
|
|
|
|
|
|
|
|
|
| |||||||||||
Portfolio Total | 14,500 | — | — | — | — | |||||||||||||||
|
|
|
|
|
|
|
|
|
| |||||||||||
Department of Environment and Science | ||||||||||||||||||||
Cape York Peninsula National Park Joint Management | — | 5,709 | 5,262 | 6,374 | 1,149 | |||||||||||||||
Land Restoration Fund Program Management Office | — | 1,654 | 1,695 | 1,738 | 1,781 | |||||||||||||||
Community Sustainability Action Grants Program | — | 1,500 | 1,500 | 1,500 | 1,500 | |||||||||||||||
11
Budget Measures 2022-23
Expense measures up to and including 2021–22 Budget Update | 2021–22 $‘000 | 2022–23 $‘000 | 2023–24 $‘000 | 2024–25 $‘000 | 2025–26 $‘000 | |||||||||||||||
Eradication of Yellow Crazy Ants from Areas Within And Adjacent To The Wet Tropics World Heritage Area | — | — | — | — | — | |||||||||||||||
Protected Area Estate | — | — | — | — | — | |||||||||||||||
|
|
|
|
|
|
|
|
|
| |||||||||||
Portfolio Total | — | 8,863 | 8,457 | 9,612 | 4,430 | |||||||||||||||
|
|
|
|
|
|
|
|
|
| |||||||||||
Department of Justice and Attorney-General | ||||||||||||||||||||
Family Support and Child Protection Reforms | — | 12,553 | 12,553 | 12,553 | 12,553 | |||||||||||||||
Youth Sexual Violence and Abuse1 | — | 2,598 | 1,229 | — | — | |||||||||||||||
Women in Custody1 | — | 2,562 | — | — | — | |||||||||||||||
Perpetrator Intervention Initiatives1 | — | 868 | — | — | — | |||||||||||||||
Queensland Human Rights Commission—Base Operations | 340 | 296 | 362 | 433 | 508 | |||||||||||||||
Women with Disability and their Children Experiencing Domestic Violence | — | 265 | 313 | — | — | |||||||||||||||
Child Safe Standards and Reportable Conduct Scheme | 137 | 140 | — | — | — | |||||||||||||||
|
|
|
|
|
|
|
|
|
| |||||||||||
Portfolio Total | 477 | 19,282 | 14,457 | 12,986 | 13,061 | |||||||||||||||
|
|
|
|
|
|
|
|
|
| |||||||||||
Department of Regional Development, Manufacturing and Water | ||||||||||||||||||||
Permanent Establishment of the Manufacturing Hub Program | — | 4,376 | 4,424 | 4,469 | 4,479 | |||||||||||||||
Hydrology Modelling | 875 | 2,008 | 2,058 | 2,109 | — | |||||||||||||||
Queensland Water Regional Alliance Program | — | 2,000 | 2,000 | 2,000 | 2,000 | |||||||||||||||
Queensland Bulk Water Infrastructure Assessment | 300 | 1,600 | 1,900 | 1,700 | — | |||||||||||||||
Queensland Rural Water Compliance System | 196 | 1,397 | 1,913 | 1,430 | — | |||||||||||||||
Queensland Audit Office Dam Safety Regulation Recommendations | 615 | 1,129 | 829 | 829 | — | |||||||||||||||
State Council of River Trusts | — | 300 | — | — | — | |||||||||||||||
Regional Water Infrastructure: Cairns Water Security Program | — | — | — | — | — | |||||||||||||||
Regional Water Infrastructure: Hughenden Water Bank | — | — | — | — | — | |||||||||||||||
Regional Water Infrastructure: Lansdown Eco-Industrial Precinct (Enabling Infrastructure) | — | — | — | — | — | |||||||||||||||
Regional Water Infrastructure: Mt Morgan Pipeline | — | — | — | — | — | |||||||||||||||
|
|
|
|
|
|
|
|
|
| |||||||||||
Portfolio Total | 1,986 | 12,810 | 13,124 | 12,537 | 6,479 | |||||||||||||||
|
|
|
|
|
|
|
|
|
| |||||||||||
Department of Resources | ||||||||||||||||||||
Natural Resources Recovery Program | — | 10,000 | 10,000 | 10,000 | 10,000 | |||||||||||||||
Abandoned Mine Sites Program1 | 5,892 | 5,768 | — | — | — | |||||||||||||||
|
|
|
|
|
|
|
|
|
| |||||||||||
Portfolio Total | 5,892 | 15,768 | 10,000 | 10,000 | 10,000 | |||||||||||||||
|
|
|
|
|
|
|
|
|
| |||||||||||
Department of Seniors, Disability Services and Aboriginal and Torres Strait Islander Partnerships |
| |||||||||||||||||||
Youth Sexual Violence and Abuse | — | 51 | 191 | — | — | |||||||||||||||
Queensland Aboriginal and Torres Strait Islander Coalition | 355 | 690 | 692 | 693 | — | |||||||||||||||
National Redress Scheme | — | 161 | 164 | 169 | 173 | |||||||||||||||
Report 1, Hear Her Voice Response—Integrated Service System Responses and High Risk Teams in Additional Locations | — | 89 | 249 | 327 | 501 | |||||||||||||||
|
|
|
|
|
|
|
|
|
| |||||||||||
Portfolio Total | 355 | 991 | 1,296 | 1,189 | 674 | |||||||||||||||
|
|
|
|
|
|
|
|
|
| |||||||||||
Department of State Development, Infrastructure, Local Government and Planning |
| |||||||||||||||||||
Burdekin Shire Council Ayr Water Supply—Infrastructure (Stage 2) Project1 | — | — | — | — | — | |||||||||||||||
12
Budget Measures 2022-23
Expense measures up to and including 2021–22 Budget Update | 2021–22 $‘000 | 2022–23 $‘000 | 2023–24 $‘000 | 2024–25 $‘000 | 2025–26 $‘000 | |||||||||||||||
Queensland Regional Accommodation Centre | — | — | — | — | — | |||||||||||||||
|
|
|
|
|
|
|
|
|
| |||||||||||
Portfolio Total | — | — | — | — | — | |||||||||||||||
|
|
|
|
|
|
|
|
|
| |||||||||||
Department of the Premier and Cabinet | ||||||||||||||||||||
COVID-19 Economic Recovery Initiatives | 3,837 | — | — | — | — | |||||||||||||||
COVID-19 Vaccination Status Campaign | 2,500 | — | — | — | — | |||||||||||||||
|
|
|
|
|
|
|
|
|
| |||||||||||
Portfolio Total | 6,337 | — | — | — | — | |||||||||||||||
|
|
|
|
|
|
|
|
|
| |||||||||||
Department of Tourism, Innovation and Sport | ||||||||||||||||||||
Attracting Aviation Investment Fund | — | — | — | — | — | |||||||||||||||
Destination Gold Coast Play Money Campaign | 1,000 | — | — | — | — | |||||||||||||||
Great Barrier Reef Education Experience Program | — | — | — | — | — | |||||||||||||||
Marine Tourism Rebate Round 2 | 3,000 | — | — | — | — | |||||||||||||||
Tourism and Hospitality Sector Hardship Program1 | 110,000 | — | — | — | — | |||||||||||||||
Work in Paradise Campaign | 7,500 | — | — | — | — | |||||||||||||||
|
|
|
|
|
|
|
|
|
| |||||||||||
Portfolio Total | 121,500 | — | — | — | — | |||||||||||||||
|
|
|
|
|
|
|
|
|
| |||||||||||
Department of Transport and Main Roads | ||||||||||||||||||||
Operational Readiness of the New Generation Rollingstock Fleet for Cross River Rail and European Train Control System | — | 11,063 | 10,325 | 10,596 | 40,875 | |||||||||||||||
Zero Emission Vehicle Strategy 2022–32 and Action Plan 2022–241 | — | 1,000 | 3,000 | (4,000 | ) | — | ||||||||||||||
|
|
|
|
|
|
|
|
|
| |||||||||||
Portfolio Total | — | 12,063 | 13,325 | 6,596 | 40,875 | |||||||||||||||
|
|
|
|
|
|
|
|
|
| |||||||||||
Legislative Assembly of Queensland | ||||||||||||||||||||
Electorate Office Technology Model | — | 1,378 | 1,507 | 1,227 | 1,227 | |||||||||||||||
|
|
|
|
|
|
|
|
|
| |||||||||||
Portfolio Total | — | 1,378 | 1,507 | 1,227 | 1,227 | |||||||||||||||
|
|
|
|
|
|
|
|
|
| |||||||||||
Queensland Corrective Services | ||||||||||||||||||||
Women in Custody1 | — | 162 | — | — | — | |||||||||||||||
State-wide Women’s Re-entry Service | — | — | — | — | — | |||||||||||||||
|
|
|
|
|
|
|
|
|
| |||||||||||
Portfolio Total | — | 162 | — | — | — | |||||||||||||||
|
|
|
|
|
|
|
|
|
| |||||||||||
Queensland Fire and Emergency Services | ||||||||||||||||||||
COVID-19 Response | — | — | — | — | — | |||||||||||||||
|
|
|
|
|
|
|
|
|
| |||||||||||
Portfolio Total | — | — | — | — | — | |||||||||||||||
|
|
|
|
|
|
|
|
|
| |||||||||||
Queensland Health | ||||||||||||||||||||
Voluntary Assisted Dying Scheme1 | 104 | 634 | — | — | — | |||||||||||||||
COVID-19 Funding | 200,000 | — | — | — | — | |||||||||||||||
|
|
|
|
|
|
|
|
|
| |||||||||||
Portfolio Total | 200,104 | 634 | — | — | — | |||||||||||||||
|
|
|
|
|
|
|
|
|
| |||||||||||
Queensland Police Service | ||||||||||||||||||||
Queensland Police Service Response to COVID-19 | — | — | — | — | — | |||||||||||||||
Safe Night Precincts | 2,500 | — | — | — | — | |||||||||||||||
|
|
|
|
|
|
|
|
|
| |||||||||||
Portfolio Total | 2,500 | — | — | — | — | |||||||||||||||
|
|
|
|
|
|
|
|
|
| |||||||||||
13
Budget Measures 2022-23
Expense measures up to and including 2021–22 Budget Update | 2021–22 $‘000 | 2022–23 $‘000 | 2023–24 $‘000 | 2024–25 $‘000 | 2025–26 $‘000 | |||||||||||||||
Queensland Treasury | ||||||||||||||||||||
Sole Trader Grants | 41,339 | — | — | — | — | |||||||||||||||
|
|
|
|
|
|
|
|
|
| |||||||||||
Portfolio Total | 41,339 | — | — | — | — | |||||||||||||||
|
|
|
|
|
|
|
|
|
| |||||||||||
Total impact on Expense up to and including 2021–22 Budget Update | 827,058 | 252,252 | 277,255 | 253,029 | 273,839 | |||||||||||||||
14
Budget Measures 2022-23
Expense measures since 2021–22 Budget Update | 2021–22 $‘000 | 2022–23 $‘000 | 2023–24 $‘000 | 2024–25 $‘000 | 2025–26 $‘000 | |||||||||||||||
Department of Agriculture and Fisheries | ||||||||||||||||||||
Fire Ant Suppression Taskforce2 | — | 8,000 | 8,018 | 8,040 | 8,063 | |||||||||||||||
Queensland Feral Pest Initiative Round 7 | — | 1,000 | — | — | ||||||||||||||||
Queensland’s Obligations within the National Biosecurity System | — | 914 | 892 | — | — | |||||||||||||||
Queensland Country Women’s Association Building Restoration and Renovation | — | 500 | 500 | — | — | |||||||||||||||
Drought Assistance and Reform Package2 | — | — | — | — | — | |||||||||||||||
Queensland Resources Industry Development Plan (QRIDP) Package | — | — | — | — | — | |||||||||||||||
|
|
|
|
|
|
|
|
|
| |||||||||||
Portfolio Total | — | 10,414 | 9,410 | 8,040 | 8,063 | |||||||||||||||
|
|
|
|
|
|
|
|
|
| |||||||||||
Department of Children, Youth Justice and Multicultural Affairs | ||||||||||||||||||||
Child and Family Services—Out of Home Care | 170,000 | 500,000 | 500,000 | 500,000 | 500,000 | |||||||||||||||
Youth Justice Investment—Youth Detention Centre Staffing | — | 7,408 | 7,408 | 7,408 | 7,408 | |||||||||||||||
Youth Justice Investment—Indigenous Youth and Family Workers | — | 3,813 | 4,000 | 4,000 | 4,000 | |||||||||||||||
Youth Justice—Community Partnerships Innovation Grants | — | 3,013 | — | — | — | |||||||||||||||
Youth Justice Investment—Integrated Case Management | — | 2,132 | 2,100 | 2,170 | 2,236 | |||||||||||||||
Youth Justice Investment—Mount Isa Transitional Hub | — | 1,446 | 1,444 | 1,446 | 1,448 | |||||||||||||||
Youth Justice Investment—Family Led Decision Making | — | 1,280 | 1,280 | 1,280 | 1,280 | |||||||||||||||
Youth Justice Investment—Multi-agency Collaborative Panels | — | 1,200 | 1,178 | 1,258 | 1,331 | |||||||||||||||
Youth Justice Investment—Five Point Plan: Co-responder Model | — | 765 | — | — | — | |||||||||||||||
Youth Justice Investment—Program Management Office | — | 722 | 742 | 767 | 790 | |||||||||||||||
Multicultural Affairs—Australian South Sea Islander Peoples Support Plan | — | 467 | 265 | 166 | 170 | |||||||||||||||
Child and Family Services—Extended Post Care Support | — | 200 | — | — | 200 | |||||||||||||||
Report 1, Hear Her Voice Response—Integrated Service System Responses and High Risk Teams in Additional Locations | — | 154 | 431 | 501 | 805 | |||||||||||||||
Report 1, Hear Her Voice Response—Respectful Relationships Program for Young People Not in Formal Education | — | 150 | 150 | 150 | — | |||||||||||||||
|
|
|
|
|
|
|
|
|
| |||||||||||
Portfolio Total | 170,000 | 522,750 | 518,998 | 519,146 | 519,668 | |||||||||||||||
|
|
|
|
|
|
|
|
|
| |||||||||||
Department of Communities, Housing and Digital Economy | ||||||||||||||||||||
Strengthening Social Services in Queensland | — | 17,918 | 19,131 | 19,352 | 18,463 | |||||||||||||||
Grow 2022–2026 | — | 15,000 | 15,000 | 10,000 | 10,000 | |||||||||||||||
Queensland Performing Arts Centre | — | 2,000 | — | — | — | |||||||||||||||
Digitisation of the State’s Audio-Visual and Other Archival Public Records | — | 945 | 973 | 841 | 841 | |||||||||||||||
Queensland Cultural Centre—Capital Works, Asset Upgrades and Refurbishment Projects | — | 621 | 907 | 1,260 | 1,578 | |||||||||||||||
Storage for State Cultural Collections | — | 400 | — | — | — | |||||||||||||||
Report 1, Hear Her Voice Response—Integrated Service System Responses and High Risk Teams in Additional Locations | — | 89 | 249 | 327 | 501 | |||||||||||||||
Queensland Cultural Centre—Security Upgrades | — | 28 | 42 | 48 | 48 | |||||||||||||||
COVID-19 Support and Service Delivery Capacity and Capability2 | — | — | — | — | — | |||||||||||||||
Digital Economy—Foundations | 1,000 | — | — | — |
| — |
| |||||||||||||
Youth Homelessness and Housing | — | — | 8,068 | 8,991 | 9,959 | |||||||||||||||
|
|
|
|
|
|
|
|
|
| |||||||||||
Portfolio Total | 1,000 | 37,001 | 44,370 | 40,819 | 41,390 | |||||||||||||||
|
|
|
|
|
|
|
|
|
| |||||||||||
Department of Education | ||||||||||||||||||||
Asbestos Program | — | 25,765 | 26,553 | 27,366 | 28,203 | |||||||||||||||
15
Budget Measures 2022-23
Expense measures since 2021–22 Budget Update | 2021–22 $‘000 | 2022–23 $‘000 | 2023–24 $‘000 | 2024–25 $‘000 | 2025–26 $‘000 | |||||||||||||||
Transition to a New Students with Disability State School Resourcing Model | — | 13,974 | 40,296 | 26,322 | — | |||||||||||||||
Expansion of the Share the Dignity in Queensland Schools Initiative | — | 13,286 | — | — | — | |||||||||||||||
School Infrastructure—Renewal | 696 | 12,364 | 30,206 | — | — | |||||||||||||||
Youth Detention Centres—Staffing Ratio Change | 2,592 | 6,015 | 6,166 | 6,320 | 6,479 | |||||||||||||||
Report 1, Hear Her Voice Response—Respectful Relationships Education | — | 6,007 | 6,176 | 3,286 | — | |||||||||||||||
School Infrastructure—Growth | — | 5,386 | 4,104 | — | — | |||||||||||||||
School Security Program | — | 5,000 | 5,000 | 5,000 | 5,000 | |||||||||||||||
Infrastructure Portfolio Management | — | 2,504 | 6,535 | 8,930 | 11,258 | |||||||||||||||
Former Origin Greats—Achieving Results Through Indigenous Education Program | — | 1,609 | 1,609 | 1,609 | 804 | |||||||||||||||
Land Acquisition for New Schools | — | 916 | — | — | — | |||||||||||||||
Non-State Schools Accreditation Board | — | 648 | 663 | 678 | 694 | |||||||||||||||
School Playground and Tuckshop Upgrades | — | 500 | 4,500 | — | — | |||||||||||||||
Workplace Rights and Harmonious Industrial Relations Grant Program | — | 500 | 500 | 500 | 500 | |||||||||||||||
Building Future Schools Program | — | 478 | 1,309 | 10,209 | 4,781 | |||||||||||||||
Non-State Schools Transport Assistance Scheme | — | 450 | 458 | 465 | 473 | |||||||||||||||
Expansion of GPs in Schools Pilot | — | — | — | — | — | |||||||||||||||
|
|
|
|
|
|
|
|
|
| |||||||||||
Portfolio Total | 3,288 | 95,402 | 134,075 | 90,685 | 58,192 | |||||||||||||||
|
|
|
|
|
|
|
|
|
| |||||||||||
Department of Employment, Small Business and Training | ||||||||||||||||||||
Training and Future Skills Investment | — | 47,250 | 53,350 | — | — | |||||||||||||||
Queensland Resources Industry Development Plan (QRIDP) Package | — | 1,640 | 1,250 | 190 | 220 | |||||||||||||||
Small Business Support | — | 1,396 | 12,555 | 12,564 | 12,573 | |||||||||||||||
Tradies in Paradise Initiative | — | — | — | — | — | |||||||||||||||
|
|
|
|
|
|
|
|
|
| |||||||||||
Portfolio Total | — | 50,286 | 67,155 | 12,754 | 12,793 | |||||||||||||||
|
|
|
|
|
|
|
|
|
| |||||||||||
Department of Energy and Public Works | ||||||||||||||||||||
Willows Sports Field2 | (14,340 | ) | 14,340 | — | — | — | ||||||||||||||
Household Resilience Program Phase 3 | — | 8,000 | 12,000 | — | — | |||||||||||||||
Queensland Microgrid Pilot Fund | — | 5,000 | 5,000 | — | — | |||||||||||||||
Development of the Old Museum Building ahead of the 2032 Olympic and Paralympic Games in Brisbane | — | 3,130 | 1,500 | 1,500 | 1,500 | |||||||||||||||
Best Practice Prequalification System, including Subcontractors | — | 1,600 | 376 | 385 | 393 | |||||||||||||||
Continuation of the Safer Building Taskforce | — | 1,335 | — | — | — | |||||||||||||||
Government Employee Housing Sustainability Funding Model | — | 1,077 | 1,099 | — | — | |||||||||||||||
Drought Assistance and Reform Package | — | — | — | — | — | |||||||||||||||
|
|
|
|
|
|
|
|
|
| |||||||||||
Portfolio Total | (14,340 | ) | 34,482 | 19,975 | 1,885 | 1,893 | ||||||||||||||
|
|
|
|
|
|
|
|
|
| |||||||||||
Department of Environment and Science | ||||||||||||||||||||
Queensland’s Resource Recovery Sector Transformation | 672,400 | 47,348 | 105,458 | 75,386 | 63,617 | |||||||||||||||
Accelerating Climate Action | — | 9,487 | 13,661 | 4,722 | 4,730 | |||||||||||||||
Saving Queensland’s Koalas | — | 7,432 | 15,215 | 1,000 | 1,000 | |||||||||||||||
Saving Queensland’s Threatened Species | — | 4,968 | 7,729 | 1,000 | 1,000 | |||||||||||||||
Protected Area Investment and Management | — | 3,137 | 3,137 | 3,137 | 3,137 | |||||||||||||||
16
Budget Measures 2022-23
Expense measures since 2021–22 Budget Update | 2021–22 $‘000 | 2022–23 $‘000 | 2023–24 $‘000 | 2024–25 $‘000 | 2025–26 $‘000 | |||||||||||||||
Queensland Resources Industry Development Plan (QRIDP) Package | — | 666 | 682 | 700 | 717 | |||||||||||||||
|
|
|
|
|
|
|
|
|
| |||||||||||
Portfolio Total | 672,400 | 73,038 | 145,882 | 85,945 | 74,201 | |||||||||||||||
|
|
|
|
|
|
|
|
|
| |||||||||||
Department of Justice and Attorney-General | ||||||||||||||||||||
Achieving Justice System Efficiency—Contemporary Infrastructure and Technology | — | 28,765 | 43,897 | 7,222 | 7,230 | |||||||||||||||
Legal Aid Queensland Challenges—Meeting Non-Discretionary Demand and Scale of Fee Increases | — | 17,227 | 18,522 | 19,842 | 21,192 | |||||||||||||||
Report 1, Hear Her Voice Response—State-Wide Plan to Improve Safety for Domestic and Family Violence Victims when Attending Courts | — | 9,980 | 15,299 | 16,601 | 15,907 | |||||||||||||||
Report 1, Hear Her Voice Response—Perpetrator Programs and Related Initiatives | — | 6,800 | 7,398 | 6,380 | 4,935 | |||||||||||||||
Report 1, Hear Her Voice Response—Integrated Service System Responses and High Risk Teams in Additional Locations | — | 4,017 | 4,393 | 5,781 | 7,448 | |||||||||||||||
Report 1, Hear Her Voice Response—Continue to Roll Out Specialist Domestic and Family Violence Courts—Legal Aid Queensland | — | 3,249 | 5,876 | 6,022 | 6,173 | |||||||||||||||
Report 1, Hear Her Voice Response—Continue to Roll Out Specialist Domestic and Family Violence Courts | — | 3,111 | 6,720 | 8,825 | 9,959 | |||||||||||||||
Controlling Risks Associated with a Changing Gambling Environment | — | 3,089 | 2,205 | 1,105 | 1,051 | |||||||||||||||
Claim Farming—Legal Services Commission | 262 | 2,873 | 1,770 | — | — | |||||||||||||||
Queensland Human Rights Commission | — | 2,670 | 764 | 764 | 764 | |||||||||||||||
Report 1, Hear Her Voice Response—Raising Awareness and Understanding in the Community and Improving Primary Prevention | — | 2,601 | 5,434 | 4,502 | 3,749 | |||||||||||||||
Report 1, Hear Her Voice Response—Over Representation Strategy and Office of the Chief First Nations Justice Officer | — | 2,440 | 2,328 | 2,226 | 2,275 | |||||||||||||||
Report 1, Hear Her Voice Response—Ensure Data Collection and Reporting Capabilities within Relevant Agencies | — | 2,261 | 2,398 | 2,121 | 918 | |||||||||||||||
Blue Card Review Implementation | — | 2,009 | 737 | 737 | — | |||||||||||||||
Commission of Inquiry into Queensland’s Crime and Corruption Commission | 3,538 | 1,533 | — | — | — | |||||||||||||||
Report 1, Hear Her Voice Response—Enhancing the Domestic Family Violence Death Review Process in Queensland | — | 1,261 | 1,650 | 372 | — | |||||||||||||||
Queensland Family and Child Commission—Continued Funding to Support Operations | — | 1,234 | 1,264 | — | — | |||||||||||||||
Supporting the Office of the Director of Public Prosecutions Criminal Prosecution Functions in North Queensland | — | 1,218 | 1,225 | 1,254 | 1,284 | |||||||||||||||
Report 1, Hear Her Voice Response—Establish a Peak Industry Body for all Specialist Domestic Family Violence Services | — | 1,200 | 934 | 933 | 933 | |||||||||||||||
Report 1, Hear Her Voice Response—Immediate Legislative Amendments and Reforms | — | 1,017 | 1,042 | — | — | |||||||||||||||
Report 1, Hear Her Voice Response—Develop and Implement a Whole-of- Government Monitoring and Evaluation Framework | — | 1,000 | 500 | 500 | — | |||||||||||||||
Report 1, Hear Her Voice Response—Ongoing Evaluation of Key Initiatives | — | 1,000 | 2,000 | 2,000 | 2,000 | |||||||||||||||
Report 1, Hear Her Voice Response—Develop a 5-Year Whole of Government Domestic Family Violence Service System Strategic Investment Plan | — | 830 | 380 | — | — | |||||||||||||||
Queensland Resources Industry Development Plan (QRIDP) Package | — | 795 | 1,550 | 900 | — | |||||||||||||||
Critical Support for Queenslanders in Community Titles Developments | — | 782 | 833 | 840 | — | |||||||||||||||
Report 1, Hear Her Voice Response—Deliver 4-Phase Implementation Plan to Support Delivery of the Response | — | 699 | 1,716 | — | — | |||||||||||||||
Report 1, Hear Her Voice Response—Domestic and Family Violence Homicide and Suicide Data Set and Implementation Monitoring Framework | — | 357 | 488 | 348 | — | |||||||||||||||
Report 1, Hear Her Voice Response—Ongoing Training for Court Staff about Domestic and Family Violence | — | 250 | — | — | — | |||||||||||||||
Beaudesert Courthouse Replacement | — | 170 | 175 | 180 | 183 | |||||||||||||||
17
Budget Measures 2022-23
Expense measures since 2021–22 Budget Update | 2021–22 $‘000 | 2022–23 $‘000 | 2023–24 $‘000 | 2024–25 $‘000 | 2025–26 $‘000 | |||||||||||||||
Women in Custody2 | — | 157 | 2,763 | 2,843 | 2,925 | |||||||||||||||
Coroners Court Queensland—Enhanced Structural Supports | — | 153 | 157 | 161 | 165 | |||||||||||||||
Meriba Omasker Kaziw Kazipa (Torres Strait Islander Child Rearing Practices) Act 2020—Ongoing Implementation | — | 4 | 785 | — | — | |||||||||||||||
Criminal Justice Innovation Office | — | — | — | — | — | |||||||||||||||
Perpetrator Intervention Initiatives2 | — | — | 905 | 931 | 958 | |||||||||||||||
Report 1, Hear Her Voice Response—Aboriginal and Torres Strait Islander Domestic and Family Violence Responses | — | — | — | — | — | |||||||||||||||
Report 1, Hear Her Voice Response—Program Implementation, Governance and Coordination | — | — | — | — | — | |||||||||||||||
Report 1, Hear Her Voice Response—Review and Update the Domestic Violence and Family Protection Act 2012 Benchbook | — | — | 514 | — | — | |||||||||||||||
Report 1, Hear Her Voice Response—Trial and Evaluate Mobile Co-responder Models | — | — | — | — | — | |||||||||||||||
Youth Sexual Violence and Abuse2 | — | — | 2,329 | 2,396 | 2,466 | |||||||||||||||
|
|
|
|
|
|
|
|
|
| |||||||||||
Portfolio Total | 3,800 | 104,752 | 138,951 | 95,786 | 92,515 | |||||||||||||||
|
|
|
|
|
|
|
|
|
| |||||||||||
Department of Regional Development, Manufacturing and Water | ||||||||||||||||||||
Made in Queensland | — | 20,000 | 20,000 | — | — | |||||||||||||||
Cloncurry Community Service Obligation (CSO) Payments | — | 6,610 | 6,965 | 7,049 | 7,175 | |||||||||||||||
Sunwater Recreation Management Costs | — | 6,289 | 5,719 | 5,434 | 3,891 | |||||||||||||||
Rural Water Futures (RWF) Program (Stage 2) | — | 5,321 | 3,958 | — | — | |||||||||||||||
Manufacturing Hubs Grant Program | — | 5,000 | 5,000 | — | — | |||||||||||||||
Queensland Resources Industry Development Plan (QRIDP) Package | — | 250 | 250 | — | — | |||||||||||||||
|
|
|
|
|
|
|
|
|
| |||||||||||
Portfolio Total | — | 43,470 | 41,892 | 12,483 | 11,066 | |||||||||||||||
|
|
|
|
|
|
|
|
|
| |||||||||||
Department of Resources | ||||||||||||||||||||
Queensland Resources Industry Development Plan (QRIDP) Package | — | 10,986 | 11,900 | 6,900 | 5,000 | |||||||||||||||
Abandoned Mine Sites Program2 | (5,892 | ) | 444 | 5,448 | — | — | ||||||||||||||
|
|
|
|
|
|
|
|
|
| |||||||||||
Portfolio Total | (5,892 | ) | 11,430 | 17,348 | 6,900 | 5,000 | ||||||||||||||
|
|
|
|
|
|
|
|
|
| |||||||||||
Department of Seniors, Disability Services and Aboriginal and Torres Strait Islander Partnerships | ||||||||||||||||||||
Electricity Asset Ownership Dividend and Cost of Living Rebate | — | 385,000 | — | — | — | |||||||||||||||
Seniors Strategy and Addressing Gaps in Elder Abuse Prevention and Intervention Services | — | 3,655 | 2,845 | 2,845 | 2,845 | |||||||||||||||
Remote Indigenous Land and Infrastructure Program Office | — | 2,694 | 4,087 | 4,266 | 4,439 | |||||||||||||||
National Disability Insurance Scheme (NDIS) Worker Screening | — | 1,237 | 346 | — | — | |||||||||||||||
Closing the Gap | — | 1,094 | 536 | 731 | 741 | |||||||||||||||
Alcohol Management in Remote and Discrete Aboriginal and Torres Strait Islander Communities | — | — | — | — | — | |||||||||||||||
Disability Royal Commission | — | — | 555 | 285 | ||||||||||||||||
Economic Development Plans | — | — | — | — | — | |||||||||||||||
Meriba Omasker Kaziw Kazipa (Torres Strait Islander Child Rearing Practices) Act 2020 | — | — | 2,050 | — | — | |||||||||||||||
|
|
|
|
|
|
|
|
|
| |||||||||||
Portfolio Total | — | 393,680 | 10,419 | 8,127 | 8,025 | |||||||||||||||
|
|
|
|
|
|
|
|
|
| |||||||||||
18
Budget Measures 2022-23
Expense measures since 2021–22 Budget Update | 2021–22 $‘000 | 2022–23 $‘000 | 2023–24 $‘000 | 2024–25 $‘000 | 2025–26 $‘000 | |||||||||||||||
Department of State Development, Infrastructure, Local Government and Planning | ||||||||||||||||||||
Disaster Recovery Funding Arrangements Category C & D Extraordinary Packages | 115,700 | 574,034 | 262,954 | 123,992 | — | |||||||||||||||
Resilient Homes Fund | — | 188,300 | 369,500 | 183,200 | — | |||||||||||||||
National Battery Testing Centre | — | 15,000 | — | — | — | |||||||||||||||
Growth Area Program | — | 5,000 | 5,000 | — | — | |||||||||||||||
Operating Grant Funding Support to South Bank Corporation | 3,395 | 4,733 | — | — | — | |||||||||||||||
Enhance the Management of Grants and Contracts | 7,000 | 4,000 | — | — | — | |||||||||||||||
Sustainability of Queensland Local Governments | — | 3,000 | 1,000 | 1,000 | — | |||||||||||||||
Burdekin Shire Council Ayr Water Supply—Infrastructure (Stage 2) Project2 | — | 2,000 | — | — | — | |||||||||||||||
Queensland Resources Industry Development Plan (QRIDP) Package | — | 1,745 | 1,745 | 1,995 | 1,000 | |||||||||||||||
Growth Monitoring Program | — | 1,000 | 1,000 | 1,000 | 1,000 | |||||||||||||||
Expansion of the Translational Research Institute | — | — | — | — | — | |||||||||||||||
The South East Queensland City Deal | — | — | — | — | — | |||||||||||||||
|
|
|
|
|
|
|
|
|
| |||||||||||
Portfolio Total | 126,095 | 798,812 | 641,199 | 311,187 | 2,000 | |||||||||||||||
|
|
|
|
|
|
|
|
|
| |||||||||||
Department of the Premier and Cabinet | ||||||||||||||||||||
Brisbane 2032 Taskforce | — | 26,583 | 18,803 | 6,877 | 7,045 | |||||||||||||||
Screen Queensland—Far North Queensland Studio | 195 | 7,117 | 1,797 | 1,819 | 1,841 | |||||||||||||||
Report 1, Hear Her Voice Response—Commission of Inquiry into policing responses to domestic and family violence | 786 | 2,709 | — | — | — | |||||||||||||||
Go for Gold Fund (School Sports Infrastructure) | — | 500 | 5,000 | 9,750 | 9,750 | |||||||||||||||
2032 High Performance Strategy | — | — | 15,657 | 15,715 | — | |||||||||||||||
Events Sponsorship Fund | — | — | 3,500 | 3,500 | 3,500 | |||||||||||||||
|
|
|
|
|
|
|
|
|
| |||||||||||
Portfolio Total | 981 | 36,909 | 44,757 | 37,661 | 22,136 | |||||||||||||||
|
|
|
|
|
|
|
|
|
| |||||||||||
Department of Tourism, Innovation and Sport | ||||||||||||||||||||
Stadiums Queensland Operating Funding | — | 60,000 | 41,000 | 42,025 | 43,076 | |||||||||||||||
Activate! Queensland 2019–2029 | — | 23,677 | 25,000 | 3,000 | — | |||||||||||||||
Tourism Recovery and Development initiatives | 25,000 | 17,900 | 14,500 | 5,000 | — | |||||||||||||||
Tourism Business Financial Counselling Service | 700 | 2,240 | — | — | — | |||||||||||||||
Assistance Package for Brisbane River Commercial Tourism Boat Operators | — | 750 | 350 | — | — | |||||||||||||||
Tourism and Hospitality Sector Hardship Program2 | 27,000 | — | — | — | — | |||||||||||||||
|
|
|
|
|
|
|
|
|
| |||||||||||
Portfolio Total | 52,700 | 104,567 | 80,850 | 50,025 | 43,076 | |||||||||||||||
|
|
|
|
|
|
|
|
|
| |||||||||||
Department of Transport and Main Roads | ||||||||||||||||||||
Zero Emission Vehicle Strategy 2022–32 and Action Plan 2022–242 | — | 18,000 | 18,000 | 19,000 | — | |||||||||||||||
Camera Detected Offence Program | — | 15,738 | 16,448 | 15,544 | 14,565 | |||||||||||||||
School Transport Infrastructure Program | — | 10,000 | 10,000 | 10,000 | 10,000 | |||||||||||||||
Regional Urban Bus Base Budget Uplift | — | 6,720 | — | — | — | |||||||||||||||
Taxi Subsidy Scheme | — | 6,462 | 6,620 | 6,894 | 7,206 | |||||||||||||||
Maintenance and Management of Gold Coast Waterways Access, Connections and Destinations | — | 5,050 | 5,250 | 5,450 | 5,450 | |||||||||||||||
Bus Services—Priority Investment for Patronage Growth | — | 5,000 | 5,000 | 8,000 | 9,200 | |||||||||||||||
War on Wrecks (Addressing Derelict Vessels) | — | 5,000 | 5,000 | 5,000 | — | |||||||||||||||
19
Budget Measures 2022-23
Expense measures since 2021–22 Budget Update | 2021–22 $‘000 | 2022–23 $‘000 | 2023–24 $‘000 | 2024–25 $‘000 | 2025–26 $‘000 | |||||||||||||||
New Payment Rates for Government Contracted School Transport Delivery Partners (School Transport Assistance Scheme) | 1,877 | 3,754 | 6,676 | 9,671 | 12,740 | |||||||||||||||
Fare Reform for Queensland Regional Urban Bus Services to Support Smart Ticketing | 3,864 | 3,486 | 3,586 | 3,723 | 3,816 | |||||||||||||||
Maritime Infrastructure Program | — | 2,337 | 3,000 | — | — | |||||||||||||||
Operational Readiness of the New Generation Rollingstock Fleet for Cross River Rail Automatic Train Operation and Platform Screen Doors | 329 | 1,459 | 7,190 | 7,378 | 7,572 | |||||||||||||||
School Transport Assistance Scheme Funding for Students Living in Shared Care Arrangements | — | 526 | 7,109 | 6,079 | 5,197 | |||||||||||||||
Future South East Queensland Level Crossing Program | — | 500 | 500 | 500 | — | |||||||||||||||
School Crossing Supervisor Expansion Scheme | — | 301 | 736 | 1,045 | 1,071 | |||||||||||||||
Townsville Connection Road Bowen Road Bridge Duplication | — | 60 | 60 | 93 | 813 | |||||||||||||||
Long term Transport Infrastructure Commitments | — | — | — | — | 14,150 | |||||||||||||||
Rail Transport Service Contract | — | — | 37,351 | 125,567 | 157,026 | |||||||||||||||
|
|
|
|
|
|
|
|
|
| |||||||||||
Portfolio Total | 6,070 | 84,393 | 132,526 | 223,944 | 248,806 | |||||||||||||||
|
|
|
|
|
|
|
|
|
| |||||||||||
Legislative Assembly of Queensland | ||||||||||||||||||||
Legislative Assembly Supplementary Funding | — | 2,200 | 2,200 | 2,200 | 2,200 | |||||||||||||||
Electorate Office Security Upgrade (CCTV) | — | 49 | 171 | 171 | 171 | |||||||||||||||
|
|
|
|
|
|
|
|
|
| |||||||||||
Portfolio Total | — | 2,249 | 2,371 | 2,371 | 2,371 | |||||||||||||||
|
|
|
|
|
|
|
|
|
| |||||||||||
Office of the Governor | ||||||||||||||||||||
Security Upgrades at Government House | — | 1,833 | — | — | — | |||||||||||||||
Office of the Governor—Expanded Work Program | — | 638 | 652 | 666 | 680 | |||||||||||||||
|
|
|
|
|
|
|
|
|
| |||||||||||
Portfolio Total | — | 2,471 | 652 | 666 | 680 | |||||||||||||||
|
|
|
|
|
|
|
|
|
| |||||||||||
Queensland Corrective Services | ||||||||||||||||||||
Infrastructure Works | — | 32,800 | 14,000 | 14,000 | 14,000 | |||||||||||||||
Parole Board Queensland | — | 11,137 | 8,454 | 310 | 317 | |||||||||||||||
Queensland Parole System Review Report Recommendations | — | 10,679 | 10,819 | 5,962 | 6,108 | |||||||||||||||
Commissioning of Southern Queensland Correctional Precinct Stage 2 | — | 4,240 | 23,992 | — | — | |||||||||||||||
Psychological and Disability Services | — | 2,936 | — | — | — | |||||||||||||||
Report 1—Hear Her Voice Response—Continue to Roll Out Specialist Domestic and Family Violence Courts | — | 1,800 | 1,800 | 1,800 | 1,800 | |||||||||||||||
Electronic Security Upgrade | — | 1,000 | — | — | — | |||||||||||||||
Report 1, Hear Her Voice Response—Integrated Service System Responses and High Risk Teams in Additional Locations | — | 76 | 217 | 267 | 418 | |||||||||||||||
Integrated Offender Management System | — | — | — | — | — | |||||||||||||||
Queensland Corrective Services—Capacity Demands and COVID-19 | 50,000 | — | — | — | — | |||||||||||||||
Women in Custody2 | — | — | 167 | 172 | 176 | |||||||||||||||
|
|
|
|
|
|
|
|
|
| |||||||||||
Portfolio Total | 50,000 | 64,668 | 59,449 | 22,511 | 22,819 | |||||||||||||||
|
|
|
|
|
|
|
|
|
| |||||||||||
Queensland Fire and Emergency Services | ||||||||||||||||||||
Camera Detected Offence Program | — | 154 | 1,158 | 162 | 166 | |||||||||||||||
Queensland Emergency Operations Centre critical upgrade | — | — | — | — | — | |||||||||||||||
Supporting Volunteer Emergency Response Entities | — | — | — | — | — | |||||||||||||||
|
|
|
|
|
|
|
|
|
| |||||||||||
Portfolio Total | — | 154 | 1,158 | 162 | 166 | |||||||||||||||
|
|
|
|
|
|
|
|
|
| |||||||||||
20
Budget Measures 2022-23
Expense measures since 2021–22 Budget Update | 2021–22 $‘000 | 2022–23 $‘000 | 2023–24 $‘000 | 2024–25 $‘000 | 2025–26 $‘000 | |||||||||||||||
Queensland Health | ||||||||||||||||||||
Operational Growth Funding | — | 777,282 | 1,771,005 | 1,999,413 | 2,236,219 | |||||||||||||||
Mental Health, Alcohol and Other Drugs Services Funding | — | 119,871 | 301,353 | 397,550 | 407,677 | |||||||||||||||
Royal Flying Doctor Service | — | 25,201 | 28,190 | 31,808 | 32,664 | |||||||||||||||
Healthcare Services for Vulnerable Queenslanders | — | 14,720 | 22,553 | 23,981 | 26,662 | |||||||||||||||
Voluntary Assisted Dying Scheme2 | 3,228 | 5,380 | — | — | — | |||||||||||||||
Public Skin Cancer Prevention Campaign and Pop-up Clinics | — | 2,374 | 2,004 | 2,004 | 2,004 | |||||||||||||||
Infrastructure Maintenance Program | — | 1,547 | 301 | — | — | |||||||||||||||
Queensland Regional Aeromedical Hub | 15,420 | — | — | — | — | |||||||||||||||
Report 1, Hear Her Voice Response—Integrated Service System Responses and High Risk Teams in additional locations | — | — | — | — | — | |||||||||||||||
|
|
|
|
|
|
|
|
|
| |||||||||||
Portfolio Total | 18,648 | 946,375 | 2,125,406 | 2,454,756 | 2,705,226 | |||||||||||||||
|
|
|
|
|
|
|
|
|
| |||||||||||
Queensland Police Service | ||||||||||||||||||||
Queensland Government Air | — | 7,380 | — | — | — | |||||||||||||||
Youth Justice Investment—Five Point Plan | — | 3,484 | — | — | — | |||||||||||||||
Relocation of the Oxley Police Academy to Wacol | — | 2,000 | — | — | — | |||||||||||||||
QLiTE | 1,992 | 1,992 | 2,042 | 2,093 | 2,145 | |||||||||||||||
Replacement of Weapons Licensing Management System | — | 1,616 | — | — | — | |||||||||||||||
Camera Detected Offence Program | — | 1,514 | 1,890 | 2,274 | 2,668 | |||||||||||||||
Body Worn Camera Digital Capability | — | 1,031 | 4,943 | 5,338 | 5,338 | |||||||||||||||
Road Safety Anti Hooning Maximum Saturation Deterrence Trial | — | 911 | — | — | — | |||||||||||||||
Report 1, Hear Her Voice Response—Continue to Roll Out Specialist Domestic and Family Violence Courts | — | 322 | 684 | 1,094 | 1,121 | |||||||||||||||
Client Management System Program | — | — | — | — | — | |||||||||||||||
Electronic Monitoring of Adult Bailees | — | — | — | — | — | |||||||||||||||
Report 1, Hear Her Voice Response—Domestic and Family Violence and Coercive Control Training and Education | — | — | — | — | — | |||||||||||||||
Report 1, Hear Her Voice Response—Integrated Service System Responses and High Risk Teams in Additional Locations | — | — | — | — | — | |||||||||||||||
Report 1, Hear Her Voice Response—Review and Update of Domestic and Family Violence Operational Policy and Procedures and Risk Assessment Processes | — | — | — | — | — | |||||||||||||||
Report 1, Hear Her Voice Response—Trial and Evaluate Mobile Co-responder Models | — | — | — | — | — | |||||||||||||||
|
|
|
|
|
|
|
|
|
| |||||||||||
Portfolio Total | 1,992 | 20,250 | 9,559 | 10,799 | 11,272 | |||||||||||||||
|
|
|
|
|
|
|
|
|
| |||||||||||
Queensland Treasury | ||||||||||||||||||||
Queensland Trade and Investment Strategy 2022–2032 | — | 13,510 | 19,590 | 22,760 | 19,350 | |||||||||||||||
Camera Detected Offence Program | — | 2,024 | 1,997 | 1,997 | 1,997 | |||||||||||||||
Crime Statistics and Research Unit | — | 1,925 | 1,981 | 2,039 | 2,098 | |||||||||||||||
Local Government Authorities Debt Collection Services | — | 1,110 | — | — | — | |||||||||||||||
Community Housing Provider Development Program | — | — | — | — | — | |||||||||||||||
|
|
|
|
|
|
|
|
|
| |||||||||||
Portfolio Total | — | 18,569 | 23,568 | 26,796 | 23,445 | |||||||||||||||
|
|
|
|
|
|
|
|
|
| |||||||||||
21
Budget Measures 2022-23
Expense measures since 2021–22 Budget Update | 2021–22 $‘000 | 2022–23 $‘000 | 2023–24 $‘000 | 2024–25 $‘000 | 2025���26 $‘000 | |||||||||||||||
Total decisions made but not yet announced | — | 81,379 | 88,162 | 105,832 | 67,240 | |||||||||||||||
Total impact on Expense since 2021–22 Budget Update | 1,086,742 | 3,537,501 | 4,358,132 | 4,129,280 | 3,982,043 | |||||||||||||||
Total impact on Expense since the 2021–22 Budget | 1,913,800 | 3,789,753 | 4,635,387 | 4,382,309 | 4,255,882 | |||||||||||||||
| 1. | Further funding for this measure can be found in the Post Budget Update section of this table. |
| 2. | Further funding for this measure can be found in the up to and including Budget Update section of this table. |
22
Budget Measures 2022-23
| Table 1.4: | Capital measures since the 2021–22 Budget |
Capital measures up to and including 2021–22 Budget Update | 2021–22 $‘000 | 2022–23 $‘000 | 2023–24 $‘000 | 2024–25 $‘000 | 2025–26 $‘000 | |||||||||||||||
Department of Environment and Science | ||||||||||||||||||||
Cape York Peninsula National Park Joint Management | — | — | — | 20,000 | — | |||||||||||||||
Protected Area Estate | — | — | — | — | — | |||||||||||||||
|
|
|
|
|
|
|
|
|
| |||||||||||
Portfolio Total | — | — | — | 20,000 | — | |||||||||||||||
|
|
|
|
|
|
|
|
|
| |||||||||||
Department of State Development, Infrastructure, Local Government and Planning |
| |||||||||||||||||||
Queensland Regional Accommodation Centre | — | — | — | — | — | |||||||||||||||
The South East Queensland City Deal1 | — | — | — | — | — | |||||||||||||||
|
|
|
|
|
|
|
|
|
| |||||||||||
Portfolio Total | — | — | — | — | — | |||||||||||||||
|
|
|
|
|
|
|
|
|
| |||||||||||
Department of Transport and Main Roads | ||||||||||||||||||||
Operational Readiness of the New Generation Rollingstock Fleet for Cross River Rail and European Train Control System | 2,408 | 6,882 | 15,152 | 66,276 | 28,366 | |||||||||||||||
|
|
|
|
|
|
|
|
|
| |||||||||||
Portfolio Total | 2,408 | 6,882 | 15,152 | 66,276 | 28,366 | |||||||||||||||
|
|
|
|
|
|
|
|
|
| |||||||||||
Queensland Corrective Services | ||||||||||||||||||||
Expansion of the Southern Queensland Correctional Precinct Stage 2 to Over 1,500 Beds1 | — | — | — | — | — | |||||||||||||||
|
|
|
|
|
|
|
|
|
| |||||||||||
Portfolio Total | — | — | — | — | — | |||||||||||||||
|
|
|
|
|
|
|
|
|
| |||||||||||
Queensland Health | ||||||||||||||||||||
Voluntary Assisted Dying Scheme | 795 | 6,135 | — | — | — | |||||||||||||||
Logan Hospital Expansion | — | — | — | — | — | |||||||||||||||
Queensland Ambulance Critical Infrastructure1 | — | — | — | — | — | |||||||||||||||
|
|
|
|
|
|
|
|
|
| |||||||||||
Portfolio Total | 795 | 6,135 | — | — | — | |||||||||||||||
|
|
|
|
|
|
|
|
|
| |||||||||||
Total impact on Capital up to and including 2021–22 Budget Update | 3,203 | 13,017 | 15,152 | 86,276 | 28,366 | |||||||||||||||
23
Budget Measures 2022-23
| 2021–22 | 2022–23 | 2023–24 | 2024–25 | 2025–26 | ||||||||||||||||
Capital measures since 2021–22 Budget Update | $‘000 | $‘000 | $‘000 | $‘000 | $‘000 | |||||||||||||||
Department of Communities, Housing and Digital Economy | ||||||||||||||||||||
Queensland Cultural Centre—Capital Works, Asset Upgrades and Refurbishment Projects | — | 8,550 | 13,850 | 17,200 | 14,100 | |||||||||||||||
Strengthening Social Services in Queensland | — | 4,000 | 17,000 | 14,000 | 13,000 | |||||||||||||||
Realignment of Grey and Russell Street Intersection | — | 1,400 | — | — | — | |||||||||||||||
Queensland Cultural Centre—Security Upgrades | — | 1,300 | 1,300 | 910 | ||||||||||||||||
Digitisation of the State’s Audio-Visual and Other Archival Public Records | — | 400 | — | — | — | |||||||||||||||
|
|
|
|
|
|
|
|
|
| |||||||||||
Portfolio Total | — | 15,650 | 32,150 | 32,110 | 27,100 | |||||||||||||||
|
|
|
|
|
|
|
|
|
| |||||||||||
Department of Education | ||||||||||||||||||||
School Infrastructure—Renewal | 6,264 | 194,595 | 143,383 | 93,830 | 92,279 | |||||||||||||||
School Infrastructure—Growth | — | 61,941 | 47,193 | — | — | |||||||||||||||
Land Acquisition for New Schools | — | 54,887 | — | — | — | |||||||||||||||
Building Future Schools Program | — | 7,498 | 20,501 | 159,936 | 74,908 | |||||||||||||||
School Playground and Tuckshop Upgrades | — | 1,500 | 13,500 | — | — | |||||||||||||||
Expansion of GPs in Schools Pilot | — | — | — | — | — | |||||||||||||||
|
|
|
|
|
|
|
|
|
| |||||||||||
Portfolio Total | 6,264 | 320,421 | 224,577 | 253,766 | 167,187 | |||||||||||||||
|
|
|
|
|
|
|
|
|
| |||||||||||
Department of Energy and Public Works | ||||||||||||||||||||
Government Employee Housing Sustainability Funding Model | — | 87,776 | 134,433 | — | — | |||||||||||||||
Northern Queensland Renewable Energy Zone | 40,000 | — | — | — | — | |||||||||||||||
Pumped Hydro Energy Storage | 13,000 | — | — | — | — | |||||||||||||||
Thomas Dixon Centre Refurbishment | 48,627 | — | — | — | — | |||||||||||||||
|
|
|
|
|
|
|
|
|
| |||||||||||
Portfolio Total | 101,627 | 87,776 | 134,433 | — | — | |||||||||||||||
|
|
|
|
|
|
|
|
|
| |||||||||||
Department of Environment and Science | ||||||||||||||||||||
Protected Area Investment and Management | — | — | — | — | — | |||||||||||||||
|
|
|
|
|
|
|
|
|
| |||||||||||
Portfolio Total | — | — | — | — | — | |||||||||||||||
|
|
|
|
|
|
|
|
|
| |||||||||||
Department of Justice and Attorney-General | ||||||||||||||||||||
Achieving Justice System Efficiency—Contemporary Technology and Infrastructure—Capital | — | 6,712 | 13,266 | 13,075 | 13,075 | |||||||||||||||
Report 1, Hear Her Voice Response—State-Wide Plan to Improve Safety for Domestic and Family Violence Victims when Attending Court | — | 3,375 | 6,300 | 20,025 | 19,350 | |||||||||||||||
Beaudesert Courthouse Replacement | — | 1,924 | 4,682 | 14,521 | 319 | |||||||||||||||
Queensland Resources Industry Development Plan (QRIDP) Package | — | 155 | — | — | — | |||||||||||||||
Report 1, Hear Her Voice response—Over Representation Strategy and Office of the Chief First Nations Justice Officer | — | 113 | — | — | — | |||||||||||||||
Claim Farming—Legal Services Commission | — | 105 | — | — | — | |||||||||||||||
Commission of Inquiry into Queensland’s Crime and Corruption Commission | 333 | — | — | — | — | |||||||||||||||
Report 1, Hear Her Voice Response—Immediate Legislative Amendments and Reforms | — | — | — | — | — | |||||||||||||||
|
|
|
|
|
|
|
|
|
| |||||||||||
Portfolio Total | 333 | 12,384 | 24,248 | 47,621 | 32,744 | |||||||||||||||
|
|
|
|
|
|
|
|
|
| |||||||||||
Department of State Development, Infrastructure, Local Government and Planning |
| |||||||||||||||||||
Growth Area Program | — | 43,000 | 52,000 | 70,000 | — | |||||||||||||||
24
Budget Measures 2022-23
| 2021–22 | 2022–23 | 2023–24 | 2024–25 | 2025–26 | ||||||||||||||||
Capital measures since 2021–22 Budget Update | $‘000 | $‘000 | $‘000 | $‘000 | $‘000 | |||||||||||||||
Capital Grant Funding Support to South Bank Corporation | — | 3,085 | — | — | — | |||||||||||||||
The Spit Master Plan Implementation | 3,305 | 1,510 | 10,651 | (215 | ) | 249 | ||||||||||||||
The South East Queensland City Deal2 | — | — | — | — | — | |||||||||||||||
|
|
|
|
|
|
|
|
|
| |||||||||||
Portfolio Total | 3,305 | 47,595 | 62,651 | 69,785 | 249 | |||||||||||||||
|
|
|
|
|
|
|
|
|
| |||||||||||
Department of the Premier and Cabinet | ||||||||||||||||||||
Go for Gold Fund (School Sports Infrastructure) | — | 1,500 | 15,000 | 29,250 | 29,250 | |||||||||||||||
|
|
|
|
|
|
|
|
|
| |||||||||||
Portfolio Total | — | 1,500 | 15,000 | 29,250 | 29,250 | |||||||||||||||
|
|
|
|
|
|
|
|
|
| |||||||||||
Department of Tourism, Innovation and Sport | ||||||||||||||||||||
Activate! Queensland 2019–2029 | — | 5,000 | 13,500 | 10,000 | — | |||||||||||||||
Stadiums Queensland Capital Funding | — | 5,000 | 20,500 | 21,013 | 21,538 | |||||||||||||||
Wangetti Trail | — | — | — | — | — | |||||||||||||||
|
|
|
|
|
|
|
|
|
| |||||||||||
Portfolio Total | — | 10,000 | 34,000 | 31,013 | 21,538 | |||||||||||||||
|
|
|
|
|
|
|
|
|
| |||||||||||
Department of Transport and Main Roads | ||||||||||||||||||||
Operational Readiness of the New Generation Rollingstock Fleet for Cross River Rail Automatic Train Operation and Platform Screen Doors | 15,032 | 80,990 | 93,673 | 55,202 | 30,803 | |||||||||||||||
Maritime Infrastructure Program | — | 10,548 | — | — | — | |||||||||||||||
Camera Detected Offence Program | — | 5,500 | 5,500 | 5,000 | — | |||||||||||||||
Townsville Connection Road Bowen Road Bridge duplication | — | 1,940 | 1,940 | 3,007 | 26,287 | |||||||||||||||
Long-term Transport Infrastructure Commitments | — | — | — | — | 137,500 | |||||||||||||||
|
|
|
|
|
|
|
|
|
| |||||||||||
Portfolio Total | 15,032 | 98,978 | 101,113 | 63,209 | 194,590 | |||||||||||||||
|
|
|
|
|
|
|
|
|
| |||||||||||
Legislative Assembly of Queensland | ||||||||||||||||||||
Electorate Office Security Upgrade (CCTV) | — | 612 | — | — | — | |||||||||||||||
|
|
|
|
|
|
|
|
|
| |||||||||||
Portfolio Total | — | 612 | — | — | — | |||||||||||||||
|
|
|
|
|
|
|
|
|
| |||||||||||
Queensland Corrective Services | ||||||||||||||||||||
Expansion of the Southern Queensland Correctional Precinct Stage 2 to Over 1,500 Beds2 | — | 150,000 | 57,000 | — | — | |||||||||||||||
Infrastructure Works | — | 40,950 | 22,820 | 7,000 | 7,000 | |||||||||||||||
Electronic Security Upgrade | — | — | — | — | — | |||||||||||||||
Integrated Offender Management System | — | — | — | — | — | |||||||||||||||
|
|
|
|
|
|
|
|
|
| |||||||||||
Portfolio Total | — | 190,950 | 79,820 | 7,000 | 7,000 | |||||||||||||||
|
|
|
|
|
|
|
|
|
| |||||||||||
Queensland Health | ||||||||||||||||||||
Capacity Expansion Program | — | 85,300 | 991,700 | 1,606,000 | 3,025,000 | |||||||||||||||
Digital Hospital Electronic Medical Records System | — | 60,000 | 60,000 | 60,000 | 60,000 | |||||||||||||||
Infrastructure Maintenance Program | — | 15,647 | 54,193 | 18,312 | — | |||||||||||||||
Queensland Ambulance Critical Infrastructure2 | — | 13,442 | 35,907 | 18,067 | 6,500 | |||||||||||||||
Mental Health and Other Drug Services Capital Investment | — | 1,791 | 9,016 | 9,691 | 4,641 | |||||||||||||||
QEII Hospital Multi-storey Carpark | — | 1,500 | 15,000 | 13,310 | — | |||||||||||||||
Accelerated Infrastructure Delivery Program | — | — | — | — | — | |||||||||||||||
Building Rural and Remote Health program—Phase 2 | — | — | — | — | — | |||||||||||||||
25
Budget Measures 2022-23
| 2021–22 | 2022–23 | 2023–24 | 2024–25 | 2025–26 | ||||||||||||||||
Capital measures since 2021–22 Budget Update | $‘000 | $‘000 | $‘000 | $‘000 | $‘000 | |||||||||||||||
Queensland Regional Aeromedical Hub | 24,849 | — | — | — | — | |||||||||||||||
|
|
|
|
|
|
|
|
|
| |||||||||||
Portfolio Total | 24,849 | 177,680 | 1,165,816 | 1,725,380 | 3,096,141 | |||||||||||||||
|
|
|
|
|
|
|
|
|
| |||||||||||
Queensland Police Service | ||||||||||||||||||||
Road Safety Anti Hooning Maximum Saturation Deterrence Trial | — | 5,160 | — | — | — | |||||||||||||||
Queensland Government Air | — | 2,941 | — | — | — | |||||||||||||||
Report 1, Hear Her Voice Response—Domestic and Family Violence and Coercive Control Training and Education | — | — | — | — | — | |||||||||||||||
Report 1, Hear Her Voice Response—Review and Update of Domestic and Family Violence Operational Policy and Procedures and Risk Assessment Processes | — | — | — | — | — | |||||||||||||||
Report 1, Hear Her Voice Response—Trial and Evaluate Mobile Co-responder Models | — | — | — | — | — | |||||||||||||||
|
|
|
|
|
|
|
|
|
| |||||||||||
Portfolio Total | — | 8,101 | — | — | — | |||||||||||||||
|
|
|
|
|
|
|
|
|
| |||||||||||
Total decisions made but not yet announced | — | 225 | 740 | — | — | |||||||||||||||
Total impact on Capital since 2021–22 Budget Update | 151,410 | 971,872 | 1,874,548 | 2,259,134 | 3,575,799 | |||||||||||||||
Total impact on Capital since the 2021–22 Budget | 154,613 | 984,889 | 1,889,700 | 2,345,410 | 3,604,165 | |||||||||||||||
| 1. | Further funding for this measure can be found in the Post Budget Update section of this table. |
| 2. | Further funding for this measure can be found in the up to and including Budget Update section of this table. |
26
Budget Measures 2022-23
| Table 1.5: | Revenue measures since the 2021–22 Budget |
2021–22 | 2022–23 | 2023–24 | 2024–25 | 2025–26 | ||||||||||||||||
Revenue measures since the 2021–22 Budget1 | $‘000 | $‘000 | $‘000 | $‘000 | $‘000 | |||||||||||||||
Department of Regional Development, Manufacturing and Water | ||||||||||||||||||||
Drought Assistance and Reform Package | — | — | — | — | — | |||||||||||||||
|
|
|
|
|
|
|
|
|
| |||||||||||
Portfolio Total | — | — | — | — | — | |||||||||||||||
|
|
|
|
|
|
|
|
|
| |||||||||||
Department of Resources | ||||||||||||||||||||
Drought Assistance and Reform Package | — | — | — | — | — | |||||||||||||||
|
|
|
|
|
|
|
|
|
| |||||||||||
Portfolio Total | — | — | — | — | — | |||||||||||||||
|
|
|
|
|
|
|
|
|
| |||||||||||
Queensland Health | ||||||||||||||||||||
Fee Alignment Cost Recovery for Healthcare Services Provided to Australian Defence Force Personnel | — | 2,368 | 2,463 | 2,563 | 2,666 | |||||||||||||||
|
|
|
|
|
|
|
|
|
| |||||||||||
Portfolio Total | — | 2,368 | 2,463 | 2,563 | 2,666 | |||||||||||||||
|
|
|
|
|
|
|
|
|
| |||||||||||
Queensland Treasury | ||||||||||||||||||||
Progressive Coal Royalty Rates | — | 764,807 | 126,549 | 138,693 | 146,226 | |||||||||||||||
Payroll Tax—Mental Health Levy | — | 183,776 | 390,340 | 407,515 | 425,446 | |||||||||||||||
Betting Tax Reform | — | 40,000 | 80,000 | 80,000 | 80,000 | |||||||||||||||
Additional Foreign Acquirer Duty Exemption for Retirement Visa | — | (150 | ) | (300 | ) | (300 | ) | (300 | ) | |||||||||||
Holders Payroll Tax Extending Deduction Phase Out | — | (30,000 | ) | (60,000 | ) | (60,000 | ) | (60,000 | ) | |||||||||||
Payroll Tax Apprentice and Trainee Rebate | — | (32,200 | ) | — | — | — | ||||||||||||||
|
|
|
|
|
|
|
|
|
| |||||||||||
Portfolio Total | — | 926,233 | 536,589 | 565,908 | 591,372 | |||||||||||||||
|
|
|
|
|
|
|
|
|
| |||||||||||
Total decisions made but not yet announced | — | — | — | — | — | |||||||||||||||
Total impact on Revenue since the 2021–22 Budget | — | 928,601 | 539,052 | 568,471 | 594,038 | |||||||||||||||
| 1. | There were no revenue measures up to and including 2021–22 Budget Update. |
27
Budget Measures 2022-23
| 2 | Expense Measures |
Introduction
The following tables present the relevant portfolio expense measures relating to decisions taken since the 2021–22 Budget. This does not represent the full amount of additional funding provided to agencies since the 2021–22 Budget. For further explanation, refer to Explanation of Scope and Terms in Chapter 1.
28
Budget Measures 2022-23
Department of Agriculture and Fisheries
| 2021–22 | 2022–23 | 2023–24 | 2024–25 | 2025–26 | ||||||||||||||||
| $‘000 | $‘000 | $‘000 | $‘000 | $‘000 | ||||||||||||||||
Fire Ant Suppression Taskforce | 5,000 | 8,000 | 8,018 | 8,040 | 8,063 | |||||||||||||||
The government is providing additional funding of $37.1 million over 5 years to establish a joint taskforce to oversee red imported fire ant suppression activities by local governments, industry and Queensland Government, including the provision of bait. This demonstrates to our partners, the Australian Government and other states and territories, Queensland’s commitment to the National Red Imported Fire Ant Eradication Program.
| 2021–22 | 2022–23 | 2023–24 | 2024–25 | 2025–26 | ||||||||||||||||
| $‘000 | $‘000 | $‘000 | $‘000 | $‘000 | ||||||||||||||||
Drought Assistance and Reform Package | — | 4,900 | 4,900 | 4,900 | 2,500 | |||||||||||||||
The government is providing additional funding of $17.2 million over 4 years to continue drought reforms to enhance resilience in a changing climate. This includes the Drought and Climate Adaptation Program, the Farm Business Resilience Program and the Regional Drought Resilience Program. Two of these schemes, the Farm Business Resilience Program and the Regional Drought Resilience Program, have been matched by the Australian Government.
In addition, the government is also providing increased funding of up to $3.2 million (totalling up to $13 million) over 4 years from 2022–23, held centrally, for the Drought Relief Assistance Scheme to maintain existing drought assistance including freight subsidies and emergency water infrastructure rebates.
The Drought Assistance and Reform Package is a total of up to $79.6 million over 4 years from 2022–23 to support drought affected communities across the state (and $150 million over 3 years from 2022–23 for drought preparedness and emergency drought assistance loans). Further details can be found in the Department of Energy and Public Works section of this chapter and the Department of Regional Development, Manufacturing and Water and the Department of Resources sections of Chapter 4 Revenue measures.
29
Budget Measures 2022-23
| 2021–22 | 2022–23 | 2023–24 | 2024–25 | 2025–26 | ||||||||||||||||
| $‘000 | $‘000 | $‘000 | $‘000 | $‘000 | ||||||||||||||||
Queensland Feral Pest Initiative Round 7 | — | 1,000 | — | — | — | |||||||||||||||
The government is providing increased funding of $1 million in 2022–23 for Round 7 of the Queensland Feral Pest Initiative to support the management of invasive plants and animals.
| 2021–22 | 2022–23 | 2023–24 | 2024–25 | 2025–26 | ||||||||||||||||
| $‘000 | $‘000 | $‘000 | $‘000 | $‘000 | ||||||||||||||||
Queensland’s Obligations within the National Biosecurity System | — | 914 | 892 | — | — | |||||||||||||||
The government is providing increased funding of $1.8 million over 2 years to meet immediate and known obligations within the National Biosecurity System.
The government is also providing increased funding of up to $6 million over 4 years from 2022–23 and $1.5 million per annum ongoing, held centrally, towards future obligations to help mitigate the risks and impacts of significant pests and diseases.
Total funding for this initiative is up to $7.8 million over 4 years from 2022–23 and $1.5 million per annum ongoing.
| 2021–22 | 2022–23 | 2023–24 | 2024–25 | 2025–26 | ||||||||||||||||
| $‘000 | $‘000 | $‘000 | $‘000 | $‘000 | ||||||||||||||||
Queensland Country Women’s Association Building Restoration and Renovation | — | 500 | 500 | — | — | |||||||||||||||
The government is providing increased funding of $1 million over 2 years for the Queensland Country Women’s Association to continue minor works upgrades to infrastructure, including community halls.
30
Budget Measures 2022-23
| 2021–22 | 2022–23 | 2023–24 | 2024–25 | 2025–26 | ||||||||||||||||
| $‘000 | $‘000 | $‘000 | $‘000 | $‘000 | ||||||||||||||||
#PickQld Bonus | 1,980 | — | — | — | — | |||||||||||||||
The government has provided increased funding of $2 million in 2021–22 to deliver the #PickQld Bonus (formally the Back to Work in Agriculture Incentive Scheme), an incentive to new workers to help fill the urgent and immediate agriculture workforce shortfall to deliver food security and maintain industry viability.
| 2021–22 | 2022–23 | 2023–24 | 2024–25 | 2025–26 | ||||||||||||||||
| $‘000 | $‘000 | $‘000 | $‘000 | $‘000 | ||||||||||||||||
Pacific Australia Labour Mobility Scheme | — | — | — | — | — | |||||||||||||||
The government is providing increased funding of up to $2.6 million in 2022–23, held centrally, to enhance implementation of the Australian Government’s Pacific Australia Labour Mobility Scheme (which replaces the former Pacific Labour Scheme and Seasonal Worker Programme). This scheme helps fill agricultural employment gaps in regional areas.
| 2021–22 | 2022–23 | 2023–24 | 2024–25 | 2025–26 | ||||||||||||||||
| $‘000 | $‘000 | $‘000 | $‘000 | $‘000 | ||||||||||||||||
Queensland Resources Industry Development Plan (QRIDP) Package | — | — | — | — | — | |||||||||||||||
Funding of $371,000 in 2022–23 is being met internally by the department to lead a review of the agricultural land use classifications as they relate to coexistence outcomes.
This forms part of the government’s commitment to a $68.5 million package over 5 years to support implementation of the final QRIDP across government. Further details on initiatives can be found in the Department of Resources, Department of State Development, Infrastructure, Local Government and Planning, Department of Environment and Science, Department of Employment, Small Business and Training, Department of Justice and the Attorney General, and Department of Regional Development, Manufacturing and Water sections of this chapter.
31
Budget Measures 2022-23
Department of Children, Youth Justice and Multicultural Affairs
| 2021–22 | 2022–23 | 2023–24 | 2024–25 | 2025–26 | ||||||||||||||||
| $‘000 | $‘000 | $‘000 | $‘000 | $‘000 | ||||||||||||||||
Child and Family Services - Out of Home Care | 170,000 | 500,000 | 500,000 | 500,000 | 500,000 | |||||||||||||||
The government is providing increased funding of $2.2 billion over 5 years and $500 million per annum ongoing for out of home care services in response to significant, ongoing pressures arising from an increase in demand in the child protection system.
| 2021–22 | 2022–23 | 2023–24 | 2024–25 | 2025–26 | ||||||||||||||||
| $‘000 | $‘000 | $‘000 | $‘000 | $‘000 | ||||||||||||||||
Family Support and Child Protection Reforms | — | 117,524 | 112,707 | 91,841 | 92,195 | |||||||||||||||
The government is providing increased funding of $414.3 million over 4 years and $92.2 million per annum ongoing to continue to promote a whole of government approach towards meeting the needs of Queensland children, young people and families experiencing vulnerability by delivering on family support and child protection reforms through the Supporting Families Changing Futures program. Further funding of $6 million over 2 years from 2022–23 is being met internally by the department.
This forms part of the government’s total funding of $470.4 million over 4 years ($464.5 million new funding and $6 million being met internally) and $104.7 million per annum ongoing for continuation of Supporting Families Changing Futures initiatives. Further details can be found in the Department of Justice and Attorney-General section of this chapter.
This funding will support a number of programs including $183.5 million over 4 years and $45.9 million per annum ongoing for the Intensive Family Support services to continue early intervention support services for families and parents who are experiencing vulnerability and have more complex needs and $66.9 million over 4 years and $16.7 million per annum ongoing for the Aboriginal and Torres Strait Islander Family Wellbeing Services.
32
Budget Measures 2022-23
| 2021–22 | 2022–23 | 2023–24 | 2024–25 | 2025–26 | ||||||||||||||||
| $‘000 | $‘000 | $‘000 | $‘000 | $‘000 | ||||||||||||||||
Youth Justice Investment - Youth Detention Centre Staffing | — | 7,408 | 7,408 | 7,408 | 7,408 | |||||||||||||||
The government is providing increased funding of $29.6 million over 4 years and $7.4 million per annum ongoing to establish a permanent staffing model for youth detention centres to ensure necessary staffing levels are maintained while centres continue operating near or at capacity.
This forms part of the government’s total funding of $78.8 million over 4 years ($77.2 million new funding and $1.6 million being met internally) and $18.9 million per annum ongoing ($18.5 million new funding and $400,000 being met internally) to continue Youth Justice Strategy reforms. Further details can be found in the Queensland Police Service section of this chapter.
| 2021–22 | 2022–23 | 2023–24 | 2024–25 | 2025–26 | ||||||||||||||||
| $‘000 | $‘000 | $‘000 | $‘000 | $‘000 | ||||||||||||||||
National Redress Scheme | — | 6,137 | 6,064 | 6,162 | 6,253 | |||||||||||||||
The government is providing increased funding of $24.6 million over 4 years to continue operationalisation of the National Redress Scheme for survivors of institutional child sexual abuse in Queensland.
This forms part of the government’s total funding of $25.9 million over 4 years for this initiative. Further details can be found in the Department of Seniors, Disability Services and Aboriginal and Torres Strait Islander Partnerships and Department of Communities, Housing and Digital Economy sections of this chapter.
33
Budget Measures 2022-23
| 2021–22 $‘000 | 2022–23 $‘000 | 2023–24 $‘000 | 2024–25 $‘000 | 2025–26 $‘000 | ||||||||||||||||
Youth Justice Investment - Indigenous Youth and Family Workers | — | 3,813 | 4,000 | 4,000 | 4,000 | |||||||||||||||
The government is providing increased funding of $15.8 million over 4 years and $4 million per annum ongoing to continue the Indigenous Youth and Family Worker initiative which responds to families where children are at risk of contact or are already in contact with the youth justice system, especially those at risk of being remanded.
This forms part of the government’s total funding of $78.8 million over 4 years ($77.2 million new funding and $1.6 million being met internally) and $18.9 million per annum ongoing ($18.5 million new funding and $400,000 being met internally) to continue Youth Justice Strategy Reforms. Further details can be found in the Queensland Police Service section of this chapter.
| 2021–22 $‘000 | 2022–23 $‘000 | 2023–24 $‘000 | 2024–25 $‘000 | 2025–26 $‘000 | ||||||||||||||||
Youth Justice - Community Partnerships Innovation Grants | — | 3,013 | — | — | — | |||||||||||||||
The government is providing additional funding of $3 million in 2022–23 to continue the Community Partnership Innovation Grant scheme for projects focussed on young people who are, or could become, high risk offenders.
| 2021–22 $‘000 | 2022–23 $‘000 | 2023–24 $‘000 | 2024–25 $‘000 | 2025–26 $‘000 | ||||||||||||||||
Youth Justice Investment - Integrated Case Management | — | 2,132 | 2,100 | 2,170 | 2,236 | |||||||||||||||
The government is providing increased funding of $8.6 million over 4 years and $2.2 million per annum ongoing to continue service responses to reduce and prevent future offending by high-risk offenders.
This forms part of the government’s total funding of $78.8 million over 4 years ($77.2 million new funding and $1.6 million being met internally) and $18.9 million per annum ongoing ($18.5 million new funding and $400,000 being met internally) to continue Youth Justice Strategy reforms. Further details can be found in the Queensland Police Service section of this chapter.
34
Budget Measures 2022-23
| 2021–22 $‘000 | 2022–23 $‘000 | 2023–24 $‘000 | 2024–25 $‘000 | 2025–26 $‘000 | ||||||||||||||||
Youth Justice Investment - Mount Isa Transitional Hub | — | 1,446 | 1,444 | 1,446 | 1,448 | |||||||||||||||
The government is providing increased funding of $5.8 million over 4 years and $1.4 million per annum ongoing (a further $1.6 million over 4 years and $400,000 per annum ongoing are being met internally by the department) for the Mount Isa Transitional Hub. This diverts young people from the youth justice system by responding to young people on the streets at night who are at risk of reoffending.
This forms part of the government’s total funding of $78.8 million over 4 years ($77.2 million new funding and $1.6 million being met internally) and $18.9 million per annum ongoing ($18.5 million new funding and $400,000 being met internally) to continue Youth Justice Strategy reforms. Further details can be found in the Queensland Police Service section of this chapter.
| 2021–22 $‘000 | 2022–23 $‘000 | 2023–24 $‘000 | 2024–25 $‘000 | 2025–26 $‘000 | ||||||||||||||||
Youth Justice Investment - Family Led Decision Making | — | 1,280 | 1,280 | 1,280 | 1,280 | |||||||||||||||
The government is providing increased funding of $5.1 million over 4 years and $1.3 million per annum ongoing for Family Led Decision Making which empowers Aboriginal and Torres Strait Islander families in decision-making and identifying solutions to address the young person’s offending behaviour.
This forms part of the government’s total funding of $78.8 million over 4 years ($77.2 million new funding and $1.6 million being met internally) and $18.9 million per annum ongoing ($18.5 million new funding and $400,000 being met internally) to continue Youth Justice Strategy reforms. Further details can be found in the Queensland Police Service section of this chapter.
35
Budget Measures 2022-23
| 2021–22 $‘000 | 2022–23 $‘000 | 2023–24 $‘000 | 2024–25 $‘000 | 2025–26 $‘000 | ||||||||||||||||
Youth Justice Investment - Multi-agency Collaborative Panels | — | 1,200 | 1,178 | 1,258 | 1,331 | |||||||||||||||
The government is providing increased funding of $5 million over 4 years and $1.3 million per annum ongoing to repurpose Specialist Multi Agency Response Teams into statewide multi-agency Collaborative Panels to address serious repeat offenders.
This forms part of the government’s total funding of $78.8 million over 4 years ($77.2 million new funding and $1.6 million being met internally) and $18.9 million per annum ongoing ($18.5 million new funding and $400,000 being met internally) to continue Youth Justice Strategy reforms. Further details can be found in the Queensland Police Service section of this chapter.
| 2021–22 $‘000 | 2022–23 $‘000 | 2023–24 $‘000 | 2024–25 $‘000 | 2025–26 $‘000 | ||||||||||||||||
Youth Justice Investment - Five Point Plan: Co-responder Model | — | 765 | — | — | — | |||||||||||||||
The government is providing increased funding of $765,000 in 2022–23 to continue to deliver a co-responder model with the Queensland Police Service to deal with or divert high risk young people. This forms part of total increased funding of $1.3 million for the co-responder model under the Five Point Plan.
This forms part of the government’s total funding of $78.8 million over 4 years ($77.2 million new funding and $1.6 million being met internally) and $18.9 million per annum ongoing ($18.5 million new funding and $400,000 being met internally) to continue Youth Justice Strategy reforms. Further details can be found in the Queensland Police Service section of this chapter.
36
Budget Measures 2022-23
| 2021–22 $‘000 | 2022–23 $‘000 | 2023–24 $‘000 | 2024–25 $‘000 | 2025–26 $‘000 | ||||||||||||||||
Youth Justice Investment - Program Management Office | — | 722 | 742 | 767 | 790 | |||||||||||||||
The government is providing increased funding of $3 million over 4 years and $790,000 per annum ongoing to establish a permanent Youth Justice Program Management Office. The office will oversee and inform the delivery of youth justice initiatives which is critical for ensuring the robustness of the youth justice investment.
This forms part of the government’s total funding of $78.8 million over 4 years ($77.2 million new funding and $1.6 million being met internally) and $18.9 million per annum ongoing ($18.5 million new funding and $400,000 being met internally) to continue Youth Justice Strategy reforms. Further details can be found in the Queensland Police Service section of this chapter.
| 2021–22 $‘000 | 2022–23 $‘000 | 2023–24 $‘000 | 2024–25 $‘000 | 2025–26 $‘000 | ||||||||||||||||
Multicultural Affairs - Australian South Sea Islander Peoples Support Plan | — | 467 | 265 | 166 | 170 | |||||||||||||||
The government is providing additional funding of $1.1 million over 4 years and $170,000 per annum ongoing to support and engage with the Australian South Sea Islander community.
| 2021–22 $‘000 | 2022–23 $‘000 | 2023–24 $‘000 | 2024–25 $‘000 | 2025–26 $‘000 | ||||||||||||||||
Child and Family Services - Child Safe Standards and Reportable Conduct Scheme | 218 | 227 | — | — | — | |||||||||||||||
The government is providing increased funding of $445,000 over 2 years to continue work on development of options for implementation of child safe standards and a reportable conduct scheme for Queensland.
This forms part of the government’s total funding of $722,000 over 2 years to continue this initiative. Further details can be found in the Department of Justice and Attorney-General section of this chapter.
37
Budget Measures 2022-23
| 2021–22 $‘000 | 2022–23 $‘000 | 2023–24 $‘000 | 2024–25 $‘000 | 2025–26 $‘000 | ||||||||||||||||
Child and Family Services - Extended Post Care Support | — | 200 | — | — | 200 | |||||||||||||||
The government is providing additional funding of $400,000 over 4 years from 2022–23 to support implementation and evaluation activities to extend support to young people leaving care. From 2023–24, carers will continue to receive allowances for 19 to 21 year olds remaining at home while young people aged 18 to 21 years leaving non family-based care will be mentored and supported financially by non-government organisations to live independently. Funding for allowances and support is held centrally from 2023–24.
| 2021–22 $‘000 | 2022–23 $‘000 | 2023–24 $‘000 | 2024–25 $‘000 | 2025–26 $‘000 | ||||||||||||||||
Report 1, Hear Her Voice Response - Integrated Service System Responses and High Risk Teams in Additional Locations | — | 154 | 431 | 501 | 805 | |||||||||||||||
The government is providing increased funding of $1.9 million over 4 years and $805,000 per annum ongoing to roll out integrated service system responses and high risk teams in additional locations.
Further details of this funding can be found in the Department of Communities, Housing and Digital Economy, Department of Justice and Attorney-General, Department of Seniors, Disability Services and Aboriginal and Torres Strait Islander Partnerships, Queensland Police, Queensland Corrective Services and Queensland Health sections of this chapter.
This forms part of the government’s total funding package of $363 million over 5 years ($350 million new funding and $12.9 million internally met) to respond to the recommendations of the Queensland Women`s Safety and Justice Taskforce in Hear her voice - Report One - Addressing coercive control and domestic and family violence in Queensland. Further details on this package are in Chapter 1 of this paper.
38
Budget Measures 2022-23
| 2021–22 $‘000 | 2022–23 $‘000 | 2023–24 $‘000 | 2024–25 $‘000 | 2025–26 $‘000 | ||||||||||||||||
Report 1, Hear Her Voice Response - Respectful Relationships Program for Young People Not in Formal Education | — | 150 | 150 | 150 | — | |||||||||||||||
The government is providing increased funding of $450,000 over 3 years to expand the availability of respectful relationships programs for young people not engaged in formal education.
This forms part of the government’s total funding package of $363 million over 5 years ($350 million new funding and $12.9 million internally met) to respond to the recommendations of the Queensland Women’s Safety and Justice Taskforce in Hear her voice - Report One - Addressing coercive control and domestic and family violence in Queensland. Further details on this package are in Chapter 1 of this paper.
39
Budget Measures 2022-23
Department of Communities, Housing and Digital Economy
| 2021–22 | 2022–23 | 2023–24 | 2024–25 | 2025–26 | ||||||||||||||||
| $‘000 | $‘000 | $‘000 | $‘000 | $‘000 | ||||||||||||||||
Strengthening Social Services in Queensland | — | 17,918 | 19,131 | 19,352 | 18,463 | |||||||||||||||
The government is providing additional funding of $74.9 million over 4 years and $17.1 million per annum ongoing to strengthen social services in Queensland. This includes funding provided towards neighbourhood and community centres and actions responding to the Queensland Parliament Community Support and Services Committee Inquiry into Social Isolation and Loneliness in Queensland.
This forms part of the government’s total funding of $125.6 million over 4 years and $19 million ongoing to strengthen social services in Queensland. The capital component of this measure can be found in Chapter 3 Capital Measures.
A further $2.8 million over 4 years and $1.8 million ongoing is held centrally, providing total services funding of $77.6 million over 4 years and $19 million ongoing for this initiative.
| 2021–22 | 2022–23 | 2023–24 | 2024–25 | 2025–26 | ||||||||||||||||
| $‘000 | $‘000 | $‘000 | $‘000 | $‘000 | ||||||||||||||||
Grow 2022–2026 | — | 15,000 | 15,000 | 10,000 | 10,000 | |||||||||||||||
The government is providing increased funding of $50 million over 4 years to support the delivery of Grow 2022–2026, the second action plan of Creative Together 2020–2030: A 10-Year Roadmap for arts, culture and creativity in Queensland.
| 2021–22 | 2022–23 | 2023–24 | 2024–25 | 2025–26 | ||||||||||||||||
| $‘000 | $‘000 | $‘000 | $‘000 | $‘000 | ||||||||||||||||
Queensland Performing Arts Centre | — | 2,000 | — | — | — | |||||||||||||||
The government is providing increased funding of $2 million in 2022–23 to support the continued growth of First Nations performing arts initiatives and delivery of digital initiatives that extend programming and audience access across the state.
40
Budget Measures 2022-23
| 2021–22 $‘000 | 2022–23 $‘000 | 2023–24 $‘000 | 2024–25 $‘000 | 2025–26 $‘000 | ||||||||||||||||
Digitisation of the State’s Audio-Visual and Other Archival Public Records | — | 945 | 973 | 841 | 841 | |||||||||||||||
The government is providing additional funding of $3.6 million over 4 years to accelerate digitisation of print and audio-visual records. The capital component of this measure can be found in Chapter 3 Capital Measures.
| 2021–22 $‘000 | 2022–23 $‘000 | 2023–24 $‘000 | 2024–25 $‘000 | 2025–26 $‘000 | ||||||||||||||||
Queensland Cultural Centre - Capital Works, Asset Upgrades and Refurbishment Projects | — | 621 | 907 | 1,260 | 1,578 | |||||||||||||||
The government is providing additional funding of $4.4 million over 4 years and $1.1 million per annum ongoing for implementation and operational maintenance of capital asset renewal works, compliance and safety improvements, and amenity upgrades funded under this measure. The capital component of this measure can be found in Chapter 3 Capital Measures.
| 2021–22 $‘000 | 2022–23 $‘000 | 2023–24 $‘000 | 2024–25 $‘000 | 2025–26 $‘000 | ||||||||||||||||
Neighbourhood and Community Centres | 557 | 619 | 619 | 619 | 619 | |||||||||||||||
The government is providing increased funding of $3 million over 5 years and $619,000 per annum ongoing for the operation of 4 neighbourhood and community centres in Manoora, Kallangur, Thursday Island and Yarrabilba.
Further uplift in funding for neighbourhood and community centres, including those mentioned above, will be provided through the Strengthening Social Services in Queensland initiative.
41
Budget Measures 2022-23
| 2021–22 $‘000 | 2022–23 $‘000 | 2023–24 $‘000 | 2024–25 $‘000 | 2025–26 $‘000 | ||||||||||||||||
Management and Matching of Donated Goods | — | 400 | 400 | 400 | 400 | |||||||||||||||
The government is providing increased funding of $1.6 million over 4 years and $400,000 per annum ongoing to continue the management and matching of donated goods following a disaster.
| 2021–22 $‘000 | 2022–23 $‘000 | 2023–24 $‘000 | 2024–25 $‘000 | 2025–26 $‘000 | ||||||||||||||||
Storage for State Cultural Collections | — | 400 | — | — | — | |||||||||||||||
The government is providing additional funding of $400,000 in 2022–23 to develop a 10-year strategic plan for the acquisition and storage of the State collection.
| 2021–22 $‘000 | 2022–23 $‘000 | 2023–24 $‘000 | 2024–25 $‘000 | 2025–26 $‘000 | ||||||||||||||||
School Breakfast Program | — | 300 | 300 | 594 | 594 | |||||||||||||||
The government is providing increased funding of $1.8 million over 4 years and $594,000 per annum ongoing to continue the School Breakfast Program including in rural and remote communities.
| 2021–22 $‘000 | 2022–23 $‘000 | 2023–24 $‘000 | 2024–25 $‘000 | 2025–26 $‘000 | ||||||||||||||||
National Redress Scheme | — | 141 | 145 | 149 | 152 | |||||||||||||||
The government is providing increased funding of $587,000 over 4 years to operationalise the National Redress Scheme for survivors of institutional child sexual abuse in Queensland.
This forms part of the government’s total funding of $25.9 million over 4 years for this initiative. Further details can be found in the Department of Children, Youth Justice and Multicultural Affairs and the Department of Seniors, Disability Services and Aboriginal and Torres Strait Islander Partnerships sections of this chapter.
42
Budget Measures 2022-23
| 2021–22 $‘000 | 2022–23 $‘000 | 2023–24 $‘000 | 2024–25 $‘000 | 2025–26 $‘000 | ||||||||||||||||
Report 1, Hear Her Voice Response - Integrated Service System Responses and High Risk Teams in Additional Locations | — | 89 | 249 | 327 | 501 | |||||||||||||||
The government is providing additional funding of $1.2 million over 4 years and $503,000 per annum ongoing to roll out integrated service system responses and high risk teams in additional locations.
Further details of this funding can be found in the Department of Justice and Attorney-General, Queensland Police Service, Queensland Corrective Services, Queensland Health, Department of Children, Youth Justice and Multicultural Affairs, and the Department of Seniors, Disability Services and Aboriginal and Torres Strait Islander Partnerships sections of this chapter.
This forms part of the government’s total funding package of $363 million over 5 years ($350 million new funding and $12.9 million internally met) to respond to the recommendations of the Queensland Women’s Safety and Justice Taskforce in Hear Her Voice - Report One - Addressing coercive control and domestic and family violence in Queensland. Further details on this package are in Chapter 1 of this paper.
| 2021–22 $‘000 | 2022–23 $‘000 | 2023–24 $‘000 | 2024–25 $‘000 | 2025–26 $‘000 | ||||||||||||||||
Queensland Cultural Centre - Security Upgrades | — | 28 | 42 | 48 | 48 | |||||||||||||||
The government is providing additional funding of $166,000 over 4 years and $48,000 per annum ongoing for the operational maintenance of the capital works funded under the capital component of this measure to enhance security measures across the Queensland Cultural Centre. The capital component of this measure can be found in Chapter 3 Capital Measures.
43
Budget Measures 2022-23
| 2021–22 $‘000 | 2022–23 $‘000 | 2023–24 $‘000 | 2024–25 $‘000 | 2025–26 $‘000 | ||||||||||||||||
COVID-19 Support and Service Delivery Capacity and Capability | 1,394 | — | — | — | — | |||||||||||||||
The government has provided increased funding of $1.4 million to continue quarantine support services and extraordinary non-clinical workforces to support vaccination centres in 2021–22. The government is also providing increased funding of $12.5 million in 2022–23, held centrally, for essential quarantine/isolation support and enhanced Smart Service Queensland COVID-19 service capacity and capability if required.
| 2021–22 $‘000 | 2022–23 $‘000 | 2023–24 $‘000 | 2024–25 $‘000 | 2025–26 $‘000 | ||||||||||||||||
Digital Economy - Foundations | 1,000 | — | — | — | — | |||||||||||||||
The government has provided additional funding of $1 million in 2021–22 to undertake foundational work so as to shape Queensland’s digital direction. Further funding of $3 million over 2 years is being internally met by the department, bringing total funding for this program to $4 million over 2 years from 2021–22.
| 2021–22 $‘000 | 2022–23 $‘000 | 2023–24 $‘000 | 2024–25 $‘000 | 2025–26 $‘000 | ||||||||||||||||
Digitally Connected Regions | 1,919 | — | — | — | — | |||||||||||||||
The government has provided additional funding of $1.9 million in 2021–22 to support several strategic initiatives including co-investment, development of a Queensland Digital Infrastructure Plan and trials of new and emerging technology to improve connectivity in regional and remote Queensland. Further funding of $3 million is being held centrally for these initiatives. Total funding for this program is $4.9 million over 2 years from 2021–22.
44
Budget Measures 2022-23
| 2021–22 $‘000 | 2022–23 $‘000 | 2023–24 $‘000 | 2024–25 $‘000 | 2025–26 $‘000 | ||||||||||||||||
Woodford Folk Festival | 1,000 | — | — | — | — | |||||||||||||||
The government has provided additional funding of $1 million in 2021–22 to support the sustainability of Woodfordia Inc, producer of the Woodford Folk Festival. Additional funding of $3 million over 3 years from 2022–23 is being held centrally and will be provided subject to achievement of agreed annual milestones.
| 2021–22 $‘000 | 2022–23 $‘000 | 2023–24 $‘000 | 2024–25 $‘000 | 2025–26 $‘000 | ||||||||||||||||
Youth Homelessness and Housing | — | — | 8,068 | 8,991 | 9,959 | |||||||||||||||
The government will provide additional funding of $27 million over 3 years and $10 million per annum ongoing to deliver new frontline service initiatives that provide housing with support for young people to access and sustain housing and work toward social and economic independence.
Funding of $2.8 million in 2022–23 is being met internally by the department towards youth homelessness initiatives. Total funding for this program is $29.8 million over 4 years from 2022–23.
45
Budget Measures 2022-23
Department of Education
| 2021–22 | 2022–23 | 2023–24 | 2024–25 | 2025–26 | ||||||||||||||||
| $‘000 | $‘000 | $‘000 | $‘000 | $‘000 | ||||||||||||||||
State Kindergarten Funding | — | 36,000 | 73,000 | 77,000 | 77,000 | |||||||||||||||
The government is providing increased funding of $263 million over 4 years and $77 million per annum ongoing to support kindergarten funding reform to reduce out-of-pocket expenses for families, increase disability funding and implement educational needs funding for children in Queensland attending a kindergarten.
| 2021–22 | 2022–23 | 2023–24 | 2024–25 | 2025–26 | ||||||||||||||||
| $‘000 | $‘000 | $‘000 | $‘000 | $‘000 | ||||||||||||||||
Asbestos Program | — | 25,765 | 26,553 | 27,366 | 28,203 | |||||||||||||||
The government is providing increased funding of $107.9 million over 4 years for the removal of all low density board asbestos containing materials from Department of Education facilities across the state.
| 2021–22 | 2022–23 | 2023–24 | 2024–25 | 2025–26 | ||||||||||||||||
| $‘000 | $‘000 | $‘000 | $‘000 | $‘000 | ||||||||||||||||
Transition to a New Students with Disability State School Resourcing Model | — | 13,974 | 40,296 | 26,322 | — | |||||||||||||||
The government is providing additional funding of $80.6 million over 3 years to support schools transition to a new resourcing model for students with disability.
46
Budget Measures 2022-23
| 2021–22 | 2022–23 | 2023–24 | 2024–25 | 2025–26 | ||||||||||||||||
| $‘000 | $‘000 | $‘000 | $‘000 | $‘000 | ||||||||||||||||
Early Childhood Education and Care - Regulation | — | 13,553 | 13,754 | 14,017 | 14,180 | |||||||||||||||
The government is providing increased funding of $55.5 million over 4 years and $14.2 million per annum ongoing for the regulation of early childhood education and care services.
| 2021–22 | 2022–23 | 2023–24 | 2024–25 | 2025–26 | ||||||||||||||||
| $‘000 | $‘000 | $‘000 | $‘000 | $‘000 | ||||||||||||||||
Expansion of the Share the Dignity in Queensland Schools Initiative | — | 13,286 | — | — | — | |||||||||||||||
The government is providing increased funding of $13.3 million in 2022–23 to expand the Share the Dignity in Queensland Schools initiative by funding the installation of Dignity Vending Machines to all state schools, outdoor education centres and student residential facilities across the state.
Funding of up to $18.8 million over 3 years and $6.4 million per annum ongoing is being met internally by the department to maintain, repair and re-stock the machines.
Total funding for the expanded initiative is $32.1 million over 4 years and $6.4 million per annum ongoing.
| 2021–22 | 2022–23 | 2023–24 | 2024–25 | 2025–26 | ||||||||||||||||
| $‘000 | $‘000 | $‘000 | $‘000 | $‘000 | ||||||||||||||||
School Infrastructure - Renewal | 696 | 12,364 | 30,206 | — | — | |||||||||||||||
The government is providing increased funding of $43.3 million over 3 years for critical infrastructure upgrades to replace and enhance infrastructure in existing state schools.
Funding of up to $50.1 million in 2024–25 and 2025–26, and $2.5 million per annum ongoing, is being met internally by the department to complete these projects. This brings total funding for the expense component of this initiative to $93.4 million over 5 years and $2.5 million per annum ongoing.
Total funding for the initiative is $623.8 million over 5 years and $25.2 million per annum ongoing. The capital component of this measure can be found in Chapter 3 Capital Measures.
47
Budget Measures 2022-23
| 2021–22 | 2022–23 | 2023–24 | 2024–25 | 2025–26 | ||||||||||||||||
| $‘000 | $‘000 | $‘000 | $‘000 | $‘000 | ||||||||||||||||
Youth Detention Centres - Staffing Ratio Change | 2,592 | 6,015 | 6,166 | 6,320 | 6,479 | |||||||||||||||
The government is providing increased funding of $27.6 million over 5 years and $6.5 million per annum ongoing to increase the teacher to student ratio from 1:6 to 1:4 for education staff working in Queensland’s 3 youth detention centres.
| 2021–22 | 2022–23 | 2023–24 | 2024–25 | 2025–26 | ||||||||||||||||
| $‘000 | $‘000 | $‘000 | $‘000 | $‘000 | ||||||||||||||||
Report 1, Hear Her Voice Response - Respectful Relationships Education | — | 6,007 | 6,176 | 3,286 | — | |||||||||||||||
The government is providing increased funding of $15.5 million over 3 years to support Queensland state schools to embed respectful relationships education.
This forms part of the government’s total funding package of $363 million over 5 years ($350 million new funding and $12.9 million internally met) to respond to the recommendations of the Queensland Women’s Safety and Justice Taskforce in Hear her voice - Report One - Addressing coercive control and domestic and family violence in Queensland. Further details on this package are in Chapter 1 of this paper.
| 2021–22 | 2022–23 | 2023–24 | 2024–25 | 2025–26 | ||||||||||||||||
| $‘000 | $‘000 | $‘000 | $‘000 | $‘000 | ||||||||||||||||
School Infrastructure - Growth | — | 5,386 | 4,104 | — | — | |||||||||||||||
The government is providing increased funding of $9.5 million over 2 years for the provision of additional infrastructure at existing schools experiencing enrolment growth.
Total funding for this initiative is $118.6 million over 2 years. The capital component of this measure can be found in Chapter 3 Capital measures.
48
Budget Measures 2022-23
| 2021–22 | 2022–23 | 2023–24 | 2024–25 | 2025–26 | ||||||||||||||||
| $‘000 | $‘000 | $‘000 | $‘000 | $‘000 | ||||||||||||||||
School Security Program | — | 5,000 | 5,000 | 5,000 | 5,000 | |||||||||||||||
The government is providing increased funding of $20 million over 4 years and $5 million per annum ongoing to enhance security measures in Queensland state schools.
| 2021–22 | 2022–23 | 2023–24 | 2024–25 | 2025–26 | ||||||||||||||||
| $‘000 | $‘000 | $‘000 | $‘000 | $‘000 | ||||||||||||||||
Infrastructure Portfolio Management | — | 2,504 | 6,535 | 8,930 | 11,258 | |||||||||||||||
The government is providing increased funding of $29.2 million over 4 years and $11.3 million per annum ongoing to support the management of the department’s infrastructure portfolio.
| 2021–22 | 2022–23 | 2023–24 | 2024–25 | 2025–26 | ||||||||||||||||
| $‘000 | $‘000 | $‘000 | $‘000 | $‘000 | ||||||||||||||||
Former Origin Greats - Achieving Results Through Indigenous Education Program | — | 1,609 | 1,609 | 1,609 | 804 | |||||||||||||||
The government is providing increased funding of $5.6 million over 4 years to Former Origin Greats Queensland to support the delivery of the Achieving Results Through Indigenous Education Program in state schools.
| 2021–22 | 2022–23 | 2023–24 | 2024–25 | 2025–26 | ||||||||||||||||
| $‘000 | $‘000 | $‘000 | $‘000 | $‘000 | ||||||||||||||||
Land Acquisition for New Schools | — | 916 | — | — | — | |||||||||||||||
The government is providing increased funding of $916,000 in 2022–23 to acquire land to continue the delivery of new schools under its Building Future Schools program.
Total funding for this initiative is $55.8 million in 2022–23. The capital component can be found in Chapter 3 Capital measures.
49
Budget Measures 2022-23
| 2021–22 | 2022–23 | 2023–24 | 2024–25 | 2025–26 | ||||||||||||||||
| $‘000 | $‘000 | $‘000 | $‘000 | $‘000 | ||||||||||||||||
Non-State Schools Accreditation Board | — | 648 | 663 | 678 | 694 | |||||||||||||||
The government is providing increased funding of $2.7 million over 4 years and $694,000 per annum ongoing to support the operation of the Non-State Schools Accreditation Board.
| 2021–22 | 2022–23 | 2023–24 | 2024–25 | 2025–26 | ||||||||||||||||
| $‘000 | $‘000 | $‘000 | $‘000 | $‘000 | ||||||||||||||||
School Playground and Tuckshop Upgrades | — | 500 | 4,500 | — | — | |||||||||||||||
The government is providing additional funding of $5 million over 2 years to improve School playground and tuckshop facilities in disadvantaged areas throughout Queensland.
Total funding for this initiative is $20 million over 2 years. The capital component of this measure can be found in Chapter 3 Capital measures.
| 2021–22 | 2022–23 | 2023–24 | 2024–25 | 2025–26 | ||||||||||||||||
| $‘000 | $‘000 | $‘000 | $‘000 | $‘000 | ||||||||||||||||
Workplace Rights and Harmonious Industrial Relations Grant Program | — | 500 | 500 | 500 | 500 | |||||||||||||||
The government is providing increased funding of $2 million over 4 years ($2.5 million over 5 years) for eligible registered employer and employee industrial organisations and their peak bodies to promote modern workplace rights and co-operative industrial relations.
50
Budget Measures 2022-23
| 2021–22 | 2022–23 | 2023–24 | 2024–25 | 2025–26 | ||||||||||||||||
| $‘000 | $‘000 | $‘000 | $‘000 | $‘000 | ||||||||||||||||
Building Future Schools Program | — | 478 | 1,309 | 10,209 | 4,781 | |||||||||||||||
The government is providing increased funding of $16.8 million over 4 years ($23.4 million over 7 years) for the construction of new schools to open in 2025 at Caboolture West, Caloundra South, Greater Flagstone and Ripley Valley, along with one new school in Bahrs Scrub to open in 2026.
Total funding for this initiative is $389.5 million over 7 years. The capital component of this measure can be found in Chapter 3 Capital measures.
| 2021–22 | 2022–23 | 2023–24 | 2024–25 | 2025–26 | ||||||||||||||||
| $‘000 | $‘000 | $‘000 | $‘000 | $‘000 | ||||||||||||||||
Non-State Schools Transport Assistance Scheme | — | 450 | 458 | 465 | 473 | |||||||||||||||
The government is providing increased funding of $1.8 million over 4 years and $473,000 per annum ongoing for the Non-State Schools Transport Assistance Scheme.
| 2021–22 | 2022–23 | 2023–24 | 2024–25 | 2025–26 | ||||||||||||||||
| $‘000 | $‘000 | $‘000 | $‘000 | $‘000 | ||||||||||||||||
Expansion of GPs in Schools Pilot | — | — | — | — | — | |||||||||||||||
Funding of up to $6 million over 3 years is being met internally by the department to expand the GPs in Schools pilot program from 20 to 50 schools.
Total funding for the expansion is $6.6 million over 3 years. The capital component of this measure can be found in Chapter 3 Capital measures.
51
Budget Measures 2022-23
| 2021–22 | 2022–23 | 2023–24 | 2024–25 | 2025–26 | ||||||||||||||||
| $‘000 | $‘000 | $‘000 | $‘000 | $‘000 | ||||||||||||||||
Youth Engagement Strategy | — | — | — | — | — | |||||||||||||||
Funding of $45.5 million over 4 years is being met internally by the department to continue the Youth Engagement Strategy, which includes a range of initiatives aimed at re-engaging children and young people who have disconnected from study or work.
52
Budget Measures 2022-23
Department of Employment, Small Business and Training
| 2021–22 | 2022–23 | 2023–24 | 2024–25 | 2025–26 | ||||||||||||||||
| $‘000 | $‘000 | $‘000 | $‘000 | $‘000 | ||||||||||||||||
Training and Future Skills Investment | — | 47,250 | 53,350 | — | — | |||||||||||||||
The government is providing additional funding of $100.6 million over 2 years to support the delivery of Vocational Education and Training (VET) services by Queensland’s public training providers.
| 2021–22 | 2022–23 | 2023–24 | 2024–25 | 2025–26 | ||||||||||||||||
| $‘000 | $‘000 | $‘000 | $‘000 | $‘000 | ||||||||||||||||
Queensland Resources Industry Development Plan (QRIDP) Package | — | 1,640 | 1,250 | 190 | 220 | |||||||||||||||
The government is providing additional funding of $3.3 million over 4 years to support the implementation of several key initiatives included in the QRIDP. This includes the Queensland Future Skills for All program (to assist industry, businesses and individuals seeking to enter, upskill and reskill in autonomous technologies fields) and to develop pathways into higher education courses for those interested in pursuing a career in automation.
This forms part of the government’s commitment to a $68.5 million package over 5 years to support implementation of the final QRIDP across government. Further details on initiatives can be found in the Department of Resources, Department of State Development, Infrastructure, Local Government and Planning, Department of Environment and Science, Department of Justice and the Attorney General, Department of Regional Development, Manufacturing and Water and Department of Agriculture and Fisheries sections of this chapter.
53
Budget Measures 2022-23
| 2021–22 | 2022–23 | 2023–24 | 2024–25 | 2025–26 | ||||||||||||||||
| $‘000 | $‘000 | $‘000 | $‘000 | $‘000 | ||||||||||||||||
Small Business Support | — | 1,396 | 12,555 | 12,564 | 12,573 | |||||||||||||||
The government is providing increased funding of $39.1 million over 4 years and $12.6 million per annum ongoing to continue to provide small business grants and the mentoring for growth program. These programs will support digital capability and upgrades, strategic business and marketing advice, staff management and future business development and planning.
| 2021–22 | 2022–23 | 2023–24 | 2024–25 | 2025–26 | ||||||||||||||||
| $‘000 | $‘000 | $‘000 | $‘000 | $‘000 | ||||||||||||||||
Queensland Small Business Commissioner | — | 500 | 3,200 | 3,200 | 3,200 | |||||||||||||||
The government is providing increased funding of $10.1 million over 4 years and $3.2 million per annum ongoing to establish a permanent Queensland Small Business Commissioner’s office. The Queensland Small Business Commissioner provides information and advocacy support to small businesses and assist in resolving commercial tenancy disputes.
| 2021–22 | 2022–23 | 2023–24 | 2024–25 | 2025–26 | ||||||||||||||||
| $‘000 | $‘000 | $‘000 | $‘000 | $‘000 | ||||||||||||||||
COVID-19 Business Support Grants | 400,000 | — | — | — | — | |||||||||||||||
The government has provided additional funding of $400 million in 2021–22, with funding also held centrally, for the 2021 COVID-19 Business Support Grants program, to help support small businesses with the impacts of COVID-19 in Queensland. This program has now closed.
This formed part of the government’s total announced funding of $600 million in 2021–22 for the Business Support Package, jointly funded by the Australian Government, to support businesses impacted by COVID-19 in Queensland
54
Budget Measures 2022-23
| 2021–22 | 2022–23 | 2023–24 | 2024–25 | 2025–26 | ||||||||||||||||
| $‘000 | $‘000 | $‘000 | $‘000 | $‘000 | ||||||||||||||||
COVID-19 Cleaning Rebate | 20,000 | — | — | — | — | |||||||||||||||
The government has provided additional funding of $20 million in 2021–22 to assist small and medium businesses and not-for-profit organisations that are identified as a site of potential COVID-19 transmission by Queensland Health.
| 2021–22 | 2022–23 | 2023–24 | 2024–25 | 2025–26 | ||||||||||||||||
| $‘000 | $‘000 | $‘000 | $‘000 | $‘000 | ||||||||||||||||
Tradies in Paradise Initiative | — | — | — | — | — | |||||||||||||||
The government is providing additional funding of up to $7.8 million, held centrally, to attract skilled, qualified tradespeople from interstate (except New South Wales) to Queensland to work on flood recovery.
55
Budget Measures 2022-23
Department of Energy and Public Works
| 2021–22 | 2022–23 | 2023–24 | 2024–25 | 2025–26 | ||||||||||||||||
| $‘000 | $‘000 | $‘000 | $‘000 | $‘000 | ||||||||||||||||
Willows Sports Field | 160 | 14,340 | — | — | — | |||||||||||||||
The government is providing additional funding of $14.5 million over 2 years to coordinate the demolition of the stadium infrastructure and site restoration at the Willow Sports Field (formerly 1300 Smiles Sports Stadium).
| 2021–22 | 2022–23 | 2023–24 | 2024–25 | 2025–26 | ||||||||||||||||
| $‘000 | $‘000 | $‘000 | $‘000 | $‘000 | ||||||||||||||||
Household Resilience Program Phase 3 | — | 8,000 | 12,000 | — | — | |||||||||||||||
The government is providing increased funding of $20 million over 2 years to extend the Household Resilience Program to Phase 3.
| 2021–22 | 2022–23 | 2023–24 | 2024–25 | 2025–26 | ||||||||||||||||
| $‘000 | $‘000 | $‘000 | $‘000 | $‘000 | ||||||||||||||||
Queensland Microgrid Pilot Fund | — | 5,000 | 5,000 | — | — | |||||||||||||||
The government is providing additional funding of $10 million over 2 years for a Queensland Microgrid Pilot Fund, with the intention of boosting resilience of regional communities to extreme weather conditions.
56
Budget Measures 2022-23
| 2021–22 | 2022–23 | 2023–24 | 2024–25 | 2025–26 | ||||||||||||||||
| $‘000 | $‘000 | $‘000 | $‘000 | $‘000 | ||||||||||||||||
Development of the Old Museum Building ahead of the 2032 Olympic and Paralympic Games in Brisbane | — | 3,130 | 1,500 | 1,500 | 1,500 | |||||||||||||||
The government is providing additional funding of $1.6 million in 2022–23 to undertake a business case and master planning for redevelopment of the Old Museum Building.
The government is also providing additional funding of $6 million over 4 years to undertake essential maintenance of the Old Museum Building to keep the building safe and operational.
| 2021–22 | 2022–23 | 2023–24 | 2024–25 | 2025–26 | ||||||||||||||||
| $‘000 | $‘000 | $‘000 | $‘000 | $‘000 | ||||||||||||||||
Best Practice Prequalification System, including Subcontractors | — | 1,600 | 376 | 385 | 393 | |||||||||||||||
The government is providing additional funding of $2.8 million over 4 years and $400,000 per annum ongoing to enhance the Department of Energy and Public Works’ existing procurement prequalification system for building projects.
| 2021–22 | 2022–23 | 2023–24 | 2024–25 | 2025–26 | ||||||||||||||||
| $‘000 | $‘000 | $‘000 | $‘000 | $‘000 | ||||||||||||||||
Continuation of the Safer Building Taskforce | — | 1,335 | — | — | — | |||||||||||||||
The government is providing additional funding of $1.3 million in 2022–23 for the continuation of the Safer Buildings Taskforce.
57
Budget Measures 2022-23
| 2021–22 | 2022–23 | 2023–24 | 2024–25 | 2025–26 | ||||||||||||||||
| $‘000 | $‘000 | $‘000 | $‘000 | $‘000 | ||||||||||||||||
Government Employee Housing Sustainability Funding Model | — | 1,077 | 1,099 | — | — | |||||||||||||||
The government is providing additional funding of $2.2 million over 2 years from 2022–23 and a further $2.3 million over 2 years from 2024–25 held centrally to manage and deliver the increased program of work. The capital component to this measure can be found in Chapter 3 Capital measures.
| 2021–22 | 2022–23 | 2023–24 | 2024–25 | 2025–26 | ||||||||||||||||
| $‘000 | $‘000 | $‘000 | $‘000 | $‘000 | ||||||||||||||||
Drought Assistance and Reform Package | — | — | — | — | — | |||||||||||||||
The government is providing relief of up to $15 million in 2022–23 to farmers and irrigators through fixed charges for electricity accounts that are used to pump water for farm or irrigation purposes during periods of drought. The total assistance provided can vary depending on the shires that are drought declared and the number of eligible customers.
The Drought Assistance and Reform Package is a total of up to $79.6 million over 4 years from 2022–23 to support drought affected communities across the State (and $150 million over 3 years from 2022–23 for drought preparedness and emergency drought assistance loans). Further details can be found in the Department of Agriculture and Fisheries section of this chapter and the Department of Regional Development, Manufacturing and Water and the Department of Resources sections of Chapter 4 Revenue measures.
58
Budget Measures 2022-23
Department of Environment and Science
| 2021–22 | 2022–23 | 2023–24 | 2024–25 | 2025–26 | ||||||||||||||||
| $‘000 | $‘000 | $‘000 | $‘000 | $‘000 | ||||||||||||||||
Queensland’s Resource Recovery Sector Transformation | 672,400 | 47,348 | 105,458 | 75,386 | 63,617 | |||||||||||||||
The government is providing increased funding of $964.2 million over 5 years as part of the 10 year $2.1 billion Waste Package. Funding will support councils and industry to invest in infrastructure and will deliver programs to reduce waste, meet resource recovery targets, create jobs, and reduce impacts on households.
| 2021–22 | 2022–23 | 2023–24 | 2024–25 | 2025–26 | ||||||||||||||||
| $‘000 | $‘000 | $‘000 | $‘000 | $‘000 | ||||||||||||||||
Accelerating Climate Action | — | 9,487 | 13,661 | 4,722 | 4,730 | |||||||||||||||
The government is providing increased funding of $32.6 million over 4 years and $4.8 million per annum ongoing to develop climate science capability that supports climate action program policy, planning and management, including emissions analysis, modelling and projections.
| 2021–22 | 2022–23 | 2023–24 | 2024–25 | 2025–26 | ||||||||||||||||
| $‘000 | $‘000 | $‘000 | $‘000 | $‘000 | ||||||||||||||||
Saving Queensland’s Koalas | — | 7,432 | 15,215 | 1,000 | 1,000 | |||||||||||||||
The government is providing increased funding of $24.6 million over 4 years and $1 million per annum ongoing to extend and accelerate implementation of the South East Queensland Koala Conservation Strategy 2020–2025 and increase the commitment to the South East Queensland Wildlife Hospital Network enabling the rescue, treatment, care and rehabilitation of sick, injured and orphaned koalas.
59
Budget Measures 2022-23
| 2021–22 | 2022–23 | 2023–24 | 2024–25 | 2025–26 | ||||||||||||||||
| $‘000 | $‘000 | $‘000 | $‘000 | $‘000 | ||||||||||||||||
Cape York Peninsula National Park Joint Management | — | 5,709 | 5,262 | 6,374 | 1,149 | |||||||||||||||
The government is providing increased funding of $18.5 million over 4 years and $1.2 million per annum ongoing for the continuation of the Cape York Peninsula Tenure Resolution Program, including support for the transfer of land to First Nations people, enhancing joint management arrangements on Cape York Peninsula Aboriginal land and management of Springvale Station Nature Refuge. The capital component of this measure can be found in Chapter 3 Capital measures.
| 2021–22 | 2022–23 | 2023–24 | 2024–25 | 2025–26 | ||||||||||||||||
| $‘000 | $‘000 | $‘000 | $‘000 | $‘000 | ||||||||||||||||
Saving Queensland’s Threatened Species | — | 4,968 | 7,729 | 1,000 | 1,000 | |||||||||||||||
The government is providing increased funding of $14.7 million over 4 years and $1 million per annum ongoing to enhance Queensland’s protection and recovery of threatened species by implementing the Threatened Species Program, focusing on the assessment, protection and recovery of species most at risk of extinction.
| 2021–22 | 2022–23 | 2023–24 | 2024–25 | 2025–26 | ||||||||||||||||
| $‘000 | $‘000 | $‘000 | $‘000 | $‘000 | ||||||||||||||||
Protected Area Investment and Management | — | 3,137 | 3,137 | 3,137 | 3,137 | |||||||||||||||
The government is providing increased funding of $12.5 million over 4 years and $3.1 million ongoing, for the continuation of the Protected Area Strategy 2020–2030, including support for managing land acquisitions across the protected area estate. The capital component of this measure can be found in Chapter 3 Capital measures.
60
Budget Measures 2022-23
| 2021–22 | 2022–23 | 2023–24 | 2024–25 | 2025–26 | ||||||||||||||||
| $‘000 | $‘000 | $‘000 | $‘000 | $‘000 | ||||||||||||||||
Land Restoration Fund Program Management Office | — | 1,654 | 1,695 | 1,738 | 1,781 | |||||||||||||||
The government is providing increased funding of $6.9 million over 4 years and $1.8 million per annum ongoing to continue the Land Restoration Fund Project Management Office to expand carbon farming in the state by supporting land-sector carbon projects that deliver additional environmental, social, economic and First Nations people outcomes.
| 2021–22 | 2022–23 | 2023–24 | 2024–25 | 2025–26 | ||||||||||||||||
| $‘000 | $‘000 | $‘000 | $‘000 | $‘000 | ||||||||||||||||
Community Sustainability Action Grants Program | — | 1,500 | 1,500 | 1,500 | 1,500 | |||||||||||||||
The government is providing increased funding of $6 million over 4 years and $1.5 million per annum ongoing to continue the Community Sustainability Action Grant program to provide community, environmental and heritage grants in Queensland.
| 2021–22 | 2022–23 | 2023–24 | 2024–25 | 2025–26 | ||||||||||||||||
| $‘000 | $‘000 | $‘000 | $‘000 | $‘000 | ||||||||||||||||
Queensland Resources Industry Development Plan (QRIDP) Package | — | 666 | 682 | 700 | 717 | |||||||||||||||
The government is providing additional funding of $3.5 million over 5 years to build capacity and skills in the environmental regulator to assess decarbonisation plans and provide additional guidance to applicants.
This forms part of the government’s commitment to a $68.5 million package over 5 years to support implementation of the final QRIDP across government. Further details on initiatives can be found in the Department of Resources, Department of State Development, Infrastructure, Local Government and Planning, Department of Employment, Small Business and Training, Department of Justice and the Attorney General, Department of Regional Development, Manufacturing and Water and Department of Agriculture and Fisheries sections of this chapter.
61
Budget Measures 2022-23
| 2021–22 | 2022–23 | 2023–24 | 2024–25 | 2025–26 | ||||||||||||||||
| $‘000 | $‘000 | $‘000 | $‘000 | $‘000 | ||||||||||||||||
Eradication of Yellow Crazy Ants from Areas Within and Adjacent to the Wet Tropics World Heritage Area | — | — | — | — | — | |||||||||||||||
The government is providing increased funding of $12 million over 4 years ($18 million over 6 years) for control of yellow crazy ants, held centrally, until matching funding by the Australian Government has been documented. This funding will be directed to the Wet Tropics Management Authority to support local eradication of yellow crazy ants in the Wet Tropics World Heritage Area and adjacent areas.
| 2021–22 | 2022–23 | 2023–24 | 2024–25 | 2025–26 | ||||||||||||||||
| $‘000 | $‘000 | $‘000 | $‘000 | $‘000 | ||||||||||||||||
Protected Area Estate | — | — | — | — | — | |||||||||||||||
The government is providing increased funding of $2.9 million over 5 years and $628,000 per annum ongoing, held centrally, to support critical infrastructure upgrades and maintenance costs associated with the increase of the protected estate. The capital component of this measure can be found in Chapter 3 Capital Measures.
62
Budget Measures 2022-23
Department of Justice and Attorney-General
| 2021–22 | 2022–23 | 2023–24 | 2024–25 | 2025–26 | ||||||||||||||||
| $‘000 | $‘000 | $‘000 | $‘000 | $‘000 | ||||||||||||||||
Achieving Justice System Efficiency - Contemporary Infrastructure and Technology | — | 28,765 | 43,897 | 7,222 | 7,230 | |||||||||||||||
The government is providing additional funding of $94.3 million over 5 years and $7.2 million annually ongoing, to digitise Queensland Courts and the Queensland Civil and Administrative Tribunal, and to support infrastructure works to ensure the efficiency and sustainability of Queensland’s courthouses.
The government is also providing additional funding of $71 million from 2024–25 to 2026–27 to be held centrally and $7 million per annum ongoing to be held centrally.
This forms part of the government’s total funding package of $246.8 million over 5 years and $27.4 million per annum ongoing to deliver an efficient and effective justice system underpinned by contemporary technology and safe, accessible and functional infrastructure. The capital component of this measure can be found in Chapter 2 Capital measures.
| 2021–22 | 2022–23 | 2023–24 | 2024–25 | 2025–26 | ||||||||||||||||
| $‘000 | $‘000 | $‘000 | $‘000 | $‘000 | ||||||||||||||||
Legal Aid Queensland Challenges - Meeting Non-Discretionary Demand and Scale of Fee Increases | — | 17,227 | 18,522 | 19,842 | 21,192 | |||||||||||||||
The government is providing increased funding of $76.8 million over 4 years and $21.2 million per annum ongoing to provide an increase in fees paid for legal work undertaken by preferred supplier legal firms, barristers and specialists and meet the rising demand for core services in criminal law, child protection and domestic and family violence matters.
63
Budget Measures 2022-23
| 2021–22 $‘000 | 2022–23 $‘000 | 2023–24 $‘000 | 2024–25 $‘000 | 2025–26 $‘000 | ||||||||||||||||
Family Support and Child Protection Reforms | — | 12,553 | 12,553 | 12,553 | 12,553 | |||||||||||||||
The government is providing increased funding of $50.2 million over 4 years and $12.6 million per annum to continue the family support and child protection reforms through the Supporting Families, Changing Futures program. The majority of the initiatives provide direct frontline services to at risk children and families.
This forms part of the government’s total funding of $470.4 million over 4 years ($464.5 million new funding and $6.0 million being met internally) and $104.7 million per annum ongoing for continuation of Supporting Families, Changing Futures initiatives. Further details of this funding can be found in the Department of Children, Youth Justice and Multicultural Affairs sections of this chapter.
| 2021–22 $‘000 | 2022–23 $‘000 | 2023–24 $‘000 | 2024–25 $‘000 | 2025–26 $‘000 | ||||||||||||||||
Report 1, Hear Her Voice Response - State-Wide Plan to Improve Safety for Domestic and Family Violence Victims when Attending Courts | — | 9,980 | 15,299 | 16,601 | 15,907 | |||||||||||||||
The government is providing additional funding of $57.8 million over 4 years and $15.8 million per annum ongoing to improve safety for victims of domestic and family violence including coercive control when attending courts. The capital component of this measure can be found in Chapter 3 Capital measures.
This forms part of the government’s total funding package of $363 million over 5 years ($350 million new funding and $12.9 million internally met) to respond to the recommendations of the Queensland Women’s Safety and Justice Taskforce in Hear her voice - Report One - Addressing coercive control and domestic and family violence in Queensland. Further details on this package are in Chapter 1 of this paper.
64
Budget Measures 2022-23
| 2021–22 | 2022–23 | 2023–24 | 2024–25 | 2025–26 | ||||||||||||||||
| $‘000 | $‘000 | $‘000 | $‘000 | $‘000 | ||||||||||||||||
Report 1, Hear Her Voice Response - Perpetrator Programs and Related Initiatives | — | 6,800 | 7,398 | 6,380 | 4,935 | |||||||||||||||
The government is providing additional funding of $25.5 million over 4 years and $4.4 million ongoing to establish and resource a statewide network of perpetrator intervention programs including specifically tailored programs to meet the needs of Aboriginal and Torres Strait Islander peoples.
This forms part of the government’s total funding package of $363 million over 5 years ($350 million new funding and $12.9 million internally met) to respond to the recommendations of the Queensland Women’s Safety and Justice Taskforce in Hear her voice - Report One - Addressing coercive control and domestic and family violence in Queensland. Further details on this package are in Chapter 1 of this paper.
| 2021–22 | 2022–23 | 2023–24 | 2024–25 | 2025–26 | ||||||||||||||||
| $‘000 | $‘000 | $‘000 | $‘000 | $‘000 | ||||||||||||||||
Report 1, Hear Her Voice Response - Integrated Service System Responses and High Risk Teams in Additional Locations | — | 4,017 | 4,393 | 5,781 | 7,448 | |||||||||||||||
The government is providing additional funding of $21.6 million over 4 years and $7.2 million per annum ongoing to roll out integrated service system responses and High Risk Teams in additional locations.
Further details can be found in the Queensland Police Service, Queensland Corrective Services, Department of Communities, Housing and Digital Economy, Department of Children, Youth Justice and Multicultural Affairs, Queensland Health, and Department of Seniors, Disability Services and Aboriginal and Torres Strait Islander Partnerships sections of this chapter.
This forms part of the government’s total funding package of $363 million over 5 years ($350 million new funding and $12.9 million internally met) to respond to the recommendations of the Queensland Women’s Safety and Justice Taskforce in Hear her voice - Report One - Addressing coercive control and domestic and family violence in Queensland. Further details on this package are in Chapter 1 of this paper.
65
Budget Measures 2022-23
| 2021–22 | 2022–23 | 2023–24 | 2024–25 | 2025–26 | ||||||||||||||||
| $‘000 | $‘000 | $‘000 | $‘000 | $‘000 | ||||||||||||||||
Report 1, Hear Her Voice Response - Continue to Roll Out Specialist Domestic and Family Violence Courts - Legal Aid Queensland | — | 3,249 | 5,876 | 6,022 | 6,173 | |||||||||||||||
The government is providing additional funding of $21.3 million over 4 years and $6.2 million per annum ongoing to Legal Aid Queensland to support the continued enhancement and roll out of specialist domestic and family courts.
Further details can be found in the Queensland Corrective Services and Queensland Police Service sections of this chapter.
This forms part of the government’s total funding package of $363 million over 5 years ($350 million new funding and $12.9 million internally met) to respond to the recommendations of the Queensland Women’s Safety and Justice Taskforce in Hear her voice - Report One - Addressing coercive control and domestic and family violence in Queensland. Further details on this package are in Chapter 1 of this paper.
| 2021–22 | 2022–23 | 2023–24 | 2024–25 | 2025–26 | ||||||||||||||||
| $‘000 | $‘000 | $‘000 | $‘000 | $‘000 | ||||||||||||||||
Report 1, Hear Her Voice Response - Continue to Roll Out Specialist Domestic and Family Violence Courts | — | 3,111 | 6,720 | 8,825 | 9,959 | |||||||||||||||
The government is providing additional funding of $28.6 million over 4 years and $10 million per annum ongoing to continue to enhance and roll out specialist domestic and family violence courts.
Further details can be found in the Queensland Corrective Services and Queensland Police Service sections of this chapter.
This forms part of the government’s total funding package of $363 million over 5 years ($350 million new funding and $12.9 million internally met) to respond to the recommendations of the Queensland Women’s Safety and Justice Taskforce in Hear her voice - Report One - Addressing coercive control and domestic and family violence in Queensland. Further details on this package are in Chapter 1 of this paper.
66
Budget Measures 2022-23
| 2021–22 | 2022–23 | 2023–24 | 2024–25 | 2025–26 | ||||||||||||||||
| $‘000 | $‘000 | $‘000 | $‘000 | $‘000 | ||||||||||||||||
Controlling Risks Associated with a Changing Gambling Environment | — | 3,089 | 2,205 | 1,105 | 1,051 | |||||||||||||||
The government is providing increased funding of $7.5 million over 4 years and $1.1 million per annum ongoing to strengthen casino and gaming regulation to control integrity, probity and harm risks, including the delivery of population risk monitoring, targeted harm minimisation initiatives and enhanced Gambling Help services.
| 2021–22 | 2022–23 | 2023–24 | 2024–25 | 2025–26 | ||||||||||||||||
| $‘000 | $‘000 | $‘000 | $‘000 | $‘000 | ||||||||||||||||
Claim Farming - Legal Services Commission | 262 | 2,873 | 1,770 | — | — | |||||||||||||||
The government is providing additional funding of $4.9 million over 3 years from 2021–22 for the oversight and enforcement of new measures to prohibit claim farming of personal injury claims and deter undesirable billing practices by lawyers in speculative personal injury claims. Funding from 2024–25 is centrally held and will be released upon meeting project milestones. The capital component of this measure can be found in Chapter 3 Capital Measures.
| 2021–22 | 2022–23 | 2023–24 | 2024–25 | 2025–26 | ||||||||||||||||
| $‘000 | $‘000 | $‘000 | $‘000 | $‘000 | ||||||||||||||||
Women in Custody | — | 2,719 | 2,763 | 2,843 | 2,925 | |||||||||||||||
The government is providing increased funding of $11.3 million over 4 years to continue the Women in Custody program.
This forms part of the government’s total funding package of $11.9 million over 4 years to continue frontline specialist support to women in contact with the criminal justice system and custodial systems, addressing the specific and complex needs of women to reduce their risk of entering or returning to prison.
Further details can be found in the Queensland Corrective Services section of this chapter.
67
Budget Measures 2022-23
| 2021–22 | 2022–23 | 2023–24 | 2024–25 | 2025–26 | ||||||||||||||||
| $‘000 | $‘000 | $‘000 | $‘000 | $‘000 | ||||||||||||||||
Queensland Human Rights Commission | — | 2,670 | 764 | 764 | 764 | |||||||||||||||
The government is providing additional funding of $5 million over 4 years and $764,000 per annum ongoing to enable increased capacity of frontline services in complaints and enquiries, in particular, COVID-19 matters.
| 2021–22 | 2022–23 | 2023–24 | 2024–25 | 2025–26 | ||||||||||||||||
| $‘000 | $‘000 | $‘000 | $‘000 | $‘000 | ||||||||||||||||
Report 1, Hear Her Voice Response - Raising Awareness and Understanding in the Community and Improving Primary Prevention | — | 2,601 | 5,434 | 4,502 | 3,749 | |||||||||||||||
The government is providing additional funding of $16.3 million over 4 years and $348,000 per annum ongoing to raise awareness and understanding in the community and develop and implement a comprehensive and integrated plan for the primary prevention of violence against women in Queensland. This includes working with First Nations peoples, people from culturally and linguistically diverse backgrounds, people with disability, and LGBTIQA+ people to develop resources about coercive control and changes to the law.
This forms part of the government’s total funding package of $363 million over 5 years ($350 million new funding and $12.9 million internally met) to respond to the recommendations of the Queensland Women’s Safety and Justice Taskforce in Hear her voice - Report One - Addressing coercive control and domestic and family violence in Queensland. Further details on this package are in Chapter 1 of this paper.
68
Budget Measures 2022-23
| 2021–22 | 2022–23 | 2023–24 | 2024–25 | 2025–26 | ||||||||||||||||
| $‘000 | $‘000 | $‘000 | $‘000 | $‘000 | ||||||||||||||||
Youth Sexual Violence and Abuse | — | 2,598 | 3,558 | 2,396 | 2,466 | |||||||||||||||
The government is providing increased funding of $11 million over 4 years to support youth sexual violence and abuse place-based prevention trials and enhanced outsourced service delivery.
This forms part of the government’s total funding package of $11.3 million over 4 years to continue priority actions to respond to young people who have experienced sexual violence or child sexual abuse. Further details can be found in the Department of Seniors, Disability Services and Aboriginal and Torres Strait Islander Partnerships Services section of this chapter.
| 2021–22 | 2022–23 | 2023–24 | 2024–25 | 2025–26 | ||||||||||||||||
| $‘000 | $‘000 | $‘000 | $‘000 | $‘000 | ||||||||||||||||
Report 1, Hear Her Voice Response - Over Representation Strategy and Office of the Chief First Nations Justice Officer | — | 2,440 | 2,328 | 2,226 | 2,275 | |||||||||||||||
The government is providing additional funding of $9.3 million over 4 years and $2.3 million per annum ongoing for co-design of a whole-of-government and community strategy to address over representation of First Nations peoples in the criminal justice system and to establish the Office of Chief First Nations Justice Officer. The capital component of this measure can be found in Chapter 2 Capital measures.
This forms part of the government’s total funding package of $363 million over 5 years ($350 million new funding and $12.9 million internally met) to respond to the recommendations of the Queensland Women’s Safety and Justice Taskforce in Hear her voice - Report One - Addressing coercive control and domestic and family violence in Queensland. Further details on this package are in Chapter 1 of this paper.
69
Budget Measures 2022-23
| 2021–22 | 2022–23 | 2023–24 | 2024–25 | 2025–26 | ||||||||||||||||
| $‘000 | $‘000 | $‘000 | $‘000 | $‘000 | ||||||||||||||||
Report 1, Hear Her Voice Response - Ensure Data Collection and Reporting Capabilities within Relevant Agencies | — | 2,261 | 2,398 | 2,121 | 918 | |||||||||||||||
The government is providing additional funding of $7.7 million over 4 years and $918,000 per annum ongoing to enhance agencies data collection and reporting capabilities to enable the implementation of the whole-of-government monitoring and evaluation framework.
This forms part of the government’s total funding package of $363 million over 5 years ($350 million new funding and $12.9 million internally met) to respond to the recommendations of the Queensland Women’s Safety and Justice Taskforce in Hear her voice - Report One - Addressing coercive control and domestic and family violence in Queensland. Further details on this package are in Chapter 1 of this paper.
| 2021–22 | 2022–23 | 2023–24 | 2024–25 | 2025–26 | ||||||||||||||||
| $‘000 | $‘000 | $‘000 | $‘000 | $‘000 | ||||||||||||||||
Blue Card Review Implementation | — | 2,009 | 737 | 737 | — | |||||||||||||||
The government is providing increased funding of $3.5 million over 3 years to substantially deliver on the Safe Children and Strong Communities Strategy and Action Plan and to also engage a dedicated team in 2022–23 to address complex eligibility assessment backlogs.
| 2021–22 | 2022–23 | 2023–24 | 2024–25 | 2025–26 | ||||||||||||||||
| $‘000 | $‘000 | $‘000 | $‘000 | $‘000 | ||||||||||||||||
Commission of Inquiry into Queensland’s Crime and Corruption Commission | 3,538 | 1,533 | — | — | — | |||||||||||||||
The government is providing additional funding of $5.1 million over 2 years for the establishment and operation of the Commission of Inquiry into aspects of the Crime and Corruption Commission. The capital component of this measure can be found in Chapter 3 Capital Measures.
70
Budget Measures 2022-23
| 2021–22 | 2022–23 | 2023–24 | 2024–25 | 2025–26 | ||||||||||||||||
| $‘000 | $‘000 | $‘000 | $‘000 | $‘000 | ||||||||||||||||
Report 1, Hear Her Voice Response - Enhancing the Domestic Family Violence Death Review Process in Queensland | — | 1,261 | 1,650 | 372 | — | |||||||||||||||
The government is providing additional funding of $3.3 million over 3 years to enhance the Domestic and Family Violence Death Review process in Queensland.
This forms part of the government’s total funding package of $363 million over 5 years ($350 million new funding and $12.9 million internally met) to respond to the recommendations of the Queensland Women’s Safety and Justice Taskforce in Hear her voice - Report One - Addressing coercive control and domestic and family violence in Queensland. Further details on this package are in Chapter 1 of this paper.
| 2021–22 | 2022–23 | 2023–24 | 2024–25 | 2025–26 | ||||||||||||||||
| $‘000 | $‘000 | $‘000 | $‘000 | $‘000 | ||||||||||||||||
Queensland Family and Child Commission - Continued Funding to Support Operations | — | 1,234 | 1,264 | — | — | |||||||||||||||
The government is providing increased funding of $2.5 million over 2 years to support the Queensland Family and Child Commission in its statutory functions and respond to emergent government priorities.
| 2021–22 | 2022–23 | 2023–24 | 2024–25 | 2025–26 | ||||||||||||||||
| $‘000 | $‘000 | $‘000 | $‘000 | $‘000 | ||||||||||||||||
Supporting the Office of the Director of Public Prosecutions Criminal Prosecution Functions in North Queensland | — | 1,218 | 1,225 | 1,254 | 1,284 | |||||||||||||||
The government is providing increased funding of $5 million over 4 years and $1.3 million per annum ongoing to assist with the sustained workload increases in matters referred for prosecution in the Office of the Director of Public Prosecution’s northern chambers of Cairns, Townsville and Rockhampton.
71
Budget Measures 2022-23
| 2021–22 | 2022–23 | 2023–24 | 2024–25 | 2025–26 | ||||||||||||||||
| $‘000 | $‘000 | $‘000 | $‘000 | $‘000 | ||||||||||||||||
Report 1, Hear Her Voice Response - Establish a Peak Industry Body for all Specialist Domestic Family Violence Services | — | 1,200 | 934 | 933 | 933 | |||||||||||||||
The government is providing additional funding of $4 million over 4 years and $933,000 per annum ongoing to establish and resource an independent and integrated peak industry body for all specialist domestic and family violence services including shelters and perpetrator intervention services.
This forms part of the government’s total funding package of $363 million over 5 years ($350 million new funding and $12.9 million internally met) to respond to the recommendations of the Queensland Women’s Safety and Justice Taskforce in Hear her voice - Report One - Addressing coercive control and domestic and family violence in Queensland. Further details on this package are in Chapter 1 of this paper.
| 2021–22 | 2022–23 | 2023–24 | 2024–25 | 2025–26 | ||||||||||||||||
| $‘000 | $‘000 | $‘000 | $‘000 | $‘000 | ||||||||||||||||
Report 1, Hear Her Voice Response - Immediate Legislative Amendments and Reforms | — | 1,017 | 1,042 | — | — | |||||||||||||||
The government is providing additional funding of $2.1 million over 2 years to immediately progress amendments to the Criminal Code, Domestic and Family Violence Protection Act 2012, Evidence Act 1977 and Penalties and Sentences Act 1992.
The department is also internally funding $2.4 million over 4 years for other legislative reform activities including introducing a new statutory code of conduct for private investigators, an independent review of the defences and excuses in the Criminal Code and to review and investigate the operation of the Dangerous Prisoners (Sexual Offenders) Act 2003.
The capital component of this measure can be found in Chapter 3 Capital measures.
This forms part of the government’s total funding package of $363 million over 5 years ($350 million new funding and $12.9 million internally met) to respond to the recommendations of the Queensland Women’s Safety and Justice Taskforce in Hear her voice - Report One - Addressing coercive control and domestic and family violence in Queensland. Further details on this package are in Chapter 1 of this paper.
72
Budget Measures 2022-23
| 2021–22 | 2022–23 | 2023–24 | 2024–25 | 2025–26 | ||||||||||||||||
| $‘000 | $‘000 | $‘000 | $‘000 | $‘000 | ||||||||||||||||
Report 1, Hear Her Voice Response - Develop and Implement a Whole-of-Government Monitoring and Evaluation Framework | — | 1,000 | 500 | 500 | — | |||||||||||||||
The government is providing additional funding of $2 million over 3 years to develop and implement a whole-of-government monitoring and evaluation framework.
This forms part of the government’s total funding package of $363 million over 5 years ($350 million new funding and $12.9 million internally met) to respond to the recommendations of the Queensland Women’s Safety and Justice Taskforce in Hear her voice - Report One - Addressing coercive control and domestic and family violence in Queensland. Further details on this package are in Chapter 1 of this paper.
| 2021–22 | 2022–23 | 2023–24 | 2024–25 | 2025–26 | ||||||||||||||||
| $‘000 | $‘000 | $‘000 | $‘000 | $‘000 | ||||||||||||||||
Report 1, Hear Her Voice Response - Ongoing Evaluation of Key Initiatives | — | 1,000 | 2,000 | 2,000 | 2,000 | |||||||||||||||
The government is providing additional funding of $7 million over 4 years for independent evaluation of key initiatives to support continuous improvement and to ensure investment is targeted in areas having the greatest impact.
This forms part of the government’s total funding package of $363 million over 5 years ($350 million new funding and $12.9 million internally met) to respond to the recommendations of the Queensland Women’s Safety and Justice Taskforce in Hear her voice - Report One - Addressing coercive control and domestic and family violence in Queensland. Further details on this package are in Chapter 1 of this paper.
73
Budget Measures 2022-23
| 2021–22 $‘000 | 2022–23 $‘000 | 2023–24 $‘000 | 2024–25 $‘000 | 2025–26 $‘000 | ||||||||||||||||
Perpetrator Intervention Initiatives | — | 868 | 905 | 931 | 958 | |||||||||||||||
The government is providing increased funding of $3.7 million over 4 years and $958,000 per annum ongoing to continue the Family Pathways Model. This is a 2-stage, early intervention program to address adolescent to parent violence, increase attachment between mothers and sons and reduce the risk of young people perpetrating domestic violence as adults.
| 2021–22 $‘000 | 2022–23 $‘000 | 2023–24 $‘000 | 2024–25 $‘000 | 2025–26 $‘000 | ||||||||||||||||
Report 1, Hear Her Voice Response - Develop a 5-Year Whole of Government Domestic Family Violence Service System Strategic Investment Plan | — | 830 | 380 | — | — | |||||||||||||||
The government is providing additional funding of $1.2 million over 2 years to develop a 5-year whole-of-government domestic and family violence service system strategic investment plan encompassing services and supports delivered and funded by Queensland Government agencies.
This forms part of the government’s total funding package of $363 million over 5 years ($350 million new funding and $12.9 million internally met) to respond to the recommendations of the Queensland Women’s Safety and Justice Taskforce in Hear her voice - Report One - Addressing coercive control and domestic and family violence in Queensland. Further details on this package are in Chapter 1 of this paper.
| 2021–22 $‘000 | 2022–23 $‘000 | 2023–24 $‘000 | 2024–25 $‘000 | 2025–26 $‘000 | ||||||||||||||||
Queensland Resources Industry Development Plan (QRIDP) Package | — | 795 | 1,550 | 900 | — | |||||||||||||||
The government is providing additional funding of $3.2 million over 3 years for the Queensland Law Reform Commission to review the objection process for mining leases. The capital component of this measure can be found in Chapter 3 Capital measures.
This forms part of the government’s commitment to a $68.5 million package over 5 years to support implementation of the final QRIDP across government. Further details on initiatives can be found in the Department of Resources, Department of State Development, Infrastructure, Local Government and Planning, Department of Environment and Science,
74
Budget Measures 2022-23
Department of Employment, Small Business and Training, Department of Regional Development, Manufacturing and Water and Department of Agriculture and Fisheries sections of this chapter.
| 2021–22 $‘000 | 2022–23 $‘000 | 2023–24 $‘000 | 2024–25 $‘000 | 2025–26 $‘000 | ||||||||||||||||
Critical Support for Queenslanders in Community Titles Developments | — | 782 | 833 | 840 | — | |||||||||||||||
The government is providing increased funding of $2.5 million over 3 years to progress amendments to the Building Units and Group Titles Act 1980 and the Mixed Use Development Act 1993 to improve protections for vulnerable residents of complex developments.
| 2021–22 $‘000 | 2022–23 $‘000 | 2023–24 $‘000 | 2024–25 $‘000 | 2025–26 $‘000 | ||||||||||||||||
Report 1, Hear Her Voice Response - Deliver 4-Phase Implementation Plan to Support Delivery of the Response | — | 699 | 1,716 | — | — | |||||||||||||||
The government is providing additional funding of $2.4 million over 2 years to develop and execute a 4-phase implementation plan to support delivery of the response including for the package of legislative reforms against coercive control. Total funding for this initiative is $4.7 million over 2 years, with $2.3 million over 2 years being internally met by the department.
This forms part of the government’s total funding package of $363 million over 5 years ($350 million new funding and $12.9 million internally met) to respond to the recommendations of the Queensland Women’s Safety and Justice Taskforce in Hear her voice - Report One - Addressing coercive control and domestic and family violence in Queensland. Further details on this package are in Chapter 1 of this paper.
75
Budget Measures 2022-23
| 2021–22 $‘000 | 2022–23 $‘000 | 2023–24 $‘000 | 2024–25 $‘000 | 2025–26 $‘000 | ||||||||||||||||
Report 1, Hear Her Voice Response - Domestic and Family Violence Homicide and Suicide Data Set and Implementation Monitoring Framework | — | 357 | 488 | 348 | — | |||||||||||||||
The government is providing additional funding of $1.2 million over 3 years to maintain and expand Queensland’s Domestic and Family Violence Homicide and Suicide Data Set and establish an implementation monitoring framework.
This forms part of the government’s total funding package of $363 million over 5 years ($350 million new funding and $12.9 million internally met) to respond to the recommendations of the Queensland Women’s Safety and Justice Taskforce in Hear her voice - Report One - Addressing coercive control and domestic and family violence in Queensland. Further details on this package are in Chapter 1 of this paper.
| 2021–22 $‘000 | 2022–23 $‘000 | 2023–24 $‘000 | 2024–25 $‘000 | 2025–26 $‘000 | ||||||||||||||||
Queensland Human Rights Commission - Base Operations | 340 | 296 | 362 | 433 | 508 | |||||||||||||||
The government is providing increased funding of $1.9 million over 5 years and $508,000 per annum ongoing for the Queensland Human Rights Commission to address increased demand.
| 2021–22 $‘000 | 2022–23 $‘000 | 2023–24 $‘000 | 2024–25 $‘000 | 2025–26 $‘000 | ||||||||||||||||
Women with Disability and their Children Experiencing Domestic Violence | — | 265 | 313 | — | — | |||||||||||||||
The government is providing increased funding of $578,000 over 2 years to further develop responses for the needs of women with a disability and their children experiencing domestic and family violence.
76
Budget Measures 2022-23
| 2021–22 $‘000 | 2022–23 $‘000 | 2023–24 $‘000 | 2024–25 $‘000 | 2025–26 $‘000 | ||||||||||||||||
Report 1, Hear Her Voice Response - Ongoing Training for Court Staff about Domestic and Family Violence | — | 250 | — | — | — | |||||||||||||||
The government is providing additional funding of $250,000 in 2022–23 to develop and implement ongoing training for court staff about the nature and impacts of domestic and family violence.
This forms part of the government’s total funding package of $363 million over 5 years ($350 million new funding and $12.9 million internally met) to respond to the recommendations of the Queensland Women’s Safety and Justice Taskforce in Hear her voice - Report One - Addressing coercive control and domestic and family violence in Queensland. Further details on this package are in Chapter 1 of this paper.
| 2021–22 $‘000 | 2022–23 $‘000 | 2023–24 $‘000 | 2024–25 $‘000 | 2025–26 $‘000 | ||||||||||||||||
Beaudesert Courthouse Replacement | — | 170 | 175 | 180 | 183 | |||||||||||||||
The government is providing additional funding of $852,000 over 5 years and $144,000 per annum ongoing to replace the current Beaudesert courthouse.
This forms part of the government’s total funding package of $246.8 million over 5 years and $27.4 million per annum ongoing to deliver an efficient and effective justice system underpinned by contemporary technology and safe, accessible and functional infrastructure. The capital component of this measure can be found in Chapter 2 Capital measures.
77
Budget Measures 2022-23
| 2021–22 $‘000 | 2022–23 $‘000 | 2023–24 $‘000 | 2024–25 $‘000 | 2025–26 $‘000 | ||||||||||||||||
Coroners Court Queensland - Enhanced Structural Supports | — | 153 | 157 | 161 | 165 | |||||||||||||||
The government is providing increased funding of $636,000 over 4 years and $165,000 per annum ongoing to ensure critical structural supports are in place within the coronial system and to mitigate risk associated with the delivery of frontline services.
| 2021–22 $‘000 | 2022–23 $‘000 | 2023–24 $‘000 | 2024–25 $‘000 | 2025–26 $‘000 | ||||||||||||||||
Child Safe Standards and Reportable Conduct Scheme | 137 | 140 | — | — | — | |||||||||||||||
The government is providing increased funding of $277,000 over 2 years to continue work on development of options for implementation of Child Safe Standards and a Reportable Conduct Scheme for Queensland.
This forms part of the government’s total funding of $722,000 over 2 years to continue this initiative. Further details can be found in the Department of Children, Youth Justice and Multicultural Affairs section of this chapter.
| 2021–22 $‘000 | 2022–23 $‘000 | 2023–24 $‘000 | 2024–25 $‘000 | 2025–26 $‘000 | ||||||||||||||||
Meriba Omasker Kaziw Kazipa (Torres Strait Islander Child Rearing Practices) Act 2020 - Ongoing Implementation | — | 4 | 785 | — | — | |||||||||||||||
The government is providing increased funding of $789,000 over 2 years for legal assistance services to provide community legal education and support for applicants under the Meriba Omasker Kaziw Kazipa (Torres Strait Islander Child Rearing Practices) Act 2020. The department is internally funding $143,000 in 2022–23.
This forms part of the government’s total funding of $3.8 million over 2 years for this initiative, including increased funding of $2.8 million and internal funding of $1 million. Further details can be found in the Department of Seniors, Disability Services, Aboriginal and Torres Strait Islander Partnerships section of this chapter.
78
Budget Measures 2022-23
| 2021–22 $‘000 | 2022–23 $‘000 | 2023–24 $‘000 | 2024–25 $‘000 | 2025–26 $‘000 | ||||||||||||||||
Criminal Justice Innovation Office | — | — | — | — | — | |||||||||||||||
The government is providing additional funding of $6 million over 2 years with funds to be held centrally, to establish a Criminal Justice Innovation Office to provide expert advice on systemic issues, lead evidence-based policy making and advise government on system priorities.
| 2021–22 $‘000 | 2022–23 $‘000 | 2023–24 $‘000 | 2024–25 $‘000 | 2025–26 $‘000 | ||||||||||||||||
Report 1, Hear Her Voice Response - Aboriginal and Torres Strait Islander Domestic and Family Violence Responses | — | — | — | — | — | |||||||||||||||
The government is providing additional funding of $3 million over 4 years, held centrally, for Aboriginal and Torres Strait Islander domestic and family violence responses.
This forms part of the government’s total funding package of $363 million over 5 years ($350 million new funding and $12.9 million internally met) to respond to the recommendations of the Queensland Women’s Safety and Justice Taskforce in Hear her voice - Report One - Addressing coercive control and domestic and family violence in Queensland. Further details on this package are in Chapter 1 of this paper.
| 2021–22 $‘000 | 2022–23 $‘000 | 2023–24 $‘000 | 2024–25 $‘000 | 2025–26 $‘000 | ||||||||||||||||
Report 1, Hear Her Voice Response - Program Implementation, Governance and Coordination | — | — | — | — | — | |||||||||||||||
The government is providing additional funding of $3.3 million over 4 years and $936,000 per annum ongoing, held centrally, to establish a suitably qualified independent implementation supervisor and secretariat.
This forms part of the government’s total funding package of $363 million over 5 years ($350 million new funding and $12.9 million internally met) to respond to the recommendations of the Queensland Women’s Safety and Justice Taskforce in Hear her voice - Report One - Addressing coercive control and domestic and family violence in Queensland. Further details on this package are in Chapter 1 of this paper.
79
Budget Measures 2022-23
| 2021–22 $‘000 | 2022–23 $‘000 | 2023–24 $‘000 | 2024–25 $‘000 | 2025–26 $‘000 | ||||||||||||||||
Report 1, Hear Her Voice Response - Review and Update the Domestic Violence and Family Protection Act 2012 Benchbook | — | — | 514 | — | — | |||||||||||||||
The government is providing additional funding of $514,000 to review and update the Domestic Violence and Family Prevention Act 2021 Benchbook for the Magistrates Court. Total funding for this program is $2.2 million over 4 years, with $1.7 million over 4 years and $540,000 per annum ongoing being internally met by the department.
This forms part of the government’s total funding package of $363 million over 5 years ($350 million new funding and $12.9 million internally met) to respond to the recommendations of the Queensland Women’s Safety and Justice Taskforce in Hear her voice - Report One - Addressing coercive control and domestic and family violence in Queensland. Further details on this package are in Chapter 1 of this paper.
| 2021–22 $‘000 | 2022–23 $‘000 | 2023–24 $‘000 | 2024–25 $‘000 | 2025–26 $‘000 | ||||||||||||||||
Report 1, Hear Her Voice Response - Trial and Evaluate Mobile Co-responder Models | — | — | — | — | — | |||||||||||||||
The government is providing additional funding of $16.6 million over 4 years, held centrally, to trial and evaluate mobile co-responder models involving joint responses between Queensland Police Service and specialist domestic and family violence services.
Further details can be found in the Queensland Police Service section of this chapter.
This forms part of the government’s total funding package of $363 million over 5 years ($350 million new funding and $12.9 million internally met) to respond to the recommendations of the Queensland Women’s Safety and Justice Taskforce in Hear her voice - Report One - Addressing coercive control and domestic and family violence in Queensland. Further details on this package are in Chapter 1 of this paper.
80
Budget Measures 2022-23
Department of Regional Development, Manufacturing and Water
| 2021–22 $‘000 | 2022–23 $‘000 | 2023–24 $‘000 | 2024–25 $‘000 | 2025–26 $‘000 | ||||||||||||||||
Made in Queensland | — | 20,000 | 20,000 | — | — | |||||||||||||||
The government is providing increased funding of $40 million over 2 years to continue the Made in Queensland program. This increase brings the total funding to $101.5 million over 7 years from 2017–18 to support the manufacturing sector to become more internationally competitive, increase productivity and adopt new processes and technologies.
| 2021–22 $‘000 | 2022–23 $‘000 | 2023–24 $‘000 | 2024–25 $‘000 | 2025–26 $‘000 | ||||||||||||||||
Cloncurry Community Service Obligation (CSO) Payments | — | 6,610 | 6,965 | 7,049 | 7,175 | |||||||||||||||
The government is providing increased funding of $27.8 million over 4 years to continue Cloncurry Pipeline CSO payments to subsidise water supplied to Cloncurry Shire Council via the North West Queensland Water Pipeline.
| 2021–22 $‘000 | 2022–23 $‘000 | 2023–24 $‘000 | 2024–25 $‘000 | 2025–26 $‘000 | ||||||||||||||||
Sunwater Recreation Management Costs | — | 6,289 | 5,719 | 5,434 | 3,891 | |||||||||||||||
The government is providing additional funding of $21.3 million over 4 years ($24.5 million over 5 years) to upgrade and maintain 19 recreation areas owned and operated by Sunwater across regional Queensland.
81
Budget Measures 2022-23
| 2021–22 | 2022–23 | 2023–24 | 2024–25 | 2025–26 | ||||||||||||||||
| $‘000 | $‘000 | $‘000 | $‘000 | $‘000 | ||||||||||||||||
Rural Water Futures (RWF) Program (Stage 2) | — | 5,321 | 3,958 | — | — | |||||||||||||||
The government is providing increased funding of $9.3 million over 2 years to assist with delivery of stage 2 of the RWF program. RWF is a multi-year program transforming how we deliver sustainable water management and ensure Queensland is a digitally enabled, modern and responsive manager of its valuable water resources.
| 2021–22 | 2022–23 | 2023–24 | 2024–25 | 2025–26 | ||||||||||||||||
| $‘000 | $‘000 | $‘000 | $‘000 | $‘000 | ||||||||||||||||
Manufacturing Hubs Grant Program | — | 5,000 | 5,000 | — | — | |||||||||||||||
The government is providing increased funding of $10 million over 2 years to continue the Manufacturing Hubs Grant Program. This brings the total funding to $28.5 million to assist eligible businesses in the Cairns, Gladstone, Gold Coast, Mackay, Rockhampton and Townsville regions. These grants are an opportunity for manufacturers to become more productive and create jobs of the future.
| 2021–22 | 2022–23 | 2023–24 | 2024–25 | 2025–26 | ||||||||||||||||
| $‘000 | $‘000 | $‘000 | $‘000 | $‘000 | ||||||||||||||||
Permanent Establishment of the Manufacturing Hub Program | — | 4,376 | 4,424 | 4,469 | 4,479 | |||||||||||||||
The government is providing increased funding of $17.7 million over 4 years and $4.5 million per annum ongoing to permanently establish the Manufacturing Hub Program. Manufacturing hubs provide a place for local manufacturing businesses to receive expert advice and support to transition to advanced manufacturing.
82
Budget Measures 2022-23
| 2021–22 | 2022–23 | 2023–24 | 2024–25 | 2025–26 | ||||||||||||||||
| $‘000 | $‘000 | $‘000 | $‘000 | $‘000 | ||||||||||||||||
Hydrology Modelling | 875 | 2,008 | 2,058 | 2,109 | — | |||||||||||||||
The government is providing additional funding of $7.1 million over 4 years to increase the capacity for water modelling technical assessments and provide critical information on water availability.
| 2021–22 | 2022–23 | 2023–24 | 2024–25 | 2025–26 | ||||||||||||||||
| $‘000 | $‘000 | $‘000 | $‘000 | $‘000 | ||||||||||||||||
Queensland Water Regional Alliance Program | — | 2,000 | 2,000 | 2,000 | 2,000 | |||||||||||||||
The government is providing increased funding of $8 million over 4 years and $2 million per annum ongoing to continue the Queensland Water Regional Alliance Program. This program is an industry-led initiative aimed at improving water and sewerage services in Queensland through regional collaboration.
| 2021–22 | 2022–23 | 2023–24 | 2024–25 | 2025–26 | ||||||||||||||||
| $‘000 | $‘000 | $‘000 | $‘000 | $‘000 | ||||||||||||||||
Queensland Bulk Water Infrastructure Assessment | 300 | 1,600 | 1,900 | 1,700 | — | |||||||||||||||
The government is providing additional funding of $5.5 million over 4 years to develop a strategic water infrastructure plan to inform optimal decisions around investment and the forward program.
| 2021–22 | 2022–23 | 2023–24 | 2024–25 | 2025–26 | ||||||||||||||||
| $‘000 | $‘000 | $‘000 | $‘000 | $‘000 | ||||||||||||||||
Queensland Rural Water Compliance System | 196 | 1,397 | 1,913 | 1,430 | — | |||||||||||||||
The government is providing additional funding of $4.9 million over 4 years to develop and implement a modern, fit for purpose compliance system to provide optimal oversight of Queensland rural water use.
83
Budget Measures 2022-23
| 2021–22 $‘000 | 2022–23 $‘000 | 2023–24 $‘000 | 2024–25 $‘000 | 2025–26 $‘000 | ||||||||||||||||
Queensland Audit Office Dam Safety Regulation Recommendations | 615 | 1,129 | 829 | 829 | — | |||||||||||||||
The government is providing additional funding of $3.4 million over 4 years to address recommendations from the Queensland Audit Office report into dam safety regulation.
| 2021–22 $‘000 | 2022–23 $‘000 | 2023–24 $‘000 | 2024–25 $‘000 | 2025–26 $‘000 | ||||||||||||||||
State Council of River Trusts | — | 300 | — | — | — | |||||||||||||||
The government is providing additional funding of $300,000 in 2022–23 to support the State Council of River Trusts Queensland.
| 2021–22 $‘000 | 2022–23 $‘000 | 2023–24 $‘000 | 2024–25 $‘000 | 2025–26 $‘000 | ||||||||||||||||
Queensland Resources Industry Development Plan (QRIDP) Package | — | 250 | 250 | — | — | |||||||||||||||
The government will provide additional funding of $500,000 over 2 years to support the development of a battery manufacturing industry in Queensland.
This forms part of the government’s commitment to a $68.5 million package over 5 years to support implementation of the final QRIDP across government. Further details on initiatives can be found in the Department of Resources, Department of State Development, Infrastructure, Local Government and Planning, Department of Environment and Science, Department of Employment, Small Business and Training, Department of Justice and the Attorney General, and Department of Agriculture and Fisheries sections of this chapter.
84
Budget Measures 2022-23
| 2021–22 $‘000 | 2022–23 $‘000 | 2023–24 $‘000 | 2024–25 $‘000 | 2025–26 $‘000 | ||||||||||||||||
Regional Water Infrastructure: Cairns Water Security Program | — | — | — | — | — | |||||||||||||||
The government is providing additional funding of $107.5 million over 2 years, held centrally, and subject to a business case and matching Australian Government funding to complete stage one of the Cairns Water Security Program.
| 2021–22 $‘000 | 2022–23 $‘000 | 2023–24 $‘000 | 2024–25 $‘000 | 2025–26 $‘000 | ||||||||||||||||
Regional Water Infrastructure: Hughenden Water Bank | — | — | — | — | — | |||||||||||||||
The government is providing additional funding of $25.6 million, held centrally and subject to a business case and matching Australian Government funding for contribution towards the development of Flinders Shire Council’s Hughenden Water Bank project, consisting of a 7,000 megalitre off-stream water storage and distribution system to support development and expansion of irrigated agriculture and industry development at Hughenden.
| 2021–22 $‘000 | 2022–23 $‘000 | 2023–24 $‘000 | 2024–25 $‘000 | 2025–26 $‘000 | ||||||||||||||||
Regional Water Infrastructure: Lansdown Eco-Industrial Precinct (Enabling Infrastructure) | — | — | — | — | — | |||||||||||||||
The government is providing additional funding of $26 million, held centrally and subject to an assessment, and contribution from the Australian Government for a 13 kilometre raw water pipeline and pumping station connecting the Lansdown Eco-Industrial Precinct to the Haughton Pipeline, and a water reservoir within the precinct capable of holding 12 days of raw water storage.
85
Budget Measures 2022-23
| 2021–22 $‘000 | 2022–23 $‘000 | 2023–24 $‘000 | 2024–25 $‘000 | 2025–26 $‘000 | ||||||||||||||||
Regional Water Infrastructure: Mt Morgan Pipeline | — | — | — | — | — | |||||||||||||||
The government is providing additional funding of $40.4 million over 3 years, held centrally and subject to a business case for construction of a drinking water pipeline from Gracemere to Mt Morgan and necessary water infrastructure upgrades in Gracemere.
86
Budget Measures 2022-23
Department of Resources
| 2021–22 $‘000 | 2022–23 $‘000 | 2023–24 $‘000 | 2024–25 $‘000 | 2025–26 $‘000 | ||||||||||||||||
Queensland Resources Industry Development Plan (QRIDP) Package | — | 10,986 | 11,900 | 6,900 | 5,000 | |||||||||||||||
The government is providing additional funding of $34.8 million over 4 years ($39.8 million over 5 years) to support the implementation of several key initiatives included in the QRIDP. This includes $17.5 million for the Collaborative Exploration Initiative, $10 million for the delivery of airborne and ground based geophysical surveys, $5 million for research to better define Queensland’s new economy minerals potential, $5.7 million for the Resources Centre of Excellence - Future Industries Delivery Hub in Mackay, and $1.6 million for regulatory system improvements. Furthermore, funding of up to $5 million is being met internally by the department to support the development of a Prospect and Program Strategy.
This forms part of the government’s commitment to a $68.5 million package over 5 years to support implementation of the final QRIDP across government. Further details on initiatives can be found in the Department of State Development, Infrastructure, Local Government and Planning, Department of Environment and Science, Department of Employment, Small Business and Training, Department of Justice and the Attorney General, Department of Regional Development, Manufacturing and Water and Department of Agriculture and Fisheries sections of this chapter.
| 2021–22 $‘000 | 2022–23 $‘000 | 2023–24 $‘000 | 2024–25 $‘000 | 2025–26 $‘000 | ||||||||
| Natural Resources Recovery Program | — | 10,000 | 10,000 | 10,000 | 10,000 | |||||||
The government is providing increased funding of $40 million over 4 years and $10 million per annum ongoing to continue the Natural Resources Recovery Program to increase the resilience of Queensland’s landscapes leading to sustained economic outcomes.
87
Budget Measures 2022-23
| 2021–22 $‘000 | 2022–23 $‘000 | 2023–24 $‘000 | 2024–25 $‘000 | 2025–26 $‘000 | ||||||||||||||||
Abandoned Mine Sites Program | — | 6,212 | 5,448 | — | — | |||||||||||||||
The government is providing increased funding of $11.7 million over 2 years to continue the Abandoned Mines Sites - Care and Maintenance, Risk Mitigation and Remediation Program at the former underground coal gasification sites at Hopeland (Linc Energy) and Bloodwood Creek (Carbon Energy) to plug and abandon all wells.
88
Budget Measures 2022-23
Department of Seniors, Disability Services and Aboriginal and Torres Strait Islander Partnerships
| 2021–22 | 2022–23 | 2023–24 | 2024–25 | 2025–26 | ||||||||||||||||
| $‘000 | $‘000 | $‘000 | $‘000 | $‘000 | ||||||||||||||||
Youth Sexual Violence and Abuse | — | 51 | 191 | — | — | |||||||||||||||
The government is providing increased funding of $242,000 over 2 years to continue a youth sexual violence and abuse place-based prevention trial in Yarrabah.
This forms part of the government’s total funding package of $11.3 million over 4 years to continue priority actions to respond to young people who have experienced sexual violence or child sexual abuse. Further details can be found in the Department of Justice and Attorney-General section of this chapter.
| 2021–22 | 2022–23 | 2023–24 | 2024–25 | 2025–26 | ||||||||||||||||
| $‘000 | $‘000 | $‘000 | $‘000 | $‘000 | ||||||||||||||||
Electricity Asset Ownership Dividend and Cost of Living Rebate | — | 385,000 | — | — | — | |||||||||||||||
The government is providing increased funding of $385 million in 2022–23 to provide Queensland households with a Cost of Living Rebate of $175. This Cost of Living Rebate will be the sixth rebate provided through electricity bills since 2017–18 and will be credited on customers’ bills from September 2022.
89
Budget Measures 2022-23
| 2021–22 | 2022–23 | 2023–24 | 2024–25 | 2025–26 | ||||||||||||||||
| $‘000 | $‘000 | $‘000 | $‘000 | $‘000 | ||||||||||||||||
Seniors Strategy and Addressing Gaps in Elder Abuse Prevention and Intervention Services | — | 3,655 | 2,845 | 2,845 | 2,845 | |||||||||||||||
The government is providing increased funding of $12.2 million over 4 years and $2.8 million ongoing to support Seniors in Queensland, including to expand elder abuse services provided under the Seniors Legal and Support Services (SLASS) program to ensure Queenslanders will have equitable access to these important services. Services will be extended to Logan, Beaudesert, Ipswich and Moreton Bay North areas, and will deliver outreach services to the Outback and the Torres and Cape region, where no service is currently available. Funding of $100,000 is being met internally by the department and has been reallocated to future years. Total funding for this program is $12.3 million over 4 years.
| 2021–22 | 2022–23 | 2023–24 | 2024–25 | 2025–26 | ||||||||||||||||
| $‘000 | $‘000 | $‘000 | $‘000 | $‘000 | ||||||||||||||||
Remote Indigenous Land and Infrastructure Program Office | — | 2,694 | 4,087 | 4,266 | 4,439 | |||||||||||||||
The government is providing increased funding of $15.5 million over 4 years and $4.4 million ongoing for addressing land administration requirements and strategic land and Infrastructure program planning initiatives in remote Aboriginal and Torres Strait Islander communities including enabling homeownership opportunities. Funding of $1.2 million is being met internally by the department and has been reallocated to future years. Total funding for this program is $16.7 million over 4 years.
| 2021–22 | 2022–23 | 2023–24 | 2024–25 | 2025–26 | ||||||||||||||||
| $‘000 | $‘000 | $‘000 | $‘000 | $‘000 | ||||||||||||||||
National Disability Insurance Scheme (NDIS) Worker Screening | — | 1,237 | 346 | — | — | |||||||||||||||
The government is providing increased funding of $1.6 million over 2 years for the NDIS Workers Screening program ensuring workers providing services to people with a disability in Queensland meet strict eligibility criteria to be able to maintain high standards of care.
90
Budget Measures 2022-23
| 2021–22 | 2022–23 | 2023–24 | 2024–25 | 2025–26 | ||||||||||||||||
| $‘000 | $‘000 | $‘000 | $‘000 | $‘000 | ||||||||||||||||
Closing the Gap | — | 1,094 | 536 | 731 | 741 | |||||||||||||||
The government is providing increased funding of $3.1 million over 4 years to implement initiatives agreed under the National Agreement on Closing the Gap and improve life outcomes of Aboriginal and Torres Strait Islanders Queenslanders.
| 2021–22 | 2022–23 | 2023–24 | 2024–25 | 2025–26 | ||||||||||||||||
| $‘000 | $‘000 | $‘000 | $‘000 | $‘000 | ||||||||||||||||
Queensland Aboriginal and Torres Strait Islander Coalition | 355 | 690 | 692 | 693 | — | |||||||||||||||
The government is providing additional funding of $2.4 million over 4 years from 2021–22 to 2024–25 for the Queensland Aboriginal and Torres Strait Islander Coalition to undertake research and consultation and provide expert and strategic advice to ensure co-design of strategies and actions, to implement the Closing the Gap National Agreement’s key priorities and targets.
| 2021–22 | 2022–23 | 2023–24 | 2024–25 | 2025–26 | ||||||||||||||||
| $‘000 | $‘000 | $‘000 | $‘000 | $‘000 | ||||||||||||||||
National Redress Scheme | — | 161 | 164 | 169 | 173 | |||||||||||||||
The government is providing increased funding of $667,000 over 4 years to continue operationalisation of the National Redress Scheme for survivors of institutional child sexual abuse in Queensland.
This forms part of the government’s total funding of $25.9 million over 4 years for this initiative. Further details can be found in the Department of Children, Youth Justice and Multicultural Affairs and Department of Communities, Housing and Digital Economy sections of this chapter.
91
Budget Measures 2022-23
| 2021–22 | 2022–23 | 2023–24 | 2024–25 | 2025–26 | ||||||||||||||||
| $‘000 | $‘000 | $‘000 | $‘000 | $‘000 | ||||||||||||||||
Report 1, Hear Her Voice Response - Integrated Service System Responses and High Risk Teams in Additional Locations | — | 89 | 249 | 327 | 501 | |||||||||||||||
The government is providing additional funding of $1.2 million over 4 years and $501,000 per annum ongoing to roll out integrated service system responses and high risk teams in additional locations.
Further details on this initiative can be found in the Department of Justice and Attorney-General, Queensland Police Service, Queensland Corrective Services, Department of Communities, Housing and Digital Economy, Queensland Health, and the Department of Children, Youth Justice and Multicultural Affairs sections of this chapter.
This forms part of the government’s total funding package of $363 million over 5 years ($350 million new funding and $12.9 million internally met) to respond to the recommendations of the Queensland Women’s Safety and Justice Taskforce in Hear her voice - Report One - Addressing coercive control and domestic and family violence in Queensland. Further details on this package are in Chapter 1 of this paper.
| 2021–22 | 2022–23 | 2023–24 | 2024–25 | 2025–26 | ||||||||||||||||
| $‘000 | $‘000 | $‘000 | $‘000 | $‘000 | ||||||||||||||||
Alcohol Management in Remote and Discrete Aboriginal and Torres Strait Islander Communities | — | — | — | — | — | |||||||||||||||
Funding of $1.5 million is being met internally by the department and has been reallocated to 2022–23 to provide grants to support local communities with their Alcohol Management Plans.
92
Budget Measures 2022-23
| 2021–22 | 2022–23 | 2023–24 | 2024–25 | 2025–26 | ||||||||||||||||
| $‘000 | $‘000 | $‘000 | $‘000 | $‘000 | ||||||||||||||||
Disability Royal Commission | — | — | 555 | 285 | — | |||||||||||||||
The government will provide increased funding of $840,000 over 2 years to continue the Queensland Government’s engagement with the Disability Royal Commission and support the significant program of work to be undertaken following the delivery of the final report in preparing a Queensland Government response.
| 2021–22 | 2022–23 | 2023–24 | 2024–25 | 2025–26 | ||||||||||||||||
| $‘000 | $‘000 | $‘000 | $‘000 | $‘000 | ||||||||||||||||
Economic Development Plans | — | — | — | — | — | |||||||||||||||
Funding of $1.9 million is being met internally by the department and has been reallocated to 2022–23 and 2023–24 to support progression of 19 Economic and Development Plans in remote Aboriginal communities.
| 2021–22 | 2022–23 | 2023–24 | 2024–25 | 2025–26 | ||||||||||||||||
| $‘000 | $‘000 | $‘000 | $‘000 | $‘000 | ||||||||||||||||
Meriba Omasker Kaziw Kazipa (Torres Strait Islander Child Rearing Practices) Act 2020 | — | — | 2,050 | — | — | |||||||||||||||
The government is providing increased funding of $2.1 million over 2 years for legal recognition of Torres Strait Islander traditional child rearing practices. Funding of $900,000 is being met internally by the department and has been reallocated across 2022–23 and 2023–24.
This forms part of the government’s total funding of $3.8 million over 2 years for this initiative, including increased funding of $2.8 million and internal funding of $1 million. Further details can be found in the Department of Justice and Attorney-General section of this chapter.
93
Budget Measures 2022-23
Department of State Development, Infrastructure, Local Government and Planning
| 2021–22 | 2022–23 | 2023–24 | 2024–25 | 2025–26 | ||||||||||||||||
| $‘000 | $‘000 | $‘000 | $‘000 | $‘000 | ||||||||||||||||
Disaster Recovery Funding Arrangements Category C & D Extraordinary Packages | 115,700 | 574,034 | 262,954 | 123,992 | — | |||||||||||||||
The government is providing additional funding of $1.077 billion over 4 years under Category C and D of the Disaster Recovery Funding Arrangements to be cost-shared equally between the Queensland and Australian governments. These packages will support a range of recovery and resilience projects following significant flood events in the 2021–22 disaster season.
This forms part of the government’s over $3 billion response to the 2021–22 disaster season.
| 2021–22 | 2022–23 | 2023–24 | 2024–25 | 2025–26 | ||||||||||||||||
| $‘000 | $‘000 | $‘000 | $‘000 | $‘000 | ||||||||||||||||
Resilient Homes Fund | — | 188,300 | 369,500 | 183,200 | — | |||||||||||||||
The government is providing additional funding of $741 million over 3 years under Category D of the Disaster Recovery Funding Arrangements, to be cost-shared equally between the Queensland and Australian governments. The package will support Queensland homeowners to improve the resilience of their residential property, following significant flood events in the 2021–22 disaster season.
This forms part of the government’s over $3 billion response to the 2021–22 disaster season.
94
Budget Measures 2022-23
| 2021-22 | 2022-23 | 2023-24 | 2024-25 | 2025-26 | ||||||||||||||||
| $‘000 | $‘000 | $‘000 | $‘000 | $‘000 | ||||||||||||||||
National Battery Testing Centre | — | 15,000 | — | — | — | |||||||||||||||
The government is providing additional funding of up to $15 million in 2022-23 to support scaling-up the National Battery Testing Centre, subject to contractual arrangements being finalised.
| 2021-22 | 2022-23 | 2023-24 | 2024-25 | 2025-26 | ||||||||||||||||
| $‘000 | $‘000 | $‘000 | $‘000 | $‘000 | ||||||||||||||||
Growth Area Program | — | 5,000 | 5,000 | — | — | |||||||||||||||
The government is providing additional funding of $10 million over 2 years to support the program of work delivered by the Growth Areas Team which aims to address land supply, population growth and property development challenges across South East Queensland. The capital component of this measure can be found in Chapter 3 Capital measures.
| 2021-22 | 2022-23 | 2023-24 | 2024-25 | 2025-26 | ||||||||||||||||
| $‘000 | $‘000 | $‘000 | $‘000 | $‘000 | ||||||||||||||||
Operating Grant Funding Support to South Bank Corporation | 3,395 | 4,733 | — | — | — | |||||||||||||||
The government is providing additional funding of $8.1 million over 2 years to assist the South Bank Corporation to manage its net cash position. The capital component of this measure can be found in Chapter 3 Capital measures.
95
Budget Measures 2022-23
| 2021-22 | 2022-23 | 2023-24 | 2024-25 | 2025-26 | ||||||||||||||||
| $‘000 | $‘000 | $‘000 | $‘000 | $‘000 | ||||||||||||||||
Enhance the Management of Grants and Contracts | 7,000 | 4,000 | — | — | — | |||||||||||||||
The government is providing additional funding of $11 million over 2 years to deliver priority grant programs and to enhance the Queensland Government’s grants administration processes and systems.
| 2021-22 | 2022-23 | 2023-24 | 2024-25 | 2025-26 | ||||||||||||||||
| $‘000 | $‘000 | $‘000 | $‘000 | $‘000 | ||||||||||||||||
Sustainability of Queensland Local Governments | — | 3,000 | 1,000 | 1,000 | — | |||||||||||||||
The government is providing additional funding of $5 million over 3 years to deliver a suite of local government sustainability initiatives focused on supporting Queensland councils address capability, service delivery and financial challenges that are impacting the sector’s long-term sustainability.
| 2021-22 | 2022-23 | 2023-24 | 2024-25 | 2025-26 | ||||||||||||||||
| $‘000 | $‘000 | $‘000 | $‘000 | $‘000 | ||||||||||||||||
Burdekin Shire Council Ayr Water Supply - Infrastructure (Stage 2) Project | — | 2,000 | — | — | — | |||||||||||||||
The government is providing increased funding of $2 million in 2022-23 for the Burdekin Shire Council to complete Stage 2 of the Ayr Water Supply Infrastructure project. Total funding for this program is $12 million over 4 years from 2019-20.
96
Budget Measures 2022-23
| 2021-22 | 2022-23 | 2023-24 | 2024-25 | 2025-26 | ||||||||||||||||
| $‘000 | $‘000 | $‘000 | $‘000 | $‘000 | ||||||||||||||||
Queensland Resources Industry Development Plan (QRIDP) Package | — | 1,745 | 1,745 | 1,995 | 1,000 | |||||||||||||||
The government is providing additional funding of $7.5 million over 5 years to support the implementation of several key initiatives included in the QRIDP. This includes the development of the Queensland Battery Industry Development Strategy, continuing the Mining, Equipment, Technology and Services (METS) Collaborative Project Fund and supporting the METS Accelerator Program.
This forms part of the government’s commitment to a $68.5 million package over 5 years to support implementation of the final QRIDP across government. Further details on initiatives can be found in the Department of Resources, Department of Environment and Science, Department of Employment, Small Business and Training, Department of Justice and the Attorney General, Department of Regional Development, Manufacturing and Water and Department of Agriculture and Fisheries sections of this chapter.
| 2021-22 | 2022-23 | 2023-24 | 2024-25 | 2025-26 | ||||||||||||||||
| $‘000 | $‘000 | $‘000 | $‘000 | $‘000 | ||||||||||||||||
Growth Monitoring Program | — | 1,000 | 1,000 | 1,000 | 1,000 | |||||||||||||||
The government is providing additional funding of $4 million over 4 years and $1 million per annum ongoing to continue the Growth Monitoring Program. The program is a key implementation action of ShapingSEQ and will provide an ongoing robust and transparent evidence based on the region’s land supply and development activity.
| 2021-22 | 2022-23 | 2023-24 | 2024-25 | 2025-26 | ||||||||||||||||
| $‘000 | $‘000 | $‘000 | $‘000 | $‘000 | ||||||||||||||||
Expansion of the Translational Research Institute | — | — | — | — | — | |||||||||||||||
The government is providing additional funding of up to $35.5 million over 4 years, held centrally, subject to the finalisation of a revised business case and appropriate governance arrangements, to support the scaling up of the Translational Research Institute under the Queensland Jobs Fund.
97
Budget Measures 2022-23
| 2021-22 | 2022-23 | 2023-24 | 2024-25 | 2025-26 | ||||||||||||||||
| $‘000 | $‘000 | $‘000 | $‘000 | $‘000 | ||||||||||||||||
Queensland Regional Accommodation Centre | — | — | — | — | — | |||||||||||||||
The government is providing additional funding to deliver and operate the Queensland Regional Accommodation Centre, located at Wellcamp near Toowoomba. This includes a capital contribution towards Queensland’s first purpose-built accommodation centre. Delivery of the centre will occur in 2 stages, with the first 500 beds operational and available to receive guests. A Quarantine Management Taskforce has also been established to oversee and implement the Queensland Government’s COVID-19 Quarantine and Isolation Network Strategy. The capital component of this measure can be found in Chapter 3 Capital measures.
| * | Arrangements are commercial in confidence. |
| 2021-22 | 2022-23 | 2023-24 | 2024-25 | 2025-26 | ||||||||||||||||
| $‘000 | $‘000 | $‘000 | $‘000 | $‘000 | ||||||||||||||||
The South East Queensland City Deal | — | — | — | — | — | |||||||||||||||
The government is providing additional funding of $622.2 million to the South East Queensland City Deal which was signed by the 3 levels of government on 21 March 2022. The City Deal will benefit more than 3.5 million residents, delivering a strategic approach to infrastructure planning and investment to support the fastest growing region in the country, with a focus on accelerating job creation, supporting thriving communities and enhancing the liveability and connectivity of South East Queensland. The capital component of this measure can be found in Chapter 3 Capital Measures.
98
Budget Measures 2022-23
Department of the Premier and Cabinet
| 2021-22 | 2022-23 | 2023-24 | 2024-25 | 2025-26 | ||||||||||||||||
| $‘000 | $‘000 | $‘000 | $‘000 | $‘000 | ||||||||||||||||
Brisbane 2032 Taskforce | — | 26,583 | 18,803 | 6,877 | 7,045 | |||||||||||||||
The government is providing additional funding of $59.3 million over 4 years and $4.7 million per annum ongoing from 2026-27 to support the Brisbane 2032 Taskforce to lead Brisbane 2032 Olympic and Paralympic Games related activities across the Queensland Government. This will support preparation of the 2032 Games Legacy Program and planning and design of Olympics infrastructure including venues and athletes villages.
| 2021-22 | 2022-23 | 2023-24 | 2024-25 | 2025-26 | ||||||||||||||||
| $‘000 | $‘000 | $‘000 | $‘000 | $‘000 | ||||||||||||||||
Screen Queensland - Far North Queensland Studio | 195 | 7,117 | 1,797 | 1,819 | 1,841 | |||||||||||||||
The government is providing increased funding of $12.8 million over 5 years ($13.8 million over 6 years) for the development and operation of the Far North Queensland studio facility. This brings total funding for the studio to $20.6 million.
| 2021-22 | 2022-23 | 2023-24 | 2024-25 | 2025-26 | ||||||||||||||||
| $‘000 | $‘000 | $‘000 | $‘000 | $‘000 | ||||||||||||||||
Report 1, Hear Her Voice Response - Commission of Inquiry into policing responses to domestic and family violence | 786 | 2,709 | — | — | — | |||||||||||||||
The government is providing additional funding of $3.5 million over 2 years to establish a Commission of Inquiry to examine Queensland Police Service responses relating to domestic and family violence.
This forms part of the government’s total funding package of $363 million over 5 years ($350 million new funding and $12.9 million internally met) to respond to the recommendations of the Queensland Women’s Safety and Justice Taskforce in Hear her voice - Report One - Addressing coercive control and domestic and family violence in Queensland. Further details on this package are in Chapter 1 of this paper.
99
Budget Measures 2022-23
| 2021-22 | 2022-23 | 2023-24 | 2024-25 | 2025-26 | ||||||||||||||||
| $‘000 | $‘000 | $‘000 | $‘000 | $‘000 | ||||||||||||||||
Go for Gold Fund (School Sports Infrastructure) | — | 500 | 5,000 | 9,750 | 9,750 | |||||||||||||||
The government is providing additional funding of $25 million over 4 years to establish the Go for Gold Fund (School Sports Infrastructure) program. The program, which is being delivered by the Department of Education, will deliver new and upgraded sports infrastructure for schools across the state, with a focus on promoting health and wellbeing, facilitating increased community use of school sports facilities and encouraging sports participation.
Total funding for the program is $100 million over 4 years. The capital component of this measure can be found in Chapter 3 Capital Measures.
| 2021-22 | 2022-23 | 2023-24 | 2024-25 | 2025-26 | ||||||||||||||||
| $‘000 | $‘000 | $‘000 | $‘000 | $‘000 | ||||||||||||||||
2032 High Performance Strategy | — | — | 15,657 | 15,715 | — | |||||||||||||||
The government will provide increased funding of $31.4 million over 2 years from 2023-24 to extend the 2032 High Performance Strategy to continue to help prepare elite Queensland athletes achieve world class success at Paris 2024 and leading up to the Brisbane 2032 Olympic and Paralympic Games. The strategy is being delivered by the Department of Tourism, Innovation and Sport.
| 2021-22 | 2022-23 | 2023-24 | 2024-25 | 2025-26 | ||||||||||||||||
| $‘000 | $‘000 | $‘000 | $‘000 | $‘000 | ||||||||||||||||
COVID-19 Economic Recovery Initiatives | 3,837 | — | — | — | — | |||||||||||||||
The government has provided additional funding of $3.8 million in 2021-22 for an advertising campaign to build business, industry and community awareness of COVID-19 economic recovery and job creation initiatives.
100
Budget Measures 2022-23
| 2021-22 | 2022-23 | 2023-24 | 2024-25 | 2025-26 | ||||||||||||||||
| $‘000 | $‘000 | $‘000 | $‘000 | $‘000 | ||||||||||||||||
COVID-19 Vaccination Status Campaign | 2,500 | — | — | — | — | |||||||||||||||
The government has provided additional funding of $2.5 million in 2021-22 for a public information and advertising campaign to support the public release of COVID-19 vaccine measures.
| 2021-22 | 2022-23 | 2023-24 | 2024-25 | 2025-26 | ||||||||||||||||
| $‘000 | $‘000 | $‘000 | $‘000 | $‘000 | ||||||||||||||||
Events Sponsorship Fund | — | — | 3,500 | 3,500 | 3,500 | |||||||||||||||
The government will provide increased funding of $10.5 million over 3 years to continue the Events Sponsorship Fund, which aims to attract high value events and deliver initiatives that provide economic, social and cultural outcomes for Queenslanders and profile Queensland’s industries and capabilities.
101
Budget Measures 2022-23
Department of Tourism, Innovation and Sport
| 2021-22 | 2022-23 | 2023-24 | 2024-25 | 2025-26 | ||||||||||||||||
| $‘000 | $‘000 | $‘000 | $‘000 | $‘000 | ||||||||||||||||
Stadiums Queensland Operating Funding | — | 60,000 | 41,000 | 42,025 | 43,076 | |||||||||||||||
The government is providing additional funding of $186.1 million over 4 years to support Stadiums Queensland’s activities to operate and maintain the state’s portfolio of major sporting stadiums and high performance / community venues to a contemporary standard in the lead up to the 2032 Olympic and Paralympic Games. The capital component of this measure can be found in Chapter 3 Capital measures.
| 2021-22 | 2022-23 | 2023-24 | 2024-25 | 2025-26 | ||||||||||||||||
| $‘000 | $‘000 | $‘000 | $‘000 | $‘000 | ||||||||||||||||
Activate! Queensland 2019-2029 | — | 23,677 | 25,000 | 3,000 | — | |||||||||||||||
The government is providing increased funding of $51.7 million over 3 years to support socioeconomic recovery from COVID-19, maximise opportunities to increase physical activity participation including the delivery of Infrastructure Projects in line with Activate! Queensland 2019-2029.
Funding of $300.7 million has been internally met by the department, bringing the total funding for the next 3 years of Activate! Queensland to $352.4 million. The capital component of this measure can be found in Chapter 3 Capital measures.
| 2021-22 | 2022-23 | 2023-24 | 2024-25 | 2025-26 | ||||||||||||||||
| $‘000 | $‘000 | $‘000 | $‘000 | $‘000 | ||||||||||||||||
Tourism Recovery and Development initiatives | 25,000 | 17,900 | 14,500 | 5,000 | — | |||||||||||||||
The government is providing additional funding of $66.4 million over 4 years, with $4 million held centrally, to implement targeted initiatives for tourism recovery and growth that are focused on experience development, tourism infrastructure, ecotourism, events and First Nations tourism.
102
Budget Measures 2022-23
| 2021-22 | 2022-23 | 2023-24 | 2024-25 | 2025-26 | ||||||||||||||||
| $‘000 | $‘000 | $‘000 | $‘000 | $‘000 | ||||||||||||||||
Tourism Business Financial Counselling Service | 700 | 2,240 | — | — | — | |||||||||||||||
The government is providing increased funding of $2.9 million over 2 years to continue the COVID-19 Small Business Financial Counselling Service and the Queensland Tourism Business Counselling Service offering support and advice to assist Queensland small and medium sized-businesses through the impact of COVID-19.
| 2021-22 | 2022-23 | 2023-24 | 2024-25 | 2025-26 | ||||||||||||||||
| $‘000 | $‘000 | $‘000 | $‘000 | $‘000 | ||||||||||||||||
Assistance Package for Brisbane River Commercial Tourism Boat Operators | — | 750 | 350 | — | — | |||||||||||||||
The government is providing additional funding of $1.1 million over 2 years to provide assistance to Brisbane river commercial tourism operators soon to be displaced from their current moorings in the inner-city.
| 2021-22 | 2022-23 | 2023-24 | 2024-25 | 2025-26 | ||||||||||||||||
| $‘000 | $‘000 | $‘000 | $‘000 | $‘000 | ||||||||||||||||
Attracting Aviation Investment Fund | — | — | — | — | — | |||||||||||||||
The government is providing additional funding of $100 million over 3 years, held centrally, for the Attracting Aviation Investment Fund to boost the fund to deliver Queensland’s International Aviation re-entry strategy to secure flights and rebuild the State’s $6 billion international tourism industry after COVID-19. This investment will be matched dollar-for-dollar by industry including the State’s 4 largest airports and Regional Tourism Organisations.
103
Budget Measures 2022-23
| 2021-22 | 2022-23 | 2023-24 | 2024-25 | 2025-26 | ||||||||||||||||
| $‘000 | $‘000 | $‘000 | $‘000 | $‘000 | ||||||||||||||||
Destination Gold Coast Play Money Campaign | 1,000 | — | — | — | — | |||||||||||||||
The government has provided additional funding of $1 million in 2021-22 towards the Destination Gold Coast Play Money Campaign to provide COVID-19 support for retail, dining, services, experiences or accommodation businesses in the southern Gold Coast.
| 2021-22 | 2022-23 | 2023-24 | 2024-25 | 2025-26 | ||||||||||||||||
| $‘000 | $‘000 | $‘000 | $‘000 | $‘000 | ||||||||||||||||
Great Barrier Reef Education Experience Program | — | — | — | — | — | |||||||||||||||
The department is internally funding $2.5 million over 3 years for the continuation of the Great Barrier Reef (GBR) Education Experience Program to support Queensland’s reef tourism operators and GBR regions by supporting Queensland school excursions. This brings the total funding for this program to $3.5 million over 3 years.
| 2021-22 | 2022-23 | 2023-24 | 2024-25 | 2025-26 | ||||||||||||||||
| $‘000 | $‘000 | $‘000 | $‘000 | $‘000 | ||||||||||||||||
Marine Tourism Rebate Round 2 | 3,000 | — | — | — | — | |||||||||||||||
The government has provided increased funding of $3 million in 2021-22 to assist Queensland marine tourism operators with a second round of funding to help with berthing fees in privately-operated marinas from Cooktown to Hervey Bay.
104
Budget Measures 2022-23
| 2021-22 $‘000 | 2022-23 $‘000 | 2023-24 $‘000 | 2024-25 $‘000 | 2025-26 $‘000 | ||||||||||||||||
Tourism and Hospitality Sector Hardship Program | 137,000 | — | — | — | — | |||||||||||||||
The government has provided additional funding of $137 million in 2021-22 to provide grants to both eligible tourism and hospitality businesses, and major tourism attractions and experiences facing significant financial hardship due to COVID-19 travel restrictions and interstate lockdowns. This program included 2 components being the Tourism and Hospitality Sector Hardship Grants scheme for small, medium and large-sized Queensland tourism and hospitality businesses and the Major Tourism Experiences Hardship Grants scheme for Queensland’s major tourism businesses. This program has now closed.
This formed part of the government’s total announced funding of $600 million in 2021-22 for the Business Support Package, jointly funded by the Australian Government, to support businesses impacted by COVID-19 in Queensland.
| 2021-22 $‘000 | 2022-23 $‘000 | 2023-24 $‘000 | 2024-25 $‘000 | 2025-26 $‘000 | ||||||||||||||||
Work in Paradise Campaign | 7,500 | — | — | — | — | |||||||||||||||
The government has provided additional funding of $7.5 million in 2021-22 to help attract workers to the tourism and hospitality sector in northern and western Queensland.
105
Budget Measures 2022-23
Department of Transport and Main Roads
| 2021-22 $‘000 | 2022-23 $‘000 | 2023-24 $‘000 | 2024-25 $‘000 | 2025-26 $‘000 | ||||||||||||||||
Zero Emission Vehicle Strategy 2022-32 and Action Plan 2022-24 | — | 19,000 | 21,000 | 15,000 | — | |||||||||||||||
The government is providing additional funding of $55 million over 3 years for Zero Emission Vehicle (ZEV) purchase subsidies and charging infrastructure. The ZEV purchase subsidy is a $3,000 incentive for anyone buying an electric vehicle upfront to the value of $58,000.
| 2021-22 $‘000 | 2022-23 $‘000 | 2023-24 $‘000 | 2024-25 $‘000 | 2025-26 $‘000 | ||||||||||||||||
Camera Detected Offence Program | — | 15,738 | 16,448 | 15,544 | 14,565 | |||||||||||||||
The government is providing increased funding of $62.3 million over 4 years and $13.8 million per annum ongoing for road safety education and awareness programs and to improve the safety of the sections of state-controlled roads where accidents happen most frequently.
The government is providing total increased funding of $96.3 million over 4 years across departments as part of the Camera Detected Offence Program. Further funding can be found in the Queensland Fire and Emergency Services, Queensland Police Service and Queensland Treasury sections of this chapter. The capital component of this measure can be found Chapter 3 Capital measures.
| 2021-22 $‘000 | 2022-23 $‘000 | 2023-24 $‘000 | 2024-25 $‘000 | 2025-26 $‘000 | ||||||||||||||||
Operational Readiness of the New Generation Rollingstock Fleet for Cross River Rail and European Train Control System | — | 11,063 | 10,325 | 10,596 | 40,875 | |||||||||||||||
The government is providing additional funding of $72.9 million over 4 years ($352.4 million over 24 years) for the maintenance of the European Train Control System (ETCS) and Automatic Train Operation (ATO) hardware for the New Generation Rollingstock (NGR) fleet of 75 trains. The installation of ETCS, ATO and Platform Screen Doors on the NGR fleet will ensure that Cross River Rail is fully operational within the scheduled timeframes. The capital component of this measure can be found in Chapter 3 Capital measures.
106
Budget Measures 2022-23
| 2021-22 $‘000 | 2022-23 $‘000 | 2023-24 $‘000 | 2024-25 $‘000 | 2025-26 $‘000 | ||||||||||||||||
School Transport Infrastructure Program | — | 10,000 | 10,000 | 10,000 | 10,000 | |||||||||||||||
The government is providing increased funding of $40 million over 4 years to continue the School Transport Infrastructure Program (STIP). The STIP provides specific funding to improve the safety and operation of schools through new or improved infrastructure at or on the surrounding road network.
| 2021-22 $‘000 | 2022-23 $‘000 | 2023-24 $‘000 | 2024-25 $‘000 | 2025-26 $‘000 | ||||||||||||||||
Regional Urban Bus Base Budget Uplift | — | 6,720 | — | — | — | |||||||||||||||
The government is providing increased funding of $6.7 million in 2022-23 to support regional urban bus delivery partners who continue to be impacted by fare revenue shortfalls associated with COVID-19 patronage reductions.
| 2021-22 $‘000 | 2022-23 $‘000 | 2023-24 $‘000 | 2024-25 $‘000 | 2025-26 $‘000 | ||||||||||||||||
Taxi Subsidy Scheme | — | 6,462 | 6,620 | 6,894 | 7,206 | |||||||||||||||
The government is providing increased funding of $27.2 million over 4 years and $7.2 million per annum ongoing for the Taxi Subsidy Scheme arising from an increase in taxi fares, an increase in the subsidy cap from $25 to $30 and to meet increased costs associated with lift payments.
107
Budget Measures 2022-23
| 2021-22 $‘000 | 2022-23 $‘000 | 2023-24 $‘000 | 2024-25 $‘000 | 2025-26 $‘000 | ||||||||||||||||
Maintenance and Management of Gold Coast Waterways Access, Connections and Destinations | — | 5,050 | 5,250 | 5,450 | 5,450 | |||||||||||||||
The government is providing increased funding of $21.2 million over 4 years and $5.5 million per annum ongoing for the Gold Coast Waterways Authority to support growing maintenance and management of Gold Coast waterways access, connections and destinations.
| 2021-22 $‘000 | 2022-23 $‘000 | 2023-24 $‘000 | 2024-25 $‘000 | 2025-26 $‘000 | ||||||||||||||||
Bus Services - Priority Investment for Patronage Growth | — | 5,000 | 5,000 | 8,000 | 9,200 | |||||||||||||||
The government is providing increased funding of $27.2 million over 4 years and $11.7 million per annum ongoing to provide an uplift in bus services for highest priority areas, such as northern Gold Coast services, which will also benefit from a further $8.2 million commitment from the City of Gold Coast.
| 2021-22 $‘000 | 2022-23 $‘000 | 2023-24 $‘000 | 2024-25 $‘000 | 2025-26 $‘000 | ||||||||||||||||
War on Wrecks (Addressing Derelict Vessels) | — | 5,000 | 5,000 | 5,000 | — | |||||||||||||||
The government is providing increased funding of $15 million over 3 years to continue the War on Wrecks initiative. Removing derelict vessels and continuing the strategic policy development is critical for keeping our waterways safe and clean.
108
Budget Measures 2022-23
| 2021-22 $‘000 | 2022-23 $‘000 | 2023-24 $‘000 | 2024-25 $‘000 | 2025-26 $‘000 | ||||||||||||||||
New Payment Rates for Government Contracted School Transport Delivery Partners (School Transport Assistance Scheme) | 1,877 | 3,754 | 6,676 | 9,671 | 12,740 | |||||||||||||||
The government is providing increased funding of $34.7 million over 5 years and $12.7 million per annum ongoing (indexed) to implement new, more transparent payment rates and a simple indexation methodology for school contracts from April 2022.
| 2021-22 $‘000 | 2022-23 $‘000 | 2023-24 $‘000 | 2024-25 $‘000 | 2025-26 $‘000 | ||||||||||||||||
Fare Reform for Queensland Regional Urban Bus Services to Support Smart Ticketing | 3,864 | 3,486 | 3,586 | 3,723 | 3,816 | |||||||||||||||
The government is providing increased funding of $18.5 million over 5 years and $3.8 million per annum ongoing (indexed) for fare reform for Queensland’s regional urban bus services to support Smart Ticketing. The regional fare reforms comprise simplification of regional fares and zones, alignment of top-up fares payable by students eligible for the School Transport Assistance Scheme and extension of South East Queensland fare products and incentives State-wide.
| 2021-22 $‘000 | 2022-23 $‘000 | 2023-24 $‘000 | 2024-25 $‘000 | 2025-26 $‘000 | ||||||||||||||||
Maritime Infrastructure Program | — | 2,337 | 3,000 | — | — | |||||||||||||||
The government is providing increased funding of $5.3 million over 2 years for navigational aids and the Horn Island pontoon upgrade. The capital component of this measure can be found in Chapter 3 Capital measures.
109
Budget Measures 2022-23
| 2021-22 $‘000 | 2022-23 $‘000 | 2023-24 $‘000 | 2024-25 $‘000 | 2025-26 $‘000 | ||||||||||||||||
Operational Readiness of the New Generation Rollingstock Fleet for Cross River Rail Automatic Train Operation and Platform Screen Doors | 329 | 1,459 | 7,190 | 7,378 | 7,572 | |||||||||||||||
The government is providing additional funding of $23.9 million over 5 years for the ongoing maintenance of Automatic Train Operation (ATO) on-board software and Platform Screen Doors (PSD) on-board equipment for the New Generation Rollingstock (NGR) fleet of 75 trains. The installation of ATO and PSD on the NGR fleet will ensure that Cross River Rail is fully operational within the scheduled timeframes. The capital component of this measure can be found in Chapter 3 Capital measures.
| 2021-22 $‘000 | 2022-23 $‘000 | 2023-24 $‘000 | 2024-25 $‘000 | 2025-26 $‘000 | ||||||||||||||||
School Transport Assistance Scheme Funding for Students Living in Shared Care Arrangements | — | 526 | 7,109 | 6,079 | 5,197 | |||||||||||||||
The government is providing increased funding of $18.9 million over 4 years and $4.3 million per annum ongoing to expand the School Transport Assistance Scheme eligibility to include students living in shared care arrangements travelling from a second address.
| 2021-22 $‘000 | 2022-23 $‘000 | 2023-24 $‘000 | 2024-25 $‘000 | 2025-26 $‘000 | ||||||||||||||||
Future South East Queensland Level Crossing Program | — | 500 | 500 | 500 | — | |||||||||||||||
The government is providing additional funding of $1.5 million over 3 years for the Coorparoo Precinct planning as part of the state’s tripartite negotiations with project partners (Australian and local governments).
110
Budget Measures 2022-23
| 2021-22 $‘000 | 2022-23 $‘000 | 2023-24 $‘000 | 2024-25 $‘000 | 2025-26 $‘000 | ||||||||||||||||
School Crossing Supervisor Expansion Scheme | — | 301 | 736 | 1,045 | 1,071 | |||||||||||||||
The government is providing increased funding of $3.2 million over 4 years and $1.1 million per annum ongoing to expand the School Crossing Supervisor Scheme to appropriately staff 83 additional sites that have been identified as high safety risk for school children and would benefit from the establishment of a supervised crossing.
| 2021-22 $‘000 | 2022-23 $‘000 | 2023-24 $‘000 | 2024-25 $‘000 | 2025-26 $‘000 | ||||||||||||||||
Townsville Connection Road Bowen Road Bridge Duplication | — | 60 | 60 | 93 | 813 | |||||||||||||||
The government is providing increased funding of $2.1 million over 5 years (2022-23 to 2026-27) for Stage 3 of the Townsville Connection Road upgrade. The capital component of this measure can be found in Chapter 3 Capital measures.
| 2021-22 $‘000 | 2022-23 $‘000 | 2023-24 $‘000 | 2024-25 $‘000 | 2025-26 $‘000 | ||||||||||||||||
Long term Transport Infrastructure Commitments | — | — | — | — | 14,150 | |||||||||||||||
The government will provide increased funding of $14.2 million in 2025-26 for the state contribution for the following projects, reflecting prior election commitments: Pacific Motorway: Daisy Hill to Logan Motorway upgrade; Inland Freight Route (Mungindi to Charters Towers); Boundary Road (Coopers Plains) rail level crossing; Mooloolah River Interchange Upgrade -Stage 1; and Roads of Strategic Importance Mount Isa to Rockhampton corridor state matching. The capital component of this measure can be found in Chapter 3 Capital measures.
111
Budget Measures 2022-23
| 2021-22 $‘000 | 2022-23 $‘000 | 2023-24 $‘000 | 2024-25 $‘000 | 2025-26 $‘000 | ||||||||||||||||
Rail Transport Service Contract | — | — | 37,351 | 125,567 | 157,026 | |||||||||||||||
The government will provide increased funding of $314.9 million over 3 years from 2023-24, and $153.9 million per annum ongoing, to support additional activities to be delivered under the Rail Transport Service Contract and includes support indexation of rail concessions and alternative transport schemes.
112
Budget Measures 2022-23
Legislative Assembly of Queensland
| 2021-22 $‘000 | 2022-23 $‘000 | 2023-24 $‘000 | 2024-25 $‘000 | 2025-26 $‘000 | ||||||||||||||||
Legislative Assembly Supplementary Funding | — | 2,200 | 2,200 | 2,200 | 2,200 | |||||||||||||||
The government is providing increased funding of $8.8 million over 4 years and $2.2 million per annum ongoing to support various operating costs and associated increases related to software and ICT support costs, select committee and committee inquiry costs, maintenance of plant and equipment, and precinct event and visitor management costs.
| 2021-22 $‘000 | 2022-23 $‘000 | 2023-24 $‘000 | 2024-25 $‘000 | 2025-26 $‘000 | ||||||||||||||||
Electorate Office Technology Model | — | 1,378 | 1,507 | 1,227 | 1,227 | |||||||||||||||
The government is providing increased funding of $5.3 million over 4 years and $1.2 million per annum ongoing to continue the Electorate Office Technology Model delivering improved data service performance and reliability, data security, mobility and business tools through provision of new software and infrastructure.
| 2021-22 $‘000 | 2022-23 $‘000 | 2023-24 $‘000 | 2024-25 $‘000 | 2025-26 $‘000 | ||||||||||||||||
Electorate Office Security Upgrade (CCTV) | — | 49 | 171 | 171 | 171 | |||||||||||||||
The government is providing additional funding of $562,000 over 4 years and $171,000 per annum ongoing to improve electorate office security through the installation of a standardised CCTV monitoring system in each electorate office across Queensland. The capital component of this measure can be found in Chapter 3 Capital measures.
113
Budget Measures 2022-23
Office of the Governor
| 2021-22 $‘000 | 2022-23 $‘000 | 2023-24 $‘000 | 2024-25 $‘000 | 2025-26 $‘000 | ||||||||||||||||
Security Upgrades at Government House | — | 1,833 | — | — | — | |||||||||||||||
The government is providing additional funding of $1.8 million in 2022-23 for the provision of enhanced security measures at the Government House Estate. Funding of $420,000 is being met internally by the Office of the Governor to complete the upgrade program. Total funding for this program is $2.3 million in 2022-23.
| 2021-22 $‘000 | 2022-23 $‘000 | 2023-24 $‘000 | 2024-25 $‘000 | 2025-26 $‘000 | ||||||||||||||||
Office of the Governor - Expanded Work Program | — | 638 | 652 | 666 | 680 | |||||||||||||||
The government is providing additional funding of $2.6 million over four years and $680,000 per annum ongoing to support the expanded work program of the new Governor of Queensland.
114
Budget Measures 2022-23
Queensland Corrective Services
| 2021-22 $‘000 | 2022-23 $‘000 | 2023-24 $‘000 | 2024-25 $‘000 | 2025-26 $‘000 | ||||||||||||||||
Infrastructure Works | — | 32,800 | 14,000 | 14,000 | 14,000 | |||||||||||||||
The government is providing increased funding of $74.8 million over 4 years and $14 million per annum ongoing to progress infrastructure works, provide body worn cameras and support ongoing maintenance and replacement programs. The capital component of this measure can be found in Chapter 3 Capital measures.
| 2021-22 $‘000 | 2022-23 $‘000 | 2023-24 $‘000 | 2024-25 $‘000 | 2025-26 $‘000 | ||||||||||||||||
Parole Board Queensland | — | 11,137 | 8,454 | 310 | 317 | |||||||||||||||
The government is providing increased funding of $20.2 million over 4 years and $317,000 per annum ongoing to enhance Parole Board Queensland operations to enable efficient consideration of parole matters.
| 2021-22 $‘000 | 2022-23 $‘000 | 2023-24 $‘000 | 2024-25 $‘000 | 2025-26 $‘000 | ||||||||||||||||
Queensland Parole System Review Report Recommendations | — | 10,679 | 10,819 | 5,962 | 6,108 | |||||||||||||||
The government is providing increased funding of $33.6 million over 4 years and $6.1 million per annum ongoing to transition the Queensland Parole System Review recommendations to business as usual, trial end-to-end case management in multiple correctional centres and improve recruitment and training for Community Corrections officers.
115
Budget Measures 2022-23
| 2021-22 $‘000 | 2022-23 $‘000 | 2023-24 $‘000 | 2024-25 $‘000 | 2025-26 $‘000 | ||||||||||||||||
Commissioning of Southern Queensland Correctional Precinct Stage 2 | — | 4,240 | 23,992 | — | — | |||||||||||||||
The government is providing increased funding of $28.2 million over 2 years to establish a commissioning project team and appoint the correctional centre leadership team in preparation for the operation of Stage 2 of the Southern Queensland Correctional Precinct.
| 2021-22 $‘000 | 2022-23 $‘000 | 2023-24 $‘000 | 2024-25 $‘000 | 2025-26 $‘000 | ||||||||||||||||
Psychological and Disability Services | — | 2,936 | — | — | — | |||||||||||||||
The government is providing increased funding of $2.9 million in 2022-23 for psychological and disability services resourcing to ensure continuity of core frontline services, uphold human rights, and minimise the risk to community safety.
| 2021-22 $‘000 | 2022-23 $‘000 | 2023-24 $‘000 | 2024-25 $‘000 | 2025-26 $‘000 | ||||||||||||||||
Report 1 - Hear Her Voice Response - Continue to Roll Out Specialist Domestic and Family Violence Courts | — | 1,800 | 1,800 | 1,800 | 1,800 | |||||||||||||||
The government is providing additional funding of $7.2 million over 4 years and $1.8 million ongoing to continue to enhance and roll out specialist domestic and family violence courts. The department is also internally funding $350,000 in 2022-23 to fund other initiatives in response to the Women’s Safety and Justice Taskforce’s report.
This forms part of the government’s total funding package of $363 million over 5 years ($350 million new funding and $12.9 million internally met) to respond to the recommendations of the Queensland Women’s Safety and Justice Taskforce in Hear her voice - Report One - Addressing coercive control and domestic and family violence in Queensland. Further details on this package are in Chapter 1 of this paper.
Further details can be found in the Department of Justice and Attorney-General and Queensland Police Service sections of this chapter.
116
Budget Measures 2022-23
| 2021-22 $‘000 | 2022-23 $‘000 | 2023-24 $‘000 | 2024-25 $‘000 | 2025-26 $‘000 | ||||||||||||||||
Electronic Security Upgrade | — | 1,000 | — | — | — | |||||||||||||||
The government is providing additional funding of $1 million in 2022-23 to undertake a competitive tender for procurement of a multi-service provider solution for Queensland Corrective Services’ Electronic Security System. The capital component of this measure can be found in Chapter 3 Capital measures.
| 2021-22 $‘000 | 2022-23 $‘000 | 2023-24 $‘000 | 2024-25 $‘000 | 2025-26 $‘000 | ||||||||||||||||
Women in Custody | — | 162 | 167 | 172 | 176 | |||||||||||||||
The government is providing increased funding of $677,000 over 4 years and $176,000 per annum ongoing for the Women in Custody program.
Further details can be found in the Department of Justice and Attorney-General section of this chapter.
This forms part of the government’s total funding package of $11.9 million over 4 years to continue frontline specialist support to women in contact with the criminal justice and custodial systems, addressing the specific and complex needs of women to reduce their risk of entering or returning to prison.
| 2021-22 $‘000 | 2022-23 $‘000 | 2023-24 $‘000 | 2024-25 $‘000 | 2025-26 $‘000 | ||||||||||||||||
Report 1, Hear Her Voice Response - Integrated Service System Responses and High Risk Teams in Additional Locations | — | 76 | 217 | 267 | 418 | |||||||||||||||
The government is providing additional funding of $978,000 over 4 years and $418,000 ongoing to roll out integrated service system responses and high risk teams in additional locations.
Further details can be found in the Department of Justice and Attorney-General, Queensland Police Service, Department of Communities, Housing and Digital Economy, Department of Children, Youth Justice and Multicultural Affairs, Queensland Health, and Department of Seniors, Disability Services and Aboriginal and Torres Strait Islander Partnerships sections of this chapter.
This forms part of the government’s total funding package of $363 million over 5 years ($350 million new funding and $12.9 million internally met) to respond to the recommendations of
117
Budget Measures 2022-23
the Queensland Women’s Safety and Justice Taskforce in Hear her voice - Report One - Addressing coercive control and domestic and family violence in Queensland. Further details on this package are in Chapter 1 of this paper.
| 2021-22 $‘000 | 2022-23 $‘000 | 2023-24 $‘000 | 2024-25 $‘000 | 2025-26 $‘000 | ||||||||||||||||
Integrated Offender Management System | — | — | — | — | — | |||||||||||||||
The government is providing additional funding of $14.1 million over 4 years, held centrally, to enhance the Integrated Offender Management System to support frontline correctional operations. The capital component of this measure can be found in Chapter 3 Capital measures.
| 2021-22 $‘000 | 2022-23 $‘000 | 2023-24 $‘000 | 2024-25 $‘000 | 2025-26 $‘000 | ||||||||||||||||
Queensland Corrective Services - Capacity Demands and COVID-19 | 50,000 | — | — | — | — | |||||||||||||||
The government is providing increased funding of $100 million over 2 years, with $50 million held centrally in 2022-23, to meet additional expenditure incurred due to sustained capacity demands, COVID-19 and other unavoidable costs.
| 2021-22 $‘000 | 2022-23 $‘000 | 2023-24 $‘000 | 2024-25 $‘000 | 2025-26 $‘000 | ||||||||||||||||
State-wide Women’s Re- entry Service | — | — | — | — | — | |||||||||||||||
The government is providing increased funding of $8 million over 4 years and $2 million per annum ongoing, held centrally, to provide a single model of re-entry services in Queensland.
118
Budget Measures 2022-23
Queensland Fire and Emergency Services
| 2021-22 $‘000 | 2022-23 $‘000 | 2023-24 $‘000 | 2024-25 $‘000 | 2025-26 $‘000 | ||||||||||||||||
Camera Detected Offence Program | — | 154 | 1,158 | 162 | 166 | |||||||||||||||
The government is providing increased funding of $1.6 million over four years, and $166,000 ongoing (with an additional $1 million every 3 years commencing 2026-27), to continue and enhance public awareness for road safety activities led by Queensland Fire and Emergency Services, including the “If It’s Flooded, Forget It” campaign.
This forms part of the government’s total increased funding of $96.3 million over 4 years across departments as part of the Camera Detected Offence Program. Further funding can be found in the Department of Transport and Main Roads, Queensland Police Service and Queensland Treasury sections of this chapter. The capital component of this measure can be found in the Department of Transport and Main Roads section of Chapter 3 Capital measures.
| 2021-22 $‘000 | 2022-23 $‘000 | 2023-24 $‘000 | 2024-25 $‘000 | 2025-26 $‘000 | ||||||||||||||||
COVID-19 Response | — | — | — | — | — | |||||||||||||||
The government has provided additional funding of up to $61.3 million in 2021-22, held centrally, to continue to support COVID-19 hotel accommodation. This is in addition to the $232.25 million available from 1 July 2021.
| 2021-22 $‘000 | 2022-23 $‘000 | 2023-24 $‘000 | 2024-25 $‘000 | 2025-26 $‘000 | ||||||||||||||||
Queensland Emergency Operations Centre critical upgrade | — | — | — | — | — | |||||||||||||||
The government is providing additional funding of $12.8 million over 4 years, and $600,000 ongoing to 2027-28, to be held centrally, to modernise and maintain the Queensland Emergency Operations Centre’s critical information communications technology and audiovisual infrastructure.
119
Budget Measures 2022-23
| 2021-22 $‘000 | 2022-23 $‘000 | 2023-24 $‘000 | 2024-25 $‘000 | 2025-26 $‘000 | ||||||||||||||||
Supporting Volunteer Emergency Response Entities | — | — | — | — | — | |||||||||||||||
The government has committed increased funding of $20 million in 2022-23 to enhance operational capability and risk management for the State Emergency Service (SES). This includes a $10 million capital boost for equipment and facilities, including new SES flood boats and upgraded facilities for the Lowood SES Group.
The government has committed increased funding of $8 million in 2022-23 to support operational capability for marine rescue services, including an additional $5 million to accelerate the rescue vessels replacement program.
The government has committed increased funding of $10 million in 2022-23 for new Rural Fire Service facilities, including funding for a new facility for Rural Fire Brigades in the Maryborough Region.
120
Budget Measures 2022-23
Queensland Health
| 2021-22 $‘000 | 2022-23 $‘000 | 2023-24 $‘000 | 2024-25 $‘000 | 2025-26 $‘000 | ||||||||||||||||
Operational Growth Funding | — | 777,282 | 1,771,005 | 1,999,413 | 2,236,219 | |||||||||||||||
The government is providing increased funding of $6.784 billion over 4 years to support the ongoing growth in demand for health and ambulance services.
| 2021-22 $‘000 | 2022-23 $‘000 | 2023-24 $‘000 | 2024-25 $‘000 | 2025-26 $‘000 | ||||||||||||||||
Mental Health, Alcohol and Other Drugs Services Funding | — | 119,871 | 301,353 | 397,550 | 407,677 | |||||||||||||||
The government is providing additional funding of $1.645 billion over 5 years for Queensland Health’s new 5 year plan, Better Care Together. This will be funded through a new mental health levy proposed to commence from 1 January 2023. Better Care Together will improve mental health, alcohol and other drugs services as well as the suicide prevention system of care and support. The capital component of this measure can be found in Chapter 3 Capital measures.
| 2021-22 $‘000 | 2022-23 $‘000 | 2023-24 $‘000 | 2024-25 $‘000 | 2025-26 $‘000 | ||||||||||||||||
Royal Flying Doctor Service | — | 25,201 | 28,190 | 31,808 | 32,664 | |||||||||||||||
The government is providing additional funding of $117.9 million over 4 years ($333.7 million over 10 years) for Queensland Health to enter a new single 10-year Standing Offer Arrangement with the Royal Flying Doctor Service.
121
Budget Measures 2022-23
| 2021-22 $‘000 | 2022-23 $‘000 | 2023-24 $‘000 | 2024-25 $‘000 | 2025-26 $‘000 | ||||||||||||||||
Healthcare Services for Vulnerable Queenslanders | — | 14,720 | 22,553 | 23,981 | 26,662 | |||||||||||||||
The government is providing additional funding of $87.9 million over 4 years and $26.7 million ongoing to deliver primary healthcare services to prisoners. This includes mental health and oral health services for the new Southern Queensland Correction Centre Stage 2 as well as nursing home type care for people who are unable to be released from Queensland Corrective Services Custody.
| 2021-22 $‘000 | 2022-23 $‘000 | �� | 2023-24 $‘000 | 2024-25 $‘000 | 2025-26 $‘000 | |||||||||||||||
Voluntary Assisted Dying Scheme | 3,332 | 6,014 | — | — | — | |||||||||||||||
The government is providing additional funding of $9.3 million over 2 years to support information and communciation technology, clinical and administrative implementation of the Voluntary Assisted Dying Scheme. The capital component of this measure can be found in Chapter 3 Capital measures.
| 2021-22 $‘000 | 2022-23 $‘000 | 2023-24 $‘000 | 2024-25 $‘000 | 2025-26 $‘000 | ||||||||||||||||
Public Skin Cancer Prevention Campaign and Pop-up Clinics | — | 2,374 | 2,004 | 2,004 | 2,004 | |||||||||||||||
The government is providing additional funding of $8.4 million over 4 years to deliver a skin cancer prevention campaign and pop-up skin cancer screening clinics.
122
Budget Measures 2022-23
| 2021-22 $‘000 | 2022-23 $‘000 | 2023-24 $‘000 | 2024-25 $‘000 | 2025-26 $‘000 | ||||||||||||||||
Infrastructure Maintenance Program | — | 1,547 | 301 | — | — | |||||||||||||||
The government is providing increased funding of $1.8 million over 2 years to support Tranche 2 of the Infrastructure Maintenance Program. The capital component of this measure can be found in Chapter 3 Capital measures.
| 2021-22 $‘000 | 2022-23 $‘000 | 2023-24 $‘000 | 2024-25 $‘000 | 2025-26 $‘000 | ||||||||||||||||
COVID-19 Funding | 200,000 | — | — | — | — | |||||||||||||||
The government has provided increased funding of $200 million in 2021-22 for the continuation of the COVID-19 health response.
| 2021-22 $‘000 | 2022-23 $‘000 | 2023-24 $‘000 | 2024-25 $‘000 | 2025-26 $‘000 | ||||||||||||||||
Queensland Regional Aeromedical Hub | 15,420 | — | — | — | — | |||||||||||||||
The government has provided increased funding of $15.4 million in 2021-22 as a capital contribution to the Aeromedical Hub project for the Royal Flying Doctor Service and LifeFlight. The capital component of this measure can be found in Chapter 3 Capital measures.
| 2021-22 $‘000 | 2022-23 $‘000 | 2023-24 $‘000 | 2024-25 $‘000 | 2025-26 $‘000 | ||||||||||||||||
Report 1, Hear Her Voice Response - Integrated Service System Responses and High Risk Teams in additional locations | — | — | — | — | — | |||||||||||||||
Funding of $2.9 million over 4 years and $1 million per annum ongoing is being internally met by the department to roll out integrated service system responses and high risk teams in additional locations. This will include collaboration with alcohol and other drug, mental health, and domestic and family violence networks to improve service responses.
This forms part of the government’s total funding package of $363 million over 5 years ($350 million new funding and $12.9 million internally met) to respond to the recommendations of the Queensland Women’s Safety and Justice Taskforce in Hear her voice - Report One - Addressing coercive control and domestic and family violence in Queensland . Further details
123
Budget Measures 2022-23
on this package are in Chapter 1 of this paper.
Further details can be found in the Department of Justice and Attorney-General, Queensland Police Service, Queensland Corrective Services, Department of Communities, Housing and Digital Economy, Department of Children, Youth Justice and Multicultural Affairs, and Department of Seniors, Disability Services and Aboriginal and Torres Strait Islander Partnerships sections of this chapter.
124
Budget Measures 2022-23
Queensland Police Service
| 2021-22 $‘000 | 2022-23 $‘000 | 2023-24 $‘000 | 2024-25 $‘000 | 2025-26 $‘000 | ||||||||||||||||
Queensland Government Air | — | 7,380 | — | — | — | |||||||||||||||
The government is providing additional funding of $7.4 million in 2022-23 to ensure the ongoing delivery of Queensland Government Air (QGAir) services. This funding enables QGAir to continue providing aviation support for search and rescue, natural disasters, police and aeromedical operations, including organ retrievals, and transport services for government. The capital component of this measure can be found in Chapter 3 Capital measures.
| 2021-22 $‘000 | 2022-23 $‘000 | 2023-24 $‘000 | 2024-25 $‘000 | 2025-26 $‘000 | ||||||||||||||||
Youth Justice Investment - Five Point Plan | — | 3,484 | — | — | — | |||||||||||||||
The government is providing increased funding of $3.5 million in 2022-23 for the continuation of the 5 Point Plan to address youth crime.
This forms part of the government’s total investment of $78.8 million over 4 years ($77.2 million new funding and $1.6 million internally funded) and $18.9 million per annum ongoing ($18.5 million new funding and $400,000 being met internally) to continue effective elements of the Youth Justice Strategy Reforms to address serious repeat offending. Further details can be found in the Department of Children, Youth Justice and Multicultural Affairs section of this chapter.
125
Budget Measures 2022-23
| 2021-22 $‘000 | 2022-23 $‘000 | 2023-24 $‘000 | 2024-25 $‘000 | 2025-26 $‘000 | ||||||||||||||||
Relocation of the Oxley Police Academy to Wacol | — | 2,000 | — | — | — | |||||||||||||||
The government is providing additional funding of $2 million in 2022-23 to develop a business case for the relocation of the Oxley Police Academy, and other co-located Queensland Police Service functions, to the Wacol Police Precinct or other appropriate new sites.
| 2021-22 $‘000 | 2022-23 $‘000 | 2023-24 $‘000 | 2024-25 $‘000 | 2025-26 $‘000 | ||||||||||||||||
QLiTE | 1,992 | 1,992 | 2,042 | 2,093 | 2,145 | |||||||||||||||
The government is providing increased funding of $10.3 million over 5 years from 2021-22 and $2.1 million per annum ongoing from 2026-27 for the continuation of the 1,400 QLiTE program to support frontline policing.
| 2021-22 $‘000 | 2022-23 $‘000 | 2023-24 $‘000 | 2024-25 $‘000 | 2025-26 $‘000 | ||||||||||||||||
Replacement of Weapons Licensing Management System | — | 1,616 | — | — | — | |||||||||||||||
The government is providing additional funding of $1.6 million in 2022-23 to ensure the firearms register is up to date and accurate and commence the replacement of the Weapons Licensing Management System.
| 2021-22 $‘000 | 2022-23 $‘000 | 2023-24 $‘000 | 2024-25 $‘000 | 2025-26 $‘000 | ||||||||||||||||
Camera Detected Offence Program | — | 1,514 | 1,890 | 2,274 | 2,668 | |||||||||||||||
The government is providing increased funding of $8.3 million over 4 years and $2.7 million per annum ongoing for road safety initiatives.
The government is providing total increased funding of $96.3 million over 4 years across departments as part of the Camera Detected Offence Program. Further funding can be found in the Department of Transport and Main Roads, Queensland Fire and Emergency Services and Queensland Treasury sections of this chapter. The capital component of this measure can be found in the Department of Transport and Main Roads section of Chapter 3 Capital measures.
126
Budget Measures 2022-23
| 2021-22 $‘000 | 2022-23 $‘000 | 2023-24 $‘000 | 2024-25 $‘000 | 2025-26 $‘000 | ||||||||||||||||
Body Worn Camera Digital Capability | — | 1,031 | 4,943 | 5,338 | 5,338 | |||||||||||||||
The government is providing increased funding of $16.7 million over 4 years and $5.3 million per annum ongoing from 2026-27 to continue the operation of body worn cameras to provide more effective and efficient policing services to the people of Queensland.
| 2021-22 $‘000 | 2022-23 $‘000 | 2023-24 $‘000 | 2024-25 $‘000 | 2025-26 $‘000 | ||||||||||||||||
Road Safety Anti Hooning Maximum Saturation Deterrence Trial | — | 911 | — | — | — | |||||||||||||||
The government is providing additional funding of $911,000 in 2022-23 to undertake a road safety anti hooning maximum saturation deterrence trial and evaluation. The capital component of this measure can be found in Chapter 3 Capital measures.
| 2021-22 $‘000 | 2022-23 $‘000 | 2023-24 $‘000 | 2024-25 $‘000 | 2025-26 $‘000 | ||||||||||||||||
Report 1, Hear Her Voice Response - Continue to Roll Out Specialist Domestic and Family Violence Courts | — | 322 | 684 | 1,094 | 1,121 | |||||||||||||||
The government is providing additional funding of $3.2 million over 4 years and $1.1 million per annum ongoing to continue to enhance and roll out specialist domestic and family violence courts.
This forms part of the government’s total funding package of $363 million over 5 years ($350 million new funding and $12.9 million internally met) to respond to the recommendations of the Queensland Women’s Safety and Justice Taskforce in Hear her voice - Report One -Addressing coercive control and domestic and family violence in Queensland. Further details on this package are in Chapter 1 of this paper.
Further details can be found in the Department of Justice and Attorney-General and Queensland Corrective Services sections of this chapter.
127
Budget Measures 2022-23
| 2021-22 $‘000 | 2022-23 $‘000 | 2023-24 $‘000 | 2024-25 $‘000 | 2025-26 $‘000 | ||||||||||||||||
Client Management System Program | — | — | — | — | — | |||||||||||||||
The government is providing additional funding, held centrally, to develop a full business case for the Client Management System Program.
| 2021-22 $‘000 | 2022-23 $‘000 | 2023-24 $‘000 | 2024-25 $‘000 | 2025-26 $‘000 | ||||||||||||||||
Electronic Monitoring of Adult Bailees | — | — | — | — | — | |||||||||||||||
The government is providing funding for the continuation of electronic monitoring of adult bailees.
| 2021-22 $‘000 | 2022-23 $‘000 | 2023-24 $‘000 | 2024-25 $‘000 | 2025-26 $‘000 | ||||||||||||||||
Queensland Police Service Response to COVID-19 | — | — | — | — | — | |||||||||||||||
The government has provided additional funding of $5.3 million in 2021-22 to supplement COVID-19 compliance activities. The government is also providing increased funding of $5.6 million in 2022-23 to continue supporting COVID-19 compliance activities. The funding is to be held centrally and released on an acquittal basis.
| 2021-22 $‘000 | 2022-23 $‘000 | 2023-24 $‘000 | 2024-25 $‘000 | 2025-26 $‘000 | ||||||||||||||||
Report 1, Hear Her Voice Response - Domestic and Family Violence and Coercive Control Training and Education | — | — | — | — | — | |||||||||||||||
The government is providing additional funding of $17.5 million over 4 years and $4.4 million per annum ongoing, held centrally, for the delivery of enhanced education and training on domestic and family violence and coercive control to all levels of the service. The capital component of this measure can be found in Chapter 3 Capital measures.
This forms part of the government’s total funding package of $363 million over 5 years ($350 million new funding and $12.9 million internally met) to respond to the recommendations of the Queensland Women’s Safety and Justice Taskforce in Hear her voice - Report One -
128
Budget Measures 2022-23
Addressing coercive control and domestic and family violence in Queensland. Further details on this package are in Chapter 1 of this paper.
| 2021-22 $‘000 | 2022-23 $‘000 | 2023-24 $‘000 | 2024-25 $‘000 | 2025-26 $‘000 | ||||||||||||||||
Report 1, Hear Her Voice Response - Integrated Service System Responses and High Risk Teams in Additional Locations | — | — | — | — | — | |||||||||||||||
Funding of $2.8 million over 4 years and $1.2 million per annum ongoing is being internally met by the department to roll out integrated service system responses and High Risk Teams in additional locations.
This forms part of the government’s total funding package of $363 million over 5 years ($350 million new funding and $12.9 million internally met) to respond to the recommendations of the Queensland Women’s Safety and Justice Taskforce in Hear her voice - Report One -Addressing coercive control and domestic and family violence in Queensland. Further details on this package are in Chapter 1 of this paper.
Further details can be found in the Department of Justice and Attorney-General, Queensland Corrective Services, Department of Communities, Housing and Digital Economy, Department of Children, Youth Justice and Multicultural Affairs, Queensland Health, and Department of Seniors, Disability Services and Aboriginal and Torres Strait Islander Partnerships sections of this chapter.
| 2021-22 $‘000 | 2022-23 $‘000 | 2023-24 $‘000 | 2024-25 $‘000 | 2025-26 $‘000 | ||||||||||||||||
Report 1, Hear Her Voice Response - Review and Update of Domestic and Family Violence Operational Policy and Procedures and Risk Assessment Processes | — | — | — | — | — | |||||||||||||||
The government is providing additional funding of $6.8 million over 4 years, held centrally, to ensure operational policies and procedures guide police in identifying and responding to domestic and family violence as a pattern of behaviour over time and to review risk assessment processes in consultation with First Nations stakeholders and people with lived experience of domestic and family violence. The capital component of this measure can be found in Chapter 3 Capital measures.
This forms part of the government’s total funding package of $363 million over 5 years ($350 million new funding and $12.9 million internally met) to respond to the recommendations of the Queensland Women’s Safety and Justice Taskforce in Hear her voice - Report One -
129
Budget Measures 2022-23
Addressing coercive control and domestic and family violence in Queensland. Further details on this package are in Chapter 1 of this paper.
| 2021-22 $‘000 | 2022-23 $‘000 | 2023-24 $‘000 | 2024-25 $‘000 | 2025-26 $‘000 | ||||||||||||||||
Report 1, Hear Her Voice Respon-Trial and Evaluate Mobile Co-responder Models | — | — | — | — | — | |||||||||||||||
The government is providing additional funding of $6.3 million over 3 years, held centrally, to trial and evaluate mobile co-responder models involving joint responses between Queensland Police Service and specialist domestic and family violence services.
Further details can be found in the Department of Justice and Attorney-General section of this chapter. The capital component of this measure can be found in Chapter 3 Capital measures.
This forms part of the government’s total funding package of $363 million over 5 years ($350 million new funding and $12.9 million internally met) to respond to the recommendations of the Queensland Women’s Safety and Justice Taskforce in Hear her voice - Report One - Addressing coercive control and domestic and family violence in Queensland. Further details on this package are in Chapter 1 of this paper.
| 2021-22 $‘000 | 2022-23 $‘000 | 2023-24 $‘000 | 2024-25 $‘000 | 2025-26 $‘000 | ||||||||||||||||
Safe Night Precincts | 2,500 | — | — | — | — | |||||||||||||||
The government has provided additional funding of $2.5 million in 2021-22 to support police operations in Safe Night Precincts. From 1 July 2022, police operations in Safe Night Precincts will transition from temporary funded operations to permanent business as usual operations.
130
Budget Measures 2022-23
Queensland Treasury
| 2021-22 $‘000 | 2022-23 $‘000 | 2023-24 $‘000 | 2024-25 $‘000 | 2025-26 $‘000 | ||||||||||||||||
Queensland Trade and Investment Strategy 2022- 2032 | — | 13,510 | 19,590 | 22,760 | 19,350 | |||||||||||||||
The government is providing additional funding of $150 million over 10 years, including $75.2 million over 4 years and $12.5 million per annum ongoing, to implement a new Queensland Trade and Investment Strategy 2022-2032. The new strategy will leverage global opportunities, drive diversity and value, and create future economic growth.
| 2021-22 $‘000 | 2022-23 $‘000 | 2023-24 $‘000 | 2024-25 $‘000 | 2025-26 $‘000 | ||||||||||||||||
Camera Detected Offence Program | — | 2,024 | 1,997 | 1,997 | 1,997 | |||||||||||||||
The government is providing increased funding of $8 million over 4 years and $2 million per annum ongoing to Queensland Revenue Office for the Camera Detected Offence Program.
The government is providing total increased funding of $96.3 million over 4 years across departments as part of the Camera Detected Offence Program. Further funding can be found in the Department of Transport and Main Roads, Queensland Fire and Emergency Services and Queensland Police Service sections of this chapter. The capital component of this measure can be found in the Department of Transport and Main Roads section of Chapter 3 Capital measures.
131
Budget Measures 2022-23
| 2021-22 $‘000 | 2022-23 $‘000 | 2023-24 $‘000 | 2024-25 $‘000 | 2025-26 $‘000 | ||||||||||||||||
Crime Statistics and Research Unit | — | 1,925 | 1,981 | 2,039 | 2,098 | |||||||||||||||
The government is providing funding of $8 million over 4 years and $2.1 million per annum ongoing for the continued operation of the Crime Statistics and Research Unit to support research and policy development and the assessment of whole of criminal justice system demands and financial impacts.
| 2021-22 $‘000 | 2022-23 $‘000 | 2023-24 $‘000 | 2024-25 $‘000 | 2025-26 $‘000 | ||||||||||||||||
Local Government Authorities Debt Collection Services | — | 1,110 | — | — | — | |||||||||||||||
The government is providing additional funding of $1.1 million in 2022-23 to fund the initial implementation cost of Queensland Revenue Office’s debt collection service to local government authorities.
Queensland Revenue Office will provide its debt collection capability to local government authorities as a fee-for-service, so ongoing service delivery costs will be fully funded by local government authority users.
| 2021-22 $‘000 | 2022-23 $‘000 | 2023-24 $‘000 | 2024-25 $‘000 | 2025-26 $‘000 | ||||||||||||||||
Community Housing Provider Development Program | — | — | — | — | — | |||||||||||||||
The government is providing additional funding of $5 million over 2 years, held centrally, to fund measures to build capability and capacity in the Community Housing Provider (CHP) sector and to incentivise CHP participation in the Housing Investment Fund (HIF). This will equip the CHP sector with the skills, expertise and resources to participate in market processes such as the HIF to sustainably deliver and manage additional supply of social housing stock.
132
Budget Measures 2022-23
| 2021-22 $‘000 | 2022-23 $‘000 | 2023-24 $‘000 | 2024-25 $‘000 | 2025-26 $‘000 | ||||||||||||||||
Sole Trader Grants | 41,339 | — | — | — | — | |||||||||||||||
The government has provided additional funding of $41.4 million in 2021-22 for $1,000 one-off grants for eligible non-employing sole traders to support Queensland business impacted by the August 2021 COVID-19 lockdowns in Queensland. This program has now closed.
This formed part of the government’s total announced funding of $600 million in 2021-22 for the Business Support Package, jointly funded by the Australian Government, to support businesses impacted by COVID-19 in Queensland.
133
Budget Measures 2022-23
| 3 | Capital Measures |
Introduction
The following tables present the relevant portfolio capital measures relating to decisions taken since the 2021-22 Budget. This does not represent the full amount of additional funding provided to agencies since the 2021-22 Budget. For further explanation, refer to Explanation of Scope and Terms in Chapter 1.
134
Budget Measures 2022-23
Department of Communities, Housing and Digital Economy
| 2021-22 $‘000 | 2022-23 $‘000 | 2023-24 $‘000 | 2024-25 $‘000 | 2025-26 $‘000 | ||||||||||||||||
Queensland Cultural Centre - Capital Works, Asset Upgrades and Refurbishment Projects | — | 8,550 | 13,850 | 17,200 | 14,100 | |||||||||||||||
The government is providing additional funding of $53.7 million over 4 years for capital asset renewal works, compliance and safety improvements, and amenity upgrades at the Queensland Cultural Centre. The expense component of this measure can be found in Chapter 2 Expense measures.
| 2021-22 $‘000 | 2022-23 $‘000 | 2023-24 $‘000 | 2024-25 $‘000 | 2025-26 $‘000 | ||||||||||||||||
Strengthening Social Services in Queensland | — | 4,000 | 17,000 | 14,000 | 13,000 | |||||||||||||||
The government is providing additional funding of $48 million over 4 years to strengthen social services in Queensland. The funding will be provided to build new neighbourhood and community centres and redevelop and upgrade existing centres.
This forms part of the government’s total funding of $125.6 million over 4 years and $19 million ongoing to strengthen social services in Queensland. The expense component of this measure can be found in Chapter 2 Expense Measures.
| 2021-22 $‘000 | 2022-23 $‘000 | 2023-24 $‘000 | 2024-25 $‘000 | 2025-26 $‘000 | ||||||||||||||||
Realignment of Grey and Russell Street Intersection | — | 1,400 | — | — | — | |||||||||||||||
The government is providing additional funding of $1.4 million in 2022-23 for the reconfiguration of the Grey and Russell Street intersection, South Brisbane to enhance vehicular access to the Queensland Cultural Precinct.
135
Budget Measures 2022-23
| 2021-22 $‘000 | 2022-23 $‘000 | 2023-24 $‘000 | 2024-25 $‘000 | 2025-26 $‘000 | ||||||||||||||||
Queensland Cultural Centre - Security Upgrades | — | 1,300 | 1,300 | 910 | — | |||||||||||||||
The government is providing additional funding of $3.5 million over 3 years to enhance security measures across the Queensland Cultural Centre. The expense component of this measure can be found in Chapter 2 Expense measures.
| 2021-22 $‘000 | 2022-23 $‘000 | 2023-24 $‘000 | 2024-25 $‘000 | 2025-26 $‘000 | ||||||||||||||||
Digitisation of the State’s Audio-Visual and Other Archival Public Records | — | 400 | — | — | — | |||||||||||||||
The government is providing additional funding of $400,000 in 2022-23 to accelerate digitisation of print and audio-visual records. The expense component of this measure can be found in Chapter 2 Expense measures.
136
Budget Measures 2022-23
Department of Education
| 2021-22 $‘000 | 2022-23 $‘000 | 2023-24 $‘000 | 2024-25 $‘000 | 2025-26 $‘000 | ||||||||||||||||
School Infrastructure - Renewal | 6,264 | 194,595 | 143,383 | 93,830 | 92,279 | |||||||||||||||
The government is providing increased funding of $530.4 million over 5 years and $22.7 million per annum ongoing for critical infrastructure upgrades to replace and enhance infrastructure in existing state schools.
Total funding for the initiative is $623.8 million over 5 years and $25.2 million per annum ongoing. The expense component of this measure can be found in Chapter 2 Expense measures.
| 2021-22 $‘000 | 2022-23 $‘000 | 2023-24 $‘000 | 2024-25 $‘000 | 2025-26 $‘000 | ||||||||||||||||
School Infrastructure - Growth | — | 61,941 | 47,193 | — | — | |||||||||||||||
The government is providing increased funding of $109.1 million over 2 years for additional infrastructure at existing schools experiencing enrolment growth.
Total funding for this initiative is $118.6 million over 2 years. The expense component of this measure can be found in Chapter 2 Expense measures.
| 2021-22 $‘000 | 2022-23 $‘000 | 2023-24 $‘000 | 2024-25 $‘000 | 2025-26 $‘000 | ||||||||||||||||
Land Acquisition for New Schools | — | 54,887 | — | — | — | |||||||||||||||
The government is providing increased funding of $54.9 million in 2022-23 to acquire land to continue the delivery of new schools under its Building Future Schools program.
Total funding for this initiative is $55.8 million in 2022-23. The expense component can be found in Chapter 2 Expense measures.
137
Budget Measures 2022-23
| 2021-22 $‘000 | 2022-23 $‘000 | 2023-24 $‘000 | 2024-25 $‘000 | 2025-26 $‘000 | ||||||||||||||||
Building Future Schools Program | — | 7,498 | 20,501 | 159,936 | 74,908 | |||||||||||||||
The government is providing increased funding of $262.8 million over 4 years ($366.1 million over 7 years) for the construction of new schools to open in 2025 at Caboolture West, Caloundra South, Greater Flagstone and Ripley Valley, along with one new school in Bahrs Scrub to open in 2026.
Total funding for this initiative is $389.5 million over 7 years. The expense component of this measure can be found in Chapter 2 Expense measures.
| 2021-22 $‘000 | 2022-23 $‘000 | 2023-24 $‘000 | 2024-25 $‘000 | 2025-26 $‘000 | ||||||||||||||||
School Playground and Tuckshop Upgrades | — | 1,500 | 13,500 | — | — | |||||||||||||||
The government is providing additional funding of $15 million over 2 years to improve School playground and tuckshop facilities in disadvantaged areas throughout Queensland.
Total funding for this initiative is $20 million over 2 years. The expense component of this measure can be found in Chapter 2 Expense measures.
| 2021-22 $‘000 | 2022-23 $‘000 | 2023-24 $‘000 | 2024-25 $‘000 | 2025-26 $‘000 | ||||||||||||||||
Expansion of GPs in Schools Pilot | — | — | — | — | — | |||||||||||||||
Funding of $600,000 in 2021-22 is being met internally by the department to expand the GPs in Schools pilot program from 20 to 50 schools.
Total funding for the expansion is $6.6 million over 3 years. The expense component of this measure can be found in Chapter 2 Expense measures.
138
Budget Measures 2022-23
Department of Energy and Public Works
| 2021-22 $‘000 | 2022-23 $‘000 | 2023-24 $‘000 | 2024-25 $‘000 | 2025-26 $‘000 | ||||||||||||||||
Government Employee Housing Sustainability Funding Model | — | 87,776 | 134,433 | — | — | |||||||||||||||
The government is providing additional funding of $222.2 million over 2 years from 2022-23 and a further $292.5 million over 2 years from 2024-25 held centrally to deliver critical new housing and upgrades to existing houses for frontline staff such as police, health workers and teachers in remote locations to ensure the portfolio is secure and of an appropriate standard for employees. The expense component to this measure can be found in Chapter 2 Expense measures.
| 2021-22 $‘000 | 2022-23 $‘000 | 2023-24 $‘000 | 2024-25 $‘000 | 2025-26 $‘000 | ||||||||||||||||
Northern Queensland Renewable Energy Zone | 40,000 | — | — | — | — | |||||||||||||||
The government has provided increased funding of $40 million in 2021-22 for the first stage project commencement of the Northern Queensland Renewable Energy Zone to Powerlink.
| 2021-22 $‘000 | 2022-23 $‘000 | 2023-24 $‘000 | 2024-25 $‘000 | 2025-26 $‘000 | ||||||||||||||||
Pumped Hydro Energy Storage | 13,000 | — | — | — | — | |||||||||||||||
The government has provided increased funding of $13 million in 2021-22 for the proposed Borumba Pumped Hydro Energy Storage facility.
The government is also providing additional funding of $35 million in 2022-23 for feasibility works on pumped hydro energy opportunities with funding to be held centrally.
139
Budget Measures 2022-23
| 2021-22 $‘000 | 2022-23 $‘000 | 2023-24 $‘000 | 2024-25 $‘000 | 2025-26 $‘000 | ||||||||||||||||
Thomas Dixon Centre Refurbishment | 48,627 | — | — | — | — | |||||||||||||||
The government has provided additional funding of $48.6 million in 2021-22, previously held centrally, to fund the balance of the Thomas Dixon Centre redevelopment.
Further funding of $14 million has also been internally funded by the department in 2021-22 to complete the base build.
This forms part of the Queensland Government’s overall capital contribution of $99.2 million to redevelop the centre, inclusive of $2.8 million centrally held funds for fit out contingency.
140
Budget Measures 2022-23
Department of Environment and Science
| 2021-22 $‘000 | 2022-23 $‘000 | 2023-24 $‘000 | 2024-25 $‘000 | 2025-26 $‘000 | ||||||||||||||||
Cape York Peninsula National Park Joint Management | — | — | — | 20,000 | — | |||||||||||||||
The government will provide increased funding of $20 million in 2024-25 for the acquisition of land under the Cape York Peninsula Tenure Resolution Program, supporting joint management with First Nations peoples.
The expense component of this measure can be found in Chapter 2 Expense measures.
| 2021-22 $‘000 | 2022-23 $‘000 | 2023-24 $‘000 | 2024-25 $‘000 | 2025-26 $‘000 | ||||||||||||||||
Protected Area Estate | — | — | — | — | — | |||||||||||||||
The government is providing increased funding of $16.9 million over 5 years ($17 million over 6 years), held centrally, to acquire property of high conservation value and undertake infrastructure upgrades associated with the increase of the protected estate.
The expense component of this measure can be found in Chapter 2 Expense Measures.
| 2021-22 $‘000 | 2022-23 $‘000 | 2023-24 $‘000 | 2024-25 $‘000 | 2025-26 $‘000 | ||||||||||||||||
Protected Area Investment and Management | — | — | — | — | — | |||||||||||||||
The government is providing increased funding of $250 million over 4 years, held centrally, for the continuation of the Protected Area Strategy 2020-2030, including support for land acquisitions and capital works to increase the protected area estate. The expense component of this measure can be found in Chapter 2 Expense measures.
141
Budget Measures 2022-23
Department of Justice and Attorney-General
| 2021-22 $‘000 | 2022-23 $‘000 | 2023-24 $‘000 | 2024-25 $‘000 | 2025-26 $‘000 | ||||||||||||||||
Achieving Justice System Efficiency - Contemporary Technology and Infrastructure - Capital | — | 6,712 | 13,266 | 13,075 | 13,075 | |||||||||||||||
The government is providing additional funding of $59.2 million over 5 years and $13.1 million per annum ongoing to deliver infrastructure works to ensure the efficiency, safety and sustainability of Queensland’s courthouses.
This forms part of the government’s total funding package of $246.8 million over 5 years and $27.4 million per annum ongoing to deliver an efficient and effective justice system underpinned by contemporary technology and safe, accessible and functional infrastructure. The expense component of this measure can be found in Chapter 2 Expense measures.
| 2021-22 $‘000 | 2022-23 $‘000 | 2023-24 $‘000 | 2024-25 $‘000 | 2025-26 $‘000 | ||||||||||||||||
Report 1, Hear Her Voice Response - State-Wide Plan to Improve Safety for Domestic and Family Violence Victims when Attending Court | — | 3,375 | 6,300 | 20,025 | 19,350 | |||||||||||||||
The government is providing additional funding of $49.1 million over 4 years to undertake enhancements to Queensland Courthouses at Toowoomba, Cairns, Brisbane, Rockhampton, Maroochydore, Caboolture, Mackay and Ipswich, to improve safety for victims of domestic and family violence including coercive control when attending courts.
The expense component of this measure can be found in Chapter 2 Expense measures.
This forms part of the government’s total funding package of $363 million over 5 years ($350 million new funding and $12.9 million internally met) to respond to the recommendations of the Queensland Women’s Safety and Justice Taskforce in Hear her voice - Report One - Addressing coercive control and domestic and family violence in Queensland. Further details on this package are in Chapter 1 of this paper.
142
Budget Measures 2022-23
| 2021-22 $‘000 | 2022-23 $‘000 | 2023-24 $‘000 | 2024-25 $‘000 | 2025-26 $‘000 | ||||||||||||||||
Beaudesert Courthouse Replacement | — | 1,924 | 4,682 | 14,521 | 319 | |||||||||||||||
The government is providing additional funding of $21.4 million over 4 years to replace the current Beaudesert courthouse.
This forms part of the government’s total funding package of $246.8 million over 5 years and $27.4 million per annum ongoing to deliver an efficient and effective justice system underpinned by contemporary technology and safe, accessible and functional infrastructure. The expense component of this measure can be found in Chapter 2 Expense measures.
| 2021-22 $‘000 | 2022-23 $‘000 | 2023-24 $‘000 | 2024-25 $‘000 | 2025-26 $‘000 | ||||||||||||||||
Queensland Resources Industry Development Plan (QRIDP) Package | — | 155 | — | — | — | |||||||||||||||
The government is providing additional funding of $155,000 in 2022-23 for the Queensland Law Reform Commission review of the objection process for mining leases. The expense component of this measure can be found in Chapter 2 Expense Measures.
This forms part of the government’s commitment to a $68.5 million package over 5 years to support implementation of the final QRIDP across government. Further details on initiatives can be found in the Department of Resources, Department of State Development, Infrastructure, Local Government and Planning, Department of Employment, Small Business and Training, Department of Environment and Science, Department of Regional Development, Manufacturing and Water and Department of Agriculture and Fisheries sections of this chapter.
143
Budget Measures 2022-23
| 2021-22 $‘000 | 2022-23 $‘000 | 2023-24 $‘000 | 2024-25 $‘000 | 2025-26 $‘000 | ||||||||||||||||
Report 1, Hear Her Voice response - Over Representation Strategy and Office of the Chief First Nations Justice Officer | — | 113 | — | — | — | |||||||||||||||
The government is providing additional funding of $113,000 in 2022-23 to accommodate staff to support the co-design of a whole-of-government and communication strategy to address over representation of First Nations peoples in the criminal justice system and to establish the Office of Chief First Nations Justice Officer.
The expenses component of this measure can be found in Chapter 2 Expense measures.
This forms part of the government’s total funding package of $363 million over 5 years ($350 million new funding and $12.9 million internally met) to respond to the recommendations of the Queensland Women’s Safety and Justice Taskforce in Hear her voice - Report One - Addressing coercive control and domestic and family violence in Queensland. Further details on this package are in Chapter 1 of this paper.
| 2021-22 | 2022-23 | 2023-24 | 2024-25 | 2025-26 | ||||||||||||||||
| $‘000 | $‘000 | $‘000 | $‘000 | $‘000 | ||||||||||||||||
Claim Farming - Legal Services Commission | — | 105 | — | — | — | |||||||||||||||
The government is providing additional funding of $105,000 in 2022-23 for the oversight and enforcement of new measures to prohibit claim farming of personal injury claims and deter undesirable billing practices by lawyers in speculative personal injury claims.
The expense component of this measure can be found in Chapter 2 Expense measures.
144
Budget Measures 2022-23
| 2021-22 | 2022-23 | 2023-24 | 2024-25 | 2025-26 | ||||||||||||||||
| $‘000 | $‘000 | $‘000 | $‘000 | $‘000 | ||||||||||||||||
Commission of Inquiry into Queensland’s Crime and Corruption Commission | 333 | — | — | — | — | |||||||||||||||
The government has provided additional funding of $333,000 in 2021-22 for the establishment and operation of the Commission of Inquiry relating to the Crime and Corruption Commission.
The expense component of this measure can be found in Chapter 2 Expense Measures.
| 2021-22 | 2022-23 | 2023-24 | 2024-25 | 2025-26 | ||||||||||||||||
| $‘000 | $‘000 | $‘000 | $‘000 | $‘000 | ||||||||||||||||
Report 1, Hear Her Voice Response - Immediate Legislative Amendments and Reforms | — | — | — | — | — | |||||||||||||||
The department is internally funding $406,000 in 2022-23 to accommodate staff to immediately progress amendments to the Criminal Code, Domestic and Family Violence Protection Act 2012, Evidence Act 1977 and Penalties and Sentences Act 1992.
The expense component of this measure can be found in Chapter 2 Expense measures.
This forms part of the government’s total funding package of $363 million over 5 years ($350 million new funding and $12.9 million internally met) to respond to the recommendations of the Queensland Women’s Safety and Justice Taskforce in Hear her voice - Report One - Addressing coercive control and domestic and family violence in Queensland. Further details on this package are in Chapter 1 of this paper.
145
Budget Measures 2022-23
Department of State Development, Infrastructure, Local Government and Planning
| 2021-22 | 2022-23 | 2023-24 | 2024-25 | 2025-26 | ||||||||||||||||
| $‘000 | $‘000 | $‘000 | $‘000 | $‘000 | ||||||||||||||||
Growth Area Program | — | 43,000 | 52,000 | 70,000 | — | |||||||||||||||
The government is providing additional funding of $200 million over 3 years, including $35 million held centrally, to deliver activities under the Growth Area Program. The program will improve planning and delivery of housing supply to cater for population growth and address pressures on the housing market. The expense component of this measure can be found in Chapter 2 Expense measures.
| 2021-22 | 2022-23 | 2023-24 | 2024-25 | 2025-26 | ||||||||||||||||
| $‘000 | $‘000 | $‘000 | $‘000 | $‘000 | ||||||||||||||||
Capital Grant Funding Support to South Bank Corporation | — | 3,085 | — | — | — | |||||||||||||||
The government is providing additional equity funding of $3.1 million in 2022-23 to support South Bank Corporation to deliver essential safety-related capital works. The expense component of this measure can be found in Chapter 2 Expense measures.
| 2021-22 | 2022-23 | 2023-24 | 2024-25 | 2025-26 | ||||||||||||||||
| $‘000 | $‘000 | $‘000 | $‘000 | $‘000 | ||||||||||||||||
The Spit Master Plan Implementation | 3,305 | 1,510 | 10,651 | (215 | ) | 249 | ||||||||||||||
The government is providing increased funding of $15.5 million over 5 years to continue delivery of The Spit Master Plan and associated implementation works in partnership with the Gold Coast Waterways Authority and the Gold Coast City Council. Funding of up to $13 million over 4 years is being met internally by the department to complete the program, bringing total funding for this program to $60 million.
146
Budget Measures 2022-23
| 2021-22 | 2022-23 | 2023-24 | 2024-25 | 2025-26 | ||||||||||||||||
| $‘000 | $‘000 | $‘000 | $‘000 | $‘000 | ||||||||||||||||
Queensland Regional Accommodation Centre | — | — | — | — | — | |||||||||||||||
The government is providing additional funding to deliver and operate the Queensland Regional Accommodation Centre, located at Wellcamp near Toowoomba. This includes a capital contribution towards Queensland’s first purpose-built accommodation centre. Delivery of the centre will occur in 2 stages, with the first 500 beds operational and available to receive guests. The expense component of this measure can be found in Chapter 2 Expense Measures.
| * | Arrangements are commercial in confidence. |
| 2021-22 | 2022-23 | 2023-24 | 2024-25 | 2025-26 | ||||||||||||||||
| $‘000 | $‘000 | $‘000 | $‘000 | $‘000 | ||||||||||||||||
The South East Queensland City Deal | — | — | — | — | — | |||||||||||||||
The government is providing additional funding of $622.2 million to the South East Queensland City Deal which was signed by the 3 levels of government on 21 March 2022. The City Deal will benefit more than 3.5 million residents, delivering a strategic approach to infrastructure planning and investment to support the fastest growing region in the country, with a focus on accelerating job creation, supporting thriving communities and enhancing the liveability and connectivity of South East Queensland.
The expense component of this measure can be found in Chapter 2 expense measures.
147
Budget Measures 2022-23
Department of the Premier and Cabinet
| 2021-22 | 2022-23 | 2023-24 | 2024-25 | 2025-26 | ||||||||||||||||
| $‘000 | $‘000 | $‘000 | $‘000 | $‘000 | ||||||||||||||||
Go for Gold Fund (School Sports Infrastructure) | — | 1,500 | 15,000 | 29,250 | 29,250 | |||||||||||||||
The government is providing additional funding of $75 million over 4 years to establish the Go for Gold Fund (School Sports Infrastructure) program. The program, which is being delivered by the Department of Education, will deliver new and upgraded sports infrastructure for schools across the State, with a focus on promoting health and wellbeing, facilitating increased community use of school sports facilities and encouraging sports participation.
Total funding for the program is $100 million over 4 years. The expense component of this measure can be found in Chapter 2 Expense measures.
148
Budget Measures 2022-23
Department of Tourism, Innovation and Sport
| 2021-22 | 2022-23 | 2023-24 | 2024-25 | 2025-26 | ||||||||||||||||
| $‘000 | $‘000 | $‘000 | $‘000 | $‘000 | ||||||||||||||||
Activate! Queensland 2019-2029 | — | 5,000 | 13,500 | 10,000 | — | |||||||||||||||
The government is providing increased funding of $28.5 million over 3 years to leverage Queensland Government-owned and/or operated sport and recreation precincts and venues to better support the community and industry to provide participation opportunities.
Funding of $13.1 million over 3 years has been internally met by the department, bringing the total funding for the next 3 years of Activate! Queensland to $41.6 million.
The expense component of this measure can be found in Chapter 2 Expense measures.
| 2021-22 | 2022-23 | 2023-24 | 2024-25 | 2025-26 | ||||||||||||||||
| $‘000 | $‘000 | $‘000 | $‘000 | $‘000 | ||||||||||||||||
Stadiums Queensland Capital Funding | — | 5,000 | 20,500 | 21,013 | 21,538 | |||||||||||||||
The government is providing additional funding of $68.1 million over 4 years to support Stadiums Queensland’s capital activities to maintain the state’s portfolio of major sporting stadiums and high performance / community venues to a contemporary standard in the lead up to the 2032 Olympic and Paralympic Games.
The expense component of this measure can be found in Chapter 2 Expense measures.
| 2021-22 | 2022-23 | 2023-24 | 2024-25 | 2025-26 | ||||||||||||||||
| $‘000 | $‘000 | $‘000 | $‘000 | $‘000 | ||||||||||||||||
Wangetti Trail | — | — | — | — | — | |||||||||||||||
The government will provide increased funding of $5.7 million in 2024-25, held centrally, towards the delivery of Queensland’s first purposely designed eco-tourism trail in a national park including the 94 kilometre trail and 4 public campsites.
149
Budget Measures 2022-23
Department of Transport and Main Roads
| 2021-22 $‘000 | 2022-23 $‘000 | 2023-24 $‘000 | 2024-25 $‘000 | 2025-26 $‘000 | ||||||||||||||||
Operational Readiness of the New Generation Rollingstock Fleet for Cross River Rail Automatic Train Operation and Platform Screen Doors | 15,032 | 80,990 | 93,673 | 55,202 | 30,803 | |||||||||||||||
The government is providing additional funding of $275.7 million over 5 years for the detailed design and fitment of Automatic Train Operation (ATO) on-board software and Platform Screen Doors (PSD) on-board equipment for the New Generation Rollingstock (NGR) fleet of 75 trains. The installation of ATO and PSD on the NGR fleet will ensure that Cross River Rail is fully operational within the scheduled timeframes. The expense component of this measure can be found in Chapter 2 Expense measures.
| 2021-22 $‘000 | 2022-23 $‘000 | 2023-24 $‘000 | 2024-25 $‘000 | 2025-26 $‘000 | ||||||||||||||||
Maritime Infrastructure Program | — | 10,548 | — | — | — | |||||||||||||||
The government is providing increased funding of $10.5 million in 2022-23 for navigational aids. The expense component of this measure can be found in Chapter 2 Expense Measures.
| 2021-22 $‘000 | 2022-23 $‘000 | 2023-24 $‘000 | 2024-25 $‘000 | 2025-26 $‘000 | ||||||||||||||||
Operational Readiness of the New Generation Rollingstock Fleet for Cross River Rail and European Train Control System | 2,408 | 6,882 | 15,152 | 66,276 | 28,366 | |||||||||||||||
The government is providing additional funding of $119.1 million over 5 years for the modification of the European Train Control System (ETCS) and Automatic Train Operation (ATO) hardware for the New Generation Rollingstock (NGR) fleet of 75 trains. The installation of ETCS, ATO and Platform Screen Doors on the NGR fleet will ensure that Cross River Rail is fully operational within the scheduled timeframes. The expense component of this measure can be found in Chapter 2 Expense measures.
150
Budget Measures 2022-23
| 2021-22 $‘000 | 2022-23 $‘000 | 2023-24 $‘000 | 2024-25 $‘000 | 2025-26 $‘000 | ||||||||||||||||
Camera Detected Offence Program | — | 5,500 | 5,500 | 5,000 | — | |||||||||||||||
The government is providing increased funding of $16 million over 3 years to improve the safety of the sections of state-controlled roads where accidents happen most frequently.
The government is providing total increased funding of $96.3 million over 4 years across departments as part of the Camera Detected Offence Program. Further funding can be found in the Department of Transport and Main Roads, Queensland Fire and Emergency Services, Queensland Police Service and Queensland Treasury sections of Chapter 2 Expense Measures.
| 2021-22 $‘000 | 2022-23 $‘000 | 2023-24 $‘000 | 2024-25 $‘000 | 2025-26 $‘000 | ||||||||||||||||
Townsville Connection Road Bowen Road Bridge duplication | — | 1,940 | 1,940 | 3,007 | 26,287 | |||||||||||||||
The government is providing increased funding of $67.9 million over 5 years (2022-23 to 2026-27) for Stage 3 of the Townsville Connection Road upgrade. The expense component of this measure can be found in Chapter 2 Expense measures.
| 2021-22 $‘000 | 2022-23 $‘000 | 2023-24 $‘000 | 2024-25 $‘000 | 2025-26 $‘000 | ||||||||||||||||
Long-term Transport Infrastructure Commitments | — | — | — | — | 137,500 | |||||||||||||||
The government will provide increased funding of $137.5 million in 2025-26 and $474.4 million beyond the forward estimates for the state contribution for the following projects reflecting prior election commitments: Pacific Motorway: Daisy Hill to Logan Motorway upgrade, Inland Freight Route (Mungindi to Charters Towers), Boundary Road (Coopers Plains) rail level crossing, Mooloolah River Interchange Upgrade - Stage 1 and Roads of Strategic Importance Mount Isa to Rockhampton corridor state matching. The expense component of this measure can be found in Chapter 2 Expense measures.
151
Budget Measures 2022-23
Legislative Assembly of Queensland
| 2021-22 $‘000 | 2022-23 $‘000 | 2023-24 $‘000 | 2024-25 $‘000 | 2025-26 $‘000 | ||||||||||||||||
Electorate Office Security Upgrade (CCTV) | — | 612 | — | — | — | |||||||||||||||
The government is providing additional funding of $612,000 in 2022-23 to improve electorate office security through the installation of a standardised CCTV monitoring system in each electorate office across Queensland. The expense component of this measure can be found in Chapter 2 Expense Measures.
152
Budget Measures 2022-23
Queensland Corrective Services
| 2021-22 $‘000 | 2022-23 $‘000 | 2023-24 $‘000 | 2024-25 $‘000 | 2025-26 $‘000 | ||||||||||||||||
Expansion of the Southern Queensland Correctional Precinct Stage 2 to Over 1,500 Beds | — | 150,000 | 57,000 | — | — | |||||||||||||||
The government is providing additional capital funding of $207 million over 2 years to increase the capacity of Southern Queensland Correctional Precinct Stage 2 by 500 beds to over 1,500 beds, including through the construction of a second secure rehabilitation unit.
| 2021-22 $‘000 | 2022-23 $‘000 | 2023-24 $‘000 | 2024-25 $‘000 | 2025-26 $‘000 | ||||||||||||||||
Infrastructure Works | — | 40,950 | 22,820 | 7,000 | 7,000 | |||||||||||||||
The government is providing additional funding of $77.8 million over 4 years and $7 million per annum ongoing to progress infrastructure works and support ongoing maintenance and replacement programs. The expense component of this measure can be found in Chapter 2 Expense measures.
| 2021-22 $‘000 | 2022-23 $‘000 | 2023-24 $‘000 | 2024-25 $‘000 | 2025-26 $‘000 | ||||||||||||||||
Electronic Security Upgrade | — | — | — | — | — | |||||||||||||||
The government is providing additional funding of $78.7 million over 3 years, held centrally, to provide a multi-service provider solution for Queensland Corrective Services’ Electronic Security System through a competitive tender package. The expense component of this measure can be found in Chapter 2 Expense measures.
153
Budget Measures 2022-23
| 2021-22 $‘000 | 2022-23 $‘000 | 2023-24 $‘000 | 2024-25 $‘000 | 2025-26 $‘000 | ||||||||||||||||
Integrated Offender Management System | — | — | — | — | — | |||||||||||||||
The government is providing additional funding of $16.3 million over 2 years, held centrally, to enhance the Integrated Offender Management System to support frontline correctional operations. The expense component of this measure can be found in Chapter 2 Expense measures.
154
Budget Measures 2022-23
Queensland Health
| 2021-22 $‘000 | 2022-23 $‘000 | 2023-24 $‘000 | 2024-25 $‘000 | 2025-26 $‘000 | ||||||||||||||||
Capacity Expansion Program | — | 85,300 | 991,700 | 1,606,000 | 3,025,000 | |||||||||||||||
The government is providing additional funding of $9.785 billion over 6 years to deliver around 2,200 additional overnight beds across the Queensland Health system for the following projects:
| • | New hospitals in Bundaberg, Toowoomba and Coomera |
| • | New Queensland Cancer Centre |
| • | Expansions to hospitals in Cairns, Townsville, Robina, Mackay, Redcliffe, Ipswich and Hervey Bay as well as to the Princess Alexandra, QEII and the Prince Charles hospitals, and a further expansion at Logan hospital. |
| 2021-22 $‘000 | 2022-23 $‘000 | 2023-24 $‘000 | 2024-25 $‘000 | 2025-26 $‘000 | ||||||||||||||||
Digital Hospital Electronic Medical Records System | — | 60,000 | 60,000 | 60,000 | 60,000 | |||||||||||||||
The government is providing additional funding of $240 million over 4 years ($300 million over 5 years) for the continued roll-out of electronic medical record functionality.
| 2021-22 $‘000 | 2022-23 $‘000 | 2023-24 $‘000 | 2024-25 $‘000 | 2025-26 $‘000 | ||||||||||||||||
Infrastructure Maintenance Program | — | 15,647 | 54,193 | 18,312 | — | |||||||||||||||
The government is providing increased funding of $88.2 million over 3 years for tranche 2 of the Infrastructure Maintenance Program. The expense component of this measure can be found in Chapter 2 Expense measures.
155
Budget Measures 2022-23
| 2021-22 $‘000 | 2022-23 $‘000 | 2023-24 $‘000 | 2024-25 $‘000 | 2025-26 $‘000 | ||||||||||||||||
Queensland Ambulance Critical Infrastructure | — | 13,442 | 35,907 | 18,067 | 6,500 | |||||||||||||||
The government is providing additional funding of $73.9 million over 4 years to enable critical infrastructure projects for the Queensland Ambulance Service.
| 2021-22 $‘000 | 2022-23 $‘000 | 2023-24 $‘000 | 2024-25 $‘000 | 2025-26 $‘000 | ||||||||||||||||
Voluntary Assisted Dying Scheme | 795 | 6,135 | — | — | — | |||||||||||||||
The government is providing additional funding of $6.9 million over 2 years for the development of an information communication technology solution to support the Voluntary Assisted Dying Scheme. The expense component of this measure can be found in Chapter 2 Expense measures.
| 2021-22 $‘000 | 2022-23 $‘000 | 2023-24 $‘000 | 2024-25 $‘000 | 2025-26 $‘000 | ||||||||||||||||
Mental Health and Other Drug Services Capital Investment | — | 1,791 | 9,016 | 9,691 | 4,641 | |||||||||||||||
The government is providing additional capital funding of $28.5 million over 5 years to support Queensland Health’s new 5 year plan, Better Care Together. Better Care Together will improve mental health, alcohol and other drugs services as well as the suicide prevention system of care and support. The expense component of this measure can be found in Chapter 2 Expense measures.
156
Budget Measures 2022-23
| 2021-22 $‘000 | 2022-23 $‘000 | 2023-24 $‘000 | 2024-25 $‘000 | 2025-26 $‘000 | ||||||||||||||||
QEII Hospital Multi-storey Carpark | — | 1,500 | 15,000 | 13,310 | — | |||||||||||||||
The government is providing additional funding of $29.8 million over 4 years for the development of the QEII Hospital Multi-storey Carpark as part of the statewide Hospital Car Parking Framework.
| 2021-22 $‘000 | 2022-23 $‘000 | 2023-24 $‘000 | 2024-25 $‘000 | 2025-26 $‘000 | ||||||||||||||||
Accelerated Infrastructure Delivery Program | — | — | — | — | — | |||||||||||||||
The government is providing $229.7 million over 2 years from the Sustaining Capital Program to increase bed capacity under the Accelerated Infrastructure Delivery Program. This program will deliver 289 beds across seven projects in the Metro South, Gold Coast, West Moreton and Cairns and Hinterland Hospital and Health Services, and will use off-site construction and standard designs to reduce time to commissioning.
| 2021-22 $‘000 | 2022-23 $‘000 | 2023-24 $‘000 | 2024-25 $‘000 | 2025-26 $‘000 | ||||||||||||||||
Building Rural and Remote Health program - Phase 2 | — | — | — | — | — | |||||||||||||||
The government is providing $943.5 million over 7 years from the Sustaining Capital Program to replace ageing rural and regional health facilities and staff accommodation as part of the next phase of the Building Rural and Remote Health Program.
This investment in Phase 2 of the program will replace ageing infrastructure across a range of Hospital and Health Services, including Torres and Cape, North West, Cairns and Hinterland, Mackay, Darling Downs, Central Queensland, Townsville, West Moreton and Wide Bay. The first tranche of Phase 2 will replace health facilities in Moranbah, Bamaga, Normanton, Pormpuraaw, Tara and Cow Bay.
157
Budget Measures 2022-23
| 2021-22 $‘000 | 2022-23 $‘000 | 2023-24 $‘000 | 2024-25 $‘000 | 2025-26 $‘000 | ||||||||||||||||
Logan Hospital Expansion | — | — | — | — | — | |||||||||||||||
The government is providing additional funding of $20 million in 2022-23, held centrally, to support the provision of a 28-bed modular ward as part of the Logan Hospital expansion project.
| 2021-22 $‘000 | 2022-23 $‘000 | 2023-24 $‘000 | 2024-25 $‘000 | 2025-26 $‘000 | ||||||||||||||||
Queensland Regional Aeromedical Hub | 24,849 | — | — | — | — | |||||||||||||||
The government has provided additional funding of $24.8 million to the Brisbane Airport Corporation as a prepayment of the government’s net rent liabilities as a sub-tenant, reducing net-rent liabilities to nil to 2047. Funding of $20 million is being met internally by the department to support the project.
Total funding for this project is $60.3 million. The expense component of this measure can be found in Chapter 2 Expense measures.
158
Budget Measures 2022-23
Queensland Police Service
| 2021-22 $‘000 | 2022-23 $‘000 | 2023-24 $‘000 | 2024-25 $‘000 | 2025-26 $‘000 | ||||||||||||||||
Road Safety Anti Hooning Maximum Saturation Deterrence Trial | — | 5,160 | — | — | — | |||||||||||||||
The government is providing additional funding of $5.2 million in 2022-23 to undertake a road safety anti hooning maximum saturation deterrence trial. The expense component of this measure can be found in Chapter 2 Expenses measures.
| 2021-22 $‘000 | 2022-23 $‘000 | 2023-24 $‘000 | 2024-25 $‘000 | 2025-26 $‘000 | ||||||||||||||||
Queensland Government Air | — | 2,941 | — | — | — | |||||||||||||||
The government is providing additional funding of $2.9 million in 2022-23 to ensure the ongoing delivery of Queensland Government Air services. This funding is for the planned aircraft maintenance schedule to ensure continued airworthiness of both fixed wing and rotary wing flying assets. The expense component of this measure can be found in Chapter 2 Expenses measures.
| 2021-22 $‘000 | 2022-23 $‘000 | 2023-24 $‘000 | 2024-25 $‘000 | 2025-26 $‘000 | ||||||||||||||||
Report 1, Hear Her Voice Response - Domestic and Family Violence and Coercive Control Training and Education | — | — | — | — | — | |||||||||||||||
The government is providing additional funding of $166,000 in 2022-23, held centrally, for the delivery of enhanced education and training on domestic and family violence and coercive control to all levels of the service. The expense component of this measure can be found in Chapter 2 Expense measures.
This forms part of the government’s total funding package of $363 million over 5 years ($350 million new funding and $12.9 million internally met) to respond to the recommendations of the Queensland Women’s Safety and Justice Taskforce in Hear her voice - Report One - Addressing coercive control and domestic and family violence in Queensland. Further details on this package are in Chapter 1 of this paper.
159
Budget Measures 2022-23
| 2021-22 $‘000 | 2022-23 $‘000 | 2023-24 $‘000 | 2024-25 $‘000 | 2025-26 $‘000 | ||||||||||||||||
Report 1, Hear Her Voice Response - Review and Update of Domestic and Family Violence Operational Policy and Procedures and Risk Assessment Processes | — | — | — | — | — | |||||||||||||||
The government is providing additional funding of $41,000 in 2022-23, held centrally, to ensure operational policies and procedures guide police in identifying and responding to domestic and family violence as a pattern of behaviour over time and to review risk assessment processes in consultation with First Nations stakeholders and people with lived experience of domestic and family violence. The expense component of this measure can be found in Chapter 2 Expense Measures.
This forms part of the government’s total funding package of $363 million over 5 years ($350 million new funding and $12.9 million internally met) to respond to the recommendations of the Queensland Women’s Safety and Justice Taskforce in Hear her voice - Report One - Addressing coercive control and domestic and family violence in Queensland. Further details on this package are in Chapter 1 of this paper.
| 2021-22 $‘000 | 2022-23 $‘000 | 2023-24 $‘000 | 2024-25 $‘000 | 2025-26 $‘000 | ||||||||||||||||
Report 1, Hear Her Voice Response - Trial and Evaluate Mobile Co- responder Models | — | — | — | — | — | |||||||||||||||
The government is providing additional funding of $108,000 in 2022-23, held centrally, to trial and evaluate mobile co-responder models involving joint responses between Queensland Police Service and specialist domestic and family violence services.
The services component of this measure, including for the Department of Justice and Attorney-General, can be found in Chapter 2 Expense measures.
This forms part of the government’s total funding package of $363 million over 5 years ($350 million new funding and $12.9 million internally met) to respond to the recommendations of the Queensland Women’s Safety and Justice Taskforce in Hear her voice - Report One - Addressing coercive control and domestic and family violence in Queensland. Further details on this package are in Chapter 1 of this paper.
160
Budget Measures 2022-23
| 4 | Revenue Measures |
Introduction
The following tables present the relevant portfolio revenue measures relating to decisions taken since the 2021-22 Budget. For further explanation, refer to Explanation of Scope and Terms in Chapter 1.
161
Budget Measures 2022-23
Department of Regional Development, Manufacturing and Water
| 2021-22 $‘000 | 2022-23 $‘000 | 2023-24 $‘000 | 2024-25 $‘000 | 2025-26 $‘000 | ||||||||||||||||
Drought Assistance and Reform Package | — | — | — | — | — | |||||||||||||||
The government is providing relief of up to $1.5 million in 2022-23 through the waiver of fees associated with an annual water licence invoice and applications for stock or domestic water licences. The waiver is available to primary producers in drought declared areas and those who have an individually droughted property.
The Drought Assistance and Reform Package is a total of up to $79.6 million over 4 years from 2022-23 to support drought affected communities across the State (and $150 million over 3 years from 2022-23 for drought preparedness and emergency drought assistance loans). Further details can be found in the Department of Resources section of this chapter and the Department of Agriculture and Fisheries and the Department of Energy and Public Works sections of Chapter 2 Expense measures.
162
Budget Measures 2022-23
Department of Resources
| 2021-22 $‘000 | 2022-23 $‘000 | 2023-24 $‘000 | 2024-25 $‘000 | 2025-26 $‘000 | ||||||||||||||||
Drought Assistance and Reform Package | — | — | — | — | — | |||||||||||||||
The government is providing relief of up to $3.2 million in 2022-23 through rent rebates for drought declared areas.
The Drought Assistance and Reform Package is a total of up to $79.6 million over 4 years from 2022-23 to support drought affected communities across the State (and $150 million over 3 years from 2022-23 for drought preparedness and emergency drought assistance loans). Further details can be found in the Department of Regional Development, Manufacturing and Water section of this chapter and the Department of Agriculture and Fisheries and the Department of Energy and Public Works sections of Chapter 2 Expense measures.
163
Budget Measures 2022-23
Queensland Health
| 2021-22 $‘000 | 2022-23 $‘000 | 2023-24 $‘000 | 2024-25 $‘000 | 2025-26 $‘000 | ||||||||||||||||
Fee Alignment Cost Recovery for Healthcare Services Provided to Australian Defence Force Personnel | — | 2,368 | 2,463 | 2,563 | 2,666 | |||||||||||||||
The government is increasing the fees charged by Queensland Health for healthcare services provided to Australian Defence Force (ADF) personnel to continue cost recovery. The additional cost of these fees will be borne by the Australian Government not ADF personnel. This measure is estimated to generate $10.1 million in revenue from 2022-23 to 2025-26.
164
Budget Measures 2022-23
Queensland Treasury
| 2021-22 $‘000 | 2022-23 $‘000 | 2023-24 $‘000 | 2024-25 $‘000 | 2025-26 $‘000 | ||||||||||||||||
Progressive Coal Royalty Rates | — | 764,807 | 126,549 | 138,693 | 146,226 | |||||||||||||||
The government is introducing three additional royalty rate tiers to the coal royalty structure, for coal sold, disposed of or used on or after 1 July 2022 as follows:
| • | a rate of 20 per cent on that part of the average price per tonne more than A$175 but not more than A$225 |
| • | a rate of 30 per cent on that part of the average price per tonne more than A$225 but not more than A$300 |
| • | a rate of 40 per cent on that part of the average price per tonne more than A$300. |
The additional tiers of coal royalty rates will ensure during future periods of high coal prices that the royalty return to the people of Queensland is appropriate for the use of the state’s valuable and limited natural resources.
| 2021-22 $‘000 | 2022-23 $‘000 | 2023-24 $‘000 | 2024-25 $‘000 | 2025-26 $‘000 | ||||||||||||||||
Payroll Tax - Mental Health Levy | — | 183,776 | 390,340 | 407,515 | 425,446 | |||||||||||||||
The government is introducing a mental health levy on large employers (or groups of employers) with annual Australian taxable wages over $10 million, to provide a sustainable funding source for mental health services.
The mental health expense measures that this initiative funds is discussed in Chapter 2 Expenses measures. Where this measure actually raises more than sufficient revenue to fund the allocation to the mental health, alcohol and other drugs funding measures any additional funding will be available to allocate to future priority mental health capital initiatives.
Subject to the passage of legislative amendments, it is proposed that for payroll tax liabilities arising on or after 1 January 2023, a 0.25 per cent levy will apply to an employer’s (or group of employers) annual Australian taxable wages above $10 million, and an additional 0.5 per cent levy will apply to annual Australian taxable wages above $100 million of the employer (or group of employers).
165
Budget Measures 2022-23
| 2021-22 $‘000 | 2022-23 $‘000 | 2023-24 $‘000 | 2024-25 $‘000 | 2025-26 $‘000 | ||||||||||||||||
Betting Tax Reform | — | 40,000 | 80,000 | 80,000 | 80,000 | |||||||||||||||
The government has announced a new funding model to ensure ongoing sustainable funding for Queensland’s racing industry. The reforms include applying a 5 per cent racing levy to the betting tax and making bonus bets (or free bets) taxable. Racing Queensland will then be hypothecated 80 per cent of total betting tax revenue. Subject to the passage of legislative amendments, it is proposed that the changes will take effect from 1 December 2022.
| 2021-22 $‘000 | 2022-23 $‘000 | 2023-24 $‘000 | 2024-25 $‘000 | 2025-26 $‘000 | ||||||||||||||||
Additional Foreign Acquirer Duty Exemption for Retirement Visa Holders | — | (150 | ) | (300 | ) | (300 | ) | (300 | ) | |||||||||||
Retirement visa holders (that is, holders of subclass 405 and 410 visas) will be exempt from additional foreign acquirer duty for purchases of their principal place of residence on or after 1 January 2023. This change will ensure that, subject to conditions, holders of retirement visas who purchase a home will not be subject to a surcharge rate of duty, and only duty at standard concessional rates will apply to eligible transactions.
The change is subject to the passage of legislative amendments.
| 2021-22 $‘000 | 2022-23 $‘000 | 2023-24 $‘000 | 2024-25 $‘000 | 2025-26 $‘000 | ||||||||||||||||
Payroll Tax Extending Deduction Phase Out | — | (30,000 | ) | (60,000 | ) | (60,000 | ) | (60,000 | ) | |||||||||||
The government will provide tax relief to small and medium businesses, through adjustments to the existing payroll tax deduction framework.
Subject to the passage of legislative amendments, it is proposed that for payroll tax liabilities arising on or after 1 January 2023, the payroll tax deduction will be extended from the current ceiling of $6.5 million in annual Australian taxable wages up to $10.4 million. This reflects an increase in the phase out rate of the deduction from $1 for every $4 to a rate of $1 for every $7 of taxable wages above the $1.3 million threshold, benefitting over 12,000 businesses.
166
Budget Measures 2022-23
| 2021-22 $‘000 | 2022-23 $‘000 | 2023-24 $‘000 | 2024-25 $‘000 | 2025-26 $‘000 | ||||||||||||||||
Payroll Tax Apprentice and Trainee Rebate | — | (32,200 | ) | — | — | — | ||||||||||||||
The government is extending the 50 per cent payroll tax rebate on the exempt wages of apprentices and trainees until 30 June 2023. The extension of the rebate is part of the government’s ongoing commitment to support Queensland businesses and build Queensland’s skills base, including for Queensland’s youth, across all regions of the state.
The change is subject to the passage of legislative amendments.
167
Queensland Budget 2022–23 Budget Measures Budget Paper No.4
Queensland Budget 2022–23
Budget Measures Budget Paper No.4