EXHIBIT (c)(iii)
Budget Papers of the Co-Registrant for 2023-24
FORWARD-LOOKING STATEMENTS
This exhibit contains forward-looking statements. Statements that are not historical facts, including statements about the State of Queensland’s (the “State” or “Queensland”) beliefs and expectations, are forward-looking statements. These statements are based on current plans, budgets, estimates and projections and therefore you should not place undue reliance on them. The words “believe”, “may”, “will”, “should”, “estimate”, “continue”, “anticipate”, “intend”, “expect”, “forecast” and similar words are intended to identify forward-looking statements. Forward-looking statements speak only as of the date they are made, and neither the Queensland Treasury Corporation nor the State undertake any obligation to update publicly any of them in light of new information or future events.
Forward-looking statements are based on current plans, estimates and projections and, therefore, undue reliance should not be placed on them. Although the Queensland Treasury Corporation and the State believe that the beliefs and expectations reflected in such forward-looking statements are reasonable, no assurance can be given that such beliefs and expectations will prove to have been correct. Forward-looking statements involve inherent risks and uncertainties. We caution you that actual results may differ materially from those contained in any forward-looking statements.
A number of important factors could cause actual results to differ materially from those expressed in any forward-looking statement. Factors that could cause the actual outcomes to differ materially from those expressed or implied in forward-looking statements include:
| | • | | the international and Australian economies, and in particular the rates of growth (or contraction) of the State’s major trading partners; |
| | • | | the effects, both internationally and in Australia, of any subsequent economic downturn, as well as the effect of ongoing economic, banking and sovereign debt risk; |
| | • | | the effect of natural disasters, epidemics and geopolitical events, such as the novel coronavirus (COVID-19) pandemic, the Russia-Ukraine conflict and the Israel-Hamas conflict; |
| | • | | increases or decreases in international and Australian domestic interest rates; |
| | • | | changes in and increased volatility in currency exchange rates; |
| | • | | changes in the State’s domestic consumption; |
| | • | | changes in the State’s labor force participation and productivity; |
| | • | | downgrades in the credit ratings of the State and Australia; |
| | • | | changes in the rate of inflation in the State; |
| | • | | changes in environmental and other regulation; and |
| | • | | changes in the distribution of revenue from the Commonwealth of Australia Government to the State. |
(c)(iii)-1
| | |
| QUEENSLAND BUDGET 2023-24 | |  |
BUDGET SPEECH
BUDGET PAPER NO. 1

2023–24 Queensland Budget Papers
1. Budget Speech
2. Budget Strategy and Outlook
3. Capital Statement
4. Budget Measures
Service Delivery Statements
Appropriation Bills
Budget Overview
Regional Action Plans
© The State of Queensland (Queensland Treasury) 2023
Copyright
This publication is protected by the Copyright Act 1968
Licence
This document is licensed by the State of Queensland (Queensland Treasury) under a Creative Commons Attribution (CC BY 4.0) International licence.

In essence, you are free to copy, communicate and adapt this publication, as long as you attribute the work to the State of Queensland (Queensland Treasury).
Attribution
Content from this publication should be attributed to:
© The State of Queensland (Queensland Treasury) - 2023–24 Queensland Budget

Translating and interpreting assistance
The Queensland Government is committed to providing accessible services to Queenslanders from all cultural and linguistic backgrounds. If you have difficulty in understanding this publication, you can contact us on telephone (07) 3035 3503 and we will arrange an interpreter to effectively communicate the report to you.
Budget Speech
Budget Paper No. 1
ISSN 1445-4890 (Print)
ISSN 1445-4904 (Online)
APPROPRIATION BILL 2023
THE HONOURABLE CAMERON DICK MP
TREASURER
MINISTER FOR TRADE AND INVESTMENT
Introduction
All over this country, Australians are feeling cost-of-living pressures in ways they have never felt them before.
On every trip to the supermarket, it seems like prices just keep going up and up.
Every time Australians have to fill up the car, or pay their mortgage, or pay the phone bill, costs seem to go up.
And while the Federal Government is stepping up for many Australians, many more are still feeling the pinch.
Many do not receive any Federal assistance to help them.
Today, for all those Queenslanders facing cost of living pressures, I have a simple message.
Help is on the way.
In this Budget, our government will deliver greater and more widespread cost-of-living relief than any other government in Australia, state or Federal.
Through this budget, no matter who they are, Queenslanders will receive cost-of-living relief from our government through their electricity bill.
And the value of that cost-of-living relief will be higher than anywhere else in Australia.
In this budget, the Palaszczuk Labor Government will also step up to invest even more into building our future.
This budget commits our government to the biggest building program in our state’s history.
Our government will deliver more hospitals, more houses, more roads, more trains, and more schools.
Page 1 of 18
And we will support more Queenslanders with the essential government services that they deserve.
Speaker, unlike some states, we will not be racking up bills on the credit card to pay for this.
We will do it the Queensland way.
The Labor way.
As we invest in cost-of-living relief, in our infrastructure Big Build, and in services across the state, we will also pay down debt.
We can do this because of our government’s strong and effective economic management.
And Labor’s strong economic management is demonstrated by our budget bottom line.
That’s why I am pleased to announce today, that for this financial year, Queensland’s budget surplus will be $12.3 billion.
This is the largest budget surplus ever recorded by any state or territory government.
And our budget surplus is larger than all but four surpluses delivered by the government of the Commonwealth of Australia, all more than fifteen years ago.
I am also pleased to announce that the funds from this double-digit surplus will pay down state debt.
Because of that surplus, we will finish the forward estimates with lower net debt than previously forecast by Queensland Treasury.
This will be achieved, even with our record infrastructure spend.
We can deliver our state’s biggest cost of living program, our state’s biggest building program, and deliver lower debt, because of one simple reason.
Progressive coal royalties.
Our decision, to take on the mining lobby, to stand our ground, and to fight for the people of our state, has delivered a rich reward for Queenslanders.
As rich as that reward is for the people of Queensland, it is a mere fraction of the rewards being earned by big coal companies.
Page 2 of 18
Those coal companies will earn four times as much in revenues as Queenslanders make in royalties.
Speaker, we know the mining lobby, and its allies, will keep fighting these progressive coal royalties.
The mining lobby and its allies simply do not think the people of Queensland deserve a fair share of mining profits.
That’s why the mining lobby is spending $40 million on a campaign to overturn progressive coal royalties.
Speaker, tomorrow marks 500 days until the next Queensland State Election.
Those 500 days will be defined by the debate over what Queenslanders deserve.
And the choice is clear.
Queenslanders can have progressive coal royalties, which means more cost-of-living relief, better services, infrastructure for regional Queenslanders including hospitals, and lower debt.
Or there can be a Queensland without progressive coal royalties, which means there will be no cost-of-living relief, cancelled infrastructure programs, cuts to services, and a higher debt burden.
Speaker, it is not enough for people to say that they support the projects, or that they support the cost-of-living relief in this budget.
To credibly support the projects in this budget, to credibly support the cost-of-living relief in this budget, then government must support keeping progressive coal royalties, permanently.
And the position of the Palaszczuk Labor Government could not be clearer.
For so long as there is a Labor Government in this state, we will keep progressive coal royalties.
I call upon those who will speak through the course of the debate on these Appropriation Bills to also make their position clear, without prevarication, evasion, or equivocation.
Do Members of this House support progressive coal royalties in their entirety, and all that they deliver for Queenslanders, or not?
Page 3 of 18
This budget debate will allow honourable Members, and all political parties, to make a public declaration on whether they support progressive coal royalties in their entirety, or not.
Our government’s position is clear, because we will need every dollar to continue to deliver the budget priorities for Queensland.
Cost of living
The highest priority of this budget is cost-of-living relief.
That priority is to deliver cost-of-living relief, but to do so in a way that does not add to inflationary pressures.
This budget delivers the strongest direct cost-of-living support package of any Australian state government.
Thanks to the Albanese Labor Government, many Queensland households will receive $250 through a Federal Government electricity rebate, matched by another $250 from our government.
However, under the terms set by the Federal Government, around half of Queensland households will receive no relief from that rebate.
Speaker, I am pleased to announce today that our government will deliver a major expansion of the rebate program.
And we will pay for the entirety of that expansion program ourselves.
As a result of our investment, every Queensland household, including those not eligible under the Federal program, will receive an enhanced electricity rebate, totalling at least $550.
This payment will go to every one of the 2.2 million Queensland households.
And that is only right.
Because every household in Queensland owns our electricity assets.
And through our Queensland Energy and Jobs Plan, we intend to keep it that way, as we deliver our world leading plan to transition to clean energy.
Our government also recognises that when inflation is high, low-income households bear the brunt of cost-of-living pressures.
Page 4 of 18
I know that first hand from the community I am so proud to represent in this House.
When cost-of-living pressures hit, they hit electorates like Woodridge first, and they hit hard.
So on top of the $550 payment, eligible Queensland concession holders will also continue to access their $372 standing concession.
Furthermore, I am pleased to announce that, on top of those payments, eligible Queensland concession holders will also receive an additional electricity bill rebate of $150.
Altogether, it means eligible Queensland concession holders will receive a total of $1,072 in concessions and cost-of-living relief.
That means low-income Queensland households, such as pensioners, may pay nothing for electricity next financial year.
This will free up their finances for other essential purchases.
Again, that is only fair.
Our government also understands the cost-of-living pressures faced by working Queensland families with young children.
And we understand the economic potential that is unlocked by enabling more women to get back into the workforce.
That is why today I am announcing that this Budget will provide $645 million over four years to fund 15 hours each week of free kindergarten for all 4-year-old Queensland children from January 2024.
Over the course of a year, that means an average saving of $4,600 for many Queensland families.
Making kindy more affordable, puts more money into the pockets of working Queenslanders.
And it gives more Queenslanders the opportunity to return to work, or to take on more work, further easing pressures.
In further targeted cost-of-living relief, this budget invests $4.8 million over two years in a new SwimStart program.
Modelled on the successful FairPlay vouchers, this program will provide more than 30,000 vouchers valued at up to $150 for eligible children under the age of five to learn to swim.
Page 5 of 18
Our government also recognises the distances that some Queenslanders must travel in a state as large as ours to get to the medical care they require.
That’s why this Budget provides $70 million over four years to increase accommodation and fuel subsidies under the Patient Travel Subsidy Scheme.
Health
More parents returning to the workforce because of free kindy is good for the Queensland economy.
And when more Queenslanders are healthy, that is also good for our economy.
The enduring lesson of the pandemic is that a strong health response leads to a strong economy.
Speaker, our government always puts health first.
That’s why this budget sets yet another record for health funding.
Next financial year, Queensland’s health budget will be a record $25.8 billion.
The 9.6 per cent increase in the health operating budget represents the largest annual increase in the health budget in Queensland history.
This budget continues the delivery of our record $9.8 billion hospital construction program, building new or expanded hospitals across the state including in Cairns, Townsville, Mackay, Bundaberg, Hervey Bay, Toowoomba and in South East Queensland.
This is the biggest health building program of any state or territory in Australia.
Our record health funding also includes $764 million to specifically address ambulance ramping and healthcare pressures that contribute to emergency department wait times.
We are investing $72 million for 200 more paramedics, $28 million for new and replacement ambulances, and $22 million in a cost-of-living allowance for nursing and midwifery students in regional, rural and remote Queensland.
Housing
Across Australia, and in many parts of the world, housing shortages are a source of daily distress for those without a home, or in fear of losing their home.
Page 6 of 18
Understandably, this housing shortage is an issue of great concern to many Queenslanders.
The causes are clear.
A shortage of building and construction materials caused by pandemic-related supply chain issues.
A shortage of tradies after stronger than expected employment growth.
And a fundamental change in household composition, accelerated by the pandemic.
In 2015, the average Australian dwelling was home to 2.6 people.
Today, that number has shrunk to 2.5.
That small change has a big impact.
All other things being equal, it means Queensland would need an extra 77,000 homes just to keep pace with that decline in household size.
But so much has changed in that time.
The pandemic also demonstrated what a great place Queensland is to live.
A safe harbour, with good jobs, better services, and a great lifestyle.
Our government has been addressing the challenge of population growth.
That’s why, as Treasurer, I was proud to help create the Housing Investment Fund, which is now supporting its first tenants in homes in regional Queensland.
And it’s also why I am pleased to announce today an additional investment of $1.1 billion into the housing portfolio.
This investment will meet the higher costs of construction faced by the Queensland Government in delivering our housing building program.
Anyone who pretends governments are immune from the rapid rise in construction costs that has affected the entire industry in Australia is economically naïve, or seeks to deceive Queenslanders.
Our investment will also see an additional $322 million to increase our social housing target by another 500 homes.
Page 7 of 18
Community Safety
Every Queenslander deserves to have a home.
And every Queenslander deserves to be safe in that home.
Our government recognises increasing community concerns about youth crime, and we are acting to address those concerns.
The budget delivers additional investment of over $440 million over five years to help boost police resources and tackle the complex causes of youth crime and support community safety.
This includes $96 million for Youth Co-responder Teams who engage with young people, to break the cycle of youth crime.
It supports up to $30 million in funding to enable seniors to be more secure in their homes.
Our government will provide $37 million to implement the Strengthening Community Safety Act 2023, which ensures repeat offenders spend less time on remand, and more time serving their sentences.
And we will invest $58.3 million over four years to implement the Domestic, Family and Sexual Violence review.
Big Build
Our government is proud to be making preparations for Queensland to host the 2032 Olympic and Paralympic Games.
We are planning for the renewable ambition of our Queensland Energy and Jobs Plan.
And as more people decide every week to become Queenslanders, we are planning for the hospitals, schools, roads and dams Queenslanders deserve, right across this state.
Today I am pleased to announce that over the four years to 2026–27, we will more than meet our $50 billion Infrastructure Guarantee.
Queensland’s Big Build, our total capital program over those four years, is forecast to be $89 billion.
This unprecedented peak is the result of accelerated works for the Queensland Energy and Jobs Plan, and the Queensland Health and Hospitals Plan, and also takes into account higher prices for construction wages and materials.
Page 8 of 18
Even as construction costs rise significantly across the country, continuing with these investments is a deliberate decision by our government.
Government either backs these projects and accepts their higher costs, or government has to walk away.
And our government will never walk away from the needs of Queenslanders.
The labour shortages that are driving up construction costs are also testing the depth of Queensland’s skills base.
Our ability to transition to a low carbon, more diversified and more industrialised economy will be underpinned by the resilience and flexibility of Queensland’s workforce.
Increased skills means increased productivity, which is the key to further wages growth.
This Budget supports The Good People, Good jobs: Queensland Workforce Strategy 2022–2032, which will strengthen local communities and ensure our workforce has the agility to support growth.
Next financial year our government will invest more than $1.2 billion in skills and training initiatives supporting workforce development and overcoming barriers to employment.
Transport Infrastructure
The $6.9 billion to be invested in transport infrastructure next financial year includes $420 million towards Stage 1 of the Coomera Connector.
It includes $260 million towards Stage 3 of Gold Coast Light Rail.
This budget will fund major upgrades to the M1 and the Bruce Highway.
And it will invest in the Queensland Train Manufacturing Program in Maryborough, the Gold Coast Faster Rail project and Cross River Rail.
Water Infrastructure
In a state as vast as Queensland, we understand the importance of infrastructure.
Not just roads, but water projects as well.
Page 9 of 18
This budget includes more than $150 million to complete construction of Rookwood Weir, as well as planning and early works for upgrades to the Burdekin Falls Dam, to Paradise Dam near Bundaberg and to the Awoonga Dam near Gladstone.
This budget also includes over $13 million for the Toowoomba to Warwick water pipeline and over $548 million for the Fitzroy to Gladstone water pipeline.
The Fitzroy to Gladstone water pipeline is one of many projects to be funded through our new progressive coal royalty tiers.
Education Infrastructure
As our government plans for Queensland’s future, we recognise that the need for new schools in new growth areas will be enduring.
To that end, we will invest $968 million over ten years to establish a Rolling Land Fund.
The focus of this fund will be the strategic acquisition of new school sites.
For existing Queensland state schools, this Budget invests $358 million for new general and specialist learning spaces.
And this Budget provides a further $259 million over three years to expand the successful school halls program.
Regional Infrastructure
As I said earlier, one of the cornerstones of this budget is the revenue generated by the coal owned by the people of Queensland.
That revenue is generated in regional Queensland, so it is only right that regional Queensland stands to benefit from what that revenue provides.
In each of the four budgets I have delivered, more than half of the total infrastructure investment has been outside greater Brisbane.
In this Budget, that proportion rises to a record 65 and a half per cent of capital investment outside Brisbane, or $13.3 billion next financial year.
In this Budget our government will provide an additional $6 billion in funding to our government-owned corporations, for priority infrastructure projects including energy, water and ports.
Page 10 of 18
Much of that investment will deliver the generational transformation that is the Queensland Energy and Jobs Plan.
That is a plan that will revolutionise Queensland’s economy.
And it will do so in regional Queensland.
Over the next four years, our government will deliver an equity investment of $6 billion to Queensland Hydro to help deliver the $14 billion Borumba Pumped Hydro Project.
Operating as a gravity-fed battery, the 2-gigawatt Borumba project will have the capacity to provide one-third of Queensland’s current average electricity demand for a period of 24 hours.
Next financial year, significant investments through our publicly-owned energy businesses include $594 million for CopperString 2032.
In the coming year, through CleanCo, we will invest $213 million to develop wind and solar projects in Central Queensland and the Swanbank Battery.
We will invest $673 million through Stanwell to develop the Wambo and Tarong West wind farms and large-scale batteries, and $312 million through CS Energy for Central Queensland wind farms and large-scale batteries.
Across the four years to 2026–27, this budget provides $19 billion in total capital investment to support the Queensland Energy and Jobs Plan.
Our energy transition will not leave behind the very resource communities in regional Queensland whose toil has enabled so much wealth to be generated.
As this energy transition occurs, the world will continue to need steel-making coal and other vital minerals.
This Budget will ensure that Queensland will continue to be able to meet that need, by working with the mining industry.
We will work together to fast-track capital investments that reduce emissions through the $500 million Low Emissions Investment Partnerships program.
And regional Queensland delivers our economic success not just through minerals resources, but through the food and fibre that is recognised around the world for its sustainable quality.
Queensland’s reputation for high quality agriculture is a competitive advantage that must be maintained.
Page 11 of 18
Over five years, this Budget provides additional funding of $22 million to address increasing animal biosecurity risks, including the risk of foot-and-mouth disease and lumpy skin disease, and a further $22 million towards biosecurity preparedness for plant pests and diseases.
Other Infrastructure
As our planning for the 2032 Olympic and Paralympic Games continues on track, this Budget provides $1.9 billion over the next four years to commence delivery of venue infrastructure.
And because Queenslanders know there is always a natural disaster waiting somewhere around the corner, this Budget includes $152 million to enhance Queensland’s disaster recovery and resilience.
This initiative is jointly funded with the Australian Government, from efficiencies in Disaster Recovery Funding Arrangements.
Next financial year, this Budget provides $8 million to enable the Rural Fire Service to improve its capability and ensure a sustainable volunteer model across Queensland.
When natural disasters strike Queensland, we rely on the invaluable role that volunteers play, because volunteering is deeply ingrained in the Queensland character.
So, we are providing funding of $3 million in 2023–24 to enable the State Emergency Service to enhance its volunteer capability.
First Nations
This year, our Parliament passed the historic Path to Treaty Bill.
And this year, Australians will vote on finally recognising our First Nations people in the Australian Constitution by enshrining an Indigenous Voice to Parliament.
Accordingly, this year’s budget papers seek to reflect Queensland’s First Nations heritage.
I wish to acknowledge David Williams, a proud Wakka Wakka artist, who is responsible for the artwork for this year’s budget papers.
That artwork tells a story that begins at the heart of the state’s economy, and the Treasury’s place of duty and responsibility.
It describes Treasury’s journey to connect meaningfully with communities, and recognises Treasury’s responsibility to recognise and celebrate First Nations cultures, contributions, and achievements.
Page 12 of 18
To build strong and authentic connections with First Nations people and communities wherever possible.
Our government has, of course, committed to reframing Queensland’s relationship with its First Nations people.
We will partner with Aboriginal and Torres Strait Islander people to deliver the best care for country through traditional knowledge and expertise, through co-stewardship arrangements and by recognising native title.
I am proud to announce this Budget will provide $39 million over four years to ensure that we progress agreements, and relationships, that promote respect, culture, rights and active co-stewardship of Country.
Our government is also providing increased funding of $50 million over four years for the continuation of the expanded Indigenous Land and Sea Ranger Program, which has doubled ranger numbers to 200.
Environment
Across Australia, and around the world, Queensland’s natural environment is renowned.
As custodians of that environment, we have a solemn responsibility to protect it, but also to ensure Queenslanders and visitors have the opportunity to appreciate its majesty.
This Budget provides increased funding of $38 million over four years to build new visitor trails in National Parks and to revitalise existing ones.
Doing so is good for our environment, it is good for tourism, and it is good for regional small businesses and the employment of First Nations peoples.
Our government is also providing an additional $5.8 million over three years for investment into infrastructure improvements in Queensland's precious World Heritage areas.
And to make sure as many international and domestic visitors as possible have the chance to see those World Heritage Areas, this Budget provides $272 million over four years for delivery of the Towards Tourism 2032: Transforming Queensland’s visitor economy future strategy.
Economic forecast and fiscal update
The strength of this year’s Budget gives us the ability to make the investments necessary to ensure Queensland’s continued prosperity.
And we can make these investments while maintaining borrowings at sustainable levels.
Page 13 of 18
We need to conserve Queensland’s fiscal strength, because the path ahead remains uncertain.
The International Monetary Fund has downgraded its global growth outlook for calendar 2023.
Russia’s illegal and obscene war in Ukraine continues to inflict human misery and economic carnage every day.
Around the world, economic conditions are deteriorating as interest rates rise to ward off inflation.
Queensland’s economy is forecast to grow two per cent this financial year, rising to three per cent in 2023–24.
By comparison, the Reserve Bank of Australia expects national economic growth to slow again, to one and a half per cent in calendar year 2024.
Inflation is forecast to continue easing, down to three and three-quarter per cent next financial year.
To date, household spending in Queensland has proved resilient in the face of successive interest rate rises.
But consumer spending growth is forecast to slow materially next financial year.
High rates of capacity utilisation and a strong construction pipeline should see business investment continue to rise, while easing supply constraints are forecast to see a welcome increase in dwelling investment.
As Queensland’s State Final Demand has grown faster than the rest of Australia, so too has our demand for labour.
Employment growth is forecast to ease from three and a quarter per cent in 2022–23 to one per cent next financial year.
But unemployment will continue to remain low by historical standards, at four and a quarter per cent next financial year, rising to four and a half per cent in 2024–25.
Queensland’s fiscal position is easily the strongest of the major states.
In 2022–23, that strength is due in large part to our progressive coal royalty tiers.
Page 14 of 18
Those progressive coal royalty tiers give our government the fiscal capacity to support Queenslanders in a way that no other state or territory can.
At the same time, expenses for 2022–23 have been managed broadly within the forecasts provided at last year’s budget.
Our government is acutely aware that the cost of living measures we put in place must not risk further exacerbating inflationary pressures.
We can do so while improving our debt position and delivering a record surplus.
Three years ago, in my first Budget, I forecast four deficits in a row.
That was the prudent course of action to adopt at that time, to absorb the pain of the pandemic.
And it was what Queenslanders voted for in the 2020 State Election.
Two of those deficits have now been erased, thanks to our fiscal management and progressive coal royalties.
The one deficit that remains, in 2023–24, is the written proof that our government puts the finances of everyday Queenslanders first.
That one remaining budget deficit is the result of our deliberate decision to dig deeper than our annual revenues would otherwise allow, to support Queenslanders with cost-of-living relief.
Through our efforts, and through our commitments, we send an important message to Queensland households and families.
Our government is willing to keep our Budget in deficit, if it means keeping the budgets of more Queensland households and families in surplus.
Our fiscal strength means we can afford to make that decision, given this Budget shows a level of debt that is less than half of what was forecast, just under two years ago.
Over successive budgets, revenue from coal royalties has been targeted towards fiscal recovery and a lower reliance on debt.
Queensland’s general government net debt to revenue ratio for the current financial year has been reduced from 27 per cent in the 2022–23 Budget, to just seven per cent in this Budget.
Page 15 of 18
This is below pre-pandemic expectations, with the 2019 Budget forecasting a net debt to revenue ratio of 30 per cent in 2022–23.
As a result of our $89 billion Big Build capital investment, the ratio of net debt to revenue is expected to increase to 55 per cent by 2026–27.
But that remains far lower than the ratios of other major states, with Victoria projecting a ratio of 172 per cent in the same year, and New South Wales projecting a ratio of 102 per cent by 2025–26.
There will, of course, be those who choose to deliberately ignore this measure of net debt, which is the accepted measure of debt for the Commonwealth Government, and for every other state and territory.
They will use the figure of $147 billion for Non-financial Public Sector Debt by the end of the forward estimates.
Some will even mistakenly compare that to net debt in other states.
Speaker, I will never stop correcting those errors, whoever makes them and wherever they are made.
But if some decide that nowhere else can be compared to the strength of the Queensland balance sheet, so be it.
If that is the number we have to wear in order to make the right decisions for Queensland, that is a number we will wear as a badge of honour.
That $147 billion in Non-financial Public Sector borrowings shows the strength of the balance sheets of our government-owned corporations.
We make no apology for using the strength of the balance sheets of our government-owned corporations to build Queensland’s renewable energy future, through our Energy and Jobs Plan.
The pumped hydro projects, the Queensland transmission SuperGrid including 500 kilovolt transmission lines, the solar and wind farms that will transform our economy and create more low emissions jobs in manufacturing and heavy industry.
Supplementary Appropriation
Speaker, this year’s Budget also provides for an improved level of scrutiny of appropriations.
Page 16 of 18
Every year, after the budget, Treasurers introduce a supplementary appropriation, to deal with unforeseen expenditure that has arisen in the previous financial year.
Unforeseen Expenditure represents additional funding required by departments above what was provided for in the original appropriation.
These additional amounts reflect expenditures related to unforeseen events like natural disasters, accelerated expenditures where programs are brought forward, decisions taken by Government after the budget, as well as technical adjustments that occur throughout the year.
Rather than have the Parliament wait until September or October after the financial year, this year, unforeseen expenditure, up until April 2023, has been incorporated into the Appropriation Bill that I am introducing today.
This is an important reform, as it means those amounts for Unforeseen Expenditure can be requested from the Parliament at the earliest opportunity, and can be scrutinised by the Parliament through the Estimates process.
This is another example of our government’s commitment to transparency and the Parliamentary process, and I am sure it will be welcomed by all Members.
I also note that there may still be a need for a small, supplementary appropriation to be introduced later in the year.
This will reflect any unforeseen expenditure arising in May and June of this year.
Conclusion
Speaker, the challenges faced by our state are significant.
We face tough economic headwinds, the highest inflation in a generation, the continuing war in Europe, and high interest rates.
And Queensland households and families experience those headwinds, through a higher cost of living.
But our actions, 12 months ago, to put in place progressive coal royalties is the decision that sets up our state to take on those challenges.
Speaker, because of those coal royalties, and the surplus that they have delivered, this Budget delivers what the people of Queensland need.
Comprehensive cost-of-living relief.
Page 17 of 18
Our state’s record Big Build.
New investments in health, housing, and youth justice.
The transformation of our energy system to clean renewable energy.
And much lower debt.
No other government in Australia could promise this.
And no other Government in Australia could deliver, what this Budget delivers, for Queensland.
Page 18 of 18
Queensland Budget 2023–24 Budget Speech Budget Paper No.1

Queensland Budget 2023–24
Budget Speech Budget Paper No.1
‘Rich history, thriving future.’ artwork by David Williams of Gilimbaa.
| | |
| QUEENSLAND BUDGET 2023–24 | | |
BUDGET STRATEGY AND OUTLOOK
BUDGET PAPER NO. 2
2023–24 Queensland Budget Papers
1. Budget Speech
2. Budget Strategy and Outlook
3. Capital Statement
4. Budget Measures
Service Delivery Statements
Appropriation Bills
Budget Overview
Regional Action Plans
© The State of Queensland (Queensland Treasury) 2023
Copyright
This publication is protected by the Copyright Act 1968
Licence
This document is licensed by the State of Queensland (Queensland Treasury) under a Creative Commons Attribution (CC BY 4.0) International licence.
In essence, you are free to copy, communicate and adapt this publication, as long as you attribute the work to the State of Queensland (Queensland Treasury).
Attribution
Content from this publication should be attributed to:
© The State of Queensland (Queensland Treasury) - 2023–24 Queensland Budget
Translating and interpreting assistance
The Queensland Government is committed to providing accessible services to Queenslanders from all cultural and linguistic backgrounds. If you have difficulty in understanding this publication, you can contact us on telephone (07) 3035 3503 and we will arrange an interpreter to effectively communicate the report to you.
Budget Strategy and Outlook
Budget Paper No. 2
ISSN 1445-4890 (Print)
ISSN 1445-4904 (Online)
Budget Strategy and Outlook 2023-24

State Budget
2023–24
Budget Strategy and Outlook
Budget Paper No. 2
Budget Strategy and Outlook 2023-24
Contents
| | | | | | |
Overview | | | 1 | |
| | |
1 | | Budget priorities and economic strategy | | | 7 | |
| | |
1.1 | | Building on strong foundations | | | 8 | |
1.2 | | Tackling the cost of living | | | 10 | |
1.3 | | Investing in Queensland’s future to create more jobs in more industries | | | 15 | |
1.4 | | Delivering better services | | | 21 | |
| | |
2 | | Economic performance and outlook | | | 23 | |
| | |
2.1 | | International conditions | | | 24 | |
2.2 | | National conditions | | | 27 | |
2.3 | | Key assumptions | | | 29 | |
2.4 | | Queensland conditions and outlook | | | 29 | |
2.5 | | Risks to the outlook | | | 52 | |
| | |
3 | | Fiscal strategy and outlook | | | 54 | |
| | |
3.1 | | Fiscal outlook | | | 55 | |
3.2 | | Key fiscal aggregates | | | 60 | |
| | |
4 | | Revenue | | | 77 | |
| | |
4.1 | | 2022–23 Estimated actual | | | 78 | |
4.2 | | 2023–24 Budget and outyears | | | 78 | |
4.3 | | Revenue initiatives | | | 81 | |
4.4 | | Revenue by operating statement category | | | 85 | |
| | |
5 | | Expenses | | | 119 | |
Budget Strategy and Outlook 2023-24
| | | | | | |
5.1 | | 2022–23 estimated actual | | | 119 | |
5.2 | | 2023–24 Budget and outyears | | | 120 | |
5.3 | | Expenses by operating statement category | | | 121 | |
5.4 | | Operating expenses by purpose | | | 128 | |
| | |
6 | | Balance sheet and cash flows | | | 130 | |
| | |
6.1 | | Overview | | | 131 | |
6.2 | | Balance sheet | | | 131 | |
6.3 | | Cash flows | | | 138 | |
| | |
7 | | Intergovernmental financial relations | | | 140 | |
| | |
7.1 | | Federal financial arrangements | | | 141 | |
7.2 | | Australian Government funding to all states and territories | | | 144 | |
7.3 | | Australian Government funding to Queensland | | | 145 | |
7.4 | | Payments to Queensland for specific purposes | | | 146 | |
7.5 | | State–local government financial relations | | | 151 | |
| | |
8 | | Public Non-financial Corporations Sector | | | 155 | |
| | |
8.1 | | Context | | | 156 | |
8.2 | | Finances and performance | | | 164 | |
| | |
9 | | Uniform Presentation Framework | | | 172 | |
| | |
9.1 | | Context | | | 172 | |
9.2 | | Uniform Presentation Framework financial information | | | 172 | |
9.3 | | General Government Sector time series | | | 182 | |
9.4 | | Other General Government Sector Uniform Presentation Framework data | | | 184 | |
9.5 | | Contingent liabilities | | | 188 | |
9.6 | | Background and interpretation of Uniform Presentation Framework | | | 188 | |
9.7 | | Sector classification | | | 190 | |
Budget Strategy and Outlook 2023-24
| | | | | | |
9.8 | | Reporting entities | | | 191 | |
| |
Appendix A: Concessions statement | | | 195 | |
| |
Focus | | | 198 | |
Explanation of scope | | | 198 | |
A.1 Concessions summary | | | 200 | |
A.2 Concessions by agency | | | 201 | |
A.3 Concessions by Government-owned corporation | | | 227 | |
| |
Appendix B: Tax expenditure statement | | | 230 | |
| |
Context | | | 230 | |
Methodology | | | 231 | |
The tax expenditure statement | | | 232 | |
Discussion of individual taxes | | | 234 | |
| |
Appendix C: Revenue and expense assumptions and sensitivity analysis | | | 239 | |
| |
Taxation revenue assumptions and revenue risks | | | 240 | |
Royalty assumptions and revenue risks | | | 241 | |
Parameters influencing Australian Government GST payments to Queensland | | | 242 | |
Sensitivity of expenditure estimates and expenditure risks | | | 242 | |
| |
Appendix D: Fiscal aggregates and indicators | | | 244 | |
Budget Strategy and Outlook 2023-24
Overview
Leveraging Queensland’s strong economic performance, the 2023–24 Queensland Budget is responding to key challenges facing Queenslanders, including addressing cost-of-living pressures, enhancing health services, improving housing affordability and keeping communities safe.
The Budget is also investing substantially in healthcare and critical infrastructure across all regions to position Queensland on a clear path towards longer-term growth and prosperity.
The historic surplus in 2022–23, driven by the temporary surge in royalties due to the exceptionally high coal prices benefitting the state’s coal producers, is providing capacity for the government to address these immediate challenges. This includes delivering substantial cost-of-living support to Queensland families and businesses, while also funding a record capital program to grow the economy and respond to Queensland’s service and regional needs.
Tackling the cost of living
Cost-of-living pressures are being felt across the country, with all Australian households, businesses and industries continuing to face challenges including higher interest rates and higher costs of goods and services.
The Queensland Government is taking action on this national problem, with the 2023–24 Budget providing a record $8.224 billion in concessions, an increase of over 21 per cent compared to 2022–23.
Notably, the 2023–24 Budget is providing $1.617 billion in new and expanded cost-of-living measures in 2023–24.
This includes $1.483 billion to deliver additional electricity bill support for households and small businesses facing cost-of-living pressures. This is the most significant electricity bill support package announced by any state or territory, more than doubling the size of the federally agreed support package for Queensland under the National Energy Bill Relief Fund.
This year’s Budget provides $645 million over 4 years from 2023–24 to provide 15 hours per week of free kindergarten from January 2024 for all 4-year-old Queensland children. This will reduce cost-of-living pressures for families, support labour market participation and improve educational outcomes.
The government is continuing to support improved social and affordable housing outcomes across Queensland, including through its $2 billion Housing Investment Fund. The Budget includes substantial tax concessions for eligible Build to Rent developments that provide affordable dwellings at discounted rents.
Over the medium term, increasing labour force flexibility, skills and participation, and other actions to enhance the competitiveness and productivity of the state’s businesses, will help reduce supply side constraints and dampen pressure on prices and cost of living.
The Big Build – infrastructure for a growing state
As Queensland continues to grow and diversify, continued investment in infrastructure will support productivity growth and enhanced standards of living.
1
Budget Strategy and Outlook 2023-24
The record capital program of $88.729 billion over the 4 years to 2026–27, directly supporting around 58,000 jobs in 2023–24, will provide productivity-enhancing infrastructure across all regions of the state that will improve the competitiveness of Queensland’s traditional industries and support growth in new and emerging sectors.
It will also provide the critical social infrastructure needed to support essential health and other services to meet the needs of a growing population.
Infrastructure delivered through the capital program will better connect communities across the state and strengthen their resilience in the face of future global challenges and natural disasters.
It will support job creation and attract people, skills and private investment to the regions, as well as improve overall liveability.
Delivering better services
The 2023–24 Budget continues to leverage off the significant investments made to date to deliver better services to Queenslanders.
Ongoing investment in essential services, including health, housing, education, justice, safety and social services, will continue delivering enduring social and economic benefits. These services support increased economic participation and improve the wellbeing of Queenslanders.
This Budget includes $25.791 billion in total health funding and $21.104 billion in total education and training funding in 2023–24, as well as significant levels of ongoing expenditure to safeguard and protect communities, improve liveability and enhance Queensland’s lifestyle.
Through this targeted service delivery, the government is also directly investing in the growth and development of a healthy and skilled workforce to help drive productivity, boost real incomes and improve standards of living over the longer term.
Economic strategy – investing in Queensland’s future
By addressing short-term challenges and laying a strong platform for future growth, the 2023–24 Budget is supporting delivery of the government’s overarching community objectives of good jobs, better services and great lifestyle.
The 2023–24 Budget, including the record capital program, will also support the ongoing transformation of the Queensland economy, in line with the government’s economic strategy focused on growing a sustainable and diversified economy that is resilient, productive, competitive and able to respond to future opportunities and challenges.
This investment will continue to create more jobs in more industries by leveraging Queensland’s strengths, growing its traditional and emerging industries, expanding supply chains, and seizing opportunities in the lead up to the Brisbane 2032 Olympic and Paralympic Games and beyond.
Key initiatives and investments outlined in the 2023–24 Budget will help enable Queensland businesses, industries and communities to capitalise on these opportunities and drive future growth across all regions of the state. As well as the initiatives outlined above, this includes more than $1.2 billion in skills and training initiatives in 2023–24, $520 million over the period 2023–24 to 2029–30 for investments through the Low Emissions Investment Partnerships program, and $16.3 million over 4 years for a package of measures to support women’s economic security. As part of the government’s capital program, $19 billion is being invested over the forward estimates to deliver on the Queensland Energy and Jobs Plan and provide clean, reliable and affordable power for generations.
2
Budget Strategy and Outlook 2023-24
Economic outlook
Following strong growth of 4.4 per cent in 2021–22, the Queensland economy is now forecast to grow a further 2 per cent in 2022–23 and strengthen to 3 per cent growth in 2023–24. The economic growth profile reflects temporary domestic and international supply constraints, which have negatively impacted private investment, especially housing construction, and the overseas trade sector in 2022–23, and their subsequent unwinding.
Interest rates also continue to filter through to borrowers and household spending growth is expected to slow materially over the coming year.
With high rates of capacity utilisation and a solid pipeline of non-dwelling construction projects, overall business investment in Queensland is forecast to grow further.
While the nominal value of Queensland’s exports is expected to grow to a record of almost $140 billion in 2022–23, driven largely by exceptionally high global coal prices, commodity prices are forecast to normalise as supply issues abate.
In real terms, the overseas trade sector is forecast to make a one percentage point contribution to economic growth in 2023–24. The trade sector is then expected to largely return to balance in 2024–25 and make a neutral contribution to growth, as services export growth moderates.
Queensland’s labour market is expected to remain exceptionally strong and tight, with the unemployment rate the lowest it has been in decades, the job vacancy rate near its historic high and the employment-to-population ratio at its highest level since the mining boom.
Following the strongest growth in 17 years, Queensland’s employment growth is expected to ease to 31⁄4 per cent in 2022–23 and one per cent in 2023–24 as growth in domestic demand moderates. The unemployment rate is forecast to edge higher, but stay low by historical standards, to 41⁄4 per cent in 2023–24 and 41⁄2 per cent in 2024–25.
Inflation is forecast to moderate to 33⁄4 per cent in 2023–24 and to 3 per cent in 2024–25.
Queensland’s population growth is forecast to increase to 2 per cent in 2022–23, reflecting a pickup in overseas migration. However, with interstate migration forecast to stabilise at pre-pandemic levels, population growth is forecast to ease back to 11⁄2 per cent by 2024–25.
Risks to the outlook however remain skewed to the downside, with inflation and monetary policy responses among major central banks the biggest risks to the global outlook.
3
Budget Strategy and Outlook 2023-24
| Overview Table 1 | Queensland economic forecasts/projections1 |
| | | | | | | | | | | | | | | | | | | | | | | | |
| | | Actuals | | | Forecasts | | | Projections | |
| | | 2021–22 | | | 2022–23 | | | 2023–24 | | | 2024–25 | | | 2025–26 | | | 2026–27 | |
Gross state product2 | | | 4.4 | | | | 2 | | | | 3 | | | | 3 | | | | 23⁄4 | | | | 23⁄4 | |
Employment | | | 5.1 | | | | 31⁄4 | | | | 1 | | | | 11⁄2 | | | | 13⁄4 | | | | 13⁄4 | |
Unemployment rate3 | | | 4.5 | | | | 33⁄4 | | | | 41⁄4 | | | | 41⁄2 | | | | 41⁄2 | | | | 43⁄4 | |
Inflation4 | | | 5.4 | | | | 71⁄4 | | | | 33⁄4 | | | | 3 | | | | 21⁄2 | | | | 21⁄2 | |
Wage Price Index | | | 2.5 | | | | 33⁄4 | | | | 4 | | | | 31⁄2 | | | | 31⁄2 | | | | 31⁄2 | |
Population | | | 1.6 | | | | 2 | | | | 13⁄4 | | | | 11⁄2 | | | | 11⁄2 | | | | 11⁄2 | |
Notes:
| 1. | Unless otherwise stated, all figures are annual percentage changes. |
| 2. | Chain volume measure (CVM), 2020–21 reference year. |
| 3. | Per cent, year-average. |
| 4. | Brisbane, per cent, year-average. |
Sources: ABS Annual State Accounts, National, State and Territory Population, Labour Force, Wage Price Index, Consumer Price Index, and Queensland Treasury.
Fiscal outlook
Since the 2021–22 Budget, the government has committed to medium-term fiscal goals for the restoration of fiscal buffers impacted by the COVID-19 pandemic. This strategy has prepared Queensland to be able to meet contemporary and upcoming challenges.
Exceptionally high coal prices and the strength of the Queensland economy has resulted in higher than previously expected state revenues in 2022–23.
General Government Sector revenue is estimated to total $87.623 billion in 2022–23, up $13.437 billion (18.1 per cent) compared with 2021–22 and $13.736 billion (18.6 per cent) higher than estimated in the 2022–23 Queensland Budget.
This significant upward revision in expected revenue in 2022–23 is largely driven by the exceptionally high coal prices that have continued to be received by Queensland’s coal producers, as well as the state’s strong labour market performance.
However, the substantial increase in royalties, is only temporary and not expected to be repeated over the forward estimates. As such, revenue is expected to decline sharply in 2023–24, by 6.3 per cent, as the temporary surge in coal and other commodity prices unwinds and continues to normalise.
Beyond 2023–24, revenue is expected to begin to stabilise (growing by less than 0.1 per cent) in 2024–25. Following this period of adjustment, revenue is expected to grow modestly in 2025–26 (by 0.9 per cent) and 2026–27 (by 3.3 per cent).
Given revenues are expected to moderate substantially as commodity prices normalise over the forward estimates, government has carefully planned its budgetary commitments.
4
Budget Strategy and Outlook 2023-24
The 2023–24 Budget achieves the right balance. Effective responses to immediate challenges will relieve cost-of-living pressures, strengthen the health system, and see more investment in social and affordable housing and youth services.
In parallel, government’s careful management of recent extraordinary revenue performance and disciplined control of spending supports positive progress towards fiscal recovery, a lower reliance on borrowings, and creates capacity for additional public infrastructure investment.
The General Government Sector net operating surplus in 2022–23 of $12.305 billion supports a reduction in the 2022–23 borrowing requirement and creates capacity for the transformative capital program while maintaining debt at sustainable levels.
A manageable deficit of $2.182 billion in 2023–24 reflects commitments to priority areas, including temporary funding to relieve cost-of-living pressures.
Going forward, wages growth alongside easing inflation are expected to see cost-of-living pressures ease. As the one-off measures in the 2023–24 Budget fall away and royalty revenue normalises across the forward estimates period, a return to operating surplus is expected.
The government’s expanded program of public infrastructure investment of $88.729 billion over 4 years to 2026–27 will underpin ongoing job creation in existing and emerging sectors and maintain a strong and diverse economy into the future. Key elements include delivering increased health system capacity, decarbonisation of the state’s energy system, improved water security and preparing for the Brisbane 2032 Olympic and Paralympic Games.
Over successive budgets, the government has worked to limit the legacy impacts of the COVID-19 crisis on borrowings and fiscal sustainability.
In 2022–23 net debt will comprise just 7 per cent of revenue. Total General Government Sector borrowings are expected to be $8.745 billion lower at 30 June 2024 than forecast in the 2022–23 Budget and remain $2.158 billion lower by 30 June 2026.
5
Budget Strategy and Outlook 2023-24
| Overview Table 2 | Key fiscal aggregates1 |
| | | | | | | | | | | | | | | | | | | | | | | | | | | | |
| | | 2021–22 | | | 2022–23 | | | 2022–23 | | | 2023–24 | | | 2024–25 | | | 2025–26 | | | 2026–27 | |
| | | Outcome | | | Budget | | | Est. Act. | | | Budget | | | Projection | | | Projection | | | Projection | |
| | | $ million | | | $ million | | | $ million | | | $ million | | | $ million | | | $ million | | | $ million | |
Revenue | | | 74,185 | | | | 73,886 | | | | 87,623 | | | | 82,079 | | | | 82,102 | | | | 82,858 | | | | 85,591 | |
Expenses | | | 69,889 | | | | 74,915 | | | | 75,317 | | | | 84,261 | | | | 81,967 | | | | 82,653 | | | | 85,214 | |
Net operating balance | | | 4,296 | | | | (1,029 | ) | | | 12,305 | | | | (2,182 | ) | | | 135 | | | | 206 | | | | 377 | |
PNFA2 | | | 7,889 | | | | 8,478 | | | | 9,194 | | | | 9,347 | | | | 11,473 | | | | 11,417 | | | | 11,389 | |
Fiscal balance | | | (71 | ) | | | (5,635 | ) | | | 6,786 | | | | (6,716 | ) | | | (7,265 | ) | | | (5,977 | ) | | | (5,301 | ) |
Borrowing3 | | | 56,764 | | | | 66,459 | | | | 54,693 | | | | 65,479 | | | | 76,040 | | | | 85,127 | | | | 94,814 | |
Net debt | | | 10,997 | | | | 19,772 | | | | 5,852 | | | | 16,190 | | | | 28,074 | | | | 37,648 | | | | 46,934 | |
Notes:
| 1. | Numbers may not add due to rounding. |
| 2. | PNFA: Purchases of non-financial assets. |
| 3. | Comprised of borrowing with QTC, leases and similar arrangements and securities and derivatives. |
6
Budget Strategy and Outlook 2023-24
| 1 | Budget priorities and economic strategy |
Features
| • | | Leveraging Queensland’s strong economic performance, the 2023–24 Queensland Budget is responding to the challenges facing Queenslanders, including cost-of-living pressures and housing affordability. The Budget is also investing substantially in healthcare and infrastructure across all regions to position Queensland on a clear path towards longer-term growth and prosperity. |
| • | | The historic surplus in 2022–23, driven by strong royalties growth due to the high coal prices received by the state’s coal producers, is providing capacity to deliver substantial cost-of-living support to Queensland families and businesses, while also funding a significant increase in the capital program to grow the economy. |
| • | | The Budget provides a record $8.224 billion in concessions in 2023–24, an increase of over 21 per cent compared to 2022–23. The Budget is delivering $1.483 billion for additional electricity bill support to households and small businesses facing cost-of-living pressures. |
| • | | This Budget provides $645 million over 4 years from 2023–24 to provide 15 hours per week of free kindergarten from January 2024 for all 4-year-old Queensland children. On average, a family attending a sessional kindy for 15 hours per week that charges $46 per day will save $4,600 a year in fees. This will not only reduce cost-of-living pressures for families but will also support labour market participation and improve educational outcomes. |
| • | | The 2023–24 Queensland Budget is providing increased funding of $1.1 billion for the delivery and supply of social housing across Queensland through the Housing and Homelessness Action Plan (2021–2025), including to meet higher construction costs and to boost the QuickStarts Queensland program target by 500 homes, bringing it to 3,265 social housing commencements by 30 June 2025. |
| • | | This brings the total investment to $5 billion for delivery of social and affordable housing, and housing and homelessness support, including $3 billion funding to support the Housing and Homelessness Action Plan 2021–2025 and $2 billion investment for the Housing Investment Fund. |
| • | | The Budget includes substantial tax concessions for eligible Build to Rent developments that provide affordable dwellings at discounted rents. |
| • | | To drive greater gender equality and deliver a fairer, more inclusive and prosperous society, the Budget allocates a $16.3 million package of targeted measures to support women’s economic security and improve women’s economic outcomes. |
7
Budget Strategy and Outlook 2023-24
| • | | Capacity constraints in recent years, including materials and labour supply shortages, have contributed to higher inflation, increasing the cost of living. Increasing labour force responsiveness, skills and participation, and other actions to enhance the competitiveness and productivity of the state’s businesses, will help reduce these supply side constraints and dampen pressure on prices and cost of living over the medium term. |
| • | | The record capital program of $89 billion over the 4 years to 2026–27 will provide the infrastructure to enhance productivity and the competitiveness of Queensland’s traditional industries, support growth in new and emerging sectors and provide the essential health and other services needed to meet the needs of a growing population. |
| • | | In 2023–24, the government will invest $20.321 billion in capital, directly supporting around 58,000 jobs. $13.308 billion of this capital program will be invested outside of the Greater Brisbane region, supporting around 38,500 jobs. |
| • | | The government is continuing to invest in the growth and development of a healthy and skilled workforce to help drive productivity, boost real incomes and improve standards of living. The Budget includes $25.791 billion in total health funding and $21.104 billion in total education and training funding in 2023–24, as well as significant levels of ongoing expenditure to safeguard and protect communities, improve liveability and enhance Queensland’s lifestyle. |
| • | | This Budget also backs the state’s ongoing decarbonisation agenda through funding of $520 million, over the period 2023–24 to 2029–30, to deliver the Low Emissions Investment Partnerships program, which will encourage the mining industry to fast-track capital investments that will both rapidly reduce its emissions profile and help maintain a competitive edge for the industry. |
| • | | By addressing short-term challenges and laying a strong platform for future growth, the Budget is supporting delivery of the government’s overarching community objectives of good jobs, better services, and great lifestyle, including delivering on the government’s economic strategy to create more jobs in more industries. |
| 1.1 | Building on strong foundations |
The government’s nation-leading response to the COVID-19 pandemic protected and maintained the health and wellbeing of Queenslanders. This set the platform for the state’s remarkable economic recovery, which has seen Queensland continue to record a stronger rate of jobs growth than the rest of the nation since pre-COVID-19, with trend employment up 8.8 per cent (or 226,300 persons) since March 2020, compared with 6.5 per cent growth in the rest of Australia.
Strong employment outcomes have been widespread across the state, with unemployment rates declining across both South East Queensland and regional Queensland (see Chart 1.1).
8
Budget Strategy and Outlook 2023-24
Chart 1.1 – Unemployment rates, South East and Regional Queensland

Source: ABS, Labour Force, Australia, Detailed
The average unemployment rate across regional Queensland fell 1.2 percentage points to 3.9 per cent in the year to April 2023, to be the lowest unemployment rate recorded in regional Queensland since May 2008. Cairns (3.8 per cent), Townsville (2.3 per cent) and Wide Bay (5.6 per cent) all recorded among the lowest unemployment rates in more than a decade in April 2023.
In addition to the strength of Queensland’s domestic economy and contributing to the state’s strong labour market performance, Queensland exporters, in particular the state’s coal producers, have been buoyed by a sustained period of exceptionally high global commodity prices.
Over the 2 years since mid-2021, Queensland coal producers have enjoyed unprecedented benefits from the surge in global coal prices, resulting in the value of Queensland coal exports reaching a calendar year record of $83.5 billion in 2022, more than double the value in 2021 and triple the value in 2020.
Importantly, these record coal export revenues have contributed to the strong financial performance of coal mining companies, with many reporting record revenues and profits in 2022.
This performance highlights the important role that Queensland’s traditional industries, such as mining, agriculture, and tourism, will continue to play alongside new and emerging growth sectors and the ongoing transformation to a low-carbon global economy.
Given the majority of Queensland’s coal exports are metallurgical coal, international demand should continue to support Queensland’s coal exports over coming decades.
As outlined in Queensland Treasury’s report, Queensland’s Coal Industry and Long-Term Global Coal Demand, published in November 2022, Queensland continues to offer an attractive environment for investment in coal, reflecting its numerous competitive advantages.
9
Budget Strategy and Outlook 2023-24
This includes its high-quality hard coking coal, proximity to the fast-growing Asian region, efficient supply chain, well-established infrastructure and skilled workforce.
In the context of unprecedented global coal prices, the new coal royalty tiers announced by the Queensland Government in the 2022–23 Budget mean Queenslanders are getting a fair return for the state’s valuable and limited resources in a period when coal companies are generating extraordinary revenues and profits.
Driven by the strong growth in coal royalties, the historic surplus expected in 2022–23 is helping to create fiscal capacity for the productivity-enhancing infrastructure needed to facilitate Queensland’s economic and energy transformation, including through the government’s record 4-year capital program of $88.729 billion.
By allowing the Budget to accommodate a much higher capital program, while keeping borrowings close to or less than the 2022–23 Budget estimate, the surge in coal royalties will enable the provision of the critical infrastructure needed to drive productivity and competitiveness for businesses and industry across the state.
The increase in coal royalties is also creating fiscal capacity for the government to address the more immediate challenges facing Queenslanders, including delivering substantial cost-of-living support to Queensland families and businesses, especially in 2023–24, in recognition of inflation growing much faster than wages the previous year.
A strong health system supports a healthy and productive population. It supports increased workforce participation and contributes to improvements in labour productivity over the longer term. As Queensland’s strong economic recovery from the COVID-19 pandemic demonstrates, the state’s economic success is dependent upon the health and wellbeing of Queenslanders.
By investing significantly in health services across the state, the government is protecting and enhancing the wellbeing of Queenslanders and strengthening the resilience and liveability of communities throughout the state’s regions.
As Queensland continues to grow and transform, the government is also taking targeted action to help ease current pressures in the state’s housing market, including supporting the supply of additional housing and rental stock. Investments to support the delivery of more social and affordable housing for Queenslanders will improve standards of living across communities and provide lasting benefits for the state’s economy. Access to more affordable housing also supports positive employment outcomes, greater labour mobility and helps attract a skilled workforce and new investment opportunities.
The critical support being provided to Queensland families, communities, and small businesses in the Budget will help ensure all Queenslanders continue to enjoy an enviable lifestyle and improved standards of living.
| 1.2 | Tackling the cost of living |
Cost-of-living pressures are currently being felt right across the country. Queensland’s households, businesses and industry are continuing to face these challenges, including higher interest rates, increasing electricity costs and higher costs of goods and services.
10
Budget Strategy and Outlook 2023-24
| Box 1.1 | Cost-of-living relief for Queenslanders |
The Queensland Government recognises the challenges Queenslanders are currently facing in terms of cost-of-living pressures.
In the 2023–24 Queensland Budget, the government is providing a record $8.224 billion in concessions to Queensland families and businesses, an increase of more than 21 per cent compared with 2022–23.
The government is providing $1.617 billion in 2023–24 in the Budget towards new and expanded cost-of-living measures that will help address these challenges.
Electricity rebates
The 2023–24 Budget delivers $1.483 billion for additional electricity bill support to households and small businesses facing cost-of-living pressures. This is the most significant electricity bill support package announced by any state or territory, more than doubling the size of the federally agreed support package for Queensland under the National Energy Bill Relief Fund.
As part of this package, all Queensland households will automatically receive a $550 Cost of Living Rebate on their electricity bill in 2023–24, while around 600,000 vulnerable households will benefit from a higher $700 Cost of Living Rebate.
In addition, vulnerable households will continue to receive the existing $372 rebate under the Queensland Electricity Rebate Scheme, bringing total support for this group to $1,072 in 2023–24.
The government’s substantial cost-of-living relief package will more than offset typical household electricity bill increases in 2023–24. In some cases, households will have zero bills or be in credit in 2023–24.
Eligible small businesses in Queensland will also receive an automatic rebate of $650 on their electricity bill in 2023–24. This includes around 205,000 Queensland small businesses that consume less than 100,000 kilowatt hours per annum.
Free kindy and FairPlay vouchers
The government will also provide 15 hours per week of free kindergarten from January 2024 for all 4-year-old Queensland children to further relieve cost-of-living pressures, improve access to early childhood education, and support economic participation across the state.
Eligibility for FairPlay vouchers will also be extended to more Queensland families to give more children aged 0-4 access to free swimming lessons.
Other cost-of-living support
The Budget also includes a range of other targeted measures that will reduce costs for Queenslanders.
11
Budget Strategy and Outlook 2023-24
Changes to licence fees will see Queensland’s learner licence fees reduced from $186.55 to $75, while the fee for replacement Queensland driver licences, photo identification cards and industry authority cards will be reduced to $35.
Access to essential health services will be enhanced through increased funding for the Patient Travel Subsidy Scheme, while other measures will provide direct support for the state’s vulnerable families and children, including through the free school breakfast and critical food relief programs.
Details of the key new and expanded cost-of-living measures in 2023–24 are outlined below.
Table 1.1 – Cost-of-living relief measures
| | | | |
Measure | | Description | | 2023–24
($ million) |
| Electricity Bill Support | | Cost of Living Rebates for Queensland households and small businesses and other household energy initiatives. | | 1,483 |
| Free Kindergarten | | 15 hours per week of free kindergarten from January 2024 for all 4-year-old Queensland children. | | 101.62 |
| Patient Travel Subsidy Scheme | | Increased funding to enhance access to essential health services. | | 14.18 |
| FairPlay Vouchers | | Extend availability to eligible children aged 0-4 years for swimming lessons. | | 2.38 |
| Electricity Life Support Scheme | | Expanded eligibility to allow more Queenslanders to access electricity rebates for life support equipment. | | 0.21 |
| School Breakfast Programs | | Extend and expand the programs delivered by non-government organisations across Queensland. | | 1.20 |
| Critical Food Relief | | Funding to help deliver critical food relief to vulnerable families and children. | | 0.32 |
| Reducing Learner Licence Fees | | Reducing Queensland’s learner licence fees from $186.55 to $75. | | 9.38 |
| Replacement Smartcard Product Fee Changes | | Reducing the replacement fees for Queensland driver licences, photo identification cards, and industry authority cards to $35. | | 5.29 |
Total | | 1,617 |
A range of other existing government concessions have also been increased or expanded to help further address cost-of-living pressures for Queenslanders. Refer to Appendix A for further details on the Queensland Government’s $8.224 billion in concessions.
12
Budget Strategy and Outlook 2023-24
In addition to providing immediate cost-of-living relief, the Queensland Government is focused on supporting economic growth through enablers and settings that will improve Queensland’s productivity and deliver sustained increases in real wages.
This will ease cost-of-living pressures over the longer term and support improved standards of living for all Queenslanders.
| Box 1.2 | More affordable housing |
Like many places in Australia and overseas, Queensland’s housing system is experiencing significant pressures.
Reflecting its desirability as a great place to live, historically high levels of net interstate migration over 2021–22, followed by a recovery in net overseas migration over 2022–23, have both contributed to strong population growth in Queensland.
Other factors that have impacted Queensland’s property market include: materials and skills shortages in the construction industry; long-term demographic trends such as the move towards smaller household sizes; working from home increasing demand for more space in different locations; and the impact of the 2022 Queensland floods.
In particular, material and labour supply shortages, weather disruptions, and several construction company insolvencies have constrained Queensland’s residential construction activity, slowing the supply of new dwelling stock.
Average household size has also been declining due to both short- and long-term factors. Small changes in household size have large impacts — for each 0.01 fall in persons per household, around 8,500 additional dwellings are required.
Broader housing market conditions have tended to have the most significant impacts on the rental market. During the pandemic, the rental stock in Queensland declined significantly, partly due to the sale of properties to owner-occupiers. This drove rental vacancy rates to record lows and sharp rent increases across many Queensland regions, with a similar phenomenon apparent nationally.
The combined effect of these factors is that housing supply has not kept up with increased demand. In recognising these challenges, on 20 October 2022, the government held the Queensland Housing Summit to address the state’s housing challenges and enhance supply, lift the responsiveness of the housing market and protect those who are most vulnerable.
The Queensland Government has a clear objective: that every Queenslander should have access to a safe, secure, and affordable home that meets their needs and enables participation in the social and economic life of this prosperous state.
13
Budget Strategy and Outlook 2023-24
To meet this objective, the government is implementing the Queensland Housing Strategy 2017–2027, delivered through the Housing and Homelessness Action Plan 2021–2025 and Aboriginal and Torres Strait Islander Housing Action Plan 2019–2023. The government has also boosted the Queensland Government’s flagship Housing Investment Fund (HIF) to $2 billion, first announced under the Action Plan, with $130 million now available per annum to support an increased target of 5,600 new social and affordable housing commencements by 30 June 2027. In 2023, the first HIF supported tenancies became active, with further units currently under construction.
The government also continues to commit significant additional investment towards social and affordable housing projects, crisis accommodation and supports, as well as services to address homelessness.
The 2023–24 Queensland Budget is providing increased funding of $1.1 billion for the delivery and supply of social housing across Queensland through the Housing and Homelessness Action Plan (2021–2025), including to meet higher construction costs and to boost the QuickStarts Queensland program target by 500 homes, bringing it to 3,265 social housing commencements by 30 June 2025.
Further to this, over $250 million has been committed to housing and homelessness support services since the 2022–23 Budget. This includes over $100 million provided throughout the last 12 months, as well as an additional $150 million committed in the Budget.
Key initiatives supported in the Budget include $51.3 million for the second Aboriginal and Torres Strait Islander Housing and Homelessness Action Plan, $61.9 million (out of a total $64.3 million) for emergency supported accommodation, and $18.1 million to enhance and expand youth housing and homelessness services.
The government is also offering tax concessions for eligible Build to Rent developments that provide at least 10 per cent of dwellings at discounted rents, thereby supporting the construction of additional rental housing and delivering more affordable housing for more Queenslanders.
Planning changes were also announced to support housing supply and delivery, including amending planning rules to allow secondary dwellings, such as granny flats, to be rented on the open market, while increases in rents have been limited to only once a year.
Further investment is being made to unlock land for housing through delivery of essential infrastructure within areas experiencing significant growth through initiatives such as the $171.2 million Catalyst Infrastructure Fund and the $50 million Growth Acceleration Fund.
14
Budget Strategy and Outlook 2023-24
| 1.3 | Investing in Queensland’s future to create more jobs in more industries |
While the 2023–24 Queensland Budget is providing significant targeted support to address immediate cost-of-living challenges, it simultaneously maintains a strong focus on investing to facilitate future economic growth and longer-term prosperity across the state.
| 1.3.1 | Securing Queensland’s path to a prosperous future |
The Queensland economy is continuing to transform in response to global trends and in the context of an uncertain global economic and socio-political outlook.
Against this backdrop, the government’s economic strategy is focused on growing a sustainable and diversified economy that is resilient, productive, competitive and able to respond to future opportunities and challenges.
The economic strategy will create more jobs by leveraging Queensland’s strengths and growing its traditional and emerging industries, expanding supply chains and seizing opportunities in the lead up to the Brisbane 2032 Olympic and Paralympic Games and beyond.
Key enablers to capitalise on these opportunities and drive future growth include: a larger, more skilled workforce; targeted infrastructure investment; a competitive investment environment; expanded trade networks; increased innovation and digitalisation; and strong Environmental, Social and Governance (ESG) credentials.
15
Budget Strategy and Outlook 2023-24
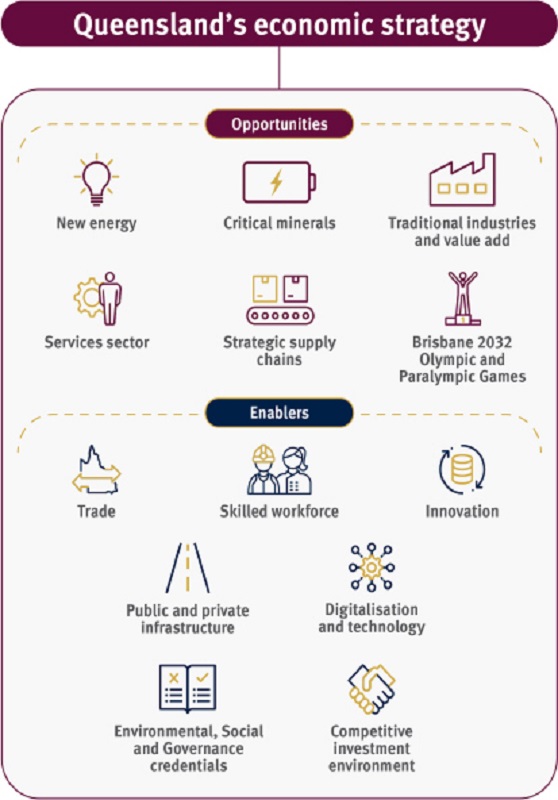
16
Budget Strategy and Outlook 2023-24
| 1.3.2 | The Big Build – infrastructure for a growing state |
As Queensland continues to grow and diversify, continued investment in the right infrastructure is vital to ensure the resilience and prosperity of the state and to support productivity growth and standards of living.
The record $88.729 billion capital program to be delivered across the state over the next 4 years will help provide the critical economic and social infrastructure to futureproof Queensland’s cities and regions. This infrastructure will better connect communities across the state and strengthen their resilience in the face of future global challenges and natural disasters. It will support job creation and attract people, skills and private investment to the regions and improve overall liveability.
This includes $20.321 billion in 2023–24, directly supporting around 58,000 jobs during construction, including 38,500 jobs outside Greater Brisbane. Many more jobs will be supported by the economic activity and connectivity generated by this investment, particularly across regional Queensland.
The government is taking a long view with its significant program of public infrastructure investment that will deliver better health and transport facilities and services, decarbonise the state’s energy system, improve water security, and prepare for the Brisbane 2032 Olympic and Paralympic Games.
To ensure Queenslanders have access to world-class health services, the government is investing $9.785 billion over 6 years to build new or expand existing hospitals across the state, as part of the Health and Hospitals Plan, including in Cairns, Townsville, Mackay, Bundaberg, Hervey Bay, Toowoomba and South East Queensland. The 2023–24 Queensland Budget provides further investment in health infrastructure, including $150 million over 4 years to fund a new mental health facility at Redland Hospital.
The Budget is also keeping Queenslanders connected through a $6.9 billion investment in 2023–24 to provide integrated, safe and efficient transport infrastructure. Investments include the ongoing Bruce Highway Upgrade Program, the Queensland Train Manufacturing Program and Gold Coast Light Rail (Stage 3).
The Budget is also delivering new and ongoing projects that will support the long-term transformation of the Queensland economy. This includes delivering critical infrastructure to facilitate the development of emerging industries, while continuing to support the traditional sectors that will remain an important source of income and economic growth well into the future.
To drive Queensland’s competitiveness in the decades ahead, the Queensland Energy and Jobs Plan (QEJP) will provide clean, reliable and affordable power for generations. Queensland’s publicly owned energy businesses are leading the state’s energy transformation, investing in new wind, solar, storage and transmission infrastructure to deliver the QEJP and achieve renewable energy targets of 50 per cent renewables by 2030, 70 per cent by 2032 and 80 per cent by 2035.
The 2023–24 Budget includes a landmark capital investment of around $19 billion over the forward estimates to deliver on the QEJP. This includes up to 7 GW of large-scale, long duration pumped hydro, CopperString 2032 to connect the North West Minerals Province to the national electricity grid, and a strong pipeline of renewable energy and storage projects.
17
Budget Strategy and Outlook 2023-24
The Queensland resources industry, a traditional driver of investment, economic growth and jobs across the state, is also undergoing transformation. The Queensland Resources Industry Development Plan, with committed funding of $68.5 million over 5 years, sets out a 30-year vision to help guide the ongoing transformation and diversification of the state’s resources industry.
The Budget is providing additional funding of $21 million over 2 years to implement the Frontier Gas Exploration grants program to help unlock significant gas resources in the Bowen and Galilee basins.
With its abundance of valuable natural resources, Queensland is well placed to sustainably mine, process, manufacture and supply the critical minerals required around the world to achieve global emissions reduction targets.
Reflecting this, the government’s $5 billion investment in CopperString 2032, a 1,100 kilometre transmission line from Townsville to Mount Isa, will provide energy certainty to the North West Minerals Province and deliver reliable, affordable and renewable power to the people, businesses and communities in the region.
Acknowledging the ongoing importance of the state’s mining industry as a driver of future growth opportunities, the Budget also allocates $520 million over the period 2023–24 to 2029–30 for investments through the Low Emissions Investment Partnerships program. The program will encourage the mining industry to fast-track capital investments that will both rapidly reduce its emissions profile and help maintain a competitive edge for the industry.
A significant capital program is planned by the Public Non-financial Corporations water sector over the 4 years to 2026–27, focused on delivering additional water supply and fortifying the flood resilience of water infrastructure. A major driver of this is Seqwater, Sunwater and Gladstone Area Water Board’s respective Dam Improvement Programs, which aim to ensure the safety and reliability of state-owned dams so they continue to operate safely during extreme weather events.
| 1.3.3 | Building a skilled workforce |
Queensland’s ability to transition to a low carbon and more diversified economy will be underpinned by the resilience, dynamism and responsiveness of the state’s labour force. Investing in skills is a key driver for addressing current capacity constraints in the labour market, while also realising sustained improvements in productivity growth in the longer term. In turn, this supports the increased resilience and competitiveness of the state’s businesses and industries.
The Good People. Good jobs: Queensland Workforce Strategy 2022–2032 will deliver practical and innovative solutions that will ensure the state has an agile workforce ready to support growth, strengthen local communities and capitalise on economic opportunities. The government’s significant investment in skills and training (more than $1.2 billion in skills and training initiatives in 2023–24) is supporting broader workforce development, while also helping Queenslanders overcome barriers to employment.
18
Budget Strategy and Outlook 2023-24
Further, reflecting the government’s commitment to improving women’s economic outcomes, the 2023–24 Queensland Budget allocates $16.3 million over 4 years for a package of measures to support women’s economic security. These include targeted grants programs and tailored support, training and mentoring services to support women’s participation in male-dominated industries, enhance retention of female apprentices in trades and support women in business and innovation and disadvantaged and vulnerable women.
Productivity is essential to secure a sustained improvement in the living standards of all Queenslanders. Over the last 3 decades, labour productivity growth has been responsible for around 80 per cent of per capita income growth in Queensland.
Productivity growth can also play a key role in addressing cost-of-living challenges, including by: raising economic capacity and reducing prices; enhancing housing supply and reducing pressure on building costs and housing affordability; and helping make Queensland’s industries more competitive, thereby supporting the ongoing transition of the economy.
The Queensland Government continues to make substantial investments to develop a more highly-skilled and dynamic workforce and provide the critical infrastructure to drive productivity growth, ultimately delivering higher real incomes and prosperity for Queenslanders.
A healthy, productive and agile workforce is essential to capitalise on global opportunities, attract high-class industries and businesses, and attract global investment into industries that leverage the state’s valuable natural endowments like critical minerals, energy, agriculture and tourism.
The government continues to deliver high quality training and employment pathways, and provide ongoing investment in Queensland’s flagship employment programs, such as Skilling Queenslanders for Work and Back to Work.
Since 2015, Skilling Queenslanders for Work has provided training to 76,000 persons, which has helped 49,000 persons secure a job, while Back to Work has helped 28,000 unemployed job seekers gain full-time employment since 2016.
The government is also providing more than $70 million for new initiatives included in the 2022–2025 Action Plan as part of the Good People. Good Jobs: Queensland Workforce Strategy 2022–2032 to further grow the skilled workforce to meet industry needs.
The 2023–24 Queensland Budget invests a record $88.729 billion over 4 years through the state’s capital program, to enable the state’s ongoing energy transformation, improve connectivity and help workers participate in a growing economy.
The government’s strong focus on productivity, including through regulatory reform and reducing costs for business, will be critical in enhancing the competitiveness of Queensland industries as they compete on the global stage. This will enable Queensland workers to access more employment opportunities and achieve higher incomes, and also ensure Queensland businesses can continue to grow, invest, innovate and export.
19
Budget Strategy and Outlook 2023-24
| 1.3.4 | Facilitating a competitive investment and trade environment |
As the Queensland economy continues to grow and diversify, the state’s traditional industries, including mining, agriculture and tourism, will continue driving ongoing economic activity and support future job opportunities across the state.
It is therefore critical that these traditional industries are positioned to remain domestically and globally competitive into the future.
In May 2023, the Queensland Government published the Queensland New-Industry Development Strategy which enhances the focus on renewable energy manufacturing and infrastructure development, critical mineral processing, manufacturing and product development, battery industry development, green hydrogen, the circular economy and the bioeconomy. These industry sectors are expected to play increasingly significant roles in the Queensland economy in the decades ahead.
Facilitating increased levels of activity across the economy, particularly in trade-exposed industries, including attracting new businesses and industries to Queensland, relies on a dynamic investment environment that is domestically and globally competitive.
The government is committed to removing barriers to investment and growth, and working with industries and businesses to unlock opportunities for the state’s workforce, enhance trade opportunities and networks and drive sustainable economic growth.
To achieve these outcomes, the Queensland Government has established specific industry attraction and investment programs, such as the $520 million Invested in Queensland program, which is part of the flagship $5.84 billion Queensland Jobs Fund, the $100 million Queensland Critical Minerals and Battery Technology Fund and the $200 million Attracting Aviation Investment Fund. The Queensland Government is partnering with industry and the private sector to ensure the state’s traditional industries remain globally competitive while helping grow the emerging industries that will play a critical role in the state’s economy in the future.
To further support businesses and industries right across the state, Queensland also continues to deliver a highly-competitive tax regime to support business and help attract investment into the economy. Reflecting this, the government is extending the one per cent payroll tax rate discount for regional employers to 30 June 2030 and has extended the 50 per cent payroll tax rebate for apprentices and trainees for a further 12 months until 30 June 2024.
The ability to continually innovate is important to drive sustained improvements in productivity and competitiveness through the creation and diffusion of ideas, technologies and practices. The government’s innovation agenda has been underpinned by its flagship Advance Queensland initiative, which has helped leverage over $1 billion from industry partners and supported more than 28,000 good jobs across the state, including over 11,200 in the regions.
Building off that success, the government last year released the $142 million Advance Queensland – Innovation for a Future Economy 2022–2032 Roadmap, which sets out the direction, priorities and initiatives to establish Queensland as a world-class innovation economy.
This year, the government also released the Our Thriving Digital Future: Queensland’s Digital Economy Strategy, which includes investment of $200 million over the next 3 years to grow the state’s digital economy and improve digital connectivity throughout Queensland.
20
Budget Strategy and Outlook 2023-24
As an open and diversified economy, Queensland relies on international trade as a driver of economic activity. In 2021–22, overseas exports were valued at $130 billion, accounting for 29 per cent of nominal GSP, while about 1 in 5 jobs is supported directly or indirectly by exports.
The record level of exports was driven by a $47 billion increase in the value of coal exports (due to high prices), worth $72 billion in 2021–22. The vast majority of Queensland’s coal exports are metallurgical coal, primarily used for making steel.
Other resources exports experienced strong growth due to high prices in 2021–22, with LNG exports doubling to just under $20 billion and metals exports rising $1 billion to $12 billion. Queensland also has a large agricultural export industry, worth $14 billion in 2021–22. Key agricultural exports include beef, sugar, cotton, wheat and grain sorghum.
The $150 million Queensland Trade and Investment Strategy 2022–2032 is positioning the state to help trade-orientated businesses adapt, thrive and grow, including targeted actions and initiatives to leverage international opportunities, drive diversity and value, create more jobs across traditional and priority industries, and champion enduring worldwide success.
The government has also released the Queensland International Education and Training Strategy 2022–2027, a 5-year, $20.6 million strategy to support growth in education and training exports.
The Queensland Government also recognises that establishing and maintaining strong ESG credentials is central to achieving sustainable development outcomes and driving future competitiveness for businesses and industries throughout the Queensland economy. The government’s sustainability agenda, including key risks and the government’s sustainability priorities, is outlined in detail in Box 3.2 in Chapter 3.
| 1.4 | Delivering better services |
The government’s significant ongoing investment in essential services, including health, education, justice, safety and social services, lies at the forefront of driving enduring social and economic outcomes. These services directly support improved living standards, participation in the economy, and increase the prosperity and wellbeing of all Queenslanders.
The 2023–24 Queensland Budget continues to leverage off the significant investments and commitments made to date to deliver better services to the people of Queensland in line with the government’s community objectives.
Providing access to first-class healthcare is critical to ensure the overall wellbeing and prosperity of Queenslanders is maintained, both now and into future, including in the face of a growing, ageing and increasingly diverse population. The 2022–23 Budget injected $1.645 billion over 5 years into mental health services. As well as improving the quality of life of Queenslanders, this will support increased participation in the economy and the community.
The 2023–24 Queensland Budget includes a Queensland Health total operating budget of $24.153 billion, including an uplift of $2.888 billion in additional operational growth funding over 5 years from 2022–23 to meet demand and cost pressures. This uplift will also support significant actions across the health system targeting improving ambulance responsiveness and reduce ramping, addressing pressures on emergency departments, reducing wait times for surgery and specialist clinics, as well as boosting women’s health care and mental health care.
21
Budget Strategy and Outlook 2023-24
Access to a quality education and training is the cornerstone of ensuring Queenslanders are equipped with the future knowledge and skills they need to meaningfully engage and participate in the state’s economy as it continues to grow and diversify. Reflecting this, the government continues to invest in the provision of inclusive and high-quality education and training services and facilities across Queensland, with total funding of $21.104 billion for education and training in 2023–24.
The Queensland Government is also committed to supporting vulnerable Queenslanders and ensuring the state’s communities are kept safe. Significant ongoing expenditure across key services such as police, justice (including youth), child safety, and social services, remain at the forefront of maintaining safe and secure communities.
22
Budget Strategy and Outlook 2023-24
| 2 | Economic performance and outlook |
Features
| • | | Following strong growth of 4.4 per cent in 2021–22, the Queensland economy is forecast to grow by 2 per cent in 2022–23, with growth then strengthening to 3 per cent in 2023–24. |
| • | | After a strong rebound across 2021 and 2022, the global economy faces increased uncertainty and volatility, with risks to the outlook skewed to the downside. |
| • | | The International Monetary Fund (IMF) has downgraded its global growth outlook for 2023, reflecting the sharp interest rate rises required to curb inflation, deterioration in financial conditions, the impacts of the Russia-Ukraine conflict and rising geopolitical tensions. |
| • | | Similar to the global economy, national economic growth is expected to slow in coming years, weighed down by slowing growth in consumption, public spending and exports according to the Reserve Bank of Australia (RBA). The RBA expects national GDP growth to slow from 3.7 per cent in 2022 to 13⁄4 per cent in 2023 and 11⁄2 per cent in 2024. |
| • | | In Queensland, household consumption remains elevated and will contribute solidly to GSP growth in 2022–23, but as significant increases in borrowing costs continue to filter through to household budgets, spending growth is expected to slow materially in 2023–24. |
| • | | High rates of capacity utilisation and a solid pipeline of non-dwelling construction projects are expected to see overall business investment in Queensland rise further. |
| • | | In the dwelling sector, capacity constraints continue to limit output growth in the near term, but the historically high pipeline of committed residential construction work and easing supply constraints should support a boost in dwelling investment in 2023–24. |
| • | | Largely reflecting the more subdued growth in household spending, growth in Queensland’s domestic economy is expected to ease slightly from 23⁄4 per cent in 2022–23 to 21⁄2 per cent in 2023–24, before strengthening to growth of 31⁄4 per cent in 2024–25. |
| • | | Overseas exports of goods and services are forecast to grow by 31⁄2 per cent in 2022–23, driven by an ongoing rebound in tourism and education services exports. After detracting from GSP growth in 2022–23, an unwinding of supply constraints on goods exports and a slowing of goods imports is forecast to result in a one percentage point contribution to growth from the trade sector in 2023–24. |
| • | | With Queensland’s state final demand outperforming the rest of Australia during the pandemic, demand for labour has been exceptionally strong. |
| • | | Queensland continues to record a stronger rate of jobs growth than the rest of the nation since pre-COVID-19, with trend employment up 8.8 per cent (or 226,300 persons) since March 2020, compared with 6.5 per cent growth in the rest of Australia. |
| • | | Queensland’s employment growth reached 5.1 per cent in 2021–22 (equating to an extra 130,000 jobs in the year), the strongest annual growth since 2004–05. The unemployment rate fell to just 4.5 per cent in 2021–22 and measures of underemployment were also low. |
| • | | Employment growth is expected to ease to 31⁄4 per cent in 2022–23 but the labour market remains extremely tight, with the unemployment rate forecast to fall to 33⁄4 per cent. |
23
Budget Strategy and Outlook 2023-24
| • | | Consistent with the growth profile of state final demand, employment growth is expected to moderate to one per cent in 2023–24 and 11⁄2 per cent in 2024–25. Similarly, the unemployment rate is forecast to edge slightly higher, but remain low by historical standards, to 41⁄4 per cent in 2023–24 and 41⁄2 per cent in 2024–25. |
| • | | There is growing evidence that inflation in Brisbane has peaked, having slowed from 7.9 per cent in September quarter 2022 to 7.4 per cent in March quarter 2023. Inflation is forecast to moderate to 33⁄4 per cent in 2023–24 and 3 per cent in 2024–25. |
| • | | Queensland population growth is expected to strengthen to 2 per cent in 2022–23, due mainly to a rebound in overseas migration, before easing to 13⁄4 per cent in 2023–24 and 11⁄2 per cent in 2024–25. |
| 2.1 | International conditions |
The global economic outlook continues to be characterised by increased uncertainty and volatility. Developments over recent years have seen global financial markets being increasingly sensitive to both positive and negative news, which has seen sharp swings in the outlook for interest rates, amidst a period of global inflation and monetary policy tightening.
These developments have included:
| | • | | across 2021 and much of 2022, the easing of COVID-19 restrictions, strong consumer demand and restricted global supply chains helped drive a surge in inflation. This was exacerbated by the Russian invasion of Ukraine and its impacts on global energy prices and trade flows, as well as COVID-19-related lockdowns in China, which led to sharper interest rate rises and a weaker global outlook |
| | • | | in late 2022, China unexpectedly unwound a range of its “Zero-COVID-19” restrictions which subsequently led to an upgrade to its growth forecasts from the IMF in January |
| | • | | in early 2023, increased trade-related dialogue indicated a stabilisation in trade relations between Australia and China |
| | • | | inflation in many advanced nations (including Australia) has proven more difficult to tame than previously expected. While goods inflation has eased as supply chains have recovered, second-round impacts have seen services inflation prove “sticky” |
| | • | | some high profile banking failures in the United States and Switzerland has increased uncertainty around the outlook for rates, financial stability and growth. |
Reflecting these factors, in its April 2023 World Economic Outlook (WEO), the IMF downgraded its forecasts for global growth in both 2023 and 2024 from forecasts made in the January 2023 WEO Update, noting ‘the anaemic outlook reflects the tight policy stances needed to bring down inflation, the fallout from the recent deterioration in financial conditions, the ongoing war in Ukraine, and growing geoeconomic fragmentation.’
Beyond 2024, the IMF projects the global economy to grow by slightly above 3 per cent per annum through to 2028, ‘the lowest medium-term forecast in decades.’
24
Budget Strategy and Outlook 2023-24
The IMF also noted ‘risks to the outlook are heavily skewed to the downside, with the chances of a hard landing having risen sharply’.
Similar to the IMF, the May 2023 issue of Consensus Forecasts points to a cyclical downturn among major economies in 2023 and 2024. Nevertheless, compared to the more pessimistic outlook portrayed by Consensus Forecasts back in late 2022, when the 2022–23 Budget Update was prepared, latest forecasts suggest that the severity of the global downturn is now less than previously expected.
| Table 2.1 | GDP Growth Forecasts1 |
| | | | | | | | | | | | | | | | | | | | | | | | |
| | | 2022 | | | 2023 | | | 2024 | | | 2025 | |
Publication | | Dec-22 | | | May-23 | | | Dec-22 | | | May-23 | | | May-23 | | | Apr-233 | |
United States | | | 1.9 | | | | 2.1 | | | | 0.2 | | | | 1.1 | | | | 0.6 | | | | 2.2 | |
Euro Area | | | 3.2 | | | | 3.5 | | | | -0.1 | | | | 0.7 | | | | 0.9 | | | | 1.5 | |
United Kingdom | | | 4.4 | | | | 4.1 | | | | -1.0 | | | | -0.1 | | | | 0.8 | | | | 1.5 | |
China | | | 3.1 | | | | 3.0 | | | | 4.5 | | | | 5.8 | | | | 4.9 | | | | 4.6 | |
India2 | | | 7.0 | | | | 6.9 | | | | 5.7 | | | | 5.8 | | | | 6.3 | | | | 6.4 | |
Japan | | | 1.5 | | | | 1.0 | | | | 1.3 | | | | 1.0 | | | | 1.1 | | | | 1.0 | |
Korea | | | 2.6 | | | | 2.6 | | | | 1.3 | | | | 1.1 | | | | 2.1 | | | | 2.3 | |
MTP4 | | | 3.7 | | | | 3.6 | | | | 3.1 | | | | 3.4 | | | | 3.6 | | | | 3.6 | |
Notes:
| 1. | Annual percentage change. |
| 2. | India Fiscal Year (April to March). |
| 3. | Latest available long-term forecasts. |
| 4. | MTP: Major Trading Partners weighted by nominal merchandise export shares. |
Source: Consensus Economics.
This anticipation of a cyclical global economic downturn has been brought on by aggressive monetary tightening by many major central banks (Chart 2.1) in response to high inflation.
25
Budget Strategy and Outlook 2023-24
| Chart 2.1 | Key central bank interest rates |
Note:
| 1. | Main refinancing operations. |
Sources: US Federal Reserve (US Fed), European Central Bank (ECB), Bank of England (BOE), Bank of Japan (BOJ) and Reserve Bank of Australia (RBA).
The success in taming inflation has so far been mixed. While headline inflation in the US has fallen from a peak of 9.1 per cent in June 2022 to 4.9 per cent in April 2023, inflation in the Euro area and the UK remains significantly higher.
Meanwhile, inflation pressure in Asia has been less severe than in the US or Europe, with inflation in both Japan and Korea moderating to around 3.5 per cent.
The causes of persistent inflation globally appear to have shifted from high energy costs and supply disruptions to broader flow on effects across the wider economy, including impacts on the cost of services.
Despite the announcement of oil production cuts by OPEC+ in early April 2023, the Brent oil price has fallen back below US$80/bbl and is well below the US$104/bbl average price recorded in 2022. The liquified natural gas price in the spot market in Asia has also dropped from the recent peak of US$38/MMBtu in mid-December 2022 to below US$10/MMBtu by early June 2023.
Meanwhile, the New York Federal Reserve’s Global Supply Chain Pressure Index has fallen below average since February 2023, indicating that global supply chain conditions have largely normalised.
However, the president of the ECB has pointed out in a recent speech that Europe may be entering a period of ‘lasting instability resulting in lower growth, higher costs and more uncertain trade partnerships’.
26
Budget Strategy and Outlook 2023-24
Consistent with the expectations of a cyclical downturn, both coking coal and iron ore prices have fallen from their respective peaks in recent months (Chart 2.2).
The premium hard coking coal price fell from its recent peak of around US$400/t in February 2023 to around US$230/t by early June 2023, while iron ore prices have also declined, from around US$135/t to less than US$110/t.
| Chart 2.2 | Iron ore, Coking Coal and Steel Prices |
Notes:
| 1. | 62% Iron, Australia CIF China. |
| 2. | Premium Low Vol Hard Coking Coal, FOB Australia. |
Sources: S&P Global Commodity Insights and Refinitiv.
The Australian economy grew by 3.7 per cent in 2022, following a 5.2 per cent rebound in 2021 as the nation recovered from the COVID-19 induced economic downturn.
However, similar to the global economy, national economic growth is expected to slow in coming years, with the RBA forecasting growth of 13⁄4 per cent in 2023 and 11⁄2 per cent in 2024, weighed down by slowing growth in consumption, public spending and exports.
27
Budget Strategy and Outlook 2023-24
The latest forecasts from Commonwealth Treasury in the 2023–24 Federal Budget show a broadly similar profile for economic activity, with growth slowing in 2023–24 before strengthening from 2024–25. However, Commonwealth Treasury indicated there are substantial downside risks to the national outlook, including further tightening in global monetary policy and financial conditions, ongoing impacts of the war in Ukraine and inflation being more entrenched than currently expected.
Nominal household spending remains well above the pre-COVID-19 trend, although growth slowed in recent quarters as household budgets, in particular discretionary spending, have come under increasing pressure.
The national household saving ratio has fallen from 17.6 per cent in the second half of 2020 to 3.7 per cent by March quarter 2023, with many households likely drawing on savings to maintain spending. Further, net household wealth has fallen in each quarter since the monetary policy tightening cycle began in May 2022 as the value of housing assets declined.
As substantial increases in borrowing costs continue to filter through to households, disposable incomes will tighten further with higher interest payments likely to constrain household spending during the remainder of 2023 and into 2024.
Strong labour demand has so far supported consumption and incomes, with compensation of employees rising 8.3 per cent in 2022 and annual growth accelerating further to 10.8 per cent in March quarter 2023. However, the pool of available potential workers has reduced, with the national unemployment rate having fallen to around 3.5 per cent, well below the rates that prevailed in the years preceding the pandemic and close to the lowest on record.
As a result, annual wages growth has finally accelerated, to 3.7 per cent in March quarter 2023, having averaged just 2 per cent per annum between 2015 and 2021. The RBA expect the unemployment rate to rise, but to a still-low 41⁄2 per cent by mid-2025, and wages growth to accelerate to a peak of 4 per cent by December quarter 2023.
Business surveys continue to show elevated business conditions and ongoing signs of capacity constraints. Machinery and equipment investment has risen strongly to meet demand but non-dwelling and engineering construction spending, which tend to be larger projects with longer timeframes, has been more modest.
Labour shortages have continued to impact new dwelling investment nationally, causing project delays and extended completion times, while renovation activity continues to trend lower from record levels in 2021 as HomeBuilder projects reached completion. However, a large pipeline of work will support dwelling investment in the near-term, beyond which leading indicators of housing demand suggest a softer outlook.
Inflation is widely forecast to have peaked in 2022, with consumer price growth easing from a 3-decade high of 7.8 per cent in December quarter 2022 to 7.0 per cent in March quarter 2023. Further, the monthly CPI Indicator has moderated at a faster than expected pace, from 8.4 per cent in December 2022 to 6.8 per cent in April 2023.
However, services price inflation has picked up in recent quarters and is expected to limit the disinflationary impact of goods prices in coming quarters. The RBA still forecasts inflation to gradually move lower and fall within the RBA’s 2 to 3 per cent target by 2025.
28
Budget Strategy and Outlook 2023-24
After raising the cash rate by 4 percentage points between May 2022 and June 2023, most market economists, as well as financial market pricing, suggest the official cash rate is close to the peak for this cycle.
The ultimate impact of higher interest rates and inflation on consumer spending remains a key uncertainty to the national economic outlook.
Key assumptions underpinning the economic forecasts for Queensland include:
| • | | broadly in line with market expectations, the RBA cash rate to peak in mid-2023, with a gradual easing of monetary policy expected over 2024 |
| • | | the A$ exchange rate to move toward its assumed medium-term anchor of around US$0.75 |
| • | | Brent oil prices to gradually ease towards a medium-term level of US$75/bbl |
| • | | residential property prices in Brisbane appear to have stabilised in early-2023 after a period of decline. Modest price growth is expected to resume thereafter |
| • | | according to the Bureau of Meteorology (BOM), the La Niña weather pattern, which resulted in substantial rainfall across eastern Australia, has ended. Forecasts have been produced on the assumption of a return to average seasonal rainfall for the remainder of the 2023 and 2024 seasons. However, there is a risk of drier conditions evolving, with the latest modelling from the BOM, released on 6 June 2023, indicating an “El Niño Alert” had been activated, ‘indicating a 70% chance of El Niño forming this year. This equates to roughly three times the normal chance of an El Niño forming’. |
| 2.4 | Queensland conditions and outlook |
Following strong growth of 4.4 per cent in 2021–22, the Queensland economy is forecast to grow by a further 2 per cent in 2022–23, with growth then strengthening to 3 per cent in 2023–24 (Chart 2.3). This growth profile largely reflects the impacts of domestic and international supply constraints and their subsequent unwinding across 2023 and 2024.
Household spending growth in Queensland has softened from the highs recorded in mid-2022 as consumers began to reassess their discretionary spending in the context of higher interest rates and other cost-of-living pressures. Even so, consumption remains considerably higher than the pre-COVID-19 trend, supported by population and employment growth recorded following the initial COVID-19 crisis, as well as the substantial savings accumulated during the pandemic.
As significant increases in borrowing costs continue to flow through to households, disposable incomes will tighten further and substantially slow spending growth to 3 per cent in 2022–23 and 11⁄4 per cent in 2023–24. Expected future cuts to interest rates and introduction of the Stage 3 income tax cuts by the Australian Government should provide some support to consumption from 2024–25 onwards.
29
Budget Strategy and Outlook 2023-24
Strong business conditions have been supported by elevated household spending and strong economic activity more broadly. While businesses are concerned about a potential economic slowdown, the high rates of capacity utilisation and a solid pipeline of non-dwelling construction projects should see overall business investment rise further.
In the dwellings sector, capacity constraints continue to limit output growth and industry completion times have drawn out. Renovation activity has fallen from the HomeBuilder peak in 2021, while declining house prices and rising construction costs have further contributed to a fall in dwelling approvals.
| Chart 2.3 | Economic growth, Queensland1 |
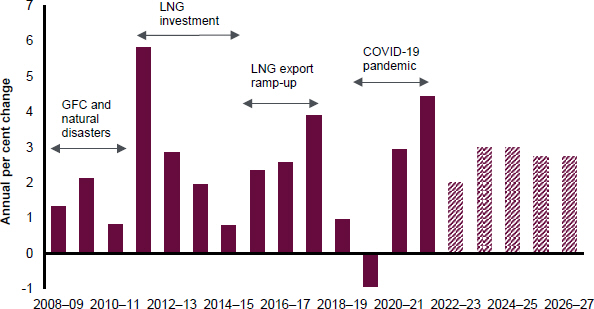
Note:
| 1. | Gross State Product, Chain volume measure (CVM), 2020–21 reference year. |
Sources: ABS Annual State Accounts and Queensland Treasury.
Following 2 years of strong growth, dwelling investment in Queensland is expected to fall 5 per cent in 2022–23, primarily because of supply side constraints, with a substantial pipeline of work yet to be done.
The solid pipeline of committed residential construction work and easing supply constraints should support a boost in dwelling investment in 2023–24, forecast to rise by 51⁄2 per cent. However, the growth of new dwelling investment coming into the pipeline is subdued amid the impacts of higher interest rates and elevated construction costs. This suggests a potential softening beyond completion of the current committed pipeline of residential construction work.
Commodity prices and nominal export values have moderated from their peaks and are expected to normalise from still-high levels as domestic and international supply issues abate.
Both exports and imports of services are forecast to increase towards pre-COVID-19 trends over the forecast horizon as global travel and related activity continues to normalise.
30
Budget Strategy and Outlook 2023-24
Overseas exports of goods and services are forecast to grow 31⁄2 per cent in 2022–23, driven by an ongoing rebound in tourism and education services exports. An unwinding of supply constraints on goods exports and slowing goods imports is forecast to result in a one percentage point contribution from the trade sector in 2023–24, before the trade sector largely returns to balance, with a neutral contribution to growth, in 2024–25 as services export growth moderates.
With Queensland’s state final demand outperforming the rest of Australia during the pandemic, demand for labour has been exceptionally strong. Queensland’s employment growth reached 5.1 per cent in 2021–22 (equating to an additional 130,000 jobs across the state), the strongest annual gain since 2004–05. The year-average unemployment rate fell to just 4.5 per cent and measures of underemployment are also low.
The job vacancy rate is near its record high and, combined with a smaller pool of potential workers since before the pandemic, wages growth picked up from a low of 1.4 per cent in early 2021 to 3.7 per cent by March quarter 2023, which is the highest annual growth since mid-2012.
Employment growth is expected to ease modestly to 31⁄4 per cent in 2022–23 but the labour market remains exceptionally tight, with the unemployment rate forecast to fall to 33⁄4 per cent, its lowest level since 2007–08. Consistent with the growth profile of state final demand, employment growth is expected to moderate to one per cent in 2023–24 and 11⁄2 per cent in 2024–25.
The unemployment rate is expected to edge slightly higher as the domestic economy slows, but remain low by historical standards, at 41⁄4 per cent in 2023–24 and 41⁄2 per cent in 2024–25.
While incomes remain under pressure in real terms, wages are forecast to strengthen to 33⁄4 per cent in 2022–23, up from 2.5 per cent in 2021–22. Consistent with the lagged impact of a very tight labour market, wages growth is forecast to strengthen further to 4 per cent in 2023–24.
Inflationary pressures have continued to build in 2022–23, with year-average growth in Brisbane’s consumer price index forecast to rise from 5.4 per cent in 2021–22 to an estimated 71⁄4 per cent for 2022–23. While goods prices (especially prices related to new dwelling purchase by owner-occupiers and automotive fuel components) have evolved largely as expected, the inflation outlook is higher than previously anticipated due to inflationary pressures in the services sector.
However, there is growing evidence that headline inflation has peaked, having slowed from 7.9 per cent in September quarter 2022 to 7.4 per cent in March quarter 2023. In year-average terms, inflation is forecast to moderate to 33⁄4 per cent in 2023–24 and then 3 per cent in 2024–25.
Queensland’s population growth is expected to strengthen to 2 per cent in 2022–23, reflecting a pickup in overseas migration as departures have temporarily lagged arrivals. With interstate migration forecast to stabilise at around pre-COVID-19 levels and net overseas migration to be maintained at elevated levels, Queensland’s population growth is forecast to ease back to 11⁄2 per cent by 2024–25.
31
Budget Strategy and Outlook 2023-24
| Table 2.2 | Queensland economic forecasts/projections1 |
| | | | | | | | | | | | | | | | | | | | | | | | |
| | | Actuals | | | Forecasts | | | Projections | |
| | | 2021–22 | | | 2022–23 | | | 2023–24 | | | 2024–25 | | | 2025–26 | | | 2026–27 | |
Gross state product2 | | | 4.4 | | | | 2 | | | | 3 | | | | 3 | | | | 23⁄4 | | | | 23⁄4 | |
Employment | | | 5.1 | | | | 31⁄4 | | | | 1 | | | | 11⁄2 | | | | 13⁄4 | | | | 13⁄4 | |
Unemployment rate3 | | | 4.5 | | | | 33⁄4 | | | | 41⁄4 | | | | 41⁄2 | | | | 41⁄2 | | | | 43⁄4 | |
Inflation4 | | | 5.4 | | | | 71⁄4 | | | | 33⁄4 | | | | 3 | | | | 21⁄2 | | | | 21⁄2 | |
Wage Price Index | | | 2.5 | | | | 33⁄4 | | | | 4 | | | | 31⁄2 | | | | 31⁄2 | | | | 31⁄2 | |
Population | | | 1.6 | | | | 2 | | | | 13⁄4 | | | | 11⁄2 | | | | 11⁄2 | | | | 11⁄2 | |
Notes:
| 1. | Unless otherwise stated, all figures are annual percentage changes. |
| 2. | Chain volume measure (CVM), 2020–21 reference year. |
| 3. | Per cent, year-average. |
| 4. | Brisbane, per cent, year-average. |
Sources: ABS Annual State Accounts, National, State and Territory Population, Labour Force, Wage Price Index, Consumer Price Index, and Queensland Treasury.
| 2.4.1 | Household consumption |
Following the impacts on spending during the initial stages of the pandemic, real household consumption in Queensland rebounded considerably across 2020–21 and 2021–22, rising 9.0 per cent between March quarter 2020 and June quarter 2022.
Since then, aggregate household spending in Queensland has generally been sustained at elevated levels with tight labour market conditions, a pick-up in population growth and substantial savings accumulated during the pandemic offsetting the impacts of higher cost-of-living pressures.
At a component level, consumption patterns that had altered during COVID-19 have continued to normalise and rebalance towards services. This has particularly been the case as consumers increased spending on travel services after the international border re-opened in early-2022.
However, there are signs that households are now adjusting spending in response to the substantial increase in borrowing costs. After being broadly unchanged in December quarter 2022, household consumption in Queensland fell marginally in March quarter 2023.
Household spending is expected to be constrained further as the lagged impact of higher interest payments weigh on household budgets, particularly with many mortgages rolling-off from fixed rates and onto higher variable rates during 2023. This, along with recent declines in asset prices lowering household wealth, is expected to see growth in real household consumption slow significantly from 3 per cent in 2022–23 to 11⁄4 per cent in 2023–24 (Chart 2.4).
32
Budget Strategy and Outlook 2023-24
Over the remainder of the forward estimates, consumption growth is forecast to recover gradually, with scheduled income tax cuts and easing of interest rates supporting disposable incomes. However, persistent consumer caution and a maturing dwelling construction cycle will likely keep spending growth over the later years of the forecast period below the average recorded in the pre-COVID-19 decade.
| Chart 2.4 | Real household consumption outlook, Queensland1 |
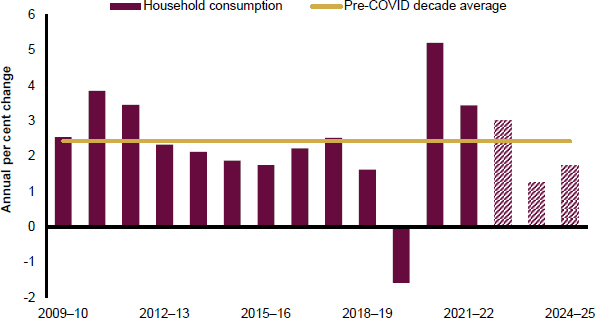
Note:
| 1. | Chain volume measure, year-average. |
Sources: ABS National Accounts and Queensland Treasury.
Dwelling investment in Queensland fell 14.0 per cent over the year to June quarter 2022, with both new and used construction and renovation activity lower over the year. Residential construction activity was greatly constrained by material and labour supply shortages, poor weather and flooding, and several construction company insolvencies.
However, there are signs that supply constraints are beginning to ease, particularly for materials, with new and used construction in March quarter 2023 rising 10.4 per cent from its trough in June quarter 2022, though this has largely been offset by lower renovation activity.
As a result of supply constraints, there remains a considerable amount of work in the pipeline, given that previous record low interest rates and indications by the RBA that rates would remain low for an extended period, as well as generous government incentives in response to COVID-19, underpinned a boom in dwelling investment in recent years.
33
Budget Strategy and Outlook 2023-24
Reflecting this strong demand, there was a record $12.7 billion of residential work in the pipeline in December quarter 2022, easily eclipsing the previous record in 2016 during the inner-city apartment boom in Brisbane (Chart 2.5).
Following 2 years of strong growth, dwelling investment in Queensland is expected to fall 5 per cent in 2022–23. Dwelling investment is then forecast to rebound 51⁄2 per cent in 2023–24 and be maintained at around this level in 2024–25, supported by the continued easing of supply constraints.
| Chart 2.5 | Queensland dwelling investment1 and work in the pipeline2 |
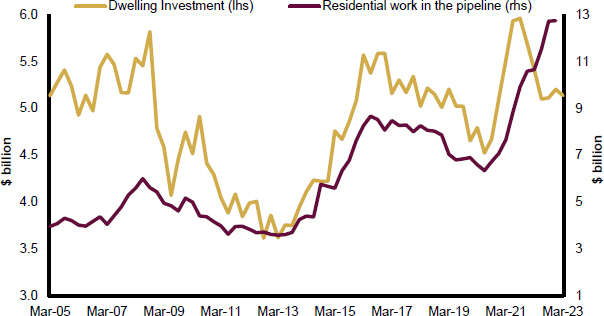
Notes:
| 1. | Quarterly, chain volume measure, seasonally adjusted. |
| 2. | Quarterly, nominal, original. |
Sources: ABS National Accounts and Building Activity.
34
Budget Strategy and Outlook 2023-24
| Box 2.1 | Housing and rental market dynamics |
Previously low interest rates and substantial government support at a national and state level in response to the COVID-19 pandemic underpinned a boom in Queensland’s housing market, creating a strong pipeline of work.
However, material and labour supply shortages, weather disruptions, and several construction company insolvencies have constrained Queensland’s residential construction activity, slowing the supply of new dwelling stock (see Chart 2.5 above).
In contrast to supply, high rates of household formation have driven strong growth in housing demand. Historically high levels of net interstate migration over 2021–22, followed by a recovery in net overseas migration over 2022–23, both contributed to strong population growth in Queensland.
Average housing size has also been declining over time due to both short and long-term factors. Small changes in household size have large impacts — for each 0.01 fall in persons per household, around 8,500 additional dwellings are required.
Broader housing market conditions have tended to have the most significant impacts on the rental market. During the pandemic, the rental stock in Queensland declined significantly, partly due to the sale of properties to owner-occupiers. This drove rental vacancy rates to record lows and sharp rent increases across many Queensland regions, with a similar phenomenon apparent nationally.
The vacancy rate in Queensland had been on a downward trend since the end of 2016, which accelerated during the COVID-19 pandemic, reaching a record low of 0.6 per cent by April 2022. However, according to SQM Research, the residential rental vacancy rate in Queensland has improved marginally over the year, having risen to 1.0 per cent by April 2023 (Chart 2.6).
35
Budget Strategy and Outlook 2023-24
| Chart 2.6 | Queensland residential rental vacancy rate1 |
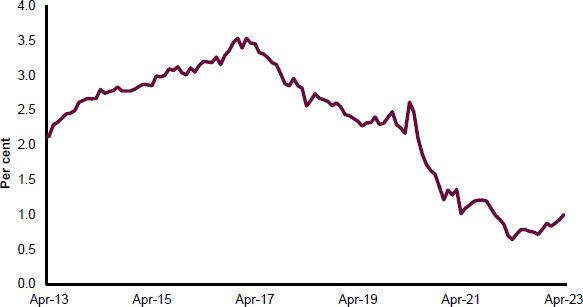
Note:
| 1. | Monthly, seasonally adjusted. |
Sources: SQM Research and Queensland Treasury.
While vacancy rates remain low across Queensland, improvements over the year can be seen across several regions, including Cairns, Townsville, Toowoomba, Sunshine Coast, Gold Coast and Greater Brisbane.
The Queensland Government has taken a range of actions to address housing affordability and increase housing availability, as outlined in Chapter 1.
Total private business investment was easing ahead of the pandemic and fell further during 2020 and early 2021 during the early stages of the pandemic. It has subsequently strengthened in line with the recovery in general economic activity, growing strongly by 8.8 per cent in the year to March quarter 2022 and a further 7.2 per cent in the year to March quarter 2023.
High levels of capacity utilisation, strong business conditions and a tight labour market (which will encourage some firms to substitute capital for labour) are all expected to support growth in machinery and equipment investment.
Leading indicators of non-residential building have eased recently but remain at elevated levels while a strong pipeline of major investment projects, including in renewable energy, is expected to support engineering construction.
36
Budget Strategy and Outlook 2023-24
Supply chain disruptions have pushed up building and construction costs in recent years. The producer price index for Queensland non-residential building and construction rose by over 12 per cent in the year to June quarter 2022. However, ongoing resolution of supply disruptions has seen some easing in cost pressures with the index growing by a more moderate 8.4 per cent in the year to March quarter 2023.
Building cost inflation is expected to ease further over the forecast horizon and overall real business investment is expected to continue to grow at a moderate pace.
Public final demand is forecast to grow 41⁄4 per cent in 2022–23 and then 43⁄4 per cent in 2023–24 and 51⁄4 per cent in 2024–25.
The 2023–24 Queensland Budget is continuing to support delivery of the government’s overarching community objectives of good jobs, better services, and great lifestyle through an unprecedented capital works program which will facilitate and deliver productivity enhancing economic and social infrastructure across the state, including a range of major projects across regional Queensland.
The record capital program of $88.729 billion over the 4 years to 2026–27 will enhance the productivity and competitiveness of Queensland businesses and industries over the medium to longer term, including supporting the transition of the economy in the context of global decarbonisation, and will also help support ongoing solid growth in public final demand across the forecast period.
| 2.4.5 | Overseas exports and imports |
High prices for Queensland’s key commodity exports have boosted the nominal value of Queensland’s goods and services exports to a record high of $130.2 billion in 2021–22, with the value of exports expected to grow even higher to nearly $140 billion in 2022–23.
Growth in real terms is expected to be more muted, given the strong increase in global prices for many key exports (Chart 2.7).
Overseas exports of goods and services are forecast to grow by 31⁄2 per cent in 2022–23. This reflects strong growth in services exports, as they recover from the impacts of the pandemic, more than offsetting a decline in goods exports caused by unscheduled LNG maintenance and weather-related supply constraints impacting coal export volumes.
Goods and services exports are forecast to grow strongly, by 101⁄2 per cent, in 2023–24 as supply constraints affecting goods exports unwind and services exports continue to recover towards pre-COVID-19 levels. In 2024–25, overseas exports are expected to continue to grow strongly but at a slightly lower rate of 63⁄4 per cent, as the growth of services exports moderates considerably.
37
Budget Strategy and Outlook 2023-24
| Chart 2.7 | Queensland’s goods and services exports1 |
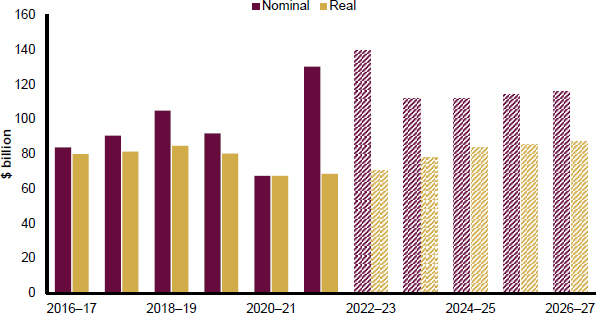
Note:
| 1. | Real values are chain volume measure 2020–21. |
Sources: ABS Balance of Payments and Queensland Treasury.
Coal
Queensland’s coal export volumes are estimated to fall by 1⁄2 per cent in 2022–23, as poor weather conditions constrained supply and global pig iron production, a key driver of demand for metallurgical coal, declined.
Spot prices for premium hard coking coal have moderated from the unprecedented highs in 2021–22 following Russia’s invasion of Ukraine but remain elevated by historical standards. The premium hard coking coal spot price fell from an average of US$594 per tonne (/t) in March 2022 to US$265/t by December 2022.
Supply disruptions in early 2023, including extreme rainfall in January, a train derailment and subsequent track closure, and a cyclone off the coast of North Queensland disrupting shipping in February, all contributed to the premium hard coking coal price rebounding to US$369/t in February 2023.
Since then, supply constraints have eased and the spot price has fallen to average US$231/t in May 2023. Hard coking coal prices are expected to continue to normalise across 2023–24, returning towards prices in line with medium-term fundamentals.
The hard coking coal price is now expected to return to US$175/t in the medium term, up from US$160/t assumed in the 2022–23 Budget Update, reflecting persistently higher than expected inflation and the impacts of decarbonisation efforts, which are expected to increase mining costs in the medium term.
38
Budget Strategy and Outlook 2023-24
Premium thermal coal spot prices remained extremely high across the first half of 2022–23, averaging nearly US$400/t, more than 5 times higher than the pre-COVID-19 average in 2019 of US$75/t. However, as supply constraints eased in the first half of 2023, the spot price fell rapidly, from US$400/t in December 2022 to US$180/t in March 2023, and US$170 in May 2023.
Premium thermal coal prices are expected to continue to ease across 2023–24. However, the thermal coal market is expected to remain tight over the forecast period, as concerns about climate change reduce the viability of new investments in thermal coal supply globally. As a result, thermal coal prices are expected to remain above their historical long-run average price across the forecast period.
In January 2023, China lifted its unofficial ban on Australian coal imports, by allowing some companies to resume importing. China has subsequently allowed all companies to resume importing coal from Australia. Ports data show that Queensland exported 5.0 million tonnes of coal to China across January to April.
Looking forward, China’s resumption of coal imports from Queensland and Australia may help support demand for Queensland’s coal exports across the forward estimates. However, this impact is expected to be modest.
Following China’s initial ban in October 2020, Queensland’s coal exporters were largely successful in finding alternative customers for their coal, offsetting the vast majority of exports to China through increased exports to other countries, primarily Japan, India and Korea.
Queensland’s coal exports are forecast to grow by 61⁄4 per cent in 2023–24, as supply conditions normalise. Coal exports are then forecast to grow further in 2024–25, returning towards pre-COVID-19 levels, as global growth strengthens.
In 2025–26 and 2026–27, coal exports are projected to grow modestly, as global economic conditions and growth normalise.
LNG
The volume of Queensland’s LNG exports is estimated to fall 53⁄4 per cent to 22.2 million tonnes in 2022–23, largely due to maintenance issues at one of the LNG plants on Curtis Island.
The majority of Queensland’s LNG exports are sold under long-term contracts linked to global oil prices, with several months lag. The Russian invasion of Ukraine sparked concerns about an oil supply shortfall in the market, which saw the Brent crude oil price average above US$100/bbl in 2022, peaking at nearly US$140/bbl in early March 2022.
These higher oil prices have flowed through to Queensland’s LNG export prices, boosting the value of Queensland’s LNG exports, which more than doubled in value in 2021–22 and are expected to rise a further 171⁄2 per cent in 2022–23.
However, concerns surrounding a global shortfall of oil have not materialised, and global supply of oil overtook global consumption in 2022, putting downward pressure on oil prices.
As a result, global oil prices have fallen back to levels in late 2022 and early 2023 similar to those seen before the war in Ukraine, reaching as low as US$73/bbl in late May 2023. The value of Queensland’s LNG exports will decline from their record high as oil prices moderate.
39
Budget Strategy and Outlook 2023-24
With maintenance issues expected to be resolved, Queensland’s LNG export volumes are expected to rebound 3 per cent in 2023–24, with all 3 LNG plants assumed to resume production at contracted capacity.
Metals
Queensland’s industrial metals exports fell 12.5 per cent in 2021–22 as production was hampered by COVID-19 related workforce disruptions, weather interruptions and outages at major refineries and smelters.
Production and exports generally rebounded strongly in late 2022. However, a workplace incident at the Dugald River mine and the significant flooding in early 2023, which saw production reduced across several sites for an extended period, resulted in overall output being reduced in the March and June quarters.
After a range of delays, commissioning of the Sun Metals zinc refinery expansion is expected to support a lift in metals exports in 2023–24 and 2024–25.
From 2025, several significant zinc and copper mines are scheduled to close as economically viable ore is depleted and this will impact Queensland’s industrial metals exports by mid-decade. However, Queensland base metal exploration has grown rapidly in recent years, particularly for copper, and there are several potential expansions currently under review which will have some offsetting effect if they proceed.
Agriculture
The volume of agricultural exports rose by 4.3 per cent in 2021–22, driven by sharp increases in cotton, grain sorghum and wheat exports, as favourable weather conditions and elevated prices incentivised growers to expand production. Beef exports moderated slightly as producers retained stock following another wet 2021–22 summer.
Agriculture exports are expected to further strengthen in 2022–23, as increased winter rainfall in 2022, combined with elevated commodity prices, lead to increased cotton and crop production and exports.
Beef exports are expected to return to growth in 2022–23 and 2023–24, as drier conditions lead to increased cattle processing.
Similarly, cotton exports are projected to rise sharply in 2022–23, due to a large harvest in 2021–22 and a sizeable crop in 2022–23 driven by high rainfall in key cotton producing areas. Cotton exports are expected to moderate from 2023–24 as drier conditions set in, resulting in a drawdown in water storages.
Services exports
The reopening of Australian borders has seen a large increase in overseas visitor inflows, albeit from exceptionally low levels (Chart 2.8).
40
Budget Strategy and Outlook 2023-24
| Chart 2.8 | Short-term visitor and student arrivals, Queensland1 |
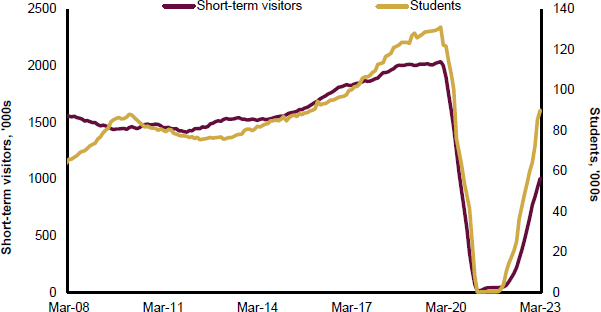
Note:
| 1. | 12-month rolling sum, ‘000s. |
Source: ABS Overseas Arrivals and Departures.
Following a prolonged period of negligible arrivals, the number of international short-term visitors has risen strongly and, on a rolling 12-month basis, in the year to March 2023 is now close to 50 per cent of the pre-COVID-19 peak.
Overseas student arrivals have increased even more strongly. On a 12-month rolling basis, student arrivals in the year to March 2023 are back to almost 70 per cent of their previous peak.
A combination of international airline capacity constraints, ongoing uncertainty, and travel restrictions in China (previously a major source of visitors and students) has prevented a complete recovery to date. However, the recent relaxation of Chinese travel restrictions, together with the assumed improvements in travel capacity and confidence, are expected to produce a further recovery in visitor arrivals over the forecast horizon.
This is expected to translate into continued strong growth in services exports.
Imports
Overseas imports are expected to grow by 111⁄2 per cent in 2022–23, driven by strong growth in goods imports in the first half of the year, as global supply chains recovered and reflecting the first full financial year without international travel restrictions.
Imports are then expected to grow by 51⁄2 per cent in 2023–24, as overseas travel continues to recover but goods imports contract, as household consumption is constrained by the impacts of interest rate rises.
41
Budget Strategy and Outlook 2023-24
In 2024–25, overseas imports are forecast to grow 81⁄2 per cent, with goods imports returning to growth. Meanwhile, growth rates for services imports are expected to moderate, but the level of overseas travel is expected to have returned by then to above pre-COVID-19 levels.
Reflecting the trends in exports and imports detailed above, in net terms the overseas trade sector is expected to detract 11⁄4 percentage points from growth in 2022–23, as strong growth in both goods and services imports and a decline in goods exports more than offset the recovery in services exports.
In 2023–24, net overseas exports are forecast to make a one percentage point contribution to growth, as goods exports recover and goods imports are impacted by slowing household consumption growth (Chart 2.9). The trade sector is then forecast to return to balance in 2024–25, with a neutral contribution to GSP growth in that year.
| Chart 2.9 | Overseas exports and imports1 |
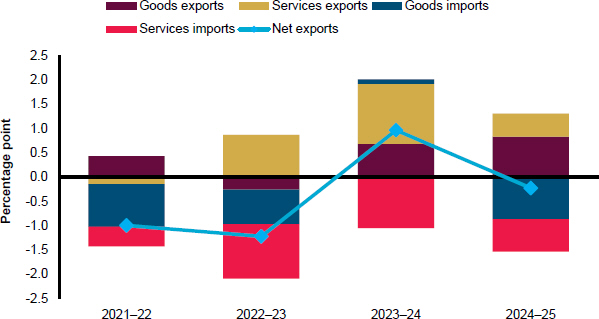
Note:
| 1. | Percentage point contribution to GSP growth. 2022–23 onwards are forecasts. |
Sources: ABS Balance of Payments and Queensland Treasury.
Queensland’s labour market remains remarkably strong and tight, with the unemployment rate at around decade lows, the job vacancy rate near its historic high and the employment-to-population ratio around its highest level in more than a decade.
As of April 2023, Queensland has recorded among the strongest employment gains of any state or territory, and stronger jobs growth in percentage terms than the rest of the nation, since the beginning of the COVID-19 pandemic in March 2020. Trend employment in Queensland has grown by 226,300 persons (or 8.8 per cent) over this period.
42
Budget Strategy and Outlook 2023-24
Despite this strong performance, there have been signs that interest rate rises have impacted the labour market in the second half of 2022 and into 2023.
Annual employment growth has slowed, from a peak of 4.8 per cent in July 2022 to 1.5 per cent in April 2023, while the unemployment rate has edged up slightly from a low of 3.5 per cent in October 2022 to 3.8 per cent in April 2023.
The full impact of rapid monetary policy tightening is expected to continue to flow through to domestic economic activity and the labour market over coming quarters.
After growing by 5.1 per cent in 2021–22, year-average employment growth is expected to moderate but remain strong at 31⁄4 per cent in 2022–23. As the effects of sharp interest rate rises flow through to consumption and the domestic economy, employment growth is forecast to slow to one per cent in 2023–24. As domestic economic activity recovers, employment growth is forecast to pick-up to 11⁄2 per cent in 2024–25 (Chart 2.10).
Through this period of softening private sector demand, ongoing growth in public final demand, including the government’s substantial infrastructure program, will provide support to the labour market.
Beyond 2024–25, employment is projected to grow by 13⁄4 per cent per annum in both 2025–26 and 2026–27, in line with projected working age population growth.
Queensland’s unemployment rate is forecast to fall from an average of 4.5 per cent in 2021–22 to an exceptionally low 33⁄4 per cent in 2022–23. This would be Queensland’s lowest year-average unemployment rate since 2007–08.
As domestic activity is expected to be more constrained in 2023–24, the unemployment rate is forecast to rise moderately to 41⁄4 per cent but remain very low by historical standards.
Queensland’s unemployment rate is then expected to continue to normalise over the forward estimates, averaging 41⁄2 per cent in both 2024–25 and 2025–26, reaching 43⁄4 per cent in 2026–27.
43
Budget Strategy and Outlook 2023-24
| Chart 2.10 | Employment growth and unemployment rate1 |
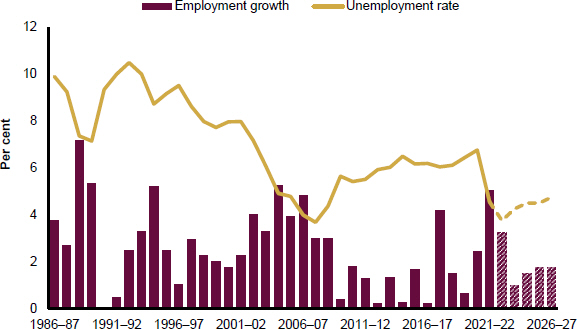
Note:
Sources: ABS Labour Force and Queensland Treasury.
Regional labour markets
Employment in many regions of the state has rebounded strongly since the COVID-19 pandemic.
Employment in South East Queensland rose 3.1 per cent in the 12 months to April 2023, led by Sunshine Coast (up 13,500 persons, or 7.0 per cent), Moreton Bay – South (up 11,000 persons, or 9.5 per cent) and Moreton Bay – North (up 8,900 persons, or 7.7 per cent). Brisbane – South (up 7,900 persons) and Brisbane – West (up 7,800 persons) also recorded strong employment gains during the period.
Many regional Queensland labour markets have recovered strongly from the COVID-19 pandemic, with key regional industries supported by high commodity prices, solid domestic tourism, improved rainfall and the strong dwelling sector. Employment in regional Queensland grew 5.4 per cent in the year ended April 2023 with Central Queensland (up 12,200 persons, or 10.4 per cent) and Wide Bay (up 10,600 persons, or 8.9 per cent) recording the strongest employment growth.
The average unemployment rate across regional Queensland fell 1.2 percentage points to 3.9 per cent in the year to April 2023, to be the lowest unemployment rate recorded in regional Queensland since May 2008.
Cairns (3.8 per cent), Townsville (2.3 per cent) and Wide Bay (5.6 per cent) all recorded among the lowest unemployment rates in more than a decade in April 2023.
44
Budget Strategy and Outlook 2023-24
In year-average terms, growth in Brisbane’s consumer price index (CPI) strengthened to 5.4 per cent in 2021–22, up from 1.2 per cent during the height of the COVID-19 pandemic in 2019–20 and 2.1 per cent in 2020–21.
Inflationary pressures have continued to build in the first half of 2022–23, with CPI growth rising to a peak of 7.9 per cent over the year to September quarter 2022, the strongest annual increase since 1987.
There is strong evidence, however, that annual inflation has peaked, having slowed to 7.7 per cent in December quarter 2022 and 7.4 per cent in March quarter 2023.
While the initial surge in inflation was predominantly driven by accelerating goods inflation, more recently inflationary pressures have also broadened across services components. In fact, in March quarter 2023, 70 of the 87 expenditure components that comprise the Brisbane CPI basket recorded annual price increases of above 3 per cent, up from just 14 components in March quarter 2021.
While new dwelling purchase for owner-occupier inflation has eased from the historical high increase of 30.2 per cent in June quarter 2022, the component remains the strongest contributor to headline inflation, having risen 12.7 per cent over the year to March quarter 2023.
Meanwhile, several services components continue to strengthen, with rents, buoyed by historically low vacancy rates, rising 7.0 per cent over the year to March quarter 2023. Further, strong demand for travel throughout 2022 and into early 2023 at a time when the number of operating flights had not yet returned to pre-COVID-19 levels, resulted in holiday travel and accommodation annual inflation surging to a record high 24.9 per cent in the March quarter.
Brisbane’s CPI growth is expected to average 71⁄4 per cent in 2022–23. If realised, this would be the strongest year-average increase in Brisbane’s CPI since 1989–90.
Beyond 2022–23, services inflation is expected to become the primary driver of inflationary pressures in Brisbane. Goods price inflation is expected to continue to ease in the near-term, driven by a range of factors including consumers continuing to switch spending from goods to services, falling global shipping costs, lower oil prices flowing through to automotive fuel, material and labour shortages continuing to ease and a normalisation in food price inflation as agricultural production recovers from the impacts of flooding events in 2022.
However, these falls are expected to be partially offset by services inflation remaining elevated for some time, primarily driven by further strengthening in rents, as population growth tempers the improvement in vacancy rates, and ongoing strong demand for holiday travel and accommodation.
The net impact of these divergent trends is expected to result in CPI growth moderating to 33⁄4 per cent in 2023–24, 3 per cent in 2024–25 and 21⁄2 per cent over the remainder of the forecast period.
Consistent with the very tight labour market, Queensland’s wage price index (WPI) annual growth has accelerated over recent years, rising from a trough of 1.4 per cent in March quarter 2021 to 3.7 per cent in March quarter 2023, which is the highest annual growth since June quarter 2012.
45
Budget Strategy and Outlook 2023-24
Queensland’s WPI growth is expected to strengthen to 33⁄4 per cent in 2022–23, up from 2.5 per cent in 2021–22, and strengthen further to 4 per cent in 2023–24.
| Box 2.2 | Recent inflation trends |
Global trends
Annual consumer price inflation rates surged globally throughout 2021 and the first half of 2022. This was driven by significant fiscal and monetary stimulus in response to the COVID-19 pandemic and supply chain disruptions, initially due to factors associated with the pandemic but then exacerbated by Russia’s invasion of Ukraine.
However, more recently there have been some signs of global disinflation (Chart 2.11) as the impact of aggressive interest rate rises begin to impact consumer demand and global supply chain disruptions have eased.
In the United States, headline consumer price inflation has eased to 4.9 per cent in April 2023, down from a peak of 9.1 per cent in June 2022. Inflation is also easing in the Euro area (7.0 per cent in April 2023, down from a peak of 10.6 per cent in October 2022), Canada (4.4 per cent in April 2023, down from 8.1 per cent in June 2022) and South Korea (3.7 per cent in April 2023, down from 6.3 per cent in July 2022).
| Chart 2.11 | Annual consumer price inflation by jurisdiction |
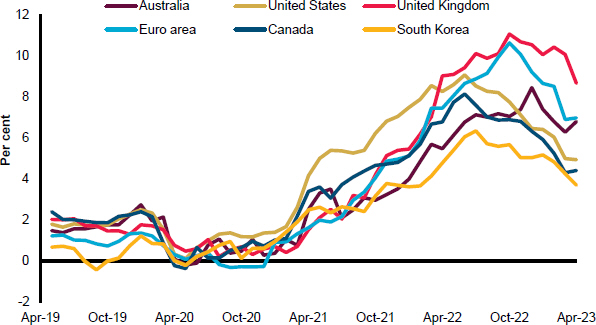
Source: Refinitiv.
However, global oil prices having almost halved since Brent crude oil peaked at US$140/bbl in March 2022 has been the predominant driver of these falling headline inflation rates. As such, various measures of core inflation, which typically remove volatile CPI components including fuel prices, have fallen at a slower rate.
46
Budget Strategy and Outlook 2023-24
Core inflation measures continue to be supported by elevated rates of services inflation. This is particularly evident in the United States where annual core inflation has remained stable at around 51⁄2 per cent in early-2023 (while headline inflation has fallen considerably during the same period), supported by annual services inflation of 6.8 per cent in April 2023.
Domestic trends
Inflationary trends in Brisbane and nationally have broadly followed global trends in recent years, with the initial surge in headline inflation primarily driven by goods components, in particular new dwelling purchases by owner-occupiers and automotive fuel, while services inflation was more delayed.
In Brisbane, annual services inflation has accelerated from 2.9 per cent in December quarter 2021 to 7.6 per cent in March quarter 2023. The March quarter 2023 result is the highest rate of annual services inflation since 1995.
Key components supporting services inflation include rents and holiday travel and accommodation costs.
Rental vacancy rates in Brisbane have trended lower since the onset of the COVID-19 pandemic, partly driven by a falling average household size as many renters opted for more living space. Partially reflecting the fall in Queensland’s rental stock, Brisbane’s rental vacancy rate has been at, or below, one per cent since early 2022, supporting strong growth in rents.
Meanwhile, strengthening demand, rising fuel costs and airline capacity remaining significantly below pre-COVID-19 levels resulted in holiday travel and accommodation costs rising significantly throughout 2022 and early-2023.
Consumer inflation trends in Australia have also been impacted by flooding events throughout 2022, impacting agricultural supply. The flooding exacerbated food price inflation that had already been impacted by Russia’s invasion of Ukraine and other constraints, including COVID-19-related supply chain disruptions and high transport and fertiliser costs.
To help address these national cost-of-living pressures, the government is providing a record $8.224 billion worth of concessions in 2023–24, an increase of 21.2 per cent from 2022–23.
The government is providing $1.617 billion in the 2023–24 Queensland Budget towards new and expanded cost-of-living measures that will help address the challenges Queenslanders are facing.
This includes an unprecedented $1.483 billion in 2023–24 for additional electricity bill support to households and small businesses facing cost-of-living pressures.
As part of this package, all Queensland households will automatically receive a $550 Cost of Living Rebate on their electricity bill in 2023–24, while around 600,000 vulnerable households will benefit from a higher $700 Cost of Living Rebate.
In addition, vulnerable households will continue to receive the existing $372 rebate under the Queensland Electricity Rebate Scheme, bringing total support for this group to $1,072.
Eligible small businesses in Queensland will also receive an automatic rebate of $650 on their electricity bill in 2023–24. This includes around 205,000 Queensland small businesses that consume less than 100,000 kilowatt hours per annum.
47
Budget Strategy and Outlook 2023-24
The Queensland Government’s cost-of-living relief package significantly increases and broadens support under the National Energy Bill Relief Plan, jointly funded by the Queensland and Australian Governments.
As part of this package, the Queensland Government has also allocated a total of $60 million for a Household Energy Initiatives program, and $10 million to support community non-government organisations to deliver energy literacy and education programs.
Queensland’s overall population growth recovered to 1.6 per cent in 2021–22, after the pandemic related international border restrictions slowed growth to 1.0 per cent in 2020–21.
Queensland’s relatively better COVID-19 health outcomes, along with stronger labour market outcomes and relative housing affordability, drove a surge in net interstate migration during the pandemic. At around 101,000 persons since June quarter 2020, Queensland’s net interstate migration during the COVID-19 pandemic has been the highest in Australia.
This is consistent with the long-term trend of Queensland being a substantial net recipient of interstate migrants, particularly from New South Wales and Victoria.
However, after a substantial upswing in the first 3 quarters of 2021–22 (up 46,930 persons), net interstate migration to Queensland has continued to normalise during the subsequent 2 quarters, averaging only around 8,200 persons per quarter. Over the remainder of the forward estimates, net interstate arrivals are expected to broadly stabilise at around pre-COVID-19 levels.
Latest data show overseas migrant arrivals have returned to pre-pandemic levels, but departures are still lagging as there are fewer recently arrived temporary migrants who are due to leave. As a result, having generally been a net outflow throughout the pandemic, net overseas migration to Queensland has risen over 41,600 persons in the first 3 quarters of 2022. This contrasted with a detraction of almost 2,400 persons over the same period in 2021.
Tight labour market conditions are also expected to support elevated levels of net overseas migration over the medium term as local firms seek overseas workers where they can’t meet workforce demands locally.
Queensland’s birth rate picked up during much of the pandemic period. However, with the overseas borders opened again and tightening financial conditions expected to impact household incomes, the increase in births seen during the COVID-19-period is likely to have only been temporary and is expected to unwind, with fertility rates expected to broadly return to the downward trend seen prior to the pandemic.
The population increase attributed to natural increase is forecast to broadly return to pre-COVID-19 trends.
Reflecting this combination of factors, Queensland overall population growth is expected to strengthen to 2 per cent in 2022–23, before easing to 13⁄4 per cent in 2023–24 and then easing further to average around 11⁄2 per cent over the remainder of the forward estimates.
48
Budget Strategy and Outlook 2023-24
| Box 2.3 | Population growth in Queensland |
International border closures during the COVID-19 pandemic led to slower population growth in Queensland and in Australia by historical standards. In year-average terms, Queensland’s population growth slowed to 1.0 per cent in 2020–21, compared with average growth of around 1.6 per cent in the preceding 5 years.
However, Queensland’s population growth recovered to 1.6 per cent in 2021–22, underpinned by a surge in net interstate migration. Queensland’s relatively better health outcomes, labour market conditions and housing affordability drove this increase in interstate migration.
Net interstate migration is now expected to stabilise at around pre-COVID-19 levels.
Recovery in net overseas migration
Net overseas migration is now recovering following the pandemic (Chart 2.12). Overseas arrivals have returned to pre-pandemic levels, while departures are still lagging, with overseas migration is expected to be the main driver of population growth over the forward estimates.
Net overseas migration to Queensland rose by over 41,600 persons in the first 3 quarters of 2022, compared with a detraction of just under 2,400 persons over the same period in 2021.
| Chart 2.12 | Queensland’s population growth, by component1 |
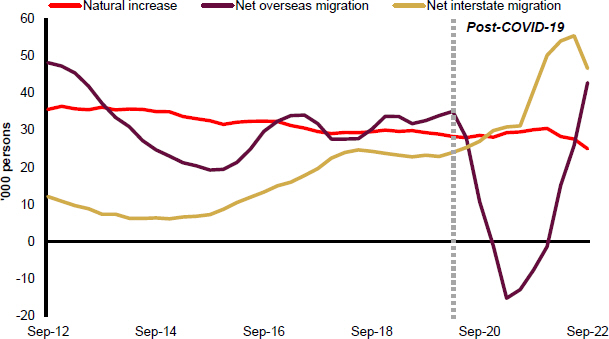
Note:
| 1. | Four-quarter rolling sum. The dotted vertical line represents March quarter 2020. |
Source: ABS National, State and Territory Population.
Reflecting these trends, Queensland’s overall population growth is expected to have strengthened to 2 per cent in 2022–23 but is then expected to ease to 13⁄4 per cent in 2023–24 before easing further to average around 11⁄2 per cent over the rest of the forward estimates.
49
Budget Strategy and Outlook 2023-24
Population growth across Queensland’s regions
As at 30 June 2022, approximately 1.4 million people lived in local government areas (LGAs) outside of South East Queensland, accounting for 27 per cent of the state’s population.
Population growth has varied across Queensland regions since the COVID-19 pandemic, with some regional LGAs growing faster than the state average, including Fraser Coast (2.8 per cent), Livingstone (2.7 per cent), Gympie (2.4 per cent) and Whitsunday (2.4 per cent).
A range of other regional LGAs have experienced more moderate, but still solid population growth, including Bundaberg (2.1 per cent), Gladstone (1.8 per cent), Cairns (1.7 per cent), Mackay (1.6 per cent) and Townsville (1.6 per cent).
Long-term population outlook
Despite the recent strength of interstate migration and the return of overseas migration, the impact of COVID-19 international border restrictions and lower fertility rates have resulted in the growth in Queensland’s population over the medium to longer term now being lower than expected prior to the pandemic.
| • | | The closure of international borders caused Queensland to record negative net overseas migration over the period from June 2020 to December 2021. This resulted in the lowest rate of population growth since World War II in 2020–21, with annual growth averaging just 0.8 per cent in both March and June quarters of 2021. |
| • | | Since peaking in the late 2000s, declining fertility has been a common trend across the world. In Australia, the total fertility rate (number of births per woman) fell from a peak of 2.02 in 2008 to 1.59 in 2020, while the OECD average fell from 1.76 to 1.56 over the same period. |
| • | | Queensland’s fertility rate fell from a peak of 2.17 in 2009 to 1.65 in 2020, and fertility is expected to remain low despite a temporary increase to 1.79 observed in 2021 (Chart 2.13). |
The 2018 edition of the Queensland Government Population Projections (the Projections) showed Queensland’s population by 2036 was expected to grow by over 1.4 million people, to reach 6.7 million.
The 2023 edition of the Projections, updated by Queensland Treasury with the latest Census data and assumptions reflecting developments over the last 5 years, projects the state’s population to now grow more slowly, by over 1.2 million people to 6.5 million, over the same period.
This almost 200,000 lower projected population in Queensland in the 2023 edition equates to a population approximately the size of Cairns local government area.
50
Budget Strategy and Outlook 2023-24
| Chart 2.13 | Total fertility rate by region |
Sources: ABS and OECD.
Despite the relatively lower growth outlook, ageing of the state’s population is expected to continue with the number of Queenslanders aged 65 years and over projected to grow by almost 0.5 million, to reach 1.3 million, by 2036.
Over the longer term, the population of 65+ year olds in Queensland is projected to more than double, to reach 2.3 million, over the 50 years to 2071 under the medium population series.
Budget priorities to meet the needs of state’s growing population
As outlined in Chapter 1, the government’s budget priorities and longer-term economic strategy are at the forefront of addressing challenges associated with the state’s growing and ageing population, both now and into the future.
The government’s ongoing substantial investment in education and training will ensure continued growth of a highly skilled, productive and flexible workforce across the state to meet the needs of the growing population and in the context of the ongoing transformation of the economy.
The government’s record capital program of $89 billion over 4 years to 2026–27 will directly facilitate the provision of the social and economic infrastructure across the state, thereby supporting the creation of more jobs in more industries, enhancing future prosperity, and improving the standard of living for Queenslanders and communities.
In the more immediate term, the government is also providing substantial support, including through actions to improve housing affordability, to address key cost-of-living pressures facing Queensland households and small businesses.
51
Budget Strategy and Outlook 2023-24
As outlined in the 2022–23 Budget Update, global inflation and monetary policy responses among major central banks remain the biggest risks to the global outlook.
This is particularly the case in Europe where inflation remains elevated, which is likely to attract more aggressive monetary tightening from the European Central Bank and Bank of England. This in turn may lead to a ‘hard landing’ in the region, which may have global repercussions, including a potential destabilisation of the financial system in some economies.
Another risk is the rising tensions between the US and China, which have already led to significant commercial sanctions according to global financial media coverage. Any resulting disruptions to supply chains in critical sectors could prolong global inflation, weaken global growth potential and may impact negatively on Australia’s mineral and energy exports.
The potential escalation of Russia’s military actions against Ukraine is also an ongoing risk to the outlook.
In Australia, the persistence of inflation and strength of the labour market may lead the RBA to continue monetary tightening further than currently expected, further impacting a sizeable portion of recent homeowners. If this was to eventuate, combined with the rising uncertainty of the international outlook, this could lead to weaker overall growth.
52
Budget Strategy and Outlook 2023-24
| Table 2.3 | Queensland economic forecasts1, by component |
| | | | | | | | | | | | | | | | |
| | | Actuals
2021–22 | | | 2022–23 | | | Forecasts
2023–24 | | | 2024–25 | |
Economic output2 | | | | | | | | | | | | | | | | |
Household consumption | | | 3.4 | | | | 3 | | | | 11⁄4 | | | | 13⁄4 | |
Dwelling investment | | | 4.4 | | | | -5 | | | | 51⁄2 | | | | 3⁄4 | |
New and used | | | 5.4 | | | | 21⁄4 | | | | 5 | | | | 13⁄4 | |
Alterations and additions | | | 3.4 | | | | -121⁄2 | | | | 61⁄2 | | | | -3⁄4 | |
Business investment | | | 8.8 | | | | 43⁄4 | | | | 2 | | | | 43⁄4 | |
Non–dwelling construction | | | 10.9 | | | | 41⁄4 | | | | 91⁄4 | | | | 131⁄2 | |
Machinery and equipment | | | 10.1 | | | | 61⁄4 | | | | -41⁄4 | | | | -33⁄4 | |
Private final demand | | | 4.7 | | | | 2 | | | | 11⁄2 | | | | 21⁄4 | |
Public final demand | | | 5.6 | | | | 41⁄4 | | | | 43⁄4 | | | | 51⁄4 | |
State Final Demand | | | 5.0 | | | | 23⁄4 | | | | 21⁄2 | | | | 31⁄4 | |
Overseas goods and services exports | | | 1.7 | | | | 31⁄2 | | | | 101⁄2 | | | | 63⁄4 | |
Overseas goods and services imports | | | 8.2 | | | | 111⁄2 | | | | 51⁄2 | | | | 81⁄2 | |
Gross state product | | | 4.4 | | | | 2 | | | | 3 | | | | 3 | |
Employment | | | 5.1 | | | | 31⁄4 | | | | 1 | | | | 11⁄2 | |
Unemployment rate3 | | | 4.5 | | | | 33⁄4 | | | | 41⁄4 | | | | 41⁄2 | |
Inflation4 | | | 5.4 | | | | 71⁄4 | | | | 33⁄4 | | | | 3 | |
Wage Price Index | | | 2.5 | | | | 33⁄4 | | | | 4 | | | | 31⁄2 | |
Population | | | 1.6 | | | | 2 | | | | 13⁄4 | | | | 11⁄2 | |
Notes:
| 1. | Unless otherwise stated, all figures are annual percentage changes. |
| 2. | CVM, 2020–21 reference year. The comparable nominal GSP growth rates are 22.5 per cent in 2021–22, 8 per cent in 2022–23, -1⁄2 per cent in 2023–24 and 5 per cent in 2024–25. The exceptionally strong growth in 2021–22 largely reflects the impact of substantial increases in commodity prices on nominal exports. |
| 3. | Per cent, year-average. |
| 4. | Brisbane, per cent, year-average. |
Sources: ABS Annual State Accounts, Australian National Accounts, Balance of Payments, National, State and Territory Population, Labour Force, Wage Price Index, Consumer Price Index and Queensland Treasury.
53
Budget Strategy and Outlook 2023-24
| 3 | Fiscal strategy and outlook |
Features
| • | | The Queensland Government is committed to investing in economic and social infrastructure to meet the needs of Queensland’s growing population and accelerate regional economic development through the strategic allocation of royalties and revenue uplifts. These investments will leverage Queensland’s natural endowments, productive capacity and competitive advantages to deliver good jobs, better services and a great lifestyle for Queenslanders. |
| • | | An operating surplus of $12.305 billion is expected in 2022–23 driven by unprecedented strength in coal royalties, attributed to a combination of high coal prices and progressive coal royalties measures introduced in the 2022–23 Budget. This will be the largest operating surplus in Queensland history, following what was a record surplus in 2021–22. |
| • | | The surplus in 2022–23 will see the General Government Sector borrowing $11.8 billion less in that year than anticipated in the 2022–23 Budget. This has provided the opportunity to fund the state’s record $89 billion capital program while maintaining debt at sustainable levels. General Government Sector debt in 2025–26 remains $2.2 billion lower than forecast in the 2022–23 Budget. |
| • | | As royalty revenue normalises, the Budget will return to modest operating surpluses across the forward estimates, other than in 2023–24. An operating deficit of $2.182 billion is expected in 2023–24, compared to the projected deficit in the 2022–23 Budget of $1.083 billion. This is in part driven by the government’s significant cost-of-living relief measures, including $1.483 billion for additional electricity bill support to households and small businesses. As wages grow and inflation falls, cost-of-living pressures should ease. |
| • | | The significant program of public infrastructure investment reflects the challenges and opportunities associated with decarbonising the state’s energy system, expanding the capacity of the health system, ensuring Queensland’s water security, and preparing to host the 2032 Olympic and Paralympic Games. |
| • | | Queensland is well positioned to meet these challenges, with a lower General Government Sector net debt to revenue ratio than interstate peers. Queensland’s ratio of 20 per cent in 2023–24 compares to 90 per cent for New South Wales and 152 per cent for Victoria. |
| • | | Sustainability risk management, including environmental, social, and governance factors, is a strategic imperative for the state. The Queensland Government publishes an annual Queensland Sustainability Report which sets out how the government has established its priorities and provides information on key policies being implemented and performance measures to develop a resilient and sustainable future. |
| • | | A new public sector wages offer balances the government’s commitment to frontline service delivery and employee retention with disciplined management of operating expenses growth. |
54
Budget Strategy and Outlook 2023-24
| • | | Queensland’s credit ratings with S&P Global (AA+) and Moody’s (Aa1) remained stable through the pandemic crisis and recovery, while Fitch upgraded Queensland’s rating from AA to AA+ in December 2021. Sound financial management supports the credit rating and provides the capacity to respond to future economic and financial shocks and position the economy for growth. |
| • | | Disaster events in the summer of 2022–23 followed the devastating floods of 2021–22, with recovery and reconstruction continuing to progress. Disaster related expenses over the 5 years to 2026–27 are large but will be significantly offset by Australian Government payments under disaster funding arrangements. |
The strength of the Queensland economy and continued high commodity prices have resulted in further upward revisions to revenue in the 2023–24 Queensland Budget, following the uplifts incorporated into the 2022–23 Budget and 2022–23 Budget Update. Since the 2022–23 Budget, revenue has been revised upwards by $13.736 billion in 2022–23 and $30.994 billion, or 10 per cent, over the 4 years to 2025–26. While revenue has increased significantly, expenses for 2022–23 have been managed broadly within 2022–23 Budget estimates. This has produced a substantial improvement in Queensland’s 2022–23 net operating balance, from a deficit of $1.029 billion in the 2022–23 Budget to a surplus of $12.305 billion, the largest in Queensland’s history.
Prudent management of the rebound in revenue forecasts has driven significant progress against the Charter of Fiscal Responsibility since those targets were set in 2021–22. The government is restoring its fiscal buffers. Over progressive budgets, temporary revenue windfalls have been targeted towards fiscal recovery and a lower reliance on debt. Queensland’s General Government Sector net debt to revenue ratio in 2022–23 has been reduced from 27 per cent in the 2022–23 Budget, to just 7 per cent in this Budget. This is below pre-pandemic expectations, with the 2019–20 Budget forecasting a net debt to revenue ratio of 30 per cent in 2022–23.
This improvement means that Queensland is well placed to meet the challenges associated with the significant additional investment that is required to decarbonise the state’s energy system, expand the capacity of the health system, ensure Queensland’s water security and prepare for hosting the Brisbane 2032 Olympic and Paralympic Games. At the same time, continued capital investment in areas such as housing, education and transport must continue to ensure service delivery can continue to keep pace with the needs of a growing population. Queensland’s total capital program over the 4 years to 2026–27 is estimated at $88.729 billion, compared to the $59.126 billion estimated capital program over the 4 years to 2025–26 in the 2022–23 Budget.
55
Budget Strategy and Outlook 2023-24
While delivery of this record capital program is challenging, the investment is necessary to ensure Queensland’s continued prosperity. It can also be achieved while maintaining borrowings at sustainable levels. The ratio of net debt to revenue is expected to increase to 55 per cent by 2026–27 as a result of this significant capital investment, but remains far lower than the ratios of other states, with Victoria projecting a ratio of 172 per cent in the same year, and New South Wales projecting a ratio of 102 per cent by 2025–26. A sustainable level of borrowings means that Queensland is comparatively well positioned in an environment of increased interest rates.
While the government’s $1.617 billion in new or expanded cost-of-living relief measures in 2023–24 alongside revenues normalising will result in a once-off operating deficit in 2023–24, an operating surplus is forecast in 2024–25.
Total concessions funding in 2023–24 is $8.224 billion, which represents an increase of more than 21 per cent compared with 2022–23.
Consistent with Queensland’s fiscal principles, net operating surpluses from 2024–25 onward and maintaining borrowings at a sustainable level will be achieved without compromising Queensland’s competitive taxation regime. The government is also ensuring that employee costs remain sustainable with a public sector wages offer that balances the government’s commitment to frontline service delivery with disciplined management of operating expenses growth.
Continued careful budget management will be key to ensuring Queensland’s fiscal position remains sustainable as revenues normalise and the substantial capital program is delivered, while progress is made towards medium term goals.
In the 2021–22 Queensland Budget, the government set out its medium-term fiscal strategy, including a new Charter of Fiscal Responsibility (the Charter) with renewed fiscal principles with objective measures to support the restoration of fiscal buffers. An update of progress towards achievement of medium-term goals is outlined below.
Fiscal Principle 1 – Stabilise the General Government Sector net debt to revenue ratio at sustainable levels in the medium term, and target reductions in the net debt to revenue ratio in the long term.
Ensuring debt is stabilised at a sustainable level is key to restoring the state’s capacity to invest in infrastructure and respond to future external shocks.
Since the development of the new Charter, significant progress has been made against Fiscal Principle 1. Revenue strength in 2022–23 has resulted in a lower debt requirement in that year and a downwards revision to the net debt to revenue ratio of 20 percentage points since the 2022–23 Budget and 44 percentage points since the 2021–22 Budget.
The reduced debt requirement in the near term provides capacity for additional capital investment while maintaining debt at sustainable levels. By 2026–27, the ratio is forecast to reach 55 per cent, a sustainable level which is less than the 2021–22 Budget estimate for 2023–24. The ratio in 2023–24 has been revised down to 20 per cent, a 37 percentage point reduction compared to the 2021–22 Budget estimate for 2023–24.
56
Budget Strategy and Outlook 2023-24
| Chart 3.1 | Ratio of general government net debt to revenue |
The downwards revisions to borrowings and net debt since the 2021–22 Budget are the result of prudent management of the significant, but short term, revenue uplifts experienced over progressive budget cycles. Borrowings increase over the forward estimates to fund the 4-year capital program, but the buffer created by recent debt reductions means that by 2026–27, the net debt to revenue ratio remains lower than the 2021–22 Budget estimates for 2023–24.
Queensland’s net debt to revenue ratio of 20 per cent in 2023–24 compares favourably to that of its peers. The net debt to revenue ratio in 2023–24 is 90 per cent for New South Wales (2023 Pre-election Budget Update) and 152 per cent for Victoria (2023–24 Budget).
Fiscal Principle 2 – Ensure that average annual growth in General Government Sector expenditure in the medium term is below the average annual growth in General Government Sector revenue to deliver fiscally sustainable operating surpluses.
Fiscal Principle 2 provides a broad measure of expense growth management. Maintaining a lower rate of expenses growth than revenue growth will in general ensure the restoration of an operating surplus and assist debt stabilisation. In the 2023–24 Budget, revenue growth over the forward estimates continues to be affected by temporary factors causing significant volatility. Across the 4 years from 2022–23 to 2026–27, the average annual revenue growth is lower than expenses growth reflecting the short-term strength of royalty revenue. While royalties have been boosted in the last few years by high commodity prices, they are expected to normalise to around a third of 2022–23 levels by 2025–26. An adjusted measure removing royalties is therefore reported to better reflect underlying growth.
57
Budget Strategy and Outlook 2023-24
Excluding royalties revenue, revenue growth is expected to be 3.5 per cent on average across the 4 years to 2026–27, compared to expenses growth of 3.1 per cent. Over the 5 years to 2026–27, growth of 4.1 per cent is expected for revenue excluding royalties and land rents compared to 4.0 per cent for expenses.
Fiscal Principle 3 – Target continual improvements in net operating surpluses to ensure that, in the medium term, net cash flows from investments in non-financial assets (capital) will be funded primarily from net cash inflows from operating activities. The capital program will focus on supporting a productive economy, jobs, and ensuring a pipeline of infrastructure that responds to population growth.
Maintaining a capital program that will support services and jobs and enhance the productive capacity of the economy is a key priority. The $88.729 billion capital program includes additional investment in major transformative projects as well as providing the critical infrastructure that is required to support service delivery, in a challenging environment of escalating cost pressures.
Volatility in revenue growth combined with the profile of capital expenditure, which is uneven by nature, means a degree of volatility can be expected in the outcomes for Fiscal Principle 3 on an individual year basis. In 2022–23, net cash inflows from operating activities greatly exceed investments in non-financial assets. The ratio reduces to 23 per cent in 2023–24 and is expected to reach 42 per cent in 2026–27. On average across the period 2022–23 to 2026–27, 62 per cent of the capital program will be funded from net cash inflows from operating activities.
| Chart 3.2 | Share of General Government Sector investments in non-financial assets funded from operating cash surpluses |
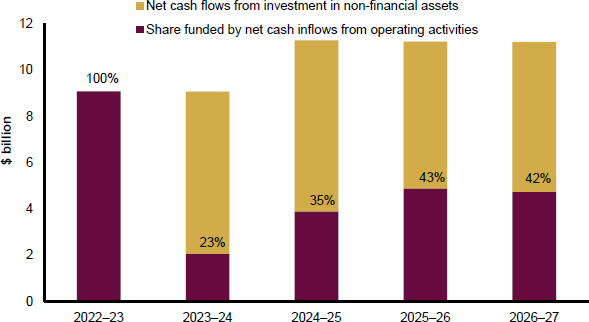
58
Budget Strategy and Outlook 2023-24
Fiscal Principle 4 – Maintain competitive taxation by ensuring that, on a per capita basis, Queensland has lower taxation than the average of other states.
This principle directly measures Queensland’s competitiveness relative to other jurisdictions, providing a meaningful indication of the comparative impact of Queensland’s tax regime and policies.
Based on the latest available outcomes, Queensland’s taxation per capita was $720 less than the average of other jurisdictions in 2021–22. On average, Queenslanders paid $1,087 less tax than New South Wales residents and $928 less than Victorian residents.
Using the latest forecasts, Queensland’s taxation per capita of $3,966 in 2023–24 compares favourably to the average of other jurisdictions of $4,507 per capita. Chart 3.3 demonstrates that Queensland is expected to maintain a highly competitive tax environment.
| Chart 3.3 | Taxation per capita, Queensland and other states and territories |
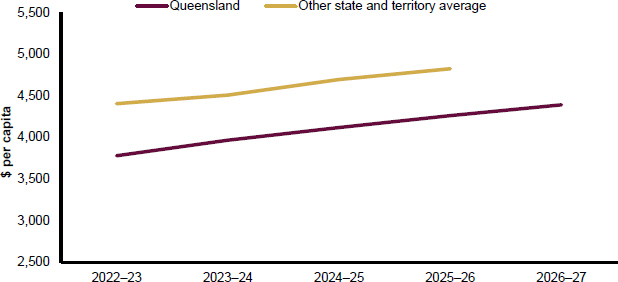
Fiscal Principle 5 – Target the full funding of long-term liabilities such as superannuation and workers’ compensation in accordance with actuarial advice.
The full funding of superannuation and other long-term liabilities is a long-standing Queensland Government priority and a key element of Queensland’s financial management. The commitment to this principle continued through the economic and fiscal recovery from the COVID-19 crisis, and it remains part of the long-term fiscal strategy.
The triennial actuarial investigation of the Defined Benefit Fund as at 30 June 2021 found it to be in surplus. As at 30 June 2022, WorkCover Queensland was fully funded.
59
Budget Strategy and Outlook 2023-24
The key fiscal aggregates for the 2023–24 Queensland Budget are outlined in Table 3.1.
| Table 3.1 | Key fiscal aggregates1 |
| | | | | | | | | | | | | | | | | | | | | | | | | | | | |
| | | 2021–22
Outcome
$ million | | | 2022–23
Budget
$ million | | | 2022–23
Est. Act.
$ million | | | 2023–24
Budget
$ million | | | 2024–25
Projection
$ million | | | 2025–26
Projection
$ million | | | 2026–27
Projection
$ million | |
Revenue | | | 74,185 | | | | 73,886 | | | | 87,623 | | | | 82,079 | | | | 82,102 | | | | 82,858 | | | | 85,591 | |
Expenses | | | 69,889 | | | | 74,915 | | | | 75,317 | | | | 84,261 | | | | 81,967 | | | | 82,653 | | | | 85,214 | |
Net operating balance | | | 4,296 | | | | (1,029 | ) | | | 12,305 | | | | (2,182 | ) | | | 135 | | | | 206 | | | | 377 | |
PNFA2 | | | 7,889 | | | | 8,478 | | | | 9,194 | | | | 9,347 | | | | 11,473 | | | | 11,417 | | | | 11,389 | |
Fiscal balance | | | (71 | ) | | | (5,635 | ) | | | 6,786 | | | | (6,716 | ) | | | (7,265 | ) | | | (5,977 | ) | | | (5,301 | ) |
Borrowing3 | | | 56,764 | | | | 66,459 | | | | 54,693 | | | | 65,479 | | | | 76,040 | | | | 85,127 | | | | 94,814 | |
Net debt | | | 10,997 | | | | 19,772 | | | | 5,852 | | | | 16,190 | | | | 28,074 | | | | 37,648 | | | | 46,934 | |
Notes:
| 1. | Numbers may not add due to rounding. Bracketed numbers represent negative amounts. |
| 2. | PNFA: Purchases of non-financial assets. |
| 3. | Comprised of borrowing with QTC, leases and similar arrangements and securities and derivatives. |
| 3.2.1 | Net operating balance |
Table 3.2 compares the General Government Sector net operating balance forecasts for the previous budget with the 2023–24 Budget forecasts.
| Table 3.2 | General Government Sector – net operating balance forecasts |
| | | | | | | | | | | | | | | | | | | | |
| | | 2022–23
$ million | | | 2023–24
$ million | | | 2024–25
$ million | | | 2025–26
$ million | | | 2026–27
$ million | |
2022–23 Budget | | | (1,029 | ) | | | (1,083 | ) | | | 137 | | | | 183 | | | | — | |
2023–24 Budget | | | 12,305 | | | | (2,182 | ) | | | 135 | | | | 206 | | | | 377 | |
Since the 2022–23 Budget, the General Government Sector net operating balance has improved substantially in 2022–23, from a deficit of $1.029 billion to a surplus of $12.305 billion. This improvement is attributable to significantly higher revenue, especially the temporary and unprecedented strength in coal royalties. The large operating surplus is reducing the 2022–23 borrowing requirement and creating capacity for a transformative capital program while maintaining debt at sustainable levels.
A deficit is expected for a single year in 2023–24 as revenues normalise and additional funding is required for priority areas, including temporary funding to alleviate cost-of-living pressures. The government’s cost-of-living relief measures in 2023–24 include $1.483 billion for additional electricity bill support to households and small businesses.
60
Budget Strategy and Outlook 2023-24
Continued revenue growth and prudent management of expenses means that Queensland remains on track to achieve a surplus in 2024–25, consistent with every forecast since the 2021–22 Budget. Continued surpluses are expected across the remainder of the forward estimates.
Queensland’s net operating surplus in 2022–23 contrasts with deficits of $12.0 billion for New South Wales (2023 Pre-election Budget Update) and $10.3 billion for Victoria (2023–24 Budget). While New South Wales and Queensland both expect to achieve an operating surplus in 2024–25, Victoria does not expect to return to a surplus until 2025–26.
| Table 3.3 | Reconciliation of net operating balance, 2022–23 Budget Update to 2023–24 Budget1 |
| | | | | | | | | | | | | | | | |
| | | 2022–23
$ million | | | 2023–24
$ million | | | 2024–25
$ million | | | 2025–26
$ million | |
2022–23 Budget Update net operating balance | | | 5,180 | | | | (458 | ) | | | 123 | | | | 220 | |
Taxation revisions2 | | | 1,436 | | | | 1,824 | | | | 1,832 | | | | 1,816 | |
Royalty revisions2 | | | 4,671 | | | | 1,556 | | | | 580 | | | | 558 | |
GST revisions | | | (104 | ) | | | (105 | ) | | | (244 | ) | | | (109 | ) |
Expense measures3 | | | (775 | ) | | | (3,277 | ) | | | (1,646 | ) | | | (1,476 | ) |
Natural disaster revisions (DRFA)4 | | | 370 | | | | 166 | | | | (243 | ) | | | (212 | ) |
Net flows from PNFC and PFC entities5 | | | (656 | ) | | | (442 | ) | | | (71 | ) | | | (254 | ) |
Australian Government funding revisions6 | | | 420 | | | | (547 | ) | | | (309 | ) | | | (83 | ) |
Other parameter adjustments7 | | | 1,764 | | | | (898 | ) | | | 112 | | | | (255 | ) |
2023–24 Budget net operating balance | | | 12,305 | | | | (2,182 | ) | | | 135 | | | | 206 | |
Notes:
| 1. | Numbers may not add due to rounding. Numbers indicate the impact on the operating balance. A number in brackets indicates a negative impact on the operating balance. |
| 2. | Taxation and royalty revisions exclude impact of revenue measures contained in Budget Paper 4 (BP4). |
| 3. | Reflects the operating balance impact of government expense measures since the 2022–23 Budget Update (refer to BP4 Chapter 2 Budget Measures for details) except for Natural disasters and Transport Service Contract measures which are included elsewhere in the reconciliation, as per footnotes 4 and 5. |
| 4. | Net impact of Disaster Recovery Funding Arrangements. |
| 5. | Represents revisions to dividends and tax equivalent payments from, and community service obligations (CSOs) and Transport Service Contract (TSC) payments to, Public Non-financial Corporations and Public Financial Corporations, net of CSO and TSC expense measures. |
| 6. | Represents the net impact of funding provided by the Australian Government primarily for Specific Purpose Payments and National Partnership payments and excludes funding for disaster recovery expenses. |
| 7. | Refers to adjustments largely of a non-policy nature, primarily changes in interest paid on borrowings, depreciation, swaps, lapses and deferrals. |
61
Budget Strategy and Outlook 2023-24
Impact of disaster recovery on the net operating balance
Significant flood events in the 2021–22 and 2022–23 disaster season have meant that related expenses and the impact of Australian Government payments for Disaster Recovery Funding Arrangements (DRFA) materially affect the net operating balance. Box 3.1 details the financial impact of the flood events and reports on progress on initiatives to support community recovery and resilience. Table 3.4 details the impact of disaster expenses and DRFA on the net operating balance. While disaster expenses of $4.447 billion are expected in total over the forward estimates, the majority is offset by $3.356 billion disaster related revenue.
| Table 3.4 | Impact of disaster funding on the net operating balance1,2 |
| | | | | | | | | | | | | | | | | | | | |
| | | 2022–23
$ million | | | 2023–24
$ million | | | 2024–25
$ million | | | 2025–26
$ million | | | 2026–27
$ million | |
Net Operating Balance | | | 12,305 | | | | (2,182 | ) | | | 135 | | | | 206 | | | | 377 | |
less Disaster revenue | | | 623 | | | | 1,849 | | | | 884 | | | | — | | | | — | |
add Disaster expenses | | | 1,099 | | | | 1,728 | | | | 1,316 | | | | 212 | | | | 92 | |
Underlying Net Operating Balance | | | 12,781 | | | | (2,303 | ) | | | 567 | | | | 418 | | | | 469 | |
Disaster capital expenditure | | | 138 | | | | 268 | | | | 270 | | | | 234 | | | | — | |
Notes:
| 1. | Numbers may not add due to rounding. |
| 2. | The disaster revenue and expenditure shown above include estimates from events prior to 2022–23 and so exceed estimates for those occurring in the summer of 2022–23. |
| Box 3.1 | 2022–23 Disaster Season |
The summer of 2022–23 has seen the state impacted by 7 disaster events, including long-term and record-breaking flooding in North West Queensland that forced evacuations and isolated already remote townships, including Burketown, Doomadgee and Urandangi.
Of Queensland’s 77 local government areas, 55 have been activated for joint State-Commonwealth Disaster Recovery Funding Arrangements (DRFA) assistance to provide support to individuals, families, businesses, primary producers and other organisations directly affected by the disasters.
Early indications suggest the cost of recovery and reconstruction from the flooding events under the DRFA for the summer of 2022–23 will be more than $500 million, coupled with complex recovery needs given the extended duration, scale of impact of the flooding, and remoteness of affected communities.
To support initial recovery, several extraordinary measures were immediately made available through the jointly funded DRFA, including personal hardship assistance for individuals and families, recovery grants for local governments, primary producers and small businesses, community mental health and coordinated livestock and carcass disposal support packages.
62
Budget Strategy and Outlook 2023-24
During 2022–23, the state continued to progress recovery following the devastating floods of 2021–22. Along with mobilisation of reconstruction efforts, the joint state and Australian Government $2.1 billion extraordinary assistance package was implemented to assist ongoing recovery, with a focus on the health, wellbeing, and resilience of communities, sustaining medium size businesses and tourism, restoring the environment, repairing community and recreational assets, supporting community development and ensuring essential public assets can be built back better. The total recovery and reconstruction cost for the 2021–22 disaster season is estimated at $4.5 billion.
A core component of the packages, the innovative $761.6 million Resilient Homes Fund has seen offers accepted for the voluntary buy-back of more than 350 homes at high risk of repeated flooding, and demolition commence of initial purchased properties.
The government will also provide additional funding of $152 million over 3 years for a suite of programs and projects selected in accordance with the Disaster Recovery Funding Arrangements Efficiencies Framework to enhance Queensland's disaster resilience, mitigate risk and create stronger and safer communities.
While the impact of the disaster events of 2021–22 and 2022–23 will be felt for many years across the entire state, efforts to build resilience and support community recovery mean that Queensland will be even better placed to handle future inevitable disasters.
General Government Sector revenue is estimated to total $87.623 billion in 2022–23, $13.437 billion higher than 2021–22. This is $13.736 billion higher than estimated in the 2022–23 Budget, driven largely by a $10.462 billion increase in royalties, reflecting the extraordinary strength in coal and oil prices across 2022 and early 2023. Taxes are also $1.721 billion higher, reflecting the strength of domestic economic activity and labour market performance, while GST has increased $586 million due primarily to a larger GST pool.
In 2023–24, royalties are expected to be $10.982 billion lower than in 2022–23, reflecting the expectation that currently elevated prices for coal and oil continue to return to levels more consistent with medium term expectations. In total, revenue is forecast to decline by $5.544 billion in 2023–24, with the decrease in royalties expected to be partially offset by a $2.095 billion increase in Australian Government grants, and a $1.080 billion increase in GST revenue.
In total over the 4 years to 2025–26, strong economic conditions and the temporary uplift to royalties means that General Government Sector revenue is forecast to be $30.994 billion, or 10 per cent, higher than forecast in the 2022–23 Budget.
63
Budget Strategy and Outlook 2023-24
| Chart 3.4 | Comparison of revenue forecasts |
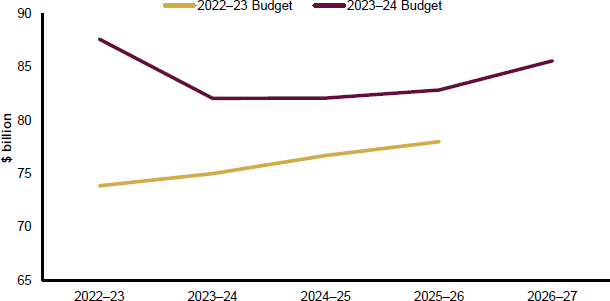
Further detail on revenues is provided in Chapter 4.
Expenses in the 2023–24 Queensland Budget reflect the government’s commitment to deliver better services to improve the lives of Queenslanders, support the state’s growing population and economic growth. Additional initiatives in the Budget are targeted to address areas of community need including support to alleviate cost-of-living pressures in 2023–24, while ensuring that fiscal targets, such as the achievement of an operating surplus in 2024–25, continue to be met.
On average, General Government Sector expenses are forecast to increase by 3.1 per cent per annum over the 4 years to 2026–27. Excluding the extraordinary impact of volatile royalty revenue, this is lower than the forecast annual increases in revenue of 3.5 per cent over the same period and is consistent with Fiscal Principle 2.
Key new initiatives in the Budget include:
| • | | an uplift of $2.888 billion in additional health operational growth funding over 5 years from 2022–23 to meet demand and cost pressures. This uplift will also support significant actions across the health system targeting improving ambulance responsiveness and reduce ramping, addressing pressures on emergency departments, reducing wait times for surgery and specialist clinics, as well as boosting women’s health care and mental health care |
| • | | $1.483 billion for additional electricity bill support to households and small businesses facing cost-of-living pressures |
| • | | $645 million over 4 years from 2023–24 to provide 15 hours per week of free kindergarten from January 2024 for all 4-year-old Queensland children |
64
Budget Strategy and Outlook 2023-24
| • | | $586.1 million towards a new 10-year agreement with LifeFlight Australia |
| • | | over $150 million over 5 years to provide temporary accommodation and to extend and enhance housing and homelessness services |
| • | | $96.2 million over 4 years and $17.9 million ongoing to continue the co-responder model to deal with or divert high risk young people, including to expand Youth Co-responder Teams into Toowoomba, Fraser Coast, Mount Isa, Ipswich and South Brisbane |
| • | | $16.3 million for a package of measures to support women’s economic security, including grants, training, and increased investment for women in male dominated industries, women in business and innovation and disadvantaged and vulnerable women. |
Employee expenses and certified agreements
Salaries and wages form a large proportion of General Government Sector expenses, with increases in salaries and wages negotiated through certified agreements. Maintaining an effective public service relies on attraction and retention strategies based on competitive remuneration and employment conditions. These need to be balanced with disciplined management of growth in operating expenses that supports fiscal sustainability and meeting fiscal goals in the medium term, particularly as employee expenses form a large proportion of General Government Sector expenses.
With the majority of public sector certified agreements nominally expiring during 2022 and 2023, the government established a public sector wages policy of 4 per cent headline wage increases in the first 2 years and 3 per cent in year 3, which recognises prevailing economic circumstances while keeping expenses growth sustainable. A Cost of Living Adjustment will also be payable where inflation exceeds headline wages increases established in agreements, capped at 3 per cent of base wages. Chapter 5 provides more detail on the public sector wages policy, superannuation arrangements and employee expenses.
Queensland’s total capital program has increased from an estimated $59.126 billion over the 4 years to 2025–26 in the 2022–23 Budget, to $88.729 billion over the 4 years to 2026–27. The updated capital program responds to a range of challenges that must be met to continue to support ongoing economic growth, meet renewable energy targets and ensure future prosperity while delivering the infrastructure that is needed to maintain critical services. Key areas of focus in the forward estimates period and over the medium term include:
| • | | transforming Queensland’s energy system through the Queensland Energy and Jobs Plan |
| • | | expanding the capacity of the health system, delivering the new infrastructure and increased number of beds to deliver better services |
| • | | safeguarding Queensland’s future water security and flood resilience |
| • | | delivering the infrastructure required to support the successful hosting of the Brisbane 2032 Olympic and Paralympic Games. |
65
Budget Strategy and Outlook 2023-24
As well as further progressing these key priority areas, the capital program must respond to unavoidable cost pressures in the current environment to ensure that critical infrastructure is provided when it is needed, and longer-term priorities remain on track. While growing demand for capital and constrained market conditions present a challenge for the capital program, continuing to deliver the infrastructure that is needed is a priority to support service delivery and avoid the potential negative economic consequences of not making necessary investments.
Queensland’s long-term capital planning provides a clear roadmap for the investment required to support growth. Sustainability risks (including environmental, social and governance factors) and Queensland’s sustainability priorities are an integral part of longer-term investment planning and budget decisions. This is detailed in Box 3.2.
Queensland Energy and Jobs Plan
The Queensland Energy and Jobs Plan (QEJP) outlines the state’s pathway to transform the energy system over the next 10 to 15 years to deliver clean, reliable, and affordable power, creating a platform for strong economic growth and continued investment.
The Plan charts an ambitious infrastructure investment pathway to 2035, including two large-scale pumped hydros in regional Queensland, 22 gigawatts of new renewable energy, and major new transmission lines across the state which will form Queensland’s SuperGrid.
In total, the 2023–24 Budget includes a landmark capital investment of around $19 billion across the forward estimates to support the QEJP.
The government’s publicly owned energy businesses are leading Queensland’s energy transformation, investing in new wind, solar, storage and transmission, supported by the $4.5 billion Queensland Renewable Energy and Hydrogen Jobs Fund.
To date, $2.7 billion has been allocated from the Fund. This includes $192.5 million towards Stanwell’s investment in the 252-megawatt (MW) Wambo Wind Farm near Dalby, and $776.1 million towards Stanwell’s 500 MW Tarong West Wind Farm near Kingaroy. CS Energy is being supported for renewables investments in Central Queensland, including $564 million from the Fund for wind developments.
The government has also allocated $300 million to CS Energy for energy projects supporting decarbonisation in Central Queensland as well as $500 million to CleanCo to support 2.3 gigawatts of renewables projects in Central Queensland.
Throughout the transformation, the government is committed to maintaining public ownership of energy assets and supporting impacted communities and workers through a range of initiatives, including a $150 million Job Security Guarantee Fund to support affected energy workers through the transformation.
66
Budget Strategy and Outlook 2023-24
Health capacity expansion
In the 2022–23 Budget, the Queensland Government provided a significant capital boost of $9.785 billion over 6 years to deliver around 2,200 additional overnight beds at 15 facilities across the Queensland health system. In 2023–24, Queensland Health will continue the delivery of this ambitious program, which has now awarded more than $3 billion of contracts to deliver expansions in Brisbane, Ipswich, Mackay, Logan, Townsville and Cairns.
Other major projects commencing or continuing during 2023–24 include:
| • | | opening all 7 Satellite Hospitals at Caboolture, Kallangur, Ripley, Eight Mile Plains, Tugun, Bribie Island and Redlands in 2023–24 |
| • | | completion of major expansions at Caboolture and Logan Hospitals |
| • | | $150 million for a new mental health facility as part of the staged expansion of Redland Hospital. |
Water capital expenditure
A significant capital program is planned by the Public Non-financial Corporations water sector over the 4 years to 2026–27 focused on delivering additional water supply and fortifying the flood resilience of water infrastructure. A major driver of this is Seqwater, Sunwater and Gladstone Area Water Board’s respective Dam Improvement Programs, which aim to ensure the safety and reliability of state-owned dams so they continue to operate safely during extreme weather events. In 2023–24, $155.8 million will be invested for planning and early works on improvements to Paradise, Burdekin Falls, Somerset, Wivenhoe, North Pine, Lake Macdonald and Awoonga dams.
Major projects commencing or continuing during 2023–24 include:
| • | | a further $440 million commitment, on top of an existing $100 million, has been provided towards Sunwater’s Burdekin Falls Dam Improvement and Raising Project, improving and raising the dam by two meters to further support water security |
| • | | progression of the $983 million Fitzroy to Gladstone Pipeline to provide long term water security to Gladstone’s large industrial base and its urban areas with $548.5 million in 2023–24 |
| • | | continued construction of the $568.9 million Rookwood Weir with Sunwater expected to spend a further $156.7 million in 2023–24 |
| • | | advancing planning and preconstruction activities on the $1.2 billion Paradise Dam Improvement Project, supported by $600 million commitments each from the Queensland and Australian Governments, with $116.4 million in 2023–24 |
| • | | the delivery of the $273.1 million Toowoomba to Warwick Pipeline, part of a more than $300 million investment into water security in the Toowoomba and Southern Downs regions with $13.4 million in 2023–24 |
| • | | progressing the $128.4 million Mount Crosby Flood Resilience Program to reduce the flood risk of critical bulk water infrastructure with $24.3 million in 2023–24 |
67
Budget Strategy and Outlook 2023-24
| • | | completion of the $95.2 million South West Pipeline connecting Beaudesert to the South East Queensland Water Grid with $24.4 million in 2023–24. |
Brisbane 2032 Olympic and Paralympic Games
The 2023–24 Queensland Budget includes funding to continue to support preparations for the Brisbane 2032 Olympic and Paralympic Games (Brisbane 2032).
The Budget has provisions for total capital expenditure for Brisbane 2032 venues infrastructure of $7.1 billion over 10 years. This venues infrastructure program is jointly funded by the Queensland and Australian Governments to support the hosting of Brisbane 2032. The allocation of funding for specific venues projects will be subject to government investment decisions following completion of project assessment activities.
The venues infrastructure program comprises the Brisbane Arena ($2.5 billion), the Gabba Redevelopment ($2.7 billion) and 16 new or upgraded venues under the Minor Venues Program ($1.9 billion). Of this, total forecast expenditure over 4 years to 2026–27 is $1.9 billion.
The Budget also includes $44 million as the state’s contribution to the University of Queensland’s proposed Paralympic Centre of Excellence as part of the Brisbane 2032 Legacy Plan. A further $154.7 million is provided over 4 years from 2024–25 for Economic Development Queensland to deliver public infrastructure to facilitate the development of services and land for the Brisbane Athlete Village.
Social housing
The 2023–24 Queensland Budget is providing increased funding of $1.1 billion for the delivery and supply of social housing across Queensland through the Housing and Homelessness Action Plan (2021–2025), including to meet higher construction costs and to boost the QuickStarts Queensland program target by 500 homes, bringing it to 3,265 social housing commencements by 30 June 2025.
At the Queensland Housing Summit in October 2022, the Queensland Government also boosted the Housing Investment Fund (HIF) to $2 billion. Under the expanded HIF, $130 million per annum is available to support an increased target of 5,600 new social and affordable home commencements by 30 June 2027.
This brings the total investment in social housing to $5 billion for delivery of social and affordable housing, and housing and homelessness support, including $3 billion funding to support the Housing and Homelessness Action Plan 2021–2025 and $2 billion investment for the Housing Investment Fund.
Support for service delivery
At the same time as delivering significant transformative investment projects, the capital program must continue to support growing service delivery needs. Other key capital investments in 2023–24 include:
68
Budget Strategy and Outlook 2023-24
| • | | $6.946 billion investment in transport infrastructure. This includes $829.2 million to continue construction work on Cross River Rail, $200 million to commence the Queensland Train Manufacturing Program and substantial ongoing investment to fund major upgrades to the M1 Pacific Motorway, the Bruce Highway and continuing the construction of Stage 3 of the Gold Coast Light Rail |
| • | | $1.5 billion to ensure that facilities in Queensland’s state schools are world class and continue to meet demand and support contemporary learning requirements. Investment in new schools is being facilitated through the $3 billion Building Future Schools Fund. |
Further information about the government’s capital program is provided in the Capital Statement (Budget Paper 3).
| Box 3.2 | Environmental, Social and Governance Credentials |
The Queensland Government recognises that establishing and maintaining strong environmental, social, and governance (ESG) credentials is central to achieving sustainable development outcomes and driving the future competitiveness of Queensland business and industry.
In this context, the government is cognisant of identifying and mitigating potential sustainability risks, including through proactive actions and investments to enhance Queensland’s strong ESG standards.
Sustainability risks describe ESG factors that can materially impact the community, economy and government.
Increased community and financial market focus on understanding potential material impacts of ESG factors have arisen from heightened global integration and heightened awareness of the impacts of climate change.
Sound financial and risk management requires the government to recognise and manage all issues that can materially impact the Queensland economy and the government’s fiscal position.
Queensland has identified several material sustainability risks and is proactively implementing policy initiatives to manage them.
69
Budget Strategy and Outlook 2023-24
| | |
ESG Factor | | Policy initiatives taken to - |
| |
| Climate change | | Transition to a low carbon future, by lowering greenhouse gas emissions. Address the physical impacts arising from climate change by embedding adaption and resilience |
| |
| Natural capital | | Manage the balance of resources used between industry, the community and safeguarding the natural environment. This includes surface and underground water management, biosecurity, aquaculture, forestry management and environmental protection. |
| |
| Social | | Support an educated, healthy, and skilled community, through education, health services, social welfare, public order, diversity and opportunity, cyber security and safety. |
| |
Governance (Economic and fiscal) | | Provide robust frameworks that support Ministers and accountable officers to provide oversight and discharge their obligations. Strong economic and fiscal management is fundamental to achieving government’s objectives and good governance. |
The Queensland Government has embedded sustainability considerations into policy and budget settings to promote sustainable economic growth and development for better communities now and into the future. At the centre of this are Queensland’s sustainability priorities.
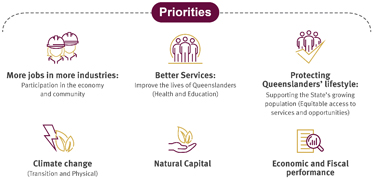
The state is advancing its Sustainability Priorities by leveraging Queensland's economic strengths and competitive advantages to drive a growing, innovative economy and job creation. Achievement of these sustainability priorities are at the centre of the state ESG credentials, one of the enablers of the state economic strategy.
70
Budget Strategy and Outlook 2023-24
Strong economic outcomes provide government with the fiscal capacity to take positive actions and deliver continued targeted investment in climate change transition, social services and reforms that strengthen communities and support vulnerable Queenslanders.
Positive action includes:
| • | | Queensland’s Economic Strategy to drive economic growth into the future |
| • | | maximising opportunities for Queensland’s economy and industries based on Queensland’s competitive and comparative advantages |
| • | | supporting innovation and new technology |
| • | | providing a Just Transition through assistance or support programs for impacted industries, workers and communities |
| • | | advancing social cohesion. |
By implementing initiatives that attract investment and promote innovation, as well as focusing on economic opportunities and enablers aligned with long-term sustainability goals, the government is building a prosperous and sustainable future.
The Good People, Good jobs: Queensland Strategy 2022–2032 will be central to ensuring the skills and capabilities of the state’s workforce are a critical economic enabler to realising the state’s economic opportunities.
The government is building a bigger Queensland to deliver an expansion to the health system, expansion to social and affordable housing, decarbonise the state’s energy system, improve water security and prepare for the Brisbane 2032 Olympic and Paralympic Games.
By supporting economic growth through enablers and settings that will improve Queensland’s productivity the state will deliver sustained increases in real wages and ease cost-of-living pressures over the longer term and support improved standards of living for all Queenslanders.
The Queensland Climate Action Plan 2030 outlines the state’s investments and actions to reach its emissions and renewable targets, create jobs and drive economic growth. This Budget backs the state’s ongoing decarbonisation agenda through funding of $520 million to deliver the Low Emissions Investment Partnerships program.
Sustainability risk management is a strategic imperative for the state, with transparency in reporting sitting at its core. The government’s proactive and transparent approach to the management of sustainability risks and opportunities is underpinned by its fiscal strategy and financial risk management framework.
The Queensland Government publishes an annual Queensland Sustainability Report which sets out how the government has established its priorities for and approach to managing sustainability risks, provides information on key policies being implemented and reports against performance measures.
71
Budget Strategy and Outlook 2023-24
| 3.2.5 | Borrowings and net debt |
Over successive budgets, the government has worked to limit the legacy impacts of the COVID-19 crisis on borrowings and fiscal sustainability. Prudent use of temporary revenue uplifts has gradually shifted 2022–23 net debt forecasts from 51 per cent of revenue in the 2021–22 Budget, to 27 per cent of revenue in the 2022–23 Budget, to just 7 per cent in this Budget. This represents a $27.474 billion reduction in expected General Government net debt in 2022–23 since the 2021–22 Budget.
The delivery of the government’s transformative capital program combined with ongoing global cost escalation means that borrowings will increase over the forward estimates period. However, the reductions to estimated debt that have been achieved in the near term mean that Queensland is well positioned to meet these challenges, with forecast debt levels that continue to compare well to peers. Forecast net debt of $37.648 billion in 2025–26 compares to $118.352 billion for New South Wales (2023 Pre-election Budget Update) and $162.202 billion for Victoria (2023–24 Budget).
| Chart 3.5 | State comparison of General Government Sector net debt |
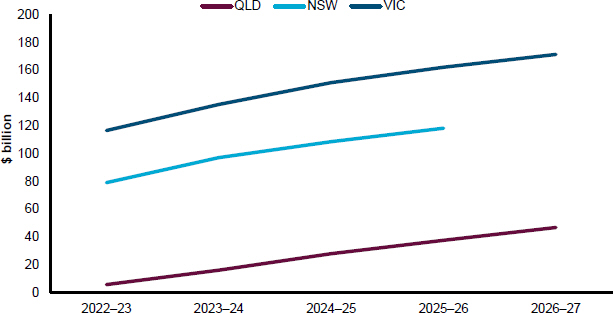
Source: 2023 Pre-election Budget Update for NSW, 2023–24 budgets for Queensland and Victoria.
Relative to revenue, Queensland’s net debt forecast of 45 per cent in 2025–26 compares to 102 per cent for New South Wales and 168 per cent for Victoria.
72
Budget Strategy and Outlook 2023-24
| Chart 3.6 | State comparison of General Government Sector net debt to revenue |
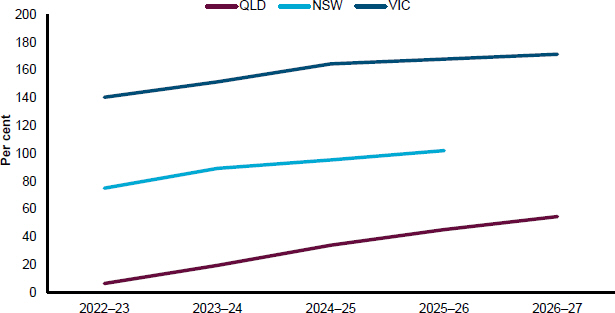
Source: 2023 Pre-election Budget Update for NSW, 2023–24 budgets for Queensland and Victoria.
Total General Government Sector borrowings are expected to be $8.745 billion lower at 30 June 2024 than forecast in the 2022–23 Budget and remain $2.158 billion lower by 30 June 2026. General Government Sector borrowings also compare well to interstate peers. Queensland’s forecast borrowings of $85.127 billion in 2025–26 are far lower than those of New South Wales ($187.490 billion, 2023 Pre-election Budget Update) and Victoria ($198.473 billion, 2023–24 Budget) in both absolute terms and as a percentage of revenue.
73
Budget Strategy and Outlook 2023-24
| Chart 3.7 | Interstate comparison of General Government Sector borrowings to revenue |

Source: 2023 Pre-election Budget Update for NSW, 2023–24 budgets for Queensland and Victoria.
Reductions to Queensland’s General Government Sector borrowings in the near term are particularly important in light of the risk of increasing debt servicing costs. Queensland’s lower levels of debt compared to other states means it is less exposed to future interest rate rises. While Queensland’s borrowing costs are increasing as borrowings increase to fund investment, the costs remain manageable. In 2023–24, General Government Sector interest expenses are expected to be around 2.4 per cent of revenue. By 2026–27, interest expenses are expected to increase to 4.1 per cent of revenue, which remains below the peak of 4.7 per cent in 2013–14 (Chart 3.8).
74
Budget Strategy and Outlook 2023-24
| Chart 3.8 | General Government Sector ratio of borrowing costs to revenue |
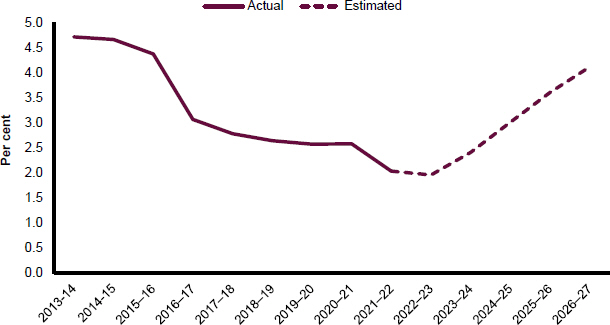
Queensland’s credit ratings
Queensland’s credit rating is stable with S&P Global (AA+), Moody’s (Aa1) and Fitch (AA+). Fitch upgraded Queensland’s rating from AA to AA+ in December 2021 driven by an upwards reassessment of the state’s risk profile to ‘Stronger’ and a debt sustainability score in the ‘a’ category. These ratings outcomes are supported by the diversity and strength of Queensland’s economy and effective financial management, including the government’s commitment to restoring a strong budgetary performance and maintaining borrowings at a sustainable level. The establishment of the Queensland Future Fund – Debt Retirement Fund also demonstrated a commitment to active debt management and supports Queensland’s credit rating.
In August 2022, Moody’s affirmed Queensland’s rating at Aa1 (stable), noting that Queensland’s credit strengths are its mature institutional framework and strong governance, which underpin fiscal strength and flexibility, and its large and diverse economic base. The stable outlook reflects that fiscal buffers have largely been rebuilt post-pandemic stimulus, and Moody’s expectation that the state’s economy will continue to underpin its capacity to service its debt burden.
S&P Global affirmed Queensland’s AA+ (stable) rating in April 2023, reflecting that the economy continues to outpace the national average and that liquidity remains exceptional even as debt levels rise due to infrastructure spending. Experienced financial management supports the ratings and delivery of the state’s capital program.
Fitch affirmed Queensland’s rating at AA+ (stable) in August 2022, reflecting their view that Queensland’s economy and fiscal performance will continue to recover from the disruption caused by the pandemic, including prudent economic and financial management and strong outcomes in the near term for commodity exports. Debt is expected to remain manageable as investment in key services increases borrowings.
75
Budget Strategy and Outlook 2023-24
| 3.2.6 | Emerging Fiscal Pressures |
Beyond general uncertainties related to budget parameters assumptions, key emerging fiscal issues include:
| • | | Native Title Compensation Settlement: the government has a potential liability with respect to compensation arising from acts that have extinguished or impaired native title since 1975 |
| • | | impacts of Australian Government changes to state shares of GST: risks to the longer-term outlook for Queensland’s GST revenue resulting from the changes made to the system of GST revenue distribution by the Australian Government in 2018. Further information on GST arrangements is provided in Box 4.6 |
| • | | adverse weather events are likely to occur in the future with the resulting damage expected to impact on the delivery of state initiatives, noting disaster-related expenses are shared with the Australian Government under DRFA |
| • | | challenges arising from delivering significant capital investment in the medium term, including the transformation of the energy system away from a reliance on coal-fired generation, meeting future water demand and providing drought contingency, and preparing to host the Brisbane 2032 Olympic and Paralympic Games. |
76
Budget Strategy and Outlook 2023-24
Features
| • | | The strength of the Queensland economy, including the state’s strong labour market performance, combined with the exceptionally high prices that have continued to be received by Queensland’s coal producers since late 2022, has resulted in higher than previously expected state revenues in 2022–23. |
| • | | However, as the extraordinary and temporary high coal prices normalise, total key state revenues (taxes, royalties and GST) are expected to decline substantially in 2023–24 and remain at more moderate levels across the later years of the forecast period. |
| • | | General Government Sector revenue is estimated to total $87.623 billion in 2022–23, up $13.437 billion (18.1 per cent) compared with 2021–22. This is $13.736 billion (18.6 per cent) higher than estimated in the 2022–23 Queensland Budget, with this upward revision largely driven by: |
| | • | | a $10.462 billion increase in royalties, reflecting the extraordinary strength in coal and oil prices across 2022 and early 2023 |
| | • | | a $1.721 billion increase in taxation, reflecting the strength of domestic economic activity and the state’s exceptional jobs growth and labour market performance |
| | • | | a $586 million increase in GST, driven primarily by a larger national GST pool. |
| • | | In 2023–24, General Government Sector revenue is estimated to total $82.079 billion, a decrease of $5.544 billion (6.3 per cent) compared with 2022–23. This decline largely reflects a substantial decline in royalties, as the temporary surge in coal prices begins to unwind and return towards medium-term expectations. |
| • | | Total key revenues are then expected to grow by an average of 1.9 per cent over the 3 years to 2026–27, reflecting average annual growth in taxation of 5.0 per cent and GST of 1.0 per cent across that period. However, this growth in tax and GST is partially offset by an expected further decline in royalties as coal and oil prices continue to normalise. |
| • | | Australian Government payments to Queensland in 2023–24 are expected to total $39.3 billion, an increase of $3.175 billion (8.8 per cent) compared with payments in 2022–23. This includes an increase in GST revenue, which is expected to be 5.9 per cent higher than in 2022–23, due primarily to higher national GST collections. |
| • | | Importantly, Queensland is maintaining its competitive tax status, with per capita state tax estimated to be $720 below the average of other states and territories in 2021–22. |
| • | | The government has extended the payroll tax discount for regional employers into the longer term, out to 30 June 2030, and the 50 per cent payroll tax rebate on wages for apprentices and trainees until 30 June 2024. A package of land tax concessions is also being provided to eligible Build to Rent developments to help drive the provision of increased rental supply and affordable dwellings for Queenslanders. |
77
Budget Strategy and Outlook 2023-24
| 4.1 | 2022–23 Estimated actual |
General Government Sector revenue is estimated to be $87.623 billion in 2022–23, $13.736 billion (18.6 per cent) higher than forecast at the time of the 2022–23 Queensland Budget.
The substantial upward revision compared with the 2022–23 Queensland Budget estimate is largely driven by:
| • | | a $10.462 billion increase in royalties, reflecting higher-than-expected global coal and oil prices being received by Queensland’s key commodity producers |
| • | | a $1.721 billion increase in taxation revenue, reflecting the strength of domestic economic activity and the state’s exceptional jobs growth and labour market performance |
| • | | a $586 million increase in GST, driven primarily by a larger national GST pool. |
The total General Government Sector revenue expected in 2022–23 represents growth of 18.1 per cent compared with 2021–22.
Total key revenues of taxes, GST and royalties are estimated to be 26.8 per cent higher in 2022–23 compared with 2021–22, reflecting:
| • | | higher coal royalties, due to a sustained period of high global coal prices in combination with the new progressive coal royalty rates announced in the 2022–23 Queensland Budget, which ensure Queenslanders receive a fairer return on this valuable non-renewable resource during periods when coal producers are receiving extraordinary prices and revenues |
| • | | a 14.4 per cent increase in GST revenue, primarily driven by a larger national GST pool, reflecting the exceptional strength of consumption expenditure nationally. |
However, growth in key state revenues is expected to moderate significantly in later years from the strength seen in 2021–22 and 2022–23.
In particular, the substantial increases in royalties experienced in 2021–22 and 2022–23, due to the unprecedented high coal and oil prices, are only temporary and are not expected to be repeated over the forward estimates as coal and other commodity prices normalise.
| 4.2 | 2023–24 Budget and outyears |
General Government Sector revenue is forecast to decline by $5.544 billion (6.3 per cent) in 2023–24, to be $82.079 billion, as outlined in Table 4.1. This decline in revenue is:
| • | | due to a $10.982 billion fall in royalties, reflecting the expectation that the currently elevated prices for coal and oil return to levels more consistent with medium term expectations |
| • | | expected to be partially offset by a $2.095 billion increase in Australian Government grants, a $1.080 billion increase in GST revenue, and a $1.374 billion increase in taxation revenue. |
Total key revenues are forecast to decline by 14.9 per cent in 2023–24 as royalty revenue normalises.
78
Budget Strategy and Outlook 2023-24
In 2024–25, total key revenues are expected to begin to stabilise (declining by around 2 per cent) with an expected decline in GST revenue being offset by an expected increase in taxation revenue, due to modest ongoing growth in transfer duty and continued strength in the labour market supporting payroll tax. Following this period of adjustment, all key revenues are expected to grow in the years beyond 2024–25.
Chart 4.1 outlines the growth in revenue across the 3 key revenue streams and the share of growth attributable to each item across the period to 2026–27.
| Chart 4.1 | Annual growth in key revenues1 |
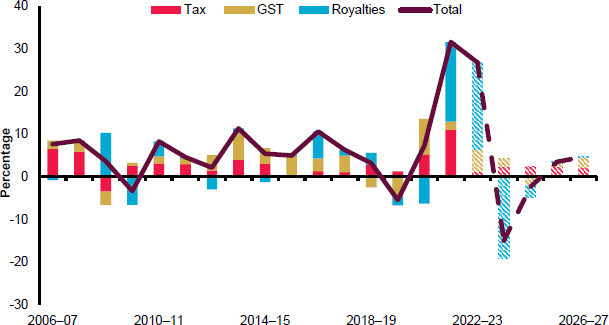
Note:
| 1. | Annual contribution to growth in key revenues. Total is the annual growth of the sum of the 3 categories. |
Taxation revenue is forecast to grow by 4.9 per cent per annum on average over the period 2021–22 to 2026–27. This reflects strong growth in land tax and payroll tax, along with the impact of revenue measures, including the mental health levy, introduced in the 2022–23 Queensland Budget. The growth profile for taxation revenue over this period also reflects the fact that transfer duty revenue is coming off a very high base in 2021–22, having more than doubled over the preceding 2 years as a result of the exceptional cyclical strength in property markets.
Royalties are expected to decline by 60.7 per cent in 2023–24, and then decline by a further 19.6 per cent in 2024–25. This reflects the expectation that coal and oil prices will return from recently elevated levels to more sustainable levels in 2024.
Royalties are then expected to grow by 1.7 per cent in 2025–26 and 0.9 per cent in 2026–27, primarily reflecting an expected modest increase in coal export volumes over time.
Queensland’s GST revenue is estimated to grow by 5.9 per cent in 2023–24 but then decline by 4.9 per cent in 2024–25, as the higher coal royalties received in 2022–23 are expected to lead to Queensland being assessed as requiring a lower share of the GST pool in later years.
79
Budget Strategy and Outlook 2023-24
However, overall GST revenue is still expected to grow slightly, by 2.2 per cent in 2025–26 and 6.0 per cent in 2026–27, largely driven by expected ongoing growth in the national GST pool, as outlined in the recent 2023–24 Federal Budget.
Table 4.1 details Queensland’s total General Government Sector revenue by component across the forward estimates period.
| Table 4.1 | General Government Sector revenue1 |
| | | | | | | | | | | | | | | | | | | | | | | | | | | | |
| | | 2021–22
Actual
$ million | | | 2022–23
Budget
$ million | | | 2022–23
Est. Act
$ million | | | 2023–24
Budget
$ million | | | 2024–25
Projection
$ million | | | 2025–26
Projection
$ million | | | 2026–27
Projection
$ million | |
Taxation revenue | | | 20,011 | | | | 18,842 | | | | 20,563 | | | | 21,938 | | | | 23,125 | | | | 24,285 | | | | 25,387 | |
Sales of goods and services | | | 5,896 | | | | 6,181 | | | | 6,344 | | | | 6,921 | | | | 6,969 | | | | 7,054 | | | | 6,871 | |
Interest income | | | 2,643 | | | | 2,847 | | | | 3,166 | | | | 3,206 | | | | 3,173 | | | | 3,116 | | | | 3,107 | |
Grants revenue | | | | | | | | | | | | | | | | | | | | | | | | | | | | |
GST revenue | | | 16,079 | | | | 17,811 | | | | 18,397 | | | | 19,477 | | | | 18,528 | | | | 18,927 | | | | 20,069 | |
Australian Government and other grants and contributions | | | 15,308 | | | | 14,561 | | | | 15,203 | | | | 16,467 | | | | 16,726 | | | | 16,756 | | | | 17,287 | |
Australian Government capital grants, other grants and contributions | | | 2,749 | | | | 2,870 | | | | 2,971 | | | | 3,699 | | | | 3,689 | | | | 3,254 | | | | 3,261 | |
Dividend and income tax equivalent income | | | | | | | | | | | | | | | | | | | | | | | | | | | | |
Dividends | | | 209 | | | | 928 | | | | 628 | | | | 970 | | | | 1,224 | | | | 1,212 | | | | 1,290 | |
Income tax equivalent income | | | 581 | | | | 572 | | | | 415 | | | | 551 | | | | 659 | | | | 644 | | | | 668 | |
Other revenue | | | | | | | | | | | | | | | | | | | | | | | | | | | | |
Royalties and land rents | | | 9,088 | | | | 7,832 | | | | 18,288 | | | | 7,318 | | | | 5,929 | | | | 6,032 | | | | 6,087 | |
Other | | | 1,623 | | | | 1,442 | | | | 1,649 | | | | 1,532 | | | | 2,079 | | | | 1,577 | | | | 1,563 | |
Total revenue | | | 74,185 | | | | 73,886 | | | | 87,623 | | | | 82,079 | | | | 82,102 | | | | 82,858 | | | | 85,591 | |
Note:
| 1. | Numbers may not add due to rounding. |
The major sources of total General Government Sector revenue in 2023–24 are grants revenue, which includes GST revenue and Australian Government Grants (48.3 per cent), and taxation revenue (26.7 per cent).
Chart 4.2 illustrates the expected composition of Queensland General Government Sector revenue in 2023–24.
80
Budget Strategy and Outlook 2023-24
| Chart 4.2 | Revenue by operating statement category, 2023–241,2 |
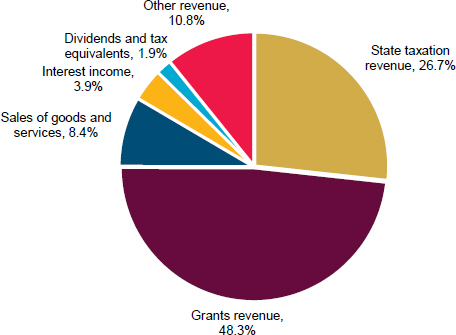
Notes:
| 1. | Numbers may not add up to 100 per cent due to rounding. |
| 2. | Chart prepared in line with Operating Statement categories. ‘Other revenue’ includes royalties and land rents, which comprise 8.9 per cent of total revenues. |
General practitioner payroll tax amnesty
Medical practices are liable to pay payroll tax on payments made to contracted general practitioners (GPs) unless an exemption applies.
An amnesty is being provided to qualifying medical practices, otherwise liable to pay payroll tax on payments made to contracted GPs, up to 30 June 2025 and for the previous 5 years (i.e. 2018 to 2025). The amnesty recognises a potential lack of awareness of the payroll tax treatment of contractors among GPs and the need to support these practices to come into compliance with the least disruption possible.
The additional payroll tax revenue which may have been recovered in absence of the amnesty is estimated to be up to $100 million per annum during the amnesty period.
81
Budget Strategy and Outlook 2023-24
Extension of payroll tax discount for regional employers
In the 2019–20 Queensland Budget, the government introduced a one per cent discount on the payroll tax rate for employers that had an ABN registered business address in regional Queensland and at least 85 per cent of their taxable wages paid to employees located outside South East Queensland. Accordingly, a reduced tax rate of 3.75 per cent or 3.95 per cent, as applicable, applied to those businesses.
This measure was set to expire in June 2023. However, the government has committed to continue this initiative over the longer term to ensure that vital support for jobs and growth across regional Queensland is maintained. Accordingly, this measure has been extended for 7 years, until 30 June 2030, to provide certainty to regional businesses until the end of the decade.
It is estimated this initiative will result in total tax relief of $505.4 million over the 4 years ending 2026–27, supporting more than 3,400 regional Queensland businesses.
Extension of 50 per cent apprentice and trainee payroll tax rebate
The 50 per cent payroll tax rebate for wages paid to apprentices and trainees will be extended for 12 months until 30 June 2024. In addition to apprentice and trainee wages generally being exempt from payroll tax, this rebate provides additional support for businesses supporting youth employment and businesses who employ trainees and apprentices.
It is estimated this initiative will result in tax relief of $48.6 million for Queensland businesses employing trainees and apprentices in 2023–24.
| Box 4.1 | Ongoing payroll tax relief to support employment and regional businesses |
As part of the Queensland Government’s commitment to support businesses across regional Queensland, as well as supporting apprentice and trainee opportunities across the state, the 2023–24 Queensland Budget includes 2 key payroll tax relief measures that will deliver substantial savings to thousands of Queensland businesses.
The Regional Payroll Tax Discount, which supports regional businesses and employment by reducing costs for regional businesses and incentivising regionally-based businesses to hire local employees, will be extended over the long term to 30 June 2030.
This discount is available to all eligible employers regardless of their taxable wage levels and across all industries and sectors. It helps support regional businesses across all industries, including mining, agriculture and manufacturing through to education, retail trade and services.
Businesses eligible for the discount operate across regional Queensland and, importantly, the vast majority of benefitting businesses (around 75 per cent of eligible businesses) are businesses with annual wages of less than $6.5 million.
82
Budget Strategy and Outlook 2023-24
Since the introduction of the regional discount in 2019, the unemployment rate has reduced substantially across regional Queensland, with the average unemployment rate across Queensland’s regions outside South East Queensland being 3.9 per cent as at April 2023.
The continuation of the regional discount will continue to support these employment gains and create further job opportunities across regional economies.
The 50 per cent Apprentice and Trainee Rebate, which applies in addition to the exemption of apprentice and trainee wages from payroll tax, has been extended to 30 June 2024.
The extension of the rebate to reduce costs for businesses across the state that employ apprentices and trainees aligns with the government’s broader objectives of supporting youth engagement in employment, skills and education, and will also help to address skills shortages across industries, including in trades and hospitality.
The Apprentice and Trainee Rebate also complements the broad suite of other Queensland Government support provided to drive enhanced employment outcomes for apprentices and trainees, including youth. This includes:
| • | | the revitalised Back to Work Program, which provides support payments to employers engaging unemployed jobseekers. This includes a Youth Boost payment of up to $20,000 for employers who hire an eligible jobseeker aged between 15-24 years |
| • | | free apprenticeships for under 25s, which contributes to the cost of training for priority apprentice and trainee qualifications |
| • | | a travel and accommodation allowance of up to 26 cents per kilometre for travel and $40 to $76 per night for accommodation, for apprentices and trainees that need to travel greater than 100km for work |
| • | | workers compensation discounts for firms that hire apprentices. |
Build to Rent
Following the Queensland Government’s Housing Roundtable on 28 March 2023, the government announced a proposal to provide tax concessions for Build to Rent developments that provide at least 10 per cent of dwellings as affordable housing, at a discounted rent.
This initiative, to commence from 1 July 2023, will help support the delivery of an enhanced supply of rental dwellings across the state, including more affordable housing for Queenslanders.
83
Budget Strategy and Outlook 2023-24
The Queensland Government’s Build to Rent tax concessions will deliver more affordable housing for more Queenslanders by supporting Build to Rent developments that provide at least 10 per cent of dwellings as affordable housing at discounted rents.
Discounted rents will need to be provided at least 25 per cent below market rents of similar dwellings in the Build to Rent development to qualify.
The initiative will commence from 1 July 2023 and will be available to eligible Build to Rent developments across the state.
Eligible Build to Rent developments will be able to benefit from the following tax concessions:
| • | | 50 per cent reduction in the taxable value of land for land tax, for land used for a Build to Rent development, up to a maximum term of 20 years |
| • | | 100 per cent reduction in the taxable value of land for land tax foreign surcharge for land used for a Build to Rent development up to a maximum term of 20 years |
| • | | 100 per cent discount on any additional foreign acquirer duty for land for a Build to Rent development. |
The tax concessions will be made available for a maximum term of 20 years or until 30 June 2050 (whichever comes sooner).
Concessions will only be available once a development is operational, noting eligible developments must be operational by 30 June 2030 to qualify for the concessions.
To be eligible, a Build to Rent development must provide at least 50 self-contained dwellings and be owned under a unified ownership structure and managed by a single entity.
Tenants eligible for the discounted rent will need to meet appropriate income and asset tests, which will include:
| • | | a household income test based on average weekly full-time adult total earnings in Queensland, published by the Australian Bureau of Statistics for May each year |
| • | | a household’s asset wealth cannot exceed 25 per cent of a benchmark set with reference to Services Australia pension assets test for non-homeowners. |
Queensland Revenue Office compliance and debt recovery
The 2023–24 Queensland Budget provides funding for the Queensland Revenue Office (QRO) to continue and establish key compliance and debt recovery measures. These comprise a range of activities that both support taxpayers to understand and meet their obligations and enforce compliant behaviour through audits, investigations and escalated enforcement actions.
84
Budget Strategy and Outlook 2023-24
These measures build community confidence in the fairness and equity of tax administration and, by safeguarding key state revenues, will help deliver better services and critical infrastructure for Queenslanders, including enabling the ongoing funding of investments in new hospitals, schools, road upgrades and essential services across the state.
| 4.4 | Revenue by operating statement category |
Chart 4.3 outlines the composition of estimated state taxation revenue for 2023–24, with the largest sources being payroll tax and transfer duty, together representing 54.3 per cent of the state’s total taxation revenue.
Payroll tax generally has a relatively stable base, with its growth usually driven by the underlying strength of the economy and how this feeds through to employment and wages growth. Transfer duty can be much more variable, reflecting pronounced cyclical residential and non-residential market conditions.
Land tax growth can also reflect variability in the property market, such as the material increases in land values seen in recent years, but is generally more stable than most other tax lines due to the relatively stable base and assessments being based on 3-year average of land values, which helps mitigate the impact of increasing land values.
85
Budget Strategy and Outlook 2023-24
| Chart 4.3 | State taxation by tax category, 2023–241 |
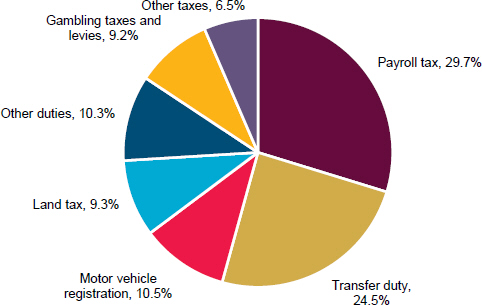
Note:
| 1. | Percentages may not add to 100 per cent due to rounding. ‘Other duties’ includes vehicle registration duty, insurance duty and other minor duties. ‘Other taxes’ includes the emergency management levy, waste disposal levy, guarantee fees and other minor taxes. ‘Payroll tax’ includes the mental health levy. |
Table 4.2 shows the main components of taxation revenue and the forecast revenues for each component across the forward estimates.
86
Budget Strategy and Outlook 2023-24
| Table 4.2 | State taxation revenue1 |
| | | | | | | | | | | | | | | | | | | | | | | | |
| | | 2021–22 | | | 2022–23 | | | 2023–24 | | | 2024–25 | | | 2025–26 | | | 2026–27 | |
| | | Actual | | | Est. Act | | | Budget | | | Projection | | | Projection | | | Projection | |
| | | $ million | | | $ million | | | $ million | | | $ million | | | $ million | | | $ million | |
Payroll tax | | | | | | | | | | | | | | | | | | | | | | | | |
Payroll tax | | | 5,001 | | | | 5,690 | | | | 6,122 | | | | 6,491 | | | | 6,872 | | | | 7,272 | |
Mental health levy | | | 0 | | | | 184 | | | | 402 | | | | 422 | | | | 443 | | | | 466 | |
Total payroll tax | | | 5,001 | | | | 5,874 | | | | 6,524 | | | | 6,913 | | | | 7,315 | | | | 7,738 | |
Duties | | | | | | | | | | | | | | | | | | | | | | | | |
Transfer | | | 6,336 | | | | 5,209 | | | | 5,385 | | | | 5,607 | | | | 5,877 | | | | 6,166 | |
Vehicle registration | | | 703 | | | | 782 | | | | 786 | | | | 809 | | | | 834 | | | | 859 | |
Insurance2 | | | 1,219 | | | | 1,360 | | | | 1,428 | | | | 1,500 | | | | 1,575 | | | | 1,653 | |
Other duties3 | | | 40 | | | | 70 | | | | 41 | | | | 41 | | | | 42 | | | | 42 | |
Total duties | | | 8,298 | | | | 7,422 | | | | 7,640 | | | | 7,957 | | | | 8,328 | | | | 8,720 | |
Gambling taxes and levies | | | | | | | | | | | | | | | | | | | | | | | | |
Gaming machine tax | | | 851 | | | | 999 | | | | 1,001 | | | | 1,031 | | | | 1,062 | | | | 1,094 | |
Health services levy | | | 117 | | | | 160 | | | | 161 | | | | 173 | | | | 187 | | | | 202 | |
Lotteries taxes | | | 381 | | | | 394 | | | | 418 | | | | 443 | | | | 470 | | | | 498 | |
Wagering taxes | | | 160 | | | | 216 | | | | 266 | | | | 273 | | | | 280 | | | | 288 | |
Casino taxes and levies | | | 112 | | | | 130 | | | | 142 | | | | 147 | | | | 152 | | | | 158 | |
Keno tax | | | 23 | | | | 28 | | | | 28 | | | | 29 | | | | 30 | | | | 31 | |
Total gambling taxes and levies | | | 1,645 | | | | 1,927 | | | | 2,015 | | | | 2,096 | | | | 2,182 | | | | 2,271 | |
Other taxes | | | | | | | | | | | | | | | | | | | | | | | | |
Land tax | | | 1,633 | | | | 1,777 | | | | 2,031 | | | | 2,280 | | | | 2,416 | | | | 2,471 | |
Motor vehicle registration | | | 2,103 | | | | 2,186 | | | | 2,301 | | | | 2,398 | | | | 2,499 | | | | 2,589 | |
Emergency management levy | | | 604 | | | | 629 | | | | 660 | | | | 687 | | | | 716 | | | | 745 | |
Waste disposal levy | | | 348 | | | | 390 | | | | 423 | | | | 453 | | | | 477 | | | | 496 | |
Guarantee fees | | | 333 | | | | 318 | | | | 311 | | | | 307 | | | | 319 | | | | 322 | |
Other taxes4 | | | 45 | | | | 41 | | | | 32 | | | | 34 | | | | 34 | | | | 35 | |
Total taxation revenue | | | 20,011 | | | | 20,563 | | | | 21,938 | | | | 23,125 | | | | 24,285 | | | | 25,387 | |
Notes:
| 1. | Numbers may not add due to rounding. |
| 2. | Includes duty on accident insurance premiums. |
| 3. | Includes duty on life insurance premiums. |
| 4. | Includes the statutory insurance scheme levy and nominal defendant levy. |
87
Budget Strategy and Outlook 2023-24
Payroll tax
Payroll tax revenue is estimated to total $5.690 billion in 2022–23, $689.4 million (13.8 per cent) higher than in 2021–22, driven by stronger than expected employment and wages growth.
Payroll tax is expected to grow by 7.6 per cent in 2023–24, with average annual growth of around 5.9 per cent then forecast over the 3 years ending 2026–27. This reflects expected ongoing solid employment and wages growth over the forward years.
Queensland’s payroll tax exemption threshold of $1.3 million is one of the highest of all jurisdictions, meaning most Queensland small businesses are not liable for payroll tax, while the standard rate of 4.75 per cent is one of the lowest rates of all jurisdictions. For comparison, New South Wales currently has an exemption threshold of $1.2 million and a standard rate of 5.45 per cent, while Victoria has an exemption threshold of $700,000 and a standard rate of 4.85 per cent. Further, Queensland offers a one percentage point discount for eligible regional employers.
There is also a deduction available for employers between the exemption threshold of $1.3 million and the current deduction threshold of $10.4 million in annual Australian taxable wages, that reduces the amount of tax payable between this wage range. The deduction was extended to the $10.4 million ceiling in the 2022–23 Queensland Budget, increasing substantially from the previous $6.5 million ceiling, benefitting an estimated 12,000 Queensland businesses.
Mental health levy
The mental health levy was announced in the 2022–23 Queensland Budget in order to provide a sustainable funding source to enhance the provision of mental health services and investment.
The levy only applies to large businesses with national payrolls of more than $10 million, with those businesses paying a 0.25 per cent levy on taxable wages above $10 million. Very large businesses with national payrolls of more than $100 million pay an extra 0.5 per cent levy on wages above $100 million.
The levy commenced from 1 January 2023 and, as such, 2022–23 revenue reflects only half a year of revenues following its implementation. Mental health levy revenue in 2022–23 is estimated at $184 million, consistent with expectations at the 2022–23 Budget Update. Over the forward estimates, mental health levy revenue is expected to grow largely in line with broader payroll tax growth.
88
Budget Strategy and Outlook 2023-24
| Box 4.3 | Mental health levy funding investment in Queenslanders’ wellbeing |
Many Queenslanders experience mental ill health, problematic alcohol and other drug use and mental health crisis in their lifetime. These issues impact individuals, families and communities.
In recognition of this, the government provided $1.645 billion in the 2022–23 Budget to support the implementation of mental health, alcohol and other drug (MHAOD) and suicide prevention services across the state.
Delivering on the recommendations of the Mental Health Select Committee, in its report to Parliament – Report No.1, 57th Parliament – Inquiry into the opportunities to improve mental health outcomes, a mental health levy on large businesses began 1 January 2023.
Funds raised through the levy are used to provide services or infrastructure that supports mental health, pursuant to the Mental Health Act 2016 and the Queensland Mental Health Commission Act 2013.
Funding has already started to roll-out to MHAOD services with 2022–23 expenditure as at 25 May 2023 including initiatives such as:
| • | | $10.9 million for whole of government action on the social determinants of mental health and wellbeing, including improving access to improved tenancy sustainment and expanded employment opportunities for people with MHAOD issues |
| • | | $11.0 million for a new perinatal mental healthcare centre being established at Mater Hill |
| • | | $7.7 million for new and existing mental health co-responder model with Queensland Ambulance Service |
| • | | $3.5 million to deliver improved services with First Nations peoples. |
Additional support for MHAOD from 2023–24 will include:
| • | | $150 million for a new mental health facility at the Redland Hospital, which will almost double mental health capacity and free up critical land on the hospital site for potential future expansion |
| • | | $67.8 million over 5 years to expand existing and establish new Crisis Support Spaces, offering an alternative to the emergency department for people experiencing mental distress and/or suicidality. Home-like environments will be designed at 11 additional hospital campuses, available by the end of 2024 |
| • | | $45.1 million increase over 5 years to the Head to Health services. This will establish 12 new adult services (including Cairns, Bundaberg, Rockhampton, Logan, and the Redlands) and 2 new children’s services (opening in the Gold Coast and Brisbane, to also service the Logan-Beaudesert and Moreton Bay regions) |
89
Budget Strategy and Outlook 2023-24
| • | | $44.5 million over 5 years to provide consultation liaison and specialist MHAOD clinical in-reach services to all headspace centres, providing free health services for young people aged 12 to 25 years |
| • | | Through this significant investment, supported by the mental health levy, the government is continuing its momentum to improve mental health and wellbeing outcomes for Queenslanders by transforming, optimising and growing state funded MHAOD treatment, care and support and responses to mental health crisis and suicidality. |
Duties
Transfer duty
Transfer duty is charged on ‘dutiable transactions’, including transfers of land in Queensland or Queensland business assets.
The Queensland Government offers extensive concessions for the transfer of property where the property is purchased as a home. This means eligible home buyers pay a one per cent concessional rate on the first $350,000 of dutiable value, rather than the normal scheduled rates of between 1.5 per cent and 3.5 per cent.
If a first home buyer purchases a property valued at $500,000 or under they will pay no duty, with reduced rates available up to $550,000.
Queensland’s transfer duty settings compare favourably to other jurisdictions. For a home buyer purchasing a principal place of residence reflecting median capital city dwelling prices as at May 2023, they would pay around $24,000 less transfer duty in Queensland than if they purchased in New South Wales, and around $22,000 less transfer duty than if they purchased in Victoria.
Transfer duty revenue is estimated to be 17.8 per cent lower in 2022–23 compared with 2021–22, reflecting a significant moderation in both residential and non-residential activity since 2021–22. Modest growth of 3.4 per cent is forecast in 2023–24 as housing market activity begins to stabilise. However, in the context of recent and potential future increases in interest rates, the size and timing of impacts on housing markets remain uncertain.
After declining in 2022–23, house prices are expected to return to modest growth across 2023–24 and 2024–25, and transaction volumes are also expected to return to be more in line with pre-2020–21 levels. The combination of these factors, along with ongoing recovery in the non-residential sector, is supporting an expected average annual growth of 4.6 per cent in transfer duty over the 3 years ending 2026–27.
Vehicle registration duty
Vehicle registration duty applies to applications to register or transfer a vehicle. Duty is imposed on the dutiable value, with the applicable rate dependent on the type of vehicle. An additional amount of registration duty is imposed on applications to register or transfer vehicles (other than special vehicles or heavy vehicles) with a dutiable value of more than $100,000.
90
Budget Strategy and Outlook 2023-24
Revenue from vehicle registration duty in 2022–23 is expected to be 11.2 per cent higher than in 2021–22, driven by the continued strength in vehicle sales in line with the high levels of broader consumption expenditure experienced as part of the recovery from COVID-19.
Vehicle registration duty is expected to remain relatively flat in 2023–24, due to rising interest rates and broader cost-of-living pressures, but is then forecast to grow by around 3 per cent per annum over the 3 years ending 2026–27.
Land tax
Land tax is imposed on the taxable value of a landowner’s aggregated holdings of freehold land owned in Queensland as at 30 June each year. The landowner’s home and some other specified types of landholdings are exempt.
Individuals other than absentees are generally liable for land tax if the total taxable value of the freehold land owned by that person is equal to or greater than $600,000. Companies, trustees and absentees are liable for land tax if the total taxable value of the freehold land owned is equal to or greater than $350,000.
Land tax revenue is expected to grow by 14.3 per cent in 2023–24, largely reflecting the impact of recent land value growth. However, the impact of these value increases has also been tempered by the 3-year averaging of land values applied in determining land tax liability.
While the strong land value growth seen in recent years will continue to flow through to support growth in land tax revenue in future years due to the effect of 3-year averaging, the subsequent falls in residential property values in 2022–23 are expected to partially offset that impact and moderate growth in land values for land tax purposes going forward.
Average annual growth of 6.8 per cent is forecast for land tax over the 3 years ending 2026–27.
| Box 4.4 | Queensland’s competitive land tax regime |
Land tax is generally considered one of the most efficient forms of tax available to states. Its broad application provides a stable and growing revenue base, and minimises distortionary impacts, including prolonged land banking.
The thresholds at which land tax becomes payable in Queensland are among the most generous in Australia. For individuals, the land tax-free threshold of $600,000 is the second highest in the country, only behind New South Wales.
Other major states also have materially higher comparative average house and associated land values. CoreLogic data for May 2023 shows that, compared to the median house price of $792,125 in Brisbane, the median house price in Sydney is $1,293,529 (63 per cent higher than Brisbane) while the median house price in Melbourne is $911,007 (15 per cent higher than Brisbane).
When land tax thresholds are considered against these median house prices, noting land value is the most significant component of house prices, the competitiveness of Queensland’s individual tax-free threshold becomes apparent as shown in Chart 4.4.
91
Budget Strategy and Outlook 2023-24
| Chart 4.4 | Comparison of median house prices and individual land tax thresholds1 |
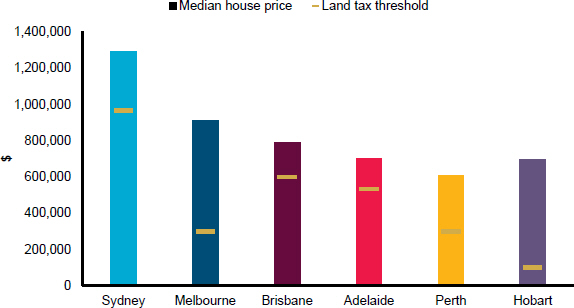
Note:
| 1. | From 1 January 2024, Victoria’s tax-free threshold for general land tax rates will decrease to $50,000 as part of its temporary COVID Debt Levy |
Sources: state revenue office websites (various), CoreLogic (May)
This shows that Queensland’s individual tax-free threshold relative to median capital city house prices compares favourably with other states. However, importantly, the home that Queenslanders live in is exempt from land tax, meaning the vast majority of Queensland homeowners are not liable for any land tax.
The Queensland Government has also recently announced it will put in place an automatic exemption process for the principal place of residence for eligible owners, based on appropriate verifying data.
Land tax in Queensland is also subject to a system of 3-year averaging of the land value, which further reduces the impacts of increasing land values on the tax payable by landholders.
Consistent with most other jurisdictions, Queensland has a progressive land tax regime, with different thresholds of taxable land value at which different rates of tax apply. Therefore, as land values increase and individuals’ or entities’ wealth increases (i.e. taxable landholdings increase in value), their land tax liability also tends to increase. Hence, it is considered a relatively fair form of tax.
Individuals are subject to more generous tax-free thresholds and lower average tax rates than companies, trusts and absentees.
Land tax provides an important revenue source to help fund the provision of essential government services and infrastructure for all Queenslanders, including critical health, education, law and order, transport and other services across the state.
92
Budget Strategy and Outlook 2023-24
Gambling taxes and levies
A range of gambling activities are subject to state taxes and levies. Total gambling tax and levy collections are expected to be 17.1 per cent higher in 2022–23 compared with 2021–22, reflecting the ongoing strong levels of gambling-related activity, including in the state’s hotels and clubs, as well as partially reflecting the betting tax measures announced in the 2022–23 Budget.
Total gambling tax and levy collections are expected to grow by 4.6 per cent in 2023–24, and average annual growth of 4.1 per cent is forecast for gambling tax revenue over the 3 years ending 2026–27, incorporating increased revenue over time from the opening of the Queen’s Wharf Brisbane casino.
Waste disposal levy
The waste disposal levy commenced on 1 July 2019 and applies to 39 local government areas, covering more than 90 per cent of the state’s waste generation and population. The levy is paid by landfill operators on waste disposed to landfill. Exemptions from the levy exist for particular waste, such as waste from declared disasters, waste donations to charitable recyclers and lawfully managed and transported asbestos.
To help Queensland reach its waste recovery targets, changes to the waste levy commenced from 1 July 2022. These included dividing the existing levy zone into metropolitan and regional levy areas, which have different annual levy rate increases. The metropolitan levy rate was increased by $10 to $95 per tonne and the regional levy rate increased in line with the consumer price index to $88 per tonne.
Revenue from the waste disposal levy is estimated to be $390 million in 2022–23, 12.0 per cent higher than in 2021–22 reflecting the increase of the metropolitan levy rate.
The government has committed to using 70 per cent of proceeds from the waste levy for resource recovery and other programs that reduce the impact of waste and protect the environment and local communities.
Queensland’s competitive tax status
Maintaining the competitiveness of Queensland’s tax system is critical to provide a competitive advantage to business and to moderate the tax burden on citizens.
Maintaining a competitive tax regime is also fundamental to the Queensland Government’s economic strategy and its commitment to creating more jobs in more industries and maintaining a competitive investment environment.
Importantly, as Chart 4.5 shows, taxation per capita in Queensland was lower in 2021–22 than the average taxation per capita in the other states and territories, highlighting the ongoing competitiveness of Queensland’s taxation regime.
Based on the latest available actuals data from states and territories, Queensland’s taxation per capita in 2021–22 was $720 less than the average of other jurisdictions. On average, Queenslanders paid $1,087 less tax than New South Wales residents and $928 less than Victorian residents, as highlighted in Chart 4.5.
93
Budget Strategy and Outlook 2023-24
| Chart 4.5 | Taxation per capita, 2021–22 |
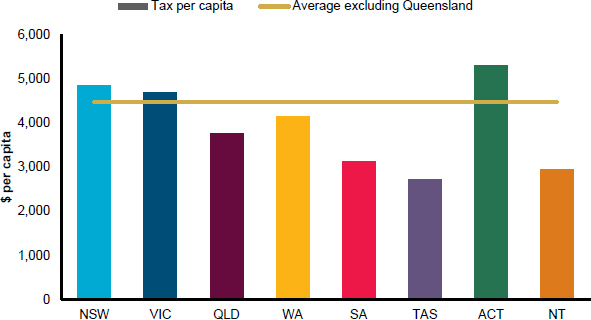
Sources: ABS Government Finance Statistics and ABS National, State and Territory Population.
Other measures of tax competitiveness include estimates by the Commonwealth Grants Commission (CGC) of Queensland’s tax effort compared with other jurisdictions, and each state or territory’s taxation revenue as a proportion of the respective size of its economy.
The CGC’s revenue raising effort ratios are an indicator of the extent to which governments burden their revenue bases, with a lower ratio indicating a relatively lower taxation burden imposed by state taxes.
The CGC’s 2022 update assessed that Queensland’s tax effort in 2021–22 (latest available CGC estimate, based on 2021–22 data and using total taxation revenue effort for CGC-assessed taxes) was 5.4 per cent below the national average.
The third measure of tax competitiveness (that is, taxation as a share of gross state product) also confirms that Queensland’s taxes are highly competitive, being below the average of the other states and territories, and significantly lower than the major southern states.
Table 4.3 summarises the estimates of these 3 measures compared with other states and territories and demonstrates that the Queensland tax system is very competitive.
94
Budget Strategy and Outlook 2023-24
| Table 4.3 | Tax competitiveness, 2021–22 |
| | | | | | | | | | | | | | | | | | | | | | | | | | | | | | | | | | | | |
| | | NSW | | | VIC | | | QLD | | | WA | | | SA | | | TAS | | | ACT4 | | | NT | | | Avg5 | |
Taxation per capita1 ($) | | | 4,844 | | | | 4,685 | | | | 3,757 | | | | 4,155 | | | | 3,126 | | | | 2,722 | | | | 5,308 | | | | 2,956 | | | | 4,477 | |
Taxation effort2 (%) | | | 96.8 | | | | 106.9 | | | | 94.6 | | | | 102.1 | | | | 96.3 | | | | 87.9 | | | | 139.3 | | | | 86.2 | | | | 100 | |
Taxation % of GSP3 (%) | | | 5.7 | | | | 6.0 | | | | 4.5 | | | | 2.9 | | | | 4.4 | | | | 4.0 | | | | 5.2 | | | | 2.4 | | | | 5.0 | |
Notes:
| 1. | 2021–22 data (latest available actuals). Sources: ABS Government Finance Statistics and ABS National, State and Territory Population. |
| 2. | 2021–22 data (latest available). Source: Commonwealth Grants Commission 2023 Update – total taxation revenue effort for assessed taxes (payroll, transfer duty, land tax, insurance duty and motor vehicle taxes). Revenue raising effort ratios are an indicator of the extent to which governments burden their revenue bases. |
| 3. | 2021–22 data (latest available). Sources: ABS Annual State Accounts and ABS Government Finance Statistics |
| 4. | Figures include municipal rates. |
| 5. | Weighted average of states and territories, excluding Queensland (aside from taxation effort, which is the average of all states). |
Tax expenditures
Tax expenditures are reductions in taxation revenue that result from the use of the tax system as a policy tool to deliver government policy objectives. Tax expenditures are provided through a range of concessions, including tax exemptions, reduced tax rates, tax rebates, tax deductions and provisions which defer payment of a tax liability to a future period.
Appendix B provides details of tax expenditure arrangements provided by the Queensland Government.
Grants revenue is comprised of Australian Government grants (including GST), grants from the community and industry, and other miscellaneous grants.
An 8.4 per cent increase in total grants revenue is forecast for 2023–24, primarily driven by an expected 11.8 per cent growth in Australian Government grants and an expected 5.9 per cent increase in GST revenue.
95
Budget Strategy and Outlook 2023-24
| Table 4.4 | Grants revenue1,2 |
| | | | | | | | | | | | | | | | | | | | | | | | |
| | | 2021–22
Actual
$ million | | | 2022–23
Est. Act
$ million | | | 2023–24
Budget
$ million | | | 2024–25
Projection
$ million | | | 2025–26
Projection
$ million | | | 2026–27
Projection
$ million | |
Current grants | | | | | | | | | | | | | | | | | | | | | | | | |
GST revenue grants3 | | | 16,079 | | | | 18,397 | | | | 19,477 | | | | 18,528 | | | | 18,927 | | | | 20,069 | |
Australian Government grants4 | | | 14,992 | | | | 14,790 | | | | 16,145 | | | | 16,410 | | | | 16,438 | | | | 16,968 | |
Other grants and contributions | | | 315 | | | | 413 | | | | 323 | | | | 317 | | | | 318 | | | | 319 | |
Total current grants | | | 31,387 | | | | 33,600 | | | | 35,944 | | | | 35,254 | | | | 35,683 | | | | 37,356 | |
Capital grants | | | | | | | | | | | | | | | | | | | | | | | | |
Australian Government capital grants | | | 2,706 | | | | 2,938 | | | | 3,679 | | | | 3,654 | | | | 3,248 | | | | 3,261 | |
Other grants and contributions | | | 42 | | | | 33 | | | | 20 | | | | 35 | | | | 7 | | | | 0 | |
Total capital grants | | | 2,749 | | | | 2,971 | | | | 3,699 | | | | 3,689 | | | | 3,254 | | | | 3,261 | |
Total Australian Government payments | | | 33,778 | | | | 36,125 | | | | 39,300 | | | | 38,591 | | | | 38,613 | | | | 40,298 | |
Total grants revenue | | | 34,135 | | | | 36,571 | | | | 39,643 | | | | 38,943 | | | | 38,937 | | | | 40,618 | |
Notes:
| 1. | Numbers may not add due to rounding. |
| 2. | Amounts in this table may differ to those outlined in Chapter 9 due to different classification treatments. |
| 3. | Includes entitlements to payments associated with the ‘no worse off’ guarantee as part of the Australian Government changes to the GST distribution. |
| 4. | Queensland Treasury estimates. Differs from Chapter 7 due to the inclusion of direct Australian Government payments to Queensland agencies for Australian Government own purpose expenditure. |
GST revenue
Growth in the national GST pool, along with an increase in Queensland’s share of the pool, have been the key drivers of stronger Queensland GST revenue across 2022–23 and 2023–24 compared with previous years.
Queensland’s GST revenue in 2022–23 is expected to be 14.4 per cent higher than in 2021–22, with this increase attributed to higher national GST collections. The 2023–24 Federal Budget estimated the total GST pool in 2022–23 to be $8.2 billion higher compared with 2021–22.
A further increase of 5.9 per cent in GST revenue in 2023–24 is expected compared with 2022–23. This more modest rate of growth, compared to the previous year, is driven by changes in the GST pool and population, combined with the CGC’s recommendation related to Queensland’s GST share in 2023–24.
Queensland’s expected share of GST, and the key factors impacting on it over the remainder of the forecast period, are discussed in further detail below.
96
Budget Strategy and Outlook 2023-24
Revisions to the GST pool
The Australian Government’s national GST pool forecasts were upgraded in the 2023–24 Federal Budget, to be $2.9 billion higher across the 4 years to 2025–26 compared with the October 2022–23 Federal Budget estimates.
The 2023–24 Federal Budget stated that increases in GST receipts largely reflect compliance measures and parameters and other variations. In particular, the 2023–24 Federal Budget announced a 4-year extension of its GST compliance program to ensure businesses meet their tax obligations, including accurately accounting for and remitting GST, and correctly claiming GST refunds. The Australian Government estimates this measure will increase GST receipts by $3.8 billion over the 4 years ending 2026–27.
The Australian Government expects the GST pool to increase by 5.2 per cent in 2023–24 and 3.9 per cent in 2024–25, in line with nominal household consumption.
Chart 4.6 compares GST pool forecasts published in the 2022–23 and 2023–24 Federal Budgets.
| Chart 4.6 | Australian Government forecasts of national GST revenue pool1 |
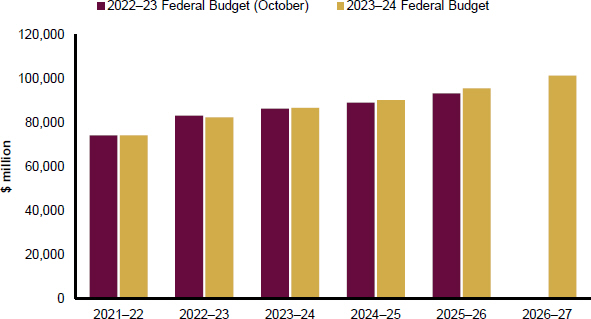
Note:
| 1. | The 2022–23 October Federal Budget estimates are limited to the 2025–26 financial year. |
Source: 2021–22 Final Budget Outcome, 2022–23 Federal Budget (October), and 2023–24 Federal Budget.
97
Budget Strategy and Outlook 2023-24
| Box 4.5 | 2025 GST Methodology Review |
GST is distributed between states and territories under a GST distribution methodology administered by the CGC. This methodology involves balancing fiscal capacity between state and territory governments so a similar standard of services and infrastructure can be delivered by each state to their population, no matter where they live. This is known as horizontal fiscal equalisation.
The GST distribution methodology is multifaceted to take into account different revenue raising capacities and differing need and costs of providing services across states and territories.
Since the introduction of the GST in 2000–01, the GST distribution methodology has been reviewed 4 times — on a 5-yearly basis — most recently in 2020. These reviews occur under terms of reference issued by the Australian Treasurer to the CGC and allow the CGC, in consultation with the states and territories, to consider changes to the data and methods for measuring fiscal capabilities and determining how GST is shared.
Terms of reference for the 2025 Methodology Review — to review the GST distribution methods to apply from 2025–26 — were issued by the Australian Treasurer to the CGC on 9 February 2023 and are available on the CGC’s website.
In 2022–23, GST is estimated to represent approximately 21 per cent of Queensland’s state revenue – providing critical funds for essential state government services such as health, education, law and order, transport and other services that are utilised by all Queenslanders.
Queensland Treasury will ensure Queensland’s position is clearly communicated and advocated for in the Methodology Review, to ensure Queensland receives its fair share of GST revenue. This significant body of work will be a focus for Queensland Treasury for the next 2 years, until the scheduled issue of CGC’s outcome report in March 2025.
It will also involve significant input from departments across the Queensland Government, to ensure the data used and assumptions relied upon by the CGC appropriately reflect the needs of the people of Queensland. This includes taking into account the state’s growing population, social-demographic composition and the challenges of service delivery in a large and decentralised state.
GST – Queensland’s assessed fiscal capacity
In early 2023, the Australian Government accepted the CGC’s recommendation that Queensland requires a similar share of GST revenue in 2023–24 compared with 2022–23, with the CGC estimating Queensland’s share of the GST pool at 21.2 per cent.
98
Budget Strategy and Outlook 2023-24
This was driven by the following factors:
| • | | population – a lower than average decline in Queensland’s population growth between 2018–19 and 2021–22, coupled with downward revisions in urban populations in New South Wales and Victoria, increased Queensland’s share of investment needs relative to other states |
| • | | property sales – very strong growth in the value of properties transferred in New South Wales increased its capacity to raise revenue from stamp duties, reducing its assessed GST needs relative to other states. |
These were offset by the following factors:
| • | | mining production – the increased value of coal production increased Queensland’s relative revenue raising capacity from mining-related activity and reduced its assessed GST needs |
| • | | capital improvements – national urban transport investment more than doubled between 2018–19 and 2021–22, decreasing the assessed GST needs of Queensland compared to more densely populated states such as New South Wales. |
Importantly, states and territories’ shares of GST revenue fluctuate over time based on the CGC’s assessment of their fiscal capacity and expenditure needs. Some key drivers of changes to Queensland’s and all states’ shares of GST are factors that are not Queensland specific, including the impacts of changes in royalty revenue from iron ore in Western Australia and transfer duty collections in New South Wales.
| Box 4.6 | No worse off guarantee |
In 2018, the former Australian Government legislated a new way to distribute GST revenue among the states, referred to as the new equalisation arrangements. These changes included:
| • | | equalising to the stronger of New South Wales or Victoria, rather than the state with the greatest fiscal capacity, with this change to be gradually introduced over 6 years from 2021–22 |
| • | | a relativity floor of 0.7 in 2022–23, increasing to 0.75 from 2024–25. That is, no state will receive less than 70 per cent of their population share of GST in 2022–23 and no less than 75 per cent in 2024–25 and beyond |
| • | | a permanent boost to the GST Pool. The Australian Government will inject $600 million per year from 2021–22 and an extra $250 million per year from 2024–25. This boost will continue in perpetuity and grow with the national pool |
| • | | provision of a ‘no worse off’ guarantee that would result in supplementary payments to any state that cumulatively received less GST under the new system than it would have received under the previous system, to apply between the years from 2021–22 to 2026–27 (the transition period) |
| • | | the Australian Productivity Commission to review the system by December 2026. |
Queensland’s longer-term GST revenue, from 2027–28 onwards, is at significant risk under these arrangements, compared to the ongoing revenue outcomes expected under the previous
99
Budget Strategy and Outlook 2023-24
system. In particular, the cessation of the no worse off guarantee will involve significant revenue implications for Queensland, and most other states and territories, from 2027–28 onwards, once the transition period ends.
The 2023–24 Federal Budget estimates that Queensland’s no worse off guarantee payment for 2022–23 will be $949 million, increasing to $1.303 billion by 2025–26.
Queensland Treasury currently estimates that cessation of the no worse off guarantee could result in Queensland being worse off by almost $1 billion a year from 2027–28 onwards.
The Treasurers of all states and territories have collectively requested that the Australian Treasurer extend the no worse off guarantee indefinitely.
The Queensland Government looks forward to genuine engagement with the Australian Government on this critical issue given its potentially significant implications for future state funding needed to provide essential services and infrastructure to the people of Queensland.
The 2024–25 Budget will be the first year where state budgets include 2027–28 GST forecasts in the forward estimates.
Australian Government payments
Australian Government payments to Queensland in 2023–24 are expected to total $39.3 billion, representing an increase of $3.175 billion (8.8 per cent) compared to payments in 2022–23. This increase is attributable to a 11.8 per cent increase in Australian Government grants and a 5.9 per cent increase in GST.
Chapter 7 provides a detailed overview of federal financial arrangements, including Australian Government payments to Queensland.
Other grants and contributions
Other grants and contributions are funds received from other state and local government agencies, other bodies and individuals.
The main sources of contributions are those received from private enterprise and community groups to fund research projects and community services and contributed assets and goods and services received for a nominal amount. Contributions exclude Australian Government grants and user charges.
Other grants and contributions comprise only a small share of total grant revenue (forecast to be 0.9 per cent in 2023–24).
The state earns royalties from the extraction of coal, base and precious metals, bauxite, petroleum and gas, mineral sands and other minerals. Royalties ensure a share of the proceeds of the extraction of non-renewable resources are returned to the community. Land rents are also earned from pastoral holdings and mining and petroleum leases.
100
Budget Strategy and Outlook 2023-24
There is a high degree of uncertainty associated with estimates of commodity prices, which can have significant impacts on royalty revenue. Risks to commodity export volumes, in particular coal, also have the potential to impact Queensland’s royalty estimates, although changes to export volumes may in turn impact prices.
Appendix C outlines key parameter assumptions, and the sensitivity of coal royalty estimates to individual changes in price, volume and exchange rate parameters.
Coal and oil prices rose substantially across 2021–22, providing a substantial short-term boost to revenues. Global prices have since moderated somewhat but remain elevated compared to historical levels.
However, the recent strength in prices, particularly in relation to coal prices, is primarily driven by a range of short-term supply side factors and disruptions. As such, prices are expected to return to more sustainable levels in 2024, but the timing and extent of the decline remains uncertain.
Forecast royalties and land rents are detailed in Table 4.5.
| Table 4.5 | Royalties and land rents1 |
| | | | | | | | | | | | | | | | | | | | | | | | |
| | | 2021–22
Actual
$ million | | | 2022–23
Est. Act
$ million | | | 2023–24
Budget
$ million | | | 2024–25
Projection
$ million | | | 2025–26
Projection
$ million | | | 2026–27
Projection
$ million | |
Coal | | | 7,243 | | | | 15,296 | | | | 5,345 | | | | 4,024 | | | | 4,224 | | | | 4,400 | |
Petroleum2 | | | 1,184 | | | | 2,332 | | | | 1,275 | | | | 1,222 | | | | 1,143 | | | | 1,039 | |
Other royalties3 | | | 490 | | | | 477 | | | | 503 | | | | 483 | | | | 460 | | | | 440 | |
Land rents | | | 171 | | | | 183 | | | | 195 | | | | 200 | | | | 204 | | | | 209 | |
Total royalties and land rents | | | 9,088 | | | | 18,288 | | | | 7,318 | | | | 5,929 | | | | 6,032 | | | | 6,087 | |
Notes:
| 1. | Numbers may not add due to rounding. |
| 2. | Includes liquefied natural gas (LNG). |
| 3. | Includes base and precious metal and other mineral royalties. |
Coal royalties
A large proportion of Queensland’s royalties comes from coal mining and the majority of this revenue is attributable to the hard-coking coal (HCC) used in global steel production.
The lower level of royalties collected from thermal coal mining compared with HCC reflects the smaller volume of thermal coal mined in Queensland, the generally lower values per tonne of thermal coal and the tiered coal royalty rate system, where lower value coal is subject to a lower average royalty rate. In 2022, HCC, in volume terms, represented around 52 cent of coal exported from Queensland, with semi soft/PCI 21 per cent and thermal coal 27 per cent.
Coal royalties are expected to total $15.296 billion in 2022–23, more than double that in 2021–22 and around 9 times the coal royalties raised in 2020–21.
101
Budget Strategy and Outlook 2023-24
The increase in coal royalties expected in 2022–23 is partially driven by the new progressive coal royalty rates announced in the 2022–23 Queensland Budget, but it primarily reflects the sustained period of higher than previously expected prices flowing through to royalty revenues more broadly. Without the new tiers introduced through the 2022–23 Queensland Budget measure, royalties during this period of unprecedented coal prices would have been around one third lower.
Importantly, as outlined in the 2022–23 Budget Update, the additional revenue raised from coal royalties, has enabled the funding of a range of substantial investments across regional Queensland, including in the key coal producing regions. The Queensland Government’s action in implementing these investments is outlined in Box 4.7 below.
| Box 4.7 | New tiers delivering for regional Queensland |
Over the 2 years since mid-2021, Queensland’s coal producers have enjoyed unprecedented benefits from an exceptional surge in global coal prices. These prices resulted in the value of Queensland coal exports reaching a calendar year record of $83.5 billion in 2022, more than double the value in 2021 and triple the value in 2020.
The record export revenues have contributed to the strong financial performance of coal mining companies operating in Queensland, with many reporting record revenues and profits in 2022.
Meanwhile, the favourable conditions created by high prices has supported strong employment growth in the mining sector, with Queensland Mines Inspectorate data showing employment in Queensland coal mines grew by 7.4 per cent in the second half of 2022.
In the context of these unprecedented global coal prices, the new coal royalty tiers announced by the Queensland Government in the 2022–23 Budget mean Queenslanders are also benefitting from these exceptional prices. Queenslanders are getting a fair and reasonable return for the use of the state’s valuable and limited resources in a period when coal mining companies are generating extraordinary revenues and profits.
Given the ongoing strength of coal prices, in particular hard coking coal prices, since the 2022–23 Budget Update, the new progressive coal royalty tiers are now expected to generate a revenue uplift of around $7.2 billion over the 5 years ending 2026–27, with most of this (around $5.7 billion) expected in 2022–23.
A more modest revenue uplift of around $783 million is expected in 2023–24. Then, as prices unwind to more normal levels in line with medium-term expectations, an average revenue uplift from the new tiers of around $235 million per annum is expected from 2024–25 onwards, representing only around 6 per cent of total coal royalty revenue once prices normalise.
The additional revenue raised from coal royalties due to the ongoing exceptionally high prices, including the revenue raised from the new progressive royalty tiers, has allowed the Queensland Government to invest more than $16 billion towards economic and social infrastructure and essential services to meet the needs of Queenslanders across all regions of the state, including coal-producing regions.
102
Budget Strategy and Outlook 2023-24
This includes continuing to deliver world class health services across regional Queensland and providing the productivity-enhancing infrastructure needed to support key growth industries and facilitate the energy transformation critical to drive increased employment opportunities and higher incomes into the future.
In the 2022–23 Budget Update, the government committed to utilise the uplift in royalty revenue to fund a combined $4 billion in productivity-enhancing investments across regional Queensland, which includes a $3 billion long-term asset held by the Consolidated Fund and $1 billion provided as equity investments in the Public Non-financial Corporations sector.
In this Budget, the government is providing an additional $6 billion in funding for the Borumba Pumped Hydro Energy Storage project. This brings the government’s total commitment to $10 billion for relevant regional PNFC sector infrastructure projects funded by the General Government Sector equity injections supported by coal royalties, and includes:
| • | | $1.06 billion towards CopperString 2032, which will support the construction of the 1,100km transmission line from Townsville to Mount Isa, connecting Queensland’s North West Minerals Province to the national electricity grid project |
| • | | $7 billion towards state-owned, large-scale, long duration pumped hydro, including $6 billion for the Borumba project over the construction period and $1 billion for the Pioneer-Burdekin project |
| • | | $550 million for the Fitzroy to Gladstone Pipeline, enabling long-term water security to the region |
| • | | $500 million to CleanCo to support a 2.3-gigawatt portfolio of wind and solar projects in Central Queensland |
| • | | $440 million towards Sunwater’s Burdekin Falls Dam Improvement and Raising Project, improving and raising the dam by 2 metres to further support water security, noting this is on top of the existing $100 million commitment towards the project |
| • | | $300 million for CS Energy to pursue investments in new wind projects and energy firming options to support future industrial decarbonisation in Central Queensland |
| • | | $100 million for Gladstone Port Corporation’s Northern Land Expansion project, subject to approvals, supporting the release of additional land at Gladstone port and the development of renewable energy and other industries |
| • | | $50 million for the replacement of North Queensland Bulk Ports’ Bowen Wharf, with the plans, design and approvals subject to further consultation with stakeholders. |
Further, leveraging Queensland’s economic strengths and to help capitalise on global growth opportunities in new and emerging sectors that will drive sustainable job creation, the following investments have been committed across regional Queensland:
| • | | $150 million will be provided to support workers in Queensland's publicly-owned coal-fired power stations and $200 million for a Regional Economic Futures Fund |
| • | | $150 million will be allocated for common user infrastructure to support development, extraction and production of critical minerals |
103
Budget Strategy and Outlook 2023-24
| • | | $120 million to enlarge the Resources Community Infrastructure Fund, with a special focus on coal producing regions |
| • | | $100 million to establish a Queensland Critical Minerals and Battery Technology Fund to position Queensland for the next resources boom in the critical minerals needed for the clean energy revolution. |
The Budget also allocates $520 million for investments through the Low Emissions Investment Partnerships program to encourage the mining industry to fast-track capital investments that will both rapidly reduce their emissions profile and help maintain a competitive edge for the industry.
To ensure Queenslanders residing in regions have access to world class health services, the government is also investing:
| • | | more than $3.6 billion to build new or expanded hospitals in the coal producing regions of Moranbah and Mackay, as well as in Cairns, Townsville, Bundaberg, Fraser Coast and Toowoomba |
| • | | $920 million for new 10-year agreements with the Royal Flying Doctor Services and LifeFlight Australia to provide aeromedical services across the state including from bases in Bundaberg, Cairns, Charleville, Longreach, Mount Isa, Rockhampton, Roma, Townsville and Toowoomba |
| • | | $70 million over 4 years, and $21 million per annum ongoing, to support an increase to the Patient Travel Subsidy Scheme (PTSS) which primarily supports Queenslanders in rural and regional areas to access specialist medical services not available locally. |
The government is also providing a $29 million boost to the initial $25 million election commitment for the Browne Park redevelopment in Rockhampton.
More broadly, the increase in royalties due to the windfall prices enjoyed by coal producers has also enabled the government to provide ongoing substantial support to regional businesses across the state, by extending the one per cent regional discount on payroll tax for a further 7 years until June 2030, estimated to cost more than $500 million over the 4 years to 2026–27.
Coal prices
Global coal prices have experienced an unprecedented surge since mid-2021, with the premium HCC spot price averaging US$392 per tonne (/t) in 2021–22, an increase of 220 per cent on 2020–21. This surge in coal prices has been driven by a number of short-term factors including:
| • | | China’s strong demand for coal from other exporters since late 2020, due to its reduced importation of Australian coal at that time, appears to have distorted global market dynamics, leading to a shortage in supply and potentially contributing to upward pressure on prices |
| • | | European buyers reducing their purchases of Russian coal following the commencement of the Russia-Ukraine conflict in early 2022. This also led to concern about securing supply, putting further upward pressure on prices |
| • | | COVID-19 impacts and a range of weather-related supply shortages across 2022 and early 2023. |
104
Budget Strategy and Outlook 2023-24
As noted in the 2022–23 Queensland Budget and 2022–23 Budget Update, these factors are all expected to be temporary in nature. In particular, COVID-19 and weather-related impacts are expected to subside, resulting in an easing of the supply constraints and thus lessening the upward pressure on coal prices. Therefore, global coal prices are expected to continue to unwind over coming quarters to align more with medium-term expectations.
However, to date, throughout late 2022 and the first half of 2023, coal prices have remained higher than previously expected and exceptionally strong compared with historical prices.
While the higher-than-expected coal prices seen in early 2023 have led to a large short-term boost to royalty revenues in 2022–23, the sustained higher global prices have also resulted in a sustained period of extraordinary returns and profits for the state’s major coal producers.
Across the 2021 calendar year, the value of Queensland coal exports totalled $39.5 billion, a growth of 41 per cent compared to the 2020 calendar year total of $28.0 billion. The value of coal exports across 2022 was more than double that of 2021, totalling $83.5 billion, or 3 times the value of coal exported only 2 years earlier.
Continued high prices in early 2023 have sustained the extraordinary returns being received by the state’s coal producers. The latest ABS data shows that the value of Queensland’s coal exports over the 12 months to March 2023 have remained at exceptionally high levels, at $80.0 billion, highlighting the extended period over which coal producers have been receiving exceptionally high prices and revenues.
While coal prices are expected to decline significantly over time, the precise timing and magnitude of such a decline is not known. Queensland Treasury has taken an appropriately conservative approach to its coal forecasts and assumed prices will normalise over time, with HCC and thermal coal prices returning to more sustainable medium-term levels in early 2024 and late 2024 respectively.
Given the expectation of lower coal prices over subsequent years compared with the prices seen across 2021–22 and so far in 2022–23, coal royalty revenue is forecast to decline by 65.1 per cent in 2023–24 and by a further 24.7 per cent in 2024–25.
Coal royalty revenue is forecast to grow by 5.0 per cent in 2025–26 and by a further 4.1 per cent in 2026–27 with crown export coal tonnages1 forecast to gradually increase over this period. This largely reflects the continued recovery in global economic activity.
Coking coal prices
At the time of the 2022–23 Budget Update, HCC spot prices were expected to average US$231/t in December quarter 2022 and decline to US$177/t in March quarter 2023. HCC prices were expected to decline across the remainder of 2022–23 reaching US$160/t by June 2023.
Prices have fallen substantially since the unprecedented levels in early to mid-2022, with HCC prices averaging US$271/t (A$405/t) in April 2023, a fall of 43 per cent compared to April 2022.
| 1 | Excludes coal where royalties are not paid to the Queensland Government, that is, private royalties. |
105
Budget Strategy and Outlook 2023-24
However, HCC prices remained stronger than expected following the 2022–23 Budget Update, growing from an average of US$279/t (A$426/t) in December quarter to an average of US$343/t (A$501/t) across March quarter.
The continued strength in HCC prices so far in 2023 has been driven primarily by concerns around supply, in particular due to the impacts of wet weather. In particular, January 2023 was a particularly wet month in Queensland’s coal mining regions, with delays in port loadings and several major producers indicating wet weather in late 2022 and early 2023 was a factor in reducing supply. For example:
| • | | major ports in Queensland experienced delays of 1-2 weeks in mid-January due to issues with loading caused by the heavy rainfall |
| • | | in their December 2022 production reports, several major coal companies, including BHP, Yancoal, Stanmore, Coronado, Glencore and Anglo American, cited wet weather as a factor in reducing supply |
| • | | a train collision caused Aurizon to close its Blackwater coal rail system in Central Queensland. The rail line was closed from 29 January to 12 February, with coal exports from the Port of Gladstone falling by 2.8 million tonnes (Mt) in February |
| • | | Severe Tropical Cyclone Gabrielle formed off the coast of North Queensland in February, which affected shipping going to Queensland ports, resulting in delays and increasing prices. |
There is a consensus among market analysts that the recent surge in HCC prices cannot be sustained indefinitely, and prices are still expected to decline over coming quarters as weather-related issues constraining supply diminish and international markets continue to adjust to other temporary factors that have contributed to the recent high prices. For example:
| • | | the Commonwealth Department of Industry Science and Resources’ Office of the Chief Economist (OCE) stated that ‘prices are expected to ease slowly over the outlook period, with the largest fall expected in 2023 as supply conditions (notably in Australia) improve and normalise1’ |
| • | | Wood Mackenzie indicated that ‘supply availability recovers and trade flow inefficiencies are worked out, pushing prices down in the next three years2’ |
| • | | S&P Global Commodity Insights reported that ‘prices are largely driven by the weather impact on mining and shipping operations in the Australian state of Queensland, as evidenced by the strong prices earlier in the year. With drier weather in store now the three-year La Nina event has finished, along with the end of the rainy season in northern Australia, supply is set to increase3’ |
| 1 | Department of Industry, Science and Resources, Commonwealth of Australia (2023), Resources and Energy Quarterly March 2023. |
| 2 | Wood Mackenzie (2023). Global Metallurgical Coal Strategic Planning Outlook H1 2023. |
| 3 | Bartholomew, P., Cao, S., Hao, C. (2023) Coking coal prices heading lower in Q2. S&P Global Commodity Insights 4 May 2023. |
106
Budget Strategy and Outlook 2023-24
| • | | The International Energy Agency1 expect Australian metallurgical coal supply to improve ‘as weather conditions normalise, improving mine and infrastructure performance. Conditions were poor for three consecutive years due to the La Nina weather phenomenon. In addition, met coal projects under development are expected to advance as they continue to find financing, insurance and government support.’ |
However, global coal prices are now expected to be slightly higher in the longer term than previously expected, as global markets continue to adjust over time to factors impacting market dynamics and prices such as:
| • | | higher hard coking coal prices continuing to be sustained in early 2023 compared to previous expectations, with market analysts and forecasters now generally expecting prices to remain higher for longer than previously expected |
| • | | China’s decision to lift its strict COVID-19 restrictions in late December/early January, which is expected to provide some potential upside to overall global demand for coal, including Australian coal, over time |
| • | | the likelihood of ongoing impact of global cost pressures in a high inflation environment, including the impacts of prevailing supply chain constraints and labour market tightness |
| • | | the impacts of decarbonisation efforts on mining costs in the medium term. |
These expectations are broadly consistent with the views outlined in the 2023–24 Federal Budget which provided the following commentary around the short to medium-term outlook for commodity prices2:
| • | | a series of significant and interrelated shocks have affected global commodity markets in recent years. In early 2022, Russia’s invasion of Ukraine precipitated a shift in global commodity supply, including a significant reduction in global gas supply and forced restructuring of global oil trade flows |
| • | | major weather disruptions in key producing regions, including for coal production in Australia and iron ore production in Brazil, reduced both the level and reliability of non-Russian supplies to global commodity markets |
| • | | the global economy has also experienced a sustained period of cost inflation that has increased production costs across the global mining sector. Input prices for the Australian coal sector, for example, have increased by around 15 per cent since 2021 |
| • | | strong cost inflation has built in a materially higher cost base across the industry that is expected to result in structurally higher prices over the medium term. |
As a result, while HCC prices are still expected to moderate substantially across 2023 from the exceptional prices seen in 2022 and early 2023, they are now expected to average US$175/t across the 3 years from 2024–25 to 2026–27 compared to the previous forecast of US$160/t over those years.
| 1 | IEA (2022), Coal 2022, IEA, Paris. |
| 2 | The Commonwealth of Australia (2023). 2023–24 Budget – Budget Strategy and Outlook |
107
Budget Strategy and Outlook 2023-24
The upward revision to coal price forecasts in forward years compared to those expected at the time of the 2022–23 Queensland Budget is consistent with other forecasters, for example:
| • | | Consensus Economics’ May 2023 HCC price forecasts were revised upwards compared to those in May 2022, as follows: up from US$209/t to US$238/t in 2024; from US$184/t to US$219/t in 2025; and from US$162/t to US$202/t in 2026 |
| • | | OCE’s March 2023 HCC spot price forecasts were revised upwards compared to those in March 2022 as follows: up from US$157/t to US$233/t in 2024; from US$154/t to US$208/t in 2025; from US$152/t to US$189/t in 2026; and from US$150/t to US$188/t in 2027. |
Chart 4.7 shows HCC price forecasts compared to the latest quarterly price forecasts from Consensus Economics, Wood Mackenzie, Westpac, OCE, and the Commonwealth Treasury.
This comparison shows that the expected sharp decline in coal prices from current levels is broadly consistent with the expectations of other key forecasters that global coal prices will be substantially lower over coming quarters and years. Queensland Treasury’s medium-term anchor price of US$175/t for HCC is similar to most other forecasters, although the pace of adjustment differs.
As at 31 May 2023, the June quarter 2023 HCC spot price averaged US$250/t, which is closely aligned with Queensland Treasury’s implied forecast for average spot prices of US$252/t in the quarter. Other key forecasters’ estimated spot price for June quarter 2023 ranged from US$243/t (Wood Mackenzie, April 2023 forecast) to US$312/t (OCE, March 2023 forecast).
108
Budget Strategy and Outlook 2023-24
| Chart 4.7 | Coking coal price forecasts1,2 |
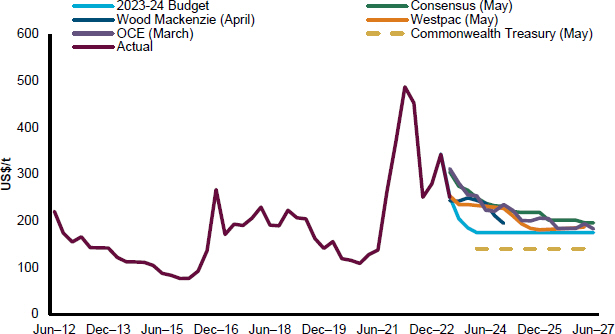
Notes:
| 1. | Actual price for June quarter 2023 reflects the average actual spot prices up until 31 May 2023 |
| 2. | Spot prices used where possible. Where spot prices are unavailable, contract prices have been used. |
Sources: Consensus Economics, Wood Mackenzie, Westpac, OCE, Commonwealth Treasury, and Queensland Treasury.
Thermal coal prices
The Russia-Ukraine conflict and associated sanctions led to a sustained surge in premium thermal coal prices beyond those expected in the 2022–23 Queensland Budget. For example, premium thermal coal spot prices1 rose from an average of around US$389/t (A$551/t) in May 2022 to a peak of around US$458/t (A$675/t) in early September 2022.
Thermal coal prices have since fallen substantially as expected at the time of the 2022–23 Budget Update, averaging around US$253/t (A$369/t) across March quarter 2023 as the extreme tightness in spot availability of high-energy coal started to subside. However, they remain elevated compared to previous levels, for example premium thermal coal (spot) prices averaged around US$79/t (A$105/t) in 2020–21.
The price for premium thermal coal is still expected to decline further from its recent peaks. However, consistent with the medium-term price outlook in the 2022–23 Budget Update, the spot price is now expected to decline to US$153/t (A$209/t) across 2023–24 before reaching a medium-term level of US$120/t (around A$160/t) across 2024–25, 2025–26, and 2026–27.
| 1 | Based on Newcastle 6,300 GAR spot prices. |
109
Budget Strategy and Outlook 2023-24
This mainly reflects expectations that, regardless of when the conflict in Ukraine ends, the ongoing impacts of sanctions and changes in global market dynamics resulting from the conflict will continue to impact over the medium term.
Importantly, the expectation that global coal prices may now remain slightly higher over the medium term than previously expected also implies the state’s coal producers will receive greater revenues than previously expected.
By way of illustration, the upward revision to coal price forecasts in this Budget, compared to the 2022–23 Queensland Budget forecasts, is estimated to result in an indicative uplift to coal producer revenue of around $8.1 billion in each 2023–24, 2024–25, and 2025–26.
In comparison, the expected higher prices over the medium term will only result in an estimated uplift in state revenues from the new tiers of around $657 million in 2023–24, and around $90 million in 2024–25 and in 2025–26 compared with the revenue expected from the new tiers at the time of the 2022–23 Queensland Budget.
Coal export volumes
Chart 4.8 shows coal export tonnage forecasts compared to the 2022–23 Queensland Budget outlook. This highlights that coal export tonnages have been revised downwards by around one per cent over the 4 years ending 2025–26.
The reduced export tonnages compared to the 2022–23 Queensland Budget are due to downward revisions in thermal coal exports. This is because Australian thermal coal exports to India have fallen sharply over the past year.
In 2022, Indian thermal imports from Indonesia increased by 30.7Mt compared to 2021 and imports from Russia increased by 6.7Mt. Meanwhile Indian thermal coal imports from South Africa fell by 20.7Mt in 2022, while imports from Australia fell by 9.3Mt. This reflects the impacts of the relatively high Australian thermal coal prices compared with some cheaper alternatives, including from Russia.
This downward revision is partially offset by an upward revision in forecast metallurgical coal exports. This is driven by a range of factors, including China’s re-opening of the economy from COVID-19 restrictions and indications China is willing to reconsider importing coal from Australia, both of which may lead to upward pressure on demand globally and demand for Australian coal.
In addition, the decision by some key markets, including Japan and Taiwan, to not import Russian coal has increased the upside for exports of PCI coal1.
| 1 | PCI coal is used in the blast furnace route of steelmaking to provide heat to the process to reduce use of higher priced coking coal. Queensland is one of the major suppliers of high quality PCI coal in the Asian market. |
110
Budget Strategy and Outlook 2023-24
| Chart 4.8 | Export coal tonnages1 |
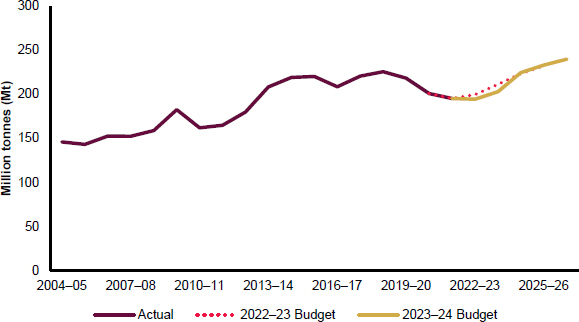
Note:
| 1. | Includes coal exports where royalties are not paid to the government, i.e. private royalties. This will not align with tonnages presented in Appendix C which exclude private royalties. |
Source: Unpublished ABS trade data and Queensland Treasury
An ongoing risk to global coal demand and export volumes over the medium to longer term is that Japan and South Korea have committed to achieving net zero CO2 emissions by 2050, while China has committed to achieve this by 2060. This may lead to an earlier reduction in thermal coal consumption in these countries than previously expected.
In addition, several South East Asian nations have announced policies to phase out coal fired power generation over the longer term. Queensland exported 11.8Mt of thermal coal to South East Asia in 2022, accounting for 22.5 per cent of total thermal coal exports, with most of this exported to Vietnam (7.5Mt) and Singapore (1.9Mt).
However, as outlined above, given the majority of Queensland’s coal exports are metallurgical coal, it is still expected that international demand should continue to support Queensland’s coal exports over coming decades.
111
Budget Strategy and Outlook 2023-24
As outlined in Queensland Treasury’s report on Queensland’s Coal Industry and Long-Term Global Coal Demand (November 2022), the positive outlook for Queensland’s long term metallurgical coal industry reflects several key factors1:
| • | | Queensland continues to offer an attractive environment for investment in coal, reflecting its numerous competitive advantages including its high-quality hard coking coal, proximity to the fast-growing Asian region, efficient supply chain, good infrastructure, and skilled workforce. |
| • | | Since mid-2022, there have been numerous announcements of substantial investments or acquisitions in the Queensland coal industry, providing a clear indication of coal producers’ ongoing confidence and appetite to invest in Queensland. |
| • | | Queensland accounted for around 90 per cent of Australia’s metallurgical coal production in 2021–22 and, given around 70 per cent of the state’s coal production in 2021–22 was metallurgical coal, Queensland’s coal industry remains relatively well placed over the longer term compared with other jurisdictions that are much more reliant on thermal coal production and exports. |
| • | | As such, Queensland’s coal industry continues to enjoy key advantages compared with many of its global competitors. |
| 1 | Queensland Treasury (2022) Queensland’s Coal Industry and Long-Term Global Coal Demand November 2022. |
112
Budget Strategy and Outlook 2023-24
| Box 4.8 | Queensland coal producers continue to enjoy strong returns and profits |
In the lead up to the 2022–23 Queensland Budget, coal producers were benefitting substantially from an exceptional surge in global coal prices, with spot metallurgical coal prices reaching as high as around A$900/t.
At the time, prices were expected to decline significantly as the temporary nature of the key factors driving the spike in global coal prices were expected to unwind relatively quickly.
However, following the 2022–23 Queensland Budget, premium thermal coal prices surged to a peak of around A$675/t in September 2022. While prices have since moderated from these highs, they remain elevated compared to historical levels. In addition, while hard coking coal prices began to moderate following the 2022–23 Queensland Budget, they have remained stronger for longer than expected.
As outlined in Queensland Treasury’s report, Queensland’s Coal Industry and Long Term Global Coal Demand (November 2022), this unprecedented surge in coal prices has seen the value of Queensland coal exports (and, therefore, the revenues and profits being enjoyed by the state’s coal mining companies) increase significantly to record levels.
The ongoing high prices across 2022 saw coal producers continuing to receive record levels of revenue, with ABS data showing that the value of Queensland’s coal exports in 2022 increased by a further 112 per cent to reach a new record high of A$83.5 billion, 3 times the value of coal exports recorded only 2 years earlier.
Continued high prices in early 2023 have sustained the extraordinary returns being received by the state’s coal producers, with the latest ABS data showing that the value of Queensland’s coal exports over the 12 months to March 2023 remained at exceptionally high levels, at A$80.0 billion.
Chart 4.9 shows Queensland’s total coal export values over the past 20 years, highlighting the exceptional and unprecedented returns being received by Queensland’s coal producers during the recent extended period of high prices, including the extent of those increased revenues to coal companies compared with the royalties to Queenslanders.
113
Budget Strategy and Outlook 2023-24
| Chart 4.9 | Value of coal exports – rolling annual sum1 |
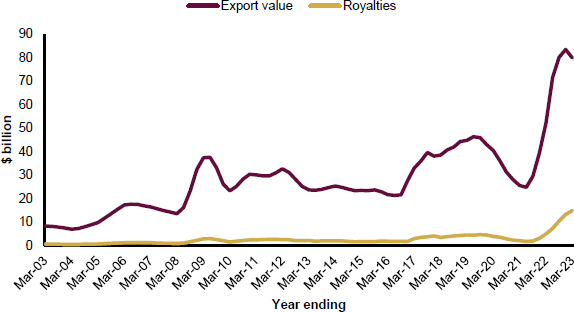
Note:
| 1. | The most recent 2 months of data are provisional and subject to revision. |
Source: Unpublished ABS trade data
Prior to the 2022–23 Queensland Budget, the highest marginal royalty rate applicable to Queensland coal royalties was 15 per cent, payable on that part of the average price per tonne exceeding A$150. This royalty rate structure was not providing a fair return to Queenslanders during periods of exceptionally high prices.
To ensure a fairer return to the people of Queensland, at the 2022–23 Queensland Budget, the government introduced 3 additional tiers to the coal royalty structure, with effect for coal sold, disposed of or used on or after 1 July 2022.
Since that time, global coal prices have remained stronger for longer than expected, but the recent surge in coal prices cannot be sustained indefinitely. Prices are still expected to decline in coming quarters as the current temporary drivers of higher prices diminish and international markets adjust.
However, given the various factors impacting global coal market dynamics, global coal prices are now expected to be slightly higher in the longer term than previously expected.
When prices are high coal miners receive higher revenues and profits. As prices adjust downwards and drop below key price thresholds, they will no longer trigger the higher royalty tiers, and royalty revenue will fall significantly.
114
Budget Strategy and Outlook 2023-24
Petroleum royalties
Compared to coal, petroleum royalties make up a smaller share of total royalties, though petroleum royalties have grown strongly as the export industry has matured.
Oil prices factor strongly into petroleum royalty forecasts. Most of the LNG produced in Queensland is sold under long-term contracts linked to oil prices, while the production level of the 3 major LNG plants is expected to be relatively stable across the forward estimates.
For 2022–23, petroleum and gas royalties are estimated to total $2.332 billion, almost double 2021–22.
Oil prices were at unexpectedly high levels throughout 2022 following Russia’s invasion of Ukraine, with concerns surrounding global oil supply due to sanctions on Russian oil. However, global oil production has since outpaced global oil consumption, which has seen oil prices moderate from their record high levels to pre-Ukraine war levels. While uncertainty in the market resulting from the war remains, its impact on oil prices has lessened greatly.
LNG prices, which are linked to oil prices, have benefitted greatly from these elevated oil prices. While oil prices have fallen throughout 2022–23, the lag in LNG contracts mean that LNG prices are expected to remain relatively high for a period, driving the expected growth in petroleum royalties compared with 2021–22.
LNG prices are expected to fall in 2023–24, with petroleum royalties expected to decline by around 45.3 per cent in 2023–24 and by a further 4.1 per cent in 2024–25.
Oil price (and subsequently LNG price) forecasts have been revised down since the 2022–23 Queensland Budget.
Other royalties
Other royalties include revenue from base and precious metals mined in Queensland such as gold, silver, copper, lead, and zinc, and other minerals such as bauxite.
Revenue from other royalties is estimated to total $477 million in 2022–23, 2.8 per cent lower than in 2021–22. This is mainly driven by heavy rainfall in early March 2023 causing significant mine access and flooding issues with several large operations shutting down. This is partially offset by a decline in shipping costs (which are deductible when calculating royalties) from previously elevated levels due to COVID-19-related issues.
Other royalties are expected to grow by around 5.5 per cent in 2023–24 reflecting an expected return to previously expected production levels following the disruptions caused by flooding as well as an expected increase in bauxite volumes.
Across the 3 years to 2026–27, other mineral royalties are forecast to decline on average by around 4.4 per cent per annum, driven by a reduction in copper, lead, and zinc volumes.
115
Budget Strategy and Outlook 2023-24
Land rents
Revenue from land rents derived from mining and petroleum leases and pastoral holdings is estimated to total $183 million in 2022–23. This is 7.5 per cent higher than in 2021–22 but 3.4 per cent lower than expected at the 2022–23 Budget, due to fewer leases subject to land rent than anticipated.
Revenue from land rents is forecast to grow by 6.3 per cent in 2023–24 driven by higher rental valuations.
Revenue from land rents is then expected to grow by 2.4 per cent per annum over the forward estimates.
| 4.4.4 | Sale of goods and services |
Sales of goods and services revenue comprises the cost recovery from the Queensland Government providing goods or services. Table 4.6 provides a breakdown of the categories of goods and services captured in terms of these revenues.
| Table 4.6 | Sales of goods and services1 |
| | | | | | | | | | | | | | | | | | | | | | | | |
| | | 2021–22
Actual
$ million | | | 2022–23
Est. Act
$ million | | | 2023–24
Budget
$ million | | | 2024–25
Projection
$ million | | | 2025–26
Projection
$ million | | | 2026–27
Projection
$ million | |
Fee for service activities | | | 2,696 | | | | 2,959 | | | | 3,236 | | | | 3,331 | | | | 3,305 | | | | 2,995 | |
Public transport: South East Queensland | | | 203 | | | | 275 | | | | 338 | | | | 358 | | | | 371 | | | | 385 | |
Rent revenue | | | 549 | | | | 554 | | | | 595 | | | | 620 | | | | 633 | | | | 644 | |
Sale of land inventory | | | 94 | | | | 53 | | | | 94 | | | | 75 | | | | 105 | | | | 131 | |
Hospital fees | | | 810 | | | | 875 | | | | 827 | | | | 827 | | | | 837 | | | | 844 | |
Transport and traffic fees | | | 509 | | | | 553 | | | | 574 | | | | 597 | | | | 620 | | | | 645 | |
Other sales of goods and services | | | 1,036 | | | | 1,075 | | | | 1,257 | | | | 1,162 | | | | 1,183 | | | | 1,226 | |
Total | | | 5,896 | | | | 6,344 | | | | 6,921 | | | | 6,969 | | | | 7,054 | | | | 6,871 | |
Note: 1. Numbers may not add due to rounding. | |
The government provides substantial concessions in the form of discounts, rebates and subsidies to improve access to and the affordability of a range of services for individuals or families, based on eligibility criteria relating to factors such as age, income and special needs or disadvantage.
Appendix A provides details of the concession arrangements provided by the Queensland Government.
116
Budget Strategy and Outlook 2023-24
Fee for service activities
Examples of major items of fee for service activities across the General Government Sector include:
| • | | recoverable works carried out by the Department of Transport and Main Roads and the commercialised arm of the department |
| • | | fees charged by TAFE colleges |
| • | | fees charged by CITEC to commercial clients for information brokerage services. |
Other sales of goods and services
As shown in Table 4.6, revenue is also raised from a variety of other types of sales of goods and services. These include revenue from public transport ticketing arrangements, rent or lease of government property, hospital fees, transport and traffic fees, title registration fees and other licences and permits.
Interest income primarily comprises interest earned on investments, including those held to support debt, superannuation and insurance liabilities.
Interest income is estimated to total $3.166 billion in 2022–23, 11.2 per cent higher than expected at the 2022–23 Budget, and 19.8 per cent higher than received in 2021–22. The increase in interest income in 2022–23 largely driven by interest earnings on investment of Queensland’s increased resources-related revenue.
Interest income is expected to grow by a further 1.3 per cent in 2023–24, before declining across the remaining forward estimates as investments are drawn down to fund priority infrastructure projects largely undertaken by Public Non-financial Corporation sector entities.
| 4.4.6 | Dividend and income tax equivalent income |
Revenue from dividend and income tax equivalent income is estimated to total $1.043 billion in 2022–23, $253 million (32.0 per cent) higher than in 2021–22, but $456 million (30.4 per cent) lower than expected at the time of the 2022–23 Queensland Budget.
Higher dividends in 2022–23 compared to 2021–22 reflect a return to normal government owned corporation (GOC) dividend policy in 2022–23 following the government’s prior year decision to allow the GOCs to retain 2021–22 dividends for critical infrastructure and growth initiatives. This reflects steady earnings growth across this sector.
Dividends and income tax equivalents are expected to increase from $1.521 billion in 2023–24 to $1.958 billion by 2026–27. This reflects steady earnings growth across the energy generation sector, as investment in new renewable generation grows and wholesale prices stabilise and significant volumes of new renewable generation and energy storage enter the market.
Trends in dividends and income tax equivalent income are discussed in more detail in Chapter 8.
117
Budget Strategy and Outlook 2023-24
Other revenue, including royalty revenue, accounts for 10.8 per cent of total General Government Sector revenue in 2023–24 (see Table 4.7). Royalties and land rents account for 8.9 per cent of total revenue in 2023–24 and are discussed in detail in section 4.4.3.
The major fines included in this category include speeding, red light, mobile phone and seatbelt camera detected offences and tolling offences.
This revenue is expected to grow by 53.0 per cent in 2022–23, partly driven by the increase in penalties for high-risk driving offences, and the full year impact of mobile phone and seatbelt detection cameras. This revenue is then expected to decline by 4.7 per cent in 2023–24 driven by expected behavioural changes associated with the mobile phone and seatbelt camera infringements and grow by 5.4 per cent in 2024–25 reflecting changes to the forward camera program schedule.
After providing for the cost of administration, funds raised from camera detected offences are allocated to allowable road safety initiatives in accordance with the legislation. Such initiatives include road funding to improve the safety of the sections of state-controlled roads based on risk assessment, road safety education and awareness programs, enabling practices and behaviours that improve road safety and road accident injury rehabilitation programs.
Revenue not elsewhere classified includes assets contributed to the state and payments received for works delivered on behalf of GOCs.
| | | | | | | | | | | | | | | | | | | | | | | | |
| | | 2021–22
Actual
$ million | | | 2022–23
Est. Act
$ million | | | 2023–24
Budget
$ million | | | 2024–25
Projection
$ million | | | 2025–26
Projection
$ million | | | 2026–27
Projection
$ million | |
Royalties and land rents | | | 9,088 | | | | 18,288 | | | | 7,318 | | | | 5,929 | | | | 6,032 | | | | 6,087 | |
Fines and forfeitures | | | 558 | | | | 853 | | | | 814 | | | | 857 | | | | 859 | | | | 859 | |
Revenue not elsewhere classified | | | 1,065 | | | | 795 | | | | 719 | | | | 1,221 | | | | 718 | | | | 704 | |
Total other revenue | | | 10,710 | | | | 19,937 | | | | 8,850 | | | | 8,008 | | | | 7,609 | | | | 7,650 | |
Note: 1. Numbers may not add due to rounding. | | | | | | | | | | | | | | | | | | | | | | | | |
118
Budget Strategy and Outlook 2023-24
Features
| • | | The 2023–24 Budget provides a substantial range of expense measures to address the immediate cost-of-living pressures facing households and businesses across Queensland, boost health funding, further support programs to alleviate housing pressures and strengthen Queensland’s community safety and youth justice systems. |
| • | | Estimated General Government Sector expenses for 2023–24 are estimated to be $84.261 billion, an increase of $8.944 billion (or 11.9 per cent) on 2022–23. |
| • | | New cost-of-living measures are mostly contained to 2023–24, with expenses growth expected to fall by 2.7 per cent in 2024–25 before growing moderately across the remainder of the forward estimates. |
| • | | Total expenses are projected to grow at an average annual rate of 4.0 per cent over the 5 years to 2026–27. |
| • | | In 2023–24, the major areas of expenditure are in the key frontline services of health and education, which constitute approximately 52.3 per cent of General Government Sector expenses. |
This chapter provides an overview of General Government Sector expenses for the forecast 2023–24 Budget year and projections for 2024–25 to 2026–27. The forward estimates are based on the economic projections outlined in Chapter 2.
| 5.1 | 2022–23 estimated actual |
General Government Sector expenses in 2022–23 are estimated to total $75.317 billion, 0.5 per cent above the 2022–23 Budget estimate, largely attributable to the timing of other operating expenses and grants expenses and higher depreciation costs following revaluations of infrastructure assets in 2021–22.
119
Budget Strategy and Outlook 2023-24
| 5.2 | 2023–24 Budget and outyears |
| Table 5.1 | General Government Sector expenses1 |
| | | | | | | | | | | | | | | | | | | | | | | | |
| | | 2021–22
Outcome
$ million | | | 2022–23
Est. Act.
$ million | | | 2023–24
Budget
$ million | | | 2024–25
Projection
$ million | | | 2025–26
Projection
$ million | | | 2026–27
Projection
$ million | |
Employee expenses | | | 28,068 | | | | 30,279 | | | | 32,175 | | | | 32,825 | | | | 33,864 | | | | 34,930 | |
Superannuation interest costs | | | 377 | | | | 775 | | | | 721 | | | | 665 | | | | 621 | | | | 587 | |
Other superannuation expenses | | | 3,387 | | | | 3,733 | | | | 4,188 | | | | 4,302 | | | | 4,419 | | | | 4,523 | |
Other operating expenses | | | 18,228 | | | | 20,287 | | | | 22,969 | | | | 21,615 | | | | 21,781 | | | | 22,411 | |
Depreciation and amortisation | | | 4,506 | | | | 4,910 | | | | 5,039 | | | | 5,242 | | | | 5,443 | | | | 5,672 | |
Other interest expenses | | | 1,508 | | | | 1,715 | | | | 1,974 | | | | 2,472 | | | | 2,984 | | | | 3,520 | |
Grants expenses | | | 13,817 | | | | 13,618 | | | | 17,195 | | | | 14,845 | | | | 13,542 | | | | 13,570 | |
Total Expenses | | | 69,889 | | | | 75,317 | | | | 84,261 | | | | 81,967 | | | | 82,653 | | | | 85,214 | |
Note: 1. Numbers may not add due to rounding. | | | | | | | | | | | | | | | | | | | | | | | | |
The 2023–24 Budget provides a substantial range of expense measures to address the cost-of-living pressures facing Queenslanders across the state. These measures provide critical and targeted cost-of-living relief for households, businesses and vulnerable Queenslanders.
In 2023–24, General Government Sector expenses are estimated to be $84.261 billion, an expected increase of $8.944 billion (or 11.9 per cent) over the estimated actual for 2022–23. This increase is due in large part to temporary factors including:
| • | | $1.483 billion in additional electricity bill support to households and small businesses facing cost-of-living pressures. All Queensland households will automatically receive a $550 Cost of Living Rebate on their electricity bill in 2023–24, while around 600,000 vulnerable households will benefit from a higher $700 Cost of Living Rebate. Eligible small businesses will also receive an automatic rebate of $650 on their electricity bill in 2023–24 |
| • | | significant $1.7 billion in Disaster Recovery Funding Arrangement (DRFA) expenses in 2023–24, largely for the South East Queensland rainfall and flooding event in the summer of 2022 |
| • | | costs associated with the most recent public sector wages offer including a Cost of Living Adjustment (COLA) payment for employees where inflation exceeds headline wage increases established in agreements |
| • | | energy initiatives under the Queensland Energy and Jobs Plan (QEJP) and community investment programs in regional Queensland, such as the Resources Community Infrastructure Fund. |
120
Budget Strategy and Outlook 2023-24
General Government Sector expenses are expected to decline by 2.7 per cent in 2024–25 as most of the cost-of-living measures are largely limited to addressing inflationary pressures within 2023–24.
| 5.3 | Expenses by operating statement category |
As outlined in Chart 5.1, employee and superannuation expenses account for 44 per cent of the General Government Sector expenses. Other operating expenses (27.3 per cent) follows, reflecting non-labour costs of providing goods and services to government and non-government recipients including, for example, repairs and maintenance but also transport service contract payments to Queensland Rail, subsidies to households and payments to contractors.
| Chart 5.1 | Expenses by operating statement category, 2023–24 |
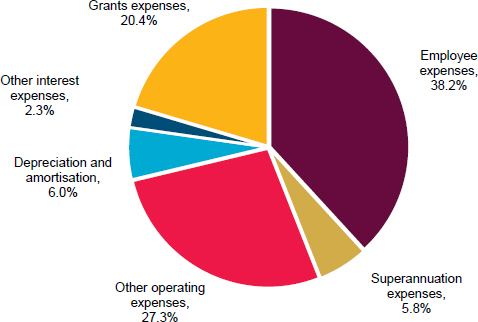
121
Budget Strategy and Outlook 2023-24
| Chart 5.2 | Expenses by operating statement category, 2023–24 |
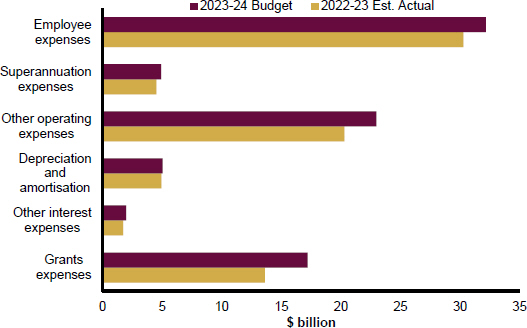
Employee expenses include salaries and wages, annual leave and long service leave.
In 2023–24, employee expenses are expected to be $32.175 billion, $1.896 billion or 6.3 per cent higher than the 2022–23 estimated actual. This increase is due in part to the public sector wage offer and related cost-of-living payments to employees and growth of 1.86 per cent in full-time equivalent employees.
Employee expenses growth is expected to be lower in 2024–25, compared to 2023–24 partly as the cost-of-living payments to employees described below are not expected to be triggered post 2023–24.
Public sector wages policy
Queensland’s public servants are dedicated to delivering essential services to Queenslanders. The majority of public sector certified agreements nominally expired during 2022 or will expire during 2023. The government has always promoted good faith bargaining and in a climate of escalating cost of living, it has established a public sector wages offer that includes the following elements:
| • | | 3-year agreements with wage increases of 4 per cent in years one and two and 3 per cent in year three. This is higher than the previous 2.5 per cent in recognition of prevailing economic circumstances and maintains capacity for strong frontline service delivery |
122
Budget Strategy and Outlook 2023-24
| • | | a Cost of Living Adjustment (COLA) payment for employees where inflation exceeds headline wage increases established in agreements. Where the relevant Brisbane consumer price index (March quarter annual percentage change) is higher than the relevant wage increase under a certified agreement, eligible employees will receive a once-off COLA payment equivalent to the percentage point difference, applied to their base wages and capped at 3 per cent. |
Full-time equivalents
The government is delivering on its commitment to revitalise frontline service delivery. This has contributed to full time equivalents (FTE) increasing by 44,900 FTE from 2014–15 to 2022–23.
As at March 2023, 91.1 per cent of public servants are engaged in frontline and frontline support roles, with 22,031 FTE in corporate service roles.
The government is also committed to ensuring that public service staff are located where there is demand. Around 46 per cent of FTE are located outside Greater Brisbane, of which around 96 per cent are engaged in frontline and frontline support roles. Regional Action Plans show increases in key service delivery occupations across the regions.
FTE are estimated to increase by 4,666 (or 1.86 per cent) in 2023–24, driven principally by increases in Department of Youth Justice, Employment, Small Business and Training, Queensland Health and Queensland Police Service.
The Public Sector Commission publishes a bi-annual Queensland Public Sector Workforce Profile, which includes specific reporting of agencies listed in Table 5.2. The March 2023 workforce profile reports a total of 244,060 FTE for these agencies, an increase of 3,876 FTE since September 2022. The increase reflects growth of 3,190 FTE frontline and frontline support roles and 686 FTE non-frontline roles. It is noted that the reporting basis of the workforce profile reflects active FTE engaged at March 2023 while FTE levels reported in Table 5.2 reflect approved funded FTE positions for the financial year.
123
Budget Strategy and Outlook 2023-24
| Table 5.2 | Funded Controlled FTE positions by Department1 |
| | | | | | | | | | | | |
| | | 2022–23
Adjusted
Budget2 | | | 2022–23
Est. Act.3 | | | 2023–24
Budget | |
Agriculture and Fisheries | | | 2,108 | | | | 2,118 | | | | 2,120 | |
Child Safety, Seniors and Disability Services4 | | | 5,384 | | | | 5,431 | | | | 5,342 | |
Education | | | 76,774 | | | | 76,726 | | | | 77,160 | |
Electoral Commission of Queensland | | | 81 | | | | 81 | | | | 101 | |
Energy and Public Works | | | 2,303 | | | | 2,317 | | | | 2,576 | |
Environment and Science4 | | | 2,863 | | | | 2,864 | | | | 2,958 | |
Housing4 | | | 2,297 | | | | 2,298 | | | | 1,363 | |
Justice and Attorney-General | | | 3,792 | | | | 3,806 | | | | 4,075 | |
Office of the Inspector-General Emergency Management | | | 22 | | | | 22 | | | | 22 | |
Premier and Cabinet | | | 474 | | | | 516 | | | | 589 | |
Public Service Commission | | | 64 | | | | 94 | | | | 82 | |
Queensland Audit Office | | | 191 | | | | 191 | | | | 191 | |
Queensland Corrective Services | | | 6,606 | | | | 6,663 | | | | 7,249 | |
Queensland Fire and Emergency Services | | | 3,901 | | | | 3,900 | | | | 4,145 | |
Queensland Health | | | 105,686 | | | | 105,686 | | | | 106,743 | |
Queensland Police Service | | | 17,548 | | | | 17,549 | | | | 18,350 | |
Queensland Treasury | | | 1,302 | | | | 1,301 | | | | 1,426 | |
Regional Development, Manufacturing and Water | | | 602 | | | | 676 | | | | 714 | |
Resources | | | 1,425 | | | | 1,427 | | | | 1,442 | |
State Development, Infrastructure, Local Government and Planning4 | | | 974 | | | | 1,020 | | | | 1,047 | |
The Public Trustee of Queensland | | | 606 | | | | 606 | | | | 633 | |
Tourism, Innovation and Sport | | | 472 | | | | 503 | | | | 570 | |
Transport and Main Roads | | | 8,675 | | | | 8,769 | | | | 9,564 | |
Treaty, Aboriginal and Torres Strait Islander Partnerships, Communities and the Arts | | | 1,903 | | | | 1,907 | | | | 679 | |
Youth Justice, Employment, Small Business and Training4 | | | 4,778 | | | | 4,883 | | | | 6,879 | |
Total | | | 250,831 | | | | 251,354 | | | | 256,020 | |
Notes: 1. Departmental FTE can also be found in the Service Delivery Statements (SDS). 2. Adjusted Budget reflects movements of FTE following Machinery of Government (MOG) changes (except for agencies per note 4). 3. May be subject to finalisation of MOG change negotiations. 4. For these agencies, the 2022–23 Adjusted Budget and 2022–23 Estimated Actuals information disclosed is presented on a pre-MOG change basis. | |
124
Budget Strategy and Outlook 2023-24
| 5.3.2 | Superannuation expenses |
The superannuation interest cost represents the imputed interest on the government’s accruing defined benefit superannuation liabilities.
In determining the state’s defined benefit superannuation liabilities, Australian Accounting Standards Board (AASB) 119 Employee Benefits requires the discounting of future benefit obligations using yield rates on government bonds net of investment tax. Interest costs are calculated on a net liability approach by applying the discount rate to both the gross liability and superannuation plans.
Superannuation interest costs are dependent on the applicable discount rate at the beginning of the year. Following rate increases in 2021–22, superannuation interest costs are higher in 2022–23 before declining modestly in 2023–24 as forecast rates stabilise. Obligations of the defined benefit scheme, which is closed to new members, will decline over time as members leave.
Other superannuation expenses represent employer superannuation contributions to accumulated superannuation and the current service cost of the state’s defined benefit obligation (or the increase in the present value of the defined benefit obligation resulting from employee service in the current period).
Other superannuation expenses are forecast to increase in 2022–23 and 2023–24 due in part to the public sector wage offer and new superannuation contribution arrangements coming into effect from 1 July 2023.
The Queensland Government is simplifying its employer superannuation contribution arrangements to 18 per cent of salary for police officers, 14.25 per cent for fire service officers and 12.75 per cent of salary for other employees. Superannuation contributions will be paid on base salary, ordinary time allowances and paid leave. Contribution rates into defined benefit categories remain unchanged, with defined benefit members receiving top up payments into accumulation accounts to match the above rates.
| 5.3.3 | Other operating expenses |
Other operating expenses comprise the non-labour costs of providing goods and services including services to government and non-government organisations (NGO), repairs and maintenance, consultancies, contractors, electricity, communication and marketing.
The Queensland Government provides additional funding to departments each year to enable appropriate indexation of service delivery arrangements with community services sector organisations in recognition of increasing costs. The NGO indexation rate, on which this funding is calculated, was approved at 3.88 per cent in the 2022–23 Budget Update.
The government is considering a revision to the 2023–24 NGO indexation rate in light of the Fair Work Commission’s Annual Wage Review decision on 2 June 2023 and higher forecast inflation in 2023–24.
Other operating expenses in 2023–24 are estimated to total $22.969 billion, representing an increase of $2.682 billion or 13.2 per cent, compared to the 2022–23 estimated actual.
125
Budget Strategy and Outlook 2023-24
The increase in other operating expenses can be attributed to:
| • | | $1.483 billion in additional electricity bill support to households and small businesses facing cost-of-living pressures. All Queensland households will automatically receive a $550 Cost of Living Rebate on their electricity bill in 2023–24, while around 600,000 vulnerable households will benefit from a higher $700 Cost of Living Rebate. Eligible small businesses will also receive an automatic rebate of $650 on their electricity bill in 2023–24 |
| • | | school education-related initiatives and additional funding under the National School Reform Agreement and associated Bilateral Agreement |
| • | | an increase in transport funding including higher Transport Service Contract payments to Queensland Rail |
| • | | further support for domestic and family and sexual violence services and expansion of a comprehensive youth justice reform agenda to target serious repeat offenders, support community safety and address the complex causes of youth crime |
| • | | offset by agency contributions towards new budget initiatives, totalling $90 million in 2023–24. |
| 5.3.4 | Depreciation and amortisation |
Depreciation and amortisation expenses is an estimate of the progressive consumption of the state’s assets through normal usage, wear and tear and obsolescence. Growth in this expense category primarily reflects the increasing investment in state infrastructure and asset revaluations.
| 5.3.5 | Other interest expenses |
Other interest expenses include interest paid on borrowings, finance leases and similar arrangements to acquire capital assets and infrastructure such as roads and government buildings such as hospitals and state schools.
Other interest expenses are estimated to increase $259 million in 2023–24 to $1.974 billion as borrowing with QTC increases to fund the expanded capital program.
Other interest expenses are estimated to be lower across all years of the forward estimates compared to the 2022–23 Budget Update due to the improved net cash flows from operating activities, mainly from the temporary uplift in royalty income in 2022–23.
Current grants include grants and subsidies to the community (such as non-state schools, hospitals, benevolent institutions and local governments) and personal benefit payments. Community Service Obligations are provided where Public Non-financial Corporations (PNFCs) are required to provide non-commercial services or services at non-commercial prices for the benefit of the community (for further details refer to Chapter 8).
Capital grants also represent transfers to the PNFC Sector, local governments, not-for-profit institutions and non-state schools, businesses and households (including the Queensland First Home Owners’ Grant) for capital purposes.
126
Budget Strategy and Outlook 2023-24
Table 5.3 provides a breakdown of grants by category and recipient type.
| | | | | | | | | | | | |
| | | 2021–22
Outcome
$ million | | | 2022–23
Est. Act.
$ million | | | 2023–24
Budget
$ million | |
Current | | | | | | | | | | | | |
Grants to local government2 | | | 1,581 | | | | 450 | | | | 755 | |
Grants to private and not-for-profit organisations | | | | | | | | | | | | |
State funding for non-state schools | | | 834 | | | | 848 | | | | 867 | |
Australian Government funding for non-state schools | | | 3,634 | | | | 3,935 | | | | 4,114 | |
Other3 | | | 2,009 | | | | 2,783 | | | | 3,679 | |
Grants to other sectors of government | | | | | | | | | | | | |
Community service obligations to PNFCs | | | 550 | | | | 645 | | | | 560 | |
Other payments to PNFCs and PFCs | | | 59 | | | | 137 | | | | 160 | |
Other (includes payments to NDIA) | | | 2,142 | | | | 2,092 | | | | 2,347 | |
Other | | | 878 | | | | 405 | | | | 386 | |
Total current grants | | | 11,686 | | | | 11,295 | | | | 12,868 | |
Capital | | | | | | | | | | | | |
Grants to local government4 | | | 1,262 | | | | 1,498 | | | | 2,111 | |
State funding for non-state schools | | | 118 | | | | 123 | | | | 127 | |
Grants to private and not-for-profit organisations | | | 326 | | | | 444 | | | | 1,295 | |
Grants to PNFCs | | | 41 | | | | 43 | | | | 411 | |
Queensland First Home Owners’ Grants | | | 143 | | | | 76 | | | | 72 | |
Other | | | 240 | | | | 139 | | | | 311 | |
Total capital grants | | | 2,130 | | | | 2,323 | | | | 4,327 | |
Total current and capital grants | | | 13,817 | | | | 13,618 | | | | 17,195 | |
Notes:
| 1. | Numbers may not add due to rounding. |
| 2. | Current grants to local governments were higher in 2021–22 due to the advance payment by the Australian Government of Financial Assistance Grants for the 2022–23 financial year on-passed to local councils, and payments made in relation to waste disposal levy in 2021–22. |
| 3. | Other current grants to private and non-financial organisations include fuel subsidy payments as part of the joint program with the Australian Government to contain electricity price increases. |
| 4. | Capital grants to local governments increase in 2023–24 compared to 2022–23 in large part due to DRFA grants. |
127
Budget Strategy and Outlook 2023-24
In 2023–24, grant expenses are estimated to total $17.195 billion, $3.577 billion higher than the 2022–23 estimated actual. The increase is mainly due to:
| • | | lower Australian Government Financial Assistance Grants (FAGs) to local councils in 2022–23 with the Australian Government making the 2022–23 FAGs payments in the 2021–22 financial year |
| • | | implementation of a cap of $125 per tonne on the price of coal used for electricity generation in Queensland. This program is part of the Energy Price Relief Plan agreed by National Cabinet in December 2022 and funded in partnership with the Australian Government |
| • | | higher Australian Government grants on-passed to non-government schools |
| • | | substantial reconstruction and resilience programs under the DRFA in partnership with the Australian Government, in the main for the 2022 flooding disaster events. Further details are discussed in Chapter 3 |
| • | | additional funding for the Resources Community Infrastructure Fund |
| • | | introduction of 15 hours per week of free kindergarten from 1 January 2024 for all 4-year-old children |
| • | | additional grant funding to support the delivery of social and affordable housing to address housing pressures |
| • | | provision for the transfer of non-financial assets to the PNFC sector. |
Grants expenses are expected to decline in 2024–25 as some funding boosts conclude and the substantial DRFA program of work for the 2022 flood event draws closer to completion.
| 5.4 | Operating expenses by purpose |
Chart 5.3 indicates the proportion of expenditure by major purpose classification for the 2023–24 Budget. Health accounts for the largest share of expenses (28.8 per cent) followed by Education (23.5 per cent).
In 2023–24, the substantial Cost of Living Rebates to households and small businesses and additional funding to alleviate housing pressures increase the social protection, housing and other community services functions relative share of total General Government Sector expenses.
Similarly, disaster payments for local council road infrastructure under DRFA increase transport services and social protection, housing and other community services’ respective share of expenses comparative to most other expenditure.
128
Budget Strategy and Outlook 2023-24
| Chart 5.3 | General Government Sector expenses by purpose, 2023–24 |
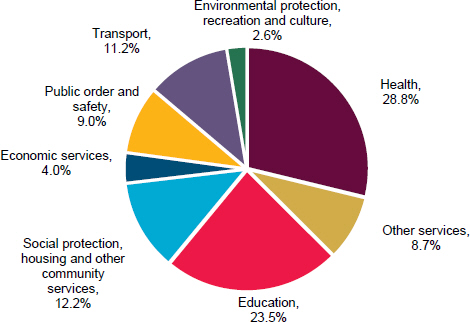
129
Budget Strategy and Outlook 2023-24
| 6 | Balance sheet and cash flows |
Features
| • | | The increase in revenue is providing capacity to reinvest in the economy and service capacity while still keeping General Government Sector borrowings lower in 2025–26. |
| • | | General Government Sector net debt at 30 June 2023 is forecast to be $5.852 billion. This is less than half of what was expected at the time of the 2022–23 Budget. |
| • | | Net Debt in the General Government Sector is expected to be lower in every year of the forward estimates compared to estimates in the 2022–23 Budget. |
| • | | By 2025–26, Queensland’s forecast net debt of $37.648 billion is around one quarter of the latest available estimate of $162.202 billion for Victoria (2023–24 Budget) and less than half of $116.505 billion (latest estimate, 2022–23 Half-Yearly review) for New South Wales. |
| • | | Forecast borrowings for 2023–24 have been progressively revised down since the 2021–22 Budget, consistent with prudent management of revenue improvements from unusually high commodity prices. |
| • | | As the Queensland Government continues to support jobs and economic growth, borrowing will grow over the forward estimates but is still expected to be $2.158 billion lower by 2025–26 than at the time of the 2022–23 Budget, and is expected to be $9.542 billion lower by 2024–25 than at the time of the 2021–22 Budget. |
| • | | The capital program over the 4 years to 2026–27 totals $89 billion. The profile of the capital program over the forward estimates includes public infrastructure investment in projects associated with the Queensland Energy and Jobs Plan (QEJP), delivering the health capacity expansion announced in the 2022–23 Budget, providing critical water infrastructure and preparing for the Brisbane 2032 Olympic and Paralympic Games. |
| • | | The Non-financial Public Sector (NFPS) capital program for the period 2023–24 to 2026–27 comprises $76.905 billion of purchases of non-financial assets (PNFA), $9.768 billion of capital grant expenses and acquisitions of non-financial assets under finance leases and similar arrangements of $2.055 billion. |
| • | | Positive NFPS operating cash flows of $48.118 billion are projected from 2022–23 to 2026–27. This will fund 53.2 per cent of the $90.507 billion PNFA over the same period. |
| • | | The net worth of the state has increased in 2022–23 by over $50 billion compared to the 2022–23 Budget estimates. The increase is due to the increase in the value of non-financial assets and investments, and improved operating position resulting in lower borrowings in 2022–23. |
130
Budget Strategy and Outlook 2023-24
The balance sheet shows the projected assets, liabilities and net worth of the General Government Sector as at 30 June each year. A resilient balance sheet provides the government with the capacity to respond to immediate financial and economic events, such as those brought about by the prolonged COVID-19 variant outbreaks and the severity of recent natural disasters.
With a strong balance sheet supporting the government’s targeted response to these events, the economy continues to recover and grow to assist Queenslanders in their time of need.
The cash flow statement shows the expected cash flows of the General Government Sector during each financial year of the forward estimates. While the operating statement is reported in accrual terms — that is, when revenues and expenses are recognised — the cash flow statement is reported in cash terms — that is, when revenues are received, and payments are made.
The largest differences between cash and accrual accounting relate to depreciation and defined benefit superannuation.
Table 6.1 summarises the key balance sheet aggregates for the General Government Sector.
| Table 6.1 | General Government Sector – summary of budgeted balance sheet1 |
| | | | | | | | | | | | | | | | | | | | | | | | |
| | | 2022–23
Budget
$ million | | | 2022–23
Est. Act.
$ million | | | 2023–24
Budget
$ million | | | 2024–25
Projection
$ million | | | 2025–26
Projection
$ million | | | 2026–27
Projection
$ million | |
Financial assets | | | 76,000 | | | | 79,580 | | | | 84,347 | | | | 87,778 | | | | 91,246 | | | | 94,751 | |
Non-financial assets | | | 261,316 | | | | 297,064 | | | | 304,312 | | | | 314,265 | | | | 322,951 | | | | 331,199 | |
Total assets | | | 337,316 | | | | 376,644 | | | | 388,659 | | | | 402,043 | | | | 414,197 | | | | 425,950 | |
Borrowings | | | 66,459 | | | | 54,693 | | | | 65,479 | | | | 76,040 | | | | 85,127 | | | | 94,814 | |
Advances | | | 1,745 | | | | 1,782 | | | | 1,734 | | | | 1,818 | | | | 2,236 | | | | 2,184 | |
Superannuation liability | | | 24,069 | | | | 21,205 | | | | 20,827 | | | | 20,075 | | | | 19,047 | | | | 17,752 | |
Other provisions and liabilities | | | 28,790 | | | | 29,753 | | | | 29,845 | | | | 30,209 | | | | 30,521 | | | | 30,120 | |
Total liabilities | | | 121,062 | | | | 107,434 | | | | 117,886 | | | | 128,142 | | | | 136,930 | | | | 144,870 | |
Net worth | | | 216,254 | | | | 269,210 | | | | 270,774 | | | | 273,900 | | | | 277,266 | | | | 281,080 | |
Net financial worth | | | (45,062 | ) | | | (27,853 | ) | | | (33,538 | ) | | | (40,365 | ) | | | (45,685 | ) | | | (50,119 | ) |
Net financial liabilities | | | 67,517 | | | | 52,570 | | | | 61,953 | | | | 73,129 | | | | 81,905 | | | | 89,603 | |
Net debt | | | 19,772 | | | | 5,852 | | | | 16,190 | | | | 28,074 | | | | 37,648 | | | | 46,934 | |
Note:
| 1. | Numbers may not add due to rounding. |
131
Budget Strategy and Outlook 2023-24
The major categories of financial assets are investments, loans and placements and investments in other public sector entities. Investments, loans and placements incorporate investments held to meet future liabilities, including superannuation and insurance, as well as investments relating to the Queensland Future Fund (QFF) – Debt Retirement Fund (DRF), which have a positive impact on the state’s ratings metrics. The General Government Sector holds the equity in the state’s public enterprises, principally the shareholding in government-owned corporations (GOCs) but also Public Financial Corporations like Queensland Treasury Corporation (QTC), in much the same manner as the parent or holding company in a group of companies.
Total financial assets of $79.580 billion are estimated for 2022–23, $3.580 billion higher than published in the 2022–23 Budget. Investments, loans and placements have increased by $2.063 billion since the 2022–23 Budget, predominantly due to setting aside investments to support the Housing Investment Fund and Queensland’s energy transformation, partly offset by market value adjustments. The investments set aside for delivering affordable and reliable energy for Queenslanders are budgeted to be largely drawn down and rolled out to GOCs as equity contributions over the forward estimates.
As the value of GOCs increases due to capital investment and revaluations, total financial assets are expected to increase by $4.767 billion to $84.347 billion by 30 June 2024. Further increases in the value of public enterprises and expected returns on investments, mean financial assets will continue to grow over the forward estimates and are projected to reach $94.751 billion by 30 June 2027.
Chart 6.1 shows forecast General Government Sector financial assets by category at 30 June 2024.
132
Budget Strategy and Outlook 2023-24
| Chart 6.1 | Forecast General Government Sector financial assets by category, at 30 June 2024 |
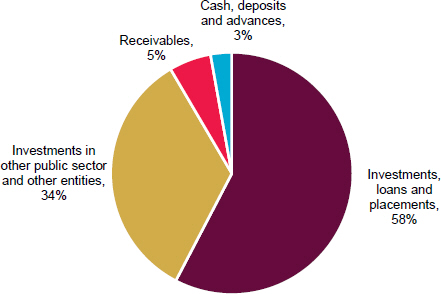
| 6.2.2 | Non-financial assets |
General Government Sector non-financial assets are estimated to be $297.064 billion at 30 June 2023, $35.748 billion higher than expected in the 2022–23 Budget.
Non-financial assets in 2023–24 are expected to increase by a further $7.248 billion to be $304.312 billion at 30 June 2024.
Total non-financial assets at 30 June 2024 consist primarily of land and other fixed assets of $296.744 billion, the majority of which are roads, schools, hospitals and other infrastructure. Other non-financial assets of $7.568 billion held by the state include prepayments and deferred income tax assets relating to GOCs.
General Government Sector capital expenditure for 2023–24 is forecast to be $13.674 billion, which comprises $9.347 billion of PNFA and $4.327 billion of capital grant expenses. In addition, acquisitions of non-financial assets under finance leases and similar arrangements are forecast to be $814 million, bringing the General Government Sector capital program for 2023–24 to $14.488 billion.
Over the 4 years to 2026–27, General Government Sector capital expenditure is forecast to be $53.838 billion, which comprises $43.626 billion of PNFA and $10.212 billion of capital grants expenses. Acquisitions of non-financial assets under finance leases and similar arrangements are forecast to be $1.679 billion, bringing the total General Government Sector capital program over the period to $55.517 billion.
133
Budget Strategy and Outlook 2023-24
Over the forward estimates, the government will invest in:
| • | | transformative transport infrastructure, including additional train rollingstock, Gold Coast Light Rail, M1 highway upgrades and Cross River Rail |
| • | | construction of new schools |
| • | | critical infrastructure upgrades and construction, including the Woodford Youth Detention Centre, hospitals and social housing |
| • | | venue infrastructure for the Brisbane 2032 Olympic and Paralympic Games. |
The finance leases and similar arrangements are mainly in relation to Public Private Partnerships (PPPs). PPPs total $2.761 billion over the period 2022–23 to 2026–27 and includes the Tunnel, Stations and Development components of Cross River Rail and construction of Gold Coast Light Rail Stage 3.
Over the 4 years to 2026–27, the capital program for the Public Non-financial Corporations sector is forecast to be $33.727 billion. This is $20.286 billion more than the 2022–23 Budget capital program for this sector, mainly due to the roll-out of the QEJP, which will transform Queensland’s energy system over the next 10 to 15 years to deliver clean, reliable and affordable power. Queensland’s publicly-owned energy businesses are investing in new wind, solar, storage and transmission infrastructure. This includes up to 7 gigawatts of large-scale, long duration pumped hydro, a $5 billion investment in CopperString 2032 connecting the North West Minerals Province to the national electricity grid, and a strong pipeline of renewable energy and storage projects.
The NFPS capital purchases for the 4 years from 2022–23 to 2025–26 have increased by $19.489 billion since the 2022–23 Budget. Over this same period, the operating cash flows for the NFPS have increased by nearly $13 billion. As a result, the increase in capital purchases is to be largely funded by operating cash flows.
Table 6.2 shows the increase in NFPS capital purchases since the 2022–23 Budget.
| Table 6.2 | Non-financial Public Sector – Capital Purchases1 |
| | | | | | | | | | | | |
| | | 2022–23
Budget
$ million | | | 2023–24
Budget
$ million | | | Increase
$ million | |
Capital Purchases - 4 years to 2025–26 | | | | | | | | | | | | |
General Government Sector | | | 36,288 | | | | 41,431 | | | | 5,144 | |
Public Non-financial Corporations Sector | | | 13,164 | | | | 27,607 | | | | 14,443 | |
Other adjustments | | | — | | | | (98 | ) | | | (98 | ) |
Total Non-financial Public Sector | | | 49,451 | | | | 68,940 | | | | 19,489 | |
Largely funded by operating cash flows | | | | | | | | | | | 12,768 | |
Note:
| 1. | Numbers may not add due to rounding. |
134
Budget Strategy and Outlook 2023-24
The current estimate of the capital program over the 4 years to 2026–27 is $88.729 billion. The PNFA by the NFPS over this period are forecast to be $76.905 billion. With capital grant expenses of $9.768 billion, this brings total capital expenditure to $86.673 billion. In addition to this, acquisitions of non-financial assets under finance leases and similar arrangements of $2.055 billion bring the total capital program over the period to $88.729 billion.
General Government Sector
Total General Government Sector liabilities are estimated to be $107.434 billion at 30 June 2023, a decrease of $13.628 billion since 2022–23 Budget, predominantly due to lower-than-expected borrowings.
Total liabilities are expected to increase by $10.452 billion in 2023–24 to be $117.886 billion. General Government Sector borrowing with QTC will increase by $10.480 billion in 2023–24, to be $57.494 billion. This is $8.921 billion lower than the 2022–23 Budget estimate for 2023–24 due to capital investment being partially funded by the uplift in revenue. General Government Sector borrowing with QTC is then forecast to grow over the forward estimates as the state invests in job-creating infrastructure projects and commits to delivering the QEJP through equity contributions to the PNFC sector.
By 2025–26, borrowing with QTC is expected to reach $78.104 billion, $2.518 billion lower than expected in the 2022–23 Budget. In 2026–27, total borrowing with QTC will increase by $10.050 billion from 2025–26 to $88.154 billion.
The defined benefit superannuation liability is projected to be $21.205 billion at 30 June 2023, $2.864 billion lower than expected in the 2022–23 Budget. This is predominantly due to a change in actuarial assumptions. By 30 June 2024 the superannuation liability is projected to be $20.827 billion and is expected to continue to decline over the forward estimates as bond rates continue to recover, and members of the defined benefit fund retire. The fund has been closed to new entrants since 2008.
The composition of the General Government Sector’s forecast liabilities at 30 June 2024 is illustrated in Chart 6.2.
135
Budget Strategy and Outlook 2023-24
| Chart 6.2 | Forecast General Government Sector liabilities by category, as at 30 June 2024 |
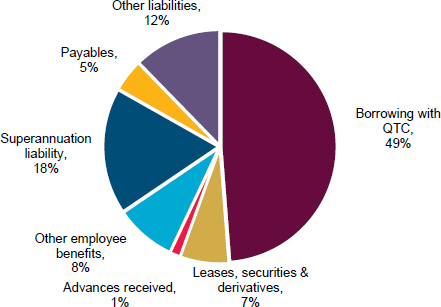
Non-financial Public Sector borrowing
The NFPS is a consolidation of the General Government and PNFC sectors, with transactions between these sectors eliminated.
PNFC debt is primarily held by GOCs and is supported by income-generating assets including key pieces of economic infrastructure.
NFPS borrowing is expected to be $102.561 billion by 30 June 2023, $8.225 billion lower than the 2022–23 Budget. Within the NFPS borrowing, derivative liabilities are estimated to be $2.012 billion higher than expected in the 2022–23 Budget. This increase largely relates to the electricity GOCs, due to movements in the value of hedging contracts entered into prior to an upward shift in market conditions. These liabilities are expected to reverse as pool prices reduce and electricity is delivered.
Net debt is the sum of borrowing and advances received, less the sum of cash and deposits, advances paid, and investments, loans and placements.
Net debt excludes certain assets and liabilities, such as superannuation and insurance liabilities. However, it still indicates the soundness of the government’s fiscal position, as high levels of net debt will require servicing through interest payments and limit flexibility to adjust expenditure.
Net debt for the General Government Sector in 2022–23 is estimated to be $5.852 billion, $13.920 billion lower than expected in the 2022–23 Budget. The lower net debt is predominantly the result of improved operating cash flows in 2022–23, and lower net debt rolling forward from the 2021–22 outcome.
136
Budget Strategy and Outlook 2023-24
Net debt is lower in each year than estimated in the 2022–23 Budget and by 2025–26 is estimated to be $1.566 billion lower than the 2022–23 Budget.
Chart 6.3 shows the net debt to revenue ratio in 2023–24 for the NFPS is lower than forecast at the time of the 2021–22 Budget.
| Chart 6.3 | Ratio of non-financial public sector net debt to revenue |
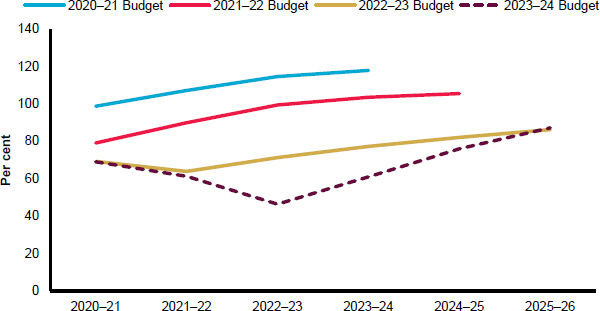
| 6.2.5 | Net financial liabilities |
Net financial liabilities are total liabilities, less financial assets other than equity instruments in other public sector entities. This measure is broader than net debt as it includes other significant liabilities rather than just borrowings (e.g. accrued employee liabilities such as superannuation and long service leave entitlements).
The net financial liabilities of the General Government Sector for 2022–23 are estimated to be $52.570 billion and are estimated to increase by $9.383 billion by 30 June 2024. This increase is commensurate with the expected increase in borrowings to invest in infrastructure to deliver economic growth and better services for Queenslanders, offset in part by an increase in investments, loans and placements and receivables.
137
Budget Strategy and Outlook 2023-24
The net worth, or equity, of the state is the amount by which the state’s assets exceed its liabilities. This is the value of the investment held on behalf of the people of Queensland by public sector entities.
Changes in the state’s net worth occur for several reasons including:
| • | | operating surpluses (deficits) that increase (decrease) the government’s equity |
| • | | revaluation of assets and liabilities as required by accounting standards |
| • | | movements in the net worth of the state’s investments in the PNFC and Public Financial Corporations sectors |
| • | | gains or losses on disposal of assets – where the selling price of an asset is greater (less) than its value in an agency’s accounts, the resultant profit (loss) affects net worth. |
General Government Sector net worth was $249.624 billion at 30 June 2022. It is expected to increase to $269.210 billion in 2022–23.
Net worth has increased in 2022–23 with the improved operating position and increases in the value of non-financial assets and investments in other public sector entities.
The net worth of the NFPS is projected to steadily grow over the forward estimates to be $281.080 billion by 2026–27.
The cash flow statement provides the cash surplus (deficit) measure, which comprises the net cash flows from operating activities plus the net cash flows from investments in non-financial assets (or physical capital).
The General Government Sector cash surplus for 2022–23 is estimated to be $7.717 billion, which is $14.480 billion higher than the deficit forecast at the time of the 2022–23 Budget. This is largely due to an improved operating position driven by the prudent management of revenue improvements from unusually high commodity prices and the economic recovery.
A cash deficit of $7.010 billion is forecast for 2023–24. Net cash flows from operating activities increased over the forward estimates compared to 2023–24, contributing to the government’s investment in non-financial assets and alleviating the need to fund these investments completely through borrowing.
Net cash flows from investments in financial assets for policy purposes include net cash flows from disposal or return of equity, net equity injections into GOCs and concessional loans and advances. Cash flows from the injection of equity into the PNFC and Public Financial Corporations sector are the primary driver of net outflows of $11.086 billion over the period from 2023–24 to 2026–27. These equity injections will support the QEJP and GOC infrastructure projects.
138
Budget Strategy and Outlook 2023-24
Net cash flows from investments in financial assets for liquidity purposes represent net investment in financial assets to, for example, cover liabilities such as superannuation and insurance, as well as deposits and withdrawals to or from the redraw facility with QTC and other specific investments.
Total General Government Sector PNFA of $9.347 billion are budgeted for 2023–24. Over the period from 2023–24 to 2026–27, General Government Sector PNFA are expected to total $43.626 billion as Queensland invests substantially in economic growth, energy transformation, health, education, roads and rail infrastructure to provide better services and a great lifestyle for Queenslanders as it prepares for the Brisbane 2032 Olympic and Paralympic Games.
139
Budget Strategy and Outlook 2023-24
| 7 | Intergovernmental financial relations |
Features
| • | | The federal financial relations framework recognises that coordinated action and clear lines of responsibility for funding and service delivery are crucial for maximising economic and social outcomes and to strategically position the nation for the future. |
| • | | One of the Australian Government’s functions under this framework is providing funding to states to deliver essential services and infrastructure, representing approximately 47.9 per cent of all Queensland’s General Government revenue in 2023–24. |
| • | | It is estimated the Australian Government will provide the Queensland Government with $39.300 billion in 2023–24 ($3.175 billion more than in 2022–23), comprising: |
| | • | | $18.613 billion1 in payments for specific purposes ($1.471 billion more than 2022–23) |
| | • | | $1.210 billion in other Australian Government grants, including payments direct to Queensland Government agencies for Australian Government own-purpose expenditure ($623 million more than 2022–23) |
| | • | | $19.477 billion in payments for general purposes ($1.080 billion more than 2022–23). Further detail is provided in Chapter 4. |
| • | | Payments for specific purposes to Queensland in 2023–24 include: |
| | • | | $6.509 billion for Quality Schools funding2 |
| | • | | $6.503 billion for National Health Reform funding |
| | • | | $4.903 billion for National Partnership payments (including the Infrastructure Investment Program, Disaster Recovery Funding Arrangements (DRFA), National Energy Bill Relief, the South East Queensland City Deal and the Brisbane 2032 Olympic and Paralympic Games) |
| | • | | $356 million for National Housing and Homelessness funding |
| | • | | $343 million for National Skills and Workforce Development funding. |
| • | | National Partnership payments to Queensland will increase in 2023–24 primarily due to: large Disaster Recovery Funding Arrangements (DRFA) payments relating to the 2021–22 floods, funding to support projects in the South East Queensland City Deal and funding to support the delivery of targeted energy bill assistance to eligible households and small businesses in Queensland. |
| • | | The Queensland Government provides considerable assistance to local governments, recognising the important services they provide to the community, and will provide a total of $2.866 billion to local governments in 2023–24. |
| 1 | Total payments for specific purposes may not add due to rounding. |
| 2 | Quality Schools funding includes payments for government schools (exclusive of GST) and non-government schools (inclusive of GST). |
140
Budget Strategy and Outlook 2023-24
| 7.1 | Federal financial arrangements |
The Australian Government has greater capacity to raise revenue than is required to meet its service delivery responsibilities. Conversely, states and territories’ (states) ability to raise revenue is less than required to meet their service delivery and infrastructure responsibilities. This vertical fiscal imbalance (VFI) is addressed through a system of intergovernmental payments from the Australian Government to the states.
In 2021–22, the Australian Government collected 71 per cent of government revenue nationally, while states collected 23.5 per cent, with local governments responsible for the balance (5.6 per cent)1. Chart 7.1 illustrates the revenue and expense disparity between the different levels of government.
| Chart 7.1 | Own-source revenue and expenses by levels of government, 2021–221,2 |
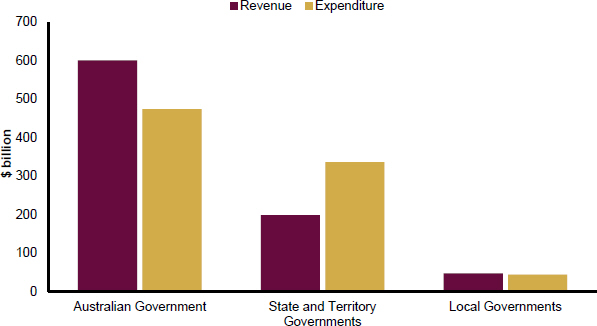
Notes:
| 1. | Revenue calculated as total revenue minus grant revenue. |
| 2. | Expenses calculated as total expenses minus grant expenses. |
Source: ABS Government Finance Statistics.
| 1 | ABS Government Finance Statistics. |
141
Budget Strategy and Outlook 2023-24
To address VFI, the Australian Government makes 2 types of payments:
| • | | general revenue assistance payments (largely GST revenue) which can be used by states for any purpose (‘untied’ funding) |
| • | | payments for specific purposes (‘tied’ funding) such as National Specific Purpose Payments (SPPs), which are a contribution toward states’ service delivery priorities, and National Partnership (NP) payments, which represent funding to support the delivery of specific priorities, outputs or projects and to facilitate or incentivise reforms. |
Given the Australian Government’s significant revenue raising capability, states are heavily reliant on these intergovernmental transfers to provide essential services and infrastructure.
As part of the national governance arrangements, the Council on Federal Financial Relations (CFFR; Chaired by the Australian Treasurer and comprising all state Treasurers) oversees national agreements and transfers between the Australian Government and states.
States have also formed the Board of Treasurers (the Board) to collaborate on common issues, advance national reform priorities from state and territory perspectives, and promote united agenda setting in federal affairs. The Board is chaired by a state Treasurer on a rotational basis for a calendar year — Queensland is the Chair in 2023.
The Board focuses on key community issues such as health and housing. This includes the implementation of the National Housing Accord which supports outcomes from the Queensland Housing Summit.
The remainder of this chapter focuses on payments for specific purposes. Detail on GST revenue is provided in Chapter 4.
| Box 7.1 | The four major funding agreements |
Queensland Government is committed to working collaboratively with the Australian Government towards sustainable, long-term funding arrangements that give states the flexibility to deliver services and infrastructure that are responsive to the local context.
Queensland Government is currently negotiating multiple agreements with the Australian Government, including the National Health Reform Agreement, National School Reform Agreement, National Skills Agreement and the National Housing and Homelessness Agreement. Combined, these 4 agreements account for $13.710 billion of the $18.613 billion (73.7 per cent) Queensland will receive in 2023–24 in specific purposes funding.
Health
The 2020–25 Addendum to the National Health Reform Agreement (NHRA) — an agreement between the Australian Government and the states to improve health outcomes for all Australians and ensure a sustainable health system — will expire on 30 June 2025.
142
Budget Strategy and Outlook 2023-24
The mid-term review of the NHRA has commenced and is due to be delivered to Health Ministers by the end of 2023. The review will consider whether the current NHRA funding arrangements are fit-for-purpose given emerging priorities, such as the need for better integrated care and improving interfaces between the health and primary care, mental health, aged care and disability sectors.
The Queensland Government is providing input to the review ahead of renegotiations of the next NHRA, which is due to commence from 1 July 2025. The Queensland Government seeks funding flexibility to deliver best outcomes and will work with the Australian Government to address short-term funding issues and embed long-term fiscal sustainability in the Queensland and national health systems.
Education
The National School Reform Agreement (NSRA) — an agreement between the Australian Government and the states to lift student outcomes across Australian schools — will expire at the end of 2023.
In December 2022, Education Ministers agreed to establish an expert panel to undertake a review to inform the development of the next NSRA, with the final report to be delivered to Education Ministers by 31 October 2023. To provide time for this work, it is proposed the current NSRA will be extended for 12 months to 31 December 2024.
The Queensland Government will work with the Australian Government to ensure a well-resourced school system that enables better learning and wellbeing outcomes for all Queensland school students.
Housing
The National Housing and Homeless Agreement (NHHA) — the key agreement that defines roles in funding and provides housing and homelessness services — is supported by bilateral schedules that expire on 30 June 2023. The Australian and Queensland governments have agreed in-principle to extend the existing NHHA bilateral schedule by 12 months to 30 June 2024 while long-term funding arrangements are being considered.
The Queensland Government seeks to secure long-term future funding arrangements that account for the pressures on the state’s housing market, in the context of the recommendations from the Productivity Commission’s study report on the NHHA — In Need of Repair: The National Housing and Homeless Agreement — the National Housing Accord, and the National Housing and Homelessness Plan.
Skills
The Queensland Government is currently negotiating a long-term National Skills Agreement (NSA) with the Australian Government to replace the existing National Agreement for Skills and Workforce Development following the Productivity Commission’s review in 2019.
Through this process, the Queensland Government is focused on ensuring Queenslanders can access high quality and relevant training and skills required to support the ongoing growth and resilience of the Queensland economy and prepare us for the future.
143
Budget Strategy and Outlook 2023-24
| 7.2 | Australian Government funding to all states and territories |
In the 2023–24 Federal Budget Paper No.3: Federal Financial Relations, the Australian Government estimates it will provide funding of $179.863 billion in 2023–24 across all states, which is $11.039 billion (or 6.5 per cent) more than in 2022–23, comprising:
| • | | $91.536 billion in payments as shares of general revenue assistance (i.e. GST revenue) ($5.078 billion more than in 2022–23) |
| • | | $87.393 billion in payments for specific purposes ($6.590 billion more than in 2022–23) including: |
| | • | | $28.535 billion in National Health Reform funding |
| | • | | $28.288 billion in Quality Schools funding |
| | • | | $1.707 billion in National Housing and Homelessness funding |
| | • | | $1.670 billion in National Skills and Workforce Development funding |
| | • | | $1.110 billion in National Energy Bill Relief |
| | • | | $26.083 billion in National Partnership payments (e.g. Infrastructure Investment Program, National Water Grid Fund, DisabilityCare Australia Fund and Preschool Reform Agreement). |
| • | | $934.3 million in other payments to states, including: |
| | • | | $890.3 million for certain royalty payments to Western Australia |
| | • | | $44.0 million for municipal services to the Australian Capital Territory. |
Australian Government payments for specific purposes may not fully fund all underlying programs. Some require states to provide matching contributions or other financial or in-kind contributions. This reduces budget flexibility for states, particularly in cases where it is not a Queensland Government priority or where the Australian Government dictates specific conditions related to the funding.
| Box 7.2 | Australian Government Independent Strategic Review of the Infrastructure Investment Program |
The Australian Government commenced an Independent Strategic Review of its Infrastructure Investment Program (the review) in May 2023, to be completed within 90 days. The purpose is to deliver a pipeline of land transport infrastructure that is sustainable, aligned to market capacity and comprised of nationally significant projects.
While the review is conducted, the Australian Government has deferred decisions on future infrastructure investment for projects within the scope of the review.
144
Budget Strategy and Outlook 2023-24
The Queensland Government will continue to advocate for the state’s fair share of the national program through this process. This must reflect Queensland’s status as the state with the fastest growing population — the Queensland Government will seek to ensure Queensland will not be worse off and that the Australian Government maintains its current level of funding for the transport corridors that connect the state’s dispersed population centres and other priority locations.
The Queensland Government would expect that priority transport infrastructure projects, including those that support delivery of the Brisbane 2032 Olympic and Paralympic Games, will be considered separately from any deferral arrangements as part of the review.
| 7.3 | Australian Government funding to Queensland |
It is estimated the Australian Government will provide the Queensland Government with $39.300 billion in 2023–24 ($3.175 billion more than in 2022–23).
Australian Government funding is estimated to account for 47.9 per cent of Queensland’s total General Government Sector revenue sources in 2023–24 (shown in Chart 7.2).
The proportion of Queensland’s revenue derived from Australian Government funding has grown significantly from 35 per cent at the time of the introduction of the GST in 2000.
145
Budget Strategy and Outlook 2023-24
| Chart 7.2 | General Government Sector revenue sources, Queensland 2023–241,2 |
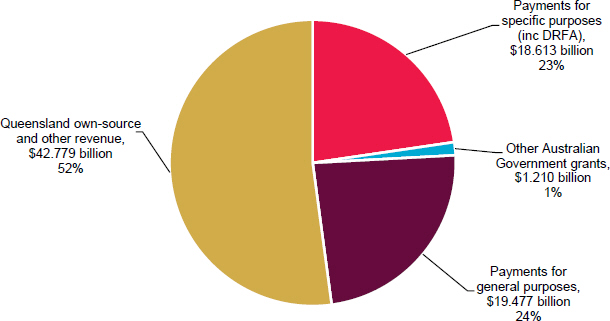
Notes:
| 1. | Queensland own-source and other revenue figure includes taxation revenue, sales of goods and services, royalties and land rents. |
| 2. | Queensland Treasury estimates. Other Australian Government grants include payments direct to Queensland Government agencies for Australian Government own-purpose expenditure. |
Sources: 2023–24 Federal Budget Paper No. 3 and Queensland Treasury estimates.
| 7.4 | Payments to Queensland for specific purposes |
In 2023–24, Queensland expects to receive $18.613 billion1 in payments for specific purposes, $1.471 billion (8.6 per cent) more than in 2022–23.
Payments for specific purposes comprise funding for National Health Reform, Quality Schools, National Housing and Homelessness, the Skills and Workforce Development National SPP and NP payments.
| 1 | Queensland Treasury estimates. |
146
Budget Strategy and Outlook 2023-24
| Table 7.1 | Estimated payments of Australian Government grants1 |
| | | | | | | | | | | | |
| | | 2021–22
Actual
$ million | | | 2022–23
Est. Act.
$ million | | | 2023–24
Budget
$ million | |
Payments for specific purposes | | | | | | | | | | | | |
Skills and Workforce Development funding | | | 321 | | | | 330 | | | | 343 | |
National Health Reform funding2 | | | 6,505 | | | | 6,232 | | | | 6,503 | |
Quality Schools funding3 | | | 5,793 | | | | 6,219 | | | | 6,509 | |
National Housing and Homelessness funding | | | 335 | | | | 343 | | | | 356 | |
National Partnership payments (incl. DRFA) | | | 3,663 | | | | 4,019 | | | | 4,903 | |
Total payments for specific purposes | | | 16,617 | | | | 17,142 | | | | 18,613 | |
Other Australian Government grants4 | | | 1,082 | | | | 587 | | | | 1,210 | |
Total payments for specific purposes and other Australian Government grants | | | 17,699 | | | | 17,729 | | | | 19,824 | |
Notes:
| 1. | Numbers may not add due to rounding. |
| 2. | Includes funding for the COVID-19 public health response of $894.6 million in 2021–22 and $192.7 million in 2022–23. The National Partnership on COVID-19 Response expired on 31 December 2022, with the Australian Government minimum funding guarantee ending in 2021–22. |
| 3. | Quality Schools funding includes payments for government schools (exclusive of GST) and non-government schools (inclusive of GST). |
| 4. | Includes direct Australian Government payments to Queensland agencies for Australian Government own-purpose expenditure (e.g. financial assistance grants to local government and funding to Hospital and Health Services). |
Sources: 2023–24 Federal Budget Paper No. 3 and Queensland Treasury estimates.
In 2023–24, National Health Reform funding, which accounts for 34.9 per cent of the total payments for specific purposes, is estimated to increase by $271 million (4.4 per cent) from 2022–23. The small increase in 2023–24 is due to the unwinding of COVID-19 public health response funding. If the impact of the COVID-19 health response funding is removed, National Health Reform funding is expected to increase by $464 million (7.7 per cent) from 2022–23.
Queensland Government projections of National Health Reform funding differ from the projections contained in the 2023–24 Federal Budget as Australian Government projections represent cash payments made in the financial year (rather than the entitlement amount for the financial year) and include adjustments for services delivered in prior years. Actual National Health Reform payments vary from estimates provided in budget papers as they are based on actual public hospital activity delivered each year.
Quality Schools funding, which accounts for 35 per cent of the total payments for specific purposes, is estimated to increase by $290 million (4.7 per cent) to $6.509 billion in 2023–24.
National Housing and Homelessness funding is estimated to increase by $13 million (3.8 per cent) in 2023–24, which comprises indexation and a temporary funding boost to address the homelessness challenges revealed in the 2021 Census.
147
Budget Strategy and Outlook 2023-24
Skills and Workforce Development funding is expected to increase by $13 million (3.9 per cent) in 2023–24 compared to 2022–23. Given the priority to grow a skilled and highly productive workforce in a tight labour market, the Australian, state and territory governments are working towards finalising a new National Skills Agreement to replace the Skills and Workforce Development SPP.
NP payments (including DRFA) account for 26.3 per cent of the total payments for specific purposes in 2023–24. It is estimated to increase by $885 million (22 per cent) from 2022–23 to 2023–24. A significant proportion of NP payments in 2023–24 is allocated to DRFA, infrastructure and other (refer to Chart 7.3).
| Chart 7.3 | National Partnership Payments by sector, 2023–241 |
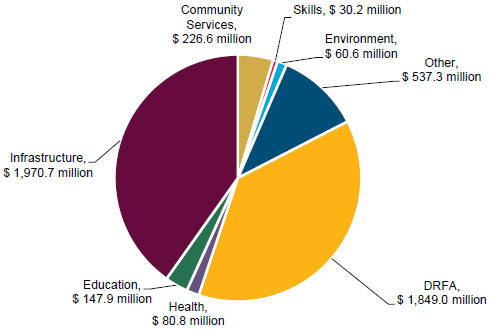
Note:
| 1. | Excludes Australian Government funding to local government and payments direct to Queensland Government agencies for Australian Government own-purpose expenditure. |
Sources: 2023–24 Federal Budget Paper No. 3 and Queensland Treasury estimates.
The increase in NP payments between 2022–23 and 2023–24 is mainly due to:
| • | | large DRFA payments in 2023–24 relating to the 2021–22 flood events |
| • | | new Australian Government funding from 2023–24 to support projects in the South East Queensland City Deal |
| • | | new Australian Government funding from 2023–24 to support the delivery of targeted energy bill assistance to eligible households and small businesses in Queensland. |
Other Australian Government grants include payments direct to Queensland Government agencies for Australian Government own-purpose expenditure.
148
Budget Strategy and Outlook 2023-24
In 2023–24, Queensland expects to receive $1.210 billion in other Australian Government grants, $623 million (106.2 per cent) more than in 2022–23. The significant increase is mainly due to the Australian Government’s bring forward of financial assistance grants to local governments from 2022–23 to 2021–22.
| 7.4.1 | Projections of payments for specific purposes to Queensland |
Across the forward estimates, total payments for specific purposes (including DRFA payments) are expected to increase modestly, with average growth of approximately 1.5 per cent between 2023–24 and 2026–27. If the impact of DRFA payments is removed, the average growth of total payments for specific purposes is expected to be 5.1 per cent between 2023–24 and 2026–27.
National Health Reform funding is expected to grow by an average of 6.5 per cent over the forward estimates. Under the National Health Reform Agreement, the Australian Government will fund 45 per cent of efficient growth in hospital activity subject to a national growth cap of 6.5 per cent per annum. Current estimates are based on this methodology.
Growth in Quality Schools funding for Queensland is expected to average 3.4 per cent between 2023–24 and 2026–27 in line with enrolment changes, increased funding per student and legislated Commonwealth funding shares. Queensland is expecting to receive $10.111 billion for state schools and $17.342 billion (including GST) for non-government schools from 2023–24 to 2026–27.
Growth in NP payments (excluding DRFA) for Queensland are expected to average 6.2 per cent between 2023–24 and 2026–27. The increase is mainly due to:
| • | | $1.076 billion over the forward estimates from 2023–24 to support venue infrastructure for the Brisbane 2032 Olympic and Paralympic Games |
| • | | $390.7 million over the forward estimates from 2023–24 to support projects in the South East Queensland City Deal, in addition to other related funding arrangements |
| • | | $328.5 million estimated from 2023–24 to 2024–25 to support the delivery of targeted energy bill assistance to eligible households and small businesses in Queensland |
| • | | $285 million over the forward estimates from 2022–23 to support the establishment of a Queensland Cancer Centre in Brisbane. |
DRFA payments of $3.356 billion are estimated from 2022–23 to 2024–25. These mainly reflect Australian Government funding for eligible expenditure under DRFA for the 2021–22 Queensland disaster season, including significant flood events.
Under the Intergovernmental Agreement on Federal Financial Relations, the Australian Government provides time-limited funding to states through NP payments to support the delivery of specific projects, facilitate reforms or reward states that deliver on nominated reforms or service delivery improvements.
149
Budget Strategy and Outlook 2023-24
Over time, some NPs have been extended beyond their intended time-limited purpose to continue funding services. NPs were never intended, and are not considered the optimal way, to fund ongoing community service needs.
Expiring NP agreements that support long standing and effective services or programs leave states with limited opportunities to appropriately manage consequences as final funding decisions are made through the Australian Government’s budget process.
Early indication from the Australian Government as to the continuation, lapse or other treatment of funding for an expiring agreement is necessary to enable states to effectively manage their service delivery responsibilities.
There are 26 agreements1 expected to expire in 2022–23. At the 2023–24 Federal Budget, the Australian Government allocated funding beyond 2022–23 for 14 expiring agreements, including the following key agreements:
| • | | National School Chaplaincy Program – replaced by the National Student Wellbeing Program with funding from 2022–23 to 2026–27 |
| • | | Public Dental Services for Adults – funding extended to 2024–25 |
| • | | Family, Domestic and Sexual Violence Responses – national funding allocated over two years from 2023–24 to extend the agreement, with state allocations yet to be finalised |
| • | | Wet Tropics of Queensland and Tasmanian Wilderness World Heritage Areas – funding extended to 2027–28 |
| • | | World Heritage Management – funding extended to 2027–28 |
| • | | Lansdown Eco-Industrial Precinct – additional funding committed to 2024–25 |
| • | | Port of Townsville Channel Capacity Upgrade – funding reprofiled to 2024–25 to reflect updated project completion date |
| • | | HomeBuilder – extension announced. |
The 2023–24 Federal Budget did not allocate funding beyond 2022–23 for 5 expiring funding agreements:
| • | | Operation of Hummingbird House |
| • | | Japanese Encephalitis Virus Mitigation through Mosquito Surveillance and Control |
| • | | Recreational Fishing and Camping Facilities Program |
| • | | Improve NDIS Participant Transition in Queensland |
| • | | Stimulating South Queensland Sheep Production – Building Strategic Alliance in southwest Lamb Supply Chains (Paroo Sheep Meat Value Chain Hub). |
A funding extension or renewal was not sought for the remaining 7 expiring agreements due to the short-term nature of the program or completion of the project. These include temporary funding provided for JobTrainer, COVID-19 World and National Heritage projects, implementation of the Australian Fire Danger rating system and the joint national Japanese encephalitis response program (agricultural industries).
| 1 | Includes any expiring schedules to Federation Funding Agreements. |
150
Budget Strategy and Outlook 2023-24
| 7.5 | State–local government financial relations |
The Queensland Government allocates considerable funding in the 2023–24 Queensland Budget to support local governments across the state. This recognises the critical role local governments play in supporting their local communities.
In 2023–24, the Queensland Government will provide a total of $2.866 billion in grants to local governments.
This includes recurrent and capital grants to local government authorities and Indigenous councils, as well as Australian Government grants paid through the state to local governments.
Grants to local governments are delivered through numerous Queensland Government departments and agencies for a variety of purposes, including through the programs discussed below.
A summary of Queensland Government grant programs that have been made exclusively available to local governments are listed in Table 7.2.
151
Budget Strategy and Outlook 2023-24
| Table 7.2 | Grant programs exclusively available to local governments |
| | | | |
Program name | | Description | | Total funding
(from 2015–16
to 2026–27) |
| Works for Queensland | | Supports local governments in regional areas to undertake job creating maintenance and minor infrastructure works. | | $1 billion |
| | |
COVID Works for Queensland | | Supports all local governments to respond to and recover from the COVID-19 pandemic to deliver job creating new infrastructure, maintenance or minor works projects. | | $200 million1 |
| | |
| South East Queensland (SEQ) Community Stimulus Program | | Supports South East Queensland local governments to fast-track investment in new infrastructure and community assets that create jobs and deliver economic stimulus to local communities. | | $200 million |
| | |
| Unite and Recover Community Stimulus Package | | Supports South East Queensland local governments to recover from the COVID-19 pandemic by fast-tracking investment in new infrastructure and community assets that create jobs and deliver economic stimulus to local communities. | | $50 million1 |
| | |
| Transport Infrastructure Development Scheme | | Provides targeted investment in regional local government transport infrastructure. | | $846 million2 |
| | |
| Building our Regions | | Provides funding for critical infrastructure in regional areas to support economic development, including generating jobs. | | $418.3 million |
| | |
| Local Government Grants and Subsidies Program | | Provides funding for priority infrastructure projects that will enhance sustainable and liveable communities. | | $347.9 million2 |
| | |
| Coastal Hazard Adaptation Program – QCoast2100 | | Assists coastal local governments to prepare plans and strategies for addressing the impact of climate change. | | $20.2 million |
| | |
| Queensland Water Regional Alliances Program | | Assists regional councils to collaborate and improve the efficiency and administration of water infrastructure. | | $14.2 million |
Notes:
| 1. | These programs are stimulus measures in response to the COVID-19 pandemic and are scheduled to cease following 2023–24. |
| 2. | Funding is ongoing. Figure is based on current projections. |
In addition to the above grant programs, the Queensland Reconstruction Authority (QRA) administers funding available under the Disaster Recovery Funding Arrangements, which is a joint funding initiative of the Queensland and Australian Governments to provide disaster relief and recovery payments to help communities recover following the effects of natural disasters.
Under these arrangements, the Queensland Government administers significant funding to local governments (more than $1.259 billion expected in 2023–24), including to provide disaster relief and assist with reconstruction of local government infrastructure damaged during natural disasters. The amount of funding administered is dependent on the final number and value of claims submitted.
152
Budget Strategy and Outlook 2023-24
QRA also administers several resilience programs of the Queensland and Australian Governments to support disaster mitigation projects and build resilience to natural disasters. These programs include the Queensland Resilience and Risk Reduction Fund, the North Queensland Natural Disasters Mitigation Program, and the National Flood Mitigation Infrastructure Program.
The Queensland Government also understands there are added challenges and disadvantages faced by Indigenous councils to ensure their communities have access to essential services and critical infrastructure, including low populations, remoteness and dispersion. To help address these challenges, the Queensland Government has allocated substantial operating funding to specifically support Indigenous councils and their communities.
The Indigenous Council Funding Program will replace the State Government Financial Aid, the Indigenous Economic Development Grant and the Revenue Replacement Program. Funding from the replaced programs will be combined into a single grant which will continue to support Indigenous Councils to service their communities and deliver critical infrastructure. This will simplify and improve the way State funding is provided to Indigenous Councils.
The 2023–24 Budget commits $25.8 million in 2023–24 in addition to existing funding for the Indigenous Council Funding Program.
A summary of grant programs that have been made available to Indigenous councils and their communities are listed in Table 7.3.
153
Budget Strategy and Outlook 2023-24
| Table 7.3 | Grant programs to support Indigenous councils and their communities |
| | | | |
Program name | | Description | | Total funding
(from 2015–16
to 2026–27) |
| Indigenous Council Funding Program1 | | Assists Indigenous councils to address financial sustainability and capacity issues. | | $208 million |
| Indigenous Councils Critical Infrastructure Program | | Contributes to the cost of water, wastewater and solid waste infrastructure in Indigenous communities. | | $120 million |
| Indigenous Economic Development Grant2 | | Contributes funding towards service positions to support permanent jobs that deliver local government services. | | $11.5 million |
| Major Infrastructure Program | | Deliver environmental, health and other infrastructure upgrades within the Torres Strait Island Regional Council, Torres Shire Council and Northern Peninsula Area Regional Council areas. | | $15 million |
| Revenue Replacement Program2 | | Provides funding to assist Indigenous councils that have divested or surrendered profitable liquor licenses. | | $28.2 million |
| State Government Financial Aid2 | | A financial contribution (in lieu of rates) to meet the costs incurred by Indigenous councils in the provision of local government services. | | $265.7 million |
| Indigenous Local Government Sustainability Program (2016–18) | | Assisted Indigenous councils to increase their capacity, capability and sustainability. | | $7.7 million |
Notes:
| 1. | This is a new program, replacing the Indigenous Economic Development Grant, Revenue Replacement Program and State Government Financial Aid (total funding reflects 2023–24 to 2026–27). |
| 2. | This program will cease from 1 July 2023 and funding will be allocated through the new Indigenous Council Funding Program (total funding reflects 2015–16 to 2022–23). |
154
Budget Strategy and Outlook 2023-24
| 8 | Public Non-financial Corporations Sector |
Features
| • | | Entities in the Public Non-financial Corporations (PNFC) Sector provide essential services such as electricity supply and distribution, bulk water supply, rail, and port services. |
| • | | The Queensland Government has a strong commitment to maintaining public ownership of its assets, and expects these businesses to operate commercially and efficiently, and to work towards continually improving services to Queenslanders. |
| • | | The PNFC Sector is expected to achieve earnings before interest and tax (EBIT) of $3.829 billion in 2023–24, a $1.482 billion increase from 2022–23. Sector-wide earnings over the forward estimates reflect the improved performance of the electricity sector. |
| • | | The 2023–24 Budget includes a landmark capital investment of around $19 billion over the forward estimates to deliver on the Queensland Energy and Jobs Plan (QEJP). The government’s publicly-owned energy businesses are leading Queensland’s energy transformation, investing in new wind, solar, storage and transmission, supported by the $4.5 billion Queensland Renewable Energy and Hydrogen Jobs Fund. |
| • | | As a cornerstone of the QEJP, the newly established Queensland Hydro will deliver up to 7 gigawatts (GW) of large-scale, long-duration pumped hydro. The government is also investing $5 billion in CopperString 2032, a 1,100-kilometre transmission line from Townsville to Mount Isa, and delivering a strong pipeline of renewable energy and storage projects. |
| • | | Increased borrowings over the forward estimates primarily reflect capital requirements to deliver the QEJP and investments to support water security. Key projects in the water sector include the Fitzroy to Gladstone Pipeline, Rookwood Weir, Mount Crosby Flood Resilience Program, Toowoomba to Warwick Pipeline, and South West Pipeline. |
| • | | Major transport sector projects continuing in 2023–24 include the Channel Capacity Upgrade at the Port of Townsville, expansion of the Cairns Marine Precinct, and a range of rail infrastructure projects to support the transformation of the Citytrain network. |
| • | | In 2022–23, PNFC Sector dividends are expected to be $511 million, or $304 million lower than forecast at the 2022–23 Budget, largely due to movements in the value of electricity hedging contracts. Returns from the PNFC Sector contribute to consolidated revenue and are used to pay for various government services, including investment into critical infrastructure delivered by PNFC Sector entities. |
| • | | The 2023–24 Budget delivers $1.483 billion in 2023–24 for additional electricity bill support to households and small businesses facing cost-of-living pressures. As part of this package, all Queensland households will automatically receive a $550 Cost of Living Rebate on their electricity bill in 2023–24, while around 600,000 vulnerable households will benefit from a higher $700 Cost of Living Rebate. |
155
Budget Strategy and Outlook 2023-24
| • | | Including the $550 Cost of Living Rebate in 2023–24, the government will have provided all Queensland households with a total of $1,125 in electricity rebates since 2018. |
| • | | These payments complement the government’s longstanding commitment under the Uniform Tariff Policy that all Queenslanders pay a similar price for electricity no matter where they live. To support the Uniform Tariff Policy, the government provides an annual Community Service Obligation payment, costing $537 million in 2023–24. |
| • | | The new progressive coal royalty rates announced in the 2022–23 Budget ensure that Queenslanders receive a fair return on the state’s valuable natural resources. The government is funding productivity-enhancing investments across regional Queensland, with $10 billion for PNFC Sector infrastructure projects supported by coal royalties in the energy, water, and ports sectors. |
Entities comprising the PNFC Sector provide vital services such as electricity supply and distribution, water supply, rail, and port services.
Queensland government owned corporations (GOCs), declared by regulation under the Government Owned Corporations Act 1993 (GOC Act), comprise a large share of the PNFC Sector. The sector also comprises commercialised statutory entities, including Queensland Rail, Queensland Bulk Water Supply Authority (trading as Seqwater), local water boards, and other public corporations (such as Queensland Hydro and Stadiums Queensland).
GOCs are accountable for their financial performance and must operate commercially and efficiently. These requirements are legislated under the GOC Act with similar provisions made in the enabling legislation of Queensland Rail and Seqwater. Entities incur costs and bear commercial risks in the delivery of their services or products, and target a commercial rate of return from the sale of these services or products to sustain ongoing investment and performance.
Returns from the PNFC Sector contribute to consolidated revenue and are used to pay for various government services, including investment into critical infrastructure delivered by PNFC Sector entities.
Community Service Obligation (CSO) payments are used to subsidise particular services so they can be offered to the community at prices lower than would otherwise be possible if full cost recovery and normal margins were applied.
A key example is the CSO paid to Energy Queensland Limited (EQL) to provide electricity in regional Queensland at prices based on the costs of supply in South East Queensland, in accordance with the government’s Uniform Tariff Policy. This policy ensures that electricity prices for most customers in regional Queensland are much lower than would otherwise be the case.
156
Budget Strategy and Outlook 2023-24
The commercial nature of PNFC Sector entities ensures debt is self-supporting and net worth continues to grow over the forward estimates. The Queensland Government has a strong ongoing commitment to maintain public ownership of the entities in the PNFC Sector. Public ownership of electricity, port, rail, and water infrastructure provides the Queensland Government with opportunities to support strategic investment in a growing economy and achieve better outcomes for all Queenslanders.
| Box 8.1 | Reinvesting in the regions |
The new progressive coal royalty rates announced in the 2022–23 Budget ensure that Queenslanders receive a fair return on this valuable natural resource. The uplift in royalties has allowed the Queensland Government to invest more than $16 billion towards economic and social infrastructure and essential services to meet the needs of Queenslanders across all regions of the state. Box 4.7 provides further detail.
In the 2022–23 Budget Update, the government committed to utilise the uplift in royalty revenue to fund $4 billion in productivity-enhancing investments across regional Queensland. This will support investments across energy, water, and ports sectors for projects which will underpin Queensland’s future economic prosperity.
In this Budget, the government is providing an additional $6 billion in funding for the Borumba Pumped Hydro Energy Storage project. This brings the Government’s total commitment to $10 billion for relevant regional PNFC sector infrastructure projects funded by the general government sector equity injections supported by coal royalties, and includes:
| • | | $1.06 billion towards CopperString 2032, which will support the construction of the 1,100-kilometre transmission line from Townsville to Mount Isa, connecting Queensland’s North West Minerals Province to the national electricity grid |
| • | | $7 billion towards state-owned, large-scale, long-duration pumped hydro, including $6 billion for the Borumba project over the construction period and $1 billion for the Pioneer-Burdekin project |
| • | | $550 million towards the Fitzroy to Gladstone Pipeline, enabling long term water security in the region |
| • | | $500 million for CleanCo to support a 2.3 GW portfolio of wind and solar projects in Central Queensland |
| • | | $440 million towards Sunwater’s Burdekin Falls Dam Improvement and Raising Project, improving and raising the dam by two metres to further support water security, noting this is on top of the existing $100 million commitment towards the project |
| • | | $300 million for CS Energy to pursue investments in new wind projects and energy firming options to support future industrial decarbonisation in Central Queensland |
| • | | $100 million for Gladstone Port Corporation’s Northern Land Expansion project, subject to approvals, supporting the release of additional land at Gladstone Port and the development of renewable energy and other industries |
157
Budget Strategy and Outlook 2023-24
| • | | $50 million for the replacement of North Queensland Bulk Ports’ Bowen Wharf, with the plans, designs, and approvals subject to further consultation with stakeholders. |
| Table 8.1 | Key financial aggregates1 |
| | | | | | | | | | | | | | | | | | | | | | | | | | | | |
| | | 2021–22
Outcome
$ million | | | 2022–23
Budget
$ million | | | 2022–23
Est. Act.
$ million | | | 2023–24
Budget
$ million | | | 2024–25
Projection
$ million | | | 2025–26
Projection
$ million | | | 2026–27
Projection
$ million | |
Revenue | | | 15,951 | | | | 13,589 | | | | 15,835 | | | | 15,746 | | | | 15,578 | | | | 16,539 | | | | 17,816 | |
Expenses | | | 14,888 | | | | 12,389 | | | | 14,887 | | | | 15,116 | | | | 14,951 | | | | 15,541 | | | | 16,499 | |
Net Operating Balance | | | 1,062 | | | | 1,199 | | | | 948 | | | | 630 | | | | 626 | | | | 998 | | | | 1,317 | |
PNFA2 | | | 3,134 | | | | 3,334 | | | | 4,489 | | | | 5,849 | | | | 8,735 | | | | 8,534 | | | | 10,233 | |
Assets | | | 91,338 | | | | 74,953 | | | | 80,459 | | | | 82,492 | | | | 88,371 | | | | 94,694 | | | | 102,088 | |
Borrowings | | | 59,495 | | | | 44,334 | | | | 47,875 | | | | 45,166 | | | | 46,120 | | | | 48,664 | | | | 52,207 | |
Notes:
| 1. | Numbers may not add due to rounding. |
| 2. | PNFA: Purchases of non-financial assets. |
| 8.1.1 | Electricity networks |
The government owns two electricity network businesses, Powerlink Queensland and Energy Queensland Limited, which are responsible for transporting safe, reliable electricity to consumers across the state.
Revenues for the network businesses are largely derived from network services that are regulated by the Australian Energy Regulator (AER). The AER determines these revenues on a 5-yearly basis, based on the businesses’ proposals and its view of the reasonable benchmark efficient costs for a network business.
Powerlink
Powerlink owns, develops, operates, and maintains the electricity transmission network in Queensland. Its network spans approximately 1,700km from north of Cairns to the New South Wales border and comprises 15,345km of transmission lines and 147 substations.
Powerlink’s role in the electricity supply chain is to transmit high voltage electricity through its transmission grid to the distribution networks. Powerlink also transmits electricity to high-usage industrial customers such as rail companies, mines, and mineral processing facilities, and to New South Wales via the Queensland/New South Wales interconnector transmission line.
158
Budget Strategy and Outlook 2023-24
Powerlink took carriage of the CopperString 2032 project in March this year, with early works expected to commence later in 2023, and construction in 2024. Under the QEJP, Powerlink is also progressing investments to deliver the Queensland SuperGrid and renewable energy zones.
Energy Queensland Limited
Energy Queensland Limited (EQL) owns and operates the low-voltage distribution network that transmits electricity from Powerlink’s transmission network to households and businesses across Queensland. EQL has several operating subsidiary businesses, including Ergon Energy Network, Ergon Energy Retail, Energex, and Yurika.
In regional Queensland, Ergon Energy Network and Ergon Energy Retail provide distribution network and customer retail services, respectively, while in South East Queensland, Energex provides distribution network services to customers.
Yurika provides in a range of other service delivery functions including demand management services, large-scale connections, microgrid solutions, the provision of contestable metering services, and telecommunications infrastructure. Yurika is focused on pursuing strategic investments in unregulated markets to provide greater choice to commercial and industrial customers.
The Queensland Government is investing $5 billion in CopperString 2032, a 1,100-kilometre transmission line from Townsville to Mount Isa that will connect Queensland’s North West Minerals Province to the national electricity grid.
This project will unlock one of Australia’s largest renewable energy zones and potentially more than $500 billion in new critical minerals in North Queensland. To be delivered by Powerlink, CopperString 2032 will connect vast renewable wind and solar resources with critical minerals mining and processing that can be used to make batteries and renewables.
CopperString 2032 is one of the most significant investments in economic infrastructure ever seen in North Queensland and has the potential to support around 800 direct jobs over its 6-year construction period (to 2029), and thousands more in critical minerals mining and renewable energy industries. Early works are expected to start later in 2023 and construction in 2024.
In the 2023–24 Budget, $1.06 billion has been allocated towards CopperString 2032, made available from the progressive coal royalties introduced at the 2022–23 Budget.
This project is being delivered as part of the QEJP, a pathway to transition Queensland to clean, reliable and affordable power.
159
Budget Strategy and Outlook 2023-24
| 8.1.2 | Electricity generation |
Queensland has three electricity generation GOCs – CleanCo, CS Energy and Stanwell. To date, these GOCs have committed to own or offtake over 2.4 GW of new renewable generation, 850 megawatts (MW) of new large-scale batteries, and are progressing a range of additional investment opportunities.
Public ownership of generation assets positions Queensland to transform the state’s energy system and deliver the government’s decarbonisation objectives – 50 per cent renewables by 2030, 70 per cent by 2032, and 80 per cent by 2035 – and reach net zero emissions by 2050.
CleanCo
CleanCo owns and operates a portfolio of low and no emissions generation assets. In addition to its foundation portfolio, CleanCo is on track to meet its commitment to deliver at least 1,400 MW of new renewable energy by 2025. This is being achieved through power agreements with wind and solar farms in the Darling Downs, Western Downs, and Far North Queensland, and to build, own and operate Swanbank Battery.
CleanCo is continuing to grow its renewable project pipeline, working with partners to develop a publicly owned and operated renewable project portfolio of up to 2.3 GW in Central Queensland. CleanCo is also supporting the sustainable energy goals of major commercial customers, including BHP and Coles, by entering long-term agreements to supply firmed renewable energy.
CS Energy
CS Energy is a major supplier of electricity across Queensland, with an energy portfolio of around 3,500 MW, including the wholly-owned Callide B and Kogan Creek Power Stations and a 50 per cent interest in the Callide C Power Station. CS Energy is also a party to the Gladstone Interconnection and Power Pooling Agreement, and trades output of the Gladstone Power Station that exceeds the electricity requirements of the Boyne Island Aluminium Smelter.
In line with the QEJP, CS Energy is diversifying its portfolio as it invests in renewable generation, storage and gas-peaking capacity, and hydrogen development. CS Energy’s investments in projects such as the 200 MW Greenbank Battery, Brigalow hydrogen-ready gas peaking plant at Kogan Creek, wind farms in Central Queensland, and the Kogan Renewable Hydrogen Project near Chinchilla, are all being supported by the Queensland Renewable Energy and Hydrogen Jobs Fund.
CS Energy also provides retail services to large commercial and industrial customers throughout Queensland, and has a 50/50 joint venture with Alinta Energy to supply electricity to residential and small business customers in South East Queensland.
Stanwell
Stanwell is a major supplier of electricity across Queensland, with an energy portfolio of around 3,300 MW from its three coal-fired power stations in Queensland. Stanwell also sells electricity directly to large commercial and industrial customers in Queensland and interstate.
160
Budget Strategy and Outlook 2023-24
Stanwell is advancing a pipeline of new energy projects across Queensland, focusing on renewable generation, storage, and hydrogen. Stanwell has entered energy offtake agreements with several renewable projects, including the Mount Hopeful and Clarke Creek Wind Farms in Central Queensland, and the Blue Grass Solar Farm and MacIntyre Wind Farms in Southern Queensland.
In 2023–24, Stanwell will be supported by the Queensland Renewable Energy and Hydrogen Jobs Fund to continue the development of the Wambo Wind Farm in partnership with global renewables developer, Cubico Sustainable Investments, progress the Tarong West Wind Farm, and also undertake a Front End Engineering Design Study of the Central Queensland Hydrogen Project near Gladstone, with a consortium of partners.
| Box 8.3 | Queensland Energy and Jobs Plan |
The Queensland Energy and Jobs Plan outlines the state’s pathway to transform the energy system over the next 10 to 15 years to deliver clean, reliable, and affordable power, creating a platform for strong economic growth and continued investment.
The QEJP charts an ambitious infrastructure investment pathway to 2035, including two large-scale pumped hydros in regional Queensland, 22 GW of new renewable energy, and major new transmission lines across the state which will form Queensland’s SuperGrid.
In total, the 2023–24 Budget includes a landmark capital investment of around $19 billion across the forward estimates to support the Queensland Energy and Jobs Plan.
The government’s publicly-owned energy businesses are leading Queensland’s energy transformation, investing in new wind, solar, storage and transmission, supported by the $4.5 billion Queensland Renewable Energy and Hydrogen Jobs Fund. To date, $2.7 billion has been allocated from the Fund, including:
| • | | $192.5 million for Stanwell’s 252 MW Wambo Wind Farm near Dalby, $776.1 million for Stanwell’s 500 MW Tarong West Wind Farm near Kingaroy, and $563.5 million for CS Energy’s wind investments in Central Queensland |
| • | | $330 million for CleanCo’s Swanbank Battery and $218 million for CS Energy’s Greenbank Battery, and a $500 million allocation to large-scale and community batteries under Action 1.3 of the Queensland Energy and Jobs Plan |
| • | | $85.5 million for CS Energy’s Brigalow Hydrogen-ready Gas Peaking Plant |
| • | | $28.9 million for CS Energy’s Kogan Renewable Hydrogen Project and $15 million for Stanwell’s Central Queensland Hydrogen Project Front End Engineering Design Study. |
Through coal royalties, the government has also allocated $300 million to CS Energy for energy projects supporting decarbonisation in Central Queensland, as well as $500 million to CleanCo to support 2.3 GW of renewables projects in Central Queensland.
161
Budget Strategy and Outlook 2023-24
The government is also delivering the critical deep storage capacity essential to Queensland’s future energy system. This includes the 2 GW Borumba Pumped Hydro Energy Storage project which will be a cornerstone of Queensland’s energy system. The 2023–24 Budget approves $6 billion in equity funding over the project’s construction phase, enabling Queensland Hydro to deliver this world class project while it also continues to lead the detailed feasibility study into the Pioneer-Burdekin Pumped Hydro Energy Storage project.
As outlined by the QEJP, Queensland’s existing publicly owned thermal generation assets will be transformed into clean energy hubs to support critical system reliability and stability. This work has already begun at CS Energy’s Kogan Creek Clean Energy Hub, comprising the Chinchilla Battery, Kogan Renewable Hydrogen Demonstration Plant, and future Brigalow Hydrogen-ready Gas Peaking Power Plant.
Throughout the transformation, the government is committed to maintaining public ownership of energy assets and supporting impacted communities and workers through a range of initiatives, including a $150 million Job Security Guarantee Fund to support affected energy workers through the transformation.
Queensland Rail is an integrated, publicly-owned rail operator, responsible for the delivery of passenger transport in South East Queensland, long distance passenger services in rural and regional Queensland, and provision of third-party access to networks for freight transport across the state.
The majority of services are delivered under a Rail Transport Services Contract (TSC) with the government, represented by the Department of Transport and Main Roads. The Rail TSC provides funding for rail infrastructure, Citytrain (South East Queensland passenger services) and Traveltrain (regional passenger services).
In 2023–24, Queensland Rail will continue to work with external partners and support delivery of significant new rail infrastructure to transform the Citytrain network, including the Cross River Rail project, new stations and accessibility upgrades, modern signalling equipment and additional train stabling capacity. These investments will increase rail service delivery for the state’s growing population and support local manufacturing supply chains, and jobs in regional areas.
Queensland has a large network of ports along its coastline that are owned and run by GOCs. These businesses, Gladstone Ports Corporation (GPC), North Queensland Bulk Ports Corporation (NQBP), Port of Townsville Limited (POTL), and Far North Queensland Ports Corporation Limited (trading as Ports North), own and operate a range of assets from small facilities serving local communities to large, world class multi-user and multi-cargo ports, which have public and privately owned import and export facilities.
162
Budget Strategy and Outlook 2023-24
Queensland’s ports play an essential role in the state’s supply chain networks by planning and delivering strategic projects which facilitate trade activity. Their ongoing efficient and responsible operation is critical to economic growth, job creation and sustainable development across the state.
Major port projects continuing throughout 2023–24 include:
| • | | the continuation of the $251 million Channel Capacity Upgrade at the Port of Townsville to improve freight export and import opportunities for North Queensland |
| • | | the completion of the $21 million Multi-Use Conveyor at the Port of Bundaberg, in partnership with the Australian Government and Sugar Terminals Limited |
| • | | expansion of the Cairns Marine Precinct (CMP) with delivery of 2 new wharves as part of a $32 million early works package. Further to this investment, the Queensland Government has committed $180 million, subject to approvals, to deliver an expansion of the CMP with the development of a Common User Facility. The proposed facility will include a 5,000 tonne shiplift, 3 hardstand areas, 2 blast and paint sheds and wet berth capacity to cater for vessels up to 120 metres in length. The Queensland Government is working with the Australian Government, which has committed a co-contribution of $180 million, bringing total funding to $360 million to progress the project |
| • | | working with various proponents in Gladstone, Townsville, and other major ports to identify and progress potential hydrogen-related project opportunities. |
The two largest entities in the Queensland bulk water supply industry are the Queensland Bulk Water Supply Authority (trading as Seqwater) and Sunwater Limited (Sunwater). Other water entities in the PNFC Sector include the Gladstone Area Water Board and Mount Isa Water Board.
Seqwater is primarily responsible for supplying safe, secure and reliable bulk drinking water for over 3 million people across South East Queensland. Its assets and operations are spread across a large geographic area from the New South Wales border to the base of the Toowoomba ranges and as far north as Gympie. Seqwater also provides essential flood mitigation services, manages seven water supply schemes which provide irrigation services and provides a range of community recreation facilities.
Sunwater is the government’s major bulk water supply business for regions outside of South East Queensland. It supplies untreated bulk water to approximately 5,000 customers across the industrial, mining, urban and irrigation customer segments. Sunwater provides this through an extensive regional asset base, owning and managing water infrastructure assets with a replacement value of around $14 billion.
During 2023–24, the Queensland Government is delivering additional water supply, fortifying the flood resilience of water infrastructure and ensuring the ongoing safety and reliability of dams through state-owned water businesses. Major projects include:
| • | | construction of the $983 million Fitzroy to Gladstone Pipeline, enabling long term water security in the Central Queensland region |
| • | | continued construction of the $568.9 million Rookwood Weir |
163
Budget Strategy and Outlook 2023-24
| • | | delivery of the $273.1 million Toowoomba to Warwick Pipeline, part of a more than $300 million investment for water security in the Toowoomba and Southern Downs regions |
| • | | completion of the $95.2 million South West Pipeline, connecting Beaudesert to the South East Queensland Water Grid. |
Dam safety is a major focus for the water sector. Sunwater, Seqwater and the Gladstone Area Water Board have ongoing dam improvement programs to ensure the safety and reliability of dams, and compliance with dam safety guidelines into the future. In 2023–24, $155.8 million will be invested for planning and early works on improvements to Paradise, Burdekin Falls, Somerset, Wivenhoe, North Pine, Lake Macdonald, and Awoonga dams.
Queensland Hydro
In 2022, the government established the new publicly-owned entity, Queensland Hydro, to develop, deliver, own, and operate the large-scale, long-duration pumped hydro storage assets that will be the cornerstone of Queensland’s future energy system. These assets will be critical to Queensland’s energy transformation, supporting renewable energy and system security by absorbing excess renewable generation and dispatching it in peak demand periods.
In 2022–23, the government approved proceeding with the $14.2 billion, 2 GW, 24-hour Borumba Pumped Hydro Energy Storage, to be located southwest of Gympie. During 2023–24, Queensland Hydro will progress State and Australian Government approvals, exploratory works, and procurement for main works.
Queensland Hydro will also continue the feasibility study for the Pioneer-Burdekin Pumped Hydro Energy Storage project, to be located west of Mackay. Pending final investment decision of this project, staged construction is expected to commence as early as 2026–27.
| 8.2 | Finances and performance |
| 8.2.1 | Earnings before interest and tax |
Estimated total PNFC Sector EBIT of $2.347 billion for 2022–23 is $1.172 billion lower than forecast at the 2022–23 Budget. Across the forward estimates, PNFC Sector EBIT is expected to increase to $4.101 billion by 2026–27.
The electricity network sector EBIT is estimated at $873 million in 2022–23, lower than forecast at the 2022–23 Budget, predominantly due to movements in the value of hedging contracts held by EQL’s retail business. Sector earnings are expected to recover year-on-year from 2023–24, to $1.806 billion by 2026–27, consistent with expected regulated revenue movements.
164
Budget Strategy and Outlook 2023-24
For the electricity generation sector, a lower EBIT of $604 million in 2022–23 is forecast to recover strongly in 2023–24 (to $1.687 billion), with movements in the value of hedging contracts continuing to drive earnings volatility in this sector. Generators enter appropriate hedging contracts to provide earnings certainty, including on the Australian Securities Exchange, with the earnings impacts of some contracts extending over multiple years. These temporary variations are expected to moderate over the forward estimates.
Rail sector EBIT in 2022–23 is slightly lower than that estimated at the 2022–23 Budget. This primarily reflects escalation of operational and capital costs during 2022–23, including in support of, and preparations for, Cross River Rail and associated works.
Port sector EBIT in 2022–23 largely aligns with the 2022–23 Budget and is forecast to trend upwards over the forward estimates, reflecting the various long-term revenue contracts with customers and cost recoveries from the completion of revenue generating capital expansions.
Water sector EBIT in 2022–23 of $415 million is lower than estimated at the 2022–23 Budget due to lower water sales, but expected to trend around $500 million over the forward estimates.
Stadiums Queensland, a major contributor to the ‘Other’ PNFC sector, operates and maintains the state’s portfolio of major sporting stadiums and high performance and community venues. Over the forward estimates, earnings will be offset by expenses as venues are updated and maintained to a contemporary standard in the lead up to the Brisbane 2032 Olympic and Paralympic Games.
| Table 8.2 | Earnings before interest and tax1 |
| | | | | | | | | | | | | | | | | | | | | | | | | | | | |
| | | 2021–22
Outcome
$ million | | | 2022–23
Budget
$ million | | | 2022–23
Est. Act.
$ million | | | 2023–24
Budget
$ million | | | 2024–25
Projection
$ million | | | 2025–26
Projection
$ million | | | 2026–27
Projection
$ million | |
Electricity Networks | | | 1,660 | | | | 1,312 | | | | 873 | | | | 1,185 | | | | 1,291 | | | | 1,547 | | | | 1,806 | |
Electricity Generation | | | 203 | | | | 1,067 | | | | 604 | | | | 1,687 | | | | 1,470 | | | | 1,156 | | | | 1,236 | |
Rail | | | 295 | | | | 312 | | | | 258 | | | | 315 | | | | 374 | | | | 402 | | | | 364 | |
Ports | | | 183 | | | | 219 | | | | 238 | | | | 248 | | | | 277 | | | | 296 | | | | 308 | |
Water | | | 479 | | | | 594 | | | | 415 | | | | 548 | | | | 493 | | | | 470 | | | | 530 | |
Other2 | | | (47 | ) | | | 15 | | | | (41 | ) | | | (154 | ) | | | (76 | ) | | | (77 | ) | | | (143 | ) |
Total PNFC sector | | | 2,773 | | | | 3,519 | | | | 2,347 | | | | 3,829 | | | | 3,828 | | | | 3,793 | | | | 4,101 | |
Notes:
| 1. | Numbers may not add due to rounding. |
| 2. | Includes other public corporations. |
Entities in the PNFC Sector use debt financing as a source of funds for asset renewal and capital investments, and to maintain an optimal capital structure. Borrowings also include derivative liabilities associated with hedging activities undertaken by GOCs.
165
Budget Strategy and Outlook 2023-24
PNFC Sector entities are required to take a prudent and sound approach to debt management, including the establishment of borrowing arrangements which are appropriate to the business risk of the organisation. These arrangements consider the proposed capital expenditure program, together with the implications of borrowings on key financial and performance related indicators.
PNFC Sector entity asset values are a relevant factor in considering PNFC Sector borrowings, with PNFC Sector entities borrowing around 55 per cent of their asset values in 2023–24 (on average). Over the forward estimates, for the PNFC Sector as a whole, increases in borrowings are more than offset by increases in the value of total assets over time, with the ratio of borrowings to total assets forecast to fall to 51 per cent by 2026–27.
Total PNFC Sector borrowing for 2022–23 is estimated at $47.875 billion, or $3.541 billion higher than forecast at the 2022–23 Budget, largely due to the accounting treatment of short-term financial contracts held by energy GOCs.
Borrowings in the water sector are largely attributable to Seqwater, which currently holds $8.908 billion of debt. This debt balance is the result of the large investment in water infrastructure in response to the Millennium Drought and the associated price path. Seqwater’s forecast borrowings reduce across the forward estimates, with price path debt forecast to be repaid by 2027–28.
Ports and rail sector borrowings have contributed to the funding of major capital works in these sectors and are forecast to sit at around $1 billion and $5 billion, respectively, over the forward estimates.
Queensland Hydro, a major contributor to the PNFC ‘Other’ sector, drives an increase in borrowings over the forward estimates as early works and construction activities advance on pumped hydro energy storage projects.
| Table 8.3 | Borrowings and total assets1 |
| | | | | | | | | | | | | | | | | | | | | | | | | | | | |
| | | 2021–22
Outcome
$ million | | | 2022–23
Budget
$ million | | | 2022–23
Est. Act.
$ million | | | 2023–24
Budget
$ million | | | 2024–25
Projection
$ million | | | 2025–26
Projection
$ million | | | 2026–27
Projection
$ million | |
Electricity Networks | | | 23,967 | | | | 24,361 | | | | 25,118 | | | | 26,498 | | | | 27,758 | | | | 29,942 | | | | 32,780 | |
Electricity Generation | | | 20,339 | | | | 4,817 | | | | 7,185 | | | | 3,225 | | | | 2,633 | | | | 2,555 | | | | 1,128 | |
Rail | | | 4,121 | | | | 4,401 | | | | 4,637 | | | | 4,652 | | | | 4,868 | | | | 4,814 | | | | 4,807 | |
Ports | | | 1,083 | | | | 1,064 | | | | 1,071 | | | | 1,049 | | | | 1,026 | | | | 970 | | | | 945 | |
Water | | | 9,827 | | | | 9,543 | | | | 9,700 | | | | 9,472 | | | | 8,989 | | | | 8,453 | | | | 7,953 | |
Other2 | | | 158 | | | | 147 | | | | 164 | | | | 271 | | | | 846 | | | | 1,930 | | | | 4,594 | |
Total PNFC sector | | | 59,495 | | | | 44,334 | | | | 47,875 | | | | 45,166 | | | | 46,120 | | | | 48,664 | | | | 52,207 | |
Total Assets | | | 91,338 | | | | 74,953 | | | | 80,459 | | | | 82,492 | | | | 88,371 | | | | 94,694 | | | | 102,088 | |
Notes:
| 1. | Numbers may not add due to rounding. |
| 2. | Includes other public corporations. |
166
Budget Strategy and Outlook 2023-24
| 8.2.3 | Returns to government |
PNFC Sector entities provide returns to government through dividends and tax equivalent payments.
Dividends
Dividends generated by the PNFC Sector form part of consolidated revenue used to fund a range of government services, including investment into critical infrastructure delivered by PNFC Sector entities. The GOC Act provides for the payment of dividends, with the dividend policies of GOCs determined by government. Each year, GOC boards make a dividend recommendation for government consideration.
While total PNFC Sector dividends for 2022–23 are expected to be $511 million, or $304 million lower than forecast at the 2022–23 Budget, the PNFC Sector is expected to deliver cumulative dividends of $4.113 billion over the forward estimates, with annual dividends increasing to $1.122 billion by 2026–27.
Electricity network dividends are expected to be $93 million in 2023–24, rising steadily over the forward estimates, in line with earnings growth.
The electricity generation sector is expected to provide reliable dividends over the forward estimates, at around $500 million per year commencing in 2023–24. This reflects steady earnings across this sector, as investment in new renewable generation grows and wholesale prices stabilise. Dividends in 2022–23 have been impacted by lower earnings and unfavourable fair value adjustments on hedge contracts.
Ports sector dividends are forecast to remain steady over the forward estimates, in line with estimated earnings and expected stable trade throughput across various cargo categories.
In the water sector, dividends for 2022–23 are expected to be above the 2022–23 Budget due to Gladstone Area Water Board. Dividends are expected to be modest over the forward estimates due to the repayment of debt by Seqwater and dam improvement costs, with the Mount Isa and Gladstone Area Water Boards forecasting dividends.
| | | | | | | | | | | | | | | | | | | | | | | | | | | | |
| | | 2021–22
Outcome
$ million | | | 2022–23
Budget
$ million | | | 2022–23
Est. Act.
$ million | | | 2023–24
Budget
$ million | | | 2024–25
Projection
$ million | | | 2025–26
Projection
$ million | | | 2026–27
Projection
$ million | |
Electricity Networks | | | — | | | | 233 | | | | 151 | | | | 93 | | | | 113 | | | | 189 | | | | 312 | |
Electricity Generation | | | — | | | | 284 | | | | — | | | | 463 | | | | 609 | | | | 511 | | | | 503 | |
Rail | | | 194 | | | | 168 | | | | 161 | | | | 146 | | | | 207 | | | | 189 | | | | 126 | |
Ports | | | — | | | | 118 | | | | 150 | | | | 138 | | | | 154 | | | | 165 | | | | 169 | |
Water | | | 15 | | | | 12 | | | | 49 | | | | 4 | | | | 4 | | | | 7 | | | | 14 | |
Total PNFC sector | | | 209 | | | | 815 | | | | 511 | | | | 844 | | | | 1,086 | | | | 1,061 | | | | 1,122 | |
Note:
| 1. | Numbers may not add due to rounding. |
167
Budget Strategy and Outlook 2023-24
Tax equivalent payments
Tax equivalent payments (TEPs) are paid by PNFC Sector entities to recognise the benefits derived because they are not liable to pay Australian Government tax. The primary objective of the payment is to promote competitive neutrality through a uniform application of income tax laws between government-owned businesses and their private sector counterparts.
In line with the trend in earnings growth, TEPs are $159 million lower than forecast at the 2022–23 Budget but expected to increase to $596 million in 2026–27.
| Table 8.5 | Tax equivalent payments1 |
| | | | | | | | | | | | | | | | | | | | | | | | | | | | |
| | | 2021–22
Outcome
$ million | | | 2022–23
Budget
$ million | | | 2022–23
Est. Act.
$ million | | | 2023–24
Budget
$ million | | | 2024–25
Projection
$ million | | | 2025–26
Projection
$ million | | | 2026–27
Projection
$ million | |
Electricity Networks | | | 322 | | | | 156 | | | | 77 | | | | 64 | | | | 75 | | | | 114 | | | | 141 | |
Electricity Generation | | | 107 | | | | 219 | | | | 142 | | | | 261 | | | | 332 | | | | 285 | | | | 312 | |
Rail | | | 71 | | | | 81 | | | | 64 | | | | 102 | | | | 114 | | | | 96 | | | | 55 | |
Ports | | | 55 | | | | 61 | | | | 76 | | | | 68 | | | | 77 | | | | 81 | | | | 80 | |
Water | | | (24 | ) | | | 6 | | | | 6 | | | | 2 | | | | 2 | | | | 4 | | | | 7 | |
Other2 | | | 1 | | | | — | | | | 1 | | | | — | | | | — | | | | 1 | | | | 1 | |
Total PNFC sector | | | 532 | | | | 524 | | | | 365 | | | | 498 | | | | 601 | | | | 580 | | | | 596 | |
Notes:
| 1. | Numbers may not add due to rounding. |
| 2. | Includes other public corporations. |
Competitive neutrality fees
Competitive neutrality policy requires that public sector businesses, including GOCs, should not have a competitive advantage (or disadvantage) over the private sector solely due to their government ownership. An application of this policy is the competitive neutrality fee (CNF).
The CNF is applied to a GOC’s cost of debt to neutralise any cost of funds advantage by way of government ownership on the basis of GOCs’ ability to borrow funds at a lower rate than private sector competitors, given the government’s credit strength.
In general, changes in CNF payments reflect movements in borrowing amounts, interest rate spreads and the entity’s stand-alone credit rating.
CNF payments by the PNFC Sector are expected to be remain at around $215 million across the forward estimates, with some increases to 2025–26 and 2026–27 in line with increased borrowing.
168
Budget Strategy and Outlook 2023-24
| Table 8.6 | Competitive neutrality fee payments1 |
| | | | | | | | | | | | | | | | | | | | | | | | | | | | |
| | | 2021–22
Outcome
$ million | | | 2022–23
Budget
$ million | | | 2022–23
Est. Act.
$ million | | | 2023–24
Budget
$ million | | | 2024–25
Projection
$ million | | | 2025–26
Projection
$ million | | | 2026–27
Projection
$ million | |
Electricity Networks | | | 152 | | | | 165 | | | | 160 | | | | 148 | | | | 141 | | | | 136 | | | | 124 | |
Electricity Generation | | | 14 | | | | 12 | | | | 22 | | | | 22 | | | | 21 | | | | 28 | | | | 32 | |
Rail | | | 29 | | | | 28 | | | | 21 | | | | 25 | | | | 29 | | | | 39 | | | | 49 | |
Ports | | | 9 | | | | 8 | | | | 8 | | | | 8 | | | | 8 | | | | 9 | | | | 9 | |
Water | | | 4 | | | | 5 | | | | 5 | | | | 6 | | | | 6 | | | | 6 | | | | 6 | |
Total PNFC sector | | | 208 | | | | 218 | | | | 216 | | | | 209 | | | | 205 | | | | 217 | | | | 220 | |
Note:
| 1. | Numbers may not add due to rounding. |
| 8.2.4 | Community service obligation and rail transport services contract payments |
For public policy reasons, the government can direct GOCs to perform activities that are not in their commercial interest (e.g., discounting rural irrigation water prices to stimulate the regional economy). In these situations, the government can compensate the GOC through the payment of a CSO for the cost of delivering the uncommercial part of the good or service.
In line with the Queensland Government’s Uniform Tariff Policy, a CSO payment is provided to EQL to compensate its retail subsidiary, Ergon Energy, for the increased costs of operating in regional Queensland. This subsidy is provided to ensure Queenslanders, regardless of their geographic location, pay a similar price for their electricity. The one-off increase in the budgeted CSO cost for electricity networks in 2022–23 is due to regulated revenue under-recoveries in previous years being recovered in 2022–23.
Seqwater and Sunwater also own and operate water supply schemes, where irrigation prices for some schemes are set below the level necessary to recover the costs of supply. The government provides a CSO to offset the reduced revenue. Over the forward estimates a substantial amount of Water CSO payments are due to the government’s rural irrigation water price discount for Sunwater and Seqwater customers which has been extended to 2024–25. There is no CSO forecast in 2026–27 because irrigation prices have not yet been set for 2025–26 and beyond.
Similarly, TSC payments are made to Queensland Rail to deliver rail passenger services at non-commercial (subsidised) prices for commuter and tourism markets.
Total PNFC Sector CSO and TSC payments for 2022–23 are expected to be $2.729 billion, largely in line with the 2022–23 Budget. Over the forward estimates, CSO and TSC payments are expected to increase to $3.099 billion by 2026–27. This trend is largely driven by TSC payments, which reflect a range of adjustments associated with growth, maintenance, and safety of the rail network. This includes delivery of significant capital projects, upgrades to existing assets, and operational activities associated with transformation and Cross River Rail.
169
Budget Strategy and Outlook 2023-24
| Table 8.7 | Community service obligation payments and transport services contracts1 |
| | | | | | | | | | | | | | | | | | | | | | | | | | | | |
| | | 2021–22
Outcome
$ million | | | 2022–23
Budget
$ million | | | 2022–23
Est. Act.
$ million | | | 2023–24
Budget
$ million | | | 2024–25
Projection
$ million | | | 2025–26
Projection
$ million | | | 2026–27
Projection
$ million | |
Electricity Networks | | | 525 | | | | 635 | | | | 621 | | | | 537 | | | | 538 | | | | 548 | | | | 573 | |
Rail | | | 1,998 | | | | 2,153 | | | | 2,085 | | | | 2,306 | | | | 2,492 | | | | 2,580 | | | | 2,526 | |
Water | | | 25 | | | | 24 | | | | 24 | | | | 23 | | | | 28 | | | | 7 | | | | — | |
Total PNFC sector | | | 2,548 | | | | 2,812 | | | | 2,729 | | | | 2,866 | | | | 3,059 | | | | 3,135 | | | | 3,099 | |
Note:
| 1. | Numbers may not add due to rounding. |
Corporations may apply different target capital structures to optimise value and support business operations. Equity movements account for changes in contributed equity and special dividends. The Queensland Government provides new equity to support Queensland’s publicly-owned businesses invest in critical new infrastructure projects across the state.
In 2022–23, total PNFC Sector net equity contributions are expected to be $808 million, compared to a $418 million forecast at the 2022–23 Budget, with the difference primarily due to a $500 million allocation to CleanCo for wind and solar investments in Central Queensland.
Over the forward estimates, total PNFC Sector equity movements reflect $4 billion from increased coal royalties allocated to a range of projects in regional Queensland, including in the energy, water, and ports sectors, as well as new government funding to support the rollout of the QEJP, including Queensland’s pumped hydro energy storage assets and projects supported by the $4.5 billion Queensland Renewable Energy and Hydrogen Jobs Fund.
In the electricity networks and generation sectors, equity adjustments reflect new investments in renewable energy, hydrogen, and storage assets, as well as to maintain the gearing ratios of network businesses over time, including special dividends. Due to ongoing delays, CleanCo is pausing the development of the Karara Wind Farm, with the $250 million equity allocation for the project repurposed towards other renewable project investment opportunities.
In the rail sector, equity movements primarily relate to new investments in significant capital projects associated with reconfiguration of the rail network and Cross River Rail.
In the ports sector, major equity movements relate to GPC and NQBP major projects (including those funded from coal royalties), and the pass through of funding under existing agreements with the Australian Government, such as the Bundaberg Port conveyor under the Hinkler Regional Deal and the Townsville Channel Capacity Upgrade under the Townsville City Deal.
In the water sector, the government has committed over $2 billion in new funding for Sunwater’s Paradise Dam Improvement Project and Burdekin Falls Dam Improvement and Raising Project, Seqwater’s Toowoomba to Warwick Pipeline, and Gladstone Area Water Board’s Fitzroy to Gladstone Pipeline.
170
Budget Strategy and Outlook 2023-24
Equity over the forward estimates in the corporations captured under ‘Other’ is primarily for Queensland Hydro to deliver the Borumba Pumped Hydro Energy Storage project and continue progressing the detailed feasibility study for Pioneer-Burdekin Pumped Hydro Energy Storage project.
| Table 8.8 | Equity movements1 |
| | | | | | | | | | | | | | | | | | | | | | | | | | | | |
| | | 2021–22
Outcome
$ million | | | 2022–23
Budget
$ million | | | 2022–23
Est. Act.
$ million | | | 2023–24
Budget
$ million | | | 2024–25
Projection
$ million | | | 2025–26
Projection
$ million | | | 2026–27
Projection
$ million | |
Electricity Networks | | | (40 | ) | | | (70 | ) | | | (160 | ) | | | 372 | | | | 393 | | | | 165 | | | | 235 | |
Electricity Generation | | | — | | | | 370 | | | | 809 | | | | 682 | | | | 1,319 | | | | 100 | | | | 100 | |
Rail | | | (5 | ) | | | 36 | | | | 36 | | | | — | | | | — | | | | 197 | | | | — | |
Ports | | | 26 | | | | 37 | | | | 41 | | | | 82 | | | | 217 | | | | 118 | | | | 43 | |
Water | | | — | | | | 3 | | | | 22 | | | | 570 | | | | 666 | | | | 454 | | | | 457 | |
Other2 | | | 4 | | | | 43 | | | | 60 | | | | 254 | | | | 853 | | | | 1,684 | | | | 1,689 | |
Total PNFC sector | | | (14 | ) | | | 418 | | | | 808 | | | | 1,960 | | | | 3,447 | | | | 2,717 | | | | 2,524 | |
Notes:
| 1. | Numbers may not add due to rounding. |
| 2. | Includes other public corporations. |
171
Budget Strategy and Outlook 2023-24
| 9 | Uniform Presentation Framework |
This chapter contains detailed financial statements for the Queensland Public Sector prepared under the Uniform Presentation Framework (UPF) first agreed to at the Premiers’ conference in 1991.
The UPF has been reviewed a number of times, more significantly following the release in October 2007 of the Australian Accounting Standards Board’s (AASB) accounting standard, AASB 1049 Whole of Government and General Government Sector Financial Reporting. The standard aims to harmonise Government Finance Statistics (GFS) and Generally Accepted Accounting Principles (GAAP) with the objective of improving the clarity and transparency of government financial statements. The UPF was reviewed more recently in February 2019 following the 2015 update to the Australian GFS framework.
In addition, this chapter provides:
| • | | a time series for the General Government Sector using the revised UPF |
| • | | details of General Government Sector grant revenue and expenses |
| • | | details of General Government Sector dividend and income tax equivalent income |
| • | | data on General Government Sector expenses and purchases of non-financial assets by function |
| • | | details of taxation revenue collected by the General Government Sector |
| • | | background information on the revised UPF and disclosure of differences arising from it, including the conceptual basis and sector definitions, along with a list of reporting entities. |
| 9.2 | Uniform Presentation Framework financial information |
The tables on the following pages present operating statements, balance sheets and cash flow statements prepared on the harmonised basis for the General Government Sector, Public Non-financial Corporations (PNFC) Sector and Non-financial Public Sector.
Budgeted financial information for the Public Financial Corporations Sector is not required by the UPF.
172
Budget Strategy and Outlook 2023-24
| Table 9.1 | General Government Sector Operating Statement1 |
| | | | | | | | | | | | | | | | | | | | | | | | | | | | |
| | | 2021–22 Outcome $ million | | | 2022–23 Budget $ million | | | 2022–23
Est.Actual $ million | | | 2023–24 Budget $ million | | | 2024–25 Projection $ million | | | 2025–26 Projection $ million | | | 2026–27 Projection $ million | |
Revenue from Transactions | | | | | | | | | | | | | | | | | | | | | | | | | | | | |
Taxation revenue | | | 20,011 | | | | 18,842 | | | | 20,563 | | | | 21,938 | | | | 23,125 | | | | 24,285 | | | | 25,387 | |
Grants revenue | | | 34,135 | | | | 35,242 | | | | 36,571 | | | | 39,643 | | | | 38,943 | | | | 38,937 | | | | 40,618 | |
Sales of goods and services | | | 5,896 | | | | 6,181 | | | | 6,344 | | | | 6,921 | | | | 6,969 | | | | 7,054 | | | | 6,871 | |
Interest income | | | 2,643 | | | | 2,847 | | | | 3,166 | | | | 3,206 | | | | 3,173 | | | | 3,116 | | | | 3,107 | |
Dividend and income tax equivalent income | | | 790 | | | | 1,499 | | | | 1,043 | | | | 1,521 | | | | 1,884 | | | | 1,857 | | | | 1,958 | |
Other revenue | | | 10,710 | | | | 9,275 | | | | 19,937 | | | | 8,850 | | | | 8,008 | | | | 7,609 | | | | 7,650 | |
Total Revenue from Transactions | | | 74,185 | | | | 73,886 | | | | 87,623 | | | | 82,079 | | | | 82,102 | | | | 82,858 | | | | 85,591 | |
| | | | | | | |
Less Expenses from Transactions | | | | | | | | | | | | | | | | | | | | | | | | | | | | |
Employee expenses | | | 28,068 | | | | 30,076 | | | | 30,279 | | | | 32,175 | | | | 32,825 | | | | 33,864 | | | | 34,930 | |
Superannuation expenses | | | | | | | | | | | | | | | | | | | | | | | | | | | | |
Superannuation interest cost | | | 377 | | | | 655 | | | | 775 | | | | 721 | | | | 665 | | | | 621 | | | | 587 | |
Other superannuation expenses | | | 3,387 | | | | 3,493 | | | | 3,733 | | | | 4,188 | | | | 4,302 | | | | 4,419 | | | | 4,523 | |
Other operating expenses | | | 18,228 | | | | 19,805 | | | | 20,287 | | | | 22,969 | | | | 21,615 | | | | 21,781 | | | | 22,411 | |
Depreciation and amortisation | | | 4,506 | | | | 4,652 | | | | 4,910 | | | | 5,039 | | | | 5,242 | | | | 5,443 | | | | 5,672 | |
Other interest expenses | | | 1,508 | | | | 1,826 | | | | 1,715 | | | | 1,974 | | | | 2,472 | | | | 2,984 | | | | 3,520 | |
Grants expenses | | | 13,817 | | | | 14,407 | | | | 13,618 | | | | 17,195 | | | | 14,845 | | | | 13,542 | | | | 13,570 | |
Total Expenses from Transactions | | | 69,889 | | | | 74,915 | | | | 75,317 | | | | 84,261 | | | | 81,967 | | | | 82,653 | | | | 85,214 | |
| | | | | | | |
Equals Net Operating Balance | | | 4,296 | | | | (1,029 | ) | | | 12,305 | | | | (2,182 | ) | | | 135 | | | | 206 | | | | 377 | |
| | | | | | | |
Plus Other economic flows—included in operating result | | | (913 | ) | | | 1 | | | | (585 | ) | | | (40 | ) | | | (33 | ) | | | (9 | ) | | | 14 | |
| | | | | | | |
Equals Operating Result | | | 3,383 | | | | (1,028 | ) | | | 11,720 | | | | (2,222 | ) | | | 102 | | | | 197 | | | | 391 | |
| | | | | | | |
Plus Other economic flows—other movements in equity | | | 36,616 | | | | 3,348 | | | | 7,866 | | | | 3,785 | | | | 3,024 | | | | 3,169 | | | | 3,422 | |
| | | | | | | |
Equals Comprehensive Result—Total Change In Net Worth | | | 39,999 | | | | 2,320 | | | | 19,587 | | | | 1,563 | | | | 3,126 | | | | 3,366 | | | | 3,814 | |
| | | | | | | |
KEY FISCAL AGGREGATES | | | | | | | | | | | | | | | | | | | | | | | | | | | | |
| | | | | | | |
Net Operating Balance | | | 4,296 | | | | (1,029 | ) | | | 12,305 | | | | (2,182 | ) | | | 135 | | | | 206 | | | | 377 | |
| | | | | | | |
Less Net Acquisition of Non-financial Assets | | | | | | | | | | | | | | | | | | | | | | | | | | | | |
Purchases of non-financial assets | | | 7,889 | | | | 8,478 | | | | 9,194 | | | | 9,347 | | | | 11,473 | | | | 11,417 | | | | 11,389 | |
Less Sales of non-financial assets | | | 255 | | | | 177 | | | | 104 | | | | 276 | | | | 185 | | | | 180 | | | | 177 | |
Less Depreciation | | | 4,506 | | | | 4,652 | | | | 4,910 | | | | 5,039 | | | | 5,242 | | | | 5,443 | | | | 5,672 | |
Plus Change in inventories | | | (77 | ) | | | 42 | | | | 65 | | | | (35 | ) | | | 51 | | | | 1 | | | | (47 | ) |
Plus Other movements in non-financial assets | | | 1,315 | | | | 914 | | | | 1,275 | | | | 538 | | | | 1,303 | | | | 388 | | | | 185 | |
Equals Total Net Acquisition of Non-financial Assets | | | 4,367 | | | | 4,606 | | | | 5,520 | | | | 4,534 | | | | 7,400 | | | | 6,183 | | | | 5,678 | |
Equals Fiscal Balance | | | (71 | ) | | | (5,635 | ) | | | 6,786 | | | | (6,716 | ) | | | (7,265 | ) | | | (5,977 | ) | | | (5,301 | ) |
Note:
| 1. | Numbers may not add due to rounding. |
173
Budget Strategy and Outlook 2023-24
| Table 9.2 | Public Non-financial Corporations Sector Operating Statement1 |
| | | | | | | | | | | | | | | | | | | | | | | | | | | | |
| | | 2021–22 Outcome $ million | | | 2022–23 Budget $ million | | | 2022–23
Est.Actual $ million | | | 2023–24 Budget $ million | | | 2024–25 Projection $ million | | | 2025–26 Projection $ million | | | 2026–27 Projection $ million | |
Revenue from Transactions | | | | | | | | | | | | | | | | | | | | | | | | | |
Grants revenue | | | 687 | | | | 851 | | | | 867 | | | | 805 | | | | 721 | | | | 704 | | | | 667 | |
Sales of goods and services | | | 14,905 | | | | 12,211 | | | | 14,314 | | | | 13,664 | | | | 14,428 | | | | 15,422 | | | | 16,807 | |
Interest income | | | 66 | | | | 56 | | | | 92 | | | | 94 | | | | 93 | | | | 101 | | | | 85 | |
Other revenue | | | 293 | | | | 471 | | | | 562 | | | | 1,183 | | | | 335 | | | | 312 | | | | 258 | |
Total Revenue from Transactions | | | 15,951 | | | | 13,589 | | | | 15,835 | | | | 15,746 | | | | 15,578 | | | | 16,539 | | | | 17,816 | |
| | | | | | | |
Less Expenses from Transactions | | | | | | | | | | | | | | | | | | | | | | | | | | | | |
Employee expenses | | | 2,245 | | | | 2,471 | | | | 2,491 | | | | 2,692 | | | | 2,866 | | | | 2,938 | | | | 2,957 | |
Superannuation expenses | | | | | | | | | | | | | | | | | | | | | | | | | | | | |
Superannuation interest cost | | | (5 | ) | | | — | | | | — | | | | — | | | | — | | | | — | | | | — | |
Other superannuation expenses | | | 260 | | | | 244 | | | | 290 | | | | 320 | | | | 333 | | | | 340 | | | | 350 | |
Other operating expenses | | | 7,484 | | | | 4,576 | | | | 7,087 | | | | 6,575 | | | | 5,861 | | | | 5,844 | | | | 6,180 | |
Depreciation and amortisation | | | 2,719 | | | | 2,924 | | | | 2,945 | | | | 3,195 | | | | 3,370 | | | | 3,696 | | | | 3,997 | |
Other interest expenses | | | 1,610 | | | | 1,622 | | | | 1,679 | | | | 1,807 | | | | 1,891 | | | | 2,120 | | | | 2,396 | |
Grants expenses | | | 25 | | | | 24 | | | | 25 | | | | 25 | | | | 25 | | | | 19 | | | | 19 | |
Other property expenses | | | 550 | | | | 528 | | | | 369 | | | | 502 | | | | 605 | | | | 584 | | | | 601 | |
Total Expenses from Transactions | | | 14,888 | | | | 12,389 | | | | 14,887 | | | | 15,116 | | | | 14,951 | | | | 15,541 | | | | 16,499 | |
| | | | | | | |
Equals Net Operating Balance | | | 1,062 | | | | 1,199 | | | | 948 | | | | 630 | | | | 626 | | | | 998 | | | | 1,317 | |
| | | | | | | |
Plus Other economic flows—included in operating result | | | (126 | ) | | | 138 | | | | (594 | ) | | | 691 | | | | 590 | | | | 9 | | | | (308 | ) |
| | | | | | | |
Equals Operating Result | | | 936 | | | | 1,337 | | | | 355 | | | | 1,320 | | | | 1,216 | | | | 1,007 | | | | 1,010 | |
| | | | | | | |
Plus Other economic flows—other movements in equity | | | (1,971 | ) | | | 816 | | | | 3,711 | | | | 2,378 | | | | 3,133 | | | | 2,449 | | | | 2,254 | |
| | | | | | | |
Equals Comprehensive Result—Total Change In Net Worth | | | (1,035 | ) | | | 2,153 | | | | 4,065 | | | | 3,698 | | | | 4,349 | | | | 3,456 | | | | 3,264 | |
| | | | | | | |
KEY FISCAL AGGREGATES | | | | | | | | | | | | | | | | | | | | | | | | | | | | |
| | | | | | | |
Net Operating Balance | | | 1,062 | | | | 1,199 | | | | 948 | | | | 630 | | | | 626 | | | | 998 | | | | 1,317 | |
| | | | | | | |
Less Net Acquisition of Non-financial Assets | | | | | | | | | | | | | | | | | | | | | | | | | | | | |
Purchases of non-financial assets | | | 3,134 | | | | 3,334 | | | | 4,489 | | | | 5,849 | | | | 8,735 | | | | 8,534 | | | | 10,233 | |
Less Sales of non-financial assets | | | 63 | | | | 33 | | | | 38 | | | | 5 | | | | 6 | | | | 15 | | | | 3 | |
Less Depreciation | | | 2,719 | | | | 2,924 | | | | 2,945 | | | | 3,195 | | | | 3,370 | | | | 3,696 | | | | 3,997 | |
Plus Change in inventories | | | 48 | | | | 16 | | | | 169 | | | | (37 | ) | | | 13 | | | | 1 | | | | 2 | |
Plus Other movements in non-financial assets | | | 60 | | | | 105 | | | | 97 | | | | 795 | | | | 82 | | | | 83 | | | | 85 | |
Equals Total Net Acquisition of Non-financial Assets | | | 462 | | | | 498 | | | | 1,772 | | | | 3,408 | | | | 5,455 | | | | 4,907 | | | | 6,320 | |
Equals Fiscal Balance | | | 601 | | | | 701 | | | | (824 | ) | | | (2,778 | ) | | | (4,829 | ) | | | (3,909 | ) | | | (5,003 | ) |
Note:
| 1. | Numbers may not add due to rounding. |
174
Budget Strategy and Outlook 2023-24
| Table 9.3 | Non-financial Public Sector Operating Statement1 |
| | | | | | | | | | | | | | | | | | | | | | | | | | | | |
| | | 2021–22 Outcome $ million | | | 2022–23 Budget $ million | | | 2022–23
Est.Actual $ million | | | 2023–24 Budget $ million | | | 2024–25 Projection $ million | | | 2025–26 Projection $ million | | | 2026–27 Projection $ million | |
Revenue from Transactions | | | | | | | | | | | | | | | | | |
Taxation revenue | | | 19,640 | | | | 18,481 | | | | 20,190 | | | | 21,553 | | | | 22,735 | | | | 23,877 | | | | 24,970 | |
Grants revenue | | | 34,148 | | | | 35,263 | | | | 36,592 | | | | 39,693 | | | | 38,986 | | | | 38,983 | | | | 40,651 | |
Sales of goods and services | | | 17,960 | | | | 15,519 | | | | 17,719 | | | | 17,557 | | | | 18,155 | | | | 19,223 | | | | 20,856 | |
Interest income | | | 2,703 | | | | 2,899 | | | | 3,238 | | | | 3,279 | | | | 3,246 | | | | 3,202 | | | | 3,174 | |
Dividend and income tax equivalent income | | | 49 | | | | 161 | | | | 167 | | | | 179 | | | | 197 | | | | 215 | | | | 239 | |
Other revenue | | | 10,984 | | | | 9,744 | | | | 20,497 | | | | 9,664 | | | | 8,340 | | | | 7,918 | | | | 7,906 | |
Total Revenue from Transactions | | | 85,485 | | | | 82,066 | | | | 98,403 | | | | 91,924 | | | | 91,660 | | | | 93,420 | | | | 97,796 | |
| | | | | | |
Less Expenses from Transactions | | | | | | | | | | | | | | | | | | | | | | | | | |
Employee expenses | | | 30,177 | | | | 32,414 | | | | 32,623 | | | | 34,711 | | | | 35,530 | | | | 36,635 | | | | 37,716 | |
Superannuation expenses | | | | | | | | | | | | | | | | | | | | | | | | | |
Superannuation interest cost | | | 372 | | | | 655 | | | | 775 | | | | 721 | | | | 665 | | | | 621 | | | | 587 | |
Other superannuation expenses | | | 3,647 | | | | 3,738 | | | | 4,024 | | | | 4,507 | | | | 4,635 | | | | 4,759 | | | | 4,873 | |
Other operating expenses | | | 22,843 | | | | 21,499 | | | | 24,427 | | | | 26,499 | | | | 24,212 | | | | 24,349 | | | | 25,744 | |
Depreciation and amortisation | | | 7,225 | | | | 7,576 | | | | 7,855 | | | | 8,234 | | | | 8,612 | | | | 9,138 | | | | 9,669 | |
Other interest expenses | | | 2,905 | | | | 3,228 | | | | 3,159 | | | | 3,551 | | | | 4,137 | | | | 4,872 | | | | 5,679 | |
Grants expenses | | | 13,167 | | | | 13,601 | | | | 12,798 | | | | 16,098 | | | | 14,193 | | | | 12,903 | | | | 12,956 | |
Total Expenses from Transactions | | | 80,335 | | | | 82,710 | | | | 85,660 | | | | 94,320 | | | | 91,985 | | | | 93,277 | | | | 97,224 | |
| | | | | | | |
Equals Net Operating Balance | | | 5,150 | | | | (644 | ) | | | 12,743 | | | | (2,397 | ) | | | (325 | ) | | | 143 | | | | 572 | |
| | | | | | | |
Plus Other economic flows—included in operating result | | | (1,119 | ) | | | 69 | | | | (1,339 | ) | | | 580 | | | | 472 | | | | (90 | ) | | | (383 | ) |
| | | | | | | |
Equals Operating Result | | | 4,030 | | | | (575 | ) | | | 11,404 | | | | (1,816 | ) | | | 147 | | | | 53 | | | | 189 | |
| | | | | | | |
Plus Other economic flows—other movements in equity | | | 35,970 | | | | 2,895 | | | | 8,181 | | | | 3,379 | | | | 2,980 | | | | 3,313 | | | | 3,625 | |
| | | | | | | |
Equals Comprehensive Result—Total Change In Net Worth | | | 40,000 | | | | 2,320 | | | | 19,585 | | | | 1,563 | | | | 3,126 | | | | 3,366 | | | | 3,814 | |
| | | | | | |
KEY FISCAL AGGREGATES | | | | | | | | | | | | | | | | | | | | | | | | | |
| | | | | | | |
Net Operating Balance | | | 5,150 | | | | (644 | ) | | | 12,743 | | | | (2,397 | ) | | | (325 | ) | | | 143 | | | | 572 | |
Less Net Acquisition of Non-financial Assets | | | | | | | | | | | | | | | | | | | | | | | | | |
Purchases of non-financial assets | | | 11,140 | | | | 11,812 | | | | 13,601 | | | | 15,231 | | | | 20,135 | | | | 19,973 | | | | 21,566 | |
Less Sales of non-financial assets | | | 317 | | | | 211 | | | | 142 | | | | 281 | | | | 191 | | | | 196 | | | | 180 | |
Less Depreciation | | | 7,225 | | | | 7,576 | | | | 7,855 | | | | 8,234 | | | | 8,612 | | | | 9,138 | | | | 9,669 | |
Plus Change in inventories | | | (29 | ) | | | 59 | | | | 234 | | | | (72 | ) | | | 64 | | | | 2 | | | | (45 | ) |
Plus Other movements in non-financial assets | | | 1,376 | | | | 1,020 | | | | 1,371 | | | | 1,333 | | | | 1,385 | | | | 471 | | | | 271 | |
Equals Total Net Acquisition of Non-financial
Assets | | | 4,945 | | | | 5,104 | | | | 7,210 | | | | 7,977 | | | | 12,781 | | | | 11,112 | | | | 11,942 | |
Equals Fiscal Balance | | | 205 | | | | (5,749 | ) | | | 5,533 | | | | (10,373 | ) | | | (13,105 | ) | | | (10,969 | ) | | | (11,371 | ) |
Note:
| 1. | Numbers may not add due to rounding. |
175
Budget Strategy and Outlook 2023-24
| Table 9.4 | General Government Sector Balance Sheet1 |
| | | | | | | | | | | | | | | | | | | | | | | | | | | | |
| | | 2021–22
Outcome
$ million | | | 2022–23
Budget
$ million | | | 2022–23
Est.Actual
$ million | | | 2023–24
Budget
$ million | | | 2024–25
Projection
$ million | | | 2025–26
Projection
$ million | | | 2026–27
Projection
$ million | |
Assets | | | | | | | | | | | | | | | | | | | | | | | | | | | | |
Financial Assets | | | | | | | | | | | | | | | | | | | | | | | | | | | | |
Cash and deposits | | | 1,710 | | | | 757 | | | | 1,072 | | | | 846 | | | | 784 | | | | 826 | | | | 800 | |
Advances paid | | | 1,233 | | | | 1,408 | | | | 1,222 | | | | 1,540 | | | | 1,634 | | | | 1,672 | | | | 1,704 | |
Investments, loans and placements | | | 44,135 | | | | 46,267 | | | | 48,330 | | | | 48,638 | | | | 47,366 | | | | 47,216 | | | | 47,561 | |
Receivables | | | 4,166 | | | | 4,947 | | | | 4,075 | | | | 4,744 | | | | 5,065 | | | | 5,147 | | | | 5,038 | |
Equity | | | | | | | | | | | | | | | | | | | | | | | | | | | | |
Investments in other public sector entities | | | 19,980 | | | | 22,455 | | | | 24,717 | | | | 28,415 | | | | 32,764 | | | | 36,220 | | | | 39,484 | |
Investments—other | | | 165 | | | | 165 | | | | 165 | | | | 165 | | | | 165 | | | | 165 | | | | 165 | |
Total Financial Assets | | | 71,389 | | | | 76,000 | | | | 79,580 | | | | 84,347 | | | | 87,778 | | | | 91,246 | | | | 94,751 | |
| | | | | | | |
Non-financial Assets | | | | | | | | | | | | | | | | | | | | | | | | | | | | |
Land and other fixed assets | | | 282,272 | | | | 254,571 | | | | 290,149 | | | | 296,744 | | | | 306,318 | | | | 314,648 | | | | 322,494 | |
Other non-financial assets | | | 10,065 | | | | 6,745 | | | | 6,915 | | | | 7,568 | | | | 7,946 | | | | 8,303 | | | | 8,705 | |
Total Non-financial Assets | | | 292,337 | | | | 261,316 | | | | 297,064 | | | | 304,312 | | | | 314,265 | | | | 322,951 | | | | 331,199 | |
| | | | | | | |
| Total Assets | | | 363,726 | | | | 337,316 | | | | 376,644 | | | | 388,659 | | | | 402,043 | | | | 414,197 | | | | 425,950 | |
| | | | | | | |
Liabilities | | | | | | | | | | | | | | | | | | | | | | | | | | | | |
Payables | | | 5,488 | | | | 4,965 | | | | 5,295 | | | | 5,328 | | | | 5,415 | | | | 5,506 | | | | 5,447 | |
Superannuation liability | | | 22,168 | | | | 24,069 | | | | 21,205 | | | | 20,827 | | | | 20,075 | | | | 19,047 | | | | 17,752 | |
Other employee benefits | | | 9,026 | | | | 9,615 | | | | 9,559 | | | | 10,028 | | | | 10,525 | | | | 10,989 | | | | 10,879 | |
Advances received | | | 1,310 | | | | 1,745 | | | | 1,782 | | | | 1,734 | | | | 1,818 | | | | 2,236 | | | | 2,184 | |
Borrowing2 | | | 56,764 | | | | 66,459 | | | | 54,693 | | | | 65,479 | | | | 76,040 | | | | 85,127 | | | | 94,814 | |
Other liabilities | | | 19,347 | | | | 14,210 | | | | 14,898 | | | | 14,489 | | | | 14,270 | | | | 14,026 | | | | 13,793 | |
Total Liabilities | | | 114,102 | | | | 121,062 | | | | 107,434 | | | | 117,886 | | | | 128,142 | | | | 136,930 | | | | 144,870 | |
| | | | | | | |
Net Worth | | | 249,624 | | | | 216,254 | | | | 269,210 | | | | 270,774 | | | | 273,900 | | | | 277,266 | | | | 281,080 | |
| | | | | | | | | | | | | | | | | | | | | | | | | | | | |
Net Financial Worth | | | (42,713 | ) | | | (45,062 | ) | | | (27,853 | ) | | | (33,538 | ) | | | (40,365 | ) | | | (45,685 | ) | | | (50,119 | ) |
Net Financial Liabilities | | | 62,694 | | | | 67,517 | | | | 52,570 | | | | 61,953 | | | | 73,129 | | | | 81,905 | | | | 89,603 | |
Net Debt | | | 10,997 | | | | 19,772 | | | | 5,852 | | | | 16,190 | | | | 28,074 | | | | 37,648 | | | | 46,934 | |
Notes: | | | | | | | | | | | | | | | | | | | | | | | | | | | | |
1. Numbers may not add due to rounding. 2. Borrowing line comprised of: | |
Borrowing with QTC | | | 49,000 | | | | 58,853 | | | | 47,014 | | | | 57,494 | | | | 67,872 | | | | 78,104 | | | | 88,154 | |
Leases and other similar arrangements | | | 7,671 | | | | 7,385 | | | | 7,586 | | | | 7,892 | | | | 8,074 | | | | 6,929 | | | | 6,567 | |
Securities and derivatives | | | 93 | | | | 220 | | | | 93 | | | | 93 | | | | 93 | | | | 93 | | | | 93 | |
| | | | | | | | | | | | | | | | | | | | | | | | | | | | |
| | | 56,764 | | | 66,459 | | | 54,693 | | | 65,479 | | | 76,040 | | | 85,127 | | | 94,814 | |
176
Budget Strategy and Outlook 2023-24
| Table 9.5 | Public Non-financial Corporations Sector Balance Sheet1 |
| | | | | | | | | | | | | | | | | | | | | | | | | | | | |
| | | 2021–22
Outcome
$ million | | | 2022–23
Budget
$ million | | | 2022–23
Est.Actual
$ million | | | 2023–24
Budget
$ million | | | 2024–25
Projection
$ million | | | 2025–26
Projection
$ million | | | 2026–27
Projection
$ million | |
Assets | | | | | | | | | | | | | | | | | | | | | | | | | | | | |
Financial Assets | | | | | | | | | | | | | | | | | | | | | | | | | | | | |
Cash and deposits | | | 1,162 | | | | 1,162 | | | | 851 | | | | 950 | | | | 1,069 | | | | 1,142 | | | | 1,280 | |
Advances paid | | | 1,053 | | | | 1,554 | | | | 1,597 | | | | 1,598 | | | | 1,656 | | | | 2,122 | | | | 2,121 | |
Investments, loans and placements | | | 15,926 | | | | 2,914 | | | | 5,638 | | | | 2,739 | | | | 1,837 | | | | 1,590 | | | | 1,361 | |
Receivables | | | 2,624 | | | | 2,056 | | | | 2,238 | | | | 2,419 | | | | 2,510 | | | | 2,640 | | | | 2,744 | |
Equity | | | | | | | | | | | | | | | | | | | | | | | | | | | | |
Investments—other | | | 6 | | | | 7 | | | | 56 | | | | 66 | | | | 66 | | | | 66 | | | | 66 | |
Total Financial Assets | | | 20,770 | | | | 7,693 | | | | 10,380 | | | | 7,772 | | | | 7,137 | | | | 7,559 | | | | 7,571 | |
| | | | | | | |
Non-financial Assets | | | | | | | | | | | | | | | | | | | | | | | | | | | | |
Land and other fixed assets | | | 64,642 | | | | 65,864 | | | | 68,471 | | | | 73,250 | | | | 79,823 | | | | 85,796 | | | | 93,248 | |
Other non-financial assets | | | 5,926 | | | | 1,396 | | | | 1,608 | | | | 1,470 | | | | 1,411 | | | | 1,338 | | | | 1,269 | |
Total Non-financial Assets | | | 70,568 | | | | 67,260 | | | | 70,079 | | | | 74,720 | | | | 81,234 | | | | 87,134 | | | | 94,517 | |
| | | | | | | |
Total Assets | | | 91,338 | | | | 74,953 | | | | 80,459 | | | | 82,492 | | | | 88,371 | | | | 94,694 | | | | 102,088 | |
| | | | | | | |
Liabilities | | | | | | | | | | | | | | | | | | | | | | | | | | | | |
Payables | | | 2,472 | | | | 2,037 | | | | 2,035 | | | | 2,717 | | | | 2,942 | | | | 2,940 | | | | 3,135 | |
Superannuation liability | | | (400 | ) | | | (273 | ) | | | (400 | ) | | | (400 | ) | | | (400 | ) | | | (400 | ) | | | (400 | ) |
Other employee benefits | | | 927 | | | | 1,008 | | | | 956 | | | | 1,015 | | | | 1,072 | | | | 1,116 | | | | 1,160 | |
Deposits held | | | 11 | | | | 12 | | | | 11 | | | | 11 | | | | 11 | | | | 11 | | | | 11 | |
Advances received | | | 22 | | | | 4 | | | | 4 | | | | 3 | | | | 2 | | | | 2 | | | | 1 | |
Borrowing2 | | | 59,495 | | | | 44,334 | | | | 47,875 | | | | 45,166 | | | | 46,120 | | | | 48,664 | | | | 52,207 | |
Other liabilities | | | 11,191 | | | | 7,816 | | | | 8,294 | | | | 8,596 | | | | 8,892 | | | | 9,174 | | | | 9,522 | |
Total Liabilities | | | 73,719 | | | | 54,938 | | | | 58,774 | | | | 57,109 | | | | 58,640 | | | | 61,506 | | | | 65,637 | |
| | | | | | | |
Net Worth | | | 17,619 | | | | 20,014 | | | | 21,685 | | | | 25,383 | | | | 29,731 | | | | 33,187 | | | | 36,451 | |
| | | | | | | | | | | | | | | | | | | | | | | | | | | | |
Net Financial Worth | | | (52,949 | ) | | | (47,245 | ) | | | (48,395 | ) | | | (49,338 | ) | | | (51,503 | ) | | | (53,947 | ) | | | (58,066 | ) |
Net Debt | | | 41,389 | | | | 38,720 | | | | 39,804 | | | | 39,893 | | | | 41,572 | | | | 43,823 | | | | 47,457 | |
Notes: | | | | | | | | | | | | | | | | | | | | | | | | | | | | |
1. Numbers may not add due to rounding. 2. Borrowing line comprised of: | | | | | | | | | | | | | | | | | |
Borrowing with QTC | | | 41,851 | | | | 41,700 | | | | 43,074 | | | | 42,963 | | | | 44,932 | | | | 47,743 | | | | 51,402 | |
Leases and other similar arrangements | | | 357 | | | | 326 | | | | 354 | | | | 653 | | | | 594 | | | | 527 | | | | 460 | |
Securities and derivatives | | | 17,288 | | | | 2,308 | | | | 4,447 | | | | 1,550 | | | | 594 | | | | 394 | | | | 345 | |
| | | | | | | | | | | | | | | | | | | | | | | | | | | | |
| | | 59,495 | | | 44,334 | | | 47,875 | | | 45,166 | | | 46,120 | | | 48,664 | | | 52,207 | |
177
Budget Strategy and Outlook 2023-24
| Table 9.6 | Non-financial Public Sector Balance Sheet1 |
| | | | | | | | | | | | | | | | | | | | | | | | | | | | |
| | | 2021–22
Outcome
$ million | | | 2022–23
Budget
$ million | | | 2022–23
Est.Actual
$ million | | | 2023–24
Budget
$ million | | | 2024–25
Projection
$ million | | | 2025–26
Projection
$ million | | | 2026–27
Projection
$ million | |
Assets | | | | | | | | | | | | | | | | | | | | | | | | | | | | |
Financial Assets | | | | | | | | | | | | | | | | | | | | | | | | | | | | |
Cash and deposits | | | 2,872 | | | | 1,919 | | | | 1,923 | | | | 1,796 | | | | 1,852 | | | | 1,967 | | | | 2,079 | |
Advances paid | | | 1,216 | | | | 1,404 | | | | 1,223 | | | | 1,542 | | | | 1,637 | | | | 1,676 | | | | 1,708 | |
Investments, loans and placements | | | 60,060 | | | | 49,180 | | | | 53,967 | | | | 51,377 | | | | 49,203 | | | | 48,806 | | | | 48,922 | |
Receivables | | | 5,958 | | | | 5,761 | | | | 5,413 | | | | 5,760 | | | | 5,897 | | | | 6,084 | | | | 5,956 | |
Equity | | | | | | | | | | | | | | | | | | | | | | | | | | | | |
Investments in other public sector entities | | | 2,363 | | | | 2,442 | | | | 3,033 | | | | 3,033 | | | | 3,033 | | | | 3,033 | | | | 3,033 | |
Investments—other | | | 171 | | | | 172 | | | | 221 | | | | 231 | | | | 231 | | | | 231 | | | | 231 | |
Total Financial Assets | | | 72,640 | | | | 60,879 | | | | 65,780 | | | | 63,738 | | | | 61,853 | | | | 61,797 | | | | 61,930 | |
| | | | | | | |
Non-financial Assets | | | | | | | | | | | | | | | | | | | | | | | | | | | | |
Land and other fixed assets | | | 346,914 | | | | 320,434 | | | | 358,619 | | | | 369,993 | | | | 386,141 | | | | 400,444 | | | | 415,741 | |
Other non-financial assets | | | 1,259 | | | | 1,095 | | | | 1,125 | | | | 1,205 | | | | 1,160 | | | | 1,130 | | | | 1,100 | |
Total Non-financial Assets | | | 348,173 | | | | 321,530 | | | | 359,743 | | | | 371,198 | | | | 387,300 | | | | 401,574 | | | | 416,841 | |
| | | | | | | |
Total Assets | | | 420,813 | | | | 382,408 | | | | 425,523 | | | | 434,937 | | | | 449,153 | | | | 463,371 | | | | 478,770 | |
| | | | | | | |
Liabilities | | | | | | | | | | | | | | | | | | | | | | | | | | | | |
Payables | | | 7,182 | | | | 5,811 | | | | 6,484 | | | | 6,699 | | | | 6,735 | | | | 6,801 | | | | 6,816 | |
Superannuation liability | | | 21,768 | | | | 23,796 | | | | 20,805 | | | | 20,427 | | | | 19,675 | | | | 18,648 | | | | 17,352 | |
Other employee benefits | | | 9,953 | | | | 10,623 | | | | 10,516 | | | | 11,044 | | | | 11,597 | | | | 12,105 | | | | 12,040 | |
Deposits held | | | 11 | | | | 12 | | | | 11 | | | | 11 | | | | 11 | | | | 11 | | | | 11 | |
Advances received | | | 262 | | | | 190 | | | | 190 | | | | 142 | | | | 168 | | | | 118 | | | | 68 | |
Borrowing2 | | | 116,252 | | | | 110,786 | | | | 102,561 | | | | 110,638 | | | | 122,152 | | | | 133,784 | | | | 147,015 | |
Other liabilities | | | 15,758 | | | | 14,936 | | | | 15,746 | | | | 15,203 | | | | 14,914 | | | | 14,637 | | | | 14,389 | |
Total Liabilities | | | 171,187 | | | | 166,154 | | | | 156,313 | | | | 164,163 | | | | 175,253 | | | | 186,105 | | | | 197,690 | |
| | | | | | | |
Net Worth | | | 249,625 | | | | 216,254 | | | | 269,210 | | | | 270,774 | | | | 273,900 | | | | 277,266 | | | | 281,080 | |
| | | | | | | | | | | | | | | | | | | | | | | | | | | | |
Net Financial Worth | | | (98,547 | ) | | | (105,276 | ) | | | (90,533 | ) | | | (100,424 | ) | | | (113,400 | ) | | | (124,308 | ) | | | (135,761 | ) |
Net Financial Liabilities | | | 100,911 | | | | 107,717 | | | | 93,566 | | | | 103,458 | | | | 116,434 | | | | 127,341 | | | | 138,794 | |
Net Debt | | | 52,379 | | | | 58,485 | | | | 45,649 | | | | 56,077 | | | | 69,639 | | | | 81,464 | | | | 94,384 | |
Notes: | | | | | | | | | | | | | | | | | | | | | | | | | | | | |
1. Numbers may not add due to rounding. 2. Borrowing line comprised of: | | | | | | | | | | | | | | | | | | | | | | | | | | | | |
Borrowing with QTC | | | 90,851 | | | | 100,553 | | | | 90,088 | | | | 100,457 | | | | 112,803 | | | | 125,847 | | | | 139,556 | |
Leases and other similar arrangements | | | 8,028 | | | | 7,711 | | | | 7,941 | | | | 8,545 | | | | 8,668 | | | | 7,456 | | | | 7,027 | |
Securities and derivatives | | | 17,374 | | | | 2,521 | | | | 4,533 | | | | 1,636 | | | | 681 | | | | 481 | | | | 432 | |
| | | | | | | | | | | | | | | | | | | | | | | | | | | | |
| | | 116,252 | | | 110,786 | | | 102,561 | | | 110,638 | | | 122,152 | | | 133,784 | | | 147,015 | |
178
Budget Strategy and Outlook 2023-24
| Table 9.7 | General Government Sector Cash Flow Statement1 |
| | | | | | | | | | | | | | | | | | | | | | | | | | | | |
| | | 2021–22
Outcome
$ million | | | 2022–23
Budget
$ million | | | 2022–23
Est.Actual
$ million | | | 2023–24
Budget
$ million | | | 2024–25
Projection
$ million | | | 2025–26
Projection
$ million | | | 2026–27
Projection
$ million | |
Cash Receipts from Operating Activities | | | | | | | | | | | | | | | | | | | | | | | | | | | | |
Taxes received | | | 20,766 | | | | 18,840 | | | | 20,561 | | | | 21,936 | | | | 23,123 | | | | 24,283 | | | | 25,385 | |
Grants and subsidies received | | | 34,377 | | | | 34,382 | | | | 36,948 | | | | 39,641 | | | | 38,942 | | | | 38,939 | | | | 40,619 | |
Sales of goods and services | | | 6,298 | | | | 6,457 | | | | 5,712 | | | | 7,196 | | | | 7,321 | | | | 7,392 | | | | 7,462 | |
Interest receipts | | | 2,638 | | | | 2,844 | | | | 3,169 | | | | 3,203 | | | | 3,173 | | | | 3,117 | | | | 3,110 | |
Dividends and income tax equivalents | | | 1,202 | | | | 788 | | | | 837 | | | | 1,080 | | | | 1,529 | | | | 1,830 | | | | 1,749 | |
Other receipts | | | 12,472 | | | | 10,866 | | | | 20,498 | | | | 9,790 | | | | 8,638 | | | | 8,621 | | | | 8,716 | |
Total Operating Receipts | | | 77,753 | | | | 74,178 | | | | 87,725 | | | | 82,846 | | | | 82,725 | | | | 84,181 | | | | 87,042 | |
| | | | | | | |
Cash Payments for Operating Activities | | | | | | | | | | | | | | | | | | | | | | | | | | | | |
Payments for employees | | | (31,739 | ) | | | (34,334 | ) | | | (34,791 | ) | | | (37,332 | ) | | | (38,069 | ) | | | (39,261 | ) | | | (41,079 | ) |
Payments for goods and services | | | (20,506 | ) | | | (22,258 | ) | | | (20,955 | ) | | | (24,872 | ) | | | (23,600 | ) | | | (23,670 | ) | | | (24,258 | ) |
Grants and subsidies | | | (13,617 | ) | | | (14,293 | ) | | | (13,532 | ) | | | (16,689 | ) | | | (14,782 | ) | | | (13,488 | ) | | | (13,525 | ) |
Interest paid | | | (1,441 | ) | | | (1,755 | ) | | | (1,639 | ) | | | (1,892 | ) | | | (2,374 | ) | | | (2,874 | ) | | | (3,442 | ) |
Total Operating Payments | | | (67,303 | ) | | | (72,640 | ) | | | (70,918 | ) | | | (80,786 | ) | | | (78,825 | ) | | | (79,294 | ) | | | (82,305 | ) |
| | | | | | | |
Net Cash Inflows from Operating Activities | | | 10,451 | | | | 1,538 | | | | 16,807 | | | | 2,060 | | | | 3,901 | | | | 4,887 | | | | 4,737 | |
| | | | | | | |
Cash Flows from Investments in Non-Financial Assets | | | | | | | | | | | | | | | | | | | | | | | | | | | | |
Purchases of non-financial assets | | | (7,889 | ) | | | (8,478 | ) | | | (9,194 | ) | | | (9,347 | ) | | | (11,473 | ) | | | (11,417 | ) | | | (11,389 | ) |
Sales of non-financial assets | | | 255 | | | | 177 | | | | 104 | | | | 276 | | | | 185 | | | | 180 | | | | 177 | |
Net Cash Flows from Investments in Non-financial Assets | | | (7,635 | ) | | | (8,301 | ) | | | (9,090 | ) | | | (9,071 | ) | | | (11,288 | ) | | | (11,237 | ) | | | (11,212 | ) |
| | | | | | | |
Net Cash Flows from Investments in Financial Assets for Policy Purposes | | | 127 | | | | (478 | ) | | | (774 | ) | | | (2,264 | ) | | | (3,534 | ) | | | (2,744 | ) | | | (2,545 | ) |
| | | | | | | |
Net Cash Flows from Investments in Financial Assets for Liquidity Purposes | | | (3,889 | ) | | | 1,321 | | | | (7,122 | ) | | | 4,657 | | | | 1,391 | | | | 226 | | | | (314 | ) |
| | | | | | | |
Receipts from Financing Activities | | | | | | | | | | | | | | | | | | | | | | | | | | | | |
Advances received (net) | | | (126 | ) | | | 900 | | | | 482 | | | | (46 | ) | | | 86 | | | | 419 | | | | (49 | ) |
Borrowing (net) | | | 1,653 | | | | 4,797 | | | | (942 | ) | | | 4,437 | | | | 9,383 | | | | 8,490 | | | | 9,356 | |
Net Cash Flows from Financing Activities | | | 1,527 | | | | 5,697 | | | | (460 | ) | | | 4,391 | | | | 9,469 | | | | 8,909 | | | | 9,307 | |
| | | | | | | |
Net Increase/(Decrease) in Cash held | | | 581 | | | | (223 | ) | | | (638 | ) | | | (226 | ) | | | (62 | ) | | | 42 | | | | (26 | ) |
| | | | | | | |
Net cash from operating activities | | | 10,451 | | | | 1,538 | | | | 16,807 | | | | 2,060 | | | | 3,901 | | | | 4,887 | | | | 4,737 | |
Net cash flows from investments in non-financial assets | | | (7,635 | ) | | | (8,301 | ) | | | (9,090 | ) | | | (9,071 | ) | | | (11,288 | ) | | | (11,237 | ) | | | (11,212 | ) |
Surplus/(Deficit) | | | 2,816 | | | | (6,763 | ) | | | 7,717 | | | | (7,010 | ) | | | (7,388 | ) | | | (6,350 | ) | | | (6,475 | ) |
| | | | | | | | | | | | | | | | | | | | | | | | | | | | |
| | | | | | | |
Derivation of ABS GFS Cash Surplus/Deficit | | | | | | | | | | | | | | | | | | | | | | | | | | | | |
Cash surplus/(deficit) | | | 2,816 | | | | (6,763 | ) | | | 7,717 | | | | (7,010 | ) | | | (7,388 | ) | | | (6,350 | ) | | | (6,475 | ) |
Acquisitions under finance leases and similar arrangements | | | (1,051 | ) | | | (810 | ) | | | (1,082 | ) | | | (814 | ) | | | (644 | ) | | | (216 | ) | | | (5 | ) |
ABS GFS Cash Surplus/(Deficit) Including Finance Leases and Similar Arrangements | | | 1,765 | | | | (7,573 | ) | | | 6,635 | | | | (7,824 | ) | | | (8,032 | ) | | | (6,566 | ) | | | (6,480 | ) |
Note:
| 1. | Numbers may not add due to rounding. |
179
Budget Strategy and Outlook 2023-24
| Table 9.8 | Public Non-financial Corporations Sector Cash Flow Statement1 |
| | | | | | | | | | | | | | | | | | | | | | | | | | | | |
| | | 2021–22
Outcome
$ million | | | 2022–23
Budget
$ million | | | 2022–23
Est.Actual
$ million | | | 2023–24
Budget
$ million | | | 2024–25
Projection
$ million | | | 2025–26
Projection
$ million | | | 2026–27
Projection
$ million | |
Cash Receipts from Operating Activities | | | | | | | | | | | | | | | | | | | | | | | | | | | | |
Grants and subsidies received | | | 676 | | | | 831 | | | | 844 | | | | 799 | | | | 710 | | | | 692 | | | | 653 | |
Sales of goods and services | | | 16,497 | | | | 14,112 | | | | 17,086 | | | | 15,616 | | | | 16,473 | | | | 17,496 | | | | 19,034 | |
Interest receipts | | | 66 | | | | 56 | | | | 92 | | | | 94 | | | | 94 | | | | 102 | | | | 85 | |
Other receipts | | | 235 | | | | 321 | | | | 425 | | | | 687 | | | | 303 | | | | 282 | | | | 216 | |
Total Operating Receipts | | | 17,474 | | | | 15,319 | | | | 18,447 | | | | 17,195 | | | | 17,579 | | | | 18,572 | | | | 19,988 | |
| | | | | | | |
Cash Payments for Operating Activities | | | | | | | | | | | | | | | | | | | | | | | | | | | | |
Payments for employees | | | (2,493 | ) | | | (2,641 | ) | | | (2,758 | ) | | | (2,953 | ) | | | (3,142 | ) | | | (3,234 | ) | | | (3,262 | ) |
Payments for goods and services | | | (8,941 | ) | | | (5,979 | ) | | | (9,449 | ) | | | (8,331 | ) | | | (7,909 | ) | | | (7,658 | ) | | | (7,946 | ) |
Grants and subsidies | | | (25 | ) | | | (24 | ) | | | (25 | ) | | | (25 | ) | | | (25 | ) | | | (19 | ) | | | (19 | ) |
Interest paid | | | (1,606 | ) | | | (1,610 | ) | | | (1,674 | ) | | | (1,793 | ) | | | (1,879 | ) | | | (2,086 | ) | | | (2,380 | ) |
Other payments | | | (976 | ) | | | (999 | ) | | | (1,117 | ) | | | (976 | ) | | | (1,066 | ) | | | (1,229 | ) | | | (1,235 | ) |
Total Operating Payments | | | (14,042 | ) | | | (11,253 | ) | | | (15,023 | ) | | | (14,078 | ) | | | (14,021 | ) | | | (14,226 | ) | | | (14,842 | ) |
| | | | | | | |
Net Cash Inflows from Operating Activities | | | 3,432 | | | | 4,066 | | | | 3,424 | | | | 3,117 | | | | 3,558 | | | | 4,345 | | | | 5,145 | |
| | | | | | | |
Cash Flows from Investments in Non-Financial Assets | | | | | | | | | | | | | | | | | | | | | | | | | | | | |
Purchases of non-financial assets | | | (3,134 | ) | | | (3,334 | ) | | | (4,489 | ) | | | (5,849 | ) | | | (8,735 | ) | | | (8,534 | ) | | | (10,233 | ) |
Sales of non-financial assets | | | 63 | | | | 33 | | | | 38 | | | | 5 | | | | 6 | | | | 15 | | | | 3 | |
Net Cash Flows from Investments in Non-financial Assets | | | (3,071 | ) | | | (3,301 | ) | | | (4,451 | ) | | | (5,844 | ) | | | (8,729 | ) | | | (8,518 | ) | | | (10,230 | ) |
| | | | | | | |
Net Cash Flows from Investments in Financial Assets for Policy Purposes | | | 4 | | | | (1,017 | ) | | | (703 | ) | | | (80 | ) | | | (143 | ) | | | (557 | ) | | | (89 | ) |
| | | | | | | |
Net Cash Flows from Investments in Financial Assets for Liquidity Purposes | | | 899 | | | | 608 | | | | 370 | | | | 10 | | | | (18 | ) | | | (19 | ) | | | (20 | ) |
| | | | | | | |
Receipts from Financing Activities | | | | | | | | | | | | | | | | | | | | | | | | | | | | |
Advances received (net) | | | (1 | ) | | | (1 | ) | | | (1 | ) | | | (1 | ) | | | (1 | ) | | | (1 | ) | | | (1 | ) |
Borrowing (net) | | | 223 | | | | (415 | ) | | | 1,592 | | | | 521 | | | | 2,166 | | | | 2,803 | | | | 3,737 | |
Dividends paid | | | (735 | ) | | | (192 | ) | | | (246 | ) | | | (474 | ) | | | (844 | ) | | | (1,086 | ) | | | (1,061 | ) |
Deposits received (net) | | | (1 | ) | | | — | | | | — | | | | — | | | | — | | | | — | | | | — | |
Other financing (net) | | | (705 | ) | | | 488 | | | | (296 | ) | | | 2,850 | | | | 4,129 | | | | 3,105 | | | | 2,656 | |
Net Cash Flows from Financing Activities | | | (1,220 | ) | | | (119 | ) | | | 1,049 | | | | 2,896 | | | | 5,450 | | | | 4,821 | | | | 5,332 | |
| | | | | | | |
Net Increase/(Decrease) in Cash held | | | 44 | | | | 237 | | | | (311 | ) | | | 99 | | | | 118 | | | | 73 | | | | 138 | |
| | | | | | | |
Net cash from operating activities | | | 3,432 | | | | 4,066 | | | | 3,424 | | | | 3,117 | | | | 3,558 | | | | 4,345 | | | | 5,145 | |
Net cash flows from investments in non-financial assets | | | (3,071 | ) | | | (3,301 | ) | | | (4,451 | ) | | | (5,844 | ) | | | (8,729 | ) | | | (8,518 | ) | | | (10,230 | ) |
Dividends paid | | | (735 | ) | | | (192 | ) | | | (246 | ) | | | (474 | ) | | | (844 | ) | | | (1,086 | ) | | | (1,061 | ) |
Surplus/(Deficit) | | | (375 | ) | | | 573 | | | | (1,273 | ) | | | (3,201 | ) | | | (6,015 | ) | | | (5,259 | ) | | | (6,146 | ) |
| | | | | | | |
Derivation of ABS GFS Cash Surplus/Deficit | | | | | | | | | | | | | | | | | | | | | | | | | | | | |
Cash surplus/(deficit) | | | (375 | ) | | | 573 | | | | (1,273 | ) | | | (3,201 | ) | | | (6,015 | ) | | | (5,259 | ) | | | (6,146 | ) |
Acquisitions under finance leases and similar arrangements | | | (13 | ) | | | (26 | ) | | | (34 | ) | | | (360 | ) | | | (5 | ) | | | (5 | ) | | | (6 | ) |
ABS GFS Cash Surplus/(Deficit) Including Finance Leases and Similar Arrangements | | | (388 | ) | | | 547 | | | | (1,307 | ) | | | (3,562 | ) | | | (6,021 | ) | | | (5,263 | ) | | | (6,152 | ) |
Note:
| 1. | Numbers may not add due to rounding. |
180
Budget Strategy and Outlook 2023-24
| Table 9.9 | Non-financial Public Sector Cash Flow Statement1 |
| | | | | | | | | | | | | | | | | | | | | | | | | | | | |
| | | 2021–22
Outcome
$ million | | | 2022–23
Budget
$ million | | | 2022–23
Est.Actual
$ million | | | 2023–24
Budget
$ million | | | 2024–25
Projection
$ million | | | 2025–26
Projection
$ million | | | 2026–27
Projection
$ million | |
| | | | | |
Cash Receipts from Operating Activities | | | | | | | | | | | | | | | | | | | | | |
Taxes received | | | 20,400 | | | | 18,480 | | | | 20,189 | | | | 21,552 | | | | 22,734 | | | | 23,876 | | | | 24,969 | |
Grants and subsidies received | | | 34,390 | | | | 34,392 | | | | 36,956 | | | | 39,679 | | | | 38,974 | | | | 38,973 | | | | 40,641 | |
Sales of goods and services | | | 20,095 | | | | 17,413 | | | | 19,495 | | | | 19,401 | | | | 20,160 | | | | 21,242 | | | | 23,273 | |
Interest receipts | | | 2,698 | | | | 2,896 | | | | 3,242 | | | | 3,276 | | | | 3,245 | | | | 3,203 | | | | 3,177 | |
Dividends and income tax equivalents | | | 79 | | | | 104 | | | | 91 | | | | 169 | | | | 184 | | | | 202 | | | | 222 | |
Other receipts | | | 12,782 | | | | 11,174 | | | | 20,838 | | | | 10,511 | | | | 8,865 | | | | 8,924 | | | | 8,870 | |
Total Operating Receipts | | | 90,445 | | | | 84,459 | | | | 100,811 | | | | 94,588 | | | | 94,162 | | | | 96,420 | | | | 101,151 | |
| | | | | | | |
Cash Payments for Operating Activities | | | | | | | | | | | | | | | | | | | | | | | | | | | | |
Payments for employees | | | (34,096 | ) | | | (36,842 | ) | | | (37,403 | ) | | | (40,129 | ) | | | (41,049 | ) | | | (42,328 | ) | | | (44,171 | ) |
Payments for goods and services | | | (26,697 | ) | | | (25,064 | ) | | | (27,094 | ) | | | (29,776 | ) | | | (27,857 | ) | | | (27,662 | ) | | | (28,952 | ) |
Grants and subsidies | | | (12,979 | ) | | | (13,496 | ) | | | (12,720 | ) | | | (15,955 | ) | | | (14,129 | ) | | | (12,850 | ) | | | (12,913 | ) |
Interest paid | | | (2,837 | ) | | | (3,144 | ) | | | (3,078 | ) | | | (3,455 | ) | | | (4,027 | ) | | | (4,729 | ) | | | (5,585 | ) |
Other payments | | | (570 | ) | | | (501 | ) | | | (612 | ) | | | (534 | ) | | | (560 | ) | | | (682 | ) | | | (764 | ) |
Total Operating Payments | | | (77,179 | ) | | | (79,048 | ) | | | (80,907 | ) | | | (89,849 | ) | | | (87,622 | ) | | | (88,251 | ) | | | (92,385 | ) |
| | | | | | | |
Net Cash Inflows from Operating Activities | | | 13,266 | | | | 5,411 | | | | 19,904 | | | | 4,738 | | | | 6,541 | | | | 8,169 | | | | 8,766 | |
| | | | | | | |
Cash Flows from Investments in Non-Financial Assets | | | | | | | | | | | | | | | | | | | | | | | | | | | | |
Purchases of non-financial assets | | | (11,140 | ) | | | (11,812 | ) | | | (13,601 | ) | | | (15,231 | ) | | | (20,135 | ) | | | (19,973 | ) | | | (21,566 | ) |
Sales of non-financial assets | | | 317 | | | | 211 | | | | 142 | | | | 281 | | | | 191 | | | | 196 | | | | 180 | |
Net Cash Flows from Investments in Non-financial Assets | | | (10,823 | ) | | | (11,602 | ) | | | (13,459 | ) | | | (14,950 | ) | | | (19,944 | ) | | | (19,777 | ) | | | (21,386 | ) |
| | | | | | | |
Net Cash Flows from Investments in Financial Assets for Policy Purposes | | | 112 | | | | (60 | ) | | | 35 | | | | (314 | ) | | | (87 | ) | | | (27 | ) | | | (22 | ) |
| | | | | | | |
Net Cash Flows from Investments in Financial Assets for Liquidity Purposes | | | (2,990 | ) | | | 1,929 | | | | (6,752 | ) | | | 4,667 | | | | 1,373 | | | | 207 | | | | (333 | ) |
| | | | | | | |
Receipts from Financing Activities | | | | | | | | | | | | | | | | | | | | | | | | | | | | |
Advances received (net) | | | (39 | ) | | | (47 | ) | | | (62 | ) | | | (47 | ) | | | 28 | | | | (48 | ) | | | (48 | ) |
Borrowing (net) | | | 1,876 | | | | 4,382 | | | | 650 | | | | 4,958 | | | | 11,549 | | | | 11,293 | | | | 13,093 | |
Deposits received (net) | | | (1 | ) | | | — | | | | — | | | | — | | | | — | | | | — | | | | — | |
Other financing (net) | | | (776 | ) | | | — | | | | (1,264 | ) | | | 820 | | | | 597 | | | | 298 | | | | 42 | |
Net Cash Flows from Financing Activities | | | 1,061 | | | | 4,335 | | | | (676 | ) | | | 5,731 | | | | 12,174 | | | | 11,543 | | | | 13,087 | |
| | | | | | | |
Net Increase/(Decrease) in Cash held | | | 625 | | | | 13 | | | | (949 | ) | | | (127 | ) | | | 57 | | | | 115 | | | | 112 | |
| | | | | | | |
Net cash from operating activities | | | 13,266 | | | | 5,411 | | | | 19,904 | | | | 4,738 | | | | 6,541 | | | | 8,169 | | | | 8,766 | |
Net cash flows from investments in non-financial assets | | | (10,823 | ) | | | (11,602 | ) | | | (13,459 | ) | | | (14,950 | ) | | | (19,944 | ) | | | (19,777 | ) | | | (21,386 | ) |
Surplus/(Deficit) | | | 2,443 | | | | (6,191 | ) | | | 6,444 | | | | (10,211 | ) | | | (13,403 | ) | | | (11,608 | ) | | | (12,620 | ) |
| | | | | | | |
Derivation of ABS GFS Cash Surplus/Deficit | | | | | | | | | | | | | | | | | | | | | | | | | | | | |
Cash surplus/(deficit) | | | 2,443 | | | | (6,191 | ) | | | 6,444 | | | | (10,211 | ) | | | (13,403 | ) | | | (11,608 | ) | | | (12,620 | ) |
Acquisitions under finance leases and similar arrangements | | | (1,064 | ) | | | (835 | ) | | | (1,116 | ) | | | (1,174 | ) | | | (649 | ) | | | (221 | ) | | | (11 | ) |
ABS GFS Cash Surplus/(Deficit) Including Finance Leases and Similar Arrangements | | | 1,379 | | | | (7,026 | ) | | | 5,328 | | | | (11,386 | ) | | | (14,052 | ) | | | (11,829 | ) | | | (12,632 | ) |
Note:
| 1. | Numbers may not add due to rounding. |
181
Budget Strategy and Outlook 2023-24
| 9.3 | General Government Sector time series |
Data presented in Table 9.10 provides a time series from 2010–11 to 2021–22 for the General Government Sector on the key fiscal aggregates used by the government to measure financial performance. These aggregates have been backcast (as far as possible) to comply with AASB 1049 Whole of Government and General Government Sector Financial Reporting.
182
Budget Strategy and Outlook 2023-24
| Table 9.10 | General Government Sector Time Series1 |
| | | | | | | | | | | | | | | | | | | | | | | | | | | | | | | | | | | | | | | | | | | | | | | | |
| | | 2010–11
Actual
$ million | | | 2011–12
Actual
$ million | | | 2012–13
Actual
$ million | | | 2013–14
Actual
$ million | | | 2014–15
Actual
$ million | | | 2015–16
Actual
$ million | | | 2016–17
Actual
$ million | | | 2017–18
Actual
$ million | | | 2018–19
Actual
$ million | | | 2019–20
Actual
$ million | | | 2020–21
Actual
$ million | | | 2021–22
Actual
$ million | |
Revenue from Transactions | | | | | | | | | | | | | | | | | | | | | | | | | | | | | | | | | | | | | | | | | | | | | | | | |
Taxation revenue | | | 9,981 | | | | 10,608 | | | | 10,937 | | | | 11,840 | | | | 12,598 | | | | 12,547 | | | | 12,919 | | | | 13,244 | | | | 14,165 | | | | 14,585 | | | | 16,249 | | | | 20,011 | |
Grant revenue | | | 20,338 | | | | 22,652 | | | | 18,322 | | | | 21,740 | | | | 23,583 | | | | 23,740 | | | | 27,384 | | | | 27,966 | | | | 28,307 | | | | 27,645 | | | | 33,013 | | | | 34,135 | |
Sales of goods and services | | | 4,172 | | | | 5,002 | | | | 5,087 | | | | 5,039 | | | | 5,443 | | | | 5,712 | | | | 5,642 | | | | 5,884 | | | | 5,783 | | | | 5,618 | | | | 6,105 | | | | 5,896 | |
Interest income | | | 2,368 | | | | 2,485 | | | | 2,644 | | | | 2,460 | | | | 2,470 | | | | 2,543 | | | | 2,351 | | | | 2,389 | | | | 2,191 | | | | 2,088 | | | | 1,948 | | | | 2,643 | |
Dividend and income tax equivalent income | | | 1,232 | | | | 1,112 | | | | 1,351 | | | | 1,975 | | | | 2,554 | | | | 2,661 | | | | 2,675 | | | | 2,920 | | | | 2,784 | | | | 1,926 | | | | 1,329 | | | | 790 | |
Other revenue | | | 3,921 | | | | 3,942 | | | | 3,415 | | | | 3,650 | | | | 3,322 | | | | 3,577 | | | | 5,223 | | | | 5,685 | | | | 6,598 | | | | 5,915 | | | | 4,147 | | | | 10,710 | |
Total Revenue | | | 42,013 | | | | 45,801 | | | | 41,755 | | | | 46,705 | | | | 49,970 | | | | 50,780 | | | | 56,194 | | | | 58,087 | | | | 59,828 | | | | 57,778 | | | | 62,791 | | | | 74,185 | |
Expenses from Transactions | | | | | | | | | | | | | | | | | | | | | | | | | | | | | | | | | | | | | | | | | | | | | | | | |
Employee expenses | | | 16,826 | | | | 18,250 | | | | 18,130 | | | | 17,816 | | | | 18,592 | | | | 20,045 | | | | 21,258 | | | | 22,681 | | | | 24,019 | | | | 25,662 | | | | 26,385 | | | | 28,068 | |
Superannuation expenses | | | | | | | | | | | | | | | | | | | | | | | | | | | | | | | | | | | | | | | | | | | | | | | | |
Superannuation interest costs | | | 1,240 | | | | 1,216 | | | | 923 | | | | 963 | | | | 878 | | | | 767 | | | | 514 | | | | 667 | | | | 653 | | | | 354 | | | | 246 | | | | 377 | |
Other superannuation expenses | | | 2,171 | | | | 2,301 | | | | 2,420 | | | | 2,277 | | | | 2,319 | | | | 2,507 | | | | 2,661 | | | | 2,741 | | | | 3,012 | | | | 3,183 | | | | 3,073 | | | | 3,387 | |
Other operating expenses | | | 8,646 | | | | 9,497 | | | | 12,817 | | | | 13,108 | | | | 14,539 | | | | 14,811 | | | | 15,578 | | | | 17,259 | | | | 16,480 | | | | 17,085 | | | | 16,500 | | | | 18,228 | |
Depreciation and amortisation | | | 2,507 | | | | 2,777 | | | | 2,902 | | | | 3,060 | | | | 3,137 | | | | 2,921 | | | | 3,068 | | | | 3,326 | | | | 3,451 | | | | 4,033 | | | | 4,170 | | | | 4,506 | |
Other interest expenses | | | 1,125 | | | | 1,659 | | | | 1,940 | | | | 2,200 | | | | 2,328 | | | | 2,220 | | | | 1,722 | | | | 1,614 | | | | 1,581 | | | | 1,486 | | | | 1,619 | | | | 1,508 | |
Grant expenses | | | 10,963 | | | | 10,327 | | | | 7,182 | | | | 6,792 | | | | 7,758 | | | | 6,841 | | | | 8,568 | | | | 8,048 | | | | 9,647 | | | | 11,702 | | | | 11,713 | | | | 13,817 | |
Total Expenses | | | 43,479 | | | | 46,028 | | | | 46,312 | | | | 46,217 | | | | 49,551 | | | | 50,112 | | | | 53,369 | | | | 56,337 | | | | 58,843 | | | | 63,505 | | | | 63,706 | | | | 69,889 | |
Net Operating Balance | | | (1,466 | ) | | | (226 | ) | | | (4,558 | ) | | | 488 | | | | 420 | | | | 668 | | | | 2,825 | | | | 1,750 | | | | 985 | | | | (5,728 | ) | | | (915 | ) | | | 4,296 | |
OTHER KEY AGGREGATES | | | | | | | | | | | | | | | | | | | | | | | | | | | | | | | | | | | | | | | | | | | | | | | | |
Purchases of non-financial assets | | | 8,237 | | | | 7,971 | | | | 7,001 | | | | 6,323 | | | | 4,635 | | | | 4,044 | | | | 4,620 | | | | 5,126 | | | | 5,764 | | | | 6,306 | | | | 6,682 | | | | 7,889 | |
Net acquisition of non-financial assets | | | 5,583 | | | | 5,241 | | | | 3,389 | | | | 3,087 | | | | 992 | | | | 1,164 | | | | 2,265 | | | | 2,337 | | | | 3,192 | | | | 3,436 | | | | 3,942 | | | | 4,367 | |
Fiscal Balance | | | (7,049 | ) | | | (5,467 | ) | | | (7,947 | ) | | | (2,599 | ) | | | (572 | ) | | | (497 | ) | | | 560 | | | | (587 | ) | | | (2,207 | ) | | | (9,164 | ) | | | (4,857 | ) | | | (71 | ) |
Cash Surplus/(Deficit) | | | (5,880 | ) | | | (4,951 | ) | | | (8,585 | ) | | | (3,213 | ) | | | (105 | ) | | | 866 | | | | 1,448 | | | | 337 | | | | 302 | | | | (6,228 | ) | | | (6,421 | ) | | | 2,816 | |
Net Worth | | | 177,875 | | | | 170,745 | | | | 172,963 | | | | 166,492 | | | | 171,933 | | | | 188,099 | | | | 194,988 | | | | 195,038 | | | | 200,861 | | | | 195,646 | | | | 209,464 | | | | 249,624 | |
Net Debt | | | (9,542 | ) | | | (5,720 | ) | | | 2,399 | | | | 5,208 | | | | 5,749 | | | | 653 | | | | (355 | ) | | | (509 | ) | | | (198 | ) | | | 14,036 | | | | 11,344 | | | | 10,997 | |
Borrowing with QTC2 | | | 23,711 | | | | 28,391 | | | | 36,508 | | | | 39,864 | | | | 41,343 | | | | 34,200 | | | | 31,358 | | | | 29,256 | | | | 29,468 | | | | 37,570 | | | | 46,153 | | | | 49,000 | |
Leases and similar arrangements | | | 508 | | | | 637 | | | | 734 | | | | 882 | | | | 1,126 | | | | 1,370 | | | | 1,503 | | | | 2,142 | | | | 2,612 | | | | 6,485 | | | | 7,703 | | | | 7,671 | |
Borrowing with QTC (NFPS) | | | 52,521 | | | | 60,205 | | | | 67,116 | | | | 70,668 | | | | 73,256 | | | | 71,160 | | | | 69,107 | | | | 66,964 | | | | 67,576 | | | | 76,464 | | | | 85,901 | | | | 90,851 | |
Leases and similar arrangements (NFPS) | | | 884 | | | | 1,127 | | | | 1,559 | | | | 1,752 | | | | 1,802 | | | | 1,316 | | | | 1,882 | | | | 2,142 | | | | 2,612 | | | | 6,977 | | | | 8,157 | | | | 8,028 | |
Notes:
| | 1. | Numbers may not add due to rounding. |
| | 2. | Borrowing in 2013–14 includes bank overdraft of $1.434 billion. |
Source: Report on State Finances for Queensland 2010–11 to 2020–21. (Numbers have been recast for changes to UPF presentation.)
183
Budget Strategy and Outlook 2023-24
| 9.4 | Other General Government Sector Uniform Presentation Framework data |
Data in the following tables is presented in accordance with the UPF.
Tables 9.11 and 9.12 provide details of General Government Sector current and capital grant revenue and expenses.
| Table 9.11 | General Government Sector grant revenue1 |
| | | | | | | | |
| | | 2022–23
Est. Act.
$ million | | | 2023–24
Budget
$ million | |
Current grant revenue | | | | | | | | |
Current grants from the Commonwealth | | | | | | | | |
General purpose grants | | | 18,401 | | | | 19,508 | |
Specific purpose grants | | | 10,694 | | | | 11,433 | |
Specific purpose grants for on-passing | | | 4,090 | | | | 4,680 | |
Total current grants from the Commonwealth | | | 33,185 | | | | 35,621 | |
Other contributions and grants | | | 415 | | | | 323 | |
Total current grant revenue | | | 33,600 | | | | 35,944 | |
Capital grant revenue | | | | | | | | |
Capital grants from the Commonwealth | | | | | | | | |
General purpose grants | | | 2 | | | | — | |
Specific purpose grants | | | 2,936 | | | | 3,679 | |
Total capital grants from the Commonwealth | | | 2,938 | | | | 3,679 | |
Other contributions and grants | | | 33 | | | | 20 | |
Total capital grant revenue | | | 2,971 | | | | 3,699 | |
Total grant revenue | | | 36,571 | | | | 39,643 | |
Note:
| 1. | Numbers may not add due to rounding. |
184
Budget Strategy and Outlook 2023-24
| Table 9.12 | General Government Sector grant expenses1 |
| | | | | | | | |
| | | 2022–23 Est. Act $ million | | | 2023–24 Budget $ million | |
Current grant expense | | | | | | | | |
Private and Not-for-profit sector | | | 3,582 | | | | 4,497 | |
Private and Not-for-profit sector on-passing | | | 3,984 | | | | 4,164 | |
Local Government | | | 294 | | | | 189 | |
Local Government on-passing | | | 156 | | | | 566 | |
Grants to other sectors of Government | | | 2,875 | | | | 3,067 | |
Other | | | 405 | | | | 385 | |
Total current grant expense | | | 11,295 | | | | 12,868 | |
Capital grant expense | | | | | | | | |
Private and Not-for-profit sector | | | 567 | | | | 1,421 | |
Local Government | | | 1,498 | | | | 2,111 | |
Grants to other sectors of Government | | | 43 | | | | 411 | |
Other | | | 215 | | | | 383 | |
Total capital grant expense | | | 2,323 | | | | 4,327 | |
Total grant expense | | | 13,618 | | | | 17,195 | |
Note:
| 1. | Numbers may not add due to rounding. |
| 9.4.2 | Dividend and income tax equivalent income |
Table 9.13 provides details of the source of dividend and income tax equivalent income in the General Government Sector.
| Table 9.13 | General Government Sector dividend and income tax equivalent income1 |
| | | | | | | | |
| | | 2022–23 Est. Act. $ million | | | 2023–24 Budget $ million | |
Dividend and Income Tax Equivalent income from PNFC sector | | | 876 | | | | 1,342 | |
Dividend and Income Tax Equivalent income from PFC sector | | | 167 | | | | 179 | |
Total Dividend and Income Tax Equivalent income | | | 1,043 | | | | 1,521 | |
Note:
| 1. | Numbers may not add due to rounding. |
185
Budget Strategy and Outlook 2023-24
| 9.4.3 | Expenses by function |
Table 9.14 provides details of General Government Sector expenses by function.
| Table 9.14 | General Government Sector expenses by function1 |
| | | | | | | | | | | | | | | | | | | | | | | | |
| | | 2022–23 Budget $ million | | | 2022–23 Est. Act. $ million | | | 2023–24 Budget $ million | | | 2024–25 Projection $ million | | | 2025–26 Projection $ million | | | 2026–27 Projection $ million | |
General public services | | | 6,555 | | | | 6,057 | | | | 7,319 | | | | 7,416 | | | | 7,723 | | | | 7,963 | |
Public order and safety | | | 6,719 | | | | 6,623 | | | | 7,615 | | | | 7,744 | | | | 7,824 | | | | 7,972 | |
Economic affairs | | | 2,810 | | | | 2,817 | | | | 3,375 | | | | 2,411 | | | | 2,255 | | | | 2,200 | |
Environmental protection | | | 846 | | | | 998 | | | | 1,008 | | | | 864 | | | | 850 | | | | 906 | |
Housing and community amenities | | | 1,539 | | | | 1,377 | | | | 2,091 | | | | 1,451 | | | | 1,306 | | | | 1,363 | |
Health | | | 22,466 | | | | 23,434 | | | | 24,260 | | | | 25,088 | | | | 25,873 | | | | 27,308 | |
Recreation, culture and religion | | | 1,022 | | | | 960 | | | | 1,218 | | | | 1,012 | | | | 1,085 | | | | 1,130 | |
Education | | | 18,232 | | | | 18,597 | | | | 19,805 | | | | 19,996 | | | | 20,494 | | | | 21,076 | |
Social protection | | | 6,936 | | | | 6,414 | | | | 8,154 | | | | 6,651 | | | | 6,577 | | | | 6,874 | |
Transport | | | 7,791 | | | | 8,041 | | | | 9,415 | | | | 9,333 | | | | 8,666 | | | | 8,423 | |
Total Expenses | | | 74,915 | | | | 75,317 | | | | 84,261 | | | | 81,967 | | | | 82,653 | | | | 85,214 | |
Note:
| 1. | Numbers may not add due to rounding. |
| 9.4.4 | Purchases of non-financial assets by function |
Table 9.15 provides details of General Government Sector purchases of non-financial assets by function.
| Table 9.15 | General Government Sector purchases of non-financial assets by function1 |
| | | | | | | | | | | | | | | | | | | | | | | | |
| | | 2022–23 Budget $ million | | | 2022–23 Est. Act. $ million | | | 2023–24 Budget $ million | | | 2024–25 Projection $ million | | | 2025–26 Projection $ million | | | 2026–27 Projection $ million | |
General public services | | | 223 | | | | 201 | | | | 243 | | | | 289 | | | | 254 | | | | 254 | |
Public order and safety | | | 766 | | | | 618 | | | | 1,213 | | | | 910 | | | | 358 | | | | 421 | |
Economic affairs | | | 47 | | | | 47 | | | | 131 | | | | 126 | | | | 124 | | | | 58 | |
Environmental protection | | | 46 | | | | 40 | | | | 84 | | | | 132 | | | | 161 | | | | 27 | |
Housing and community amenities | | | 371 | | | | 399 | | | | 415 | | | | 530 | | | | 364 | | | | 265 | |
Health | | | 1,222 | | | | 1,411 | | | | 1,502 | | | | 2,430 | | | | 2,835 | | | | 2,897 | |
Recreation, culture and religion | | | 140 | | | | 129 | | | | 186 | | | | 141 | | | | 97 | | | | 130 | |
Education | | | 1,321 | | | | 1,368 | | | | 1,485 | | | | 1,461 | | | | 1,111 | | | | 651 | |
Social protection | | | 65 | | | | 67 | | | | 129 | | | | 88 | | | | 81 | | | | 41 | |
Transport | | | 4,278 | | | | 4,914 | | | | 3,959 | | | | 5,367 | | | | 6,030 | | | | 6,645 | |
Total Purchases | | | 8,478 | | | | 9,194 | | | | 9,347 | | | | 11,473 | | | | 11,417 | | | | 11,389 | |
Note:
| 1. | Numbers may not add due to rounding. |
186
Budget Strategy and Outlook 2023-24
Table 9.16 provides details of taxation revenue collected by the General Government Sector.
| Table 9.16 | General Government Sector taxes1 |
| | | | | | | | |
| | | 2022–23 Est. Act. $ million | | | 2023–24 Budget $ million | |
Taxes on employers’ payroll and labour force | | | 5,874 | | | | 6,524 | |
Taxes on property | | | | | | | | |
Land taxes | | | 1,777 | | | | 2,031 | |
Stamp duties on financial and capital transactions | | | 5,209 | | | | 5,385 | |
Other | | | 1,408 | | | | 1,435 | |
Taxes on the provision of goods and services | | | | | | | | |
Taxes on gambling | | | 1,927 | | | | 2,015 | |
Taxes on insurance | | | 1,401 | | | | 1,460 | |
Taxes on use of goods and performance of activities | | | | | | | | |
Motor vehicle taxes | | | 2,968 | | | | 3,087 | |
Total Taxation Revenue | | | 20,563 | | | | 21,938 | |
Note:
| 1. | Numbers may not add due to rounding. |
187
Budget Strategy and Outlook 2023-24
| 9.5 | Contingent liabilities |
Contingent liabilities represent items that are not included in the budget as significant uncertainty exists as to whether the government would sacrifice future economic benefits in respect of these items. Nevertheless, such contingencies need to be recognised and managed wherever possible in terms of their potential impact on the government’s financial position in the future.
The state’s quantifiable and non-quantifiable contingent liabilities are detailed in the 2021–22 Report on State Finances – whole-of-government financial statements (note 43).
A summary of the state’s quantifiable contingent liabilities as at 30 June 2022 is provided in Table 9.17.
| Table 9.17 | Contingent liabilities |
| | | | |
| | | 2021–22
$ million | |
Nature of contingent liability | | | |
Guarantees and indemnities | | | 12,842 | |
Other | | | 178 | |
Total | | | 13,020 | |
| 9.6 | Background and interpretation of Uniform Presentation Framework |
As mentioned in the introduction to this chapter, the UPF was reviewed in 2007 following release of the accounting standard, AASB 1049 Whole of Government and General Government Sector Financial Reporting.
This standard aims to harmonise GFS and GAAP with the objective of improving the clarity and transparency of government financial statements.
| 9.6.1 | Accrual Government Finance Statistics Framework |
The GFS reporting framework, developed by the Australian Bureau of Statistics (ABS), is based on international statistics standards (the International Monetary Fund Manual on Government Finance Statistics and the United Nations System of National Accounts). This allows comprehensive assessments to be made of the economic impact of government.
188
Budget Strategy and Outlook 2023-24
The accrual GFS framework is based on an integrated recording of stocks and flows. Stocks refers to a unit’s holding of assets and liabilities at a point in time, while flows represent the movement in the stock of assets and liabilities between two points in time. Flows comprise two separate types, transactions and other economic flows. Transactions come about from mutually agreed interactions between units or within a single unit. Other economic flows would include revaluations and destruction or discovery of assets that do not result from a transaction.
In GFS operating statements, other economic flows, being outside the control of government, are excluded and do not affect the net operating balance or fiscal balance.
| 9.6.2 | Generally Accepted Accounting Principles |
In addition to the GFS framework, public sector entities were previously required to report at year end against AAS 31 Financial Reporting by Government, which meant complying with the Accounting Standards issued by the AASB.
| 9.6.3 | Harmonisation under AASB 1049 |
This dual reporting regime caused confusion for financial report users and the Financial Reporting Council asked the AASB to develop a framework harmonising GAAP and GFS and to issue an Australian accounting standard for a single set of government reports.
In the development of AASB 1049, the AASB adopted the following approaches:
| • | | adoption of GAAP definition, recognition and measurement principles in almost all cases |
| • | | amended presentation requirements to encompass a comprehensive result that retains GAAP classification system but overlays it with a transaction and other economic flows classification system based on GFS |
| • | | expanding the disclosure requirements to incorporate key fiscal aggregates required by GFS. |
| 9.6.4 | Revisions to the Uniform Presentation Framework |
Following the introduction of AASB 1049, the Australian, state and territory governments consider that the UPF will continue to be an important framework for ensuring comparability of financial information across jurisdictions. The UPF continues to apply to financial statements produced by government in budget, mid-year budget updates and final budget outcome reports, whereas the accounting standard applies only to outcome reports.
Aligning the framework with the AASB 1049 was not intended to create a UPF that complies with all the reporting requirements of AASB 1049. For example, the UPF does not include the same level of detail in relation to disclosure requirements of AASB 1049. Instead, the revised UPF allows jurisdictions to utilise the framework as the base set of statements and add additional relevant information to comply with AASB 1049.
189
Budget Strategy and Outlook 2023-24
GFS data is presented by institutional sector, distinguishing between the General Government Sector and the PNFC Sector.
Budget reporting focuses on the General Government Sector, which provides regulatory services, and goods and services of a non-market nature that are provided at less than cost or at no cost. These services are largely financed by general revenue (Australian Government grants and state taxation). This service comprises government departments, their commercialised business units/shared service providers and certain statutory bodies.
The PNFC Sector comprises bodies that provide mainly market goods and services that are of non-regulatory and non-financial nature. PNFCs are financed through sales to customers of their goods and services and may be supplemented by explicit government subsidy to satisfy community service obligations. In general, PNFCs are largely distinguishable from the governments that own them. Examples of PNFCs include the energy entities and Queensland Rail.
Together, the General Government Sector and the PNFC Sector comprise the Non-financial Public Sector.
Further discussions of the GFS framework of reporting, including definitions of GFS terms, can be obtained from the website page of the ABS.
190
Budget Strategy and Outlook 2023-24
The reporting entities included in the General Government and the PNFC sectors in these budget papers are included below:
Departments
Agriculture and Fisheries
Child Safety, Seniors and Disability Services (renamed from Children, Youth Justice and Multicultural Affairs)
Housing (renamed from Communities, Housing and Digital Economy)
Education
Energy and Public Works
Environment and Science
Justice and Attorney-General
Premier and Cabinet
Queensland Corrective Services
Queensland Fire and Emergency Services
Queensland Health
Queensland Police Service
Queensland Treasury
Regional Development, Manufacturing and Water
Resources
State Development, Infrastructure, Local Government and Planning
Tourism, Innovation and Sport
Transport and Main Roads
Treaty, Aboriginal and Torres Strait Islander Partnerships, Communities and the Arts (renamed from Seniors, Disability Services and Aboriginal and Torres Strait Islander Partnerships)
Youth Justice, Employment, Small Business and Training (renamed from Employment, Small Business and Training)
191
Budget Strategy and Outlook 2023-24
Commercialised Business Units
CITEC
Economic Development Queensland
QBuild
QFleet
RoadTek
Shared Service Providers
Corporate Administration Agency
Queensland Shared Services
192
Budget Strategy and Outlook 2023-24
Other General Government entities
Board of the Queensland Museum
Crime and Corruption Commission
Cross River Rail Delivery Authority
Electoral Commission of Queensland
Gold Coast Waterways Authority
Health and Wellbeing Queensland
Hospital and Health Services
Cairns and Hinterland
Central Queensland
Central West
Children’s Health Queensland
Darling Downs
Gold Coast
Mackay
Metro North
Metro South
North West
South West
Sunshine Coast
Torres and Cape
Townsville
West Moreton
Wide Bay
Legal Aid Queensland
Legislative Assembly
Library Board of Queensland
Motor Accident Insurance Commission
Nominal Defendant
Office of the Governor
Office of the Health Ombudsman
Prostitution Licensing Authority
Public Sector Commission
Queensland Art Gallery Board of Trustees
Queensland Audit Office
Queensland Building and Construction Commission
Queensland Curriculum and Assessment Authority
Queensland Family and Child Commission
Queensland Human Rights Commission
Queensland Mental Health Commission
Queensland Performing Arts Trust
Queensland Racing Integrity Commission
Queensland Reconstruction Authority
Queensland Rural and Industry Development Authority
Residential Tenancies Authority
South Bank Corporation
TAFE Queensland
The Council of the Queensland Institute of Medical Research
The Public Trustee of Queensland
Tourism and Events Queensland
Trade and Investment Queensland
193
Budget Strategy and Outlook 2023-24
| 9.8.2 | Public Non-financial Corporations |
Brisbane Organising Committee for the 2032 Olympic and Paralympic Games
CleanCo Queensland Ltd
CS Energy Limited
Energy Queensland Limited
Far North Queensland Ports Corporations Limited
Gladstone Area Water Board
Gladstone Ports Corporation Limited
Mount Isa Water Board
North Queensland Bulk Ports Corporation Limited
Port of Townsville Limited
Powerlink Queensland
Queensland Bulk Water Supply Authority (Seqwater)
Queensland Hydro Pty Ltd
Queensland Rail
Queensland Treasury Holdings Pty Ltd
Stadiums Queensland
Stanwell Corporation Limited
Sunwater Limited
194
Budget Strategy and Outlook 2023-24
| Appendix A: | Concessions statement |
Queensland Government subsidies, discounts and rebates to ease cost-of-living pressures and support businesses
The Queensland Government is taking action on the national cost-of-living challenge, building on an extensive program of existing concessions and subsidies to deliver relief for households and small businesses.
Cost-of-living pressures are currently being felt right across the country, with Queensland households, businesses and industry continuing to face challenges including rising interest rates, increasing electricity costs and higher costs of goods and services.
While income support is the responsibility of the Australian Government, the Queensland Government has been actively working to assist households and businesses to manage cost-of-living pressures.
The Queensland Government provides a wide range of concessions including subsidies, rebates and discounts across a variety of services and products. These concessions provide Queenslanders with cost-of-living support for essentials like electricity, transport, health, housing, education and training services.
As highlighted in Chart A.1, the total value of all concessions provided to Queenslanders is estimated to be $8.224 billion in 2023–24. This represents an increase of 21.2 per cent compared with estimated actual concessions of $6.788 billion in 2022–23.
This uplift in concessions being paid to Queenslanders in 2023–24 reflects in part the government providing $1.617 billion1 in 2023–24 towards new and expanded cost-of-living measures that will help address the challenges Queenslanders are facing.
This includes $1.483 billion for additional electricity bill support to households and small businesses facing cost-of living pressures. This is the most significant electricity bill support package announced by any state or territory, more than doubling the size of the Federally agreed support package for Queensland under the National Energy Bill Relief Fund.
As part of this package, all Queensland households will automatically receive a $550 Cost of Living Rebate on their electricity bill in 2023–24, while around 600,000 vulnerable households will benefit from a higher $700 Cost of Living Rebate.
The government’s substantial cost-of-living relief package will more than offset typical household electricity bill increases in 2023–24. In some cases, households will have zero bills or be in credit in 2023–24.
Including the $550 Cost of Living Rebate in 2023–24, the government will have provided all Queensland households with a total of $1,125 in electricity rebates since 2018.
| 1 | Some minor elements of the cost-of-living measures included in this figure are grants and support measures not defined as concessions for the purposes of this chapter. |
195
Budget Strategy and Outlook 2023-24
Eligible small businesses in Queensland will also receive an automatic rebate of $650 on their electricity bill in 2023–24. This includes around 205,000 Queensland small businesses that consume less than 100,000 kilowatt hours per annum.
The Budget is providing $645 million over 4 years from 2023–24 to provide 15 hours per week of free kindergarten from January 2024 for all 4-year-old Queensland children.
In addition to relieving cost-of-living pressures for families, this measure will remove cost as a barrier to participation in kindergarten, support labour market participation, and improve educational outcomes.
| Chart A.1 | Total concessions value by year1 |
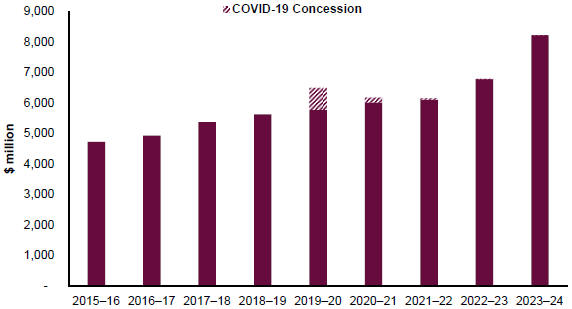
Note:
| 1. | Due to the timing of the 2020–21 Budget, an actual figure was calculated for the total concessions value in 2019–20. Values for all other years are estimated actuals aside from 2023–24, which is the budgeted amount. |
Total government spending on concessions is expected to increase by 73.9 per cent from 2015–16 to 2023–24. This increase, on average, exceeds inflation by 4 per cent per annum.
This has ensured that the real value of concessions available to Queenslanders has not only been maintained but has grown over time. Further detail regarding Queensland Government cost-of-living support can be found in Chapter 1.
196
Budget Strategy and Outlook 2023-24
| Box A.1 | Cost-of-living relief for Queenslanders |
The majority of Queenslanders benefit from at least one Queensland Government concession and, in many cases, may benefit from multiple concessions each year.
Retired couple
A retired couple in their seventies, living in their own home in South East Queensland with no dependents, both with a Queensland Seniors Card and on the pension, could benefit from a broad range of concessions in 2023–24 including:
| • | | $700 Cost of Living Rebate plus the existing $372 electricity rebate, bringing total support to $1,072 off their electricity bill |
| • | | $120 South East Queensland water subsidy |
| • | | $87 for reticulated natural gas |
| • | | an average benefit of $830 for general dental care under the Oral Health Scheme |
| • | | 50 per cent discount on Translink public transport services in South East Queensland |
| • | | registration fee concessions, which for a 4-cylinder vehicle would reduce the 12-month registration fee by 50 per cent from $360.60 to $180.30. |
Low-income family
A low-income family with a Health Care Card and 3 children aged 4, 13 and 16 could benefit from a broad range of concessions in 2023–24, including:
| • | | $700 Cost of Living Rebate on their electricity bill plus the existing $372 electricity rebate, bringing total support to $1,072 |
| • | | $463 through the Textbook and Resource Allowance paid to the children’s school |
| • | | 15 hours of free kindergarten per week. On average, a family attending a sessional kindergarten for 15 hours per week that charges $46 per day will save $4,600 a year in fees |
| • | | 50 per cent discount on Translink public transport services in South East Queensland for their 3 children. |
School-leaver
A low-income casual worker who has just graduated from high school and has a Health Care Card could benefit from a substantial range of concessions in 2023–24, including:
| • | | an interest-free and fee-free bond loan providing average support of $1,600 |
| • | | $700 Cost of Living Rebate on their electricity bill plus the existing $372 electricity rebate, bringing total support to $1,072 |
| • | | an average subsidy of $3,270 to undertake their first post-school Certificate III qualification |
| • | | an average benefit of $830 for general dental care under the Oral Health Scheme. |
197
Budget Strategy and Outlook 2023-24
Other relevant concessions that individuals could be eligible for include:
| • | | an average subsidy of $10,209 to pre-approved public and private registered training organisations to subsidise the cost of training and assessment for eligible Queensland apprentices and trainees, or complementary pathways through the User Choice program |
| • | | an average subsidy of $4,846 to undertake a priority Certificate IV, diploma or advanced diploma qualification or industry endorsed skillset through the VET – Higher Level Skills Tuition Fee Subsidy |
| • | | financial assistance for apprentices and trainees to cover the cost of travel incurred in attending off-the-job training at a registered training organisation through the Travel and Accommodation Subsidy |
| • | | an average rental rebate of around $12,181 per annum for people living in social housing through the Government Managed Housing Rental Rebate. |
Focus
This statement highlights the cost and nature of concessions provided by the Queensland Government. It covers concessions that are direct budget outlays (e.g. fee subsidy payments) and concessions that are revenue foregone through fees and charges set at a lower rate than applies to the wider community and other businesses. In the case of broader concessions, it also includes concessions related to the delivery of services to consumers at less than the full cost of service provision.
Section A.2 sets out the specific concessions provided by the Queensland Government by agency. Section A.3 sets out the concessions provided by government-owned corporations (GOCs) and is separated into concessions by GOC and concessional leases (industry, commercial and community) by GOC. Within each agency or GOC, concessions are listed in descending order of value.
Explanation of scope
For the purposes of this document, concessions include:
| • | | discounts, rebates and subsidies provided by the government that improve access to, and affordability of, a range of services for certain individuals, families or businesses based on eligibility criteria (e.g. relating to factors such as age, income, special needs, location or business characteristic) |
| • | | concessions where all consumers, including businesses, of a particular good or service pay a price that is below the full cost of service provision (that is, no eligibility criteria is applied). |
198
Budget Strategy and Outlook 2023-24
Both General Government and Public Non-financial Corporations (PNFC) Sector concessions are included in this statement. Where a payment is made from a General Government Sector agency to a PNFC entity for a concession arrangement, the expenditure is reported against the General Government Sector agency only to avoid double counting.
To be included in this statement, concessions must meet the minimum materiality threshold of estimated expenditure or revenue foregone of $50,000 in either the budget year or the year prior.
Varying methods have been used to estimate the cost of concessions, depending on the nature of the concessions, including:
| • | | direct budget outlay cost (e.g. direct subsidy or rebate payments or the government’s contribution in the case of items such as rental subsidies) |
| • | | revenue foregone (e.g. concessional fees and charges) |
| • | | cost of goods and services provided. |
For the purposes of illustration, the document often uses averages to demonstrate the potential value of the concession to recipients. However, averages are not reflective of individual circumstances, meaning the actual dollar value of the concession to individual recipients may vary from person to person or business to business.
The Concessions Statement does not include tax expenditures (e.g. tax exemptions, reduced tax rates, tax rebates and deductions). Information on tax expenditures can be found in Appendix B.
199
Budget Strategy and Outlook 2023-24
| Table A.1.1 | Concession by entity1 |
| | | | | | | | |
Concession by entity | | 2022–23
Est. Act.
$ million | | | 2023–24
Estimate
$ million | |
Agency | | | | | | | | |
Department of Agriculture and Fisheries | | | 18.5 | | | | 34.3 | |
Department of Child Safety, Seniors and Disability Services | | | 725.0 | | | | 1,780.5 | |
Department of Education | | | 194.2 | | | | 286.3 | |
Department of Energy and Public Works | | | 641.8 | | | | 560.0 | |
Department of Environment and Science | | | 2.0 | | | | 2.2 | |
Department of Housing | | | 619.6 | | | | 722.5 | |
Department of Justice and Attorney-General | | | 114.8 | | | | 118.2 | |
Department of Regional Development, Manufacturing and Water | | | 31.7 | | | | 40.6 | |
Department of Resources | | | 3.2 | | | | 3.2 | |
Department of Tourism, Innovation and Sport | | | 2.0 | | | | 2.1 | |
Department of Transport and Main Roads | | | 3,436.6 | | | | 3,641.1 | |
Department of Treaty, Aboriginal and Torres Strait Islander Partnerships, Communities and the Arts | | | 6.6 | | | | 6.6 | |
Department of Youth Justice, Employment, Small Business and Training | | | 547.5 | | | | 538.9 | |
Queensland Fire and Emergency Services | | | 11.2 | | | | 11.7 | |
Queensland Health | | | 302.6 | | | | 343.4 | |
Total Agency | | | 6,657.3 | | | | 8,091.6 | |
| | |
Government-owned corporations | | | | | | | | |
Energy Queensland Limited | | | 22.2 | | | | 23.8 | |
Far North Queensland Ports Corporation Limited | | | 2.1 | | | | 2.0 | |
Gladstone Ports Corporation Limited | | | 43.5 | | | | 39.3 | |
North Queensland Bulk Ports Corporation Limited | | | 1.4 | | | | 1.4 | |
Port of Townsville Limited | | | 6.5 | | | | 6.6 | |
Queensland Rail | | | 2.2 | | | | 2.6 | |
Sunwater Limited | | | 52.5 | | | | 56.6 | |
Total Government-owned corporations | | | 130.4 | | | | 132.3 | |
| | |
Total all entities | | | 6,787.7 | | | | 8,223.9 | |
Note:
| 1. | Numbers may not add due to rounding. |
200
Budget Strategy and Outlook 2023-24
| Table A.2.1 | Department of Agriculture and Fisheries |
| | | | | | | | |
Concession | | 2022–23
Est. Act.
$ million | | | 2023–24
Estimate
$ million | |
Primary Industry Productivity Enhancement Scheme (PIPES)1 | | | 11.9 | | | | 20.5 | |
Drought Preparedness Grant Scheme | | | 3.0 | | | | 3.0 | |
Drought Relief Assistance Scheme | | | 2.2 | | | | 2.6 | |
Drought Carry-on Finance Loan Scheme1 | | | — | | | | 2.6 | |
Drought Ready and Recovery Finance Loan Scheme1 | | | 0.3 | | | | 2.6 | |
Emergency Drought Assistance Loan Scheme1 | | | — | | | | 1.9 | |
Farm Management Grants Program2 | | | 1.0 | | | | 1.0 | |
Stocked Impoundment Permit Scheme | | | 0.1 | | | | 0.1 | |
Total | | | 18.5 | | | | 34.3 | |
Notes:
| 1. | The increase is mainly due to the anticipated increase in loan advances and higher interest rates. |
| 2. | The value of this concession includes Queensland Government funding only. The Australian Government also contributes towards the funding for this program. |
Primary Industry Productivity Enhancement Scheme (PIPES)
PIPES is administered by the Queensland Rural and Industry Development Authority and provides concessional rates of interest on loans to eligible primary producers in need of financial assistance. First Start Loans and Sustainability Loans of up to $2 million and $1.3 million, respectively, support applicants to enter primary production and to improve productivity and sustainability.
The average concessional interest rate for new lending is 4.9 per cent. The amounts in the above table represent the fair values of the interest rate concessions pertaining to loans issued in the PIPES portfolio in each of the financial years shown.
Drought Preparedness Grant Scheme
As part of the Drought Assistance and Reform Package, the Drought Preparedness Grant Scheme provides a rebate to eligible primary producers of up to $50,000 for on-farm capital improvements identified in their Farm Business Resilience Plan to improve the drought preparedness of the producer’s property.
201
Budget Strategy and Outlook 2023-24
Drought Relief Assistance Scheme
As part of the Drought Assistance and Reform Package, the Drought Relief Assistance Scheme provides freight subsidies and emergency water infrastructure rebates during drought declarations of up to 50 per cent to eligible applicants, between $20,000 and $50,000 per property, per financial year. Freight subsidies are available for 2 years after drought revocation for the movement of livestock. These concessions are only available to producers that do not access the new drought preparedness measures. Free financial counselling is being provided via the Rural Financial Counselling Service for producers and related small business owners.
Drought Carry-on Finance Loan Scheme
As part of the Drought Assistance and Reform Package, the Drought Carry-on Finance Loan Scheme provides a concessional loan to eligible primary producers of up to $250,000 for carry-on finance during drought. These loans would be available where the $50,000 available from the Emergency Drought Assistance Loan Scheme is insufficient to assist the producer to manage drought conditions.
The concession is calculated on the basis of a commercial reference rate of 6.43 per cent per annum and an average concessional interest rate for new lending of 4.06 per cent per annum. The amount shown in the above table represents the fair values of the interest rate concessions pertaining to loans in the financial year shown.
Drought Ready and Recovery Finance Loan Scheme
As part of the Drought Assistance and Reform Package, the Drought Ready and Recovery Finance Loan Scheme provides a concessional loan of up to $250,000 for eligible primary producers to undertake measures identified in their Farm Business Resilience Plan that will improve the drought preparedness of the producer’s property.
The concession is calculated on the basis of a commercial reference rate of 6.43 per cent per annum and an average concessional interest rate for new lending of 4.06 per cent per annum. The amount shown in the above table represents the fair values of the interest rate concessions pertaining to loans in the financial year shown.
Emergency Drought Assistance Loan Scheme
As part of the Drought Assistance and Reform Package, the Emergency Drought Assistance Loan Scheme provides an interest free concessional loan to eligible primary producers of up to $50,000 as emergency finance for carry-on activities like paying wages or creditors during drought. The concession is calculated at a rate of 6.43 per cent per annum on the basis of a commercial reference rate of this amount and no interest being charged on the loan. The amount shown in the above table represents the fair values of the interest rate concessions pertaining to loans in the financial year shown.
Farm Management Grants Program
As part of the Drought Assistance and Reform Package, the Farm Management Grants Program provides a rebate of 50 per cent to a maximum of $2,500 to eligible primary producers for the cost of developing a Farm Business Resilience Plan for their property.
202
Budget Strategy and Outlook 2023-24
Stocked Impoundment Permit Scheme
The Stocked Impoundment Permit Scheme provides world class, sustainable fishing options in freshwater environments. It helps reduce fishing pressure on wild fish stocks through a requirement to hold a permit to fish in one of the state’s 63 impoundments. The scheme provides concessions if you have a Queensland Seniors Card, Pensioner Concession Card, Health Care Card or a Repatriation Health Card (Gold Card) and aims to encourage participation in recreational fishing for seniors and concession card holders. The concession provides a discount of $16.40 on the cost of an annual permit in 2022–23 and will increase to $16.96 per annual permit in 2023–24.
| Table A.2.2 | Department of Child Safety, Seniors and Disability Services |
| | | | | | | | |
Concession | | 2022–23
Est. Act.
$ million | | | 2023–24
Estimate
$ million | |
Cost of Living Rebate and National Energy Bill Relief1 | | | 385.0 | | | | 1,435.0 | |
Electricity Rebate Scheme2 | | | 243.0 | | | | 245.9 | |
Pensioner Rate Subsidy Scheme | | | 58.6 | | | | 59.7 | |
South East Queensland Pensioner Water Subsidy Scheme | | | 20.1 | | | | 20.5 | |
Home Energy Emergency Assistance Scheme | | | 10.0 | | | | 10.0 | |
Medical Cooling and Heating Electricity Concession Scheme3 | | | 2.9 | | | | 3.4 | |
Electricity Life Support Concession Scheme3,4 | | | 2.7 | | | | 3.1 | |
Reticulated Natural Gas Rebate Scheme | | | 2.7 | | | | 2.9 | |
Total | | | 725.0 | | | | 1,780.5 | |
Notes:
| 1. | The variance is due to an increase in the value of the Cost of Living Rebate (COLR) from $175 to $550 for all households, and $700 for all Queensland households that receive an electricity rebate under the Electricity Rebate Scheme. The 2023–24 estimate also includes a $650 rebate for small businesses under the National Energy Bill Relief (NEBR) plan. This measure includes contributions from the Australian Government under the NEBR, with the Queensland Government contributing an estimated $1.1 billion. |
| 2. | Electricity rebates have historically been adjusted annually according to the Queensland Competition Authority’s (QCA) price determination for general household electricity tariff (Tariff 11). However, given the provision of the COLR for 2023–24, this cohort will be protected from electricity price rises through those programs. Therefore, the value of the Electricity Rebate Scheme will be held at $372.20. |
| 3. | The Medical Cooling and Heating Electricity Concession Scheme and Electricity Life Support Concession Scheme are adjusted annually according to the QCA price determination for Tariff 11. For 2023–24, the QCA determined Tariff 11 will increase by 28.7 per cent. |
| 4. | The Queensland Government has expanded eligibility for the Electricity Life Support Concession Scheme to include Queenslanders with a home-based life support system acquired through the Australian Government Home Care Package. |
Cost of Living Rebate and National Energy Bill Relief
In 2022–23, the Queensland Government allocated $385 million to provide all Queensland households with a Cost of Living Rebate of $175.
In 2023–24, all Queensland households will automatically receive a $550 Cost of Living Rebate on their electricity bill, while around 600,000 vulnerable households will benefit from a higher $700 Cost of Living Rebate.
203
Budget Strategy and Outlook 2023-24
In addition, vulnerable households will continue to receive the existing $372 rebate under the Queensland Electricity Rebate Scheme, bringing total support for this group to $1,072 in 2023–24 (see below).
The government’s substantial cost-of-living relief package will more than offset typical household electricity bill increases in 2023–24. In some cases, households will have zero bills or be in credit in 2023–24.
Including the $550 Cost of Living Rebate in 2023–24, the government will have provided all Queensland households with a total of $1,125 in electricity rebates since 2018.
Eligible small businesses in Queensland will also receive an automatic rebate of $650 on their electricity bill in 2023–24. This includes around 205,000 Queensland small businesses that consume less than 100,000 kilowatt hours per annum.
The Queensland Government’s cost-of-living relief package significantly increases and broadens support under the National Energy Bill Relief Plan, jointly funded by the Queensland and Australian Governments.
Electricity Rebate Scheme
The Electricity Rebate Scheme provides a rebate of up to approximately $372 per annum to assist with the cost of domestic electricity supply to the home of eligible holders of a Pensioner Concession Card, a Queensland Seniors Card, Commonwealth Health Care Card, Department of Veterans’ Affairs Gold Card (who receive a War Widow/er Pension or special rate Totally or Permanently Incapacitated Pension) and asylum seekers. It is estimated that approximately 600,000 households will receive an electricity rebate in 2023–24.
Pensioner Rate Subsidy Scheme
The Pensioner Rate Subsidy Scheme offers a 20 per cent subsidy (up to a maximum of $200 per annum) to lessen the impact of local government rates and charges on pensioners, thereby assisting them to continue to live in their own homes.
South East Queensland Pensioner Water Subsidy Scheme
The South East Queensland (SEQ) Pensioner Water Subsidy Scheme provides a subsidy of up to $120 per annum to eligible pensioner property owners in the SEQ Water Grid to lessen the impact of water prices. This subsidy is in addition to the Pensioner Rate Subsidy Scheme.
Home Energy Emergency Assistance Scheme
The Home Energy Emergency Assistance Scheme provides emergency assistance of up to $720 once in a 2-year period to assist low income households experiencing a short-term financial crisis and who are unable to pay their current electricity and/or reticulated natural gas account. It is not a requirement for the claimant to hold a concession card.
Medical Cooling and Heating Electricity Concession Scheme
The Medical Cooling and Heating Electricity Concession Scheme provides a rebate of up to approximately $479 per annum for eligible concession card holders with a medical condition who have dependence on air conditioning to regulate body temperature.
204
Budget Strategy and Outlook 2023-24
Electricity Life Support Concession Scheme
The Electricity Life Support Concession Scheme is aimed at assisting seriously ill people who use home-based life support systems by providing a rebate of up to approximately $976 per annum for users of oxygen concentrators and a rebate of up to approximately $653 per annum for users of kidney dialysis machines to meet their electricity costs. The concession is paid quarterly and is subject to the patient being medically assessed in accordance with Queensland Health eligibility criteria.
Reticulated Natural Gas Rebate Scheme
The Reticulated Natural Gas Rebate Scheme provides a rebate of up to approximately $87 per annum to assist with the cost of reticulated natural gas supplied to the home of eligible holders of a Pensioner Concession Card, Queensland Seniors Card or a Department of Veterans’ Affairs Gold Card (who receive the War Widow/er Pension or special rate Totally or Permanently Incapacitated Pension).
| Table A.2.3 | Department of Education |
| | | | | | | | |
Concession | | 2022–23
Est. Act.
$ million | | | 2023–24
Estimate
$ million | |
Queensland Kindergarten Funding1 | | | 32.7 | | | | 115.7 | |
Textbook and Resource Allowance2 | | | 78.3 | | | | 83.2 | |
School Transport Assistance for Students with Disability3 | | | 52.0 | | | | 53.7 | |
Living Away from Home Allowance Scheme4 | | | 8.6 | | | | 10.2 | |
Tuition Fee Exemptions/Waivers - Dependants of International Students5 | | | 8.0 | | | | 8.2 | |
Non-State Schools Transport Assistance Scheme6 | | | 7.6 | | | | 7.9 | |
Dalby State High School - Bunya Campus Residential Facility | | | 2.6 | | | | 2.7 | |
Spinifex State College - Mount Isa Student Residential Facility | | | 1.3 | | | | 1.4 | |
Western Cape College - Weipa Campus Student Residential College | | | 1.3 | | | | 1.4 | |
Distance Education - Information and Communication Technology Subsidy Scheme | | | 1.1 | | | | 1.1 | |
Distance Education - Non-Government Student Fee Subsidy7 | | | 0.7 | | | | 0.8 | |
Total | | | 194.2 | | | | 286.3 | |
Notes:
| 1. | The variance is due to the new Queensland Kindergarten Funding model commencing from 1 January 2023. The 2022–23 current budget relates to the period 1 January 2023 to 30 June 2023. Indexation has also been included in the 2023–24 Estimate. The 2023–24 Estimate also includes an affordability subsidy from January 2024 to be provided for 15 hours per week to make kindergarten free for all 4-year-olds. |
| 2. | The increase is due to enrolment growth and CPI indexation. |
| 3. | The increase is due to rate increases, additional bus services and operational costs due to enhanced student safety on buses. |
| 4. | The increase is due to CPI indexation and an increase in the Remote Area Tuition Allowance. |
| 5. | The increase is due to CPI indexation. |
| 6. | The increase is due to CPI indexation and increased demand for assistance under the scheme. |
| 7. | The variance is due to a higher number of students utilising the service in 2023–24. |
205
Budget Strategy and Outlook 2023-24
Queensland Kindergarten Funding
Queensland Kindergarten Funding provides funding to eligible kindergarten service providers to ensure greater access to a quality kindergarten program for Queensland children and to reduce out-of-pocket fees for many families.
Subsidies paid to eligible kindergarten service providers in 2023 that aim to reduce out-of-pocket costs for families include:
| • | | Sessional Kindergarten Base Subsidy – $1,500 mandated pass through which is provided for each eligible child who is enrolled in an approved kindergarten program |
| • | | Affordability Subsidy – provided for each eligible child who meets one or more specified criteria. The two affordability subsidies – Kindy Plus and Kindy Family Tax Benefit (FTB) – are paid to eligible service providers and must be applied to each child’s account to reduce a family’s out-of-pocket cost for the kindergarten program. For sessional kindergarten, the Kindy Plus subsidy is an average of $3,000 per child, per annum and the Kindy FTB subsidy is $2,044 per child, per annum. For long day care, families may be eligible for a subsidy of between $500 and $1,409 per child, per annum. |
These subsidies are funded by both the Queensland Government and the Australian Government under the Preschool Reform Agreement 2022 to 2025.
From 1 January 2024, the Queensland Government will provide an affordability subsidy of 15 hours per week to make kindergarten free for all 4-year-olds. On average, a family attending a sessional kindergarten that charges $46 per day (15 hours per week) will save $4,600 a year in fees.
Textbook and Resource Allowance
The Textbook and Resource Allowance is available for all parents/caregivers of secondary school age students attending state and non-government schools, and children registered in home education of equivalent age, to assist with the cost of textbooks and learning resources. In schools, parents may assign this allowance to the school to reduce the fees associated with participating in the school’s textbook and resource scheme. For children registered for home education, the allowance is paid directly to the parent.
In 2023, the rates per annum are $146 for students in Years 7 to 10 and $317 for students in Years 11 and 12.
School Transport Assistance for Students with Disability
The School Transport Assistance Program for Students with Disability assists eligible state school students whose disability impacts on their parents’ or carers’ ability to arrange their safe travel to and from school. This assistance includes coordinated service delivery in specially contracted taxis or minibuses, payment of fares on bus, ferry, tram and train, or an allowance for parents who make private travel arrangements for their children to school or a transport meeting point. The benefit level is to a maximum of $400 per week, per student, however in exceptional circumstances higher amounts may be approved. A separate scheme is in place for students with disability attending non-state schools (refer ‘Non-State Schools Transport Assistance Scheme’).
206
Budget Strategy and Outlook 2023-24
Living Away from Home Allowance Scheme
The Living Away from Home Allowance Scheme provides financial assistance to support geographically isolated families. The scheme assists with the costs of children required to live away from home to attend school. This concession is available to Queensland students attending both state and non-state schools.
The benefits available for eligible students in 2023 are:
| • | | Remote Area Tuition Allowance – assistance is available for primary students of up to $4,360 per annum (increasing to $8,360 per annum in 2024) and secondary students of up to $6,276 per annum (increasing to $10,276 per annum in 2024) for students who board at approved non-state schools |
| • | | Remote Area Allowance – assistance of $2,740 per annum is available to students attending the campus of a Queensland state high school and undertaking an approved agriculture course in lieu of Years 11 and 12 |
| • | | Remote Area Travel Allowance – available where the distance from the family home to the boarding location is at least 50km. Benefit levels depend on the distance travelled and range from $164 per annum to a maximum of $2,011 per annum |
| • | | Remote Area Disability Supplement – available to students with disability who incur additional costs associated with living away from home to attend school. Benefits are up to $8,916 per student, per annum. |
Tuition Fee Exemptions/Waivers – Dependants of International Students
International students who meet the approved exemption criteria and wish to enrol their child in Preparatory (Prep) Year to Year 12 of schooling are exempt from paying dependant tuition fees. The exemption only applies for the duration of the main temporary visa holder’s (parent) course of study in Queensland. A dependant student (Prep to Year 12) of a temporary visa holder may also be eligible for a tuition fee waiver in certain circumstances, including financial hardship.
The estimateed average amount exempted or waived per student is $12,162 in 2023–24.
Non-State Schools Transport Assistance Scheme
The Non-State Schools Transport Assistance Scheme directly assists families through the provision of funding towards the transport costs incurred for eligible students enrolled in non-state schools. Under the Scheme, payments are made twice a year to the families of students enrolled in non-state schools located beyond the Brisbane City Council area where bus and ferry fare expenses are above the annual Queensland Catholic Education Commission set weekly threshold amount.
In Semester 1 2023, the weekly threshold is $35 per family, or $25 for families with a current Health Care Card, Pensioner Concession Card or Veterans’ Affairs Card. From Semester 2 2023, the weekly threshold rates will be adjusted to $25 per family, or $15 for families with a current Health Care Card, Pensioner Concession Card or Veterans’ Affairs Card.
207
Budget Strategy and Outlook 2023-24
The program also assists families of eligible students with disability enrolled in non-state schools. The level of assistance provided is dependent on the type of transport needed and travel assistance already provided by the Department of Transport and Main Roads (DTMR). For families using taxi travel, the benefit level is to a maximum of $300 per week, inclusive of any assistance provided through DTMR’s Taxi Subsidy Scheme.
Dalby State High School – Bunya Campus Residential Facility
The Dalby State High School – Bunya Campus Residential Facility provides affordable residential accommodation for secondary school students in a boarding facility. The concession targets secondary school students from rural and remote communities, however any secondary age student is eligible. Students accommodated at the residential facility are enrolled at Dalby State High School and participate in agricultural education programs.
Spinifex State College – Mount Isa Student Residential Facility
The Spinifex State College – Mount Isa Student Residential Facility provides an affordable residential facility in Mount Isa for students from the North Western area of the state whose home community does not provide secondary schooling. The funding meets the cost of wages for the residential college, increasing the affordability of the accommodation rates charged to students.
Western Cape College – Weipa Campus Student Residential College
The Western Cape College – Weipa Campus Student Residential College provides a residential schooling option for students from the Torres Strait and Cape York. This college provides an option that is more familiar for students from remote locations with the intent to increase participation and retention of secondary students in schooling. The concession targets students from the Torres Strait and Cape York seeking secondary education when their home community does not provide secondary schooling.
Distance Education – Information and Communication Technology Subsidy Scheme
The Distance Education Information and Communication Technology Subsidy provides assistance to students enrolled in a school of distance education that are geographically isolated or in the medical category.
The scheme provides $400 per annum to assist with purchasing, replacing or upgrading computer hardware for students in the distance/geographically isolated and medical categories, and $500 per annum to assist students in the distance/geographically isolated category to meet the costs of broadband internet access and download charges for the home classroom. Eligible students also receive access to free software licences.
Distance Education – Non-Government Student Fee Subsidy
The Distance Education Non-Government Student Fee Subsidy is available to students who are enrolled in non-government schools and also choose to access distance education subjects. It provides an average annual subsidy of approximately $1,508 per distance education subject enrolment.
208
Budget Strategy and Outlook 2023-24
This subsidises approximately 50 per cent of the total average cost per annum of providing a subject through distance education for non-government school students. The concession contributes towards the state continuing to make distance education available to non-government schools ensuring the widest possible subject choice for students, while recovering a proportion of the teaching and overhead costs.
| Table A.2.4 | Department of Energy and Public Works |
| | | | | | | | |
Concession | | 2022–23
Est. Act.
$ million | | | 2023–24
Estimate
$ million | |
Uniform Tariff Policy - Energy Queensland (Excluding Isolated Systems)1 | | | 555.3 | | | | 446.6 | |
Uniform Tariff Policy - Energy Queensland (Isolated Systems)2 | | | 65.2 | | | | 90.4 | |
Non-residential Buildings - Subsidised Rents | | | 7.6 | | | | 7.6 | |
Electricity Tariff Adjustment Scheme3 | | | 6.1 | | | | 6.2 | |
Drought Relief from Electricity Charge Scheme4 | | | 5.0 | | | | 5.0 | |
Uniform Tariff Policy - Origin Energy5 | | | 2.6 | | | | 4.2 | |
Total | | | 641.8 | | | | 560.0 | |
Notes:
| 1. | The decrease is driven by the CSO returning to historical normal levels after a one-off regulatory impact on network charges in 2022–23. As regional Queensland electricity prices are based on the cost of supply in South East Queensland, this reduction in the CSO payment does not reflect a reduction of support. |
| 2. | The increase is largely driven by changes in diesel fuel costs. |
| 3. | This was a new initiative for 2021–22 targeted at regional businesses facing significant bill impacts due to the phase out of obsolete electricity tariffs. The scheme is designed to help customers transition over a 9-year period with rebate amounts fixed at the start of the program and reducing each year. The cost of the scheme will decrease each year as payments and the number of participants reduce. The slight increase is due to an adjustment made in 2022–23 for overpayments in the previous year. |
| 4. | Expenditure is dependent on the extent of drought conditions, the number of registered eligible parties in drought declared areas and the number of customers seeking a rebate for the fixed charges of their electricity accounts. Due to improving seasonal conditions it is anticipated that expenditure will be lower than previous financial years. |
| 5. | The increase is due to regulated tariffs in regional Queensland increasing relative to prices in regional New South Wales. |
Uniform Tariff Policy – Energy Queensland (Excluding Isolated Systems)
The Uniform Tariff Policy ensures that, where possible, all Queensland non-market electricity customers of a similar type pay a similar price for electricity regardless of where they are located. As the notified prices do not reflect the full cost of electricity supply for most regional and remote Queenslanders, a subsidy is provided through a community service obligation (CSO) payment.
The CSO payment is provided to the regional retailer, Ergon Energy, through Energy Queensland, and covers the difference between the revenue earned by charging customers notified prices and the actual costs in the regional areas (due to differences in network costs and energy losses).
209
Budget Strategy and Outlook 2023-24
Uniform Tariff Policy – Energy Queensland (Isolated Systems)
The Uniform Tariff Policy ensures that, where possible, all Queensland non-market electricity customers of a similar type pay a similar price for electricity regardless of where they are located. As the notified prices do not reflect the full cost of electricity supply for most regional and remote Queenslanders, a subsidy is provided through a CSO payment.
Energy Queensland, through the regional retailer Ergon Energy, owns and operates 33 isolated power systems which supply electricity in remote and isolated communities, and provides retail electricity services to customers in those communities at notified electricity prices. This CSO payment is provided to Ergon Energy, through Energy Queensland, and covers the difference between the revenue earned by charging customers notified prices and the actual cost of operating the isolated power systems.
Non-residential Buildings – Subsidised Rents
Accommodation is provided to 35 community, education, arts and not-for-profit organisations in government-owned non-residential buildings. Tenures for the occupancies are by way of leases, licences or month-to-month arrangements. Rents paid by the organisations are often below independently assessed market rent levels. Subsidised rental arrangements are provided to 25 properties comprising a total floor area of approximately 39,934 square metres. The total subsidy is calculated by deducting the actual amount paid by the occupants from the total estimated annual market rent for the office space.
Electricity Tariff Adjustment Scheme
The Electricity Tariff Adjustment Scheme provides targeted support to regional businesses materially impacted by the phase-out of obsolete electricity tariffs from 30 June 2021. This initiative provides eligible customers with individually tailored transitional rebates to help offset the removal of obsolete tariffs and incentivise a pathway to self-sufficiency over time. Eligible businesses will receive a subsidy payment for up to 9 years.
Drought Relief from Electricity Charge Scheme
Drought Relief from Electricity Charges Scheme provides farmers and irrigators with relief from fixed charges for electricity accounts that are used to pump water for farm or irrigation purposes during periods of drought. The concessions can vary depending on the shires that are drought declared and the number of eligible customers.
Uniform Tariff Policy – Origin Energy
The Uniform Tariff Policy ensures that, where possible, all Queensland non-market electricity customers of a similar type pay a similar price for electricity regardless of where they are located. As the notified prices do not reflect the full cost of electricity supply for most regional and remote Queenslanders, a subsidy is provided through a CSO payment.
Origin Energy retails electricity to approximately 5,450 Queensland non-market customers in the Goondiwindi, Texas and Inglewood areas who are supplied electricity through the New South Wales Essential Energy distribution network. The government provides a subsidy to these customers, via a CSO payment to Origin Energy, to ensure they pay a similar price for electricity as other Queenslanders. Therefore, the CSO amount depends on the relative difference between Queensland and New South Wales retail electricity tariffs for non-market customers.
210
Budget Strategy and Outlook 2023-24
| Table A.2.5 | Department of Environment and Science |
| | | | | | | | |
Concession | | 2022–23
Est. Act.
$ million | | | 2023–24
Estimate
$ million | |
Queensland Parks and Wildlife Service - Tour Fee and Access Permits1 | | | 2.0 | | | | 2.2 | |
Total | | | 2.0 | | | | 2.2 | |
Note:
| 1. | Variance is primarily due to anticipated increase in visitation to national parks and visitor centres including the David Fleay Wildlife Park and Mon Repos Turtle Centre. |
Queensland Parks and Wildlife Service – Tour Fee and Access Permits
Visitor admission and ranger guided tour fees concessions of 10 to 100 per cent are available at several attractions and visitor centres for eligible persons including children, pensioners, concession card holders and groups undertaking visits for educational purposes.
Vehicle access permit concessions of up to 100 per cent are available in the Cooloola Recreation Area, Bribie, Moreton (Mulgumpin) and K’gari for approved applicants including First Nations peoples and local residents required to traverse the protected area estate.
Camping concessions of 45 to 100 per cent are available in all national park and state forest camping areas for educational purposes and children under 5 years of age.
In 2023–24, approximately 225,000 persons are expected to access the range of concessions available through the Department of Environment and Science.
211
Budget Strategy and Outlook 2023-24
| Table A.2.6 | Department of Housing |
| | | | | | | | |
Concession | | 2022–23
Est. Act.
$ million | | | 2023–24
Estimate
$ million | |
Government Managed Housing Rental Rebate1 | | | 570.6 | | | | 670.5 | |
Home Assist Secure2 | | | 23.0 | | | | 26.4 | |
National Rental Affordability Scheme3 | | | 20.3 | | | | 12.8 | |
Helping Seniors Secure Their Homes4 | | | 4.0 | | | | 11.0 | |
Rental Bond Loans | | | 1.7 | | | | 1.8 | |
Non-government Managed Housing5 | | | — | | | | — | |
Total | | | 619.6 | | | | 722.5 | |
Notes:
| 1. | The increase is due to an increase in private market rents based on prevailing conditions. |
| 2. | The variance is based on the anticipated year-on-year demand for services paid under this scheme. |
| 3. | The variance is primarily due to a decrease in the number of incentives paid as the scheme winds down. The cessation of the scheme was a decision of the Australian Government. |
| 4. | New item for 2023–24. This program was announced in April 2023. The expenditure profile across 2022–23 and 2023–24 is based on the anticipated expenditure informed by the timing of program implementation and delivery being trialled in Cairns, Mount Isa and Townsville local government areas. The trial will be expanded to include the Toowoomba local government area and the greater Cairns region. The government is providing up to an additional $15 million in 2023–24, centrally held if needed to expand the program in other locations. This will bring the total funding available for this program up to $30 million over 2 years. |
| 5. | The value of this concession arrangement cannot be easily quantified. |
Government Managed Housing Rental Rebate
The Government Managed Housing Rental Rebate targets low-income families and individuals and represents the difference between the estimated rents that would be payable in the private market and rent that is charged by the government based on household income.
Assistance is provided to approximately 55,000 households. The estimated average yearly subsidy per household for 2023–24 is $12,181.
Home Assist Secure
Home Assist Secure provides free safety related information and referrals, and subsidised assistance to eligible clients unable to undertake or pay for critical maintenance services without assistance. To be considered for assistance, homeowners or tenants over the age of 60 or of any age with a disability must hold a Pensioner Concession Card and be unable to complete the work themselves. In addition, they must be unable to access assistance from other services.
Labour costs (up to $500 per household per year) for the assistance provided are subsidised by Home Assist Secure while the balance of the costs (including the materials) are met by the client. Clients can also get a one-off subsidy of $80 for the cost of materials for security related work (Security Hardware Subsidy).
Home Assist Secure targets homeowners and those in rental housing who are over 60 years of age or have disability, and who require assistance to remain living in their home. In 2023–24, it is estimated that over 40,000 households will be assisted.
212
Budget Strategy and Outlook 2023-24
National Rental Affordability Scheme
The National Rental Affordability Scheme (NRAS) is an Australian Government initiative, delivered in partnership with the Queensland Government, to increase the supply of new affordable rental housing. The scheme provides financial incentives to investors to build well located dwellings and rent them to eligible low-to-moderate income households, at a discounted rate at least 20 per cent below market rent.
Under the scheme, the concession to the tenant is provided by the property owner. Due to the nature of the arrangement, the overall value of the concession to the tenant cannot be easily quantified. In 2023–24, the government has allocated $12.8 million for the payment of financial incentives to NRAS investors who are then required to discount rents to tenants.
Helping Seniors Secure Their Homes
Helping Seniors Secure Their Homes provides assistance to eligible homeowners aged 60 years and over who are Pensioner Concession Card holders to subsidise the cost of improving the safety and security features of their homes, allowing them to remain safe and secure in their homes. The program provides financial assistance of up to $10,000 per household to allow them to implement a range of security measures to increase home security, including door and window locks, security screening on doors and windows, security lighting and sensor lights, alarm systems and CCTV cameras.
Rental Bond Loans
The government provides interest-free rental bond loans to people who cannot afford to pay a full bond to move into private rental accommodation, thereby reducing the need for more costly, subsidised housing assistance, through 2 products:
| • | | Bond Loans: equivalent to a maximum amount of 4 weeks rent |
| • | | Bond Loan Plus: equivalent to a maximum amount of 6 weeks rent. |
The interest-free bond loan targets low-income households and can stabilise tenancies, preventing households from entering the cycle of homelessness and engaging with fringe, high interest credit providers. The concession represents the interest saving for the client on the bond loan. In 2023–24, $20.8 million in Bond Loans and Bond Loan Plus may be advanced to an estimated 13,000 clients, averaging $1,600 in support per client.
Non-Government Managed Housing
The government provides contributions to social housing providers, including capital grants, granted land or properties, or recurrent funding to assist in increasing housing affordability and access to social housing.
Due to the nature of the arrangement, particularly varying rents charged by providers based on individual circumstances of each household, the overall value of the concession provided by the government cannot be easily quantified.
Rents charged for social housing managed by the providers are based on between 25 and 30 per cent of a household’s income or the market rent, whichever is lower, which substantially reduces accommodation costs for eligible individuals and families. Many of these families may also be eligible for Commonwealth Rent Assistance to assist in the cost of their accommodation.
213
Budget Strategy and Outlook 2023-24
Assistance is expected to be provided to approximately 16,500 households to access non-government managed housing in 2023–24.
| Table A.2.7 | Department of Justice and Attorney-General |
| | | | | | | | |
Concession | | 2022–23
Est. Act.
$ million | | | 2023–24
Estimate
$ million | |
Public Trustee of Queensland - Concessions | | | 42.1 | | | | 43.3 | |
Court Services - Civil Court | | | 29.6 | | | | 30.5 | |
Queensland Civil and Administrative Tribunal | | | 27.3 | | | | 26.4 | |
Blue Card - Volunteer Applicants | | | 11.9 | | | | 12.5 | |
Body Corporate and Community Management - Dispute Resolution | | | 3.4 | | | | 4.9 | |
Liquor Gaming and Fair Trading - Rural Hotel Concessions | | | 0.4 | | | | 0.4 | |
Registry of Births, Deaths and Marriages - Fee Waivers | | | 0.1 | | | | 0.2 | |
Total | | | 114.8 | | | | 118.2 | |
Public Trustee of Queensland – Concessions
The Public Trustee of Queensland (the Public Trustee) is a self-funded organisation and uses a scale of fees which is designed to reflect a fair cost for the services provided.
The Public Trustee has established a safety net limit on the annual fees payable by certain customers which provides for a rebate of fees for some customers with limited assets. The rebate is applied to customers such as financial administration customers with impaired capacity, or estate administration customers of limited means. The Public Trustee also provides Will making services at no cost for all Queenslanders.
In addition, the Public Trustee provides funding to the Public Guardian and financial assistance under the Civil Law Legal Aid Scheme administered by Legal Aid Queensland, to enable these organisations to provide services to the people of Queensland.
Court Services – Civil Court
The Supreme, District and Magistrates Courts hear civil disputes between 2 or more parties (people or organisations) where one party sues the other, usually to obtain compensation, or seeks some other remedy. These disputes may involve anything from defamation to outstanding debts. Civil Court Fees are prescribed under the Uniform Civil Procedure (Fees) Regulation 2009 for proceedings commenced in civil matters and are set below full cost recovery to ensure that civil remedies are accessible to all Queenslanders.
Queensland Civil and Administrative Tribunal
The Queensland Civil and Administrative Tribunal (QCAT) is an independent tribunal which makes decisions and resolves disputes across a wide range of jurisdictions for the community. Fees for these services are set below cost recovery to ensure services are accessible, fair and inexpensive. QCAT provides human rights services with no application fees for matters in guardianship and administration of adults, children and young people and anti-discrimination.
214
Budget Strategy and Outlook 2023-24
Blue Card – Volunteer Applicants
Individuals providing child-related services or conducting child-related activities in regulated service environments are required to undergo an assessment of their police record and relevant disciplinary information, and if approved, are issued with a blue card. A blue card is valid for 3 years unless cancelled or suspended earlier.
The Queensland Government has met the cost of blue card assessment for volunteer applicants since the inception of the blue card system in 2001. This is to ensure children can continue to receive services and participate in activities which are essential to their development and well-being, in a safe and supportive environment.
Body Corporate and Community Management – Dispute Resolution
The Office of the Commissioner for Body Corporate and Community Management provides a dispute resolution service to parties unable to resolve disputes themselves. The service consists of conciliation, with the aim of achieving a voluntary agreement, and adjudication, which results in a formal order. The service is delivered below full cost recovery so as to not restrict access to justice due to affordability reasons. The commissioner has the discretion to waive application fees on the grounds of financial hardship.
Liquor Gaming and Fair Trading – Rural Hotel Concessions
The Office of Liquor and Gaming Regulation licenses hotels and clubs under the Liquor Act 1992. Under the Liquor (Rural Hotels Concession) Amendment Act 2019, the Rural Hotels Concession provides licence fee relief to establishments in remote communities by reducing the base licence fees for hotels and community clubs with no more than 2,000 members, for eligible licences from July 2019.
Registry of Births, Deaths and Marriages – Fee Waivers
The Registry of Births, Deaths and Marriages waives the fees for certificates provided to disadvantaged groups in the Queensland Community (e.g. Aboriginal peoples and Torres Strait Islander peoples, people who are homeless, domestic and family violence victims, etc.) and those impacted by major emergencies (e.g. natural disasters such as cyclones and bushfires).
215
Budget Strategy and Outlook 2023-24
| Table A.2.8 | Department of Regional Development, Manufacturing and Water |
| | | | | | | | |
Concession | | 2022–23
Est. Act.
$ million | | | 2023–24
Estimate
$ million | |
Sunwater Rural Irrigation Water Price Subsidy | | | 19.5 | | | | 19.5 | |
Horticulture Rural Irrigation Water Price Rebate Scheme administered by the Queensland Rural and Industry Development Authority1 | | | 2.0 | | | | 9.9 | |
Cloncurry Pipeline Water Supply Subsidy2 | | | 6.6 | | | | 7.0 | |
Seqwater Rural Irrigation Water Price Subsidy3 | | | 2.3 | | | | 2.4 | |
Disaster Relief Arrangements - Annual Water Licence Fee Waiver | | | 1.0 | | | | 0.9 | |
Drought Relief Arrangements - Water Licence Fee Waiver | | | 0.3 | | | | 0.9 | |
Total | | | 31.7 | | | | 40.6 | |
Notes:
| 1. | The increase is due to an expected increase in the number of applications. |
| 2. | The increase is due to indexation and increased insurance costs. |
| 3. | The variance is due to prices paid by rural irrigation customers which gradually transition towards cost recovery. |
Sunwater Rural Irrigation Water Price Subsidy
Sunwater’s irrigation water prices for some schemes are set below the level necessary to recover the cost of supplying water to the irrigators.
Government funding is provided to Sunwater to offset the reduced revenue and to ensure that irrigation prices gradually transition towards cost recovery.
Funding is also provided to continue a 15 per cent discount on Sunwater irrigation prices for a 4-year period ending 2024–25.
Horticulture Rural Irrigation Water Price Rebate Scheme administered by the Queensland Rural and Industry Development Authority
Payments to Queensland Rural and Industry Development Authority (QRIDA) to deliver an additional 35 per cent rebate on Sunwater and Seqwater irrigation water prices related to horticulture production for a 3-year period ending 2023–24, bringing the total irrigation discount provided to 50 per cent for approved applicants.
Cloncurry Pipeline Water Supply Subsidy
North West Queensland Water Pipeline Limited (NWQWP), a Sunwater Limited (Sunwater) subsidiary, owns and operates the Cloncurry Pipeline between the Ernest Henry Mine and Cloncurry. The pipeline guarantees Cloncurry Shire Council’s water supply and supports industrial development in the region. The Queensland Government provides funding to NWQWP to ensure the pipeline remains commercially viable to operate while providing an affordable and safe water supply to Cloncurry.
216
Budget Strategy and Outlook 2023-24
Seqwater Rural Irrigation Water Price Subsidy
Seqwater’s irrigation water prices for some schemes are set below the level necessary to recover the cost of supplying water to the irrigators.
Government funding is provided to Seqwater to offset the reduced revenue and to ensure that irrigation prices gradually transition towards cost recovery.
Funding is also provided to continue a 15 per cent discount on Seqwater irrigation prices for a 4-year period ending 2024–25.
Disaster Relief Arrangements – Annual Water License Fee Waiver
Fees associated with annual water licences ($92.01) will be waived for 2023–24 for disaster declared areas. The waiver is available to landholders in Local Government Areas where Category B of the Disaster Recovery Funding Arrangements for Disaster Assistance (Primary Producer) Loans or Disaster Assistance (Essential Working Capital) Loans Scheme for Small Business is activated. In 2023–24, it is estimated 9,000 waivers will be issued to landholders.
Drought Relief Arrangements – Water Licence Fee Waiver
As part of the Drought Assistance Reform Package, fees associated with an annual water licence invoice ($92.01) and applications for stock or domestic water licences ($146.17) will be waived for 2023–24. It is estimated that 6,000 waivers will be issued to landholders.
The waiver is available to primary producers in drought declared areas and those who have an individually droughted property (IDP).
| Table A.2.9 | Department of Resources |
| | | | | | | | |
Concession | | 2022–23
Est. Act.
$ million | | | 2023–24
Estimate
$ million | |
Land Rental Rebates | | | 3.2 | | | | 3.2 | |
Total | | | 3.2 | | | | 3.2 | |
Land Rental Rebates
As part of the Drought Assistance and Reform Package, Category 11 Grazing and Primary Production landholders under the Land Act 1994 are eligible for a rental rebate. The rebate is available to lessees, other than those on minimum rent, that are in a drought declared local government area and to individually drought declared properties. In addition to this rebate, drought declared landholders will be granted a hardship deferral for required rent payments.
| Table A.2.10 | Department of Tourism, Innovation and Sport |
| | | | | | | | |
Concession | | 2022–23
Est. Act.
$ million | | | 2023–24
Estimate
$ million | |
Sport and Recreation Venues - Concessional Usage Rates | | | 2.0 | | | | 2.1 | |
Total | | | 2.0 | | | | 2.1 | |
217
Budget Strategy and Outlook 2023-24
Sport and Recreation Venues – Concessional Usage Rates
Concessional usage rates of 20 per cent are offered to clients who meet the strategic objectives of the Activate! Queensland strategy, including not-for-profit sport and recreation organisations, Queensland schools and Queensland state sporting organisations, for the use of Sport and Recreation owned and operated venues, including Queensland Recreation Precincts at Currimundi and Tallebudgera.
| Table A.2.11 | Department of Transport and Main Roads |
| | | | | | | | |
Concession | | 2022–23
Est. Act.
$ million | | | 2023–24
Estimate
$ million | |
General Public Transport Concessions (South East Queensland)1 | | | 1,800.4 | | | | 1,874.2 | |
Rail Network and Infrastructure Funding2 | | | 776.7 | | | | 867.3 | |
General Public Transport Concessions (Regional Queensland) | | | 314.0 | | | | 334.4 | |
Vehicle and Boat Registration Concessions | | | 198.3 | | | | 206.8 | |
School Transport Assistance Scheme | | | 153.9 | | | | 165.1 | |
TransLink Transport Concessions (South East Queensland) | | | 77.7 | | | | 96.1 | |
Livestock and Regional Freight Contracts | | | 35.4 | | | | 36.1 | |
Rail Concession Scheme | | | 27.1 | | | | 27.8 | |
Other Transport Concessions (Regional Queensland) and Taxi Subsidies | | | 24.2 | | | | 24.4 | |
Practical Driving Test | | | 4.5 | | | | 4.5 | |
Designated Public Transport Concessions for Seniors Card Holders | | | 4.2 | | | | 4.3 | |
COVID-19 Relief Measures - Transport Services3 | | | 0.2 | | | | 0.1 | |
Mount Isa Line Incentive Scheme | | | 20.0 | | | | — | |
Total | | | 3,436.6 | | | | 3,641.1 | |
Note:
| 1. | The increase is due to significant investment in the South East Queensland rail network to make it reliable both in the near term and in the future when the expanded network is live. |
| 2. | The increase is due to a change in the investment timeline for significant network improvement infrastructure projects. |
| 3. | This item is part of the government response to COVID-19. |
General Public Transport Concessions (South East Queensland)
The General Public Transport Concessions (South East Queensland) represents the direct funding contribution that the government makes towards the cost of operating public transport services within South East Queensland. This contribution effectively reduces the ticket price paid by all public transport users on bus, rail and ferry services, increasing the affordability of these services.
218
Budget Strategy and Outlook 2023-24
Rail Network and Infrastructure Funding
Rail network and infrastructure funding ensures that the state-supported rail network is safe, reliable and fit for purpose. The contract also provides funding to Queensland Rail to support major capital projects and related asset strategies. The funding provided via this contract directly benefits customers of the state-supported rail network, including both freight and passengers. Without this funding, rail access charges (including public transport fares) would be significantly higher for all users of the rail network.
General Public Transport Concessions (Regional Queensland)
The General Public Transport Concessions (Regional Queensland) represents the financial contribution that government provides across a range of transport services in regional Queensland. The impact of this contribution benefits all public transport users through reduced transport fares. This concession covers:
| • | | subsidies for regional bus and ferry operators (excluding concessional top up amounts and School Transport Assistance Scheme related amounts) |
| • | | subsidies for air services to remote and rural communities within the state |
| • | | subsidies for Kuranda Scenic Railway |
| • | | TravelTrain (excluding the ‘Rail Concession Scheme’ for eligible pensioners, veterans and seniors) |
| • | | subsidies for long distance coach services to rural and remote communities within the state |
| • | | subsidies for Heritage Rail Services |
| • | | subsidies for the Rail XPT Service (Sydney-Brisbane) and Savannahlander (Atherton Tableland). |
Vehicle and Boat Registration Concessions
Vehicle registration concessions for light and heavy motor vehicles and recreational boats are provided to a wide variety of individuals and organisations, including holders of the Pensioner Concession Card, Queensland Seniors Card and to those assessed by the Department of Veterans’ Affairs as meeting the necessary degree of incapacity or impairment, primary producers and charitable organisations. As at 31 March 2023, the Queensland Government is providing vehicle registration concessions on approximately 686,850 vehicles, totalling $206.8 million.
Person based concessions, such as those aimed at improving access to travel for pensioners, seniors and people with disability, provide a reduced rate of registration fees. For most eligible card holders, a concession for a 4-cylinder vehicle would reduce the 12-month registration fee by 50 per cent from $360.60 to $180.30. For a recreational boat up to and including 4.5 metres in length, the concession reduces the registration fee by 50 per cent from $97.35 to $48.70. As at 31 March 2023, these concessions apply to approximately 573,760 vehicles and 20,590 vessels.
A Special Interest Vehicle (SIV) registration concession is offered for motor vehicles that have low use associated with vintage and historic and street rod car club events. A SIV concession would reduce the 12-month registration fee for a 6-cylinder SIV over 80 per cent from $570.95 to $101.60. As at 31 March 2023, this concession applies to approximately 40,801 vehicles.
219
Budget Strategy and Outlook 2023-24
A registration concession is also available for prescribed heavy vehicles that are solely used for the purpose of carrying on the business of a primary producer. A primary production business consists mainly of the production of raw materials for clothing or food (derived from agriculture, dairying, fishing, raising of livestock or viticulture). Eligible primary producers receive registration concessions for prescribed heavy vehicles, reducing their registration fees by 50 to 75 per cent. For example, a primary producer’s 12-month registration fee for a 2-axle truck with a Gross Vehicle Mass over 12 tonne reduces from $1,068.00 to $534.00. As at 31 March 2023, this concession applies to approximately 30,583 heavy vehicles.
Other motor vehicle registration concessions are also provided to local governments, charitable and community service organisations, and people living in remote areas. Vessel registration concessions may be provided to accredited surf lifesaving clubs and schools.
School Transport Assistance Scheme
The School Transport Assistance Scheme (STAS) assists students that do not have a school in their local area or who are from defined low income groups with travel costs. The scheme provides funding to reduce the cost of travelling to school on bus, rail and/or ferry services, with allowances for private vehicle transport in certain circumstances. A typical concession would be to fully fund the cost of travel from home to the nearest state primary or high school where no local primary or high school is available (e.g. from Bargara to Bundaberg High School). In 2023–24, approximately 130,000 students will be STAS eligible.
TransLink Transport Concessions (South East Queensland)
The TransLink Transport Concessions (South East Queensland) are provided by the government to ensure access and mobility for Queenslanders who require assistance because of age, disability or fixed low income. Passengers entitled to receive public transport concessions include holders of a Pensioner Concession Card, Veterans’ Affairs Gold Card, Seniors Card (all states and territories), Companion Card, Vision Impairment Travel Pass, Total Permanent Incapacitated (TPI) Veteran Travel Pass, children, secondary and tertiary students, JobSeeker and Youth Allowance recipients, asylum seekers and White Card holders. Under current fare arrangements, approved concession groups receive at least a 50 per cent discount when compared to the same applicable adult fare.
Livestock and Regional Freight Contracts
The Livestock and Regional Freight Contracts provide funding to support the movement of cattle (via rail only) and freight (via road and rail) to and from regional areas of Queensland. The funding provided directly benefits the cattle industry and enables regional Queensland communities to maintain employment and directly benefits those communities who are reliant on rail freight services by reducing the cost of these freight services for users.
Rail Concession Scheme
The Queensland Rail Concession Scheme improves the affordability of long distance and urban rail services for eligible pensioners, veterans, seniors and current/past rail employees with 25 years of service. Assistance for long distance rail services is provided through discounted fares and free travel vouchers. For TravelTrain (long distance rail) services, depending on the service, the concession may be for free travel for up to 4 trips per year for Queensland pensioners (subject to availability of seats and payment of an administration fee).
220
Budget Strategy and Outlook 2023-24
Other Transport Concessions (Regional Queensland) and Taxi Subsidies
Other transport concessions (Regional Queensland) and taxi subsidies are provided by the government to ensure access and mobility for Queenslanders who require assistance because of age, disability or fixed low income. Passengers entitled to receive public transport concessions include holders of a Pensioner Concession Card, Veterans’ Affairs Gold Card, Seniors Card (all states and territories), Companion Card, Vision Impairment Travel Pass, TPI Veteran Travel Pass, children, secondary and tertiary students, JobSeeker and Youth Allowance recipients, asylum seekers and White Card holders. The Taxi Subsidy Scheme aims to improve the mobility of persons with severe disabilities by providing a 50 per cent concession fare up to a maximum subsidy of $30 per trip.
Practical Driving Test
As part of the state’s driver licensing arrangements, applicants for new licences are required to undertake a practical driving test. The total cost to pre-book driver examinations and to perform the practical driver assessment is not fully recovered by the fee charged ($64.95 (including GST) as at 1 July 2023), providing a direct concession to applicants.
Designated Public Transport Concessions for Seniors Card Holders
Designated Public Transport Concessions for Seniors Card Holders allows visitors from interstate, who hold a state or territory Seniors Card, to access public transport concessions within Queensland and is fully funded by the Queensland Government. Under current fare arrangements, this enables eligible interstate visitors to receive at least a 50 per cent discount when compared to the same applicable adult fare.
COVID-19 Relief Measures – Transport Services
Transport services COVID-19 relief measures provided by the government include financial assistance for the personalised transport industry.
Mount Isa Line Incentive Scheme
Under the Mount Isa Line Incentive Scheme, the Queensland Government provided $20 million per annum for 4 years between 2019–20 and 2022–23 to reduce below rail access costs for eligible freight users. The scheme ended in 2022–23.
221
Budget Strategy and Outlook 2023-24
| Table A.2.12 | Department of Treaty, Aboriginal and Torres Strait Islander Partnerships, Communities and the Arts |
| | | | | | | | |
Concession | | 2022–23
Est. Act.
$ million | | | 2023–24
Estimate
$ million | |
Queensland Museum - Arts Concessional Entry Fees | | | 2.6 | | | | 2.8 | |
Queensland Performing Arts Trust - Arts Concessional Entry Fees1 | | | 1.6 | | | | 1.2 | |
Arts Queensland - Discount on Property Lease Rentals | | | 0.8 | | | | 0.8 | |
Queensland Performing Arts Trust - Venue Hire Rebates | | | 0.5 | | | | 0.6 | |
Queensland Art Gallery - Arts Concessional Entry Fees | | | 0.4 | | | | 0.5 | |
Arts Queensland - Venue Hire Rebates | | | 0.4 | | | | 0.4 | |
State Library of Queensland - Venue Hire Rebates | | | 0.3 | | | | 0.3 | |
Total | | | 6.6 | | | | 6.6 | |
Note:
| 1. | The variance is primarily due to two major shows produced by QPAC in 2022–23, with no similar major shows expected in 2023–24. |
Queensland Museum – Arts Concessional Entry Fee
Queensland Museum provides concessional entry fees to seniors, students, children, families and a variety of concession card holders for ticketed exhibitions at Queensland Museum and Sciencentre and for general entry to Cobb & Co Museum Toowoomba, the Workshops Rail Museum Ipswich and Museum of Tropical Queensland Townsville. Concessions are also provided to targeted groups, such as schools, to encourage visits to museums. The level of concession provided varies depending on the venue and the event.
Queensland Performing Arts Trust – Arts Concessional Entry Fees
Concessional entry fees are offered for specific Queensland Performing Arts Trust productions and to provide support for other not-for-profit theatre companies to enable tickets to be sold at concessional prices. The level of concession provided varies depending on the number and size of events being held each year.
Arts Queensland – Discount on Property Lease Rentals
Property lease rentals are provided to arts and cultural organisations at a discount from market rental rates at the Judith Wright Arts Centre, Festival House, and Bulmba-ja Arts Centre. Further discounts on specialist rehearsal and gallery space are given as negotiated at the time of entering the lease and dependent on the individual arts or cultural organisation and its funding.
Queensland Performing Arts Trust – Venue Hire Rebates
Venue hire rebates are offered to government-funded cultural organisations, charitable organisations, government departments and educational institutions. Organisations currently receiving discounts are Queensland Symphony Orchestra, Opera Queensland, Queensland Theatre Company and Queensland Ballet.
222
Budget Strategy and Outlook 2023-24
Queensland Art Gallery – Arts Concessional Entry Fees
Queensland Art Gallery’s ticket prices are set to ensure that they are affordable and to maximise attendance, with additional concessions provided to seniors, students, children, families, and a variety of concession card holders. The purpose of the Queensland Art Gallery Arts entry fees concession is to contribute to the cultural, social, and intellectual development of Queenslanders, and encourage diverse audiences.
Arts Queensland – Venue Hire Rebates
Venue hire rebates support Queensland Government-funded arts organisations and professional artists to develop and present new work at the Judith Wright Arts Centre and Bulmba-ja Arts Centre.
State Library of Queensland – Venue Hire Rebates
State Library of Queensland provides venue hire concessions to targeted community and non-profit groups including cultural and charitable organisations and educational institutions in order to support events and programs directly linked to State Library of Queensland’s services, programs, and activities.
| Table A.2.13 | Department of Youth Justice, Employment, Small Business and Training |
| | | | | | | | |
Concession | | 2022–23
Est. Act.
$ million | | | 2023–24
Estimate
$ million | |
User Choice - Apprentice and Trainee Training Subsidy1 | | | 251.1 | | | | 252.0 | |
Vocation Education and Training (VET) - Certificate 3 Guarantee Tuition Fee Subsidy1 | | | 228.4 | | | | 218.9 | |
VET - Higher Level Skills Tuition Fee Subsidy | | | 65.0 | | | | 65.0 | |
Travel and Accommodation Subsidy | | | 3.0 | | | | 3.0 | |
Total | | | 547.5 | | | | 538.9 | |
Note:
| 1. | The variance is due to the demand driven nature of the programs. |
User Choice – Apprentice and Trainee Training Subsidy
The User Choice – Apprentice and Trainee Training Subsidy program provides government funding towards the costs of training and assessment for eligible Queensland apprentices and trainees, or complementary pathways leading to apprenticeship outcomes.
The subsidy is available to pre-approved public and private registered training organisations to subsidise tuition fees to reduce the cost of nationally recognised entry level training for apprentices and trainees. The program provides greater flexibility for apprentices, trainees and their employers to select a preferred registered training organisation and to negotiate the type of training to meet their specific needs.
The value of this subsidy for each qualification ranges from $1,240 to $50,720, depending on student eligibility and qualification subsidised. The average subsidy value is $10,209.
223
Budget Strategy and Outlook 2023-24
Vocational Education and Training (VET) – Certificate 3 Guarantee Tuition Fee Subsidy
The Vocational Education and Training (VET) Certificate 3 Guarantee Tuition Fee Subsidy provides a government subsidy to allow eligible Queenslanders to obtain their first post-school Certificate III qualification to help them gain a job or to improve their employment status, including pathways for disadvantaged learners and Queensland school students (VET in Schools).
The subsidy is available to pre-approved private and public registered training organisations to subsidise tuition fees paid by students undertaking eligible VET qualifications (primarily Certificate III qualifications).
The value of this subsidy for each qualification ranges from $496 to $6,990, depending on student eligibility and qualification subsidised. The average subsidy value is $3,270.
VET – Higher Level Skills Tuition Fee Subsidy
The VET Higher Level Skills Tuition Fee Subsidy provides a government subsidy to eligible students and employers to undertake a priority Certificate IV, diploma or advanced diploma qualification or industry endorsed skill set. This program assists individuals to gain employment in a critical occupation, career advancement in a priority industry or transition to university to continue their studies.
The subsidy is available to pre-approved private and public registered training organisations to subsidise tuition fees paid by students undertaking eligible VET qualifications at Certificate IV or above.
The value of this subsidy for each qualification ranges from $1,235 to $12,830, depending on student eligibility and qualification subsidised. The average subsidy value is $4,846.
Travel and Accommodation Subsidy
The Travel and Accommodation Subsidy provides financial assistance to Queensland apprentices and trainees for travel expenses incurred in attending off-the-job training at a registered training organisation. To be eligible, apprentices must attend the closest registered training organisation that offers the required qualification and travel a minimum of 100km return from their usual place of residence to the registered training organisation. The subsidy provides for:
| • | | return land travel to the registered training organisation of 21 cents per km for distances between 100km—649km, increasing to 26 cents per km for distances of 650km or more |
| • | | a return economy air ticket to the location of the registered training organisation for distances of 1,100km or more if necessary |
| • | | cost of ferry travel if necessary |
| • | | accommodation assistance of $40 per day for overnight stay within Queensland and $76 for interstate travellers, if it is necessary to live away from their usual place of residence to attend training. |
224
Budget Strategy and Outlook 2023-24
| Table A.2.14 | Queensland Fire and Emergency Services |
| | | | | | | | |
Concession | | 2022–23
Est. Act.
$ million | | | 2023–24
Estimate
$ million | |
Emergency Management Levy Concession | | | 11.2 | | | | 11.7 | |
Total | | | 11.2 | | | | 11.7 | |
Emergency Management Levy Concession
The Emergency Management Levy (EML) is applied to all prescribed Queensland property via council rates to ensure there is a secure funding base for fire and emergency services when Queenslanders are at risk during emergencies such as floods, cyclones, storms as well as fire and accidents. A 20 per cent discount is available on the EML for a property that is the owner’s principal place of residence and where the owner holds a Commonwealth Pensioner Concession Card or a Repatriation Health Card (Gold Card). In 2023–24, 282,000 property owners are estimated to receive the concession.
| Table A.2.15 | Queensland Health |
| | | | | | | | |
Concession | | 2022–23
Est. Act.
$ million | | | 2023–24
Estimate
$ million | |
Oral Health Scheme1 | | | 173.5 | | | | 185.9 | |
Patient Travel Subsidy Scheme2 | | | 89.6 | | | | 113.8 | |
Medical Aids Subsidy Scheme3 | | | 28.7 | | | | 31.8 | |
Spectacle Supply Scheme4 | | | 9.0 | | | | 10.1 | |
Hospital Car Parking Concession Scheme5 | | | 1.8 | | | | 1.8 | |
Total | | | 302.6 | | | | 343.4 | |
Notes:
| 1. | The increase is primarily due to an escalation in state funding for the Oral Health Scheme. Australian Government funding available under the Federation Funding Agreement on Public Dental Services for Adults was extended in the 2023–24 Federal Budget and will be the same as recent years. |
| 2. | The increase in Patient Travel Subsidy Scheme (PTSS) expenditure is due to increased PTSS claims, driven by increased demand projections and increased concession rate subsidies. |
| 3. | The 2022–23 estimated actual of $28.7 million is lower than the 2022–23 estimate by $0.8 million due to continued, although reduced, impacts of COVID-19. 2023–24 estimate represents a return to normal operations utilising the full year MASS budget. |
| 4. | 2023–24 estimate represents a return to normal operations utilising the full year Spectacle Supply Scheme budget. |
| 5. | Actual expenditure varies slightly from year to year in response to demand by eligible patients, the value of parking tickets, and the level of subsidy provided, at each site. |
Oral Health Scheme
The Oral Health Scheme provides free dental care to eligible clients and their dependants who possess a current Health Care Card, Pensioner Concession Card, Queensland Seniors Card or Commonwealth Seniors Card.
The average value of a course of treatment for eligible clients is approximately $830 for general care, $2,200 for treatment involving dentures, and $290 for emergency dental care.
225
Budget Strategy and Outlook 2023-24
In rural and remote areas where no private dental practitioner exists, access to dental care for the general public is provided at a concessional rate, generally 15 per cent to 20 per cent less than average private dental fees.
Patient Travel Subsidy Scheme
The Patient Travel Subsidy Scheme (PTSS) provides financial assistance to patients travelling for specialist medical services that are not available locally. The PTSS provides a financial subsidy toward the cost of travel and accommodation for patients and, in some cases, an approved escort when patients are required to travel more than 50 kilometres from their nearest public hospital or public health facility to access specialist medical services.
Patients receive fully subsidised commercial transport for the most clinically appropriate cost-effective mode or will be subsidised at the economy/government discount rate (less GST). Commencing from 2023–24, the mileage subsidy will be increased from 30 cents to 34 cents per kilometre where patients travel by private car. Accommodation subsidies will also be increased in 2023–24 from $60 per person, per night, to $70 per person, per night, for the patient and approved escort if they stay in commercial accommodation. Should the patient or escort stay with family or friends, a subsidy of $10 per person per night remains.
In 2023–24, the government has also provided funding in relation to repatriation costs for deceased patients under the PTSS scheme to their place of residence.
Medical Aids Subsidy Scheme
The Medical Aids Subsidy Scheme provides access to subsidy funding assistance for the provision of a range of aids and equipment to eligible Queensland residents with permanent and established conditions or disabilities. Aids and equipment are provided primarily to assist people to live at home, therefore avoiding premature or inappropriate residential care or hospitalisation.
Subsidies vary based on service category and clinical criteria and are provided to assist with the costs of communication aids, continence aids, daily living aids, medical grade footwear, mobility aids, orthoses and oxygen. Actual expenditure for 2022–23 reflects the continued and changing impacts of COVID-19 and implementation of the National Disability Insurance Scheme since 2020–21.
Based on demand in 2022–23, and current applications, the scheme is estimated to provide 57,000 occasions of service to approximately 48,400 clients in 2022–23. The scheme is estimated to provide approximately 60,000 occasions of service to approximately 45,000 clients in 2023–24.
Spectacle Supply Scheme
The Spectacle Supply Scheme (SSS) provides eligible Queensland residents with free access to a comprehensive range of basic spectacles every two years including bifocals and trifocals. Applicants must be holders of eligible concession cards and be deemed by a prescriber to have a clinical need for spectacles.
226
Budget Strategy and Outlook 2023-24
The SSS provides around 90,000 items each year to approximately 70,000 clients (some clients require more than one pair of spectacles due to clinical need). With eligibility on a 2-year basis, demand can fluctuate across financial years. During 2022–23, it is estimated that SSS will provide approximately 76,000 items to 57,600 clients. The average cost of services provided to applicants during 2022–23, is approximately $118 per item, including the costs of administering the scheme through the Medical Aids Subsidy Scheme.
Hospital Car Parking Concession Scheme
The Hospital Car Parking Concession Scheme supports Hospital and Health Services to provide affordable car parking for eligible patients and their carers at 15 Queensland public hospitals with paid parking. Car parking concessions are available to eligible patients and their carers who attend hospital frequently, or for an extended period of time; patients and their carers with special needs who require assistance; and patients and carers experiencing financial hardship. The scheme provides access to discounted parking with an average discount of approximately 50 to 60 per cent of the commercial cost of parking, with 60 per cent average discount realised across all sites in 2022–23.
A.3 Concessions by Government-owned corporation
| Table A.3.1 | Energy Queensland Limited |
| | | | | | | | |
Concession | | 2022–23
Est. Act.
$ million | | | 2023–24
Estimate
$ million | |
Regulated Service Charges—Ergon Energy | | | 11.4 | | | | 12.2 | |
Regulated Service Charges—Energex | | | 10.8 | | | | 11.6 | |
Total | | | 22.2 | | | | 23.8 | |
Regulated Service Charges – Ergon Energy
Under Schedule 8 of the Electricity Regulation 2006, service charges for a range of services provided by Ergon Energy Corporation Limited (Ergon Energy) to energy retailers, for example disconnection and reconnection of supply, are capped. The maximum amount Ergon Energy is able to charge for these services is, on average, less than the value which the Australian Energy Regulator ascribes to the provision of these services by Ergon Energy, resulting in a concession provided to energy retailers and in turn, to households.
Regulated Service Charges – Energex
Under Schedule 8 of the Electricity Regulation 2006, charges for a range of services provided by Energex Limited (Energex) to energy retailers, for example disconnection and reconnection of supply, are capped. The maximum amount Energex is able to charge for these services is, on average, less than the value which the Australian Energy Regulator ascribes to the provision of these services by Energex, resulting in a concession provided to energy retailers and in turn, to households.
227
Budget Strategy and Outlook 2023-24
| Table A.3.2 | Far North Queensland Ports Corporation Limited |
| | | | | | | | |
Concession | | 2022–23
Est. Act.
$ million | | | 2023–24
Estimate
$ million | |
Covid-19 Relief | | | 0.1 | | | | — | |
Total | | | 0.1 | | | | — | |
COVID-19 Relief
In response to COVID-19, Far North Queensland Ports Corporation Ltd provided relief measures including temporary reductions to commercial leases and other measures. The scheme ended in 2022–23.
| Table A.3.3 | Gladstone Ports Corporation Limited |
| | | | | | | | |
Concession | | 2022–23
Est. Act.
$ million | | | 2023–24
Estimate
$ million | |
Concessional Port Charges | | | 40.5 | | | | 36.0 | |
Total | | | 40.5 | | | | 36.0 | |
Concessional Port Charges
The Gladstone Ports Corporation Limited (GPC) is subject to a number of long-term major industry contracts where port charges are significantly lower than market rates. These historical contracts were entered into to support various industries and government initiatives from time to time. The amounts shown are estimates of the revenue foregone by GPC as a result of being unable to charge commercial rates.
| Table A.3.4 | Sunwater Limited |
| | | | | | | | |
Concession | | 2022–23
Est. Act.
$ million | | | 2023–24
Estimate
$ million | |
Water Supply Contracts | | | 52.5 | | | | 56.6 | |
Total | | | 52.5 | | | | 56.6 | |
Water Supply Contracts
Sunwater has a number of historic non-commercial water supply contracts that benefit specific entities (including local governments). The amount shown represents the difference between the estimated revenue under these contracts and that which could be recovered under a full cost allocation model.
228
Budget Strategy and Outlook 2023-24
| Table A.3.5 | Concessional Leases by Entity (Industry, Commercial and Community) |
| | | | | | | | |
Concession | | 2022–23
Est. Act.
$ million | | | 2023–24
Estimate
$ million | |
Port of Townsville Limited | | | 6.5 | | | | 6.6 | |
Gladstone Ports Corporation Limited | | | 3.0 | | | | 3.3 | |
Queensland Rail Limited | | | 2.2 | | | | 2.6 | |
Far North Queensland Ports Corporation Limited | | | 2.0 | | | | 2.0 | |
North Queensland Bulk Ports Corporation Limited | | | 1.4 | | | | 1.4 | |
Total | | | 15.1 | | | | 15.9 | |
Concessional Leases (Industry, Commercial and Community)
The above government-owned corporation entities provide leases to various community organisations, local councils, government departments and industry participants at below commercial rates. The amounts shown are estimates of the revenue foregone by not charging commercial rates.
229
Budget Strategy and Outlook 2023-24
Appendix B: Tax expenditure statement
Context
Governments employ a range of policy tools to achieve social and economic objectives. These include the use of direct budgetary outlays, regulatory mechanisms and taxation.
This Tax Expenditure Statement (TES) details revenue forgone as a result of Queensland Government decisions relating to the provision of tax exemptions or concessions. The TES is designed to improve transparency in the use of tax expenditures and increase public understanding of the fiscal process.
Tax expenditures are reductions in tax revenue that result from the use of the taxation system as a policy tool to deliver government policy objectives. Tax expenditures are provided through a range of measures, including:
| • | | tax exemptions, rebates or deductions |
| • | | the application of reduced tax rates to certain groups or sectors of the community |
| • | | provisions, which defer payment of a tax liability to a future period. |
Labelling an exemption or concession as a tax expenditure does not necessarily imply any judgement as to its appropriateness. It merely makes the amount of the exemption or concession explicit and thereby facilitates its scrutiny as part of the annual budget process.
COVID-19 and implications for tax expenditure
The impact of the COVID-19 pandemic on Queensland businesses was significant and the Queensland Government moved quickly to introduce substantial tax relief measures to support Queensland businesses, particularly small to medium businesses. These initiatives were primarily aimed at supporting the cashflow and viability of Queensland businesses, landlords, tenants, and the state’s pubs and clubs.
The key relief measures fell under 3 categories:
| • | | direct refunds, holidays, rebates or waivers of tax liabilities – refunds, holidays and waivers of payroll tax liabilities; and a 25 per cent rebate and waiver of foreign surcharge on land tax |
| • | | deferrals of tax liabilities – various deferrals of payroll tax, land tax, gaming machine tax and lotteries tax |
| • | | exemptions – eligible JobKeeper payments were exempted from payroll tax. |
The impact of these measures resulted in a significant increase in forgone revenue, most notably in 2019–20 and 2020–21, although some measures continued to impact in 2021–22.
230
Budget Strategy and Outlook 2023-24
Methodology
Revenue forgone approach
The method used almost exclusively by governments to quantify the value of their tax expenditures is the revenue forgone approach. This method estimates the revenue forgone through use of the concession by applying the benchmark rate of taxation to the volume of activities or assets affected by the concession.
One of the deficiencies of the revenue forgone approach is that effects on taxpayer behaviour resulting from tax expenditures are not factored into the estimate. Consequently, the aggregation of costings for individual tax expenditure items presented in the TES will not necessarily provide an accurate estimate of the total level of assistance provided through tax expenditures.
Additionally, while total COVID-19 relief is included in the TES, some relief was treated as a grant expense, for example in relation to rebates of already-paid tax liabilities. In these cases, the associated tax expenditure did not reduce revenues.
Measuring tax expenditures requires the identification of:
| • | | concessionally taxed components of the benchmark tax base such as a specific activity or class of taxpayer |
| • | | a benchmark tax rate to apply to the concessionally taxed components of the tax base. |
Defining the tax benchmark
The most important step in the preparation of a TES is the establishment of a benchmark for each tax included in the statement. The benchmark provides a basis against which each tax concession can be evaluated. The aim of the benchmark is to determine which concessions are tax expenditures as opposed to structural elements of the tax. The key features of a tax benchmark are:
| • | | any specific accounting conventions applicable to the tax |
| • | | the deductibility of compulsory payments |
| • | | any provisions to facilitate administration |
| • | | provisions relating to any fiscal obligations. |
By definition, tax expenditures are those tax concessions not included as part of the tax benchmark.
Identification of what features of a tax constitute a tax expenditure, as well as the relevant benchmark revenue bases and rates, requires a degree of judgement and is not definitive. Furthermore, data limitations mean that the tax expenditures are approximations and are not exhaustive. This statement does not include estimates of revenue forgone from exemptions or concessions provided to government agencies. Very small exemptions or concessions are also excluded.
231
Budget Strategy and Outlook 2023-24
The tax expenditure statement
This year’s statement includes estimates of tax expenditures in 2021–22 and 2022–23 for payroll tax, the mental health levy, land tax, duties, the waste disposal levy and gambling taxes. A summary of the major tax expenditures valued on the basis of revenue forgone is presented in Table B.1. Not all expenditures can be quantified at this time. Accordingly, the total value of tax expenditures should be considered as indicative only.
| Table B.18 | Tax expenditure summary1 |
| | | | | | | | |
| | | 2021–222
$ million | | | 2022–23
$ million | |
Payroll tax | | | | | | | | |
Exemption threshold | | | 1,060 | | | | 1,093 | |
Graduated tax scale | | | 28 | | | | 31 | |
Deduction scheme | | | 497 | | | | 545 | |
Regional discount | | | 97 | | | | 108 | |
COVID-19 relief3 | | | 4 | | | | — | |
Section 14 exemptions | | | 858 | | | | 884 | |
Local government | | | 178 | | | | 184 | |
Education | | | 222 | | | | 229 | |
Hospitals (excluding public hospitals) | | | 67 | | | | 69 | |
Charities | | | 391 | | | | 403 | |
Apprentice and trainee exemption | | | 86 | | | | 106 | |
Apprentice and trainee rebate | | | 37 | | | | 45 | |
General practitioner payroll tax amnesty4 | | | 100 | | | | 100 | |
Total payroll tax | | | 2,767 | | | | 2,912 | |
Mental health levy5 | | | | | | | | |
Graduated scale | | | | | | | 86 | |
Total mental health levy | | | | | | | 86 | |
Land tax | | | | | | | | |
Liability threshold6 | | | 846 | | | | 891 | |
Graduated land tax scale | | | 1,543 | | | | 1,840 | |
Principal place of residence exemption | | | 343 | | | | 410 | |
Primary production exemption | | | 175 | | | | 197 | |
Part 6 Divisions 2 and 3 exemptions not included elsewhere7 | | | 161 | | | | 169 | |
Land developers’ concession | | | 7 | | | | 6 | |
COVID-19 relief3 | | | 1 | | | | — | |
Total land tax | | | 3,076 | | | | 3,513 | |
Duties | | | | | | | | |
Transfer duty | | | | | | | | |
Home concession8 | | | 608 | | | | 500 | |
First home concession8 | | | 250 | | | | 181 | |
First home vacant land8 | | | 24 | | | | 14 | |
AFAD exemption/ex gratia | | | 10 | | | | 12 | |
232
Budget Strategy and Outlook 2023-24
| | | | | | | | |
Insurance duty | | | | | | | | |
WorkCover | | | 79 | | | | 93 | |
Health insurance | | | 523 | | | | 549 | |
Compulsory third party (CTP)9 | | | 87 | | | | 89 | |
Total duties | | | 1,581 | | | | 1,438 | |
Queensland waste levy | | | | | |
Exempt waste – general | | | 97 | | | | 92 | |
Approved exemptions | | | 94 | | | | 94 | |
Approved discounts | | | 8 | | | | 10 | |
Total waste levy | | | 199 | | | | 196 | |
Taxes on gambling | | | | | | | | |
Gaming machine taxes | | | 125 | | | | 135 | |
Casino taxes | | | 11 | | | | 11 | |
Total gambling tax | | | 136 | | | | 146 | |
Total | | | 7,759 | | | | 8,291 | |
Notes:
| 1. | Numbers may not add due to rounding. |
| 2. | 2021–22 estimates may have been revised since the 2022–23 Queensland Budget. |
| 3. | A ‘cashflow benefit’ was provided through deferrals related to COVID-19 support initiatives, with some of this benefit flowing through to 2021–22. In relation to the deferrals, the estimated expense reflects the implied foregone interest on the deferred payments. |
| 4. | Estimates reflect the amnesty period covering the five years prior to 30 June 2025 (i.e. including 2021–22 and 2022–23). |
| 5. | 2022–23 estimates reflect implementation from 1 January 2023 (i.e. half a financial year). |
| 6. | Land tax is payable only on the value of taxable land above a threshold, depending on ownership structure. |
| 7. | Applicable, but not limited to; religious bodies, public benevolent institutions, and other exempt charitable institutions. |
| 8. | The reduction in estimated tax expenditures in 2022–23 reflects the reduced level of housing market activity, including by eligible first home buyers, in 2022–23 relative to the elevated levels observed in 2021–22. |
| 9. | CTP duty is levied at a rate of 10 cents per policy. |
233
Budget Strategy and Outlook 2023-24
Discussion of individual taxes
Payroll tax
The benchmark tax base for payroll tax is assumed to be all taxable wages, salaries and supplements (including employer superannuation contributions) paid in Queensland, as defined in the Payroll Tax Act 1971.
Payroll tax exemption threshold
From 1 July 2019, employers who employ in Queensland with an annual Australian payroll of $1.3 million or less are exempt from payroll tax. On the basis of November 2022 average weekly adult total earnings, the threshold corresponded to businesses with payrolls equivalent to employing approximately 14 full-time equivalent employees. This exemption is designed to assist small and medium sized businesses.
Graduated payroll tax scale
Queensland employers with Australian payrolls between $1.3 million and $6.5 million are liable for payroll tax at a rate of 4.75 per cent, and those with payrolls above $6.5 million are liable at a rate of 4.95 per cent. The benchmark tax rate for payroll tax is assumed to be 4.95 per cent.
Deduction scheme
Until 1 January 2023, Queensland employers with Australian payrolls between $1.3 million and $6.5 million benefit from a deduction of $1.3 million, which reduces by $1 for every $4 by which the annual payroll exceeds $1.3 million, with no deduction for employers or groups that have annual payroll in excess of $6.5 million.
From 1 January 2023, the deduction applies to payrolls between $1.3 million and $10.4 million, reducing by $1 in every $7 by which the annual payroll exceeds $1.3 million. No deduction is available for employers or groups that have annual payroll in excess of $10.4 million.
Regional discount
Employers who are based in regional Queensland and pay over 85 per cent of taxable wages to regional areas may be entitled to a discount on the rate of payroll tax imposed on their taxable wages. The discounted payroll tax rates for regional businesses are 3.75 per cent for employers who pay $6.5 million or less in Australian taxable wages, or 3.95 per cent for employers who pay more than $6.5 million in Australian taxable wages.
234
Budget Strategy and Outlook 2023-24
COVID-19 relief – payroll tax
In response to the COVID-19 pandemic, a number of payroll tax relief measures were implemented to assist Queensland businesses that resulted in foregone revenue, most notably in 2019–20 and 2020–21, with a small impact in 2021–22. The specific support measures that impacted revenues in 2021–22 are the implied foregone interest on:
| • | | the deferral of payroll tax liabilities from the 2020 calendar year over four payments ending in January 2022 |
| • | | a six-month deferral of July or August 2021 payroll tax payments for tourism and hospitality businesses. |
Section 14 exemptions
A number of organisations are provided with exemptions from payroll tax under Section 14 of the Payroll Tax Act 1971. The activities for which estimates have been calculated are wages paid by charities for employees working in hospitals, non-tertiary private educational institutions and for other qualifying exempt purposes, and for local governments (excluding commercial activities).
Apprentice and trainee exemptions
Most apprentice and trainee wages are exempt from payroll tax. To be eligible the employee must sign a training contract with their employer to undertake an apprenticeship or traineeship declared under the Further Education and Training Act 2014.
Apprentice and trainee rebate
In addition to being exempt wages for payroll tax, a rebate can be claimed that reduces the overall payroll tax liability of an employer. The rebate is calculated by multiplying 50 per cent of the apprentice and trainee wages by the applicable payroll tax rate for each return period.
General practitioner payroll tax amnesty
An amnesty is being provided to qualifying medical practices, otherwise liable to pay payroll tax on payments made to contracted general practitioners (GPs), up to 30 June 2025 and for the previous 5 years (i.e. 2018-25). The amnesty recognises a potential lack of awareness of the payroll tax treatment of contractors among GPs and the need to support these practices to come into compliance with the least disruption possible.
Mental health levy
The benchmark tax base for the mental health levy is assumed to be taxable wages, salaries and supplements (including employer superannuation contributions) paid in Queensland, as defined in the Payroll Tax Act 1971 that are paid by employers or groups of employers with Australian taxable wages of at least $10 million (on an annual basis).
A number of organisations are provided with exemptions from the mental health levy under Section 14 of the Payroll Tax Act 1971. Further, most apprentice and trainee wages are exempt from the mental health levy. The revenue foregone as a result of these exemptions cannot be quantified at this time.
235
Budget Strategy and Outlook 2023-24
Graduated scale
Queensland employers with Australian payrolls between $10 million and $100 million are liable for a primary rate of 0.25 per cent, and those with payrolls above $100 million are liable for the primary rate of 0.25 per cent plus an additional rate of 0.5 per cent. The benchmark rate for the mental health levy is assumed to be 0.75 per cent.
For the 2022–23 financial year, the thresholds are adjusted to accommodate the levy commencing during the financial year. For wages paid or payable for the period 1 January to 30 June 2023, Queensland employers with Australian payrolls between $5 million and $50 million are liable for a primary rate of 0.25 per cent, and those with payrolls above $50 million are liable for the primary rate of 0.25 per cent plus an additional rate of 0.5 per cent.
Land tax
The benchmark tax base is assumed to be all freehold land within Queensland. As outlined below for each specific tax expenditure, the appropriate benchmark tax rate for land tax is either the top rate of land tax applicable in Queensland (excluding surcharges) in each financial year, or the effective rate under the graduated scale of land tax rates for revenue foregone.
Liability threshold
Land tax is payable on the value of taxable land equal to or above a threshold which depends on the land’s ownership. The threshold for companies, trusts and absentees is $350,000 and for resident individuals the threshold is $600,000.
Graduated land tax scale
A graduated (concessional) scale of land tax rates is applicable to land holdings with a taxable value of less than $10 million for resident individuals and companies, trustees and absentees. The benchmark rates used for estimating the tax expenditures were the highest rates applicable for different types of owner, 2.25 per cent for individuals, 2.5 per cent for absentees and 2.75 per cent for companies and trustees.
Principal place of residence exemption
Land owned by resident individuals as their principal place of residence is excluded from the estimate of taxable land value in calculating land tax. The benchmark rates used for estimating the tax expenditures were the effective rate under the graduated scale of land tax rates.
Primary production deduction
The taxable value of land owned by a resident individual, trustee or some absentees and companies does not include all or part of their land that is used for the business of agriculture, pasturage or dairy farming. The benchmark rates used for estimating the tax expenditures were the effective rate under the graduated scale of land tax rates.
236
Budget Strategy and Outlook 2023-24
Part 6 Divisions 2 and 3 exemptions (not elsewhere included)
A number of land tax exemptions are granted in Part 6 Divisions 2 and 3 of the Land Tax Act 2010 to eligible organisations. These include, but are not limited to, public benevolent institutions, religious institutions and other exempt charitable institutions, retirement villages, trade unions and showgrounds.
Land developers’ concession
Land tax payable by land developers is calculated on the basis that the unimproved value of undeveloped land subdivided in the previous financial year and which remains unsold at 30 June of that year is 60 per cent of the Valuer-General’s value. This concession is outlined in Section 30 of the Land Tax Act 2010.
COVID-19 relief – land tax
In response to the COVID-19 pandemic a number of measures were implemented with most of the impact in earlier financial years. The foregone revenue in 2021–22 reflects the interest cost associated with the 3-month deferral of 2020–21 land tax liabilities.
Duties
Home concession
A concessional rate of duty applies to purchases of a principal place of residence. A one per cent concessional rate applies on dutiable values up to $350,000, rather than the normal schedule of rates between 1.5 per cent and 3.5 per cent. For properties valued over $350,000, the scheduled rates of transfer duty apply on the excess.
First home concession
Where a purchaser has not previously owned a residence in Queensland or elsewhere, the purchaser of a home receives a more generous concession on duty. This concession comprises a rebate in addition to the home concession on properties (this concession may not be applicable if the purchase price is less than the full market value of the property). The size of the rebate depends on the value of the property. A full concession is provided to purchases of a first principal place of residence valued up to $500,000, phasing out at $550,000.
First home vacant land concession
A first home concession is available for the purchase of certain vacant land up to the value of $400,000, with a full concession available on certain vacant land up to the value of $250,000.
Additional foreign acquirer duty exemption
An Australian-based foreign corporation or trust whose commercial activities involve significant development by adding to the supply of housing stock in Queensland, where such development is primarily residential, may be eligible for ex-gratia relief from the additional 7 per cent additional foreign acquirer duty.
237
Budget Strategy and Outlook 2023-24
Insurance duty
The benchmark tax base is assumed to be all premiums for general insurance policies (not for life insurance). The benchmark tax rate is 9 per cent.
Queensland Waste Levy
The Queensland waste levy is payable by landfill operators on waste disposed to landfill, except waste generated and disposed in the non-levy zone. In 2022–23, the levy rate was $95 per tonne in the metropolitan levy area and $88 per tonne in the regional levy area (higher for regulated wastes).
General levy exemptions exist for particular wastes, such as those from declared disasters and severe local weather events. Also, levy exemptions are available on application for other particular wastes, such as waste from charitable recycling organisations and community clean-up events.
Levy discounts of 50 per cent are available on application for residue wastes from particular recycling activities. Seventy per cent of proceeds from the waste levy will be used for waste programs, environmental priorities and community purposes.
Gambling taxes
Gaming machine tax concessions for licensed clubs
The benchmark tax base is assumed to be all gaming machines operated by licensed clubs and hotels in Queensland. The benchmark tax rate is assumed to be the highest marginal tax rate (as is applied to hotels) that actually applied in each financial year.
A progressive tax rate scale applies to gaming machines operated by licensed clubs. The tax rate is calculated monthly on the gaming machine taxable metered win and the top tax rate is only applied to the portion of gaming machine revenue where the monthly metered win exceeds $1.4 million for any licensed club.
Casino tax concessions
The benchmark tax base is assumed to be all casinos operating in Queensland. The benchmark tax rate is assumed to be the highest tax rate that is actually applied in each financial year.
A tax rate of 20 per cent of gross revenue applies for standard transactions in the Brisbane and Gold Coast casinos. A concessional tax rate of 10 per cent applies for gross revenue from standard transactions in the Cairns and Townsville casinos. The tax rate applicable to gaming machines in casinos is 30 per cent of gross revenue in the Brisbane and Gold Coast casinos, and 20 per cent in the Cairns and Townsville casinos.
In addition, concessional rates of 10 per cent also apply for revenue from high rollers table game play in all casinos. A GST credit is provided to casinos that approximates a reduction in the above tax rates of 9.09 per cent.
238
Budget Strategy and Outlook 2023-24
Appendix C: Revenue and expense assumptions and sensitivity analysis
The 2023–24 Queensland Budget, similar to all other jurisdictions, is based in part on assumptions made about parameters, both internal and external to Queensland, which can impact directly on economic and fiscal forecasts. The sensitivity of revenue and expense forecasts to movements in underlying assumptions is particularly relevant given the uncertainty in global and national economic conditions in the context of recent global and domestic developments that have impacted key revenues.
The forward estimates in the 2023–24 Queensland Budget are framed on a no-policy-change basis. That is, the expenditure and revenue policies in place at the time of the budget (including those announced in the budget) are applied consistently throughout the forward estimates period.
Table C.1 shows the main components of taxation and royalty revenue, and the forecast revenues for each component across the forward estimates.
| Table C.19 | Taxation and royalty revenue1 |
| | | | | | | | | | | | | | | | | | | | | | | | |
| | | 2021–22
Actual
$ million | | | 2022–23
Est. Act.
$ million | | | 2023–24
Budget
$ million | | | 2024–25
Projection
$ million | | | 2025–26
Projection
$ million | | | 2026–27
Projection
$ million | |
Payroll tax and mental health levy | | | 5,001 | | | | 5,874 | | | | 6,524 | | | | 6,913 | | | | 7,315 | | | | 7,738 | |
Transfer duty | | | 6,336 | | | | 5,209 | | | | 5,385 | | | | 5,607 | | | | 5,877 | | | | 6,166 | |
Other duties | | | 1,963 | | | | 2,213 | | | | 2,255 | | | | 2,350 | | | | 2,450 | | | | 2,554 | |
Gambling taxes and levies | | | 1,645 | | | | 1,927 | | | | 2,015 | | | | 2,096 | | | | 2,182 | | | | 2,271 | |
Land tax | | | 1,633 | | | | 1,777 | | | | 2,031 | | | | 2,280 | | | | 2,416 | | | | 2,471 | |
Motor vehicle registration | | | 2,103 | | | | 2,186 | | | | 2,301 | | | | 2,398 | | | | 2,499 | | | | 2,589 | |
Other taxes | | | 1,330 | | | | 1,378 | | | | 1,426 | | | | 1,481 | | | | 1,546 | | | | 1,597 | |
Total tax revenue | | | 20,011 | | | | 20,563 | | | | 21,938 | | | | 23,125 | | | | 24,285 | | | | 25,387 | |
Royalties | | | | | | | | | | | | | | | | | | | | | | | | |
Coal | | | 7,243 | | | | 15,296 | | | | 5,345 | | | | 4,024 | | | | 4,224 | | | | 4,400 | |
Petroleum2 | | | 1,184 | | | | 2,332 | | | | 1,275 | | | | 1,222 | | | | 1,143 | | | | 1,039 | |
Other royalties3 | | | 490 | | | | 477 | | | | 503 | | | | 483 | | | | 460 | | | | 440 | |
Total royalties | | | 8,917 | | | | 18,105 | | | | 7,123 | | | | 5,730 | | | | 5,827 | | | | 5,878 | |
Land rents | | | 171 | | | | 183 | | | | 195 | | | | 200 | | | | 204 | | | | 209 | |
Total royalties and land rents | | | 9,088 | | | | 18,288 | | | | 7,318 | | | | 5,929 | | | | 6,032 | | | | 6,087 | |
Notes:
| 1. | Numbers may not add due to rounding. |
| 2. | Includes liquefied natural gas (LNG). |
| 3. | Includes base and precious metal and other mineral royalties. |
239
Budget Strategy and Outlook 2023-24
The remainder of this chapter outlines the key assumptions, estimates and risks associated with key revenue and expenditure forecasts.
Taxation revenue assumptions and revenue risks
The rate of growth in tax revenues is dependent on a range of factors linked to the rate of growth in economic activity in the state. Some taxes are closely related to activity in specific sectors of the economy, whilst others are broadly related to the general rate of economic growth, employment, inflation or wages.
Therefore, any change in the level of economic activity compared with that reflected in the economic forecasts outlined in this paper, would impact a broad range of taxation receipts.
Wages and employment growth – payroll tax collections
Wages and employment growth have a direct impact on payroll tax collections. In 2023–24, wages in Queensland are forecast to increase by 4 per cent, while employment is forecast to rise 1 per cent in 2023–24.
The composition of the payroll tax base is also important as businesses in sectors such as tourism, retail and hospitality are often outside the tax base because they are below a threshold.
A one percentage point variation in either Queensland wages growth or employment would change total payroll tax collections by approximately $65 million in 2023–24.
Transfer duty estimates
Transfer duty collections in 2023–24 are expected to grow modestly by 3.4 per cent compared with 2022–23 as housing market activity begins to stabilise. However, in the context of recent and future increases in interest rates, there are uncertainties as to the size and timing of impacts on housing markets.
After declining in 2022–23, house prices are expected to return to modest growth across 2023–24 and 2024–25, and transaction volumes are also expected to return to be more in line with pre-2020–21 levels. The combination of these factors, along with ongoing recovery in the non-residential sector, is supporting an expected average annual growth of 4.6 per cent in transfer duty over the 3 years ending 2026–27.
A one percentage point variation in either the average value of property transactions or the volume of transactions would change transfer duty collections by approximately $54 million in 2023–24.
240
Budget Strategy and Outlook 2023-24
Royalty assumptions and revenue risks
Table C.2 provides the key assumptions adopted for the 2023–24 Queensland Budget in relation to coal and petroleum royalties, which represent the bulk of Queensland’s royalty revenue.
| Table C.20 | Coal royalty assumptions1 |
| | | | | | | | | | | | | | | | | | | | | | | | |
| | | 2021–22
Actual | | | 2022–23
Est. Act. | | | 2023–24
Budget | | | 2024–25
Projection | | | 2025–26
Projection | | | 2026–27
Projection | |
Tonnages—crown export2 coal (Mt) | | | 185 | | | | 188 | | | | 199 | | | | 219 | | | | 230 | | | | 238 | |
Exchange rate US$ per A$3 | | | 0.72 | | | | 0.68 | | | | 0.73 | | | | 0.75 | | | | 0.75 | | | | 0.75 | |
Year average coal prices (US$ per tonne)4,5 | | | | | | | | | | | | | | | | | |
Hard coking | | | 392 | | | | 281 | | | | 185 | | | | 175 | | | | 175 | | | | 175 | |
PCI/Semi-soft | | | 310 | | | | 265 | | | | 158 | | | | 149 | | | | 149 | | | | 149 | |
Thermal | | | 244 | | | | 310 | | | | 153 | | | | 120 | | | | 120 | | | | 120 | |
Year average oil price | | | | | | | | | | | | | | | | | | | | | | | | |
Brent (US$ per barrel)6 | | | 77 | | | | 102 | | | | 81 | | | | 79 | | | | 76 | | | | 75 | |
Notes:
| 1. | Numbers in this table may be affected by rounding. |
| 2. | Excludes coal produced for domestic consumption and where royalties are not paid to the government (private royalties). The 2023–24 estimated domestic coal volume is approximately 25.5 Mt and private coal is 4.1 Mt. |
| 3. | Estimated year-average. |
| 4. | Estimated year-average spot prices for highest quality coking and thermal coal. Lower quality coal can be sold below this price, with indicative average prices for 2023–24 as follows: hard coking US$170/t and thermal US$122/t. |
| 5. | In previous budget papers, year-average contract price assumptions were published. However, spot prices are now considered to better reflect expected price movements in the dynamic global coal market. As such, spot prices are outlined in this Budget and will be presented in future budget papers. |
| 6. | Published Brent oil prices are lagged by 4 months to better align with royalty revenue. |
Exchange rate and commodity prices and volumes
Estimates of mining royalties are sensitive to movements in the A$-US$ exchange rate and commodity prices and volumes.
Since mid-2021, there has been an unprecedented surge in coal prices. While prices have since moderated from these exceptionally high levels, they remain elevated compared to historical levels.
The recent strength in prices is primarily driven by a range of short-term supply side factors and disruptions. As such, prices are expected to return to more sustainable levels across the forward estimates. However, the timing and extent of the decline remains uncertain.
Coal royalties are based on progressive rates with higher royalty rates applying to higher coal prices. This means coal royalty estimates are even more sensitive to price movements at times when prices are very high, therefore providing increased returns to Queenslanders from royalties on this valuable and limited resource during times when coal producers are also benefitting from the high prices in terms of increased revenues and profits.
241
Budget Strategy and Outlook 2023-24
Contracts for the supply of commodities are generally written in US dollars. Accordingly, a change in the exchange rate impacts on the Australian dollar price of commodities and, therefore, expected royalty collections.
Potential impact on coal royalty revenue1
For each one cent movement in the A$-US$ exchange rate in 2023–24, the impact on royalty revenue would be approximately $136 million.
A one per cent variation in export coking and thermal coal volumes would lead to a change in royalty revenue of approximately $47 million. A one million tonne variation would lead to a change in royalty revenue of approximately $24 million.
A one per cent variation in the average price of export coal would lead to a change in royalty revenue of approximately $98 million.
Parameters influencing Australian Government GST payments to Queensland
The 2023–24 Queensland Budget incorporates estimates of GST revenue grants to Queensland based on 2023–24 Federal Budget estimates of national GST collections and Queensland Treasury assumptions of Queensland’s share. The estimates of collections are primarily determined by the value of national consumption subject to GST.
Since the Australian Government payments are based on the amount actually collected, it is the Queensland Budget that bears the risks of fluctuations in GST collections. As with all other tax estimates, there is a risk of lower collections than estimated if national economic growth and consumption are weaker than expected.
Due to the complexities associated with the GST base, the information provided in the Federal Budget papers is insufficient to prepare indicative estimates of the sensitivity of GST forecasts to key variables.
Sensitivity of expenditure estimates and expenditure risks
Public sector wage costs
Salaries and wages form a large proportion of General Government Sector operating expenses. Increases in salaries and wages are negotiated through enterprise bargaining agreements.
The 2023–24 Budget and forward estimates reflect growth in full-time equivalent and wage increases consistent with existing agreements, the government’s wages policy, and an allowance for future bargaining agreements. A one percentage point increase in wage rates above expectation would increase employee expenses by around $322 million per annum.
| 1 | Sensitivities represent the estimated change to royalty revenue accruing over the 2023–24 return period. |
242
Budget Strategy and Outlook 2023-24
Interest rates
The General Government Sector has a total debt servicing cost forecast at $1.974 billion in 2023–24. The current average duration of General Government Sector borrowing with the Queensland Treasury Corporation (QTC) is 6 years.
The majority of General Government Sector debt is held under fixed interest rates and, therefore, the impact of interest rate variations on debt servicing costs in 2023–24 would be relatively modest, with the impact occurring progressively across the forward estimates.
Actuarial estimates of superannuation and long service leave
Liabilities for superannuation and long service leave are estimated by the State Actuary with reference to, among other things, assumed rates of investment returns, salary growth, inflation and the discount rate. These liabilities are therefore subject to changes in these parameters. Similarly, the long service leave liabilities are subject to the risk that the actual rates of employee retention will vary from those assumed in the liability calculation.
243
Budget Strategy and Outlook 2023-24
Appendix D: Fiscal aggregates and indicators
| | | | | | | | | | | | | | | | | | | | | | | | | | | | | | | | | | | | | | | | | | | | | | | | |
| | | 2015–16
Actual1
$ million | | | 2016–17
Actual1
$ million | | | 2017–18
Actual1
$ million | | | 2018–19
Actual1
$ million | | | 2019–20
Actual1
$ million | | | 2020–21
Actual1
$ million | | | 2021–22
Actual1
$ million | | | 2022–23
Est. Act.
$ million | | | 2023–24
Projection
$ million | | | 2024–25
Projection
$ million | | | 2025–26
Projection
$ million | | | 2026–27
Projection
$ million | |
General Government | | | | | | | | | | | | | | | | | | | | | | | | | | | | | | | | | | | | | | | | | | | | | | | | |
Total revenue | | | 50,780 | | | | 56,194 | | | | 58,087 | | | | 59,828 | | | | 57,778 | | | | 62,791 | | | | 74,185 | | | | 87,623 | | | | 82,079 | | | | 82,102 | | | | 82,858 | | | | 85,591 | |
Tax revenue | | | 12,547 | | | | 12,919 | | | | 13,244 | | | | 14,165 | | | | 14,585 | | | | 16,249 | | | | 20,011 | | | | 20,563 | | | | 21,938 | | | | 23,125 | | | | 24,285 | | | | 25,387 | |
Total expenses | | | 50,112 | | | | 53,369 | | | | 56,337 | | | | 58,843 | | | | 63,505 | | | | 63,706 | | | | 69,889 | | | | 75,317 | | | | 84,261 | | | | 81,967 | | | | 82,653 | | | | 85,214 | |
Employee expenses | | | 20,045 | | | | 21,258 | | | | 22,681 | | | | 24,019 | | | | 25,662 | | | | 26,385 | | | | 28,068 | | | | 30,279 | | | | 32,175 | | | | 32,825 | | | | 33,864 | | | | 34,930 | |
Net operating balance | | | 668 | | | | 2,825 | | | | 1,750 | | | | 985 | | | | (5,728 | ) | | | (915 | ) | | | 4,296 | | | | 12,305 | | | | (2,182 | ) | | | 135 | | | | 206 | | | | 377 | |
Capital purchases | | | 4,044 | | | | 4,620 | | | | 5,126 | | | | 5,764 | | | | 6,306 | | | | 6,682 | | | | 7,889 | | | | 9,194 | | | | 9,347 | | | | 11,473 | | | | 11,417 | | | | 11,389 | |
Net capital purchases | | | 1,163 | | | | 2,265 | | | | 2,337 | | | | 3,192 | | | | 3,436 | | | | 3,942 | | | | 4,367 | | | | 5,520 | | | | 4,534 | | | | 7,400 | | | | 6,183 | | | | 5,678 | |
Fiscal balance | | | (495 | ) | | | 560 | | | | (587 | ) | | | (2,207 | ) | | | (9,164 | ) | | | (4,857 | ) | | | (71 | ) | | | 6,786 | | | | (6,716 | ) | | | (7,265 | ) | | | (5,977 | ) | | | (5,301 | ) |
Borrowing with QTC | | | 34,200 | | | | 31,358 | | | | 29,256 | | | | 29,468 | | | | 37,570 | | | | 46,153 | | | | 49,000 | | | | 47,014 | | | | 57,494 | | | | 67,872 | | | | 78,104 | | | | 88,154 | |
Leases and similar arrangements2 | | | 1,286 | | | | 1,882 | | | | 2,142 | | | | 2,612 | | | | 6,485 | | | | 7,703 | | | | 7,671 | | | | 7,586 | | | | 7,892 | | | | 8,074 | | | | 6,929 | | | | 6,567 | |
Securities and Derivatives | | | (0 | ) | | | (0 | ) | | | 122 | | | | 121 | | | | 198 | | | | 220 | | | | 93 | | | | 93 | | | | 93 | | | | 93 | | | | 93 | | | | 93 | |
Net debt | | | 654 | | | | (355 | ) | | | (509 | ) | | | (198 | ) | | | 14,036 | | | | 11,344 | | | | 10,997 | | | | 5,852 | | | | 16,190 | | | | 28,074 | | | | 37,648 | | | | 46,934 | |
| | | | | | | | | | | | |
Non-financial Public Sector | | | | | | | | | | | | | | | | | | | | | | | | | | | | | | | | | | | | | | | | | | | | | | | | |
Total revenue | | | 57,393 | | | | 64,855 | | | | 66,164 | | | | 68,329 | | | | 66,171 | | | | 71,318 | | | | 85,485 | | | | 98,403 | | | | 91,924 | | | | 91,660 | | | | 93,420 | | | | 97,796 | |
Capital purchases | | | 6,852 | | | | 7,291 | | | | 7,643 | | | | 8,460 | | | | 9,482 | | | | 9,877 | | | | 11,140 | | | | 13,601 | | | | 15,231 | | | | 20,135 | | | | 19,973 | | | | 21,566 | |
Borrowing with QTC | | | 71,160 | | | | 69,107 | | | | 66,964 | | | | 67,576 | | | | 76,464 | | | | 85,901 | | | | 90,851 | | | | 90,088 | | | | 100,457 | | | | 112,803 | | | | 125,847 | | | | 139,556 | |
Leases and similar arrangements2 | | | 1,316 | | | | 1,882 | | | | 2,142 | | | | 2,612 | | | | 6,977 | | | | 8,157 | | | | 8,028 | | | | 7,941 | | | | 8,545 | | | | 8,668 | | | | 7,456 | | | | 7,027 | |
Securities and Derivatives | | | 446 | | | | 895 | | | | 405 | | | | 720 | | | | 1,503 | | | | 1,570 | | | | 17,374 | | | | 4,533 | | | | 1,636 | | | | 681 | | | | 481 | | | | 432 | |
Notes:
| 1. | With the implementation of the latest GFS Manual (AGFS15), some categories have been restated to ensure comparability. |
| 2. | Approximately $2.2 billion increase in General Government and $2.6 billion in NFPS in 2019–20 on adoption of the new lease accounting standard AASB 16. |
274
Budget Strategy and Outlook 2023-24
| | | | | | | | | | | | | | | | | | | | | | | | | | | | | | | | | | | | | | | | | | | | | | | | |
| | | 2015–16
Actual1
% | | | 2016–17
Actual1
% | | | 2017–18
Actual1
% | | | 2018–19
Actual1
% | | | 2019–20
Actual1
% | | | 2020–21
Actual1
% | | | 2021–22
Actual1
% | | | 2022–23
Est. Act.
% | | | 2023–24
Projection
% | | | 2024–25
Projection
% | | | 2025–26
Projection
% | | | 2026–27
Projection
% | |
General Government | | | | | | | | | | | | | | | | | | | | | | | | | | | | | | | | | | | | | | | | | | | | | | | | |
Revenue/GSP | | | 16.9 | | | | 17.1 | | | | 16.6 | | | | 16.3 | | | | 16.0 | | | | 17.1 | | | | 16.6 | | | | 18.1 | | | | 17.0 | | | | 16.2 | | | | 15.6 | | | | 15.3 | |
Tax/GSP | | | 4.2 | | | | 3.9 | | | | 3.8 | | | | 3.9 | | | | 4.0 | | | | 4.4 | | | | 4.5 | | | | 4.2 | | | | 4.6 | | | | 4.6 | | | | 4.6 | | | | 4.5 | |
Own source revenue/GSP | | | 9.0 | | | | 8.8 | | | | 8.6 | | | | 8.6 | | | | 8.3 | | | | 8.1 | | | | 8.9 | | | | 10.5 | | | | 8.8 | | | | 8.5 | | | | 8.3 | | | | 8.0 | |
Expenses/GSP | | | 16.6 | | | | 16.3 | | | | 16.1 | | | | 16.1 | | | | 17.6 | | | | 17.3 | | | | 15.6 | | | | 15.6 | | | | 17.5 | | | | 16.2 | | | | 15.5 | | | | 15.2 | |
Employee expenses/GSP | | | 6.7 | | | | 6.5 | | | | 6.5 | | | | 6.6 | | | | 7.1 | | | | 7.2 | | | | 6.3 | | | | 6.3 | | | | 6.7 | | | | 6.5 | | | | 6.4 | | | | 6.2 | |
Net operating balance/GSP | | | 0.2 | | | | 0.9 | | | | 0.5 | | | | 0.3 | | | | (1.6 | ) | | | (0.2 | ) | | | 1.0 | | | | 2.5 | | | | (0.5 | ) | | | 0.0 | | | | 0.0 | | | | 0.1 | |
Capital purchases/GSP | | | 1.3 | | | | 1.4 | | | | 1.5 | | | | 1.6 | | | | 1.7 | | | | 1.8 | | | | 1.8 | | | | 1.9 | | | | 1.9 | | | | 2.3 | | | | 2.1 | | | | 2.0 | |
Net cash inflows from operating activities/Net cash flows from investments in non-financial assets | | | 122.9 | | | | 134.2 | | | | 107.0 | | | | 105.5 | | | | (2.5 | ) | | | 0.7 | | | | 136.9 | | | | 184.9 | | | | 22.7 | | | | 34.6 | | | | 43.5 | | | | 42.3 | |
Fiscal balance/GSP | | | (0.2 | ) | | | 0.2 | | | | (0.2 | ) | | | (0.6 | ) | | | (2.5 | ) | | | (1.3 | ) | | | (0.0 | ) | | | 1.4 | | | | (1.4 | ) | | | (1.4 | ) | | | (1.1 | ) | | | (0.9 | ) |
Total borrowings/GSP | | | 11.8 | | | | 10.1 | | | | 9.0 | | | | 8.8 | | | | 12.3 | | | | 14.7 | | | | 12.7 | | | | 11.3 | | | | 13.6 | | | | 15.0 | | | | 16.0 | | | | 17.0 | |
Total Borrowings/Revenue | | | 69.9 | | | | 59.2 | | | | 54.3 | | | | 53.8 | | | | 76.6 | | | | 86.1 | | | | 76.5 | | | | 62.4 | | | | 79.8 | | | | 92.6 | | | | 102.7 | | | | 110.8 | |
Lease and other liabilities/revenue | | | 2.5 | | | | 3.3 | | | | 3.7 | | | | 4.4 | | | | 11.2 | | | | 12.3 | | | | 10.3 | | | | 8.7 | | | | 9.6 | | | | 9.8 | | | | 8.4 | | | | 7.7 | |
Net debt/revenue | | | 1.3 | | | | (0.6 | ) | | | (0.9 | ) | | | (0.3 | ) | | | 24.3 | | | | 18.1 | | | | 14.8 | | | | 6.7 | | | | 19.7 | | | | 34.2 | | | | 45.4 | | | | 54.8 | |
| | | | | | | | | | | | |
Revenue growth | | | 1.6 | | | | 10.7 | | | | 3.4 | | | | 3.0 | | | | (3.4 | ) | | | 8.7 | | | | 18.1 | | | | 18.1 | | | | (6.3 | ) | | | 0.0 | | | | 0.9 | | | | 3.3 | |
Tax growth | | | (0.4 | ) | | | 3.0 | | | | 2.5 | | | | 7.0 | | | | 3.0 | | | | 11.4 | | | | 23.1 | | | | 2.8 | | | | 6.7 | | | | 5.4 | | | | 5.0 | | | | 4.5 | |
Expenses growth | | | 1.1 | | | | 6.5 | | | | 5.6 | | | | 4.4 | | | | 7.9 | | | | 0.3 | | | | 9.7 | | | | 7.8 | | | | 11.9 | | | | (2.7 | ) | | | 0.8 | | | | 3.1 | |
Employee expenses growth | | | 7.8 | | | | 6.1 | | | | 6.7 | | | | 5.9 | | | | 6.8 | | | | 2.8 | | | | 6.4 | | | | 7.9 | | | | 6.3 | | | | 2.0 | | | | 3.2 | | | | 3.1 | |
| | | | | | | | | | | | |
Non-Financial Public Sector | | | | | | | | | | | | | | | | | | | | | | | | | | | | | | | | | | | | | | | | | | | | | | | | |
Capital purchases/GSP | | | 2.3 | | | | 2.2 | | | | 2.2 | | | | 2.3 | | | | 2.6 | | | | 2.7 | | | | 2.5 | | | | 2.8 | | | | 3.2 | | | | 4.0 | | | | 3.8 | | | | 3.9 | |
Total borrowings/GSP | | | 24.2 | | | | 21.9 | | | | 19.9 | | | | 19.3 | | | | 23.5 | | | | 26.0 | | | | 26.0 | | | | 21.2 | | | | 23.0 | | | | 24.1 | | | | 25.1 | | | | 26.3 | |
Total Borrowings/Revenue | | | 127.1 | | | | 110.8 | | | | 105.1 | | | | 103.8 | | | | 128.4 | | | | 134.1 | | | | 136.0 | | | | 104.2 | | | | 120.4 | | | | 133.3 | | | | 143.2 | | | | 150.3 | |
Net financial liabilities/revenue | | | 127.4 | | | | 111.2 | | | | 111.5 | | | | 114.9 | | | | 158.3 | | | | 142.5 | | | | 118.0 | | | | 95.1 | | | | 112.5 | | | | 127.0 | | | | 136.3 | | | | 141.9 | |
Notes:
| 1. | With the implementation of the latest GFS Manual (AGFS15), some categories have been restated to ensure comparability. GSP figures reflect 2021–22 ABS National Accounts: State Accounts and Queensland Treasury forecasts. |
275
Queensland Budget 2023–24 Budget Strategy and Outlook Budget Paper No.2

Queensland Budget 2023–24
Budget Strategy and Outlook Budget Paper No.2
‘Rich history, thriving future.’ artwork by David Williams of Gilimbaa.
| | |
$89 BILLION OVER 4 YEARS | | |
QUEENSLAND
BUDGET 2023–24
Capital Statement
BUDGET PAPER NO. 3
‘Rich history, thriving future.’ artwork by David Williams of Gilimbaa.

2023–24 Queensland Budget Papers
1. Budget Speech
2. Budget Strategy and Outlook
3. Capital Statement
4. Budget Measures
Service Delivery Statements
Appropriation Bills
Budget Overview
Regional Action Plans
© The State of Queensland (Queensland Treasury) 2023
Copyright
This publication is protected by the Copyright Act 1968
Licence
This document is licensed by the State of Queensland (Queensland Treasury) under a Creative Commons Attribution (CC BY 4.0) International licence.

In essence, you are free to copy, communicate and adapt this publication, as long as you attribute the work to the State of Queensland (Queensland Treasury).
Attribution
Content from this publication should be attributed to:
© The State of Queensland (Queensland Treasury)—2023–24 Queensland Budget
 Translating and interpreting assistance
The Queensland Government is committed to providing accessible services to Queenslanders from all cultural and linguistic backgrounds. If you have difficulty in understanding this publication, you can contact us on telephone (07) 3035 3503 and we will arrange an interpreter to effectively communicate the report to you.
Capital Statement
Budget Paper No. 3
ISSN 1445-4890 (Print)
ISSN 1445-4904 (Online)
Capital Statement 2023–24

State Budget
2023–24
Capital Statement
Budget Paper No. 3
Capital Statement 2023-24
| | | | | | |
Contents | | | | |
| | |
1 | | Approach and highlights | | | 1 | |
| |
| Features | | | 1 | |
| | |
1.1 | | Introduction | | | 3 | |
1.2 | | Queensland’s infrastructure frameworks | | | 4 | |
1.3 | | Key capital projects and programs | | | 6 | |
| | |
2 | | 2023–24 Capital program overview | | | 18 | |
| | |
2.1 | | Introduction | | | 18 | |
2.2 | | Capital purchases | | | 19 | |
2.3 | | Capital grants | | | 23 | |
| | |
3 | | Capital outlays by entity | | | 27 | |
| | |
3.1 | | Agriculture and Fisheries | | | 27 | |
3.2 | | Child Safety, Seniors and Disability Services | | | 30 | |
3.3 | | Education | | | 32 | |
3.4 | | Energy and Public Works | | | 40 | |
3.5 | | Environment and Science | | | 49 | |
3.6 | | Housing | | | 52 | |
3.7 | | Justice and Attorney-General | | | 56 | |
3.8 | | Legislative Assembly of Queensland | | | 58 | |
3.9 | | Premier and Cabinet | | | 59 | |
3.10 | | Queensland Corrective Services | | | 60 | |
3.11 | | Queensland Fire and Emergency Services | | | 62 | |
3.12 | | Queensland Health | | | 66 | |
3.13 | | Queensland Police Service | | | 75 | |
3.14 | | Queensland Treasury | | | 78 | |
3.15 | | Regional Development, Manufacturing and Water | | | 79 | |
3.16 | | Resources | | | 85 | |
Capital Statement 2023-24
| | | | | | |
3.17 | | State Development, Infrastructure, Local Government and Planning | | | 86 | |
3.18 | | Tourism, Innovation and Sport | | | 90 | |
3.19 | | Transport and Main Roads | | | 93 | |
3.20 | | Treaty, Aboriginal and Torres Strait Islander Partnerships, Communities and the Arts | | | 112 | |
3.21 | | Youth Justice, Employment, Small Business and Training | | | 116 | |
| | | | | | |
Appendix A: | | Entities included in capital outlays 2023–24 | | | 118 | |
Appendix B: | | Key concepts and coverage | | | 121 | |
Appendix C: | | Capital purchases by entity by region 2023–24 | | | 122 | |
Capital Statement 2023-24
Features
| • | | The Queensland Government is continuing to deliver the economic and social infrastructure needed to support a growing Queensland through a record 4-year capital program. The Big Build will underpin the long-term, sustainable development of our cities and regions, supporting good jobs, better services and a great lifestyle for Queenslanders. |
| • | | With total capital commitments of $88.729 billion over 4 years, the 2023–24 Queensland Budget again delivers on the Queensland Government’s $50 billion Infrastructure Guarantee. This investment will create generational change, cement Queensland’s role on the world’s stage and provide first-class facilities for Queensland. Over the 12 years to 2026–27, the government will have supported over $184.970 billion in infrastructure works. |
| • | | In 2023–24, the government will invest $20.321 billion in capital, directly supporting around 58,000 jobs. A record $13.308 billion, or 65.5 per cent (up from 63.3 per cent in 2022–23) of this capital program will be invested outside of the Greater Brisbane region, supporting around 38,500 jobs. |
| • | | Capital expenditure on health infrastructure in 2023–24 will total $1.638 billion with a focus on increasing bed capacity across the state. Work is continuing on the government’s $9.785 billion Capacity Expansion Program to deliver around 2,200 additional beds. Seven Satellite Hospitals are also due to open in 2023-24 at Caboolture, Kallangur, Ripley, Eight Mile Plains, Tugun, Bribie Island and Redlands. |
| • | | Capital expenditure by the transport portfolio is budgeted to total $6.946 billion in 2023–24, this includes $829.2 million to continue construction work on Cross River Rail, $420.0 million towards construction on Coomera Connector (Stage 1) and $259.4 million to continue Gold Coast Light Rail (Stage 3). There is also substantial ongoing investment to fund major upgrades to the Bruce Highway, the M1 Pacific Motorway and the rail network through the Logan and Gold Coast Faster Rail project and the Queensland Train Manufacturing Program to build 65 new trains in Maryborough. |
| • | | In 2023–24, the government will invest over $1.5 billion to ensure that facilities in Queensland’s state schools are world-class and continue to meet demand and support contemporary learning requirements. Investment in new schools is being facilitated through the $3 billion Building Future Schools Program. This Budget also includes a $968 million investment over the next decade in a strategic land acquisition fund to secure the land needed for new and expanded schools into the future. |
| • | | The 2023–24 Queensland Budget includes a landmark capital investment of around $19 billion over the forward estimates to deliver on the Queensland Energy and Jobs Plan. The government’s publicly owned energy businesses are leading Queensland’s energy transformation, investing in new wind, solar, storage and transmission. |
1
Capital Statement 2023-24
| | • | | Significant investments through the government’s energy businesses in 2023-24 include $594.0 million for CopperString 2032, $212.6 million for CleanCo renewables projects in Central Queensland and the Swanbank Battery, $673.0 million for Stanwell to develop the Wambo and Tarong West Wind Farms and large-scale batteries, $312.1 million for CS Energy to invest in Central Queensland wind farms and large-scale batteries, and $183.7 million for Queensland Hydro to progress the Borumba Pumped Hydro Energy Storage project. |
| | • | | Through state-owned water businesses, the Queensland Government is delivering additional water supply where it is needed, fortifying the flood resilience of water infrastructure and ensuring the ongoing safety and reliability of dams. Major investments in 2023-24 include $548.5 million for the Fitzroy to Gladstone Pipeline, $156.7 million to complete construction of Rookwood Weir, $24.3 million for the Mount Crosby Flood Resilience Program, $13.4 million to deliver the Toowoomba to Warwick Pipeline, and $24.4 million to complete the South West Pipeline. |
| | • | | During 2023-24, Sunwater, Seqwater and Gladstone Area Water Board will also invest $155.8 million for planning and early works on improvements to Paradise, Burdekin Falls, Somerset, Wivenhoe, North Pine, Lake Macdonald and Awoonga Dams. As part of reinvesting in the regions, $440 million, on top of an existing $100 million commitment, is allocated toward improving and raising Burdekin Falls Dam by 2 metres. |
| | • | | The 2023–24 Queensland Budget is providing an additional $1.1 billion for the delivery and supply of social housing across Queensland through the Housing and Homelessness Action Plan 2021–2025, including to meet higher construction costs and to boost the QuickStarts Queensland program target by 500 homes, bringing it to 3,265 social housing commencements by 30 June 2025. |
| | • | | The government will continue to progress work on 2 new youth detention centres for Queensland. The first of these will be built at the Woodford Correctional Precinct, north west of Brisbane, with the expenditure subject to commercial negotiation with potential providers. The second youth detention centre is proposed to be built in Cairns. |
| | • | | A key element of the government’s capital program is providing grants to local governments and non-government organisations to support their work within communities across Queensland. In total, the government will provide $3.915 billion in capital grants in 2023–24, including $2.487 billion outside of the Greater Brisbane region. This includes more than $1.265 billion to support the Queensland Government program of infrastructure renewal and recovery within disaster-affected communities. |
2
Capital Statement 2023-24
The Capital Statement presents an overview of the Queensland Government’s infrastructure delivery program and proposed capital outlays for 2023–24.
The 2023–24 capital program is a record investment in infrastructure across the state that will sustain and enhance the Queensland lifestyle as the population continues to grow. This includes investment in new and ongoing projects in health, transport, energy, education, water and social and affordable housing.
The government’s Big Build takes a long-term view, with the capital program to deliver an expansion to the health system, decarbonise the State’s energy system, improve water security and prepare for the Brisbane 2032 Olympic and Paralympics Games.
The $20.321 billion of investment outlined in the 2023–24 Capital Statement is estimated to directly support around 58,000 jobs, with 38,500 of these jobs located outside of the Greater Brisbane region.
3
Capital Statement 2023-24
| 1.2 | Queensland’s infrastructure frameworks |
The Queensland Government’s infrastructure frameworks focus on achieving robust capital planning, quality investment decisions and regional economic development.
In 2023–24, the capital program is to be delivered in the midst of a building boom, with heightened competition for materials and labour. The government has made the deliberate decision to meet these higher costs, as well as increase infrastructure investment, to support a growing Queensland.
The government’s infrastructure frameworks and planning processes are critical to prioritise the continued delivery of this infrastructure program, incorporating the latest population projections from the Queensland Government’s Statistician’s Office.
State Infrastructure Strategy
The State Infrastructure Strategy (SIS) sets the statewide priorities for infrastructure, providing a framework for how the Queensland Government will plan and invest in infrastructure over the 20-year period to 2042. These statewide priorities underpin portfolio and regional infrastructure planning. Developed with infrastructure providers and informed by industry and the community, this strategy aligns priorities across agencies while also seeking partnerships with other levels of government and the private sector.
State-significant priorities are profiled across 10 infrastructure classes, such as transport, energy and health, and a cross-government class that features cross-sectorial priorities. These priorities focus on realising infrastructure opportunities and addressing challenges that Queensland will face into the future.
Regional Infrastructure Plans
Queensland is a diverse state and its regions have different priorities. Supporting the SIS, the introduction of 7 Regional Infrastructure Plans (RIPs) recognises the significant role infrastructure plays in catalysing regional economic resilience and recovery, growth and liveability. Drawing on the SIS’s priorities, and complementing statutory regional plans, these plans are being developed in consultation with regional stakeholders (industry, peak bodies and local government) through a place-based approach to help prioritise regionally significant infrastructure needs.
The Queensland Government Infrastructure Pipeline
The Queensland Government Infrastructure Pipeline (QGIP) provides industry with visibility of the government’s infrastructure pipeline, creating confidence and enabling workforce planning. QGIP complements the SIS and RIPs and demonstrates the government’s commitment to delivering Queensland’s infrastructure needs.
4
Capital Statement 2023-24
Infrastructure Proposal Development Policy
The Infrastructure Proposal Development Policy (IPDP) sets the government’s objectives for planning and assessing major infrastructure, including:
| • | | aligning agency infrastructure programs with whole-of-government objectives to maximise outcomes for the state |
| • | | supporting agencies to mature their infrastructure planning and assessment capabilities |
| • | | providing targeted assistance and assurance advice to agencies on major infrastructure proposal development |
| • | | ensuring frameworks and systems are in place and applied to give government confidence in infrastructure investment decisions. |
Project Assessment Framework
The Project Assessment Framework (PAF) is used across the Queensland Government to ensure a common and rigorous approach to assessing projects at critical stages in their development lifecycle.
The PAF is administered by Queensland Treasury and applied by government departments to evaluate proposals for infrastructure projects and proposals for the procurement of goods and services. The PAF may also be used by other government entities when developing and implementing project assessment methodologies.
Business Case Development Framework
The Business Case Development Framework (BCDF) supports the implementation of the PAF by providing agencies with detailed guidance and tools to complete assessment and assurance of infrastructure proposals. The BCDF informs the development of proposals from early assessment stages through to detailed business case stage; it is scalable and can be applied to all infrastructure proposals.
The BCDF ensures that major infrastructure proposals are thoroughly assessed to provide a firm basis for government investment decisions. The BCDF guidance materials and templates are published and maintained by the Department of State Development, Infrastructure, Local Government and Planning.
5
Capital Statement 2023-24
| 1.3 | Key capital projects and programs |
Queensland Health Capacity Expansion Program
As Queensland’s population expands, so does the demand on the health system. In the 2022–23 Budget, the Queensland Government provided a significant capital boost of $9.785 billion over 6 years to deliver around 2,200 additional overnight beds at 15 facilities across the Queensland health system:
| • | | New Queensland Cancer Centre |
| • | | Cairns Hospital expansion |
| • | | Hervey Bay Hospital expansion |
| • | | Ipswich Hospital expansion |
| • | | Logan Hospital expansion |
| • | | Mackay Hospital expansion |
| • | | Princess Alexandra Hospital expansion |
| • | | QEII Hospital expansion |
| • | | Redcliffe Hospital expansion |
| • | | Robina Hospital expansion |
| • | | The Prince Charles Hospital expansion |
| • | | Townsville University Hospital expansion. |
In 2023-24, Queensland Health will continue the delivery of this ambitious program which has now awarded contracts valued at more than $3 billion to deliver hospital expansions in Brisbane, Ipswich, Mackay, Logan, Townsville and Cairns.
Accelerated Infrastructure Delivery Program
Queensland Health is delivering $269.2 million over 2 years to immediately increase bed capacity across Queensland. The Accelerated Infrastructure Delivery Program will commission 289 overnight beds across 7 projects to be delivered over the next 2 years.
Through a lease arrangement, 45 additional sub-acute beds have already been delivered in Cairns under this Program.
Construction contracts have been awarded for 5 of the 6 remaining projects, with works currently underway on these sites, with the final contract to be awarded in the second half of 2023.
6
Capital Statement 2023-24
Satellite Hospitals: Better Care, Closer to Home
The government is providing $376.9 million in funding to deliver Satellite Hospitals at Bribie Island, Caboolture, Eight Mile Plains, Kallangur, Tugun, Ripley and Redlands. Five of the facilities are on track to open in 2023 and the remaining 2 in the first half of 2024.
The Satellite Hospitals Program will assist acute hospitals in South East Queensland to manage demand and free up capacity while continuing to safely manage patients via alternative models of care.
The facilities will provide non-urgent health care services that are more appropriately delivered in the community, closer to home and in a more convenient setting.
Each Satellite Hospital will include a Minor Injury and Illness Clinic that will be open 7 days a week from 8:00 am and will accept patients until 10:00 pm. These clinics will provide walk-in urgent care for common injuries and illnesses, including strains and sprains, broken bones, minor head injuries, infections and rashes, minor eye issues, minor cuts and burns, tooth ache and earache, and fever.
The Satellite Hospitals will also include a range of other services depending on the location, such as renal dialysis, chemotherapy, ante-natal and post-natal services, and day medical treatments, as well as consult and treatment rooms.
Regional, Rural and Remote Health Infrastructure
To ensure Queenslanders receive world-class health care no matter where they live, Queensland Health continues to invest in health infrastructure, capital works and projects across regional, rural and remote Queensland. In 2023-24, Queensland Health will continue to deliver the $943.5 million Building Rural and Remote Health Program to replace ageing infrastructure and to ensure new ways of working and models of care can be delivered right across Queensland over the next 6 years.
A number of projects to replace ageing infrastructure in regional and remote Queensland will commence construction in 2023-24, including:
| • | | Blackwater Multipurpose Health Centre |
| • | | St George Primary and Allied Health Centre |
| • | | Charleville Primary and Allied Health Centre |
| • | | Morven Community Clinic |
| • | | Pormpuraaw Primary Health Care Centre |
| • | | Camooweal Primary Health Care Centre |
| • | | Cow Bay Primary Health Care Centre |
7
Capital Statement 2023-24
Cross River Rail
Cross River Rail is the largest transport project in South East Queensland. It is funded via a capital contribution of $6.349 billion along with financing of $1.499 billion secured through a public private partnership.
This transformative transport project involves a new 10.2 kilometre rail line from Dutton Park to Bowen Hills, 5.9 kilometres of twin tunnels under the Brisbane River and CBD and 4 new high capacity underground stations (at Boggo Road, Woolloongabba, Albert Street and Roma Street).
The Cross River Rail project is being delivered in partnership with the private sector through 2 major infrastructure packages of work: Tunnel, Stations and Development (TSD) with Pulse Consortium through a public private partnership; and Rail, Integration and Systems (RIS) through an alliance model with Unity Alliance.
The project will also support the introduction of a new world-class signalling system, the European Train Control System (ETCS), which will allow trains to run more frequently, efficiently and with improved safety.
Each of Cross River Rail’s high-capacity stations will generate unique opportunities for urban renewal, economic development, inner-city precinct revitalisation and new employment.
Cross River Rail is into its fourth year of major construction, with work underway at 17 worksites across South East Queensland.
Cross River Rail is estimated to support up to 7,700 full-time equivalent jobs and 450 new apprenticeship and traineeship opportunities during construction.
Queensland Transport and Roads Investment Program
The Queensland Transport and Roads Investment Program (QTRIP) is a four-year program released annually outlining current and planned investments in transport infrastructure. QTRIP spans road, rail, bus, cycling and marine infrastructure on freight, commuter and recreational networks. QTRIP includes works for the Department of Transport and Main Roads, Queensland Rail and the Gold Coast Waterways Authority.
The program of works detailed in QTRIP 2023–24 to 2026–27 represents a $32.1 billion1 investment over the 4 years. QTRIP is developed in accordance with funding allocations identified by the Queensland and Australian Governments in their annual budgets, which align to both governments’ policy objectives and agendas. The Australian Government has commenced an independent review of its Infrastructure Investment Program to refocus on nationally significant land transport projects. This may result in changes to funding allocations within QTRIP.
The strategic intent of QTRIP is shaped by state infrastructure planning processes and specific transport strategies and plans developed in accordance with state legislation.
M1 Pacific Motorway Upgrades and Coomera Connector
A safe, efficient and reliable M1 Pacific Motorway plays an important role in driving productivity and competitiveness across South East Queensland. The program of works, jointly funded by the
| 1 | Total QTRIP investment is inclusive of both non-capital and capital components. |
8
Capital Statement 2023-24
Queensland and Australian Governments, is delivering major projects, such as the Varsity Lakes (Exit 85) to Tugun (Exit 95) upgrade, Eight Mile Plains to Daisy Hill upgrade, and the Exit 49 interchange upgrade at Pimpama. The Queensland and Australian Governments have also committed $1 billion towards upgrades between Daisy Hill and the Logan Motorway.
The M1 program of works is complemented by the Australian Government and Queensland Government commitment of $2.163 billion (on a 50:50 basis) to plan and construct Coomera Connector (Stage 1) between Coomera and Nerang. Coomera Connector (Stage 1) will provide an alternative route for the growing communities and commercial hubs of Helensvale and Coomera.
Bruce Highway Upgrades
The Bruce Highway is Queensland’s major north-south freight and commuter corridor, connecting coastal population centres from Brisbane to Cairns over almost 1,700 kilometres. The Queensland Government will continue to work with the Australian Government to deliver the Bruce Highway Upgrade Program, aimed at improving safety, flood resilience and capacity along the length of the highway.
The 2023-24 capital program includes investment towards several key projects on the Bruce Highway, improving safety and access and supporting jobs across the regions, including the following example investments (noting the total budgets):
| • | | $1.0 billion to construct Cooroy to Curra (Section D) |
| • | | $662.5 million to upgrade the Bruce Highway between Caboolture – Bribie Island Road and Steve Irwin Way |
| • | | $336.0 million towards a bypass of Tiaro, to increase the flood immunity, safety and efficiency of the Bruce Highway. |
Gold Coast Light Rail (Stage 3)
The Australian Government ($395.6 million contribution), Queensland Government ($713.3 million contribution) and City of Gold Coast ($110.1 million contribution) are co-funding the project, with a total project cost of $1.219 billion.
Stage 3 of Gold Coast Light Rail will connect to the existing Gold Coast Light Rail network (from Helensvale to Broadbeach South), delivering a 6.7-kilometre extension from Broadbeach South to Burleigh Heads and providing 8 additional stations.
Logan and Gold Coast Faster Rail (Kuraby to Beenleigh) Upgrade
The Australian Government and Queensland Government have committed a total of $2.598 billion (on a 50:50 basis) towards the Logan and Gold Coast Faster Rail (Kuraby to Beenleigh) upgrade.
To support growing population and rail patronage demand between Brisbane, Logan and the Gold Coast, the number of Beenleigh and Gold Coast train services needs to be doubled over the next 20 years. The rail line between Kuraby and Beenleigh is a capacity bottleneck on the rail corridor.
The Queensland Government, together with the Australian Government, is planning to increase the number of tracks between Kuraby and Beenleigh from 2 to 4 tracks, with modernised rail systems, station accessibility upgrades and level crossing removals along this 20 kilometre corridor.
9
Capital Statement 2023-24
By connecting the 2 largest centres in South East Queensland, the Gold Coast rail line will also play a significant role in servicing the travel needs of the Brisbane 2032 Olympic and Paralympic Games.
Queensland Train Manufacturing Program
The Queensland Government’s Queensland Train Manufacturing Program (QTMP) was established to meet the increasing demand for rail transport in South East Queensland over the next 10 years.
The QTMP will build 65 new 6-car passenger trains at a purpose-built manufacturing facility at Torbanlea, in the Maryborough region. As part of the program, a new rail facility will also be constructed at Ormeau, in the Gold Coast region.
The QTMP will support South East Queensland’s population and economic growth, as well as Cross River Rail and the Brisbane 2032 Olympic and Paralympic Games.
Construction of the facilities, trains, and maintenance of the fleet will support Queensland jobs now and into the future. The program brings with it a pipeline of training and development opportunities to Queensland.
The Queensland Government has committed $4.869 billion for the manufacturing phase of the QTMP.
Social and Affordable Housing
The 2023–24 Queensland Budget is providing increased funding of $1.1 billion for the delivery and supply of social housing across Queensland through the Housing and Homelessness Action Plan 2021–2025, including to meet higher construction costs and to boost the QuickStarts Queensland program target by 500 homes, bringing it to 3,265 social housing commencements by 30 June 2025.
Since July 2021, the QuickStarts Queensland program has commenced over 1,500 dwellings.
The 2023–24 total capital program is 67 per cent greater than the 2022–23 housing capital program budget, including capital grants.
At the Queensland Housing Summit in October 2022, the Queensland Government also boosted the Housing Investment Fund (HIF) to $2 billion. Under the expanded HIF, $130 million per annum is available to support an increased target of 5,600 new social and affordable home commencements by 30 June 2027.
To date, over 1,500 homes have been approved for support under the HIF. This includes support for the purchase of up to 335 properties existing under the Federal Government’s soon-to-be closed National Rental Affordability Scheme in Townsville and South-East Queensland by the National Affordable Housing Consortium.
It also includes support for the delivery of a pipeline of up to 1,200 new social and affordable homes through a commercial partnership between community housing provider Brisbane Housing Company and the Queensland Investment Corporation Limited.
Government Employee Housing
In 2023-24, the Queensland Government will invest $118.2 million to deliver secure and fit-for-purpose government employee housing in remote and regional communities, as part of its
10
Capital Statement 2023-24
commitment to attract and retain key frontline staff. This program will include new accommodation for staff delivering critical services, replacement or refurbishment of residences at the end of their useful life to modern design standards, and the upgrade of residences to ensure they remain of an appropriate amenity for government workers in locations across Queensland.
New School Infrastructure
Through the $3 billion Building Future Schools Program, the government is delivering new state schools in high-growth areas across Queensland.
The government has delivered 25 new schools since 2015, and a further 2 new schools will open in 2024.
The Department of Education is planning for the delivery of more new schools and additional classrooms to meet expected enrolment growth into the future. To better support the planning and delivery process, this year’s Budget includes $968 million over 10 years to establish a strategic land acquisition fund, to help secure the land needed for new and expanded schools into the future.
Queensland Energy and Jobs Plan
Over the next 10 to 15 years, Queensland’s energy system will be transformed through the Queensland Energy and Jobs Plan (the Plan) to deliver clean, reliable, and affordable power, create a platform for strong economic growth and continued investment, and support the achievement of the state’s renewable energy and emissions reduction objectives.
Through the energy government owned corporations, the 2023-24 capital program is delivering on the Plan with investments across a range of renewable energy, storage and network projects that will support the decarbonisation of the State’s energy system, including:
| • | | $221.2 million for Stanwell to develop the 252-megawatt Wambo Wind Farm near Dalby, in partnership with global renewables developer, Cubico |
| • | | $208.0 million for CS Energy to invest in Central Queensland wind farms |
| • | | $200.0 million for Stanwell to develop the 500-megawatt Tarong West Wind Farm near Kingaroy – Australia’s largest state-owned wind farm |
| • | | $171.1 million for CleanCo to develop up to 2.3 gigawatts of wind and solar projects in Central Queensland |
| • | | $183.7 million for Queensland Hydro to commence delivery of the 2 gigawatt, 24-hour Borumba Pumped Hydro Energy Storage project |
| • | | $183.2 million for Stanwell for the 150-megawatt Southern Renewable Energy Zone battery near the Tarong Power Station |
| • | | $85.5 million for CS Energy to develop a 200-megawatt battery with 2-hour storage at Powerlink’s Greenbank substation, south of Brisbane |
| • | | $41.5 million for CleanCo to build, own and operate Queensland’s largest grid-scale battery at the Swanbank Power Station – a 250-megawatt battery with 2-hour storage. |
Borumba Pumped Hydro Energy Storage
In 2023-24, the Queensland Government will proceed with the 2 gigawatt, 24-hour Borumba Pumped Hydro Energy Storage project located southwest of Gympie, subject to final approvals by
11
Capital Statement 2023-24
the Queensland and Australian Governments. This project, to be delivered by the Queensland Government-owned Queensland Hydro, is a cornerstone investment of the Queensland Energy and Jobs Plan. It plays a fundamental role in transitioning the Queensland energy sector towards renewables to meet the Queensland Government’s renewable energy targets and net zero emissions by 2050.
The total cost to deliver the Borumba Pumped Hydro Energy Storage project is estimated to be $14.159 billion. The 2023–24 Queensland Budget approved up to $6 billion in equity funding over the project’s construction phase.
In addition to supporting the transition of Queensland’s electricity grid towards renewables, the project will provide benefits to the local economy. During construction, project personnel will peak at over 2,000. Exploratory works are expected to start later in 2023, with main works targeted to commence in 2025.
CopperString 2032
The Queensland Government is investing $5 billion in Copperstring 2032, a 1,100-kilometre transmission line from Townsville to Mount Isa that will connect Queensland’s North West Minerals Province to the national electricity grid. In 2023-24, Powerlink is investing $594.0 million on initial construction works for the project.
This project, to be delivered by Queensland Government-owned Powerlink, will unlock one of Australia’s largest renewable energy zones and potentially more than $500 billion in new critical minerals in North Queensland. It will connect vast renewable wind and solar resources with critical minerals mining and processing that can be used to make batteries and renewables. Copperstring 2032 has the potential to support around 800 direct jobs over its 6-year construction (to 2029), and thousands more in critical minerals mining and renewable energy industries. Early works are expected to start later in 2023, with construction commencing in 2024.
This project will support the Queensland Energy and Jobs Plan and the transition of Queensland to clean, reliable and affordable power.
Building our Regions
The Building our Regions program continues to support local government infrastructure projects in regional and remote Queensland communities. These projects, spanning the breadth and width of the state, provide much needed infrastructure that creates flow-on economic development opportunities, improved liveability and jobs for Queenslanders.
Since December 2015, the program has approved over $417.4 million towards 370 projects across 68 local governments and one town authority, supporting an estimated 3,179 jobs during construction. This has leveraged further financial co-contributions of over $609.2 million from local governments, the Australian Government, and other organisations, with a total capital expenditure value of over $1 billion.
Of this, $348.2 million was approved towards 271 projects under Building our Regions Rounds 1-5. These projects were approved and being delivered by the Department of State Development, Infrastructure, Local Government and Planning.
In 2021–22, a further $70 million was made available under Building our Regions Round 6. This round focuses on improving water supply and sewerage systems in local communities and is being delivered by the Department of Regional Development, Manufacturing and Water. To date,
12
Capital Statement 2023-24
$69.2 million in funding has been approved towards 99 projects, including over $59.4 million towards 55 water and sewerage infrastructure projects and over $9.8 million towards 35 water and sewerage planning projects. These investments leverage almost $70 million in co-contributions resulting in an expected total capital expenditure of over $139 million for the round.
Works for Queensland
The $1 billion Works for Queensland program will continue to support local governments outside South East Queensland by funding job-creating maintenance and minor infrastructure projects relating to assets owned or controlled by local governments.
In 2023–24, $42.8 million will be delivered towards Works for Queensland projects. As at 31 March 2023, local governments estimated more than 22,200 jobs have been supported by the first 4 rounds of the program.
Disaster Resilience Program
As one of the most disaster impacted states in Australia, it is imperative to help local Queensland communities better prepare for future natural disasters. Increasing the resilience of infrastructure and investing in innovative programs to lessen the impacts of natural disasters means that communities can recover more quickly after a natural disaster strikes.
The Queensland Resilience and Risk Reduction Fund, jointly funded with the Australian Government as part of the National Partnership Agreement, will allocate $65.5 million over 5 years to improve safety and disaster resilience across the state. The fund is administered by the Queensland Reconstruction Authority, with $13.1 million to be delivered in 2023–24 to support disaster mitigation projects and build resilience to natural disasters.
The $10.0 million North Queensland Natural Disaster Mitigation Program will allocate $5.0 million in 2023–24 to help local governments in North and Far North Queensland reduce their disaster risk and assist in reducing the growth of insurance costs for residents, businesses and the community.
The Queensland Reconstruction Authority will also continue to administer targeted measures aimed at promoting disaster recovery and resilience including a suite of programs funded through the Australian Government’s Emergency Response Fund, which includes the National Flood Mitigation Infrastructure Program (Round 1 $9.9 million and Round 2 $0.9 million) and $75 million allocated for flood recovery and resilience after the 2022 South East Queensland floods. The Australian Government’s recovery and resilience grants from the 2019 Monsoon Trough Floods and the 2022 South East Queensland floods will also be administered.
Southern Queensland Correctional Precinct (Stage 2)
Construction of the new 1,500 bed facility commenced in early 2021, with construction of the main buildings currently underway. Construction of the prisoner accommodation and administration buildings will continue during 2023–24.
The project will provide significant economic flow on benefits to the Lockyer Valley region, including approximately 450 short-term construction-based employment opportunities, ongoing support of both existing and new industry jobs in the operational phase and potential ongoing supply chain opportunities for local businesses.
13
Capital Statement 2023-24
This new facility will implement a health and rehabilitation operating model, which will help to address complex prisoner needs such as mental health and substance abuse. It will also ease overcrowding across Queensland’s correctional services system and deliver a safer environment for staff, prisoners and the community.
Domestic and Family Violence Courthouse Improvements
As part of the continued response to the Queensland Women’s Safety and Justice Taskforce, Hear her voice – Report one – Addressing coercive control and domestic and family violence in Queensland, the Queensland Government is committed to a range of domestic and family violence (DFV) courthouse capital upgrades to support enhanced delivery of DFV services at selected locations. These capital improvements to existing courthouse infrastructure will make facilities functional, client-centred and trauma-informed, and support the safety of victims of domestic and family violence attending court.
This includes $49.1 million over 4 years from 2022–23 to complete DFV capital upgrades to Mackay, Ipswich, Cairns, Caboolture, Maroochydore, Toowoomba, Rockhampton and Brisbane courthouses, including new DFV courtrooms and safe rooms, reconfigured registry counters, public waiting areas and interview rooms, improved stakeholder facilities, public amenities and security infrastructure, to maximise victim safety.
Construction is on track to commence at 4 of the 8 sites (Toowoomba, Ipswich, Cairns and Caboolture) in 2023-24, and at the remaining 4 sites by late 2024.
Port of Townsville Channel Capacity Upgrade
Delivery of the Townsville Channel Capacity Upgrade (TCCU), which commenced in early 2019, is ongoing with the dredging of the Platypus channel beginning on 15 March 2022. The TCCU, the largest infrastructure project in the port’s history, will widen the shipping channel to allow access for larger vessels and facilitate future trade growth in the region.
The TCCU project is jointly funded by the Queensland and Australian Governments and the Port of Townsville Limited (POTL), and forms part of the Townsville City Deal signed in December 2016. The total project cost of the TCCU project is $251.2 million with the Queensland Government contributing $105 million, the Australian Government committing $75 million and POTL funding the remainder.
The TCCU project will continue to support the local economy and jobs, with more than 1,800 people having worked on the project to date.
Cairns Marine Precinct
Far North Queensland Ports Corporation Limited is progressing the $32 million Cairns Marine Precinct early works, for infrastructure upgrades including the delivery of 2 new wharves at the Port of Cairns.
Further to this investment, the Queensland Government has committed $180 million, subject to approvals, to deliver an expansion of the Cairns Marine Precinct with the development of a Common User Facility. The proposed Common User Facility will include a 5,000 tonne shiplift, 3 hardstand areas, 2 blast and paint sheds and a wet berth to cater for vessels up to 120 metres in length. The Queensland Government is working with the Australian Government, which has committed to a co-contribution of $180 million, bringing total funding to $360 million to progress the project.
14
Capital Statement 2023-24
In addition to the above, the Queensland Government recently announced $27 million for the provision of direct access to the Cairns Marine Precinct – Common User Facility for shipyard operators.
These investments will help diversify the Cairns economy and take advantage of emerging commercial and defence-related opportunities for the precinct as an Australian Navy Regional Maintenance Centre. It will ensure that the Port of Cairns continues to be the leading maintenance, repair and overhaul facility in Northern Australia.
Rookwood Weir
Construction of the $568.9 million Rookwood Weir on the Fitzroy River is nearing completion, with the first water from the weir to be available in early 2024, weather permitting. The project will add up to 86,000 megalitres of medium priority equivalent water supply to Central Queensland. The Queensland and Australian Governments have each funded a total of $183.6 million ($367.2 million), with the remainder funded by Sunwater including $156.7 million in 2023-24. The weir will provide for significant agricultural growth along the Fitzroy River near Rockhampton and enhance the security of urban and industrial water supplies for Gladstone and Capricorn Coast communities.
Burdekin Falls Dam Improvement and Raising Project
As part of reinvesting in the regions, which utilises royalty revenues to fund productivity-enhancing investment, the 2023-24 Queensland Budget allocates $440.0 million toward improving and raising Burdekin Falls Dam by 2 metres. This is on top of the Queensland Government’s existing $100.0 million commitment to this important project. Raising the dam by 2 metres will create an additional 150,000 megalitres of water supply and support long-term economic development in North Queensland. Planning and preconstruction activities will continue during 2023-24 while the Environmental Impact Statement process, which will inform a final investment decision, is underway.
Dam Improvement Program
To ensure state-owned dams continue to operate safely during extreme weather events, Sunwater, Seqwater and Gladstone Area Water Board are delivering significant dam safety investment through their respective Dam Improvement Programs in 2023–24.
The 2023–24 Queensland Budget allocates investments of $155.8 million for dam improvement projects, with work this year focusing on planning activities for Paradise Dam, Burdekin Falls Dam, Somerset Dam, Wivenhoe Dam, Lake Macdonald Dam, North Pine Dam and Awoonga Dam.
This year’s Budget supports the Queensland Government’s continuing commitment to rebuild and improve Paradise Dam, with $116.4 million allocated to planning and pre-construction activities in 2023-24.
The Paradise Dam Improvement project will deliver $1.2 billion of dam safety investment to keep downstream communities safe and support economic growth by increasing water supply by 130,000 megalitres. The project is jointly funded by matching $600.0 million funding contributions from the Queensland and Australian Governments and will support 250 jobs during construction.
15
Capital Statement 2023-24
South West Pipeline
The $95.2 million South West Pipeline project is nearing completion and will be the largest addition to the South East Queensland Water Grid since completion of the Northern Pipeline Interconnector in 2012.
The project involves the construction of a 24-kilometre pipeline connecting Beaudesert to the South East Queensland Water Grid to improve regional water security as well as supporting the Bromelton State Development Area.
Up to 100 jobs have been supported during construction, which is on track to be completed in early 2024, with $24.4 million allocated to the project in 2023–24.
Toowoomba to Warwick Pipeline (formerly the Southern Downs Drought Resilience Package)
The Queensland Government has committed $273.1 million for construction of the Toowoomba to Warwick Pipeline, part of a more than $300 million investment into water security in the Toowoomba and Southern Downs regions. The project will provide a permanent water supply to 3,400 residents in the Toowoomba region and drought contingency supply to 24,000 residents in the Southern Downs region.
Seqwater is delivering the pipeline and is undertaking further site investigations, final design, land acquisitions and approvals, with procurement and construction commencing in 2024–25. The project will support 420 jobs during construction and the targeted 2026–27 completion date will ensure a contingent supply is in place for Warwick before local supplies are put at risk by potential future droughts.
Mount Crosby Flood Resilience Program
The 2023–24 Queensland Budget provides $24.3 million of investment for multiple projects under Seqwater’s Mount Crosby Flood Resilience Program.
This program will deliver a range of major works to improve the flood resilience of critical infrastructure located at Mount Crosby, including the replacement and relocation of the existing East Bank substation, construction of a new 2-lane road bridge adjacent to the Mount Crosby Weir, and electrical upgrades to the East Bank Pump Station.
Enabling works for the new substation were completed in December 2022 and construction on the new $29.5 million road bridge commenced in mid-2022. The East Bank Pump Station upgrade project will commence in 2023–24.
Fitzroy to Gladstone Pipeline
The Fitzroy to Gladstone Pipeline is a 117 kilometre raw water pipeline with capacity to transfer 30 gigalitres of water per annum from the Lower Fitzroy River to Gladstone. The pipeline will provide long term water security to Gladstone’s large industrial base and its urban areas. The pipeline is also expected to meet some early stage water demands of the region’s emerging clean energy industry, including hydrogen.
The Queensland Government has committed $983.0 million towards the project which will also support an estimated 400 jobs during construction. To date, $166.4 million has been expended and budgeted expenditure in 2023-24 is $548.5 million. Gladstone Area Water Board will deliver and operate the pipeline. The pipeline is expected to be completed in early 2026.
16
Capital Statement 2023-24
Brisbane 2032 Olympic and Paralympic Games
The 2023-24 Queensland Budget has provisions for total capital expenditure for Brisbane 2032 Olympic and Paralympic Games (Brisbane 2032) venues infrastructure of $7.1 billion over 10 years. The venues infrastructure program is jointly funded by the Queensland and Australian Governments to support the hosting of Brisbane 2032. The allocation of funding for specific venues projects will be subject to government investment decisions following completion of project assessment activities.
The venues infrastructure program comprises the Brisbane Arena ($2.5 billion), the Gabba Redevelopment ($2.7 billion) and 16 new or upgraded venues under the Minor Venues Program ($1.9 billion).
This year’s Budget also includes $44 million as the Queensland Government’s contribution to the University of Queensland’s proposed Paralympic Centre of Excellence as part of the Brisbane 2032 Legacy Plan. A further $154.7 million is provided over 4 years from 2024–25 for Economic Development Queensland to bring forward delivery of public infrastructure to facilitate the development of services and land for the Brisbane Athlete Village.
17
Capital Statement 2023-24
| 2 | 2023–24 Capital program overview |
In this year’s Budget, the Queensland Government has allocated a total of $20.321 billion in 2023–24 to provide productivity-enhancing economic and essential social infrastructure to meet the needs of a growing Queensland.
This investment will help create jobs, support Queensland businesses and deliver economic stimulus, including in Queensland’s vital regional areas. The 2023–24 capital program is estimated to directly support around 58,000 jobs across the state.
The 2023–24 capital program comprises $16.405 billion of purchases of non-financial assets (PNFA) and acquisitions of non-financial assets under finance leases, and $3.915 billion of capital grants expenses.
Importantly, the 2023–24 capital program demonstrates the government’s commitment to growing the state’s regions, with a record $13.308 billion, or 65.5 per cent (up from 63.3 per cent in 2022–23) of the capital program in 2023–24 to be spent outside of the Greater Brisbane region (Brisbane and Redlands, Logan and Ipswich), supporting an estimated 38,500 jobs across those regions.
The government’s capital program includes a range of critical infrastructure projects in the port, rail, water and energy sectors being delivered through the state’s Public Non-financial Corporations (PNFC) sector (that is, commercial entities of government, including government owned corporations).
Capital purchases by the PNFC sector in 2023–24 total $6.209 billion.
18
Capital Statement 2023-24
The Queensland Government is continuing to provide the essential economic and social infrastructure needed to support economic growth, deliver essential services, and ensure ongoing improvements in the quality of life enjoyed by Queensland’s growing population.
The 2023–24 capital program includes $16.405 billion of PNFA and acquisitions of non-financial assets under finance leases.
Capital purchases in 2023–24, categorised according to purpose, are outlined in Chart 1. Transport continues to account for the largest share of purchases. The significant investment in the Queensland Energy and Jobs Plan has increased the overall share of energy infrastructure to 30 per cent of capital purchases, followed by health, housing, and community services and education and training.
| Chart 1 | Capital purchases by purpose 2023–24 |
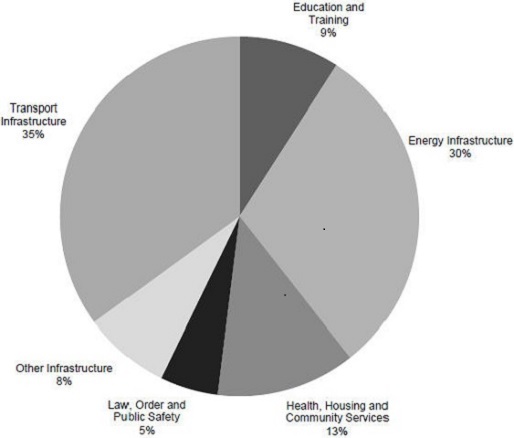
19
Capital Statement 2023-24
Table 1 outlines the capital purchases by Queensland Government entity, including the 2022–23 year (estimated actual) and the Budget for 2023–24. Transport and Main Roads has the largest proportion of total capital purchases.
| Table 1 | Capital purchases by Queensland Government entity1,2,6 |
| | | | | | | | |
Entity | | 2022–23
Est. Actual
$‘000 | | | 2023–24
Budget
$‘000 | |
Agriculture and Fisheries | | | 23,148 | | | | 45,284 | |
Child Safety, Seniors and Disability Services | | | 56,811 | | | | 49,587 | |
Education | | | 1,400,829 | | | | 1,534,355 | |
Energy and Public Works | | | | | | | | |
Energy and Public Works | | | 172,410 | | | | 155,448 | |
Energy Generation Sector | | | 932,482 | | | | 2,252,602 | |
Energy Transmission and Distribution | | | 2,265,234 | | | | 3,212,201 | |
Environment and Science | | | 76,788 | | | | 69,618 | |
Housing | | | 421,174 | | | | 511,148 | |
Justice and Attorney-General | | | 31,729 | | | | 48,858 | |
Legislative Assembly of Queensland | | | 31,413 | | | | 36,880 | |
Premier and Cabinet | | | 377 | | | | 1,337 | |
Queensland Corrective Services | | | 343,936 | | | | 439,599 | |
Queensland Fire and Emergency Services | | | 78,040 | | | | 125,004 | |
Queensland Health | | | 1,523,655 | | | | 1,638,431 | |
Queensland Police Service | | | 177,515 | | | | 337,577 | |
Queensland Treasury | | | 1,942 | | | | 43,950 | |
Regional Development, Manufacturing and Water | | | | | | | | |
Regional Development, Manufacturing and Water | | | 128,107 | | | | 3,500 | |
Water Distribution and Supply | | | 457,992 | | | | 981,435 | |
Resources | | | 12,103 | | | | 10,976 | |
State Development, Infrastructure, Local Government and Planning | | | 150,682 | | | | 125,741 | |
Tourism, Innovation and Sport | | | 55,089 | | | | 69,526 | |
Transport and Main Roads | | | | | | | | |
Transport and Main Roads | | | 5,146,367 | | | | 4,192,450 | |
Port Authorities | | | 234,028 | | | | 236,427 | |
Queensland Rail | | | 806,557 | | | | 1,134,521 | |
Cross River Rail Delivery Authority | | | 1,196,543 | | | | 762,905 | |
Treaty, Aboriginal and Torres Strait Islander Partnerships, Communities and the Arts | | | 7,327 | | | | 111,968 | |
Youth Justice, Employment, Small Business and Training | | | 135,113 | | | | 115,541 | |
Other agencies3 | | | 4,533 | | | | 5,538 | |
Other adjustments4 | | | (454,218 | ) | | | (597,068 | ) |
Anticipated contingency reserve5 | | | (700,000 | ) | | | (1,250,000 | ) |
| | | | | | | | |
Total capital purchases | | | 14,717,706 | | | | 16,405,339 | |
| | | | | | | | |
20
Capital Statement 2023-24
| | | | | | | | |
Total capital purchases breakdown | | 2022–23
Est. Actual
$‘000 | | | 2023–24
Budget
$‘000 | |
Consisting of: | | | | | | | | |
Purchases of non-financial assets per Non-financial Public Sector Cash Flow Statement (BP2 Table 9.9) | | | 13,601,396 | | | | 15,230,921 | |
New leases | | | 1,116,310 | | | | 1,174,418 | |
| | | | | | | | |
Total capital purchases | | | 14,717,706 | | | | 16,405,339 | |
| | | | | | | | |
Notes
| 1. | Includes all associated statutory bodies. |
| 2. | Numbers may not add due to rounding. |
| 3. | Includes other Government entities with non-material capital programs. |
| 4. | Representing inter-agency eliminations, movements in capital payable and receivable, funds held centrally and other accounting adjustments to align with Uniform Presentation Framework Statements. |
| 5. | Contingency recognises that on a whole-of-government basis there is likely to be under spending resulting in a carryover of capital allocations. |
| 6. | The 2022–23 estimated actuals are presented on a pre-machinery-of-government basis. |
21
Capital Statement 2023-24
Table 2 shows capital purchases by Regional Action Plan (RAP) region and statistical area. The government’s commitment to supporting growth in Queensland’s vital regional areas is highlighted by the fact that $10.821 billion (66.0 per cent) of capital purchases in 2023–24 will be spent outside of Greater Brisbane (Brisbane and Redlands, Logan and Ipswich).
| Table 2 | Capital purchases by RAP region and statistical area for 2023–241,2 |
| | | | | | | | | | | | | | |
Regional Action Plan region | | Capital
purchases
$‘000 | | | Statistical
area | | Capital
purchases
$‘000 | |
Brisbane and Redlands | | | 3,508,002 | | | | 301 | | | Brisbane East | | | 337,151 | |
| | | | | | | 302 | | | Brisbane North | | | 405,450 | |
| | | | | | | 303 | | | Brisbane South | | | 552,897 | |
| | | | | | | 304 | | | Brisbane West | | | 213,533 | |
| | | | | | | 305 | | | Inner Brisbane | | | 1,998,972 | |
Ipswich | | | 1,113,659 | | | | 310 | | | Ipswich | | | 1,113,659 | |
Wide Bay | | | 1,628,252 | | | | 319 | | | Wide Bay | | | 1,628,252 | |
Darling Downs | | | 910,634 | | | | 307 | | | Darling Downs Maranoa | | | 614,464 | |
| | | | | | | 317 | | | Toowoomba | | | 296,170 | |
Gold Coast | | | 1,862,000 | | | | 309 | | | Gold Coast | | | 1,862,000 | |
Logan | | | 962,555 | | | | 311 | | | Logan Beaudesert | | | 962,555 | |
Mackay-Whitsunday | | | 525,319 | | | | 312 | | | Mackay | | | 525,319 | |
Outback Queensland3 | | | 402,355 | | | | 315 | | | Outback | | | 672,560 | |
Far North Queensland3 | | | 1,232,219 | | | | 306 | | | Cairns | | | 962,014 | |
Central Queensland | | | 1,816,465 | | | | 308 | | | Central Queensland | | | 1,816,465 | |
Sunshine Coast | | | 727,927 | | | | 316 | | | Sunshine Coast | | | 727,927 | |
Moreton Bay | | | 691,771 | | | | 313 | | | Moreton Bay North | | | 312,761 | |
| | | | | | | 314 | | | Moreton Bay South | | | 379,010 | |
Townsville | | | 1,024,180 | | | | 318 | | | Townsville | | | 1,024,180 | |
| | | | | | | | | | | | | | |
Total capital purchases | | | | | | | | | | | | | 16,405,339 | |
| | | | | | | | | | | | | | |
Notes
| 1. | Numbers may not add due to rounding. |
| 2. | The anticipated capital contingency reserve and other adjustments have been spread across statistical areas proportionate to capital spends |
| 3. | $270,205,000 of capital purchases in Outback statistical area belong to the Far North Queensland RAP region. |
22
Capital Statement 2023-24
The Queensland Government provides capital grants to a range of organisations.
Total capital grants are expected to be $3.915 billion in 2023–24, with Chart 2 below outlining the capital grants to local governments (LG) and non-government organisations (NGOs).
| Chart 2 | Capital grants by purpose and recipient |
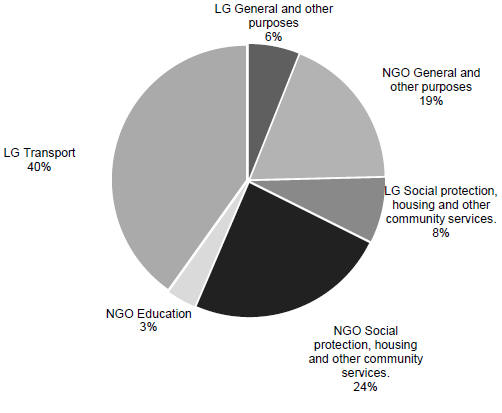
23
Capital Statement 2023-24
Table 3 shows the planned expenditure on capital grants by Queensland Government entity for 2023–24. State Development, Infrastructure, Local Government and Planning has the highest proportion of capital grants.
| Table 3 | Expenditure on capital grants by Queensland Government entity1,2,4 |
| | | | | | | | |
Entity | | 2022–23
Est. Actual
$‘000 | | | 2023–24
Budget
$‘000 | |
Agriculture and Fisheries | | | 800 | | | | 5,100 | |
Child Safety, Seniors and Disability Services | | | 3,110 | | | | — | |
Education | | | 139,037 | | | | 174,205 | |
Energy and Public Works | | | 12,500 | | | | 207,557 | |
Environment and Science | | | 5,058 | | | | 31,240 | |
Housing | | | 153,451 | | | | 239,884 | |
Premier and Cabinet | | | 5,508 | | | | 14,643 | |
Queensland Fire and Emergency Services | | | 2,121 | | | | 11,712 | |
Queensland Police Service | | | — | | | | 25,000 | |
Queensland Treasury | | | 131,825 | | | | 152,001 | |
Regional Development, Manufacturing and Water | | | 82,593 | | | | 103,569 | |
State Development, Infrastructure, Local Government and Planning | | | 1,047,418 | | | | 1,698,884 | |
Tourism, Innovation and Sport | | | 70,218 | | | | 218,929 | |
Transport and Main Roads | | | | | | | | |
Transport and Main Roads | | | 536,082 | | | | 553,078 | |
Cross River Rail Delivery Authority | | | 11,143 | | | | 66,344 | |
Treaty, Aboriginal and Torres Strait Islander Partnerships, Communities and the Arts | | | 1,315 | | | | 2,214 | |
Youth Justice, Employment, Small Business and Training | | | 20,147 | | | | — | |
Other adjustments3 | | | 62,083 | | | | 410,943 | |
| | | | | | | | |
Total capital grants | | | 2,284,409 | | | | 3,915,303 | |
| | | | | | | | |
Notes
| 1. | Includes associated statutory bodies. |
| 2. | Numbers may not add due to rounding. |
| 3. | Includes assets transferred, funds held centrally and other technical accounting adjustments. |
| 4. | The 2022–23 estimated actuals are presented on a pre-machinery-of-government basis. |
24
Capital Statement 2023-24
Table 4 shows expenditure on capital grants by RAP region and statistical area. The government’s commitment to support growth in Queensland’s vital regional areas is highlighted by the fact that $2.487 billion (63.5 per cent) of capital grants in 2023–24 will be spent outside of Greater Brisbane (Brisbane and Redlands, Logan and Ipswich).
| Table 4 | Capital grants by RAP region and statistical area for 2023–241,2 |
| | | | | | | | | | | | | | |
Regional Action Plan region | | Capital
grants
$‘000 | | | Statistical area | | Capital
grants
$‘000 | |
Brisbane and Redlands | | | 817,055 | | | | 301 | | | Brisbane East | | | 243,058 | |
| | | | | | | 302 | | | Brisbane North | | | 90,775 | |
| | | | | | | 303 | | | Brisbane South | | | 105,513 | |
| | | | | | | 304 | | | Brisbane West | | | 56,850 | |
| | | | | | | 305 | | | Inner Brisbane | | | 320,860 | |
Ipswich | | | 147,615 | | | | 310 | | | Ipswich | | | 147,615 | |
Wide Bay | | | 235,764 | | | | 319 | | | Wide Bay | | | 235,764 | |
Darling Downs | | | 153,469 | | | | 307 | | | Darling Downs Maranoa | | | 73,826 | |
| | | | | | | 317 | | | Toowoomba | | | 79,643 | |
Gold Coast | | | 446,429 | | | | 309 | | | Gold Coast | | | 446,429 | |
Logan | | | 463,666 | | | | 311 | | | Logan Beaudesert | | | 463,666 | |
Mackay-Whitsunday | | | 98,102 | | | | 312 | | | Mackay | | | 98,102 | |
Outback Queensland3 | | | 273,470 | | | | 315 | | | Outback | | | 461,660 | |
Far North Queensland3 | | | 472,382 | | | | 306 | | | Cairns | | | 284,192 | |
Central Queensland | | | 186,490 | | | | 308 | | | Central Queensland | | | 186,490 | |
Sunshine Coast | | | 231,786 | | | | 316 | | | Sunshine Coast | | | 231,786 | |
Moreton Bay | | | 233,531 | | | | 313 | | | Moreton Bay North | | | 84,822 | |
| | | | | | | 314 | | | Moreton Bay South | | | 148,709 | |
Townsville | | | 155,544 | | | | 318 | | | Townsville | | | 155,544 | |
| | | | | | | | | | | | | | |
Total capital grants | | | | | | | | | | | | | 3,915,303 | |
| | | | | | | | | | | | | | |
Notes
| 1. | Numbers may not add due to rounding. |
| 2. | The anticipated capital contingency reserve and other adjustments have been spread across statistical areas proportionate to capital spends. |
| 3. | $188,190,000 of capital grants in Outback statistical area belong to the Far North Queensland RAP region. |
Chart 3 shows the distribution of the total 2023–24 capital program (capital purchases and capital grants) across the geographical regions of Queensland, as classified for Budget Paper 3 purposes.
25
Capital Statement 2023-24
Chart 3 Map of 2023–24 capital program by Queensland regions

26
Capital Statement 2023-24
| 3 | Capital outlays by entity |
| 3.1 | AGRICULTURE AND FISHERIES |
Department of Agriculture and Fisheries
Capital purchases and grants for the Department of Agriculture and Fisheries, reporting to the Minister for Agricultural Industry Development and Fisheries and Minister for Rural Communities are $27.3 million for 2023-24. The department’s capital program is focused on developing and upgrading research facilities to deliver outcomes for agriculture, biosecurity, fisheries and forestry.
The department has facilities located throughout rural and regional Queensland. These require continual minor works, mechanical items and plant equipment upgrades to keep them operating effectively.
Program Highlights (Property, Plant and Equipment)
| • | | $4.0 million to continue upgrades to the department’s research and operational facilities through the research facilities development, scientific equipment and minor works programs. |
| • | | $2.1 million to finalise long-term decisions on the future of assets formerly held by the Queensland Agricultural Training Colleges, including a new Central Queensland Smart Cropping Centre at Emerald. |
| • | | $1.7 million for new and replacement heavy plant and equipment including trucks, tractors, irrigators, all-terrain vehicles and other machinery. |
| • | | $1.5 million to upgrade infrastructure and equipment at Gatton Smart Farm. |
| • | | $1.4 million to develop and replace the Brands Information System. |
| • | | $1.4 million to continue to replace vessels and marine equipment for fisheries research and regulatory functions. |
| • | | $1.4 million to upgrade the Wild Dog Barrier Fence. |
| • | | $965,000 to Acquaculture Transformation towards the development of a diverse aquaculture industry at Bribie Island Research Centre. |
| • | | $820,000 to upgrade the fitout at Ecosciences and Health and Food Sciences Precincts. |
| • | | $585,000 to upgrade Longreach office accommodation. |
Program Highlights (Capital Grants)
| • | | $4 million to finalise long-term decisions on the future of assets formerly held by the Queensland Agricultural Training Colleges. |
| • | | $600,000 is provided as a contribution towards the upgrade of adoption facilities at the Young Animal Protection Society in Cairns. |
| • | | $500,000 is provided as a contribution to the Queensland Country Women’s Association to continue minor works upgrades to infrastructure, including community halls. |
Queensland Racing Integrity Commission
Capital purchases for the Queensland Racing Integrity Commission, reporting to the Minister for Education, Minister for Industrial Relations and Minister for Racing are $23.1 million for 2023-24.
Program Highlights (Property, Plant and Equipment)
| • | | Up to $20 million to relocate the Racing Science Centre to make way for the Brisbane 2032 |
27
Capital Statement 2023-24
Olympic and Paralympic Games.
| • | | $2.5 million for upgrades to laboratory equipment to support drug testing services. |
Agriculture and Fisheries
| | | | | | | | | | | | | | | | | | |
Project | | Statistical
Area | | Total
Estimated
Cost
$‘000 | | | Expenditure
to
30-06-23
$‘000 | | | Budget
2023-24
$‘000 | | | Post
2023-24
$‘000 | |
DEPARTMENT OF AGRICULTURE AND FISHERIES | | | | | | | | | | | | | | | | |
Property, Plant and Equipment | | | | | | | | | | | | | | | | | | |
Computer equipment | | Various | | | | | | | | | | | 4,290 | | | | Ongoing | |
Assets formerly held by Queensland Agricultural Training Colleges | | 308 | | | 5,850 | | | | 714 | | | | 2,075 | | | | 3,061 | |
Scientific equipment | | Various | | | | | | | | | | | 1,477 | | | | Ongoing | |
Research facilities development | | Various | | | | | | | | | | | 549 | | | | Ongoing | |
Heavy plant and equipment | | Various | | | | | | | | | | | 1,700 | | | | Ongoing | |
Minor works | | Various | | | | | | | | | | | 1,943 | | | | Ongoing | |
Gatton Smart Farm | | 317 | | | 2,000 | | | | 488 | | | | 1,512 | | | | | |
Brands Information System replacement | | 305 | | | 1,566 | | | | 163 | | | | 1,404 | | | | | |
Vessels and marine equipment | | Various | | | | | | | | | | | 1,406 | | | | Ongoing | |
Wild Dog Barrier Fence | | 307 | | | | | | | | | | | 1,428 | | | | Ongoing | |
Queensland Aquaculture Transformation | | 313 | | | 965 | | | | | | | | 965 | | | | | |
Other property, plant and equipment | | Various | | | | | | | | | | | 969 | | | | Ongoing | |
Longreach office upgrade | | 315 | | | 1,170 | | | | 585 | | | | 585 | | | | | |
Longreach office fire information panel & smoke detectors upgrade | | 315 | | | 306 | | | | 30 | | | | 276 | | | | | |
Fitout of Ecosciences and Health and Food Sciences Precincts | | 303 | | | | | | | | | | | 820 | | | | Ongoing | |
Gatton Research Facility fire hydrant upgrade | | 317 | | | 270 | | | | | | | | 270 | | | | | |
Maroochy Research Facility Spillway upgrade | | 316 | | | 300 | | | | 35 | | | | 265 | | | | | |
Maroochy Research Facility fire hydrant water mains upgrade | | 316 | | | 354 | | | | 100 | | | | 254 | | | | | |
| | | | | | | | | | | | | | | | | | |
Total Property, Plant and Equipment | | | | | | | | | | | | | 22,189 | | | | | |
| | | | | | | | | | | | | | | | | | |
Capital Grants | | | | | | | | | | | | | | | | | | |
Assets formerly held by Queensland Agricultural Training Colleges | | 315 | | | 4,000 | | | | | | | | 4,000 | | | | | |
Young Animal Protection Society upgrade | | 306 | | | 1,000 | | | | 300 | | | | 600 | | | | 100 | |
Queensland Country Women’s Association | | Various | | | 1,000 | | | | 500 | | | | 500 | | | | | |
| | | | | | | | | | | | | | | | | | |
Total Capital Grants | | | | | | | | | | | | | 5,100 | | | | | |
| | | | | | | | | | | | | | | | | | |
QUEENSLAND RACING INTEGRITY COMMISSION | | | | | | | | | | | | | | | | |
Property, Plant and Equipment | | | | | | | | | | | | | | | | | | |
Relocation of the Racing Science Centre | | 305 | | | 20,000 | | | | | | | | 20,000 | | | | | |
28
Capital Statement 2023-24
Agriculture and Fisheries
| | | | | | | | | | | | | | | | | | |
Project | | Statistical
Area | | Total
Estimated
Cost
$‘000 | | | Expenditure
to
30-06-23
$‘000 | | | Budget
2023-24
$‘000 | | | Post
2023-24
$‘000 | |
Racing Science Centre laboratory technology upgrades | | 305 | | | | | | | | | | | 2,545 | | | | Ongoing | |
Other asset replacement | | Various | | | | | | | | | | | 400 | | | | Ongoing | |
Registration and licensing environment | | Various | | | 4,847 | | | | 3,297 | | | | 150 | | | | 1,400 | |
| | | | | | | | | | | | | | | | | | |
Total Property, Plant and Equipment | | | | | | | | | | | | | 23,095 | | | | | |
| | | | | | | | | | | | | | | | | | |
| | |
TOTAL AGRICULTURE AND FISHERIES (PPE) | | | | 45,284 | | | | | |
| | | | | | | | | | | | | | | | | | |
| | |
TOTAL AGRICULTURE AND FISHERIES (CG) | | | | 5,100 | | | | | |
| | | | | | | | | | | | | | | | | | |
29
Capital Statement 2023-24
| 3.2 | CHILD SAFETY, SENIORS AND DISABILITY SERVICES |
Child Safety, Seniors and Disability Services
The total capital outlay for the Department of Child Safety, Seniors and Disability Services is $49.6 million in 2023–24.
These funds provide the infrastructure and systems to support children, young people and families to be safe and to safeguard and promote the inclusion, rights and social participation of seniors, carers and people with disability.
Program highlights (Property, Plant and Equipment)
| • | | $36.0 million in 2023-24 of a total $93.5 million for Unify (Integrated Client Management System (ICMS) Replacement Program). The Unify program will strengthen information sharing and collaboration across Queensland Government, social services and justice sectors by delivering a contemporary case management system that will enable more streamlined processes, support staff and continuing services reforms while engaging with young people, families, carers and services. |
| • | | $6.0 million for Child and Family Services facilities, including fit out and upgrade of Child Safety service centres and office accommodation and upgrades to Residential Care properties. |
| • | | $2.8 million to enhance and develop information systems and programs to provide additional system functionality, information security and contemporary technology to improve service delivery. |
| • | | $1.7 million to advance the provision of infrastructure for clients transitioning from Forensic Disability Services to accommodation within the Wacol Disability Services Precinct. |
| • | | $1.7 million to upgrade Forensic Disability Services accommodation to support people with cognitive disability who require access to specialist forensic support and treatment. |
| • | | $798,000 for capital replacement of information technology infrastructure that is at end of life. |
| • | | $611,000 to continue upgrading, improving and modifying accommodation facilities for Disability Services clients. |
| | | | | | | | | | | | | | | | | | |
| Child Safety, Seniors and Disability Services | | | | | | | | | | | | | | |
Project | | Statistical
Area | | Total
Estimated
Cost
$‘000 | | | Expenditure
to
30-06-23
$‘000 | | | Budget
2023-24
$‘000 | | | Post
2023-24
$‘000 | |
DEPARTMENT OF CHILD SAFETY, SENIORS AND DISABILITY SERVICES | | | | | | | | | | | | | | | | | | |
Property, Plant and Equipment | | | | | | | | | | | | | | | | | | |
Information Systems and Technology | | | | | | | | | | | | | | | | | | |
Unify (Integrated Client Management System replacement) Program | | Various | | | 93,498 | | | | 55,569 | | | | 36,047 | | | | 1,882 | |
Information system enhancements | | Various | | | | | | | | | | | 2,813 | | | | Ongoing | |
30
Capital Statement 2023-24
| | | | | | | | | | | | | | | | | | |
| Child Safety, Seniors and Disability Services | |
Project | | Statistical
Area | | Total
Estimated
Cost
$‘000 | | | Expenditure
to
30-06-23
$‘000 | | | Budget
2023-24
$‘000 | | | Post
2023-24
$‘000 | |
Information technology infrastructure replacement | | Various | | | | | | | | | | | 798 | | | | Ongoing | |
| | | | | | | | | | | | | | | | | | |
Sub-total Information Systems and Technology | | | | | | | | | | | | | 39,658 | | | | | |
| | | | | | | | | | | | | | | | | | |
Child and Family Services facilities | | | | | | | | | | | | | | | | | | |
Child and Family Services facilities | | Various | | | | | | | | | | | 5,950 | | | | Ongoing | |
| | | | | | | | | | | | | | | | | | |
Sub-total Child and Family Services facilities | | | | | | | | | | | | | 5,950 | | | | | |
| | | | | | | | | | | | | | | | | | |
Disability Services | | | | | | | | | | | | | | | | | | |
Forensic Disability Services House 2 rectification and upgrade works | | 310 | | | 1,808 | | | | 115 | | | | 1,693 | | | | | |
Disability Services - Wacol FDS transition accommodation | | 310 | | | 8,650 | | | | 6,975 | | | | 1,675 | | | | | |
Disability Services - General property upgrades | | Various | | | | | | | | | | | 611 | | | | Ongoing | |
| | | | | | | | | | | | | | | | | | |
Sub-total Disability Services | | | | | | | | | | | | | 3,979 | | | | | |
| | | | | | | | | | | | | | | | | | |
Total Property, Plant and Equipment | | | | | | | | | | | | | 49,587 | | | | | |
| | | | | | | | | | | | | | | | | | |
TOTAL CHILD SAFETY, SENIORS AND DISABILITY SERVICES (PPE) | | | | | | | | | | | | | 49,587 | | | | | |
| | | | | | | | | | | | | | | | | | |
31
Capital Statement 2023-24
Total capital purchases for the Education portfolio (including the Department of Education and related entities) are $1.534 billion in 2023-24. Total capital grants for the portfolio are $174.2 million in 2023-24.
Department of Education
The 2023-24 capital purchases of $1.534 billion include the capital works program of $1.451 billion for the construction and refurbishment of school educational facilities and early childhood education and care services. Capital works planning targets government priorities through consideration of population growth and shifts, changes in educational needs and addressing high priority needs for student and staff health and safety.
Program Highlights (Property, Plant and Equipment)
| • | | $421.9 million for the Building Future Schools Program to deliver world-class learning environments for students. |
| • | | $326.3 million for the provision of additional facilities at existing state schools experiencing faster enrolment growth. |
| • | | $221.7 million to replace and enhance facilities at existing schools; including $138 million for critical infrastructure upgrades to create contemporary learning environments as part of the Special School Renewal, Contemporary Specialist Spaces and Discrete Indigenous Community Renewal programs. |
| • | | $202.6 million as part of the School Halls program to boost education infrastructure investment across Queensland. |
| • | | $106.3 million as part of the new strategic land acquisition fund, to acquire land for future new and expanded schools. |
Program Highlights (Capital Grants)
| • | | $126.8 million is provided for the non-state schooling sector and student hostels. |
| • | | $47.4 million is provided for racing infrastructure projects that contribute to the growth and sustainability of the Queensland racing industry. |
| | | | | | | | | | | | | | | | | | |
| Education | |
Project | | Statistical
Area | | Total
Estimated
Cost
$‘000 | | | Expenditure
to
30-06-23
$‘000 | | | Budget
2023-24
$‘000 | | | Post
2023-24
$‘000 | |
DEPARTMENT OF EDUCATION | | | | | | | | | | | | | | | | | | |
Property, Plant and Equipment | | | | | | | | | | | | | | | | | | |
Education Capital Works Program | | | | | | | | | | | | | | | | | | |
New schools¹ | | Various | | | 630,011 | | | | 10,072 | | | | 157,791 | | | | 462,148 | |
New primary school in Bellbird Park | | 310 | | | 73,030 | | | | 20,930 | | | | 49,425 | | | | 2,675 | |
New primary school in Redland Bay | | 301 | | | 63,966 | | | | 30,270 | | | | 20,398 | | | | 13,298 | |
Ayr State High School - New hall facility | | 318 | | | 5,175 | | | | 380 | | | | 4,795 | | | | | |
32
Capital Statement 2023-24
| | | | | | | | | | | | | | | | | | |
| Education | |
Project | | Statistical
Area | | Total
Estimated
Cost
$‘000 | | | Expenditure
to
30-06-23
$‘000 | | | Budget
2023-24
$‘000 | | | Post
2023-24
$‘000 | |
Baringa State Secondary College - New secondary school | | 316 | | | 111,575 | | | | 90,860 | | | | 4,794 | | | | 15,921 | |
Bracken Ridge State High School - Additional classrooms | | 302 | | | 18,003 | | | | 9,757 | | | | 5,486 | | | | 2,760 | |
Bray Park State High School - Additional classrooms | | 314 | | | 16,268 | | | | 245 | | | | 16,023 | | | | | |
Bremer State High School - Additional specialist classrooms | | 310 | | | 6,585 | | | | | | | | 6,585 | | | | | |
Brisbane South State Secondary College - Stage 1 sports fields | | 303 | | | 13,160 | | | | 5,197 | | | | 7,963 | | | | | |
Brisbane South State Secondary College - Stage 2 fit out | | 303 | | | 16,016 | | | | 2,739 | | | | 13,277 | | | | | |
Buderim Mountain State School - New hall facility | | 316 | | | 9,699 | | | | 3,276 | | | | 6,423 | | | | | |
Burnside State High School - New hall facility | | 316 | | | 9,630 | | | | 2,937 | | | | 6,693 | | | | | |
Bwgcolman Community School - Administration upgrades | | 318 | | | 3,150 | | | | 930 | | | | 2,220 | | | | | |
Bwgcolman Community School - New home economics building | | 318 | | | 6,807 | | | | 1,202 | | | | 5,605 | | | | | |
Cairns State High School - Additional specialist classrooms | | 306 | | | 606 | | | | 14 | | | | 592 | | | | | |
Cairns State Special School - Additional classrooms | | 306 | | | 9,140 | | | | 110 | | | | 1,354 | | | | 7,676 | |
Capalaba State College - New hall facility | | 301 | | | 11,537 | | | | 4,614 | | | | 6,923 | | | | | |
Centenary Heights State High School - Additional classrooms | | 317 | | | 9,101 | | | | 4,797 | | | | 4,304 | | | | | |
Claremont Special School - Additional classrooms | | 310 | | | 12,972 | | | | 7,723 | | | | 5,249 | | | | | |
Clifton State High School - Amenities upgrades | | 307 | | | 1,200 | | | | 160 | | | | 1,040 | | | | | |
Clifton State High School - Upgrade existing hall facility | | 307 | | | 2,484 | | | | 1,584 | | | | 900 | | | | | |
Coombabah State High School - Additional classrooms | | 309 | | | 13,119 | | | | 11,419 | | | | 1,700 | | | | | |
Coomera State Special School - New special school | | 309 | | | 47,874 | | | | 30,128 | | | | 17,746 | | | | | |
Corinda State High School - Additional specialist classrooms | | 304 | | | 9,000 | | | | | | | | 375 | | | | 8,625 | |
Darling Point Special School - Additional classrooms | | 301 | | | 22,264 | | | | 5,110 | | | | 12,554 | | | | 4,600 | |
Darra State School - Additional classrooms | | 310 | | | 11,016 | | | | 430 | | | | 10,586 | | | | | |
33
Capital Statement 2023-24
| | | | | | | | | | | | | | | | | | |
| Education | |
Project | | Statistical
Area | | Total
Estimated
Cost
$‘000 | | | Expenditure
to
30-06-23
$‘000 | | | Budget
2023-24
$‘000 | | | Post
2023-24
$‘000 | |
Deception Bay State High School - Additional classrooms | | 313 | | | 7,336 | | | | 1,345 | | | | 5,991 | | | | | |
Deception Bay State School - New hall facility | | 313 | | | 7,405 | | | | 3,504 | | | | 3,901 | | | | | |
Dirranbandi P-10 State School - Additional specialist classrooms | | 307 | | | 606 | | | | 302 | | | | 304 | | | | | |
Emerald State High School - Additional classrooms | | 308 | | | 8,167 | | | | 2,183 | | | | 5,984 | | | | | |
Everleigh State School - New primary school | | 311 | | | 64,484 | | | | 38,801 | | | | 18,492 | | | | 7,191 | |
Ferny Hills State School - Amenities upgrades | | 314 | | | 960 | | | | 160 | | | | 800 | | | | | |
Flagstone State School - Additional classrooms | | 311 | | | 10,065 | | | | 8,102 | | | | 491 | | | | 1,472 | |
Gainsborough State School - New primary school | | 309 | | | 51,990 | | | | 50,313 | | | | 1,677 | | | | | |
Gladstone Central State School - New hall facility | | 308 | | | 5,175 | | | | 3,375 | | | | 1,800 | | | | | |
Gladstone State High School - Additional specialist classrooms | | 308 | | | 9,731 | | | | 1,076 | | | | 8,655 | | | | | |
Glenala State High School - Additional classrooms | | 310 | | | 10,541 | | | | 5,494 | | | | 3,759 | | | | 1,288 | |
Glenala State High School - Upgrade existing hall facility | | 310 | | | 6,153 | | | | 4,192 | | | | 1,961 | | | | | |
Glenala State High School - Upgrade skills development and training facilities | | 310 | | | 2,768 | | | | 1,449 | | | | 1,319 | | | | | |
Glenview State School - Administration upgrades | | 316 | | | 5,012 | | | | 4,170 | | | | 842 | | | | | |
Goodna Special School - Additional classrooms | | 310 | | | 19,937 | | | | 16,345 | | | | 1,200 | | | | 2,392 | |
Goondiwindi State High School - Additional specialist classrooms | | 307 | | | 606 | | | | 237 | | | | 369 | | | | | |
Gordonvale State High School - Additional specialist classrooms | | 306 | | | 566 | | | | | | | | 566 | | | | | |
Highfields State School - Administration upgrades | | 317 | | | 2,700 | | | | 1,800 | | | | 900 | | | | | |
Holland Park State High School - Additional specialist classrooms | | 303 | | | 11,771 | | | | 3,833 | | | | 7,938 | | | | | |
Indooroopilly State School - Administration upgrades | | 304 | | | 3,600 | | | | 134 | | | | 360 | | | | 3,106 | |
Inglewood State School - Additional specialist classrooms | | 307 | | | 606 | | | | 233 | | | | 373 | | | | | |
Inner west Brisbane primary school network upgrades | | Various | | | 19,800 | | | | | | | | 3,960 | | | | 15,840 | |
34
Capital Statement 2023-24
| | | | | | | | | | | | | | | | | | |
| Education | |
Project | | Statistical
Area | | Total
Estimated
Cost
$‘000 | | | Expenditure
to
30-06-23
$‘000 | | | Budget
2023-24
$‘000 | | | Post
2023-24
$‘000 | |
Innisfail State College - Additional specialist classrooms | | 306 | | | 364 | | | | | | | | 364 | | | | | |
Ipswich State High School - Additional classrooms | | 310 | | | 25,848 | | | | 12,108 | | | | 10,095 | | | | 3,645 | |
James Nash State High School - Additional specialist classrooms | | 319 | | | 1,662 | | | | 122 | | | | 1,540 | | | | | |
Kallangur State School - Additional classrooms | | 314 | | | 10,874 | | | | 6,937 | | | | 3,937 | | | | | |
Keebra Park State High School - Additional specialist classrooms | | 309 | | | 8,492 | | | | 161 | | | | 2,497 | | | | 5,834 | |
Kenmore South State School - Additional classrooms | | 304 | | | 23,486 | | | | 1,206 | | | | 13,633 | | | | 8,647 | |
Kenmore State High School - Additional specialist classrooms | | 304 | | | 4,893 | | | | | | | | 4,893 | | | | | |
Kepnock State High School - Additional specialist classrooms | | 319 | | | 6,393 | | | | 381 | | | | 6,012 | | | | | |
Kilcoy State High School - New hall facility | | 313 | | | 4,770 | | | | 3,060 | | | | 1,710 | | | | | |
Kilcoy State School - Amenities upgrades | | 313 | | | 952 | | | | 592 | | | | 360 | | | | | |
Kingston State School - FamilyLinQ - school-based hub | | 311 | | | 13,055 | | | | 6,786 | | | | 6,269 | | | | | |
Kirwan State School - Administration upgrades | | 318 | | | 3,060 | | | | 1,800 | | | | 1,260 | | | | | |
MacGregor State High School - Site renewal | | 303 | | | 4,893 | | | | 3,128 | | | | 1,765 | | | | | |
Malanda State School - Enhance outdoor learning area | | 306 | | | 1,161 | | | | 3 | | | | 1,158 | | | | | |
Manly State School - Additional classrooms | | 301 | | | 9,292 | | | | 442 | | | | 8,850 | | | | | |
Miami State High School - New hall facility | | 309 | | | 10,800 | | | | 6,118 | | | | 4,682 | | | | | |
Millmerran State School - Amenities upgrades | | 307 | | | 1,600 | | | | 320 | | | | 1,280 | | | | | |
Mitchelton Special School - Additional classrooms | | 304 | | | 14,016 | | | | 7,918 | | | | 2,418 | | | | 3,680 | |
Moranbah East State School - Additional classrooms | | 312 | | | 5,704 | | | | 3,036 | | | | 2,668 | | | | | |
Moranbah State High School - Additional classrooms | | 312 | | | 7,436 | | | | 2,260 | | | | 5,176 | | | | | |
Morayfield State High School - Additional classrooms | | 313 | | | 20,818 | | | | 4,495 | | | | 14,759 | | | | 1,564 | |
Nerang State High School - Upgrade existing hall facility | | 309 | | | 4,500 | | | | 902 | | | | 3,598 | | | | | |
Nirimba State Primary School - New primary school | | 316 | | | 41,833 | | | | 41,418 | | | | 415 | | | | | |
35
Capital Statement 2023-24
| | | | | | | | | | | | | | | | | | |
| Education | |
Project | | Statistical
Area | | Total
Estimated
Cost
$‘000 | | | Expenditure
to
30-06-23
$‘000 | | | Budget
2023-24
$‘000 | | | Post
2023-24
$‘000 | |
Noosa District State High School - Pomona Campus - New hall facility | | 316 | | | 10,638 | | | | 919 | | | | 9,719 | | | | | |
North Arm State School - Administration upgrades | | 316 | | | 5,119 | | | | 4,500 | | | | 619 | | | | | |
Northern Peninsula Area College - Bamaga Junior Campus - Administration upgrades | | 315 | | | 1,951 | | | | 888 | | | | 1,063 | | | | | |
Oakey State High School - New hall facility | | 307 | | | 8,151 | | | | 1,647 | | | | 6,504 | | | | | |
Oakleigh State School - New hall facility | | 305 | | | 7,329 | | | | 2,869 | | | | 4,460 | | | | | |
One Mile State School - Amenities upgrades | | 319 | | | 1,600 | | | | | | | | 1,600 | | | | | |
Pallara State School - Additional classrooms | | 303 | | | 14,553 | | | | 1,309 | | | | 13,244 | | | | | |
Palm Beach-Currumbin State High School - New hall facility | | 309 | | | 9,802 | | | | 8,866 | | | | 936 | | | | | |
Palmview State Primary School - New primary school | | 316 | | | 53,639 | | | | 47,684 | | | | 5,955 | | | | | |
Palmview State Secondary College - New secondary school | | 316 | | | 88,157 | | | | 51,582 | | | | 15,056 | | | | 21,519 | |
Palmview State Special School - New special school | | 316 | | | 50,855 | | | | 44,927 | | | | 5,928 | | | | | |
Park Ridge State High School - Additional classrooms | | 311 | | | 11,132 | | | | 10,321 | | | | 811 | | | | | |
Petrie Terrace State School - Renew entry and install walkway covers | | 305 | | | 473 | | | | 172 | | | | 301 | | | | | |
Pimlico State High School - Additional specialist classrooms | | 318 | | | 404 | | | | 15 | | | | 389 | | | | | |
Pimlico State High School - New hall facility | | 318 | | | 15,045 | | | | 3,683 | | | | 11,362 | | | | | |
Pittsworth State High School - Additional specialist classrooms | | 307 | | | 727 | | | | 371 | | | | 356 | | | | | |
Pittsworth State High School - New hall facility | | 307 | | | 7,433 | | | | 2,767 | | | | 4,666 | | | | | |
Proserpine State High School - Additional specialist classrooms | | 312 | | | 606 | | | | | | | | 606 | | | | | |
Proserpine State School - Amenities upgrades | | 312 | | | 400 | | | | | | | | 400 | | | | | |
Redlynch State College - Upgrade hall facility | | 306 | | | 6,255 | | | | 443 | | | | 5,812 | | | | | |
Ripley Central State School - New primary school | | 310 | | | 68,760 | | | | 51,470 | | | | 10,409 | | | | 6,881 | |
Ripley Valley State Secondary College - stage 2 | | 310 | | | 17,578 | | | | 3,995 | | | | 13,583 | | | | | |
Rochedale State High School - New hall facility | | 303 | | | 13,160 | | | | 5,549 | | | | 7,611 | | | | | |
Rochedale State High School - Site renewal | | 303 | | | 1,478 | | | | | | | | 1,478 | | | | | |
36
Capital Statement 2023-24
| | | | | | | | | | | | | | | | | | |
| Education | |
Project | | Statistical
Area | | Total
Estimated
Cost
$‘000 | | | Expenditure
to
30-06-23
$‘000 | | | Budget
2023-24
$‘000 | | | Post
2023-24
$‘000 | |
Rockhampton North Special School - Additional classrooms | | 308 | | | 15,640 | | | | 11,311 | | | | 3,501 | | | | 828 | |
Rockhampton Special School - Additional classrooms | | 308 | | | 8,769 | | | | 686 | | | | 8,083 | | | | | |
Rosewood State High School - Additional classrooms | | 310 | | | 6,440 | | | | 5,165 | | | | 1,275 | | | | | |
Sandgate District State High School - Upgrade existing hall facility | | 302 | | | 15,946 | | | | 369 | | | | 15,577 | | | | | |
Serviceton South State School - Additional classrooms | | 310 | | | 6,992 | | | | 1,735 | | | | 5,257 | | | | | |
Seven Hills State School - New hall facility | | 305 | | | 7,200 | | | | 3,067 | | | | 4,133 | | | | | |
South Rock State School - New primary school | | 311 | | | 62,310 | | | | 54,437 | | | | 5,335 | | | | 2,538 | |
Spinifex State College - Mount Isa - Senior Campus - Amenities upgrades | | 315 | | | 536 | | | | 260 | | | | 276 | | | | | |
Spinifex State College - Mount Isa - Student Residential - security fence | | 315 | | | 558 | | | | | | | | 558 | | | | | |
Spring Mountain State School - Additional classrooms | | 310 | | | 22,758 | | | | 1,049 | | | | 21,709 | | | | | |
Sunnybank State High School - Site renewal | | 303 | | | 2,805 | | | | 821 | | | | 1,984 | | | | | |
Taigum State School - Additional classrooms | | 302 | | | 9,987 | | | | 2,490 | | | | 7,497 | | | | | |
The Hall State School - New hall facility | | 308 | | | 11,370 | | | | 2,349 | | | | 9,021 | | | | | |
Thuringowa State High School - New hall facility | | 318 | | | 5,175 | | | | 4,608 | | | | 567 | | | | | |
Toogoolawah State High School - New hall facility | | 310 | | | 7,722 | | | | 2,883 | | | | 4,839 | | | | | |
Toolooa State High School - Additional classrooms | | 308 | | | 7,176 | | | | 5,621 | | | | 1,555 | | | | | |
Toolooa State High School - New hall facility | | 308 | | | 2,880 | | | | 1,812 | | | | 1,068 | | | | | |
Trinity Bay State High School - Additional specialist classrooms | | 306 | | | 1,454 | | | | 122 | | | | 1,332 | | | | | |
Trinity Bay State High School - New hall facility | | 306 | | | 10,350 | | | | 2,758 | | | | 7,592 | | | | | |
Upper Mount Gravatt State School - Carpark renewal | | 303 | | | 559 | | | | 249 | | | | 310 | | | | | |
Urangan Point State School - New hall facility | | 319 | | | 5,175 | | | | 3,529 | | | | 1,646 | | | | | |
Urangan State High School - New hall facility | | 319 | | | 9,630 | | | | 2,321 | | | | 7,309 | | | | | |
Walloon State School - Additional classrooms | | 310 | | | 4,784 | | | | 4,048 | | | | 736 | | | | | |
37
Capital Statement 2023-24
| | | | | | | | | | | | | | | | | | |
| Education | |
Project | | Statistical
Area | | Total
Estimated
Cost
$‘000 | | | Expenditure
to
30-06-23
$‘000 | | | Budget
2023-24
$‘000 | | | Post
2023-24
$‘000 | |
Warwick State High School - New hall facility | | 307 | | | 8,002 | | | | 2,995 | | | | 5,007 | | | | | |
Western Cape College - Weipa - Additional classrooms | | 315 | | | 10,114 | | | | 644 | | | | 9,470 | | | | | |
Whites Hill State College - Site renewal | | 303 | | | 2,978 | | | | 2,581 | | | | 397 | | | | | |
Wilston State School - New hall facility | | 305 | | | 7,200 | | | | 4,246 | | | | 2,954 | | | | | |
Wishart State School - Additional classrooms | | 303 | | | 10,202 | | | | 1,188 | | | | 9,014 | | | | | |
Woodcrest State College - Additional specialist classrooms | | 310 | | | 1,662 | | | | 122 | | | | 1,540 | | | | | |
Woodford State School - Amenities upgrades | | 313 | | | 1,200 | | | | 160 | | | | 1,040 | | | | | |
Woogaroo Creek State School - New primary school | | 310 | | | 77,096 | | | | 63,394 | | | | 9,193 | | | | 4,509 | |
Wooloowin State School - Additional classrooms | | 305 | | | 11,776 | | | | 7,221 | | | | 4,555 | | | | | |
Woombye State School - Replacement of classroom block | | 316 | | | 1,200 | | | | 800 | | | | 400 | | | | | |
Woree State School - New hall facility | | 306 | | | 6,071 | | | | 758 | | | | 5,313 | | | | | |
Wowan State School - Amenities upgrades | | 308 | | | 645 | | | | | | | | 645 | | | | | |
Yandina State School - Additional classrooms | | 316 | | | 8,363 | | | | 4,903 | | | | 3,460 | | | | | |
Discrete communities renewal | | Various | | | 36,681 | | | | 3,825 | | | | 9,028 | | | | 23,828 | |
General and minor works | | Various | | | | | | | | | | | 220,942 | | | | Ongoing | |
Go for Gold (School sports Infrastructure) | | Various | | | 75,000 | | | | 1,500 | | | | 15,000 | | | | 58,500 | |
Growth program - Additional classrooms | | Various | | | 304,353 | | | | | | | | 52,177 | | | | 252,176 | |
Halls program - Additional learning infrastructure | | Various | | | 186,322 | | | | | | | | 4,860 | | | | 181,462 | |
Land acquisition | | Various | | | | | | | | | | | 174,367 | | | | Ongoing | |
School infrastructure enhancement | | Various | | | | | | | | | | | 25,000 | | | | Ongoing | |
School playground and tuckshop upgrades | | Various | | | 15,000 | | | | | | | | 15,000 | | | | | |
School Subsidy Scheme | | Various | | | | | | | | | | | 9,100 | | | | Ongoing | |
School Upgrade Fund² | | Various | | | 48,387 | | | | 7,979 | | | | 40,408 | | | | | |
Shovel Ready Program - Various minor works | | Various | | | 48,025 | | | | 44,200 | | | | 3,825 | | | | | |
Special school renewal | | Various | | | 102,957 | | | | 6,684 | | | | 46,508 | | | | 49,765 | |
| | | | | | | | | | | | | | | | | | |
Sub-total Education Capital Works Program | | | | | | | | | | | | | 1,445,013 | | | | | |
| | | | | | | | | | | | | | | | | | |
Early Childhood Education and Care Capital Works Program | | | | | | | | | | | | | | | | | | |
General and minor works | | Various | | | | | | | | | | | 5,536 | | | | Ongoing | |
| | | | | | | | | | | | | | | | | | |
Sub-total Early Childhood Education and Care Capital Works Program | | | | | | | | 5,536 | | | | | |
| | | | | | | | | | | | | | | | | | |
38
Capital Statement 2023-24
| | | | | | | | | | | | | | | | | | |
| Education | |
Project | | Statistical
Area | | Total
Estimated
Cost
$‘000 | | | Expenditure
to
30-06-23
$‘000 | | | Budget
2023-24
$‘000 | | | Post
2023-24
$‘000 | |
Plant and Equipment | | | | | | | | | | | | | | | | | | |
Education plant and equipment | | Various | | | | | | | | | | | 80,028 | | | | Ongoing | |
Office of Industrial Relations plant and equipment | | Various | | | | | | | | | | | 3,778 | | | | Ongoing | |
| | | | | | | | | | | | | | | | | | |
Sub-total Plant and Equipment | | | | | | | | | | | | | 83,806 | | | | | |
| | | | | | | | | | | | | | | | | | |
Total Property, Plant and Equipment | | | | | | | | | | | | | 1,534,355 | | | | | |
| | | | | | | | | | | | | | | | | | |
Capital Grants | | | | | | | | | | | | | | | | | | |
Capital grants - Education | | Various | | | | | | | | | | | 126,792 | | | | Ongoing | |
Racing Infrastructure Fund | | Various | | | 179,928 | | | | 82,515 | | | | 47,413 | | | | 50,000 | |
| | | | | | | | | | | | | | | | | | |
Total Capital Grants | | | | | | | | | | | | | 174,205 | | | | | |
| | | | | | | | | | | | | | | | | | |
TOTAL EDUCATION (PPE) | | | | | | | | | | | | | 1,534,355 | | | | | |
| | | | | | | | | | | | | | | | | | |
TOTAL EDUCATION (CG) | | | | | | | | | | | | | 174,205 | | | | | |
| | | | | | | | | | | | | | | | | | |
Notes:
| 1. | Refers to funding allocated for 7 new schools (primary schools in the Park Ridge, Caboolture West, Caloundra South, Ripley, Flagstone and Bahrs Scrub areas, and a secondary school in Collingwood Park). |
| 2. | Australian Government funding received to support capital projects to keep students and staff safe after disruptions due to COVID-19. |
39
Capital Statement 2023-24
| 3.4 | ENERGY AND PUBLIC WORKS |
The Energy and Public Works Portfolio includes the Department of Energy and Public Works, energy government owned corporations, and statutory bodies reporting to the Minister for Energy, Renewables and Hydrogen and Minister for Public Works and Procurement. The portfolio’s capital program for 2023-24 is $5.620 billion. The portfolio’s capital grants for 2023-24 are $207.6 million.
Department of Energy and Public Works
Total capital purchases for the Department of Energy and Public Works are $149.7 million in 2023-24. Total capital grants for the department are $207.6 million in 2023-24.
Program highlights (Property, Plant and Equipment)
| • | | $118.2 million investment to deliver safe and secure government employee housing including in remote and regional communities as part of government’s commitment to attract and retain key frontline staff. This program will include new accommodation for staff delivering critical services, replacement or refurbishment of residences at the end of their useful life to modern design standards and the upgrade of residences to ensure they remain fit-for-purpose and appropriate for employees. |
| • | | $12.5 million to make Zero Emission Vehicle (ZEV) charging infrastructure available in Queensland government buildings. |
Program Highlights (Capital Grants)
| • | | $201.6 million to eligible homeowners to raise, repair or retrofit their homes to incorporate flood resilient design and materials to reduce the impacts of future flood events. |
CleanCo Queensland Limited
Total capital expenditure planned for 2023-24 is $631.9 million. The capital program is focused on building new renewable energy assets and firming the energy portfolio, maintaining existing assets, developing trading and reporting systems and refreshing server infrastructure.
Program Highlights (Property, Plant and Equipment)
| • | | $171.1 million to develop new wind and solar projects in Central Queensland. |
| • | | $41.5 million to build and install battery storage at Swanbank. |
| • | | $29.6 million for the Kogan North Gas Fields development to support fuel security. |
| • | | $16.1 million to maintain existing assets including a major overhaul at Wivenhoe Power Station. |
| • | | $12.9 million to maintain existing assets including preparing for the gas turbine overhaul and undertaking site reconfiguration at Swanbank E Power Station. |
CS Energy Limited
Total capital expenditure planned for 2023-24 is $579.5 million. This reflects CS Energy’s continued commitment to expanding its portfolio in renewable energy and to ongoing reliability and efficiency of generation plant at its power station sites.
40
Capital Statement 2023-24
Program highlights (Property, Plant and Equipment)
| • | | $208.0 million for development of wind farm investments in Central Queensland. |
| • | | $185.9 million for overhauls, enhancements and refurbishments to existing infrastructure at Callide Power Station. |
| • | | $85.5 million for development of the Greenbank Battery. |
| • | | $33.4 million for development of the Brigalow hydrogen ready gas peaking plant. |
| • | | $20.1 million for overhauls, enhancements and refurbishments to existing infrastructure at Kogan Creek Power Station. |
| • | | $18.5 million for development of the Chinchilla Battery. |
| • | | $1.1 million for development of the Kogan Renewable Hydrogen Demonstration Plant. |
Energy Queensland Limited
Total capital expenditure planned for 2023-24 is $2.042 billion and forms part of Energy Queensland’s commitment to providing safe, secure and highly reliable electricity to all Queensland customers. Energy Queensland is focused on safety, efficiency, asset management and network capability. The capital program aims to improve and reinforce electricity supplies across Queensland to meet customer needs, and to support the transformation of Queensland’s energy system to deliver clean, reliable and affordable energy for generations.
Program Highlights (Property, Plant and Equipment)
| • | | $150.0 million to continue the roll-out of local network batteries, projects to decarbonise isolated networks, and support renewable generation across Queensland. |
| • | | $99.9 million for network replacement in the Mackay region. |
| • | | $25.3 million to continue the refurbishment of the Mossman Substation. |
| • | | $14.5 million to continue the refurbishment of the Ergon Energy Cairns operational depot. |
| • | | $13.2 million to replace the Pialba Substation. |
| • | | $10.8 million to continue the replacement of the Kilkivan Substation. |
| • | | $10.4 million to continue the upgrade of the 66 kilovolt Cannonvale to Jubilee Pocket powerline. |
Powerlink Queensland
Total capital expenditure planned for 2023-24 is $1.170 billion. Powerlink Queensland is the high voltage electricity transmission entity for Queensland. Powerlink has a central role in delivering the Queensland Energy and Jobs Plan, including transmission investments in CopperString 2032 and the SuperGrid, along with replacement of aged equipment and assets to ensure supply security.
Program Highlights (Property, Plant and Equipment)
| • | | $594 million on construction works for CopperString 2032, a transmission line from Townsville to Mt Isa that will connect the Queensland North West Minerals Province to the national electricity grid. |
| • | | $193.8 million for non prescribed transmission network connections which includes the Genex Kidston 275 kilowatt transmission connection, Borumba Pumped Hydro Energy Storage project, MacIntyre Windfarm connections and the Calvale - Calliope River 275 kilowatt Transmission Line project. |
41
Capital Statement 2023-24
| • | | $26.0 million for the commencement of construction of the Gladstone Transmission Training Hub. |
| • | | $24.0 million to upgrade infrastructure on the Davies Creek to Bayview Heights Transmission Line to ensure continued reliability of supply to the surrounding area. |
| • | | $5.6 million to replace primary plant at the Ross Substation near Townsville. |
| • | | $5.5 million to replace secondary systems plant at the Nebo Substation near Mackay. |
Queensland Hydro Pty Ltd
Total capital expenditure planned for 2023-24 is $183.7 million. This includes progress of approvals, exploratory works, and procurement for the main works of the Borumba Pumped Hydro Energy Storage project.
Program Highlights (Property, Plant and Equipment)
| • | | $183.7 million for detailed design and exploratory works for the Borumba Pumped Hydro Energy Storage project, which will be capable of producing 2 gigawatts and storing up to 24 hours of energy. |
Stanwell Corporation Limited
Total capital expenditure planned for 2023-24 is $857.5 million. This reflects Stanwell’s commitment to delivering a balanced portfolio for the future, through investment in the reliability and efficiency of its generation plant, along with renewable generation and energy storage.
Program Highlights (Property, Plant and Equipment)
| • | | $221.2 million for the Wambo Wind Farm. |
| • | | $200.0 million for the Tarong West Wind Farm. |
| • | | $183.2 million for the Southern Renewable Energy Zone battery project. |
| • | | $77.2 million to replace and refurbish existing infrastructure at Tarong Power Station to ensure the continued reliability of supply to Queensland and the National Electricity Market. |
| • | | $68.6 million for the Central Renewable Energy Zone battery project. |
| • | | $60.9 million to replace and refurbish existing infrastructure at Stanwell Power Station to ensure the continued reliability of supply to Queensland and the National Electricity Market. |
| | | | | | | | | | | | | | | | | | | | |
| Energy and Public Works | |
Project | | Statistical
Area | | | Total
Estimated
Cost
$‘000 | | | Expenditure
to
30-06-23
$‘000 | | | Budget
2023-24
$‘000 | | | Post
2023-24
$‘000 | |
DEPARTMENT OF ENERGY AND PUBLIC WORKS | | | | | | | | | | | | | | | | | | | | |
Property, Plant and Equipment | | | | | | | | | | | | | | | | | | | | |
Government Employee Housing | | | Various | | | | | | | | | | | | 118,159 | | | | Ongoing | |
Government Buildings ZEV ready | | | Various | | | | 30,000 | | | | 2,000 | | | | 12,500 | | | | 15,500 | |
Office Accommodation Program | | | Various | | | | | | | | | | | | 11,342 | | | | Ongoing | |
42
Capital Statement 2023-24
| | | | | | | | | | | | | | | | | | |
| Energy and Public Works | |
Project | | Statistical
Area | | Total
Estimated
Cost
$‘000 | | | Expenditure
to
30-06-23
$‘000 | | | Budget
2023-24
$‘000 | | | Post
2023-24
$‘000 | |
Regional Infrastructure Upgrades | | Various | | | 16,567 | | | | | | | | 5,852 | | | | 10,715 | |
Other property, plant and equipment | | Various | | | | | | | | | | | 1,358 | | | | Ongoing | |
Building works and capital replacements | | Various | | | | | | | | | | | 500 | | | | Ongoing | |
| | | | | | | | | | | | | | | | | | |
Total Property, Plant and Equipment | | | | | | | | | | | | | 149,711 | | | | | |
| | | | | | | | | | | | | | | | | | |
Capital Grants | | | | | | | | | | | | | | | | | | |
Resilient Homes Fund | | Various | | | 288,377 | | | | 12,500 | | | | 201,557 | | | | 74,320 | |
Queensland Business Energy Saving and Transformation Program (QBEST) | | Various | | | 13,000 | | | | | | | | 6,000 | | | | 7,000 | |
| | | | | | | | | | | | | | | | | | |
Total Capital Grants | | | | | | | | | | | | | 207,557 | | | | | |
| | | | | | | | | | | | | | | | | | |
QBUILD | | | | | | | | | | | | | | | | | | |
Property, Plant and Equipment | | | | | | | | | | | | | | | | | | |
Other property, plant and equipment | | Various | | | 697 | | | | | | | | 697 | | | | | |
Rapid Accommodation and Apprenticeship Centre Cairns | | 306 | | | 2,702 | | | | | | | | 2,702 | | | | | |
Regional Infrastructure Upgrades | | Various | | | 944 | | | | | | | | 944 | | | | | |
| | | | | | | | | | | | | | | | | | |
Total Property, Plant and Equipment | | | | | | | | | | | | | 4,343 | | | | | |
| | | | | | | | | | | | | | | | | | |
QUEENSLAND BUILDING AND CONSTRUCTION COMMISSION | | | | | | | | | | | | | | | | | | |
Property, Plant and Equipment | | | | | | | | | | | | | | | | | | |
Other property, plant and equipment | | Various | | | 1,394 | | | | | | | | 1,394 | | | | | |
| | | | | | | | | | | | | | | | | | |
Total Property, Plant and Equipment | | | | | | | | | | | | | 1,394 | | | | | |
| | | | | | | | | | | | | | | | | | |
CLEANCO QUEENSLAND LIMITED | | | | | | | | | | | | | | | | | | |
Property, Plant and Equipment | | | | | | | | | | | | | | | | | | |
New Renewables and Firming | | | | | | | | | | | | | | | | | | |
Central Queensland renewable projects | | 308 | | | 500,000 | | | | 58,161 | | | | 171,076 | | | | 270,763 | |
Swanbank Battery Storage | | 310 | | | 424,653 | | | | 843 | | | | 41,494 | | | | 382,316 | |
Kaban Wind Farm capacity purchase agreement¹ | | 306 | | | 343,725 | | | | | | | | 343,725 | | | | | |
| | | | | | | | | | | | | | | | | | |
Sub-total New Renewables and Firming | | | | | | | | | | | | | 556,295 | | | | | |
| | | | | | | | | | | | | | | | | | |
Wivenhoe major overhauls | | 310 | | | | | | | | | | | 5,827 | | | | Ongoing | |
Wivenhoe other projects | | 310 | | | | | | | | | | | 10,251 | | | | Ongoing | |
Swanbank E major overhaul | | 310 | | | | | | | | | | | 1,402 | | | | Ongoing | |
Swanbank E other projects | | 310 | | | | | | | | | | | 11,460 | | | | Ongoing | |
Kareeya Hydro other projects | | 306 | | | | | | | | | | | 6,886 | | | | Ongoing | |
Barron Gorge Hydro other projects | | 306 | | | | | | | | | | | 3,282 | | | | Ongoing | |
43
Capital Statement 2023-24
| | | | | | | | | | | | | | | | | | | | |
| Energy and Public Works | |
Project | | Statistical
Area | | | Total
Estimated
Cost
$‘000 | | | Expenditure
to
30-06-23
$‘000 | | | Budget
2023-24
$‘000 | | | Post
2023-24
$‘000 | |
Koombooloomba Dam other projects | | | 306 | | | | | | | | | | | | 659 | | | | Ongoing | |
Other corporate projects | | | 305 | | | | | | | | | | | | 6,284 | | | | Ongoing | |
Kogan North Gas Fields development | | | 307 | | | | | | | | | | | | 29,550 | | | | Ongoing | |
| | | | | | | | | | | | | | | | | | | | |
Total Property, Plant and Equipment | | | | | | | | | | | | | | | 631,896 | | | | | |
| | | | | | | | | | | | | | | | | | | | |
CS ENERGY LIMITED | | | | | | | | | | | | | | | | | | | | |
Property, Plant and Equipment | | | | | | | | | | | | | | | | | | | | |
New Renewables and Firming Wind farm investments in Central Queensland | | | 308 | | | | 1,112,544 | | | | | | | | 208,043 | | | | 904,501 | |
Greenbank Battery | | | 311 | | | | 325,275 | | | | 67,881 | | | | 85,517 | | | | 171,877 | |
Brigalow hydrogen ready gas peaking plant | | | 307 | | | | 189,982 | | | | | | | | 33,427 | | | | 156,555 | |
Chinchilla Battery | | | 307 | | | | 110,745 | | | | 92,248 | | | | 18,497 | | | | | |
| | | | | | | | | | | | | | | | | | | | |
Sub-total New Renewables and Firming | | | | | | | | | | | | | | | 345,484 | | | | | |
| | | | | | | | | | | | | | | | | | | | |
Callide Power Station enhancements, overhauls, refurbishment and rebuild | | | 308 | | | | | | | | | | | | 185,915 | | | | Ongoing | |
Kogan Creek Power Station enhancements, overhauls and refurbishment | | | 307 | | | | | | | | | | | | 20,057 | | | | Ongoing | |
Kogan Creek Mine developments and refurbishment | | | 307 | | | | | | | | | | | | 14,350 | | | | Ongoing | |
Upgrade of corporate information technology systems | | | 305 | | | | | | | | | | | | 12,612 | | | | Ongoing | |
Kogan Renewable Hydrogen Demonstration Plant | | | 307 | | | | 15,000 | | | | 13,875 | | | | 1,125 | | | | | |
| | | | | | | | | | | | | | | | | | | | |
Total Property, Plant and Equipment | | | | | | | | | | | | | | | 579,543 | | | | | |
| | | | | | | | | | | | | | | | | | | | |
ENERGY QUEENSLAND LIMITED | | | | | | | | | | | | | | | | | | | | |
Property, Plant and Equipment | | | | | | | | | | | | | | | | | | | | |
System replacements | | | | | | | | | | | | | | | | | | | | |
Network replacement - Cairns | | | 306 | | | | | | | | | | | | 99,926 | | | | Ongoing | |
Network replacement - Darling Downs | | | 307 | | | | | | | | | | | | 24,981 | | | | Ongoing | |
Network replacement - Central Queensland | | | 308 | | | | | | | | | | | | 24,981 | | | | Ongoing | |
Network replacement - Mackay | | | 312 | | | | | | | | | | | | 99,926 | | | | Ongoing | |
Network replacement - Outback Queensland | | | 315 | | | | | | | | | | | | 99,926 | | | | Ongoing | |
Network replacement - Toowoomba | | | 317 | | | | | | | | | | | | 49,963 | | | | Ongoing | |
Network replacement - Townsville | | | 318 | | | | | | | | | | | | 99,926 | | | | Ongoing | |
Network replacement - Wide Bay - Ergon | | | 319 | | | | | | | | | | | | 49,963 | | | | Ongoing | |
Network replacement - Gold Coast | | | 309 | | | | | | | | | | | | 31,688 | | | | Ongoing | |
44
Capital Statement 2023-24
| | | | | | | | | | | | | | | | | | |
| Energy and Public Works | |
Project | | Statistical
Area | | Total
Estimated
Cost
$‘000 | | | Expenditure
to
30-06-23
$‘000 | | | Budget
2023-24
$‘000 | | | Post
2023-24
$‘000 | |
Network replacement - Brisbane | | 305 | | | | | | | | | | | 119,554 | | | | Ongoing | |
Network replacement - Ipswich | | 310 | | | | | | | | | | | 16,074 | | | | Ongoing | |
Network replacement - Sunshine Coast | | 316 | | | | | | | | | | | 38,854 | | | | Ongoing | |
Network replacement - Wide Bay - Energex | | 319 | | | | | | | | | | | 4,190 | | | | Ongoing | |
Childers - Gayndah - aged line rebuild | | 319 | | | 65,000 | | | | 41,747 | | | | 8,991 | | | | 14,262 | |
Replace 66 kilovolt outdoor switchgear at Garbutt | | 318 | | | 28,771 | | | | 22,535 | | | | 5,477 | | | | 760 | |
Emerald Comet Substation upgrade | | 308 | | | 7,113 | | | | 3,631 | | | | 2,605 | | | | 877 | |
Kilkivan Substation Replacement | | 319 | | | 33,654 | | | | 17,791 | | | | 10,810 | | | | 5,052 | |
Mossman Substation, transmission plant and sections of timber feeder replacement | | 306 | | | 31,618 | | | | 5,407 | | | | 25,304 | | | | 907 | |
East Bundaberg Substation refurbishment | | 319 | | | 11,461 | | | | 3,337 | | | | 5,992 | | | | 2,132 | |
West Toowoomba 11 kilovolt Plant Replacement | | 317 | | | 15,363 | | | | 3,807 | | | | 9,108 | | | | 2,448 | |
Kleinton Substation | | 317 | | | 16,092 | | | | 920 | | | | 1,248 | | | | 13,924 | |
Rockhampton Glenmore Substation refurbishment | | 308 | | | 10,158 | | | | 459 | | | | 573 | | | | 9,126 | |
Replace 33 kilovolt feeder (Kilcoy to Woodford) | | 313 | | | 22,700 | | | | 10,462 | | | | 8,913 | | | | 3,325 | |
Replace 11 kilovolt switchgear Nudgee Substation | | 302 | | | 13,073 | | | | 6,154 | | | | 5,355 | | | | 1,564 | |
Rebuild Maleny Substation | | 316 | | | 13,450 | | | | 1,963 | | | | 4,543 | | | | 6,943 | |
Mount Crosby East Substation | | 310 | | | 22,290 | | | | 1,728 | | | | 9,038 | | | | 11,524 | |
Rebuild Rosewood Substation | | 310 | | | 11,795 | | | | 160 | | | | 1,172 | | | | 10,463 | |
Rebuild Pialba Substation | | 319 | | | 19,758 | | | | 3,255 | | | | 13,220 | | | | 3,283 | |
Barcaldine Asset Refurbishment | | 315 | | | 12,600 | | | | 3,462 | | | | 3,231 | | | | 5,906 | |
System augmentation | | | | | | | | | | | | | | | | | | |
Network augmentation - Cairns | | 306 | | | | | | | | | | | 20,258 | | | | Ongoing | |
Network augmentation - Darling Downs | | 307 | | | | | | | | | | | 5,065 | | | | Ongoing | |
Network augmentation - Central Queensland | | 308 | | | | | | | | | | | 5,065 | | | | Ongoing | |
Network augmentation - Mackay | | 312 | | | | | | | | | | | 20,258 | | | | Ongoing | |
Network augmentation - Outback Queensland | | 315 | | | | | | | | | | | 20,258 | | | | Ongoing | |
Network augmentation - Toowoomba | | 317 | | | | | | | | | | | 10,129 | | | | Ongoing | |
Network augmentation - Townsville | | 318 | | | | | | | | | | | 20,258 | | | | Ongoing | |
Network augmentation - Wide Bay | | 319 | | | | | | | | | | | 10,129 | | | | Ongoing | |
Network augmentation - Brisbane | | 305 | | | | | | | | | | | 52,228 | | | | Ongoing | |
Network augmentation - Sunshine Coast | | 316 | | | | | | | | | | | 20,958 | | | | Ongoing | |
45
Capital Statement 2023-24
| | | | | | | | | | | | | | | | | | |
| Energy and Public Works | |
Project | | Statistical
Area | | Total
Estimated
Cost
$‘000 | | | Expenditure
to
30-06-23
$‘000 | | | Budget
2023-24
$‘000 | | | Post
2023-24
$‘000 | |
Network augmentation - Ipswich | | 310 | | | | | | | | | | | 7,587 | | | | Ongoing | |
Network augmentation - Gold Coast | | 309 | | | | | | | | | | | 18,681 | | | | Ongoing | |
Cannonvale-Jubilee Pocket 66 kilovolt reinforcement | | 312 | | | 30,440 | | | | 20,063 | | | | 10,377 | | | | | |
ICT | | | | | | | | | | | | | | | | | | |
Digital office capital expenditure - Energy Queensland | | Various | | | | | | | | | | | 187,100 | | | | Ongoing | |
Non-regulated | | | | | | | | | | | | | | | | | | |
Ergon Energy Retail information communications and technology | | 305 | | | | | | | | | | | 28,488 | | | | Ongoing | |
Metering dynamics | | 305 | | | | | | | | | | | 44,429 | | | | Ongoing | |
Other isolated systems capital work | | Various | | | | | | | | | | | 51,967 | | | | Ongoing | |
Yurika infrastructure services - build, own, operate and maintain | | Various | | | | | | | | | | | 17,671 | | | | Ongoing | |
Distributed Generation and Storage | | Various | | | | | | | | | | | 149,950 | | | | Ongoing | |
Alternative control services | | | | | | | | | | | | | | | | | | |
Sunshine Coast | | 316 | | | | | | | | | | | 40,696 | | | | Ongoing | |
Ipswich | | 310 | | | | | | | | | | | 17,889 | | | | Ongoing | |
Gold Coast | | 309 | | | | | | | | | | | 7,760 | | | | Ongoing | |
Brisbane | | 305 | | | | | | | | | | | 7,135 | | | | Ongoing | |
Wide Bay | | 319 | | | | | | | | | | | 3,775 | | | | Ongoing | |
Ergon Energy | | Various | | | | | | | | | | | 59,852 | | | | Ongoing | |
Non-system | | | | | | | | | | | | | | | | | | |
Tools and equipment - Energex | | Various | | | | | | | | | | | 5,118 | | | | Ongoing | |
Tools and equipment - Ergon Energy | | Various | | | | | | | | | | | 6,256 | | | | Ongoing | |
Vehicles - Energex | | Various | | | | | | | | | | | 18,893 | | | | Ongoing | |
Vehicles - Ergon Energy | | Various | | | | | | | | | | | 45,607 | | | | Ongoing | |
Property and buildings program - Energex funded | | Various | | | | | | | | | | | 2,130 | | | | Ongoing | |
Property - minor program - Ergon funded | | Various | | | | | | | | | | | 20,447 | | | | Ongoing | |
Ergon Energy Cairns operational depot redevelopment | | 306 | | | 32,195 | | | | 17,670 | | | | 14,525 | | | | | |
Rocklea depot & training facility redevelopment | | 303 | | | 19,500 | | | | | | | | 8,500 | | | | 11,000 | |
System connections | | | | | | | | | | | | | | | | | | |
Gold Coast | | 309 | | | | | | | | | | | 14,957 | | | | Ongoing | |
Sunshine Coast | | 316 | | | | | | | | | | | 23,724 | | | | Ongoing | |
Brisbane | | 305 | | | | | | | | | | | 58,673 | | | | Ongoing | |
46
Capital Statement 2023-24
| | | | | | | | | | | | | | | | | | | | |
| Energy and Public Works | |
Project | | Statistical
Area | | | Total
Estimated
Cost
$‘000 | | | Expenditure
to
30-06-23
$‘000 | | | Budget
2023-24
$‘000 | | | Post
2023-24
$‘000 | |
Ipswich | | | 310 | | | | | | | | | | | | 7,982 | | | | Ongoing | |
Ergon Energy | | | Various | | | | | | | | | | | | 101,903 | | | | Ongoing | |
| | | | | | | | | | | | | | | | | | | | |
Total Property, Plant and Equipment | | | | | | | | | | | | | | | 2,042,207 | | | | | |
| | | | | | | | | | | | | | | | | | | | |
POWERLINK QUEENSLAND | | | | | | | | | | | | | | | | | | | | |
Property, Plant and Equipment | | | | | | | | | | | | | | | | | | | | |
Gladstone South secondary systems replacement | | | 308 | | | | 20,800 | | | | 9,256 | | | | 763 | | | | 10,782 | |
Nebo secondary systems replacement | | | 312 | | | | 36,000 | | | | 29,984 | | | | 5,519 | | | | 497 | |
Total other projects | | | Various | | | | | | | | | | | | 305,242 | | | | Ongoing | |
Calvale and Callide B secondary systems replacement | | | 308 | | | | 21,800 | | | | 19,683 | | | | 1,185 | | | | 932 | |
Bouldercombe primary plant replacement | | | 308 | | | | 40,400 | | | | 34,789 | | | | 2,280 | | | | 3,332 | |
Total non-prescribed transmission network connections | | | Various | | | | | | | | | | | | 193,830 | | | | Ongoing | |
Nebo primary plant replacement | | | 312 | | | | 26,800 | | | | 22,199 | | | | 2,655 | | | | 1,946 | |
Ross 275 kilovolt primary plant replacement | | | 318 | | | | 28,800 | | | | 13,239 | | | | 5,563 | | | | 9,998 | |
Advanced energy management system replacement | | | 302 | | | | 65,500 | | | | 54,486 | | | | 3,933 | | | | 7,081 | |
Lilyvale selected primary plant replacement | | | 308 | | | | 27,900 | | | | 9,743 | | | | 1,439 | | | | 16,718 | |
Lilyvale transformers replacement | | | 308 | | | | 21,500 | | | | 13,148 | | | | 2,285 | | | | 6,067 | |
Dense Wave Division Multiplexing Network replacement | | | Various | | | | 35,000 | | | | 25,775 | | | | 1,272 | | | | 7,954 | |
Davies Creek to Bayview Heights 275 kilovolt refit | | | 306 | | | | 45,000 | | | | 3,494 | | | | 24,030 | | | | 17,476 | |
Gladstone Transmission Training Hub | | | 308 | | | | 52,000 | | | | | | | | 26,000 | | | | 26,000 | |
CopperString 2032 | | | Various | | | | 5,000,000 | | | | | | | | 594,000 | | | | 4,406,000 | |
| | | | | | | | | | | | | | | | | | | | |
Total Property, Plant and Equipment | | | | | | | | | | | | | | | 1,169,994 | | | | | |
| | | | | | | | | | | | | | | | | | | | |
QUEENSLAND HYDRO PTY LTD | | | | | | | | | | | | | | | | | | | | |
Property, Plant and Equipment | | | | | | | | | | | | | | | | | | | | |
Borumba Pumped Hydro Energy Storage² | | | 319 | | | | 14,159,006 | | | | | | | | 183,703 | | | | 13,975,303 | |
| | | | | | | | | | | | | | | | | | | | |
Total Property, Plant and Equipment | | | | | | | | | | | | | | | 183,703 | | | | | |
| | | | | | | | | | | | | | | | | | | | |
STANWELL CORPORATION LIMITED | | | | | | | | | | | | | | | | | | | | |
Property, Plant and Equipment | | | | | | | | | | | | | | | | | | | | |
New Renewables and Firming | | | | | | | | | | | | | | | | | | | | |
Wambo Wind Farm | | | 307 | | | | 374,344 | | | | 81,453 | | | | 221,224 | | | | 71,667 | |
47
Capital Statement 2023-24
| | | | | | | | | | | | | | | | | | |
| Energy and Public Works | |
Project | | Statistical
Area | | Total
Estimated
Cost
$‘000 | | | Expenditure
to
30-06-23
$‘000 | | | Budget
2023-24
$‘000 | | | Post
2023-24
$‘000 | |
Southern Renewable Energy Zone battery storage | | 319 | | | 269,144 | | | | 41,342 | | | | 183,155 | | | | 44,647 | |
Tarong West Wind Farm | | 319 | | | | | | | | | | | 200,000 | | | | Ongoing | |
Central Renewable Energy Zone battery storage | | 308 | | | 216,841 | | | | | | | | 68,600 | | | | 148,241 | |
Service and maintenance for renewable projects | | Various | | | 1,840 | | | | | | | | 1,840 | | | | | |
| | | | | | | | | | | | | | | | | | |
Sub-total New Renewables and Firming | | | | | | | | | | | | | 674,819 | | | | | |
| | | | | | | | | | | | | | | | | | |
Stanwell Power Station - turbine overhauls | | 308 | | | | | | | | | | | 3,915 | | | | Ongoing | |
Other capital projects | | Various | | | | | | | | | | | 13,487 | | | | Ongoing | |
Meandu Mine - development program | | 319 | | | | | | | | | | | 9,996 | | | | Ongoing | |
Meandu Mine - minor works | | 319 | | | | | | | | | | | 19,526 | | | | Ongoing | |
Stanwell Power Station - overhauls | | 308 | | | | | | | | | | | 30,307 | | | | Ongoing | |
ICT - hardware and software upgrades | | 305 | | | | | | | | | | | 1,520 | | | | Ongoing | |
Tarong Power Station - overhauls | | 319 | | | | | | | | | | | 33,248 | | | | Ongoing | |
Tarong Power Station - cooling tower refurbishment | | 319 | | | 7,339 | | | | 2,620 | | | | 4,719 | | | | | |
Stanwell Power Station - generator rotor replacement | | 308 | | | 4,360 | | | | 839 | | | | 3,521 | | | | | |
Stanwell Power Station - other sustaining projects | | 308 | | | | | | | | | | | 23,130 | | | | Ongoing | |
Tarong Power Station - other sustaining projects | | 319 | | | | | | | | | | | 39,273 | | | | Ongoing | |
| | | | | | | | | | | | | | | | | | |
Total Property, Plant and Equipment | | | | | | | | | | | | | 857,460 | | | | | |
| | | | | | | | | | | | | | | | | | |
TOTAL ENERGY AND PUBLIC WORKS (PPE) | | | | | | | | | | | 5,620,251 | | | | | |
| | | | | | | | | | | | | | | | | | |
TOTAL ENERGY AND PUBLIC WORKS (CG) | | | | | | | | | | | 207,557 | | | | | |
| | | | | | | | | | | | | | | | | | |
Notes:
| 1. | Kaban Wind Farm capacity purchase agreement is a right-of-use asset with no cashflow impacts in 2023-24 |
| 2. | Note this estimate excludes financing costs. |
48
Capital Statement 2023-24
| 3.5 | ENVIRONMENT AND SCIENCE |
Department of Environment and Science
In 2023-24, the Department of Environment and Science has a capital program of $100.9 million. This includes $69.6 million in capital purchases and $31.2 million in capital grants. The capital program will focus on the department’s core purpose of partnering to manage, protect and restore Queensland’s natural environment and heritage. This is achieved by expanding and conserving protected areas, improving environmental outcomes and providing leading edge scientific services.
Government has previously set aside $250 million over 4 years ($25 million in 2023-24), held centrally, for land acquisitions and capital works to support the Protected Area Strategy 2020-2030.
Program Highlights (Property, Plant and Equipment):
| • | | $5.6 million for high priority land acquisitions for the expansion of the protected area land portfolio. An additional $25 million in centrally held funds will also be spent on land acquisitions during 2023-24. |
| • | | $4.6 million for implementation of the Queensland Waste Management and Resource Recovery Strategy and administration and compliance relating to the Queensland waste disposal levy. |
| • | | $3.8 million towards buildings and park infrastructure to support visitor recreation, management and access of the Quandamooka Country parks and recreation areas jointly managed with Traditional Owners on Minjerribah (North Stradbroke Island) and Mulgumpin (Moreton Island). |
| • | | $3.7 million to provide ecotourism facilities as part of the Ngaro trail on Whitsunday Islands National Park. |
| • | | $2.9 million for the major upgrade of visitor infrastructure at Central Station on K’gari. |
| • | | $2.8 million to deliver the final tranche of the Government Science Platform. |
| • | | $1.6 million for the construction of the Girraween National Park Information Hub. |
| • | | $1.5 million to upgrade and build new nature-based visitor experiences and facilities along the Thorsborne trail on Hinchinbrook Island National Park. |
| • | | $1.4 million for upgrades to visitor facilities at Crater Lakes National Park. |
| • | | $1.4 million to replace the Jindalba Boardwalk in Daintree National Park (Cape York Peninsula Aboriginal Land). |
| • | | $1.2 million to upgrade visitor infrastructure at Springbrook National Park. |
| • | | $1.0 million to upgrade visitor infrastructure at Booloumba Creek in Conondale National Park. |
| • | | $1.0 million to upgrade visitor infrastructure at Bunya Mountains National Park. |
| • | | $1.0 million towards the replacement of major vessels for marine parks management. |
Program Highlights (Capital Grants):
| • | | $30.9 million in capital grants for buildings, infrastructure and equipment to improve waste management and recycling outcomes. |
49
Capital Statement 2023-24
| | | | | | | | | | | | | | | | | | |
| Environment and Science | |
Project | | Statistical
Area | | Total
Estimated
Cost
$‘000 | | | Expenditure
to
30-06-23
$‘000 | | | Budget
2023-24
$‘000 | | | Post
2023-24
$‘000 | |
DEPARTMENT OF ENVIRONMENT AND SCIENCE | | | | | | | | | | | | | | | | |
Property, Plant and Equipment | | | | | | | | | | | | | | | | | | |
Land | | | | | | | | | | | | | | | | | | |
Protected Area Strategy - land acquisitions¹ | | Various | | | 38,150 | | | | 32,570 | | | | 5,580 | | | | | |
| | | | | | | | | | | | | | | | | | |
Sub-total Land | | | | | | | | | | | | | 5,580 | | | | | |
| | | | | | | | | | | | | | | | | | |
Buildings and infrastructure | | | | | | | | | | | | | | | | | | |
Quandamooka Country | | Various | | | 17,063 | | | | | | | | 3,763 | | | | 13,300 | |
Whitsunday Islands National Park - Ngaro trail ecotourism facilities | | 312 | | | 4,900 | | | | 1,200 | | | | 3,700 | | | | | |
K’gari - Central Station area upgrade | | 319 | | | 9,196 | | | | 2,261 | | | | 2,935 | | | | 4,000 | |
Girraween National Park Information Hub | | 307 | | | 7,850 | | | | 150 | | | | 1,600 | | | | 6,100 | |
Hinchinbrook Island National Park - Thorsborne trail and visitor facilities upgrade | | 306 | | | 3,200 | | | | 614 | | | | 1,518 | | | | 1,068 | |
Crater Lakes National Park visitor facilities upgrade | | 306 | | | 6,700 | | | | 150 | | | | 1,400 | | | | 5,150 | |
Daintree National Park (Cape York Peninsula Aboriginal Land) - Jindalba boardwalk redevelopment | | 306 | | | 6,030 | | | | 30 | | | | 1,350 | | | | 4,650 | |
Springbrook National Park visitor facilities upgrade | | 309 | | | 16,410 | | | | 190 | | | | 1,230 | | | | 14,990 | |
Conondale National Park - Booloumba Creek visitor facilities upgrade | | 316 | | | 2,584 | | | | 1,584 | | | | 1,000 | | | | | |
Bunya Mountains National Park visitor facilities upgrade | | 319 | | | 5,450 | | | | 950 | | | | 1,000 | | | | 3,500 | |
Mon Repos Turtle Centre carpark extension | | 319 | | | 865 | | | | | | | | 865 | | | | | |
David Fleay Wildlife Park Nocturnal House | | 309 | | | 1,600 | | | | | | | | 800 | | | | 800 | |
Great Barrier Reef Investment Marine Park reef trails | | Various | | | 2,500 | | | | 1,750 | | | | 750 | | | | | |
Magnetic Island National Park trails network | | 318 | | | 743 | | | | 135 | | | | 608 | | | | | |
Recreation Areas Management | | Various | | | | | | | | | | | 500 | | | | Ongoing | |
Parks and forests - other recreation and visitor facilities | | Various | | | | | | | | | | | 11,707 | | | | Ongoing | |
Parks and forests - other management facilities | | Various | | | | | | | | | | | 7,536 | | | | Ongoing | |
Parks and forests - tracks and trails | | Various | | | | | | | | | | | 2,175 | | | | Ongoing | |
Parks and forests - fences, roads and firelines | | Various | | | | | | | | | | | 1,631 | | | | Ongoing | |
| | | | | | | | | | | | | | | | | | |
Sub-total Buildings and infrastructure | | | | | | | | | | | | | 46,068 | | | | | |
| | | | | | | | | | | | | | | | | | |
50
Capital Statement 2023-24
| | | | | | | | | | | | | | | | | | |
| Environment and Science | |
Project | | Statistical
Area | | Total
Estimated
Cost
$‘000 | | | Expenditure
to
30-06-23
$‘000 | | | Budget
2023-24
$‘000 | | | Post
2023-24
$‘000 | |
Plant and equipment | | | | | | | | | | | | | | | | | | |
Marine parks major vessel replacements | | Various | | | 2,000 | | | | | | | | 1,000 | | | | 1,000 | |
Queensland Reef Water Quality monitoring equipment | | Various | | | 1,412 | | | | 406 | | | | 902 | | | | 104 | |
General plant and equipment | | Various | | | | | | | | | | | 7,484 | | | | Ongoing | |
| | | | | | | | | | | | | | | | | | |
Sub-total Plant and equipment | | | | | | | | | | | | | 9,386 | | | | | |
| | | | | | | | | | | | | | | | | | |
Systems development | | | | | | | | | | | | | | | | | | |
Waste management systems | | Various | | | 5,000 | | | | 450 | | | | 4,550 | | | | | |
Government Science Platform | | Various | | | 7,727 | | | | 4,937 | | | | 2,790 | | | | | |
General systems development | | Various | | | | | | | | | | | 1,244 | | | | Ongoing | |
| | | | | | | | | | | | | | | | | | |
Sub-total Systems development | | | | | | | | | | | | | 8,584 | | | | | |
| | | | | | | | | | | | | | | | | | |
Total Property, Plant and Equipment | | | | | | | | | | | | | 69,618 | | | | | |
| | | | | | | | | | | | | | | | | | |
Capital Grants | | | | | | | | | | | | | | | | | | |
Waste and Recycling program | | Various | | | 30,940 | | | | | | | | 30,940 | | | | | |
Newstead House capital works program | | 305 | | | 5,492 | | | | 5,192 | | | | 300 | | | | | |
| | | | | | | | | | | | | | | | | | |
Total Capital Grants | | | | | | | | | | | | | 31,240 | | | | | |
| | | | | | | | | | | | | | | | | | |
TOTAL ENVIRONMENT AND SCIENCE (PPE) | | | | | | | | | | | 69,618 | | | | | |
| | | | | | | | | | | | | | | | | | |
TOTAL ENVIRONMENT AND SCIENCE (CG) | | | | | | | | | | | | | 31,240 | | | | | |
| | | | | | | | | | | | | | | | | | |
Notes:
| 1. | An additional $25 million previously approved and held centrally, will also contribute to land acquisitions in 2023-24 as part of the total capital funding of $270.6 million committed to support the Protected Area Strategy 2020-2030 through land acquisitions and capital works to expand the protected area estate. |
51
Capital Statement 2023-24
Department of Housing
The total capital program in 2023-24 for the Department of Housing is $751.0 million, including capital works of $501.9 million, capital grants of $239.9 million and other property, plant and equipment of $9.2 million.
Under the Queensland Housing Strategy 2017-2027 the government is providing additional funding of $1.1 billion over 5 years to continue the delivery and supply of social housing as part of the Housing and Homelessness Action Plan, including within remote and discrete First Nations communities.
Program Highlights (Property, Plant and Equipment)
| • | | $441.4 million to deliver social housing dwellings, commence and continue construction, and upgrade existing social housing dwellings. |
| • | | $60.5 million to deliver social housing dwellings in Aboriginal and Torres Strait Islander communities, commence and continue construction of dwellings, and upgrade existing social housing dwellings. |
Program Highlights (Capital Grants)
| • | | $175.8 million to deliver social housing dwellings, commence and continue construction, and upgrade existing dwellings. |
| • | | $64.1 million to deliver social housing dwellings in Aboriginal and Torres Strait Islander communities, commence and continue construction, upgrade existing dwellings, and undertake land infrastructure development. |
| | | | | | | | | | | | | | | | | | |
| Housing | |
Project | | Statistical
Area | | Total
Estimated
Cost
$‘000 | | | Expenditure
to 30-06-23
$‘000 | | | Budget
2023-24
$‘000 | | | Post
2023-24
$‘000 | |
DEPARTMENT OF HOUSING | | | | | | | | | | | | | | | | | | |
Property, Plant and Equipment | | | | | | | | | | | | | | | | | | |
Housing and Homelessness Services | | | | | | | | | | | | | | | | | | |
Construct social housing | | | | | | | | | | | | | | | | | | |
Brisbane - East | | 301 | | | | | | | | | | | 2,017 | | | | Ongoing | |
Brisbane - North | | 302 | | | | | | | | | | | 989 | | | | Ongoing | |
Brisbane - South | | 303 | | | | | | | | | | | 8,000 | | | | Ongoing | |
Brisbane - West | | 304 | | | | | | | | | | | 2,500 | | | | Ongoing | |
Brisbane Inner City | | 305 | | | | | | | | | | | 20,886 | | | | Ongoing | |
Cairns | | 306 | | | | | | | | | | | 41,475 | | | | Ongoing | |
Darling Downs - Maranoa | | 307 | | | | | | | | | | | 1,421 | | | | Ongoing | |
Central Queensland | | 308 | | | | | | | | | | | 5,804 | | | | Ongoing | |
Gold Coast | | 309 | | | | | | | | | | | 17,580 | | | | Ongoing | |
52
Capital Statement 2023-24
| | | | | | | | | | | | | | | | | | |
| Housing | |
Project | | Statistical
Area | | Total
Estimated
Cost
$‘000 | | | Expenditure
to 30-06-23
$‘000 | | | Budget
2023-24
$‘000 | | | Post
2023-24
$‘000 | |
Ipswich | | 310 | | | | | | | | | | | 13,961 | | | | Ongoing | |
Logan - Beaudesert | | 311 | | | | | | | | | | | 22,655 | | | | Ongoing | |
Mackay | | 312 | | | | | | | | | | | 5,120 | | | | Ongoing | |
Moreton Bay - North | | 313 | | | | | | | | | | | 17,025 | | | | Ongoing | |
Moreton Bay - South | | 314 | | | | | | | | | | | 1,300 | | | | Ongoing | |
Queensland - Outback | | 315 | | | | | | | | | | | 12,895 | | | | Ongoing | |
Sunshine Coast | | 316 | | | | | | | | | | | 4,523 | | | | Ongoing | |
Toowoomba | | 317 | | | | | | | | | | | 4,906 | | | | Ongoing | |
Townsville | | 318 | | | | | | | | | | | 16,452 | | | | Ongoing | |
Wide Bay | | 319 | | | | | | | | | | | 25,470 | | | | Ongoing | |
Statewide | | Various | | | | | | | | | | | 15,674 | | | | Ongoing | |
Sub-total Construct social housing | | | | | | | | | | | | | 240,653 | | | | | |
Upgrade existing social housing | | | | | | | | | | | | | | | | | | |
Brisbane - East | | 301 | | | | | | | | | | | 3,609 | | | | Ongoing | |
Brisbane - North | | 302 | | | | | | | | | | | 4,603 | | | | Ongoing | |
Brisbane - South | | 303 | | | | | | | | | | | 8,995 | | | | Ongoing | |
Brisbane - West | | 304 | | | | | | | | | | | 1,634 | | | | Ongoing | |
Brisbane Inner City | | 305 | | | | | | | | | | | 10,315 | | | | Ongoing | |
Cairns | | 306 | | | | | | | | | | | 28,032 | | | | Ongoing | |
Darling Downs - Maranoa | | 307 | | | | | | | | | | | 1,093 | | | | Ongoing | |
Central Queensland | | 308 | | | | | | | | | | | 7,397 | | | | Ongoing | |
Gold Coast | | 309 | | | | | | | | | | | 5,402 | | | | Ongoing | |
Ipswich | | 310 | | | | | | | | | | | 7,570 | | | | Ongoing | |
Logan - Beaudesert | | 311 | | | | | | | | | | | 6,370 | | | | Ongoing | |
Mackay | | 312 | | | | | | | | | | | 3,731 | | | | Ongoing | |
Moreton Bay - North | | 313 | | | | | | | | | | | 5,367 | | | | Ongoing | |
Moreton Bay - South | | 314 | | | | | | | | | | | 1,380 | | | | Ongoing | |
Queensland - Outback | | 315 | | | | | | | | | | | 7,398 | | | | Ongoing | |
Sunshine Coast | | 316 | | | | | | | | | | | 3,864 | | | | Ongoing | |
Toowoomba | | 317 | | | | | | | | | | | 2,211 | | | | Ongoing | |
Townsville | | 318 | | | | | | | | | | | 10,761 | | | | Ongoing | |
Wide Bay | | 319 | | | | | | | | | | | 4,431 | | | | Ongoing | |
| | | | | | | | | | | | | | | | | | |
Sub-total Upgrade existing social housing | | | | | | | | | | | | | 124,163 | | | | | |
| | | | | | | | | | | | | | | | | | |
Social housing land acquisition | | | | | | | | | | | | | | | | | | |
Brisbane - North | | 302 | | | | | | | | | | | 2,500 | | | | Ongoing | |
53
Capital Statement 2023-24
| | | | | | | | | | | | | | | | | | |
| Housing | |
Project | | Statistical
Area | | Total
Estimated
Cost
$‘000 | | | Expenditure
to 30-06-23
$‘000 | | | Budget
2023-24
$‘000 | | | Post
2023-24
$‘000 | |
Brisbane - South | | 303 | | | | | | | | | | | 2,500 | | | | Ongoing | |
Cairns | | 306 | | | | | | | | | | | 2,000 | | | | Ongoing | |
Central Queensland | | 308 | | | | | | | | | | | 2,000 | | | | Ongoing | |
Gold Coast | | 309 | | | | | | | | | | | 2,000 | | | | Ongoing | |
Ipswich | | 310 | | | | | | | | | | | 2,000 | | | | Ongoing | |
Mackay | | 312 | | | | | | | | | | | 2,000 | | | | Ongoing | |
Moreton Bay - North | | 313 | | | | | | | | | | | 1,500 | | | | Ongoing | |
Moreton Bay - South | | 314 | | | | | | | | | | | 1,500 | | | | Ongoing | |
Sunshine Coast | | 316 | | | | | | | | | | | 2,000 | | | | Ongoing | |
Toowoomba | | 317 | | | | | | | | | | | 1,000 | | | | Ongoing | |
Townsville | | 318 | | | | | | | | | | | 2,000 | | | | Ongoing | |
Wide Bay | | 319 | | | | | | | | | | | 2,000 | | | | Ongoing | |
Statewide | | Various | | | | | | | | | | | 500 | | | | Ongoing | |
| | | | | | | | | | | | | | | | | | |
Sub-total Social housing land acquisition | | | | | | | | | | | | | 25,500 | | | | | |
| | | | | | | | | | | | | | | | | | |
Purchase of existing properties | | | | | | | | | | | | | | | | | | |
Brisbane Inner City | | 305 | | | | | | | | | | | 38,759 | | | | Ongoing | |
Cairns | | 306 | | | | | | | | | | | 10,000 | | | | Ongoing | |
Darling Downs - Maranoa | | 307 | | | | | | | | | | | 1,500 | | | | Ongoing | |
Central Queensland | | 308 | | | | | | | | | | | 3,150 | | | | Ongoing | |
Ipswich | | 310 | | | | | | | | | | | 3,500 | | | | Ongoing | |
Mackay | | 312 | | | | | | | | | | | 3,414 | | | | Ongoing | |
Moreton Bay North | | 313 | | | | | | | | | | | 1,275 | | | | Ongoing | |
Moreton Bay South | | 314 | | | | | | | | | | | 850 | | | | Ongoing | |
Toowoomba | | 317 | | | | | | | | | | | 1,797 | | | | Ongoing | |
Townsville | | 318 | | | | | | | | | | | 10,278 | | | | Ongoing | |
Wide Bay | | 319 | | | | | | | | | | | 3,825 | | | | Ongoing | |
Statewide | | Various | | | | | | | | | | | 33,284 | | | | Ongoing | |
| | | | | | | | | | | | | | | | | | |
Sub-total Purchase of existing properties | | | | | | | | | | | | | 111,632 | | | | | |
| | | | | | | | | | | | | | | | | | |
Other plant and equipment and intangibles | | Various | | | | | | | | | | | 9,200 | | | | Ongoing | |
| | | | | | | | | | | | | | | | | | |
Sub-total Housing and Homelessness Services | | | | | | | | | | | | | 511,148 | | | | | |
| | | | | | | | | | | | | | | | | | |
Total Property, Plant and Equipment | | | | | | | | | | | | | 511,148 | | | | | |
| | | | | | | | | | | | | | | | | | |
Capital Grants | | | | | | | | | | | | | | | | | | |
Housing and Homelessness Services | | | | | | | | | | | | | | | | | | |
Brisbane - East | | 301 | | | | | | | | | | | 6,552 | | | | Ongoing | |
54
Capital Statement 2023-24
| | | | | | | | | | | | | | | | | | |
| Housing | |
Project | | Statistical
Area | | Total
Estimated
Cost
$‘000 | | | Expenditure
to 30-06-23
$‘000 | | | Budget
2023-24
$‘000 | | | Post
2023-24
$‘000 | |
Brisbane - North | | 302 | | | | | | | | | | | 903 | | | | Ongoing | |
Brisbane - South | | 303 | | | | | | | | | | | 3,787 | | | | Ongoing | |
Brisbane - Inner City | | 305 | | | | | | | | | | | 32,838 | | | | Ongoing | |
Cairns | | 306 | | | | | | | | | | | 54,446 | | | | Ongoing | |
Darling Downs - Maranoa | | 307 | | | | | | | | | | | 667 | | | | Ongoing | |
Central Queensland | | 308 | | | | | | | | | | | 1,677 | | | | Ongoing | |
Gold Coast | | 309 | | | | | | | | | | | 23,449 | | | | Ongoing | |
Ipswich | | 310 | | | | | | | | | | | 11,474 | | | | Ongoing | |
Mackay | | 312 | | | | | | | | | | | 4,061 | | | | Ongoing | |
Moreton Bay - North | | 313 | | | | | | | | | | | 3,490 | | | | Ongoing | |
Queensland - Outback | | 315 | | | | | | | | | | | 5,369 | | | | Ongoing | |
Sunshine Coast | | 316 | | | | | | | | | | | 20,863 | | | | Ongoing | |
Toowoomba | | 317 | | | | | | | | | | | 1,960 | | | | Ongoing | |
Townsville | | 318 | | | | | | | | | | | 6,637 | | | | Ongoing | |
Wide Bay | | 319 | | | | | | | | | | | 13,375 | | | | Ongoing | |
Statewide | | Various | | | | | | | | | | | 48,336 | | | | Ongoing | |
| | | | | | | | | | | | | | | | | | |
Sub-total Housing and Homelessness Services | | | | | | | | | | | | | 239,884 | | | | | |
| | | | | | | | | | | | | | | | | | |
Total Capital Grants | | | | | | | | | | | | | 239,884 | | | | | |
| | | | | | | | | | | | | | | | | | |
TOTAL HOUSING (PPE) | | | | | | | | | | | | | 511,148 | | | | | |
| | | | | | | | | | | | | | | | | | |
TOTAL HOUSING (CG) | | | | | | | | | | | | | 239,884 | | | | | |
| | | | | | | | | | | | | | | | | | |
55
Capital Statement 2023-24
| 3.7 | JUSTICE AND ATTORNEY-GENERAL |
The 2023-24 capital acquisitions budget for the Justice and Attorney-General portfolio (including the Department of Justice and Attorney-General, Crime and Corruption Commission, Electoral Commission Queensland and Public Trustee of Queensland) is $48.9 million.
Department of Justice and Attorney-General
The Department of Justice and Attorney-General capital acquisitions budget for 2023-24 is $43.5 million.
Program Highlights (Property, Plant and Equipment)
| • | | $17.3 million to continue the ongoing program of minor capital works in courthouses. |
| • | | $9.8 million to expand and upgrade existing audio-visual capacity in the justice system, which includes video conferencing and in-custody court appearances. |
| • | | $6.3 million to continue the domestic and family violence courthouse improvements in Toowoomba, Cairns, Brisbane, Rockhampton, Maroochydore, Caboolture, Mackay and Ipswich. This forms part of the government’s response to the Queensland Women’s Safety and Justice Taskforce, Hear Her Voice - Report One - Addressing coercive control and domestic and family violence in Queensland. |
| • | | $4.7 million to continue the replacement of the Beaudesert courthouse. |
Crime and Corruption Commission
The Crime and Corruption Commission’s 2023-24 capital acquisitions budget is $2.3 million.
Program Highlights (Property, Plant and Equipment)
| • | | $1.5 million to replace computer and other information technology equipment. |
| • | | $800,000 to replace vehicles. |
Electoral Commission of Queensland
Electoral Commission of Queensland’s 2023-24 capital acquisitions budget is $2.1 million of which $2.0 million is to purchase the Election Management System (EMS) to ensure the long-term stability and integrity of the system and $79,000 is allocated to replace plant and equipment.
Program Highlights (Property, Plant and Equipment)
| • | | $2.0 million to purchase the Election Management System. |
| • | | $79,000 to replace plant and equipment. |
Public Trustee of Queensland
The 2023-24 capital budget is $1.0 million. This capital budget will enable the Public Trustee of Queensland to continue to provide a wide range of efficient services to the Queensland community, as well as continuing to maintain appropriate workplace health and safety standards for customers and staff.
Program Highlights (Property, Plant and Equipment)
| • | | $400,000 to enhance and develop information systems. |
56
Capital Statement 2023-24
| • | | $600,000 for refurbishment of existing regional office premises. |
| | | | | | | | | | | | | | | | | | |
| Justice and Attorney-General | |
Project | | Statistical
Area | | Total
Estimated
Cost
$‘000 | | | Expenditure
to
30-06-23
$‘000 | | | Budget
2023-24
$‘000 | | | Post
2023-24
$‘000 | |
DEPARTMENT OF JUSTICE AND ATTORNEY-GENERAL | | | | | | | | | | | | | | | | | | |
Property, Plant and Equipment | | | | | | | | | | | | | | | | | | |
Domestic and family violence courthouse improvements | | Various | | | 49,050 | | | | 1,825 | | | | 6,300 | | | | 40,925 | |
Beaudesert courthouse replacement | | 311 | | | 21,446 | | | | 724 | | | | 4,682 | | | | 16,040 | |
Courthouses - minor capital works | | Various | | | | | | | | | | | 17,309 | | | | Ongoing | |
Justice System - audio visual capacity expansion and upgrades | | Various | | | | | | | | | | | 9,824 | | | | Ongoing | |
Minor capital works - software | | 305 | | | | | | | | | | | 2,065 | | | | Ongoing | |
Leasehold improvements | | 305 | | | | | | | | | | | 1,424 | | | | Ongoing | |
Courthouses - information systems upgrades and replacements | | 305 | | | | | | | | | | | 795 | | | | Ongoing | |
Other acquisitions of property, plant and equipment | | Various | | | | | | | | | | | 1,080 | | | | Ongoing | |
| | | | | | | | | | | | | | | | | | |
Total Property, Plant and Equipment | | | | | | | | | | | | | 43,479 | | | | | |
| | | | | | | | | | | | | | | | | | |
CRIME AND CORRUPTION COMMISSION | | | | | | | | | | | | | | | | | | |
Property, Plant and Equipment | | | | | | | | | | | | | | | | | | |
Other plant and equipment | | Various | | | | | | | | | | | 1,506 | | | | Ongoing | |
Vehicle replacements | | Various | | | | | | | | | | | 794 | | | | Ongoing | |
| | | | | | | | | | | | | | | | | | |
Total Property, Plant and Equipment | | | | | | | | | | | | | 2,300 | | | | | |
| | | | | | | | | | | | | | | | | | |
ELECTORAL COMMISSION OF QUEENSLAND | | | | | | | | | | | | | | | | | | |
Property, Plant and Equipment | | | | | | | | | | | | | | | | | | |
Election Management System | | Various | | | 2,000 | | | | | | | | 2,000 | | | | | |
Plant and equipment | | Various | | | | | | | | | | | 79 | | | | Ongoing | |
| | | | | | | | | | | | | | | | | | |
Total Property, Plant and Equipment | | | | | | | | | | | | | 2,079 | | | | | |
| | | | | | | | | | | | | | | | | | |
PUBLIC TRUSTEE OF QUEENSLAND | | | | | | | | | | | | | | | | | | |
Property, Plant and Equipment | | | | | | | | | | | | | | | | | | |
Information systems development | | Various | | | | | | | | | | | 400 | | | | Ongoing | |
Other acquisitions of property, plant and equipment | | Various | | | | | | | | | | | 600 | | | | Ongoing | |
| | | | | | | | | | | | | | | | | | |
Total Property, Plant and Equipment | | | | | | | | | | | | | 1,000 | | | | | |
| | | | | | | | | | | | | | | | | | |
TOTAL JUSTICE AND ATTORNEY-GENERAL (PPE) | | | | | | | | | | | | | 48,858 | | | | | |
| | | | | | | | | | | | | | | | | | |
57
Capital Statement 2023-24
| 3.8 | LEGISLATIVE ASSEMBLY OF QUEENSLAND |
Legislative Assembly of Queensland
The total planned 2023-24 capital expenditure for the Legislative Assembly of Queensland is $36.9 million.
Major capital projects include the necessary repairs and upgrades to the external façade of the Parliamentary Annexe, and the refurbishment of soft furnishings in Members’ office and overnight accommodation floors (levels 9 to 23). Other capital projects include modernising AV broadcast infrastructure and the ongoing electorate office accommodation improvement program.
| | | | | | | | | | | | | | | | | | |
| Legislative Assembly of Queensland | |
Project | | Statistical
Area | | Total
Estimated
Cost
$‘000 | | | Expenditure
to
30-06-23
$‘000 | | | Budget
2023-24
$‘000 | | | Post
2023-24
$‘000 | |
LEGISLATIVE ASSEMBLY OF QUEENSLAND | | | | | | | | | | | | | | | | | | |
Property, Plant and Equipment | | | | | | | | | | | | | | | | | | |
Annexe critical infrastructure and services upgrade | | 305 | | | 58,021 | | | | 26,006 | | | | 32,015 | | | | | |
Electorate office accommodation improvement program | | Various | | | | | | | | | | | 2,110 | | | | Ongoing | |
Other property, plant and equipment | | 305 | | | | | | | | | | | 1,484 | | | | Ongoing | |
Queensland Parliament digital transformation program | | 305 | | | 1,891 | | | | | | | | 865 | | | | 1,026 | |
Information technology network infrastructure | | 305 | | | | | | | | | | | 406 | | | | Ongoing | |
| | | | | | | | | | | | | | | | | | |
Total Property, Plant and Equipment | | | | | | | | | | | | | 36,880 | | | | | |
| | | | | | | | | | | | | | | | | | |
TOTAL LEGISLATIVE ASSEMBLY OF QUEENSLAND (PPE) | | | | | | | | | | | | | 36,880 | | | | | |
| | | | | | | | | | | | | | | | | | |
58
Capital Statement 2023-24
The Department of the Premier and Cabinet (including Ministerial Offices and Office of the Leader of the Opposition) has planned capital purchases of $1.3 million and capital grants of $14.6 million in 2023-24.
Department of the Premier and Cabinet
Program Highlights (Property, Plant and Equipment)
| • | | $691,000 for ongoing upgrades to and maintenance of departmental ICT systems and other minor works. |
| • | | $646,000 for ongoing upgrades and maintenance of existing Ministerial Services ICT systems and other minor works. |
Program Highlights (Capital Grants)
| • | | $8.1 million of a total $12.6 million for the Far North Queensland screen production studio, a multipurpose facility in Cairns. |
| • | | $5.0 million for the Gold Coast production hub servicing film and television projects. |
| • | | $1.5 million of a total $5.2 million for the Queensland Remembers Grants Program, to support ex-service organisations and not-for-profit organisations that provide services to veterans to upgrade their buildings, facilities and equipment. |
| | | | | | | | | | | | | | | | | | |
| Premier and Cabinet | |
Project | | Statistical
Area | | Total
Estimated
Cost
$‘000 | | | Expenditure
to
30-06-23
$‘000 | | | Budget
2023-24
$‘000 | | | Post
2023-24
$‘000 | |
DEPARTMENT OF PREMIER AND CABINET | | | | | | | | | | | | | | | | | | |
Property, Plant and Equipment | | | | | | | | | | | | | | | | | | |
Departmental ICT systems and other minor works | | 305 | | | | | | | | | | | 691 | | | | Ongoing | |
Ministerial Offices and Office of the Leader of the Opposition - ICT systems and other minor works | | 305 | | | | | | | | | | | 646 | | | | Ongoing | |
| | | | | | | | | | | | | | | | | | |
Total Property, Plant and Equipment | | | | | | | | | | | | | 1,337 | | | | | |
| | | | | | | | | | | | | | | | | | |
Capital Grants | | | | | | | | | | | | | | | | | | |
Queensland Remembers Grants Program | | Various | | | 5,191 | | | | 1,841 | | | | 1,500 | | | | 1,850 | |
Screen Queensland Studios, Cairns | | 306 | | | 12,600 | | | | 4,457 | | | | 8,143 | | | | | |
Screen Queensland Studios, Gold Coast | | 309 | | | 5,000 | | | | | | | | 5,000 | | | | | |
| | | | | | | | | | | | | | | | | | |
Total Capital Grants | | | | | | | | | | | | | 14,643 | | | | | |
| | | | | | | | | | | | | | | | | | |
TOTAL PREMIER AND CABINET (PPE) | | | | | | | | | | | | | 1,337 | | | | | |
| | | | | | | | | | | | | | | | | | |
TOTAL PREMIER AND CABINET (CG) | | | | | | | | | | | | | 14,643 | | | | | |
| | | | | | | | | | | | | | | | | | |
59
Capital Statement 2023-24
| 3.10 | QUEENSLAND CORRECTIVE SERVICES |
Queensland Corrective Services’ 2023-24 capital program of $439.6 million will primarily focus on correctional centre expansion and enhancements.
Queensland Corrective Services
Program Highlights (Property, Plant and Equipment)
| • | | $341.0 million of total $861.0 million to continue the expansion of Southern Queensland Correctional Precinct - Stage 2. The new centre will be a modern, purpose-built facility with over 1,500 beds and will enable a focus on health and rehabilitation to reduce reoffending. |
| • | | $3.0 million of total $5.4 million to acquire video conference suites and other property, plant and equipment for prison industries at Southern Queensland Correctional Precinct - Stage 2. |
| • | | $3.3 million of total $31.8 million to install information technology infrastructure in correctional centres to enhance the provision of health care. |
| • | | $20.0 million for pre-commencement activities including design works, site investigations and other preliminary works for the future expansion of the Townsville Correctional Precinct. |
| • | | $10.0 million for pre-commencement activities including design works, site investigations and other preliminary works for the future establishment of a new Wacol Precinct Enhanced Primary Health Care facility located at the Brisbane Correctional Centre. |
| • | | $41.6 million of total $71.8 million to progress infrastructure works and support ongoing maintenance and replacement programs. |
| • | | $4.1 million of total $13.6 million to upgrade the intercom system at the Woodford Correctional Centre. |
| • | | $1.0 million of total $8.0 million to install additional bunk beds in high security correctional centres across Queensland to manage the increasing prison population. |
| • | | $1.0 million of total $3.0 million to complete the refurbishment of the Princess Alexandra Hospital Secure Unit. |
| • | | $14.6 million to acquire other property, plant and equipment. |
| | | | | | | | | | | | | | | | | | |
| Queensland Corrective Services | |
Project | | Statistical
Area | | Total
Estimated
Cost
$‘000 | | | Expenditure
to
30-06-23
$‘000 | | | Budget
2023-24
$‘000 | | | Post
2023-24
$‘000 | |
QUEENSLAND CORRECTIVE SERVICES | | | | | | | | | | | | | | | | | | |
Property, Plant and Equipment | | | | | | | | | | | | | | | | | | |
Major works - correctional centres | | | | | | | | | | | | | | | | | | |
Southern Queensland Correctional Precinct - Stage 2 | | | | | | | | | | | | | | | | | | |
Stage 2 construction over 1,500 beds | | 310 | | | 860,978 | | | | 472,023 | | | | 340,955 | | | | 48,000 | |
Stage 2 Property, Plant and Equipment | | 310 | | | 5,390 | | | | | | | | 2,990 | | | | 2,400 | |
Information Technology Infrastructure | | Various | | | 31,750 | | | | | | | | 3,321 | | | | 28,429 | |
Townsville Correctional Precinct | | 318 | | | 20,000 | | | | | | | | 20,000 | | | | | |
60
Capital Statement 2023-24
| | | | | | | | | | | | | | | | | | |
| Queensland Corrective Services | |
Project | | Statistical
Area | | Total
Estimated
Cost
$‘000 | | | Expenditure
to
30-06-23
$‘000 | | | Budget
2023-24
$‘000 | | | Post
2023-24
$‘000 | |
Wacol Precinct Enhanced Primary Health Care Facility | | 310 | | | 10,000 | | | | | | | | 10,000 | | | | | |
| | | | | | | | | | | | | | | | | | |
Sub-total Major works - correctional centres | | | | | | | | | | | | | 377,266 | | | | | |
| | | | | | | | | | | | | | | | | | |
Correctional centre enhancements | | | | | | | | | | | | | | | | | | |
Infrastructure works | | Various | | | 71,770 | | | | 22,829 | | | | 41,591 | | | | 7,350 | |
Woodford Correctional Centre - intercoms | | 313 | | | 13,600 | | | | 9,512 | | | | 4,088 | | | | | |
Princess Alexandra Hospital Secure Unit | | 303 | | | 3,040 | | | | 1,999 | | | | 1,041 | | | | | |
Additional bunk beds | | Various | | | 8,000 | | | | 7,032 | | | | 968 | | | | | |
| | | | | | | | | | | | | | | | | | |
Sub-total Correctional centre enhancements | | | | | | | | | | | | | 47,688 | | | | | |
| | | | | | | | | | | | | | | | | | |
Other acquisitions of property, plant and equipment | | | | | | | | | | | | | | | | | | |
Other acquisitions of property, plant and equipment | | Various | | | | | | | | | | | 14,645 | | | | Ongoing | |
| | | | | | | | | | | | | | | | | | |
Sub-total Other acquisitions of property, plant and equipment | | | | | | | | | | | | | 14,645 | | | | | |
| | | | | | | | | | | | | | | | | | |
Total Property, Plant and Equipment | | | | | | | | | | | | | 439,599 | | | | | |
| | | | | | | | | | | | | | | | | | |
TOTAL QUEENSLAND CORRECTIVE SERVICES (PPE) | | | | | | | | | | | | | 439,599 | | | | | |
| | | | | | | | | | | | | | | | | | |
61
Capital Statement 2023-24
| 3.11 | QUEENSLAND FIRE AND EMERGENCY SERVICES |
Queensland Fire and Emergency Services
The 2023-24 Queensland Fire and Emergency Services (QFES) capital program of $125.0 million in capital purchases and $11.7 million in capital grants supports the provision of fire and rescue and emergency management services throughout Queensland. The program will fund fire and emergency services facilities, fire appliances, and essential operational equipment and information systems.
Through an agreed arrangement, the Queensland Police Service Frontline and Digital Division will provide information and communications technology systems and equipment.
Fire and Rescue Service
Program Highlights (Property, Plant and Equipment)
| • | | $18.7 million for replacement and new fire and rescue appliances. |
| • | | $17.9 million for land acquisitions for replacement facilities at Atherton, Beerwah, Bundaberg East, Hervey Bay, Highfields, South Townsville and Wulguru. |
| • | | $12.1 million for operational equipment including specialised firefighting, scientific analysis and detection, breathing apparatus, and rescue equipment. |
| • | | $8.2 million to complete the new permanent fire and rescue station at Mount Cotton Road. |
| • | | $7.0 million to continue the delivery of the new permanent fire and rescue station at Caloundra South. |
| • | | $5.8 million for the upgrade and refurbishment of auxiliary fire and rescue stations across Queensland including at Allora, Boonah, Emerald, Imbil and Mitchell. |
| • | | $4.7 million to continue replacement of the permanent and auxiliary fire and rescue stations at Airlie Beach and Drayton. |
| • | | $3.0 million to complete the new permanent fire and rescue station at Moreton Bay Central. |
| • | | $2.5 million to continue the delivery of the new permanent fire and rescue station at Greater Springfield. |
| • | | $2.4 million to continue the delivery of the replacement permanent fire and rescue station at Gympie South. |
| • | | $2.4 million for minor works across auxiliary and permanent fire and rescue stations across Queensland. |
| • | | $2.0 million for refurbishment of the fire and rescue station at Roma Street in Brisbane. |
Rural Fire Service
Program Highlights (Property, Plant and Equipment)
| • | | $16.2 million for replacement and new rural fire appliances. |
| • | | $7.0 million for support vehicles to enhance Rural Fire Service response capability. |
| • | | $3.7 million to complete new or upgraded rural fire brigade stations across Queensland including at Moore Linville and Mount Alford. |
| • | | $3.5 million to complete the new Maryborough area brigade headquarters. |
| • | | $2.6 million for operational equipment including specialised firefighting, breathing apparatus, and rescue equipment. |
62
Capital Statement 2023-24
| • | | $1.0 million for the retrofitting of cabin deluge systems into rural fire appliances. |
| • | | $1.0 million to upgrade rural fire service facilities. |
Program Highlights (Capital Grants)
| • | | $500,000 in capital grants for Rural Fire Brigades. |
State Emergency Service
Program Highlights (Property, Plant and Equipment)
| • | | $3.0 million for support vehicles to enhance State Emergency Service response capability. |
Program Highlights (Capital Grants)
| • | | $11.2 million in capital grants for the State Emergency Service. |
| | | | | | | | | | | | | | | | | | | | |
| Queensland Fire and Emergency Services | |
Project | | Statistical
Area | | | Total
Estimated
Cost
$‘000 | | | Expenditure
to
30-06-23
$‘000 | | | Budget
2023-24
$‘000 | | | Post
2023-24
$‘000 | |
QUEENSLAND FIRE AND EMERGENCY SERVICES | | | | | | | | | | | | | | | | | | | | |
Property, Plant and Equipment | | | | | | | | | | | | | | | | | | | | |
Buildings | | | | | | | | | | | | | | | | | | | | |
Fire and Rescue Facilities | | | | | | | | | | | | | | | | | | | | |
Airlie Beach replacement permanent and auxiliary fire and rescue station | | | 312 | | | | 8,900 | | | | 300 | | | | 2,250 | | | | 6,350 | |
Allora auxiliary fire and rescue station refurbishment | | | 307 | | | | 970 | | | | | | | | 970 | | | | | |
Boonah auxiliary fire and rescue station upgrade and refurbishment | | | 310 | | | | 2,500 | | | | | | | | 300 | | | | 2,200 | |
Caloundra South new permanent fire and rescue station | | | 316 | | | | 8,500 | | | | 200 | | | | 7,000 | | | | 1,300 | |
Drayton replacement permanent and auxiliary fire and rescue station | | | 317 | | | | 7,500 | | | | 100 | | | | 2,400 | | | | 5,000 | |
Emerald permanent and auxiliary fire and rescue station works | | | 308 | | | | 400 | | | | | | | | 400 | | | | | |
Greater Springfield new permanent fire and rescue station | | | 310 | | | | 10,000 | | | | 100 | | | | 2,500 | | | | 7,400 | |
Gympie South replacement permanent fire and rescue station | | | 319 | | | | 7,500 | | | | 100 | | | | 2,400 | | | | 5,000 | |
Imbil auxiliary fire and rescue station upgrade and refurbishment | | | 319 | | | | 1,900 | | | | | | | | 1,900 | | | | | |
63
Capital Statement 2023-24
| | | | | | | | | | | | | | | | | | | | |
| Queensland Fire and Emergency Services | |
Project | | Statistical
Area | | | Total
Estimated
Cost
$‘000 | | | Expenditure
to
30-06-23
$‘000 | | | Budget
2023-24
$‘000 | | | Post
2023-24
$‘000 | |
Mitchell auxiliary fire and rescue station upgrade and refurbishment | | | 307 | | | | 2,200 | | | | | | | | 2,200 | | | | | |
Moreton Bay Central new permanent fire and rescue station | | | 313 | | | | 6,800 | | | | 3,800 | | | | 3,000 | | | | | |
Mount Cotton Road new permanent fire and rescue station | | | 311 | | | | 10,500 | | | | 2,270 | | | | 8,230 | | | | | |
Roma Street fire station refurbishment | | | 305 | | | | 2,000 | | | | | | | | 2,000 | | | | | |
Minor works | | | Various | | | | | | | | | | | | 2,400 | | | | Ongoing | |
| | | | | | | | | | | | | | | | | | | | |
Sub-total Fire and Rescue Facilities | | | | | | | | | | | | | | | 37,950 | | | | | |
| | | | | | | | | | | | | | | | | | | | |
Rural Fire Service Facilities | | | | | | | | | | | | | | | | | | | | |
Maryborough area brigade headquarters | | | 319 | | | | 4,000 | | | | 500 | | | | 3,500 | | | | | |
Millaroo Dalbeg rural fire brigade station | | | 318 | | | | 300 | | | | | | | | 300 | | | | | |
Moore Linville rural fire brigade station | | | 313 | | | | 700 | | | | | | | | 700 | | | | | |
Mount Alford rural fire brigade station | | | 310 | | | | 700 | | | | | | | | 700 | | | | | |
Whetstone rural fire brigade station | | | 307 | | | | 450 | | | | | | | | 450 | | | | | |
New and replacement rural fire station build program | | | Various | | | | 3,350 | | | | 1,800 | | | | 1,550 | | | | | |
Rural Fire Service facilities program | | | Various | | | | | | | | | | | | 1,000 | | | | Ongoing | |
| | | | | | | | | | | | | | | | | | | | |
Sub-total Rural Fire Service Facilities | | | | | | | | | | | | | | | 8,200 | | | | | |
| | | | | | | | | | | | | | | | | | | | |
Other Facilities | | | | | | | | | | | | | | | | | | | | |
Bamaga fire and emergency services complex | | | 315 | | | | 4,500 | | | | | | | | 300 | | | | 4,200 | |
| | | | | | | | | | | | | | | | | | | | |
Sub-total Buildings | | | | | | | | | | | | | | | 46,450 | | | | | |
| | | | | | | | | | | | | | | | | | | | |
Strategic Land Acquisitions | | | | | | | | | | | | | | | | | | | | |
Atherton replacement fire and rescue station land acquisition | | | 306 | | | | 3,000 | | | | | | | | 3,000 | | | | | |
Beerwah replacement fire and rescue station land acquisition | | | 316 | | | | 3,770 | | | | | | | | 3,770 | | | | | |
Bundaberg East new fire and emergency services facility | | | 319 | | | | 2,000 | | | | | | | | 2,000 | | | | | |
Hervey Bay replacement fire and rescue station land acquisition | | | 319 | | | | 1,700 | | | | | | | | 1,700 | | | | | |
Highfields replacement fire and rescue station land acquisition | | | 317 | | | | 2,000 | | | | | | | | 2,000 | | | | | |
South Townsville replacement fire and rescue station land acquisition | | | 318 | | | | 3,200 | | | | | | | | 3,200 | | | | | |
Wulguru replacement fire and rescue station land acquisition | | | 318 | | | | 2,200 | | | | | | | | 2,200 | | | | | |
64
Capital Statement 2023-24
| | | | | | | | | | | | | | | | | | | | |
| Queensland Fire and Emergency Services | |
Project | | Statistical
Area | | | Total
Estimated
Cost
$‘000 | | | Expenditure
to 30-06-23
$‘000 | | | Budget
2023-24
$‘000 | | | Post
2023-24
$‘000 | |
Rural Fire Service operations land acquisitions | | | Various | | | | | | | | | | | | 200 | | | | Ongoing | |
| | | | | | | | | | | | | | | | | | | | |
Sub-total Strategic Land Acquisitions | | | | | | | | | | | | | | | 18,070 | | | | | |
| | | | | | | | | | | | | | | | | | | | |
Plant and Equipment | | | | | | | | | | | | | | | | | | | | |
Fire and Rescue | | | | | | | | | | | | | | | | | | | | |
Fire and rescue appliances | | | Various | | | | | | | | | | | | 18,705 | | | | Ongoing | |
Operational equipment | | | Various | | | | | | | | | | | | 12,082 | | | | Ongoing | |
| | | | | | | | | | | | | | | | | | | | |
Sub-total Fire and Rescue | | | | | | | | | | | | | | | 30,787 | | | | | |
| | | | | | | | | | | | | | | | | | | | |
Rural Fire Service | | | | | | | | | | | | | | | | | | | | |
Operational equipment | | | Various | | | | | | | | | | | | 2,590 | | | | Ongoing | |
Rural Fire Service deluge system retrofit | | | Various | | | | 3,000 | | | | 1,000 | | | | 1,000 | | | | 1,000 | |
Rural Fire Service support vehicles | | | Various | | | | 6,950 | | | | | | | | 6,950 | | | | | |
Rural Fire Service appliances | | | Various | | | | | | | | | | | | 16,157 | | | | Ongoing | |
| | | | | | | | | | | | | | | | | | | | |
Sub-total Rural Fire Service | | | | | | | | | | | | | | | 26,697 | | | | | |
| | | | | | | | | | | | | | | | | | | | |
State Emergency Service | | | | | | | | | | | | | | | | | | | | |
State Emergency Service support vehicles | | | Various | | | | 3,000 | | | | | | | | 3,000 | | | | | |
| | | | | | | | | | | | | | | | | | | | |
Sub-total State Emergency Service | | | | | | | | | | | | | | | 3,000 | | | | | |
| | | | | | | | | | | | | | | | | | | | |
Sub-total Plant and Equipment | | | | | | | | | | | | | | | 60,484 | | | | | |
| | | | | | | | | | | | | | | | | | | | |
Total Property, Plant and Equipment | | | | | | | | | | | | | | | 125,004 | | | | | |
| | | | | | | | | | | | | | | | | | | | |
Capital Grants | | | | | | | | | | | | | | | | | | | | |
Rural fire brigades | | | Various | | | | | | | | | | | | 500 | | | | Ongoing | |
State Emergency Service | | | Various | | | | | | | | | | | | 11,212 | | | | Ongoing | |
| | | | | | | | | | | | | | | | | | | | |
Total Capital Grants | | | | | | | | | | | | | | | 11,712 | | | | | |
| | | | | | | | | | | | | | | | | | | | |
| TOTAL QUEENSLAND FIRE AND EMERGENCY SERVICES (PPE) | | | | | | | | | | | | | | | 125,004 | | | | | |
| | | | | | | | | | | | | | | | | | | | |
| TOTAL QUEENSLAND FIRE AND EMERGENCY SERVICES (CG) | | | | | | | | | | | | | | | 11,712 | | | | | |
| | | | | | | | | | | | | | | | | | | | |
65
Capital Statement 2023-24
QUEENSLAND HEALTH
Queensland Health is comprised of the Department of Health, the Queensland Ambulance Service (QAS) and 16 independent Hospital and Health Services (HHSs) situated across the state. The remainder of the Queensland Health portfolio includes the Queensland Mental Health Commission, the Office of the Health Ombudsman, the Council of the Queensland Institute of Medical Research (QIMR Berghofer) and Health and Wellbeing Queensland.
The total capital investment program in 2023-24 for Queensland Health, including QIMR, is $1.638 billion.
Queensland Health and Hospital and Health Services
The Queensland Health Capital Program delivers built infrastructure and digital technologies to enable the delivery of safe, high-quality health services to Queenslanders. The built infrastructure, equipment and technology requirements of Queensland Health are driven by clinical services planning and models of care. Over the next 15 years, the demand on Queensland’s public health system is projected to increase significantly. The Queensland Health Capital Program is positioned to respond to these pressures with innovative approaches to managing existing assets, leveraging emerging healthcare technology, and utilising contemporary building practices and enhanced design processes.
Queensland Health also uses a strategic approach to forward planning which considers the needs of all Queenslanders, including efficiencies that can be leveraged across the statewide network. This ensures healthcare infrastructure and equipment programs are delivered at the right place, at the right time, for Queensland communities.
Program Highlights (Property, Plant and Equipment)
In 2023-24, Queensland Health will continue to invest in health infrastructure, capital works and purchases across a broad range of areas including hospitals, ambulance stations and vehicles, health technology, research and scientific services, mental health services, staff accommodation, and ICT.
Hospital and health facility project highlights in 2023-24 include:
$414.6 million for the Queensland Health Capacity Expansion Program to deliver around 2,200 additional overnight beds. This includes new hospitals in Bundaberg, Toowoomba and Coomera; a new Queensland Cancer Centre; expansions to hospitals in Cairns, Townsville, Robina, Mackay, Redcliffe, Ipswich and Hervey Bay as well as to the Princess Alexandra, QEII and The Prince Charles hospitals; and a further expansion of Logan Hospital.
$346.5 million under the Sustaining Capital Program will be distributed across Hospital and Health Services and the Department of Health for a range of minor capital projects, to efficiently replace and renew Queensland Health’s existing asset base to maintain business and service delivery. The program will seek to enhance, optimise, renew, and replace the asset base to ensure facilities and equipment are fit for purpose.
$135.2 million from the Sustaining Capital Program to enhance ageing rural and regional health facilities and staff accommodation as part of the next stage of the Queensland Health Building Rural and Remote Health Program. Locations include Darling Downs, Cairns and Hinterland, Central Queensland, Mackay, North West, South West, Central West, Torres and Cape, Townsville, West Moreton and Wide Bay Hospital and Health Services.
66
Capital Statement 2023-24
$121.4 million as part of the Building Better Hospitals program including:
| • | | $82.0 million for the Logan Hospital Expansion to deliver an additional 206 beds and bed alternatives with a vertical expansion of Building 3 and targeted refurbishment of other key locations. |
| • | | $34.4 million for the Caboolture Hospital Redevelopment to support an additional 130 beds and refurbishment of critical clinical support services. |
| • | | $4.7 million for the Ipswich Hospital Expansion Stage 1A which includes redevelopment of the hospital including new mental health facilities for adults and older persons, 26 bed ward refurbishment and a Magnetic Resonance Imaging suite to grow clinical capacity. |
| • | | $0.4 million for the Logan Hospital Maternity Services Upgrade with the refurbishment to deliver 6 additional maternity inpatient beds, 5 extra birthing suites, an expanded special care nursery with 10 additional cots, and the installation of birthing pools suitable for water birthing. |
$108.3 million from the Sustaining Capital Program to immediately increase bed capacity across South East Queensland under the Accelerated Infrastructure Delivery Program. The program will use off-site construction and standard designs to reduce time to commissioning with 289 overnight beds across 7 projects in West Moreton, Metro South, Cairns and Hinterland, and Gold Coast Hospital and Health Services, to be delivered within 2 years.
$78.9 million as part of the Satellite Hospitals Program to deliver satellite hospitals to Bribie Island, Caboolture, Eight Mile Plains (Brisbane South), Kallangur (Pine Rivers), Tugun (Gold Coast), Ripley (Ipswich), and Redlands. The Satellite Hospitals will have a Minor Injury and Illness Clinic (MIIC) with medical imaging and diagnostic services to alleviate pressure on Emergency Departments as well as referral-based outpatient services, such as mental health support, renal dialysis and a range of medical and allied health specialty clinics, based on the specific needs of their local communities.
$58.4 million in hospital parking projects to meet increasing demand for parking, including:
| • | | $43.7 million for construction of a new multi-storey car park at The Prince Charles Hospital. |
| • | | $10.0 million for construction of a new multi-storey car park at the Queen Elizabeth II Jubilee Hospital. |
| • | | $2.7 million for completion of the new multi-storey car park at Caboolture Hospital, providing approximately 1,080 parking spaces in a mix of multi-storey and at grade facilities, accessible parking spaces, electric vehicle charging bays and motorcycle parking. Combined with other car spaces around the site, there will be approximately 1,640 spaces in total. |
| • | | $2 million for completion of a new multi-level car park for Redland Hospital. |
$52.1 million for an expansion of the Gold Coast University Hospital to deliver a Secure Mental Health Rehabilitation Unit.
$45.6 million for the Building Rural and Remote Health Program Phase 1 to address ageing infrastructure at Camooweal, St George, Morven, Charleville and Blackwater, and provide a safe and contemporary environment for the communities’ health services.
$28.7 million as part of the Rural and Regional Infrastructure Package for construction of a new mental health facility at Cairns Hospital, a purpose-built Sarina Hospital and staff accommodation, and for the replacement of the Mer (Murray) Island Primary Health Care Centre.
$20.2 million as part of the Advancing Queensland’s Health Infrastructure Program to continue essential upgrades to health facilities and supporting infrastructure across Queensland, including
67
Capital Statement 2023-24
repurposing of the Nambour Hospital, redevelopment of the Atherton Hospital including the emergency department and operating theatres, and staged refurbishment of the Thursday Island Hospital and Primary Health Care Centre.
$12.0 million for the Staff Accommodation Program to renew and enhance healthcare staff accommodation in Torres and Cape and North West Hospital and Health Services.
$11.5 million for the Toowoomba Day Surgery Theatre to construct a 2-theatre day surgery unit at the Baillie Henderson Hospital Campus.
$10.3 million for planning and initiatives under Better Care Together, a new 5-year plan for state funded mental health, alcohol and other drug services.
$9.8 million for the Woorabinda Multi-Purpose Health Service to increase from 4 residential aged care beds to 14, including the upgrade of the laundry facilities and the construction of a new kitchen.
$8.3 million for the Alcohol and Other Drug Community Treatment Program. The program will deliver a new 45 bed adult Alcohol and Other Drug Residential Rehabilitation Service in West Moreton, 28 bed adult Alcohol and Other Drug Residential Rehabilitation Service in Wide Bay and 10 bed youth Alcohol and Other Drug Residential Rehabilitation Service in Cairns.
$8.3 million for the Ipswich Hospital Upgrade to improve utilisation of space in the current hospital and address increased service demands on the emergency department, maternity and gynaecology services and renal dialysis and nephrology services.
$8.2 million for the Fraser Coast Mental Health Service Enhancement, providing a new adult acute mental health inpatient unit at Hervey Bay Hospital and sub-acute older persons mental health unit refurbishment at Maryborough Hospital.
$8.0 million will be spent in 2023–24 for the demolition and construction of a new clinical services building and a new mental health facility as the first tranche of the Stage 2 Redland Hospital Expansion. This is from the total approved commitment of $150.0 million over 4 years.
$84.9 million will be invested in ICT to support the safe and efficient provision of health services that enable the successful delivery of health care and business services across Queensland. This investment will assist the transformation of healthcare delivery and mitigate the risk of digital infrastructure failure. Digital enhancements will also improve equity of service at rural and remote sites.
$11.4 million will be allocated by Hospital and Health Services for capital projects across Queensland in 2023–24. Projects include:
| • | | $5.8 million for digital works for the Caboolture Hospital Redevelopment project. |
| • | | $1.5 million for the replacement of the electrical, mechanical, hydraulic infrastructure, park lift and refurbishment of the level 3 residential care spaces and roof repairs at Halwyn Centre. |
| • | | $1.2 million for refurbishment works and the extension of the Cunnamulla Multi-Purpose Healthcare Service to support an additional ten aged care beds. |
| • | | $0.8 million for an extension of the Augathella Multi-Purpose Healthcare Service to support an additional two aged care beds. |
| • | | $0.7 million for an extension of the Injune Multi-Purpose Healthcare Service to support an additional two aged care beds. |
| • | | $0.6 million for an extension of the Surat Multi-Purpose Healthcare Service to support an additional two aged care beds. |
68
Capital Statement 2023-24
$4.1 million has been allocated to other acquisitions of property, plant and equipment across the state, including:
| • | | $1.7 million for the completion of the Statewide General Chemistry and Immunoassay Replacement and Automation Project. |
| • | | $1.1 million for the AUSLAB Unique Tube Identifier project delivering additional system functionality to the AUSLAB Laboratory Information System. |
| • | | $0.3 million for the Queensland Health Emission Reduction Program to support Queensland Health’s statewide energy efficiency projects. |
Queensland Ambulance Service
In 2023–24, the QAS will invest $105.3 million in enabling critical infrastructure to support essential frontline services to provide timely, quality, and appropriate patient focused pre-hospital emergency and non-emergency care and services to the community. In implementing its capital program, the QAS will review opportunities for co-location and integration with health services, thus improving the close linkages and working relationships between public hospitals, as well as other emergency management infrastructure. Highlights of the capital program include:
| • | | $48.3 million to progress the planning and construction phases for new ambulance stations at Caloundra South, Lawnton and Morayfield, the new Ripley Ambulance Station and West Moreton District Office, replacement of the North Rockhampton Ambulance Station and Central Queensland Regional Office and the new Burdell Ambulance Station and the North Queensland and Townsville District Office. |
| • | | $8.4 million for the planning, design and construction phases for the redevelopment of the Cairns Ambulance Station and Operations Centre, Gold Coast Operations Centre (Coomera), Southport Ambulance Station and Pimpama Ambulance Station. |
| • | | $10.8 million for the planning, design and construction phases for the relocation of the Springwood Ambulance Station and Sandgate Ambulance Station and the redevelopment of Beenleigh Ambulance Station. |
| • | | $5.0 million investment in minor works at various existing stations to improve functionality, amenities and prolong useful life. |
| • | | $1.5 million investment in the acquisition of strategically located land to accommodate future expansion of services aligned with identified growth areas. |
| • | | $28.3 million to commission 144 new and replacement ambulance vehicles including the continued rollout of power assisted stretchers and $1.5 million for the fit out of emergency response vehicles. |
| • | | $2.1 million investment in information and communication technology for software development projects to enhance patient care and service delivery. |
| • | | $1.0 million in operational equipment to support frontline services. |
Council of the Queensland Institute of Medical Research
The 2023–24 QIMR Berghofer capital program will invest $7.7 million for the acquisition of new and/or replacement state-of-the-art scientific equipment and research facilities.
69
Capital Statement 2023-24
| | | | | | | | | | | | | | | | | | | | |
| Queensland Health | |
Project | | Statistical
Area | | | Total
Estimated
Cost
$‘000 | | | Expenditure
to
30-06-23
$‘000 | | | Budget
2023-24
$‘000 | | | Post
2023-24
$‘000 | |
QUEENSLAND HEALTH AND HOSPITAL AND HEALTH SERVICES | | | | | | | | | |
Property, Plant and Equipment1 | | | | | | | | | | | | | | | | | | | | |
Hospital and Health Services | | | | | | | | | | | | | | | | | | | | |
Advancing Queensland Health Infrastructure Program | | | Various | | | | 257,986 | | | | 218,077 | | | | 20,159 | | | | 19,750 | |
Alcohol and Other Drug Community Treatment Program | | | 305 | | | | 51,000 | | | | 4,298 | | | | 8,294 | | | | 38,408 | |
Better Care Together | | | 305 | | | | 28,455 | | | | 500 | | | | 10,307 | | | | 17,648 | |
Bowen Overall Program of Works | | | 312 | | | | 3,700 | | | | 3,200 | | | | 500 | | | | | |
Building Better Hospitals | | | | | | | | | | | | | | | | | | | | |
Caboolture Hospital Redevelopment Stage 12 | | | 313 | | | | 352,900 | | | | 247,013 | | | | 34,362 | | | | 71,525 | |
Ipswich Hospital Expansion Stage 1A2 | | | 310 | | | | 146,300 | | | | 133,757 | | | | 4,685 | | | | 7,858 | |
Logan Hospital Expansion Stage 12 | | | 311 | | | | 460,871 | | | | 244,327 | | | | 81,981 | | | | 134,563 | |
Logan Hospital Maternity Services Upgrade3 | | | 311 | | | | 15,600 | | | | 15,198 | | | | 402 | | | | | |
Building Rural and Remote Health Program | | | Various | | | | 94,660 | | | | 13,288 | | | | 45,592 | | | | 35,780 | |
Business Case Program | | | Various | | | | | | | | | | | | 9,914 | | | | Ongoing | |
Caboolture Hospital Multi-Storey Car Park | | | 313 | | | | 46,610 | | | | 37,933 | | | | 2,675 | | | | 6,002 | |
Cairns Bay Village Project | | | 306 | | | | 12,000 | | | | 250 | | | | 5,000 | | | | 6,750 | |
Cairns Hospital Emergency Department Expansion | | | 306 | | | | 30,000 | | | | 15,484 | | | | 3,844 | | | | 10,672 | |
Cairns Hospital Research Education and Innovation Centre Land Acquisition | | | 306 | | | | 11,000 | | | | 10,026 | | | | 974 | | | | | |
Capacity Expansion Program | | | | | | | | | | | | | | | | | | | | |
New Bundaberg Hospital | | | 319 | | | | 1,200,000 | | | | 16,901 | | | | 52,300 | | | | 1,130,799 | |
New Coomera Hospital | | | 309 | | | | 1,300,000 | | | | 16,263 | | | | 74,000 | | | | 1,209,737 | |
New Toowoomba Hospital | | | 317 | | | | 1,300,000 | | | | 15,000 | | | | 50,000 | | | | 1,235,000 | |
Capacity Expansion Program - Rest of Program | | | Various | | | | 5,985,000 | | | | 70,333 | | | | 238,260 | | | | 5,676,407 | |
Capital Infrastructure Projects - CHQ | | | 305 | | | | 7,691 | | | | 4,983 | | | | 1,910 | | | | 798 | |
Community Health and Hospitals | | | | | | | | | | | | | | | | | | | | |
Caboolture Hospital Chemotherapy Chairs | | | 313 | | | | 10,000 | | | | 6,010 | | | | 3,990 | | | | | |
Emerald Hospital Emergency Department Upgrade | | | 308 | | | | 10,000 | | | | 7,290 | | | | 2,610 | | | | 100 | |
Logan Urgent and Specialist Care Centre | | | 311 | | | | 33,400 | | | | 662 | | | | 22,738 | | | | 10,000 | |
Redcliffe Hospital Paediatric Emergency Department Redesign | | | 313 | | | | 10,000 | | | | 8,561 | | | | 76 | | | | 1,363 | |
70
Capital Statement 2023-24
| | | | | | | | | | | | | | | | | | |
| Queensland Health | |
Project | | Statistical
Area | | Total
Estimated
Cost
$‘000 | | | Expenditure
to
30-06-23
$‘000 | | | Budget
2023-24
$‘000 | | | Post
2023-24
$‘000 | |
Redland Hospital Expansion - Stage 14 | | 301 | | | 62,000 | | | | 8,196 | | | | 28,410 | | | | 25,394 | |
Townsville Hospital South Block Level 1 Fit Out 33-Bed Acute Medical Receiving Unit | | 318 | | | 12,980 | | | | 11,044 | | | | 401 | | | | 1,535 | |
Dakabin Family and Community Place | | 314 | | | 8,056 | | | | 510 | | | | 7,546 | | | | | |
Fraser Coast Mental Health Project | | 319 | | | 39,610 | | | | 27,003 | | | | 8,203 | | | | 4,404 | |
Gold Coast Secure Mental Health Rehabilitation Unit | | 309 | | | 122,744 | | | | 16,290 | | | | 52,075 | | | | 54,379 | |
Ipswich Hospital Upgrade | | 310 | | | 22,000 | | | | 5,959 | | | | 8,325 | | | | 7,716 | |
Kirwan Health Campus | | 318 | | | 40,000 | | | | 1,453 | | | | 17,990 | | | | 20,557 | |
Logan Hospital 28-Bed Modular Ward | | 311 | | | 20,000 | | | | 13,014 | | | | 2,635 | | | | 4,351 | |
Mackay Community Mental Health Refurbishment | | 312 | | | 6,000 | | | | 322 | | | | 2,253 | | | | 3,425 | |
Master Planning Studies | | 305 | | | | | | | | | | | 1,850 | | | | Ongoing | |
Moura Multi-Purpose Healthcare Service | | 308 | | | 7,200 | | | | 132 | | | | 499 | | | | 6,569 | |
Old Roma Hospital Project Finalisation | | 307 | | | 3,327 | | | | 2,894 | | | | 433 | | | | | |
Princess Alexandra Hospital Limited Care Dialysis Unit Refurbishment | | 303 | | | 12,731 | | | | 101 | | | | 8,812 | | | | 3,818 | |
Proserpine Hospital Acute Primary Care Clinic Upgrade | | 312 | | | 5,000 | | | | 9 | | | | 3,993 | | | | 998 | |
Queen Elizabeth II Jubilee Hospital Car Park | | 303 | | | 29,810 | | | | 1,500 | | | | 10,000 | | | | 18,310 | |
Queensland Health Spinal Unit | | 303 | | | 5,000 | | | | | | | | 5,000 | | | | | |
Redland Hospital Expansion - Stage 2 | | 301 | | | 150,000 | | | | | | | | 8,000 | | | | 142,000 | |
Redland Hospital Multi-Level Car Park5 | | 301 | | | 50,465 | | | | 42,385 | | | | 2,010 | | | | 6,070 | |
Rockhampton Hospital Cardiac Hybrid Theatre | | 308 | | | 18,200 | | | | 661 | | | | 1,500 | | | | 16,039 | |
Rockhampton Hospital Mental Health Ward Expansion | | 308 | | | 6,000 | | | | 64 | | | | 720 | | | | 5,216 | |
Rural and Regional Infrastructure Package | | | | | | | | | | | | | | | | | | |
Cairns Hospital Mental Health Unit | | 306 | | | 70,000 | | | | 38,262 | | | | 21,533 | | | | 10,205 | |
Mer (Murray) Island Building Replacement | | 315 | | | 8,800 | | | | 7,090 | | | | 1,710 | | | | | |
Sarina Hospital Redevelopment6 | | 312 | | | 31,500 | | | | 24,419 | | | | 5,443 | | | | 1,638 | |
Rural and Regional Renal Program | | Various | | | 9,320 | | | | 6,013 | | | | 2,697 | | | | 610 | |
Satellite Hospitals Program | | Various | | | 376,900 | | | | 274,036 | | | | 78,937 | | | | 23,927 | |
Staff Accommodation Program | | 315 | | | 21,104 | | | | 832 | | | | 12,000 | | | | 8,272 | |
Sunshine Coast University Hospital | | 316 | | | 1,872,151 | | | | 1,846,571 | | | | 16,580 | | | | 9,000 | |
Sunshine Coast University Hospital Patient Access and Coordination Hub | | 316 | | | 5,000 | | | | 150 | | | | 4,850 | | | | | |
Sustaining Capital Program7 | | Various | | | | | | | | | | | 346,540 | | | | Ongoing | |
71
Capital Statement 2023-24
| | | | | | | | | | | | | | | | | | | | |
| Queensland Health | |
Project | | Statistical
Area | | | Total
Estimated
Cost
$‘000 | | | Expenditure
to
30-06-23
$‘000 | | | Budget
2023-24
$‘000 | | | Post
2023-24
$‘000 | |
The Prince Charles Hospital Car Park | | | 302 | | | | 81,940 | | | | 6,729 | | | | 43,679 | | | | 31,532 | |
Toowoomba Day Surgery Theatre | | | 317 | | | | 42,000 | | | | 20,501 | | | | 11,531 | | | | 9,968 | |
Townsville University Hospital Hybrid Theatre | | | 318 | | | | 17,000 | | | | 933 | | | | 13,122 | | | | 2,945 | |
Townsville University Hospital Upgrades | | | 318 | | | | 8,000 | | | | 915 | | | | 6,203 | | | | 882 | |
Voluntary Assisted Dying ICT Solution | | | 305 | | | | 6,930 | | | | 6,135 | | | | 795 | | | | | |
Woorabinda Multi-Purpose Health Service | | | 308 | | | | 17,241 | | | | 4,573 | | | | 9,824 | | | | 2,844 | |
Yeronga Child and Youth Community Hub | | | 303 | | | | 7,835 | | | | 467 | | | | 4,380 | | | | 2,988 | |
| | | | | | | | | | | | | | | | | | | | |
Sub-total Hospital and Health Services | | | | | | | | | | | | | | | 1,425,052 | | | | | |
| | | | | | | | | | | | | | | | | | | | |
Other Acquisitions of Property, Plant and Equipment | | | | | | | | | | | | | | | | | | | | |
AUSLAB Unique Tube Identifier | | | 305 | | | | 2,624 | | | | 1,537 | | | | 1,087 | | | | | |
Building Works Capital Project Management | | | 305 | | | | | | | | | | | | 850 | | | | Ongoing | |
Cladding Investigation and Remediation Program | | | 312 | | | | 27,300 | | | | 26,763 | | | | 60 | | | | 477 | |
Queensland Health Emission Reduction Program | | | Various | | | | 30,000 | | | | 16,865 | | | | 346 | | | | 12,789 | |
State-Wide General Chemistry and Immunoassay Replacement and Automation Project | | | 305 | | | | 16,511 | | | | 14,385 | | | | 1,727 | | | | 399 | |
| | | | | | | | | | | | | |
Sub-total Other Acquisitions of Property, Plant and Equipment | | | | | | | | | | | | | | | 4,070 | | | | | |
| | | | | | | | | | | | | |
Information Communication and Technology | | | | | | | | | | | | | | | | | | | | |
Information Communication and Technology | | | 305 | | | | | | | | | | | | 84,929 | | | | Ongoing | |
| | | | | | | | | | | | | | | | | | | | |
Sub-total Information Communication and Technology | | | | | | | | | | | | | | | 84,929 | | | | | |
| | | | | | | | | | | | | | | | | | | | |
Central West | | | | | | | | | | | | | | | | | | | | |
Central West - ROU Lease | | | 315 | | | | 1,463 | | | | 340 | | | | 231 | | | | 892 | |
| | | | | | | | | | | | | | | | | | | | |
Sub-total Central West | | | | | | | | | | | | | | | 231 | | | | | |
| | | | | | | | | | | | | | | | | | | | |
Mackay | | | | | | | | | | | | | | | | | | | | |
Mackay - ROU Lease | | | 312 | | | | 2,393 | | | | 1,213 | | | | 162 | | | | 1,018 | |
| | | | | | | | | | | | | | | | | | | | |
Sub-total Mackay | | | | | | | | | | | | | | | 162 | | | | | |
| | | | | | | | | | | | | | | | | | | | |
Metro North | | | | | | | | | | | | | | | | | | | | |
Halwyn Centre Infrastructure Replacement and Refurbishment | | | 305 | | | | 2,151 | | | | 620 | | | | 1,531 | | | | | |
Metro North Health Caboolture Hospital Redevelopment Digital Project | | | 305 | | | | 20,000 | | | | 13,694 | | | | 5,814 | | | | 492 | |
| | | | | | | | | | | | | | | | | | | | |
Sub-total Metro North | | | | | | | | | | | | | | | 7,345 | | | | | |
| | | | | | | | | | | | | | | | | | | | |
72
Capital Statement 2023-24
| | | | | | | | | | | | | | | | | | | | |
| Queensland Health | |
Project | | Statistical
Area | | | Total
Estimated
Cost
$‘00 | | | Expenditure
to
30-06-23
$‘000 | | | Budget
2023-24
$‘000 | | | Post
2023-24
$‘000 | |
Metro South | | | | | | | | | | | | | | | | | | | | |
Metro South - Capital Projects | | | 303 | | | | 7,057 | | | | 6,814 | | | | 34 | | | | 209 | |
| | | | | | | | | | | | | | | | | | | | |
Sub-total Metro South | | | | | | | | | | | | | | | 34 | | | | | |
| | | | | | | | | | | | | |
South West | | | | | | | | | | | | | | | | | | | | |
Augathella Multi-Purpose Healthcare Service 2-Bed Aged Care | | | 315 | | | | 1,642 | | | | 861 | | | | 781 | | | | | |
Cunnamulla Multi-Purpose Healthcare Service 10-Bed Aged Care Project | | | 315 | | | | 2,149 | | | | 931 | | | | 1,218 | | | | | |
Surat Multi-Purpose Healthcare Service 2-Bed Aged Care | | | 307 | | | | 1,490 | | | | 843 | | | | 647 | | | | | |
Injune Multi-Purpose Healthcare Service 2-Bed Aged Care | | | 307 | | | | 1,660 | | | | 950 | | | | 710 | | | | | |
| | | | | | | | | | | | | |
Sub-total South West | | | | | | | | | | | | | | | 3,356 | | | | | |
| | | | | | | | | | | | | |
Sunshine Coast | | | | | | | | | | | | | | | | | | | | |
Sunshine Coast University Hospital Group 4 ICT Project | | | 316 | | | | 66,300 | | | | 66,288 | | | | 12 | | | | | |
| | | | | | | | | | | | | | | | | | | | |
Sub-total Sunshine Coast | | | | | | | | | | | | | | | 12 | | | | | |
| | | | | | | | | | | | | |
Torres and Cape | | | | | | | | | | | | | | | | | | | | |
Thursday Island Hospital CT Scanner | | | 315 | | | | 1,842 | | | | 1,602 | | | | 240 | | | | | |
| | | | | | | | | | | | | | | | | | | | |
Sub-total Torres and Cape | | | | | | | | | | | | | | | 240 | | | | | |
| | | | | | | | | | | | | |
Queensland Ambulance Service | | | | | | | | | | | | | | | | | | | | |
Beenleigh Ambulance Station Replacement | | | 311 | | | | 16,500 | | | | | | | | 300 | | | | 16,200 | |
Burdell New Station and Townsville District Office | | | 318 | | | | 12,400 | | | | 456 | | | | 10,819 | | | | 1,125 | |
Cairns Ambulance Station and Operations Centre | | | 306 | | | | 14,415 | | | | 502 | | | | 1,175 | | | | 12,738 | |
Caloundra South New Ambulance Station | | | 316 | | | | 7,900 | | | | 432 | | | | 6,168 | | | | 1,300 | |
Gold Coast Operations Centre Redevelopment (Coomera) | | | 309 | | | | 17,000 | | | | 977 | | | | 7,000 | | | | 9,023 | |
Lawnton New Ambulance Station | | | 314 | | | | 7,800 | | | | 1,105 | | | | 6,210 | | | | 485 | |
Morayfield New Ambulance Station | | | 313 | | | | 8,450 | | | | 1,311 | | | | 6,739 | | | | 400 | |
North Rockhampton Replacement Ambulance Station and District Office | | | 308 | | | | 12,150 | | | | 432 | | | | 11,000 | | | | 718 | |
Pimpama Ambulance Station Redevelopment | | | 309 | | | | 5,500 | | | | 193 | | | | 100 | | | | 5,207 | |
Ripley New Ambulance Station and West Moreton District | | | 310 | | | | 10,900 | | | | 3,056 | | | | 7,344 | | | | 500 | |
Sandgate Ambulance Station Relocation | | | | | | | 11,000 | | | | | | | | 9,000 | | | | 2,000 | |
73
Capital Statement 2023-24
| | | | | | | | | | | | | | | | | | |
| Queensland Health | |
Project | | Statistical
Area | | Total
Estimated
Cost
$‘000 | | | Expenditure
to
30-06-23
$‘000 | | | Budget
2023-24
$‘000 | | | Post
2023-24
$‘000 | |
Southport Ambulance Station Redevelopment | | 309 | | | 14,000 | | | | 481 | | | | 100 | | | | 13,419 | |
Springwood Ambulance Station Relocation | | 311 | | | 8,100 | | | | 100 | | | | 1,500 | | | | 6,500 | |
Minor Works | | 305 | | | | | | | | | | | 5,000 | | | | Ongoing | |
Strategic Land Acquisitions | | 305 | | | | | | | | | | | 1,500 | | | | Ongoing | |
Operational Equipment | | 305 | | | | | | | | | | | 1,000 | | | | Ongoing | |
Ambulance Vehicle Purchases | | 305 | | | | | | | | | | | 28,270 | | | | Ongoing | |
Information Systems Development | | 305 | | | | | | | | | | | 2,100 | | | | Ongoing | |
| | | | | | | | | | | | | | | | | | |
Sub-total Queensland Ambulance Service | | | | | | | | | | | | | 105,325 | | | | | |
| | | | | | | | | | | | | | | | | | |
| | | | | | | | | | | | | | | | | | |
| | | | | | | | | | | | | | | | | | |
Total Property, Plant and Equipment | | | | | | | | | | | | | 1,630,756 | | | | | |
| | | | | | | | | | | | | | | | | | |
QUEENSLAND INSTITUTE OF MEDICAL RESEARCH BERGHOFER | | | | | | | | | |
Property, Plant and Equipment | | | | | | | | | | | | | | | | | | |
Other scientific equipment - QIMRB | | 305 | | | | | | | | | | | 7,675 | | | | Ongoing | |
| | | | | | | | | | | | | | | | | | |
Total Property, Plant and Equipment | | | | | | | | | | | | | 7,675 | | | | | |
| | | | | | | | | | | | | | | | | | |
| | | | | | | | | | | | | | | | | | |
| | | | | | | | | | | | | | | | | | |
TOTAL QUEENSLAND HEALTH (PPE) | | | | | | | | | | | | | 1,638,431 | | | | | |
| | | | | | | | | | | | | | | | | | |
Notes:
| 1. | Total estimated cost may include both non-capital and capital components of project expenditure. |
| 2. | Total estimated cost includes funding of $3 million from South East Queensland - Planning for Growth. |
| 3. | Total funding for the Logan Hospital Maternity Services Update is $18.9 million including funding of $2.3 million from Metro South Hospital and Health Service and $1 million from minor capital projects and acquisitions. |
| 4. | Total funding for the Redland Hospital Expansion Stage 1 is $62 million including State funding of $32 million. |
| 5. | Total funding for the Redland Hospital Multi-level Carpark is $50.4 million including funding of $16 million from Community Health and Hospitals. |
| 6. | Total funding for Sarina Hospital Redevelopment is $31.5 million including funding of $10 million from Mackay Hospital and Health Service. |
| 7. | Amount is net of non capital component of project expenditure. |
74
Capital Statement 2023-24
| 3.13 | QUEENSLAND POLICE SERVICE |
The 2023–24 Queensland Police Service capital program of $362.6 million will support the delivery of quality frontline services throughout Queensland. The program will fund police facilities, motor vehicles, aviation assets, vessels and other essential equipment.
Program Highlights (Property, Plant and Equipment)
| • | | $108.7 million for the aircraft acquisition program. |
| • | | $59.8 million for new and replacement police service vehicles including new armoured vehicles for Specialist Response Group. |
| • | | $22.6 million for the Public Safety Network. |
| • | | $20.5 million to continue the replacement police facilities at Cunnamulla, Hervey Bay, Kirwan and Rosewood. |
| • | | $17.9 million for Camera Detected Offence Program equipment. |
| • | | $17.0 million for information and communications technology. |
| • | | $15.2 million to complete the upgrade of the police facilities at Cairns, Dalby and Maryborough. |
| • | | $12.7 million to complete the replacement police facilities at Clermont, Cooroy and Dayboro. |
| • | | $11.1 million for minor capital works and other plant and equipment across the state. |
| • | | $9.0 million to continue the new police facilities at Caloundra and Ripley. |
| • | | $8.9 million to continue the upgrades of the Mackay and Warwick police facilities. |
| • | | $7.3 million for the marine rescue vessel replacement program, which will be transferred to Marine Rescue Queensland in 2023–24. |
| • | | $6.1 million for Queensland Ambulance Service and Queensland Fire and Emergency Services information systems. |
| • | | $5.5 million for upgrades and replacements to air conditioning and closed circuit cameras at police facilities across the state. |
| • | | $4.1 million for new and replacement police service vessels. |
| • | | $3.7 million for aircraft maintenance. |
| • | | $3.0 million for the new residential accommodation at Mount Isa and Tara. |
| • | | $2.7 million for mobile capability and the development of new applications for the QPS QLiTE mobile tablet devices. |
| • | | $1.5 million for land acquisitions. |
| • | | $250,000 to continue the replacement police facilities at Longreach, Proserpine, Rainbow Beach and Winton, and the multi-agency community safety facility at Palm Island. |
| • | | $200,000 to commence the replacement of the water police facility at Hervey Bay. |
Program Highlights (Capital Grant)
| • | | $25.0 million to PCYC Queensland for infrastructure development. |
75
Capital Statement 2023-24
| | | | | | | | | | | | | | | | | | | | |
| Queensland Police Service | |
Project | | Statistical
Area | | | Total
Estimated
Cost
$‘000 | | | Expenditure
to
30-06-23
$‘000 | | | Budget
2023-24
$‘000 | | | Post
2023-24
$‘000 | |
QUEENSLAND POLICE SERVICE | | | | | | | | | | | | | | | | | | | | |
Property, Plant and Equipment | | | | | | | | | | | | | | | | | | | | |
Buildings/ General Works | | | | | | | | | | | | | | | | | | | | |
Cairns police facility upgrade | | | 306 | | | | 20,000 | | | | 18,600 | | | | 1,400 | | | | | |
Caloundra South new police facility | | | 316 | | | | 13,500 | | | | 500 | | | | 4,000 | | | | 9,000 | |
Clermont replacement police facility | | | 312 | | | | 3,500 | | | | 200 | | | | 3,300 | | | | | |
Cooroy replacement police facility | | | 316 | | | | 5,300 | | | | 366 | | | | 4,934 | | | | | |
Cunnamulla replacement police facility | | | 315 | | | | 13,000 | | | | 139 | | | | 2,361 | | | | 10,500 | |
Dalby police facility upgrade | | | 307 | | | | 19,000 | | | | 8,852 | | | | 10,148 | | | | | |
Dayboro replacement police facility | | | 314 | | | | 4,800 | | | | 360 | | | | 4,440 | | | | | |
Hervey Bay replacement police facility | | | 319 | | | | 14,000 | | | | 160 | | | | 940 | | | | 12,900 | |
Hervey Bay replacement water police facility | | | 319 | | | | 3,800 | | | | | | | | 200 | | | | 3,600 | |
Kirwan replacement police facility | | | 318 | | | | 30,000 | | | | 1,200 | | | | 15,000 | | | | 13,800 | |
Longreach replacement police facility | | | 315 | | | | 13,800 | | | | 50 | | | | 50 | | | | 13,700 | |
Mackay police facility upgrade | | | 312 | | | | 4,000 | | | | 500 | | | | 3,000 | | | | 500 | |
Maryborough police facility upgrade | | | 319 | | | | 4,000 | | | | 379 | | | | 3,621 | | | | | |
Mount Isa new residential accommodation | | | 315 | | | | 5,750 | | | | 100 | | | | 1,000 | | | | 4,650 | |
Palm Island multi-agency community safety facility | | | 318 | | | | 18,000 | | | | 50 | | | | 50 | | | | 17,900 | |
Proserpine replacement police facility | | | 312 | | | | 2,300 | | | | 50 | | | | 50 | | | | 2,200 | |
Rainbow Beach replacement police facility | | | 319 | | | | 2,300 | | | | 50 | | | | 50 | | | | 2,200 | |
Ripley new police facility | | | 310 | | | | 25,000 | | | | 1,000 | | | | 5,000 | | | | 19,000 | |
Rosewood replacement police facility | | | 310 | | | | 4,000 | | | | 309 | | | | 2,191 | | | | 1,500 | |
Tara new residential accommodation | | | 307 | | | | 2,500 | | | | 500 | | | | 2,000 | | | | | |
Warwick police facility upgrade | | | 307 | | | | 15,000 | | | | 640 | | | | 5,860 | | | | 8,500 | |
Winton replacement police facility | | | 315 | | | | 4,600 | | | | 50 | | | | 50 | | | | 4,500 | |
| | | | | | | | | | | | | | | | | | | | |
Sub-total Buildings/ General Works | | | | | | | | | | | | | | | 69,645 | | | | | |
| | | | | | | | | | | | | | | | | | | | |
Land | | | | | | | | | | | | | | | | | | | | |
Land acquisition | | | Various | | | | | | | | | | | | 1,500 | | | | Ongoing | |
| | | | | | | | | | | | | | | | | | | | |
Sub-total Land | | | | | | | | | | | | | | | 1,500 | | | | | |
| | | | | | | | | | | | | | | | | | | | |
Plant and Equipment | | | | | | | | | | | | | | | | | | | | |
Air conditioning plant replacement program | | | Various | | | | | | | | | | | | 4,000 | | | | Ongoing | |
Aircraft Acquisition Program | | | Various | | | | 146,301 | | | | 25,849 | | | | 108,672 | | | | 11,780 | |
Aircraft Maintenance | | | Various | | | | | | | | | | | | 3,740 | | | | Ongoing | |
76
Capital Statement 2023-24
| | | | | | | | | | | | | | | | | | |
| Queensland Police Service | |
Project | | Statistical
Area | | Total
Estimated
Cost
$‘000 | | | Expenditure
to
30-06-23
$‘000 | | | Budget
2023-24
$‘000 | | | Post
2023-24
$‘000 | |
Camera Detected Offence Program | | Various | | | | | | | | | | | 17,908 | | | | Ongoing | |
Closed circuit camera upgrades in various police facilities | | Various | | | | | | | | | | | 1,500 | | | | Ongoing | |
Information and communication technology | | Various | | | | | | | | | | | 16,950 | | | | Ongoing | |
Marine rescue vessel replacement program | | Various | | | | | | | | | | | 7,250 | | | | Ongoing | |
Minor works | | Various | | | | | | | | | | | 6,045 | | | | Ongoing | |
Mobile capability | | Various | | | | | | | | | | | 2,720 | | | | Ongoing | |
New and replacement vehicles including new armoured vehicles for Specialist Response Group | | Various | | | | | | | | | | | 59,818 | | | | Ongoing | |
Police vessel management program | | Various | | | | | | | | | | | 4,115 | | | | Ongoing | |
Public Safety Network | | Various | | | | | | | | | | | 22,570 | | | | Ongoing | |
Queensland Ambulance Service information systems development | | Various | | | | | | | | | | | 3,250 | | | | Ongoing | |
Queensland Fire and Emergency Services information and communications systems and equipment | | Various | | | | | | | | | | | 2,828 | | | | Ongoing | |
Other plant and equipment | | Various | | | | | | | | | | | 5,066 | | | | Ongoing | |
| | | | | | | | | | | | | | | | | | |
Sub-total Plant and Equipment | | | | | | | | | | | | | 266,432 | | | | | |
| | | | | | | | | | | | | | | | | | |
| | | | | | | | | | | | | | | | | | |
| | | | | | | | | | | | | | | | | | |
Total Property, Plant and Equipment | | | | | | | | | | | | | 337,577 | | | | | |
| | | | | | | | | | | | | | | | | | |
Capital Grants | | | | | | | | | | | | | | | | | | |
PCYC Queensland Capital Works | | Various | | | 50,000 | | | | | | | | 25,000 | | | | 25,000 | |
| | | | | | | | | | | | | | | | | | |
Total Capital Grants | | | | | | | | | | | | | 25,000 | | | | | |
| | | | | | | | | | | | | | | | | | |
TOTAL QUEENSLAND POLICE SERVICE (PPE) | | | | | | | | | | | | | | | | | | |
| | | | | | | | | | | | | | | | | | |
| | | | | | | | | | | | | 337,577 | | | | | |
| | | | | | | | | | | | | | | | | | |
TOTAL QUEENSLAND POLICE SERVICE (CG) | | | | | | | | | | | | | | | | | | |
| | | | | | | | | | | | | | | | | | |
| | | | | | | | | | | | | 25,000 | | | | | |
| | | | | | | | | | | | | | | | | | |
77
Capital Statement 2023-24
Queensland Treasury
Queensland Treasury has a capital purchase of $44.0 million and capital grants of $152.0 million in 2023–24.
Program Highlights (Total Property, Plant and Equipment)
| • | | $44.0 million to develop a Queensland Resources Common User Facility to support pilot and demonstration scale trials of processing methods and technologies for critical minerals and rare earth elements. |
Program Highlights (Capital Grants)
| • | | $72.0 million through the Queensland First Home Owners’ Grant to assist first-time home buyers buying or building a new home with grants to get into the market sooner. |
| • | | $80.0 million HomeBuilder Grant provided by the Australian Government to eligible applicants towards building a new home, buying a new home or substantially renovating an existing home. The Queensland Government is delivering the HomeBuilder Grant on behalf of the Australian Government. |
| | | | | | | | | | | | | | | | | | | | |
| Queensland Treasury | |
Project | | Statistical
Area | | | Total
Estimated
Cost
$‘000 | | | Expenditure
to
30-06-23
$‘000 | | | Budget
2023-24
$‘000 | | | Post
2023-24
$‘000 | |
QUEENSLAND TREASURY | | | | | | | | | | | | | | | | | | | | |
Property, Plant and Equipment | | | | | | | | | | | | | | | | | | | | |
Queensland Resources Common User Facility | | | 318 | | | | 60,742 | | | | 1,542 | | | | 43,950 | | | | 15,250 | |
| | | | | | | | | | | | | | | | | | | | |
Total Property, Plant and Equipment | | | | | | | | | | | | | | | 43,950 | | | | | |
| | | | | | | | | | | | | | | | | | | | |
Capital Grants | | | | | | | | | | | | | | | | | | | | |
Queensland First Home Owners’ Grant | | | Various | | | | | | | | | | | | 72,001 | | | | Ongoing | |
HomeBuilder Grant (Australian Government) | | | Various | | | | 364,290 | | | | 284,290 | | | | 80,000 | | | | | |
| | | | | | | | | | | | | | | | | | | | |
Total Capital Grants | | | | | | | | | | | | | | | 152,001 | | | | | |
| | | | | | | | | | | | | | | | | | | | |
TOTAL QUEENSLAND TREASURY (PPE) | | | | | | | | | | | | | | | 43,950 | | | | | |
| | | | | | | | | | | | | | | | | | | | |
TOTAL QUEENSLAND TREASURY (CG) | | | | | | | | | | | | | | | 152,001 | | | | | |
| | | | | | | | | | | | | | | | | | | | |
78
Capital Statement 2023-24
| 3.15 | REGIONAL DEVELOPMENT, MANUFACTURING AND WATER |
The Regional Development, Manufacturing and Water portfolio includes the Department of Regional Development, Manufacturing and Water, Gladstone Area Water Board, Mount Isa Area Water Board, Seqwater and Sunwater Limited. In 2023-24 the portfolio’s capital program includes capital purchases of $984.9 million and capital grants of $103.6 million.
Department of Regional Development, Manufacturing and Water
The Department of Regional Development, Manufacturing and Water has capital purchases of $3.5 million and capital grants of $103.6 million.
Program Highlights (Property, Plant and Equipment)
| • | | The Rookwood Weir project is providing investment into Central Queensland’s water supply for both agricultural and urban customers and will create up to 86,000 megalitres of new (medium priority equivalent) water allocations. The Queensland and Australian governments have each committed $183.6 million towards the project ($367.2 million in total). The total cost of the project is now estimated to be $568.9 million due to escalating supplier costs and multiple site inundations caused by high river flows; the increased cost will be funded by Sunwater. The project is on track for completion by early 2024. |
Program Highlights (Capital Grants)
| • | | $32.2 million through the Made in Queensland program to assist small to medium sized manufacturers to increase international competitiveness, productivity and innovation via the adoption of new technologies, systems and processes, and to generate high-skilled jobs for the future. |
| • | | $28.0 million as part of the $70.0 million Building our Regions program (Round 6) to assist water service providers to deliver water and sewerage projects that create regional and economic development opportunities, support local industry growth, generate jobs, and improve liveability in Queensland’s regional communities. |
| • | | $16.7 million through the Manufacturing Hubs Grant Program to assist regional small to medium sized manufacturers to become more productive, build their advanced manufacturing capabilities and create the jobs of the future. |
| • | | $10.8 million as part of the $40.4 million Mount Morgan Pipeline project for Rockhampton Regional Council to construct a drinking water pipeline from Gracemere to Mount Morgan providing reliability of water supply. |
| • | | $5.3 million for the Toowoomba Regional Council to undertake construction of water treatment and supply works for its four satellite communities of Cambooya, Greenmount, Nobby and Clifton. |
Gladstone Area Water Board
Total expenditure planned for 2023-24 is $585 million, and is focused on continuing and improving water security and the effective, reliable, and safe operation of Gladstone Area Water Board’s infrastructure.
Program Highlights (Property, Plant and Equipment)
| • | | $548.5 million for construction of the Fitzroy to Gladstone Pipeline, a water security initiative |
79
Capital Statement 2023-24
| | to address the single source supply risk from Lake Awoonga, delivering water from the Lower Fitzroy River to Gladstone Area Water Board’s existing network. |
| • | | $5.2 million for a new treated water connection at Aldoga to enable new customer connections within the Gladstone State Development Area. |
| • | | $2.7 million for construction of a solar farm at Awoonga Dam to facilitate the reduction of carbon emissions. |
| • | | $2.3 million to continue planning and preparatory works for the Awoonga Dam spillway capacity upgrade to comply with dam safety standards for extreme weather events. |
| • | | $1.2 million to continue planning for the expansion of the Boat Creek pump station to increase resilience and capacity. |
Mount Isa Water Board
Total capital expenditure planned for 2023-24 is $9.9 million, and is focused on continuing and improving the cost-efficient, reliable, and safe operation of Mount Isa Water Board’s bulk water infrastructure.
Program Highlights (Property, Plant and Equipment)
| • | | $2.5 million to renew the high-voltage yard and electro-mechanical equipment in the Fred Haigh pump station to improve operational reliability and efficiency. |
| • | | $1.8 million to renew the leaking joint sealant system of the 50 megalitre reservoir, including refurbishment of existing North reservoir to serve as a backup. |
| • | | $815,000 to continue replacing the aged timber poles and cross-arms of the Lake Julius 66kV power line with bushfire-resistant materials (concrete and steel). |
| • | | $670,000 to address recurring damage to Lake Julius access road and renewals of other road assets. |
Seqwater
Total capital expenditure planned for 2023-24 is $173.9 million. The capital program is focused on delivering a safe, secure and reliable water supply across South East Queensland, as well as supporting planning activities for future dam improvement projects. Seqwater operates the South East Queensland Water Grid and has facilities located throughout the region. This requires a large program of renewals as well as upgrades and compliance-driven works to ensure effective operation.
Program Highlights (Property, Plant and Equipment)
| • | | $24.4 million to complete construction on the South West Pipeline to connect the Beaudesert region to the South East Queensland Water Grid and improve water security. |
| • | | $17.5 million to continue planning and investigatory work for dam improvement projects to comply with dam safety standards for extreme weather events, including Wivenhoe Dam, North Pine Dam, Somerset Dam and Lake Macdonald Dam. |
| • | | $13.4 million to construct the Toowoomba to Warwick Pipeline to provide a drought contingency for Warwick and surrounding communities and a permanent water supply to four Toowoomba satellite communities. |
| • | | $11.1 million for the Mount Crosby Weir Bridge structure upgrade to construct a new vehicle bridge to improve flood resilient access between Mount Crosby East Bank and West Bank and improve structure performance. |
Sunwater Limited
Total capital expenditure planned for 2023-24 is $212.6 million. The capital program is focused
80
Capital Statement 2023-24
| | on enhancing Sunwater’s dam infrastructure to continue operating safely during extreme weathe conditions and to provide a reliable water supply to regional Queensland. It will also support the expansion of Sunwater’s Rocklea laboratory facility to produce commercial modelling for dam safety design and development programs. |
Program Highlights (Property, Plant and Equipment)
| • | | $116.4 million to continue planning and commence enabling works for the Paradise Dam improvement project. |
| • | | $19.5 million to continue planning and commence pre-construction activities for the Burdekin Falls Dam improvement and raising projects. $440 million has been committed as part of reinvesting in the regions, on top of the existing $100 million commitment. |
| | | | | | | | | | | | | | | | | | |
| Regional Development, Manufacturing and Water | |
Project | | Statistical
Area | | Total
Estimated
Cost
$‘000 | | | Expenditure
to
30-06-23
$‘000 | | | Budget
2023-24
$‘000 | | | Post
2023-24
$‘000 | |
DEPARTMENT OF REGIONAL DEVELOPMENT, MANUFACTURING AND WATER | |
Property, Plant and Equipment1 | | | | | | | | | | | | | | | | | | |
Other property, plant and equipment | | Various | | | | | | | | | | | 3,500 | | | | Ongoing | |
| | | | | | | | | | | | | | | | | | |
Total Property, Plant and Equipment | | | | | | | | | | | | | 3,500 | | | | | |
| | | | | | | | | | | | | | | | | | |
Capital Grants | | | | | | | | | | | | | | | | | | |
Building our Regions (Round 6) | | Various | | | 70,000 | | | | 21,000 | | | | 28,000 | | | | 21,000 | |
Fish-friendly water extraction project: Condamine-Balonne and Border Rivers | | Various | | | 6,614 | | | | 4,218 | | | | 2,396 | | | | | |
Improving Great Artesian Basin Drought Resilience | | Various | | | 18,200 | | | | 15,600 | | | | 2,600 | | | | | |
Made in Queensland | | Various | | | 101,500 | | | | 49,555 | | | | 32,160 | | | | 19,785 | |
Manufacturing Hub Grant Program | | Various | | | 28,500 | | | | 11,331 | | | | 16,669 | | | | 500 | |
Mount Morgan Pipeline | | 308 | | | 40,350 | | | | 18,150 | | | | 10,825 | | | | 11,375 | |
Southern Downs Drought Resilience Package | | 307 | | | 7,640 | | | | 4,861 | | | | 2,779 | | | | | |
Southern Downs smart reticulation and network monitoring | | 307 | | | 8,500 | | | | 1,700 | | | | 1,700 | | | | 5,100 | |
Toowoomba water treatment to four communities | | 317 | | | 15,000 | | | | | | | | 5,250 | | | | 9,750 | |
Warren’s Gully system capacity upgrade project | | 318 | | | 4,760 | | | | 3,570 | | | | 1,190 | | | | | |
| | | | | | | | | | | | | | | | | | |
Total Capital Grants | | | | | | | | | | | | | 103,569 | | | | | |
| | | | | | | | | | | | | | | | | | |
GLADSTONE AREA WATER BOARD | | | | | | | | | | | | | | | | | | |
Property, Plant and Equipment | | | | | | | | | | | | | | | | | | |
Aldoga treated water connection | | 308 | | | 7,711 | | | | 2,481 | | | | 5,230 | | | | | |
Awoonga Dam pipeline remediation | | 308 | | | 3,410 | | | | 1,005 | | | | 1,595 | | | | 810 | |
Awoonga Dam recreation area expansion | | 308 | | | 7,195 | | | | 4,426 | | | | 2,769 | | | | | |
Awoonga Dam solar farm | | 308 | | | 2,946 | | | | 200 | | | | 2,746 | | | | | |
81
Capital Statement 2023-24
| | | | | | | | | | | | | | | | | | | | |
| Regional Development, Manufacturing and Water | |
Project | | Statistical
Area | | | Total
Estimated
Cost
$‘000 | | | Expenditure
to
30-06-23
$‘000 | | | Budget
2023-24
$‘000 | | | Post
2023-24
$‘000 | |
Awoonga Dam spillway capacity upgrade - planning | | | 308 | | | | 8,494 | | | | 6,207 | | | | 2,287 | | | | | |
Boyne Island Reservoir roof replacement | | | 308 | | | | 2,636 | | | | 1,368 | | | | 1,268 | | | | | |
East End Pipeline replacement - planning | | | 308 | | | | 9,616 | | | | 109 | | | | 1,141 | | | | 8,366 | |
Expansion of Boat Creek pump station - planning | | | 308 | | | | 5,507 | | | | 416 | | | | 1,191 | | | | 3,900 | |
Fitzroy to Gladstone Pipeline | | | 308 | | | | 983,000 | | | | 166,400 | | | | 548,530 | | | | 268,070 | |
Gladstone Water Treatment Plant onsite generator | | | 308 | | | | 1,000 | | | | | | | | 1,000 | | | | | |
Golegumma pipeline replacement | | | 308 | | | | 6,700 | | | | 2,450 | | | | 3,000 | | | | 1,250 | |
Program of smaller capital works projects | | | 308 | | | | | | | | | | | | 7,755 | | | | Ongoing | |
Queensland Alumina Limited raw water pipeline replacement | | | 308 | | | | 6,737 | | | | 264 | | | | 4,316 | | | | 2,157 | |
Raw water pipeline, Glen Eden and Moura rail reline | | | 308 | | | | 1,789 | | | | 211 | | | | 1,000 | | | | 578 | |
Right of use lease assets | | | 308 | | | | 1,214 | | | | | | | | 1,214 | | | | | |
| | | | | | | | | | | | | | | | | | | | |
Total Property, Plant and Equipment | | | | | | | | | | | | | | | 585,042 | | | | | |
| | | | | | | | | | | | | | | | | | | | |
MOUNT ISA WATER BOARD | | | | | | | | | | | | | | | | | | | | |
Property, Plant and Equipment | | | | | | | | | | | | | | | | | | | | |
Booster station switchyard renewal | | | 315 | | | | 660 | | | | | | | | 150 | | | | 510 | |
Fred Haigh pump station electro-mechanical overhaul | | | 315 | | | | 12,488 | | | | 9,988 | | | | 2,500 | | | | | |
Lake Julius access road renewal and other road renewals | | | 315 | | | | 1,951 | | | | 81 | | | | 670 | | | | 1,200 | |
Lake Julius power pole replacement | | | 315 | | | | 1,921 | | | | 821 | | | | 815 | | | | 285 | |
Mount Isa Terminal Reservoir filtration membrane modules options | | | 315 | | | | 1,850 | | | | | | | | 650 | | | | 1,200 | |
Other asset enhancements | | | 315 | | | | | | | | | | | | 495 | | | | Ongoing | |
Other asset renewals | | | 315 | | | | | | | | | | | | 700 | | | | Ongoing | |
Pipeline renewals | | | 315 | | | | 1,115 | | | | | | | | 300 | | | | 815 | |
Power network upgrade | | | 315 | | | | 1,003 | | | | 88 | | | | 160 | | | | 755 | |
Reservoir renewals | | | 315 | | | | 3,704 | | | | | | | | 1,800 | | | | 1,904 | |
Second pathogen disinfection system | | | 315 | | | | 1,859 | | | | 140 | | | | 1,684 | | | | 35 | |
| | | | | | | | | | | | | | | | | | | | |
Total Property, Plant and Equipment | | | | | | | | | | | | | | | 9,924 | | | | | |
| | | | | | | | | | | | | | | | | | | | |
SEQWATER | | | | | | | | | | | | | | | | | | | | |
Property, Plant and Equipment | | | | | | | | | | | | | | | | | | | | |
Dayboro water source and treatment upgrade with pipeline grid connection | | | 314 | | | | 20,314 | | | | 12 | | | | 270 | | | | 20,032 | |
82
Capital Statement 2023-24
| | | | | | | | | | | | | | | | | | | | |
| Regional Development, Manufacturing and Water | |
Project | | Statistical
Area | | | Total
Estimated
Cost
$‘000 | | | Expenditure
to
30-06-23
$‘000 | | | Budget
2023-24
$‘000 | | | Post
2023-24
$‘000 | |
Information and communication technology capital program | | | 310 | | | | | | | | | | | | 18,401 | | | | Ongoing | |
Lake Macdonald Dam improvement project - planning2 | | | 316 | | | | 127,278 | | | | 25,734 | | | | 989 | | | | 100,555 | |
Lowood Water Treatment Plant sludge capacity upgrade | | | 310 | | | | 10,016 | | | | 41 | | | | 267 | | | | 9,708 | |
Mount Crosby East Bank sub-station and enabling works | | | 310 | | | | 35,600 | | | | 24,855 | | | | 3,130 | | | | 7,615 | |
Mount Crosby East Bank sub-station critical electrical infrastructure upgrade | | | 310 | | | | 49,400 | | | | 6,830 | | | | 9,907 | | | | 32,663 | |
Mount Crosby Weir Bridge upgrade | | | 310 | | | | 29,450 | | | | 14,412 | | | | 11,050 | | | | 3,988 | |
Mount Crosby West Bank Water Treatment Plant centrifuge installation | | | 310 | | | | 13,935 | | | | 1,072 | | | | 250 | | | | 12,613 | |
Non-infrastructure capital works | | | 310 | | | | | | | | | | | | 8,382 | | | | Ongoing | |
North Pine Dam improvement project - planning | | | | | | | 12,140 | | | | 6,900 | | | | 5,240 | | | | | |
Other infrastructure improvements - other infrastructure projects | | | 310 | | | | | | | | | | | | 26,340 | | | | Ongoing | |
Other infrastructure improvements - water storage projects | | | 310 | | | | | | | | | | | | 6,391 | | | | Ongoing | |
Other infrastructure improvements - water transport projects | | | 310 | | | | | | | | | | | | 6,696 | | | | Ongoing | |
Other infrastructure improvements - water treatment projects | | | 310 | | | | | | | | | | | | 27,480 | | | | Ongoing | |
Somerset Dam improvement project - planning | | | 310 | | | | 34,792 | | | | 32,502 | | | | 2,290 | | | | | |
South West Pipeline | | | 311 | | | | 95,200 | | | | 70,079 | | | | 24,400 | | | | 721 | |
Toowoomba to Warwick Pipeline3 | | | 317 | | | | 273,100 | | | | 13,697 | | | | 13,412 | | | | 245,991 | |
Wivenhoe Dam improvement project - planning | | | 310 | | | | 11,600 | | | | 2,600 | | | | 9,000 | | | | | |
| | | | | | | | | | | | | | | | | | | | |
Total Property, Plant and Equipment | | | | | | | | | | | | | | | 173,895 | | | | | |
| | | | | | | | | | | | | | | | | | | | |
SUNWATER LIMITED | | | | | | | | | | | | | | | | | | | | |
Property, Plant and Equipment | | | | | | | | | | | | | | | | | | | | |
Burdekin Falls Dam improvement and raising projects - planning | | | 318 | | | | | | | | | | | | 19,548 | | | | Ongoing | |
Burdekin Moranbah Pipeline - inline storage | | | 312 | | | | 12,711 | | | | 441 | | | | 9,134 | | | | 3,136 | |
Enterprise data and analytics service | | | 305 | | | | 18,201 | | | | 5,148 | | | | 4,562 | | | | 8,491 | |
Eungella Water Pipeline (stage 3) | | | 312 | | | | 22,987 | | | | 3,624 | | | | 14,106 | | | | 5,257 | |
Leslie Dam dead storage access | | | 307 | | | | 2,269 | | | | 222 | | | | 2,047 | | | | | |
Lower Burdekin rising groundwater mitigation project | | | 318 | | | | 10,808 | | | | 2,039 | | | | 1,982 | | | | 6,787 | |
Non-infrastructure capital works | | | Various | | | | | | | | | | | | 5,585 | | | | Ongoing | |
83
Capital Statement 2023-24
| | | | | | | | | | | | | | | | | | | | |
| Regional Development, Manufacturing and Water | |
Project | | Statistical
Area | | | Total
Estimated
Cost
$‘000 | | | Expenditure
to
30-06-23
$‘000 | | | Budget
2023-24
$‘000 | | | Post
2023-24
$‘000 | |
Non-routine capital works - bulk water infrastructure | | | Various | | | | | | | | | | | | 5,300 | | | | Ongoing | |
Non-routine capital works - industrial pipelines | | | Various | | | | | | | | | | | | 5,021 | | | | Ongoing | |
Non-routine capital works - irrigation systems | | | Various | | | | | | | | | | | | 12,966 | | | | Ongoing | |
Paradise Dam improvement project - planning and enabling works | | | 319 | | | | 1,198,225 | | | | 68,081 | | | | 116,400 | | | | 1,013,744 | |
Right of use leased assets | | | Various | | | | | | | | | | | | 3,048 | | | | Ongoing | |
Rocklea laboratory facility upgrade | | | 303 | | | | 20,031 | | | | 5,322 | | | | 12,875 | | | | 1,834 | |
| | | | | | | | | | | | | | | | | | | | |
Total Property, Plant and Equipment | | | | | | | | | | | | | | | 212,574 | | | | | |
| | | | | | | | | | | | | | | | | | | | |
TOTAL REGIONAL DEVELOPMENT, MANUFACTURING AND WATER (PPE) | | | | | | | | | | | | | | | 984,935 | | | | | |
| | | | | | | | | | | | | | | | | | | | |
TOTAL REGIONAL DEVELOPMENT, MANUFACTURING AND WATER (CG) | | | | | | | | | | | | | | | 103,569 | | | | | |
| | | | | | | | | | | | | | | | | | | | |
Notes:
| | 1. | The construction of Rookwood Weir is excluded from the department’s Budget Paper No.3 Capital Statement as all State and Australian Government funds are expected to be paid to Sunwater during 2022-23. The total estimated cost of the project has increased to $568.9 million due to escalating supplier costs and multiple site inundations caused by high river flows; the increased cost will be funded by Sunwater and appear as an expense in Sunwater’s Income Statement. |
| | 2. | The Lake Macdonald Dam improvement project budget in 2023-24 reflects the cost of the ongoing options assessment process. The $127.3 million total estimated cost reflects the previous total estimated cost for the project including construction costs. The total estimated cost will be revised following the completion of a revised business case. |
| | 3. | $273.1 million relates to construction of the Toowoomba to Warwick Pipeline only. This forms part of a more than $300 million investment into water security in Toowoomba and Southern Downs regions. |
84
Capital Statement 2023-24
Department of Resources
The capital purchases budget for the Resources portfolio for 2023–24 is $11.0 million.
The department’s capital investment program will support maintenance of the state’s stock route network, investment in digital solutions to support the vast datasets used to stimulate economic development in Queensland and other critical property, plant and equipment assets to support the department’s service delivery requirements.
Program Highlights (Property, Plant and Equipment)
| • | | $900,000 in 2023–24 to continue improving and maintaining stock route water facilities across the state to ensure their safe and efficient operation. |
| • | | $500,000 in 2023–24 to manage health, safety and environmental risks at the disclaimed Thalanga Copper mine site as part of the Abandoned mine sites - care and maintenance, risk mitigation and remediation program. |
| | | | | | | | | | | | | | | | | | | | |
| Resources | |
Project | | Statistical
Area | | | Total
Estimated
Cost
$‘000 | | | Expenditure
to
30-06-23
$‘000 | | | Budget
2023-24
$‘000 | | | Post
2023-24
$‘000 | |
DEPARTMENT OF RESOURCES | | | | | | | | | | | | | | | | | | | | |
Property, Plant and Equipment | | | | | | | | | | | | | | | | | | | | |
Systems development | | | Various | | | | | | | | | | | | 4,700 | | | | Ongoing | |
Stock route network | | | Various | | | | | | | | | | | | 900 | | | | Ongoing | |
Abandoned mine sites - care and maintenance, risk mitigation and remediation program | | | 318 | | | | 500 | | | | | | | | 500 | | | | | |
Other property, plant and equipment | | | Various | | | | | | | | | | | | 4,876 | | | | Ongoing | |
| | | | | | | | | | | | | | | | | | | | |
Total Property, Plant and Equipment | | | | | | | | | | | | | | | 10,976 | | | | | |
| | | | | | | | | | | | | | | | | | | | |
TOTAL RESOURCES (PPE) | | | | | | | | | | | | | | | 10,976 | | | | | |
| | | | | | | | | | | | | | | | | | | | |
85
Capital Statement 2023-24
| 3.17 | STATE DEVELOPMENT, INFRASTRUCTURE, LOCAL GOVERNMENT AND PLANNING |
In 2023-24, the State Development, Infrastructure, Local Government and Planning portfolio, including Economic Development Queensland, the Queensland Reconstruction Authority and South Bank Corporation, has capital purchases of more than $125.7 million and capital grants of $1.699 billion.
Department of State Development, Infrastructure, Local Government and Planning
The Department of State Development, Infrastructure, Local Government and Planning has capital purchases of $5.6 million and capital grants of $433.5 million in 2023-24.
Program Highlights (Capital Grants)
| • | | $143.1 million as part of the $218.2 million Resources Community Infrastructure Fund to support regional communities by improving economic and social infrastructure across Queensland’s resources communities. |
| • | | $63.8 million as part of the $221.4 million Industry Partnership Program to support the creation of jobs and rebuild the State’s economy by boosting its industry footprint and raising the State’s profile in industry development. |
| • | | $58.5 million for the Local Government Grants and Subsidies Program, which provides funding for priority infrastructure projects to meet identified community needs and supports projects that will create sustainable and liveable communities. |
| • | | $42.8 million as part of the $1.0 billion Works for Queensland program to support local governments in regional Queensland undertaking job-creating maintenance and minor infrastructure works. |
| • | | $34.4 million towards the $200.0 million South East Queensland Community Stimulus Program to fast track South East Queensland councils’ investment in new infrastructure and community assets that create jobs and deliver economic stimulus. |
| • | | $16.3 million as part of the $120.0 million Indigenous Councils Critical Infrastructure Program to support Indigenous councils to deliver infrastructure relating to critical water, wastewater and solid waste assets, and provide a basis for the long-term strategic management of essential assets. |
| • | | $15.8 million as part of the $25.0 million Regional Recovery Partnerships program to support recovery and growth through a package of targeted initiatives in Cairns, Gladstone and the Mackay-Isaac-Whitsunday region, funded by the Australian Government. |
| • | | $10 million towards the $41.1 milllion Recycling Modernisation Fund to support businesses to improve recycling infrastructure for waste streams impacted by waste export bans. |
Economic Development Queensland
In 2023-24, Economic Development Queensland has capital purchases of more than $101.1 million.
Program Highlights (Property, Plant and Equipment)
| • | | $18.2 million for the development of the Gladstone State Development Area. |
| • | | $16.2 million for planned land acquisition at Southport. |
| • | | $10.6 million for the development of the Sunshine Coast Industrial Park (Stage 2). |
| • | | $10.6 million for the urban renewal development at Northshore Hamilton. |
86
Capital Statement 2023-24
| • | | $9.4 million for the development of the Yeronga Priority Development Area. |
| • | | $9.4 million for the development of the Carseldine Village. |
| • | | $8.1 million for the development of the Oxley Priority Development Area. |
| • | | $8 million for the development of Currumbin Eco-Parkland. |
Queensland Reconstruction Authority
In 2023-24, the Queensland Reconstruction Authority has capital grants of more than $1.265 billion to support the Queensland Government’s program of infrastructure renewal and recovery within disaster-affected communities, and to help build disaster resilience across Queensland.
Program Highlights (Capital Grants)
| • | | $1.240 billion for Disaster Recovery Funding Arrangements will be paid to local government authorities for reconstruction, betterment and other projects relating to natural disaster events between 2019 and 2023. This program is jointly funded by the Queensland Government and the Australian Government. |
| • | | $13.1 million towards the $65.5 million Queensland Resilience and Risk Reduction Fund, part of a National Partnership Agreement, jointly funded with the Australian Government, to support disaster mitigation projects and build resilience to natural disasters over 5 years. |
| • | | $6 million as part of the $28 million Recovery and Resilience Grants to support 14 local government areas hardest hit by the 2019 North Queensland Monsoon Trough, funded by the Australian Government. |
| • | | $5 million as part of the $10 million North Queensland Natural Disasters Mitigation Program to help councils in North and Far North Queensland reduce their disaster risk and assist in reducing the growth of insurance costs for residents, businesses and the community. |
South Bank Corporation
In 2023-24, the South Bank Corporation has budgeted capital purchases of more than $19 million to enhance the South Bank Parklands, the Corporation’s commercial assets and the Brisbane Convention and Exhibition Centre.
| | | | | | | | | | | | | | | | | | | | |
| State Development, Infrastructure, Local Government and Planning | |
| | | | | |
Project | | Statistical
Area | | | Total
Estimated
Cost
$‘000 | | | Expenditure
to
30-06-23
$‘000 | | | Budget
2023-24
$‘000 | | | Post
2023-24
$‘000 | |
DEPARTMENT OF STATE DEVELOPMENT, INFRASTRUCTURE, LOCAL GOVERNMENT AND PLANNING | |
Property, Plant and Equipment | | | | | | | | | | | | | | | | | | | | |
Cairns Marine Precinct Common User Facility | | | 306 | | | | 6,275 | | | | 741 | | | | 5,534 | | | | | |
State development area property management | | | 308 | | | | 200 | | | | 100 | | | | 50 | | | | 50 | |
| | | | | | | | | | | | | | | | | | | | |
Total Property, Plant and Equipment | | | | | | | | | | | | | | | 5,584 | | | | | |
| | | | | | | | | | | | | | | | | | | | |
Capital Grants | | | | | | | | | | | | | | | | | | | | |
Resources Community Infrastructure Fund | | | Various | | | | 218,200 | | | | 10,935 | | | | 143,100 | | | | 64,165 | |
Industry Partnership Program | | | Various | | | | 221,361 | | | | 3,000 | | | | 63,842 | | | | 154,519 | |
Local Government Grants and Subsidies Program | | | Various | | | | | | | | | | | | 58,530 | | | | Ongoing | |
87
Capital Statement 2023-24
| | | | | | | | | | | | | | | | | | | | |
| State Development, Infrastructure, Local Government and Planning | |
| | | | | |
Project | | Statistical
Area | | | Total
Estimated
Cost
$‘000 | | | Expenditure
to
30-06-23
$‘000 | | | Budget
2023-24
$‘000 | | | Post
2023-24
$‘000 | |
Works for Queensland | | | Various | | | | 1,000,000 | | | | 742,962 | | | | 42,824 | | | | 214,214 | |
South East Queensland Community Stimulus Program | | | Various | | | | 200,000 | | | | 65,581 | | | | 34,419 | | | | 100,000 | |
Indigenous Councils Critical Infrastructure Program | | | Various | | | | 120,000 | | | | 103,749 | | | | 16,251 | | | | | |
Regional Recovery Partnerships Program | | | Various | | | | 25,000 | | | | 6,615 | | | | 15,810 | | | | 2,575 | |
Recycling Modernisation Fund | | | Various | | | | 41,113 | | | | 1,113 | | | | 10,000 | | | | 30,000 | |
Building our Regions (Rounds 1-5) | | | Various | | | | 329,510 | | | | 309,360 | | | | 8,150 | | | | 12,000 | |
Modern Manufacturing Initiative | | | Various | | | | 56,530 | | | | 1,000 | | | | 6,500 | | | | 49,030 | |
Community Infrastructure Investment Partnership | | | Various | | | | 15,000 | | | | 7,563 | | | | 5,437 | | | | 2,000 | |
Southport Spit | | | 309 | | | | 10,614 | | | | 5,769 | | | | 4,480 | | | | 365 | |
Grant maturity project | | | Various | | | | 3,500 | | | | | | | | 3,500 | | | | | |
Barcaldine Renewable Energy Zone | | | 315 | | | | 7,000 | | | | | | | | 3,500 | | | | 3,500 | |
Kenrick Park Masterplan (Stage 1) | | | 306 | | | | 3,000 | | | | | | | | 3,000 | | | | | |
Hinchinbrook Harbour new sewage plant | | | 306 | | | | 6,433 | | | | 1,022 | | | | 2,835 | | | | 2,576 | |
Roma Street Parklands | | | 305 | | | | | | | | | | | | 2,372 | | | | Ongoing | |
Northern Peninsula Area water supply system - replacement of asbestos cement pipelines | | | 315 | | | | 5,000 | | | | 3,039 | | | | 1,961 | | | | | |
COVID-19 Works for Queensland | | | Various | | | | 200,000 | | | | 198,348 | | | | 1,652 | | | | | |
Splash Parks in Mareeba and Douglas Shires | | | 306 | | | | 3,000 | | | | 1,650 | | | | 1,350 | | | | | |
Logan City Council - digital infrastructure and connectivity | | | 311 | | | | 2,500 | | | | 1,250 | | | | 1,250 | | | | | |
Trinity Beach Community Activity Space | | | 306 | | | | 935 | | | | | | | | 935 | | | | | |
BBD Brewery Waste Water Treatment Plant | | | 319 | | | | 1,000 | | | | 400 | | | | 600 | | | | | |
Torres Strait Ferry Funding Program | | | 315 | | | | 500 | | | | | | | | 500 | | | | | |
Kuranda infrastructure levy | | | 306 | | | | | | | | | | | | 444 | | | | Ongoing | |
Unite and Recover Community Stimulus Package | | | Various | | | | 50,000 | | | | 49,760 | | | | 240 | | | | | |
| | | | | | | | | | | | | | | | | | | | |
Total Capital Grants | | | | | | | | | | | | | | | 433,482 | | | | | |
| | | | | | | | | | | | | | | | | | | | |
ECONOMIC DEVELOPMENT QUEENSLAND | | | | | | | | | | | | | | | | | | | | |
Property, Plant and Equipment | | | | | | | | | | | | | | | | | | | | |
Gladstone State Development Area | | | 308 | | | | 83,149 | | | | 60,349 | | | | 18,200 | | | | 4,600 | |
Southport | | | 309 | | | | 18,954 | | | | | | | | 16,185 | | | | 2,769 | |
Sunshine Coast Industrial Park (Stage 2) | | | 316 | | | | 31,535 | | | | 20,920 | | | | 10,615 | | | | | |
Northshore Hamilton | | | 302 | | | | 418,151 | | | | 114,457 | | | | 10,602 | | | | 293,092 | |
Yeronga Priority Development Area | | | 303 | | | | 32,755 | | | | 23,323 | | | | 9,432 | | | | | |
88
Capital Statement 2023-24
| | | | | | | | | | | | | | | | | | | | |
| State Development, Infrastructure, Local Government and Planning | |
| | | | | |
Project | | Statistical
Area | | | Total
Estimated
Cost
$‘000 | | | Expenditure
to
30-06-23
$‘000 | | | Budget
2023-24
$‘000 | | | Post
2023-24
$‘000 | |
Carseldine Village | | | 302 | | | | 36,301 | | | | 26,374 | | | | 9,410 | | | | 517 | |
Oxley Priority Development Area | | | 310 | | | | 34,250 | | | | 25,863 | | | | 8,055 | | | | 332 | |
Currumbin Eco-Parkland | | | 309 | | | | 39,000 | | | | 15,000 | | | | 8,000 | | | | 16,000 | |
Yeerongpilly Green | | | 303 | | | | 71,825 | | | | 56,347 | | | | 3,582 | | | | 11,896 | |
Gold Coast Health and Knowledge Precinct | | | 309 | | | | 41,738 | | | | 26,622 | | | | 3,354 | | | | 11,762 | |
Coolum Eco Industrial Park (Stage 2) | | | 316 | | | | 35,000 | | | | 2,500 | | | | 2,500 | | | | 30,000 | |
Clinton Industrial Estate | | | 308 | | | | 2,629 | | | | 2,129 | | | | 500 | | | | | |
Salisbury Plains Industrial Precinct | | | 312 | | | | 9,225 | | | | 2,725 | | | | 250 | | | | 6,250 | |
Willowbank Industrial Precinct | | | 310 | | | | 22,656 | | | | 22,406 | | | | 250 | | | | | |
Townsville Regional Industrial Estate | | | 318 | | | | 6,551 | | | | 4,751 | | | | 200 | | | | 1,600 | |
| | | | | | | | | | | | | | | | | | | | |
Total Property, Plant and Equipment | | | | | | | | | | | | | | | 101,135 | | | | | |
| | | | | | | | | | | | | | | | | | | | |
QUEENSLAND RECONSTRUCTION AUTHORITY | | | | | | | | | | | | | | | | | | | | |
Capital Grants | | | | | | | | | | | | | | | | | | | | |
Disaster Recovery Funding Arrangements | | | Various | | | | | | | | | | | | 1,239,952 | | | | Ongoing | |
Queensland Resilience and Risk Reduction Fund | | | Various | | | | 65,507 | | | | 31,442 | | | | 13,102 | | | | 20,963 | |
Recovery and Resilience Grants | | | Various | | | | 28,000 | | | | 15,000 | | | | 6,000 | | | | 7,000 | |
North Queensland Natural Disasters Mitigation Program | | | Various | | | | 10,000 | | | | 3,000 | | | | 5,000 | | | | 2,000 | |
National Flood Mitigation Infrastructure Program | | | Various | | | | 10,794 | | | | 9,178 | | | | 1,348 | | | | 268 | |
| | | | | | | | | | | | | | | | | | | | |
Total Capital Grants | | | | | | | | | | | | | | | 1,265,402 | | | | | |
| | | | | | | | | | | | | | | | | | | | |
SOUTH BANK CORPORATION | | | | | | | | | | | | | | | | | | | | |
Property, Plant and Equipment | | | | | | | | | | | | | | | | | | | | |
Brisbane Convention and Exhibition Centre enhancements and replacements | | | | | | | | | | | | | | | 10,835 | | | | Ongoing | |
South Bank Parklands enhancements and replacements | | | 305 | | | | | | | | | | | | 7,557 | | | | Ongoing | |
Investment properties - other enhancements and replacements | | | 305 | | | | | | | | | | | | 585 | | | | Ongoing | |
Car park upgrades and replacements | | | 305 | | | | | | | | | | | | 45 | | | | Ongoing | |
| | | | | | | | | | | | | | | | | | | | |
Total Property, Plant and Equipment | | | | | | | | | | | | | | | 19,022 | | | | | |
| | | | | | | | | | | | | | | | | | | | |
TOTAL STATE DEVELOPMENT, INFRASTRUCTURE, LOCAL GOVERNMENT AND PLANNING (PPE) | | | | | | | | | | | | | | | 125,741 | | | | | |
| | | | | | | | | | | | | | | | | | | | |
TOTAL STATE DEVELOPMENT, INFRASTRUCTURE, LOCAL GOVERNMENT AND PLANNING (CG) | | | | | | | | | | | | | | | 1,698,884 | | | | | |
| | | | | | | | | | | | | | | | | | | | |
89
Capital Statement 2023-24
| 3.18 | TOURISM, INNOVATION AND SPORT |
Department of Tourism, Innovation and Sport
Total capital purchases for the Department of Tourism, Innovation and Sport are estimated to be $27.1 million in 2023-24. Total capital grants for the department are estimated to be $218.9 million in 2023-24.
Program Highlights (Property, Plant and Equipment)
| • | | $17.0 million to enhance existing state-owned sport and active recreation facilities at the Gold Coast, Sunshine Coast and Townsville, to deliver quality experiences that inspire physical activity. |
| • | | $10.0 million for a 94 kilometre walking and mountain biking trail from Palm Cove to Port Douglas, with public and eco-accommodation facilities. |
Program Highlights (Capital Grants)
| • | | $53.0 million to support sport and recreation organisations with the clean up and repair of equipment and facilities damaged from the South East Queensland rain and flooding event in February 2022. |
| • | | $33.6 million for the Stage 1 redevelopment of Browne Park including building a contemporary 3,500 seat grandstand, public amenities, food and beverage outlets, media and coach facilities, and increasing the ground capacity. |
| • | | $26.4 million to encourage Queenslanders to be more active, more often, as well as working to increase health and wellbeing outcomes across the state in line with key government priorities. |
| • | | $17.5 million to progress the construction of the Quandamooka Art Museum and Performance Institute (QUAMPI) and auxiliary infrastructure for the recreational trail. |
| • | | $17.2 million for minor facility improvements that support increased opportunities for Queenslanders to participate in sport and active recreation. |
| • | | $16.6 million under the Regional Tourism Recovery Program, to rebuild the heritage listed Binna Burra lodge and cabins rooms on Mount Roberts. |
Stadiums Queensland
Stadiums Queensland’s 2023-24 capital outlay of $42.5 million represents the minimum capital investment required to assist in ensuring that Queensland’s major sports and entertainment facilities continue to provide world-class fan experiences, support high performance development and facilitate community participation in sport and physical activity.
90
Capital Statement 2023-24
| | | | | | | | | | | | | | | | | | | | |
| Tourism, Innovation and Sport | | | | |
| | | | | |
Project | | Statistical
Area | | | Total
Estimated
Cost
$‘000 | | | Expenditure
to
30-06-23
$‘000 | | | Budget
2023-24
$‘000 | | | Post
2023-24
$‘000 | |
DEPARTMENT OF TOURISM, INNOVATION AND SPORT | | | | | |
Property, Plant and Equipment | | | | | | | | | | | | |
Queensland Active Precincts | | | Various | | | | 88,585 | | | | 41,936 | | | | 16,986 | | | | 29,663 | |
Wangetti Trail | | | 306 | | | | 30,462 | | | | 1,806 | | | | 10,000 | | | | 18,656 | |
Queensland Academy of Sport - specialist equipment | | | 303 | | | | 450 | | | | | | | | 75 | | | | 375 | |
| | | | | | | | | | | | | | | | | | | | |
Total Property, Plant and Equipment | | | | | | | | | | | 27,061 | | | | | |
| | | | | | | | | | | | | | | | | | | | |
Capital Grants | | | | | | | | | | | | |
Community Recreational Assets Recovery and Resilience Program | | | Various | | | | 73,500 | | | | 11,500 | | | | 53,000 | | | | 9,000 | |
Browne Park Redevelopment | | | 308 | | | | 54,326 | | | | 1,400 | | | | 33,600 | | | | 19,326 | |
Local community sporting infrastructure | | | Various | | | | 48,380 | | | | 18,895 | | | | 26,410 | | | | 3,075 | |
Minjerribah Futures Program | | | 301 | | | | 19,516 | | | | 2,009 | | | | 17,507 | | | | | |
Sport Minor Infrastructure Program | | | Various | | | | 38,518 | | | | 1,668 | | | | 17,216 | | | | 19,634 | |
Binna Burra Lodge rebuild | | | 309 | | | | 18,000 | | | | 1,038 | | | | 16,609 | | | | 353 | |
Sport infrastructure program | | | Various | | | | 10,000 | | | | | | | | 10,000 | | | | | |
Tourism Experience Development Fund | | | Various | | | | 10,050 | | | | 2,000 | | | | 8,050 | | | | | |
Activate Ecotourism | | | Various | | | | 9,200 | | | | | | | | 7,200 | | | | 2,000 | |
Drive It NQ | | | 318 | | | | 10,000 | | | | 2,800 | | | | 7,200 | | | | | |
Sporting infrastructure | | | Various | | | | 13,157 | | | | 2,557 | | | | 5,850 | | | | 4,750 | |
Active Community Infrastructure - Round 1 | | | Various | | | | 26,235 | | | | 23,678 | | | | 2,557 | | | | | |
Pajinka infrastructure | | | 315 | | | | 2,000 | | | | | | | | 2,000 | | | | | |
QRA SEQ 2022 Floods Tourism infrastructure | | | Various | | | | 4,750 | | | | | | | | 1,950 | | | | 2,800 | |
Great Barrier Reef Marine infrastructure | | | Various | | | | 3,000 | | | | | | | | 1,500 | | | | 1,500 | |
Active Game Day Schools | | | Various | | | | 8,465 | | | | 7,036 | | | | 1,429 | | | | | |
Abbey Museum Art Gallery & Cafe and Abbey Medieval Festival Site Redevelopment | | | 313 | | | | 2,100 | | | | 648 | | | | 1,402 | | | | 50 | |
Wangetti Trail (Mowbray North) | | | 306 | | | | 5,737 | | | | 4,341 | | | | 1,396 | | | | | |
Regional Tourism Recovery Projects | | | Various | | | | 3,300 | | | | 78 | | | | 1,184 | | | | 2,038 | |
Growing Indigenous Tourism in Queensland Fund | | | Various | | | | 6,353 | | | | 5,322 | | | | 1,031 | | | | | |
Surf Lifesaving infrastructure | | | Various | | | | 6,000 | | | | 4,550 | | | | 850 | | | | 600 | |
Townsville skate park (Harold Phillips Park) | | | 318 | | | | 1,000 | | | | 500 | | | | 500 | | | | | |
Allied Health and Wellbeing Centre (Clem Jones Centre) | | | 303 | | | | 5,000 | | | | 4,750 | | | | 250 | | | | | |
91
Capital Statement 2023-24
| | | | | | | | | | | | | | | | | | | | |
| Tourism, Innovation and Sport | |
| | | | | |
Project | | Statistical
Area | | | Total
Estimated
Cost
$‘000 | | | Expenditure
to
30-06-23
$‘000 | | | Budget
2023-24
$‘000 | | | Post
2023-24
$‘000 | |
Attracting Tourism Fund | | | Various | | | | 10,213 | | | | 9,975 | | | | 238 | | | | | |
| | | | | | | | | | | | | | | | | | | | |
Total Capital Grants | | | | | | | | | | | | | | | 218,929 | | | | | |
| | | | | | | | | | | | | | | | | | | | |
STADIUMS QUEENSLAND | | | | | | | | | | | | | | | | | | | | |
Property, Plant and Equipment | | | | | | | | | | | | | | | | | | | | |
Stadiums Queensland - Annual capital program | | | Various | | | | | | | | | | | | 42,465 | | | | Ongoing | |
| | | | | | | | | | | | | | | | | | | | |
Total Property, Plant and Equipment | | | | | | | | | | | | | | | 42,465 | | | | | |
| | | | | | | | | | | | | | | | | | | | |
TOTAL TOURISM, INNOVATION AND SPORT (PPE) | | | | | | | | | | | | | | | 69,526 | | | | | |
| | | | | | | | | | | | | | | | | | | | |
TOTAL TOURISM, INNOVATION AND SPORT (CG) | | | | | | | | | | | | | | | 218,929 | | | | | |
| | | | | | | | | | | | | | | | | | | | |
92
Capital Statement 2023-24
| 3.19 | TRANSPORT AND MAIN ROADS |
TRANSPORT AND MAIN ROADS
In 2023-24, total capital purchases for the Transport and Main Roads portfolio are $6.946 billion including capital grants of $619.4 million. The portfolio includes the Department of Transport and Main Roads, Queensland Rail, Cross River Rail Delivery Authority, Far North Queensland Ports Corporation Limited, Gladstone Ports Corporation Limited, North Queensland Bulk Ports Corporation Limited, Port of Townsville Limited, RoadTek, Gold Coast Waterways Authority and CITEC.
Department of Transport and Main Roads
In 2023-24, capital purchases total $4.704 billion towards infrastructure investment across the state. The Queensland Government is committed to delivering an integrated, safe and efficient transport system that connects regional Queenslanders and other communities throughout the state.
Program Highlights (Property, Plant and Equipment)
| • | | $420 million towards Coomera Connector (Stage 1), Coomera to Nerang, at a total estimated cost of $2.163 billion (jointly funded with the Australian Government). |
| • | | $259.4 million towards Gold Coast Light Rail (Stage 3), Broadbeach South to Burleigh Heads, at a total estimated cost of $1.219 billion (jointly funded with the Australian Government and City of Gold Coast). |
| • | | $240 million towards Logan and Gold Coast Faster Rail, as part of a total commitment of $2.598 billion (jointly funded with the Australian Government). |
| • | | $200 million towards the Queensland Train Manufacturing Program, at a total estimated capital cost of $4.869 billion. |
| • | | $190 million towards Pacific Motorway, Varsity Lakes (Exit 85) to Tugun (Exit 95) upgrade, as part of a total commitment of $1 billion (jointly funded with the Australian Government). |
| • | | $170.5 million towards Bruce Highway, (Cooroy to Curra) Section D, construction, at a total estimated cost of $1 billion (jointly funded with the Australian Government). |
| • | | $123.1 million towards ongoing accessibility modifications for New Generation Rollingstock to comply with disability standards. |
| • | | $110 million towards Pacific Motorway, Eight Mile Plains to Daisy Hill upgrade, at a total estimated cost of $750 million (jointly funded with the Australian Government). |
| • | | $100 million towards Rockhampton Ring Road, at a total estimated cost of $1.065 billion (jointly funded with the Australian Government). |
| • | | $94.8 million towards New Gold Coast Train Stations (Pimpama, Hope Island and Merrimac), at a total estimated cost of $500 million. |
| • | | $64.8 million towards Beerburrum to Nambour Rail Upgrade (Stage 1), at a total estimated cost of $550.8 million (jointly funded with the Australian Government). |
| • | | $60.7 million towards Sunshine Motorway, Mooloolah River Interchange Upgrade (Stage 1), at a total estimated cost of $320 million (jointly funded with the Australian Government). |
| • | | $60 million towards Northern Transitway, bus priority works, at a total estimated cost of $172 million. |
| • | | $54.8 million towards New Generation Rollingstock, European Train Control System fitment, install new signalling, at a total estimated cost of $374.1 million. |
| • | | $50 million towards the Centenary Bridge upgrade, as part of a total commitment of |
93
Capital Statement 2023-24
| | $271.5 million (jointly funded with the Australian Government). |
| • | | $44.8 million towards Walkerston Bypass, as part of a total commitment of $187.4 million (jointly funded with the Australian Government). |
| • | | $43.2 million towards Cleveland - Redland Bay Road, Anita Street to Magnolia Parade, duplicate to four lanes, at a total estimated cost of $97 million. |
| • | | $42.4 million towards Bruce Highway (Brisbane - Gympie), Caboolture - Bribie Island Road to Steve Irwin Way upgrade, at a total estimated cost of $662.5 million (jointly funded with the Australian Government). |
| • | | $41.7 million towards Gore Highway (Millmerran - Goondiwindi), Wyaga Creek, upgrade floodway, as part of a total commitment of $46.7 million (jointly funded with the Australian Government). |
| • | | $40 million towards Pacific Motorway, Exit 49, upgrade interchange, at a total estimated cost of $110.8 million (jointly funded with the Australian Government). |
| • | | $38.9 million towards New Generation Rollingstock, Automatic Train Operation and Platform Screen Doors fitment, at a total estimated cost of $275.7 million. |
| • | | $38.5 million towards disaster recovery reconstruction works along the Cunningham Highway between Ipswich and Warwick, at a total estimated cost of $134.4 million (jointly funded with the Australian Government). |
| • | | $37 million towards Townsville Connection Road (Stuart Drive), University Road to Bowen Road Bridge (Idalia), improve safety, at a total estimated cost of $96 million. |
| • | | $35.9 million towards Strathpine - Samford Road, Eatons Crossing Road and Mount Samson Road intersection, improve safety, at a total estimated cost of $75.2 million. |
| • | | $35 million towards Bruce Highway, Pine River to Caloundra Road, Smart Motorways (Stage 2), at a total estimated cost of $105 million (jointly funded with the Australian Government). |
| • | | $32 million towards Pacific Motorway, Daisy Hill to Logan Motorway, funding commitment, as part of a total commitment of $1 billion (jointly funded with the Australian Government). |
| • | | $30.9 million towards Cairns Western Arterial Road, Redlynch Connector Road to Captain Cook Highway duplication, at a total cost of $300 million (jointly funded with the Australian Government). |
Program Highlights (Capital Grants)
| • | | $76 million towards Transport Infrastructure Development Scheme to local governments, including Aboriginal and Torres Strait Islander community assistance. |
| • | | $22.5 million towards charging infrastructure as part of the Zero Emission Vehicle strategy 2022-32 and Action Plan 2022-24. |
| • | | $16.2 million towards Beams Road (Carseldine and Fitzgibbon), upgrade rail level crossing, as part of a total commitment of $209.3 million (jointly funded with the Australian Government and Brisbane City Council). |
| • | | $12 million towards development of the cycle network throughout Queensland. |
RoadTek
In 2023-24, $26 million is allocated to replace the construction plant and equipment for road construction and maintenance throughout Queensland.
CITEC
In 2023-24, CITEC has capital purchases of $1.4 million, comprising right of use lease assets and hardware replacement.
94
Capital Statement 2023-24
Program Highlights (Property, Plant and Equipment)
| • | | $1 million for hardware replacement. |
| • | | $440,000 of right of use lease assets for ICT services. |
Queensland Rail
In 2023-24, $1.135 billion is allocated towards capital purchases for Queensland Rail.
Program Highlights (Property, Plant and Equipment)
$711.6 million is provided towards projects that will grow or enhance the Queensland Rail network including:
| • | | $151.3 million towards constructing Clapham Yard Stabling at Moorooka. |
| • | | $121.1 million towards implementing the European Train Control System Level 2 in the Brisbane Inner City Network. |
| • | | $90.6 million towards station accessibility upgrades including at Banyo, Bundamba, Burpengary, Lindum and Morningside. |
| • | | $48.7 million towards signalling integration works to enable delivery of the European Train Control System. |
| • | | $35 million towards the Roma Street surface station integration project. |
| • | | $20 million towards constructing the Breakfast Creek Bridge Replacement. |
$422.9 million to replace, renew and upgrade rail infrastructure, rollingstock, buildings, facilities, and other network assets including:
| • | | $198.8 million to invest in the South East Queensland network including rollingstock, operational facilities, track infrastructure, civil structures and signalling. |
| • | | $173.9 million to invest in the regional network including rollingstock, operational facilities, track infrastructure, civil structures and signalling. |
| • | | $50.3 million for business enabling investment on corporate, property and ICT works across Queensland. |
Gold Coast Waterways Authority
Program Highlights (Property, Plant and Equipment)
In 2023-24, the Gold Coast Waterways Authority has allocated $14.4 million to improve management of, and provide better access to, the Gold Coast Waterway, canals and rivers and to deliver The Spit Works Program.
| • | | $8.8 million to deliver The Spit Works Program, including Muriel Henchman boat ramp and carparking facilities. |
| • | | $3.4 million to upgrade Muriel Henchman Park Pontoon and boat ramp, Isle of Capri and Tallebudgera (Murlong Crescent) boat ramp replacements, and improvements to the Sand Bypass System. |
Cross River Rail Delivery Authority
In 2023-24, $829.2 million has been allocated to construct a new 10.2 kilometre rail line from
95
Capital Statement 2023-24
Dutton Park to Bowen Hills, including 5.9 kilometres of twin tunnels under the Brisbane River and CBD, and four new underground stations.
Program Highlights (Property, Plant and Equipment)
| • | | $762.9 million in 2023-24 to continue delivery of Cross River Rail, at a total estimated cost of $7.686 billion. |
Program Highlights (Capital Grants)
| • | | $66.3 million towards third party returnable works for Cross River Rail, at a total estimated cost of $162.2 million. |
Far North Queensland Ports Corporation Limited
In 2023-24, Far North Queensland Ports Corporation Limited has allocated $15.4 million towards new and continuing development within its ports in Far North Queensland.
Program Highlights (Property, Plant and Equipment)
| • | | $6 million for the Horn Island Passenger Jetty and Cargo Wharf, at a total estimated cost of $8.5 million. |
Gladstone Ports Corporation Limited
In 2023-24 Gladstone Ports Corporation Limited has allocated $126 million towards ongoing development of the Port of Gladstone, and additional works at the Port of Bundaberg and the Port of Rockhampton (Port Alma).
Program highlights (Property Plant & Equipment)
| • | | $36.9 million towards replacement of Ship Loader 1 at the RG Tanna Coal Terminal at the Port of Gladstone. |
| • | | $7.3 million towards Port Services projects, including East Shores Stage 1C - Auckland Hill. |
North Queensland Bulk Ports Corporation Limited
In 2023-24, North Queensland Bulk Ports Corporation Limited has allocated $19.4 million to continue port planning and development initiatives to meet industry requirements for export facilities.
Program Highlights (Property, Plant and Equipment)
| • | | $6.5 million to replace Middle Breakwater fuel line supports at the Port of Mackay, at a total estimated cost of $9.1 million. |
| • | | $2.5 million to improve the Northern Breakwater revetment at the Port of Mackay, at a total estimated cost of $3 million. |
| • | | $2 million to reseal and upgrade the road from the Bruce Highway to the Port of Abbot Point. |
| • | | $500,000 to undertake hydrogen trade studies. |
96
Capital Statement 2023-24
Port of Townsville Limited
In 2023-24, Port of Townsville Limited has allocated $75.6 million towards ongoing development at the Port of Townsville.
Program Highlights (Property, Plant and Equipment)
| • | | $60.7 million to continue the capital dredging and reclamation works to widen the shipping channels for access by larger vessels, at a total estimated cost of $251.2 million. |
| | | | | | | | | | | | | | | | | | | | |
| Transport and Main Roads | |
Project | | Statistical
Area | | | Total
Estimated
Cost
$‘000 | | | Expenditure
to
30-06-23
$‘000 | | | Budget
2023-24
$‘000 | | | Post
2023-24
$‘000 | |
DEPARTMENT OF TRANSPORT AND MAIN ROADS | | | | | | | | | | | | | | | | | | | | |
Property, Plant and Equipment | | | | | | | | | | | | | | | | | | | | |
South Coast District | | | | | | | | | | | | | | | | | | | | |
Beaudesert - Beenleigh Road, Milne Street to Tallagandra Road, duplicate to four lanes1 | | | 311 | | | | 12,000 | | | | 2,792 | | | | 7,208 | | | | 2,000 | |
Beenleigh Connection Road and City Road (Beenleigh), upgrade intersection2 | | | 311 | | | | 11,000 | | | | 900 | | | | 3,700 | | | | 6,400 | |
Brisbane - Beenleigh Road, improve safety | | | 311 | | | | 13,290 | | | | | | | | 4,856 | | | | 8,434 | |
Brisbane - Beenleigh Road, Kingston Road and Compton Road, upgrade intersection | | | 311 | | | | 14,670 | | | | 1,020 | | | | 6,000 | | | | 7,650 | |
Coomera Connector (Stage 1), Coomera to Nerang1 | | | 309 | | | | 2,162,707 | | | | 358,897 | | | | 420,000 | | | | 1,383,810 | |
Cunningham Highway (Ipswich - Warwick), 2020 Disaster Recovery Funding Arrangements reconstruction works3 | | | 310 | | | | 134,400 | | | | 19,440 | | | | 38,520 | | | | 76,440 | |
Currumbin Creek - Tomewin Road, 2022 Disaster Recovery Funding Arrangements reconstruction works3 | | | 309 | | | | 16,259 | | | | | | | | 8,129 | | | | 8,129 | |
Gold Coast - Springbrook Road (Stage 1), 2022 Disaster Recovery Funding Arrangements reconstruction works3 | | | 309 | | | | 33,163 | | | | 13,324 | | | | 19,838 | | | | | |
Gold Coast - Springbrook Road (Stage 3), 2022 Disaster Recovery Funding Arrangements reconstruction works3 | | | 309 | | | | 19,398 | | | | | | | | 9,699 | | | | 9,699 | |
Gold Coast - Springbrook Road, 2023 Disaster Recovery Funding Arrangements immediate reconstruction works3 | | | 309 | | | | 15,000 | | | | 5,000 | | | | 10,000 | | | | | |
Gold Coast Light Rail (Stage 3), Broadbeach South to Burleigh Heads4 | | | 309 | | | | 1,219,000 | | | | 391,433 | | | | 259,396 | | | | 568,171 | |
Loganlea train station relocation2 | | | 311 | | | | 95,076 | | | | 15,700 | | | | 9,961 | | | | 69,415 | |
Mount Lindesay Highway (Brisbane - Beaudesert), Johanna Street to South Street (Jimboomba), duplication2 | | | 311 | | | | 57,400 | | | | 11,080 | | | | 24,120 | | | | 22,200 | |
Nerang - Murwillumbah Road, various locations, safety treatments | | | 309 | | | | 38,668 | | | | 25,173 | | | | 10,300 | | | | 3,196 | |
97
Capital Statement 2023-24
| | | | | | | | | | | | | | | | | | |
| Transport and Main Roads | |
Project | | Statistical
Area | | Total
Estimated
Cost
$‘000 | | | Expenditure
to
30-06-23
$‘000 | | | Budget
2023-24
$‘000 | | | Post
2023-24
$‘000 | |
New Gold Coast Stations (Pimpama, Hope Island and Merrimac) | | 309 | | | 500,000 | | | | 91,524 | | | | 94,817 | | | | 313,659 | |
Other construction - South Coast District (Transport and Main Roads) | | Various | | | | | | | | | | | 114,279 | | | | Ongoing | |
Pacific Motorway, Daisy Hill to Logan Motorway funding commitment5 | | 311 | | | 1,000,000 | | | | 69,000 | | | | 32,000 | | | | 899,000 | |
Pacific Motorway, Eight Mile Plains to Daisy Hill upgrade1 | | 311 | | | 750,000 | | | | 437,982 | | | | 110,000 | | | | 202,018 | |
Pacific Motorway, Exit 49, upgrade interchange1 | | 309 | | | 110,768 | | | | 36,963 | | | | 40,000 | | | | 33,805 | |
Pacific Motorway, Varsity Lakes (Exit 85) to Tugun (Exit 95) upgrade1 | | 309 | | | 1,000,000 | | | | 756,975 | | | | 190,000 | | | | 53,025 | |
| | | | | | | | | | | | | | | | | | |
Sub-total South Coast District | | | | | | | | | | | | | 1,412,823 | | | | | |
| | | | | | | | | | | | | | | | | | |
| | | | | |
Metropolitan District | | | | | | | | | | | | | | | | | | |
Brisbane Metro, Woolloongabba Station6 | | 303 | | | 450,000 | | | | 48,117 | | | | 8,700 | | | | 393,183 | |
Cannon Hill Shopping Centre, upgrade bus station | | 303 | | | 12,405 | | | | 1,416 | | | | 7,277 | | | | 3,712 | |
Centenary Bridge upgrade1 | | 304 | | | 271,507 | | | | 61,738 | | | | 50,000 | | | | 159,769 | |
Chermside Bus Layover, Gympie Road and Murphy Road intersection, construct bus facilities | | 302 | | | 17,480 | | | | 6,307 | | | | 3,223 | | | | 7,950 | |
Chermside bus stop, construct southbound platform | | 302 | | | 16,536 | | | | 4,002 | | | | 1,500 | | | | 11,034 | |
Cleveland - Redland Bay Road, Anita Street to Giles Road, duplicate lanes | | 301 | | | 80,000 | | | | | | | | 7,000 | | | | 73,000 | |
Cleveland - Redland Bay Road, Anita Street to Magnolia Parade, duplicate to four lanes | | 301 | | | 97,000 | | | | 39,937 | | | | 43,183 | | | | 13,880 | |
Gateway Motorway, Bracken Ridge to Pine River upgrade funding commitment7 | | 302 | | | 1,000,000 | | | | 19,000 | | | | 18,000 | | | | 963,000 | |
Inner Northern Busway, Roma Street, improve bus station | | 305 | | | 12,000 | | | | 1,000 | | | | 7,000 | | | | 4,000 | |
Linkfield Road Overpass upgrade8 | | 302 | | | 131,400 | | | | 11,991 | | | | 5,796 | | | | 113,613 | |
Northern Transitway, bus priority works | | 302 | | | 172,000 | | | | 75,057 | | | | 60,000 | | | | 36,943 | |
Veloway 1 (V1) Cycleway, O’Keefe Street, construct cycle bridge and approaches | | 303 | | | 22,030 | | | | 14,106 | | | | 4,493 | | | | 3,431 | |
Other construction - Metropolitan District (Transport and Main Roads) | | Various | | | | | | | | | | | 82,237 | | | | Ongoing | |
| | | | | | | | | | | | | | | | | | |
Sub-total Metropolitan District | | | | | | | | | | | | | 298,409 | | | | | |
| | | | | | | | | | | | | | | | | | |
| | | | | |
North Coast District | | | | | | | | | | | | | | | | | | |
98
Capital Statement 2023-24
| | | | | | | | | | | | | | | | | | |
| Transport and Main Roads | |
Project | | Statistical
Area | | Total
Estimated
Cost
$‘000 | | | Expenditure
to
30-06-23
$‘000 | | | Budget
2023-24
$‘000 | | | Post
2023-24
$‘000 | |
Beerburrum to Nambour Rail Upgrade (Stage 1)1 | | 316 | | | 550,791 | | | | 103,260 | | | | 64,801 | | | | 382,730 | |
Brisbane Valley Highway (Ipswich - Harlin), Warrego Highway to Fernvale, improve safety | | 310 | | | 14,400 | | | | 7,618 | | | | 4,182 | | | | 2,600 | |
Bruce Highway (Brisbane - Gympie), Caboolture - Bribie Island Road to Steve Irwin Way upgrade1 | | 313 | | | 662,500 | | | | 332,255 | | | | 42,393 | | | | 287,852 | |
Bruce Highway (Brisbane - Gympie), Dohles Rocks Road to Anzac Avenue upgrade funding commitment7 | | 314 | | | 250,000 | | | | 27,050 | | | | 14,150 | | | | 208,800 | |
Bruce Highway (Brisbane - Gympie), Gateway Motorway to Dohles Rocks Road upgrade funding commitment9 | | 314 | | | 948,000 | | | | 19,000 | | | | 23,000 | | | | 906,000 | |
Bruce Highway, Pine River to Caloundra Road, Smart Motorways (Stage 2)1 | | 316 | | | 105,000 | | | | 62,426 | | | | 35,000 | | | | 7,574 | |
Caboolture - Beachmere Road, improve safety | | 313 | | | 11,000 | | | | 853 | | | | 5,500 | | | | 4,647 | |
Caboolture - Bribie Island Road, Hickey Road to King Johns Creek, upgrade2 | | 313 | | | 36,367 | | | | | | | | 1,000 | | | | 35,367 | |
Caboolture - Bribie Island Road, upgrade program10 | | 313 | | | 39,315 | | | | 16,132 | | | | 7,500 | | | | 15,683 | |
Clontarf - Anzac Avenue (Elizabeth Avenue), construct active transport overpass1 | | 313 | | | 22,000 | | | | 11,378 | | | | 10,622 | | | | | |
Coominya Connection Road, Buaraba Creek, replace timber bridge | | 310 | | | 12,000 | | | | 400 | | | | 6,000 | | | | 5,600 | |
Kin Kin Road, Six Mile Creek, replace timber bridge | | 316 | | | 22,500 | | | | 11,366 | | | | 9,184 | | | | 1,950 | |
Maleny - Kenilworth Road (Cambroon), various locations, strengthen and widen pavement | | 316 | | | 11,600 | | | | 1,995 | | | | 9,206 | | | | 399 | |
Strathpine - Samford Road, Eatons Crossing Road and Mount Samson Road intersection, improve safety | | 314 | | | 75,200 | | | | 13,644 | | | | 35,906 | | | | 25,650 | |
Sunshine Motorway, Mooloolah River Interchange Upgrade (Stage 1)1 | | 316 | | | 320,000 | | | | 60,198 | | | | 60,680 | | | | 199,122 | |
Other construction - North Coast District (Transport and Main Roads) | | Various | | | | | | | | | | | 80,591 | | | | Ongoing | |
| | | | | | | | | | | | | | | | | | |
Sub-total North Coast District | | | | | | | | | | | | | 409,716 | | | | | |
| | | | | | | | | | | | | | | | | | |
| | | | | |
Wide Bay Burnett District | | | | | | | | | | | | | | | | | | |
Booral Road and Boundary Road (Urangan), upgrade intersection | | 319 | | | 18,487 | | | | 1,499 | | | | 5,988 | | | | 11,000 | |
Bruce Highway (Cooroy to Curra) Section D, construction1 | | 319 | | | 1,000,000 | | | | 688,459 | | | | 170,507 | | | | 141,034 | |
99
Capital Statement 2023-24
| | | | | | | | | | | | | | | | | | | | |
| Transport and Main Roads | |
Project | | Statistical
Area | | | Total
Estimated
Cost
$‘000 | | | Expenditure
to
30-06-23
$‘000 | | | Budget
2023-24
$‘000 | | | Post
2023-24
$‘000 | |
Bruce Highway (Gympie - Benaraby), various locations, upgrade culverts1 | | | 305 | | | | 44,194 | | | | 22,194 | | | | 4,500 | | | | 17,500 | |
Bruce Highway (Gympie - Maryborough), Owanyilla to Tinana, upgrade intersection and improve safety11 | | | 319 | | | | 11,590 | | | | 1,005 | | | | 3,333 | | | | 7,252 | |
Bruce Highway (Gympie - Maryborough), Tiaro Bypass, construct four lane bypass1 | | | 319 | | | | 336,000 | | | | 8,595 | | | | 8,000 | | | | 319,405 | |
D’Aguilar Highway (Yarraman - Kingaroy), Alexander Lane to Bunya Highway, improve safety | | | 319 | | | | 23,910 | | | | 11,467 | | | | 4,000 | | | | 8,443 | |
Isis Highway (Bundaberg - Childers), various locations, improve safety | | | 319 | | | | 41,943 | | | | 7,364 | | | | 13,000 | | | | 21,578 | |
Maryborough - Hervey Bay Road and Pialba - Burrum Heads Road, upgrade intersection2 | | | 319 | | | | 45,892 | | | | 500 | | | | 8,000 | | | | 37,392 | |
Other construction - Wide Bay Burnett District (Transport and Main Roads) | | | 319 | | | | | | | | | | | | 53,938 | | | | Ongoing | |
Pialba - Burrum Heads Road, O’Regan Creek, upgrade existing floodway | | | 319 | | | | 28,950 | | | | 50 | | | | 1,100 | | | | 27,800 | |
Torbanlea - Pialba Road, various locations, upgrade intersections and floodways2 | | | 319 | | | | 31,400 | | | | 24,894 | | | | 4,606 | | | | 1,900 | |
| | | | | | | | | | | | | | | | | | | | |
Sub-total Wide Bay Burnett District | | | | | | | | | | | | | | | 276,972 | | | | | |
| | | | | | | | | | | | | | | | | | | | |
| | | | | |
Darling Downs District | | | | | | | | | | | | | | | | | | | | |
Cunningham Highway (Ipswich - Warwick), Tregony to Maryvale, improve safety1 | | | 307 | | | | 16,750 | | | | 682 | | | | 1,560 | | | | 14,508 | |
Cunningham Highway (Warwick - Inglewood), improve safety | | | 307 | | | | 16,885 | | | | | | | | 1,000 | | | | 15,885 | |
Gore Highway (Millmerran - Goondiwindi), Wyaga Creek, upgrade floodway2 | | | 307 | | | | 46,672 | | | | 4,491 | | | | 41,729 | | | | 452 | |
Gore Highway (Toowoomba - Millmerran) and Toowoomba - Athol Road, improve safety | | | 307 | | | | 23,359 | | | | | | | | 1,000 | | | | 22,359 | |
New England Highway (Toowoomba - Warwick), improve safety | | | 307 | | | | 13,200 | | | | 2,969 | | | | 9,259 | | | | 971 | |
Toowoomba - Cecil Plains Road, improve safety | | | 307 | | | | 27,031 | | | | | | | | 1,000 | | | | 26,031 | |
Other construction - Darling Downs District (Transport and Main Roads) | | | Various | | | | | | | | | | | | 73,517 | | | | Ongoing | |
| | | | | | | | | | | | | | | | | | | | |
Sub-total Darling Downs District | | | | | | | | | | | | | | | 129,065 | | | | | |
| | | | | | | | | | | | | | | | | | | | |
| | | | | |
South West District | | | | | | | | | | | | | | | | | | | | |
Castlereagh Highway (St George - Hebel), 2022 Disaster Recovery Funding Arrangements betterment works3 | | | 307 | | | | 10,078 | | | | | | | | 3,000 | | | | 7,078 | |
100
Capital Statement 2023-24
| | | | | | | | | | | | | | | | | | |
| Transport and Main Roads | |
Project | | Statistical
Area | | Total
Estimated
Cost
$‘000 | | | Expenditure
to
30-06-23
$‘000 | | | Budget
2023-24
$‘000 | | | Post
2023-24
$‘000 | |
Other construction - South West District (Transport and Main Roads) | | Various | | | | | | | | | | | 20,599 | | | | Ongoing | |
| | | | | | | | | | | | | | | | | | |
Sub-total South West District | | | | | | | | | | | | | 23,599 | | | | | |
| | | | | | | | | | | | | | | | | | |
| | | | | |
Fitzroy District | | | | | | | | | | | | | | | | | | |
Access to Gladstone Port, upgrade1 | | 308 | | | 125,000 | | | | | | | | 2,000 | | | | 123,000 | |
Bruce Highway (Gin Gin - Benaraby), Station Creek and Boyne River, upgrade bridges1 | | 308 | | | 13,800 | | | | 2,172 | | | | 6,135 | | | | 5,494 | |
Bruce Highway (Rockhampton - St Lawrence) and Bolsover Street, upgrade intersection1 | | 308 | | | 37,616 | | | | 3,273 | | | | 1,360 | | | | 32,983 | |
Bruce Highway (Rockhampton - St Lawrence), various locations (Rockhampton), improve intersections1 | | 308 | | | 21,788 | | | | 4,901 | | | | 10,000 | | | | 6,887 | |
Duaringa - Apis Creek Road, Foleyvale Crossing (Mackenzie River Crossing), upgrade road | | 308 | | | 12,199 | | | | 6,199 | | | | 6,000 | | | | | |
Rockhampton - Emu Park Road, upgrade overtaking lanes and improve safety | | 308 | | | 21,000 | | | | 6,098 | | | | 14,902 | | | | | |
Rockhampton - Yeppoon Road, Yeppoon Road upgrade2 | | 308 | | | 85,400 | | | | 12,932 | | | | 19,500 | | | | 52,968 | |
Rockhampton Ring Road12 | | 308 | | | 1,065,000 | | | | 152,081 | | | | 100,000 | | | | 812,919 | |
Other construction - Fitzroy District (Transport and Main Roads) | | 308 | | | | | | | | | | | 41,206 | | | | Ongoing | |
| | | | | | | | | | | | | | | | | | |
Sub-total Fitzroy District | | | | | | | | | | | | | 201,103 | | | | | |
| | | | | | | | | | | | | | | | | | |
| | | | | |
Central West District | | | | | | | | | | | | | | | | | | |
Capricorn Highway (Emerald - Alpha) (Package 2), strengthen and widen pavement1 | | 315 | | | 45,000 | | | | 18 | | | | 2,482 | | | | 42,500 | |
Capricorn Highway (Emerald - Alpha), widen pavement | | 315 | | | 11,150 | | | | 8,550 | | | | 2,600 | | | | | |
Other construction - Central West District (Transport and Main Roads) | | 315 | | | | | | | | | | | 19,043 | | | | Ongoing | |
| | | | | | | | | | | | | | | | | | |
Sub-total Central West District | | | | | | | | | | | | | 24,125 | | | | | |
| | | | | | | | | | | | | | | | | | |
| | | | | |
Mackay Whitsunday District | | | | | | | | | | | | | | | | | | |
Bruce Highway (Bowen - Ayr), Bowen Connection Road to Champion Street intersection, widen pavement1 | | 312 | | | 31,398 | | | | 16,459 | | | | 10,303 | | | | 4,636 | |
Bruce Highway (Mackay - Proserpine), Jumper Creek, upgrade flood immunity1 | | 312 | | | 23,000 | | | | 15,893 | | | | 4,400 | | | | 2,707 | |
Bruce Highway (Mackay - Proserpine), Palm Tree and Blackrock Creek bridges, strengthen bridges1 | | 312 | | | 10,000 | | | | 2,060 | | | | 2,500 | | | | 5,440 | |
101
Capital Statement 2023-24
| | | | | | | | | | | | | | | | | | | | |
| Transport and Main Roads | |
Project | | Statistical
Area | | | Total
Estimated
Cost
$‘000 | | | Expenditure
to
30-06-23
$‘000 | | | Budget
2023-24
$‘000 | | | Post
2023-24
$‘000 | |
Bruce Highway (Proserpine - Bowen), Bowen Connection Road, improve intersection1 | | | 312 | | | | 12,042 | | | | 6,809 | | | | 3,094 | | | | 2,139 | |
Bruce Highway (Proserpine - Bowen), Emu Creek to Drays Road, various locations, widen formation1 | | | 312 | | | | 56,450 | | | | 25,446 | | | | 18,007 | | | | 12,997 | |
Mackay Port Access, Bruce Highway to Mackay - Slade Point Road, construct new two lane road1 | | | 312 | | | | 350,000 | | | | 21,190 | | | | 7,680 | | | | 321,130 | |
Mackay Ring Road (Stage 1)13 | | | 312 | | | | 497,375 | | | | 398,359 | | | | 22,453 | | | | 76,563 | |
Other construction - Mackay Whitsunday District (Transport and Main Roads) | | | 312 | | | | | | | | | | | | 29,431 | | | | Ongoing | |
Proserpine - Shute Harbour Road, Hamilton Plains, flood immunity upgrade1 | | | 312 | | | | 21,000 | | | | 4,031 | | | | 8,180 | | | | 8,789 | |
Walkerston Bypass1 | | | 312 | | | | 187,401 | | | | 81,562 | | | | 44,754 | | | | 61,086 | |
| | | | | | | | | | | | | | | | | | | | |
Sub-total Mackay Whitsunday District | | | | | | | | | | | | | | | 150,802 | | | | | |
| | | | | | | | | | | | | | | | | | | | |
| | | | | |
Northern District | | | | | | | | | | | | | | | | | | | | |
Bruce Highway (Bowen - Ayr), Fredericksfield Road to Homestead Road, construct overtaking lanes11 | | | 318 | | | | 11,365 | | | | 3,096 | | | | 4,401 | | | | 3,868 | |
Burdekin River Bridge, rehabilitation program14 | | | 318 | | | | 96,931 | | | | 56,891 | | | | 4,000 | | | | 36,040 | |
Douglas - Garbutt Road (Townsville), various locations (Stage 1), improve intersections | | | 318 | | | | 13,562 | | | | 2,454 | | | | 3,001 | | | | 8,107 | |
Garbutt - Upper Ross Road (Riverway Drive) (Stage 2), Allambie Lane to Dunlop Street, duplicate to four lanes1 | | | 318 | | | | 95,000 | | | | 6,150 | | | | 1,500 | | | | 87,350 | |
Garbutt - Upper Ross Road, Halliday Street to Gouldian Avenue, improve safety | | | 318 | | | | 43,210 | | | | 400 | | | | 1,000 | | | | 41,810 | |
Other construction - Northern District (Transport and Main Roads) | | | 318 | | | | | | | | | | | | 28,960 | | | | Ongoing | |
Ross River Road, Mabin Street to Rolfe Street, improve safety | | | 318 | | | | 19,320 | | | | 400 | | | | 1,000 | | | | 17,920 | |
Townsville Connection Road (Stuart Drive), Bowen Road Bridge (Idalia), duplicate bridge and approaches | | | 318 | | | | 70,000 | | | | 1,502 | | | | 2,000 | | | | 66,498 | |
Townsville Connection Road (Stuart Drive), University Road to Bowen Road Bridge (Idalia), improve safety | | | 318 | | | | 96,000 | | | | 9,381 | | | | 36,980 | | | | 49,639 | |
Townsville Ring Road (Stage 5) | | | 318 | | | | 280,000 | | | | 255,000 | | | | 10,000 | | | | 15,000 | |
| | | | | | | | | | | | | | | | | | | | |
Sub-total Northern District | | | | | | | | | | | | | | | 92,841 | | | | | |
| | | | | | | | | | | | | | | | | | | | |
| | | | | |
North West District | | | | | | | | | | | | | | | | | | | | |
102
Capital Statement 2023-24
| | | | | | | | | | | | | | | | | | |
| Transport and Main Roads | |
Project | | Statistical
Area | | Total
Estimated
Cost
$‘000 | | | Expenditure
to
30-06-23
$‘000 | | | Budget
2023-24
$‘000 | | | Post
2023-24
$‘000 | |
Flinders Highway (Julia Creek - Cloncurry), Scrubby Creek, strengthen pavement and widen floodway1 | | 315 | | | 42,650 | | | | 25,401 | | | | 16,086 | | | | 1,163 | |
Kennedy Developmental Road (The Lynd - Hughenden), progressive sealing1 | | 315 | | | 50,000 | | | | 37,154 | | | | 11,444 | | | | 1,402 | |
Richmond - Winton Road, strengthen and widen pavement1 | | 315 | | | 13,000 | | | | 634 | | | | 7,770 | | | | 4,596 | |
Other construction - North West District (Transport and Main Roads) | | 315 | | | | | | | | | | | 14,699 | | | | Ongoing | |
| | | | | | | | | | | | | | | | | | |
Sub-total North West District | | | | | | | | | | | | | 49,999 | | | | | |
| | | | | | | | | | | | | | | | | | |
| | | | | |
Far North District | | | | | | | | | | | | | | | | | | |
Bruce Highway (Ingham - Innisfail), Dallachy Road, install floodway1 | | 306 | | | 11,000 | | | | 3,176 | | | | 6,478 | | | | 1,346 | |
Bruce Highway, Cairns Southern Access Corridor (Stage 5), Foster Road, upgrade intersection1 | | 306 | | | 225,000 | | | | 6,129 | | | | 1,146 | | | | 217,725 | |
Cairns Southern Access Cycleway, construct cycleway15 | | 306 | | | 31,849 | | | | 22,375 | | | | 6,692 | | | | 2,782 | |
Cairns Western Arterial Road, Redlynch Connector Road to Captain Cook Highway, duplication1 | | 306 | | | 300,000 | | | | 22,111 | | | | 30,943 | | | | 246,946 | |
Captain Cook Highway (Cairns - Mossman) (Section 2), improve safety | | 306 | | | 21,667 | | | | 17,143 | | | | 3,054 | | | | 1,470 | |
Captain Cook Highway, Cairns CBD to Smithfield, upgrade1 | | 306 | | | 359,000 | | | | 16,789 | | | | 5,973 | | | | 336,238 | |
Gulf Developmental Road (Croydon - Georgetown) (Package 4), strengthen and widen pavement1 | | 315 | | | 12,060 | | | | | | | | 1,500 | | | | 10,560 | |
Other construction - Far North District (Transport and Main Roads) | | Various | | | | | | | | | | | 54,104 | | | | Ongoing | |
Peninsula Developmental Road (Coen - Weipa), Archer River Crossing southern approach, pave and seal1 | | 315 | | | 11,462 | | | | 9,396 | | | | 2,067 | | | | | |
Peninsula Developmental Road (Coen - Weipa), Archer River Crossing, construct bridge1 | | 315 | | | 54,867 | | | | 35,686 | | | | 14,181 | | | | 5,000 | |
Peninsula Developmental Road (Laura - Coen), Musgrave to Red Blanket (Part B), pave and seal1 | | 315 | | | 11,073 | | | | 2,578 | | | | 2,574 | | | | 5,921 | |
Peninsula Developmental Road (Laura - Coen), Yarraden to Three Sisters (Part A), pave and seal1 | | 315 | | | 17,641 | | | | 2,880 | | | | 10,231 | | | | 4,530 | |
| | | | | | | | | | | | | | | | | | |
Sub-total Far North District | | | | | | | | | | | | | 138,943 | | | | | |
| | | | | | | | | | | | | | | | | | |
103
Capital Statement 2023-24
| | | | | | | | | | | | | | | | | | | | |
| Transport and Main Roads | |
Project | | Statistical
Area | | | Total
Estimated
Cost
$‘000 | | | Expenditure
to
30-06-23
$‘000 | | | Budget
2023-24
$‘000 | | | Post
2023-24
$‘000 | |
Statewide District | | | | | | | | | | | | | | | | | | | | |
Bruce Highway (Pine River - Cairns), Road Operations Improvements1 | | | Various | | | | 56,000 | | | | 41,559 | | | | 4,000 | | | | 10,441 | |
Logan and Gold Coast Faster Rail2 | | | 311 | | | | 2,598,155 | | | | 136,617 | | | | 240,000 | | | | 2,221,538 | |
Marine Safety minor works | | | Various | | | | | | | | | | | | 9,035 | | | | Ongoing | |
New Generation Rollingstock | | | Various | | | | 4,155,705 | | | | 1,647,235 | | | | 123,138 | | | | 2,385,332 | |
New Generation Rollingstock, Automatic Train Operation and Platform Screen Doors fitment | | | Various | | | | 275,700 | | | | 50,749 | | | | 38,850 | | | | 186,101 | |
New Generation Rollingstock, European Train Control System fitment, install new signalling | | | Various | | | | 374,084 | | | | 138,679 | | | | 54,818 | | | | 180,587 | |
Queensland Train Manufacturing Program | | | 319 | | | | 4,869,000 | | | | 239,966 | | | | 200,000 | | | | 4,429,034 | |
Rockhampton Rail yards, rail maintenance, manufacturing and logistics centre | | | 308 | | | | 33,400 | | | | 25,346 | | | | 5,300 | | | | 2,754 | |
Transport Corridor Acquisition Fund | | | Various | | | | | | | | | | | | 38,800 | | | | Ongoing | |
Other construction - Statewide (Transport and Main Roads) | | | Various | | | | | | | | | | | | 151,061 | | | | Ongoing | |
| | | | | | | | | | | | | | | | | | | | |
Sub-total Statewide District | | | | | | | | | | | | | | | 865,003 | | | | | |
| | | | | | | | | | | | | | | | | | | | |
| | | | | |
Other Plant and Equipment | | | | | | | | | | | | | | | | | | | | |
Asset replacement for Smart Service Queensland | | | Various | | | | | | | | | | | | 600 | | | | Ongoing | |
Corporate buildings | | | Various | | | | | | | | | | | | 23,360 | | | | Ongoing | |
Information technology | | | Various | | | | | | | | | | | | 30,255 | | | | Ongoing | |
Plant and Equipment | | | Various | | | | | | | | | | | | 22,962 | | | | Ongoing | |
| | | | | | | | | | | | | | | | | | | | |
Sub-total Other Plant and Equipment | | | | | | | | | | | | | | | 77,177 | | | | | |
| | | | | | | | | | | | | | | | | | | | |
Total Property, Plant and Equipment | | | | | | | | | | | | | | | 4,150,579 | | | | | |
| | | | | | | | | | | | | | | | | | | | |
| | | | | |
Capital Grants | | | | | | | | | | | | | | | | | | | | |
Active Transport Rail Trails | | | Various | | | | | | | | | | | | 2,194 | | | | Ongoing | |
Beams Road (Carseldine and Fitzgibbon), upgrade rail level crossing16 | | | 303 | | | | 209,330 | | | | 16,330 | | | | 16,217 | | | | 176,783 | |
Black Spot Program | | | Various | | | | | | | | | | | | 24,335 | | | | Ongoing | |
Boundary Road (Coopers Plains), upgrade rail level crossing funding commitment16 | | | 303 | | | | 352,500 | | | | 6,550 | | | | 2,000 | | | | 343,950 | |
Capital grants - Transport and Roads | | | Various | | | | | | | | | | | | 360,277 | | | | Ongoing | |
Cycling Program | | | Various | | | | | | | | | | | | 12,038 | | | | Ongoing | |
Lansdown Eco-Industrial Precinct (Calcium), upgrade road and rail infrastructure | | | 318 | | | | 12,000 | | | | 4,800 | | | | 3,000 | | | | 4,200 | |
104
Capital Statement 2023-24
| | | | | | | | | | | | | | | | | | | | |
| Transport and Main Roads | |
Project | | Statistical
Area | | | Total
Estimated
Cost
$‘000 | | | Expenditure
to
30-06-23
$‘000 | | | Budget
2023-24
$‘000 | | | Post
2023-24
$‘000 | |
Lindum rail level crossing, upgrade signalisation16 | | | 301 | | | | 20,000 | | | | 5,450 | | | | 8,300 | | | | 6,250 | |
Passenger Transport Accessible Infrastructure Program | | | Various | | | | | | | | | | | | 2,796 | | | | Ongoing | |
Saraji Road, Phillips Creek, replace bridge1 | | | 312 | | | | 18,000 | | | | | | | | 5,900 | | | | 12,100 | |
School Bus Upgrade Program | | | Various | | | | | | | | | | | | 11,747 | | | | Ongoing | |
School Transport Infrastructure Program | | | Various | | | | 60,000 | | | | 23,252 | | | | 3,824 | | | | 32,924 | |
Transport Infrastructure Development Scheme | | | Various | | | | | | | | | | | | 75,950 | | | | Ongoing | |
Wheelchair accessible taxi sustainability funding | | | Various | | | | 20,890 | | | | 18,890 | | | | 2,000 | | | | | |
Zero Emission Vehicle Action Plan17 | | | Various | | | | 55,000 | | | | 17,500 | | | | 22,500 | | | | 15,000 | |
| | | | | | | | | | | | | | | | | | | | |
Total Capital Grants | | | | | | | | | | | | | | | 553,078 | | | | | |
| | | | | | | | | | | | | | | | | | | | |
| | | | | |
ROADTEK | | | | | | | | | | | | | | | | | | | | |
| | | | | |
Property, Plant and Equipment | | | | | | | | | | | | | | | | | | | | |
Construction Plant Works | | | Various | | | | | | | | | | | | 26,000 | | | | Ongoing | |
| | | | | | | | | | | | | | | | | | | | |
Total Property, Plant and Equipment | | | | | | | | | | | | | | | 26,000 | | | | | |
| | | | | | | | | | | | | | | | | | | | |
| | | | | |
CITEC | | | | | | | | | | | | | | | | | | | | |
| | | | | |
Property, Plant and Equipment | | | | | | | | | | | | | | | | | | | | |
Hardware replacement | | | 305 | | | | | | | | | | | | 1,000 | | | | Ongoing | |
Right of use lease assets | | | 305 | | | | | | | | | | | | 440 | | | | Ongoing | |
| | | | | | | | | | | | | | | | | | | | |
Total Property, Plant and Equipment | | | | | | | | | | | | | | | 1,440 | | | | | |
| | | | | | | | | | | | | | | | | | | | |
| | | | | |
QUEENSLAND RAIL LIMITED | | | | | | | | | | | | | | | | | | | | |
| | | | | |
Property, Plant and Equipment | | | | | | | | | | | | | | | | | | | | |
Growth - Externally Led | | | | | | | | | | | | | | | | | | | | |
Breakfast Creek Bridge, realign track18 | | | 305 | | | | 55,280 | | | | 23,334 | | | | 7,862 | | | | 24,083 | |
Bridge pier protection18 | | | 305 | | | | 3,778 | | | | 3,500 | | | | 278 | | | | | |
Clapham Yard Stabling18 | | | 303 | | | | 532,356 | | | | 132,168 | | | | 151,336 | | | | 248,852 | |
European Train Control System Level 219 | | | 305 | | | | 717,323 | | | | 509,732 | | | | 121,100 | | | | 86,491 | |
Other European Train Control System Level 2 - Inner City | | | 305 | | | | | | | | | | | | 10,460 | | | | Ongoing | |
Station Upgrades Fairfield to Salisbury18 | | | 303 | | | | 105,355 | | | | 36,060 | | | | 9,211 | | | | 60,084 | |
Inner City signalling upgrades18 | | | Various | | | | 64,913 | | | | 30,565 | | | | 8,714 | | | | 25,634 | |
Mayne Yard Relocations18 | | | 302 | | | | 33,712 | | | | 12,594 | | | | 4,099 | | | | 17,019 | |
Mayne Yard Accessibility18 | | | 302 | | | | 152,723 | | | | 93,921 | | | | 2,907 | | | | 55,895 | |
Moolabin Power Upgrade18 | | | | | | | 18,075 | | | | | | | | 586 | | | | 17,489 | |
105
Capital Statement 2023-24
| | | | | | | | | | | | | | | | | | |
| Transport and Main Roads | |
Project | | Statistical
Area | | Total
Estimated
Cost
$‘000 | | | Expenditure
to
30-06-23
$‘000 | | | Budget
2023-24
$‘000 | | | Post
2023-24
$‘000 | |
New Generation Rollingstock compatible stabling yard upgrades | | Various | | | 76,900 | | | | | | | | 28,200 | | | | 48,700 | |
Other rail network enhancements | | Various | | | | | | | | | | | 10,350 | | | | Ongoing | |
Other station and network improvements | | Various | | | | | | | | | | | 2,740 | | | | Ongoing | |
Rail station access improvements20 | | Various | | | 212,448 | | | | 20,809 | | | | 41,809 | | | | 149,830 | |
Signalling Integration Works | | Various | | | 153,259 | | | | 15,250 | | | | 48,709 | | | | 89,300 | |
Narangba train station, construct park ‘n’ ride21 | | 313 | | | 6,500 | | | | 217 | | | | 712 | | | | 5,572 | |
Roma Street surface station integration18 | | 305 | | | 35,000 | | | | | | | | 35,000 | | | | | |
Station Precinct Infrastructure Program21 | | Various | | | 20,000 | | | | | | | | 1,000 | | | | 19,000 | |
Ormeau feeder substation | | 309 | | | 110,700 | | | | | | | | 1,100 | | | | 109,600 | |
Ormeau Mainline connection works | | 309 | | | 136,200 | | | | | | | | 1,400 | | | | 134,800 | |
Station Accessibility Upgrades Other | | Various | | | | | | | | | | | 32,996 | | | | Ongoing | |
Train Crew Capacity Upgrades | | Various | | | 4,000 | | | | | | | | 4,000 | | | | | |
Other park ‘n’ rides | | Various | | | | | | | | | | | 1,096 | | | | Ongoing | |
| | | | | | | | | | | | | | | | | | |
Sub-total Growth - Externally Led | | | | | | | | | | | | | 525,664 | | | | | |
| | | | | | | | | | | | | | | | | | |
| | | | | |
Growth - Internally Led | | | | | | | | | | | | | | | | | | |
Breakfast Creek Bridge Replacement | | 305 | | | 28,000 | | | | 2,000 | | | | 20,000 | | | | 6,000 | |
Inner City Rail Corridor, upgrade signalling and interlocking | | Various | | | 1,500 | | | | 200 | | | | 1,300 | | | | | |
Mount Isa Line, capacity and resilience improvements22 | | Various | | | 50,000 | | | | 5,011 | | | | 11,681 | | | | 33,308 | |
Other Rail Growth | | Various | | | | | | | | | | | 58,619 | | | | Ongoing | |
Autonomous track inspections | | Various | | | 650 | | | | | | | | 650 | | | | | |
Cross River Rail Tunnel Maintenance Plant | | 305 | | | 22,350 | | | | 50 | | | | 2,250 | | | | 20,050 | |
Track Construction Enabling Plant Package | | Various | | | 800 | | | | | | | | 800 | | | | | |
Auchenflower train station, Auchenflower Terrace, upgrade station | | 305 | | | 46,406 | | | | 45,356 | | | | 1,050 | | | | | |
Banyo train station, St Vincents Road, upgrade station | | 302 | | | 54,284 | | | | 6,396 | | | | 11,709 | | | | 36,178 | |
Bundamba train station, Mining Street, upgrade station | | 310 | | | 59,545 | | | | 9,238 | | | | 14,012 | | | | 36,295 | |
Buranda train station, Arne Street (Woolloongabba), upgrade station | | 303 | | | 36,690 | | | | 5,440 | | | | 14,456 | | | | 16,793 | |
Burpengary train station, Burpengary Road, upgrade station | | 313 | | | 53,033 | | | | 5,242 | | | | 14,258 | | | | 33,532 | |
Cannon Hill train station, Barrack Road, upgrade station | | 303 | | | 26,700 | | | | 24,933 | | | | 1,767 | | | | | |
106
Capital Statement 2023-24
| | | | | | | | | | | | | | | | | | | | |
| Transport and Main Roads | |
Project | | Statistical
Area | | | Total
Estimated
Cost
$‘000 | | | Expenditure
to
30-06-23
$‘000 | | | Budget
2023-24
$‘000 | | | Post
2023-24
$‘000 | |
Lindum train station, Sibley Road, upgrade station | | | 301 | | | | 58,992 | | | | 7,344 | | | | 15,056 | | | | 36,592 | |
Morningside train station, Waminda Street, upgrade station | | | 302 | | | | 69,925 | | | | 6,625 | | | | 18,335 | | | | 44,966 | |
| | | | | | | | | | | | | | | | | | | | |
Sub-total Growth - Internally Led | | | | | | | | | | | | | | | 185,943 | | | | | |
| | | | | | | | | | | | | | | | | | | | |
| | | | | |
South East Queensland Network | | | | | | | | | | | | | | | | | | | | |
Rail Network Maintenance Program, South East Queensland network, maintain below rail assets23 | | | Various | | | | | | | | | | | | 76,879 | | | | Ongoing | |
Rail Network Maintenance Program, South East Queensland network, maintain above rail assets24 | | | Various | | | | | | | | | | | | 121,877 | | | | Ongoing | |
| | | | | | | | | | | | | | | | | | | | |
Sub-total South East Queensland Network | | | | | | | | | | | | | | | 198,756 | | | | | |
| | | | | | | | | | | | | | | | | | | | |
| | | | | |
Regional Network | | | | | | | | | | | | | | | | | | | | |
Maintenance of below rail assets - Townsville - Mount Isa Rail Line | | | Various | | | | | | | | | | | | 11,045 | | | | Ongoing | |
Rail Network Maintenance Program, North Coast Line, maintain below rail assets25 | | | Various | | | | | | | | | | | | 68,837 | | | | Ongoing | |
Rail Network Maintenance Program, Regional network, maintain above rail assets26 | | | Various | | | | | | | | | | | | 39,543 | | | | Ongoing | |
Rail Network Maintenance Program, West Moreton, maintain below rail assets27 | | | Various | | | | | | | | | | | | 39,210 | | | | Ongoing | |
Rail Network Maintenance Program, Western region, maintain below rail assets28 | | | Various | | | | | | | | | | | | 15,238 | | | | Ongoing | |
| | | | | | | | | | | | | | | | | | | | |
Sub-total Regional Network | | | | | | | | | | | | | | | 173,873 | | | | | |
| | | | | | | | | | | | | | | | | | | | |
| | | | | |
Enterprise | | | | | | | | | | | | | | | | | | | | |
Enterprise Assets | | | Various | | | | | | | | | | | | 29,408 | | | | Ongoing | |
Enterprise Other | | | Various | | | | | | | | | | | | 8,990 | | | | Ongoing | |
Information and Technology | | | Various | | | | | | | | | | | | 11,563 | | | | Ongoing | |
Safety and Risk | | | Various | | | | | | | | | | | | 322 | | | | Ongoing | |
| | | | | | | | | | | | | | | | | | | | |
Sub-total Enterprise | | | | | | | | | | | | | | | 50,284 | | | | | |
| | | | | | | | | | | | | | | | | | | | |
Total Property, Plant and Equipment | | | | | | | | | | | | | | | 1,134,521 | | | | | |
| | | | | | | | | | | | | | | | | | | | |
| | | | | |
GOLD COAST WATERWAYS AUTHORITY | | | | | | | | | | | | | | | | | | | | |
| | | | | |
Property, Plant and Equipment | | | | | | | | | | | | | | | | | | | | |
Boating Infrastructure Program, various locations | | | 309 | | | | | | | | | | | | 3,362 | | | | Ongoing | |
Plant, equipment and minor works | | | 309 | | | | | | | | | | | | 2,270 | | | | Ongoing | |
107
Capital Statement 2023-24
| | | | | | | | | | | | | | | | | | | | |
| Transport and Main Roads | |
Project | | Statistical
Area | | | Total
Estimated
Cost $‘000 | | | Expenditure
to
30-06-23
$‘000 | | | Budget
2023-24
$‘000 | | | Post
2023-24
$‘000 | |
Spit Masterplan (Southport), northern end of Main Beach, implement spit masterplan | | | 309 | | | | 33,153 | | | | 11,099 | | | | 8,799 | | | | 13,255 | |
| | | | | | | | | | | | | | | | | | | | |
Total Property, Plant and Equipment | | | | | | | | | | | | | | | 14,431 | | | | | |
| | | | | | | | | | | | | | | | | | | | |
| | | | | |
CROSS RIVER RAIL DELIVERY AUTHORITY | | | | | | | | | | | | | | | | | | | | |
| | | | | |
Property, Plant and Equipment | | | | | | | | | | | | | | | | | | | | |
Cross River Rail | | | 305 | | | | 7,686,278 | | | | 5,633,041 | | | | 762,905 | | | | 1,290,331 | |
| | | | | | | | | | | | | | | | | | | | |
Total Property, Plant and Equipment | | | | | | | | | | | | | | | 762,905 | | | | | |
| | | | | | | | | | | | | | | | | | | | |
| | | | | |
Capital Grants | | | | | | | | | | | | | | | | | | | | |
Cross River Rail - third party returnable works | | | 305 | | | | 162,196 | | | | 95,852 | | | | 66,344 | | | | | |
| | | | | | | | | | | | | | | | | | | | |
Total Capital Grants | | | | | | | | | | | | | | | 66,344 | | | | | |
| | | | | | | | | | | | | | | | | | | | |
| | | | | |
FAR NORTH QUEENSLAND PORTS CORPORATION LIMITED | | | | | | | | | | | | | | | | | | | | |
| | | | | |
Property, Plant and Equipment | | | | | | | | | | | | | | | | | | | | |
Cairns shipping development project - fine sediment offset | | | 306 | | | | 110,605 | | | | 109,855 | | | | 750 | | | | | |
General cargo consolidation | | | 306 | | | | | | | | | | | | 200 | | | | Ongoing | |
Horn Island Passenger Jetty and Cargo Wharf Upgrade | | | 315 | | | | 8,500 | | | | | | | | 6,000 | | | | 2,500 | |
Lease Acquisition | | | 306 | | | | 2,000 | | | | | | | | 1,000 | | | | 1,000 | |
Mourilyan Land Development for Bulk Cargo | | | 306 | | | | 5,400 | | | | 200 | | | | 200 | | | | 5,000 | |
Plant, equipment and minor works | | | 306 | | | | | | | | | | | | 2,235 | | | | Ongoing | |
Site decontamination at Cityport Precinct 5 | | | 306 | | | | 6,000 | | | | 2,500 | | | | 3,500 | | | | | |
Smith’s Creek Cargo Land Consolidation | | | 306 | | | | | | | | | | | | 200 | | | | Ongoing | |
Tingira Street Subdivision Development | | | 306 | | | | 10,669 | | | | 4,784 | | | | 745 | | | | 5,140 | |
Tingira Street Warehouse/Shops | | | 306 | | | | | | | | | | | | 200 | | | | Ongoing | |
Wharf 7 and 8 Southern Approach | | | 306 | | | | 1,006 | | | | 606 | | | | 400 | | | | | |
| | | | | | | | | | | | | | | | | | | | |
Total Property, Plant and Equipment | | | | | | | | | | | | | | | 15,430 | | | | | |
| | | | | | | | | | | | | | | | | | | | |
| | | | | |
GLADSTONE PORTS CORPORATION LIMITED | | | | | | | | | | | | | | | | | | | | |
| | | | | |
Property, Plant and Equipment | | | | | | | | | | | | | | | | | | | | |
Auckland Point Central projects | | | 308 | | | | | | | | | | | | 2,000 | | | | Ongoing | |
Auckland Point projects | | | | | | | | | | | | | | | | | | | | |
Auckland Point 1 projects | | | 308 | | | | | | | | | | | | 867 | | | | Ongoing | |
Auckland Point 3 projects | | | 308 | | | | | | | | | | | | 3,470 | | | | Ongoing | |
Auckland Point 4 projects | | | 308 | | | | | | | | | | | | 1,800 | | | | Ongoing | |
Barney Point projects | | | 308 | | | | | | | | | | | | 1,050 | | | | Ongoing | |
Fisherman’s landing projects | | | 308 | | | | | | | | | | | | 2,480 | | | | Ongoing | |
108
Capital Statement 2023-24
| | | | | | | | | | | | | | | | | | | | |
| Transport and Main Roads | |
Project | | Statistical
Area | | | Total
Estimated
Cost
$‘000 | | | Expenditure
to
30-06-23
$‘000 | | | Budget
2023-24
$‘000 | | | Post
2023-24
$‘000 | |
Information systems projects | | | 308 | | | | | | | | | | | | 2,419 | | | | Ongoing | |
Marina projects | | | 308 | | | | | | | | | | | | 1,355 | | | | Ongoing | |
Marine pilot services projects | | | 308 | | | | | | | | | | | | 500 | | | | Ongoing | |
Plant, equipment and minor works | | | 308 | | | | | | | | | | | | 3,474 | | | | Ongoing | |
Port Alma projects | | | 308 | | | | | | | | | | | | 2,382 | | | | Ongoing | |
Port of Bundaberg conveyor project | | | 319 | | | | 19,127 | | | | 11,427 | | | | 7,700 | | | | | |
Port of Bundaberg projects | | | 319 | | | | | | | | | | | | 500 | | | | Ongoing | |
Port Services projects | | | 308 | | | | | | | | | | | | 7,341 | | | | Ongoing | |
Quarry projects | | | 308 | | | | | | | | | | | | 1,500 | | | | Ongoing | |
RG Tanna Coal Terminal Projects | | | | | | | | | | | | | | | | | | | | |
Conveyor life extension | | | 308 | | | | | | | | | | | | 1,380 | | | | Ongoing | |
Process control systems, stockpile management and upgrades | | | 308 | | | | | | | | | | | | 46,289 | | | | Ongoing | |
Ship loader (SL1) replacement | | | 308 | | | | 63,921 | | | | 21,587 | | | | 36,942 | | | | 5,392 | |
Right-of-use lease assets | | | 308 | | | | | | | | | | | | 2,572 | | | | Ongoing | |
| | | | | | | | | | | | | | | | | | | | |
Total Property, Plant and Equipment | | | | | | | | | | | | | | | 126,021 | | | | | |
| | | | | | | | | | | | | | | | | | | | |
| | | | | |
NORTH QUEENSLAND BULK PORTS CORPORATION LIMITED | | | | | | | | | | | | | | | | | | | | |
| | | | | |
Property, Plant and Equipment | | | | | | | | | | | | | | | | | | | | |
5 Yearly Dredging at Hay Point | | | 312 | | | | | | | | | | | | 2,096 | | | | Ongoing | |
Abbot Point Road Resealing and Asphalting | | | 312 | | | | 2,000 | | | | | | | | 2,000 | | | | | |
Armour Rock Stockpile | | | 312 | | | | | | | | | | | | 350 | | | | Ongoing | |
Cargo Handling Security & Operational Improvements | | | 312 | | | | 1,892 | | | | 142 | | | | 500 | | | | 1,250 | |
Harbour Road Upgrade (Middle Breakwater) | | | 312 | | | | 3,131 | | | | 131 | | | | 500 | | | | 2,500 | |
Hydrogen trade studies | | | 312 | | | | | | | | | | | | 500 | | | | Ongoing | |
Louisa Creek Acquisition Program | | | 312 | | | | | | | | | | | | 1,052 | | | | Ongoing | |
Marine Offloading Facility Expansion - Stage 1 | | | 312 | | | | | | | | | | | | 500 | | | | Ongoing | |
Middle Breakwater Fuel Line Supports Replacement | | | 312 | | | | 9,131 | | | | 2,631 | | | | 6,500 | | | | | |
New Abbot Point Eastern Precinct Facility (Stage 1) | | | 312 | | | | 1,575 | | | | 175 | | | | 1,400 | | | | | |
North Queensland Bulk Ports Corporation Limited - Port Development General | | | 312 | | | | | | | | | | | | 1,501 | | | | Ongoing | |
Northern Breakwater Inner Revetment Upgrade | | | 312 | | | | 2,990 | | | | 490 | | | | 2,500 | | | | | |
| | | | | | | | | | | | | | | | | | | | |
Total Property, Plant and Equipment | | | | | | | | | | | | | | | 19,399 | | | | | |
| | | | | | | | | | | | | | | | | | | | |
| | | | | |
PORT OF TOWNSVILLE LIMITED | | | | | | | | | | | | | | | | | | | | |
109
Capital Statement 2023-24
| | | | | | | | | | | | | | | | | | | | |
| Transport and Main Roads | |
Project | | Statistical
Area | | | Total
Estimated
Cost
$‘000 | | | Expenditure
to 30-06-23
$‘000 | | | Budget
2023-24
$‘000 | | | Post
2023-24
$‘000 | |
Property, Plant and Equipment | | | | | | | | | | | | | | | | | | | | |
Channel capacity upgrade | | | 318 | | | | 251,180 | | | | 169,998 | | | | 60,699 | | | | 20,483 | |
Other infrastructure and maintenance works | | | 318 | | | | | | | | | | | | 3,565 | | | | Ongoing | |
Plant, equipment and minor works | | | 318 | | | | | | | | | | | | 1,522 | | | | Ongoing | |
Road network upgrades | | | 318 | | | | | | | | | | | | 3,200 | | | | Ongoing | |
Wharf facilities upgrades | | | 318 | | | | | | | | | | | | 6,591 | | | | Ongoing | |
| | | | | | | | | | | | | | | | | | | | |
Total Property, Plant and Equipment | | | | | | | | | | | | | | | 75,578 | | | | | |
| | | | | | | | | | | | | | | | | | | | |
TOTAL TRANSPORT AND MAIN ROADS (PPE) | | | | | | | | | | | | | | | 6,326,303 | | | | | |
| | | | | | | | | | | | | | | | | | | | |
TOTAL TRANSPORT AND MAIN ROADS (CG) | | | | | | | | | | | | | | | 619,422 | | | | | |
| | | | | | | | | | | | | | | | | | | | |
Notes:
| 1. | Jointly funded with the Australian Government. |
| 2. | Jointly funded with the Australian Government and subject to the Australian Government’s Infrastructure Investment Program review. |
| 3. | Jointly funded with the Australian Government. Funding administered by the Queensland Reconstruction Authority. |
| 4. | Jointly funded with the Australian Government and City of Gold Coast. |
| 5. | Jointly funded with the Australian Government. Project cost, scope and timing subject to further planning. |
| 6. | Represents a funding commitment by the Australian Government, Queensland Government and Brisbane City Council. |
| 7. | Jointly funded with the Australian Government. This commitment is part of integrated planning underway for Gateway Motorway and Bruce Highway upgrades. Project cost, scope and timing subject to further planning and negotiation with the Australian Government. |
| 8. | Jointly funded with the Australian Government (part of the Bruce Highway Upgrade Program) and subject to the Australian Government’s Infrastructure Investment Program review. |
| 9. | Jointly funded with the Australian Government. This commitment is part of integrated planning underway for Gateway Motorway and Bruce Highway upgrades and also considers upgrades to Gympie Arterial Road (between Strathpine Road and Gateway Motorway). Project cost, scope and timing subject to further planning and negotiation with the Australian Government. |
| 10. | Jointly funded with the Australian Government and subject to the Australian Government’s Infrastructure Investment Program review. Includes funding for Old Toorbul Point Road intersection signalisation. |
| 11. | Funded by the Australian Government. |
| 12. | Jointly funded with the Australian Government. $280 million package of works committed in the forward estimates for the first phase of construction (early works). Major works timing subject to negotiation with the Australian Government. |
| 13. | Jointly funded with the Australian Government. Construction on the Mackay Ring Road is complete, with remaining works associated with the Bald Hill Connection Road. |
| 14. | Jointly funded with the Australian Government. Includes an agreed contribution from Queensland Rail. |
| 15. | Jointly funded with the Australian Government (funded as part of the Bruce Highway, Cairns Southern Access Stage 2 project) and subject to the Australian Government’s Infrastructure Investment Program review. |
| 16. | Jointly funded with the Australian Government and Brisbane City Council and subject to the Australian Government’s Infrastructure Investment Program review. |
| 17. | Zero Emission Vehicle Action Plan includes the Queensland Zero Emission Vehicle Rebate Scheme and the Queensland Electric Vehicle Charging Infrastructure Co-Fund Scheme |
| 18. | This project is being delivered by Cross River Rail Delivery Authority. |
| 19. | The project is being delivered by Cross River Rail Delivery Authority and Department of Transport and Main Roads with support from Queensland Rail. |
110
Capital Statement 2023-24
| 20. | Rail station access improvements include Roma Street train station, Dutton Park train station and Boggo Road train station, Pimpama train station, Hope Island train station and Merrimac train station. |
| 21. | Jointly delivered by Queensland Rail and Department of Transport and Main Roads. |
| 22. | The works involve increased structural gauge, waterway resilience and track renewal. |
| 23. | The works relate to renewal, improvement, replacement and upgrade of track infrastructure in the South East Queensland rail network. |
| 24. | The works relate to maintenance of stations, platforms and rollingstock in the South East Queensland rail network. |
| 25. | The works relate to renewal, replacement and upgrade of track infrastructure on the North Coast Line. |
| 26. | The works relate to maintenance of rollingstock, stations, yards and locomotives in the Regional Queensland rail network. |
| 27. | The works relate to renewal, improvement, replacement and upgrade of rail infrastructure on West Moreton system. |
| 28. | The works relate to renewal, improvement, replacement and upgrade of the Western Regional rail systems. |
111
Capital Statement 2023-24
| 3.20 | TREATY, ABORIGINAL AND TORRES STRAIT ISLANDER PARTNERSHIPS, COMMUNITIES AND THE ARTS |
The Treaty, Aboriginal and Torres Strait Islander Partnerships, Communities and the Arts portfolio includes the Department of Treaty, Aboriginal and Torres Strait Islander Partnerships, Communities and the Arts together with Arts Queensland, and statutory bodies reporting to the Minister for Treaty, Minister for Aboriginal and Torres Strait Islander Partnerships, Minister for Communities and Minister for the Arts.
The portfolio’s capital purchases for 2023-24 are $112.0 million. The portfolio’s capital grants for 2023-24 are $2.2 million.
Department of Treaty, Aboriginal and Torres Strait Islander Partnerships, Communities and the Arts
Total capital purchases for the Department of Treaty, Aboriginal and Torres Strait Islander Partnerships, Communities and the Arts are $105.9 million in 2023-24. Total capital grants for the department are $2.2 million in 2023-24.
Program Highlights (Property, Plant and Equipment)
| • | | $44.1 million to continue construction of the new performing arts venue at the Queensland Performing Arts Centre, benefiting Queensland artists and audiences. |
| • | | $12.2 million to continue the upgrade and construction program for neighbourhood centres and other key social infrastructure. |
| • | $11.4 million to address Stage 2 of urgent and unavoidable critical infrastructure renewal works at the Queensland Cultural Centre. |
| • | $9.0 million to deliver priority infrastructure projects across state owned arts and cultural facilities. |
| • | $8.0 million for capital asset renewal works, compliance and safety improvements and amenities upgrades across the Queensland Cultural Centre. |
| • | $5.9 million towards the upgrade and acquisition of capital equipment within the Queensland Performing Arts Centre. |
| • | $3.4 million towards the design and construction of a new neighbourhood centre in Rockhampton. |
| • | $2.9 million towards the redevelopment of the Bribie Island neighbourhood centre. |
| • | $2.8 million to deliver security enhancement measures across the Queensland Cultural Centre, including additional funding of $500,000 for installation of new security cameras across the Precinct. |
| • | $2.0 million towards construction of a flexible performance space within the Queensland Performing Arts Centre. |
| • | $1.6 million towards the fit-out of the Yeronga neighbourhood centre. |
| • | $1.0 million towards the upgrade of the Mount Isa Diversion centre to enable a specific service offering for women. |
| • | $700,000 to complete the reconfiguration of the Grey and Russell Street intersection, South Brisbane to enhance vehicular access to the Queensland Performing Arts Centre. |
| • | $898,000 for office accommodation and other property plant and equipment. |
112
Capital Statement 2023-24
Program Highlights (Capital Grants)
| • | | $1.45 million towards the construction of the Thursday Island Splash Park. |
| • | | $763,000 towards the construction of the Atherton Neighbourhood Centre. |
Library Board of Queensland
The Library Board of Queensland has capital purchases of $2.2 million in 2023-24, to purchase heritage collections, information collections, intangible assets in the form of digital collections, and replace information technology equipment.
Program Highlights (Property, Plant and Equipment)
| • | | $1.6 million to acquire new items for the digital, heritage and information collections. |
| • | | $638,000 to replace information technology equipment. |
Queensland Art Gallery
The Queensland Art Gallery has capital purchases of $2.8 million in 2023-24, for acquiring art for the gallery’s collection, as well as life-cycle replacement of other property, plant, and equipment assets.
Program Highlights (Property, Plant and Equipment)
| • | | $2.5 million to acquire art for the gallery’s collection. |
| • | | $300,000 to replace other property, plant, and equipment. |
Queensland Performing Arts Trust
The Queensland Performing Arts Trust will invest $1.0 million in the lifecycle replacement of operational property, plant and equipment assets, such as theatre equipment and food and beverage equipment.
| | | | | | | | | | | | |
| Treaty, Aboriginal and Torres Strait Islander Partnerships, Communities and the Arts |
Project | | Statistical
Area | | | Total Estimated Cost $‘000 | | Expenditure to 30-06-23 $‘000 | | Budget 2023-24 $‘000 | | Post 2023-24 $‘000 |
DEPARTMENT OF TREATY, ABORIGINAL AND TORRES STRAIT ISLANDER PARTNERSHIPS, COMMUNITIES AND THE ARTS |
Property, Plant and Equipment | | | | | | | | | | | | |
Arts Queensland | | | | | | | | | | | | |
New Performing Arts Venue at QPAC1 | | | 305 | | | 150,000 | | 102,558 | | 44,100 | | 3,342 |
Queensland Cultural Centre critical infrastructure works - Stage 2 2021 to 2025 | | | 305 | | | 30,519 | | 7,778 | | 11,400 | | 11,341 |
Arts Infrastructure Investment Fund - Stage 2 2021 to 2024 | | | 305 | | | 9,525 | | 536 | | 8,989 | | |
Queensland Cultural Centre - Capital Works, Asset Upgrades and Refurbishment Projects | | | 305 | | | 53,700 | | 700 | | 8,000 | | 45,000 |
113
Capital Statement 2023-24
| | | | | | | | | | | | | | | | | | |
| Treaty, Aboriginal and Torres Strait Islander Partnerships, Communities and the Arts | |
Project | | Statistical
Area | | Total
Estimated
Cost
$‘000 | | | Expenditure
to
30-06-23
$‘000 | | | Budget
2023-24
$‘000 | | | Post
2023-24
$‘000 | |
Queensland Performing Arts Venue - Capital Upgrades | | 305 | | | 5,940 | | | | | | | | 5,940 | | | | | |
Queensland Cultural Centre - Security Upgrades | | 305 | | | 4,010 | | | | 300 | | | | 2,800 | | | | 910 | |
Flexible Performance Space | | 305 | | | 14,600 | | | | | | | | 2,000 | | | | 12,600 | |
Realignment of Grey and Russell Street Intersection | | 305 | | | 1,400 | | | | 700 | | | | 700 | | | | | |
| | | | | | | | | | | | | | | | | | |
Sub-total Arts Queensland | | | | | | | | | | | | | 83,929 | | | | | |
| | | | | | | | | | | | | | | | | | |
| | | | | |
Community Services | | | | | | | | | | | | | | | | | | |
Rockhampton Neighbourhood Centre | | 308 | | | 4,555 | | | | 1,106 | | | | 3,449 | | | | | |
Bribie Island Neighbourhood Centre | | 313 | | | 3,000 | | | | 100 | | | | 2,900 | | | | | |
Fitout of the Yeronga Neighbourhood Centre | | 303 | | | 1,788 | | | | 200 | | | | 1,588 | | | | | |
Mount Isa Diversion Centre Upgrade | | 315 | | | 4,000 | | | | | | | | 1,000 | | | | 3,000 | |
New and Replacement Neighbourhood Centres | | Various | | | | | | | | | | | 7,687 | | | | Ongoing | |
General Property Upgrades | | Various | | | | | | | | | | | 4,470 | | | | Ongoing | |
Office accommodation, fixtures and fittings | | Various | | | | | | | | | | | 496 | | | | Ongoing | |
| | | | | | | | | | | | | | | | | | |
Sub-total Community Services | | | | | | | | | | | | | 21,590 | | | | | |
| | | | | | | | | | | | | | | | | | |
Other Property, Plant and Equipment - Minor capital works | | Various | | | | | | | | | | | 402 | | | | Ongoing | |
| | | | | | | | | | | | | | | | | | |
Total Property, Plant and Equipment | | | | | | | | | | | | | 105,921 | | | | | |
| | | | | | | | | | | | | | | | | | |
Capital Grants | | | | | | | | | | | | | | | | | | |
Splash Park - Thursday Island | | 315 | | | 3,000 | | | | 1,549 | | | | 1,451 | | | | | |
Atherton Neighbourhood Centre | | 306 | | | 1,907 | | | | 1,144 | | | | 763 | | | | | |
| | | | | | | | | | | | | | | | | | |
Total Capital Grants | | | | | | | | | | | | | 2,214 | | | | | |
| | | | | | | | | | | | | | | | | | |
LIBRARY BOARD OF QUEENSLAND | | | | | | | | | | | | | | | | | | |
Property, Plant and Equipment | | | | | | | | | | | | | | | | | | |
Digital collection | | 305 | | | | | | | | | | | 795 | | | | Ongoing | |
Heritage collection | | 305 | | | | | | | | | | | 465 | | | | Ongoing | |
Information collection | | 305 | | | | | | | | | | | 349 | | | | Ongoing | |
Information technology equipment | | 305 | | | | | | | | | | | 638 | | | | Ongoing | |
| | | | | | | | | | | | | | | | | | |
Total Property, Plant and Equipment | | | | | | | | | | | | | 2,247 | | | | | |
| | | | | | | | | | | | | | | | | | |
QUEENSLAND ART GALLERY | | | | | | | | | | | | | | | | | | |
Property, Plant and Equipment | | | | | | | | | | | | | | | | | | |
Acquisitions for the Queensland Art Gallery’s collection | | 305 | | | | | | | | | | | 2,500 | | | | Ongoing | |
114
Capital Statement 2023-24
| | | | | | | | | | | | | | | | | | | | |
| Treaty, Aboriginal and Torres Strait Islander Partnerships, Communities and the Arts | |
Project | | Statistical
Area | | | Total
Estimated
Cost
$‘000 | | | Expenditure
to
30-06-23
$‘000 | | | Budget
2023-24
$‘000 | | | Post
2023-24
$‘000 | |
Ongoing replacement of plant and equipment | | | 305 | | | | | | | | | | | | 300 | | | | Ongoing | |
| | | | | | | | | | | | | | | | | | | | |
Total Property, Plant and Equipment | | | | | | | | | | | | | | | 2,800 | | | | | |
| | | | | | | | | | | | | | | | | | | | |
QUEENSLAND PERFORMING ARTS TRUST | | | | | | | | | | | | | | | | | | | | |
Property, Plant and Equipment | | | | | | | | | | | | | | | | | | | | |
Property, plant and equipment | | | 305 | | | | | | | | | | | | 1,000 | | | | Ongoing | |
| | | | | | | | | | | | | | | | | | | | |
Total Property, Plant and Equipment | | | | | | | | | | | | | | | 1,000 | | | | | |
| | | | | | | | | | | | | | | | | | | | |
TOTAL TREATY, ABORIGINAL AND TORRES STRAIT ISLANDER PARTNERSHIPS, COMMUNITIES AND THE ARTS (PPE) | | | | | | | | | | | | | | | 111,968 | | | | | |
| | | | | | | | | | | | | | | | | | | | |
TOTAL TREATY, ABORIGINAL AND TORRES STRAIT ISLANDER PARTNERSHIPS, COMMUNITIES AND THE ARTS (CG) | | | | | | | | | | | | | | | 2,214 | | | | | |
| | | | | | | | | | | | | | | | | | | | |
Notes:
| 1. | The Total Estimated Cost of $175 million includes a State contribution of $150 million and a contribution by the Queensland Performing Arts Trust of $25 million |
115
Capital Statement 2023-24
| 3.21 | YOUTH JUSTICE, EMPLOYMENT, SMALL BUSINESS AND TRAINING |
In 2023-24, the Youth Justice, Employment, Small Business and Training portfolio, including TAFE Queensland, has capital purchases of $115.5 million.
Department of Youth Justice, Employment, Small Business and Training
The 2023-24 capital program for the Department of Youth Justice, Employment, Small Business and Training of $99.4 million.
Program Highlights (Property, Plant and Equipment)
| • | | $31.8 million for the continued delivery of Equipping TAFE for Our Future projects including Eagle Farm Robotics and Advanced Manufacturing Centre and Bohle Hydrogen and Renewable Energy Training Facility, (noting that the Annual Training Infrastructure Program funding also contributes to Equipping TAFE for Our Future Projects). |
| • | | $8.0 million for the commencement and delivery of the Great Barrier Reef International Marine College expansion project. |
| • | | $5.8 million for the commencement and delivery of TAFE Technology Fund projects including Loganlea Clinical Skills Laboratory, Pimlico Visual Arts Precinct and Thursday Island Health Hub. |
| • | | $40.5 million for the delivery of the Annual Training Infrastructure Program including building and fire compliance works and asset lifecycle condition upgrades for various TAFE locations across Queensland. The program focuses on improving safety, sustainability and resilience by the renewal and upgrades of roofs, roads, carparks, electrical works, building management and heating, ventilation and air conditioning systems. |
| • | | $13.4 million for ongoing upgrades and minor works to Youth Detention centres and Youth Justice services centres. |
| | | | | | | | | | | | | | | | | | | | |
| Youth Justice, Employment, Small Business and Training | |
Project | | Statistical
Area | | | Total
Estimated
Cost
$‘000 | | | Expenditure
to
30-06-23
$‘000 | | | Budget
2023-24
$‘000 | | | Post
2023-24
$‘000 | |
DEPARTMENT OF YOUTH JUSTICE, EMPLOYMENT, SMALL BUSINESS AND TRAINING | | | | | |
Property, Plant and Equipment | | | | | | | | | | | | | | | | | | | | |
Equipping TAFE for Our Future | | | | | | | | | | | | | | | | | | | | |
Eagle Farm Robotics and Advanced Manufacturing Centre | | | 302 | | | | 28,900 | | | | 2,450 | | | | 26,450 | | | | | |
Bohle Hydrogen and Renewable Energy Training Facility | | | 318 | | | | 10,600 | | | | 5,300 | | | | 5,300 | | | | | |
Great Barrier Reef International Marine College Expansion | | | 306 | | | | 16,000 | | | | | | | | 8,000 | | | | 8,000 | |
TAFE Technology Fund | | | | | | | | | | | | | | | | | | | | |
Pimlico Visual Arts Precinct | | | 318 | | | | 2,500 | | | | | | | | 2,500 | | | | | |
Loganlea Clinical Skills Laboratory | | | 311 | | | | 2,300 | | | | | | | | 2,300 | | | | | |
116
Capital Statement 2023-24
| | | | | | | | | | | | | | | | | | |
| Youth Justice, Employment, Small Business and Training | |
Project | | Statistical
Area | | Total
Estimated
Cost
$‘000 | | | Expenditure
to
30-06-23
$‘000 | | | Budget
2023-24
$‘000 | | | Post
2023-24
$‘000 | |
Thursday Island Health Hub | | 315 | | | 1,000 | | | | | | | | 1,000 | | | | | |
Annual Training Infrastructure Program | | Various | | | | | | | | | | | 40,473 | | | | Ongoing | |
Youth Justice Services | | | | | | | | | | | | | | | | | | |
Youth Justice facilities | | Various | | | | | | | | | | | 13,386 | | | | Ongoing | |
| | | | | | | | | | | | | | | | | | |
Total Property, Plant and Equipment | | | | | | | | | | | | | 99,409 | | | | | |
| | | | | | | | | | | | | | | | | | |
TAFE QUEENSLAND | | | | | | | | | | | | | | | | | | |
Property, Plant and Equipment | | | | | | | | | | | | | | | | | | |
Training and operational equipment acquisition, replacement and modernisation | | | | | | | | | | | | | | | | | | |
Rolling replacement program | | Various | | | | | | | | | | | 1,995 | | | | Ongoing | |
Modernisation and Reinvigoration projects | | Various | | | | | | | | | | | 2,500 | | | | Ongoing | |
ICT program of work | | | | | | | | | | | | | | | | | | |
ICT hardware and equipment | | Various | | | | | | | | | | | 5,061 | | | | Ongoing | |
Product development | | Various | | | | | | | | | | | 5,576 | | | | Ongoing | |
Aviation Australia Capital Program | | Various | | | | | | | | | | | 1,000 | | | | Ongoing | |
| | | | | | | | | | | | | | | | | | |
Total Property, Plant and Equipment | | | | | | | | | | | | | 16,132 | | | | | |
| | | | | | | | | | | | | | | | | | |
TOTAL YOUTH JUSTICE, EMPLOYMENT, SMALL BUSINESS AND TRAINING (PPE) | | | | | | | | | | | | | 115,541 | | | | | |
| | | | | | | | | | | | | | | | | | |
117
Capital Statement 2023-24
| Appendix A: | Entities included in capital outlays 2023–24 |
Agriculture and Fisheries
| | • | | Department of Agriculture and Fisheries |
| | • | | Queensland Racing Integrity Commission |
Child Safety, Seniors and Disability Services
| | • | | Department of Child Safety, Seniors and Disability Services |
Education
| | • | | Department of Education |
Energy and Public Works
| | • | | Department of Energy and Public Works |
| | • | | CleanCo Queensland Limited |
| | • | | Energy Queensland Limited |
| | • | | Queensland Hydro Pty Ltd |
| | • | | Stanwell Corporation Limited |
Environment and Science
| | • | | Department of Environment and Science |
Housing
Justice and Attorney-General
| | • | | Department of Justice and Attorney-General |
| | • | | Crime and Corruption Commission |
| | • | | Electoral Commission of Queensland |
| | • | | Public Trustee of Queensland |
Legislative Assembly of Queensland
| | • | | Legislative Assembly of Queensland |
118
Capital Statement 2023-24
Premier and Cabinet
| | • | | Department of the Premier and Cabinet |
Queensland Corrective Services
| | • | | Queensland Corrective Services |
Queensland Fire and Emergency Services
| | • | | Queensland Fire and Emergency Services |
Queensland Health
| | • | | Queensland Health and Hospital and Health Services |
| | • | | Council of the Queensland Institute of Medical Research |
Queensland Police Service
| | • | | Queensland Police Service |
Queensland Treasury
Regional Development, Manufacturing and Water
| | • | | Department of Regional Development, Manufacturing and Water |
| | • | | Gladstone Area Water Board |
Resources
| | • | | Department of Resources |
State Development, Infrastructure, Local Government and Planning
| | • | | Department of State Development, Infrastructure, Local Government and Planning |
| | • | | Economic Development Queensland |
| | • | | Queensland Reconstruction Authority |
Tourism, Innovation and Sport
| | • | | Department of Tourism, Innovation and Sport |
Transport and Main Roads
| | • | | Department of Transport and Main Roads |
119
Capital Statement 2023-24
| | • | | Queensland Rail Limited |
| | • | | Gold Coast Waterways Authority |
| | • | | Cross River Rail Delivery Authority |
| | • | | Far North Queensland Ports Corporation Limited |
| | • | | Gladstone Ports Corporation Limited |
| | • | | North Queensland Bulk Ports Corporation Limited |
| | • | | Port of Townsville Limited |
Treaty, Aboriginal and Torres Strait Islander Partnerships, Communities and the Arts
| | • | | Department of Treaty, Aboriginal and Torres Strait Islander Partnerships, Communities and the Arts |
| | • | | Library Board of Queensland |
| | • | | Queensland Performing Arts Trust |
Youth Justice, Employment, Small Business and Training
| | • | | Department of Youth Justice, Employment, Small Business and Training |
120
Capital Statement 2023-24
| Appendix B: | Key concepts and coverage |
Coverage of the capital statement
Under accrual output budgeting, capital is the stock of assets including property, plant and equipment and intangible assets that any agency owns and/or controls and uses in the delivery of services, as well as capital grants made to other entities. The following definitions are applicable throughout this document:
| • | | capital purchases – property, plant and equipment outlay as per the financial statements excluding asset sales, depreciation and revaluations |
| • | | capital grants – capital grants to other entities and individuals (excluding grants to other government departments and statutory bodies) |
| • | | right of use assets – property, plant and equipment to which government agencies have a right to use through lease or similar arrangements. |
Capital contingency
Consistent with the approach adopted in previous years, a capital contingency reserve has been included. This reserve recognises that while agencies budget to fully use their capital works allocation, circumstances such as project lead-in times, project management constraints, unexpected weather conditions and capacity constraints such as the supply of labour and materials may prevent full usage. On a whole-of-government basis, there is likely to be underspending, resulting in a carry-over of capital allocations.
Estimated jobs supported by capital works
The $20.321 billion capital works program in 2023–24 is estimated to directly support around 58,000 jobs, equating to around 53,200 full-time equivalent jobs. The estimate of jobs supported by the Government’s capital works program in 2023–24 is based on Queensland Treasury’s Guidelines for estimating the full-time equivalent (FTE) jobs directly supported by the construction component of the capital works program.
The estimate of jobs supported by the capital works program is presented both in terms of FTEs and total jobs. Further, in some cases, jobs estimates quoted for specific projects throughout the Capital Statement and in other budget papers may reflect other approaches, including proponents’ estimates or project specific information, rather than the methodology in the Queensland Treasury Guidelines for estimating jobs supported by capital works.
121
Capital Statement 2023-24
| Appendix C: | Capital purchases by entity by region 2023–241 |
| | | | | | | | | | | | | | | | | | | | | | | | |
| | | Brisbane and Redlands | |
| | | East | | | North | | | South | | | West | | | Inner city | | | Sub total | |
Entity2 | | $‘000 | | | $‘000 | | | $‘000 | | | $‘000 | | | $‘000 | | | $‘000 | |
| | | | | | |
Agriculture and Fisheries | | | 576 | | | | 328 | | | | 1,372 | | | | 277 | | | | 25,628 | | | | 28,181 | |
| | | | | | |
Child Safety, Seniors and Disability Services | | | 1,839 | | | | 1,991 | | | | 2,866 | | | | 1,638 | | | | 2,791 | | | | 11,124 | |
| | | | | | |
Education | | | 88,145 | | | | 65,088 | | | | 126,417 | | | | 54,481 | | | | 67,499 | | | | 401,630 | |
| | | | | | |
Energy and Public Works | | | 45,762 | | | | 40,213 | | | | 59,356 | | | | 26,502 | | | | 507,158 | | | | 678,990 | |
| | | | | | |
Environment and Science | | | 3,964 | | | | 1,929 | | | | 3,245 | | | | 1,628 | | | | 4,601 | | | | 15,366 | |
| | | | | | |
Housing | | | 8,304 | | | | 10,574 | | | | 23,669 | | | | 6,228 | | | | 73,297 | | | | 122,072 | |
| | | | | | |
Justice and Attorney-General | | | 1,821 | | | | 1,688 | | | | 2,839 | | | | 1,424 | | | | 6,553 | | | | 14,326 | |
| | | | | | |
Legislative Assembly of Queensland | | | 96 | | | | 89 | | | | 150 | | | | 75 | | | | 34,890 | | | | 35,301 | |
| | | | | | |
Premier and Cabinet | | | — | | | | — | | | | — | | | | — | | | | 1,337 | | | | 1,337 | |
| | | | | | |
Queensland Corrective Services | | | 2,764 | | | | 2,561 | | | | 5,348 | | | | 2,161 | | | | 3,443 | | | | 16,276 | |
| | | | | | |
Queensland Fire and Emergency Services | | | 2,997 | | | | 2,777 | | | | 4,671 | | | | 2,343 | | | | 5,734 | | | | 18,521 | |
| | | | | | |
Queensland Health | | | 66,455 | | | | 67,341 | | | | 52,886 | | | | 12,371 | | | | 301,034 | | | | 500,087 | |
| | | | | | |
Queensland Police Service | | | 12,234 | | | | 11,336 | | | | 19,066 | | | | 9,565 | | | | 15,243 | | | | 67,444 | |
| | | | | | |
Queensland Treasury | | | — | | | | — | | | | — | | | | — | | | | — | | | | — | |
| | | | | | |
Regional Development, Manufacturing and Water | | | 1,617 | | | | 1,499 | | | | 15,395 | | | | 1,264 | | | | 6,577 | | | | 26,353 | |
| | | | | | |
Resources | | | 478 | | | | 443 | | | | 745 | | | | 374 | | | | 596 | | | | 2,637 | |
| | | | | | |
State Development, Infrastructure, Local Government and Planning | | | — | | | | 20,012 | | | | 13,014 | | | | — | | | | 19,022 | | | | 52,048 | |
| | | | | | |
Tourism, Innovation and Sport | | | 2,715 | | | | 2,515 | | | | 4,306 | | | | 2,122 | | | | 3,382 | | | | 15,040 | |
| | | | | | |
Transport and Main Roads | | | 131,908 | | | | 190,940 | | | | 272,859 | | | | 112,433 | | | | 1,050,993 | | | | 1,759,132 | |
| | | | | | |
Treaty, Aboriginal and Torres Strait Islander Partnerships, Communities and the Arts | | | 596 | | | | 552 | | | | 2,517 | | | | 466 | | | | 90,719 | | | | 94,850 | |
| | | | | | |
Youth Justice, Employment, Small Business and Training | | | 2,585 | | | | 28,982 | | | | 4,028 | | | | 2,021 | | | | 3,220 | | | | 40,836 | |
| | | | | | |
Other Agencies3 | | | 256 | | | | 240 | | | | 399 | | | | 201 | | | | 318 | | | | 1,415 | |
| | | | | | |
Anticipated capital contingency reserve and other adjustments4 | | | | | | | | | | | | | | | | | | | | | | | | |
| | | | | | |
Funds allocated | | | 337,151 | | | | 405,450 | | | | 552,897 | | | | 213,533 | | | | 1,998,972 | | | | 3,508,002 | |
Notes
| 1. | Numbers may not add due to rounding and allocations of adjustments. |
| 2. | Includes all associated statutory bodies. |
| 3. | Includes other government entities with non-material capital programs. |
| 4. | The anticipated contingency reserve and other adjustments have been spread across statistical areas proportionate to capital spends. |
122
Capital Statement 2023-24
| | | | | | | | | | | | | | | | | | | | | | | | |
| | | Darling Downs | |
| | | Ipswich | | | Wide Bay | | | DD
Maranoa | | | Toowoomba | | | Sub total | | | Gold Coast | |
Entity2 | | $‘000 | | | $‘000 | | | $‘000 | | | $‘000 | | | $‘000 | | | $‘000 | |
| | | | | | |
Agriculture and Fisheries | | | 608 | | | | 828 | | | | 1,904 | | | | 2,258 | | | | 4,162 | | | | 1,084 | |
| | | | | | |
Child Safety, Seniors and Disability Services | | | 6,527 | | | | 2,303 | | | | 1,088 | | | | 1,210 | | | | 2,298 | | | | 5,363 | |
| | | | | | |
Education | | | 226,441 | | | | 67,491 | | | | 41,545 | | | | 31,148 | | | | 72,693 | | | | 143,103 | |
| | | | | | |
Energy and Public Works | | | 185,275 | | | | 883,056 | | | | 415,795 | | | | 137,527 | | | | 553,322 | | | | 174,149 | |
| | | | | | |
Environment and Science | | | 3,577 | | | | 7,658 | | | | 2,696 | | | | 1,370 | | | | 4,066 | | | | 7,854 | |
| | | | | | |
Housing | | | 31,632 | | | | 39,081 | | | | 5,424 | | | | 11,677 | | | | 17,100 | | | | 32,474 | |
| | | | | | |
Justice and Attorney-General | | | 3,129 | | | | 2,282 | | | | 959 | | | | 1,199 | | | | 2,157 | | | | 5,095 | |
| | | | | | |
Legislative Assembly of Queensland | | | 166 | | | | 121 | | | | 51 | | | | 63 | | | | 114 | | | | 269 | |
| | | | | | |
Premier and Cabinet | | | — | | | | — | | | | — | | | | — | | | | — | | | | — | |
| | | | | | |
Queensland Corrective Services | | | 358,693 | | | | 3,462 | | | | 1,454 | | | | 1,819 | | | | 3,273 | | | | 7,730 | |
| | | | | | |
Queensland Fire and Emergency Services | | | 8,648 | | | | 15,254 | | | | 5,197 | | | | 6,372 | | | | 11,569 | | | | 8,383 | |
| | | | | | |
Queensland Health | | | 83,911 | | | | 94,645 | | | | 19,236 | | | | 71,945 | | | | 91,180 | | | | 189,374 | |
| | | | | | |
Queensland Police Service | | | 28,208 | | | | 20,137 | | | | 24,446 | | | | 8,051 | | | | 32,498 | | | | 34,220 | |
| | | | | | |
Queensland Treasury | | | — | | | | — | | | | — | | | | — | | | | — | | | | — | |
| | | | | | |
Regional Development, Manufacturing and Water | | | 132,362 | | | | 118,426 | | | | 2,898 | | | | 14,476 | | | | 17,375 | | | | 4,524 | |
| | | | | | |
Resources | | | 822 | | | | 599 | | | | 252 | | | | 315 | | | | 567 | | | | 1,338 | |
| | | | | | |
State Development, Infrastructure, Local Government and Planning | | | 8,305 | | | | — | | | | — | | | | — | | | | — | | | | 27,539 | |
| | | | | | |
Tourism, Innovation and Sport | | | 4,663 | | | | 3,401 | | | | 1,429 | | | | 1,787 | | | | 3,215 | | | | 7,593 | |
| | | | | | |
Transport and Main Roads | | | 146,657 | | | | 547,812 | | | | 157,392 | | | | 36,032 | | | | 193,424 | | | | 1,411,892 | |
| | | | | | |
Treaty, Aboriginal and Torres Strait Islander Partnerships, Communities and the Arts | | | 1,024 | | | | 747 | | | | 314 | | | | 392 | | | | 706 | | | | 1,667 | |
| | | | | | |
Youth Justice, Employment, Small Business and Training | | | 7,998 | | | | 3,943 | | | | 1,431 | | | | 1,701 | | | | 3,132 | | | | 7,300 | |
| | | | | | |
Other Agencies3 | | | 401 | | | | 330 | | | | 136 | | | | 174 | | | | 310 | | | | 690 | |
| | | | | | |
Anticipated capital contingency reserve and other adjustments4 | | | | | | | | | | | | | | | | | | | | | | | | |
| | | | | | |
Funds allocated | | | 1,113,659 | | | | 1,628,252 | | | | 614,464 | | | | 296,170 | | | | 910,634 | | | | 1,862,000 | |
Notes
| 1. | Numbers may not add due to rounding and allocations of adjustments. |
| 2. | Includes all associated statutory bodies. |
| 3. | Includes other government entities with non-material capital programs. |
| 4. | The anticipated contingency reserve and other adjustments have been spread across statistical areas proportionate to capital spends. |
123
Capital Statement 2023-24
| | | | | | | | | | | | | | | | | | | | | | | | |
| | | Logan - | | | Mackay - | | | Outback and Far North Queensland | | | Central | |
| | | Beaudesert | | | Whitsunday | | | Outback | | | Cairns | | | Sub total | | | Queensland | |
Entity2 | | $‘000 | | | $‘000 | | | $‘000 | | | $‘000 | | | $‘000 | | | $‘000 | |
| | | | | | |
Agriculture and Fisheries | | | 583 | | | | 1,277 | | | | 992 | | | | 668 | | | | 1,660 | | | | 2,732 | |
| | | | | | |
Child Safety, Seniors and Disability Services | | | 5,953 | | | | 1,360 | | | | 593 | | | | 2,587 | | | | 3,180 | | | | 1,920 | |
| | | | | | |
Education | | | 92,558 | | | | 38,005 | | | | 24,075 | | | | 66,948 | | | | 91,024 | | | | 77,462 | |
| | | | | | |
Energy and Public Works | | | 148,127 | | | | 212,962 | | | | 468,824 | | | | 638,120 | | | | 1,106,944 | | | | 852,177 | |
| | | | | | |
Environment and Science | | | 3,230 | | | | 5,875 | | | | 671 | | | | 6,532 | | | | 7,203 | | | | 1,962 | |
| | | | | | |
Housing | | | 33,180 | | | | 16,246 | | | | 21,156 | | | | 84,419 | | | | 105,576 | | | | 20,875 | |
| | | | | | |
Justice and Attorney-General | | | 7,508 | | | | 1,347 | | | | 587 | | | | 1,981 | | | | 2,568 | | | | 1,717 | |
| | | | | | |
Legislative Assembly of Queensland | | | 149 | | | | 71 | | | | 31 | | | | 105 | | | | 136 | | | | 91 | |
| | | | | | |
Premier and Cabinet | | | — | | | | — | | | | — | | | | — | | | | — | | | | — | |
| | | | | | |
Queensland Corrective Services | | | 4,288 | | | | 2,044 | | | | 891 | | | | 3,005 | | | | 3,896 | | | | 2,604 | |
| | | | | | |
Queensland Fire and Emergency Services | | | 12,880 | | | | 4,466 | | | | 1,266 | | | | 6,259 | | | | 7,525 | | | | 3,224 | |
| | | | | | |
Queensland Health | | | 169,201 | | | | 46,446 | | | | 50,506 | | | | 63,361 | | | | 113,867 | | | | 54,658 | |
| | | | | | |
Queensland Police Service | | | 18,980 | | | | 15,398 | | | | 7,405 | | | | 14,703 | | | | 22,108 | | | | 11,529 | |
| | | | | | |
Queensland Treasury | | | — | | | | — | | | | — | | | | — | | | | — | | | | — | |
| | | | | | |
Regional Development, Manufacturing and Water | | | 26,909 | | | | 24,436 | | | | 10,445 | | | | 1,759 | | | | 12,204 | | | | 586,566 | |
| | | | | | |
Resources | | | 742 | | | | 354 | | | | 154 | | | | 520 | | | | 674 | | | | 451 | |
| | | | | | |
State Development, Infrastructure, Local Government and Planning | | | — | | | | 250 | | | | — | | | | 5,534 | | | | 5,534 | | | | 18,750 | |
| | | | | | |
Tourism, Innovation and Sport | | | 4,212 | | | | 2,008 | | | | 875 | | | | 12,952 | | | | 13,827 | | | | 2,558 | |
| | | | | | |
Transport and Main Roads | | | 534,330 | | | | 209,373 | | | | 155,877 | | | | 148,068 | | | | 303,944 | | | | 374,877 | |
| | | | | | |
Treaty, Aboriginal and Torres Strait Islander Partnerships, Communities and the Arts | | | 925 | | | | 441 | | | | 1,192 | | | | 648 | | | | 1,840 | | | | 4,011 | |
| | | | | | |
Youth Justice, Employment, Small Business and Training | | | 6,780 | | | | 1,912 | | | | 2,656 | | | | 11,888 | | | | 14,544 | | | | 2,573 | |
| | | | | | |
Other agencies3 | | | 394 | | | | 194 | | | | 85 | | | | 271 | | | | 357 | | | | 244 | |
| | | | | | |
Anticipated capital contingency reserve and other adjustments4 | | | | | | | | | | | | | | | | | | | | | | | | |
| | | | | | |
Funds allocated | | | 962,555 | | | | 525,319 | | | | 672,560 | | | | 962,014 | | | | 1,634,574 | | | | 1,816,465 | |
Notes
| 1. | Numbers may not add due to rounding and allocations of adjustments. |
| 2. | Includes all associated statutory bodies. |
| 3. | Includes other government entities with non-material capital programs. |
| 4. | The anticipated contingency reserve and other adjustments have been spread across statistical areas proportionate to capital spends. |
124
Capital Statement 2023-24
| | | | | | | | | | | | | | | | | | | | | | | | |
| | | Sunshine
Coast | | | Moreton
Bay South | | | Moreton Bay
Moreton
Bay North | | | Sub total | | | Townsville | | | Totals1 | |
Entity2 | | $‘000 | | | $‘000 | | | $‘000 | | | $‘000 | | | $‘000 | | | $‘000 | |
| | | | | | |
Agriculture and Fisheries | | | 1,361 | | | | 1,362 | | | | 489 | | | | 1,850 | | | | 958 | | | | 45,284 | |
| | | | | | |
Child Safety, Seniors and Disability Services | | | 3,280 | | | | 2,381 | | | | 1,832 | | | | 4,212 | | | | 2,067 | | | | 49,587 | |
| | | | | | |
Education | | | 128,051 | | | | 71,939 | | | | 57,461 | | | | 129,399 | | | | 66,499 | | | | 1,534,355 | |
| | | | | | |
Energy and Public Works | | | 184,346 | | | | 44,459 | | | | 29,751 | | | | 74,210 | | | | 566,693 | | | | 5,620,251 | |
| | | | | | |
Environment and Science | | | 4,578 | | | | 2,333 | | | | 2,063 | | | | 4,397 | | | | 3,852 | | | | 69,618 | |
| | | | | | |
Housing | | | 14,990 | | | | 28,169 | | | | 7,524 | | | | 35,692 | | | | 42,229 | | | | 511,148 | |
| | | | | | |
Justice and Attorney-General | | | 3,130 | | | | 2,041 | | | | 1,696 | | | | 3,737 | | | | 1,862 | | | | 48,858 | |
| | | | | | |
Legislative Assembly of Queensland | | | 166 | | | | 108 | | | | 90 | | | | 198 | | | | 98 | | | | 36,880 | |
| | | | | | |
Premier and Cabinet | | | — | | | | — | | | | — | | | | — | | | | — | | | | 1,337 | |
| | | | | | |
Queensland Corrective Services | | | 4,749 | | | | 7,185 | | | | 2,573 | | | | 9,758 | | | | 22,825 | | | | 439,599 | |
| | | | | | |
Queensland Fire and Emergency Services | | | 15,920 | | | | 7,058 | | | | 2,790 | | | | 9,849 | | | | 8,764 | | | | 125,004 | |
| | | | | | |
Queensland Health | | | 62,046 | | | | 65,574 | | | | 70,111 | | | | 135,686 | | | | 97,331 | | | | 1,638,431 | |
| | | | | | |
Queensland Police Service | | | 29,959 | | | | 13,710 | | | | 15,830 | | | | 29,540 | | | | 27,557 | | | | 337,577 | |
| | | | | | |
Queensland Treasury | | | — | | | | — | | | | — | | | | — | | | | 43,950 | | | | 43,950 | |
| | | | | | |
Regional Development, Manufacturing and Water | | | 3,768 | | | | 1,812 | | | | 7,016 | | | | 8,828 | | | | 23,183 | | | | 984,935 | |
| | | | | | |
Resources | | | 822 | | | | 536 | | | | 445 | | | | 981 | | | | 989 | | | | 10,976 | |
| | | | | | |
State Development, Infrastructure, Local Government and Planning | | | 13,115 | | | | — | | | | — | | | | — | | | | 200 | | | | 125,741 | |
| | | | | | |
Tourism, Innovation and Sport | | | 4,665 | | | | 3,042 | | | | 2,527 | | | | 5,569 | | | | 2,775 | | | | 69,526 | |
| | | | | | |
Transport and Main Roads | | | 328,618 | | | | 162,321 | | | | 142,457 | | | | 304,778 | | | | 211,466 | | | | 6,326,303 | |
| | | | | | |
Treaty, Aboriginal and Torres Strait Islander Partnerships, Communities and the Arts | | | 1,024 | | | | 3,568 | | | | 555 | | | | 4,123 | | | | 609 | | | | 111,968 | |
| | | | | | |
Youth Justice, Employment, Small Business and Training | | | 4,865 | | | | 3,849 | | | | 2,477 | | | | 6,326 | | | | 15,333 | | | | 115,541 | |
| | | | | | |
Other agencies3 | | | 430 | | | | 236 | | | | 288 | | | | 523 | | | | 250 | | | | 5,538 | |
| | | | | | |
Anticipated capital contingency reserve and other adjustments4 | | | | | | | | | | | | | | | | | | | | | | | (1,847,068 | ) |
| | | | | | |
Funds allocated | | | 727,927 | | | | 379,010 | | | | 312,761 | | | | 691,771 | | | | 1,024,180 | | | | 16,405,339 | |
Notes
| 1. | Numbers may not add due to rounding and allocations of adjustments. |
| 2. | Includes all associated statutory bodies. |
| 3. | Includes other government entities with non-material capital programs. |
| 4. | The anticipated contingency reserve and other adjustments have been spread across statistical areas proportionate to capital spends. |
125
Queensland Budget 2023–24 Capital Statement Budget Paper No.3
Queensland Budget 2023–24
Capital Statement Budget Paper No.3
| | |
QUEENSLAND BUDGET 2023-24 | | |
BUDGET MEASURES
BUDGET PAPER NO. 4

2023–24 Queensland Budget Papers
1. Budget Speech
2. Budget Strategy and Outlook
3. Capital Statement
4. Budget Measures
Service Delivery Statements
Appropriation Bills
Budget Overview
Regional Action Plans
© The State of Queensland (Queensland Treasury) 2023
Copyright
This publication is protected by the Copyright Act 1968
Licence
This document is licensed by the State of Queensland (Queensland Treasury) under a Creative Commons Attribution (CC BY 4.0) International licence.

In essence, you are free to copy, communicate and adapt this publication, as long as you attribute the work to the State of Queensland (Queensland Treasury).
Attribution
Content from this publication should be attributed to:
© The State of Queensland (Queensland Treasury) - 2023–24 Queensland Budget

Translating and interpreting assistance
The Queensland Government is committed to providing accessible services to Queenslanders from all cultural and linguistic backgrounds. If you have difficulty in understanding this publication, you can contact us on telephone (07) 3035 3503 and we will arrange an interpreter to effectively communicate the report to you.
Budget Measures
Budget Paper No. 4
ISSN 1445-4890 (Print)
ISSN 1445-4904 (Online)
Budget Measures 2023-24

State Budget
2023–24
Budget Measures
Budget Paper No. 4
Budget Measures 2023-24
Contents
| | | | | | |
| |
Key Features | | | 1 | |
| | |
1 | | Introduction | | | 2 | |
| |
Explanation of scope and terms | | | 2 | |
Overview | | | 3 | |
Whole-of-Government Measures | | | 6 | |
Government Indexation Policy | | | 12 | |
| | |
2 | | Expense Measures | | | 33 | |
| |
Introduction | | | 33 | |
Department of Agriculture and Fisheries | | | 34 | |
Department of Child Safety, Seniors and Disability Services | | | 37 | |
Department of Education | | | 42 | |
Department of Energy and Public Works | | | 46 | |
Department of Environment and Science | | | 50 | |
Department of Housing | | | 54 | |
Department of Justice and Attorney-General | | | 59 | |
Department of Regional Development, Manufacturing and Water | | | 75 | |
Department of Resources | | | 79 | |
Department of State Development, Infrastructure, Local Government and Planning | | | 80 | |
Department of the Premier and Cabinet | | | 87 | |
Department of Tourism, Innovation and Sport | | | 93 | |
Department of Transport and Main Roads | | | 96 | |
Department of Treaty, Aboriginal and Torres Strait Islander Partnerships, Communities and the Arts | | | 103 | |
Department of Youth Justice, Employment, Small Business and Training | | | 109 | |
Legislative Assembly of Queensland | | | 125 | |
Office of the Queensland Ombudsman | | | 126 | |
Budget Measures 2023-24
| | | | |
Public Sector Commission | | | 127 | |
Queensland Corrective Services | | | 128 | |
Queensland Fire and Emergency Services | | | 134 | |
Queensland Health | | | 137 | |
Queensland Police Service | | | 145 | |
Queensland Treasury | | | 160 | |
| |
3 Capital measures | | | 164 | |
| |
Introduction | | | 164 | |
Department of Agriculture and Fisheries | | | 165 | |
Department of Education | | | 166 | |
Department of Energy and Public Works | | | 168 | |
Department of Environment and Science | | | 169 | |
Department of Housing | | | 170 | |
Department of Justice and Attorney-General | | | 172 | |
Department of Resources | | | 173 | |
Department of State Development, Infrastructure, Local Government and Planning | | | 174 | |
Department of Tourism, Innovation and Sport | | | 176 | |
Department of Transport and Main Roads | | | 177 | |
| Department of Treaty, Aboriginal and Torres Strait Islander Partnerships, Communities and the Arts | | 179 | |
Department of Youth Justice, Employment, Small Business and Training | | | 181 | |
Legislative Assembly of Queensland | | | 182 | |
Queensland Corrective Services | | | 183 | |
Queensland Fire and Emergency Services | | | 185 | |
Queensland Health | | | 187 | |
Queensland Police Service | | | 189 | |
Queensland Treasury | | | 194 | |
Budget Measures 2023-24
| | | | |
4 Revenue measures | | | 195 | |
| |
Introduction | | | 195 | |
Department of Agriculture and Fisheries | | | 196 | |
Department of Education | | | 197 | |
Department of Justice and Attorney-General | | | 198 | |
Department of Regional Development, Manufacturing and Water | | | 199 | |
Department of Resources | | | 200 | |
Department of Transport and Main Roads | | | 201 | |
Queensland Fire and Emergency Services | | | 202 | |
Queensland Treasury | | | 203 | |
Budget Measures 2023-24
Key Features
| • | | The 2023–24 Budget measures will support more jobs in more industries, deliver even better services and enhance the great Queensland lifestyle. |
| • | | To support Queenslanders across the state, the government has committed $8.224 billion in total concessions funding in 2023–24, an increase of 21 per cent from 2022–23. This includes $1.617 billion in new and expanded cost of living relief measures in 2023–24. |
| • | | This includes $1.483 billion of additional electricity bill support to households and small businesses facing cost-of-living pressures. As part of this package, all Queensland households will automatically receive a $550 Cost of Living Rebate on their electricity bill in 2023–24, while around 600,000 vulnerable households will benefit from a higher $700 Cost of Living Rebate. |
| • | | This budget provides $645 million over 4 years from 2023–24 to provide 15 hours per week of free kindergarten from January 2024 for all 4-year-old Queensland children. This will not only reduce cost of living pressures for families, but will also support labour market participation and improve educational outcomes. |
| • | | The government is providing an uplift to Queensland Health’s operating funding envelope of $2.888 billion to address demand and cost pressures, and support a suite of programs and initiatives targeting improving ambulance responsiveness and reducing ramping, addressing pressures on emergency departments, reducing wait times for surgery and specialist clinics, as well as boosting women’s health care and mental health care. |
| • | | This uplift means that the 2023–24 Budget delivers a 9.6 per cent boost to the health system, with record operating funding of $24.153 billion. |
| • | | The 2023–24 Budget provides an additional $1.25 billion over 5 years for housing and homelessness across Queensland, including $1.1 billion for social housing infrastructure and $150 million for housing and homelessness supports. |
| • | | The Big Build outlined in this Budget delivers above and beyond the government’s $50 billion Infrastructure Guarantee, with total commitments of $88.729 billion over 4 years. |
| • | | The government is committed to environmentally sustainable growth through renewable energy targets outlined in the Queensland Energy and Jobs Plan, including 70 per cent renewable energy by 2032 and 80 per cent by 2035. |
| • | | The 2023–24 Budget delivers on energy projects such as the equity investment of up to $6 billion for the Borumba Pumped Hydro Energy Storage project over the construction period. This project is critical as it is close to the load centres of the South East and Central Queensland. |
1
Budget Measures 2023-24
The document provides a consolidated view of policy decisions with budgetary impacts made by the government since the 2022–23 Budget.
This document complements other budget papers, in particular Budget Paper No. 2 Budget Strategy and Outlook, Budget Paper No. 3 Capital Statement and the Service Delivery Statements.
This paper includes only new policy decisions and does not detail the full amount of additional funding being provided to agencies to deliver services and infrastructure. Other adjustments, including those that are parameter based and where the funding formula remains unchanged, are similarly excluded.
The total funding impact of new measures is summarised in Tables 1.3 to 1.5 at the conclusion of this chapter.
For details on the total funding available to agencies, refer to agencies’ Service Delivery Statements.
| 1.1 | Explanation of scope and terms |
Scope
This document includes measures with the following features:
| • | | Sector. Only Queensland General Government sector agencies are included. Measures involving government-owned corporations or other Public Non-Financial Corporations sector agencies are within scope only if the measures are being funded directly by the General Government sector or if there is a flow through effect (for example, community service obligations). |
| • | | Timeframe. Measures based on decisions made by the government since the 2022–23 Budget. |
| • | | Type. Measures with budgetary impacts, in particular: |
| | (i) | expense and capital measures with service delivery, capital enhancement, grant or subsidy impacts on the community and |
| | (ii) | revenue measures involving a significant change in revenue policy, including changes in the tax rate. |
| • | | Materiality. Minor measures or measures with non-significant community impact are not included in this document. |
| • | | Technical initiatives or non-policy-based adjustments, such as parameter-based funding adjustments, are not included if the formula to calculate these adjustments has not changed, as they do not reflect changes in government policy. The main focus is on measures reflecting policy decisions that impact directly on the community through service delivery or other means. |
2
Budget Measures 2023-24
Funding basis
Tables in this document are presented on a net funding basis.
| • | | Net funding refers to the impact that the funding of the measure has on appropriations from the Consolidated Fund or centrally held funds to the relevant General Government agency. The tables do not include funding directed to the measure from existing agency resources or other sources. |
| • | | Amounts refer to additional funding being provided to agencies for a particular program or project, as a result of decisions by government since the 2022–23 Budget. The amount provided for a measure may differ from other budget papers, such as Budget Paper No. 3 Capital Statement, that may refer to total funding. |
| • | | Where a measure involves material expenditure or revenue collections by more than one department, the measure is reported under each department involved. The addition of each individual department’s portion of a particular measure may not equate to the reported total whole-of-government figure due to the omission of some departments’ portions that did not meet Budget Paper 4’s materiality threshold (i.e. $250,000 over 5 years). |
| • | | Amounts included in the tables relating to revenue measures represent the impact of the measure on government revenue (with a positive amount representing additional revenue). |
| • | | Tables 1.3 to 1.5 identify expense, capital and revenue measures separately, categorised as: up to and including 2022–23 Budget Update, and since the 2022–23 Budget Update. |
The following section presents selected measures relating to decisions taken since the 2022–23 Budget.
| 1.2.1 | Cost of living measures |
Queensland households and businesses are facing increased financial pressure due to a range of economic factors including ongoing global inflation and raising interest rates. The government is providing a range of measures to help Queenslanders with some of these pressures, including:
| • | | $8.224 billion in total concessions funding in 2023–24. This represents an increase of 21.2 per cent compared with estimated actual concessions of $6.788 billion in 2022–23. |
| • | | $1.617 billion in new and expanded cost of living relief measures in 2023-24. This includes $1.483 billion for additional electricity bill support to households and small businesses facing cost of living pressures. As part of this package, all Queensland households will automatically receive a $550 Cost of Living Rebate on their electricity bill in 2023–24, while around 600,000 vulnerable households will benefit from a total $700 Cost of Living Rebate. |
| • | | $645 million over 4 years from 2023–24 making 15 hours of kindergarten free from 1 January 2024 for all 4-year-old children across sessional kindergartens and long day care services. |
This will not only reduce cost-of-living pressures for families, but will also support labour market participation and improve educational outcomes.
3
Budget Measures 2023-24
The government continues to deliver a world class health system for our community, ensuring patients get treated at the right place, at the right time. The 2023–24 Budget delivers:
| • | | $2.888 billion uplift to the Queensland Health operating funding envelope to address demand and cost pressures and support a suite of programs and initiatives targeting improving ambulance responsiveness and reducing ramping, addressing pressures on emergency departments, reducing wait times for surgery and specialist clinics, as well as boosting women’s health care and mental health care. This includes measures such as: Domestic and Family Violence services system reform, Making Tracks Towards Achieving Health Equity with First Nations People 2021–2025, and Rural and Regional Birthing Services. |
| • | | $586.1 million over 10 years for a new commercial agreement between Queensland Health and LifeFlight Australia Limited, for on-going emergency medical helicopter services to those in rural, regional and remote Queensland. |
| • | | $150 million for a new mental health facility at the Redland Hospital, which will more than double mental health capacity and free up critical land on the hospital site for potential future expansion. |
| • | | $70.3 million over 4 years and $21 million ongoing to increase the Patient Travel Subsidy Scheme, supporting financially vulnerable Queenslanders to access the clinical care they need. |
The government has committed to protect and enhance the Queensland lifestyle as we grow, with continued investment in housing across the state working towards the vision of every Queenslander having access to safe, affordable housing.
| • | | $1.1 billion for the delivery and supply of social housing across Queensland through the Housing and Homelessness Action Plan (2021–2025) including to meet higher construction costs and to boost the QuickStarts Queensland program target by 500 homes, bringing it to 3,265 social housing commencements by 30 June 2025. |
| • | | Over $150 million additional funding for housing and homelessness support, including $51.3 million for the second Queensland Aboriginal and Torres Strait Islander Housing Action Plan, $61.9 million for emergency supported accommodation, and $32 million for enhanced operational services of three accommodation sites and to support enhanced and expanded youth services. |
4
Budget Measures 2023-24
As part of its commitment to gender responsive budgeting, the 2023–24 Budget bids were assessed to determine alignment with the impact areas identified in the Queensland Women’s Strategy 2022–27. The aim of this work was to focus funding on initiatives that were supportive of the impact areas of economic security, safety, health and wellbeing, elevating First Nations women, women with diverse backgrounds and experiences, and empowerment and recognition.
It led to $16.3 million additional funding for a package of measures focussed on enhancing the economic opportunities and economic security of women. The package includes grants, training and increased investment for women in male dominated industries, women in business and innovation and disadvantaged and vulnerable women.
5
Budget Measures 2023-24
| 1.3 | Whole-of-Government Measures |
Good People. Good Jobs: Queensland Workforce Strategy 2022–2032
The government is delivering the Good people. Good jobs: Queensland Workforce Strategy 2022–2032 to guide the development and growth of Queensland’s workforce across industry sectors and regions. The strategy is supporting employers to effectively respond to workforce change and helping to ensure every Queenslander has the opportunity to participate in work.
The strategy includes 33 actions that the government is delivering in partnership with industries, regions and communities, including:
| • | | Workforce Connect Fund: a $20 million fund to increase investment in industry and community-led projects addressing workforce issues. To date, 16 projects have been funded, creating 6,300 new jobs and upskilling almost 14,000 existing workers. |
| • | | Industry Workforce Advisors: $6.5 million to provide workforce planning support for up to 1,800 small and medium sized enterprises through a network of advisors across 11 industries. |
| • | | Rural and Remote Capacity Building Project: $3 million working in partnership with Local Government Association of Queensland to support 24 councils in rural and remote areas to deliver local skills and job creation initiatives to increase workforce capacity. |
| • | | Diverse Queensland Workforce: $8.5 million to assist up to 2,500 migrants, refugees and international students into employment across 9 delivery locations in the state. To date more than 1,000 people have been assisted, with 85 per cent of participants exiting the program gaining employment. |
| • | | Paving the Way – First Nations Training Strategy: $8.3 million to support Aboriginal and Torres Strait Islander peoples’ skills development and respond to local and community employment needs. |
| • | | Hydrogen Gateway to Industry Schools project: to deliver a new hydrogen stream in the Gateway to Industry Schools Program, supporting career pathways into this emerging industry for up to 2,000 students across more than 30 schools. |
| • | | Train and Retain activities: supporting apprenticeship and traineeship retention and completions. The activities are underpinned by the Let’s Protect Respect campaign, supporting positive action to embrace gender equality and ensure sexism and unfair treatment has no place in the workplace. |
Youth Justice
The 2023–24 Budget includes investment of $446.4 million ($441.9 million new funding and $4.5 million internally funded) over 5 years and $33.7 million per annum ongoing to help boost police resources and tackle the complex causes of youth crime and support community safety.
This includes:
| • | | $96.2 million over 4 years and $17.9 million ongoing for youth co-responder teams who engage with young people to break the cycle of youth crime |
| • | | $64.0 million over 3 years for policing responses including high visibility patrols and specialist youth crime rapid response squads |
6
Budget Measures 2023-24
| • | | $50.0 million for infrastructure development at priority Queensland Police-Citizens Youth Club (PCYC) sites to improve frontline social program delivery and intervention initiatives for vulnerable youths and $6.0 million to enable PCYC police officers to increase their focus on social programs aimed at the prevention of youth crime |
| • | | $37.0 million over 4 years to support amendments to the Strengthening Community Safety Act 2023 and to ensure repeat offenders spend less time on remand and more time serving their sentences |
| • | | up to $30.0 million over 2 years to help seniors secure their homes |
| • | | $15.0 million over 2 years to empower communities to develop local solutions to youth crime issues |
| • | | $10.0 million over 3 years for a trial to help subsidise the cost for Queenslanders to install vehicle immobilisers in Cairns, Townsville and Mount Isa |
| • | | $9.0 million over 4 years to respond better to victims of property crime where violence or a threat of violence has occurred. |
Response to Hear her voice – Report Two
The Queensland Government has committed $225 million over 5 years ($32.7 million per annum ongoing) for a package of reforms in response to the Queensland Women’s Safety and Justice Taskforce, Hear her voice – Report Two – Women and girls’ experiences across the criminal justice system. The reform package focuses on the systemic change required to improve the experiences of women and girls in the criminal justice system as victim-survivors of sexual violence, or as accused persons and offenders. Particular focus will be on:
| • | | educating the community about the fundamental importance of respectful relationships |
| • | | increasing specialist support and systemic advocacy for victim-survivors of sexual violence |
| • | | improving the responses of police, health workers, prosecutors and courts to victim-survivors of sexual violence |
| • | | extensive law reform relating to sexual offences, including changes to the laws of evidence, consent laws and court procedures to minimise trauma for victim-survivors of sexual violence |
| • | | addressing the underlying drivers of women and girls’ contact with the criminal justice system |
| • | | supporting the diversion of women and girls away from the criminal justice system |
| • | | ensuring the human rights of women and girls are adequately protected when they are detained in watchhouses and prisons |
| • | | rehabilitation to address women’s needs and reduce reoffending and the number of women in prison and girls in detention. |
7
Budget Measures 2023-24
| Table 1.1 | Hear her voice – Report 2 response package |
| | | | | | | | | | | | | | | | | | | | | | | | |
| | | 2022-23 | | | 2023-24 | | | 2024-25 | | | 2025-26 | | | 2026-27 | | | Total | |
| | | $million | | | $million | | | $million | | | $million | | | $million | | | $million | |
Expense Measures | | | | | | | | | | | | | | | | | | | | | | | | |
| | | | | | |
Community attitudes to sexual violence and consent | | | 0.3 | | | | 1.3 | | | | 0.5 | | | | 0.5 | | | | — | | | | 2.5 | |
Barriers to reporting sexual violence | | | 0.1 | | | | 0.8 | | | | 0.5 | | | | 0.5 | | | | — | | | | 1.9 | |
Support for victim-survivors through their criminal justice journey | | | 0.5 | | | | 3.1 | | | | 3.3 | | | | 3.0 | | | | 2.8 | | | | 12.6 | |
Prosecution response to victim-survivors of sexual violence | | | — | | | | 2.0 | | | | 2.0 | | | | 2.0 | | | | 2.1 | | | | 8.1 | |
Treatment of victim-survivors in trials for sexual offences | | | 0.6 | | | | 2.4 | | | | 1.8 | | | | 1.3 | | | | 1.3 | | | | 7.4 | |
Improving court management of sexual offence cases | | | — | | | | 1.0 | | | | 2.0 | | | | 1.8 | | | | 1.7 | | | | 6.5 | |
Jury directions and the use of expert evidence in trials for sexual offences | | | — | | | | 1.8 | | | | 2.6 | | | | 2.5 | | | | — | | | | 7.0 | |
Limitations on publishing the identity of victims and accused people | | | — | | | | — | | | | 0.3 | | | | — | | | | — | | | | 0.3 | |
Restorative justice for victims of sexual violence | | | — | | | | 0.5 | | | | — | | | | 0.2 | | | | 0.7 | | | | 1.4 | |
Women and girls’ experiences in watchhouses, on remand, and when applying for bail | | | — | | | | 0.6 | | | | 1.7 | | | | 1.7 | | | | 1.7 | | | | 5.7 | |
Women and girls’ experiences of the legal and court system | | | — | | | | 0.4 | | | | 0.5 | | | | 2.4 | | | | 2.5 | | | | 5.8 | |
Sentencing women and girls | | | — | | | | 0.3 | | | | 3.7 | | | | 3.7 | | | | — | | | | 7.7 | |
Health, wellbeing, prenatal and postnatal care and birth experiences in prison and detention | | | 0.1 | | | | 1.0 | | | | 1.0 | | | | 2.9 | | | | 4.8 | | | | 9.8 | |
Treatment in custody, complaints mechanisms and oversight | | | 0.3 | | | | 1.3 | | | | 1.8 | | | | 1.8 | | | | 1.8 | | | | 7.0 | |
Rehabilitating women in prison and girls in detention | | | 0.1 | | | | 4.2 | | | | 8.8 | | | | 10.9 | | | | 16.0 | | | | 40.0 | |
Reintegrating women and girls into the community | | | — | | | | 1.9 | | | | 2.4 | | | | 5.4 | | | | 5.5 | | | | 15.2 | |
Data, investment, evaluation and implementation | | | 0.3 | | | | 0.5 | | | | 1.7 | | | | 2.3 | | | | — | | | | 4.8 | |
Demand impacts from Reports 1 & 2 and for recommendations needing further exploration | | | | | | | | | | | | | | | 26.0 | | | | 30.0 | | | | 56.0 | |
| | | | | | | | | | | | | | | | | | | | | | | | |
Sub Total - Expense Measures | | | 2.2 | | | | 23.2 | | | | 34.7 | | | | 68.9 | | | | 70.8 | | | | 199.8 | |
| | | | | | | | | | | | | | | | | | | | | | | | |
8
Budget Measures 2023-24
| | | | | | | | | | | | | | | | | | | | | | | | |
| | | 2022-23 | | | 2023-24 | | | 2024-25 | | | 2025-26 | | | 2026-27 | | | Total | |
| | | $million | | | $million | | | $million | | | $million | | | $million | | | $million | |
Capital measures | | | | | | | | | | | | | | | | | | | | | | | | |
| | | | | | |
Treatment of victim-survivors in trials for sexual offences | | | — | | | | 4.4 | | | | 4.4 | | | | 4.0 | | | | — | | | | 12.8 | |
Sentencing women and girls | | | — | | | | 1.5 | | | | | | | | — | | | | — | | | | 1.5 | |
Treatment in custody, complaints mechanisms and oversight | | | — | | | | 11.0 | | | | — | | | | — | | | | — | | | | 11.0 | |
| | | | | | | | | | | | | | | | | | | | | | | | |
Sub Total - Capital Measures | | | — | | | | 16.9 | | | | 4.4 | | | | 4.0 | | | | — | | | | 25.3 | |
| | | | | | | | | | | | | | | | | | | | | | | | |
Total1 | | | 2.2 | | | | 40.0 | | | | 39.1 | | | | 72.9 | | | | 70.8 | | | | 225.0 | |
| | | | | | | | | | | | | | | | | | | | | | | | |
Notes
| 1. | Figures shown are net additional funding, including funds held centrally, and may not sum due to rounding |
Women’s economic security
The Government is committing $16.3 million over 4 years for a package of measures to support women’s economic security. Measures within the package are aimed at improving women’s economic participation and outcomes, with a focus on supporting:
| • | | women in male dominated industries (including construction and trades) |
| • | | women in business and innovation |
| • | | disadvantaged and vulnerable women to access and maximise economic opportunities. |
The package of measures is summarised in Table 1.2 and additional details can be found in Chapter 2 Expense measures.
9
Budget Measures 2023-24
| Table 1.2 | Women’s economic security package |
| | | | | | | | | | | | | | | | | | | | | | | | |
| | | 2022-23
$million | | | 2023-24
$million | | | 2024-25
$million | | | 2025-26
$million | | | 2026-27
$million | | | Total
$million | |
Supporting women in male dominated industries (including construction and trades) | | | | | | | | | |
| | | | | | |
Women in Network Grants Program | | | — | | | | 0.6 | | | | 0.6 | | | | 0.8 | | | | 0.7 | | | | 2.8 | |
Women in Trade Apprenticeships Mentoring Program | | | — | | | | 2.3 | | | | 2.3 | | | | — | | | | — | | | | 4.6 | |
| | | | | | |
Supporting women in business and innovation | | | | | | | | | | | | | | | | | | | | | | | | |
| | | | | | |
Female Founders Co-Investment Fund | | | — | | | | 1.0 | | | | 2.0 | | | | — | | | | — | | | | 3.0 | |
Accelerating Female Founders | | | — | | | | 1.0 | | | | 1.0 | | | | — | | | | — | | | | 2.0 | |
|
Supporting disadvantaged and vulnerable women to access and maximise economic opportunities | |
| | | | | | |
Fresh Start for Me (transition from recovery to workforce) | | | — | | | | 0.5 | | | | — | | | | — | | | | — | | | | 0.5 | |
Future Women – Jobs Academy | | | — | | | | 0.8 | | | | 1.6 | | | | 0.8 | | | | — | | | | 3.2 | |
Working Women’s Centre | | | — | | | | — | | | | — | | | | — | | | | — | | | | 0.0 | |
| | | | | | |
Other | | | | | | | | | | | | | | | | | | | | | | | | |
| | | | | | |
Resourcing to support Office for Women initiatives | | | — | | | | 0.1 | | | | 0.1 | | | | — | | | | — | | | | 0.2 | |
| | | | | | | | | | | | | | | | | | | | | | | | |
Total | | | | | | | 6.4 | | | | 7.6 | | | | 1.6 | | | | 0.7 | | | | 16.3 | |
| | | | | | | | | | | | | | | | | | | | | | | | |
Brisbane 2032 Olympic and Paralympic Games
The 2023-24 Budget includes funding to continue to support preparations for the Brisbane 2032 Olympic and Paralympic Games (Brisbane 2032). Specific measures to support these activities can be found in the Department of the Premier and Cabinet, the Department of State Development, Infrastructure, Local Government and Planning and the Queensland Police Service sections of chapter 2.
Consistent with the Brisbane 2032 Intergovernmental Agreement signed with the Australian Government on 17 February 2023, funding contributions from each government have been agreed for the jointly funded $7.1 billion venues infrastructure program to support the hosting of Brisbane 2032. The venues infrastructure program comprises:
| • | | Brisbane Arena ($2.5 billion) |
| • | | Gabba redevelopment ($2.7 billion) |
| • | | Minor Venues Program for 16 new and upgraded venues across the state ($1.9 billion). |
The 2023-24 Budget includes provision for total expenditure of $1.9 billion over 4 years for Brisbane 2032 venues infrastructure.
| | | | | | | | | | | | | | | | | | | | | | | | |
| | | 2022-23
$million | | | 2023-24
$million | | | 2024-25
$million | | | 2025-26
$million | | | 2026-27
$million | | | Total
$million | |
Venues infrastructure | | | — | | | | 67.7 | | | | 197.9 | | | | 622.7 | | | | 1,006.8 | | | | 1,895.1 | |
10
Budget Measures 2023-24
Reinvesting in regional infrastructure projects
The new progressive coal royalty rates announced in the 2022–23 Budget ensure that Queenslanders receive a fair return on this valuable natural resource. The uplift in royalties has allowed the Queensland Government to invest more than $16 billion towards economic and social infrastructure and essential services to meet the needs of Queenslander across all regions of the State. Box 4.7 of Budget Paper No. 2 Budget Strategy and Outlook 2023-24 provides further detail.
In the 2022–23 Budget Update, the government committed to utilise the uplift in royalty revenue to fund $4 billion in productivity-enhancing investments across regional Queensland. This will support investments across energy, water and ports sectors for projects which will underpin Queensland’s future economic prosperity, including CopperString 2032 and the Fitzroy to Gladstone water pipeline.
In this Budget, the government is providing an additional $6 billion in funding for the Borumba Pumped Hydro Energy Storage project. This brings the Government’s total commitment to $10 billion for relevant Public Non-financial Corporations sector infrastructure projects funded by the general government sector equity injections supported by coal royalties Box 8.1 of Budget Paper No.2 Budget Strategy and Outlook 2023-24 provides further detail on these equity injections.
Public Sector Wages Policy
Queensland’s public servants are dedicated to delivering essential services to Queenslanders. The majority of public sector enterprise bargaining agreements nominally expired during 2022 or will expire during 2023. Government has always promoted good faith bargaining and in the context of immediate cost of living challenges, it has established a public sector wages offer that includes the following elements:
| • | | 3-year agreements with wage increases of 4 per cent in years one and two and 3 per cent in year 3. This is higher than the previous 2.5 per cent in recognition of prevailing economic circumstances and maintains capacity for strong frontline service delivery. |
| • | | A Cost of Living Adjustment (COLA) payment for employees where inflation exceeds headline wage increases established in agreements. Where the relevant Brisbane Consumer Price Index (March quarter annual percentage change) is higher than the relevant wage increase under a certified agreement, eligible employees will receive a once-off COLA payment equivalent to the percentage point difference, applied to their base wages and capped at 3 per cent. |
The Queensland Government is also simplifying its superannuation contribution arrangement for its employees – employer superannuation contributions of 18 per cent of salary for police officers, 14.25 per cent for fire service officers, and 12.75 per cent of salary for other employees. Superannuation contributions will be paid on base salary, ordinary time allowances and paid leave. Contribution rates into defined benefit categories remain unchanged, with defined benefit members receiving top up payments into accumulation accounts to match the above rates.
11
Budget Measures 2023-24
Integrity reforms
The government has made a total funding commitment of $50.8 million over 5 years from 2022-23 ($13.5 million held centrally), with $11.5 million ongoing, to deliver a package of reforms to improve integrity, accountability and transparency in government decisions and enhance the role of the Public Sector Commission and provide greater independence to integrity bodies, including the Office of the Queensland Integrity Commissioner.
These reforms deliver on the recommendations in the report by Professor Coaldrake AO, Let the Sunshine In: Review of culture and accountability in the Queensland public sector, and the report by Mr Kevin Yearbury PSM, Strategic Review of the Integrity Commissioner’s Functions. Further details can be found in the Department of the Premier and Cabinet (including the Office of the Queensland Integrity Commissioner), the Public Sector Commission, the Department of Justice and Attorney-General and the Office of the Queensland Ombudsman sections of Chapter 2.
| 1.4 | Government Indexation Policy |
For the 2023–24 year, the government has set the Government Indexation Rate for fees and charges at 3.4 per cent. This is in line with wages growth and government’s commitment to ease cost of living pressures.
12
Budget Measures 2023-24
| Table 1.3: | Expense measures since the 2022-23 Budget |
| | | | | | | | | | | | | | | | | | | | |
Expense measures up to and including 2022–23 Budget Update | | 2022–23
$‘000 | | | 2023–24
$‘000 | | | 2024–25
$‘000 | | | 2025–26
$‘000 | | | 2026–27
$‘000 | |
Department of Agriculture and Fisheries | | | | | | | | | | | | | | | | | | | | |
Biosecurity Preparedness Package | | | 8,060 | | | | 4,977 | | | | 4,056 | | | | 2,398 | | | | 2,497 | |
| | | | | | | | | | | | | | | | | | | | |
Portfolio Total | | | 8,060 | | | | 4,977 | | | | 4,056 | | | | 2,398 | | | | 2,497 | |
| | | | | | | | | | | | | | | | | | | | |
Department of Child Safety, Seniors and Disability Services | | | | | | | | | | | | | | | | | | | | |
Reform of Queensland’s Positive Behaviour Support and Restrictive Practices | | | 1,179 | | | | 4,843 | | | | 4,326 | | | | 4,437 | | | | 4,551 | |
Queensland Disability Advocacy Program | | | — | | | | 4,047 | | | | 4,047 | | | | 4,047 | | | | 4,047 | |
National Disability Insurance Scheme (NDIS) Assessment Services 1 | | | — | | | | 3,677 | | | | — | | | | — | | | | — | |
Youth Justice Investment—Fast-track Sentencing 1 | | | 227 | | | | 605 | | | | 110 | | | | — | | | | — | |
| | | | | | | | | | | | | | | | | | | | |
Portfolio Total | | | 1,406 | | | | 13,172 | | | | 8,483 | | | | 8,484 | | | | 8,598 | |
| | | | | | | | | | | | | | | | | | | | |
Department of Education | | | | | | | | | | | | | | | | | | | | |
Queensland Workforce Strategy—Regional School Industry Partnerships | | | 845 | | | | 1,643 | | | | 1,690 | | | | 866 | | | | — | |
| | | | | | | | | | | | | | | | | | | | |
Portfolio Total | | | 845 | | | | 1,643 | | | | 1,690 | | | | 866 | | | | — | |
| | | | | | | | | | | | | | | | | | | | |
Department of Energy and Public Works | | | | | | | | | | | | | | | | | | | | |
Bundaberg East Levee Project | | | — | | | | — | | | | — | | | | — | | | | — | |
| | | | | | | | | | | | | | | | | | | | |
Portfolio Total | | | — | | | | — | | | | — | | | | — | | | | — | |
| | | | | | | | | | | | | | | | | | | | |
Department of Environment and Science | | | | | | | | | | | | | | | | | | | | |
Queensland Workforce Strategy—Multicultural Affairs Settlement Team | | | 746 | | | | 739 | | | | 760 | | | | 779 | | | | — | |
Revitalising National Parks | | | — | | | | 3,457 | | | | 3,545 | | | | 3,631 | | | | 3,722 | |
Queensland Indigenous Land and Sea Ranger Program | | | — | | | | 2,813 | | | | 15,000 | | | | 15,675 | | | | 16,367 | |
Strategic Science and International Partnerships | | | — | | | | 728 | | | | 1,500 | | | | 1,500 | | | | 1,500 | |
| | | | | | | | | | | | | | | | | | | | |
Portfolio Total | | | 746 | | | | 7,737 | | | | 20,805 | | | | 21,585 | | | | 21,589 | |
| | | | | | | | | | | | | | | | | | | | |
Department of Housing | | | | | | | | | | | | | | | | | | | | |
Immediate Housing Response Package | | | 12,000 | | | | 32,000 | | | | — | | | | — | | | | — | |
Youth Justice Investment—Stronger Communities Initiative: Early Action Groups | | | — | | | | 287 | | | | 545 | | | | — | | | | — | |
Hear her voice—Report 2—Reintegrating Women and Girls into the Community | | | — | | | | 124 | | | | 590 | | | | 3,533 | | | | 3,551 | |
Homes for Homes 1 | | | — | | | | — | | | | — | | | | — | | | | — | |
Housing Summit Outcomes 1 | | | — | | | | — | | | | — | | | | — | | | | — | |
| | | | | | | | | | | | | | | | | | | | |
Portfolio Total | | | 12,000 | | | | 32,411 | | | | 1,135 | | | | 3,533 | | | | 3,551 | |
| | | | | | | | | | | | | | | | | | | | |
Department of Justice and Attorney-General | | | | | | | | | | | | | | | | | | | | |
Legal Aid Queensland—Extension of Protected Witness Scheme | | | — | | | | 4,595 | | | | 4,641 | | | | 4,677 | | | | 4,708 | |
Response to the Commission of Inquiry Relating to the Crime and Corruption Commission 1 | | | 950 | | | | 4,075 | | | | 4,186 | | | | 4,050 | | | | 4,080 | |
Hear her voice—Report 2—Support for victim-survivors through their criminal justice journey | | | 518 | | | | 3,074 | | | | 3,252 | | | | 2,964 | | | | 2,835 | |
Hear her voice—Report 2—Treatment of victim-survivors in trials for sexual offences | | | 635 | | | | 2,377 | | | | 1,804 | | | | 1,253 | | | | 1,296 | |
Hear her voice—Report 2—Prosecution response to victim-survivors of sexual violence | | | — | | | | 1,954 | | | | 1,978 | | | | 2,037 | | | | 2,087 | |
13
Budget Measures 2023-24
| | | | | | | | | | | | | | | | | | | | |
Expense measures up to and including 2022–23 Budget Update | | 2022–23
$‘000 | | | 2023–24
$‘000 | | | 2024–25
$‘000 | | | 2025–26
$‘000 | | | 2026–27
$‘000 | |
Hear her voice—Report 2—Jury directions and the use of expert evidence in trials for sexual offences | | | — | | | | 1,837 | | | | 2,607 | | | | 2,516 | | | | — | |
Hear her voice—Report 2—Community attitudes to sexual violence and consent | | | 250 | | | | 1,286 | | | | 500 | | | | 500 | | | | — | |
Hear her voice—Report 2—Barriers to reporting sexual violence 1 | | | (278 | ) | | | 1,178 | | | | 500 | | | | 500 | | | | — | |
Hear her voice—Report 2—Data, investment, evaluation and implementation | | | 280 | | | | 545 | | | | 1,714 | | | | 2,257 | | | | — | |
Hear her voice—Report 2—Restorative justice for victims of sexual violence | | | — | | | | 500 | | | | — | | | | — | | | | 400 | |
Hear her voice—Report 2—Women and girls’ experiences of the legal and court system | | | — | | | | 409 | | | | 516 | | | | 2,406 | | | | 2,466 | |
Hear her voice—Report 2—Improving court management of sexual offence cases | | | — | | | | — | | | | 604 | | | | 564 | | | | 373 | |
Hear her voice—Report 2—Limitations on publishing the identity of victims and accused people | | | — | | | | — | | | | 333 | | | | — | | | | — | |
Hear her voice—Report 2—Reintegrating women and girls into the community | | | — | | | | — | | | | — | | | | — | | | | — | |
Hear her voice—Report 2—Women and girls’ experiences in watchhouses, on remand, and when applying for bail | | | — | | | | — | | | | — | | | | — | | | | — | |
Youth Justice Investment—Fast-track sentencing 1 | | | 1,330 | | | | 3,570 | | | | 790 | | | | — | | | | — | |
Queensland Worker Screening Program | | | 395 | | | | 2,759 | | | | 1,838 | | | | 1,727 | | | | — | |
Strengthening Timely Access to Civil Justice for Vulnerable and Everyday Queenslanders 1 | | | — | | | | 1,787 | | | | — | | | | — | | | | — | |
Office of the Information Commissioner—Demand Pressures | | | — | | | | 736 | | | | 765 | | | | 796 | | | | 828 | |
Child Safe Standards and Reportable Conduct Scheme | | | 179 | | | | 373 | | | | 194 | | | | — | | | | — | |
| | | | | | | | | | | | | | | | | | | | |
Portfolio Total | | | 4,259 | | | | 31,055 | | | | 26,222 | | | | 26,247 | | | | 19,073 | |
| | | | | | | | | | | | | | | | | | | | |
Department of Regional Development, Manufacturing and Water | | | | | | | | | | | | | | | | | | | | |
Irrigation Pricing Discount and Cap | | | — | | | | 600 | | | | 22,200 | | | | — | | | | — | |
| | | | | | | | | | | | | | | | | | | | |
Portfolio Total | | | — | | | | 600 | | | | 22,200 | | | | — | | | | — | |
| | | | | | | | | | | | | | | | | | | | |
Department of State Development, Infrastructure, Local Government and Planning | | | | | | | | | | | | | | | | | |
Resources Community Infrastructure Fund 1 | | | — | | | | 118,200 | | | | — | | | | — | | | | — | |
Rockhampton Regional Council (Mount Morgan Water Supply) | | | 5,400 | | | | 5,400 | | | | — | | | | — | | | | — | |
Toowoomba to Warwick Pipeline | | | 1,500 | | | | — | | | | — | | | | — | | | | — | |
| | | | | | | | | | | | | | | | | | | | |
Portfolio Total | | | 6,900 | | | | 123,600 | | | | — | | | | — | | | | — | |
| | | | | | | | | | | | | | | | | | | | |
Department of the Premier and Cabinet | | | | | | | | | | | | | | | | | | | | |
Screen Queensland—Studios Hemmant | | | — | | | | 2,000 | | | | 2,000 | | | | 3,000 | | | | — | |
Domestic and Family Violence (DFV) Prevention Council | | | — | | | | 849 | | | | 1,154 | | | | 1,167 | | | | 283 | |
Queensland Integrity Commissioner reforms | | | — | | | | 676 | | | | 471 | | | | 495 | | | | 501 | |
Paralympic Centre of Excellence | | | — | | | | — | | | | — | | | | — | | | | — | |
| | | | | | | | | | | | | | | | | | | | |
Portfolio Total | | | — | | | | 3,525 | | | | 3,625 | | | | 4,662 | | | | 784 | |
| | | | | | | | | | | | | | | | | | | | |
Department of Tourism, Innovation and Sport | | | | | | | | | | | | | | | | | | | | |
Tourism and Events Queensland’s Funding | | | — | | | | 53,114 | | | | 73,123 | | | | 72,927 | | | | 72,726 | |
Browne Park | | | 2,000 | | | | 33,000 | | | | 19,326 | | | | — | | | | — | |
2023 Year of Accessible Tourism | | | 1,500 | | | | 10,500 | | | | — | | | | — | | | | — | |
FIFA Women’s World Cup Infrastructure 2023 | | | 2,000 | | | | — | | | | — | | | | — | | | | — | |
| | | | | | | | | | | | | | | | | | | | |
Portfolio Total | | | 5,500 | | | | 96,614 | | | | 92,449 | | | | 72,927 | | | | 72,726 | |
| | | | | | | | | | | | | | | | | | | | |
14
Budget Measures 2023-24
| | | | | | | | | | | | | | | | | | | | |
Expense measures up to and including 2022–23 Budget Update | | 2022–23
$‘000 | | | 2023–24
$‘000 | | | 2024–25
$‘000 | | | 2025–26
$‘000 | | | 2026–27
$‘000 | |
Department of Transport and Main Roads | | | | | | | | | | | | | | | | | | | | |
Concessions and Rebates Awareness Campaign | | | 3,000 | | | | — | | | | — | | | | — | | | | — | |
Disaster Contact Centre Service Response Capacity 1 | | | — | | | | — | | | | — | | | | — | | | | — | |
Driver Protection Barrier Retrofit Program 1 | | | — | | | | — | | | | — | | | | — | | | | — | |
| | | | | | | | | | | | | | | | | | | | |
Portfolio Total | | | 3,000 | | | | — | | | | — | | | | — | | | | — | |
| | | | | | | | | | | | | | | | | | | | |
Department of Treaty, Aboriginal and Torres Strait Islander Partnerships, Communities and the Arts | | | | | | | | | | | | | |
Queensland Men’s Shed Association | | | — | | | | 150 | | | | 150 | | | | 150 | | | | 150 | |
| | | | | | | | | | | | | | | | | | | | |
Portfolio Total | | | — | | | | 150 | | | | 150 | | | | 150 | | | | 150 | |
| | | | | | | | | | | | | | | | | | | | |
Department of Youth Justice, Employment, Small Business and Training | | | | | | | | | | | | | | | | | | | | |
Youth Detention Centre Capacity—Addressing Capacity Issues at Youth Detention Centres 1 | | | 1,532 | | | | 2,154 | | | | — | | | | — | | | | — | |
Youth Justice Investment—Fast-track Sentencing 1 | | | 444 | | | | 1,202 | | | | 217 | | | | — | | | | — | |
Small Business Support and Wellness Package | | | 2,280 | | | | 2,980 | | | | 1,490 | | | | — | | | | — | |
Queensland Workforce Strategy—Diverse Queensland Workforce Program | | | 900 | | | | 2,275 | | | | 2,275 | | | | — | | | | — | |
Queensland Workforce Strategy—Industry Workforce Advisors | | | 2,100 | | | | 2,160 | | | | 2,200 | | | | — | | | | — | |
Queensland Workforce Strategy—Gateway to Industry Schools Program | | | 1,371 | | | | 1,371 | | | | 1,371 | | | | — | | | | — | |
Queensland Workforce Strategy—Implementation Arrangements | | | 1,910 | | | | 1,280 | | | | 1,310 | | | | 800 | | | | — | |
Queensland Workforce Strategy—Place-based Skills and Job Creation Initiatives | | | 1,000 | | | | 1,000 | | | | 1,000 | | | | 500 | | | | — | |
Hear her voice—Report 2—Rehabilitating women in prison and girls in detention | | | — | | | | — | | | | — | | | | 1,963 | | | | 6,846 | |
Hear her voice—Report 2—Restorative justice for victims of sexual violence | | | — | | | | — | | | | — | | | | 180 | | | | 270 | |
Hear her voice Report 2—Health, wellbeing, prenatal and postnatal care and birth experiences in prison and detention | | | — | | | | — | | | | — | | | | 1,862 | | | | 3,710 | |
Queensland Workforce Strategy—Workforce Connect Fund 1 | | | — | | | | — | | | | — | | | | — | | | | — | |
| | | | | | | | | | | | | | | | | | | | |
Portfolio Total | | | 11,537 | | | | 14,422 | | | | 9,863 | | | | 5,305 | | | | 10,826 | |
| | | | | | | | | | | | | | | | | | | | |
Public Sector Commission | | | | | | | | | | | | | | | | | | | | |
Public Sector Culture and Integrity Reforms | | | 1,429 | | | | 4,127 | | | | 4,303 | | | | 4,504 | | | | 4,220 | |
| | | | | | | | | | | | | | | | | | | | |
Portfolio Total | | | 1,429 | | | | 4,127 | | | | 4,303 | | | | 4,504 | | | | 4,220 | |
| | | | | | | | | | | | | | | | | | | | |
Queensland Corrective Services | | | | | | | | | | | | | | | | | | | | |
Southern Queensland Correctional Precinct—Stage 2—Commissioning and Maintenance 1 | | | 8,979 | | | | 9,400 | | | | — | | | | — | | | | — | |
Hear her voice—Report 2—Treatment in custody, complaints mechanisms and oversight | | | 280 | | | | 1,033 | | | | 845 | | | | 742 | | | | 761 | |
Hear her voice—Report 2—Health, wellbeing, prenatal and postnatal care and birth experiences in prison and detention | | | 70 | | | | 998 | | | | 1,038 | | | | 1,069 | | | | 1,096 | |
Hear her voice—Report 2—Reintegrating women and girls into the community | | | — | | | | 400 | | | | 300 | | | | 309 | | | | 317 | |
Hear her voice—Report 2—Sentencing women and girls | | | — | | | | 315 | | | | — | | | | — | | | | — | |
Hear her voice—Report 2—Rehabilitating women in prison and girls in detention | | | — | | | | — | | | | — | | | | — | | | | — | |
| | | | | | | | | | | | | | | | | | | | |
Portfolio Total | | | 9,329 | | | | 12,146 | | | | 2,183 | | | | 2,120 | | | | 2,174 | |
| | | | | | | | | | | | | | | | | | | | |
15
Budget Measures 2023-24
| | | | | | | | | | | | | | | | | | | | |
Expense measures up to and including 2022–23 Budget Update | | 2022–23
$‘000 | | | 2023–24
$‘000 | | | 2024–25
$‘000 | | | 2025–26
$‘000 | | | 2026–27
$‘000 | |
Queensland Health | | | | | | | | | | | | | | | | | | | | |
Palliative and End of Life Care 1 | | | — | | | | 10,000 | | | | 12,000 | | | | 13,810 | | | | — | |
Youth Justice Investment—Fast-track Sentencing 1 | | | 58 | | | | 175 | | | | 45 | | | | — | | | | — | |
| | | | | | | | | | | | | | | | | | | | |
Portfolio Total | | | 58 | | | | 10,175 | | | | 12,045 | | | | 13,810 | | | | — | |
| | | | | | | | | | | | | | | | | | | | |
Queensland Police Service | | | | | | | | | | | | | | | | | | | | |
Youth Justice Investment—Fast-track Sentencing 1 | | | 216 | | | | 446 | | | | 464 | | | | — | | | | — | |
Youth Justice Investment—Youth Co-responder Teams 1 | | | — | | | | — | | | | — | | | | — | | | | — | |
Weapons Licensing Management System Replacement Project | | | — | | | | 1,459 | | | | 745 | | | | — | | | | — | |
| | | | | | | | | | | | | | | | | | | | |
Portfolio Total | | | 216 | | | | 1,905 | | | | 1,209 | | | | — | | | | — | |
| | | | | | | | | | | | | | | | | | | | |
Queensland Treasury | | | | | | | | | | | | | | | | | | | | |
Queensland Resources Common User Facility | | | 1,300 | | | | 5,000 | | | | 3,700 | | | | — | | | | — | |
| | | | | | | | | | | | | | | | | | | | |
Portfolio Total | | | 1,300 | | | | 5,000 | | | | 3,700 | | | | — | | | | — | |
| | | | | | | | | | | | | | | | | | | | |
Total impact on Expense up to and including 2022-23 Budget Update | | | 66,585 | | | | 363,259 | | | | 214,118 | | | | 166,591 | | | | 146,188 | |
16
Budget Measures 2023-24
| | | | | | | | | | | | | | | | | | | | |
Expense measures since 2022–23 Budget Update | | 2022–23
$‘000 | | | 2023–24
$‘000 | | | 2024–25
$‘000 | | | 2025–26
$‘000 | | | 2026–27
$‘000 | |
Department of Agriculture and Fisheries | | | | | | | | | | | | | | | | | | | | |
Continuation of Fisheries Reform | | | (2,000 | ) | | | 7,465 | | | | 6,223 | | | | — | | | | — | |
Queensland’s Obligations under the National Biosecurity System | | | 7,668 | | | | 7,000 | | | | — | | | | — | | | | — | |
Biosecurity Preparedness and Capability Uplift | | | 804 | | | | 6,957 | | | | 7,307 | | | | 3,919 | | | | 2,730 | |
Rural Economic Development Grants Program | | | — | | | | 3,300 | | | | — | | | | — | | | | — | |
Innovative Emergency Animal Disease Response Preparedness Tools | | | — | | | | 1,764 | | | | — | | | | — | | | | — | |
Improving Swimmer Safety including the Shark Control Program | | | 527 | | | | 1,306 | | | | 1,893 | | | | 2,443 | | | | 3,022 | |
Implementing Independent Data Validation as part of Fisheries Reform | | | — | | | | — | | | | — | | | | — | | | | — | |
National Red Imported Fire Ant Eradication Program in South East Queensland | | | — | | | | — | | | | — | | | | — | | | | — | |
| | | | | | | | | | | | | | | | | | | | |
Portfolio Total | | | 6,999 | | | | 27,792 | | | | 15,423 | | | | 6,362 | | | | 5,752 | |
| | | | | | | | | | | | | | | | | | | | |
Department of Child Safety, Seniors and Disability Services | | | | | | | | | | | | | | | | | | | | |
Cost of Living Rebate and National Energy Bill Relief | | | — | | | | 1,435,000 | | | | — | | | | — | | | | — | |
Supporting people with disability ineligible for the National Disability Insurance Scheme | | | — | | | | 4,206 | | | | 4,332 | | | | 4,462 | | | | 4,596 | |
National Disability Insurance Scheme (NDIS) Assessment Services 2 | | | — | | | | 3,964 | | | | 4,669 | | | | 1,818 | | | | 2,029 | |
Seniors support package | | | — | | | | 2,871 | | | | 4,448 | | | | 4,495 | | | | 4,439 | |
Human Services Quality Framework Funding | | | — | | | | 956 | | | | 918 | | | | 508 | | | | 521 | |
Family Support and Child Protection Reforms—Our Way | | | — | | | | 16,347 | | | | 32,046 | | | | 51,930 | | | | 66,922 | |
Child and Family Services—Delivering Placement Reforms | | | — | | | | 6,280 | | | | 6,109 | | | | 6,320 | | | | 6,486 | |
Child and Family Services—Responses to Child Sexual Abuse | | | — | | | | 2,824 | | | | 2,846 | | | | 2,947 | | | | 3,027 | |
Youth Justice Investment—Fast-track Sentencing 2 | | | 59 | | | | 167 | | | | 30 | | | | — | | | | — | |
Child and Family Services—Parameter Based Funding Model | | | — | | | | — | | | | — | | | | — | | | | — | |
Family Support and Child Protection Reforms—Family and Child Connect | | | — | | | | — | | | | 16,182 | | | | 16,182 | | | | 16,182 | |
Future delivery of Queensland Accommodation Support and Respite Services (AS&RS) | | | — | | | | — | | | | — | | | | — | | | | — | |
| | | | | | | | | | | | | | | | | | | | |
Portfolio Total | | | 59 | | | | 1,472,615 | | | | 71,580 | | | | 88,662 | | | | 104,202 | |
| | | | | | | | | | | | | | | | | | | | |
Department of Education | | | | | | | | | | | | | | | | | | | | |
Free Kindergarten in Queensland | | | — | | | | 101,624 | | | | 173,724 | | | | 180,720 | | | | 189,359 | |
School Infrastructure and Land Acquisitions | | | — | | | | 16,785 | | | | 28,978 | | | | 14,819 | | | | 4,498 | |
Youth Justice Investment—Stronger Communities Initiative: Early Action Groups | | | — | | | | 261 | | | | 491 | | | | — | | | | — | |
Youth Detention Centre Capacity—Addressing Capacity Issues at Youth Detention Centres | | | 220 | | | | 242 | | | | — | | | | — | | | | — | |
Non-State Schools Transport Assistance Scheme | | | 81 | | | | 221 | | | | 364 | | | | 521 | | | | 674 | |
Teacher Housing | | | — | | | | 220 | | | | 234 | | | | 248 | | | | 264 | |
Addressing Market Pressures | | | — | | | | — | | | | 14,456 | | | | 14,456 | | | | 14,456 | |
School Infrastructure—Renewal | | | — | | | | — | | | | — | | | | — | | | | — | |
| | | | | | | | | | | | | | | | | | | | |
Portfolio Total | | | 301 | | | | 119,353 | | | | 218,247 | | | | 210,764 | | | | 209,251 | |
| | | | | | | | | | | | | | | | | | | | |
Department of Energy and Public Works | | | | | | | | | | | | | | | | | | | | |
Household Energy Initiatives | | | — | | | | 40,000 | | | | 20,000 | | | | — | | | | — | |
ReBuild QBuild | | | 6,411 | | | | 15,267 | | | | 9,022 | | | | 8,438 | | | | — | |
Queensland Business Energy Saving and Transformation Program | | | 6,000 | | | | 14,500 | | | | 14,500 | | | | — | | | | — | |
Queensland Energy and Jobs Plan Implementation | | | 11,775 | | | | 13,050 | | | | 10,845 | | | | 8,150 | | | | — | |
17
Budget Measures 2023-24
| | | | | | | | | | | | | | | | | | | | |
Expense measures since 2022–23 Budget Update | | 2022–23
$‘000 | | | 2023–24
$‘000 | | | 2024–25
$‘000 | | | 2025–26
$‘000 | | | 2026–27
$‘000 | |
Hydrogen Hubs Initiative | | | 1,000 | | | | 13,000 | | | | 6,000 | | | | — | | | | — | |
Queensland Renewable Energy Zones Planning and Community Engagement | | | 2,000 | | | | 12,000 | | | | 15,000 | | | | 6,000 | | | | — | |
Vulnerable Households Energy Advice Initiatives | | | — �� | | | | 7,500 | | | | 2,500 | | | | — | | | | — | |
Public Information Regarding Access to Energy Bill Support | | | — | | | | 5,000 | | | | — | | | | — | | | | — | |
Drought Assistance and Reform Package | | | — | | | | — | | | | — | | | | — | | | | — | |
Government Employee Housing Expansion—Program Management | | | — | | | | — | | | | 1,128 | | | | 1,155 | | | | — | |
| | | | | | | | | | | | | | | | | | | | |
Portfolio Total | | | 27,186 | | | | 120,317 | | | | 78,995 | | | | 23,743 | | | | — | |
| | | | | | | | | | | | | | | | | | | | |
Department of Environment and Science | | | | | | | | | | | | | | | | | | | | |
Multicultural Affairs—Celebrating Multicultural Qld | | | — | | | | 1,176 | | | | 1,178 | | | | 1,184 | | | | 1,189 | |
Managing Country with First Nations Peoples | | | — | | | | 9,019 | | | | 9,459 | | | | 10,386 | | | | 9,704 | |
Partnering with Quandamooka On Land and Sea Country | | | — | | | | 2,261 | | | | 4,604 | | | | 5,541 | | | | 4,648 | |
Keeping the Queensland public safe from crocodiles and management of flying foxes | | | — | | | | 1,310 | | | | 2,162 | | | | 1,703 | | | | 800 | |
World-Class Protected Area Management | | | — | | | | 978 | | | | 4,811 | | | | 5,898 | | | | 8,767 | |
Currumbin Eco-Parkland | | | — | | | | 574 | | | | 624 | | | | 648 | | | | 667 | |
Waste Package | | | 139,600 | | | | — | | | | — | | | | — | | | | 94,400 | |
| | | | | | | | | | | | | | | | | | | | |
Portfolio Total | | | 139,600 | | | | 15,318 | | | | 22,838 | | | | 25,360 | | | | 120,175 | |
| | | | | | | | | | | | | | | | | | | | |
Department of Housing | | | | | | | | | | | | | | | | | | | | |
Housing with Support Initiative | | | — | | | | 13,515 | | | | 18,515 | | | | — | | | | — | |
Youth Justice Investment—Helping Seniors Secure their Homes | | | 4,000 | | | | 11,000 | | | | — | | | | — | | | | — | |
Second Aboriginal and Torres Strait Islander Housing Action Plan | | | — | | | | 6,669 | | | | 14,877 | | | | 14,877 | | | | 14,877 | |
Acceleration of Social and Affordable Housing Delivery | | | — | | | | 5,583 | | | | 5,794 | | | | 5,965 | | | | 6,111 | |
Frontline Support Services | | | — | | | | 5,418 | | | | — | | | | — | | | | — | |
Additional Social Housing Supply | | | — | | | | 3,060 | | | | 9,800 | | | | 20,260 | | | | 27,383 | |
Emergency Accommodation | | | 2,274 | | | | 2,274 | | | | 2,274 | | | | 2,274 | | | | 3,000 | |
Helena’s House Project | | | — | | | | 2,000 | | | | — | | | | — | | | | — | |
Queensland Housing Strategy 2017-2027—Supply of Social Housing | | | — | | | | 1,475 | | | | — | | | | — | | | | — | |
Homes for Homes 2 | | | — | | | | — | | | | — | | | | — | | | | — | |
Housing Summit Outcomes 2 | | | — | | | | — | | | | — | | | | — | | | | — | |
| | | | | | | | | | | | | | | | | | | | |
Portfolio Total | | | 6,274 | | | | 50,994 | | | | 51,260 | | | | 43,376 | | | | 51,371 | |
| | | | | | | | | | | | | | | | | | | | |
Department of Justice and Attorney-General | | | | | | | | | | | | | | | | | | | | |
Supporting escalating workloads within the District Court of Queensland | | | — | | | | 8,205 | | | | 8,408 | | | | 8,614 | | | | 8,812 | |
Response to the Commission of Inquiry Relating to the Crime and Corruption Commission 2 | | | — | | | | 4,218 | | | | 4,293 | | | | 3,686 | | | | 2,842 | |
Domestic, Family and Sexual Violence Investment Review Outcomes | | | — | | | | 3,700 | | | | 13,200 | | | | 20,700 | | | | 20,700 | |
Coroners Court of Queensland—Sustainable Resourcing | | | — | | | | 3,639 | | | | 3,796 | | | | 5,687 | | | | 5,790 | |
Forensic DNA Commission of Inquiry | | | 459 | | | | 3,422 | | | | 3,458 | | | | 3,487 | | | | 3,011 | |
Hear her voice—Report 2—Adult Restorative Justice Program | | | — | | | | 1,549 | | | | 1,557 | | | | — | | | | — | |
Hear her voice—Report 2—Barriers to reporting sexual violence 2 | | | 378 | | | | (378 | ) | | | — | | | | — | | | | — | |
Youth Justice Investment—Enhanced Assistance for Victims of Crime | | | — | | | | 2,653 | | | | 2,080 | | | | 2,117 | | | | 2,150 | |
Youth Justice Investment—Townsville Community Youth Response: High Risk Youth Court | | | — | | | | 2,234 | | | | 2,300 | | | | — | | | | — | |
18
Budget Measures 2023-24
| | | | | | | | | | | | | | | | | | | | |
Expense measures since 2022–23 Budget Update | | 2022–23
$‘000 | | | 2023–24
$‘000 | | | 2024–25
$‘000 | | | 2025–26
$‘000 | | | 2026–27
$‘000 | |
Youth Justice Investment—Fast-track sentencing 2 | | | 759 | | | | 2,020 | | | | 476 | | | | — | | | | — | |
Youth Justice Investment—Strengthen Bail Laws: Resourcing | | | — | | | | 1,985 | | | | 2,045 | | | | — | | | | — | |
Youth Justice Investment—Youth Justice Reinvestment | | | — | | | | 1,250 | | | | 1,250 | | | | 1,250 | | | | 1,250 | |
Body Corporate and Community Management—contemporary service delivery to address demand growth in the community titles sector | | | — | | | | 1,493 | | | | 1,010 | | | | 1,041 | | | | — | |
Queensland Human Rights Commission—Addressing complaint management resourcing requirements | | | — | | | | 1,318 | | | | — | | | | — | | | | — | |
Implementation of Cabinet Proactive Release | | | — | | | | 1,016 | | | | 1,016 | | | | 1,016 | | | | 1,016 | |
Blue Card Services—Demand Management | | | — | | | | 896 | | | | — | | | | — | | | | — | |
Strengthening Timely Access to Civil Justice for Vulnerable and Everyday Queenslanders 2 | | | — | | | | 820 | | | | 3,523 | | | | 3,567 | | | | 3,658 | |
Strengthen casino oversight and regulation | | | — | | | | 750 | | | | — | | | | — | | | | — | |
Increased funding to support the community legal sector | | | — | | | | 336 | | | | 336 | | | | — | | | | — | |
Office of the Independent Implementation Supervisor for Commission of Inquiry into Queensland Police Service Responses to Domestic and Family Violence | | | — | | | | 329 | | | | 335 | | | | 342 | | | | 348 | |
Queensland Human Rights Commission—Complaints Management System | | | — | | | | — | | | | 50 | | | | 50 | | | | 50 | |
Safe Night Precincts | | | — | | | | — | | | | — | | | | — | | | | — | |
Victim Liaison Services | | | — | | | | — | | | | 808 | | | | 830 | | | | 851 | |
| | | | | | | | | | | | | | | | | | | | |
Portfolio Total | | | 1,596 | | | | 41,455 | | | | 49,941 | | | | 52,387 | | | | 50,478 | |
| | | | | | | | | | | | | | | | | | | | |
Department of Regional Development, Manufacturing and Water | | | | | | | | | | | | | | | | | | | | |
Toowoomba Water Treatment to Four Communities | | | — | | | | 5,250 | | | | 6,000 | | | | 3,000 | | | | 750 | |
Hydrogen Water Requirements in Gladstone—Detailed Business Case | | | — | | | | 4,000 | | | | 4,000 | | | | — | | | | — | |
Strengthening First Nations Peoples’ Inclusion and Economic Development in Water Management | | | — | | | | 3,838 | | | | 3,886 | | | | 3,933 | | | | — | |
Grow Manufacturing Capacity through Energy Programs in Queensland | | | 55 | | | | 2,717 | | | | 2,728 | | | | 2,438 | | | | 962 | |
Urban Water Risk Assessment—Stage 1 | | | — | | | | 2,578 | | | | — | | | | — | | | | — | |
Southern Downs Smart Reticulation and Network Monitoring | | | 1,700 | | | | 1,700 | | | | 2,975 | | | | 1,700 | | | | 425 | |
Advanced Robotics in Manufacturing (ARM) Hub | | | — | | | | 621 | | | | 2,200 | | | | 2,200 | | | | 2,200 | |
Fitzroy to Gladstone Water Pipeline Administration | | | 30 | | | | 300 | | | | 585 | | | | 585 | | | | — | |
River Improvement Trusts | | | — | | | | 300 | | | | — | | | | — | | | | — | |
Toowoomba to Warwick Pipeline Administration | | | 50 | | | | 200 | | | | 300 | | | | 300 | | | | 150 | |
| | | | | | | | | | | | | | | | | | | | |
Portfolio Total | | | 1,835 | | | | 21,504 | | | | 22,674 | | | | 14,156 | | | | 4,487 | |
| | | | | | | | | | | | | | | | | | | | |
Department of Resources | | | | | | | | | | | | | | | | | | | | |
Abandoned Mine Sites Program | | | — | | | | 13,425 | | | | 6,000 | | | | — | | | | — | |
Enhanced Vegetation Compliance | | | — | | | | 1,573 | | | | 2,679 | | | | 2,743 | | | | 2,798 | |
Frontier Gas Exploration Program | | | — | | | | 517 | | | | 20,528 | | | | — | | | | — | |
| | | | | | | | | | | | | | | | | | | | |
Portfolio Total | | | — | | | | 15,515 | | | | 29,207 | | | | 2,743 | | | | 2,798 | |
| | | | | | | | | | | | | | | | | | | | |
Department of State Development, Infrastructure, Local Government and Planning | | | | | | | | | | | | | | | | | |
Industry Partnership Program | | | — | | | | 53,539 | | | | — | | | | — | | | | — | |
Disaster Resilience | | | — | | | | 28,543 | | | | 28,543 | | | | 14,272 | | | | — | |
Indigenous Council Funding Program | | | — | | | | 25,800 | | | | — | | | | — | | | | — | |
Regional Industrial Land Improvement Program | | | — | | | | 15,000 | | | | 20,000 | | | | 10,000 | | | | — | |
19
Budget Measures 2023-24
| | | | | | | | | | | | | | | | | | | | |
Expense measures since 2022–23 Budget Update | | 2022–23
$‘000 | | | 2023–24
$‘000 | | | 2024–25
$‘000 | | | 2025–26
$‘000 | | | 2026–27
$‘000 | |
Sanofi Translational Science Hub | | | 5,440 | | | | 12,240 | | | | 12,240 | | | | 14,520 | | | | 11,800 | |
Resilient Homes Fund | | | — | | | | 8,257 | | | | 8,257 | | | | 4,128 | | | | — | |
Queensland Energy and Jobs Plan | | | — | | | | 6,850 | | | | 16,850 | | | | 32,000 | | | | 50,000 | |
South East Queensland Digital Twin | | | — | | | | 5,000 | | | | — | | | | — | | | | — | |
Housing Site Investigations | | | — | | | | 4,000 | | | | 3,500 | | | | — | | | | — | |
Barcaldine Renewable Energy Zone | | | — | | | | 3,500 | | | | 3,500 | | | | — | | | | — | |
Kenrick Park Masterplan Stage 1 | | | — | | | | 3,000 | | | | — | | | | — | | | | — | |
Regional Infrastructure Plans | | | — | | | | 2,100 | | | | 437 | | | | 536 | | | | 538 | |
Office of the Independent Assessor | | | — | | | | 1,702 | | | | 1,684 | | | | 1,744 | | | | 1,764 | |
Trinity Beach Community Activity Space | | | — | | | | 935 | | | | — | | | | — | | | | — | |
Currumbin Eco-Parkland | | | — | | | | 875 | | | | 882 | | | | 889 | | | | 550 | |
Torres Strait Ferry Funding Program | | | — | | | | 500 | | | | — | | | | — | | | | — | |
Cairns Shipyards Upgrades | | | — | | | | — | | | | — | | | | — | | | | — | |
Emergency Management Reforms—Queensland Reconstruction Authority | | | — | | | | — | | | | — | | | | — | | | | — | |
Resources Community Infrastructure Fund 2 | | | — | | | | — | | | | — | | | | — | | | | — | |
ShapingSEQ | | | — | | | | — | | | | — | | | | — | | | | — | |
Supporting Housing Diversity | | | — | | | | — | | | | — | | | | — | | | | — | |
| | | | | | | | | | | | | | | | | | | | |
Portfolio Total | | | 5,440 | | | | 171,841 | | | | 95,893 | | | | 78,089 | | | | 64,652 | |
| | | | | | | | | | | | | | | | | | | | |
Department of the Premier and Cabinet | | | | | | | | | | | | | | | | | | | | |
Brisbane 2032 Coordination Office | | | — | | | | 36,841 | | | | 19,104 | | | | 19,942 | | | | 24,373 | |
Screen Queensland—Production Attraction Strategy | | | — | | | | 28,000 | | | | — | | | | — | | | | — | |
Screen Queensland—Post, Digital and Visual Effects | | | — | | | | 8,000 | | | | — | | | | — | | | | — | |
Screen Queensland—Digital Games Program | | | — | | | | 2,000 | | | | — | | | | — | | | | — | |
Screen Queensland—Aboriginal and Torres Strait Islander Screen Program | | | — | | | | 500 | | | | — | | | | — | | | | — | |
Implementation of the Cabinet Proactive Release | | | — | | | | 2,338 | | | | 1,210 | | | | 1,248 | | | | 1,277 | |
All hazards disaster and crisis management capability | | | — | | | | 1,000 | | | | 1,000 | | | | 1,000 | | | | 1,000 | |
Demand for Legislative drafting, editing, and publishing services | | | — | | | | 886 | | | | 908 | | | | 937 | | | | 961 | |
Queensland Community Forum Program | | | — | | | | 451 | | | | 643 | | | | — | | | | — | |
Youth Justice Investment—Early intervention and prevention coordination in Mount Isa and Toowoomba | | | — | | | | 400 | | | | — | | | | — | | | | — | |
Office of the Governor | | | — | | | | 381 | | | | 369 | | | | 277 | | | | 284 | |
Policy Insights Analytical Capability | | | — | | | | 351 | | | | 358 | | | | 369 | | | | 378 | |
Queensland Remembers Grants Program | | | — | | | | 164 | | | | 171 | | | | 1,526 | | | | — | |
Youth Justice Investment—Independent Evaluation | | | — | | | | — | | | | — | | | | — | | | | — | |
| | | | | | | | | | | | | | | | | | | | |
Portfolio Total | | | — | | | | 81,312 | | | | 23,763 | | | | 25,299 | | | | 28,273 | |
| | | | | | | | | | | | | | | | | | | | |
Department of Tourism, Innovation and Sport | | | | | | | | | | | | | | | | | | | | |
Tourism Experience and Infrastructure Grants Program | | | — | | | | 20,000 | | | | — | | | | — | | | | — | |
Sport Infrastructure Program | | | — | | | | 10,000 | | | | — | | | | — | | | | — | |
Sport and Recreation Infrastructure | | | — | | | | 7,000 | | | | 1,000 | | | | — | | | | — | |
FairPlay | | | — | | | | 2,384 | | | | 2,384 | | | | — | | | | — | |
Women’s Economic Security: Female Founders | | | — | | | | 2,000 | | | | 3,000 | | | | — | | | | — | |
| | | | | | | | | | | | | | | | | | | | |
Portfolio Total | | | — | | | | 41,384 | | | | 6,384 | | | | — | | | | — | |
| | | | | | | | | | | | | | | | | | | | |
20
Budget Measures 2023-24
| | | | | | | | | | | | | | | | | | | | |
Expense measures since 2022–23 Budget Update | | 2022–23
$‘000 | | | 2023–24
$‘000 | | | 2024–25
$‘000 | | | 2025–26
$‘000 | | | 2026–27
$‘000 | |
Department of Transport and Main Roads | | | | | | | | | | | | | | | | | | | | |
Rail Transport Service Contract | | | — | | | | 132,217 | | | | 238,070 | | | | 226,471 | | | | 226,471 | |
Remote Community Freight Contracts | | | 650 | | | | 22,157 | | | | 17,516 | | | | 18,367 | | | | 19,252 | |
Camera Detected Offence Program | | | (1,500 | ) | | | 18,454 | | | | 23,066 | | | | 28,274 | | | | 27,726 | |
Translink Network Officers and Third-party Enforcement Program | | | 3,233 | | | | 13,735 | | | | 14,216 | | | | 14,571 | | | | 14,936 | |
Cyber Security Unit | | | — | | | | 12,265 | | | | 13,706 | | | | 15,645 | | | | 17,778 | |
Regional Urban Bus Service Contracts | | | — | | | | 11,695 | | | | 13,472 | | | | 16,097 | | | | 16,802 | |
Transport Infrastructure Development Scheme | | | — | | | | 5,950 | | | | — | | | | — | | | | — | |
Tell Us Once Operational Model | | | — | | | | 5,665 | | | | 5,996 | | | | 5,398 | | | | 5,514 | |
Zero Emission Bus Program Stage 1 | | | — | | | | 5,000 | | | | — | | | | — | | | | — | |
Long Distance Passenger Rail Program | | | 800 | | | | 3,400 | | | | 800 | | | | — | | | | — | |
Specialist School Transport—Replacement, Capacity and Growth Bus Fleet | | | — | | | | 3,336 | | | | 285 | | | | 294 | | | | 303 | |
Cyber Security Partnerships | | | — | | | | 3,322 | | | | 3,441 | | | | 3,549 | | | | 3,756 | |
Torres Strait Islands Marine Infrastructure Program | | | 500 | | | | 2,500 | | | | 2,500 | | | | 2,500 | | | | 2,500 | |
Translink Resourcing | | | — | | | | 1,330 | | | | 4,903 | | | | 3,861 | | | | 4,187 | |
Phillips Creek Bridge Replacement Project | | | — | | | | 1,180 | | | | 620 | | | | — | | | | — | |
Hull Identification Number Program | | | — | | | | 500 | | | | 500 | | | | — | | | | — | |
Cyber Security Supports | | | — | | | | — | | | | — | | | | — | | | | — | |
Disaster Contact Centre Service Response Capacity 2 | | | — | | | | — | | | | — | | | | 206 | | | | — | |
Driver Protection Barrier Retrofit Program 2 | | | — | | | | — | | | | 3,000 | | | | 3,000 | | | | 3,000 | |
Youngs Crossing Road | | | 15,000 | | | | — | | | | — | | | | — | | | | — | |
| | | | | | | | | | | | | | | | | | | | |
Portfolio Total | | | 18,683 | | | | 242,706 | | | | 342,091 | | | | 338,233 | | | | 342,225 | |
| | | | | | | | | | | | | | | | | | | | |
Department of Treaty, Aboriginal and Torres Strait Islander Partnerships, Communities and the Arts | | | | | | | | | | | | | |
Critical Emergency and Food Relief | | | — | | | | 4,251 | | | | — | | | | — | | | | — | |
Support for Vulnerable Queenslanders | | | — | | | | 1,205 | | | | 1,480 | | | | — | | | | — | |
Community Services Resourcing | | | — | | | | 700 | | | | — | | | | — | | | | — | |
Public Intoxication Program Enhancement | | | — | | | | 688 | | | | 1,375 | | | | — | | | | — | |
Asset Management Model and Maintenance Program | | | — | | | | 2,875 | | | | 2,875 | | | | — | | | | — | |
Storage for State Cultural Collections—Business Case and Short-Term Storage | | | — | | | | 2,036 | | | | 1,624 | | | | 1,694 | | | | — | |
Queensland Cultural Centre—Flood Resilience Program | | | — | | | | 2,000 | | | | — | | | | — | | | | — | |
Queensland Performing Arts Centre—Strategic Capability Enhancement | | | — | | | | 2,000 | | | | — | | | | — | | | | — | |
Queensland Museum—First Nations Repatriation Program | | | — | | | | 872 | | | | 894 | | | | 916 | | | | 939 | |
Queensland Music Network BIGSOUND conference | | | 610 | | | | 610 | | | | 610 | | | | 610 | | | | — | |
State Library of Queensland—Vision Australia and Braille House | | | — | | | | 600 | | | | — | | | | — | | | | — | |
Queensland Museum—Maintenance Program | | | — | | | | 335 | | | | — | | | | — | | | | — | |
Connect Queenslanders to Art—Digital Transformation Initiative | | | — | | | | 200 | | | | 220 | | | | 240 | | | | 260 | |
Cultural Tourism Programming Strategy—Exhibition Funding | | | — | | | | — | | | | — | | | | 2,175 | | | | 2,229 | |
Queensland Museum Network—World Science Festival | | | — | | | | — | | | | 3,000 | | | | 3,000 | | | | 3,000 | |
Aboriginal and Torres Strait Islander Cultural Initiatives | | | — | | | | 445 | | | | — | | | | — | | | | — | |
First Nations Economic Development | | | — | | | | 348 | | | | 355 | | | | 362 | | | | 367 | |
Youth Justice Investment—Stronger Communities Initiative: Early Action Groups | | | — | | | | 290 | | | | 551 | | | | — | | | | — | |
| | | | | | | | | | | | | | | | | | | | |
Portfolio Total | | | 610 | | | | 19,455 | | | | 12,984 | | | | 8,997 | | | | 6,795 | |
| | | | | | | | | | | | | | | | | | | | |
21
Budget Measures 2023-24
| | | | | | | | | | | | | | | | | | | | |
Expense measures since 2022–23 Budget Update | | 2022–23
$‘000 | | | 2023–24
$‘000 | | | 2024–25
$‘000 | | | 2025–26
$‘000 | | | 2026–27
$‘000 | |
Department of Youth Justice, Employment, Small Business and Training | | | | | | | | | | | | | | | | | | | | |
Youth Detention Centre Operations | | | 12,737 | | | | 20,222 | | | | 22,870 | | | | 25,007 | | | | 29,015 | |
Youth Detention Centre Capacity—Addressing Capacity Issues at Youth Detention Centres 2 | | | 36 | | | | 12,504 | | | | 979 | | | | — | | | | — | |
Youth Justice Investment—Youth Co-responder Teams | | | — | | | | 24,459 | | | | 25,219 | | | | 14,055 | | | | 14,402 | |
Youth Justice Investment—Intensive Case Management | | | — | | | | 10,690 | | | | 13,285 | | | | 3,010 | | | | 3,084 | |
Youth Justice Investment—Diversion | | | — | | | | 7,287 | | | | 7,333 | | | | 7,381 | | | | 7,416 | |
Youth Justice Investment—Intensive Bail Initiative | | | — | | | | 6,677 | | | | 8,054 | | | | 5,328 | | | | 5,338 | |
Youth Justice Investment—Empowering communities to develop local solutions to youth crime issues | | | — | | | | 2,500 | | | | 2,500 | | | | — | | | | — | |
Youth Justice Investment—On Country | | | — | | | | 2,080 | | | | 2,080 | | | | — | | | | — | |
Youth Justice Investment—Specialist Youth Crime Rapid Response Squad | | | 1,000 | | | | 2,000 | | | | 2,000 | | | | — | | | | — | |
Youth Justice Investment—The Street University Townsville | | | 782 | | | | 1,596 | | | | 1,846 | | | | — | | | | — | |
Youth Justice Investment—Townsville Community Youth Response: High Risk Youth Court | | | — | | | | 1,345 | | | | 1,345 | | | | — | | | | — | |
Youth Justice Investment—Stronger Communities Initiative: Early Action Groups | | | — | | | | 728 | | | | 1,030 | | | | — | | | | — | |
Youth Justice Investment—Fast-track Sentencing 2 | | | 223 | | | | 628 | | | | 109 | | | | — | | | | — | |
Youth Justice Investment—Townsville Stockland and other shopping precincts crime prevention program | | | — | | | | 350 | | | | 500 | | | | — | | | | — | |
Youth Justice Investment—Big Bounce Initiative | | | — | | | | — | | | | — | | | | — | | | | — | |
Vocational Education and Training Modernisation and Transformation Program | | | — | | | | 8,823 | | | | 15,942 | | | | 4,987 | | | | — | |
Queensland Workforce Strategy—Micro-Credentialing | | | 2,950 | | | | 2,950 | | | | — | | | | — | | | | — | |
Women’s Economic Security—Women in Trade Apprenticeships Mentoring Program | | | — | | | | 2,300 | | | | 2,300 | | | | — | | | | — | |
Queensland Workforce Strategy—Train and Retain | | | 1,133 | | | | 1,133 | | | | 1,134 | | | | — | | | | — | |
Australian Training Works Group | | | — | | | | — | | | | — | | | | — | | | | — | |
Queensland Workforce Strategy—Group Training Organisation Pre- Apprenticeships Program | | | 7,300 | | | | — | | | | — | | | | — | | | | — | |
Queensland Workforce Strategy—Workforce Connect Fund 2 | | | — | | | | — | | | | — | | | | — | | | | — | |
| | | | | | | | | | | | | | | | | | | | |
Portfolio Total | | | 26,161 | | | | 108,272 | | | | 108,526 | | | | 59,768 | | | | 59,255 | |
| | | | | | | | | | | | | | | | | | | | |
Legislative Assembly of Queensland | | | | | | | | | | | | | | | | | | | | |
Queensland Parliament Digital Transformation Program | | | — | | | | 268 | | | | 732 | | | | 751 | | | | 253 | |
| | | | | | | | | | | | | | | | | | | | |
Portfolio Total | | | — | | | | 268 | | | | 732 | | | | 751 | | | | 253 | |
| | | | | | | | | | | | | | | | | | | | |
Office of the Queensland Ombudsman | | | | | | | | | | | | | | | | | | | | |
Public Sector Culture and Integrity Reforms | | | — | | | | 763 | | | | 1,401 | | | | 1,418 | | | | 1,453 | |
| | | | | | | | | | | | | | | | | | | | |
Portfolio Total | | | — | | | | 763 | | | | 1,401 | | | | 1,418 | | | | 1,453 | |
| | | | | | | | | | | | | | | | | | | | |
Queensland Corrective Services | | | | | | | | | | | | | | | | | | | | |
Queensland Corrective Services additional prisoner growth funding | | | — | | | | 51,799 | | | | 1,628 | | | | — | | | | — | |
Parole Board Queensland | | | — | | | | 7,556 | | | | 15,909 | | | | — | | | | — | |
Southern Queensland Correctional Precinct—Stage 2—Commissioning and Maintenance 2 | | | (1,000 | ) | | | 4,255 | | | | 4,706 | | | | 1,524 | | | | 788 | |
Psychological and Disability Services | | | — | | | | 3,699 | | | | 3,515 | | | | 3,624 | | | | 3,731 | |
In-Cell Technology in Queensland Correctional Centres | | | — | | | | 2,000 | | | | — | | | | — | | | | — | |
Gangs Exit Program | | | — | | | | 543 | | | | — | | | | — | | | | — | |
22
Budget Measures 2023-24
| | | | | | | | | | | | | | | | | | | | |
Expense measures since 2022–23 Budget Update | | 2022–23
$‘000 | | | 2023–24
$‘000 | | | 2024–25
$‘000 | | | 2025–26
$‘000 | | | 2026–27
$‘000 | |
Prisoner Capacity and Health Services | | | — | | | | 358 | | | | 1,255 | | | | 1,596 | | | | 1,443 | |
Youth Justice Investment—Electronic Monitoring | | | — | | | | — | | | | — | | | | — | | | | — | |
| | | | | | | | | | | | | | | | | | | | |
Portfolio Total | | | (1,000 | ) | | | 70,210 | | | | 27,013 | | | | 6,744 | | | | 5,962 | |
| | | | | | | | | | | | | | | | | | | | |
Queensland Fire and Emergency Services | | | | | | | | | | | | | | | | | | | | |
Emergency Management Reform—State Emergency Service | | | — | | | | 18,304 | | | | — | | | | — | | | | — | |
Emergency Management Reform—Rural Fire Service | | | — | | | | 11,989 | | | | — | | | | — | | | | — | |
Supporting Our Fire Service Officers | | | 4,583 | | | | 4,894 | | | | 5,162 | | | | 5,291 | | | | 5,424 | |
Bushfire Safety Campaign | | | — | | | | 1,600 | | | | 600 | | | | 600 | | | | — | |
Camera Detected Offence Program | | | — | | | | 605 | | | | 628 | | | | 651 | | | | 674 | |
Fire Communications Staffing | | | — | | | | — | | | | — | | | | — | | | | — | |
Queensland’s Aerial Firefighting Capability (National Aerial Firefighting Centre Contracts) | | | — | | | | — | | | | — | | | | — | | | | — | |
| | | | | | | | | | | | | | | | | | | | |
Portfolio Total | | | 4,583 | | | | 37,392 | | | | 6,390 | | | | 6,542 | | | | 6,098 | |
| | | | | | | | | | | | | | | | | | | | |
Queensland Health | | | | | | | | | | | | | | | | | | | | |
Health Funding Uplift | | | 325,503 | | | | 508,707 | | | | 521,133 | | | | 572,869 | | | | 959,337 | |
Palliative and End of Life Care 2 | | | — | | | | 25,664 | | | | 37,974 | | | | 52,377 | | | | — | |
Forensic DNA Commission of Inquiry | | | 7,755 | | | | 17,520 | | | | 16,090 | | | | 10,345 | | | | 10,200 | |
Patient Travel Subsidy Scheme | | | — | | | | 14,179 | | | | 16,407 | | | | 18,679 | | | | 20,996 | |
Waterproof Artificial Limbs | | | — | | | | 2,327 | | | | 2,327 | | | | 2,327 | | | | 2,327 | |
Women’s Economic Security: Future Women—Jobs Academy | | | — | | | | 800 | | | | 1,600 | | | | 800 | | | | — | |
Women’s Economic Security: Women in Network Grants Program | | | — | | | | 625 | | | | 625 | | | | 825 | | | | 725 | |
Women’s Economic Security: Fresh Start for Me (transition from recovery to workforce) | | | — | | | | 533 | | | | — | | | | — | | | | — | |
Women’s Economic Security: Resourcing to support Office for Women initiatives | | | — | | | | 100 | | | | 100 | | | | — | | | | — | |
Youth Detention Centre Capacity—Addressing Capacity Issues at Youth Detention Centres | | | 386 | | | | 386 | | | | — | | | | — | | | | — | |
Youth Justice Investment—Fast-track Sentencing 2 | | | 52 | | | | 157 | | | | 41 | | | | — | | | | — | |
Domestic and Family Violence Services System Reform | | | — | | | | — | | | | — | | | | — | | | | — | |
Improvement to Salary Packaging and Fringe Benefits Tax (FBT) Policy for Hospital Employees | | | — | | | | — | | | | — | | | | — | | | | — | |
LifeFlight Australia Limited Emergency Helicopter Services New 10-year Service Agreement | | | 32,432 | | | | — | | | | — | | | | — | | | | — | |
Making Tracks Towards Achieving Health Equity With First Nations Peoples 2021-2025 | | | — | | | | — | | | | — | | | | — | | | | — | |
Nursing and Midwifery Student Regional Placements Allowance | | | — | | | | — | | | | — | | | | — | | | | — | |
Queensland Ambulance Service (QAS) Additional Ambulance Operatives | | | — | | | | — | | | | — | | | | — | | | | — | |
Rural and Regional Birthing Services | | | — | | | | — | | | | — | | | | — | | | | — | |
Transitional Support | | | 130,511 | | | | — | | | | — | | | | — | | | | — | |
Workforce Attraction Incentive Scheme | | | — | | | | — | | | | — | | | | — | | | | — | |
| | | | | | | | | | | | | | | | | | | | |
Portfolio Total | | | 496,639 | | | | 570,998 | | | | 596,297 | | | | 658,222 | | | | 993,585 | |
| | | | | | | | | | | | | | | | | | | | |
23
Budget Measures 2023-24
| | | | | | | | | | | | | | | | | | | | |
Expense measures since 2022–23 Budget Update | | 2022–23
$‘000 | | | 2023–24
$‘000 | | | 2024–25
$‘000 | | | 2025–26
$‘000 | | | 2026–27
$‘000 | |
Queensland Police Service | | | | | | | | | | | | | | | | | | | | |
Emergency Management Reforms—Marine Rescue Queensland | | | — | | | | 27,000 | | | | — | | | | — | | | | — | |
Emergency Management Reforms—Disaster Management | | | — | | | | 16,500 | | | | — | | | | — | | | | — | |
Emergency Management Reforms—Queensland Police Service Reform Implementation Taskforce | | | — | | | | — | | | | — | | | | — | | | | — | |
Youth Justice Investment—Program for Queensland Police-Citizens Youth Club (PCYC) Capital Works | | | — | | | | 25,000 | | | | 25,000 | | | | — | | | | — | |
Youth Justice Investment—Police Extreme High Visibility Patrols | | | 5,000 | | | | 10,000 | | | | 10,000 | | | | — | | | | — | |
Youth Justice Investment—Youth Co-responder Teams 2 | | | — | | | | 5,447 | | | | 5,529 | | | | 3,379 | | | | 3,459 | |
Youth Justice Investment—Police Online Engagement and Intelligence Team | | | 2,320 | | | | 5,040 | | | | 5,471 | | | | — | | | | — | |
Youth Justice Investment—Empowering communities to develop local solutions to youth crime issues | | | — | | | | 5,000 | | | | 5,000 | | | | — | | | | — | |
Youth Justice Investment—Specialist Youth Crime Rapid Response Squad | | | 2,321 | | | | 4,825 | | | | 5,352 | | | | — | | | | — | |
Youth Justice Investment—Queensland Police-Citizens Youth Club (PCYC) Restructure | | | — | | | | 3,985 | | | | — | | | | — | | | | — | |
Youth Justice Investment—Bail Monitoring | | | — | | | | 3,417 | | | | 3,661 | | | | — | | | | — | |
Youth Justice Investment—Police Liaison Officer High Visibility Proactive Patrols | | | 1,000 | | | | 2,500 | | | | 2,630 | | | | — | | | | — | |
Youth Justice Investment—Fast-track Sentencing 2 | | | 45 | | | | 1,120 | | | | 650 | | | | 24 | | | | — | |
Youth Justice Investment—Youth Development Partnership Fund: Cairns Safer Streets and Midnight Basketball Program | | | 375 | | | | 750 | | | | 375 | | | | — | | | | — | |
Youth Justice Investment—Youth Crime Taskforce | | | 237 | | | | 489 | | | | 507 | | | | — | | | | — | |
Youth Justice Investment—Townsville Community Youth Response: High Risk Youth Court | | | — | | | | 374 | | | | 386 | | | | — | | | | — | |
Youth Justice Investment—Stronger Communities Initiative: Early Action Groups | | | 76 | | | | 330 | | | | 337 | | | | — | | | | — | |
Youth Justice Investment—Police Blitz on Bail | | | — | | | | 80 | | | | 83 | | | | — | | | | — | |
Youth Justice Investment—Vehicle Immobiliser Trial | | | — | | | | — | | | | — | | | | — | | | | — | |
Relocation of the Oxley Police Academy to Wacol | | | — | | | | 1,000 | | | | — | | | | — | | | | — | |
Brisbane 2032 Olympic and Paralympic Games | | | — | | | | 745 | | | | 1,207 | | | | 2,016 | | | | 3,498 | |
Gangs Exit Program | | | — | | | | 623 | | | | — | | | | — | | | | — | |
Armoured Vehicle Fleet | | | — | | | | 370 | | | | 568 | | | | 568 | | | | 568 | |
Camera Detected Offence Program | | | — | | | | 285 | | | | 577 | | | | 921 | | | | — | |
Budget Modernisation Program | | | — | | | | — | | | | — | | | | — | | | | — | |
Domestic and Family Violence Commission of Inquiry | | | — | | | | — | | | | — | | | | — | | | | — | |
Recruitment Drive—Additional Police Personnel | | | — | | | | — | | | | — | | | | — | | | | — | |
Youth Detention Centre Capacity—Addressing Capacity Issues at Youth Detention Centres | | | — | | | | — | | | | — | | | | — | | | | — | |
| | | | | | | | | | | | | | | | | | | | |
Portfolio Total | | | 11,374 | | | | 114,880 | | | | 67,333 | | | | 6,908 | | | | 7,525 | |
| | | | | | | | | | | | | | | | | | | | |
Queensland Treasury | | | | | | | | | | | | | | | | | | | | |
Gympie Road Bypass—funding to investigate the construction of road tunnels between Kedron and Carseldine | | | — | | | | 35,000 | | | | — | | | | — | | | | — | |
Financial Reporting and Management Enhanced Systems | | | — | | | | 16,800 | | | | 20,100 | | | | 11,900 | | | | 4,500 | |
Camera Detected Offence Program | | | — | | | | 6,737 | | | | 8,124 | | | | 9,110 | | | | 10,169 | |
Low Emissions Investment Partnerships Program | | | — | | | | 5,000 | | | | 5,000 | | | | 5,000 | | | | 5,000 | |
Debt Recovery and Compliance Program | | | (4,579 | ) | | | 4,579 | | | | 15,983 | | | | 16,472 | | | | 16,917 | |
Queensland Revenue Office Increased Compliance Work | | | — | | | | 3,049 | | | | 6,080 | | | | 7,571 | | | | 7,744 | |
Regional Resources Development Fund—additional operational funding | | | — | | | | 1,500 | | | | 750 | | | | 750 | | | | — | |
24
Budget Measures 2023-24
| | | | | | | | | | | | | | | | | | | | |
Expense measures since 2022–23 Budget Update | | 2022–23
$‘000 | | | 2023–24
$‘000 | | | 2024–25
$‘000 | | | 2025–26
$‘000 | | | 2026–27
$‘000 | |
Queensland Workforce Strategy—Skilled Workforce Attraction Office | | | — | | | | 1,100 | | | | 1,100 | | | | 1,100 | | | | 1,100 | |
Borumba Dam Pumped Hydro | | | — | | | | 1,000 | | | | — | | | | — | | | | — | |
Land tax—unilateral application of the home exemption | | | — | | | | 1,000 | | | | — | | | | — | | | | — | |
Fine Modernisation Program Foundation Phase | | | — | | | | — | | | | — | | | | — | | | | — | |
| | | | | | | | | | | | | | | | | | | | |
Portfolio Total | | | (4,579 | ) | | | 75,765 | | | | 57,137 | | | | 51,903 | | | | 45,430 | |
| | | | | | | | | | | | | | | | | | | | |
Total decisions made but not yet announced | | | 33,070 | | | | 18,000 | | | | 6,500 | | | | 6,000 | | | | 6,000 | |
| | | | | |
Total impact on Expense since 2022—23 Budget Update | | | 774,831 | | | | 3,438,109 | | | | 1,912,609 | | | | 1,716,427 | | | | 2,116,020 | |
| | | | | |
Total impact on Expense since the 2022—23 Budget | | | 841,416 | | | | 3,801,368 | | | | 2,126,727 | | | | 1,883,018 | | | | 2,262,208 | |
| 1. | Further funding for this measure can be found in the Post Budget Update section of this table. |
| 2. | Further funding for this measure can be found in the up to and including Budget Update section of this table. |
25
Budget Measures 2023-24
| Table 1.4: | Capital measures since the 2022-23 Budget |
| | | | | | | | | | | | | | | | | | | | |
Capital measures up to and including 2022–23 Budget Update | | 2022–23
$‘000 | | | 2023–24
$‘000 | | | 2024–25
$‘000 | | | 2025–26
$‘000 | | | 2026–27
$‘000 | |
Department of Environment and Science | | | | | | | | | | | | | | | | | | | | |
Revitalising National Parks | | | — | | | | 7,500 | | | | 10,000 | | | | 10,000 | | | | 10,000 | |
| | | | | | | | | | | | | | | | | | | | |
Portfolio Total | | | — | | | | 7,500 | | | | 10,000 | | | | 10,000 | | | | 10,000 | |
| | | | | | | | | | | | | | | | | | | | |
Department of Justice and Attorney-General | | | | | | | | | | | | | | | | | |
Hear her voice—Report 2—Treatment of victim-survivors in trials for sexual offences | | | — | | | | 4,387 | | | | 4,387 | | | | 3,987 | | | | — | |
| | | | | | | | | | | | | | | | | | | | |
Portfolio Total | | | — | | | | 4,387 | | | | 4,387 | | | | 3,987 | | | | — | |
| | | | | | | | | | | | | | | | | | | | |
Department of State Development, Infrastructure, Local Government and Planning | | | | | | | | | | | | | | | | | | | | |
Catalyst Infrastructure Fund | | | — | | | | — | | | | — | | | | — | | | | — | |
| | | | | | | | | | | | | | | | | | | | |
Portfolio Total | | | — | | | | — | | | | — | | | | — | | | | — | |
| | | | | | | | | | | | | | | | | | | | |
Legislative Assembly of Queensland | | | | | | | | | | | | | | | | | | | | |
Annexe Critical Infrastructure and Services Upgrade | | | 18,092 | | | | — | | | | — | | | | — | | | | — | |
| | | | | | | | | | | | | | | | | | | | |
Portfolio Total | | | 18,092 | | | | — | | | | — | | | | — | | | | — | |
| | | | | | | | | | | | | | | | | | | | |
Queensland Corrective Services | | | | | | | | | | | | | | | | | | | | |
Southern Queensland Correctional Precinct—Stage 2—Commissioning | | | — | | | | 2,990 | | | | 2,400 | | | | — | | | | — | |
Hear her voice—Report 2—Sentencing women and girls | | | — | | | | — | | | | — | | | | — | | | | — | |
Hear her voice—Report 2—Treatment in custody, complaints mechanisms and oversight | | | — | | | | — | | | | — | | | | — | | | | — | |
| | | | | | | | | | | | | | | | | | | | |
Portfolio Total | | | — | | | | 2,990 | | | | 2,400 | | | | — | | | | — | |
| | | | | | | | | | | | | | | | | | | | |
Queensland Police Service | | | | | | | | | | | | | | | | | | | | |
Youth Justice Investment—Youth Co-responder Teams 1 | | | — | | | | 168 | | | | — | | | | — | | | | — | |
| | | | | | | | | | | | | | | | | | | | |
Portfolio Total | | | — | | | | 168 | | | | — | | | | — | | | | — | |
| | | | | | | | | | | | | | | | | | | | |
Queensland Treasury | | | | | | | | | | | | | | | | | | | | |
Queensland Critical Minerals and Battery Technology Fund | | | — | | | | 100,000 | | | | — | | | | — | | | | — | |
Queensland Resources Common User Facility | | | 1,542 | | | | 43,950 | | | | 15,250 | | | | — | | | | — | |
| | | | | | | | | | | | | | | | | | | | |
Portfolio Total | | | 1,542 | | | | 143,950 | | | | 15,250 | | | | — | | | | — | |
| | | | | | | | | | | | | | | | | | | | |
Total impact on Capital up to and including 2022-23 Budget Update | | | 19,634 | | | | 158,995 | | | | 32,037 | | | | 13,987 | | | | 10,000 | |
26
Budget Measures 2023-24
| | | | | | | | | | | | | | | | | | | | |
Capital measures since 2022–23 Budget Update | | 2022–23
$‘000 | | | 2023–24
$‘000 | | | 2024–25
$‘000 | | | 2025–26
$‘000 | | | 2026–27
$‘000 | |
Department of Agriculture and Fisheries | | | | | | | | | | | | | | | | | | | | |
Relocation of the Racing Science Centre | | | — | | | | 20,000 | | | | — | | | | — | | | | — | |
| | | | | | | | | | | | | | | | | �� | | | |
Portfolio Total | | | — | | | | 20,000 | | | | — | | | | — | | | | — | |
| | | | | | | | | | | | | | | | | | | | |
Department of Education | | | | | | | | | | | | | | | | | |
School Infrastructure and Land Acquisitions | | | — | | | | 195,102 | | | | 470,280 | | | | 333,377 | | | | 117,376 | |
Teacher Housing | | | — | | | | 10,780 | | | | 11,451 | | | | 12,165 | | | | 12,922 | |
Addressing Market Pressures | | | — | | | | — | | | | 89,744 | | | | 89,744 | | | | 89,744 | |
School Infrastructure—Renewal | | | — | | | | — | | | | — | | | | — | | | | — | |
| | | | | | | | | | | | | | | | | | | | |
Portfolio Total | | | — | | | | 205,882 | | | | 571,475 | | | | 435,286 | | | | 220,042 | |
| | | | | | | | | | | | | | | | | | | | |
Department of Energy and Public Works | | | | | | | | | | | | | | | | | | | | |
Government Buildings Electrical Vehicle Ready | | | 2,000 | | | | 12,500 | | | | 12,500 | | | | 3,000 | | | | — | |
ReBuild QBuild Capital | | | 3,291 | | | | 9,498 | | | | 8,415 | | | | 8,250 | | | | — | |
Government Employee Housing Expansion—Capital | | | — | | | | — | | | | 153,351 | | | | 139,161 | | | | — | |
| | | | | | | | | | | | | | | | | | | | |
Portfolio Total | | | 5,291 | | | | 21,998 | | | | 174,266 | | | | 150,411 | | | | — | |
| | | | | | | | | | | | | | | | | | | | |
Department of Environment and Science | | | | | | | | | | | | | | | | | | | | |
Partnering with Quandamooka on Land and Sea Country | | | — | | | | 1,500 | | | | 4,300 | | | | 9,000 | | | | — | |
World-Class Protected Area Management | | | — | | | | 1,100 | | | | 3,350 | | | | 1,350 | | | | — | |
| | | | | | | | | | | | | | | | | | | | |
Portfolio Total | | | — | | | | 2,600 | | | | 7,650 | | | | 10,350 | | | | — | |
| | | | | | | | | | | | | | | | | | | | |
Department of Housing | | | | | | | | | | | | | | | | | | | | |
Queensland Housing Strategy 2017-2027—Supply of Social Housing | | | 120,000 | | | | 201,600 | | | | 194,834 | | | | 130,833 | | | | 130,833 | |
Emergency Accommodation | | | 5,300 | | | | 44,480 | | | | — | | | | — | | | | — | |
Additional Social Housing Supply | | | — | | | | 35,896 | | | | 123,606 | | | | 90,531 | | | | 11,739 | |
Purchase of New Social Housing | | | — | | | | — | | | | — | | | | — | | | | — | |
| | | | | | | | | | | | | | | | | | | | |
Portfolio Total | | | 125,300 | | | | 281,976 | | | | 318,440 | | | | 221,364 | | | | 142,572 | |
| | | | | | | | | | | | | | | | | | | | |
Department of Justice and Attorney-General | | | | | | | | | | | | | | | | | | | | |
Queensland Human Rights Commission—Complaints Management System | | | — | | | | 350 | | | | — | | | | — | | | | — | |
| | | | | | | | | | | | | | | | | | | | |
Portfolio Total | | | — | | | | 350 | | | | — | | | | — | | | | — | |
| | | | | | | | | | | | | | | | | | | | |
Department of Resources | | | | | | | | | | | | | | | | | | | | |
Abandoned Mine Sites Program | | | — | | | | 500 | | | | — | | | | — | | | | — | |
| | | | | | | | | | | | | | | | | | | | |
Portfolio Total | | | — | | | | 500 | | | | — | | | | — | | | | — | |
| | | | | | | | | | | | | | | | | | | | |
Department of State Development, Infrastructure, Local Government and Planning | | | | | | | | | | | | | | | | | |
Currumbin Eco-Parkland | | | — | | | | 8,000 | | | | 8,000 | | | | 8,000 | | | | — | |
Yeronga Community Centre | | | — | | | | 2,642 | | | | — | | | | — | | | | — | |
Brisbane Athlete Village | | | — | | | | — | | | | 33,300 | | | | 33,300 | | | | 33,300 | |
Gladstone Land Acquisition Strategy | | | — | | | | — | | | | — | | | | — | | | | — | |
Townsville Concert Hall | | | — | | | | — | | | | — | | | | — | | | | — | |
| | | | | | | | | | | | | | | | | | | | |
Portfolio Total | | | — | | | | 10,642 | | | | 41,300 | | | | 41,300 | | | | 33,300 | |
| | | | | | | | | | | | | | | | | | | | |
27
Budget Measures 2023-24
| | | | | | | | | | | | | | | | | | | | |
Capital measures since 2022–23 Budget Update | | 2022–3
$‘000 | | | 2023–24
$‘000 | | | 2024–25
$‘000 | | | 2025–26
$‘000 | | | 2026–27
$‘000 | |
Department of Tourism, Innovation and Sport | | | | | | | | | | | | | | | | | | | | |
2032 High Performance Strategy | | | — | | | | 75 | | | | 75 | | | | 75 | | | | 75 | |
| | | | | | | | | | | | | | | | | | | | |
Portfolio Total | | | — | | | | 75 | | | | 75 | | | | 75 | | | | 75 | |
| | | | | | | | | | | | | | | | | | | | |
Department of Transport and Main Roads | | | | | | | | | | | | | | | | | | | | |
New Gold Coast Stations | | | 9,300 | | | | 66,600 | | | | 68,200 | | | | 19,700 | | | | — | |
Camera Detected Offence Program | | | — | | | | 13,500 | | | | 105,260 | | | | 140,170 | | | | 144,900 | |
Cleveland-Redland Bay Road Upgrade | | | — | | | | 7,000 | | | | 23,000 | | | | 29,000 | | | | 21,000 | |
Torres Strait Islands Marine Infrastructure Program | | | — | | | | 1,000 | | | | 5,500 | | | | 7,500 | | | | 7,500 | |
Access to Gladstone Port Project | | | — | | | | 400 | | | | 1,000 | | | | 4,000 | | | | 19,600 | |
Kurrimine Beach Boat Ramp | | | — | | | | — | | | | — | | | | — | | | | — | |
| | | | | | | | | | | | | | | | | | | | |
Portfolio Total | | | 9,300 | | | | 88,500 | | | | 202,960 | | | | 200,370 | | | | 193,000 | |
| | | | | | | | | | | | | | | | | | | | |
Department of Treaty, Aboriginal and Torres Strait Islander Partnerships, Communities and the Arts | | | | | | | | | | | | | |
Queensland Performing Arts Centre—Capital Upgrades | | | — | | | | 5,940 | | | | — | | | | — | | | | — | |
Queensland Performing Arts Centre—Flexible Performance Space | | | — | | | | 2,000 | | | | 12,600 | | | | — | | | | — | |
Queensland Cultural Centre—Security Upgrades | | | — | | | | 500 | | | | — | | | | — | | | | — | |
Public Intoxication Program Enhancement | | | — | | | | 1,000 | | | | 3,000 | | | | — | | | | — | |
| | | | | | | | | | | | | | | | | | | | |
Portfolio Total | | | — | | | | 9,440 | | | | 15,600 | | | | — | | | | — | |
| | | | | | | | | | | | | | | | | | | | |
Department of Youth Justice, Employment, Small Business and Training | | | | | | | | | | | | | | | | | | | | |
Great Barrier Reef International Marine College | | | — | | | | 8,000 | | | | 8,000 | | | | — | | | | — | |
Youth Detention Centre Operations | | | — | | | | 2,000 | | | | 3,500 | | | | 3,500 | | | | 3,500 | |
Youth Detention Centre Capacity—Addressing Capacity Issues at Youth Detention Centres | | | — | | | | — | | | | — | | | | — | | | | — | |
| | | | | | | | | | | | | | | | | | | | |
Portfolio Total | | | — | | | | 10,000 | | | | 11,500 | | | | 3,500 | | | | 3,500 | |
| | | | | | | | | | | | | | | | | | | | |
Legislative Assembly of Queensland | | | | | | | | | | | | | | | | | | | | |
Queensland Parliament Digital Transformation Program | | | — | | | | 465 | | | | 626 | | | | — | | | | — | |
| | | | | | | | | | | | | | | | | | | | |
Portfolio Total | | | — | | | | 465 | | | | 626 | | | | — | | | | — | |
| | | | | | | | | | | | | | | | | | | | |
Queensland Corrective Services | | | | | | | | | | | | | | | | | | | | |
Prisoner Capacity and Health Services | | | — | | | | 33,465 | | | | 19,245 | | | | 8,504 | | | | 857 | |
Infrastructure—Safety and Security | | | — | | | | 15,000 | | | | — | | | | — | | | | — | |
| | | | | | | | | | | | | | | | | | | | |
Portfolio Total | | | — | | | | 48,465 | | | | 19,245 | | | | 8,504 | | | | 857 | |
| | | | | | | | | | | | | | | | | | | | |
Queensland Fire and Emergency Services | | | | | | | | | | | | | | | | | | | | |
Emergency Management Reform—Rural Fire Service | | | — | | | | 8,000 | | | | — | | | | — | | | | — | |
Emergency Management Reform—State Emergency Service | | | — | | | | 3,000 | | | | — | | | | — | | | | — | |
| | | | | | | | | | | | | | | | | | | | |
Portfolio Total | | | — | | | | 11,000 | | | | — | | | | — | | | | — | |
| | | | | | | | | | | | | | | | | | | | |
28
Budget Measures 2023-24
| | | | | | | | | | | | | | | | | | | | |
Capital measures since 2022–23 Budget Update | | 2022–23
$‘000 | | | 2023–24
$‘000 | | | 2024–25
$‘000 | | | 2025–26
$‘000 | | | 2026–27
$‘000 | |
Queensland Health | | | | | | | | | | | | | | | | | | | | |
Base Capital Program | | | — | | | | 60,000 | | | | — | | | | — | | | | — | |
Queensland Ambulance Service (QAS) New Ambulances | | | — | | | | 10,770 | | | | — | | | | — | | | | — | |
Redland Hospital Expansion- Mental Health Facility | | | — | | | | 8,000 | | | | 1,800 | | | | 60,000 | | | | 80,200 | |
Queensland Health Spinal Unit | | | — | | | | 5,000 | | | | — | | | | — | | | | — | |
| | | | | | | | | | | | | | | | | | | | |
Portfolio Total | | | — | | | | 83,770 | | | | 1,800 | | | | 60,000 | | | | 80,200 | |
| | | | | | | | | | | | | | | | | | | | |
Queensland Police Service | | | | | | | | | | | | | | | | | | | | |
Enhanced Capital Program | | | 700 | | | | 4,400 | | | | 18,100 | | | | 25,250 | | | | 22,300 | |
Camera Detected Offence Program | | | — | | | | 3,667 | | | | 2,925 | | | | 3,143 | | | | — | |
Armoured Vehicle Fleet | | | — | | | | 2,195 | | | | 1,980 | | | | — | | | | — | |
Youth Justice Investment—Youth Co-responder Teams 2 | | | — | | | | 42 | | | | — | | | | — | | | | — | |
Youth Justice Investment—Youth Crime Taskforce | | | — | | | | 42 | | | | — | | | | — | | | | — | |
Gangs Exit Program | | | — | | | | 37 | | | | — | | | | — | | | | — | |
North Queensland Police Academy | | | — | | | | — | | | | — | | | | — | | | | — | |
Relocation of the Oxley Police Academy to Wacol | | | — | | | | — | | | | — | | | | — | | | | — | |
Youth Detention Centre Capacity—Addressing Capacity Issues at Youth Detention Centres | | | — | | | | — | | | | — | | | | — | | | | — | |
Youth Justice Investment—Police Liaison Officer High Visibility Proactive Patrols | | | 2,500 | | | | — | | | | — | | | | — | | | | — | |
Youth Justice Investment—Stronger Communities Initiative: Early Action Groups | | | 126 | | | | — | | | | — | | | | — | | | | — | |
| | | | | | | | | | | | | | | | | | | | |
Portfolio Total | | | 3,326 | | | | 10,383 | | | | 23,005 | | | | 28,393 | | | | 22,300 | |
| | | | | | | | | | | | | | | | | | | | |
Total decisions made but not yet announced | | | 24,396 | | | | 1,500 | | | | 1,504 | | | | — | | | | — | |
| | | | | |
Total impact on Capital since 2022-23 Budget Update | | | 167,613 | | | | 807,546 | | | | 1,389,446 | | | | 1,159,553 | | | | 695,846 | |
| | | | | |
Total impact on Capital since the 2022-23 Budget | | | 187,247 | | | | 966,541 | | | | 1,421,483 | | | | 1,173,540 | | | | 705,846 | |
| 1. | Further funding for this measure can be found in the Post Budget Update section of this table. |
| 2. | Further funding for this measure can be found in the up to and including Budget Update section of this table. |
29
Budget Measures 2023-24
| Table 1.5: | Revenue measures since the 2022-23 Budget |
| | | | | | | | | | | | | | | | | | | | |
Revenue measures up to and including 2022–23 Budget Update | | 2022–23
$‘000 | | | 2023–24
$‘000 | | | 2024–25
$‘000 | | | 2025–26
$‘000 | | | 2026–27
$‘000 | |
Department of Transport and Main Roads | | | | | | | | | | | | | | | | | | | | |
Reducing Learner Licence Fees | | | (2,975 | ) | | | (9,376 | ) | | | (9,850 | ) | | | (10,349 | ) | | | (10,873 | ) |
| | | | | | | | | | | | | | | | | | | | |
Portfolio Total | | | (2,975 | ) | | | (9,376 | ) | | | (9,850 | ) | | | (10,349 | ) | | | (10,873 | ) |
| | | | | | | | | | | | | | | | | | | | |
Queensland Treasury | | | | | | | | | | | | | | | | | | | | |
Debt Recovery and Compliance Program 1 | | | — | | | | — | | | | — | | | | — | | | | — | |
| | | | | | | | | | | | | | | | | | | | |
Portfolio Total | | | — | | | | — | | | | — | | | | — | | | | — | |
| | | | | | | | | | | | | | | | | | | | |
Total impact on Revenue up to and including 2022-23 Budget Update | | | (2,975 | ) | | | (9,376 | ) | | | (9,850 | ) | | | (10,349 | ) | | | (10,873 | ) |
30
Budget Measures 2023-24
| | | | | | | | | | | | | | | | | | | | |
Revenue measures since 2022–23 Budget Update | | 2022–23
$‘000 | | | 2023–24
$‘000 | | | 2024–25
$‘000 | | | 2025–26
$‘000 | | | 2026–27
$‘000 | |
Department of Agriculture and Fisheries | | | | | | | | | | | | | | | | | | | | |
Horticulture Food Safety Schemes | | | — | | | | 303 | | | | 622 | | | | 1,062 | | | | 1,089 | |
Exhibited Animals | | | — | | | | 78 | | | | 161 | | | | 165 | | | | 173 | |
| | | | | | | | | | | | | | | | | | | | |
Portfolio Total | | | — | | | | 381 | | | | 783 | | | | 1,227 | | | | 1,262 | |
| | | | | | | | | | | | | | | | | | | | |
Department of Education | | | | | | | | | | | | | | | | | | | | |
Homestay Program Fees for International Students | | | — | | | | 101 | | | | 261 | | | | 265 | | | | 272 | |
| | | | | | | | | | | | | | | | | | | | |
Portfolio Total | | | — | | | | 101 | | | | 261 | | | | 265 | | | | 272 | |
| | | | | | | | | | | | | | | | | | | | |
Department of Justice and Attorney-General | | | | | | | | | | | | | | | | | | | | |
Civil Partnerships—Revision of Prescribed Fees | | | — | | | | 486 | | | | 498 | | | | 512 | | | | 524 | |
Justice Services Fees and Charges | | | — | | | | — | | | | — | | | | — | | | | — | |
| | | | | | | | | | | | | | | | | | | | |
Portfolio Total | | | — | | | | 486 | | | | 498 | | | | 512 | | | | 524 | |
| | | | | | | | | | | | | | | | | | | | |
Department of Regional Development, Manufacturing and Water | | | | | | | | | | | | | | | | | | | | |
Drought Assistance and Reform Package | | | — | | | | — | | | | — | | | | — | | | | — | |
| | | | | | | | | | | | | | | | | | | | |
Portfolio Total | | | — | | | | — | | | | — | | | | — | | | | — | |
| | | | | | | | | | | | | | | | | | | | |
Department of Resources | | | | | | | | | | | | | | | | | | | | |
Drought Assistance and Reform Package | | | — | | | | — | | | | — | | | | — | | | | — | |
| | | | | | | | | | | | | | | | | | | | |
Portfolio Total | | | — | | | | — | | | | — | | | | — | | | | — | |
| | | | | | | | | | | | | | | | | | | | |
Department of Transport and Main Roads | | | | | | | | | | | | | | | | | | | | |
Secure Taxi Rank Program Review | | | — | | | | (1,207 | ) | | | (1,214 | ) | | | (1,222 | ) | | | (1,222 | ) |
Replacement Smartcard Product Fee Changes | | | — | | | | (5,292 | ) | | | (5,604 | ) | | | (5,915 | ) | | | (6,240 | ) |
| | | | | | | | | | | | | | | | | | | | |
Portfolio Total | | | — | | | | (6,499 | ) | | | (6,818 | ) | | | (7,137 | ) | | | (7,462 | ) |
| | | | | | | | | | | | | | | | | | | | |
Queensland Fire and Emergency Services | | | | | | | | | | | | | | | | | | | | |
Reduction in Alarm Monitoring Fees | | | — | | | | (3,893 | ) | | | (3,990 | ) | | | (4,089 | ) | | | (4,191 | ) |
| | | | | | | | | | | | | | | | | | | | |
Portfolio Total | | | — | | | | (3,893 | ) | | | (3,990 | ) | | | (4,089 | ) | | | (4,191 | ) |
| | | | | | | | | | | | | | | | | | | | |
Queensland Treasury | | | | | | | | | | | | | | | | | | | | |
Queensland Revenue Office Increased Compliance Work | | | — | | | | 18,000 | | | | 44,100 | | | | 74,250 | | | | 88,425 | |
Debt Recovery and Compliance Program 2 | | | — | | | | — | | | | 128,400 | | | | 128,400 | | | | 128,400 | |
Build to Rent Tax concession | | | — | | | | (1,500 | ) | | | (3,000 | ) | | | (5,000 | ) | | | (6,000 | ) |
50 per cent Payroll Tax Rebate for Apprentices and Trainees | | | — | | | | (48,600 | ) | | | — | | | | — | | | | — | |
General practitioner payroll tax amnesty | | | (100,000 | ) | | | (100,000 | ) | | | (100,000 | ) | | | — | | | | — | |
Regional Payroll Tax Discount | | | — | | | | (116,100 | ) | | | (122,800 | ) | | | (129,600 | ) | | | (136,900 | ) |
| | | | | | | | | | | | | | | | | | | | |
Portfolio Total | | | (100,000 | ) | | | (248,200 | ) | | | (53,300 | ) | | | 68,050 | | | | 73,925 | |
| | | | | | | | | | | | | | | | | | | | |
31
Budget Measures 2023-24
| | | | | | | | | | | | | | | | | | | | |
Revenue measures since 2022–23 Budget Update | | 2022–23
$‘000 | | | 2023–24
$‘000 | | | 2024–25
$‘000 | | | 2025–26
$‘000 | | | 2026–27
$‘000 | |
Total decisions made but not yet announced | | | — | | | | 453 | | | | 2,603 | | | | 3,090 | | | | 3,164 | |
| | | | | |
Total impact on Revenue since 2022-23 Budget Update | | | (100,000 | ) | | | (257,171 | ) | | | (59,963 | ) | | | 61,918 | | | | 67,494 | |
| | | | | |
Total impact on Revenue since the 2022-23 Budget | | | (102,975 | ) | | | (266,547 | ) | | | (69,813 | ) | | | 51,569 | | | | 56,621 | |
| 1. | Further funding for this measure can be found in the Post Budget Update section of this table. |
| 2. | Further funding for this measure can be found in the up to and including Budget Update section of this table. |
32
Budget Measures 2023-24
Introduction
The following tables present the relevant portfolio expense measures relating to decisions taken since the 2022-23 Budget. This does not represent the full amount of additional funding provided to agencies since the 2022-23 Budget. For further explanation, refer to Explanation of Scope and Terms in Chapter 1.
33
Budget Measures 2023-24
Department of Agriculture and Fisheries
| | | | | | | | | | | | | | | | | | | | |
| | | 2022-23
$‘000 | | | 2023-24
$‘000 | | | 2024-25
$‘000 | | | 2025-26
$‘000 | | | 2026-27
$‘000 | |
Continuation of Fisheries Reform | | | (2,000 | ) | | | 7,465 | | | | 6,223 | | | | — | | | | — | |
The government is providing increased funding of $11.7 million over 3 years to continue the fisheries reform process which includes upgrades to the compliance system and fish aggregating devices.
| | | | | | | | | | | | | | | | | | | | |
| | | 2022-23
$‘000 | | | 2023-24
$‘000 | | | 2024-25
$‘000 | | | 2025-26
$‘000 | | | 2026-27
$‘000 | |
Queensland’s Obligations under the National Biosecurity System | | | 7,668 | | | | 7,000 | | | | — | | | | — | | | | — | |
The government is providing increased funding of $14.7 million over 2 years to meet immediate and known obligations within the National Biosecurity System.
The government will also provide increased funding of up to $7 million per annum ongoing, held centrally, towards future obligations to help mitigate the risks and impacts of significant pests and diseases.
Total government funding for this measure is up to $35.7 million over 5 years and $7 million per annum ongoing.
| | | | | | | | | | | | | | | | | | | | |
| | | 2022-23
$‘000 | | | 2023-24
$‘000 | | | 2024-25
$‘000 | | | 2025-26
$‘000 | | | 2026-27
$‘000 | |
Biosecurity Preparedness and Capability Uplift | | | 804 | | | | 6,957 | | | | 7,307 | | | | 3,919 | | | | 2,730 | |
The government is providing additional funding of $21.7 million over 5 years and $2.8 million per annum ongoing towards biosecurity preparedness for plant pests and diseases. This shifts Biosecurity Queensland’s posture to proactively meet emerging threats and empower the collective responsibility of the community and industry.
34
Budget Measures 2023-24
| | | | | | | | | | | | | | | | | | | | |
| | | 2022-23
$‘000 | | | 2023-24
$‘000 | | | 2024-25
$‘000 | | | 2025-26
$‘000 | | | 2026-27
$‘000 | |
Biosecurity Preparedness Package | | | 8,060 | | | | 4,977 | | | | 4,056 | | | | 2,398 | | | | 2,497 | |
The government is providing additional funding of $22 million over 5 years and $2.5 million per annum ongoing to address increasing animal biosecurity risks, including foot-and-mouth disease and lumpy skin disease.
The government has also provided additional funding of $4.7 million in 2022-23, to introduce an individual electronic identification traceability system for sheep and goats in Queensland, as part of a national initiative. This funding is held centrally, until the Australian Government’s contribution has been documented.
This forms part of the government’s total funding of $26.7 million over 5 years and $2.5 million per annum ongoing towards biosecurity preparedness for emergency animal diseases.
| | | | | | | | | | | | | | | | | | | | |
| | | 2022-23 | | | 2023-24 | | | 2024-25 | | | 2025-26 | | | 2026-27 | |
| | | $‘000 | | | $‘000 | | | $‘000 | | | $‘000 | | | $‘000 | |
Rural Economic Development Grants Program | | | — | | | | 3,300 | | | | — | | | | — | | | | — | |
The government is providing increased funding of $3.3 million in 2023-24 to increase employment and agribusiness development in regional Queensland.
| | | | | | | | | | | | | | | | | | | | |
| | | 2022-23
$‘000 | | | 2023-24
$‘000 | | | 2024-25
$‘000 | | | 2025-26
$‘000 | | | 2026-27
$‘000 | |
Innovative Emergency Animal Disease Response Preparedness Tools | | | — | | | | 1,764 | | | | — | | | | — | | | | — | |
The government is providing additional funding of $1.8 million in 2023-24 to commence developing innovative rapid detection tools to improve the speed at which an animal disease incursion can be diagnosed and managed. The associated capital expense for this initiative is $98,000 in 2023-24.
This forms part of the government’s total funding of $1.9 million in 2023-24 to invest in this new technology.
35
Budget Measures 2023-24
| | | | | | | | | | | | | | | | | | | | |
| | | 2022-23
$‘000 | | | 2023-24
$‘000 | | | 2024-25
$‘000 | | | 2025-26
$‘000 | | | 2026-27
$‘000 | |
Improving Swimmer Safety including the Shark Control Program | | | 527 | | | | 1,306 | | | | 1,893 | | | | 2,443 | | | | 3,022 | |
The government is providing increased funding of $9.2 million over 5 years and $3 million per annum ongoing to continue the shark control program, undertake research and trial the application of new technologies (such as drones) in swimmer risk mitigation, and roll out education and awareness programs.
| | | | | | | | | | | | | | | | | | | | |
| | | 2022-23
$‘000 | | | 2023-24
$‘000 | | | 2024-25
$‘000 | | | 2025-26
$‘000 | | | 2026-27
$‘000 | |
Implementing Independent Data Validation as part of Fisheries Reform | | | — | | | | — | | | | — | | | | — | | | | — | |
The government is providing additional funding of $22 million over 4 years to implement independent data validation which will monitor commercial fishing activities at sea to provide more accurate data to support sustainable fisheries management. Funding is held centrally pending the negotiation of matching funds from the Australian Government.
| | | | | | | | | | | | | | | | | | | | |
| | | 2022-23
$‘000 | | | 2023-24
$‘000 | | | 2024-25
$‘000 | | | 2025-26
$‘000 | | | 2026-27
$‘000 | |
National Red Imported Fire Ant Eradication Program in South East Queensland | | | — | | | | — | | | | — | | | | — | | | | — | |
The government is providing increased funding of $60.9 million over 4 years to continue delivery of the critical National Red Imported Fire Ant Eradication Program. Funding is held centrally, subject to a National Cost Sharing Agreement being finalised with the Australian Government and other States and Territories.
36
Budget Measures 2023-24
Department of Child Safety, Seniors and Disability Services
| | | | | | | | | | | | | | | | | | | | |
| | | 2022-23
$‘000 | | | 2023-24
$‘000 | | | 2024-25
$‘000 | | | 2025-26
$‘000 | | | 2026-27
$‘000 | |
Cost of Living Rebate and National Energy Bill Relief | | | — | | | | 1,435,000 | | | | — | | | | — | | | | — | |
The government is providing increased funding of $1.435 billion in 2023-24 to provide cost of living relief for Queensland households and small businesses through a Cost of Living Rebate (COLR). In 2023-24, all Queensland households will automatically receive a $550 COLR on their electricity bill, while around 600,000 vulnerable households will benefit from a higher $700 COLR. Approximately 205,000 small businesses will also receive a $650 rebate to assist with the higher cost of electricity.
This measure includes contributions from the Australian Government under the National Energy Bill Relief plan, with the Queensland Government contributing an estimated $1.1 billion.
| | | | | | | | | | | | | | | | | | | | |
| | | 2022-23
$‘000 | | | 2023-24
$‘000 | | | 2024-25
$‘000 | | | 2025-26
$‘000 | | | 2026-27
$‘000 | |
National Disability Insurance Scheme (NDIS) Assessment Services | | | — | | | | 7,641 | | | | 4,669 | | | | 1,818 | | | | 2,029 | |
The government is providing increased funding of $16.2 million over 4 years and $2 million per annum ongoing to continue the operation of Assessment and Referral teams until December 2024, and then from January 2025 to establish and maintain a specialist disability assessment team to support high-complexity clients intersecting with multiple mainstream service systems.
37
Budget Measures 2023-24
| | | | | | | | | | | | | | | | | | | | |
| | | 2022-23
$‘000 | | | 2023-24
$‘000 | | | 2024-25
$‘000 | | | 2025-26
$‘000 | | | 2026-27
$‘000 | |
Reform of Queensland’s Positive Behaviour Support and Restrictive Practices | | | 1,179 | | | | 4,843 | | | | 4,326 | | | | 4,437 | | | | 4,551 | |
The government is providing increased funding of $19.3 million over 5 years and $4.6 million per annum ongoing to progress a review of the current Positive Behaviour Support and Restrictive Practices authorisation framework and to continue the current authorisation framework pending implementation of a reformed authorisation framework.
| | | | | | | | | | | | | | | | | | | | |
| | | 2022-23
$‘000 | | | 2023-24
$‘000 | | | 2024-25
$‘000 | | | 2025-26
$‘000 | | | 2026-27
$‘000 | |
Supporting people with disability ineligible for the National Disability Insurance Scheme | | | — | | | | 4,206 | | | | 4,332 | | | | 4,462 | | | | 4,596 | |
The government is providing increased funding of $17.6 million over 4 years and $4.6 million per annum ongoing to provide specialist disability supports to adult clients ineligible for the National Disability Insurance Scheme.
| | | | | | | | | | | | | | | | | | | | |
| | | 2022-23
$‘000 | | | 2023-24
$‘000 | | | 2024-25
$‘000 | | | 2025-26
$‘000 | | | 2026-27
$‘000 | |
Queensland Disability Advocacy Program | | | — | | | | 4,047 | | | | 4,047 | | | | 4,047 | | | | 4,047 | |
The government is providing increased funding of $16.2 million over 4 years and $4 million per annum ongoing to support the continuation of disability advocacy services in Queensland to assist Queenslanders with disability to understand their rights, navigate the National Disability Insurance Scheme and other mainstream services, address discrimination, conflict and unfair treatment, make informed decisions, safeguard well-being and build capacity to self-advocate.
38
Budget Measures 2023-24
| | | | | | | | | | | | | | | | | | | | |
| | | 2022-23
$‘000 | | | 2023-24
$‘000 | | | 2024-25
$‘000 | | | 2025-26
$‘000 | | | 2026-27
$‘000 | |
Seniors support package | | | — | | | | 2,871 | | | | 4,448 | | | | 4,495 | | | | 4,439 | |
The government is providing increased funding of $16.3 million over 4 years and $4.3 million per annum ongoing for a range of measures to support and engage with carers and older Queenslanders. Measures include continued engagement through Seniors expos, support for the Carers Advisory Council, extension of the Electricity Life Support concession eligibility, increased funding from 2024-25 for social isolation support services, and working with Volunteering Queensland to support seniors volunteering.
| | | | | | | | | | | | | | | | | | | | |
| | | 2022-23
$‘000 | | | 2023-24
$‘000 | | | 2024-25
$‘000 | | | 2025-26
$‘000 | | | 2026-27
$‘000 | |
Human Services Quality Framework Funding | | | — | | | | 956 | | | | 918 | | | | 508 | | | | 521 | |
The government is providing increased funding of $2.9 million over 4 years and $521,000 per annum ongoing to continue and strengthen the Human Services Quality Framework as the core cross-government quality system for outsourced human service delivery.
| | | | | | | | | | | | | | | | | | | | |
| | | 2022-23
$‘000 | | | 2023-24
$‘000 | | | 2024-25
$‘000 | | | 2025-26
$‘000 | | | 2026-27
$‘000 | |
Family Support and Child Protection Reforms - Our Way | | | — | | | | 16,347 | | | | 32,046 | | | | 51,930 | | | | 66,922 | |
The government is providing increased funding of $167.2 million over 4 years and $20 million per annum ongoing to eliminate the over-representation of Aboriginal and Torres Strait Islander children in the child protection system and build the Aboriginal and Torres Strait Islander services sector to meet the needs of children and families and safely reunify children with their families.
A further $14 million over 4 years and $1.5 million per annum ongoing will be internally met by the department.
39
Budget Measures 2023-24
| | | | | | | | | | | | | | | | | | | | |
| | | 2022-23
$‘000 | | | 2023-24
$‘000 | | | 2024-25
$‘000 | | | 2025-26
$‘000 | | | 2026-27
$‘000 | |
Child and Family Services - Delivering Placement Reforms | | | — | | | | 6,280 | | | | 6,109 | | | | 6,320 | | | | 6,486 | |
The government is providing additional funding of $25.2 million over 4 years and $6.5 million per annum ongoing to support critical placement reforms, ensuring placements of children and young people match their needs and deliver intended cost efficiencies.
| | | | | | | | | | | | | | | | | | | | |
| | | 2022-23
$‘000 | | | 2023-24
$‘000 | | | 2024-25
$‘000 | | | 2025-26
$‘000 | | | 2026-27
$‘000 | |
Child and Family Services - Responses to Child Sexual Abuse | | | — | | | | 2,824 | | | | 2,846 | | | | 2,947 | | | | 3,027 | |
The government is providing additional funding of $11.6 million over 4 years and $3 million per annum ongoing to administer litigation on behalf of the State, required following the removal of the civil statutory time limit for victims of sexual abuse as recommended by the Royal Commission into Institutional Responses to Child Sexual Abuse.
| | | | | | | | | | | | | | | | | | | | |
| | | 2022-23
$‘000 | | | 2023-24
$‘000 | | | 2024-25
$‘000 | | | 2025-26
$‘000 | | | 2026-27
$‘000 | |
Youth Justice Investment - Fast-track Sentencing | | | 286 | | | | 772 | | | | 140 | | | | — | | | | — | |
The government is providing additional funding of $1.2 million over 3 years to deliver a fast-track sentencing pilot in 4 locations for 18 months to address delays in court proceedings through proactive case management of matters. This forms part of total additional funding of $16.5 million over 4 years for these pilots.
This forms part of the government’s total funding package of $446.4 million ($441.9 million new funding and $4.5 million internally funded) over 5 years and $33.7 million per annum ongoing to help boost police resources and tackle the complex causes of youth crime and support community safety.
Further details can be found in Chapter 1 of this paper and in the Department of Education, Department of Housing, Department of Justice and Attorney-General, Department of the Premier and Cabinet, Department of Treaty, Aboriginal and Torres Strait Islander Partnerships, Communities and the Arts, Department of Youth Justice, Employment, Small Business and Training, Queensland Corrective Services, Queensland Health and Queensland Police Service sections of this chapter and the Queensland Police Service section of Chapter 3 Capital Measures.
40
Budget Measures 2023-24
| | | | | | | | | | | | | | | | | | | | |
| | | 2022-23
$‘000 | | | 2023-24
$‘000 | | | 2024-25
$‘000 | | | 2025-26
$‘000 | | | 2026-27
$‘000 | |
Child and Family Services - Parameter Based Funding Model | | | — | | | | — | | | | — | | | | — | | | | — | |
The government has approved a Parameter Based Funding Model for tertiary child protection services which will enable funding to vary in accordance with actual demand while also incentivising placement reform efforts.
| | | | | | | | | | | | | | | | | | | | |
| | | 2022-23
$‘000 | | | 2023-24
$‘000 | | | 2024-25
$‘000 | | | 2025-26
$‘000 | | | 2026-27
$‘000 | |
Family Support and Child Protection Reforms - Family and Child Connect | | | — | | | | — | | | | 16,182 | | | | 16,182 | | | | 16,182 | |
The government will provide increased funding of $48.5 million over 3 years from 2024-25 and $16.2 million per annum ongoing to continue to help families to navigate the child and family support system and connect them to appropriate supports.
A further $17.1 million over 3 years from 2024-25 and $5.8 million per annum ongoing will be internally met by the department.
| | | | | | | | | | | | | | | | | | | | |
| | | 2022-23
$‘000 | | | 2023-24
$‘000 | | | 2024-25
$‘000 | | | 2025-26
$‘000 | | | 2026-27
$‘000 | |
Future delivery of Queensland Accommodation Support and Respite Services (AS&RS) | | | — | | | | — | | | | — | | | | — | | | | — | |
The Queensland Government has committed to continuing the provision of AS&RS to allow continuity of care for people with a disability, with the department to register as a National Disability Insurance Scheme (NDIS) provider and undertake consultation to confirm future service delivery models from 2025 with key stakeholders, including clients, families, staff and unions. The Government will meet any costs of service delivery above that provided by the NDIS.
41
Budget Measures 2023-24
Department of Education
| | | | | | | | | | | | | | | | | | | | |
| | | 2022-23
$‘000 | | | 2023-24
$‘000 | | | 2024-25
$‘000 | | | 2025-26
$‘000 | | | 2026-27
$‘000 | |
Free Kindergarten in Queensland | | | — | | | | 101,624 | | | | 173,724 | | | | 180,720 | | | | 189,359 | |
The government is providing increased funding of $645.4 million over 4 years and $189.4 million per annum ongoing, with indexation, for 15 hours per week of free kindergarten from 1 January 2024 for all 4-year-olds. This initiative will remove cost as a barrier to participation, relieve cost of living pressure for Queensland families, support labour market participation for parents, and improve educational outcomes.
| | | | | | | | | | | | | | | | | | | | |
| | | 2022-23
$‘000 | | | 2023-24
$‘000 | | | 2024-25
$‘000 | | | 2025-26
$‘000 | | | 2026-27
$‘000 | |
School Infrastructure and Land Acquisitions | | | — | | | | 16,785 | | | | 28,978 | | | | 14,819 | | | | 4,498 | |
The government is providing increased funding of $65.1 million over 4 years ($79.4 million over 10 years), and a further $4.3 million over 5 years held centrally, to deliver critical educational infrastructure to accommodate enrolment growth in state schools. This includes funding to establish a strategic land acquisition fund for future new and expanded schools, provide another round of school hall and performing arts centre projects, and provide additional classrooms in existing schools that are nearing capacity.
Total funding for this initiative is $1.231 billion over 4 years ($1.727 billion over 10 years). The capital component of this measure can be found in Chapter 3 Capital measures.
42
Budget Measures 2023-24
| | | | | | | | | | | | | | | | | | | | |
| | | 2022-23
$‘000 | | | 2023-24
$‘000 | | | 2024-25
$‘000 | | | 2025-26
$‘000 | | | 2026-27
$‘000 | |
Queensland Workforce Strategy - Regional School Industry Partnerships | | | 845 | | | | 1,643 | | | | 1,690 | | | | 866 | | | | — | |
The government is providing additional funding of $5 million over 4 years to strengthen local school-industry partnerships and support school to work transitions.
This forms part of the government’s total funding package of over $70 million for new initiatives included in the 2022-2025 Action Plan as part of the Good people. Good jobs: Queensland Workforce Strategy 2022-2032 to create a strong and diverse workforce ready to seize today’s jobs and adapt to future opportunities.
Further details on initiatives can be found in the Department of Youth Justice, Employment, Small Business and Training, the Department of Environment and Science and Queensland Treasury sections of this chapter.
| | | | | | | | | | | | | | | | | | | | |
| | | 2022-23
$‘000 | | | 2023-24
$‘000 | | | 2024-25
$‘000 | | | 2025-26
$‘000 | | | 2026-27
$‘000 | |
Youth Justice Investment - Stronger Communities Initiative: Early Action Groups | | | — | | | | 261 | | | | 491 | | | | — | | | | — | |
The government is providing increased funding of $752,000 over 2 years to extend the Townsville Early Action Group and expand to Cairns and Mount Isa to help break the cycle of youth crime. This initiative aims to deal with underlying issues that lead some young people to offend, including poor school attendance, mental health concerns, drug and substance misuse, domestic violence and family dysfunction. This forms part of total increased funding of $5.1 million over 3 years for the Early Action Groups.
This forms part of the government’s total funding package of $446.4 million ($441.9 million new funding and $4.5 million internally funded) over 5 years and $33.7 million per annum ongoing to help boost police resources and tackle the complex causes of youth crime and support community safety.
Further details can be found in Chapter 1 of this paper and in the Department of Child Safety, Seniors and Disability Services, Department of Housing, Department of Justice and Attorney-General, Department of the Premier and Cabinet, Department of Treaty, Aboriginal and Torres Strait Islander Partnerships, Communities and the Arts, Department of Youth Justice, Employment, Small Business and Training, Queensland Corrective Services, Queensland Health and Queensland Police Service sections of this chapter and the Queensland Police Service section of Chapter 3 Capital Measures.
43
Budget Measures 2023-24
| | | | | | | | | | | | | | | | | | | | |
| | | 2022-23
$‘000 | | | 2023-24
$‘000 | | | 2024-25
$‘000 | | | 2025-26
$‘000 | | | 2026-27
$‘000 | |
Youth Detention Centre Capacity - Addressing Capacity Issues at Youth Detention Centres | | | 220 | | | | 242 | | | | — | | | | — | | | | — | |
The government is providing additional funding of $462,000 over 2 years to assist education delivery for young people in watchhouses. Further funding of up to $2.5 million over 2 years to 2023-24 is held centrally to support strategies addressing capacity issues at Youth Detention Centres.
This forms part of total increased funding of $89.7 million over 3 years ($78.1 million new funding and $11.6 million from existing resources) to address capacity issues for Youth Detention Centres. Further details can be found in the Department of Youth Justice, Employment, Small Business and Training, Queensland Health and Queensland Police Service sections of this chapter.
| | | | | | | | | | | | | | | | | | | | |
| | | 2022-23
$‘000 | | | 2023-24
$‘000 | | | 2024-25
$‘000 | | | 2025-26
$‘000 | | | 2026-27
$‘000 | |
Non-State Schools Transport Assistance Scheme | | | 81 | | | | 221 | | | | 364 | | | | 521 | | | | 674 | |
The government is providing increased funding of $1.9 million over 5 years and $674,000 per annum ongoing for the Non-State Schools Transport Assistance Scheme.
| | | | | | | | | | | | | | | | | | | | |
| | | 2022-23
$‘000 | | | 2023-24
$‘000 | | | 2024-25
$‘000 | | | 2025-26
$‘000 | | | 2026-27
$‘000 | |
Teacher Housing | | | — | | | | 220 | | | | 234 | | | | 248 | | | | 264 | |
The government is providing increased funding of $966,000 over 4 years for safe and secure teacher housing in regional and remote communities.
Total funding for this initiative is $48.3 million over 4 years. The capital component of this measure can be found in Chapter 3 Capital measures.
44
Budget Measures 2023-24
| | | | | | | | | | | | | | | | | | | | |
| | | 2022-23
$‘000 | | | 2023-24
$‘000 | | | 2024-25
$‘000 | | | 2025-26
$‘000 | | | 2026-27
$‘000 | |
Addressing Market Pressures | | | — | | | | — | | | | 14,456 | | | | 14,456 | | | | 14,456 | |
The government is providing increased funding of $43.4 million over 3 years to address cost escalation in the construction market.
Total funding for this initiative is $312.6 million over 3 years. The capital component of this measure can be found in Chapter 3 Capital measures.
| | | | | | | | | | | | | | | | | | | | |
| | | 2022-23
$‘000 | | | 2023-24
$‘000 | | | 2024-25
$‘000 | | | 2025-26
$‘000 | | | 2026-27
$‘000 | |
School Infrastructure - Renewal | | | — | | | | — | | | | — | | | | — | | | | — | |
The government has provided increased funding of $29 million in 2022-23, held centrally, for the renewal, upgrade and enhancement of critical infrastructure in existing state schools, including tuckshop and playground upgrades and priority flood mitigation works.
Total funding for this initiative is $117.4 million over 6 years. The capital component of this measure can be found in Chapter 3 Capital measures.
45
Budget Measures 2023-24
Department of Energy and Public Works
| | | | | | | | | | | | | | | | | | | | |
| | | 2022-23
$‘000 | | | 2023-24
$‘000 | | | 2024-25
$‘000 | | | 2025-26
$‘000 | | | 2026-27
$‘000 | |
Household Energy Initiatives | | | — | | | | 40,000 | | | | 20,000 | | | | — | | | | — | |
The government is providing additional funding of $60 million over 2 years to deliver efficiency measures to keep costs down for households, enabling more choice and greater energy equity. This constitutes Queensland’s co-contribution to the Australian Government’s Household Energy Upgrades Fund.
| | | | | | | | | | | | | | | | | | | | |
| | | 2022-23
$‘000 | | | 2023-24
$‘000 | | | 2024-25
$‘000 | | | 2025-26
$‘000 | | | 2026-27
$‘000 | |
ReBuild QBuild | | | 6,411 | | | | 15,267 | | | | 9,022 | | | | 8,438 | | | | — | |
The government is providing additional funding of $39.1 million over 4 years and a further $27.4 million over 2 years from 2024-25 held centrally to support the next stages of ReBuild QBuild. This includes re-introduction of funding for apprentice training and support for initial operating costs for Rapid Accommodation and Apprentice Centres in Eagle Farm and Cairns.
The capital component to this measure can be found in Chapter 3 Capital Measures.
| | | | | | | | | | | | | | | | | | | | |
| | | 2022-23
$‘000 | | | 2023-24
$‘000 | | | 2024-25
$‘000 | | | 2025-26
$‘000 | | | 2026-27
$‘000 | |
Queensland Business Energy Saving and Transformation Program | | | 6,000 | | | | 14,500 | | | | 14,500 | | | | — | | | | — | |
The government is providing additional funding of $35 million over 3 years to support businesses in Queensland to reduce their electricity bills.
46
Budget Measures 2023-24
| | | | | | | | | | | | | | | | | | | | |
| | | 2022-23
$‘000 | | | 2023-24
$‘000 | | | 2024-25
$‘000 | | | 2025-26
$‘000 | | | 2026-27
$‘000 | |
Queensland Energy and Jobs Plan Implementation | | | 11,775 | | | | 13,050 | | | | 10,845 | | | | 8,150 | | | | — | |
The government is providing additional funding of $43.8 million over 4 years to support implementation of the Queensland Energy and Jobs Plan and to deliver energy transformation including electricity modelling, SuperGrid Blueprint updates and community engagement.
| | | | | | | | | | | | | | | | | | | | |
| | | 2022-23
$‘000 | | | 2023-24
$‘000 | | | 2024-25
$‘000 | | | 2025-26
$‘000 | | | 2026-27
$‘000 | |
Hydrogen Hubs Initiative | | | 1,000 | | | | 13,000 | | | | 6,000 | | | | — | | | | — | |
The government is providing additional funding of $20 million over 3 years to grow the future hydrogen industry by super-charging Queensland’s Hydrogen Hubs and engaging the community around hydrogen.
| | | | | | | | | | | | | | | | | | | | |
| | | 2022-23
$‘000 | | | 2023-24
$‘000 | | | 2024-25
$‘000 | | | 2025-26
$‘000 | | | 2026-27
$‘000 | |
Queensland Renewable Energy Zones Planning and Community Engagement | | | 2,000 | | | | 12,000 | | | | 15,000 | | | | 6,000 | | | | — | |
The government is providing additional funding of $35 million over 4 years to undertake strategic planning and community engagement activities to develop Queensland Renewable Energy Zones in a coordinated way and increase community benefits.
47
Budget Measures 2023-24
| | | | | | | | | | | | | | | | | | | | |
| | | 2022-23
$‘000 | | | 2023-24
$‘000 | | | 2024-25
$‘000 | | | 2025-26
$‘000 | | | 2026-27
$‘000 | |
Vulnerable Households Energy Advice Initiatives | | | — | | | | 7,500 | | | | 2,500 | | | | — | | | | — | |
The government is providing additional funding of $10 million over 2 years to deliver a range of energy bill savings initiatives, by providing energy efficiency advice, assessments and including installing smart, innovative products to reduce power bills. This constitutes Queensland’s co-contribution to the Australian Government’s Household Energy Upgrades Fund.
| | | | | | | | | | | | | | | | | | | | |
| | | 2022-23
$‘000 | | | 2023-24
$‘000 | | | 2024-25
$‘000 | | | 2025-26
$‘000 | | | 2026-27
$‘000 | |
Public Information Regarding Access to Energy Bill Support | | | — | | | | 5,000 | | | | — | | | | — | | | | — | |
The government is providing additional funding of up to $5 million for public information to advise and assist households to access significant energy bill relief, along with other energy programs and concessions.
| | | | | | | | | | | | | | | | | | | | |
| | | 2022-23
$‘000 | | | 2023-24
$‘000 | | | 2024-25
$‘000 | | | 2025-26
$‘000 | | | 2026-27
$‘000 | |
Bundaberg East Levee Project | | | — | | | | — | | | | — | | | | — | | | | — | |
The government is providing increased funding of $132.5 million, held centrally subject to agreement with the Australian Government, for the Bundaberg East Levee from 2023-24 to support the delivery of a 1.7-kilometre levee to reduce the impact of flooding on parts of Bundaberg East and Bundaberg South. Funding includes $57.4 million fully funded by the Australian Government from the Emergency Response Fund and $60 million jointly funded by the State and Commonwealth Governments from Disaster Recovery Funding Arrangements Efficiencies. This brings total funding for the Bundaberg East Levee to $174.7 million.
This forms part of the government’s total investment of $152 million from the Disaster Recovery Funding Arrangements Efficiencies. For further details see the Department of State Development, Infrastructure, Local Government and Planning section of this chapter.
48
Budget Measures 2023-24
| | | | | | | | | | | | | | | | | | | | |
| | | 2022-23
$‘000 | | | 2023-24
$‘000 | | | 2024-25
$‘000 | | | 2025-26
$‘000 | | | 2026-27
$‘000 | |
Drought Assistance and Reform Package | | | — | | | | — | | | | — | | | | — | | | | — | |
The government is providing increased funding of up to $5 million in 2023-24, held centrally, to provide relief to farmers and irrigators from fixed charges for electricity accounts that are used to pump water for farm or irrigation purposes during periods of drought. The total assistance provided can vary depending on the shires that are drought declared and the number of eligible customers.
Further details can be found in the Department of Regional Development, Manufacturing and Water and the Department of Resources sections of Chapter 4 Revenue Measures.
| | | | | | | | | | | | | | | | | | | | |
| | | 2022-23
$‘000 | | | 2023-24
$‘000 | | | 2024-25
$‘000 | | | 2025-26
$‘000 | | | 2026-27
$‘000 | |
Government Employee Housing Expansion - Program Management | | | — | | | | — | | | | 1,128 | | | | 1,155 | | | | — | |
The government is providing $3.5 million over 3 years to manage and deliver an increased program of work. A further $1.2 million will be held centrally in 2026-27.
The capital component to this measure can be found in Chapter 3 Capital measures.
49
Budget Measures 2023-24
Department of Environment and Science
| | | | | | | | | | | | | | | | | | | | |
| | | 2022-23
$‘000 | | | 2023-24
$‘000 | | | 2024-25
$‘000 | | | 2025-26
$‘000 | | | 2026-27
$‘000 | |
Multicultural Affairs - Celebrating Multicultural Qld | | | — | | | | 1,176 | | | | 1,178 | | | | 1,184 | | | | 1,189 | |
The government is providing increased funding of $4.7 million over 4 years and $1.2 million per annum ongoing for multicultural projects that engage people from culturally diverse backgrounds and the wider community contributing to building a united, harmonious and inclusive Queensland.
| | | | | | | | | | | | | | | | | | | | |
| | | 2022-23
$‘000 | | | 2023-24
$‘000 | | | 2024-25
$‘000 | | | 2025-26
$‘000 | | | 2026-27
$‘000 | |
Queensland Workforce Strategy - Multicultural Affairs Settlement Team | | | 746 | | | | 739 | | | | 760 | | | | 779 | | | | — | |
The government is providing additional funding of $3 million over 4 years to establish a Multicultural Affairs Settlement Team to advocate and improve workforce outcomes for migrants and refugees. This forms part of the government’s total funding package of over $70 million for new initiatives included in the 2022-2025 Action Plan as part of the Good People. Good Jobs: Queensland Workforce Strategy 2022-2032 to create a strong and diverse workforce ready to seize today’s jobs and adapt to future opportunities. Further details on initiatives can be found in the Department of Youth Justice, Employment, Small Business and Training, the Department of Education and Queensland Treasury sections of this chapter.
| | | | | | | | | | | | | | | | | | | | |
| | | 2022-23
$‘000 | | | 2023-24
$‘000 | | | 2024-25
$‘000 | | | 2025-26
$‘000 | | | 2026-27
$‘000 | |
Managing Country with First Nations Peoples | | | — | | | | 9,019 | | | | 9,459 | | | | 10,386 | | | | 9,704 | |
The government is providing increased funding of $38.6 million over 4 years and $10.4 million per annum ongoing to honour existing commitments with First Nations peoples in Queensland, to ensure progression of agreements and relationships that promote respect, culture, rights and active co-stewardship of Country.
50
Budget Measures 2023-24
| | | | | | | | | | | | | | | | | | | | |
| | | 2022-23
$‘000 | | | 2023-24
$‘000 | | | 2024-25
$‘000 | | | 2025-26
$‘000 | | | 2026-27
$‘000 | |
Revitalising National Parks | | | — | | | | 3,457 | | | | 3,545 | | | | 3,631 | | | | 3,722 | |
The government is providing increased funding of $14.4 million over 4 years and $3.8 million per annum ongoing to continue the delivery of the Values-Based Management Framework, support improved visitor experiences in Queensland’s national parks, and support the revitalisation of visitor infrastructure.
The capital component of this measure can be found in Chapter 3 Capital Measures.
| | | | | | | | | | | | | | | | | | | | |
| | | 2022-23
$‘000 | | | 2023-24
$‘000 | | | 2024-25
$‘000 | | | 2025-26
$‘000 | | | 2026-27
$‘000 | |
Queensland Indigenous Land and Sea Ranger Program | | | — | | | | 2,813 | | | | 15,000 | | | | 15,675 | | | | 16,367 | |
The government is providing increased funding of $49.9 million over 4 years and $16.4 million per annum ongoing (indexed annually) for the continuation of the expanded Indigenous Land and Sea Ranger Program, which increased ranger numbers from 100 to 200.
| | | | | | | | | | | | | | | | | | | | |
| | | 2022-23
$‘000 | | | 2023-24
$‘000 | | | 2024-25
$‘000 | | | 2025-26
$‘000 | | | 2026-27
$‘000 | |
Partnering with Quandamooka On Land and Sea Country | | | — | | | | 2,261 | | | | 4,604 | | | | 5,541 | | | | 4,648 | |
The government is providing increased funding of $17.1 million over 4 years and $1.7 million per annum ongoing to support Traditional Owner decision making and enhanced joint management of protected areas including new fire management programs on Mulgumpin (Moreton Island) in partnership with the Quandamooka People.
The capital component of this measure can be found in Chapter 3 Capital Measures.
51
Budget Measures 2023-24
| | | | | | | | | | | | | | | | | | | | |
| | | 2022-23
$‘000 | | | 2023-24
$‘000 | | | 2024-25
$‘000 | | | 2025-26
$‘000 | | | 2026-27
$‘000 | |
Keeping the Queensland public safe from crocodiles and management of flying foxes | | | — | | | | 1,310 | | | | 2,162 | | | | 1,703 | | | | 800 | |
The government is providing increased funding of $6 million over 4 years and $300,000 per annum ongoing to support public safety through collaboration and commercialisation of devices to detect and deter crocodiles, an enhanced ‘Be Crocwise’ safety program, and extend the Local Government Flying-Fox Roost Management Grant Program to support local governments’ management of urban flying-fox roosts.
| | | | | | | | | | | | | | | | | | | | |
| | | 2022-23
$‘000 | | | 2023-24
$‘000 | | | 2024-25
$‘000 | | | 2025-26
$‘000 | | | 2026-27
$‘000 | |
World-Class Protected Area Management | | | — | | | | 978 | | | | 4,811 | | | | 5,898 | | | | 8,767 | |
The government is providing increased funding of $32.8 million over 5 years (including $12.4 million in 2027-28) and $11.9 million per annum ongoing from 2028-29, for the continuation of Queensland’s Protected Area Strategy 2020-2030 and to improve the management of Queensland’s World Heritage Areas.
The capital component of this measure can be found in Chapter 3 Capital Measures.
| | | | | | | | | | | | | | | | | | | | |
| | | 2022-23
$‘000 | | | 2023-24
$‘000 | | | 2024-25
$‘000 | | | 2025-26
$‘000 | | | 2026-27
$‘000 | |
Strategic Science and International Partnerships | | | — | | | | 728 | | | | 1,500 | | | | 1,500 | | | | 1,500 | |
The government is providing increased funding of $5.2 million over 4 years and $1.5 million per annum ongoing to continue science engagement and promotion. This initiative aims to enhance the connection of Queenslanders to science and support Strategic International Science Partnerships.
52
Budget Measures 2023-24
| | | | | | | | | | | | | | | | | | | | |
| | | 2022-23
$‘000 | | | 2023-24
$‘000 | | | 2024-25
$‘000 | | | 2025-26
$‘000 | | | 2026-27
$‘000 | |
Currumbin Eco-Parkland | | | — | | | | 574 | | | | 624 | | | | 648 | | | | 667 | |
The government is providing increased funding of $2.5 million over 4 years and $682,000 per annum ongoing to support ongoing management activities.
This forms part of the government’s total funding of $46 million over 5 years to support the Currumbin Eco-Parkland. Further details can be found in the Department of State Development, Infrastructure, Local Government and Planning section of this chapter.
| | | | | | | | | | | | | | | | | | | | |
| | | 2022-23
$‘000 | | | 2023-24
$‘000 | | | 2024-25
$‘000 | | | 2025-26
$‘000 | | | 2026-27
$‘000 | |
Waste Package | | | 139,600 | | | | — | | | | — | | | | — | | | | 94,400 | |
The government is providing increased funding of $234 million over 5 years for continued delivery of the $2.1 billion Waste Package, announced in 2022-23. This includes an allocation of $94.4 million in 2026-27 for year 5 of the program and bringing forward $139.6 million in planned annual payments to local councils to 2022-23 to provide financial certainty.
Funding will support councils and industry to invest in infrastructure and will deliver programs to reduce waste, meet resource recovery targets, create jobs, and reduce impacts on households.
53
Budget Measures 2023-24
Department of Housing
| | | | | | | | | | | | | | | | | | | | |
| | | 2022-23
$‘000 | | | 2023-24
$‘000 | | | 2024-25
$‘000 | | | 2025-26
$‘000 | | | 2026-27
$‘000 | |
Immediate Housing Response Package | | | 12,000 | | | | 32,000 | | | | — | | | | — | | | | — | |
The government is providing additional funding of $54 million over 2 years for the Immediate Housing Response package, including $10 million through the Housing Roundtable and Housing Summit Outcomes, with funding allocated from a whole-of-government provision.
| | | | | | | | | | | | | | | | | | | | |
| | | 2022-23
$‘000 | | | 2023-24
$‘000 | | | 2024-25
$‘000 | | | 2025-26
$‘000 | | | 2026-27
$‘000 | |
Housing with Support Initiative | | | — | | | | 13,515 | | | | 18,515 | | | | — | | | | — | |
The government is providing additional funding of $32 million over 2 years for operational services including for 3 accommodation sites, to support enhanced services across 5 youth shelters and to deliver specialist mobile supports across 13 locations.
As part of the Queensland Housing Summit outcomes, funding of $5 million in 2023-24 is being provided for emergency temporary accommodation. This brings the total funding for this program to $37 million over 2 years from 2023-24.
| | | | | | | | | | | | | | | | | | | | |
| | | 2022-23
$‘000 | | | 2023-24
$‘000 | | | 2024-25
$‘000 | | | 2025-26
$‘000 | | | 2026-27
$‘000 | |
Youth Justice Investment - Helping Seniors Secure their Homes | | | 4,000 | | | | 11,000 | | | | — | | | | — | | | | — | |
The government is providing additional funding of $15 million over 2 years commencing 2022-23 to the Helping Seniors Secure Their Homes program currently being trialled in Cairns, Mount Isa and Townsville local government areas. The trial will be expanded to include the Toowoomba local government area and the greater Cairns region.
The government is providing an additional $15 million in 2023-24, held centrally, if needed. This brings the total funding available for this program to $30 million over 2 years.
This forms part of the government’s total funding package of $446.4 million ($441.9 million new funding and $4.5 million internally funded) over 5 years and $33.7 million per annum ongoing to help boost police resources and tackle the complex causes of youth crime and
54
Budget Measures 2023-24
support community safety. Further details can be found in Chapter 1 of this paper and in the Department of Child Safety, Seniors and Disability Services, Department of Education, Department of Justice and Attorney-General, Department of the Premier and Cabinet, Department of Treaty, Aboriginal and Torres Strait Islander Partnerships, Communities and the Arts, Department of Youth Justice, Employment, Small Business and Training, Queensland Corrective Services, Queensland Health and Queensland Police Service sections of this chapter and the Queensland Police Service section of Chapter 3 Capital Measures.
| | | | | | | | | | | | | | | | | | | | |
| | | 2022-23
$‘000 | | | 2023-24
$‘000 | | | 2024-25
$‘000 | | | 2025-26
$‘000 | | | 2026-27
$‘000 | |
Second Aboriginal and Torres Strait Islander Housing Action Plan | | | — | | | | 6,669 | | | | 14,877 | | | | 14,877 | | | | 14,877 | |
The government is providing additional funding of $51.3 million over 4 years for the second Queensland Aboriginal and Torres Strait Islander Housing Action Plan (2024-2027), with a focus on progressing Closing the Gap initiatives, enhancing culturally safe services and delivering innovative housing supply solutions.
| | | | | | | | | | | | | | | | | | | | |
| | | 2022-23
$‘000 | | | 2023-24
$‘000 | | | 2024-25
$‘000 | | | 2025-26
$‘000 | | | 2026-27
$‘000 | |
Acceleration of Social and Affordable Housing Delivery | | | — | | | | 5,583 | | | | 5,794 | | | | 5,965 | | | | 6,111 | |
The government is providing additional funding of $23.5 million over 4 years and $6.3 million per annum ongoing from 2027-28 to support the delivery of Housing Investment Fund initiatives, including ongoing contract management activities.
55
Budget Measures 2023-24
| | | | | | | | | | | | | | | | | | | | |
| | | 2022-23
$‘000 | | | 2023-24
$‘000 | | | 2024-25
$‘000 | | | 2025-26
$‘000 | | | 2026-27
$‘000 | |
Frontline Support Services | | | — | | | | 5,418 | | | | — | | | | — | | | | — | |
The government is providing increased funding of $5.4 million in 2023-24 to continue the delivery of critical frontline housing and homelessness services to vulnerable Queenslanders.
| | | | | | | | | | | | | | | | | | | | |
| | | 2022-23
$‘000 | | | 2023-24
$‘000 | | | 2024-25
$‘000 | | | 2025-26
$‘000 | | | 2026-27
$‘000 | |
Additional Social Housing Supply | | | — | | | | 3,060 | | | | 9,800 | | | | 20,260 | | | | 27,383 | |
The government is providing increased funding of $60.5 million over 4 years and $2 million per annum ongoing to expand the QuickStarts Queensland program of new social housing with a new commencements target of 3,265 by 30 June 2025. Total program funding is $322.2 million when combined with the capital component of this measure. Further details can be found in Chapter 3 Capital Measures.
| | | | | | | | | | | | | | | | | | | | |
| | | 2022-23
$‘000 | | | 2023-24
$‘000 | | | 2024-25
$‘000 | | | 2025-26
$‘000 | | | 2026-27
$‘000 | |
Emergency Accommodation | | | 2,274 | | | | 2,274 | | | | 2,274 | | | | 2,274 | | | | 3,000 | |
The government is providing additional funding of $12.1 million over 5 years from 2022-23 and $3 million per annum ongoing to purchase and lease accommodation complexes and provide housing supports for emergency accommodation in inner Brisbane. A further $2.4 million is being met internally by the department. Total funding for this initiative is $14.5 million over 5 years from 2022-23 and $3 million per annum ongoing.
The capital component of this measure can be found in Chapter 3 Capital Measures.
56
Budget Measures 2023-24
| | | | | | | | | | | | | | | | | | | | |
| | | 2022-23
$‘000 | | | 2023-24
$‘000 | | | 2024-25
$‘000 | | | 2025-26
$‘000 | | | 2026-27
$‘000 | |
Helena’s House Project | | | — | | | | 2,000 | | | | — | | | | — | | | | — | |
The government is providing additional funding of $2 million in 2023-24 to BestLife Incorporated for the Helena’s House project to support the safe transition of young people with a disability from the family home to a living solution of their choice.
| | | | | | | | | | | | | | | | | | | | |
| | | 2022-23
$‘000 | | | 2023-24
$‘000 | | | 2024-25
$‘000 | | | 2025-26
$‘000 | | | 2026-27
$‘000 | |
Queensland Housing Strategy 2017-2027 - Supply of Social Housing | | | — | | | | 1,475 | | | | — | | | | — | | | | — | |
The government is providing increased funding of $1.5 million in 2023-24 to maintain dwellings for social housing that would have otherwise been sold.
The capital component of this measure can be found in Chapter 3 Capital Measures.
| | | | | | | | | | | | | | | | | | | | |
| | | 2022-23
$‘000 | | | 2023-24
$‘000 | | | 2024-25
$‘000 | | | 2025-26
$‘000 | | | 2026-27
$‘000 | |
Youth Justice Investment - Stronger Communities Initiative: Early Action Groups | | | — | | | | 287 | | | | 545 | | | | — | | | | — | |
The government is providing increased funding of $832,000 over 2 years to extend the Townsville Early Action Group and expand to Cairns and Mount Isa to help break the cycle of youth crime by dealing with underlying issues that lead some young people to offend including poor school attendance, mental health concerns, drug and substance misuse, domestic violence, and family dysfunction. This forms part of total increased funding of $5.1 million over 3 years for the Early Action Groups.
This forms part of the government’s total funding package of $446.4 million ($441.9 million new funding and $4.5 million internally funded) over 5 years and $33.7 million per annum ongoing to help boost police resources and tackle the complex causes of youth crime and support community safety.
Further details can be found in Chapter 1 of this paper and in the Department of Child Safety, Seniors and Disability Services, Department of Education, Department of Justice and Attorney-General, Department of the Premier and Cabinet, Department of Treaty, Aboriginal and Torres Strait Islander Partnerships, Communities and the Arts, Department of Youth Justice, Employment, Small Business and Training, Queensland Corrective Services, Queensland Health and Queensland Police Service sections of this chapter and the Queensland Police Service section of Chapter 3 Capital Measures.
57
Budget Measures 2023-24
| | | | | | | | | | | | | | | | | | | | |
| | | 2022-23
$‘000 | | | 2023-24
$‘000 | | | 2024-25
$‘000 | | | 2025-26
$‘000 | | | 2026-27
$‘000 | |
Hear her voice - Report 2 - Reintegrating Women and Girls into the Community | | | — | | | | 124 | | | | 590 | | | | 3,533 | | | | 3,551 | |
The government is providing increased funding of $7.8 million over 4 years and $3.6 million per annum ongoing to support reintegrating women and girls into the community. Total funding for this program is $8 million over 4 years, with funding of up to $196,000 is being met internally by the department. This program will support the review of the Absence from your Home policy and expansion of the Next Step Home program for women and girls.
This forms part of the government’s total funding package of $225 million over 5 years to respond to the recommendations of the Queensland Women’s Safety and Justice Taskforce in Hear her voice - Report Two - Women and girls’ experiences across the criminal justice system. Further details on this package are in Chapter 1 of this paper and in the Department of Justice and Attorney-General and Queensland Corrective Services sections of this chapter.
| | | | | | | | | | | | | | | | | | | | |
| | | 2022-23
$‘000 | | | 2023-24
$‘000 | | | 2024-25
$‘000 | | | 2025-26
$‘000 | | | 2026-27
$‘000 | |
Homes for Homes | | | — | | | | — | | | | — | | | | — | | | | — | |
The government has provided additional funding of $500,000 in 2022-23 to Homes for Homes to contribute towards social and affordable housing, with funding allocated from a whole-of-government provision.
| | | | | | | | | | | | | | | | | | | | |
| | | 2022-23
$‘000 | | | 2023-24
$‘000 | | | 2024-25
$‘000 | | | 2025-26
$‘000 | | | 2026-27
$‘000 | |
Housing Summit Outcomes | | | — | | | | — | | | | — | | | | — | | | | — | |
The government is providing funding of $45.2 million over 2 years as part of the Queensland Housing Summit outcomes to expand housing supply and increase housing support. This includes increased funding of $5 million in 2022-23 for the Immediate Housing Response package.
This forms part of the government’s total funding of $56 million over 2 years to deliver outcomes from the Queensland Housing Summit with funding allocated from a whole-of-government provision.
58
Budget Measures 2023-24
Department of Justice and Attorney-General
| | | | | | | | | | | | | | | | | | | | |
| | | 2022-23
$‘000 | | | 2023-24
$‘000 | | | 2024-25
$‘000 | | | 2025-26
$‘000 | | | 2026-27
$‘000 | |
Response to the Commission of Inquiry Relating to the Crime and Corruption Commission | | | 950 | | | | 8,293 | | | | 8,479 | | | | 7,736 | | | | 6,922 | |
The government is providing increased funding of $32.4 million over 5 years and $6.4 million per annum ongoing to implement the Government response to the Commission of Inquiry Relating to the Crime and Corruption Commission and other reforms to enhance the operations of the Crime and Corruption Commission (including $20.8 million over 5 years and $3.4 million per annum ongoing for the Crime and Corruption Commission).
| | | | | | | | | | | | | | | | | | | | |
| | | 2022-23
$‘000 | | | 2023-24
$‘000 | | | 2024-25
$‘000 | | | 2025-26
$‘000 | | | 2026-27
$‘000 | |
Supporting escalating workloads within the District Court of Queensland | | | — | | | | 8,205 | | | | 8,408 | | | | 8,614 | | | | 8,812 | |
The government is providing increased funding of $34 million over 4 years and $8.8 million per annum ongoing to address sustained growth in demand in the criminal justice system (including $17 million over 4 years and $4.4 million per annum ongoing for Legal Aid Queensland).
| | | | | | | | | | | | | | | | | | | | |
| | | 2022-23
$‘000 | | | 2023-24
$‘000 | | | 2024-25
$‘000 | | | 2025-26
$‘000 | | | 2026-27
$‘000 | |
Legal Aid Queensland - Extension of Protected Witness Scheme | | | — | | | | 4,595 | | | | 4,641 | | | | 4,677 | | | | 4,708 | |
The government is providing increased funding of $18.6 million over 4 years and $4.7 million per annum ongoing for Legal Aid Queensland to meet demand arising from extension of the protected witness scheme to domestic and family violence victim-survivors.
59
Budget Measures 2023-24
| | | | | | | | | | | | | | | | | | | | |
| | | 2022-23
$‘000 | | | 2023-24
$‘000 | | | 2024-25
$‘000 | | | 2025-26
$‘000 | | | 2026-27
$‘000 | |
Domestic, Family and Sexual Violence Investment Review Outcomes | | | — | | | | 3,700 | | | | 13,200 | | | | 20,700 | | | | 20,700 | |
The government is providing increased funding of $58.3 million over 4 years and $20.7 million per annum ongoing to address gaps in domestic, family and sexual violence service provision and to meet the immediate demand in the sector.
| | | | | | | | | | | | | | | | | | | | |
| | | 2022-23
$‘000 | | | 2023-24
$‘000 | | | 2024-25
$‘000 | | | 2025-26
$‘000 | | | 2026-27
$‘000 | |
Coroners Court of Queensland - Sustainable Resourcing | | | — | | | | 3,639 | | | | 3,796 | | | | 5,687 | | | | 5,790 | |
The government is providing additional funding of $18.9 million over 4 years and $5.8 million per annum ongoing to support sustainable resourcing and to meet community expectations of comprehensive and timely coronial investigations.
| | | | | | | | | | | | | | | | | | | | |
| | | 2022-23
$‘000 | | | 2023-24
$‘000 | | | 2024-25
$‘000 | | | 2025-26
$‘000 | | | 2026-27
$‘000 | |
Forensic DNA Commission of Inquiry | | | 459 | | | | 3,422 | | | | 3,458 | | | | 3,487 | | | | 3,011 | |
The government is providing additional funding of $3.8 million over 5 years to the Director of Public Prosecutions to assess witness statements and manage cases in a timely manner.
The government is also providing $10 million over 4 years for victim support services.
This forms part of the government’s total funding package of $105.3 million over 5 years and $10.2 million per annum ongoing for immediate measures in response to the Commission of Inquiry into Forensic DNA Testing in Queensland.
Further details can be found in the Queensland Health section of this chapter.
60
Budget Measures 2023-24
| | | | | | | | | | | | | | | | | | | | |
| | | 2022-23
$‘000 | | | 2023-24
$‘000 | | | 2024-25
$‘000 | | | 2025-26
$‘000 | | | 2026-27
$‘000 | |
Hear her voice - Report 2 - Support for victim-survivors through their criminal justice journey | | | 518 | | | | 3,074 | | | | 3,252 | | | | 2,964 | | | | 2,835 | |
The government is providing additional funding of $12.6 million over 5 years and $2.6 million per annum ongoing to support victim-survivors through their criminal justice journey. A further $3.6 million ($597,000 per annum ongoing) is being met internally by the department. This includes to pilot a statewide victim advocate service; develop a 5-year sexual violence service system strategic investment plan; implement a victim-centric, trauma-informed service model for responding to sexual violence; embed a system of safe pathways for victim survivors of sexual violence across the criminal justice systems; establish a victim’s commissioner, consider establishment of an independent sexual violence case review board; and to review policies, guidelines and court models to ensure the needs of women and girls are met.
This forms part of the government’s total funding package of $225 million over 5 years to respond to the recommendations of the Queensland Women’s Safety and Justice Taskforce in Hear her voice - Report 2 - Women and girls’ experiences across the criminal justice system. Further details on this package are in Chapter 1 of this paper.
| | | | | | | | | | | | | | | | | | | | |
| | | 2022-23
$‘000 | | | 2023-24
$‘000 | | | 2024-25
$‘000 | | | 2025-26
$‘000 | | | 2026-27
$‘000 | |
Hear her voice - Report 2 - Treatment of victim-survivors in trials for sexual offences | | | 635 | | | | 2,377 | | | | 1,804 | | | | 1,253 | | | | 1,296 | |
The government is providing additional funding of $7.4 million over 5 years and $1.3 million per annum ongoing to improve the safety and experience of victim-survivors in trials for sexual offences. A further $877,000 over 5 years and $130,000 per annum ongoing is being met internally by the department. This includes improving the safety for all victim-survivors of sexual violence when attending courts; and ensuring that victim-survivors of sexual violence have access to legal information and advice. The capital component of the measure can be found in Chapter 3 Capital Measures.
This forms part of the government’s total funding package of $225 million over 5 years to respond to the recommendations of the Queensland Women’s Safety and Justice Taskforce in Hear her voice - Report 2 - Women and girls’ experiences across the criminal justice system. Further details on this package are in Chapter 1 of this paper.
61
Budget Measures 2023-24
| | | | | | | | | | | | | | | | | | | | |
| | | 2022-23
$‘000 | | | 2023-24
$‘000 | | | 2024-25
$‘000 | | | 2025-26
$‘000 | | | 2026-27
$‘000 | |
Hear her voice - Report 2 - Prosecution response to victim-survivors of sexual violence | | | — | | | | 1,954 | | | | 1,978 | | | | 2,037 | | | | 2,087 | |
The government is providing additional funding of $8.1 million over 4 years to support prosecution responses to victim-survivors of sexual violence. This includes training for all legal staff who work with victim-survivors of sexual violence within the Office of the Director of Public Prosecutions, Police Prosecution Corps, and legal assistance services and to review, update and publish the memorandum of understanding relating to the investigation and prosecution of sexual violence cases.
This forms part of the government’s total funding package of $225 million over 5 years to respond to the recommendations of the Queensland Women’s Safety and Justice Taskforce in Hear her voice - Report 2 - Women and girls’ experiences across the criminal justice system. Further details on this package are in Chapter 1 of this paper.
| | | | | | | | | | | | | | | | | | | | |
| | | 2022-23
$‘000 | | | 2023-24
$‘000 | | | 2024-25
$‘000 | | | 2025-26
$‘000 | | | 2026-27
$‘000 | |
Hear her voice - Report 2 - Jury directions and the use of expert evidence in trials for sexual offences | | | — | | | | 1,837 | | | | 2,607 | | | | 2,516 | | | | — | |
The government is providing additional funding of $7 million over 3 years to better understand the use of jury directions and expert evidence in trials for sexual offences. This includes trialling and evaluating a pilot expert evidence panel for sexual offence proceedings.
This forms part of the government’s total funding package of $225 million over 5 years to respond to the recommendations of the Queensland Women’s Safety and Justice Taskforce in Hear her voice - Report 2 - Women and girls’ experiences across the criminal justice system. Further details on this package are in Chapter 1 of this paper.
62
Budget Measures 2023-24
| | | | | | | | | | | | | | | | | | | | |
| | | 2022-23
$‘000 | | | 2023-24
$‘000 | | | 2024-25
$‘000 | | | 2025-26
$‘000 | | | 2026-27
$‘000 | |
Hear her voice - Report 2 - Adult Restorative Justice Program | | | — | | | | 1,549 | | | | 1,557 | | | | — | | | | — | |
The government is providing increased funding of $3.1 million over 2 years to deliver timely adult restorative justice conferencing to address demand.
This forms part of the government’s total funding package of $225 million over 5 years to respond to the recommendations of the Queensland Women’s Safety and Justice Taskforce in Hear her voice - Report Two - Women and girls’ experiences across the criminal justice system. Further details on this package are in Chapter 1 of this paper.
| | | | | | | | | | | | | | | | | | | | |
| | | 2022-23
$‘000 | | | 2023-24
$‘000 | | | 2024-25
$‘000 | | | 2025-26
$‘000 | | | 2026-27
$‘000 | |
Hear her voice - Report 2 - Community attitudes to sexual violence and consent | | | 250 | | | | 1,286 | | | | 500 | | | | 500 | | | | — | |
The government is providing additional funding of $2.5 million over 5 years, to implement a primary prevention-focused community education campaign to improve awareness and understanding about sexual violence and consent. A further $821,000 is being internally met by the department.
This forms part of the government’s total funding package of $225 million over 5 years to respond to the recommendations of the Queensland Women’s Safety and Justice Taskforce in Hear her voice - Report 2 - Women and girls’ experiences across the criminal justice system. Further details on this package are in Chapter 1 of this paper.
| | | | | | | | | | | | | | | | | | | | |
| | | 2022-23
$‘000 | | | 2023-24
$‘000 | | | 2024-25
$‘000 | | | 2025-26
$‘000 | | | 2026-27
$‘000 | |
Hear her voice - Report 2 - Barriers to reporting sexual violence | | | 100 | | | | 800 | | | | 500 | | | | 500 | | | | — | |
The government is providing additional funding of $1.9 million over 4 years (with a further $1.5 million being met internally by the department) to address barriers to reporting sexual violence. This includes for a review of the reasonable excuses listed in section 229BC(4) of the Criminal Code; and community awareness campaign targeting youth, and sexual assault and health services about the failure to report offence.
This forms part of the government’s total funding package of $225 million over 5 years to respond to the recommendations of the Queensland Women’s Safety and Justice Taskforce in Hear her voice - Report 2 - Women and girls’ experiences across the criminal justice system. Further details on this package are in Chapter 1 of this paper.
63
Budget Measures 2023-24
| | | | | | | | | | | | | | | | | | | | |
| | | 2022-23
$‘000 | | | 2023-24
$‘000 | | | 2024-25
$‘000 | | | 2025-26
$‘000 | | | 2026-27
$‘000 | |
Hear her voice - Report 2 - Data, investment, evaluation and implementation | | | 280 | | | | 545 | | | | 1,714 | | | | 2,257 | | | | — | |
The government is providing increased funding of $4.8 million to support data, investment, evaluation and implementation activities. A further $33.8 million is being met internally by the department with $864,000 per annum ongoing. This includes to develop a plan to replace the Queensland Wide Inter-linked Courts database with a contemporary and innovative database; improve data analytics capability across the courts and legal process; develop a whole-of-government monitoring and evaluation framework; and expand the role of the independent implementation supervisor to include responsibility to oversee implementation of Report 2 recommendations.
This forms part of the government’s total funding package of $225 million over 5 years to respond to the recommendations of the Queensland Women’s Safety and Justice Taskforce in Hear her voice - Report 2 - Women and girls’ experiences across the criminal justice system. Further details on this package are in Chapter 1 of this paper.
| | | | | | | | | | | | | | | | | | | | |
| | | 2022-23
$‘000 | | | 2023-24
$‘000 | | | 2024-25
$‘000 | | | 2025-26
$‘000 | | | 2026-27
$‘000 | |
Hear her voice - Report 2 - Restorative justice for victims of sexual violence | | | — | | | | 500 | | | | — | | | | — | | | | 400 | |
The government is providing additional funding of $900,000 over 4 years for restorative justice for victims of sexual violence. This includes the development of options for a sustainable long-term plan for the expansion of adult restorative justice in Queensland; and a pilot restorative justice program for adult sexual and domestic and family violence offences.
Further details can be found in the Department of Youth Justice, Employment, Small Business and Training section of this chapter. This forms part of the government’s total funding package of $225 million over 5 years to respond to the recommendations of the Queensland Women’s Safety and Justice Taskforce in Hear her voice - Report 2 - Women and girls’ experiences across the criminal justice system. Further details on this package are in Chapter 1 of this paper.
64
Budget Measures 2023-24
| | | | | | | | | | | | | | | | | | | | |
| | | 2022-23
$‘000 | | | 2023-24
$‘000 | | | 2024-25
$‘000 | | | 2025-26
$‘000 | | | 2026-27
$‘000 | |
Hear her voice - Report 2 - Women and girls’ experiences of the legal and court system | | | — | | | | 409 | | | | 516 | | | | 2,406 | | | | 2,466 | |
The government is providing additional funding of $5.8 million over 4 years and $2.5 million per annum ongoing to improve women and girls’ experiences of the legal and court system. A further $1 million over 5 years and $194,000 per annum ongoing is being met internally by the department.
This includes: exploring establishment of an independent legal assistance program in women’s correctional facilities; funding for Legal Aid Queensland, and other community legal services or lawyers to provide legal advice and representation to women; to consider future program developments to improve how the Queensland Drug and Alcohol Court is meeting the needs of women, informed by the recommendations of an independent evaluation; and in consultation with the Chief Magistrate, pilot an approach for women participants on the Court Link program that addresses their underlying needs while they are on bail.
This forms part of the government’s total funding package of $225 million over 5 years to respond to the recommendations of the Queensland Women’s Safety and Justice Taskforce in Hear her voice - Report 2 - Women and girls’ experiences across the criminal justice system. Further details on this package are in Chapter 1 of this paper.
| | | | | | | | | | | | | | | | | | | | |
| | | 2022-23
$‘000 | | | 2023-24
$‘000 | | | 2024-25
$‘000 | | | 2025-26
$‘000 | | | 2026-27
$‘000 | |
Hear her voice - Report 2 - Improving court management of sexual offence cases | | | — | | | | — | | | | 604 | | | | 564 | | | | 373 | |
The government will provide additional funding of $6.5 million over 3 years ($5 million of this held centrally) and $1.3 million per annum ongoing (held centrally) with a further $110,000 being met internally by the department for improving court management of sexual offence cases.
This includes for the consideration of a specialist list and to design and implement a pilot of voluntary case conferencing model in sexual violence cases in the District Court of Queensland; to identify opportunities for courts to improve efficiency and timeliness; and exploring options to provide information to judicial officers and lawyers in the Supreme and District Courts of Queensland regarding the laws and procedures for sexual violence cases.
This forms part of the government’s total funding package of $225 million over 5 years to respond to the recommendations of the Queensland Women’s Safety and Justice Taskforce in Hear her voice - Report 2 - Women and girls’ experiences across the criminal justice system. Further details on this package are in Chapter 1 of this paper.
65
Budget Measures 2023-24
| | | | | | | | | | | | | | | | | | | | |
| | | 2022-23
$‘000 | | | 2023-24
$‘000 | | | 2024-25
$‘000 | | | 2025-26
$‘000 | | | 2026-27
$‘000 | |
Hear her voice - Report 2 - Limitations on publishing the identity of victims and accused people | | | — | | | | — | | | | 333 | | | | — | | | | — | |
The government will provide additional funding of $333,000 to address limitations on publishing the identity of victims and accused persons. This includes the development of a guide for the media to support responsible reporting of sexual violence.
This forms part of the government’s total funding package of $225 million over 5 years to respond to the recommendations of the Queensland Women’s Safety and Justice Taskforce in Hear her voice - Report 2 - Women and girls’ experiences across the criminal justice system. Further details on this package are in Chapter 1 of this paper.
| | | | | | | | | | | | | | | | | | | | |
| | | 2022-23
$‘000 | | | 2023-24
$‘000 | | | 2024-25
$‘000 | | | 2025-26
$‘000 | | | 2026-27
$‘000 | |
Hear her voice - Report 2 - Reintegrating women and girls into the community | | | — | | | | — | | | | — | | | | — | | | | — | |
Funding of $102,000 in 2023-24 will be met internally by the department to support reintegrating women and girls into the community. This includes the consideration of options to develop tailored, accessible resources for women in custody.
Further details can be found in Department of Housing and Queensland Corrective Services section of this chapter. This forms part of the government’s total funding package of $225 million over 5 years to respond to the recommendations of the Queensland Women’s Safety and Justice Taskforce in Hear her voice - Report 2 - Women and girls’ experiences across the criminal justice system. Further details on this package are in Chapter 1 of this paper.
66
Budget Measures 2023-24
| | | | | | | | | | | | | | | | | | | | |
| | | 2022-23
$‘000 | | | 2023-24
$‘000 | | | 2024-25
$‘000 | | | 2025-26
$‘000 | | | 2026-27
$‘000 | |
Hear her voice - Report 2 - Women and girls’ experiences in watchhouses, on remand, and when applying for bail | | | — | | | | — | | | | — | | | | — | | | | — | |
The government is providing increased funding of $5.7 million over 4 years, held centrally, and $1.7 million per annum ongoing to improve women and girls’ experiences in watchhouses, on remand, and when applying for bail. This includes for the expansion of the provision of early bail support programs and early intervention services for women and girls to areas beyond Southeast Queensland.
This forms part of the government’s total funding package of $225 million over 5 years to respond to the recommendations of the Queensland Women’s Safety and Justice Taskforce in Hear her voice - Report 2 - Women and girls’ experiences across the criminal justice system. Further details on this package are in Chapter 1 of this paper.
| | | | | | | | | | | | | | | | | | | | |
| | | 2022-23
$‘000 | | | 2023-24
$‘000 | | | 2024-25
$‘000 | | | 2025-26
$‘000 | | | 2026-27
$‘000 | |
Youth Justice Investment - Fast-track sentencing | | | 2,089 | | | | 5,590 | | | | 1,266 | | | | — | | | | — | |
The government is providing additional funding of $8.9 million over 3 years to deliver a fast-track sentencing pilot in 4 locations for 18 months to address delays in court proceedings through proactive case management of matters (including $4.7 million for Legal Aid Queensland).
This forms part of total additional funding of $16.5 million over 4 years for these pilots.
This forms part of the government’s total funding package of $446.4 million ($441.9 million new funding and $4.5 million internally funded) over 5 years and $33.7 million per annum ongoing to help boost police resources and tackle the complex causes of youth crime and support community safety.
Further details can be found in Chapter 1 of this paper and in the Department of Child Safety, Seniors and Disability Services, Department of Education, Department of Housing, Department of the Premier and Cabinet, Department of Treaty, Aboriginal and Torres Strait Islander Partnerships, Communities and the Arts, Department of Youth Justice, Employment, Small Business and Training, Queensland Corrective Services, Queensland Health and Queensland Police Service sections of this chapter and the Queensland Police Service section of Chapter 3 Capital Measures.
67
Budget Measures 2023-24
| | | | | | | | | | | | | | | | | | | | |
| | | 2022-23
$‘000 | | | 2023-24
$‘000 | | | 2024-25
$‘000 | | | 2025-26
$‘000 | | | 2026-27
$‘000 | |
Youth Justice Investment - Enhanced Assistance for Victims of Crime | | | — | | | | 2,653 | | | | 2,080 | | | | 2,117 | | | | 2,150 | |
The government is providing increased funding of $9 million over 4 years to support victims of violent crime, including victims of domestic and family violence, and to assist in more effectively responding to the victims of property crime where violence or a threat of violence has occurred.
This forms part of the government’s total funding package of $446.4 million ($441.9 million new funding and $4.5 million internally funded) over 5 years and $33.7 million per annum ongoing to help boost police resources and tackle the complex causes of youth crime and support community safety.
Further details can be found in Chapter 1 of this paper and in the Department of Child Safety, Seniors and Disability Services, Department of Education, Department of Housing, Department of the Premier and Cabinet, Department of Treaty, Aboriginal and Torres Strait Islander Partnerships, Communities and the Arts, Department of Youth Justice, Employment, Small Business and Training, Queensland Corrective Services, Queensland Health and Queensland Police Service sections of this chapter and the Queensland Police Service section of Chapter 3 Capital Measures.
| | | | | | | | | | | | | | | | | | | | |
| | | 2022-23
$‘000 | | | 2023-24
$‘000 | | | 2024-25
$‘000 | | | 2025-26
$‘000 | | | 2026-27
$‘000 | |
Youth Justice Investment - Townsville Community Youth Response: High Risk Youth Court | | | — | | | | 2,234 | | | | 2,300 | | | | — | | | | — | |
The Government is providing increased funding of $4.5 million over 2 years to continue the specialist court established in 2017 as part of the Townsville Community Youth Response.
This forms part of total increased funding of $8 million over 2 years for the Townsville High Risk Youth Court.
This forms part of the government’s total funding package of $446.4 million ($441.9 million new funding and $4.5 million internally funded) over 5 years and $33.7 million per annum ongoing to help boost police resources and tackle the complex causes of youth crime and support community safety.
Further details can be found in Chapter 1 of this paper and in the Department of Child Safety, Seniors and Disability Services, Department of Education, Department of Housing, Department of the Premier and Cabinet, Department of Treaty, Aboriginal and Torres Strait Islander Partnerships, Communities and the Arts, Department of Youth Justice, Employment, Small Business and Training, Queensland Corrective Services, Queensland Health and Queensland Police Service sections of this chapter and the Queensland Police Service section of Chapter 3 Capital Measures.
68
Budget Measures 2023-24
| | | | | | | | | | | | | | | | | | | | |
| | | 2022-23
$‘000 | | | 2023-24
$‘000 | | | 2024-25
$‘000 | | | 2025-26
$‘000 | | | 2026-27
$‘000 | |
Youth Justice Investment - Strengthen Bail Laws: Resourcing | | | — | | | | 1,985 | | | | 2,045 | | | | — | | | | — | |
The government is providing additional funding of $4 million over 2 years to strengthen youth justice bail laws introduced by the Youth Justice and Other Legislation Amendment Bill 2021.
This forms part of the government’s total funding package of $446.4 million ($441.9 million new funding and $4.5 million internally funded) over 5 years and $33.7 million per annum ongoing to help boost police resources and tackle the complex causes of youth crime and support community safety.
Further details can be found in Chapter 1 of this paper and in the Department of Child Safety, Seniors and Disability Services, Department of Education, Department of Housing, Department of the Premier and Cabinet, Department of Treaty, Aboriginal and Torres Strait Islander Partnerships, Communities and the Arts, Department of Youth Justice, Employment, Small Business and Training, Queensland Corrective Services, Queensland Health and Queensland Police Service sections of this chapter and the Queensland Police Service section of Chapter 3 Capital Measures.
| | | | | | | | | | | | | | | | | | | | |
| | | 2022-23
$‘000 | | | 2023-24
$‘000 | | | 2024-25
$‘000 | | | 2025-26
$‘000 | | | 2026-27
$‘000 | |
Youth Justice Investment - Youth Justice Reinvestment | | | — | | | | 1,250 | | | | 1,250 | | | | 1,250 | | | | 1,250 | |
The government is providing additional funding of $5 million over 4 years from 2023-24 to establish community-led, place-based justice reinvestment initiatives to address the underlying causes of youth crime.
This forms part of the government’s total funding package of $446.4 million ($441.9 million new funding and $4.5 million internally funded) over 5 years and $33.7 million per annum ongoing to help boost police resources and tackle the complex causes of youth crime and support community safety.
Further details can be found in Chapter 1 of this paper and in the Department of Child Safety, Seniors and Disability Services, Department of Education, Department of Housing, Department of the Premier and Cabinet, Department of Treaty, Aboriginal and Torres Strait Islander Partnerships, Communities and the Arts, Department of Youth Justice, Employment, Small Business and Training, Queensland Corrective Services, Queensland Health and Queensland Police Service sections of this chapter and the Queensland Police Service section of Chapter 3 Capital Measures.
69
Budget Measures 2023-24
| | | | | | | | | | | | | | | | | | | | |
| | | 2022-23
$‘000 | | | 2023-24
$‘000 | | | 2024-25
$‘000 | | | 2025-26
$‘000 | | | 2026-27
$‘000 | |
Queensland Worker Screening Program | | | 395 | | | | 2,759 | | | | 1,838 | | | | 1,727 | | | | — | |
The government is providing additional funding of $6.7 million over 4 years to undertake transition and implementation activities to co-locate and co-administer worker screening checks.
| | | | | | | | | | | | | | | | | | | | |
| | | 2022-23
$‘000 | | | 2023-24
$‘000 | | | 2024-25
$‘000 | | | 2025-26
$‘000 | | | 2026-27
$‘000 | |
Strengthening Timely Access to Civil Justice for Vulnerable and Everyday Queenslanders | | | — | | | | 2,607 | | | | 3,523 | | | | 3,567 | | | | 3,658 | |
The government is providing increased funding of $13.4 million over 4 years and $1.2 million per annum ongoing, with a further $1.5 million ($386,000 per annum ongoing) being met internally by the department, for the Queensland Civil and Administrative Tribunal to address increasing demand, wait times and meet service demand pressures and deliver an efficient and sustainable civil system for vulnerable Queenslanders.
| | | | | | | | | | | | | | | | | | | | |
| | | 2022-23
$‘000 | | | 2023-24
$‘000 | | | 2024-25
$‘000 | | | 2025-26
$‘000 | | | 2026-27
$‘000 | |
Body Corporate and Community Management - contemporary service delivery to address demand growth in the community titles sector | | | — | | | | 1,493 | | | | 1,010 | | | | 1,041 | | | | — | |
The government is providing increased funding of $3.5 million over 3 years to support the implementation of community titles legislation reform in an environment of continued significant sector growth and increasing dispute resolution pressure.
70
Budget Measures 2023-24
| | | | | | | | | | | | | | | | | | | | |
| | | 2022-23 | | | 2023-24 | | | 2024-25 | | | 2025-26 | | | 2026-27 | |
| | | $‘000 | | | $‘000 | | | $‘000 | | | $‘000 | | | $‘000 | |
Queensland Human Rights Commission - Addressing complaint management resourcing requirements | | | — | | | | 1,318 | | | | — | | | | — | | | | — | |
The government is providing increased funding of $1.3 million for 2023-24 to enhance capacity in frontline services to manage complaints and enquiries. This will provide the additional support and relief needed by preventing further increases to wait times.
| | | | | | | | | | | | | | | | | | | | |
| | | 2022-23 | | | 2023-24 | | | 2024-25 | | | 2025-26 | | | 2026-27 | |
| | | $‘000 | | | $‘000 | | | $‘000 | | | $‘000 | | | $‘000 | |
Implementation of Cabinet Proactive Release | | | — | | | | 1,016 | | | | 1,016 | | | | 1,016 | | | | 1,016 | |
The government is providing additional funding of $4.1 million over 4 years and $1 million ongoing per annum to implement the Proactive Release Policy.
This forms part of the government’s total funding commitment of $50.8 million over 5 years from 2022-23 ($13.5 million held centrally), with $11.5 million ongoing, to deliver a package of reforms to improve integrity, accountability and transparency in government decisions and enhance the role of the Public Sector Commission and provide greater independence to integrity bodies, including the Office of the Queensland Integrity Commissioner. These reforms deliver on the recommendations in the report by Professor Coaldrake AO, Let the Sunshine In: Review of culture and accountability in the Queensland public sector, and the report by Mr Kevin Yearbury PSM, Strategic Review of the Integrity Commissioner’s Functions.
Further details can be found in the Department of the Premier and Cabinet (including the Office of the Queensland Integrity Commissioner), the Public Sector Commission, and the Office of the Queensland Ombudsman sections of this chapter.
71
Budget Measures 2023-24
| | | | | | | | | | | | | | | | | | | | |
| | | 2022-23 | | | 2023-24 | | | 2024-25 | | | 2025-26 | | | 2026-27 | |
| | | $‘000 | | | $‘000 | | | $‘000 | | | $‘000 | | | $‘000 | |
Blue Card Services - Demand Management | | | — | | | | 896 | | | | — | | | | — | | | | — | |
The government is providing increased funding of $896,000 in 2023-24 to address the increase in service demand pressures.
| | | | | | | | | | | | | | | | | | | | |
| | | 2022-23 | | | 2023-24 | | | 2024-25 | | | 2025-26 | | | 2026-27 | |
| | | $‘000 | | | $‘000 | | | $‘000 | | | $‘000 | | | $‘000 | |
Strengthen casino oversight and regulation | | | — | | | | 750 | | | | — | | | | — | | | | — | |
The government is providing additional funding of $750,000 to progress the design and implementation of a casino levy to cover the costs of casino regulation.
| | | | | | | | | | | | | | | | | | | | |
| | | 2022-23 | | | 2023-24 | | | 2024-25 | | | 2025-26 | | | 2026-27 | |
| | | $‘000 | | | $‘000 | | | $‘000 | | | $‘000 | | | $‘000 | |
Office of the Information Commissioner - Demand Pressures | | | — | | | | 736 | | | | 765 | | | | 796 | | | | 828 | |
The government is providing increased funding of $3.1 million over 4 years and $828,000 per annum ongoing to respond to the current and continuing increased demand for services.
| | | | | | | | | | | | | | | | | | | | |
| | | 2022-23 | | | 2023-24 | | | 2024-25 | | | 2025-26 | | | 2026-27 | |
| | | $‘000 | | | $‘000 | | | $‘000 | | | $‘000 | | | $‘000 | |
Child Safe Standards and Reportable Conduct Scheme | | | 179 | | | | 373 | | | | 194 | | | | — | | | | — | |
The government is providing additional funding of $746,000 over 3 years to continue project implementation work and $10 million per annum ongoing from 2023-24, held centrally, to support establishment of a Reportable Conduct Scheme and support implementation of the Child Safe Standards by non-government institutions.
72
Budget Measures 2023-24
| | | | | | | | | | | | | | | | | | | | |
| | | 2022-23 | | | 2023-24 | | | 2024-25 | | | 2025-26 | | | 2026-27 | |
| | | $‘000 | | | $‘000 | | | $‘000 | | | $‘000 | | | $‘000 | |
Increased funding to support the community legal sector | | | — | | | | 336 | | | | 336 | | | | — | | | | — | |
The government is providing increased funding of $672,000 over 2 years to support the Queensland Coronial Legal Service in the provision of legal assistance to bereaved families involved in coronial processes.
| | | | | | | | | | | | | | | | | | | | |
| | | 2022-23 | | | 2023-24 | | | 2024-25 | | | 2025-26 | | | 2026-27 | |
| | | $‘000 | | | $‘000 | | | $‘000 | | | $‘000 | | | $‘000 | |
Office of the Independent Implementation Supervisor for Commission of Inquiry into Queensland Police Service Responses to Domestic and Family Violence | | | — | | | | 329 | | | | 335 | | | | 342 | | | | 348 | |
The government is providing additional funding of $1.4 million over 4 years for the Office of the Independent Implementation Supervisor to oversee the government’s response to the Commission of Inquiry into Queensland Police Service Responses to Domestic and Family Violence.
This forms part of the government’s total funding package of $100 million, held centrally, to implement the Queensland Government’s response to A Call for Change Commission of Inquiry into Queensland Police Service responses to domestic and family violence. This investment will support a whole of government effort to deliver more victims liaison officers, more domestic and family violence support workers in police stations, more specialist domestic and family violence officers and more specialist police prosecutors. Further details of this package can be found in the Queensland Police Service section of this chapter.
| | | | | | | | | | | | | | | | | | | | |
| | | 2022-23 | | | 2023-24 | | | 2024-25 | | | 2025-26 | | | 2026-27 | |
| | | $‘000 | | | $‘000 | | | $‘000 | | | $‘000 | | | $‘000 | |
Queensland Human Rights Commission - Complaints Management System | | | — | | | | — | | | | 50 | | | | 50 | | �� | | 50 | |
The government is providing increased funding of $150,000 over 3 years and $50,000 per annum ongoing to deliver a complaint management system that will enable the delivery of information and services to clients.
The capital component of this measure can be found in Chapter 3 Capital Measures.
73
Budget Measures 2023-24
| | | | | | | | | | | | | | | | | | | | |
| | | 2022-23 | | | 2023-24 | | | 2024-25 | | | 2025-26 | | | 2026-27 | |
| | | $‘000 | | | $‘000 | | | $‘000 | | | $‘000 | | | $‘000 | |
Safe Night Precincts | | | — | | | | — | | | | — | | | | — | | | | — | |
Funding of up to $1 million per annum ongoing is being provided from the Gambling Community Benefit Fund to support the Safe Night Precinct program and implement initiatives specifically targeting women’s safety in and around licensed venues.
| | | | | | | | | | | | | | | | | | | | |
| | | 2022-23 | | | 2023-24 | | | 2024-25 | | | 2025-26 | | | 2026-27 | |
| | | $‘000 | | | $‘000 | | | $‘000 | | | $‘000 | | | $‘000 | |
Victim Liaison Services | | | — | | | | — | | | | 808 | | | | 830 | | | | 851 | |
The government will provide increased funding of $2.5 million over 3 years and $851,000 per annum ongoing to deliver victim liaison services and support information and referral services for victims of crime.
74
Budget Measures 2023-24
Department of Regional Development, Manufacturing and Water
| | | | | | | | | | | | | | | | | | | | |
| | | 2022-23
$‘000 | | | 2023-24
$‘000 | | | 2024-25
$‘000 | | | 2025-26
$‘000 | | | 2026-27
$‘000 | |
Toowoomba Water Treatment to Four Communities | | | — | | | | 5,250 | | | | 6,000 | | | | 3,000 | | | | 750 | |
The government is providing additional funding of $15 million over 4 years for the construction of water treatment and supply works to the communities of Cambooya, Greenmount, Nobby and Clifton.
This forms part of the more than $300 million funding for the Toowoomba to Warwick Pipeline project.
| | | | | | | | | | | | | | | | | | | | |
| | | 2022-23
$‘000 | | | 2023-24
$‘000 | | | 2024-25
$‘000 | | | 2025-26
$‘000 | | | 2026-27
$‘000 | |
Hydrogen Water Requirements in Gladstone - Detailed Business Case | | | — | | | | 4,000 | | | | 4,000 | | | | — | | | | — | |
The government is providing additional funding of $8 million over 2 years to develop a detailed business case for the preferred long-term bulk water supply source to meet the hydrogen industry’s water requirements in Gladstone post 2030.
| | | | | | | | | | | | | | | | | | | | |
| | | 2022-23
$‘000 | | | 2023-24
$‘000 | | | 2024-25
$‘000 | | | 2025-26
$‘000 | | | 2026-27
$‘000 | |
Strengthening First Nations Peoples’ Inclusion and Economic Development in Water Management | | | — | | | | 3,838 | | | | 3,886 | | | | 3,933 | | | | — | |
The government is providing additional funding of $11.7 million over 3 years for the development of a Water for First Nations Strategy and to develop effective strategies for engagement with First Nations Peoples on water planning and other decision-making.
75
Budget Measures 2023-24
| | | | | | | | | | | | | | | | | | | | |
| | | 2022-23
$‘000 | | | 2023-24
$‘000 | | | 2024-25
$‘000 | | | 2025-26
$‘000 | | | 2026-27
$‘000 | |
Grow Manufacturing Capacity through Energy Programs in Queensland | | | 55 | | | | 2,717 | | | | 2,728 | | | | 2,438 | | | | 962 | |
The government is providing additional funding of $8.9 million over 5 years to implement energy efficiency measures for small to medium manufacturing enterprises and undertake detailed analysis of wind farm supply chains.
This forms part of the government’s Queensland Energy and Jobs Plan.
| | | | | | | | | | | | | | | | | | | | |
| | | 2022-23
$‘000 | | | 2023-24
$‘000 | | | 2024-25
$‘000 | | | 2025-26
$‘000 | | | 2026-27
$‘000 | |
Urban Water Risk Assessment - Stage 1 | | | — | | | | 2,578 | | | | — | | | | — | | | | — | |
The government is providing additional funding of $2.6 million to complete rapid and detailed assessments of drinking water and water security risks to regional and remote communities.
| | | | | | | | | | | | | | | | | | | | |
| | | 2022-23
$‘000 | | | 2023-24
$‘000 | | | 2024-25
$‘000 | | | 2025-26
$‘000 | | | 2026-27
$‘000 | |
Southern Downs Smart Reticulation and Network Monitoring | | | 1,700 | | | | 1,700 | | | | 2,975 | | | | 1,700 | | | | 425 | |
The government is providing additional funding of $8.5 million over 5 years for installation of water monitoring across the Southern Downs reticulation network to identify where water is being lost or extracted.
This forms part of the more than $300 million funding for the Toowoomba to Warwick Pipeline project.
76
Budget Measures 2023-24
| | | | | | | | | | | | | | | | | | | | |
| | | 2022-23
$‘000 | | | 2023-24
$‘000 | | | 2024-25
$‘000 | | | 2025-26
$‘000 | | | 2026-27
$‘000 | |
Advanced Robotics in Manufacturing (ARM) Hub | | | — | | | | 621 | | | | 2,200 | | | | 2,200 | | | | 2,200 | |
The government is providing increased funding of $7.2 million over 4 years ($8.8 million over 5 years) to continue operational support to the ARM Hub.
| | | | | | | | | | | | | | | | | | | | |
| | | 2022-23
$‘000 | | | 2023-24
$‘000 | | | 2024-25
$‘000 | | | 2025-26
$‘000 | | | 2026-27
$‘000 | |
Irrigation Pricing Discount and Cap | | | — | | | | 600 | | | | 22,200 | | | | — | | | | — | |
The government is providing increased funding of $22.8 million over 2 years to continue the government’s election commitment to discount irrigation prices by 15 per cent for one additional year and as a result of the decision to cap all Sunwater and Seqwater irrigation prices at Queensland Competition Authority assessed cost recovery levels from 2023-24.
| | | | | | | | | | | | | | | | | | | | |
| | | 2022-23
$‘000 | | | 2023-24
$‘000 | | | 2024-25
$‘000 | | | 2025-26
$‘000 | | | 2026-27
$‘000 | |
Fitzroy to Gladstone Water Pipeline Administration | | | 30 | | | | 300 | | | | 585 | | | | 585 | | | | — | |
The government is providing additional funding of $1.5 million over 4 years to facilitate delivery of the Fitzroy to Gladstone water pipeline and manage state interests and risks relating to its delivery.
| | | | | | | | | | | | | | | | | | | | |
| | | 2022-23
$‘000 | | | 2023-24
$‘000 | | | 2024-25
$‘000 | | | 2025-26
$‘000 | | | 2026-27
$‘000 | |
River Improvement Trusts | | | — | | | | 300 | | | | — | | | | — | | | | — | |
The government is providing increased funding of $300,000 to continue operational support for River Improvement Trusts.
77
Budget Measures 2023-24
| | | | | | | | | | | | | | | | | | | | |
| | | 2022-23
$‘000 | | | 2023-24
$‘000 | | | 2024-25
$‘000 | | | 2025-26
$‘000 | | | 2026-27
$‘000 | |
Toowoomba to Warwick Pipeline Administration | | | 50 | | | | 200 | | | | 300 | | | | 300 | | | | 150 | |
The government is providing additional funding of $1 million over 5 years to facilitate delivery of the Toowoomba to Warwick Pipeline and manage state interests and risks relating to its delivery.
78
Budget Measures 2023-24
Department of Resources
| | | | | | | | | | | | | | | | | | | | |
| | | 2022-23
$‘000 | | | 2023-24
$‘000 | | | 2024-25
$‘000 | | | 2025-26
$‘000 | | | 2026-27
$‘000 | |
Abandoned Mine Sites Program | | | — | | | | 13,425 | | | | 6,000 | | | | — | | | | — | |
The government is providing increased funding of $19.4 million over 2 years to continue decommissioning activities at the underground coal gasification project sites at Hopeland (formerly Linc Energy) and Bloodwood Creek (formerly Carbon Energy), and manage safety, health and environmental risks at other high-risk abandoned mine sites. The capital component of this measure can be found in Chapter 3 Capital Measures.
| | | | | | | | | | | | | | | | | | | | |
| | | 2022-23
$‘000 | | | 2023-24
$‘000 | | | 2024-25
$‘000 | | | 2025-26
$‘000 | | | 2026-27
$‘000 | |
Enhanced Vegetation Compliance | | | — | | | | 1,573 | | | | 2,679 | | | | 2,743 | | | | 2,798 | |
The government is providing additional funding of $9.8 million over 4 years to implement an enhanced vegetation compliance model to reduce emissions from unexplained land clearing as part of the government’s commitment to achieve emissions reductions targets.
| | | | | | | | | | | | | | | | | | | | |
| | | 2022-23
$‘000 | | | 2023-24
$‘000 | | | 2024-25
$‘000 | | | 2025-26
$‘000 | | | 2026-27
$‘000 | |
Frontier Gas Exploration Program | | | — | | | | 517 | | | | 20,528 | | | | — | | | | — | |
The government is providing additional funding of $21 million over 2 years to implement the Frontier Gas Exploration grants program to support appraisal activities to unlock significant gas resources in the Bowen and Galilee basins.
79
Budget Measures 2023-24
Department of State Development, Infrastructure, Local Government and Planning
| | | | | | | | | | | | | | | | | | | | |
| | | 2022-23
$‘000 | | | 2023-24
$‘000 | | | 2024-25
$‘000 | | | 2025-26
$‘000 | | | 2026-27
$‘000 | |
Resources Community Infrastructure Fund | | | — | | | | 118,200 | | | | — | | | | — | | | | — | |
The government is providing increased funding of $118.2 million in 2023-24 for Round 3 of the Resources Community Infrastructure Fund.
This brings the government’s commitment for Round 3 to $120 million, with total funding of $220 million over 5 years for the Resources Community Infrastructure Fund, in partnership with industry, to support improvements in economic and social infrastructure across Queensland’s resources communities. Further detail can be found in the Department of Transport and Main Roads section of this chapter.
| | | | | | | | | | | | | | | | | | | | |
| | | 2022-23
$‘000 | | | 2023-24
$‘000 | | | 2024-25
$‘000 | | | 2025-26
$‘000 | | | 2026-27
$‘000 | |
Industry Partnership Program | | | — | | | | 53,539 | | | | — | | | | — | | | | — | |
The government is providing increased funding of $53.5 million to expand the Industry Partnership Program to incentivise emerging industries, target supply chain gaps, create jobs and strengthen Queensland’s economy though the transition to decarbonisation.
| | | | | | | | | | | | | | | | | | | | |
| | | 2022-23
$‘000 | | | 2023-24
$‘000 | | | 2024-25
$‘000 | | | 2025-26
$‘000 | | | 2026-27
$‘000 | |
Disaster Resilience | | | — | | | | 28,543 | | | | 28,543 | | | | 14,272 | | | | — | |
The government is providing additional funding of $131.4 million over 3 years, including $60 million held centrally, subject to further government consideration, from the Disaster Recovery Funding Arrangements Efficiencies jointly funded by the Queensland and Australian Governments. This will deliver a suite of programs and projects to enhance Queensland’s disaster resilience, mitigate risk and create stronger and safer communities.
This forms part of the government’s total investment of $152 million from the Disaster Recovery Funding Arrangements Efficiencies. Further detail can be found in the Department of Energy and Public Works section of this chapter.
80
Budget Measures 2023-24
| | | | | | | | | | | | | | | | | | | | |
| | | 2022–23 | | | 2023–24 | | | 2024–25 | | | 2025–26 | | | 2026–27 | |
| | | $‘000 | | | $‘000 | | | $‘000 | | | $‘000 | | | $‘000 | |
Indigenous Council Funding Program | | | — | | | | 25,800 | | | | — | | | | — | | | | — | |
The government is providing additional funding of $25.8 million for the Indigenous Council Funding Program initiative to support the sustainability challenges facing Indigenous local governments and assist in the delivery of essential local government services.
| | | | | | | | | | | | | | | | | | | | |
| | | 2022–23 | | | 2023–24 | | | 2024–25 | | | 2025–26 | | | 2026–27 | |
| | | $‘000 | | | $‘000 | | | $‘000 | | | $‘000 | | | $‘000 | |
Regional Industrial Land Improvement Program | | | — | | | | 15,000 | | | | 20,000 | | | | 10,000 | | | | — | |
The government is providing additional funding of $45 million over 3 years for the Regional Industrial Land Improvement Program to develop land in Mackay and support the development of the hydrogen industry in Gladstone.
| | | | | | | | | | | | | | | | | | | | |
| | | 2022–23 | | | 2023–24 | | | 2024–25 | | | 2025–26 | | | 2026–27 | |
| | | $‘000 | | | $‘000 | | | $‘000 | | | $‘000 | | | $‘000 | |
Sanofi Translational Science Hub | | | 5,440 | | | | 12,240 | | | | 12,240 | | | | 14,520 | | | | 11,800 | |
The government is providing additional funding of $65 million over 6 years to establish a world-first research centre in Brisbane. The $280 million Translational Science Hub will be established under an agreement between Sanofi, the University of Queensland, Griffith University and the Queensland Government.
81
Budget Measures 2023-24
| | | | | | | | | | | | | | | | | | | | |
| | | 2022–23 | | | 2023–24 | | | 2024–25 | | | 2025–26 | | | 2026–27 | |
| | | $‘000 | | | $‘000 | | | $‘000 | | | $‘000 | | | $‘000 | |
Resilient Homes Fund | | | — | | | | 8,257 | | | | 8,257 | | | | 4,128 | | | | — | |
The government is providing increased funding of $20.6 million over 3 years from the Disaster Recovery Funding Arrangements Efficiencies, jointly funded by the Queensland and Australian Governments. The package will support Queensland homeowners to improve the resilience of their residential property, following significant flood events in the 2021-22 disaster season.
This forms part of the government’s total investment of $152 million from the Disaster Recovery Funding Arrangements Efficiencies. Further detail can be found in the Department of Energy and Public Works section of this chapter.
| | | | | | | | | | | | | | | | | | | | |
| | | 2022–23 | | | 2023–24 | | | 2024–25 | | | 2025–26 | | | 2026–27 | |
| | | $‘000 | | | $‘000 | | | $‘000 | | | $‘000 | | | $‘000 | |
Queensland Energy and Jobs Plan | | | — | | | | 6,850 | | | | 16,850 | | | | 32,000 | | | | 50,000 | |
The government is providing additional funding of $205.7 million over 5 years including $200 million to establish the Regional Economic Futures Fund, $1.7 million to investigate renewable energy precincts and recycling and manufacturing opportunities and $4 million to advance Queensland’s bioenergy future by supporting technical studies into options to expand bioenergy generation. These programs are part of the Queensland Energy and Jobs Plan.
| | | | | | | | | | | | | | | | | | | | |
| | | 2022–23 | | | 2023–24 | | | 2024–25 | | | 2025–26 | | | 2026–27 | |
| | | $‘000 | | | $‘000 | | | $‘000 | | | $‘000 | | | $‘000 | |
Rockhampton Regional Council (Mount Morgan Water Supply) | | | 5,400 | | | | 5,400 | | | | — | | | | — | | | | — | |
The government is providing additional funding of $10.8 million over 2 years to support the Rockhampton Regional Council to transport drinking water from the Gracemere Water Treatment Plant to the Mount Morgan Water Treatment Plant.
82
Budget Measures 2023-24
| | | | | | | | | | | | | | | | | | | | |
| | | 2022–23 | | | 2023–24 | | | 2024–25 | | | 2025–26 | | | 2026–27 | |
| | | $‘000 | | | $‘000 | | | $‘000 | | | $‘000 | | | $‘000 | |
South East Queensland Digital Twin | | | — | | | | 5,000 | | | | — | | | | — | | | | — | |
The government is providing additional funding of $5 million to deliver a pilot on 2032 venues, precincts and transport connections as proof-of-concept for the South East Queensland Digital Twin.
| | | | | | | | | | | | | | | | | | | | |
| | | 2022–23 | | | 2023–24 | | | 2024–25 | | | 2025–26 | | | 2026–27 | |
| | | $‘000 | | | $‘000 | | | $‘000 | | | $‘000 | | | $‘000 | |
Housing Site Investigations | | | — | | | | 4,000 | | | | 3,500 | | | | — | | | | — | |
The government is providing additional funding of $7.5 million over 2 years to support Economic Development Queensland to undertake detailed site investigations of mixed tenure residential and housing developments, including social and affordable housing.
| | | | | | | | | | | | | | | | | | | | |
| | | 2022–23 | | | 2023–24 | | | 2024–25 | | | 2025–26 | | | 2026–27 | |
| | | $‘000 | | | $‘000 | | | $‘000 | | | $‘000 | | | $‘000 | |
Barcaldine Renewable Energy Zone | | | — | | | | 3,500 | | | | 3,500 | | | | — | | | | — | |
The government is providing additional funding of $7 million over 2 years to support the establishment of the Barcaldine Renewable Energy Zone precinct.
| | | | | | | | | | | | | | | | | | | | |
| | | 2022–23 | | | 2023–24 | | | 2024–25 | | | 2025–26 | | | 2026–27 | |
| | | $‘000 | | | $‘000 | | | $‘000 | | | $‘000 | | | $‘000 | |
Kenrick Park Masterplan Stage 1 | | | — | | | | 3,000 | | | | — | | | �� | — | | | | — | |
The government is providing additional funding of $3 million for the delivery of the Kenrick Park Masterplan Stage 1, including site preparation, service connection, recreational infrastructure and arboretum, subject to matched funding from Cairns Regional Council.
83
Budget Measures 2023-24
| | | | | | | | | | | | | | | | | | | | |
| | | 2022–23 | | | 2023–24 | | | 2024–25 | | | 2025–26 | | | 2026–27 | |
| | | $‘000 | | | $‘000 | | | $‘000 | | | $‘000 | | | $‘000 | |
Regional Infrastructure Plans | | | — | | | | 2,100 | | | | 437 | | | | 536 | | | | 538 | |
The government is providing additional funding of $3.6 million over 4 years to support the delivery of regional infrastructure plans throughout Queensland and the development of a robust benefits realisation and evaluation framework.
| | | | | | | | | | | | | | | | | | | | |
| | | 2022–23 | | | 2023–24 | | | 2024–25 | | | 2025–26 | | | 2026–27 | |
| | | $‘000 | | | $‘000 | | | $‘000 | | | $‘000 | | | $‘000 | |
Office of the Independent Assessor | | | — | | | | 1,702 | | | | 1,684 | | | | 1,744 | | | | 1,764 | |
The government is providing increased funding of $6.9 million over 4 years and $1.8 million per annum ongoing, to support the delivery of recommendations from the State Development and Regional Industries Committee Inquiry into the Independent Assessor and councillor conduct complaints system.
| | | | | | | | | | | | | | | | | | | | |
| | | 2022–23 | | | 2023–24 | | | 2024–25 | | | 2025–26 | | | 2026–27 | |
| | | $‘000 | | | $‘000 | | | $‘000 | | | $‘000 | | | $‘000 | |
Trinity Beach Community Activity Space | | | — | | | | 935 | | | | — | | | | — | | | | — | |
The government is providing additional funding of $935,000 for the delivery of the Trinity Beach Community Activity Space to create a space for residents to connect, gather, learn, share and play, subject to matched funding from Cairns Regional Council.
| | | | | | | | | | | | | | | | | | | | |
| | | 2022–23 | | | 2023–24 | | | 2024–25 | | | 2025–26 | | | 2026–27 | |
| | | $‘000 | | | $‘000 | | | $‘000 | | | $‘000 | | | $‘000 | |
Currumbin Eco-Parkland | | | — | | | | 875 | | | | 882 | | | | 889 | | | | 550 | |
The government is providing increased funding of up to $3.8 million over 5 years for the Currumbin Eco-Parkland. This forms part of the government’s total funding of $46 million over 5 years to support the Currumbin Eco-Parkland.
Further details can be found in the Department of Environment and Science section of this chapter. The capital component of this measure can be found in Chapter 3 Capital measures.
84
Budget Measures 2023-24
| | | | | | | | | | | | | | | | | | | | |
| | | 2022–23 | | | 2023–24 | | | 2024–25 | | | 2025–26 | | | 2026–27 | |
| | | $‘000 | | | $‘000 | | | $‘000 | | | $‘000 | | | $‘000 | |
Torres Strait Ferry Funding Program | | | — | | | | 500 | | | | — | | | | — | | | | — | |
The government is providing additional funding of $500,000 to support the Torres Strait Island Regional Council’s critical maintenance activities and ensure continuity of ferry services for the local community.
| | | | | | | | | | | | | | | | | | | | |
| | | 2022–23 | | | 2023–24 | | | 2024–25 | | | 2025–26 | | | 2026–27 | |
| | | $‘000 | | | $‘000 | | | $‘000 | | | $‘000 | | | $‘000 | |
Cairns Shipyards Upgrades | | | — | | | | — | | | | — | | | | — | | | | — | |
The government is providing additional funding of $12 million over 2 years from 2023-24, held centrally, for use by existing Cairns shipyards to upgrade facilities within the Cairns Marine Precinct, subject to matched industry funding and satisfactory business cases.
| | | | | | | | | | | | | | | | | | | | |
| | | 2022–23 | | | 2023–24 | | | 2024–25 | | | 2025–26 | | | 2026–27 | |
| | | $‘000 | | | $‘000 | | | $‘000 | | | $‘000 | | | $‘000 | |
Emergency Management Reforms - Queensland Reconstruction Authority | | | — | | | | — | | | | — | | | | — | | | | — | |
The government is providing increased funding for the Queensland Reconstruction Authority, held centrally, to continue to improve Queensland’s preparedness and response to emergency and disaster events.
This forms part of the government’s total funding package of up to $578 million ($493.2 million held centrally) over 5 years and $142 million per annum ongoing, to deliver enhanced emergency and fire services for a safer Queensland.
The government’s investment, in response to the Independent Review of Queensland Fire and Emergency Services, will provide for an uplift of over 500 full time emergency services staff, the establishment of a new Queensland fire department and provide support for our volunteers in Marine Rescue Queensland, the State Emergency Service and the Rural Fire Brigade. Implementation of these reforms is being overseen by the Reform Implementation Taskforce, including developing the ongoing operating and funding models beyond 2023-24.
Further details can be found in Chapter 3 Capital Measures of this paper and in the Queensland Police Service and Queensland Fire and Emergency Services sections of this chapter.
85
Budget Measures 2023-24
| | | | | | | | | | | | | | | | | | | | |
| | | 2022–23 | | | 2023–24 | | | 2024–25 | | | 2025–26 | | | 2026–27 | |
| | | $‘000 | | | $‘000 | | | $‘000 | | | $‘000 | | | $‘000 | |
ShapingSEQ | | | — | | | | — | | | | — | | | | — | | | | — | |
The government is providing additional funding of $2.5 million over 2 years to review the South East Queensland Regional Plan (ShapingSEQ), to ensure land and housing supply settings are fit for purpose and responsive to current growth, and to provide for an enhanced framework to engage with councils to accelerate the delivery of increased housing.
This forms part of the government’s total funding of $56 million over 2 years, with funding allocated from a whole-of-government provision, to deliver outcomes from the Queensland Housing Summit.
| | | | | | | | | | | | | | | | | | | | |
| | | 2022–23 | | | 2023–24 | | | 2024–25 | | | 2025–26 | | | 2026–27 | |
| | | $‘000 | | | $‘000 | | | $‘000 | | | $‘000 | | | $‘000 | |
Supporting Housing Diversity | | | — | | | | — | | | | — | | | | — | | | | — | |
The government is providing additional funding of $3.5 million in 2023-24 for a community engagement campaign in partnership with local government and industry. Funding of $1.5 million over 2 years is being met internally by the department to complete the program. Total funding to Support Housing Diversity is $5 million over 2 years from 2022-23.
This forms part of the government’s total funding of $56 million over 2 years, with funding allocated from a whole-of-government provision, to deliver outcomes from the Queensland Housing Summit.
| | | | | | | | | | | | | | | | | | | | |
| | | 2022–23 | | | 2023–24 | | | 2024–25 | | | 2025–26 | | | 2026–27 | |
| | | $‘000 | | | $‘000 | | | $‘000 | | | $‘000 | | | $‘000 | |
Toowoomba to Warwick Pipeline | | | 1,500 | | | | — | | | | — | | | | — | | | | — | |
The government has provided additional funding of $1.5 million for operational costs associated with the Toowoomba to Warwick Pipeline compulsory land acquisitions.
86
Budget Measures 2023-24
Department of the Premier and Cabinet
| | | | | | | | | | | | | | | | | | | | |
| | | 2022–23 | | | 2023–24 | | | 2024–25 | | | 2025–26 | | | 2026–27 | |
| | | $‘000 | | | $‘000 | | | $‘000 | | | $‘000 | | | $‘000 | |
Brisbane 2032 Coordination Office | | | — | | | | 36,841 | | | | 19,104 | | | | 19,942 | | | | 24,373 | |
The government is providing additional funding of $100.3 million over four years and $13.6 million per year ongoing from 2027-28, for delivering the Brisbane 2032 Games. The Brisbane 2032 Coordination Office will oversee key aspects of Games preparations. This includes planning and designing infrastructure like venues and athletes’ villages, as well as transport, environment, legacy, First Nations and security. The Coordination Office will also work closely with the Organising Committee for the Brisbane 2032 Olympic and Paralympic Games to ensure Government meets its contractual commitments to the International Olympic Committee.
| | | | | | | | | | | | | | | | | | | | |
| | | 2022–23 | | | 2023–24 | | | 2024–25 | | | 2025–26 | | | 2026–27 | |
| | | $‘000 | | | $‘000 | | | $‘000 | | | $‘000 | | | $‘000 | |
Screen Queensland - Production Attraction Strategy | | | — | | | | 28,000 | | | | — | | | | — | | | | — | |
The government is providing increased funding of $28 million for the Production Attraction Strategy to help grow a pipeline of large-scale film and high-end television productions in Queensland.
| | | | | | | | | | | | | | | | | | | | |
| | | 2022–23 | | | 2023–24 | | | 2024–25 | | | 2025–26 | | | 2026–27 | |
| | | $‘000 | | | $‘000 | | | $‘000 | | | $‘000 | | | $‘000 | |
Screen Queensland - Post, Digital and Visual Effects | | | — | | | | 8,000 | | | | — | | | | — | | | | — | |
The government is providing increased funding of $8 million to continue the Post, Digital and Visual Effects (PDV) incentive to harness the economic, industry and employment benefits of Queensland’s PDV industry.
87
Budget Measures 2023-24
| | | | | | | | | | | | | | | | | | | | |
| | | 2022–23 | | | 2023–24 | | | 2024–25 | | | 2025–26 | | | 2026–27 | |
| | | $‘000 | | | $‘000 | | | $‘000 | | | $‘000 | | | $‘000 | |
Screen Queensland - Digital Games Program | | | — | | | | 2,000 | | | | — | | | | — | | | | — | |
The government is providing increased funding of $2 million in 2023-24 for the Digital Games Program, designed to harness the economic, industry and employment benefits of Queensland’s growing games industry. Funding of $2 million in 2023-24 is being met internally by Screen Queensland, bringing total funding for this program to $4 million in 2023-24.
| | | | | | | | | | | | | | | | | | | | |
| | | 2022–23 | | | 2023–24 | | | 2024–25 | | | 2025–26 | | | 2026–27 | |
| | | $‘000 | | | $‘000 | | | $‘000 | | | $‘000 | | | $‘000 | |
Screen Queensland - Aboriginal and Torres Strait Islander Screen Program | | | — | | | | 500 | | | | — | | | | — | | | | — | |
The government is providing additional funding of $500,000 to develop an Aboriginal and Torres Strait Islander Screen Program to build, expand and empower Queensland’s Aboriginal and Torres Strait Islander screen industry.
| | | | | | | | | | | | | | | | | | | | |
| | | 2022–23 | | | 2023–24 | | | 2024–25 | | | 2025–26 | | | 2026–27 | |
| | | $‘000 | | | $‘000 | | | $‘000 | | | $‘000 | | | $‘000 | |
Implementation of the Cabinet Proactive Release | | | — | | | | 2,338 | | | | 1,210 | | | | 1,248 | | | | 1,277 | |
The government is providing additional funding of $6.1 million over four years and $1.3 million per annum ongoing to implement the Coaldrake Report recommendation that Cabinet material be proactively released, including $649,000 in 2023-24 to support the continuation of the Integrity Reform Taskforce.
This forms part of the government’s total funding commitment of $50.8 million over 5 years from 2022-23 ($13.5 million held centrally), with $11.5 million ongoing, to deliver a package of reforms to improve integrity, accountability and transparency in government decisions and enhance the role of the Public Sector Commission and provide greater independence to integrity bodies, including the Office of the Queensland Integrity Commissioner. These reforms deliver on the recommendations in the report by Professor Coaldrake AO, Let the Sunshine In: Review of culture and accountability in the Queensland public sector, and the report by Mr Kevin Yearbury PSM, Strategic Review of the Integrity Commissioner’s Functions.
Further details can be found in the Public Sector Commission, the Department of Justice and Attorney-General and the Office of the Queensland Ombudsman sections of this chapter.
88
Budget Measures 2023-24
| | | | | | | | | | | | | | | | | | | | |
| | | 2022–23 | | | 2023–24 | | | 2024–25 | | | 2025–26 | | | 2026–27 | |
| | | $‘000 | | | $‘000 | | | $‘000 | | | $‘000 | | | $‘000 | |
Screen Queensland - Studios Hemmant | | | — | | | | 2,000 | | | | 2,000 | | | | 3,000 | | | | — | |
The government is providing increased funding of $7 million over 3 years to continue the operation of the Screen Queensland Studios in Hemmant.
| | | | | | | | | | | | | | | | | | | | |
| | | 2022–23 | | | 2023–24 | | | 2024–25 | | | 2025–26 | | | 2026–27 | |
| | | $‘000 | | | $‘000 | | | $‘000 | | | $‘000 | | | $‘000 | |
All hazards disaster and crisis management capability | | | — | | | | 1,000 | | | | 1,000 | | | | 1,000 | | | | 1,000 | |
The government is providing additional funding of $4 million over 4 years and $1 million ongoing to enhance the all hazards disaster and crisis management capability.
| | | | | | | | | | | | | | | | | | | | |
| | | 2022–23 | | | 2023–24 | | | 2024–25 | | | 2025–26 | | | 2026–27 | |
| | | $‘000 | | | $‘000 | | | $‘000 | | | $‘000 | | | $‘000 | |
Demand for Legislative drafting, editing, and publishing services | | | — | | | | 886 | | | | 908 | | | | 937 | | | | 961 | |
The government is providing increased funding of $3.7 million over 4 years and $961,000 per annum ongoing to the Office of the Queensland Parliamentary Counsel to meet demand for legislative drafting, editing, and publishing services.
| | | | | | | | | | | | | | | | | | | | |
| | | 2022–23 | | | 2023–24 | | | 2024–25 | | | 2025–26 | | | 2026–27 | |
| | | $‘000 | | | $‘000 | | | $‘000 | | | $‘000 | | | $‘000 | |
Domestic and Family Violence (DFV) Prevention Council | | | — | | | | 849 | | | | 1,154 | | | | 1,167 | | | | 283 | |
The government is providing increased funding of $3.5 million over 4 years for the continuation of monitoring and evaluation activities and to support the operation of the DFV Prevention Council, for the remainder of the DFV Strategy 2016-2026.
89
Budget Measures 2023-24
| | | | | | | | | | | | | | | | | | | | |
| | | 2022–23 | | | 2023–24 | | | 2024–25 | | | 2025–26 | | | 2026–27 | |
| | | $‘000 | | | $‘000 | | | $‘000 | | | $‘000 | | | $‘000 | |
Queensland Integrity Commissioner reforms | | | — | | | | 676 | | | | 471 | | | | 495 | | | | 501 | |
The government is providing additional funding of $4.1 million over 5 years from 2022-23, including $2 million held centrally, and $958,000 per annum ongoing from 2027-28 to enhance the functions of the Office of the Queensland Integrity Commissioner (OQIC) in relation to capability and competency building across the public sector and support the OQIC’s independence.
This forms part of the government’s total funding commitment of $50.8 million over 5 years from 2022-23 ($13.5 million held centrally), with $11.5 million ongoing, to deliver a package of reforms to improve integrity, accountability and transparency in government decisions and enhance the role of the Public Sector Commission and provide greater independence to integrity bodies, including the Office of the Queensland Integrity Commissioner. These reforms deliver on the recommendations in the report by Professor Coaldrake AO, Let the Sunshine In: Review of culture and accountability in the Queensland public sector, and the report by Mr Kevin Yearbury PSM, Strategic Review of the Integrity Commissioner’s Functions.
Further details can be found in the Public Sector Commission, the Department of Justice and Attorney-General and the Office of the Queensland Ombudsman sections of this chapter.
| | | | | | | | | | | | | | | | | | | | |
| | | 2022–23 | | | 2023–24 | | | 2024–25 | | | 2025–26 | | | 2026–27 | |
| | | $‘000 | | | $‘000 | | | $‘000 | | | $‘000 | | | $‘000 | |
Queensland Community Forum Program | | | — | | | | 451 | | | | 643 | | | | — | | | | — | |
The government is providing increased funding of $1.1 million over 2 years to expand the Queensland Community Forum Program to support the Gold Coast and Sunshine Coast regions. Funding of $200,000 is being met internally by the department.
90
Budget Measures 2023-24
| | | | | | | | | | | | | | | | | | | | |
| | | 2022–23 | | | 2023–24 | | | 2024–25 | | | 2025–26 | | | 2026–27 | |
| | | $‘000 | | | $‘000 | | | $‘000 | | | $‘000 | | | $‘000 | |
Youth Justice Investment - Early intervention and prevention coordination in Mount Isa and Toowoomba | | | — | | | | 400 | | | | — | | | | — | | | | — | |
The government is providing additional funding of $400,000 to scope and support enhanced coordination of youth justice, early intervention and prevention services in Mount Isa and Toowoomba.
This forms part of the government’s total funding package of $446.4 million ($441.9 million new funding and $4.5 million internally funded) over 5 years and $33.7 million per annum ongoing to help boost police resources and tackle the complex causes of youth crime and support community safety.
Further details can be found in Chapter 1 of this paper and in the Department of Child Safety, Seniors and Disability Services, Department of Education, Department of Housing, Department of Justice and Attorney-General, Department of Treaty, Aboriginal and Torres Strait Islander Partnerships, Communities and the Arts, Department of Youth Justice, Employment Small Business and Training, Queensland Corrective Services, Queensland Health and Queensland Police Service sections of this chapter and the Queensland Police Service section of Chapter 3 Capital Measures.
| | | | | | | | | | | | | | | | | | | | |
| | | 2022–23 | | | 2023–24 | | | 2024–25 | | | 2025–26 | | | 2026–27 | |
| | | $‘000 | | | $‘000 | | | $‘000 | | | $‘000 | | | $‘000 | |
Office of the Governor | | | — | | | | 381 | | | | 369 | | | | 277 | | | | 284 | |
The government is providing additional funding of $1.3 million over 4 years and $284,000 per annum ongoing to meet increased Office of the Governor commitments.
| | | | | | | | | | | | | | | | | | | | |
| | | 2022–23 | | | 2023–24 | | | 2024–25 | | | 2025–26 | | | 2026–27 | |
| | | $‘000 | | | $‘000 | | | $‘000 | | | $‘000 | | | $‘000 | |
Policy Insights Analytical Capability | | | — | | | | 351 | | | | 358 | | | | 369 | | | | 378 | |
The government is providing increased funding of $1.5 million over 4 years and $378,000 per annum ongoing to support the newly established Policy Insights analytical capability function to support a responsive government in developing policy solutions and ensuring better service outcomes for Queensland.
91
Budget Measures 2023-24
| | | | | | | | | | | | | | | | | | | | |
| | | 2022–23 | | | 2023–24 | | | 2024–25 | | | 2025–26 | | | 2026–27 | |
| | | $‘000 | | | $‘000 | | | $‘000 | | | $‘000 | | | $‘000 | |
Queensland Remembers Grants Program | | | — | | | | 164 | | | | 171 | | | | 1,526 | | | | — | |
The government is providing increased funding of $1.9 million over 3 years to extend the Queensland Remembers Grants Program.
| | | | | | | | | | | | | | | | | | | | |
| | | 2022–23 | | | 2023–24 | | | 2024–25 | | | 2025–26 | | | 2026–27 | |
| | | $‘000 | | | $‘000 | | | $‘000 | | | $‘000 | | | $‘000 | |
Paralympic Centre of Excellence | | | — | | | | — | | | | — | | | | — | | | | — | |
The government has committed to providing additional funding of $44 million, to be held centrally pending finalisation of funding agreements, to support the University of Queensland (UQ) to deliver a world leading Paralympic Centre of Excellence at its St Lucia campus. The Centre will provide a powerful legacy for the Brisbane 2032 Olympic and Paralympic Games, and the paralympic movement more generally, by creating a world-first facility that combines sport, rehabilitation, movement services, research and education facilities all in one space.
The Centre will help facilitate participation and training by para-athletes, which will include international standard sport facilities for all levels of ability, a wheelchair and prosthetics workshop and dedicated testing facilities and world-class research and education facilities.
| | | | | | | | | | | | | | | | | | | | |
| | | 2022–23 | | | 2023–24 | | | 2024–25 | | | 2025–26 | | | 2026–27 | |
| | | $‘000 | | | $‘000 | | | $‘000 | | | $‘000 | | | $‘000 | |
Youth Justice Investment - Independent Evaluation | | | — | | | | — | | | | — | | | | — | | | | — | |
The government is providing additional funding of $10 million over 3 years, held centrally, to support a comprehensive independent evaluation of the government’s youth justice response.
This forms part of the government’s total funding package of $446.4 million ($441.9 million new funding and $4.5 million internally funded) over 5 years and $33.7 million per annum ongoing to help boost police resources and tackle the complex causes of youth crime and support community safety.
Further details can be found in Chapter 1 of this paper and in the Department of Child Safety, Seniors and Disability Services, Department of Education, Department of Housing, Department of Justice and Attorney-General, Department of Treaty, Aboriginal and Torres Strait Islander Partnerships, Communities and the Arts, Department of Youth Justice, Employment Small Business and Training, Queensland Corrective Services, Queensland Health and Queensland Police Service sections of this chapter and the Queensland Police Service section of Chapter 3 Capital Measures.
92
Budget Measures 2023-24
Department of Tourism, Innovation and Sport
| | | | | | | | | | | | | | | | | | | | |
| | | 2022–23 | | | 2023–24 | | | 2024–25 | | | 2025–26 | | | 2026–27 | |
| | | $‘000 | | | $‘000 | | | $‘000 | | | $‘000 | | | $‘000 | |
Tourism and Events Queensland’s Funding | | | — | | | | 53,114 | | | | 73,123 | | | | 72,927 | | | | 72,726 | |
The government is providing increased funding of $271.9 million over 4 years to deliver on its objectives as required under the Tourism and Events Queensland Act 2012 and to contribute to the delivery of the Towards Tourism 2032: Transforming Queensland’s visitor economy future strategy.
| | | | | | | | | | | | | | | | | | | | |
| | | 2022–23 | | | 2023–24 | | | 2024–25 | | | 2025–26 | | | 2026–27 | |
| | | $‘000 | | | $‘000 | | | $‘000 | | | $‘000 | | | $‘000 | |
Browne Park | | | 2,000 | | | | 33,000 | | | | 19,326 | | | | — | | | | — | |
The government is providing additional funding of $54.3 million over 3 years for stage one of the redevelopment of Browne Park being the home of Rugby League in Central Queensland, and also hosting a range of other sporting and entertainment events.
| | | | | | | | | | | | | | | | | | | | |
| | | 2022–23 | | | 2023–24 | | | 2024–25 | | | 2025–26 | | | 2026–27 | |
| | | $‘000 | | | $‘000 | | | $‘000 | | | $‘000 | | | $‘000 | |
Tourism Experience and Infrastructure Grants Program | | | — | | | | 20,000 | | | | — | | | | — | | | | — | |
The government is providing additional funding of $20 million to support tourism experience development in priority areas with focus on First Nations, sustainability, eco/nature, accessibility and paleo.
93
Budget Measures 2023-24
| | | | | | | | | | | | | | | | | | | | |
| | | 2022–23 | | | 2023–24 | | | 2024–25 | | | 2025–26 | | | 2026–27 | |
| | | $‘000 | | | $‘000 | | | $‘000 | | | $‘000 | | | $‘000 | |
2023 Year of Accessible Tourism | | | 1,500 | | | | 10,500 | | | | — | | | | — | | | | — | |
The government is providing additional funding of $12 million over 2 years for the 2023 Year of Accessible Tourism to deliver the Accessible Tourism Fund, increase awareness and capability, and for visitor experience development.
| | | | | | | | | | | | | | | | | | | | |
| | | 2022–23 | | | 2023–24 | | | 2024–25 | | | 2025–26 | | | 2026–27 | |
| | | $‘000 | | | $‘000 | | | $‘000 | | | $‘000 | | | $‘000 | |
Sport Infrastructure Program | | | — | | | | 10,000 | | | | — | | | | — | | | | — | |
The government is providing additional funding of $10 million for an Infrastructure Program to support the delivery of priority infrastructure projects that enhance the accessibility, safety, and inclusiveness of community level sport and active recreation infrastructure, including for females and people with disability.
| | | | | | | | | | | | | | | | | | | | |
| | | 2022–23 | | | 2023–24 | | | 2024–25 | | | 2025–26 | | | 2026–27 | |
| | | $‘000 | | | $‘000 | | | $‘000 | | | $‘000 | | | $‘000 | |
Sport and Recreation Infrastructure | | | — | | | | 7,000 | | | | 1,000 | | | | — | | | | — | |
The government is providing additional funding of $8 million over 2 years to finalise delivery of in progress, approved projects, and to improve Scouts and Girls Guides infrastructure.
| | | | | | | | | | | | | | | | | | | | |
| | | 2022–23 | | | 2023–24 | | | 2024–25 | | | 2025–26 | | | 2026–27 | |
| | | $‘000 | | | $‘000 | | | $‘000 | | | $‘000 | | | $‘000 | |
FairPlay | | | — | | | | 2,384 | | | | 2,384 | | | | — | | | | — | |
The government is providing increased funding of $4.8 million over 2 years to expand the FairPlay voucher program to support swimming lessons for 0 to 4 year olds who meet the FairPlay eligibility criteria.
94
Budget Measures 2023-24
| | | | | | | | | | | | | | | | | | | | |
| | | 2022–23 | | | 2023–24 | | | 2024–25 | | | 2025–26 | | | 2026–27 | |
| | | $‘000 | | | $‘000 | | | $‘000 | | | $‘000 | | | $‘000 | |
Women’s Economic Security: Female Founders | | | — | | | | 2,000 | | | | 3,000 | | | | — | | | | — | |
The government is providing increased funding of $5 million over 2 years to expand on the pilot of the Female Founders Co-Investment Fund and the existing Accelerating Female Founders program. This forms part of the government’s total funding of $16.3 million over 4 years for the Women’s Economic Security package. Further details on this package are in Chapter 1 of this paper and the Department of Youth Justice, Employment, Small Business and Training and the Queensland Health sections of this chapter.
| | | | | | | | | | | | | | | | | | | | |
| | | 2022–23 | | | 2023–24 | | | 2024–25 | | | 2025–26 | | | 2026–27 | |
| | | $‘000 | | | $‘000 | | | $‘000 | | | $‘000 | | | $‘000 | |
FIFA Women’s World Cup Infrastructure 2023 | | | 2,000 | | | | — | | | | — | | | | — | | | | — | |
The government has provided additional funding of $2 million to improve facilities at 5 suburban football grounds to support the FIFA Women’s World Cup 2023.
95
Budget Measures 2023-24
Department of Transport and Main Roads
| | | | | | | | | | | | | | | | | | | | |
| | | 2022–23 | | | 2023–24 | | | 2024–25 | | | 2025–26 | | | 2026–27 | |
| | | $‘000 | | | $‘000 | | | $‘000 | | | $‘000 | | | $‘000 | |
Rail Transport Service Contract | | | — | | | | 132,217 | | | | 238,070 | | | | 226,471 | | | | 226,471 | |
The government is providing increased funding of $823.2 million over 4 years and $226.5 million per annum ongoing for Queensland Rail to deliver capital and operational objectives under the Rail Transport Service Contract.
| | | | | | | | | | | | | | | | | | | | |
| | | 2022–23 | | | 2023–24 | | | 2024–25 | | | 2025–26 | | | 2026–27 | |
| | | $‘000 | | | $‘000 | | | $‘000 | | | $‘000 | | | $‘000 | |
Remote Community Freight Contracts | | | 650 | | | | 22,157 | | | | 17,516 | | | | 18,367 | | | | 19,252 | |
The government is providing additional funding of $77.9 million over 5 years ($90.7 million over 6 years) to deliver Remote Community Freight Contracts targeting specific freight disadvantage in remote and very remote communities across Queensland.
| | | | | | | | | | | | | | | | | | | | |
| | | 2022–23 | | | 2023–24 | | | 2024–25 | | | 2025–26 | | | 2026–27 | |
| | | $‘000 | | | $‘000 | | | $‘000 | | | $‘000 | | | $‘000 | |
Camera Detected Offence Program | | | (1,500 | ) | | | 18,454 | | | | 23,066 | | | | 28,274 | | | | 27,726 | |
The government is providing increased funding of $96 million over 5 years and $27.7 million per annum ongoing for road safety education and awareness programs and to improve the safety of the sections of state-controlled roads where accidents happen most frequently.
This forms part of the government’s total funding of $548.1 million over 5 years, and $183.5 million per annum ongoing, as part of the Camera Detected Offence Program. Further funding can be found in the Queensland Fire and Emergency Services, Queensland Police Service and Queensland Treasury sections of this chapter. The capital component of this measure can be found in the Department of Transport and Main Roads and Queensland Police Service sections of Chapter 3 Capital measures.
96
Budget Measures 2023-24
| | | | | | | | | | | | | | | | | | | | |
| | | 2022–23 | | | 2023–24 | | | 2024–25 | | | 2025–26 | | | 2026–27 | |
| | | $‘000 | | | $‘000 | | | $‘000 | | | $‘000 | | | $‘000 | |
Translink Network Officers and Third-party Enforcement Program | | | 3,233 | | | | 13,735 | | | | 14,216 | | | | 14,571 | | | | 14,936 | |
The government is providing increased funding of $60.7 million over 5 years and $14.9 million per annum ongoing (indexed annually) for additional Network Officers to improve safety on the bus network.
| | | | | | | | | | | | | | | | | | | | |
| | | 2022–23 | | | 2023–24 | | | 2024–25 | | | 2025–26 | | | 2026–27 | |
| | | $‘000 | | | $‘000 | | | $‘000 | | | $‘000 | | | $‘000 | |
Cyber Security Unit | | | — | | | | 12,265 | | | | 13,706 | | | | 15,645 | | | | 17,778 | |
The government is providing increased funding of $59.4 million over 4 years from 2023-24 and $17.8 million per annum ongoing from 2027-28 to support the permanent function of the Cyber Security Unit.
| | | | | | | | | | | | | | | | | | | | |
| | | 2022–23 | | | 2023–24 | | | 2024–25 | | | 2025–26 | | | 2026–27 | |
| | | $‘000 | | | $‘000 | | | $‘000 | | | $‘000 | | | $‘000 | |
Regional Urban Bus Service Contracts | | | — | | | | 11,695 | | | | 13,472 | | | | 16,097 | | | | 16,802 | |
The government is providing increased funding of $58.1 million over 4 years and $16.8 million per annum ongoing (indexed annually) to address ongoing operator revenue shortfalls due to COVID-19, and to fund indexation and operator cost increases including increased fuel costs.
| | | | | | | | | | | | | | | | | | | | |
| | | 2022–23 | | | 2023–24 | | | 2024–25 | | | 2025–26 | | | 2026–27 | |
| | | $‘000 | | | $‘000 | | | $‘000 | | | $‘000 | | | $‘000 | |
Transport Infrastructure Development Scheme | | | — | | | | 5,950 | | | | — | | | | — | | | | — | |
The government is providing increased funding of $6 million for the Transport Infrastructure Development Scheme (TIDS) to provide a 50 per cent boost to the Aboriginal and Torres Strait Islands TIDS funding component and to apply indexation of 2.5 per cent.
97
Budget Measures 2023-24
| | | | | | | | | | | | | | | | | | | | |
| | | 2022–23 | | | 2023–24 | | | 2024–25 | | | 2025–26 | | | 2026–27 | |
| | | $‘000 | | | $‘000 | | | $‘000 | | | $‘000 | | | $‘000 | |
Tell Us Once Operational Model | | | — | | | | 5,665 | | | | 5,996 | | | | 5,398 | | | | 5,514 | |
The government is providing increased funding of $22.6 million over 4 years for the operational model for the Tell Us Once Platform which provides customers with a single view of government and the flexibility to access online services using an account of their choice.
| | | | | | | | | | | | | | | | | | | | |
| | | 2022–23 | | | 2023–24 | | | 2024–25 | | | 2025–26 | | | 2026–27 | |
| | | $‘000 | | | $‘000 | | | $‘000 | | | $‘000 | | | $‘000 | |
Zero Emission Bus Program Stage 1 | | | — | | | | 5,000 | | | | — | | | | — | | | | — | |
The government is providing additional funding of $5 million for the Zero Emission Bus Program Stage 1, to allow for more detailed investigations into financing strategy and options, ownership and operating models, fleet integration and depot strategy and $40 million equity funding in 2023-24, held centrally, to progress establishment of Zero Emission Bus depots.
| | | | | | | | | | | | | | | | | | | | |
| | | 2022–23 | | | 2023–24 | | | 2024–25 | | | 2025–26 | | | 2026–27 | |
| | | $‘000 | | | $‘000 | | | $‘000 | | | $‘000 | | | $‘000 | |
Long Distance Passenger Rail Program | | | 800 | | | | 3,400 | | | | 800 | | | | — | | | | — | |
The government is providing additional funding of $5 million over 3 years for completion of the Long Distance Passenger Rail Program business case and pre-procurement activities.
| | | | | | | | | | | | | | | | | | | | |
| | | 2022–23 | | | 2023–24 | | | 2024–25 | | | 2025–26 | | | 2026–27 | |
| | | $‘000 | | | $‘000 | | | $‘000 | | | $‘000 | | | $‘000 | |
Specialist School Transport - Replacement, Capacity and Growth Bus Fleet | | | — | | | | 3,336 | | | | 285 | | | | 294 | | | | 303 | |
The government is providing increased funding of $4.2 million over 4 years for bus fleet replacement, capacity and growth for Specialist School Transport (SST) and $52.6 million over 3 years, held centrally, for bus replacement. SST is delivered in Queensland state schools through the School Transport Assistance Scheme for students with disability.
98
Budget Measures 2023-24
| | | | | | | | | | | | | | | | | | | | |
| | | 2022–23 | | | 2023–24 | | | 2024–25 | | | 2025–26 | | | 2026–27 | |
| | | $‘000 | | | $‘000 | | | $‘000 | | | $‘000 | | | $‘000 | |
Cyber Security Partnerships | | | — | | | | 3,322 | | | | 3,441 | | | | 3,549 | | | | 3,756 | |
The government is providing increased funding of $14.1 million over 4 years to support delivery of cyber security partnerships with local government agencies and statutory bodies in Queensland.
| | | | | | | | | | | | | | | | | | | | |
| | | 2022–23 | | | 2023–24 | | | 2024–25 | | | 2025–26 | | | 2026–27 | |
| | | $‘000 | | | $‘000 | | | $‘000 | | | $‘000 | | | $‘000 | |
Torres Strait Islands Marine Infrastructure Program | | | 500 | | | | 2,500 | | | | 2,500 | | | | 2,500 | | | | 2,500 | |
The government is providing additional funding of $10.5 million over 5 years ($12.5 million over 6 years) to deliver Stage 1 of the Torres Strait Islands Marine Infrastructure Program. The program will prioritise and deliver marine infrastructure and provide ongoing maintenance in partnership with the councils and communities in the region. The capital component of this measure can be found in Chapter 3 Capital Measures.
| | | | | | | | | | | | | | | | | | | | |
| | | 2022–23 | | | 2023–24 | | | 2024–25 | | | 2025–26 | | | 2026–27 | |
| | | $‘000 | | | $‘000 | | | $‘000 | | | $‘000 | | | $‘000 | |
Translink Resourcing | | | — | | | | 1,330 | | | | 4,903 | | | | 3,861 | | | | 4,187 | |
The government is providing additional funding of $14.3 million over 4 years and $4.2 million per annum ongoing (indexed annually) for public transport network transformation. The following projects are shaping the future of the passenger transport network across the state and will impact all aspects of the delivery and management of the passenger transport networks: Smart Ticketing project, Brisbane Metro, Cross River Rail, Gold Coast Light Rail Stage 3, European Train Control System, On Demand Transport, Mobility as a Service and Zero Emission Buses.
99
Budget Measures 2023-24
| | | | | | | | | | | | | | | | | | | | |
| | | 2022–23 | | | 2023–24 | | | 2024–25 | | | 2025–26 | | | 2026–27 | |
| | | $‘000 | | | $‘000 | | | $‘000 | | | $‘000 | | | $‘000 | |
Phillips Creek Bridge Replacement Project | | | — | | | | 1,180 | | | | 620 | | | | — | | | | — | |
The government is providing additional funding of $1.8 million over 2 years for the Phillips Creek Bridge Replacement Project as part of Round 3 of the Resources Community Infrastructure Fund. A further $1.8 million over 2 years will be met internally by the department to complete the project. Total state funding for this project is $3.6 million over 3 years.
This brings the government’s commitment for Round 3 to $120 million, with total funding of $220 million over 5 years for the Resources Community Infrastructure Fund, in partnership with industry, to support improvements in economic and social infrastructure across Queensland’s resources communities. Further detail can be found in the Department of State Development, Infrastructure, Local Government and Planning section of this chapter.
| | | | | | | | | | | | | | | | | | | | |
| | | 2022–23 | | | 2023–24 | | | 2024–25 | | | 2025–26 | | | 2026–27 | |
| | | $‘000 | | | $‘000 | | | $‘000 | | | $‘000 | | | $‘000 | |
Hull Identification Number Program | | | — | | | | 500 | | | | 500 | | | | — | | | | — | |
The government is providing additional funding of $1 million over 2 years for the introduction of permanent recording of a Hull Identification Number for vessels.
| | | | | | | | | | | | | | | | | | | | |
| | | 2022–23 | | | 2023–24 | | | 2024–25 | | | 2025–26 | | | 2026–27 | |
| | | $‘000 | | | $‘000 | | | $‘000 | | | $‘000 | | | $‘000 | |
Concessions and Rebates Awareness Campaign | | | 3,000 | | | | — | | | | — | | | | — | | | | — | |
The government has provided additional funding of $3 million in 2022-23 to deliver the Concessions and Rebates Awareness Campaign to better inform the community about available Queensland Government rebates and concessions.
100
Budget Measures 2023-24
| | | | | | | | | | | | | | | | | | | | |
| | | 2022–23 | | | 2023–24 | | | 2024–25 | | | 2025–26 | | | 2026–27 | |
| | | $‘000 | | | $‘000 | | | $‘000 | | | $‘000 | | | $‘000 | |
Cyber Security Supports | | | — | | | | — | | | | — | | | | — | | | | — | |
The government is providing additional funding of up to $5 million over 2 years from 2023-24, held centrally, to prepare and implement cyber security support initiatives for small to medium enterprises.
| | | | | | | | | | | | | | | | | | | | |
| | | 2022–23 | | | 2023–24 | | | 2024–25 | | | 2025–26 | | | 2026–27 | |
| | | $‘000 | | | $‘000 | | | $‘000 | | | $‘000 | | | $‘000 | |
Disaster Contact Centre Service Response Capacity | | | — | | | | — | | | | — | | | | 206 | | | | — | |
The government is providing increased funding of $8.8 million over 3 years from 2023-24, including $8.6 million reallocated from Smart Services Queensland COVID-19 response, to improve the disaster contact centre service response capacity.
In addition, the government has provided additional funding of $1.5 million in 2022-23, held centrally, to cover any shortfall in disaster contact centre response coverage during disaster events.
| | | | | | | | | | | | | | | | | | | | |
| | | 2022–23 | | | 2023–24 | | | 2024–25 | | | 2025–26 | | | 2026–27 | |
| | | $‘000 | | | $‘000 | | | $‘000 | | | $‘000 | | | $‘000 | |
Driver Protection Barrier Retrofit Program | | | — | | | | — | | | | 3,000 | | | | 3,000 | | | | 3,000 | |
The government is providing additional funding of $12.7 million over 5 years from 2022-23 for the roll out of driver protection barriers on up to 600 buses, with funding of $3.7 million met internally by the department.
101
Budget Measures 2023-24
| | | | | | | | | | | | | | | | | | | | |
| | | 2022–23 | | | 2023–24 | | | 2024–25 | | | 2025–26 | | | 2026–27 | |
| | | $‘000 | | | $‘000 | | | $‘000 | | | $‘000 | | | $‘000 | |
Youngs Crossing Road | | | 15,000 | | | | — | | | | — | | | | — | | | | — | |
The government has provided additional funding of $15 million as the State’s contribution towards the Youngs Crossing Road-Dayboro Road intersection being delivered by Moreton Bay Regional Council.
102
Budget Measures 2023-24
Department of Treaty, Aboriginal and Torres Strait Islander Partnerships, Communities and the Arts
| | | | | | | | | | | | | | | | | | | | |
| | | 2022–23 | | | 2023–24 | | | 2024–25 | | | 2025–26 | | | 2026–27 | |
| | | $‘000 | | | $‘000 | | | $‘000 | | | $‘000 | | | $‘000 | |
Critical Emergency and Food Relief | | | — | | | | 4,251 | | | | — | | | | — | | | | — | |
The government is providing increased funding of $7.6 million to extend and expand food and emergency relief throughout Queensland, including funding of $3.3 million in 2022-23 which forms part of the Government’s total funding of $56 million over 2 years, with funding allocated from a whole-of-government provision, to deliver outcomes from the Queensland Housing Summit.
| | | | | | | | | | | | | | | | | | | | |
| | | 2022–23 | | | 2023–24 | | | 2024–25 | | | 2025–26 | | | 2026–27 | |
| | | $‘000 | | | $‘000 | | | $‘000 | | | $‘000 | | | $‘000 | |
Support for Vulnerable Queenslanders | | | — | | | | 1,205 | | | | 1,480 | | | | — | | | | — | |
The government is providing increased funding of $2.7 million over 2 years to extend and expand school breakfast programs delivered by non-government organisations in areas experiencing hardship across Queensland.
| | | | | | | | | | | | | | | | | | | | |
| | | 2022–23 | | | 2023–24 | | | 2024–25 | | | 2025–26 | | | 2026–27 | |
| | | $‘000 | | | $‘000 | | | $‘000 | | | $‘000 | | | $‘000 | |
Community Services Resourcing | | | — | | | | 700 | | | | — | | | | — | | | | — | |
The government is providing increased funding of $700,000 in 2023-24 to support core departmental functions in the delivery of community services.
103
Budget Measures 2023-24
| | | | | | | | | | | | | | | | | | | | |
| | | 2022–23 | | | 2023–24 | | | 2024–25 | | | 2025–26 | | | 2026–27 | |
| | | $‘000 | | | $‘000 | | | $‘000 | | | $‘000 | | | $‘000 | |
Public Intoxication Program Enhancement | | | — | | | | 688 | | | | 1,375 | | | | — | | | | — | |
The government is providing increased funding of $2.1 million over 2 years for public intoxication diversionary services in Mount Isa.
The capital component of this measure can be found in Chapter 3 Capital Measures.
| | | | | | | | | | | | | | | | | | | | |
| | | 2022–23 | | | 2023–24 | | | 2024–25 | | | 2025–26 | | | 2026–27 | |
| | | $‘000 | | | $‘000 | | | $‘000 | | | $‘000 | | | $‘000 | |
Queensland Men’s Shed Association | | | — | | | | 150 | | | | 150 | | | | 150 | | | | 150 | |
The government is providing increased funding of $150,000 per annum from 2023-24 as a contribution towards administration costs for Queensland Men’s Shed Association (annually indexed).
| | | | | | | | | | | | | | | | | | | | |
| | | 2022–23 | | | 2023–24 | | | 2024–25 | | | 2025–26 | | | 2026–27 | |
| | | $‘000 | | | $‘000 | | | $‘000 | | | $‘000 | | | $‘000 | |
Asset Management Model and Maintenance Program | | | — | | | | 2,875 | | | | 2,875 | | | | — | | | | — | |
The government is providing additional funding of $5.8 million over 2 years to progress development of a revised Asset Management Model and undertake urgent and unavoidable maintenance projects at the Queensland Cultural Centre.
| | | | | | | | | | | | | | | | | | | | |
| | | 2022–23 | | | 2023–24 | | | 2024–25 | | | 2025–26 | | | 2026–27 | |
| | | $‘000 | | | $‘000 | | | $‘000 | | | $‘000 | | | $‘000 | |
Storage for State Cultural Collections - Business Case and Short-Term Storage | | | — | | | | 2,036 | | | | 1,624 | | | | 1,694 | | | | — | |
The government is providing additional funding of $5.4 million over 3 years to fund collections storage requirements for the Arts statutory bodies. This is in addition to funding to complete the business case for long term storage solutions.
104
Budget Measures 2023-24
| | | | | | | | | | | | | | | | | | | | |
| | | 2022–23 | | | 2023–24 | | | 2024–25 | | | 2025–26 | | | 2026–27 | |
| | | $‘000 | | | $‘000 | | | $‘000 | | | $‘000 | | | $‘000 | |
Queensland Cultural Centre - Flood Resilience Program | | | — | | | | 2,000 | | | | — | | | | — | | | | — | |
The government is providing additional funding of $2 million in 2023-24 to complete an options assessment and feasibility study identifying methods of improving Queensland Cultural Centre flood resilience.
| | | | | | | | | | | | | | | | | | | | |
| | | 2022–23 | | | 2023–24 | | | 2024–25 | | | 2025–26 | | | 2026–27 | |
| | | $‘000 | | | $‘000 | | | $‘000 | | | $‘000 | | | $‘000 | |
Queensland Performing Arts Centre - Strategic Capability Enhancement | | | — | | | | 2,000 | | | | — | | | | — | | | | — | |
The government is providing increased funding of $2 million in 2023-24 to the Queensland Performing Arts Centre to continue growth and development of the First Nations initiatives and digital capacity.
| | | | | | | | | | | | | | | | | | | | |
| | | 2022–23 | | | 2023–24 | | | 2024–25 | | | 2025–26 | | | 2026–27 | |
| | | $‘000 | | | $‘000 | | | $‘000 | | | $‘000 | | | $‘000 | |
Queensland Museum - First Nations Repatriation Program | | | — | | | | 872 | | | | 894 | | | | 916 | | | | 939 | |
The government is providing increased funding of $3.6 million over 4 years ($4.6 million over 5 years) for the Queensland Museum Network First Nations Repatriation Program, as a vital step on the Path to Treaty.
| | | | | | | | | | | | | | | | | | | | |
| | | 2022–23 | | | 2023–24 | | | 2024–25 | | | 2025–26 | | | 2026–27 | |
| | | $‘000 | | | $‘000 | | | $‘000 | | | $‘000 | | | $‘000 | |
Queensland Music Network BIGSOUND conference | | | 610 | | | | 610 | | | | 610 | | | | 610 | | | | — | |
The government is providing increased funding of $2.44 million over 4 years to secure a strong future for the Queensland Music Network’s annual industry conference and showcase, BIGSOUND.
This is in addition to existing Queensland Government funding of $1.4 million over 4 years, funded from internal budget sources, bringing the total funding for this initiative to $3.84 million.
105
Budget Measures 2023-24
| | | | | | | | | | | | | | | | | | | | |
| | | 2022–23 | | | 2023–24 | | | 2024–25 | | | 2025–26 | | | 2026–27 | |
| | | $‘000 | | | $‘000 | | | $‘000 | | | $‘000 | | | $‘000 | |
State Library of Queensland - Vision Australia and Braille House | | | — | | | | 600 | | | | — | | | | — | | | | — | |
The government is providing additional funding of $600,000 in 2023-24 to administer grants to Vision Australia Queensland Library and Braille House to enhance library services for vision impaired Queenslanders.
| | | | | | | | | | | | | | | | | | | | |
| | | 2022–23 | | | 2023–24 | | | 2024–25 | | | 2025–26 | | | 2026–27 | |
| | | $‘000 | | | $‘000 | | | $‘000 | | | $‘000 | | | $‘000 | |
Queensland Museum - Maintenance Program | | | — | | | | 335 | | | | — | | | | — | | | | — | |
The government is providing increased funding of $335,000 in 2023-24 to undertake urgent and unavoidable maintenance projects at the Queensland Museum.
| | | | | | | | | | | | | | | | | | | | |
| | | 2022–23 | | | 2023–24 | | | 2024–25 | | | 2025–26 | | | 2026–27 | |
| | | $‘000 | | | $‘000 | | | $‘000 | | | $‘000 | | | $‘000 | |
Connect Queenslanders to Art - Digital Transformation Initiative | | | — | | | | 200 | | | | 220 | | | | 240 | | | | 260 | |
The government is providing additional funding of $920,000 over 4 years and $260,000 per annum ongoing for delivery of systems and programs under the Digital Transformation Initiative.
| | | | | | | | | | | | | | | | | | | | |
| | | 2022–23 | | | 2023–24 | | | 2024–25 | | | 2025–26 | | | 2026–27 | |
| | | $‘000 | | | $‘000 | | | $‘000 | | | $‘000 | | | $‘000 | |
Cultural Tourism Programming Strategy - Exhibition Funding | | | — | | | | — | | | | — | | | | 2,175 | | | | 2,229 | |
The government will provide increased funding of $4.4 million over 2 years from 2025-26 and $2.2 million ongoing for special exhibitions and events, annually indexed.
106
Budget Measures 2023-24
| | | | | | | | | | | | | | | | | | | | |
| | | 2022–23 | | | 2023–24 | | | 2024–25 | | | 2025–26 | | | 2026–27 | |
| | | $‘000 | | | $‘000 | | | $‘000 | | | $‘000 | | | $‘000 | |
Queensland Museum Network - World Science Festival | | | — | | | | — | | | | 3,000 | | | | 3,000 | | | | 3,000 | |
The government is providing increased funding of $9 million over 3 years for the World Science Festival (2025-2027).
| | | | | | | | | | | | | | | | | | | | |
| | | 2022–23 | | | 2023–24 | | | 2024–25 | | | 2025–26 | | | 2026–27 | |
| | | $‘000 | | | $‘000 | | | $‘000 | | | $‘000 | | | $‘000 | |
Aboriginal and Torres Strait Islander Cultural Initiatives | | | — | | | | 445 | | | | — | | | | — | | | | — | |
The government will provide increased funding of $345,000 to review and improve the cultural capability training and resources and $100,000 to increase Celebrating Reconciliation Grants in line with the launch of the strategy.
| | | | | | | | | | | | | | | | | | | | |
| | | 2022–23 | | | 2023–24 | | | 2024–25 | | | 2025–26 | | | 2026–27 | |
| | | $‘000 | | | $‘000 | | | $‘000 | | | $‘000 | | | $‘000 | |
First Nations Economic Development | | | — | | | | 348 | | | | 355 | | | | 362 | | | | 367 | |
The government is providing additional funding of $1.4 million over 4 years to support First Nations economic development.
107
Budget Measures 2023-24
| | | | | | | | | | | | | | | | | | | | |
| | | 2022–23 | | | 2023–24 | | | 2024–25 | | | 2025–26 | | | 2026–27 | |
| | | $‘000 | | | $‘000 | | | $‘000 | | | $‘000 | | | $‘000 | |
Youth Justice Investment - Stronger Communities Initiative: Early Action Groups | | | — | | | | 290 | | | | 551 | | | | — | | | | — | |
The government is providing increased funding of $841,000 over 2 years to extend the Townsville Early Action Group and expand to Cairns and Mount Isa to help break the cycle of youth crime by dealing with underlying issues that lead some young people to offend including poor school attendance, mental health concerns, drug and substance misuse, domestic violence and family dysfunction. This forms part of total increased funding of $5.1 million over 3 years for the Early Action Groups.
This forms part of the government’s total funding package of $446.4 million ($441.9 million new funding and $4.5 million internally funded) over 5 years and $33.7 million per annum ongoing to help boost police resources and tackle the complex causes of youth crime and support community safety.
Further details can be found in Chapter 1 of this paper and in the Department of Child Safety, Seniors and Disability Services, Department of Education, Department of Housing, Department of Justice and Attorney-General, Department of the Premier and Cabinet, Department of Youth Justice, Employment, Small Business and Training, Queensland Corrective Services, Queensland Health and Queensland Police Service sections of this chapter and the Queensland Police Service section of Chapter 3 Capital Measures.
108
Budget Measures 2023-24
Department of Youth Justice, Employment, Small Business and Training
| | | | | | | | | | | | | | | | | | | | |
| | | 2022–23 | | | 2023–24 | | | 2024–25 | | | 2025–26 | | | 2026–27 | |
| | | $‘000 | | | $‘000 | | | $‘000 | | | $‘000 | | | $‘000 | |
Youth Detention Centre Operations | | | 12,737 | | | | 20,222 | | | | 22,870 | | | | 25,007 | | | | 29,015 | |
The government is providing additional funding of $109.9 million over 5 years and $29 million per annum ongoing to address non-discretionary budget pressures in existing Youth Detention Centres.
Total funding for this initiative is $122.4 million over 5 years and $31 million per annum ongoing. The capital component of this measure can be found in Chapter 3 Capital Measures.
| | | | | | | | | | | | | | | | | | | | |
| | | 2022–23 | | | 2023–24 | | | 2024–25 | | | 2025–26 | | | 2026–27 | |
| | | $‘000 | | | $‘000 | | | $‘000 | | | $‘000 | | | $‘000 | |
Youth Detention Centre Capacity - Addressing Capacity Issues at Youth Detention Centres | | | 1,568 | | | | 14,658 | | | | 979 | | | | — | | | | — | |
The government is providing increased funding of $17.2 million over 3 years to address capacity issues at Youth Detention Centres, with a further $11.6 million reallocated from existing resources.
Funding of $11.8 million is being used to establish regional response teams and brokerage to provide services and supports to young people detained in watchhouses. $2.1 million is being used to establish a watchhouse response co-ordination unit. $1.4 million is being allocated to continue funding Murri Watch to provide advocacy and support services to young people detained in watchhouses. $4.7 million is being used for an operational implementation team, recruitment and training. $8.8 million in 2023-24 is provided for continued preliminary work and procurement activities, including sole sourcing options, on the new youth detention centres, to be located at the Woodford Corrections Precinct and near Cairns, and interim options.
The government is providing increased funding of a further $11.7 million, held centrally, to provide services to support strategies addressing capacity issues at Youth Detention Centres.
This forms part of total increased funding of $89.7 million over 3 years ($78.1 million new funding and $11.6 million from existing resources) to address capacity issues at Youth Detention Centres. Further details can be found in the Department of Education, Queensland Health and Queensland Police Service sections of this chapter and the Queensland Police Service section of Chapter 3 Capital Measures.
109
Budget Measures 2023-24
| | | | | | | | | | | | | | | | | | | | |
| | | 2022–23 | | | 2023–24 | | | 2024–25 | | | 2025–26 | | | 2026–27 | |
| | | $‘000 | | | $‘000 | | | $‘000 | | | $‘000 | | | $‘000 | |
Youth Justice Investment - Youth Co-responder Teams | | | — | | | | 24,459 | | | | 25,219 | | | | 14,055 | | | | 14,402 | |
The government is providing increased funding of $78.1 million over 4 years and $14.4 million per annum ongoing to continue to deliver and expand the co-responder model to deal with or divert high risk young people including those on bail and those subject to electronic monitoring. This forms part of total increased funding of $96.2 million over 4 years and $17.9 million per annum ongoing for the co-responder model.
This forms part of the government’s total funding package of $446.4 million ($441.9 million new funding and $4.5 million internally funded) over 5 years and $33.7 million per annum ongoing to help boost police resources and tackle the complex causes of youth crime and support community safety.
Further details can be found in Chapter 1 of this paper and in the Department of Child Safety, Seniors and Disability Services, Department of Education, Department of Housing, Department of Justice and Attorney-General, Department of the Premier and Cabinet, Department of Treaty, Aboriginal and Torres Strait Islander Partnerships, Communities and the Arts, Queensland Corrective Services, Queensland Health and Queensland Police Service sections of this chapter and the Queensland Police Service section of Chapter 3 Capital Measures.
| | | | | | | | | | | | | | | | | | | | |
| | | 2022–23 | | | 2023–24 | | | 2024–25 | | | 2025–26 | | | 2026–27 | |
| | | $‘000 | | | $‘000 | | | $‘000 | | | $‘000 | | | $‘000 | |
Youth Justice Investment - Intensive Case Management | | | — | | | | 10,690 | | | | 13,285 | | | | 3,010 | | | | 3,084 | |
The government is providing increased funding of $30.1 million over 4 years and $3.1 million per annum ongoing to continue and expand service responses to reduce frequency and severity of offending behaviours by young people by addressing risk and enhancing young person and family capacity for pro-social decision making.
This forms part of the government’s total funding package of $446.4 million ($441.9 million new funding and $4.5 million internally funded) over 5 years and $33.7 million per annum ongoing to help boost police resources and tackle the complex causes of youth crime and support community safety.
Further details can be found in Chapter 1 of this paper and in the Department of Child Safety, Seniors and Disability Services, Department of Education, Department of Housing, Department of Justice and Attorney-General, Department of the Premier and Cabinet, Department of Treaty, Aboriginal and Torres Strait Islander Partnerships, Communities and the Arts, Queensland Corrective Services, Queensland Health and Queensland Police Service sections of this chapter and the Queensland Police Service section of Chapter 3 Capital Measures.
110
Budget Measures 2023-24
| | | | | | | | | | | | | | | | | | | | |
| | | 2022–23 | | | 2023–24 | | | 2024–25 | | | 2025–26 | | | 2026–27 | |
| | | $‘000 | | | $‘000 | | | $‘000 | | | $‘000 | | | $‘000 | |
Youth Justice Investment - Diversion | | | — | | | | 7,287 | | | | 7,333 | | | | 7,381 | | | | 7,416 | |
The government is providing increased funding of $29.4 million over 4 years and $7.4 million per annum ongoing to provide location specific diversionary responses to youth crime and young people engaging in anti-social behaviour including after-hours support, cultural mentoring, bridging to flexi-school and case management, and alternative opportunities and activities for at-risk young people.
This forms part of the government’s total funding package of $446.4 million ($441.9 million new funding and $4.5 million internally funded) over 5 years and $33.7 million per annum ongoing to help boost police resources and tackle the complex causes of youth crime and support community safety.
Further details can be found in Chapter 1 of this paper and in the Department of Child Safety, Seniors and Disability Services, Department of Education, Department of Housing, Department of Justice and Attorney-General, Department of the Premier and Cabinet, Department of Treaty, Aboriginal and Torres Strait Islander Partnerships, Communities and the Arts, Queensland Corrective Services, Queensland Health and Queensland Police Service sections of this chapter and the Queensland Police Service section of Chapter 3 Capital Measures.
| | | | | | | | | | | | | | | | | | | | |
| | | 2022–23 | | | 2023–24 | | | 2024–25 | | | 2025–26 | | | 2026–27 | |
| | | $‘000 | | | $‘000 | | | $‘000 | | | $‘000 | | | $‘000 | |
Youth Justice Investment - Intensive Bail Initiative | | | — | | | | 6,677 | | | | 8,054 | | | | 5,328 | | | | 5,338 | |
The government is providing increased funding of $25.4 million over 4 years and $5.3 million per annum ongoing to continue and expand intensive support to high-risk young people on bail and their families, and provide assistance to aid compliance with bail including young people with an electronic monitoring device as a condition of bail.
This forms part of the government’s total funding package of $446.4 million ($441.9 million new funding and $4.5 million internally funded) over 5 years and $33.7 million per annum ongoing to help boost police resources and tackle the complex causes of youth crime and support community safety.
Further details can be found in Chapter 1 of this paper and in the Department of Child Safety, Seniors and Disability Services, Department of Education, Department of Housing, Department of Justice and Attorney-General, Department of the Premier and Cabinet, Department of Treaty, Aboriginal and Torres Strait Islander Partnerships, Communities and the Arts, Queensland Corrective Services, Queensland Health and Queensland Police Service sections of this chapter and the Queensland Police Service section of Chapter 3 Capital Measures.
111
Budget Measures 2023-24
| | | | | | | | | | | | | | | | | | | | |
| | | 2022–23 | | | 2023–24 | | | 2024–25 | | | 2025–26 | | | 2026–27 | |
| | | $‘000 | | | $‘000 | | | $‘000 | | | $‘000 | | | $‘000 | |
Youth Justice Investment - Empowering communities to develop local solutions to youth crime issues | | | — | | | | 2,500 | | | | 2,500 | | | | — | | | | — | |
The government is providing increased funding of $5 million over 2 years to focus on empowering local communities to develop and trial localised responses that address youth offending behaviour and enhance positive connections between young people and their community.
This forms part of increased funding of $15 million aimed at empowering communities to develop local solutions to youth crime issues and connecting local leaders to prevent and respond to youth crime.
This forms part of the government’s total funding package of $446.4 million ($441.9 million new funding and $4.5 million internally funded) over 5 years and $33.7 million per annum ongoing to help boost police resources and tackle the complex causes of youth crime and support community safety.
Further details can be found in Chapter 1 of this paper and in the Department of Child Safety, Seniors and Disability Services, Department of Education, Department of Housing, Department of Justice and Attorney-General, Department of the Premier and Cabinet, Department of Treaty, Aboriginal and Torres Strait Islander Partnerships, Communities and the Arts, Queensland Corrective Services, Queensland Health and Queensland Police Service sections of this chapter and the Queensland Police Service section of Chapter 3 Capital Measures.
112
Budget Measures 2023-24
| | | | | | | | | | | | | | | | | | | | |
| | | 2022–23 | | | 2023–24 | | | 2024–25 | | | 2025–26 | | | 2026–27 | |
| | | $‘000 | | | $‘000 | | | $‘000 | | | $‘000 | | | $‘000 | |
Youth Justice Investment - On Country | | | — | | | | 2,080 | | | | 2,080 | | | | — | | | | — | |
The government is providing increased funding of $4.2 million over 2 years to continue providing culture-based rehabilitation for young First Nations peoples with complex needs in Cairns, Mount Isa and Townsville.
This forms part of the government’s total funding package of $446.4 million ($441.9 million new funding and $4.5 million internally funded) over 5 years and $33.7 million per annum ongoing to help boost police resources and tackle the complex causes of youth crime and support community safety.
Further details can be found in Chapter 1 of this paper and in the Department of Child Safety, Seniors and Disability Services, Department of Education, Department of Housing, Department of Justice and Attorney-General, Department of the Premier and Cabinet, Department of Treaty, Aboriginal and Torres Strait Islander Partnerships, Communities and the Arts, Queensland Corrective Services, Queensland Health and Queensland Police Service sections of this chapter and the Queensland Police Service section of Chapter 3 Capital Measures.
| | | | | | | | | | | | | | | | | | | | |
| | | 2022–23 | | | 2023–24 | | | 2024–25 | | | 2025–26 | | | 2026–27 | |
| | | $‘000 | | | $‘000 | | | $‘000 | | | $‘000 | | | $‘000 | |
Youth Justice Investment - Specialist Youth Crime Rapid Response Squad | | | 1,000 | | | | 2,000 | | | | 2,000 | | | | — | | | | — | |
The government is providing additional funding of $5 million over 3 years to engage expert youth justice workers to partner with the Queensland Police Service to establish a Specialist Youth Crime Rapid Response Squad as part of a holistic response to prevent, disrupt and respond to youth crime in hot spot areas around the state. This forms part of total additional funding of $17.5 million over 3 years for the Specialist Youth Crime Rapid Response Squad.
This forms part of the government’s total funding package of $446.4 million ($441.9 million new funding and $4.5 million internally funded) over 5 years and $33.7 million per annum ongoing to help boost police resources and tackle the complex causes of youth crime and support community safety.
Further details can be found in Chapter 1 of this paper and in the Department of Child Safety, Seniors and Disability Services, Department of Education, Department of Housing, Department of Justice and Attorney-General, Department of the Premier and Cabinet, Department of Treaty, Aboriginal and Torres Strait Islander Partnerships, Communities and the Arts, Queensland Corrective Services, Queensland Health and Queensland Police Service sections of this chapter and the Queensland Police Service section of Chapter 3 Capital Measures.
113
Budget Measures 2023-24
| | | | | | | | | | | | | | | | | | | | |
| | | 2022–23 | | | 2023–24 | | | 2024–25 | | | 2025–26 | | | 2026–27 | |
| | | $‘000 | | | $‘000 | | | $‘000 | | | $‘000 | | | $‘000 | |
Youth Justice Investment - Fast-track Sentencing | | | 667 | | | | 1,830 | | | | 326 | | | | — | | | | — | |
The government is providing additional funding of $2.8 million over 3 years to deliver a fast-track sentencing pilot in 4 locations for 18 months to address delays in court proceedings through proactive case management of matters. This forms part of total additional funding of $16.5 million over 4 years for these pilots.
This forms part of the government’s total funding package of $446.4 million ($441.9 million new funding and $4.5 million internally funded) over 5 years and $33.7 million per annum ongoing to help boost police resources and tackle the complex causes of youth crime and support community safety.
Further details can be found in Chapter 1 of this paper and in the Department of Child Safety, Seniors and Disability Services, Department of Education, Department of Housing, Department of Justice and Attorney-General, Department of the Premier and Cabinet, Department of Treaty, Aboriginal and Torres Strait Islander Partnerships, Communities and the Arts, Queensland Corrective Services, Queensland Health and Queensland Police Service sections of this chapter and the Queensland Police Service section of Chapter 3 Capital Measures.
| | | | | | | | | | | | | | | | | | | | |
| | | 2022–23 | | | 2023–24 | | | 2024–25 | | | 2025–26 | | | 2026–27 | |
| | | $‘000 | | | $‘000 | | | $‘000 | | | $‘000 | | | $‘000 | |
Youth Justice Investment - The Street University Townsville | | | 782 | | | | 1,596 | | | | 1,846 | | | | — | | | | — | |
The government is providing additional funding of $4.2 million over 3 years to provide a safe space for young people in Townsville to engage in vocational and educational workshops, drug and alcohol treatment services, life skills training and mentoring with pathways to further education.
This forms part of the government’s total funding package of $446.4 million ($441.9 million new funding and $4.5 million internally funded) over 5 years and $33.7 million per annum ongoing to help boost police resources and tackle the complex causes of youth crime and support community safety.
Further details can be found in Chapter 1 of this paper and in the Department of Child Safety, Seniors and Disability Services, Department of Education, Department of Housing, Department of Justice and Attorney-General, Department of the Premier and Cabinet, Department of Treaty, Aboriginal and Torres Strait Islander Partnerships, Communities and the Arts, Queensland Corrective Services, Queensland Health and Queensland Police Service sections of this chapter and the Queensland Police Service section of Chapter 3 Capital Measures.
114
Budget Measures 2023–24
| | | | | | | | | | | | | | | | | | | | |
| | | 2022–23 | | | 2023–24 | | | 2024–25 | | | 2025–26 | | | 2026–27 | |
| | | $‘000 | | | $‘000 | | | $‘000 | | | $‘000 | | | $‘000 | |
Youth Justice Investment - Townsville Community Youth Response: High Risk Youth Court | | | — | | | | 1,345 | | | | 1,345 | | | | — | | | | — | |
The government is providing increased funding of $2.7 million over 2 years to continue the specialist court established in 2017 as part of the Townsville Community Youth Response. This forms part of total increased funding of $8 million over 2 years for the Townsville High Risk Youth Court.
This forms part of the government’s total funding package of $446.4 million ($441.9 million new funding and $4.5 million internally funded) over 5 years and $33.7 million per annum ongoing to help boost police resources and tackle the complex causes of youth crime and support community safety.
Further details can be found in Chapter 1 of this paper and in the Department of Child Safety, Seniors and Disability Services, Department of Education, Department of Housing, Department of Justice and Attorney-General, Department of the Premier and Cabinet, Department of Treaty, Aboriginal and Torres Strait Islander Partnerships, Communities and the Arts, Queensland Corrective Services, Queensland Health and Queensland Police Service sections of this chapter and the Queensland Police Service section of Chapter 3 Capital Measures.
| | | | | | | | | | | | | | | | | | | | |
| | | 2022–23 | | | 2023–24 | | | 2024–25 | | | 2025–26 | | | 2026–27 | |
| | | $‘000 | | | $‘000 | | | $‘000 | | | $‘000 | | | $‘000 | |
Youth Justice Investment - Stronger Communities Initiative: Early Action Groups | | | — | | | | 728 | | | | 1,030 | | | | — | | | | — | |
The government is providing increased funding of $1.8 million over 2 years to extend the Townsville Early Action Group and expand to Cairns and Mount Isa to help break the cycle of youth crime by dealing with underlying issues that lead some young people to offend including poor school attendance, mental health concerns, drug and substance misuse, domestic violence and family dysfunction. This forms part of total increased funding of $5.1 million over 3 years for the Early Action Groups.
This forms part of the government’s total funding package of $446.4 million ($441.9 million new funding and $4.5 million internally funded) over 5 years and $33.7 million per annum ongoing to help boost police resources and tackle the complex causes of youth crime and support community safety.
Further details can be found in Chapter 1 of this paper and in the Department of Child Safety, Seniors and Disability Services, Department of Education, Department of Housing, Department of Justice and Attorney-General, Department of the Premier and Cabinet, Department of Treaty, Aboriginal and Torres Strait Islander Partnerships, Communities and
115
Budget Measures 2023-24
the Arts, Queensland Corrective Services, Queensland Health and Queensland Police Service sections of this chapter and the Queensland Police Service section of Chapter 3 Capital Measures.
| | | | | | | | | | | | | | | | | | | | |
| | | 2022–23 | | | 2023–24 | | | 2024–25 | | | 2025–26 | | | 2026–27 | |
| | | $‘000 | | | $‘000 | | | $‘000 | | | $‘000 | | | $‘000 | |
Youth Justice Investment - Townsville Stockland and other shopping precincts crime prevention program | | | — | | | | 350 | | | | 500 | | | | — | | | | — | |
The government is providing additional funding of $850,000 over 2 years to engage at risk young people in pro-social activities and divert them from crime targeting young people congregating at Stockland and other shopping precincts in Townsville.
This forms part of the government’s total funding package of $446.4 million ($441.9 million new funding and $4.5 million internally funded) over 5 years and $33.7 million per annum ongoing to help boost police resources and tackle the complex causes of youth crime and support community safety.
Further details can be found in Chapter 1 of this paper and in the Department of Child Safety, Seniors and Disability Services, Department of Education, Department of Housing, Department of Justice and Attorney-General, Department of the Premier and Cabinet, Department of Treaty, Aboriginal and Torres Strait Islander Partnerships, Communities and the Arts, Queensland Corrective Services, Queensland Health and Queensland Police Service sections of this chapter and the Queensland Police Service section of Chapter 3 Capital Measures.
| | | | | | | | | | | | | | | | | | | | |
| | | 2022–23 | | | 2023–24 | | | 2024–25 | | | 2025–26 | | | 2026–27 | |
| | | $‘000 | | | $‘000 | | | $‘000 | | | $‘000 | | | $‘000 | |
Youth Justice Investment - Big Bounce Initiative | | | — | | | | — | | | | — | | | | — | | | | — | |
The government is providing additional funding of $2 million over 2 years from 2023–24, held centrally, to expand the Big Bounce Initiative to provide diversionary programs to youths at risk of offending and rehabilitation programs to youths in detention. Youths identified as at-risk of offending will be provided with access to community basketball clinics, Brian Kerle Academy clinics, peer leadership workshops, mentoring, and assistance with education and employment opportunities. Youth in detention will receive weekly engagement activities through basketball sessions to build trust and rapport with young people, followed by support through an outreach project with intensive case management post release.
This forms part of the government’s total funding package of $446.4 million ($441.9 million new funding and $4.5 million internally funded) over 5 years and $33.7 million per annum
116
Budget Measures 2023-24
ongoing to help boost police resources and tackle the complex causes of youth crime and support community safety.
Further details can be found in Chapter 1 of this paper and in the Department of Child Safety, Seniors and Disability Services, Department of Education, Department of Housing, Department of Justice and Attorney-General, Department of the Premier and Cabinet, Department of Treaty, Aboriginal and Torres Strait Islander Partnerships, Communities and the Arts, Queensland Corrective Services, Queensland Health and Queensland Police Service sections of this chapter and the Queensland Police Service section of Chapter 3 Capital Measures.
| | | | | | | | | | | | | | | | | | | | |
| | | 2022–23 | | | 2023–24 | | | 2024–25 | | | 2025–26 | | | 2026–27 | |
| | | $‘000 | | | $‘000 | | | $‘000 | | | $‘000 | | | $‘000 | |
Vocational Education and Training Modernisation and Transformation Program | | | — | | | | 8,823 | | | | 15,942 | | | | 4,987 | | | | — | |
The government is providing additional funding of $29.8 million over 3 years to upgrade and modernise existing government Vocational Education and Training Information and Communication Technology systems.
| | | | | | | | | | | | | | | | | | | | |
| | | 2022–23 | | | 2023–24 | | | 2024–25 | | | 2025–26 | | | 2026–27 | |
| | | $‘000 | | | $‘000 | | | $‘000 | | | $‘000 | | | $‘000 | |
Small Business Support and Wellness Package | | | 2,280 | | | | 2,980 | | | | 1,490 | | | | — | | | | — | |
The government is providing additional funding of $6.8 million over 3 years for a package of initiatives to support the mental health and wellness of small business owners.
117
Budget Measures 2023-24
| | | | | | | | | | | | | | | | | | | | |
| | | 2022–23 | | | 2023–24 | | | 2024–25 | | | 2025–26 | | | 2026–27 | |
| | | $‘000 | | | $‘000 | | | $‘000 | | | $‘000 | | | $‘000 | |
Queensland Workforce Strategy - Micro-Credentialing | | | 2,950 | | | | 2,950 | | | | — | | | | — | | | | — | |
The government is providing increased funding of $5.9 million over 2 years to extend the Micro-Credentialing Pilot Program to provide increased access to industry-supported short courses.
This forms part of the government’s total funding package of over $70 million for new initiatives included in the 2022-2025 Action Plan as part of the Good People. Good Jobs: Queensland Workforce Strategy 2022-2032 to create a strong and diverse workforce ready to seize today’s jobs and adapt to future opportunities. Further details on initiatives can be found in the Department of Education, the Department of Environment and Science and Queensland Treasury sections of this chapter.
| | | | | | | | | | | | | | | | | | | | |
| | | 2022–23 | | | 2023–24 | | | 2024–25 | | | 2025–26 | | | 2026–27 | |
| | | $‘000 | | | $‘000 | | | $‘000 | | | $‘000 | | | $‘000 | |
Women’s Economic Security - Women in Trade Apprenticeships Mentoring Program | | | — | | | | 2,300 | | | | 2,300 | | | | — | | | | — | |
The government is providing additional funding of $4.6 million over 2 years to support women undertaking a trade apprenticeship and provide them with a network to improve retention and completion rates, in alignment with the Good People. Good Jobs: Queensland Workforce Strategy 2022-2032.
This forms part of the government’s total funding package of $16.3 million over 4 years for the Women’s Economic Security package. Further details on this package are in Chapter 1 of this paper and the Department of Tourism, Innovation and Sport and the Queensland Health sections of this chapter.
118
Budget Measures 2023-24
| | | | | | | | | | | | | | | | | | | | |
| | | 2022–23 | | | 2023–24 | | | 2024–25 | | | 2025–26 | | | 2026–27 | |
| | | $‘000 | | | $‘000 | | | $‘000 | | | $‘000 | | | $‘000 | |
Queensland Workforce Strategy - Diverse Queensland Workforce Program | | | 900 | | | | 2,275 | | | | 2,275 | | | | — | | | | — | |
The government is providing increased funding of $5.5 million over 3 years to expand the Diverse Queensland Workforce Program to support migrants, refugees and international students into employment.
This forms part of the government’s total funding package of over $70 million for new initiatives included in the 2022-2025 Action Plan as part of the Good People. Good Jobs: Queensland Workforce Strategy 2022-2032 to create a strong and diverse workforce ready to seize today’s jobs and adapt to future opportunities. Further details on initiatives can be found in the Department of Education, the Department of Environment and Science and Queensland Treasury sections of this chapter.
| | | | | | | | | | | | | | | | | | | | |
| | | 2022–23 | | | 2023–24 | | | 2024–25 | | | 2025–26 | | | 2026–27 | |
| | | $‘000 | | | $‘000 | | | $‘000 | | | $‘000 | | | $‘000 | |
Queensland Workforce Strategy - Industry Workforce Advisors | | | 2,100 | | | | 2,160 | | | | 2,200 | | | | — | | | | — | |
The government is providing additional funding of $6.5 million over 3 years for a network of Industry Workforce Advisors to work directly with employers to help them to address workforce challenges, diversify their workforces and support workforce growth.
This forms part of the government’s total funding package of over $70 million for new initiatives included in the 2022-2025 Action Plan as part of the Good People. Good Jobs: Queensland Workforce Strategy 2022-2032 to create a strong and diverse workforce ready to seize today’s jobs and adapt to future opportunities. Further details on initiatives can be found in the Department of Education, the Department of Environment and Science and Queensland Treasury sections of this chapter.
119
Budget Measures 2023-24
| | | | | | | | | | | | | | | | | | | | |
| | | 2022–23 | | | 2023–24 | | | 2024–25 | | | 2025–26 | | | 2026–27 | |
| | | $‘000 | | | $‘000 | | | $‘000 | | | $‘000 | | | $‘000 | |
Queensland Workforce Strategy - Gateway to Industry Schools Program | | | 1,371 | | | | 1,371 | | | | 1,371 | | | | — | | | | — | |
The government is providing increased funding of $4.1 million over 3 years to expand the Gateway to Industry Schools Program to include the hydrogen industry and increase accessibility for individuals and groups that may be underrepresented.
This forms part of the government’s total funding package of over $70 million for new initiatives included in the 2022-2025 Action Plan as part of the Good People. Good Jobs: Queensland Workforce Strategy 2022-2032 to create a strong and diverse workforce ready to seize today’s jobs and adapt to future opportunities. Further details on initiatives can be found in the Department of Education, the Department of Environment and Science and Queensland Treasury sections of this chapter.
| | | | | | | | | | | | | | | | | | | | |
| | | 2022–23 | | | 2023–24 | | | 2024–25 | | | 2025–26 | | | 2026–27 | |
| | | $‘000 | | | $‘000 | | | $‘000 | | | $‘000 | | | $‘000 | |
Queensland Workforce Strategy - Implementation Arrangements | | | 1,910 | | | | 1,280 | | | | 1,310 | | | | 800 | | | | — | |
The government is providing additional funding of $5.3 million over 4 years for the implementation arrangements of the Queensland Workforce Strategy.
This forms part of the government’s total funding package of over $70 million for new initiatives included in the 2022-2025 Action Plan as part of the Good People. Good Jobs: Queensland Workforce Strategy 2022-2032 to create a strong and diverse workforce ready to seize today’s jobs and adapt to future opportunities. Further details on initiatives can be found in the Department of Education, the Department of Environment and Science and Queensland Treasury sections of this chapter.
120
Budget Measures 2023-24
| | | | | | | | | | | | | | | | | | | | |
| | | 2022–23
$‘000 | | | 2023–24
$‘000 | | | 2024–25
$‘000 | | | 2025–26
$‘000 | | | 2026–27
$‘000 | |
Queensland Workforce Strategy - Train and Retain | | | 1,133 | | | | 1,133 | | | | 1,134 | | | | — | | | | — | |
The government is providing additional funding of $3.4 million over 3 years to implement new initiatives focussed on supporting apprentices and trainees to complete their training.
This forms part of the government’s total funding package of over $70 million for new initiatives included in the 2022-2025 Action Plan as part of the Good People. Good Jobs: Queensland Workforce Strategy 2022-2032 to create a strong and diverse workforce ready to seize today’s jobs and adapt to future opportunities. Further details on initiatives can be found in the Department of Education, the Department of Environment and Science and Queensland Treasury sections of this chapter.
| | | | | | | | | | | | | | | | | | | | |
| | | 2022–23
$‘000 | | | 2023–24
$‘000 | | | 2024–25
$‘000 | | | 2025–26
$‘000 | | | 2026–27
$‘000 | |
Queensland Workforce Strategy - Place-based Skills and Job Creation Initiatives | | | 1,000 | | | | 1,000 | | | | 1,000 | | | | 500 | | | | — | |
The government is providing additional funding of $3.5 million over 4 years to partner with rural and remote communities to deliver place-based skills and job creation initiatives to increase workforce capacity in these locations.
This forms part of the government’s total funding package of over $70 million for new initiatives included in the 2022-2025 Action Plan as part of the Good People. Good Jobs: Queensland Workforce Strategy 2022-2032 to create a strong and diverse workforce ready to seize today’s jobs and adapt to future opportunities. Further details on initiatives can be found in the Department of Education, the Department of Environment and Science and Queensland Treasury sections of this chapter.
121
Budget Measures 2023-24
| | | | | | | | | | | | | | | | | | | | |
| | | 2022–23
$‘000 | | | 2023–24
$‘000 | | | 2024–25
$‘000 | | | 2025–26
$‘000 | | | 2026–27
$‘000 | |
Australian Training Works Group | | | — | | | | — | | | | — | | | | — | | | | — | |
The government is providing additional funding of up to $1 million in 2023-24, subject to determining a final project scope, to the Australian Training Works Group Pty Ltd to assist with the development of the Cairns Indigenous Training Centre.
| | | | | | | | | | | | | | | | | | | | |
| | | 2022–23
$‘000 | | | 2023–24
$‘000 | | | 2024–25
$‘000 | | | 2025–26
$‘000 | | | 2026–27
$‘000 | |
Hear her voice - Report 2 - Rehabilitating women in prison and girls in detention | | | — | | | | — | | | | — | | | | 1,963 | | | | 6,846 | |
The government will provide increased funding of $8.8 million over 2 years from 2025-26 and $2.5 million per annum ongoing to support rehabilitating girls in detention. This includes funding for the improvement of rehabilitation programs offered to girls, including those on remand.
Further details can be found in the Queensland Corrective Services section of this chapter. This forms part of the government’s total funding package of $225 million over 5 years to respond to the recommendations of the Queensland Women’s Safety and Justice Taskforce in Hear her voice - Report Two - Women and girls’ experiences across the criminal justice system. Further details on this package are in Chapter 1 of this paper.
| | | | | | | | | | | | | | | | | | | | |
| | | 2022–23
$‘000 | | | 2023–24
$‘000 | | | 2024–25
$‘000 | | | 2025–26
$‘000 | | | 2026–27
$‘000 | |
Hear her voice - Report 2 - Restorative justice for victims of sexual violence | | | — | | | | — | | | | — | | | | 180 | | | | 270 | |
The government will provide additional funding of $450,000 over 2 years from 2025-26 for restorative justice for victims of sexual violence. This includes funding for the independent review of the use of youth justice conferencing in cases involving sexual offences.
Further details can be found in the Department of Justice and Attorney-General section of this chapter. This forms part of the government’s total funding package of $225 million over 5 years to respond to the recommendations of the Queensland Women’s Safety and Justice Taskforce in Hear her voice - Report Two - Women and girls’ experiences across the criminal justice system. Further details on this package are in Chapter 1 of this paper.
122
Budget Measures 2023-24
| | | | | | | | | | | | | | | | | | | | |
| | | 2022–23
$‘000 | | | 2023–24
$‘000 | | | 2024–25
$‘000 | | | 2025–26
$‘000 | | | 2026–27
$‘000 | |
Hear her voice Report 2 - Health, wellbeing, prenatal and postnatal care and birth experiences in prison and detention | | | — | | | | — | | | | — | | | | 1,862 | | | | 3,710 | |
The government will provide additional funding of $5.6 million over 2 years from 2025-26 and $3.4 million per annum ongoing to support health, wellbeing, prenatal and postnatal care and birth experiences in detention. These services are funded so as to better meet the health and wellbeing, and disability support needs of girls in custody; and to design and implement culturally appropriate family and parenting support to girls in custody who are mothers.
Further details can be found in the Queensland Corrective Services section of this chapter. This forms part of the government’s total funding package of $225 million over 5 years to respond to the recommendations of the Queensland Women’s Safety and Justice Taskforce in Hear her voice - Report Two - Women and girls’ experiences across the criminal justice system. Further details on this package are in Chapter 1 of this paper.
| | | | | | | | | | | | | | | | | | | | |
| | | 2022–23
$‘000 | | | 2023–24
$‘000 | | | 2024–25
$‘000 | | | 2025–26
$‘000 | | | 2026–27
$‘000 | |
Queensland Workforce Strategy - Group Training Organisation Pre-Apprenticeships Program | | | 7,300 | | | | — | | | | — | | | | — | | | | — | |
The government has provided increased funding of $7.3 million to expand the Group Training Organisation Pre-Apprenticeships Program to encourage more individuals to complete an apprenticeship and to provide employers with greater access to skilled workers.
This forms part of the government’s total funding package of over $70 million for new initiatives included in the 2022-2025 Action Plan as part of the Good People. Good Jobs: Queensland Workforce Strategy 2022-2032 to create a strong and diverse workforce ready to seize today’s jobs and adapt to future opportunities. Further details on initiatives can be found in the Department of Education, the Department of Environment and Science and Queensland Treasury sections of this chapter.
123
Budget Measures 2023-24
| | | | | | | | | | | | | | | | | | | | |
| | | 2022–23
$‘000 | | | 2023–24
$‘000 | | | 2024–25
$‘000 | | | 2025–26
$‘000 | | | 2026–27
$‘000 | |
Queensland Workforce Strategy - Workforce Connect Fund | | | — | | | | — | | | | — | | | | — | | | | — | |
Funding of $20 million over 2 years is being met internally by the department to increase investment in industry and community led projects that address attraction, retention and participation issues within the workforce.
This forms part of the government’s total funding package of over $70 million for new initiatives included in the 2022-2025 Action Plan as part of the Good People. Good Jobs: Queensland Workforce Strategy 2022-2032 to create a strong and diverse workforce ready to seize today’s jobs and adapt to future opportunities. Further details on initiatives can be found in the Department of Education, the Department of Environment and Science and Queensland Treasury sections of this chapter.
124
Budget Measures 2023-24
Legislative Assembly of Queensland
| | | | | | | | | | | | | | | | | | | | |
| | | 2022–23
$‘000 | | | 2023–24
$‘000 | | | 2024–25
$‘000 | | | 2025–26
$‘000 | | | 2026–27
$‘000 | |
Queensland Parliament Digital Transformation Program | | | — | | | | 268 | | | | 732 | | | | 751 | | | | 253 | |
The government is providing additional funding of $2.0 million over 4 years and $253,000 per annum ongoing to replace and modernise business-critical legacy IT systems which directly support the effective operations of the Queensland Legislative Assembly and parliamentary committees.
The capital component of this measure can be found in Chapter 3 Capital Measures.
125
Budget Measures 2023-24
Office of the Queensland Ombudsman
| | | | | | | | | | | | | | | | | | | | |
| | | 2022–23
$‘000 | | | 2023–24
$‘000 | | | 2024–25
$‘000 | | | 2025–26
$‘000 | | | 2026–27
$‘000 | |
Public Sector Culture and Integrity Reforms | | | — | | | | 763 | | | | 1,401 | | | | 1,418 | | | | 1,453 | |
The government is providing increased funding of $5 million over 4 years and $1.5 million per annum ongoing to enhance the Office of the Queensland Ombudsman’s complaints and investigations management capacity.
This forms part of the government’s total funding commitment of $50.8 million over 5 years from 2022-23 ($13.5 million held centrally), with $11.5 million ongoing, to deliver a package of reforms to improve integrity, accountability and transparency in government decisions and enhance the role of the Public Sector Commission and provide greater independence to integrity bodies, including the Office of the Queensland Integrity Commissioner. These reforms deliver on the recommendations in the report by Professor Coaldrake AO, Let the Sunshine In: Review of culture and accountability in the Queensland public sector, and the report by Mr Kevin Yearbury PSM, Strategic Review of the Integrity Commissioner’s Functions.
Further details can be found in the Department of the Premier and Cabinet (including the Office of the Queensland Integrity Commissioner), the Public Sector Commission, and the Department of Justice and Attorney-General sections of this chapter.
126
Budget Measures 2023-24
Public Sector Commission
| | | | | | | | | | | | | | | | | | | | |
| | | 2022–23
$‘000 | | | 2023–24
$‘000 | | | 2024–25
$‘000 | | | 2025–26
$‘000 | | | 2026–27
$‘000 | |
Public Sector Culture and Integrity Reforms | | | 1,429 | | | | 4,127 | | | | 4,303 | | | | 4,504 | | | | 4,220 | |
The government is providing additional funding of $18.6 million over 5 years and $4.2 million per annum ongoing to deliver on the Coaldrake Report recommendations to:
| • | | rejuvenate the public sector |
| • | | drive substantial cultural and capability reforms |
| • | | reposition the Public Sector Commission as a public service system leader. |
This forms part of the government’s total funding commitment of $50.8 million over 5 years from 2022-23 ($13.5 million held centrally), with $11.5 million ongoing, to deliver a package of reforms to improve integrity, accountability and transparency in government decisions and enhance the role of the Public Sector Commission and provide greater independence to integrity bodies, including the Office of the Queensland Integrity Commissioner. These reforms deliver on the recommendations in the report by Professor Coaldrake AO, Let the Sunshine In: Review of culture and accountability in the Queensland public sector, and the report by Mr Kevin Yearbury PSM, Strategic Review of the Integrity Commissioner’s Functions.
Further details can be found in the Department of the Premier and Cabinet (including the Office of the Queensland Integrity Commissioner), the Department of Justice and Attorney-General, and the Office of the Queensland Ombudsman sections of this chapter.
127
Budget Measures 2023-24
Queensland Corrective Services
| | | | | | | | | | | | | | | | | | | | |
| | | 2022–23
$‘000 | | | 2023–24
$‘000 | | | 2024–25
$‘000 | | | 2025–26
$‘000 | | | 2026–27
$‘000 | |
Queensland Corrective Services additional prisoner growth funding | | | — | | | | 51,799 | | | | 1,628 | | | | — | | | | — | |
The government is providing additional funding of $53.4 million over 2 years to support and safely manage the demands of a growing prisoner population.
| | | | | | | | | | | | | | | | | | | | |
| | | 2022–23
$‘000 | | | 2023–24
$‘000 | | | 2024–25
$‘000 | | | 2025–26
$‘000 | | | 2026–27
$‘000 | |
Southern Queensland Correctional Precinct - Stage 2 - Commissioning and Maintenance | | | 7,979 | | | | 13,655 | | | | 4,706 | | | | 1,524 | | | | 788 | |
The government is providing additional funding of $28.7 million over 5 years for the Southern Queensland Correctional Precinct - Stage 2 commissioning project to design and deliver the commissioning documentation and planning, design and establish the operating processes, and develop the holistic service delivery model for the centre. This includes procurement and contract management of a facility maintenance provider.
| | | | | | | | | | | | | | | | | | | | |
| | | 2022–23
$‘000 | | | 2023–24
$‘000 | | | 2024–25
$‘000 | | | 2025–26
$‘000 | | | 2026–27
$‘000 | |
Parole Board Queensland | | | — | | | | 7,556 | | | | 15,909 | | | | — | | | | — | |
The government is providing increased funding of $23.5 million over 2 years to enhance Parole Board Queensland operations to enable efficient consideration of parole matters.
128
Budget Measures 2023-24
| | | | | | | | | | | | | | | | | | | | |
| | | 2022–23
$‘000 | | | 2023–24
$‘000 | | | 2024–25
$‘000 | | | 2025–26
$‘000 | | | 2026–27
$‘000 | |
Psychological and Disability Services | | | — | | | | 3,699 | | | | 3,515 | | | | 3,624 | | | | 3,731 | |
The government is providing increased funding of $14.6 million over 4 years and $3.7 million per annum ongoing for psychological and disability services resourcing to ensure continuity of core frontline services, uphold human rights, and minimise the risk to community safety.
| | | | | | | | | | | | | | | | | | | | |
| | | 2022–23
$‘000 | | | 2023–24
$‘000 | | | 2024–25
$‘000 | | | 2025–26
$‘000 | | | 2026–27
$‘000 | |
In-Cell Technology in Queensland Correctional Centres | | | — | | | | 2,000 | | | | — | | | | — | | | | — | |
The government is providing additional funding of $2 million to explore opportunities for prisoner in-cell technology in correctional centres with self-service capabilities and alternatives for service delivery.
| | | | | | | | | | | | | | | | | | | | |
| | | 2022–23
$‘000 | | | 2023–24
$‘000 | | | 2024–25
$‘000 | | | 2025–26
$‘000 | | | 2026–27
$‘000 | |
Hear her voice - Report 2 - Treatment in custody, complaints mechanisms and oversight | | | 280 | | | | 1,033 | | | | 845 | | | | 742 | | | | 761 | |
The government is providing additional funding of $7 million over 5 years from 2022-23 ($3.4 million held centrally), and $1.8 million per annum ongoing ($1 million held centrally) to support treatment in custody, complaints mechanisms and oversight.
The capital component of this measure can be found in Chapter 3 Capital measures. This forms part of the government’s total funding package of $225 million over 5 years to respond to the recommendations of the Queensland Women’s Safety and Justice Taskforce in Hear her voice - Report 2 - Women and girls’ experiences across the criminal justice system . Further details on this package are in Chapter 1 of this paper.
129
Budget Measures 2023-24
| | | | | | | | | | | | | | | | | | | | |
| | | 2022–23
$‘000 | | | 2023–24
$‘000 | | | 2024–25
$‘000 | | | 2025–26
$‘000 | | | 2026–27
$‘000 | |
Hear her voice - Report 2 - Health, wellbeing, prenatal and postnatal care and birth experiences in prison and detention | | | 70 | | | | 998 | | | | 1,038 | | | | 1,069 | | | | 1,096 | |
The government is providing additional funding of $4.3 million over 5 years from 2022-23 and $1.1 million per annum ongoing to support health, wellbeing, prenatal and postnatal care and birth experiences in prison and detention. This includes the design and implementation of culturally appropriate family and parenting support to women and girls in custody who are mothers; and to better meet the needs of women and girls in custody who are pregnant, and the needs of children living in custody with their mothers.
Further details can be found in the Department of Youth Justice, Employment, Small Business and Training section of this chapter. This forms part of the government’s total funding package of $225 million over 5 years to respond to the recommendations of the Queensland Women’s Safety and Justice Taskforce in Hear her voice - Report 2 - Women and girls’ experiences across the criminal justice system. Further details on this package are in Chapter 1 of this paper.
| | | | | | | | | | | | | | | | | | | | |
| | | 2022–23
$‘000 | | | 2023–24
$‘000 | | | 2024–25
$‘000 | | | 2025–26
$‘000 | | | 2026–27
$‘000 | |
Hear her voice - Report 2 - Reintegrating women and girls into the community | | | — | | | | 400 | | | | 300 | | | | 309 | | | | 317 | |
The government is providing increased funding of $7.4 million over 4 years from 2023-24 (including $6.1 million held centrally) and $1.9 million per annum ongoing to support reintegrating women and girls into the community. A further $379,000 over 4 years from 2023-24 and $99,000 per annum ongoing is being met internally by the department. This is to:
| • | | implement a scheme to enable safe storage of personal belongings of women and girls in custody |
| • | | develop options to better identify girls and women who are at risk of being refused bail and women eligible to apply for parole, to assist them to access accommodation, services and to support their transition from custody |
| • | | implement a process to enable women and girls in custody to apply for identification documents so they can have them prior to their release. |
Further details can be found in the Department of Housing and Department of Justice and Attorney-General sections of this chapter. This forms part of the government’s total funding package of $225 million over 5 years to respond to recommendations of the Queensland
130
Budget Measures 2023-24
Women’s Safety and Justice Taskforce in Hear her voice - Report 2 - Women and girls’ experiences across the criminal justice system. Further details on this package are in Chapter 1 of this paper.
| | | | | | | | | | | | | | | | | | | | |
| | | 2022–23 | | | 2023–24 | | | 2024–25 | | | 2025–26 | | | 2026–27 | |
| | | $‘000 | | | $‘000 | | | $‘000 | | | $‘000 | | | $‘000 | |
Hear her voice - Report 2 - Sentencing women and girls | | | — | | | | 315 | | | | — | | | | — | | | | — | |
The government is providing increased funding of $7.7 million over 3 years from 2023-24, $7.4 million (held centrally), and a further $883,000 is being met internally by the department. This includes to assist with the design and evaluation of a trial of dedicated court advisory services.
The capital component of this measure can be found in Chapter 3 Capital measures. This forms part of the government’s total funding package of $225 million over 5 years to respond to the recommendations of the Queensland Women’s Safety and Justice Taskforce in Hear her voice - Report 2 - Women and girls’ experiences across the criminal justice system. Further details on this package are in Chapter 1 of this paper.
| | | | | | | | | | | | | | | | | | | | |
| | | 2022–23 | | | 2023–24 | | | 2024–25 | | | 2025–26 | | | 2026–27 | |
| | | $‘000 | | | $‘000 | | | $‘000 | | | $‘000 | | | $‘000 | |
Hear her voice - Report 2 - Rehabilitating women in prison and girls in detention | | | — | | | | — | | | | — | | | | — | | | | — | |
The government is providing increased funding of $31.2 million over 5 years from 2022-23, held centrally, and $9.2 million per annum ongoing to support rehabilitating women in prison and girls in detention. This includes for the improvement of the provision of rehabilitation programs; and improved access to quality education programs, including online programs.
Further details can be found in the Department of Youth Justice, Employment, Small Business and Training section of his chapter. This forms part of the government’s total funding package of $225 million over 5 years to respond to the recommendations of the Queensland Women’s Safety and Justice Taskforce in Hear her voice - Report 2 - Women and girls’ experiences across the criminal justice system. Further details on this package are in Chapter 1 of this paper.
131
Budget Measures 2023-24
| | | | | | | | | | | | | | | | | | | | |
| | | 2022–23 | | | 2023–24 | | | 2024–25 | | | 2025–26 | | | 2026–27 | |
| | | $‘000 | | | $‘000 | | | $‘000 | | | $‘000 | | | $‘000 | |
Gangs Exit Program | | | — | | | | 543 | | | | — | | | | — | | | | — | |
The government is providing increased funding of $0.5 million in 2023-24 to continue to support the Exit program and to scope and assess its expansion into Queensland correctional centres.
The Exit program, established in July 2020, is aimed at preventing Outlaw Motorcycle Gang crime, reducing victims of crime (including those experiencing domestic and family violence) and combating recidivism.
This forms part of the government’s total funding of $1.2 million in 2023-24 to support the Queensland Gangs Exit program. Further details of this package can be found in the Queensland Police Service section of this chapter.
| | | | | | | | | | | | | | | | | | | | |
| | | 2022–23 | | | 2023–24 | | | 2024–25 | | | 2025–26 | | | 2026–27 | |
| | | $‘000 | | | $‘000 | | | $‘000 | | | $‘000 | | | $‘000 | |
Prisoner Capacity and Health Services | | | — | | | | 358 | | | | 1,255 | | | | 1,596 | | | | 1,443 | |
The government is providing additional funding of $4.7 million over 4 years for the Enhanced Community Corrections Pilot being piloted initially in Townsville to enhance court advice and prosecution support services to reduce the imprisonment of First Nations peoples, maximise rehabilitative outcomes and put downward pressure on rates of recidivism. Additional funding also provides for the installation of information technology infrastructure in correctional centres to enhance the provision of health care.
The capital component of this measure can be found in Chapter 3 Capital Measures.
132
Budget Measures 2023-24
| | | | | | | | | | | | | | | | | | | | |
| | | 2022–23 | | | 2023–24 | | | 2024–25 | | | 2025–26 | | | 2026–27 | |
| | | $‘000 | | | $‘000 | | | $‘000 | | | $‘000 | | | $‘000 | |
Youth Justice Investment - Electronic Monitoring | | | — | | | | — | | | | — | | | | — | | | | — | |
The government is providing increased funding of $4 million over 2 years from 2023-24 (held centrally) for the expanded use of electronic monitoring of young offenders on bail.
This forms part of the government’s total funding package of $446.4 million ($441.9 million new funding and $4.9 million internally funded) over 5 years and $33.7 million per annum ongoing to help boost police resources and tackle the complex causes of youth crime and support community safety.
Further details can be found in Chapter 1 of this paper and in the Department of Child Safety, Seniors and Disability Services, Department of Education, Department of Housing, Department of Justice and Attorney-General, Department of the Premier and Cabinet, Department of Treaty, Aboriginal and Torres Strait Islander Partnerships, Communities and the Arts, Department of Youth Justice, Employment, Small Business and Training, Queensland Health and Queensland Police Service sections of this chapter and the Queensland Police Service section of Chapter 3 Capital Measures.
133
Budget Measures 2023-24
Queensland Fire and Emergency Services
| | | | | | | | | | | | | | | | | | | | |
| | | 2022–23 | | | 2023–24 | | | 2024–25 | | | 2025–26 | | | 2026–27 | |
| | | $‘000 | | | $‘000 | | | $‘000 | | | $‘000 | | | $‘000 | |
Emergency Management Reform - State Emergency Service | | | — | | | | 18,304 | | | | — | | | | — | | | | — | |
The government is providing increased funding of $18.3 million in 2023-24 to continue to enhance the State Emergency Service volunteer capability across Queensland. This includes an additional 60 full time equivalent positions provided over 2 years, with 30 recruited in 2023-24. This will bring a total uplift of 105 positions to the State Emergency Service, as part of the government’s response.
This forms part of the government’s total funding package of up to $578 million ($493.2 million held centrally) over 5 years and $142 million per annum ongoing, to deliver enhanced emergency and fire services for a safer Queensland.
The government’s investment, in response to the Independent Review of Queensland Fire and Emergency Services, will provide for an uplift of over 500 full time emergency services staff, the establishment of a new Queensland fire department and provide support for our volunteers in Marine Rescue Queensland, the State Emergency Service and the Rural Fire Service. Implementation of these reforms is being overseen by the Reform Implementation Taskforce including developing the ongoing operating and funding models beyond 2023-24.
Further details can be found in Chapter 3 Capital Measures of this paper and in the Queensland Police Service and Department of State Development, Infrastructure, Local Government and Planning sections of this chapter.
| | | | | | | | | | | | | | | | | | | | |
| | | 2022–23 | | | 2023–24 | | | 2024–25 | | | 2025–26 | | | 2026–27 | |
| | | $‘000 | | | $‘000 | | | $‘000 | | | $‘000 | | | $‘000 | |
Emergency Management Reform - Rural Fire Service | | | — | | | | 11,989 | | | | — | | | | — | | | | — | |
The government is providing increased funding of $12 million in 2023-24 to continue the commitment to uplift Rural Fire Service capability and ensure a sustainable volunteer model across Queensland.
This forms part of the government’s total funding package of up to $578 million ($493.2 million held centrally) over 5 years and $142 million per annum ongoing, to deliver enhanced emergency and fire services for a safer Queensland. The government’s investment, in response to the Independent Review of Queensland Fire and Emergency Services, will provide for an uplift of over 500 full time emergency services staff, the establishment of a new Queensland fire department and provide support for our volunteers in Marine Rescue Queensland, the State Emergency Service and the Rural Fire Service. Implementation of
134
Budget Measures 2023-24
these reforms is being overseen by the Reform Implementation Taskforce including developing the ongoing operating and funding models beyond 2023-24. Further details can be found in Chapter 3 Capital Measures of this paper and in the Queensland Police Service and Department of State Development, Infrastructure, Local Government and Planning sections of this chapter.
| | | | | | | | | | | | | | | | | | | | |
| | | 2022–23 | | | 2023–24 | | | 2024–25 | | | 2025–26 | | | 2026–27 | |
| | | $‘000 | | | $‘000 | | | $‘000 | | | $‘000 | | | $‘000 | |
Supporting Our Fire Service Officers | | | 4,583 | | | | 4,894 | | | | 5,162 | | | | 5,291 | | | | 5,424 | |
The government is providing additional funding of $19.9 million over 4 years and $5.4 million per annum ongoing to increase employer superannuation contributions for those fire officers who are statutorily required to retire from employment with Queensland Fire and Emergency Services by the age of 65 years.
| | | | | | | | | | | | | | | | | | | | |
| | | 2022–23 | | | 2023–24 | | | 2024–25 | | | 2025–26 | | | 2026–27 | |
| | | $‘000 | | | $‘000 | | | $‘000 | | | $‘000 | | | $‘000 | |
Bushfire Safety Campaign | | | — | | | | 1,600 | | | | 600 | | | | 600 | | | | — | |
The government is providing increased funding of $2.8 million over 3 years, to enhance Queensland’s bushfire safety and preparedness messaging campaigns.
Funding of up to $2.2 million over 3 years is being met internally by Queensland Fire and Emergency Services to deliver the campaigns. Total funding for this program is $5 million over 3 years from 2023-24.
| | | | | | | | | | | | | | | | | | | | |
| | | 2022–23 | | | 2023–24 | | | 2024–25 | | | 2025–26 | | | 2026–27 | |
| | | $‘000 | | | $‘000 | | | $‘000 | | | $‘000 | | | $‘000 | |
Camera Detected Offence Program | | | — | | | | 605 | | | | 628 | | | | 651 | | | | 674 | |
The government is providing increased funding of $2.6 million over 4 years and $700,000 per annum ongoing, to enhance delivery of Queensland Fire and Emergency Services’ Road Attitudes and Action Planning programs across Queensland.
This forms part of the government’s total funding of $548.1 million over 5 years, and $183.5 million per annum ongoing, as part of the Camera Detected Offence Program. Further funding can be found in the Queensland Police Service, Department of Transport and Main Roads, and Queensland Treasury sections of this chapter. The capital component of this measure can be found in the Department of Transport and Main Roads and Queensland Police Service sections of Chapter 3 Capital Measures.
135
Budget Measures 2023-24
| | | | | | | | | | | | | | | | | | | | |
| | | 2022–23 | | | 2023–24 | | | 2024–25 | | | 2025–26 | | | 2026–27 | |
| | | $‘000 | | | $‘000 | | | $‘000 | | | $‘000 | | | $‘000 | |
Fire Communications Staffing | | | — | | | | — | | | | — | | | | — | | | | — | |
Funding of $10.4 million over 4 years from 2023-24 and $3.5 million ongoing is being met internally by the department to fully fund an additional 20 full time equivalent Fire Communication Officers to enhance emergency dispatch operations. An additional 7 officers will be recruited in 2023-24 with the full complement of 20 officers expected to commence in 2024-25.
| | | | | | | | | | | | | | | | | | | | |
| | | 2022–23 | | | 2023–24 | | | 2024–25 | | | 2025–26 | | | 2026–27 | |
| | | $‘000 | | | $‘000 | | | $‘000 | | | $‘000 | | | $‘000 | |
Queensland’s Aerial Firefighting Capability (National Aerial Firefighting Centre Contracts) | | | — | | | | — | | | | — | | | | — | | | | — | |
The government is providing increased funding over 3 years, held centrally, to enhance Queensland’s aerial firefighting capability to include intelligence gathering aircraft platforms and additional suppressant delivery aircraft under additional National Aerial Firefighting Centre contracts.
136
Budget Measures 2023-24
Queensland Health
| | | | | | | | | | | | | | | | | | | | |
| | | 2022–23 | | | 2023–24 | | | 2024–25 | | | 2025–26 | | | 2026–27 | |
| | | $‘000 | | | $‘000 | | | $‘000 | | | $‘000 | | | $‘000 | |
Health Funding Uplift | | | 325,503 | | | | 508,707 | | | | 521,133 | | | | 572,869 | | | | 959,337 | |
The government is providing an uplift to Queensland Health’s operating funding envelope of $2.888 billion over 5 years to address demand and cost pressures and support a suite of programs and initiatives targeting improving ambulance responsiveness and reducing ramping, addressing pressures on emergency departments, reducing wait times for surgery and specialist clinics, as well as boosting women’s health care and mental health care. This uplift in funding will also support:
| | • | | the operating requirements for the Satellite Hospitals and the Logan and Caboolture Hospital expansions |
| | • | | Domestic and Family Violence services system reform |
| | • | | Making Tracks towards Achieving Health Equity with First Nations People 2021-2025 |
| | • | | Rural and Regional Birthing Services |
| | • | | Queensland Ambulance Services additional ambulance operatives. |
| | | | | | | | | | | | | | | | | | | | |
| | | 2022–23 | | | 2023–24 | | | 2024–25 | | | 2025–26 | | | 2026–27 | |
| | | $‘000 | | | $‘000 | | | $‘000 | | | $‘000 | | | $‘000 | |
Palliative and End of Life Care | | | — | | | | 35,664 | | | | 49,974 | | | | 66,187 | | | | — | |
The government is providing additional funding of $151.8 million over 3 years to support palliative care reform. This includes funding to support the government’s response to the Health, Communities, Disability Services and Domestic and Family Violence Prevention Committee’s Report No. 33, 56th Parliament Aged care, end-of-life and palliative care.
Funding of up to $19.4 million is being met internally by the department to support this reform.
Total funding for palliative care reform is $171.2 million over 5 years, including $9.7 million in 2022-23.
137
Budget Measures 2023-24
| | | | | | | | | | | | | | | | | | | | |
| | | 2022–23 | | | 2023–24 | | | 2024–25 | | | 2025–26 | | | 2026–27 | |
| | | $‘000 | | | $‘000 | | | $‘000 | | | $‘000 | | | $‘000 | |
Forensic DNA Commission of Inquiry | | | 7,755 | | | | 17,520 | | | | 16,090 | | | | 10,345 | | | | 10,200 | |
The government is providing additional funding of $81.2 million over 4 years (including $29.5 million held centrally) for a range of measures including to support and expand forensic DNA service delivery, design and establish the new Queensland forensic science agency and dedicated retrospective case and sample review function, and support retrospective DNA testing and analysis required following case review.
This forms part of the government’s total funding package of $105.3 million over 5 years and $10.2 million per annum ongoing for immediate measures in response to the Commission of Inquiry into Forensic DNA Testing in Queensland.
Further details can be found in the Department of Justice and Attorney-General sections of this chapter.
| | | | | | | | | | | | | | | | | | | | |
| | | 2022–23 | | | 2023–24 | | | 2024–25 | | | 2025–26 | | | 2026–27 | |
| | | $‘000 | | | $‘000 | | | $‘000 | | | $‘000 | | | $‘000 | |
Patient Travel Subsidy Scheme | | | — | | | | 14,179 | | | | 16,407 | | | | 18,679 | | | | 20,996 | |
The government is providing increased funding of $70.3 million over 4 years and $21 million per annum ongoing from 2026-27 to support an increase to the Patient Travel Subsidy Scheme (PTSS). The increase to the PTSS will assist with offsetting current cost of living pressures and support financially vulnerable Queenslanders to seek the clinical care they need.
| | | | | | | | | | | | | | | | | | | | |
| | | 2022–23 | | | 2023–24 | | | 2024–25 | | | 2025–26 | | | 2026–27 | |
| | | $‘000 | | | $‘000 | | | $‘000 | | | $‘000 | | | $‘000 | |
Waterproof Artificial Limbs | | | — | | | | 2,327 | | | | 2,327 | | | | 2,327 | | | | 2,327 | |
The government is providing additional funding of $9.3 million over 4 years to provide eligible applicants under the Queensland Artificial Limb Service the option of a prosthesis with waterproof components, where appropriate.
138
Budget Measures 2023-24
| | | | | | | | | | | | | | | | | | | | |
| | | 2022–23 | | | 2023–24 | | | 2024–25 | | | 2025–26 | | | 2026–27 | |
| | | $‘000 | | | $‘000 | | | $‘000 | | | $‘000 | | | $‘000 | |
Women’s Economic Security: Future Women - Jobs Academy | | | — | | | | 800 | | | | 1,600 | | | | 800 | | | | — | |
The government is providing additional funding of $3.2 million to support a Future Women -Jobs Academy program for a 2-year period to train, support and connect up to an estimated 500 unemployed and underemployed Queensland women with paid employment and training programs.
This forms part of the government’s total funding package of $16.3 million over 4 years for the Women’s Economic Security package. Further details on this package are in Chapter 1 of this paper and the Department of Tourism, Innovation and Sport, and Department of Youth Justice, Employment, Small Business and Training sections of this chapter.
| | | | | | | | | | | | | | | | | | | | |
| | | 2022–23 | | | 2023–24 | | | 2024–25 | | | 2025–26 | | | 2026–27 | |
| | | $‘000 | | | $‘000 | | | $‘000 | | | $‘000 | | | $‘000 | |
Women’s Economic Security: Women in Network Grants Program | | | — | | | | 625 | | | | 625 | | | | 825 | | | | 725 | |
The government is providing additional funding of $2.8 million over 4 years from 2023-24, including $300,000 for evaluation, for the Women in Network grant program to support girls and women’s participation and pathways in male dominated industries, including through support to recruit, retain, upskill and progress into leadership positions in these industries.
This forms part of the government’s total funding package of $16.3 million over 4 years for the Women’s Economic Security package. Further details on this package are in Chapter 1 of this paper and the Department of Tourism, Innovation and Sport, and Department of Youth Justice, Employment, Small Business and Training sections of this chapter.
139
Budget Measures 2023-24
| | | | | | | | | | | | | | | | | | | | |
| | | 2022–23 | | | 2023–24 | | | 2024–25 | | | 2025–26 | | | 2026–27 | |
| | | $‘000 | | | $‘000 | | | $‘000 | | | $‘000 | | | $‘000 | |
Women’s Economic Security: Fresh Start for Me (transition from recovery to workforce) | | | — | | | | 533 | | | | — | | | | — | | | | — | |
The government is providing additional funding of $533,000 in 2023-24 for the Fresh Start For Me program to establish online resources to support women, post domestic and family violence crisis, to return to or enter the workforce.
This forms part of the government’s total funding package of $16.3 million over 4 years for the Women’s Economic Security package. Further details on this package are in Chapter 1 of this paper and the Department of Tourism, Innovation and Sport, and Department of Youth Justice, Employment, Small Business and Training sections of this chapter.
| | | | | | | | | | | | | | | | | | | | |
| | | 2022–23 | | | 2023–24 | | | 2024–25 | | | 2025–26 | | | 2026–27 | |
| | | $‘000 | | | $‘000 | | | $‘000 | | | $‘000 | | | $‘000 | |
Women’s Economic Security: Resourcing to support Office for Women initiatives | | | — | | | | 100 | | | | 100 | | | | — | | | | — | |
The government is providing additional funding of $200,000 over 2 years for implementation of Women’s Economic Security initiatives led by the Office for Women.
This forms part of the government’s total funding package of $16.3 million over 4 years for the Women’s Economic Security package. Further details on this package are in Chapter 1 of this paper and the Department of Tourism, Innovation and Sport, and Department of Youth Justice, Employment, Small Business and Training sections of this chapter.
| | | | | | | | | | | | | | | | | | | | |
| | | 2022–23 | | | 2023–24 | | | 2024–25 | | | 2025–26 | | | 2026–27 | |
| | | $‘000 | | | $‘000 | | | $‘000 | | | $‘000 | | | $‘000 | |
Youth Detention Centre Capacity - Addressing Capacity Issues at Youth Detention Centres | | | 386 | | | | 386 | | | | — | | | | — | | | | — | |
The government is providing additional funding of $722,000 over 2 years for health services as part of the Government’s response to addressing capacity issues in youth detention centres. A further $118,991 is held centrally for this measure.
This forms part of total increased funding of $89.7 million over 3 years ($78.1 million new funding and $11.6 million from existing resources) to address capacity issues at Youth Detention Centres. Further details can be found in the Department of Education, Department of Youth Justice, Employment, Small Business and Training and Queensland Police Service sections of this chapter and the Queensland Police Service section of Chapter 3 Capital Measures.
140
Budget Measures 2023-24
| | | | | | | | | | | | | | | | | | | | |
| | | 2022–23 | | | 2023–24 | | | 2024–25 | | | 2025–26 | | | 2026–27 | |
| | | $‘000 | | | $‘000 | | | $‘000 | | | $‘000 | | | $‘000 | |
Youth Justice Investment - Fast-track Sentencing | | | 110 | | | | 332 | | | | 86 | | | | — | | | | — | |
The government is providing $528,000 over 3 years to enhance existing child and youth mental health court liaison services to support the fast-track sentencing pilot in 4 locations for 18 months to address delays in court proceedings through proactive case management of matters.
This forms part of the government’s total additional funding of $16.5 million over 4 years for these pilots.
This forms part of the government’s total funding package of $446.4 million ($441.9 million new funding and $4.5 million internally funded) over 5 years and $33.7 million per annum ongoing to help boost police resources and tackle the complex causes of youth crime and support community safety.
Further details can be found in Chapter 1 of this paper and in the Department of Child Safety, Seniors and Disability Services, Department of Education, Department of Housing, Department of Justice and Attorney-General, Department of the Premier and Cabinet, Department of Treaty, Aboriginal and Torres Strait Islander Partnerships, Communities and the Arts, Queensland Corrective Services, Department of Youth Justice, Employment, Small Business and Training and Queensland Police Service sections of this chapter and the Queensland Police Service section of Chapter 3 Capital Measures.
| | | | | | | | | | | | | | | | | | | | |
| | | 2022–23 | | | 2023–24 | | | 2024–25 | | | 2025–26 | | | 2026–27 | |
| | | $‘000 | | | $‘000 | | | $‘000 | | | $‘000 | | | $‘000 | |
Domestic and Family Violence Services System Reform | | | — | | | | — | | | | — | | | | — | | | | — | |
The government will provide $21.6 million over 4 years for trauma-informed domestic and family violence (DFV) training to the frontline health workforce across Queensland, and mental health, alcohol and other drug service participation in DFV High Risk Teams.
This initiative will be funded from within the $2.888 billion Health Funding Uplift.
141
Budget Measures 2023-24
| | | | | | | | | | | | | | | | | | | | |
| | | 2022–23 | | | 2023–24 | | | 2024–25 | | | 2025–26 | | | 2026–27 | |
| | | $‘000 | | | $‘000 | | | $‘000 | | | $‘000 | | | $‘000 | |
Improvement to Salary Packaging and Fringe Benefits Tax (FBT) Policy for Hospital Employees | | | — | | | | — | | | | — | | | | — | | | | — | |
Funding is being met internally by the department to assist in attraction and retention of frontline staff, particularly to regional and remote Hospital and Health Services, by simplifying salary packaging arrangements.
| | | | | | | | | | | | | | | | | | | | |
| | | 2022–23 | | | 2023–24 | | | 2024–25 | | | 2025–26 | | | 2026–27 | |
| | | $‘000 | | | $‘000 | | | $‘000 | | | $‘000 | | | $‘000 | |
LifeFlight Australia Limited Emergency Helicopter Services New 10-year Service Agreement | | | 32,432 | | | | — | | | | — | | | | — | | | | — | |
The government is providing $586.1 million held centrally towards a new, fully costed, 10-year commercial agreement between Queensland Health and LifeFlight Australia Limited.
The government has provided an increase of $13.8 million to LifeFlight Australia’s operating expenditure as a one-off contribution. The government is also providing an increase of $18.6 million for Queensland Health to provide a grant to LifeFlight Australia for the land lease, construction and fit-out of a new 3-bay hangar at Sunshine Coast Airport.
| | | | | | | | | | | | | | | | | | | | |
| | | 2022–23 | | | 2023–24 | | | 2024–25 | | | 2025–26 | | | 2026–27 | |
| | | $‘000 | | | $‘000 | | | $‘000 | | | $‘000 | | | $‘000 | |
Making Tracks Towards Achieving Health Equity With First Nations Peoples 2021-2025 | | | — | | | | — | | | | — | | | | — | | | | — | |
The government will provide an additional $123 million over 4 years to continue initiatives under Making Tracks Towards Achieving Health Equity with First Nations Peoples 2021-25.
This initiative will be funded from within the $2.888 billion Health Funding Uplift.
142
Budget Measures 2023-24
| | | | | | | | | | | | | | | | | | | | |
| | | 2022–23 | | | 2023–24 | | | 2024–25 | | | 2025–26 | | | 2026–27 | |
| | | $‘000 | | | $‘000 | | | $‘000 | | | $‘000 | | | $‘000 | |
Nursing and Midwifery Student Regional Placements Allowance | | | — | | | | — | | | | — | | | | — | | | | — | |
The government is providing additional funding of $22.0 million over 4 years from 2023-24, to be held centrally, to provide a cost-of-living allowance of $5,000 per student to provide financial assistance to student nurses and midwives undertaking placements in regional, rural and remote areas.
| | | | | | | | | | | | | | | | | | | | |
| | | 2022–23 | | | 2023–24 | | | 2024–25 | | | 2025–26 | | | 2026–27 | |
| | | $‘000 | | | $‘000 | | | $‘000 | | | $‘000 | | | $‘000 | |
Queensland Ambulance Service (QAS) Additional Ambulance Operatives | | | — | | | | — | | | | — | | | | — | | | | — | |
The government is providing $207 million over 4 years for an additional 200 Queensland Ambulance operatives.
This initiative will be funded from within the $2.888 billion Health Funding Uplift.
| | | | | | | | | | | | | | | | | | | | |
| | | 2022–23 | | | 2023–24 | | | 2024–25 | | | 2025–26 | | | 2026–27 | |
| | | $‘000 | | | $‘000 | | | $‘000 | | | $‘000 | | | $‘000 | |
Rural and Regional Birthing Services | | | — | | | | — | | | | — | | | | — | | | | — | |
The government is providing $42 million over 4 years for continued support for maternity birthing services in regional and rural locations and strengthening outreach obstetric and gynaecology services.
This initiative will be funded from within the $2.888 billion Health Funding Uplift.
143
Budget Measures 2023-24
| | | | | | | | | | | | | | | | | | | | |
| | | 2022–23 | | | 2023–24 | | | 2024–25 | | | 2025–26 | | | 2026–27 | |
| | | $‘000 | | | $‘000 | | | $‘000 | | | $‘000 | | | $‘000 | |
Transitional Support | | | 130,511 | | | | — | | | | — | | | | — | | | | — | |
The government has provided an additional $130.5 million as transitional support for Queensland Health to meet cost and demand pressures.
| | | | | | | | | | | | | | | | | | | | |
| | | 2022–23 | | | 2023–24 | | | 2024–25 | | | 2025–26 | | | 2026–27 | |
| | | $‘000 | | | $‘000 | | | $‘000 | | | $‘000 | | | $‘000 | |
Workforce Attraction Incentive Scheme | | | — | | | | — | | | | — | | | | — | | | | — | |
The government is providing an incentive of up to $20,000 for eligible health workers and up to $70,000 for doctors to attract interstate and international clinical workers to move to Queensland and work in the public health system, particularly targeting rural and remote health facilities.
144
Budget Measures 2023-24
Queensland Police Service
| | | | | | | | | | | | | | | | | | | | |
| | | 2022–23 | | | 2023–24 | | | 2024–25 | | | 2025–26 | | | 2026–27 | |
| | | $‘000 | | | $‘000 | | | $‘000 | | | $‘000 | | | $‘000 | |
Emergency Management Reforms - Marine Rescue Queensland | | | — | | | | 27,000 | | | | — | | | | — | | | | — | |
The government is providing additional funding of $27 million to continue the commitment to establish an integrated volunteer marine rescue service to ensure a sustainable model to enhance the marine rescue volunteer capability for on-water safety across Queensland.
This forms part of the government’s total funding package of up to $578 million ($493.2 million held centrally) over 5 years and $142 million per annum ongoing, to deliver enhanced emergency and fire services for a safer Queensland. The government’s investment, in response to the Independent Review of Queensland Fire and Emergency Services, will provide for an uplift of over 500 full time emergency services staff, the establishment of a new Queensland fire department and provide support for our volunteers in Marine Rescue Queensland, the State Emergency Service and the Rural Fire Service.
Implementation of these reforms is being overseen by the Reform Implementation Taskforce, including developing the ongoing operating and funding models beyond 2023-24. Further details can be found in Chapter 3 Capital Measures of this paper, and in the Queensland Fire and Emergency Services and Department of State Development, Infrastructure, Local Government and Planning sections of this chapter.
| | | | | | | | | | | | | | | | | | | | |
| | | 2022–23 | | | 2023–24 | | | 2024–25 | | | 2025–26 | | | 2026–27 | |
| | | $‘000 | | | $‘000 | | | $‘000 | | | $‘000 | | | $‘000 | |
Emergency Management Reforms - Disaster Management | | | — | | | | 16,500 | | | | — | | | | — | | | | — | |
The government is providing increased funding of $16.5 million in 2023-24 to progress the government’s commitment from the Independent Review of Queensland Fire and Emergency Services.
This forms part of the government’s total funding package of up to $578 million ($493.2 million held centrally) over 5 years and $142 million per annum ongoing, to deliver enhanced emergency and fire services for a safer Queensland. The government’s investment, in response to the Independent Review of Queensland Fire and Emergency Services, will provide for an uplift of over 500 full time emergency services staff, the establishment of a new Queensland fire department and provide support for our volunteers in Marine Rescue Queensland, the State Emergency Service and the Rural Fire Service.
145
Budget Measures 2023-24
Implementation of these reforms is being overseen by the Reform Implementation Taskforce, including developing the ongoing operating and funding models beyond 2023-24. Further details can be found in Chapter 3 Capital Measures of this paper, and in the Queensland Fire and Emergency Services and Department of State Development, Infrastructure, Local Government and Planning sections of this chapter.
| | | | | | | | | | | | | | | | | | | | |
| | | 2022–23 | | | 2023–24 | | | 2024–25 | | | 2025–26 | | | 2026–27 | |
| | | $‘000 | | | $‘000 | | | $‘000 | | | $‘000 | | | $‘000 | |
Emergency Management Reforms - Queensland Police Service Reform Implementation Taskforce | | | — | | | | — | | | | — | | | | — | | | | — | |
The government is providing additional funding of $10 million over 2 years, held centrally, to establish the Queensland Police Service Reform Implementation Taskforce and to implement the Government Response to the independent review of Queensland Fire and Emergency Services.
This forms part of the government’s total funding package of up to $578 million ($493.2 million held centrally) over 5 years and $142 million per annum ongoing, to deliver enhanced emergency and fire services for a safer Queensland. The government’s investment, in response to the Independent Review of Queensland Fire and Emergency Services, will provide for an uplift of over 500 full time emergency services staff, the establishment of a new Queensland fire department and provide support for our volunteers in Marine Rescue Queensland, the State Emergency Service and the Rural Fire Service. Implementation of these reforms is being overseen by the Reform Implementation Taskforce, including developing the ongoing operating and funding models beyond 2023-24. Further details can be found in Chapter 3 Capital Measures of this paper, and in the Queensland Fire and Emergency Services and Department of State Development, Infrastructure, Local Government and Planning sections of this chapter.
146
Budget Measures 2023-24
| | | | | | | | | | | | | | | | | | | | |
| | | 2022–23 | | | 2023–24 | | | 2024–25 | | | 2025–26 | | | 2026–27 | |
| | | $‘000 | | | $‘000 | | | $‘000 | | | $‘000 | | | $‘000 | |
Youth Justice Investment - Program for Queensland Police-Citizens Youth Club (PCYC) Capital Works | | | — | | | | 25,000 | | | | 25,000 | | | | — | | | | — | |
The government is providing additional funding of $50 million over 2 years for a grant program to PCYC to facilitate infrastructure development in priority locations; improving frontline social program delivery and intervention initiatives targeting youth offending and recidivism, and victimisation.
This forms part of the government’s total funding package of $446.4 million ($441.9 million new funding and $4.5 million internally funded) over 5 years and $33.7 million per annum ongoing to help boost police resources and tackle the complex causes of youth crime and support community safety.
Further details can be found in Chapter 1 of this paper and in the Department of Child Safety, Seniors and Disability Services, Department of Education, Department of Housing, Department of Justice and Attorney-General, Department of the Premier and Cabinet, Department of Treaty, Aboriginal and Torres Strait Islander Partnerships, Communities and the Arts, Department of Youth Justice, Employment, Small Business and Training, Queensland Corrective Services and Queensland Health sections of this chapter and the Queensland Police Service section of Chapter 3 Capital Measures.
| | | | | | | | | | | | | | | | | | | | |
| | | 2022–23 | | | 2023–24 | | | 2024–25 | | | 2025–26 | | | 2026–27 | |
| | | $‘000 | | | $‘000 | | | $‘000 | | | $‘000 | | | $‘000 | |
Youth Justice Investment - Police Extreme High Visibility Patrols | | | 5,000 | | | | 10,000 | | | | 10,000 | | | | — | | | | — | |
The government is providing increased funding of $25 million over 3 years to support Police Extreme High Visibility Patrols in hot spots and at targeted times throughout the year.
This forms part of the government’s total funding package of $446.4 million ($441.9 million new funding and $4.5 million internally funded) over 5 years and $33.7 million per annum ongoing to help boost police resources and tackle the complex causes of youth crime and support community safety.
Further details can be found in Chapter 1 of this paper and in the Department of Child Safety, Seniors and Disability Services, Department of Education, Department of Housing, Department of Justice and Attorney-General, Department of the Premier and Cabinet, Department of Treaty, Aboriginal and Torres Strait Islander Partnerships, Communities and the Arts, Department of Youth Justice, Employment, Small Business and Training, Queensland Corrective Services and Queensland Health sections of this chapter and the Queensland Police Service section of Chapter 3 Capital Measures.
147
Budget Measures 2023-24
| | | | | | | | | | | | | | | | | | | | |
| | | 2022–23 | | | 2023–24 | | | 2024–25 | | | 2025–26 | | | 2026–27 | |
| | | $‘000 | | | $‘000 | | | $‘000 | | | $‘000 | | | $‘000 | |
Youth Justice Investment - Youth Co-responder Teams | | | — | | | | 5,447 | | | | 5,529 | | | | 3,379 | | | | 3,459 | |
The government is providing increased funding of $17.8 million over 4 years and $3.5 million per annum ongoing to continue to deliver and expand the youth co-responder model to deal with or divert high risk young people including those on bail and those subject to electronic monitoring. This forms part of total increased funding of $96.2 million over 4 years and $17.9 million per annum ongoing for the youth co-responder model.
This forms part of the government’s total funding package of $446.4 million ($441.9 million new funding and $4.5 million internally funded) over 5 years and $33.7 million per annum ongoing to help boost police resources and tackle the complex causes of youth crime and support community safety.
Further details can be found in Chapter 1 of this paper and in the Department of Child Safety, Seniors and Disability Services, Department of Education, Department of Housing, Department of Justice and Attorney-General, Department of the Premier and Cabinet, Department of Treaty, Aboriginal and Torres Strait Islander Partnerships, Communities and the Arts, Department of Youth Justice, Employment, Small Business and Training, Queensland Corrective Services and Queensland Health sections of this chapter and the Queensland Police Service section of Chapter 3 Capital Measures.
| | | | | | | | | | | | | | | | | | | | |
| | | 2022–23 | | | 2023–24 | | | 2024–25 | | | 2025–26 | | | 2026–27 | |
| | | $‘000 | | | $‘000 | | | $‘000 | | | $‘000 | | | $‘000 | |
Youth Justice Investment - Police Online Engagement and Intelligence Team | | | 2,320 | | | | 5,040 | | | | 5,471 | | | | — | | | | — | |
The government is providing additional funding of $12.8 million over 3 years to support a police online engagement and intelligence team to monitor social media platforms and identify and respond to potential criminal activity.
This forms part of the government’s total funding package of $446.4 million ($441.9 million new funding and $4.5 million internally funded) over 5 years and $33.7 million per annum ongoing to help boost police resources and tackle the complex causes of youth crime and support community safety.
Further details can be found in Chapter 1 of this paper and in the Department of Child Safety, Seniors and Disability Services, Department of Education, Department of Housing, Department of Justice and Attorney-General, Department of the Premier and Cabinet, Department of Treaty, Aboriginal and Torres Strait Islander Partnerships, Communities and the Arts, Department of Youth Justice, Employment, Small Business and Training, Queensland Corrective Services and Queensland Health sections of this chapter and the Queensland Police Service section of Chapter 3 Capital Measures.
148
Budget Measures 2023-24
| | | | | | | | | | | | | | | | | | | | |
| | | 2022–23 | | | 2023–24 | | | 2024–25 | | | 2025–26 | | | 2026–27 | |
| | | $‘000 | | | $‘000 | | | $‘000 | | | $‘000 | | | $‘000 | |
Youth Justice Investment - Empowering communities to develop local solutions to youth crime issues | | | — | | | | 5,000 | | | | 5,000 | | | | — | | | | — | |
The government is providing increased funding of $10 million over 2 years to support communities to develop local solutions to youth crime issues. This forms part of increased funding of $15 million aimed at empowering communities and connecting local leaders to prevent and respond to youth crime.
This forms part of the government’s total funding package of $446.4 million ($441.9 million new funding and $4.5 million internally funded) over 5 years and $33.7 million per annum ongoing to help boost police resources and tackle the complex causes of youth crime and support community safety.
Further details can be found in Chapter 1 of this paper and in the Department of Child Safety, Seniors and Disability Services, Department of Education, Department of Housing, Department of Justice and Attorney-General, Department of the Premier and Cabinet, Department of Treaty, Aboriginal and Torres Strait Islander Partnerships, Communities and the Arts, Department of Youth Justice, Employment, Small Business and Training, Queensland Corrective Services and Queensland Health sections of this chapter and the Queensland Police Service section of Chapter 3 Capital Measures.
| | | | | | | | | | | | | | | | | | | | |
| | | 2022–23 | | | 2023–24 | | | 2024–25 | | | 2025–26 | | | 2026–27 | |
| | | $‘000 | | | $‘000 | | | $‘000 | | | $‘000 | | | $‘000 | |
Youth Justice Investment - Specialist Youth Crime Rapid Response Squad | | | 2,321 | | | | 4,825 | | | | 5,352 | | | | — | | | | — | |
The government is providing additional funding of $12.5 million over 3 years to engage expert youth justice workers to partner with the Queensland Police Service to establish a Specialist Youth Crime Rapid Response Squad as part of a holistic response to prevent, disrupt and respond to youth crime in hot spot areas around the state. This forms part of increased funding of $17.5 million over 3 years for the Specialist Youth Crime Rapid Response Squad.
This forms part of the government’s total funding package of $446.4 million ($441.9 million new funding and $4.5 million internally funded) over 5 years and $33.7 million per annum ongoing to help boost police resources and tackle the complex causes of youth crime and support community safety.
149
Budget Measures 2023-24
Further details can be found in Chapter 1 of this paper and in the Department of Child Safety, Seniors and Disability Services, Department of Education, Department of Housing, Department of Justice and Attorney-General, Department of the Premier and Cabinet, Department of Treaty, Aboriginal and Torres Strait Islander Partnerships, Communities and the Arts, Department of Youth Justice, Employment, Small Business and Training, Queensland Corrective Services and Queensland Health sections of this chapter and the Queensland Police Service section of Chapter 3 Capital Measures.
| | | | | | | | | | | | | | | | | | | | |
| | | 2022–23 | | | 2023–24 | | | 2024–25 | | | 2025–26 | | | 2026–27 | |
| | | $‘000 | | | $‘000 | | | $‘000 | | | $‘000 | | | $‘000 | |
Youth Justice Investment - Queensland Police-Citizens Youth Club (PCYC) Restructure | | | — | | | | 3,985 | | | | — | | | | — | | | | — | |
The government is providing additional funding of $4 million in 2023-24 to implement a PCYC restructure and enable police officers to focus on delivering frontline youth programs including domestic and family violence and early intervention initiatives, reducing victimisation, youth offending and youth recidivism. This includes $175,000 for the After Dark drop in program. Funding of $2 million in 2023-24 is also internally committed by the department to complete the program, bringing total funding for this program to $6 million in 2023-24.
This forms part of the government’s total funding package of $446.4 million ($441.9 million new funding and $4.5 million internally funded) over 5 years and $33.7 million per annum ongoing to help boost police resources and tackle the complex causes of youth crime and support community safety.
Further details can be found in Chapter 1 of this paper and in the Department of Child Safety, Seniors and Disability Services, Department of Education, Department of Housing, Department of Justice and Attorney-General, Department of the Premier and Cabinet, Department of Treaty, Aboriginal and Torres Strait Islander Partnerships, Communities and the Arts, Department of Youth Justice, Employment, Small Business and Training, Queensland Corrective Services and Queensland Health sections of this chapter and the Queensland Police Service section of Chapter 3 Capital Measures.
150
Budget Measures 2023-24
| | | | | | | | | | | | | | | | | | | | |
| | | 2022–23 | | | 2023–24 | | | 2024–25 | | | 2025–26 | | | 2026–27 | |
| | | $‘000 | | | $‘000 | | | $‘000 | | | $‘000 | | | $‘000 | |
Youth Justice Investment - Bail Monitoring | | | — | | | | 3,417 | | | | 3,661 | | | | — | | | | — | |
The government is providing increased funding of $7.1 million over 2 years to support Bail Monitoring, to assist young people to comply with their bail conditions and keep them from returning to custody.
This forms part of the government’s total funding package of $446.4 million ($441.9 million new funding and $4.5 million internally funded) over 5 years and $33.7 million per annum ongoing to help boost police resources and tackle the complex causes of youth crime and support community safety.
Further details can be found in Chapter 1 of this paper and in the Department of Child Safety, Seniors and Disability Services, Department of Education, Department of Housing, Department of Justice and Attorney-General, Department of the Premier and Cabinet, Department of Treaty, Aboriginal and Torres Strait Islander Partnerships, Communities and the Arts, Department of Youth Justice, Employment, Small Business and Training, Queensland Corrective Services and Queensland Health sections of this chapter and the Queensland Police Service section of Chapter 3 Capital Measures.
| | | | | | | | | | | | | | | | | | | | |
| | | 2022–23 | | | 2023–24 | | | 2024–25 | | | 2025–26 | | | 2026–27 | |
| | | $‘000 | | | $‘000 | | | $‘000 | | | $‘000 | | | $‘000 | |
Youth Justice Investment - Police Liaison Officer High Visibility Proactive Patrols | | | 1,000 | | | | 2,500 | | | | 2,630 | | | | — | | | | — | |
The government is providing additional funding of $6.1 million over 3 years to support Police Liaison Officer High Visibility Proactive Patrols to deter potential offenders in crime hot spots and conduct community safety engagement initiatives across the state. The capital component of this measure can be found in Chapter 3 Capital Measures.
This forms part of the government’s total funding package of $446.4 million ($441.9 million new funding and $4.5 million internally funded) over 5 years and $33.7 million per annum ongoing to help boost police resources and tackle the complex causes of youth crime and support community safety.
Further details can be found in Chapter 1 of this paper and in the Department of Child Safety, Seniors and Disability Services, Department of Education, Department of Housing, Department of Justice and Attorney-General, Department of the Premier and Cabinet, Department of Treaty, Aboriginal and Torres Strait Islander Partnerships, Communities and the Arts, Department of Youth Justice, Employment, Small Business and Training, Queensland Corrective Services and Queensland Health sections of this chapter and the Queensland Police Service section of Chapter 3 Capital Measures.
151
Budget Measures 2023-24
| | | | | | | | | | | | | | | | | | | | |
| | | 2022–23 | | | 2023–24 | | | 2024–25 | | | 2025–26 | | | 2026–27 | |
| | | $‘000 | | | $‘000 | | | $‘000 | | | $‘000 | | | $‘000 | |
Youth Justice Investment - Fast-track Sentencing | | | 261 | | | | 1,566 | | | | 1,114 | | | | 24 | | | | — | |
The government has provided additional funding of $3 million over 4 years to a deliver fast-track sentencing in 4 locations for 18 months to address delays in court proceedings through proactive case management of matters. This forms part of total additional funding of $16.5 million over 4 years for these pilots.
This forms part of the government’s total funding package of $446.4 million ($441.9 million new funding and $4.5 million internally funded) over 4 years and $33.7 million per annum ongoing to help boost police resources and tackle the complex causes of youth crime and support community safety.
Further details can be found in Chapter 1 of this paper and in the Department of Child Safety, Seniors and Disability Services, Department of Treaty, Aboriginal and Torres Strait Islander Partnerships, Communities and the Arts, Department of Education, Department of Housing, Department of Justice and Attorney-General, Department of the Premier and Cabinet, Department of Youth Justice, Employment, Small Business and Training, Queensland Corrective Services and Queensland Health sections of this chapter and the Queensland Police Service section of Chapter 3 Capital Measures.
| | | | | | | | | | | | | | | | | | | | |
| | | 2022–23 | | | 2023–24 | | | 2024–25 | | | 2025–26 | | | 2026–27 | |
| | | $‘000 | | | $‘000 | | | $‘000 | | | $‘000 | | | $‘000 | |
Youth Justice Investment - Youth Development Partnership Fund: Cairns Safer Streets and Midnight Basketball Program | | | 375 | | | | 750 | | | | 375 | | | | — | | | | — | |
The government is providing additional funding of $1.5 million over 3 years to support the Cairns Safer Streets and Midnight Basketball Program to engage young people and minimise the risk of anti-social behaviour administered through the Youth Development Partnership Fund which will invest in the development, implementation and facilitation of early intervention and diversionary crime prevention programs for young people across Queensland. A further $2.5 million is being internally reprioritised by the Department of Tourism, Innovation and Sport towards the Youth Development Partnership Fund.
This forms part of the government’s total funding package of $446.4 million ($441.9 million new funding and $4.5 million internally funded) over 5 years and $33.7 million per annum ongoing to help boost police resources and tackle the complex causes of youth crime and support community safety.
Further details can be found in Chapter 1 of this paper and in the Department of Child Safety, Seniors and Disability Services, Department of Education, Department of Housing,
152
Budget Measures 2023-24
Department of Justice and Attorney-General, Department of the Premier and Cabinet, Department of Treaty, Aboriginal and Torres Strait Islander Partnerships, Communities and the Arts, Department of Youth Justice, Employment, Small Business and Training, Queensland Corrective Services and Queensland Health sections of this chapter and the Queensland Police Service section of Chapter 3 Capital Measures.
| | | | | | | | | | | | | | | | | | | | |
| | | 2022–23 | | | 2023–24 | | | 2024–25 | | | 2025–26 | | | 2026–27 | |
| | | $‘000 | | | $‘000 | | | $‘000 | | | $‘000 | | | $‘000 | |
Youth Justice Investment - Youth Crime Taskforce | | | 237 | | | | 489 | | | | 507 | | | | — | | | | — | |
The government is providing increased funding of $1.2 million over 3 years to continue the Youth Crime Taskforce to build on the case management approach of serious repeat youth offenders, strengthening the collaboration of government departments and support agencies to break the cycle of reoffending. The capital component of this measure can be found in Chapter 3 Capital Measures.
This forms part of the government’s total funding package of $446.4 million ($441.9 million new funding and $4.5 million internally funded) over 5 years and $33.7 million per annum ongoing to help boost police resources and tackle the complex causes of youth crime and support community safety.
Further details can be found in Chapter 1 of this paper and in the Department of Child Safety, Seniors and Disability Services, Department of Treaty, Aboriginal and Torres Strait Islander Partnerships, Communities and the Arts, Department of Education, Department of Housing, Department of Justice and Attorney-General, Department of the Premier and Cabinet, Department of Youth Justice, Employment, Small Business and Training, Queensland Corrective Services and Queensland Health sections of this chapter and the Queensland Police Service section of Chapter 3 Capital Measures.
153
Budget Measures 2023-24
| | | | | | | | | | | | | | | | | | | | |
| | | 2022–23 | | | 2023–24 | | | 2024–25 | | | 2025–26 | | | 2026–27 | |
| | | $‘000 | | | $‘000 | | | $‘000 | | | $‘000 | | | $‘000 | |
Youth Justice Investment - Townsville Community Youth Response: High Risk Youth Court | | | — | | | | 374 | | | | 386 | | | | — | | | | — | |
The government is providing increased funding of $760,000 over 2 years to continue the specialist court established in 2017 as part of the Townsville Community Youth Response. This forms part of total increased funding of $8 million over 2 years for the Townsville High Risk Youth Court.
This forms part of the government’s total funding package of $446.4 million ($441.9 million new funding and $4.5 million internally funded) over 5 years and $33.7 million per annum ongoing to help boost police resources and tackle the complex causes of youth crime and support community safety.
Further details can be found in Chapter 1 of this paper and in the Department of Child Safety, Seniors and Disability Services, Department of Education, Department of Housing, Department of Justice and Attorney-General, Department of the Premier and Cabinet, Department of Treaty, Aboriginal and Torres Strait Islander Partnerships, Communities and the Arts, Department of Youth Justice, Employment, Small Business and Training, Queensland Corrective Services and Queensland Health sections of this chapter and the Queensland Police Service section of Chapter 3 Capital Measures.
| | | | | | | | | | | | | | | | | | | | |
| | | 2022–23 | | | 2023–24 | | | 2024–25 | | | 2025–26 | | | 2026–27 | |
| | | $‘000 | | | $‘000 | | | $‘000 | | | $‘000 | | | $‘000 | |
Youth Justice Investment - Stronger Communities Initiative: Early Action Groups | | | 76 | | | | 330 | | | | 337 | | | | — | | | | — | |
The government is providing increased funding of $743,000 over 3 years to extend the Townsville Early Action Group and expand to Cairns and Mount Isa to help break the cycle of youth crime by dealing with underlying issues that lead some young people to offend including poor school attendance, mental health concerns, drug and substance misuse, domestic violence and family dysfunction. This forms part of total increased funding of $5.1 million over 3 years for the Early Action Groups.
This forms part of the government’s total funding package of $446.4 million ($441.9 million new funding and $4.5 million internally funded) over 5 years and $33.7 million per annum ongoing to help boost police resources and tackle the complex causes of youth crime and support community safety.
Further details can be found in Chapter 1 of this paper and in the Department of Child Safety, Seniors and Disability Services, Department of Education, Department of Housing, Department of Justice and Attorney-General, Department of the Premier and Cabinet,
154
Budget Measures 2023-24
Department of Treaty, Aboriginal and Torres Strait Islander Partnerships, Communities and the Arts, Department of Youth Justice, Employment, Small Business and Training, Queensland Corrective Services and Queensland Health sections of this chapter and the Queensland Police Service section of Chapter 3 Capital Measures.
| | | | | | | | | | | | | | | | | | | | |
| | | 2022–23 | | | 2023–24 | | | 2024–25 | | | 2025–26 | | | 2026–27 | |
| | | $‘000 | | | $‘000 | | | $‘000 | | | $‘000 | | | $‘000 | |
Youth Justice Investment - Police Blitz on Bail | | | — | | | | 80 | | | | 83 | | | | — | | | | — | |
The government is providing increased funding of $163,000 over 2 years to support the Police Blitz on Bail providing specialist prosecutors to review charges, bail objections and court decisions.
This forms part of the government’s total funding package of $446.4 million ($441.9 million new funding and $4.5 million internally funded) over 5 years and $33.7 million per annum ongoing to help boost police resources and tackle the complex causes of youth crime and support community safety.
Further details can be found in Chapter 1 of this paper and in the Department of Child Safety, Seniors and Disability Services, Department of Education, Department of Housing, Department of Justice and Attorney-General, Department of the Premier and Cabinet, Department of Treaty, Aboriginal and Torres Strait Islander Partnerships, Communities and the Arts, Department of Youth Justice, Employment, Small Business and Training, Queensland Corrective Services and Queensland Health sections of this chapter and the Queensland Police Service section of Chapter 3 Capital Measures.
| | | | | | | | | | | | | | | | | | | | |
| | | 2022–23 | | | 2023–24 | | | 2024–25 | | | 2025–26 | | | 2026–27 | |
| | | $‘000 | | | $‘000 | | | $‘000 | | | $‘000 | | | $‘000 | |
Youth Justice Investment - Vehicle Immobiliser Trial | | | — | | | | — | | | | — | | | | — | | | | — | |
The government is providing additional funding of $10 million over 3 years, held centrally, to establish the Vehicle Immobiliser Trial for eligible residents in Cairns, Townsville and Mt Isa. This program is designed to prevent crime, particularly vehicle theft and unlawful use of vehicles by supporting community members to improve the security of their vehicles. This program is to be administered by the Department of Tourism, Innovation and Sport.
This forms part of the government’s total funding package of $446.4 million ($441.9 million new funding and $4.5 million internally funded) over 5 years and $33.7 million per annum ongoing to help boost police resources and tackle the complex causes of youth crime and support community safety.
155
Budget Measures 2023-24
Further details can be found in Chapter 1 of this paper and in the Department of Child Safety, Seniors and Disability Services, Department of Education, Department of Housing, Department of Justice and Attorney-General, Department of the Premier and Cabinet, Department of Treaty, Aboriginal and Torres Strait Islander Partnerships, Communities and the Arts, Department of Youth Justice, Employment, Small Business and Training, Queensland Corrective Services and Queensland Health sections of this chapter and the Queensland Police Service section of Chapter 3 Capital Measures.
| | | | | | | | | | | | | | | | | | | | |
| | | 2022–23 | | | 2023–24 | | | 2024–25 | | | 2025–26 | | | 2026–27 | |
| | | $‘000 | | | $‘000 | | | $‘000 | | | $‘000 | | | $‘000 | |
Weapons Licensing Management System Replacement Project | | | — | | | | 1,459 | | | | 745 | | | | — | | | | — | |
The government is providing increased funding of $2.2 million over 2 years to continue support for the weapons licensing function. The government is also providing additional funding, held centrally, to upgrade the current Weapons Licensing Management System.
| | | | | | | | | | | | | | | | | | | | |
| | | 2022–23 | | | 2023–24 | | | 2024–25 | | | 2025–26 | | | 2026–27 | |
| | | $‘000 | | | $‘000 | | | $‘000 | | | $‘000 | | | $‘000 | |
Relocation of the Oxley Police Academy to Wacol | | | — | | | | 1,000 | | | | — | | | | — | | | | — | |
The government is providing increased funding of $1 million for design and scope works for the relocation of the Oxley Police Academy, and other co-located Queensland Police Service functions, to the Wacol Police Precinct or other appropriate site. The capital component of this measure can be found in Chapter 3 Capital Measures.
156
Budget Measures 2023-24
| | | | | | | | | | | | | | | | | | | | |
| | | 2022–23 | | | 2023–24 | | | 2024–25 | | | 2025–26 | | | 2026–27 | |
| | | $‘000 | | | $‘000 | | | $‘000 | | | $‘000 | | | $‘000 | |
Brisbane 2032 Olympic and Paralympic Games | | | — | | | | 745 | | | | 1,207 | | | | 2,016 | | | | 3,498 | |
The government is providing additional funding of $7.5 million over 4 years to develop the public safety and security arrangement for the Brisbane 2032 Olympic and Paralympic Games.
| | | | | | | | | | | | | | | | | | | | |
| | | 2022–23 | | | 2023–24 | | | 2024–25 | | | 2025–26 | | | 2026–27 | |
| | | $‘000 | | | $‘000 | | | $‘000 | | | $‘000 | | | $‘000 | |
Gangs Exit Program | | | — | | | | 623 | | | | — | | | | — | | | | — | |
The government is providing increased funding of $623,000 to continue the highly acclaimed Queensland Gangs Exit Program. The capital component of this measure can be found in Chapter 3 Capital Measures.
This forms part of the government’s total funding of $1.2 million in 2023-24 to support the Queensland Gangs Exit Program. Further details of this package can be found in the Queensland Corrective Services section of this chapter.
| | | | | | | | | | | | | | | | | | | | |
| | | 2022–23 | | | 2023–24 | | | 2024–25 | | | 2025–26 | | | 2026–27 | |
| | | $‘000 | | | $‘000 | | | $‘000 | | | $‘000 | | | $‘000 | |
Armoured Vehicle Fleet | | | — | | | | 370 | | | | 568 | | | | 568 | | | | 568 | |
The government is providing additional funding of $2.1 million over 4 years and $568,000 per annum ongoing for an enhanced armoured vehicle fleet to meet special response operational requirements. The capital component of this measure can be found in Chapter 3 Capital Measures.
157
Budget Measures 2023-24
| | | | | | | | | | | | | | | | | | | | |
| | | 2022–23 | | | 2023–24 | | | 2024–25 | | | 2025–26 | | | 2026–27 | |
| | | $‘000 | | | $‘000 | | | $‘000 | | | $‘000 | | | $‘000 | |
Camera Detected Offence Program | | | — | | | | 285 | | | | 577 | | | | 921 | | | | — | |
The government is providing increased funding of $1.8 million over 3 years for road safety initiatives.
This forms part of the government’s total funding of $548.1 million over 5 years, and $183.5 million per annum ongoing, as part of the Camera Detected Offence Program. Further funding can be found in the Queensland Fire and Emergency Services, Department of Transport and Main Roads and Queensland Treasury sections of this chapter. The capital component of this measure can be found in the Department of Transport and Main Roads and Queensland Police Service sections of Chapter 3 Capital measures.
| | | | | | | | | | | | | | | | | | | | |
| | | 2022–23 | | | 2023–24 | | | 2024–25 | | | 2025–26 | | | 2026–27 | |
| | | $‘000 | | | $‘000 | | | $‘000 | | | $‘000 | | | $‘000 | |
Budget Modernisation Program | | | — | | | | — | | | | — | | | | — | | | | — | |
The government is providing $12 million over 4 years and $3 million ongoing, held centrally, to increase capability and capacity in financial management, and implement the Queensland Police Service Budget Modernisation Program.
| | | | | | | | | | | | | | | | | | | | |
| | | 2022–23 | | | 2023–24 | | | 2024–25 | | | 2025–26 | | | 2026–27 | |
| | | $‘000 | | | $‘000 | | | $‘000 | | | $‘000 | | | $‘000 | |
Domestic and Family Violence Commission of Inquiry | | | — | | | | — | | | | — | | | | — | | | | — | |
The government is providing additional funding of $100 million, held centrally, to implement the Queensland Government’s response to A Call for Change - Commission of Inquiry into Queensland Police Service responses to domestic and family violence. This investment will support a whole of government effort to deliver more victims liaison officers, more domestic and family violence support workers in police stations, more specialist domestic and family violence officers and more specialist police prosecutors.
Further details of this package can be found in the Department of Justice and Attorney-General section of this chapter.
158
Budget Measures 2023-24
| | | | | | | | | | | | | | | | | | | | |
| | | 2022–23 | | | 2023–24 | | | 2024–25 | | | 2025–26 | | | 2026–27 | |
| | | $‘000 | | | $‘000 | | | $‘000 | | | $‘000 | | | $‘000 | |
Recruitment Drive - Additional Police Personnel | | | — | | | | — | | | | — | | | | — | | | | — | |
The government is providing additional funding of $87.5 million over 5 years, held centrally, to support the recruitment of additional police personnel.
| | | | | | | | | | | | | | | | | | | | |
| | | 2022–23 | | | 2023–24 | | | 2024–25 | | | 2025–26 | | | 2026–27 | |
| | | $‘000 | | | $‘000 | | | $‘000 | | | $‘000 | | | $‘000 | |
Youth Detention Centre Capacity - Addressing Capacity Issues at Youth Detention Centres | | | — | | | | — | | | | — | | | | — | | | | — | |
The government is providing additional funding of up to $45 million, held centrally, for the Queensland Police Service to support strategies addressing capacity issues at Youth Detention Centres.
This forms part of total increased funding of $89.7 million over 3 years ($78.1 million new funding and $11.6 million from existing resources) to address capacity issues at Youth Detention Centres. Further details can be found in the Department of Education, Department of Youth Justice, Employment, Small Business and Training and Queensland Health sections of this chapter, and the Queensland Police Service section of Chapter 3 Capital Measures.
159
Budget Measures 2023-24
Queensland Treasury
| | | | | | | | | | | | | | | | | | | | |
| | | 2022–23 | | | 2023–24 | | | 2024–25 | | | 2025–26 | | | 2026–27 | |
| | | $‘000 | | | $‘000 | | | $‘000 | | | $‘000 | | | $‘000 | |
Gympie Road Bypass - funding to investigate the construction of road tunnels between Kedron and Carseldine | | | — | | | | 35,000 | | | | — | | | | — | | | | — | |
The government is providing additional funding of $35 million to develop a detailed investment proposal for the construction of road tunnels from Carseldine to Kedron.
| | | | | | | | | | | | | | | | | | | | |
| | | 2022–23 | | | 2023–24 | | | 2024–25 | | | 2025–26 | | | 2026–27 | |
| | | $‘000 | | | $‘000 | | | $‘000 | | | $‘000 | | | $‘000 | |
Financial Reporting and Management Enhanced Systems | | | — | | | | 16,800 | | | | 20,100 | | | | 11,900 | | | | 4,500 | |
The government is providing additional funding of $53.3 million over 4 years to replace and modernise the legacy whole-of-government financial reporting and budget management enterprise systems to support enhanced budget management outcomes and fiscal sustainability.
| | | | | | | | | | | | | | | | | | | | |
| | | 2022–23 | | | 2023–24 | | | 2024–25 | | | 2025–26 | | | 2026–27 | |
| | | $‘000 | | | $‘000 | | | $‘000 | | | $‘000 | | | $‘000 | |
Camera Detected Offence Program | | | — | | | | 6,737 | | | | 8,124 | | | | 9,110 | | | | 10,169 | |
The government is providing increased funding of $34.1 million over 4 years and $10.2 million per annum ongoing to Queensland Revenue Office for the Camera Detected Offence Program.
This forms part of the government’s total funding of $548.1 million over 5 years, and $183.5 million per annum ongoing, as part of the Camera Detected Offence Program. Further funding can be found in Queensland Fire and Emergency Services, Department of Transport and Main Roads and Queensland Police Service sections of this chapter. The capital component of this measure can be found in the Department of Transport and Main Roads and Queensland Police Service sections of Chapter 3 Capital measures.
160
Budget Measures 2023–24
| | | | | | | | | | | | | | | | | | | | |
| | | 2022–23 | | | 2023–24 | | | 2024–25 | | | 2025–26 | | | 2026–27 | |
| | | $‘000 | | | $‘000 | | | $‘000 | | | $‘000 | | | $‘000 | |
Low Emissions Investment Partnerships Program | | | — | | | | 5,000 | | | | 5,000 | | | | 5,000 | | | | 5,000 | |
The government is providing additional funding of $520 million between 2023–24 and 2029-30, with $500 million held centrally, for the Low Emissions Investment Partnerships Program to drive emissions reductions, with a focus on the state’s highest emitting metallurgical coal mines.
| | | | | | | | | | | | | | | | | | | | |
| | | 2022–23 | | | 2023–24 | | | 2024–25 | | | 2025–26 | | | 2026–27 | |
| | | $‘000 | | | $‘000 | | | $‘000 | | | $‘000 | | | $‘000 | |
Queensland Resources Common User Facility | | | 1,300 | | | | 5,000 | | | | 3,700 | | | | — | | | | — | |
The government is providing additional funding of $10 million over 3 years to develop the Queensland Resources Common User Facility. This facility is to accommodate a broader range of purposes in the future beyond vanadium processing to include additional minerals and rare earth elements as well as research and development activities by universities and research institutes. The capital component of this measure can be found in Chapter 3 Capital Measures.
This forms part of the Common User Infrastructure which has a total funding commitment of $150 million over 5 years for the development of critical minerals for projects that demonstrate sustainable value to the state.
| | | | | | | | | | | | | | | | | | | | |
| | | 2022–23 | | | 2023–24 | | | 2024–25 | | | 2025–26 | | | 2026–27 | |
| | | $‘000 | | | $‘000 | | | $‘000 | | | $‘000 | | | $‘000 | |
Debt Recovery and Compliance Program | | | (4,579 | ) | | | 4,579 | | | | 15,983 | | | | 16,472 | | | | 16,917 | |
The government will provide increased funding of $49.4 million over 3 years and $16.9 million per annum ongoing to retain Queensland Revenue Office’s ongoing capacity to deliver increased debt recovery and compliance measures for ongoing additional revenue for Queensland. The revenue component of this measure can be found in Chapter 4 Revenue Measures.
161
Budget Measures 2023-24
| | | | | | | | | | | | | | | | | | | | |
| | | 2022–23 | | | 2023–24 | | | 2024–25 | | | 2025–26 | | | 2026–27 | |
| | | $‘000 | | | $‘000 | | | $‘000 | | | $‘000 | | | $‘000 | |
Queensland Revenue Office Increased Compliance Work | | | — | | | | 3,049 | | | | 6,080 | | | | 7,571 | | | | 7,744 | |
The government is providing additional funding of $24.4 million over 4 years to increase Queensland Revenue Office’s capacity to undertake taxation compliance work to increase revenue for Queensland. The revenue component of this measure can be found in Chapter 4 Revenue Measures.
| | | | | | | | | | | | | | | | | | | | |
| | | 2022–23 | | | 2023–24 | | | 2024–25 | | | 2025–26 | | | 2026–27 | |
| | | $‘000 | | | $‘000 | | | $‘000 | | | $‘000 | | | $‘000 | |
Regional Resources Development Fund - additional operational funding | | | — | | | | 1,500 | | | | 750 | | | | 750 | | | | — | |
The government is providing additional funding of $3 million over 3 years for the ongoing administration of the Regional Resources Development Framework.
| | | | | | | | | | | | | | | | | | | | |
| | | 2022–23 | | | 2023–24 | | | 2024–25 | | | 2025–26 | | | 2026–27 | |
| | | $‘000 | | | $‘000 | | | $‘000 | | | $‘000 | | | $‘000 | |
Queensland Workforce Strategy - Skilled Workforce Attraction Office | | | — | | | | 1,100 | | | | 1,100 | | | | 1,100 | | | | 1,100 | |
The government is providing additional funding of $4.4 million over 4 years and $1.1 million per annum ongoing to establish the Skilled Workforce Attraction Office within Trade and Investment Queensland to strengthen delivery of the State Nominated Migration Program, including enhanced industry engagement activities, and for skilled migration policy and coordination to be consolidated within Queensland Treasury.
This forms part of the government’s total funding package of over $70 million for new initiatives included in the 2022-2025 Action Plan as part of the Good People. Good Jobs: Queensland Workforce Strategy 2022-2032 to create a strong and diverse workforce ready to seize today’s jobs and adapt to future opportunities.
Further details on initiatives can be found in the Department of Youth Justice, Employment, Small Business and Training, the Department of Education and the Department of Environment and Science sections of this chapter.
162
Budget Measures 2023-24
| | | | | | | | | | | | | | | | | | | | |
| | | 2022–23 | | | 2023–24 | | | 2024–25 | | | 2025–26 | | | 2026–27 | |
| | | $‘000 | | | $‘000 | | | $‘000 | | | $‘000 | | | $‘000 | |
Borumba Dam Pumped Hydro | | | — | | | | 1,000 | | | | — | | | | — | | | | — | |
The government is providing additional funding of $1 million in 2023-24 to progress work to define future trading arrangements for state-owned pumped hydro assets.
| | | | | | | | | | | | | | | | | | | | |
| | | 2022–23 | | | 2023–24 | | | 2024–25 | | | 2025–26 | | | 2026–27 | |
| | | $‘000 | | | $‘000 | | | $‘000 | | | $‘000 | | | $‘000 | |
Land tax - unilateral application of the home exemption | | | — | | | | 1,000 | | | | — | | | | — | | | | — | |
The government is providing additional funding of $1 million in 2023-24 to implement and operationalise arrangements that will remove the requirement for landowners to apply for a land tax home exemption in relation to the property in which they live where data matching verifies eligibility.
The change is subject to the passage of legislative amendments.
| | | | | | | | | | | | | | | | | | | | |
| | | 2022–23 | | | 2023–24 | | | 2024–25 | | | 2025–26 | | | 2026–27 | |
| | | $‘000 | | | $‘000 | | | $‘000 | | | $‘000 | | | $‘000 | |
Fine Modernisation Program Foundation Phase | | | — | | | | — | | | | — | | | | — | | | | — | |
Funding of $12.9 million in 2023-24 is being internally reprioritised to fund the Fine Modernisation Program (FMP) Foundation Phase, which will deliver early benefits for the community and government through business improvement initiatives such as earlier payment reminders to clients, and provide a sound basis to support the FMP Stage 2 Business Case.
163
Budget Measures 2023-24
Introduction
The following tables present the relevant portfolio capital measures relating to decisions taken since the 2022-23 Budget. This does not represent the full amount of additional funding provided to agencies since the 2022-23 Budget. For further explanation, refer to Explanation of Scope and Terms in Chapter 1.
164
Budget Measures 2023-24
Department of Agriculture and Fisheries
| | | | | | | | | | | | | | | | | | | | |
| | | 2022–23 | | | 2023–24 | | | 2024–25 | | | 2025–26 | | | 2026–27 | |
| | | $‘000 | | | $‘000 | | | $‘000 | | | $‘000 | | | $‘000 | |
Relocation of the Racing Science Centre | | | — | | | | 20,000 | | | | — | | | | — | | | | — | |
The government is providing additional funding of up to $20 million to relocate Queensland Racing Integrity Commission’s Racing Science Centre to make way for the Brisbane 2032 Olympic and Paralympic Games.
165
Budget Measures 2023-24
Department of Education
| | | | | | | | | | | | | | | | | | | | |
| | | 2022–23 | | | 2023–24 | | | 2024–25 | | | 2025–26 | | | 2026–27 | |
| | | $‘000 | | | $‘000 | | | $‘000 | | | $‘000 | | | $‘000 | |
School Infrastructure and Land Acquisitions | | | — | | | | 195,102 | | | | 470,280 | | | | 333,377 | | | | 117,376 | |
The government is providing increased funding of $1.116 billion over 4 years ($1.575 billion over 10 years), and a further $67.9 million over 5 years held centrally, to deliver critical educational infrastructure to accommodate enrolment growth in state schools. This includes funding to establish a strategic land acquisition fund for future new and expanded schools, provide another round of school hall and performing arts centre projects, and provide additional classrooms in existing schools that are nearing capacity.
Total funding for this initiative is $1.231 billion over 4 years ($1.727 billion over 10 years). The expense component of this measure can be found in Chapter 2 Expense measures.
| | | | | | | | | | | | | | | | | | | | |
| | | 2022–23 | | | 2023–24 | | | 2024–25 | | | 2025–26 | | | 2026–27 | |
| | | $‘000 | | | $‘000 | | | $‘000 | | | $‘000 | | | $‘000 | |
Teacher Housing | | | — | | | | 10,780 | | | | 11,451 | | | | 12,165 | | | | 12,922 | |
The government is providing increased funding of $47.3 million over 4 years for safe and secure teacher housing in regional and remote communities.
Total funding for this initiative is $48.3 million over 4 years. The expense component of this measure can be found in Chapter 2 Expense measures.
| | | | | | | | | | | | | | | | | | | | |
| | | 2022–23 | | | 2023–24 | | | 2024–25 | | | 2025–26 | | | 2026–27 | |
| | | $‘000 | | | $‘000 | | | $‘000 | | | $‘000 | | | $‘000 | |
Addressing Market Pressures | | | — | | | | — | | | | 89,744 | | | | 89,744 | | | | 89,744 | |
The government is providing increased funding of $269.2 million over 3 years to address cost escalation in the construction market.
Total funding for this initiative is $312.6 million over 3 years. The expense component of this measure can be found in Chapter 2 Expense measures.
166
Budget Measures 2023-24
| | | | | | | | | | | | | | | | | | | | |
| | | 2022–23 | | | 2023–24 | | | 2024–25 | | | 2025–26 | | | 2026–27 | |
| | | $‘000 | | | $‘000 | | | $‘000 | | | $‘000 | | | $‘000 | |
School Infrastructure - Renewal | | | — | | | | — | | | | — | | | | — | | | | — | |
The government is providing increased funding of $88.4 million over 5 years, held centrally, for the renewal, upgrade and enhancement of critical infrastructure in existing state schools, including tuckshop and playground upgrades and priority flood mitigation works.
Total funding for this initiative is $117.4 million over 6 years. The expense component of this measure can be found in Chapter 2 Expense measures.
167
Budget Measures 2023-24
Department of Energy and Public Works
| | | | | | | | | | | | | | | | | | | | |
| | | 2022–23 | | | 2023–24 | | | 2024–25 | | | 2025–26 | | | 2026–27 | |
| | | $‘000 | | | $‘000 | | | $‘000 | | | $‘000 | | | $‘000 | |
Government Buildings Electrical Vehicle Ready | | | 2,000 | | | | 12,500 | | | | 12,500 | | | | 3,000 | | | | — | |
The government is providing additional funding of $30 million over 4 years to make zero emission vehicles charging infrastructure available in Queensland government buildings across Queensland.
| | | | | | | | | | | | | | | | | | | | |
| | | 2022–23 | | | 2023–24 | | | 2024–25 | | | 2025–26 | | | 2026–27 | |
| | | $‘000 | | | $‘000 | | | $‘000 | | | $‘000 | | | $‘000 | |
ReBuild QBuild Capital | | | 3,291 | | | | 9,498 | | | | 8,415 | | | | 8,250 | | | | — | |
The government is providing additional funding of $29.5 million over 4 years to support ReBuild QBuild to upgrade and redevelop depots across the state and investment in Rapid Accommodation and Apprentice Centres in Eagle Farm and Cairns.
The expense component to this measure can be found in Chapter 2 Expense Measures.
| | | | | | | | | | | | | | | | | | | | |
| | | 2022–23 | | | 2023–24 | | | 2024–25 | | | 2025–26 | | | 2026–27 | |
| | | $‘000 | | | $‘000 | | | $‘000 | | | $‘000 | | | $‘000 | |
Government Employee Housing Expansion - Capital | | | — | | | | — | | | | 153,351 | | | | 139,161 | | | | — | |
The government is providing $455.3 million over 3 years to manage and deliver an increased program of work. Of the funding provided, $162.8 million will be held centrally in 2026-27.
The expense component to this measure can be found in Chapter 2 Expense measures.
168
Budget Measures 2023-24
Department of Environment and Science
| | | | | | | | | | | | | | | | | | | | |
| | | 2022–23 | | | 2023–24 | | | 2024–25 | | | 2025–26 | | | 2026–27 | |
| | | $‘000 | | | $‘000 | | | $‘000 | | | $‘000 | | | $‘000 | |
Revitalising National Parks | | | — | | | | 7,500 | | | | 10,000 | | | | 10,000 | | | | 10,000 | |
The government is providing increased funding of $37.5 million over 4 years to continue revitalising and investing in new visitor infrastructure including trails and amenities, with opportunities to support the growth of regional small businesses and First Nations peoples employment.
The expense component of this measure can be found in Chapter 2 Expense Measures.
| | | | | | | | | | | | | | | | | | | | |
| | | 2022–23 | | | 2023–24 | | | 2024–25 | | | 2025–26 | | | 2026–27 | |
| | | $‘000 | | | $‘000 | | | $‘000 | | | $‘000 | | | $‘000 | |
Partnering with Quandamooka on Land and Sea Country | | | — | | | | 1,500 | | | | 4,300 | | | | 9,000 | | | | — | |
The government is providing increased funding of $14.8 million over 3 years and $170,000 per annum ongoing from 2027-28 for new and modernisation of infrastructure, plant and equipment to support joint management of country in partnership with Quandamooka First Nations peoples.
The expense component of this measure can be found in Chapter 2 Expense Measures.
| | | | | | | | | | | | | | | | | | | | |
| | | 2022–23 | | | 2023–24 | | | 2024–25 | | | 2025–26 | | | 2026–27 | |
| | | $‘000 | | | $‘000 | | | $‘000 | | | $‘000 | | | $‘000 | |
World-Class Protected Area Management | | | — | | | | 1,100 | | | | 3,350 | | | | 1,350 | | | | — | |
The government is providing increased funding of $5.8 million over 3 years for investment into infrastructure and visitor amenities improvements in Queensland’s World Heritage Areas.
The expense component of this measure can be found in Chapter 2 Expense Measures.
169
Budget Measures 2023-24
Department of Housing
| | | | | | | | | | | | | | | | | | | | |
| | | 2022–23 | | | 2023–24 | | | 2024–25 | | | 2025–26 | | | 2026–27 | |
| | | $‘000 | | | $‘000 | | | $‘000 | | | $‘000 | | | $‘000 | |
Queensland Housing Strategy 2017-2027 - Supply of Social Housing | | | 120,000 | | | | 201,600 | | | | 194,834 | | | | 130,833 | | | | 130,833 | |
The government is providing increased funding of $778.1 million over 5 years to continue the delivery of existing Housing and Homelessness Action Plan commencement targets, including in remote and discrete First Nations communities, to offset unavoidable cost increases and supply chain impacts in the construction sector and to retain and upgrade dwellings for social housing that would have otherwise been sold. Funding of up to $24.7 million over 4 years is being met internally by the department to maintain head leased social housing homes. Total funding for this program is $802.8 million over 5 years from 2022–23.
The expense component of this measure can be found in Chapter 2 Expense measures.
| | | | | | | | | | | | | | | | | | | | |
| | | 2022–23 | | | 2023–24 | | | 2024–25 | | | 2025–26 | | | 2026–27 | |
| | | $‘000 | | | $‘000 | | | $‘000 | | | $‘000 | | | $‘000 | |
Emergency Accommodation | | | 5,300 | | | | 44,480 | | | | — | | | | — | | | | — | |
The government is providing additional funding of $49.8 million over 2 years from 2022–23 to purchase and lease accommodation complexes and provide housing supports for emergency accommodation in inner Brisbane.
The expense component of this measure can be found in Chapter 2 Expense measures.
170
Budget Measures 2023-24
| | | | | | | | | | | | | | | | | | | | |
| | | 2022–23 | | | 2023–24 | | | 2024–25 | | | 2025–26 | | | 2026–27 | |
| | | $‘000 | | | $‘000 | | | $‘000 | | | $‘000 | | | $‘000 | |
Additional Social Housing Supply | | | — | | | | 35,896 | | | | 123,606 | | | | 90,531 | | | | 11,739 | |
The government is providing increased funding of $261.8 million over 4 years to expand the QuickStarts Queensland program of new social housing, with a new commencement target of 3,265 dwellings by 30 June 2025. Total program funding is $322.2 million when combined with the capital component of this measure. Further details can be found in Chapter 2 Expense measures.
| | | | | | | | | | | | | | | | | | | | |
| | | 2022–23 | | | 2023–24 | | | 2024–25 | | | 2025–26 | | | 2026–27 | |
| | | $‘000 | | | $‘000 | | | $‘000 | | | $‘000 | | | $‘000 | |
Purchase of New Social Housing | | | — | | | | — | | | | — | | | | — | | | | — | |
The government is providing funding of $25 million over 2 years from 2022-23 to purchase up to 64 existing dwellings for use as social housing, with funding allocated from a whole-of-government provision.
171
Budget Measures 2023-24
Department of Justice and Attorney-General
| | | | | | | | | | | | | | | | | | | | |
| | | 2022-23 | | | 2023-24 | | | 2024-25 | | | 2025-26 | | | 2026-27 | |
| | | $‘000 | | | $‘000 | | | $‘000 | | | $‘000 | | | $‘000 | |
Hear her voice - Report 2 - Treatment of victim-survivors in trials for sexual offences | | | — | | | | 4,387 | | | | 4,387 | | | | 3,987 | | | | — | |
The government is providing additional funding of $12.8 million over 3 years to improve the safety and experience of victim-survivors in trials for sexual offences. A further $2.4 million over 3 years will be met internally by the department. This includes implementing transformational information technology infrastructure and technological solutions to expand remote witness technology in regional Queensland and improve the safety of victim-survivors of sexual violence.
The expense component of this measure can be found in Chapter 2 Expense measures. This forms part of the government’s total funding package of $225 million over 5 years to respond to the recommendations of the Queensland Women’s Safety and Justice Taskforce in Hear her voice - Report 2 - Women and girls’ experiences across the criminal justice system.
Further details on this package are in Chapter 1 of this paper.
| | | | | | | | | | | | | | | | | | | | |
| | | 2022-23 | | | 2023-24 | | | 2024-25 | | | 2025-26 | | | 2026-27 | |
| | | $‘000 | | | $‘000 | | | $‘000 | | | $‘000 | | | $‘000 | |
Queensland Human Rights Commission - Complaints Management System | | | — | | | | 350 | | | | — | | | | — | | | | — | |
The government is providing increased funding of $350,000 to deliver a complaint management system that will enable the delivery of information and services to clients.
The expense component of this measure can be found in Chapter 2 Expense measures.
172
Budget Measures 2023-24
Department of Resources
| | | | | | | | | | | | | | | | | | | | |
| | | 2022–23 | | | 2023–24 | | | 2024–25 | | | 2025–26 | | | 2026–27 | |
| | | $‘000 | | | $‘000 | | | $‘000 | | | $‘000 | | | $‘000 | |
Abandoned Mine Sites Program | | | — | | | | 500 | | | | — | | | | — | | | | — | |
The government is providing increased funding of $500,000 to manage health, safety and environmental risks at the disclaimed Thalanga Copper mine site as part of the Abandoned Mine Sites - Care and Maintenance, Risk Mitigation and Remediation Program. The expense component of this measure can be found in Chapter 2 Expense measures.
173
Budget Measures 2023-24
Department of State Development, Infrastructure, Local Government and Planning
| | | | | | | | | | | | | | | | | | | | |
| | | 2022–23 | | | 2023–24 | | | 2024–25 | | | 2025–26 | | | 2026–27 | |
| | | $‘000 | | | $‘000 | | | $‘000 | | | $‘000 | | | $‘000 | |
Currumbin Eco-Parkland | | | — | | | | 8,000 | | | | 8,000 | | | | 8,000 | | | | — | |
The government is providing increased funding of $24 million over 3 years for the delivery of the Currumbin Eco-Parkland.
This forms part of the government’s total funding of $46 million over 5 years to support the Currumbin Eco-Parkland. The expense component of this measure can be found in the Department of State Development, Infrastructure, Local Government and Planning and the Department of Environment and Science sections of Chapter 2 Expense measures.
| | | | | | | | | | | | | | | | | | | | |
| | | 2022–23 | | | 2023–24 | | | 2024–25 | | | 2025–26 | | | 2026–27 | |
| | | $‘000 | | | $‘000 | | | $‘000 | | | $‘000 | | | $‘000 | |
Yeronga Community Centre | | | — | | | | 2,642 | | | | — | | | | — | | | | — | |
The government is providing increased funding of $2.6 million to support delivery of the Yeronga Community Centre as part of the Parkside Yeronga Masterplan.
| | | | | | | | | | | | | | | | | | | | |
| | | 2022–23 | | | 2023–24 | | | 2024–25 | | | 2025–26 | | | 2026–27 | |
| | | $‘000 | | | $‘000 | | | $‘000 | | | $‘000 | | | $‘000 | |
Brisbane Athlete Village | | | — | | | | — | | | | 33,300 | | | | 33,300 | | | | 33,300 | |
The government will provide additional funding of $154.7 million over 4 years from 2024-25 to bring forward the delivery of public infrastructure required for the Brisbane Athlete Village.
174
Budget Measures 2023-24
| | | | | | | | | | | | | | | | | | | | |
| | | 2022–23 | | | 2023–24 | | | 2024–25 | | | 2025–26 | | | 2026–27 | |
| | | $‘000 | | | $‘000 | | | $‘000 | | | $‘000 | | | $‘000 | |
Catalyst Infrastructure Fund | | | — | | | | — | | | | — | | | | — | | | | — | |
Funding of $21.2 million over 2 years is being met internally by the department for the Catalyst Infrastructure Fund as part of the government’s broader response to the Queensland Housing Summit. Total funding for this program is $171.2 million over 4 years from 2022-23.
| | | | | | | | | | | | | | | | | | | | |
| | | 2022–23 | | | 2023–24 | | | 2024–25 | | | 2025–26 | | | 2026–27 | |
| | | $‘000 | | | $‘000 | | | $‘000 | | | $‘000 | | | $‘000 | |
Gladstone Land Acquisition Strategy | | | — | | | | — | | | | — | | | | — | | | | — | |
The government is providing additional funding of $80 million over 3 years, held centrally, and subject to further government consideration to deliver a state-led approach to identify and secure key linear infrastructure corridors and strategic sites for bulk chemical storage facilities required for industrial development. This includes developing the hydrogen industry and improving connectivity to the Port of Gladstone.
| | | | | | | | | | | | | | | | | | | | |
| | | 2022–23 | | | 2023–24 | | | 2024–25 | | | 2025–26 | | | 2026–27 | |
| | | $‘000 | | | $‘000 | | | $‘000 | | | $‘000 | | | $‘000 | |
Townsville Concert Hall | | | — | | | | — | | | | — | | | | — | | | | — | |
The government is providing additional funding of up to $50 million over 3 years, held centrally and subject to finalisation of a business case and matched funding from Townsville City Council, to support the delivery of the proposed Townsville Concert Hall.
175
Budget Measures 2023-24
Department of Tourism, Innovation and Sport
| | | | | | | | | | | | | | | | | | | | |
| | | 2022–23 | | | 2023–24 | | | 2024–25 | | | 2025–26 | | | 2026–27 | |
| | | $‘000 | | | $‘000 | | | $‘000 | | | $‘000 | | | $‘000 | |
2032 High Performance Strategy | | | — | | | | 75 | | | | 75 | | | | 75 | | | | 75 | |
The government is providing increased funding of $450,000 over 6 years for specialist high-performance equipment to prepare elite athletes for success at Olympic and Paralympic Games, including Brisbane 2032.
176
Budget Measures 2023-24
Department of Transport and Main Roads
| | | | | | | | | | | | | | | | | | | | |
| | | 2022–23 | | | 2023–24 | | | 2024–25 | | | 2025–26 | | | 2026–27 | |
| | | $‘000 | | | $‘000 | | | $‘000 | | | $‘000 | | | $‘000 | |
New Gold Coast Stations | | | 9,300 | | | | 66,600 | | | | 68,200 | | | | 19,700 | | | | — | |
The government is providing increased funding of $163.8 million over 4 years to support delivery of new Gold Coast rail stations.
| | | | | | | | | | | | | | | | | | | | |
| | | 2022–23 | | | 2023–24 | | | 2024–25 | | | 2025–26 | | | 2026–27 | |
| | | $‘000 | | | $‘000 | | | $‘000 | | | $‘000 | | | $‘000 | |
Camera Detected Offence Program | | | — | | | | 13,500 | | | | 105,260 | | | | 140,170 | | | | 144,900 | |
The government is providing increased funding of $403.8 million over 4 years and $144.9 million per annum ongoing to improve the safety of the sections of state-controlled roads where accidents happen most frequently.
This forms part of the government’s total funding of $548.1 million over 5 years, and $183.5 million per annum ongoing, as part of the Camera Detected Offence Program. Further funding can be found in the Queensland Police Service section of this chapter. The expense component of this measure can be found in the Department of Transport and Main Roads, Queensland Fire and Emergency Services, Queensland Police Service and Queensland Treasury sections of Chapter 2 Expense measures.
| | | | | | | | | | | | | | | | | | | | |
| | | 2022–23 | | | 2023–24 | | | 2024–25 | | | 2025–26 | | | 2026–27 | |
| | | $‘000 | | | $‘000 | | | $‘000 | | | $‘000 | | | $‘000 | |
Cleveland-Redland Bay Road Upgrade | | | — | | | | 7,000 | | | | 23,000 | | | | 29,000 | | | | 21,000 | |
The government is providing additional funding of $80 million over 4 years to deliver the next stage of the Cleveland-Redland Bay Road duplication between Anita Street and Giles Road.
177
Budget Measures 2023-24
| | | | | | | | | | | | | | | | | | | | |
| | | 2022–23 | | | 2023–24 | | | 2024–25 | | | 2025–26 | | | 2026–27 | |
| | | $‘000 | | | $‘000 | | | $‘000 | | | $‘000 | | | $‘000 | |
Torres Strait Islands Marine Infrastructure Program | | | — | | | | 1,000 | | | | 5,500 | | | | 7,500 | | | | 7,500 | |
The government is providing additional funding of $21.5 million over 4 years ($27.5 million over 5 years) to deliver Stage 1 of the Torres Strait Islands Marine Infrastructure Program. The program will prioritise and deliver marine infrastructure and provide ongoing maintenance in partnership with the councils and communities in the region. The expense component of this measure can be found in Chapter 2 Expense Measures.
| | | | | | | | | | | | | | | | | | | | |
| | | 2022–23 | | | 2023–24 | | | 2024–25 | | | 2025–26 | | | 2026–27 | |
| | | $‘000 | | | $‘000 | | | $‘000 | | | $‘000 | | | $‘000 | |
Access to Gladstone Port Project | | | — | | | | 400 | | | | 1,000 | | | | 4,000 | | | | 19,600 | |
The government is providing additional funding of $25 million over 4 years to improve access to the Port of Gladstone.
| | | | | | | | | | | | | | | | | | | | |
| | | 2022–23 | | | 2023–24 | | | 2024–25 | | | 2025–26 | | | 2026–27 | |
| | | $‘000 | | | $‘000 | | | $‘000 | | | $‘000 | | | $‘000 | |
Kurrimine Beach Boat Ramp | | | — | | | | — | | | | — | | | | — | | | | — | |
Funding of up to $3.5 million is being met internally by the department as the State’s contribution to support delivery of the Kurrimine Beach boat ramp.
178
Budget Measures 2023-24
Department of Treaty, Aboriginal and Torres Strait Islander Partnerships, Communities and the Arts
| | | | | | | | | | | | | | | | | | | | |
| | | 2022-23 | | | 2023-24 | | | 2024-25 | | | 2025-26 | | | 2026-27 | |
| | | $‘000 | | | $‘000 | | | $‘000 | | | $‘000 | | | $‘000 | |
Queensland Performing Arts Centre - Capital Upgrades | | | — | | | | 5,940 | | | | — | | | | — | | | | — | |
The government is providing additional funding of $5.9 million for upgrade and acquisition of capital equipment within the Queensland Performing Arts Centre.
| | | | | | | | | | | | | | | | | | | | |
| | | 2022-23 | | | 2023-24 | | | 2024-25 | | | 2025-26 | | | 2026-27 | |
| | | $‘000 | | | $‘000 | | | $‘000 | | | $‘000 | | | $‘000 | |
Queensland Performing Arts Centre - Flexible Performance Space | | | — | | | | 2,000 | | | | 12,600 | | | | — | | | | — | |
The government is providing additional funding of $14.6 million over 2 years to construct a Flexible Performance Space at the Queensland Performing Arts Centre.
| | | | | | | | | | | | | | | | | | | | |
| | | 2022-23 | | | 2023-24 | | | 2024-25 | | | 2025-26 | | | 2026-27 | |
| | | $‘000 | | | $‘000 | | | $‘000 | | | $‘000 | | | $‘000 | |
Queensland Cultural Centre - Security Upgrades | | | — | | | | 500 | | | | — | | | | — | | | | — | |
The government is providing additional funding of $500,000 to install additional security cameras at the Queensland Cultural Centre.
179
Budget Measures 2023-24
| | | | | | | | | | | | | | | | | | | | |
| | | 2022–23 | | | 2023–24 | | | 2024–25 | | | 2025–26 | | | 2026–27 | |
| | | $‘000 | | | $‘000 | | | $‘000 | | | $‘000 | | | $‘000 | |
Public Intoxication Program Enhancement | | | — | | | | 1,000 | | | | 3,000 | | | | — | | | | — | |
The government is providing increased funding of $4 million over 2 years to upgrade the Mount Isa Diversion Centre.
The expense component of this measure can be found in Chapter 2 Expense measures.
180
Budget Measures 2023-24
Department of Youth Justice, Employment, Small Business and Training
| | | | | | | | | | | | | | | | | | | | |
| | | 2022–23 | | | 2023–24 | | | 2024–25 | | | 2025–26 | | | 2026–27 | |
| | | $‘000 | | | $‘000 | | | $‘000 | | | $‘000 | | | $‘000 | |
Great Barrier Reef International Marine College | | | — | | | | 8,000 | | | | 8,000 | | | | — | | | | — | |
The government is providing additional funding of $16 million over 2 years to expand TAFE Queensland’s Great Barrier Reef International Marine College in Cairns, which will include construction of a new workshop, additional classrooms, staff facilities and a boat shed.
| | | | | | | | | | | | | | | | | | | | |
| | | 2022–23 | | | 2023–24 | | | 2024–25 | | | 2025–26 | | | 2026–27 | |
| | | $‘000 | | | $‘000 | | | $‘000 | | | $‘000 | | | $‘000 | |
Youth Detention Centre Operations | | | — | | | | 2,000 | | | | 3,500 | | | | 3,500 | | | | 3,500 | |
The government is providing additional funding of $12.5 million over 4 years and $2 million per annum ongoing to address critical upgrade requirements in existing Youth Detention Centres to ensure capacity and effectiveness.
Total funding for this initiative is $122.4 million over 5 years and $31 million per annum ongoing. The expense component of this measure can be found in Chapter 2 Expense Measures.
| | | | | | | | | | | | | | | | | | | | |
| | | 2022–23 | | | 2023–24 | | | 2024–25 | | | 2025–26 | | | 2026–27 | |
| | | $‘000 | | | $‘000 | | | $‘000 | | | $‘000 | | | $‘000 | |
Youth Detention Centre Capacity - Addressing Capacity Issues at Youth Detention Centres | | | — | | | | — | | | | — | | | | — | | | | — | |
The government is providing increased funding over 2 years from 2023-24 for the construction of an 80 bed youth detention centre at Woodford. Expenditure for this measure is subject to commercial negotiation with potential contractors.
181
Budget Measures 2023-24
Legislative Assembly of Queensland
| | | | | | | | | | | | | | | | | | | | |
| | | 2022–23
$‘000 | | | 2023–24
$‘000 | | | 2024–25
$‘000 | | | 2025–26
$‘000 | | | 2026–27
$‘000 | |
Queensland Parliament Digital Transformation Program | | | — | | | | 465 | | | | 626 | | | | — | | | | — | |
The government is providing additional funding of $1.1 million over 2 years to replace and modernise business-critical AV broadcast infrastructure which directly supports the effective operations of the Queensland Legislative Assembly and parliamentary committees.
The expense component of this measure can be found in Chapter 2 Expense Measures.
| | | | | | | | | | | | | | | | | | | | |
| | | 2022–23
$‘000 | | | 2023–24
$‘000 | | | 2024–25
$‘000 | | | 2025–26
$‘000 | | | 2026–27
$‘000 | |
Annexe Critical Infrastructure and Services Upgrade | | | 18,092 | | | | — | | | | — | | | | — | | | | — | |
The government has provided increased funding of $18.1 million to undertake the necessary repairs and upgrades to the external façade of the Parliamentary Annexe, and the refurbishment of soft furnishings in Members’ office and overnight accommodation floors (levels 9 to 23).
182
Budget Measures 2023-24
Queensland Corrective Services
| | | | | | | | | | | | | | | | | | | | |
| | | 2022–23
$‘000 | | | 2023–24
$‘000 | | | 2024–25
$‘000 | | | 2025–26
$‘000 | | | 2026–27
$‘000 | |
Prisoner Capacity and Health Services | | | — | | | | 33,465 | | | | 19,245 | | | | 8,504 | | | | 857 | |
The government is providing additional funding of $62.1 million over 4 years for: pre-commencement activities including design works, site investigations and other preliminary works for the future expansion of the Townsville Correctional Precinct and the future establishment of a new Wacol Precinct Enhanced Primary Health Care facility located at the Brisbane Correctional Centre; installation of information technology infrastructure in correctional centres to enhance the provision of health care; and office accommodation to support the Enhanced Community Corrections Pilot.
The expense component of this measure can be found in Chapter 2 Expense Measures.
| | | | | | | | | | | | | | | | | | | | |
| | | 2022–23
$‘000 | | | 2023–24
$‘000 | | | 2024–25
$‘000 | | | 2025–26
$‘000 | | | 2026–27
$‘000 | |
Infrastructure - Safety and Security | | | — | | | | 15,000 | | | | — | | | | — | | | | — | |
The government is providing additional funding of $15 million to progress priority maintenance and upgrades to critical prison infrastructure to ensure safety and security.
| | | | | | | | | | | | | | | | | | | | |
| | | 2022–23
$‘000 | | | 2023–24
$‘000 | | | 2024–25
$‘000 | | | 2025–26
$‘000 | | | 2026–27
$‘000 | |
Southern Queensland Correctional Precinct - Stage 2 - Commissioning | | | — | | | | 2,990 | | | | 2,400 | | | | — | | | | — | |
The government is providing additional capital funding of $5.4 million over 2 years from 2023-24 to acquire video conference suites and other property, plant and equipment for prison industries, providing vocational skills for prisoners to help them reintegrate into the community on release and avoid reoffending.
183
Budget Measures 2023-24
| | | | | | | | | | | | | | | | | | | | |
| | | 2022–23
$‘000 | | | 2023–24
$‘000 | | | 2024–25
$‘000 | | | 2025–26
$‘000 | | | 2026–27
$‘000 | |
Hear her voice - Report 2 - Sentencing women and girls | | | — | | | | — | | | | — | | | | — | | | | — | |
The government is providing increased funding of $1.5 million in 2023-24, held centrally, to assist with the design and evaluation of a trial of dedicated court advisory services. The expense component of this measure can be found in Chapter 2 Expense Measures. This forms part of the government’s total funding package of $225 million over 5 years to respond to the recommendations of the Queensland Women’s Safety and Justice Taskforce in Hear her voice - Report 2 - Women and girls’ experiences across the criminal justice system. Further details on this package are in Chapter 1 of this paper.
| | | | | | | | | | | | | | | | | | | | |
| | | 2022–23
$‘000 | | | 2023–24
$‘000 | | | 2024–25
$‘000 | | | 2025–26
$‘000 | | | 2026–27
$‘000 | |
Hear her voice - Report 2 - Treatment in custody, complaints mechanisms and oversight | | | — | | | | — | | | | — | | | | — | | | | — | |
The government is providing additional funding of $11 million in 2023-24, held centrally, to support treatment in custody, complaints mechanisms and oversight. This includes support for the introduction of non-invasive screening technology to minimise the practice of strip searches in all women’s correctional facilities. The expense component of this measure can be found in Chapter 2 Expense Measures. This forms part of the government’s total funding package of $225 million over 5 years to respond to the recommendations of the Queensland Women’s Safety and Justice Taskforce in Hear her voice - Report 2 - Women and girls’ experiences across the criminal justice system. Further details on this package are in Chapter 1 of this paper.
184
Budget Measures 2023-24
Queensland Fire and Emergency Services
| | | | | | | | | | | | | | | | | | | | |
| | | 2022–23
$‘000 | | | 2023–24
$‘000 | | | 2024–25
$‘000 | | | 2025–26
$‘000 | | | 2026–27
$‘000 | |
Emergency Management Reform - Rural Fire Service | | | — | | | | 8,000 | | | | — | | | | — | | | | — | |
The government is providing increased funding of $8 million in 2023-24 to continue the commitment to uplift Rural Fire Service capability and ensure a sustainable volunteer model across Queensland.
This forms part of the government’s total funding package of up to $578 million ($493.2 million held centrally) over 5 years and $142 million per annum ongoing, to deliver enhanced emergency and fire services for a safer Queensland. The government’s investment, in response to the Independent Review of Queensland Fire and Emergency Services, will provide for an uplift of over 500 full time emergency services staff, the establishment of a new Queensland fire department and provide support for our volunteers in Marine Rescue Queensland, the State Emergency Service and the Rural Fire Service. Implementation of these reforms is being overseen by the Reform Implementation Taskforce including developing the ongoing operating and funding models beyond 2023-24.
Further details can be found in Chapter 2 Expense Measures of this paper and in the Queensland Police Service and Department of State Development, Infrastructure, Local Government and Planning sections of this chapter.
| | | | | | | | | | | | | | | | | | | | |
| | | 2022–23
$‘000 | | | 2023–24
$‘000 | | | 2024–25
$‘000 | | | 2025–26
$‘000 | | | 2026–27
$‘000 | |
Emergency Management Reform - State Emergency Service | | | — | | | | 3,000 | | | | — | | | | — | | | | — | |
The government is providing increased funding of $3 million in 2023-24 to continue to enhance the State Emergency Service volunteer capability across Queensland.
This forms part of the government’s total funding package of up to $578 million ($493.2 million held centrally) over 5 years and $142 million per annum ongoing, to deliver enhanced emergency and fire services for a safer Queensland. The government’s investment, in response to the Independent Review of Queensland Fire and Emergency Services, will provide for an uplift of over 500 full time emergency services staff, the establishment of a new Queensland fire department and provide support for our volunteers in Marine Rescue Queensland, the State Emergency Service and the Rural Fire Service. Implementation of these reforms is being overseen by the Reform Implementation Taskforce including developing the ongoing operating and funding models beyond 2023-24.
185
Budget Measures 2023-24
Further details can be found in Chapter 2 Expense Measures of this paper and in the Queensland Police Service and Department of State Development, Infrastructure, Local Government and Planning sections of this chapter.
186
Budget Measures 2023-24
Queensland Health
| | | | | | | | | | | | | | | | | | | | |
| | | 2022–23
$‘000 | | | 2023–24
$‘000 | | | 2024–25
$‘000 | | | 2025–26
$‘000 | | | 2026–27
$‘000 | |
Base Capital Program | | | — | | | | 60,000 | | | | — | | | | — | | | | — | |
The government is providing an additional $60 million for Queensland Health’s Base Capital Program in 2023-24.
| | | | | | | | | | | | | | | | | | | | |
| | | 2022–23
$‘000 | | | 2023–24
$‘000 | | | 2024–25
$‘000 | | | 2025–26
$‘000 | | | 2026–27
$‘000 | |
Queensland Ambulance Service (QAS) New Ambulances | | | — | | | | 10,770 | | | | — | | | | — | | | | — | |
The government is providing $10.8 million in 2023-24 for 40 new ambulance vehicles, including stretchers/loaders and defibrillators, to support and equip frontline ambulance operatives.
| | | | | | | | | | | | | | | | | | | | |
| | | 2022–23
$‘000 | | | 2023–24
$‘000 | | | 2024–25
$‘000 | | | 2025–26
$‘000 | | | 2026–27
$‘000 | |
Redland Hospital Expansion-Mental Health Facility | | | — | | | | 8,000 | | | | 1,800 | | | | 60,000 | | | | 80,200 | |
The government is providing $150 million over 4 years for the demolition and replacement of the existing mental health facility, as part of the staged capacity increase at Redland Hospital.
187
Budget Measures 2023-24
| | | | | | | | | | | | | | | | | | | | |
| | | 2022–23
$‘000 | | | 2023–24
$‘000 | | | 2024–25
$‘000 | | | 2025–26
$‘000 | | | 2026–27
$‘000 | |
Queensland Health Spinal Unit | | | — | | | | 5,000 | | | | — | | | | — | | | | — | |
The government is providing $5 million for a detailed business case on the redevelopment of the Spinal Injuries Unit at the Princess Alexandra Hospital.
188
Budget Measures 2023-24
Queensland Police Service
| | | | | | | | | | | | | | | | | | | | |
| | | 2022–23
$‘000 | | | 2023–24
$‘000 | | | 2024–25
$‘000 | | | 2025–26
$‘000 | | | 2026–27
$‘000 | |
Enhanced Capital Program | | | 700 | | | | 4,400 | | | | 18,100 | | | | 25,250 | | | | 22,300 | |
The government is providing additional funding of $70.8 million over 5 years to deliver replacement police facilities and new residential accommodation for police officers across multiple regions in Queensland.
| | | | | | | | | | | | | | | | | | | | |
| | | 2022–23
$‘000 | | | 2023–24
$‘000 | | | 2024–25
$‘000 | | | 2025–26
$‘000 | | | 2026–27
$‘000 | |
Camera Detected Offence Program | | | — | | | | 3,667 | | | | 2,925 | | | | 3,143 | | | | — | |
The government is providing increased funding of $9.7 million over 3 years for road safety initiatives.
This forms part of the government’s total funding of $548.1 million over 5 years, and $183.5 million per annum ongoing, as part of the Camera Detected Offence Program. Further funding can be found in the Department of Transport and Main Roads section of this chapter. The expense component of this measure can be found in the Department of Transport and Main Roads, Queensland Fire and Emergency Services, Queensland Police Service and Queensland Treasury sections of Chapter 2 Expense measures.
| | | | | | | | | | | | | | | | | | | | |
| | | 2022–23
$‘000 | | | 2023–24
$‘000 | | | 2024–25
$‘000 | | | 2025–26
$‘000 | | | 2026–27
$‘000 | |
Armoured Vehicle Fleet | | | — | | | | 2,195 | | | | 1,980 | | | | — | | | | — | |
The government is providing additional funding of $4.2 million over 2 years for an enhanced armoured vehicle fleet to meet special response operational requirements. The expense component of this measure can be found in the Chapter 2 Expenses Measures.
189
Budget Measures 2023-24
| | | | | | | | | | | | | | | | | | | | |
| | | 2022–23
$‘000 | | | 2023–24
$‘000 | | | 2024–25
$‘000 | | | 2025–26
$‘000 | | | 2026–27
$‘000 | |
Youth Justice Investment - Youth Co-responder Teams | | | — | | | | 210 | | | | — | | | | — | | | | — | |
The government is providing increased funding of $210,000 to support the expansion of the Youth Co-responder Teams into South Brisbane, Ipswich, Toowoomba, Mount Isa and Fraser Coast to engage with at-risk youth to address issues which contribute to involvement in youth crime and improve community safety. This forms part of total increased funding of $96.2 million over 4 years and $17.9 million per annum ongoing for the youth co-responder model.
This forms part of the government’s total funding package of $446.4 million ($441.9 million new funding and $4.5 million internally funded) over 5 years and $33.7 million per annum ongoing to help boost police resources and tackle the complex causes of youth crime and support community safety.
Further details can be found in Chapter 1 of this paper and in the Department of Child Safety, Seniors and Disability Services, Department of Treaty, Aboriginal and Torres Strait Islander Partnerships, Communities and the Arts, Department of Education, Department of Housing, Department of Justice and Attorney-General, Department of the Premier and Cabinet, Department of Youth Justice, Employment, Small Business and Training, Queensland Corrective Services and Queensland Health sections of this chapter and the Queensland Police Service section of Chapter 2 Expense Measures.
| | | | | | | | | | | | | | | | | | | | |
| | | 2022–23
$‘000 | | | 2023–24
$‘000 | | | 2024–25
$‘000 | | | 2025–26
$‘000 | | | 2026–27
$‘000 | |
Youth Justice Investment - Youth Crime Taskforce | | | — | | | | 42 | | | | — | | | | — | | | | — | |
The government is providing $42,000 to build on the case management approach of serious repeat youth offenders, strengthening the collaboration of government departments and support agencies to break the cycle of reoffending.
This forms part of the government’s total funding package of $446.4 million ($441.9 million new funding and $4.5 million internally funded) over 5 years and $33.7 million per annum ongoing to help boost police resources and tackle the complex causes of youth crime and support community safety.
Further details can be found in Chapter 1 of this paper and in the Department of Child Safety, Seniors and Disability Services, Department of Education, Department of Housing, Department of Justice and Attorney-General, Department of the Premier and Cabinet, Department of Treaty, Aboriginal and Torres Strait Islander Partnerships, Communities and the Arts, Department of Youth Justice, Employment, Small Business and Training, Queensland Corrective Services and Queensland Health sections of this chapter and the Queensland Police Service section of Chapter 2 Expense Measures.
190
Budget Measures 2023-24
| | | | | | | | | | | | | | | | | | | | |
| | | 2022–23
$‘000 | | | 2023–24
$‘000 | | | 2024–25
$‘000 | | | 2025–26
$‘000 | | | 2026–27
$‘000 | |
Gangs Exit Program | | | — | | | | 37 | | | | — | | | | — | | | | — | |
The government is providing increased funding of $37,000 to continue the highly acclaimed Queensland Gangs Exit Program. The expense component of this measure can be found in Chapter 2 Expenses Measures.
This forms part of the government’s total funding of $1.2 million in 2023-24 to support the Queensland Gangs Exit Program.
| | | | | | | | | | | | | | | | | | | | |
| | | 2022–23
$‘000 | | | 2023–24
$‘000 | | | 2024–25
$‘000 | | | 2025–26
$‘000 | | | 2026–27
$‘000 | |
North Queensland Police Academy | | | — | | | | — | | | | — | | | | — | | | | — | |
The government is providing additional funding, held centrally, for the construction of the replacement North Queensland Police Academy as part of the new Kirwan Police Precinct in Townsville.
| | | | | | | | | | | | | | | | | | | | |
| | | 2022–23
$‘000 | | | 2023–24
$‘000 | | | 2024–25
$‘000 | | | 2025–26
$‘000 | | | 2026–27
$‘000 | |
Relocation of the Oxley Police Academy to Wacol | | | — | | | | — | | | | — | | | | — | | | | — | |
The government will provide increased funding, held centrally, for construction costs and for the relocation of the Oxley Police Academy and Dog Squad to the Wacol Police Precinct and the Specialist Response Group to an alternative site. The expense component of this measure can be found in Chapter 2 Expenses Measures.
191
Budget Measures 2023-24
| | | | | | | | | | | | | | | | | | | | |
| | | 2022–23
$‘000 | | | 2023–24
$‘000 | | | 2024–25
$‘000 | | | 2025–26
$‘000 | | | 2026–27
$‘000 | |
Youth Detention Centre Capacity - Addressing Capacity Issues at Youth Detention Centres | | | — | | | | — | | | | — | | | | — | | | | — | |
The government is providing additional funding of $395,000, held centrally, for the Queensland Police Service to support strategies addressing capacity issues at Youth Detention Centres. Further details can be found in Chapter 2 Expense Measures.
This forms part of total increased funding of $89.7 million over 3 years ($78.1 million new funding and $11.6 million from existing resources) to address capacity issues at Youth Detention Centres. Further details can be found in the Department of Education, Department of Youth Justice, Employment, Small Business and Training and Queensland Health sections of Chapter 2 Expense Measures.
| | | | | | | | | | | | | | | | | | | | |
| | | 2022–23
$‘000 | | | 2023–24
$‘000 | | | 2024–25
$‘000 | | | 2025–26
$‘000 | | | 2026–27
$‘000 | |
Youth Justice Investment - Police Liaison Officer High Visibility Proactive Patrols | | | 2,500 | | | | — | | | | — | | | | — | | | | — | |
The government has provided additional funding of $2.5 million to support Police Liaison Officer High Visibility Proactive Patrols and community safety engagement initiatives across the state. The expense component of this measure can be found in Chapter 2 Expense Measures.
This forms part of the government’s total funding package of $446.4 million ($441.9 million new funding and $4.5 million internally funded) over 5 years and $33.7 million per annum ongoing to help boost police resources and tackle the complex causes of youth crime and support community safety.
Further details can be found in Chapter 1 of this paper and in the Department of Child Safety, Seniors and Disability Services, Department of Education, Department of Housing, Department of Justice and Attorney-General, Department of the Premier and Cabinet, Department of Treaty, Aboriginal and Torres Strait Islander Partnerships, Communities and the Arts, Department of Youth Justice, Employment, Small Business and Training, Queensland Corrective Services and Queensland Health sections of this chapter and the Queensland Police Service section of Chapter 2 Expense Measures.
192
Budget Measures 2023-24
| | | | | | | | | | | | | | | | | | | | |
| | | 2022–23
$‘000 | | | 2023–24
$‘000 | | | 2024–25
$‘000 | | | 2025–26
$‘000 | | | 2026–27
$‘000 | |
Youth Justice Investment - Stronger Communities Initiative: Early Action Groups | | | 126 | | | | — | | | | — | | | | — | | | | — | |
The government is providing increased funding of $126,000 to extend the Townsville Early Action Group and expand to Cairns and Mount Isa to help break the cycle of youth crime by dealing with underlying issues that lead some young people to offend including poor school attendance, mental health concerns, drug and substance misuse, domestic violence and family dysfunction. This forms part of total increased funding of $5.1 million over 3 years for the Early Action Groups.
This forms part of the government’s total funding package of $446.4 million ($441.9 million new funding and $4.5 million internally funded) over 5 years and $33.7 million per annum ongoing to help boost police resources and tackle the complex causes of youth crime and support community safety.
Further details can be found in Chapter 1 of this paper and in the Department of Child Safety, Seniors and Disability Services, Department of Education, Department of Housing, Department of Justice and Attorney-General, Department of the Premier and Cabinet, Department of Treaty, Aboriginal and Torres Strait Islander Partnerships, Communities and the Arts, Department of Youth Justice, Employment, Small Business and Training, Queensland Corrective Services and Queensland Health sections of this chapter and the Queensland Police Service section of Chapter 2 Expense Measures.
193
Budget Measures 2023-24
Queensland Treasury
| | | | | | | | | | | | | | | | | | | | |
| | | 2022–23 | | | 2023–24 | | | 2024–25 | | | 2025–26 | | | 2026–27 | |
| | | $‘000 | | | $‘000 | | | $‘000 | | | $‘000 | | | $‘000 | |
Queensland Critical Minerals and Battery Technology Fund | | | — | | | | 100,000 | | | | — | | | | — | | | | — | |
The government is providing additional funding of $100 million to establish Queensland Critical Minerals and Battery Technology Fund with the Queensland Investment Corporation to assist in positioning Queensland for the next resources boom in critical minerals and support the development of battery technology and advanced materials needed for the clean energy revolution.
| | | | | | | | | | | | | | | | | | | | |
| | | 2022–23 | | | 2023–24 | | | 2024–25 | | | 2025–26 | | | 2026–27 | |
| | | $‘000 | | | $‘000 | | | $‘000 | | | $‘000 | | | $‘000 | |
Queensland Resources Common User Facility | | | 1,542 | | | | 43,950 | | | | 15,250 | | | | — | | | | — | |
The government is providing additional funding of $60.7 million over 3 years to develop the Queensland Resources Common User Facility. This Facility is to accommodate a broader range of purposes in the future beyond vanadium processing to include additional minerals and rare earth elements as well as research and development activities by universities and research institutes. Further capital funding can be found in the Department of Resources. The expense component of this measure can be found in Chapter 2 Expense Measures.
This forms part of the Common User Infrastructure which has a total funding commitment of $150 million over 5 years for the development of critical minerals for projects that demonstrate sustainable value to the state.
194
Budget Measures 2023-24
Introduction
The following tables present the relevant portfolio revenue measures relating to decisions taken since the 2022-23 Budget. For further explanation, refer to Explanation of Scope and Terms in Chapter 1.
195
Budget Measures 2023-24
Department of Agriculture and Fisheries
| | | | | | | | | | | | | | | | | | | | |
| | | 2022–23 | | | 2023–24 | | | 2024–25 | | | 2025–26 | | | 2026–27 | |
| | | $‘000 | | | $‘000 | | | $‘000 | | | $‘000 | | | $‘000 | |
Horticulture Food Safety Schemes | | | — | | | | 303 | | | | 622 | | | | 1,062 | | | | 1,089 | |
The government is introducing fees to administer horticulture food safety schemes to facilitate implementation of a national decision that ensures the safe production of high risk horticulture commodities.
| | | | | | | | | | | | | | | | | | | | |
| | | 2022–23 | | | 2023–24 | | | 2024–25 | | | 2025–26 | | | 2026–27 | |
| | | $‘000 | | | $‘000 | | | $‘000 | | | $‘000 | | | $‘000 | |
Exhibited Animals | | | — | | | | 78 | | | | 161 | | | | 165 | | | | 173 | |
The government is introducing fees to support the licensing, assessment, monitoring and compliance services associated with exhibited animals. The additional cost of these fees will be borne by entities exhibiting and dealing with animals under an exhibited animal authority.
196
Budget Measures 2023-24
Department of Education
| | | | | | | | | | | | | | | | | | | | |
| | | 2022–23 | | | 2023–24 | | | 2024–25 | | | 2025–26 | | | 2026–27 | |
| | | $‘000 | | | $‘000 | | | $‘000 | | | $‘000 | | | $‘000 | |
Homestay Program Fees for International Students | | | — | | | | 101 | | | | 261 | | | | 265 | | | | 272 | |
The government is aligning the fee for airport transfer services for arriving international students enrolled in the Department of Education International (DEi) Homestay Program to include fees incurred for this service.
197
Budget Measures 2023-24
Department of Justice and Attorney-General
| | | | | | | | | | | | | | | | | | | | |
| | | 2022–23
$‘000 | | | 2023–24
$‘000 | | | 2024–25
$‘000 | | | 2025–26
$‘000 | | | 2026–27
$‘000 | |
Civil Partnerships - Revision of Prescribed Fees | | | — | | | | 486 | | | | 498 | | | | 512 | | | | 524 | |
The government is introducing a new civil partnership fee schedule to achieve cost recovery. Implementing the revised fee schedule would enable the civil partnership scheme to sustainably operate at full cost recovery and alleviate the resource burden administering the scheme places on other frontline services. This measure is estimated to generate $2 million in revenue from 2023-24 to 2026-27.
| | | | | | | | | | | | | | | | | | | | |
| | | 2022–23
$‘000 | | | 2023–24
$‘000 | | | 2024–25
$‘000 | | | 2025–26
$‘000 | | | 2026–27
$‘000 | |
Justice Services Fees and Charges | | | — | | | | — | | | | — | | | | — | | | | — | |
The government will provide fee exemptions for persons seeking appointment as a Justice of the Peace or as a Commissioner for Declarations where they are above 18 years of age and can demonstrate financial hardship. The government will also provide fee exemptions for applications to the Queensland Civil and Administrative Tribunal in relation to Voluntary Assisted Dying.
198
Budget Measures 2023-24
Department of Regional Development, Manufacturing and Water
| | | | | | | | | | | | | | | | | | | | |
| | | 2022–23
$‘000 | | | 2023–24
$‘000 | | | 2024–25
$‘000 | | | 2025–26
$‘000 | | | 2026–27
$‘000 | |
Drought Assistance and Reform Package | | | — | | | | — | | | | — | | | | — | | | | — | |
The government is providing relief of up to $910,000 in 2023-24 through the waiver of fees associated with an annual water licence invoice and applications for stock or domestic water licences. The waiver is available to primary producers in drought declared areas and for those who have an individually droughted property.
Further details can be found in the Department of Resources section of this chapter and the Department of Energy and Public Works section of Chapter 2 Expense Measures.
199
Budget Measures 2023-24
Department of Resources
| | | | | | | | | | | | | | | | | | | | |
| | | 2022–23
$‘000 | | | 2023–24
$‘000 | | | 2024–25
$‘000 | | | 2025–26
$‘000 | | | 2026–27
$‘000 | |
Drought Assistance and Reform Package | | | — | | | | — | | | | — | | | | — | | | | — | |
The government is providing relief of up to $3.2 million in 2023-24 through rent rebates for primary production leases in drought declared areas.
Further details can be found in the Department of Regional Development, Manufacturing and Water section of this chapter and the Department of Energy and Public Works section of Chapter 2 Expense Measures.
200
Budget Measures 2023-24
Department of Transport and Main Roads
| | | | | | | | | | | | | | | | | | | | |
| | | 2022–23
$‘000 | | | 2023–24
$‘000 | | | 2024–25
$‘000 | | | 2025–26
$‘000 | | | 2026–27
$‘000 | |
Secure Taxi Rank Program Review | | | — | | | | (1,207 | ) | | | (1,214 | ) | | | (1,222 | ) | | | (1,222 | ) |
The government is removing the late night surcharge and the Taxi Industry Security Levy at an estimated cost of $4.9 million over 4 years.
| | | | | | | | | | | | | | | | | | | | |
| | | 2022–23
$‘000 | | | 2023–24
$‘000 | | | 2024–25
$‘000 | | | 2025–26
$‘000 | | | 2026–27
$‘000 | |
Replacement Smartcard Product Fee Changes | | | — | | | | (5,292 | ) | | | (5,604 | ) | | | (5,915 | ) | | | (6,240 | ) |
The government is reducing the replacement fee for Queensland driver licences, photo identification cards and industry authority cards to $35 from 1 July 2023 at an estimated cost of $23.1 million over 4 years and $6.2 million per annum ongoing.
| | | | | | | | | | | | | | | | | | | | |
| | | 2022–23
$‘000 | | | 2023–24
$‘000 | | | 2024–25
$‘000 | | | 2025–26
$‘000 | | | 2026–27
$‘000 | |
Reducing Learner Licence Fees | | | (2,975 | ) | | | (9,376 | ) | | | (9,850 | ) | | | (10,349 | ) | | | (10,873 | ) |
The government is reducing Queensland’s learner licence fees from $186.55 to $75 at an estimated cost of $43.4 million over 5 years.
201
Budget Measures 2023-24
Queensland Fire and Emergency Services
| | | | | | | | | | | | | | | | | | | | |
| | | 2022–23
$‘000 | | | 2023–24
$‘000 | | | 2024–25
$‘000 | | | 2025–26
$‘000 | | | 2026–27
$‘000 | |
Reduction in Alarm Monitoring Fees | | | — | | | | (3,893 | ) | | | (3,990 | ) | | | (4,089 | ) | | | (4,191 | ) |
The government is reducing annual fire alarm monitoring charges by up to 15 per cent as a result of modernising fire alarm services provided by Queensland Fire and Emergency Services.
202
Budget Measures 2023-24
Queensland Treasury
| | | | | | | | | | | | | | | | | | | | |
| | | 2022–23 | | | 2023–24 | | | 2024–25 | | | 2025–26 | | | 2026–27 | |
| | | $‘000 | | | $‘000 | | | $‘000 | | | $‘000 | | | $‘000 | |
Queensland Revenue Office Increased Compliance Work | | | — | | | | 18,000 | | | | 44,100 | | | | 74,250 | | | | 88,425 | |
The government is increasing taxation revenue compliance work undertaken by Queensland Revenue Office. The compliance program is expected to generate revenue of $224.8 million over 4 years. The expenses component of this measure can be found in Chapter 2 Expenses Measures.
| | | | | | | | | | | | | | | | | | | | |
| | | 2022–23 | | | 2023–24 | | | 2024–25 | | | 2025–26 | | | 2026–27 | |
| | | $‘000 | | | $‘000 | | | $‘000 | | | $‘000 | | | $‘000 | |
Debt Recovery and Compliance Program | | | — | | | | — | | | | 128,400 | | | | 128,400 | | | | 128,400 | |
The Debt Recovery and Compliance Program is expected to generate revenue of $385.2 million over 3 years through a package of increased revenue compliance and collection measures. The expenses component of this measure can be found in Chapter 2 Expenses Measures.
| | | | | | | | | | | | | | | | | | | | |
| | | 2022–23 | | | 2023–24 | | | 2024–25 | | | 2025–26 | | | 2026–27 | |
| | | $‘000 | | | $‘000 | | | $‘000 | | | $‘000 | | | $‘000 | |
Build to Rent Tax concession | | | — | | | | (1,500 | ) | | | (3,000 | ) | | | (5,000 | ) | | | (6,000 | ) |
The government is providing tax concessions for eligible Build to Rent developments that provide at least 10 per cent of dwellings as affordable homes at discounted rents. The initiative is estimated to result in $15.5 million over 4 years in tax relief, with ongoing costs up to 30 June 2050 in the form of tax concessions to support eligible Build to Rent developments that become operational between 1 July 2023 and 30 June 2030.
The change is subject to the passage of legislative amendments.
203
Budget Measures 2023-24
| | | | | | | | | | | | | | | | | | | | |
| | | 2022–23 | | | 2023–24 | | | 2024–25 | | | 2025–26 | | | 2026–27 | |
| | | $‘000 | | | $‘000 | | | $‘000 | | | $‘000 | | | $‘000 | |
50 per cent Payroll Tax Rebate for Apprentices and Trainees | | | — | | | | (48,600 | ) | | | — | | | | — | | | | — | |
The government is extending the 50 per cent payroll tax rebate on the exempt wages of apprentices and trainees until 30 June 2024. The extension of the rebate is part of the government’s ongoing commitment to support Queensland businesses and build Queensland’s skills base, including for Queensland’s youth, across all regions of the state.
The change is subject to the passage of legislative amendments.
| | | | | | | | | | | | | | | | | | | | |
| | | 2022–23 | | | 2023–24 | | | 2024–25 | | | 2025–26 | | | 2026–27 | |
| | | $‘000 | | | $‘000 | | | $‘000 | | | $‘000 | | | $‘000 | |
General practitioner payroll tax amnesty | | | (100,000 | ) | | | (100,000 | ) | | | (100,000 | ) | | | — | | | | — | |
An amnesty is being provided to qualifying medical practices, otherwise liable to pay payroll tax on payments made to contracted general practitioners (GPs), up to 30 June 2025 and for the previous 5 years (i.e. 2018-25). The amnesty recognises a potential lack of awareness of the payroll tax treatment of contractors among GPs and the need to support these practices to come into compliance with the least disruption possible. The additional payroll tax revenue which may have been recovered in absence of the amnesty is estimated to be up to $100 million per annum during the amnesty period.
| | | | | | | | | | | | | | | | | | | | |
| | | 2022–23 | | | 2023–24 | | | 2024–25 | | | 2025–26 | | | 2026–27 | |
| | | $‘000 | | | $‘000 | | | $‘000 | | | $‘000 | | | $‘000 | |
Regional Payroll Tax Discount | | | — | | | | (116,100 | ) | | | (122,800 | ) | | | (129,600 | ) | | | (136,900 | ) |
The government is extending the one per cent discount on the payroll tax rate for eligible regional employers until 30 June 2030 to provide ongoing certainty to regional businesses across the state. It is estimated this initiative will result in total tax relief to eligible businesses of $505.4 million over the 4 years ending 2026-27.
The change is subject to the passage of legislative amendments.
204
| | |
| Queensland Budget 2023–24 Budget Measures Budget Paper No.4 |

Queensland Budget 2023–24
Budget Measures Budget Paper No.4
‘Rich history, thriving future.’ artwork by David Williams of Gilimbaa.