EXHIBIT (c)(vii)
Queensland Sustainability Report 2023
EXPLANATORY NOTE
This exhibit contains various website links and addresses. The information contained on or linked to or from any of the website links or addresses is not incorporated by reference into this filing and should not be considered part of this filing.
FORWARD-LOOKING STATEMENTS
This exhibit contains forward-looking statements. Statements that are not historical facts, including statements about the State of Queensland’s (the “State” or “Queensland”) beliefs and expectations, are forward-looking statements. These statements are based on current plans, budgets, estimates and projections and therefore you should not place undue reliance on them. The words “believe”, “may”, “will”, “should”, “estimate”, “continue”, “anticipate”, “intend”, “expect”, “forecast” and similar words are intended to identify forward-looking statements. Forward-looking statements speak only as of the date they are made, and neither the Queensland Treasury Corporation nor the State undertake any obligation to update publicly any of them in light of new information or future events.
Forward-looking statements are based on current plans, estimates and projections and, therefore, undue reliance should not be placed on them. Although the Queensland Treasury Corporation and the State believe that the beliefs and expectations reflected in such forward-looking statements are reasonable, no assurance can be given that such beliefs and expectations will prove to have been correct. Forward-looking statements involve inherent risks and uncertainties. We caution you that actual results may differ materially from those contained in any forward-looking statements.
A number of important factors could cause actual results to differ materially from those expressed in any forward-looking statement. Factors that could cause the actual outcomes to differ materially from those expressed or implied in forward-looking statements include:
| • | the international and Australian economies, and in particular the rates of growth (or contraction) of the State’s major trading partners; |
| • | the effects, both internationally and in Australia, of any subsequent economic downturn, as well as the effect of ongoing economic, banking and sovereign debt risk; |
| • | the effect of natural disasters, epidemics and geopolitical events, such as the novel coronavirus (COVID-19) pandemic, the Russia-Ukraine conflict and the Israel-Hamas conflict; |
| • | increases or decreases in international and Australian domestic interest rates; |
| • | changes in and increased volatility in currency exchange rates; |
| • | changes in the State’s domestic consumption; |
| • | changes in the State’s labor force participation and productivity; |
| • | downgrades in the credit ratings of the State and Australia; |
| • | changes in the rate of inflation in the State; |
| • | changes in environmental and other regulation; and |
| • | changes in the distribution of revenue from the Commonwealth of Australia Government to the State. |
(c)(vii)-1
QUEENSLAND
SUSTAINABILITY REPORT
2023

© The State of Queensland (Queensland Treasury) 2024
Copyright
This publication is protected by the Copyright Act 1968
Licence
This document is licensed by the State of Queensland (Queensland Treasury) under a Creative Commons Attribution (CC BY 4.0) International licence. In essence, you are free to copy, communicate and adapt this publication, as long as you attribute the work to the State of Queensland (Queensland Treasury).
Attribution
Content from this publication should be attributed to: © The State of Queensland (Queensland Treasury) - 2023 Queensland Sustainability Report.
Translating and interpreting assistance
The Queensland Government is committed to providing accessible services to Queenslanders from all cultural and linguistic backgrounds. If you have difficulty in understanding this publication, you can contact us on telephone (07) 3035 3503 and we will arrange an interpreter to effectively communicate the report to you.
| December 2023 | Page | 2 |
| Contents | ||||
Acknowledgement of Country | 4 | |||
| Message from the Deputy Premier, Treasurer and Minister for Trade and Investment | 5 | |||
Welcome to the 2023 Queensland Sustainability Report | 6 | |||
Queensland’s approach to managing sustainability risks | 8 | |||
Sustainability - Management | 8 | |||
Sustainability - Strategy | 10 | |||
Sustainability - Risk management | 13 | |||
Sustainability - Metrics and targets | 13 | |||
Environment | 14 | |||
Environmental management | 14 | |||
Climate change | 15 | |||
Climate change - Management | 15 | |||
Climate change - Strategy | 15 | |||
Climate change - Policy response | 18 | |||
Climate change - Risk management | 31 | |||
Climate change - Metrics and targets | 32 | |||
Natural capital | 33 | |||
Natural capital - Management | 33 | |||
Natural capital - Strategy | 33 | |||
Natural capital - Policy response | 35 | |||
Natural capital - Risk management | 45 | |||
Natural capital - Metrics and targets | 45 | |||
Social | 46 | |||
Social - Management | 46 | |||
Social - Strategy | 47 | |||
Social - Policy response | 49 | |||
Social - Risk management | 62 | |||
Social - Metrics and targets | 62 | |||
Governance | 63 | |||
Economic and Fiscal - Management | 63 | |||
Economic and Fiscal - Strategy | 63 | |||
Economic and Fiscal - Policy response | 65 | |||
Economic and Fiscal - Risk management | 67 | |||
Economic and Fiscal - Metrics and targets | 67 | |||
Appendix A: Datasets | 68 | |||
Appendix B: Ministers and responsibilities | 94 | |||
Appendix C: Supporting Information | 103 | |||
| December 2023 | Page | 3 |
Acknowledgement of Country
The Queensland Government acknowledges Aboriginal peoples and Torres Strait Islander peoples as the Traditional Owners and Custodians of the land. We recognise their connection to land, sea and community, and pay our respects to Elders past, present and emerging.
Rich history, thriving future, David Williams
This artwork tells the story of Queensland Treasury acknowledging and celebrating First Nations peoples, cultures, and contributions. The artwork shows that by connecting with First Nations peoples and sharing stories, we can build strong and authentic relationships for the benefit of every Queenslander. Further information on David Williams and Rich history, thriving future, can be found at treasury.qld.gov.au, searching for Acknowledgement of Traditional Custodians.1
| December 2023 | Page | 4 |
Message from the Deputy Premier, Treasurer and Minister for Trade and Investment
I am delighted to present the 2023 Queensland Sustainability Report, a demonstration of the Miles government’s continuing commitment to environmental protection, human rights and responsible governance.
The Queensland Government is focused on leveraging Queensland’s strong economic performance to respond to the key challenges facing Queenslanders, including climate change, addressing cost-of-living pressures, enhancing health services and improving housing affordability.
Since the release of the 2022 Queensland Sustainability Report, the Queensland Government has moved to legislate a new emissions target, 75 per cent by 2035 below 2005 levels, with the introduction to Parliament of the Clean Economy Jobs Bill 2024. This also includes legislating the existing targets to achieve a 30 per cent reduction below 2005 levels by 2030 and net zero emissions by 2050.
The report outlines the Queensland Government’s strategic priorities in managing sustainability risks and opportunities, and key policies being implemented to build a resilient and sustainable future for Queensland.
The report showcases the progress of the State of Queensland towards this future and provides essential data on key sustainability policy responses, reflecting the government’s dedication to transparency and accountability.
I endorse this report and extend my gratitude to Queensland Treasury and all government agencies involved in its preparation.
Together, we can forge a path towards a sustainable future, fostering a vibrant economy and a thriving environment for the betterment of all Queenslanders and our global partners.
 | The Honourable Cameron Dick MP
Deputy Premier, Treasurer and
Minister for Trade and Investment
| |
| December 2023 | Page | 5 |
Welcome to the 2023 Queensland Sustainability Report
The Queensland Government is committed to providing up to date, detailed, transparent financial and non-financial information related to sustainability management, reinforcing accountability to the community and stakeholders.
By upholding transparent reporting practices, the Queensland Sustainability Report endeavours to support a continuous journey towards a sustainable and resilient future.
This report should be read in conjunction with the 2022-23 Report on State Finances of the Queensland Government (ROSF) for a comprehensive view of the financial operations and performance of the Queensland Government.
Reporting approach
This report provides information on the Queensland Government’s overall approach to managing sustainability risks and more specifically separately addresses key risk factors of Environment, Social and Governance (ESG).
The government’s approach to managing sustainability risks is set out using four key areas comprising management, strategy, risk management, and metrics and target setting. Focusing on these areas shows how sustainability risks are embedded into strategy and risk management practices, and how policies, systems and processes are being developed in response.
This report has been prepared to:
| ● | Outline the Queensland Government’s approach to managing sustainability risks and opportunities, including governance structures supporting policy, oversight, and implementation. |
| ● | Provide information on the Queensland Government’s major commitments and policies addressing sustainability risks and opportunities. |
| ● | Describe how the Queensland Government measures, monitors, and manages sustainability risks and opportunities. |
The 2023 Queensland Sustainability Report has been developed with reference to emerging best practices in sustainability reporting within Australia and internationally. Development of the report has taken into consideration the International Financial Reporting Standards (IFRS) S1 General Requirements for Disclosure of Sustainability-related Financial Information and S2 Climate-related Disclosures.2,3
Appendix A: Datasets provides time series sustainability data on the State of Queensland compiled by the Queensland Government Statistician’s Office. This data has been prepared to assist the reader to verify the effectiveness of key policy responses.
Appendix B: Ministers and responsibilities provides a list of Ministers and their responsibilities or the Minister’s charter letter.
Appendix C: Supporting information provides a consolidated list of the sources of the data provided in this report, supporting transparency and accessibility.
Feedback
The Queensland Government acknowledges its role in actively managing sustainability risks and opportunities and is committed to ongoing improvements to its sustainability reporting. It welcomes the opportunity to engage with stakeholders on the state’s approach to reporting on sustainability risks and opportunities, and to inform future focus areas. For more information, please contact info@treasury.qld.gov.au
| December 2023 | Page | 6 |
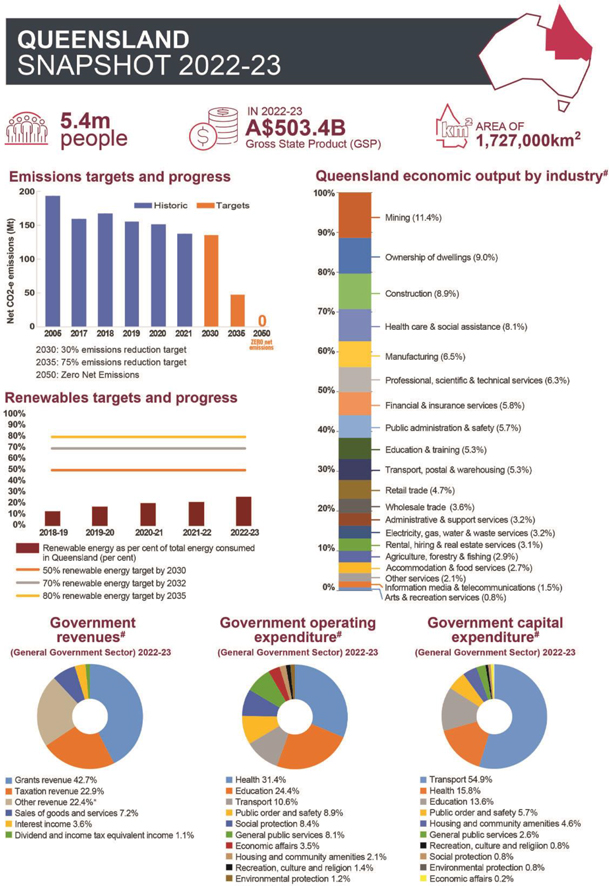
#: Average share of nominal output by industry over the past decade. Not all numbers will sum to 100% due to rounding.
*: Other revenues includes Royalties and Land Rents which make up 20.5% of total revenues, Page 5-21, 2022-23 Report on State Finances of the Queensland Government – 30 June 2023, (https://s3.treasury.qld.gov.au/files/Report-on-State-Finances-2022-23.pdf). Over the previous decade to 2021-22, Royalties and Land Rents represented 7.1% of total revenue.
Sources are available from Endnote:4
| December 2023 | Page | 7 |
Queensland’s approach to managing sustainability risks
The State of Queensland represents a vast range of activities, resources, and relationships. As the state responds to a changing world, the interaction between these networks, including upstream and downstream activities, can create sustainability related risks and opportunities.
The Queensland Government is responsible for managing sustainability risks and opportunities likely to impact the economy, community, and state finances. Robust governance practices underpin the government’s approach to understanding and managing sustainability risks and opportunities and becoming a low carbon, resilient and sustainable economy.
Sustainability - Management
This section describes the governance processes, controls, and procedures for managing sustainability related risks by detailing the governance framework and key responsibilities.
The Queensland Government is founded on the principles of the Westminster system, it is a representative democracy, supported by institutions and conventions including:
| ● | the Constitution of Queensland |
| ● | elections and the peaceful transfer of power |
| ● | separation of powers between the legislature, the executive, and the judiciary |
| ● | the Queensland Parliament. |
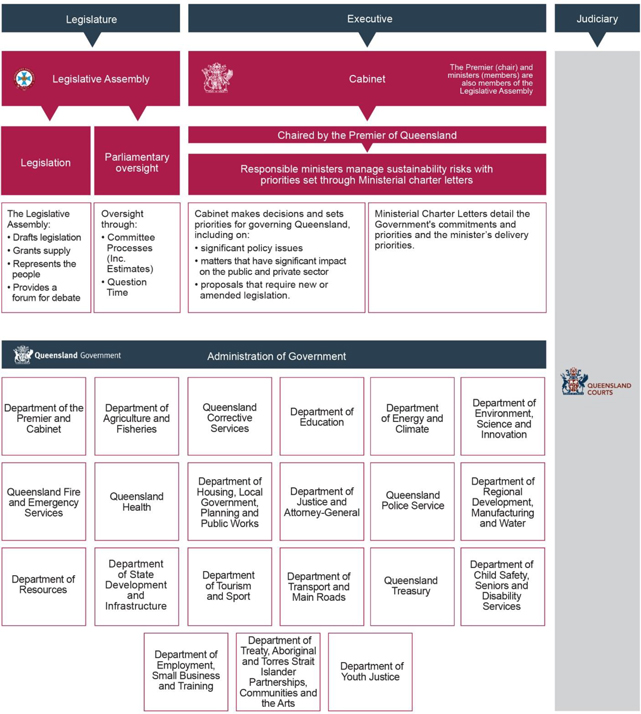
Figure 1 highlights that the Executive Government acts on the advice of the Ministry (Cabinet) which is responsible for the development and coordination of the Government’s policies, led by the Premier of Queensland. The State Cabinet is collectively responsible to the Queensland Parliament in its role representing the people of Queensland. Individual Ministers are responsible to Parliament for the administration of their portfolios and as members of the State Cabinet. Each Minister plays a crucial role in the policy and decision-making process central to government action.
Cabinet holds primary responsibility for overseeing the management of sustainability-related risks and opportunities, including climate, natural and social capital. It is responsible for making decisions and setting priorities for the Queensland Government, which underpin the approach to managing sustainability risks and opportunities as the state transitions to a net-zero emissions economy. Cabinet is accountable for the establishment of key metrics and targets concerning sustainability risks and opportunities and the monitoring of progress in achieving these targets.
Cabinet meetings are held weekly or as determined by the Premier. To ensure greater regional access and consultation with government, Cabinet meetings are also conducted in various regional centres throughout the state. The Regional Community Forums program, established in 2019, aims to strengthen partnerships with regional Queensland and foster community involvement.5
The Premier of Queensland determines the responsibilities of Cabinet Ministers, which are outlined in Administrative Arrangements Orders6 and Ministerial Charter Letters.7
Under the Public Sector Act 2022 (Qld), Ministers may appoint a chief executive of a department as the accountable officer whose responsibility includes ensuring the operations of the department or statutory body within their portfolio are carried out effectively, efficiently and economically. Ministers work with the appointed heads of these agencies to implement government policy and support agencies to meet their goals and purposes. The management of risks is embedded in the Financial Accountability Act 2009 (Qld).
| December 2023 | Page | 8 |
Figure 1: Structure of the Queensland Government8,9
| December 2023 | Page | 9 |
Sustainability - Strategy
Sustainability strategy identifies significant sustainability risks and opportunities and describes how these are being addressed.
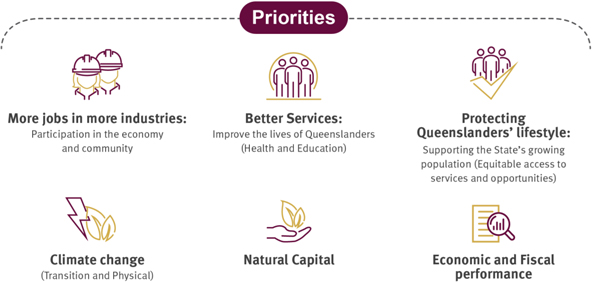
The Queensland Government is committed to integrating sustainability considerations into its decision-making processes, to support communities now and in the future. There is a focus on taking positive action to enhance health and education, while achieving sustainable economic growth without compromising Queensland’s ecosystems and environment. Queensland’s sustainability priorities (Figure 2) outline the areas of focus of the Queensland Government with respect to material sustainability risks that may impact the community, economy, and government. The establishment of sustainability priorities embeds these considerations into policy and budget settings along with promoting sustainable economic growth and the development of better communities. The government is taking proactive actions and investments to enhance Queensland’s position as a preferred investment location.
Figure 2: Queensland’s sustainability priorities10
Queensland’s sustainability risks and opportunities
The Queensland Government has identified material risks and opportunities relating to the priorities. Figure 3 summarises the sustainability risks and opportunities and sets out how these are being managed by government.
| December 2023 | Page | 10 |
Figure 3: Sustainability priorities, risks, impacts and actions
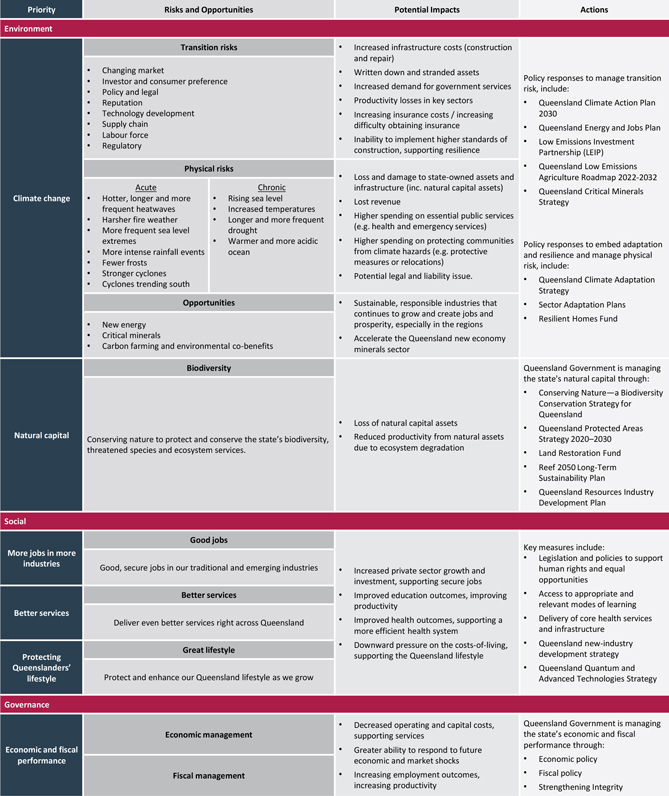
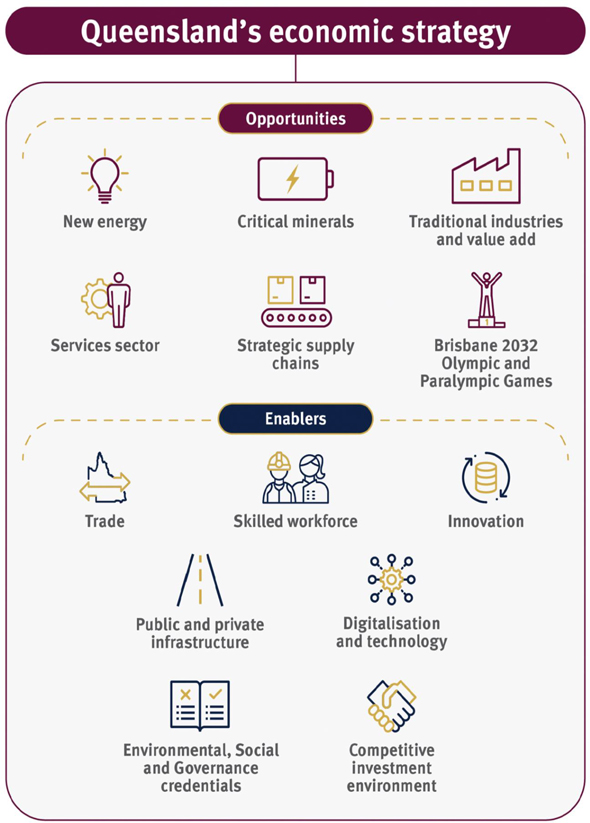
Strong economic outcomes provide government with the fiscal capacity to take positive actions and deliver targeted investment in climate change transition, social services and reforms that strengthen communities and support vulnerable Queenslanders. Responding to the sustainability priorities, the Queensland Government is implementing an economic strategy focused on leveraging Queensland’s strengths in both traditional and emerging industries and aims to expand supply chains and focus on leveraging opportunities leading up to the Brisbane 2032 Olympic and Paralympic Games (Brisbane 2032) and sustain growth towards a low emissions future (Figure 4).
The Government has announced it will legislate emissions reduction targets, with the introduction to Parliament of the Clean Economy Jobs Bill 2024.
| December 2023 | Page | 11 |
These targets are for the State to achieve a 30 per cent emissions reduction below 2005 levels by 2030, 75 per cent below 2005 levels by 2035 and net zero emissions by 2050. Formalising Queensland’s emissions targets in legislation will deliver lasting benefits that safeguard Queenslanders’ way of life — protecting the environment for the enjoyment of future generations and unlocking new job opportunities. The legislation of Queensland’s greenhouse gas emissions reduction targets will give clarity to industry, to Queenslanders, and the international community. Queensland’s clean economy plan presents an incredible opportunity.
Figure 4: Queensland’s economic strategy10
The Government’s actions are further reinforced by a commitment to transparent reporting on progress towards an equitable, net-zero, and sustainable future. Accurate and reliable information regarding sustainability risks and opportunities is crucial, as these factors directly impact the achievement of the government’s objectives.
| December 2023 | Page | 12 |
Sustainability - Risk management
Sustainability risk management describes the processes used to identify, assess, prioritise and monitor sustainability risks and opportunities.
Sustainability risk management and reporting is a strategic imperative for the state, with a core focus on increased transparency. This is underpinned by the state’s fiscal strategy and financial risk management framework. Within this framework, sustainability risks are recognised, captured, and managed as strategic risks within government operations. This approach facilitates the identification, assessment, and mitigation of sustainability risks, safeguarding the state’s interests and supporting the sustainable development of the State of Queensland. Figure 5 sets out the key elements of the government’s risk management controls.
Figure 5: Risk management controls
| Measure | Description | |
| Financial Accountability Act 2009 (Qld) (the FA Act)11 | ● Establishes the government’s risk management framework, promoting effective risk management.
● Requires each agency to establish and maintain internal controls and an audit function to provide reasonable assurance that the agency is operating efficiently, effectively and economically and that risk management controls are in place. | |
| A Guide to Risk Management12 | ● Supports the requirements of the FA Act, providing the minimum principles and procedures to encourage best practice. The guide is consistent with the principles set out in AS/NZS ISO 31000:2018 Risk management - Principles and Guidelines. | |
| Departmental Directors-General and agency accountable officers11 | ● Hold responsibility for effective risk management, including maintaining an agency governance and risk management framework.
● This responsibility includes the management of sustainability risks (including climate risk management) particularly in relation to the effectiveness and efficiency of operations and safeguarding of assets. | |
Sustainability - Metrics and targets
Information on metric and target setting is provided to describe performance management arrangements and how performance in relation to these sustainability-related risks and opportunities is measured.
The government uses a wide range of metrics and targets to assess, manage and monitor its performance. The achievement of agency objectives and risk management outcomes is supported by the Queensland Government Performance Management Framework Policy.13 The framework focuses on three key elements of public sector performance:
| ● | Planning — at the whole-of-government, agency, and individual levels to determine what outcomes are to be achieved for customers, stakeholders and the community. |
| ● | Measuring and monitoring performance — achieved across the whole-of-government direction, agency business direction, agency service delivery and at the individual level. |
| ● | Public reporting — of the performance of the Queensland Government, in a fair and balanced way, to facilitate accountability and transparency. |
The Queensland Government publishes Service Delivery Statements which provide budgeted financial and non-financial performance information and targets in relation to each Minister’s portfolio. These documents are a key accountability mechanism, subject to public scrutiny, and form the basis of parliamentary accountability.
Agency performance is monitored externally through the annual Parliamentary Estimates process held each year after the Queensland Budget. The Performance Management Framework Policy13 works in conjunction with the FA Act (section 63) which requires government agencies to prepare annual reports to provide public disclosure.
In addition, Appendix A: Datasets provides additional financial and non-financial data to assist readers to verify the effectiveness of key policy responses.
| December 2023 | Page | 13 |
Environment
The environment is essential to our survival and well-being. It provides food, water, air, and raw materials that sustain society. Queensland’s environment, offers a wealth of valuable resources, including metal and mineral deposits, renewable energy sources, fertile agricultural land, clean and secure water sources, and rich biodiverse crucial ecosystems such as the Great Barrier Reef World Heritage Area. Effective management of these systems and resources is key to ensure that ours and future generations can also enjoy their benefits.
The Queensland Government is committed to responsibly managing the environment and minimising human-induced impacts, particularly those related to climate change and biodiversity. Efforts to mitigate climate change are part of a larger global economic transformation14, offering both opportunities and challenges for Queensland’s economy. To tackle these changes, the government’s policy response centres on leveraging its competitive advantages while prioritising long-term sustainability and resilience of communities and industries.
The Queensland Government has embedded environmental considerations into policy and budget settings through the environmental sustainability priorities (Figure 6)
Figure 6: Queensland’s environmental sustainability priorities
Environmental management
The Queensland Government takes a whole-of-government approach to climate action. The Ministers depicted in Figure 7 are tasked with overseeing specific aspects of the Government’s climate action responsibilities. For full list of Ministers and their responsibilities please see Appendix B: Ministers and responsibilities or the Minister’s charter letter.
Figure 7: Queensland’s environmental management15
Ministers
| ||
| Premier | Deputy Premier, Treasurer and Minister for Trade and Investment | |
| Minister for the Environment and the Great Barrier Reef and Minister for Science and Innovation | Minister for State Development and Infrastructure, Minister for Industrial Relations and Minister for Racing | |
| Minister for Energy and Clean Economy Jobs | Minister for Agricultural Industry Development and Fisheries and Minister for Rural Communities | |
| Minister for Regional Development and Manufacturing and Minister for Water | Minister for Resources and Critical Minerals | |
For this report, environmental risk management is separated into:
| ● | Climate change — the long-term shifts in temperatures and weather patterns. |
| ● | Natural capital — the stock of the earth’s renewable and non-renewable resources, including trees, soils, air, water, minerals and all living things that provide ecosystem services. |
| December 2023 | Page | 14 |
Climate change
The State of Queensland is encountering climate change due to rising greenhouse gas concentrations in the atmosphere, leading to higher global average temperatures. Risks and expected adverse impacts from climate change will escalate as global warming increases.16
Climate change - Management
The Queensland Government’s climate management is undertaken by the Ministers outlined in Figure 7.
Due to the scope, scale and volume of initiatives being undertaken to address climate change, the Queensland Government is creating a Clean Economy Expert Panel to advise on the optimal pathways to meeting emissions reduction targets and promote alignment with Australian Government policies and initiatives. The Expert Panel will also establish five yearly emissions targets until 2050, with annual progress reporting to the Queensland Parliament. 17
Climate change - Strategy
Queensland’s climate strategy is focused on managing transition and physical risks arising from climate change. A summary of these risks and potential impacts are outlined in Figure 8.
Figure 8: Transition and physical risks
Transition risk
| ||
| ‘Transition risks’ are those risks that arise from managing the transition to a low carbon economy. They relate to the policy, legal, technology, market and reputational risks arising from climate change. This includes how organisations adjust to changes driven by and in response to mitigating and adapting to climate change, as well as impacts driven by the economic, policy, technology, and social changes. | ||
| These changes include automation, electrification, disruptive technologies, and information and communications technologies (ICT) innovation. | ||
Physical risk
| ||
| ‘Physical risk’ refers to the physical impacts of climate change from specific events or longer-term (chronic) shifts in climate patterns. | ||
| The State of Queensland may experience acute and chronic impacts including: | ||
| Acute | Chronic | |
● Hotter, longer and more frequent heatwaves ● More intense bushfires ● More frequent sea level extremes ● More intense rainfall events ● Fewer frosts ● Stronger cyclones ● Cyclones trending south. | ● Rising sea level ● Increased temperatures ● Longer and more frequent drought ● Ongoing temperature increases ● Warmer and more acidic ocean. | |
| These changes could have a significant potential economic impact on the State of Queensland including: | ||
● loss and damage to state-owned assets and infrastructure (inc. natural capital assets) | ||
● degradation of natural assets and ecosystem services, which food, fibre and tourism industries are highly dependent upon | ||
● lost revenue | ||
● higher spending on essential public services (e.g. health and emergency services) | ||
● higher spending on protecting communities from climate hazards (e.g. protective measures or relocations) | ||
● potential legal and liability issues.
| ||
| December 2023 | Page | 15 |
To manage the above risks, the Queensland Government is focused on:
| ● | creating a future economy that is environmentally sustainable and supports the transition to a low carbon future. |
| ● | climate adaptation activities aimed at reducing the impact of climate change on people, industries, and nature, while embedding greater resilience in our environment and infrastructure |
| ● | investing in climate-related opportunities. |
An outline of climate change policies being implemented by the Queensland Government is provided in the Climate Change - Policy response section.
Acknowledgment of exposure to emissions intensive industries
The Queensland Government acknowledges the role of emissions intensive industries, particularly coal exports, in Queensland’s economy. These industries contribute significantly to the prosperity of the state, providing employment opportunities, economic benefits, and essential resources that support communities.
The State of Queensland coal resources include:
| ● | Metallurgical coal – A large proportion of Queensland Government’s royalties18,19,a comes from coal mining and the majority of royalties are attributable to the hard-coking coal (HCC) used in global steel production (Appendix A Datasets: Metric 46). The State of Queensland is a large seaborne exporter of metallurgical coal. It is expected that international demand will continue to support the State of Queensland’s metallurgical coal exports over coming decades.20 |
| ● | Thermal coal – Used for electricity generation (Appendix A Datasets: Metric 46) both domestically and overseas. Use of thermal coal in Queensland’s electricity generation is expected to decline as further progress is made towards the Queensland Government’s renewable energy target. The global trend towards zero-net emissions is well established and the shift away from thermal coal in electricity generation is expected to progress in the coming decades. The Queensland Government’s thermal generation ownership structure means it is positioned to manage an orderly energy transition.20 |
Safeguard Mechanism facility operations in Queensland
The Safeguard Mechanism is the Australian Government’s policy for reducing emissions at Australia’s largest industrial facilities. It is administered by the Federal Department of Climate Change, Energy, the Environment and Water and sets legislated limits—known as baselines—on the greenhouse gas emissions of these facilities. These baselines will decline, predictably and gradually, on a trajectory consistent with achieving Australia’s federal emission reduction targets. If a Safeguard facility exceeds their baseline, they must manage excess emissions or become liable to pay a pecuniary penalty for failure to comply with the Safeguard Mechanism.21,22,b
For more information please see the Australian Government Clean Energy Regulator website: www.cleanenergyregulator.gov.au
The State of Queensland has 64 private facilities captured by the Safeguard Mechanism, across a range of industries, representing scope 1 emissions of 37.3 of MtCO2-e23.
Figure 9: 2021-22 Breakdown of Queensland’s Safeguard Mechanism footprint
Of the 64 Queensland Facilities: |
36 from the coal industry (56%) |
11 from the gas industry (17%) |
5 from the ammonia industry (8%) |
3 from the aluminium industry (5%) |
9 “other” facilities, including transport, cement, petroleum and non-coal mining (14%) |
Note: Safeguard facility reported emissions 2021-22.23 This list excludes National Energy Market (NEM) connected generators and some operations managed at a national level. Not all numbers will sum to 100% due to rounding.
a Mining and petroleum royalty payments are made to the owner of resources for the right to extract them. In Queensland, royalty is generally paid to the Queensland Government as the resource owner. Australia’s primary coal exports destinations are Japan, Other (combined), South Korea, India and Taiwan.
b New obligations and reporting requirements apply to Safeguard facility financial years commencing on or after 1 July 2023.
| December 2023 | Page | 16 |
Queensland initiatives implemented in addition to the Safeguard Mechanism
The Low Emissions Investment Partnerships (LEIP) Program, announced in the 2023–24 Queensland Budget, is a $520 million initiative of the Queensland Government to bring forward private sector investment to:24
| ● | Fast-track emissions reductions with a preference for abatement that exceeds safeguard mechanism requirements and is delivered before 2030. |
| ● | Increase resource optimisation and maximise the beneficial use of gas resources. |
| ● | Maximise economic opportunities and workforce development in regional Queensland. |
| ● | Develop low emissions knowledge within the sector and diffuse low emissions technology in Queensland. |
The initial focus of the LEIP program will be on partnering to reduce emissions across Queensland’s metallurgical coal sector. Implementation of the Queensland Energy and Jobs Plan33 (QEJP) will also support emissions abatement opportunities at these facilities through uptake of renewable energy.
The Queensland Resources Industry Development Plan (QRIDP) outlines how government and industry can work together to address and respond to key global emerging trends.25
Managing a Just transition26,
The Queensland Government is enabling a just transition through several policies providing social and economic opportunities with respect for labour principles and rights. These include:
| ● | The Queensland Energy Workers’ Charter is a landmark agreement between government, publicly owned energy businesses and energy unions to support affected energy workers through the energy transformation. It sets out principles and actions for the parties to provide support to workers. |
| ● | The Charter is backed by a $150 million Job Security Guarantee which supports workers in Queensland’s publicly owned coal- fired power stations to have a secure future and clear employment pathways and opportunities. The Energy (Renewable Transformation and Jobs) Bill 2023 introduced to Parliament on 24 October 2023, will establish the Job Security Guarantee and Fund in law, creating an enduring framework to support energy workers.27,33 |
| ● | The Regional Economic Futures Fund (REFF) will support economic and community development initiatives.28 |
| ● | The Queensland Clean Energy Workforce Roadmap53 sets out the pathway to help create a skilled, job-ready workforce to deliver Queensland’s clean energy transformation. It is supported by the Future Energy Jobs Guide, which outlines job opportunities and career pathways available to existing workers and school students. Specific initiatives under the roadmap include: 29 |
| ● | Piloting of Mobile Regional Energy Jobs Hubs across the Queensland Renewable Energy Zone (QREZ) regions, connecting regional communities to job opportunities. |
| ● | An expansion to the Gateway to Industry Schools program to cover a dedicated renewable energy focus, and online resources to support Queensland teachers to deliver clean energy content and student learning. |
| ● | A skills academy as part of Stanwell’s Future Energy Innovation and Training Hub in Rockhampton. |
| ● | The Queensland Government provides employment and jobs support across several areas to employees and employers. It includes, career advice, links to programs for specific groups, industry job trends and statistics, links to education, training and qualifications and information on employee rights, entitlements and pay.30 |
| December 2023 | Page | 17 |
Climate change - Policy response
Below is a summary of Queensland Government policies that support the management of climate change risks and opportunities.
| Policy response | Strategies and goals | Targets and outcomes | Responsible minister | |||
Implement measures to manage transition risk | ||||||
Queensland Climate Action Plan 2020-2030 | The plan outlines the state’s investments and actions to reach its emissions and renewables targets, create jobs and drive economic growth. It provides a central framework and a coordinated approach to combine actions across departments and areas of ministerial responsibility.31
The trajectory towards the targets will build on the investments and actions already taken, with priorities identified across five key sectors:
● energy
● transport
● land
● buildings
● industry
For further information please visit www.des.qld.gov.au and search for Queensland Climate Action.
| Targets:
● 30% emissions reduction below 2005 levels by 2030.32 ● 75% emissions reduction below 2005 levels by 2035.32 ● Zero net emissions by 2050.32
Outcomes:
● Emissions reduction of 29% below 2005 levels in 2021, as compared with the target of 75% reduction by 2035.32 ● 139.665 million tonnes net CO2-e emissions (2020-21).32 ● 26.78 tonnes net CO2-e per capita. (Appendix A Datasets: Metric 1)
See Appendix A: Datasets for metrics. |
Minister for Energy and Clean Economy Jobs | |||
Queensland Energy and Jobs Plan (QEJP) | The QEJP outlines the state’s orderly pathway to transform the State’s electricity system to deliver a clean, reliable and affordable power for generation. Released alongside the QEJP, the Queensland SuperGrid Infrastructure Blueprint (the Blueprint) outlines optimal infrastructure pathway to transform Queensland’s electricity system.33,34 The QEJP has three focus areas:
1. Clean energy economy: Build a clean and competitive energy system for the Queensland economy and industries as a platform for accelerated growth. 2. Empower households and businesses: Deliver affordable energy for households and businesses to support more rooftop solar and batteries. 3. Secure jobs and communities: Drive better outcomes for workers and communities as partners in the energy transformation.
Specific QEJP initiatives include:
● The Queensland Renewable Energy and Hydrogen Jobs Fund will deliver publicly owned renewables, storage and network investments35 ● The Job Security Guarantee Fund and Energy Workers’ Charter, will support workers in publicly owned coal-fired power stations by ensuring they have a secure future, choices and clear employment pathways and opportunities 33,36 ● Investing $90 million in two new apprentice training hubs for critical skills that will be needed in the energy transformation in Gladstone and Townsville. A $200 million Regional Economic Futures Fund (REFF) to support economic and community development initiatives.37,38
| Targets:
● 50% renewable energy by 2030.40 ● 70% renewable energy by 2032.40 ● 80% renewable energy by 2035.40
As part of QEJP implementation, by 2035, Queensland’s electricity system is likely to include:
● 25 GW of new and existing large-scale wind and solar.34 ● Two new pumped hydro projects designed to deliver up to 7 GW of long duration storage, focused on:34 ● Borumba Pumped Hydro Energy Storage, a 2,000 megawatt (MW) pumped hydro energy storage facility expected to deliver long duration energy storage needed for a reliable, renewable energy system41 ● Pioneer-Burdekin Pumped Hydro Energy Storage, the Queensland Government has announced the commencement of detailed design and cost analysis for a potential 5-gigawatt pumped hydro energy storage (PHES) facility in the western Pioneer Valley.42 ● Approximately 3 GW of low to zero emissions gas generation for periods of peak demand and backup security.34 ● Grid capacity supporting 11 GW of rooftop solar and approximately 6 GW of batteries in homes and businesses.34 ● Approximately 200km of new high voltage transmission infrastructure.43 | Minister for Energy and Clean Economy Jobs | |||
| December 2023 | Page | 18 |
| Policy response | Strategies and goals | Targets and outcomes | Responsible minister | |||
As part of the QEJP, policy commitments have been made to:
● Prepare legislation to establish the government’s renewable energy targets in law39
● Convert all publicly owned coal-fired power stations into clean energy hubs by 2035.33
For further information please visit www.epw.qld.gov.au and search for Queensland Energy and Jobs Plan. | Outcomes:
● 26% renewable energy as percentage of total energy consumed in Queensland in 2022-23.44 (2021-22: 21.4% Appendix A: Datasets Metric 5) ● The Energy (Renewable Transformation and Jobs) Bill 2023 (Qld) was introduced to Queensland Parliament on the 24th October 2023. The bill proposes to establish key commitments from the Plan in law, create the infrastructure frameworks needed to build the SuperGrid, and establish the governance and advisory arrangements needed for a smooth, coordinated transformation.45,46,47 ● During 2022-23, $ 2.7 billion was allocated from the Queensland Renewable Energy and Hydrogen Jobs Fund, including:44 ● $563.5 million for CS Energy’s wind investments in Central Queensland44 ● $330 million for CleanCo’s 250 MW Swanbank Battery44,48 ● $85.5 million for CS Energy’s 400 MW Brigalow Hydrogen ready Gas Peaking Plant44,49
See Appendix A: Datasets for metrics.
| |||||
CopperString 2032 | CopperString 2032 project is 1,100km of new electricity transmission line from Townsville to Mount Isa that will connect Queensland’s North West Minerals Province (NWMP) to the North Queensland Renewable Energy Zone (NQREZ) and the National Electricity Market.50,51
The overall project has a budget of $5 billion and includes:51
● 500 kilovolt (kV) transmission line from just south of Townsville to Hughenden ● 330kV transmission line from Hughenden to Cloncurry ● 220kV transmission line from Cloncurry to Mount Isa ● up to six new substation sites.
|
Target:
● The project is expected to be completed by 2029.51
Outcomes:
● Powerlink is progressing early works on the project in 2023 ahead of construction commencing in 2024.52 |
Minister for Energy and Clean Economy Jobs
Minister for State Development and Infrastructure, Minister for Industrial Relations and Minister for Racing | |||
Queensland’s Clean Energy Workforce Roadmap | Queensland’s Clean Energy Workforce Roadmap sets out the pathway to help create a skilled, job-ready workforce to deliver Queensland’s clean energy transformation. It is supported by the Future Energy Jobs Guide, which comprehensively outlines job opportunities and career pathways available to existing workers and school students.53 The Clean Energy Workforce Roadmap is an action in the Queensland Workforce Strategy and builds on actions in the Hydrogen Industry Workforce Development Roadmap 2022-2032, which supports workforce development for the renewable hydrogen industry now and into the future | Targets:
● Piloting of Mobile Regional Energy Jobs Hubs, facilitated by Regional Project Coordinators, within the Queensland Renewable Energy Zone (REZ) regions to connect local workers with industry and relevant training providers and support small businesses to access clean energy opportunities.53 ● Establish a Renewable Energy Gateway to Industry Schools program, targeting over 30 schools, to engage students in clean energy related learning opportunities, career information and training pathways.53 ● A skills academy as part of Stanwell’s Future Energy Innovation and Training Hub in Rockhampton.53 ● Co-funding of up to 20 places in Engineers Australia Global Engineering Talent Pilot Program for future clean energy related positions.53 ● $12.45 million to build hydrogen and renewable energy training facility for training in renewable energy such as hydrogen, solar and wind at the Bohle Trade Training TAFE in Townsville. Scheduled for completion December 2023.53
|
Minister for Employment and Small Business and Minister for Training and Skills Development
Minister for Energy and Clean Economy Jobs | |||
| December 2023 | Page | 19 |
| Policy response | Strategies and goals | Targets and outcomes | Responsible minister | |||
● $40 million to deliver the Eagle Farm TAFE Robotics and Advanced Manufacturing Centre project that will provide for specialist trade training, including facilities for advanced manufacturing and robotics, process instrumentation, telecommunications and renewable technologies training. Scheduled for completion in later half of 2024.53
Outcomes: ● $20 million for Stage 2 upgrades to the industry led Queensland Apprenticeships Centre, featuring a new Hydrogen Training Centre of Excellence at Beenleigh. Completed in September 2022.53 ● $17 million to build the Pinkenba Renewable Energy Training Facility. Completed in September 2022.53
| ||||||
Queensland’s Zero Emission Vehicle Strategy3 | Queensland’s Zero Emission Vehicle Strategy 2022– 2032 (ZEV Strategy) and Queensland’s Zero Emission Vehicle Action Plan 2022– 2024 (Action Plan) were released in 2022, outlining key initiatives and actions that will shift Queensland to Zero Emission Vehicles (ZEVs) and lower transport emissions.54,55 The strategy details:
● removing barriers to enable all Queenslanders, communities and industries, to access and benefit from ZEVs over the next 10 years. ● supporting the uptake and development of ZEV technologies in Queensland and build industry and supply capability. ● how to strategically integrate ZEV technology into the energy system and the built environment in a way that benefits all Queenslanders.
In addition, the Qfleet Electric Vehicle Transition Strategy 2023–2026 sets out the strategy for transitioning Queensland Government’s fleet to EV.56
For further information please visit www.qld.gov.au and search for Queensland’s Zero Emission Vehicle Strategy. | ZEV Strategy
● Target: 50% of new passenger vehicle sales to be zero emission by 2030, moving to 100% by 2036.57 ● Target: Every new TransLink funded bus to be zero emissions from 2025 in South East Queensland and from 2025-2030 across regional Queensland.57 Queensland Electric Super Highway (QESH) ● Target: Once fully delivered, the QESH network will consist of more than 54 fast charging locations.58 ● Outcome: 44 fast charging stations have been delivered as part of the QESH.58 Queensland Electric Vehicle Charging Infrastructure Co-fund Scheme ● Target: Public-private co-funding and construction of 46 new public fast charging sites across the state, in addition to the QESH.59 ● Outcome: 5 co-fund recipients confirmed, and the first public co-fund EV charging site has been delivered with all 46 sites to be delivered progressively by end of 2024.59 Queensland Zero Emission Vehicle Rebate Scheme ● Target: The scheme provides eligible Queenslanders rebates of up to $6000 and businesses up to $3000 for eligible new Zero Emission Vehicles purchased from 21 April 2023.60 ● Outcomes: Government has committed to $45 million to the rebate scheme to be offered until funding is exhausted. Remaining scheme funding (as at 1 November 2023): $28,845,000.60 ● Outcomes: Contributing to the Queensland’s Government commitment to support electric vehicle uptake and contribute to emissions targets.61 Qfleet Electric Vehicle Transition Strategy ● Target: 100% of eligible Qfleet passenger vehicles to be zero emission by 202654 ● Outcomes: As at 30 June 2023, Qfleet had transitioned 30.7% of eligible vehicles to zero emission vehicles.62 |
Minister for Transport and Main Roads and Minister for Digital Services
Minister for Energy and Clean Economy Jobs |
3 Zero Emission Vehicles refers to zero exhaust emissions while driving.
| December 2023 | Page | 20 |
| Policy response | Strategies and goals | Targets and outcomes | Responsible minister | |||
| ||||||
Environmental sustainability for households and businesses, helping to manage demand for electricity | The Queensland Government has introduced several initiatives to support households and business transition to a low-carbon economy. These include:
Queensland Business Energy Saving and Transformation (QBEST) Program: provides rebates of up to $12,500 to eligible small and medium-sized Queensland businesses to install energy-efficient equipment.63
Queensland Building Plan (QBP): guides change to policy and legislation that create a safer, fairer and more sustainable building industry. Specifically, Action 6.6 Help Queensland deliver a zero-net emissions target by 2050 by driving the national agenda to improve sustainability performance by updating the National Construction Code (NCC).64 For further information please visit www.qld.gov.au and search for Building laws and standards.
Digital Electricity metering: all new and replacement electricity meters installed in homes are digital meters and are now the standard electricity metering system. They provide more accurate and more up-to-date information on usage patterns to consumers.65
ecoBiz: provides free personal coaching, site surveys, training and tools to small and medium sized businesses to help them improve resource efficiency, environmental sustainability and reduce operating costs.66,67
Climate Smart Energy Savers: provides rebates of between $300 and $1,000 for the replacement of old appliances with 4 star-rated (or higher) appliances and hot water systems. Eligible appliances must be purchased and installed on or after the program commencement date and on or before the closure date to be eligible for a rebate.68
For further information please visit www.qld.gov.au and search for Climate Smart Energy Savers. | Queensland Business Energy Saving and Transformation (QBEST) Program
● Outcome: First-round applications are now open for QBEST Rebates.69
Queensland Building Plan
● Target: Increased residential energy efficiency standards for new houses and units under the NCC 2022 to require: 70,71,72 ● 7-stars (out of 10) for the building shell (up from 6-stars), and ● a new ‘whole-of-home’ energy budget for a dwelling’s major fixtures and any on-site renewable energy e.g. solar photovoltaic (PV) system ● Outcome: The State of Queensland is adopting the residential energy efficiency standards as part of the update of the NCC 2022. (This forms part of the Modern Homes standards, along with liveable housing design.73,74 ● Outcome: Liveable housing design standards were introduced with NCC 2022 to improve access and function of new houses and units.
Digital Electricity metering:
● Target: A target of 100 per cent penetration of smart meters by 2030.34 ● Outcome: Approximately 39% of Ergon Retail customer premises now have digital metering.75
ecoBiz:
● Outcome: Over 1,000 businesses registered with 90% of businesses recorded an increase in productivity and savings.66 ● Outcome: On average, participants in the program saved: 19% on their electricity costs, 31% on their water costs and 39% on their waste management costs.76,77
Climate Smart Energy Savers
● Outcome: Climate Smart Energy Savers applications are open for eligible Queenslanders who replace old appliances with 4 star-rated (or higher) energy-efficient appliances and hot water systems.78
|
Minister for Energy and Clean Economy Jobs
Minister for Agricultural Industry Development and Fisheries and Minister for Rural Communities | |||
Low Emissions Investment Partnership (LEIP) | Low Emissions Investment Partnerships (LEIP) program is designed to reduce emissions to support the State of Queensland’s targets of a 30% emissions reduction on 2005 levels by 2030, and net zero by 2050. The $520 million program will accelerate least cost emissions reductions and capitalise on collaborative opportunities, with partnerships through bilateral agreements and co-investment in established emission reduction strategies. The focus will be on reducing the emissions from the state’s largest emitting facilities, with initial concentration on the metallurgical coal industry.79 The objectives of the LEIP program are to:
● Fast-track emissions reductions with a preference for abatement that exceeds safeguard mechanism requirements and is delivered before 2030. |
Target:
● Support the mining industry to attract private sector investment and Australian Government funding into low emissions projects, delivering a step-change in emissions reduction and supporting strong regions.79 |
Deputy Premier, Treasurer and Minister for Trade and Investment |
| December 2023 | Page | 21 |
| Policy response | Strategies and goals | Targets and outcomes | Responsible minister | |||
● Increase resource optimisation and maximise the beneficial use of gas resources. ● Maximise economic opportunities and workforce development in regional Queensland. ● Develop low emissions knowledge within the sector and diffuse low emissions technology in Queensland.
| ||||||
Queensland Low Emissions Agriculture Roadmap 2022–2032 | The roadmap will assist Queensland agribusinesses and the broader supply chain to lower their greenhouse gas (GHG) emissions without impacting the supply of food and fibre. This roadmap seeks to support industries in the agriculture sector to set and deliver against their targets, with actions identified across five pathways: 80
● Livestock emissions ● Cropping and horticulture emissions ● On-farm energy opportunities ● Carbon farming and landscape management ● Regions and supply chains.
|
Outcomes:
The Queensland Government has partnered with AgForce and the Queensland Farmers’ Federation to develop the roadmap, which will evolve as the needs and ambitions of partners change. This process will ensure the roadmap remains current and relevant to the sector.80 |
Minister for Agricultural Industry Development and Fisheries and Minister for Rural Communities | |||
Reducing emissions from government operations | The government is undertaking several emissions reductions initiatives including:
● Establishment of an Office of Hospital Sustainability within the Department of Health. This office will be responsible for implementing the emissions reduction plans as well as:81,82 ● setting benchmarks and targets for environmental sustainability in Queensland Health
● investment in green/sustainable infrastructure for hospitals
● review of procurement policies and practices to manage waste and procure environmentally sustainable products in a hospital setting.
● providing advice and support on managing the effects of climate change on Queensland’s healthcare system.
Department of Transport and Main Roads (TMR) ● Building sustainable roads: Using recycled materials has the potential to deliver significant benefits including cost savings, reducing landfill, protecting the environment, network performance, circular economy and reducing emissions.83 ● Building Waste 2 Resource (W2R) Strategy: The W2R Strategy sets the strategic direction and intent to minimise waste and achieve a more sustainable use of resources across the department. The W2R Strategy sits under TMR’s Environmental Sustainability Policy84 ● Light Emitting Diode (LED) lighting replacement project: TMR is replacing obsolete road lights with high performing Light Emitting Diode (LED) luminaires as well as Smart Light Control units.85
|
Outcomes:
● In total, energy efficiency and emissions reduction initiatives have reduced Queensland Health’s carbon emissions output by around 60,000 tonnes of CO2 equivalent each year.86,87 ● 2 million m2 of pavement has been recycled using Hot-in-place asphalt recycling (HIPAR).88 ● W2R Plan Tender Schedule S12 – a new tender schedule that requires tenderers to submit details of the quantities of recycled materials that they propose to use. It is a prompt for tenderers to consider the use of recycled materials and to provide continuous feedback to TMR about market conditions.84 ● W2R Calculator – allows TMR to utilise data to monitor uptake and trends of recycled materials, resource efficiency and waste reduction.84 ● The W2R Annual report provides greater detail on how TMR is managing waste. E.g. Total waste generated by TMR in 2021/2022 was 685,309 tonnes, of which 85% was diverted (reused or recycled) and 15% was disposed to landfill.89
Light Emitting Diode (LED) lighting replacement project:
● In 2022–23, the government replaced 6,288 obsolete road lights with high performing Light Emitting Diode (LED) luminaires as well as installing 7,234 Smart Light Control units.85 ● More than 25,521 have been installed since delivery commenced in 2017.85 |
Minister for Health, Mental Health and Ambulance Services and Minister for Women
Minister for Energy and Clean Economy Jobs
Minister for Transport and Main Roads and Minister for Digital Services |
| December 2023 | Page | 22 |
| Policy response | Strategies and goals | Targets and outcomes | Responsible minister | |||
Resource Recovery | The Queensland Government has developed a comprehensive Waste Management and Resource Recovery Strategy which aims to promote more sustainable waste management practices that reduce the amount of waste produced by business, industry and households.90
Queensland’s Resource Recovery Industries 10-Year Roadmap and Action Plan provides a framework to accelerate this transition and develop Queensland’s resource recovery industries.91,92
In 2021 the Queensland Government announced a 10-year $2.1 billion waste and resource recovery package, including a $1.1 billion Recycling and Jobs Fund that will support infrastructure and non-infrastructure priorities to facilitate the recovery of more resources from waste, enable the transition to the circular economy and continue to ensure households are not directly impacted by the waste levy.93 | Targets (for 2050):
● 25% reduction in household waste vs 2018 baseline.90 ● 90% of waste is recovered and does not go to landfill vs 2018 baseline.90 ● 75% recycling rates across all waste types vs 2018 baseline.90
Outcomes:
● Implementation of regional waste management plans, provide an investment blueprint to support improved waste management and resource recovery practices and transition to a circular economy.94 ● Single-use plastic items bans: Queensland has banned the supply of numerous single-use plastic items to tackle plastic pollution.95 ● The Queensland Recycling Modernisation Fund (QRMF) is being delivered in partnership with the Australian Government, to fund projects that improve the sorting, processing, recycling and remanufacturing of waste materials.96 ● The Regional and Remote Recycling Modernisation Fund (RRRMF), also co-funded with the Australian Government, provided grants of up to $500,000 for local governments and their industry partners to improve the viability of sorting, processing, recycling or re-manufacturing of waste in regional Queensland.97 ● The Recycling Enterprise Precincts Guideline and Location Strategy have been published to increase economic opportunities and help facilitate industrial land growth. Since the launch of the roadmap in August 2019, 46 business and local government projects have received funding diverting 1.41 million tonnes of waste per annum from landfill, delivering an additional $255 million in capital investment and creating more than 468 jobs across Queensland.98
See Appendix A: Datasets for metrics.
|
Minister for State Development and Infrastructure, Minister for Industrial Relations and Minister for Racing
Minister for the Environment and the Great Barrier Reef and Minister for Science and Innovation | |||
A more sustainable Games - Infrastructure delivery for the Brisbane 2032 Olympic and Paralympic Games | Games delivery partners will implement best practice industry standards in the planning, design and delivery of resilient, resource efficient, sustainable and inclusive Games infrastructure.99
A more sustainable Games will focus on delivering lasting legacies and help accelerate progress towards sustainability objectives, including emissions reduction.
To help make the Games more sustainable and upholding a strong commitment to climate action, carbon management strategies will include: ● minimising the Games’ carbon footprint as much as possible ● continuously improving emissions forecasting and measurement to support evidence-based decision making ● promoting shared responsibility and delivering verifiable climate friendly outcomes for Queensland and Australia.
This is supported by the Q2032 Procurement Strategy and Elevate 2042.100,101 |
Targets:
● Brisbane 2032 will achieve a more sustainable Games in accordance with the IOC agreed definition.99 ● Minimising the Games’ carbon footprint as much as possible.102 ● Brisbane 2032 Future Host Questionnaire response outlines the Queensland Government and Games Delivery Partners’ commitments related to Brisbane 2032 ‘green building’ standards for infrastructure. This includes:99
● All new vertical infrastructure projects or significant upgrades will target 6 star (world leadership) Green Star for Buildings ratings from the Green Building Council of Australia (GBCA), where relevant.
● All new linear infrastructure or significant upgrades target an Infrastructure Sustainability (IS) rating of excellent or greater from the Infrastructure Sustainability Council of Australia (ISCA).
● As part of the Green Star and IS rating approach, capital programmes will target zero net waste and 100% renewable electricity and fuel use for construction phases and deliver assets that achieve the same in operation. |
Minister for State Development and Infrastructure, Minister for Industrial Relations and Minister for Racing
Minister for Energy and Clean Economy Jobs |
| December 2023 | Page | 23 |
| Policy response | Strategies and goals | Targets and outcomes | Responsible minister | |||
| ||||||
Community Sustainability Action grants (Round 6 & 7 Community Climate Action) | The Community Sustainability Action grants provide funding to eligible community groups and individuals for innovative projects which seek to address climate change, conserve Queensland’s natural and built environment and protect unique wildlife.103
Previous rounds have included funding for environmental conservation, koalas, threatened species, wildlife carers and heritage conservation. | Targets:
● Grants of up to $100,000 (excluding GST) provided for projects that enable community organisations to reduce emissions, boost renewables and reduce energy bills that come with running facilities and services.103
Outcomes:
● As at 12 July 2023, 759 projects have been allocated funding under the Community Sustainability Action grant program.103 ● Details on projects recipients can be found online.104 ● A total of 107 community climate action projects were funded under Rounds 6 & 7 of the Community Sustainability Action Grants103
|
Minister for the Environment and the Great Barrier Reef and Minister for Science and Innovation
Minister for Energy and Clean Economy Jobs | |||
Implement adaptation and resilience measures to manage physical risk | ||||||
Queensland Climate Adaptation Strategy / Sector Adaptation Plans | The Queensland Climate Adaptation Strategy and the Sector Adaptation Plans outlines actions to support adaptation outcomes for the community, local governments, key sectors and systems and the Queensland Government.105,106 |
Outcomes:
Specific sector plans have been published for:106
● Human Health and Wellbeing Climate Change Adaptation Plan (H-CAP) ● Built Environment and Infrastructure Sector Adaptation Plan (BE&I SAP) ● Building a resilient tourism industry: Queensland tourism climate change response plan (Tourism SAP) ● Agriculture Sector Adaptation Plan (Ag SAP) ● Biodiversity and Ecosystems Climate Adaptation Plan (B&E CAP) ● Small and Medium Enterprise Sector Adaptation Plan (SME SAP) ● Emergency Management Sector Adaptation Plan (EM SAP)
|
Minister for Energy and Clean Economy Jobs | |||
Long Paddock | The Long Paddock is a Queensland Government initiative that provides climate information to the community. The site provides access to rainfall and pasture outlooks and decision support tools to support land management decision making and planning for land holders, education, consultants and extension officers.
The Long Paddock website is operated by the Science and Technology Division of the Queensland Department of Energy and Climate with support from the Queensland Department of Agriculture and Fisheries (DAF).107 | Outcomes:
Long Paddock includes information on:107
● Drought Declarations ● Drought & Climate Adaptation ● Southern Oscillation Index (SOI is used to assess the strength of the El Niño Southern Oscillation phenomenon) ● Climate Outlooks, Weather & Fire ● Scientific Information for Land Owners (SILO) (Provides daily meteorological datasets in ready-to-use formats suitable for biophysical modelling, research and climate applications.) ● AussieGRASS Rainfall / Pasture ● FORAGE (Grazing science for property management) ● Queensland Future Climate ● Australia’s Variable Rainfall
|
Minister for the Environment and the Great Barrier Reef and Minister for Science and Innovation
Minister for Energy and Clean Economy Jobs | |||
| December 2023 | Page | 24 |
| Policy response | Strategies and goals | Targets and outcomes | Responsible minister | |||
Drought and Climate Adaptation Program (DCAP) | The DCAP assists agricultural producers to better manage the impact of drought and climate change. Through the program, climate scientists, government and non- government agencies, producers and industry leaders collaborate to help producers better manage the financial risks associated with climate change through improved forecasting, tools and other activities.108 | Outcomes: Examples of DCAP projects include:
● Delivering the Long-Term Carrying Capacity report, providing Pasture Growth Alerts and access to the MyFORAGE Platform.109 ● The Farm Business Resilience Program.110 ● The Northern Australia Climate Program, improving management of climate variability in the grazing industry across northern Australia.111
|
Minister for Agricultural Industry Development and Fisheries and Minister for Rural Communities | |||
Resilient Homes Fund | The Queensland and Australian Governments developed the Resilient Homes Fund to help Queenslanders across 39 local government areas whose homes were impacted by the 2021-2022 floods. The aim of the program is to help as many Queenslanders as possible with the funding available. It includes several programs including:
● Resilient Retrofit program, provides funding to repair (enhance resilience) or retrofit homes.112 ● Home Raising program, provides funding to raise homes to reduce impacts of future flood events.113 ● Home Buy-Back program, the Voluntary Home Buy-Back provided funding to councils to buy-back homes at risk of severe and frequent flooding.114 ● Industry and community education program is an integral component of the RHF aimed at supporting homeowners to understand their flood risk and better understand what they can do to mitigate/reduce their risk.115 ● Demolish and rebuild or relocate, in limited circumstances, homeowner may be eligible for financial assistance to demolish and rebuild home or relocate an area of a home above the assessed flood level.116 | Outcomes: More than 6,500 homeowners registered for the Resilient Homes Fund, prior to registrations closing on 30 July 2023.117
In relation to the Voluntary Home Buy-Back (VHBB) program, as at end-August 2023:
● More than 610 offers were accepted for VHBB. ● More than 460 homes have now been settled for VHBB under the Resilient Homes Fund. ● Over 190 homes have been demolished or removed.
In relation to the Resilient Retrofit, Home Raising and Demolish and build or locate programs, as of mid-November 2023:
● Over 4,800 home assessment reports were issued.118 ● In August 2023, it was announced that up to 1,000 additional homeowners could now be eligible to access additional funding to raise their homes above flood level, where previously they had only been eligible und under the resilient retrofit option.119 ● Continued delivery of the Resilient Homes Fund, jointly funded (50:50) by the Queensland and Australian governments, with approximately 5,000 active registrations of interest received and more than 90% of home assessment completed.118
|
Fire and Disaster Recovery and Minister for Corrective Services
Minister for Housing, Local Government and Planning and Minister for Public Works | |||
Disaster management | Queensland’s disaster management arrangements are based on partnerships between the community and groups at the local, district, state and Commonwealth levels to deliver coordinated, cooperative and integrated outcomes. Each level within the arrangements is enabled by disaster management groups working collaboratively to deliver effective disaster management within Queensland.
Queensland State Disaster Management Plan (QSDMP)120 The QSDMP establishes the overarching state framework, arrangements and practices that enable current and future disaster management in Queensland. It includes guidance for disaster management stakeholders through the provision of commentary and directions to supporting documents such as plans, strategies, or guidelines. | Outcomes: Queensland State Disaster Management Plan (QSDMP)
● Warnings information is available across: Storm, flood and cyclone warnings, Weather and information warnings, Local Government disaster dashboards, Bushfire warnings and Extreme heatwave warnings.125 ● Plans are available including Local Disaster Management Plans and Resources, District Disaster Management Plans, State Disaster Management Plans and applicable National Plans.126
Queensland Recovery Plan
● The Queensland Recovery Plan describes the arrangements for transition from response to recovery - highlighting the roles and responsibilities of the State Recovery Policy and Planning Coordinator and the State Recovery Coordinator and the functional recovery groups - to assist disaster impacted communities achieve optimum recovery outcomes.
|
Minister for Fire and Disaster Recovery and Minister for Corrective Service
Minister for Fire and Disaster Recovery and Minister for Corrective Services
Minister for Police and Community Safety |
| December 2023 | Page | 25 |
| Policy response | Strategies and goals | Targets and outcomes | Responsible minister | |||
Queensland Recovery Plan121 The Queensland Recovery Plan, a sub-plan to the QSDMP, outlines recovery requirements for operations, planning and arrangements at the local, district and state level. It drives a collaborative and coordinated approach across all functions of recovery, all levels of government and the whole community and ensures recovery operations are appropriate to the scale of the disaster event.
Queensland Strategy for Disaster Resilience 2022-27 (QSDR) 122 The QSDR is a five-year strategy to strengthen disaster resilience in Queensland promotes a systems approach to resilience, connecting agencies and sectors to deliver improved resilience outcomes for Queensland.
Queensland Emergency Risk Management Framework (QERMF)123 Roles and responsibilities are outlined by the State Disaster Management Plan (SDMP), Queensland Fire and Emergency Services (QFES) is responsible for state- wide disaster risk assessments. Through the development and maturation of the QERMF, Queensland’s endorsed approach to disaster and emergency risk management, QFES seeks to uphold international best practice as championed by:
● The United Nations Office for Disaster Risk Reduction (UNISDR). ● The Global Facility for Disaster Reduction and Recovery (GFDRR). ● The Sendai Framework for Disaster Risk Reduction.
Tropical cyclones Preparedness124 The Queensland Fire and Emergency Service provides guidance to Queenslanders on how to prepare and act when a cyclone is imminent, when it strikes and what to do afterwards. | ● The Queensland Recovery Plan promotes the enhancement of resilience through recovery and provides information and guidance to stakeholders on the governance, planning and operational issues relating to disaster recovery for all hazards.
Queensland Strategy for Disaster Resilience 2022-27 (QSDR)
● As the state’s lead agency for disaster recovery, resilience, and mitigation policy, QRA developed and launched the QSDR. ● The QSDR aims to embed resilience activities into business as usual and mandates the need for collaboration across stakeholders to ensure the four objectives,19 strategic commitments and 52 actions are clearly outlined with agreed responsible lead agencies for delivery. ● QRA delivered the Queensland Government’s voluntary commitment under the United Nations Office for Disaster Risk Reduction Sendai Framework to establish Regional Resilience Strategies to ensure every region in Queensland is now part of a locally led, regionally coordinated and state facilitated blueprint to strengthen disaster resilience.127 ● The Regional Resilience Strategies are supported by detailed local resilience action plans for councils that guide implementation of resilience actions over time aligned with potential investment pathways.
Queensland Emergency Risk Management Framework (QERMF)
● In line with the Disaster Management Act 2003 (Qld), the Queensland Government makes available disaster management information. The Disaster Management website includes information around State level risk assessments, warnings, planning and education.128 ● State level hazard risk assessments are available, including the 2021-22 State Disaster Risk Report (SDRR) and the Severe Wind Hazard Assessment for Queensland (SWHA-Q) which were published in August 2022. A collaborative follow-on project from the SWHA-Q, the Severe Wind Hazard Assessment for South-East Queensland (SWHA-SEQ) was completed in partnership with six local governments in South-East Queensland, other Queensland Government departments and the insurance and research sector.129
Tropical cyclones Preparedness
● QFES has developed a Tropical Cyclones Preparedness Guide.130
| |||||
Disaster Recovery Funding Arrangements (DRFA) | In certain situations, the Queensland Government will enter into Disaster Recovery Funding Arrangements (DFRA)131 with the Commonwealth Government. The DRFA is joint Australian Government and State Government funding, providing financial assistance to help communities recover from eligible disasters.132 The Australian Government and Queensland Government funding split for the DRFA is:133
● Categories A and B – up to 75% Commonwealth and 25% State ● Category C – 50% Commonwealth and 50% State funding ● Category D – funding split is agreed to when the measure is approved.
| Outcomes:
● QRA has provided recovery guidance, assistance, and support to 57 local government areas activated under DRFA for the seven events that impacted the State in the 2022–23 disaster season136 ● QRA coordinated delivery of a disaster recovery and resilience program valued at $7.2 billion, comprising works from 32 disaster events across 2019–20 to 2022–23.137 ● The DRFA provides financial assistance to help communities recover from eligible disasters.138 |
Minister for Fire and Disaster Recovery and Minister for Corrective Services | |||
| December 2023 | Page | 26 |
| Policy response | Strategies and goals | Targets and outcomes | Responsible minister | |||
State funding for non-DRFA eligible disasters will continue to be administered under the State Disaster Relief Arrangements (SDRA), a wholly state funded program that may be activated for all hazards providing assistance to alleviate personal hardship and distress.134
The most recent exceptional circumstances package was established in relation to the 2022–23 Monsoon and Flooding events, which impacted 45 of Queensland’s 77 local government areas. This includes extraordinary recovery grants for primary producers, small business and not-for profit organisations, as well as local recovery and resilience grants for councils, and a community mental health package.135
QRA is tasked with administering the DRFA and other disaster resilience funding, as well as:
● managing and coordinating the Queensland Government’s program of infrastructure renewal and recovery within disaster-affected communities ● working with state and local government partners to deliver best practice administration of public reconstruction and resilience funds, ● and working collaboratively with key stakeholders to reduce risk and bolster disaster preparedness.
| ● The SDRA provides assistance to alleviate personal hardship and distress due to disasters.138
The $2.1 billion DRFA extraordinary assistance packages following the 2021–22 Rainfall and Flooding events continue to be delivered. In addition, the $31 million Flood Risk Management Package will contribute to the following outcomes:139
● improved critical baseline data and information to inform flood studies and risk assessments ● increased flood intelligence to be better able to prepare for and respond to flooding events ● community awareness of their flood risk and the information and services available to them to manage their risks ● availability of fit-for-purpose data, information, flood studies, risk assessments and management strategies, consistent with the Queensland Flood Risk Management Framework, to enable informed local decision making ● prioritised future investment in flood risk management. | |||||
Embedding adaptation and resilience into government operations | Examples of adaptation and resilience practices being embedded into government operations and infrastructure include: Qcoast2100 2.0:140
● This initiative assists coastal government councils understand the risks from coastal erosion, storm tide inundation and sea level rise from climate change, finalise development of their Coastal Hazard Adaptation Strategies and to commence implementation of works and actions recommended in the strategy.
Climate Change Risk Assessments for Infrastructure Projects
● Department of Transport and Main Roads has published guidance on undertaking climate change risk assessments on major infrastructure projects. These assessments allow for the inclusion of adaptation measures in design development.141
Regional Resilience Strategies
● Delivery of the Regional Resilience Strategies, ensuring every region across Queensland is part of a locally led and regionally coordinated blueprint to strengthen disaster resilience. The Regional Resilience Strategies are supported by detailed local resilience action plans for councils that guide implementation of resilience actions over time aligned with potential investment pathways.142
Get Ready Queensland
● Increased Queensland community awareness of disaster preparedness through the Get Ready Queensland campaign providing alerts and warnings,
|
Outcomes: QCoast2100: 30 of 77 councils145 are participating in the:
● development of Coastal Hazard Adaptation Strategies146 ● implementation of the Coastal Hazard Adaptation Strategies actions through on-ground works and activities146 ● development of First Nations Coastal Hazard Studies.147
Climate Change Risk Assessments for Infrastructure Projects
● Climate projections are used to identify hazards, or changes in hazards, that may affect an asset or organisation, and to identify the consequence and likelihood of that hazard or opportunity occurring. This aids network resilience by incorporating adaptive designs in project delivery.141
Regional Resilience Strategies
● Regional Resilience Strategies for 14 regions are available.148
Get Ready Queensland
● Tools and information to help people prepare for, act during and act after disasters is available.143
Queensland Climate Resilient Councils
● The program has developed a Climate Risk Management Framework for Queensland Local Government149 ● The program, provides a variety of resources to help consider climate risk within the Climate Risk Management Framework.150
|
Minister for the Environment and the Great Barrier Reef and Minister for Science and Innovation
Minister for Energy and Clean Economy Jobs
Minister for Transport and Main Roads and Minister for Digital Services
Minister for State Development and Infrastructure, Minster for Industrial Relations and Minister for Racing |
| December 2023 | Page | 27 |
| Policy response | Strategies and goals | Targets and outcomes | Responsible minister | |||
understanding of the risk and tools to help people prepare for, known what to do during and after disasters.143
Queensland Climate Resilient Councils
● The Queensland Climate Resilient Councils (Q CRC) program works with Queensland local governments to deliver services and products that will strengthen staff and leadership team skills and capacity to plan for and respond to the challenges and opportunities arising from climate change.144
| Minister for Fire and Disaster Recovery and Minister for Corrective Services | |||||
Tourism industry adaptation and resilience | The Department of Tourism and Sport is committed to driving sustainable growth of the tourism industry, recognising that climate change impacts, environmental degradation and consumer demands for environmental best practice are key risks to future growth and prosperity.
Through the Queensland Government’s Towards Tourism 2032: Transforming Queensland’s visitor economy tourism industry strategy the Queensland Government is:151
● supporting the development of a clear, sustainable and measurable pathway to net zero emissions for the tourism industry, being delivered through the Queensland Regional Tourism Network’s Queensland Tourism Climate Action Project. ● assisting more tourism businesses to be resilient to natural disasters, including delivering the $7 million Tourism Recovery and Resilience Package.
As part of the Tourism Recovery and Resilience Package, the Queensland Government is delivering an online platform to map tourism offerings in areas impacted by natural disaster events, with the aim of assessing natural disaster risk and identifying opportunities for tourism development to support future industry resilience.152
| Targets: Key priorities under Queensland’s Towards Tourism 2032: Transforming Queensland’s visitor economy tourism industry strategy include the delivery of:151
● a clear industry pathway towards net zero emissions. ● sustainable and regenerative tourism practices that support communities and value the contribution visitors make to their environment and lifestyle.
Outcomes:
● Commenced delivery of the Phase 1 Implementation Plan 2023-2025 to ‘build and focus’. 151 |
Minister for Tourism, and Sport | |||
Investing in climate change opportunities | ||||||
The Queensland Critical Minerals Strategy | Queensland has many of the world’s critical minerals (such as copper, cobalt and vanadium) essential for the technologies needed to transition energy systems and decarbonise local, national and global economies. Queensland’s critical minerals will be needed to build the wind and solar farms and batteries to deliver on Queensland’s target of 80 per cent renewable energy by 2035.
The Queensland Critical Minerals Strategy (QCMS) outlines the states’ ambition to transform the state, national and global economy through the responsible use of Queensland’s critical minerals, creating sustainable economic prosperity for Queensland.153 The QCMS has four key objectives:
● Move faster, smarter. ● Maximise investment. ● Build value chains. ● Foster research and environmental, social and governance (ESG) excellence.
| Targets:
● Work with community, First Nations peoples and industry to commence a coordinated place-based approach where projects are co-located in one regional area. Each zone will be unique, and government actions will be tailored according to geography, stakeholder priority and concerns, and the minerals targeted.153 ● Explore remaining mineralisation in mine waste for critical minerals by providing funding to assist companies to undertake drilling within tailings and waste-rock dumps and other activities on abandoned and operating mines sites. ● Review the regulatory framework to facilitate reprocessing opportunities in mine tailings and waste rock which hold substantial mineral deposits and value including critical minerals.
|
Minister For Resources and Critical Minerals | |||
| December 2023 | Page | 28 |
| Policy response | Strategies and goals | Targets and outcomes | Responsible minister | |||
● Profile and promote Queensland’s critical minerals by developing an investor- focused portal and working with the Australian Government.153 ● Work with Treasury to deliver the Critical Minerals and Battery Technology Fund to support businesses across the whole critical minerals supply chain, with a focus on enhancing the extraction and processing of critical minerals and accelerating the development of battery technologies and production of precursor or advanced materials in Queensland. ● ● Deliver $8 million to research and development in circular economy and mining.154 Outcomes:
● Rent reduction for exploration – the Queensland Government has reduced the rent for new and existing exploration permits for minerals to $0 for five years from 1 September 2023.153 ● | ||||||
North West Minerals Province (NWMP) | The NWMP, some 375,000 square kilometres of North West Queensland encompassing towns such as Mount Isa, Cloncurry and Julia Creek, contains one of the world’s richest deposits of critical minerals that are essential components for production of emerging technologies such as electric vehicles, renewable energy products, storage and low-emission power sources.155,156 | Outcomes:
● The Queensland Government has delivered a range of actions through the Blueprint and Strategy Implementation Plan 2019-2021 to further strengthen the North West Queensland region and its communities.157 ● The Queensland Government developed a support package for mine workers affected by the closure of Glencore’s Mount Isa Copper Operations and Lady Loretta Zinc Mine. The support package will include: ● Up to $30 million to accelerate development of resource projects in the North West Minerals Province. ● Up to $20 million, to be matched dollar-for-dollar by Glencore, for an economic structural adjustment package for Mount Isa and North West Queensland.158 |
Minister For Resources and Critical Minerals
Minister for State Development and Infrastructure, Minster for Industrial Relations and Minister for Racing | |||
Queensland Hydrogen Strategy | The Queensland Hydrogen Industry Strategy aims to support a low emissions economy and create growth opportunities for new export markets. The Queensland Renewable Energy and Hydrogen Jobs Fund will facilitate future production and supply of renewable hydrogen for both domestic and export markets.159
Introduction of new legislation - The Gas Supply and Other Legislation (Hydrogen Industry Development) Amendment Act 2023 (Qld) will mean Queensland’s construction, operation and safety management of hydrogen projects and other renewable gas pipelines are well established – turning the industry into a powerhouse of opportunity for jobs, climate, and export potential.160,161 | Targets: The Queensland Government is facilitating significant private sector investments in large scale hydrogen projects including:
● Supporting the Stanwell-Iwatani consortium to progress technical feasibility studies for the CQ-H2 renewable hydrogen export facility in Gladstone.162,163 ● Partnering with Fortescue Energy to deliver the Global Green Energy Manufacturing Centre near Gladstone. Fortescue Energy chose Gladstone, Queensland to establish Australia’s first multi-gigawatt-scale electrolyser factory, with an initial capacity of 2 gigawatts per annum.164 ● Supporting initiatives to facilitate private sector investment through the Hydrogen Industry Development Fund. The Fund is supporting renewable hydrogen technology projects in the transport sector and the integration of hydrogen production into wastewater treatment.165
Outcomes, include: |
Minister for State Development and Infrastructure, Minster for Industrial Relations and Minister for Racing
Minister for Energy and Clean Economy Jobs |
| December 2023 | Page | 29 |
| Policy response | Strategies and goals | Targets and outcomes | Responsible minister | |||
● Funding from the Queensland Government’s Hydrogen Industry Development Fund has been committed to the Hydrogen Park Gladstone project. The project will contribute to the state’s renewable energy targets.166 ● The Gas Supply and Other Legislation (Hydrogen Industry Development) Amendment Bill 2023 has been assented to.167,168 ● The Queensland Government has signed an MOU with the Port of Rotterdam to collaborate on a hydrogen export supply chain.169 | ||||||
Biofutures 10-year Roadmap and Action Plan | The Queensland Biofutures 10-Year Roadmap and Action Plan aims for Queensland to be an Asia-Pacific hub in biomanufacturing and biorefining, enabling global efforts to decarbonise and build diverse local industrial capabilities.170 | Outcomes include:171
● Signed a Memorandum of Understanding (MoU) with Qantas to collaborate on developing a sustainable aviation fuel (SAF) industry in Queensland. ● Signed a MoU with Ampol and ENEOS to investigate feedstock and using existing refinery infrastructure to generate up to 500 million litres of SAF and renewable diesel a year at Ampol’s Lytton site. ● Attracted Oceania Biofuels $500 million renewable diesel and SAF biorefinery to Gladstone. |
Minister for State Development and Infrastructure, Minster for Industrial Relations and Minister for Racing
Minister for Energy and Clean Economy Jobs | |||
Low Carbon Accelerator Program | Through the Low Carbon Accelerator Program, the Queensland Government works with entrepreneurs to accelerate the transition to a low carbon economy. | Outcomes:
● The 2022-23 program brought industry and government together to support entrepreneurs and innovators to develop market readiness of their low-carbon products and services. The projects address key decarbonisation challenges and support progress towards Queensland’s emissions reduction targets.172,173 ● Over a six-month period, the program worked with 22 companies delivering decarbonisation and low carbon solutions for Queensland.173 |
Minister for the Environment and the Great Barrier Reef and Minister for Science and Innovation | |||
Sustainable finance | Queensland Treasury Corporation (QTC) issues Green Bonds on behalf of the Queensland Government. QTC Green Bonds enable investors to support Queensland’s pathway to a climate resilient and an environmentally sustainable economy. The net proceeds of QTC’s Green Bonds may be notionally allocated against new, existing and ongoing eligible projects and assets that have an environmental benefit associated with the State of Queensland.174
QTC’s Green Bonds are issued in accordance with QTC’s Green Bond Framework, and either, the Climate Bonds Initiative (CBI) Climate Bonds Standard or the International Capital Market Association (ICMA) Green Bond Principles.174 | Outcomes
● QTC has an eligible project and asset pool of circa A$16.83 billion, of which circa A$10.55 billion of Green Bond proceeds have been allocated as at 31 May 2023.175 ● QTC issued A$3.0 billion of a new 2033 maturity CBI certified Green Bond on 2 March 2023. This bringing QTC’s total number of Green Bond lines on issue to five.174 |
Deputy Premier, Treasurer and Minister for Trade and Investment | |||
| December 2023 | Page | 30 |
Climate change - Risk management
Effective climate risk management enables the Queensland Government to continue to:
| ● | deliver services |
| ● | protect assets, staff and programs of work |
| ● | provide leadership, strategic direction and certainty |
| ● | support the growth of the economy into the future |
| ● | enable private industry to embed climate risk considerations into capital planning decisions. |
The Queensland Climate Action Plan 2020–2030 provides a framework and approach to reach net zero emissions by 2050 bringing together actions across departments and areas of Ministerial responsibility. The plan supports the management of key risks and opportunities by Cabinet through responsible Ministers and administering departments to support effective performance management consistent with the Queensland Government’s Performance Management Framework Policy.
Figure 10: Examples of support for climate action in government operations and private sector
| Integrating climate action into public and private sector decisions | Queensland Climate Action Plan 2020-2030 and Queensland Climate Adaptation Strategy
Sets out action on climate change:176
● Individuals: how to reduce emissions and consider climate risks in decision-making.
● Communities: how to collectively work to reduce emissions and protect the environment.
● Business and industry: support for businesses and industries to develop their own solutions that maximise growth and resilience in a changing world.
● Local government: how councils can plan for climate risks and build resilience.
● State Government: how government embeds climate risks in policies, regulations and procedures, and address risks to assets and services.
| |
| Enabling industry to make informed climate risk assessments through provision of regionalised climate data | Climate science resources The Queensland Government has invested in climate science and resources to provide free, up to date, regionalised climate data for private industry to make informed climate risk assessments. These include: ● regional climate change impact summaries177 ● map-based interface to climate projection data for Queensland178 ● hazard assessments, to provide a better understanding of potential impacts on population centres and elements of critical infrastructure in Queensland.179,180
| |
| Integrating climate risk management considerations into government operations | Examples of integration into government operations ● Queensland Climate Ready (QCR) program supports Queensland Government departments to better understand their climate risks, build their capacity to manage these risks, and embed climate risk management into current risk management practices.181 ● The Queensland State Planning Policy considers matters relating to climate change adaptation and emissions mitigation, including a state interest guideline for natural hazards, risk and resilience.182 ● Queensland Government is committed to strengthening disaster resilience, supporting communities to be better equipped to deal with the increasing prevalence of natural disasters. The Queensland Government has established 14 Regional Resilience Strategies. This program of work has been delivered as a commitment under the United Nations Office for Disaster Risk Reduction Sendai Framework.183 ● Climate Change Risk Assessments for Infrastructure Projects provides guidance to complement and support climate change risk assessments for Transport Infrastructure Projects.184
| |
| December 2023 | Page | 31 |
Climate change - Metrics and targets
Quality climate science and economic analyses are critical to support decision makers in their efforts to manage climate risk and identify emerging opportunities.
Effectiveness of key policies
To ensure the effectiveness of key policies in achieving emission reduction objectives, the government has set targets and milestones. Regular monitoring of these policies over time allows for an assessment of their progress. Reports on policy outcomes and advancements are available in the above Climate change - Policy response section.
Setting of targets
Figure 11: Key emissions and renewable energy targets
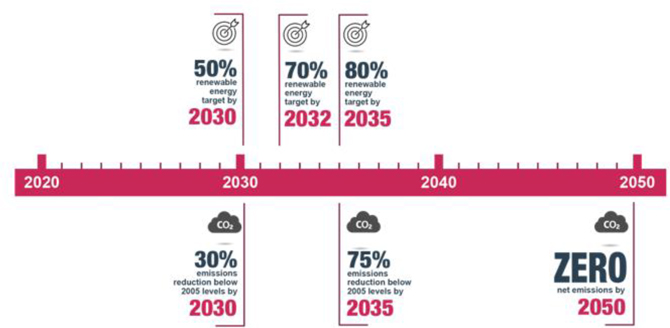
The Queensland Government has set emissions reduction and renewable energy targets with the objectives of achieving net zero emissions and decarbonising the energy sector.
Emissions reduction monitoring
The Department of Energy and Climate reports progress on the emissions reduction targets on the Queensland Climate Action Plan 2020–2030 website.185
The Queensland Government assesses progress on its targets using the State and Territory Greenhouse Gas Inventories prepared by the Australian Government. National and state/territory inventory data is publicly available from Australia’s National Greenhouse Inventory.186
Renewable energy monitoring
The Department of Energy and Climate reports progress on the renewable energy targets on its website.187
Queensland’s renewable energy percentage is calculated from data provided by Australian Energy Market Operator (AEMO), supplemented by DHLGPPW estimates for generators where AEMO data is not available (typically smaller generators below 30MW in capacity). The renewable energy percentage is calculated as the ratio of renewable generation to consumption.
| December 2023 | Page | 32 |
Natural capital
Natural capital is the stock of the earth’s renewable and non-renewable resources, including trees, soils, air, water, minerals, and all living things that provide ecosystem services. The State of Queensland has a range of natural capital assets, comprising of metal and mineral resources, agricultural land, clean and secure water supplies, rich biodiversity and globally recognised protected areas, including World Heritage Areas such as K’gari (Fraser Island), the Wet Tropics of Queensland, the Gondwana Rainforests of Australia, the Australian Fossil Mammal Sites – Riversleigh section and the Great Barrier Reef.
The Queensland Government has responsibility for the effective management of the state’s natural resources. In doing so, it seeks to balance resource utilisation between industry, community use and safeguarding the integrity of the natural environment for future generations.
The Queensland Government manages nature related risks at both a whole-of-state level and at an organisational level by establishing structures and regulating interactions of stakeholders with ecosystems. This considers key elements including water management, biosecurity, aquaculture, forestry management and environmental protection.188
Natural capital - Management
The management of natural capital is undertaken by Cabinet with the support of key departments led by responsible Ministers as set out in Figure 7: Queensland’s environmental management.
The Queensland Treasurer and the Minister for Environment and the Great Barrier Reef and Minister for Science and Innovation jointly manage the Queensland Government’s Land Restoration Fund (LRF). The LRF supports landholders, farmers and First Nations peoples to generate new, regular income streams through carbon farming projects whilst providing valuable co-benefits such as healthier waterways, increased habitat for threatened species, and more resilient landscapes.
Natural capital - Strategy
Queensland’s natural assets, including biodiversity and the health of ecosystems, can affect the productivity and fertility of land, rivers and oceans. Adverse changes to ecosystem services may impact agriculture, tourism and many other industries. The Queensland Government is aware of systemic risks embedded within natural capital that may have cascading or amplifying impacts through supply chains and resource availability, business operations and regulatory environments.189
Protecting Queensland’s natural environment in a way that complements economic development is a priority. The state actively leverages its natural capital assets to develop new industries, such as the liquefied natural gas (LNG) export supply chain, critical minerals and bio-futures.
The government’s approach to natural capital management is focused on protecting and conserving the state’s biodiversity values, addressing the decline in threatened species, and connecting people and nature in economic, social and environmental contexts. The Queensland Government manages its assets and ecosystems, through the implementation of policies to mitigate risks to natural capital and ecosystem loss. These policies focus on creating positive outcomes by reducing human impacts on nature and/or contributing to its restoration.190
The Queensland Government manages Queensland’s natural capital based on the key elements as set out in Figure 12.
| December 2023 | Page | 33 |
Figure 12: Queensland’s natural capital – key elements
| Element | Example | Overview and objectives | ||
| Land |
Forests, urban, mining and agricultural lands and the impacts of land- use changes on the quality of land-based ecosystems
|
● The Queensland Government regulates land use to achieve sustainable economic prosperity while also helping to protect our environment.191 ● The Queensland Government’s land management objective is to manage native vegetation to achieve sustainable outcomes for land use and the environment whilst ensuring environmental and cultural values are considered and protected.191 | ||
| Freshwater | Fresh aquifers and surface water management |
● Surface water dominates Queensland’s water supply sources, with groundwater playing an important role for inland areas of the state. Access to fresh water relies heavily on rainfall which is highly seasonal and varies considerably year to year.192 ● Underpinned by science and community consultation, water plans have been developed for major catchment regions to meet cultural, social, economic and environmental outcomes.193
| ||
| Ocean | Estuaries and marine ecosystems |
● Marine ecosystems support much of the state’s native biodiversity, including migratory birds, dugongs, dolphins, turtles and fish.194 ● Overall, sediment, nutrients and pesticides are the major catchment pressures that broadly impact Queensland estuaries and are targeted by key measures and included in water quality reporting.194
| ||
| Atmosphere | Air quality |
● The main sources of air pollutants in Queensland are transport and industrial activities, with rural and domestic activities also considered contributors.195 ● Planning schemes are significant drivers of air-quality management by establishing the location and nature of major infrastructure, setting up goals and processes to guide development decisions, promotion of public transport, walking and cycling and the use of low emission vehicles.195
| ||
An outline of significant natural capital initiatives being implemented by the Queensland Government is provided in the Natural capital - Policy response.
| December 2023 | Page | 34 |
Natural capital - Policy response
Below is a summary of Queensland Government policies that support the management of natural capital risks and opportunities.
| Policy response | Strategies and goals | Targets and outcomes | Responsible minister | |||
Managing the state’s natural capital | ||||||
Queensland’s biodiversity conservation strategy | Conserving Nature—a Biodiversity Conservation Strategy for Queensland (the Strategy) sets out Queensland Government’s commitment to conserving biodiversity and its values.196 The Strategy seeks to address the current and future economic, social and environmental risks posed by biodiversity decline and degradation of Queensland’s natural capital and ecosystem services. It establishes a high-level vision, outcomes, goals, objectives and principles to guide implementation. The goals of the Strategy are:
● Queensland’s biodiversity is protected and well-managed.
● Queensland’s biodiversity is restored and rehabilitated to reinstate ecosystem function and recover species populations.
● Queensland’s biodiversity is supported to adapt to changing environments. ● People value biodiversity, including its contribution to their wellbeing, and are motivated to protect it.
Each goal is supported by objectives. A set of six guiding principles set out to underpin all biodiversity conservation activities.
| Targets:
Published in October 2022, the strategy is a living document that can be updated with new policies, actions, initiatives and investment approaches as they are developed across government. The strategy is an overarching framework for biodiversity conservation, with its outcomes linked to existing programs and initiatives across Government and includes:
● Queensland’s Protected Area Strategy 2020-2030197
● Land Restoration Fund198
● Threatened Species Program199
● Biodiversity and Ecosystems Climate Adaptation Plan.
See Appendix A: Datasets for metrics. |
Minister for the Environment and the Great Barrier Reef and Minister for Science and Innovation | |||
Queensland’s Protected Area Strategy 2020–2030 |
Establishes the overarching framework, strategic direction and actions to further enhance Queensland’s terrestrial protected areas, both public and private, and the natural habitats and ecosystems they support.200
Strategic priorities are:
● Expanding Queensland’s protected area system to safeguard biodiversity and cultural values, protect threatened species, and build climate change resilience while creating economic benefits.
● Managing protected areas in partnership with First Nations peoples, landholders and other land managers to deliver global best practice in conserving natural and cultural values.
Ensuring Queenslanders are aware of and appreciate the state’s protected areas and support investment in their expansion and management to conserve natural and cultural values.
Queensland’s protected area system is made up of:
● 69% public protected areas (national parks, conservation parks and resources reserves)
● 31% private protected areas (special wildlife reserves and nature refuges), forming the largest private protected area network in Australia.
● As at 1 August 2023, Queensland’s terrestrial protected area system covered more than 14.5 million hectares (8.38% of Queensland’s total land area).205 |
Targets:
The Strategy has defined progress measures that are reported against. This is undertaken via annual report cards.202
Outcomes:
In 2023, the Department of Environment, Science and Innovation acquired a number of land parcels that will expand the protected area estate and protect important habitat for threatened species. These include:
● The 3,500 hectare Long Island grazing lease in Broad Sound, which will protect a known rookery for the vulnerable flatback turtle.203
● The 4.2 hectare St Bees Island lease, which will consolidate the South Cumberland Islands National Park.203
● The 2,800 hectare grazing lease over Powrunna State Forest, which will enable the establishment of a third population of the critically endangered northern hairy-nosed wombat.204
● Around 8,000 hectares of Pretty Plains Station, which adjoins a 2022 land acquisition, The Lakes.205
● A 250 hectare addition to Lockyer National Park, which will expand the protection of koala conservation lands.205
Other initiatives to protect Country with First Nations peoples include: �� ● Over 200 Indigenous Land and Sea Rangers across 37 communities.206 |
Minister for the Environment and the Great Barrier Reef and Minister for Science and Innovation | |||
| December 2023 | Page | 35 |
| Policy response | Strategies and goals | Targets and outcomes | Responsible minister | |||
● On Cape York Peninsula, more than 2.65 million hectares of land is jointly managed in partnership with First Nations peoples. Across Queensland this increases to over 2.76 million hectares when including national park (Aboriginal land) and Indigenous Joint Management Areas.201
| ● Supporting First Nations organisations to deliver outcomes for Country through the annual Looking after Country Grant Program.207 | |||||
Regulatory Strategy 2022–2027, Queensland’s Environmental Regulator | The Regulatory Strategy 2022–2027 Queensland’s Environmental Regulator (the Strategy) sets out the environmental regulator’s vision for the delivery of its regulatory functions and activities to safeguard the state’s environment, its coasts and built heritage.208
The Strategy applies to DES’s regulated activities under the following Acts:
● Environmental Offsets Act 2014 (Qld)
· Environmental Protection Act 1994 (Qld)
· Queensland Heritage Act 1992 (Qld)
● Planning Act 2016 (Qld)
· Waste Reduction and Recycling Act 2011 (Qld)
● Water Act 2000 (Qld) (Chapter 3)
· Wet Tropics World Heritage Protection and Management Act 1993 (Qld)
· Coastal Protection and Management Act 1995 (Qld)
|
Target:
The Strategy outlines key target and actions to be delivered over five years for six focus areas. The Strategy for 2022–2027 is structured around six key focus areas:
1. Regulate proportionate to risk
2. Assessment processes
3. Targeted compliance
4. Customer focus
5. Partnership, science and innovation
6. Communication and engagement.
The Strategy includes a commitment to annually report on progress to drive continuous improvement. A Progress Report for 2023 is available.209 |
Minister for the Environment and the Great Barrier Reef and Minister for Science and Innovation
Minister for Housing, Local Government and Planning and Minister for Public Works | |||
Biosecurity Management | The Queensland Biosecurity Strategy 2018–2023 (the Strategy)210
The plan focuses on:
● proactive and reactive monitoring of pests, diseases and weeds so that they can be dealt with quickly.
● being prepared with systems and trained people to deal with threats.
● developing tools to manage the impact of invasive species, such as weeds and animals that may damage the environment or make life difficult for people.
● preventing outbreaks through effective border controls and property management.
|
Targets:
● Implementing the Saving Queensland’s Threatened Species Program. 211 212
Outcomes:
● Several bio-security programs are in place to manage key risks. The full list is available from the Department of Agriculture and Fisheries (DAF).213 |
Minister for Agricultural Industry Development and Fisheries and Minister for Rural Communities | |||
Coordinator-General | The Coordinator-General administers the State Development and Public Works Organisation Act 1971 (Qld) (SDPWO Act).
Functions utilised in the SDPWO Act pertaining to managing natural capital are:
● coordination of project declaration and environmental assessment
● administration of the planning and development of State Development Areas
● facilitation of land acquisitions for large scale infrastructure projects
● Part 4 of the SDPWO Act specifically relates to the Coordinator-General’s environmental impact statement (EIS) or impact assessment report (IAR) process. The EIS and IAR processes require assessment and development of management strategies for the potential impacts (positive and negative) of major and/or complex projects on the natural, social and economic environment. The act also outlines how the EIS process considers matters of national environmental significance, in accordance with Commonwealth |
Outcomes:
With regard to coordinated projects (Part 4, SDPWO Act), the Coordinator-General evaluates the EIS or IAR and sets conditions for proponents to mitigate negative impacts, and enhance benefits, on the natural, social and economic environment.
Coordinated project outcomes pertaining to natural capital values have recently included strategies and proponent requirements for land / aquatic /marine biodiversity protection, land-based offsets, water quality protection, rehabilitation, water resource allocation, species protection, protection of cultural heritage values etc.215 |
Minister for State Development and Infrastructure, Minister for Industrial Relations and Minister for Racing | |||
| December 2023 | Page | 36 |
| Policy response | Strategies and goals | Targets and outcomes | Responsible minister | |||
legislation. Projects undergoing the EIS or IAR process are known as coordinated projects.214
| ||||||
State development areas (SDA) are areas of land established by the Coordinator- General for industry, infrastructure corridors and major public works to promote industrial development opportunities in Queensland. Concentration of industrial development in selected areas, thereby minimising or avoiding:215
| ||||||
● environmental impacts | ||||||
● loss of amenity | ||||||
● infrastructure duplications | ||||||
● transport conflicts.
| ||||||
World Heritage | The State of Queensland is home to five of Australia’s 20 World Heritage Areas, and the Queensland Government is committed to managing these areas to maintain the Outstanding Universal Value for which each property is listed.216
Queensland’s First Nations World Heritage Strategy demonstrates how the Queensland Government is responding to and empowering First Nations peoples and local communities to better protect, manage, present and maintain the irreplaceable values of World Heritage areas.217 | Targets:
The Queensland Government has allocated $200,000 to four Traditional Owners organisations in Cape York to progress cultural heritage assessments for their Country, which may contribute to a future National or World Heritage nomination if they wish to do so.218
Outcomes:
Advisory committees for World Heritage areas provide advice to management agencies and State Government and Australian Government Ministers responsible for World Heritage on matters relating to the identification, protection, conservation, presentation and transmission to future generations, of the cultural and natural heritage.
Advisory committees have been established for:
● K’gari (Fraser Island)
● Australian Fossil Mammal Sites – Riversleigh Section
● Gondwana Rainforests of Australia – Queensland Section.
|
Minister for the Environment and the Great Barrier Reef and Minister for Science and Innovation | |||
Managing Natural Capital – Land | ||||||
Vegetation Management | Native vegetation is critical for maintaining biodiversity, preventing land degradation and reducing Queensland’s carbon emissions.219
Clearing in the State of Queensland is regulated through the vegetation management framework. It applies to most land tenures, including freehold land, Indigenous land, leasehold land and occupational licences under the Land Act 1994 (Qld) as well as the Vegetation Management and Other Legislation Amendment Bill 2018 (Qld).220
The government’s vegetation clearing laws allow landholders to undertake a range of activities to deal with the threat or aftermath of a bushfire. The Clearing for Bushfire Management Guide explains the approval and notification requirements under vegetation and planning legislation.
| Outcomes:
● The Queensland Government has set requirements regarding the clearing vegetation; monitors clearing and ensure people comply with the laws.220 ● The 2020-21 annual Statewide Landcover and Trees Study (SLATS) reporting shows overall clearing in 2019-20 has fallen nearly 49 per cent since 2018-19 with the majority of clearing in areas not generally regulated by the Vegetation Management Act 1999 (Qld). Clearing of regulated vegetation has reduced by 70% from 2018-19 to 2020-21.221
See Appendix A: Datasets for metrics. |
Minister for Resources and Critical Minerals | |||
| December 2023 | Page | 37 |
| Policy response | Strategies and goals | Targets and outcomes | Responsible minister | |||
Native Forestry Policy | State-owned native timber
The government’s native forestry policy supports a sustainable future that balances jobs and conservation. | Outcomes:
State-owned native timber State-owned native timber production will end in the SEQ Regional Plan area on 31 December 2024.
Timber production the Eastern hardwoods region
State-owned native timber production will continue in the Eastern hardwoods region until at least 31 December 2026.222
|
Minister for Agricultural Industry Development and Fisheries and Minister for Rural Communities | |||
Sustainable Agriculture | The government provides an information service to assist proponents of private sector agricultural projects.223
This includes information on:
● Managing an agriculture business
● Drought and natural disasters
● Livestock and animals
● Crops and horticulture
● Sustainability and environment
● Research, development and extension
● Initiatives, programs and campaigns
|
Outcomes:
Examples of this assistance include:
● Land management: A variety of information is available about land management practices in Queensland, including managing weeds, moving equipment, using chemicals and wildlife and conservation issues. This includes best practise guides and grants funding.224
● Queensland agricultural land audit: This identifies land important to current and future production and the constraints to development.225
See Appendix A: Datasets for metrics.
|
Minister for Agricultural Industry Development and Fisheries and Minister for Rural Communities | |||
Queensland Resources Industry Development Plan | The Queensland Resources Industry Development Plan (QRIDP) outlines how government and industry can work together to address and respond to key global emerging trends.
The QRIDP sets a path for a resilient, responsible and sustainable Queensland resources industry that grows as it transforms over the next 30 years. The six key focus area for government and industry are:
● Grow and diversify the industry.
● Strengthen environmental, social and governance credentials and protect the environment.
● Foster coexistence and sustainable communities.
● Ensure strong and genuine First Nations partnerships.
● Build a safe and resilient future workforce.
● Improve regulatory efficiency.
Focus areas contain 43 actions to be undertaken over the short and medium term.226 | Targets:
● Deliver the 43 QRIDP actions to enable the development of a resilient, responsible and sustainable Queensland resources industry that grows as it transforms.226
Outcomes:
● Since the launch of QRIDP in June 2022, progress has continued against the 43 actions, including:
Completed actions, including:
● establishment of the Ministerial QRIDP Advisory Group
● implementing promotion strategies for Queensland’s critical minerals
● completion of the re-commercialising abandoned mine pilot program
● implementing the rent deferral for critical minerals project
● delivering common user infrastructure guidance
● completing the Bowen Basin pipeline study ● publishing principles for coexistence in the Land Access Code
● delivering the mapping layer to better support coexistence
● allowing the use of steel casing in horizontal wells.
In progress, including:
● 31 actions remain in progress.
● Three actions will be delivered through the Queensland Critical Minerals Strategy, being the establishment of a Queensland Resources Industry ESG |
Minister for Resources and Critical Minerals | |||
| December 2023 | Page | 38 |
| Policy response | Strategies and goals | Targets and outcomes | Responsible minister | |||
Expert Advisory Panel, embedding Queensland’s ESG competitive advantage and critical mineral regulatory sandbox.227
| ||||||
Natural Resources Recovery Program (NRRP) | The NRRP has up to $10 million in funding available per year to eligible Queensland- based natural resource management organisations to promote sustainable outcomes and innovation for land and vegetation resources.228
The program invests in projects that support:
● improved landscape resilience and the ability of our natural resources to respond to natural disasters and climate change
● support stakeholder adoption of sustainable practice management to drive regional economies
● improve monitoring and evaluation to understand the state of our natural resources. | Targets:
Approved projects are required to deliver outcomes under one of the following priorities:
Soil and Land:
● Improved soil health and land condition.
Vegetation:
● Improved condition and extent of native vegetation (woody and non-woody).
Education Facilitation and Collaboration:
● Increased capacity (skills and knowledge) to drive ongoing change. ● Beneficial, efficient, highly valued and enduring Regional NRM Partnerships.
First Nations People:
● Valued and enduring partnerships built with Traditional Custodians/ Owners.
Informed Decision Making:
● Effective interventions and utilisation of data to drive decision making and innovation.
Outcomes:
● $14.3 million has been allocated to 31 projects across the 2022-2023 and 2023- 2024 financial years focused on delivering these priorities.229
|
Minister for Resources and Critical Minerals | |||
Mine site development, management and rehabilitation | The government has an established process to manage the use of land for mining.
This includes:
● Environmental Authority (EA): All resource activities (which includes coal and mineral mining, petroleum and gas, geothermal and greenhouse gas storage activities) must have a specific type of licence called an Environmental Authority (EA) which is required under the Environmental Protection Act 1994 (Qld).
● Mining authorities and permits: The process for the approval of resource authorities and permits considers: Financial and technical capability, Development plans and work programs, Environmental requirements, Native title, regional interests development approval, Eligibility, Financial security and Rents and royalties.
● Reports and notices: Holders of permits, licenses or leases must provide information about their activities and meet their reporting obligations under |
Outcomes:
● Information on current and approved applications for EAs is reported through the Environmental Protection Act 1994 (Qld) Public Register.230
● Queensland Government applies rigorous assessment process for resource projects which ensures the state’s mineral and energy resources are explored for and developed in the public interest. The assessment process is proportionate to environmental risk.231
● Risk and Prioritisation Framework for Abandoned Mine Management and Remediation: the framework supports the Abandoned Mines Management Policy to undertake prioritised works to make abandoned mines safe, secure, durable, and productive.232
● Progressive rehabilitation and closure of mined land.233,234
● The Office of the Queensland Mine Rehabilitation Commissioner has been in place since October 2021 and publishes research and annual reports about mine rehabilitation.235 |
Minister for the Environment and the Great Barrier Reef and Minister for Science and Innovation
Minister for Resources and Critical Minerals | |||
| December 2023 | Page | 39 |
| Policy response | Strategies and goals | Targets and outcomes | Responsible minister | |||
Queensland resources legislation and the Environmental Protection Act 1994 (Qld).
● Legislation and policies: Both the Department of Environment, Science and Innovation and the Department of Resources has developed a series of guidelines to assist existing and prospective resource authority holders understand the legislation around resources issues and the responsibilities of a resource authority holder under the Environmental Protection Act 1994 (Qld) and the relevant resource legislation.
● Safety and health management and reporting requirements: The government requires that holders of Authorities and Permits meet set safety standards and expectations. These include accident and incident reporting, legislated operational safety requirements, required work competencies, certificates and rehabilitation. The government has undertaken an extensive review to improve the rehabilitation and financial assurance outcomes in the resources sector. | ● The Financial Provisioning Scheme was established to improve the state’s management of its financial risk in the event holders of a resource activity EA (holders) or small-scale mining tenure (SSMT) fail to comply with their environmental management and rehabilitation obligations. Over time, the scheme will also provide funds to support rehabilitation of abandoned mines and expand research into mine rehabilitation.236 | |||||
Managing Natural Capital – Freshwater | ||||||
Water Management | The Department of Regional Development, Manufacturing and Water (RDMW)237 focuses on the sustainable management of water resources, focused on:
● water planning that balances the needs of water users and the environment
● ensuring the people of Queensland have access to safe and reliable drinking water and recycled water supplies
● improving water security for both drinking and non-drinking purposes.
● facilitating efficient water markets to stimulate economic development in regional communities
● ensuring the safety of dam infrastructure and downstream people and property
● enabling fairness, transparency and accountability of water systems through high-quality data collection and visibility (WaTERS - Water Tracking and Electronic Reporting System).
|
Outcomes:
● Percentage of the state’s drinking water service providers compliant with drinking water regulatory requirements, Actual: 98% (Target: 90%).238
● The Water Tracking and Electronic Reporting System (WaTERS) has been developed to improve the tracking of regulated activities in Queensland that involve water releases to the environment.239 |
Minister for Regional Development and Manufacturing and Minister for Water | |||
Queensland Water Strategy | The Queensland Water Strategy highlights the collective effort and initiatives that communities, government and industry are undertaking to achieve the strategy vision – Sustainable and secure water resources are central to Queensland’s economic transformation and the legacy we pass onto future generations.240
The strategy encourages collective action towards long-term water security and efficient use of water to our future sustainability. | Targets:
The Queensland Water Strategy sets out priorities and several delivery focus areas, these include:240
● Healthy waterways, rivers, aquifers and sustainable water management: Respond swiftly to climate change, using the best available science to maximise our water resources and sustain healthy, more resilient catchments.
● First Nations partnerships, access and ownership: Partner with First Nations peoples and develop sustainable practices that build on traditional wisdom and provide opportunities for social and economic development.
● Water for regional economic prosperity: Build state water infrastructure to boost established industries and jobs underpinned by long-term water security.
● Safe and secure water supply: Ensure every community across Queensland has safe and secure water, alongside support for boosting resilience and contingency plans even in times of severe drought or floods.
|
Minister for Regional Development and Manufacturing and Minister for Water | |||
| December 2023 | Page | 40 |
| Policy response | Strategies and goals | Targets and outcomes | Responsible minister | |||
Water conservation and security | Investment has been made to ensure future water security through a program of initiatives in recycling, desalination and large-scale interconnection of the pipeline networks across South-East Queensland following the 1996–2010 drought. The Water Act 2000 (Qld) prescribes the framework to provide long-term water security for South East Queensland.
The Queensland Government collaborate widely across the water sector, with peoples and communities and other levels of government to define and manage current and future water resource risks and explore, implement, and communicate the broad range of innovations and actions to respond to climate change and adapt to future climate realities.241 |
Targets:
● The Department of Regional Development, Manufacturing and Water provides a framework to provide long-term water security for South East Queensland (SEQ), as prescribed in the Water Act 2000 (Qld). The framework sets the desired level of service (LOS) objectives for water security in the SEQ region. 242
● The Department of Regional Development, Manufacturing and Water works in partnership with local councils to develop and publish Regional Water Supply Security Assessments that identify long-term water security risk for individual communities.243
● First Nations Water Strategy: Mid 2024 Publish a listening report. Mid 2025 – Develop draft strategy and publish a discussion paper. Mid 2026 Implementation of strategy.244
Outcomes:
● In 2022–23, Regional Water Supply Security Assessments were advanced for Goondiwindi and Dawson River communities (including Banana, Baralaba, Moura and Theodore), with publication expected in 2023–24. And assessments were progressed for Biloela, Dalby and Cassowary Coast communities. 243
● Queensland has 3 fully accredited Murray-Darling Basin water resource plans. These are Condamine and Balonne (accredited September 2019), Border Rivers and Moonie (accredited September 2019) & Warrego, Paroo and Nebine (accredited June 2017).245
See Appendix A: Datasets for metrics.
|
Minister for Regional Development and Manufacturing and Minister for Water | |||
Water Plan Areas | Queensland Government has established Water Plans, which set out how water is managed in a defined water plan area. The plans are tailored for each area to balance the needs of water users (e.g. towns, agriculture and other industries) and the environment.246
All water plans include unallocated water reserves which can be made available for future use without compromising the security of existing users or the environmental values within a catchment.
These reserves include Indigenous water reserves held for projects that advance the social and economic aspirations of Aboriginal peoples and Torres Strait Islanders. The development process generally includes the following stages:247
1. technical assessments (environmental, economic, social, hydrologic and cultural data)
2. preliminary stakeholder consultation
3. preparation of a draft water plan
4. publication of draft plan and opportunity for public submissions
5. consideration of submissions |
Outcome:
● Water Plans seek to achieve a balance between economic, social, cultural, and environmental value. There are 23 water plan areas. These include the Fitzroy Basin and the Great Artesian Basin and other regional aquifers water plan.248 |
Minister for Regional Development and Manufacturing and Minister for Water | |||
| December 2023 | Page | 41 |
| Policy response | Strategies and goals | Targets and outcomes | Responsible minister | |||
6. finalisation and approval of water plan. | ||||||
Managing Natural Capital – Oceans | ||||||
Protecting and managing the Great Barrier Reef | The Reef 2050 Long-Term Sustainability Plan is the Australian and Queensland Government’s overarching framework for protecting and managing the Great Barrier Reef. Under this plan are several initiatives including:249,250
● the Sustainable Ports Development Act 2015 (Qld) to reduce the impacts of port development
● the Reef 2050 Wetlands Strategy
● the Queensland Sustainable Fisheries Strategy 2017–2027.
● the Reef 2050 Traditional Owner Implementation Plan.
In response to the recommendations in the Report on the Reactive Monitoring Mission to the Great Barrier Reef (Australia) 2022251, the Queensland and Australian Governments have committed over $160 million to significantly reduce net fishing and other high risk fishing activities impacting the Reef. This includes ensuring the Great Barrier Reef is gillnet free by mid-2027.252
The Queensland Government continues to implement the Reef 2050 Water Quality Improvement Plan 2017–2022 (WQIP) which identifies how the water quality outcome under the Reef 2050 Long-Term Sustainability Plan will be delivered. The Queensland Government has committed $289.6 million to continue the Queensland Reef Water Quality Program to 2025-2026, which delivers on WQIP outcomes and funds a range of water quality improvement projects working with industry, agricultural producers, communities and Traditional Owners.253,254
|
Outcomes: 255
● The Reef Water Quality Report Card measures progress towards the Reef 2050 Water Quality Improvement Plan objectives and targets.256
● Inshore marine conditions were improved on the previous year and rated C.257,d
● Freshwater wetland conditions held steady and were rated C (Based on Department of Environment and Science data from field assessments of wetlands and satellite imagery analysis, on a scale of A to E).258
● 2.2% reduction in dissolved inorganic nitrogen across the Great Barrier Reef catchment.259
● 0.6% reduction in fine sediment across the Great Barrier Reef catchment.260
See Appendix A: Datasets for metrics. |
Minister for the Environment and the Great Barrier Reef and Minister for Science and Innovation
Minister for Transport and Main Roads and Minister for Digital Services | |||
Fisheries Management | The Queensland Sustainable Fisheries Strategy 2017–2027261 (QSFS) sets out the government’s reform agenda over 10 years.
The Strategy sets out clear targets to be achieved by 2020 and 2027 and a range of actions to deliver on the vision and targets. There are 33 actions across ten reform areas. | Targets:
The QSFS has set several targets to establish sustainable catch limits based on achieving maximum economic yield for all Queensland fisheries and demonstrate that no Queensland fisheries are overfished.261
By 2027, Queensland aims to have:261
● set sustainable catch limits based on achieving maximum economic yield for all Queensland fisheries (around 60% biomass)
● identified that no Queensland fisheries are overfished
● increased certainty for commercial operators
● reduced the volume of fisheries regulation
● improved trends of compliance rates
● implemented a responsive and consultative approach to fisheries management.
Outcomes:
The QSFS – Annual progress reports set out the progress related to the strategy. 262
|
Minister for Agricultural Industry Development and Fisheries and Minister for Rural Communities | |||
d Based on data from the Australian Institute of Marine Science (AIMS) coral monitoring, James Cook University (JCU) seagrass field surveys, and eReefs (CSIRO) water quality modelling. Report Card methodology is available https://www.reefplan.qld.gov.au/tracking-progress/reef-report-card/methods-to-create-report-card.
| December 2023 | Page | 42 |
| Policy response | Strategies and goals | Targets and outcomes | Responsible minister | |||
The most recent annual progress report is the Sustainable Fisheries Strategy progress report—year 6. It sets out the 29 delivered actions of a total of 33.263
| ||||||
Managing Natural Capital – Air | ||||||
Air Quality Protection | At the state level, the Environmental Protection Act 1994 (Qld) and the Environmental Protection Regulation 2019 (Qld) establish a list of industrial activities (called environmentally-relevant activities—ERAs) that must have a current development approval or environmental authority.
To prevent or minimise environmental harm, a person carrying out an activity must take all reasonable and practicable steps to ensure that best practices in environmental management are used. Conditions of approval may include:
● limits on emissions of air pollutants
● requirements to monitor emissions or ambient air quality.
The Environmental Protection (Air) Policy 2019 (Qld) sets air quality objectives for the state. The policy sets the targets for particulate matter 2.5 and 10, particles which result from pollution, smoke, dust and haze and can negatively impact human health. | Outcomes:
The Queensland Department of Environment, Science and Innovation (DES) in collaboration with industry partners operates an air quality monitoring network across the state.
Data from the monitoring network is presented online as ambient concentration, air quality categories and smoke and dust health action levels which are updated hourly.264
Health action levels are recommendations that have been developed by Queensland Health to support and inform the community on what actions to take to protect their health during a smoke event.265
In response to local air quality issues, DES occasionally conducts short-term ambient air monitoring investigations to determine if air quality near emission sources is acceptable. Information on these sites is available online.266
See Appendix A: Datasets for metrics.
|
Minister for the Environment and the Great Barrier Reef and Minister for Science and Innovation | |||
Investing in Natural Capital opportunities - Land | ||||||
Land Restoration Fund (Carbon farming) | The Land Restoration Fund (LRF) is a Queensland Government initiative investing in carbon farming projects that support landholders, farmers and First Nations peoples to generate new, regular income streams through the production of carbon credits through carbon farming projects whilst providing valuable co-benefits for Queensland such as healthier waterways, increased habitat for threatened species, and more resilient landscapes.
The fund has two main purposes:
● invest in carbon farming projects that deliver additional co-benefits
● broaden the scope of carbon farming in Queensland with investments in research, development and innovation.
The LRF:
● has established a Co-benefits Standard that specifies how co-benefits generated from a carbon project are to be measured, reported and verified for the purposes of the LRF.267
● is expanding carbon farming in the state by investing in land-sector projects that produce Australian Carbon Credit Units (ACCUs) as well as additional co- benefits for the environment, regional economies and First Nations people.268,269 | Outcomes (aggregated from the Land Restoration Fund Register and Investment Rounds Report):270
Investment Round 1
● 13 contracted carbon farming projects
● An average of 7 co-benefit types contracted for delivery by each project.
Investment Round 2
● 8 contracted carbon farming projects
● An average of 6 co-benefit types contracted for delivery by each project.
Investment Round 3 - 2023
● Investment Round 3 launched in April 2023 offering up to $50 million (maximum $10 million per project) to the market.271 Successful applications will be offered contracts during the 2023-24 financial year. ● Investment Round 3 is prioritising projects that propose vegetation and savannah burning carbon farming methods, that offer longer permanence periods and/or offer additional legal security and that demonstrate improved outcomes for threatened ecosystems and unregulated ‘Category X’ vegetation.
As of 30 June 2023, 19,000 ACCUs are held by the LRF equivalent to 19,000 tonnes of carbon dioxide being sequestered or avoided.272
|
Minister for the Environment and the Great Barrier Reef and Minister for Science and Innovation | |||
| December 2023 | Page | 43 |
| Policy response | Strategies and goals | Targets and outcomes | Responsible minister | |||
| The Carbon Market Institute’s Carbon Farming Scorecard 2023 found that Queensland was ‘advanced’ in its support for carbon farming with a score of 82%, noting the maintenance of Queensland’s leading position among Australian states and territories was underpinned by strong capital outlay and fundamental integration of co-benefits.273 | ||||||
Tourism supporting natural capital | The Department of Tourism and Sport supports investment into development of sustainable, low impact tourism infrastructure, aimed at balancing tourism development with environmental preservation and protection. The Department’s objectives include delivering new and diverse business opportunities to grow a sustainable and competitive tourism industry, while ensuring natural assets are preserved, explored and treasured for future generations.274 Current initiatives include:
● the Activate Ecotourism Infrastructure initiative to facilitate the delivery of ecotourism or nature-based tourism infrastructure adjacent to, or near, public protected areas, world heritage areas, state forests or timber reserves.275 ● the Eco-certified Tourism Destination Program to support Queensland destinations to achieve sustainable tourism certification, recognising the importance of natural capital in underpinning industry’s long-term success.276 | Targets: Key priorities under Queensland’s Towards Tourism 2032: Transforming Queensland’s visitor economy tourism industry strategy include:277
● positioning Queensland as a global leader in sustainable tourism and ecotourism experiences ● delivering sustainable and regenerative tourism practices that support communities and value the contribution visitors make to their environment and lifestyle ● supporting a thriving nature-based tourism sector that balances tourism development with environmental preservation, protection and interpretation. |
Minister for Tourism, and Sport | |||
| December 2023 | Page | 44 |
Natural capital - Risk management
Climate risks and Natural capital risks are managed through the same process, with risk managed by Cabinet through responsible Ministers and administering departments with support from the Queensland Government’s Performance Management Framework Policy.
Annual reports are prepared by each government agency on non-financial and financial performance towards achievement of government’s objectives.
The Queensland Government publishes public natural capital data to assist with natural capital risk assessment and monitoring.
Figure 13: Examples of government published natural capital data
| Element | Data series | |
| Land | Statewide Landcover and Trees Study (SLATS) | |
SLATS is a scientific monitoring program that provides data to support vegetation management and environmental protection laws in Queensland and informs a range of sustainable land management, biodiversity, and conservation initiatives.
SLATS data is available online.278 | ||
| Regional Ecosystems mapping | ||
The Queensland Herbarium surveys, maps and monitors the state’s vegetation and regional ecosystems with information used for the purposes of the Vegetation Management Act 1999 (Qld), Environmental Protection Act 1994 (Qld) and the Environment Protection and Biodiversity Conservation Act 1999 (Cth).279
It has information on the each of the state’s 1,435 regional ecosystems.280,281,282 | ||
| Queensland Globe (biota globe) data is available online.283 | ||
| Land Use Mapping | ||
| The Queensland Government maps and assesses land use patterns and changes across the state, according to the Australian Land Use and Management Classification.284 | ||
| More information can be found online from Land Use Mapping datasets285 and reports.286 | ||
| Freshwater | WetlandInfo | |
| WetlandInfo is provides a range of tools and resources to assist with the sustainable management of wetlands.287 | ||
| More information can be found online.288 | ||
| Ocean | Reef Report Cards | |
| Measures progress towards the Reef 2050 Water Quality Improvement Plan targets, objectives and long-term outcomes. It reports on information around the success of actions and identifies whether further measures are needed to address water quality in the Great Barrier Reef.289,290,291 | ||
| Atmosphere | Live air data | |
Air quality data information on ambient particulate concentration and other air quality categories.
More information can be found online.292 | ||
Natural capital - Metrics and targets
The Queensland Government uses a wide range of metrics and targets to assess, manage and monitor the government’s performance in managing its natural capital. Targets and milestones are established for key policy responses to monitor their effectiveness over time. Key targets and milestones are identified in Natural Capital - Policy response.
| December 2023 | Page | 45 |
Social
The Queensland Government’s investment in social and human services enables the delivery of services to improve wellbeing of Queenslanders leading to an educated, healthy, and skilled workforce. These services include:
| ● | Social or community services that support most vulnerable groups, such as child protection, domestic, family and sexual violence prevention and response and disability and youth services. |
| ● | Human services, such as support for education and training, employment, sport and recreation, culture and the arts.293 |
The Queensland Government has embedded social considerations into policy and budget settings through the social sustainability priorities (Figure 14).
Figure 14: Queensland’s social sustainability priorities
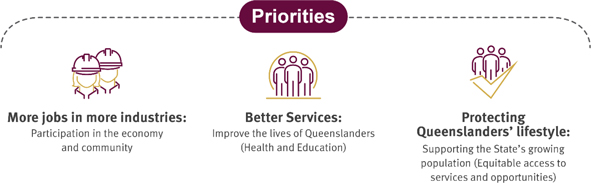
Social - Management
Cabinet has responsibility for the management of social risks with the Premier of Queensland assigning areas of responsibility to Ministers. Ministerial oversight of Queensland’s social priorities is outlined in Figure 15. For a full list of Ministers and their responsibilities please see Appendix B: Ministers and responsibilities or the Minister’s charter letter.
It is the responsibility of Cabinet for Ministers to work together to progress its priorities and deliver the government’s objectives for the community, summarised as:
| ● | Good jobs |
| ● | Better services |
| ● | Great lifestyle. |
| December 2023 | Page | 46 |
Figure 15: Queensland’s social management
| Ministers | ||
Premier | Minister for State Development and Infrastructure, Minister for Industrial Relations and Minister for Racing | |
Deputy Premier, Treasurer and Minister for Trade and Investment | Minister for Education and Minister for Youth Justice, | |
Minister for Health, Mental Health and Ambulance Services and Minister for Women | Minister for Transport and Main Roads and Minister for Digital Services | |
Attorney-General and Minister for Justice and Minister for the Prevention of Domestic and Family Violence | Minister for Energy and Clean Economy Jobs | |
Minister for Police and Community Safety | Minister for Tourism and Sport | |
Minister for Treaty, Minister for Aboriginal and Torres Strait Islander Partnerships, Minister for Communities and Minister for the Arts | Minister for Housing, Local Government and Planning and Minister for Public Works | |
Minister for Employment and Small Business and Minister for Training and Skills Development | Minister for Agricultural Industry Development and Fisheries and Minister for Rural Communities | |
Minister for Regional Development and Manufacturing and Minister for Water | Minister for Child Safety, Minister for Seniors and Disability Services and Minister for Multicultural Affairs | |
Minister for Resources and Critical Minerals | Minister for the Environment and the Great Barrier Reef and Minister for Science and Innovation | |
Minister for Fire and Disaster Recovery and Minister for Corrective Services | ||
Social - Strategy
The Queensland Government’s ongoing investment in its community has established a workforce that is well-prepared and equipped for the demands of the modern economy. Combined with the state’s appealing lifestyle, favourable geography and diverse economic opportunities, the State of Queensland attracts both skilled workers and investments, driving further growth and development.
The Premier of Queensland prepares the government’s objectives for the community (Figure 16).294 These objectives inform the sustainability priorities. The Queensland Government is delivering on these priorities whilst growing the economy and enhancing the quality of life for all Queenslanders.
In recognition of the breadth of organisations that deliver social services for Queenslanders, the government is partnering with the private sector, philanthropic organisations, non-government organisations, universities and knowledge precincts to reduce disadvantage and lift wellbeing outcomes for communities. In this context, there are also opportunities to leverage technological and digital innovation and new ways of working, to improve how services meet people’s needs.
| December 2023 | Page | 47 |
Figure 16: Queensland Government’s objectives for the community
 | ||
GOOD JOBS | ||
Good, secure jobs in our traditional and emerging industries
» Supporting jobs: Good, secure jobs in more industries to diversify the Queensland economy and build on existing strengths in agriculture, resources and tourism.
» Backing small business: Help small business, the backbone of the state’s economy, thrive in a changing environment.
» Making it for Queensland: Grow manufacturing across traditional and new industries, making new products in new ways and creating new jobs.
» Investing in skill: Ensure Queenslanders have the skills they need to find meaningful jobs and set up pathways for the future. | ||
 | ||
BETTER SERVICES | ||
Deliver even better services right across Queensland
» Backing our frontline services: Deliver world-class frontline services in key areas such as health, education, transport and community safety.
» Keeping Queenslanders safe: Continue to keep Queenslanders safe as we learn to live with COVID-19 and ensure all Queenslanders can access world-class healthcare no matter where they live.
» Connecting Queensland: Drive the economic benefits, improve social outcomes and create greater social inclusion through digital technology and services.
» Educating for the future: Give our children the best start by investing in our teachers and schools. | ||
 | ||
GREAT LIFESTYLE | ||
Protect and enhance our Queensland lifestyle as we grow
» Protecting the environment: Protect and enhance our natural environment and heritage for future generations and achieve a 70 per cent renewable energy target by 2032 and net zero emissions by 2050.
» Growing our regions: Help Queensland’s regions grow by attracting people, talent and investment, and driving sustainable economic prosperity.
» Building Queensland: Drive investment in the infrastructure that supports the State’s economy and jobs, builds resilience and underpins prosperity.
» Honouring and embracing our rich and ancient cultural history: Create opportunities for First Nations Queenslanders to thrive in a modern Queensland. |
An outline of strategies being implemented by the Queensland Government to manage social risks is provided in the Social – Policy Response section.
| December 2023 | Page | 48 |
Social - Policy response
Below is a summary of Queensland Government policies that support the management of social risks and opportunities.
| Policy response | Strategies and goals | Targets and outcomes | Responsible minister | |||
Protect and enhance our Queensland lifestyle as we grow | ||||||
Legislation and policies to support human rights and promote equal opportunities | Legislation and initiatives include:
· Human Rights Act 2019 (Qld) · Anti-Discrimination Act 1991 (Qld) · Right to Information Act 2009 (Qld) · Modern Slavery Act 2018 (Cth) ● Path to Treaty Act 2023 (Qld) · Multicultural Recognition Act 2016 (Qld) ● Criminal Code (Serious Vilification and Hate Crimes) and Other Legislation Amendment Act (Qld) ● Queensland Women’s Strategy 2022-2027.295 | Outcomes:
● Yearly average labour force participation rate of 77.1% for females compared to 83.6% for males for those aged 15 to 64 in 2022–23 (2021–22: 76.8% for females compared to 83.9% for males for those aged 15 to 64).296 (Appendix A: Datasets: Metric 20).
See Appendix A: Datasets for metrics. |
Attorney-General and Minister for Justice and Minister for the Prevention of Domestic and Family Violence
Minister for Treaty, Minister for Aboriginal and Torres Strait Islander Partnerships, Minister for Communities and Minister for Arts
Minister for Child Safety, Minister for Seniors and Disability Services and Minister for Multicultural Affairs | |||
Queensland Human Rights Commission | The Queensland Human Rights Commission (QHRC) is an independent statutory body established under the Anti- Discrimination Act 1991(Qld). It is accountable to Parliament through the Attorney-General and Minister for Justice and Minister for the Prevention of Domestic and Family Violence. It contributes to the whole-of government objectives of ‘be a responsive government’ and ‘keep communities safe’, while also delivering on its independent objectives. Its primary legislated functions are under the Anti-Discrimination Act 1991 (Qld) and Human Rights Act 2019 (Qld).297 | Outcomes:
● 1,568 complaints finalised, with 508 accepted and 203 of these resolved.298 ● 44,000 active users of the QHRC online learning products.299 |
Attorney-General and Minister for Justice and Minister for the Prevention of Domestic and Family Violence | |||
Managing Modern Slavery Risk | Through its procurement function known as Buy Queensland, the Queensland Government plays a key role in responding to and eliminating modern slavery and promoting human rights.300
The Queensland Procurement Policy 2023 (QPP) requires government agencies to identify, assess and take action to eliminate as far as possible, or mitigate modern slavery risks in relation to agency supply chains in accordance with Eliminating modern slavery in government supply chains: Framework and roadmap.301,302
While the Modern Slavery Act 2018 (Cth) does not extend to Queensland Government agencies, there are some entities captured by the Act that are required to comply and prepare annual Modern Slavery Statements for the Australian Government actions under the QPP that are separate to any | Outcomes:
● Government Best Practice Principles Quality, safe workplaces (BPPs):303 All government agencies subject to the QPP must apply the BPPs to major projects of $100 million or more. Projects less than $100 million may also be declared as subject to the BPPs. The BPPs include workplace health and safety systems and standards, a commitment to apprentices and trainees and best practice industrial relations. ● Queensland Government Supplier Code of Conduct 2023304 sets out the expectations that government has of businesses that want to sell their goods or services to the government, and outlines what constitutes a responsible supplier. This Code applies to all procurement activities regardless of their value from 1 June 2023. ● Ethical Supplier Mandate and Threshold.305 The Threshold reflects the minimum legal responsibilities expected of all suppliers who want to do business with the Queensland Government. The mandate is being expanded to all procurement categories from 1 February 2024. |
Attorney-General and Minister for Justice and Minister for the Prevention of Domestic and Family Violence
Minister for Energy and Clean Economy Jobs | |||
| December 2023 | Page | 49 |
| Policy response | Strategies and goals | Targets and outcomes | Responsible minister | |||
| obligations Government Owned Corporations may have under the Modern Slavery Act 2018 (Cth). | ||||||
National Agreement on Closing the Gap | The Queensland Government is a signatory to the National Agreement on Closing the Gap which aims to overcome the inequality experienced by First Nations peoples and achieve life outcomes equal to all Australians.306 | Outcomes:
● See the Australian Government Closing the Gap (CtG) Annual Report 2023 307 and Productivity Commission 2023 Annual Data Compilation Report 308
● For Queensland outcomes, refer Queensland Closing the Gap Snapshot Report 2023309
See Appendix A: Datasets for metrics. | Minister for Treaty, Minister for Aboriginal and Torres Strait Islander Partnerships, Minister for Communities and Minister for the Arts | |||
Reframing the relationship between First Nations Queenslanders and the Queensland Government | First Nations peoples and the Queensland Government are building a reframed relationship that acknowledges, embraces and celebrates the humanity of Indigenous Australians.310
Queensland is a signatory to the National Agreement on Closing the Gap, the first to be developed and negotiated in genuine partnership with First Nations peoples to improve life outcomes for First Nations Queenslanders
There are four priority reforms that underpin the National Agreement on Closing the Gap: partnerships and shared decision- making; building the community-controlled sector; transforming Government organisations; and shared access to data and information.
It aligns with parallel reforms underway in Queensland and at the national level that seek to uphold First Nations aspirations, including:
● local thriving communities – focusing on local decision making through the establishment of Local Decision Making Bodies to influence service delivery co-design.311 |
Outcomes:
● Establishment of the Queensland First Children and Families Board.312
● Appointment of the Chief First Nations Health Officer in Queensland Health313 ● Implementation of Our Way: a generational strategy for Aboriginal and Torres Strait Islander children and families 2017 – 2037.314 ● Development of annual Queensland Closing the Gap Implementation Plans and transparent annual reporting on progress through Annual Reports and Snapshots (www.qld.gov.au/ctg). ● Release of the Local Thriving Communities Action Plan 2022-2024.315 ● Enactment of Public Sector Act 2022 (Qld) acknowledging that public sector organisations have a unique role and obligation to reframe relationships and recognise the importance of the right to self- determination for First Nations peoples. ● Appointment of First Nations Justice Officer.316 ● Introduction of the Meriba Omasker Kaziw Kazipa (Torres Strait Islander Traditional Child Rearing Practice) Act 2020. The Act recognises Ailan Kastom (island custom) child rearing practice. |
Premier
Minister for Treaty, Minister for Aboriginal and Torres Strait Islander Partnerships, Minister for Communities and Minister for the Arts
Minister for Child Safety, Minister for Seniors and Disability Services and Minister for Multicultural Affairs
Attorney-General and Minister for Justice and Minister for the Prevention of Domestic and Family Violence | |||
First Nations partnerships | The government undertakes a range of initiatives to deliver improved social and economic outcomes for First Nations peoples in cities and regional communities. Examples include:
● Queensland Indigenous (Aboriginal and Torres Strait Islander) Procurement Policy (QIPP) - the policy provides a whole-of-government framework to increase procurement with Indigenous businesses.317 The QIPP is a procurement- related policy under the Queensland Procurement Policy 2023.
● Ending Rheumatic Heart Disease: Queensland First Nations Strategy 2021–2024 which guides and frames the next steps Queensland Health and its partners will take to advance the | Targets:
● Increase government procurement with Indigenous businesses to be three per cent of addressable spend.317,323
● The Ending Rheumatic Heart Disease: Queensland First Nations Strategy 2021–2024 will contribute to the achieving Closing the Gap Targets and Outcomes.318
● Increase speakers of traditional Aboriginal and Torres Strait Islander languages.
Outcomes: | Minister for Treaty, Minister for Aboriginal and Torres Strait Islander Partnerships, Minister for Communities and Minister for the Arts
Minister for Health, Mental Health and Ambulance Services and Minister for Women | |||
| December 2023 | Page | 50 |
| Policy response | Strategies and goals | Targets and outcomes | Responsible minister | |||
| vision of ending acute rheumatic fever and rheumatic heart disease in Queensland.318 | ● 591 Aboriginal and Torres Strait Islander businesses securing government procurement in 2022–23.317 | |||||
● The Aboriginal Land Act 1991 (Qld) and Torres Strait Islander Land Act 1991 (Qld)(known collectively as the Indigenous Land Acts) were introduced to transfer land (including the existing Deed of Grant in Trust community lands and some lands reserved for particular purposes) to Aboriginal or Torres Strait Islander peoples to enable them to manage the land according to their tradition or custom. Under the Acts, the Minister can make declarations to facilitate the granting of land and about the management of the land.319
● The Aboriginal Cultural Heritage Act 2003 (Qld) and Torres Strait Islander Cultural Heritage Act 2003 (Qld) (the Cultural Heritage Acts) require anyone who carries out a land-use activity to exercise a duty of care to take all reasonable and practicable measures to ensure their activity does not harm Aboriginal or Torres Strait Islander cultural heritage.320
● Health and Wellbeing Queensland released Gather + Grow: Queensland Remote Food Security Strategy 2023-32 and the associated Action Plan in November 2023 to address food security, particularly in remote Aboriginal and Torres Strait Islander communities.321
● Many Voices: Queensland Aboriginal and Torres Strait Islander Languages Policy was developed in partnership with Aboriginal and Torres Strait Islander language experts to develop measures to strengthen and promote Aboriginal and Torres Strait Islander languages.322 | ● $442 million of government procurement from Aboriginal and Torres Strait Islander owned businesses in 2022–23.317 ● Anyone who carries out land-use activities have a duty of care to not harm Aboriginal or Torres Strait Islander cultural heritage.320 ● The Gather + Grow Strategy and Action Plan will drive actions to improve food security in remote Queensland across four priority areas: logistics and supply chains, local food production, healthy communities and healthy homes.321 ● Released the ‘Many Voices: Queensland Aboriginal and Torres Strait Islander Languages Action Plan’ aligned with the United Nations International Decade for Indigenous Languages 2022–2032 which commits to drawing attention to the critical loss of Indigenous languages and the urgent need to preserve, revitalise and promote Indigenous languages. | |||||
The Communities 2032 Strategy and Action Plan 2022-25 | The Communities 2032 Strategy is Queensland’s first long term, whole-of-government vision for communities and guide Queensland Government action over 10 years to support and empower every person to connect, participate, contribute and thrive.324,325 | Targets: The Strategy outlines a number of targets, including:326
● Release Queensland’s Disability Plan (with a focus on employment opportunities for people with disability) and the development and review of department Disability Service Plans.327,328 ● Develop a Youth Strategy for Queensland.
● Support the implementation of the Cultural Engagement Framework: Working with Aboriginal and Torres Strait Islander Arts and Cultures in Queensland to guide respectful government and arts sector engagement.
● Develop a Queensland Equity Framework to address the causes of inequity and enable individuals and communities to flourish by receiving the right support at the right time.
● Release of a $4 million Communities Innovation Fund to support innovative approaches to tackling social isolation and loneliness.329 | Minister for Treaty, Minister for Aboriginal and Torres Strait Islander Partnerships, Minister for Communities and Minister for the Arts
Minister for Child Safety, Minister for Seniors and Disability Services and Minister for Multicultural Affairs
Minister for Health, Mental Health and Ambulance Services and Minister for Women | |||
| December 2023 | Page | 51 |
| Policy response | Strategies and goals | Targets and outcomes | Responsible minister | |||
Prevention of domestic, family and sexual violence. | The Domestic and Family Violence Prevention Strategy 2016– 2026 sets the direction for collaborative action to end domestic family violence in the State of Queensland, encouraging partnerships between the government, community and business.330
Prevent. Support. Believe. Queensland’s Framework to address Sexual Violence outlines the government’s overarching approach to preventing and responding to sexual violence in Queensland. Implementation of the Framework is supported by consecutive whole-of-government action plans.331 | Outcomes:
● Since 2015, the Queensland Government has invested more than $1.5 billion in reforms and initiatives to address domestic, family and sexual violence and to improve women’s and girl’s safety in Queensland, including a $588 million package of reforms from 2022-23 to 2025-26 in response to the findings of the Women’s Safety and Justice Taskforce.332
● In 2022-23, 26,567 domestic and family violence counselling service users had their cases closed or finalised with the majority of their identified needs met.333
For further information please visit www.qld.gov.au and search for DFV prevention strategy or sexual violence.
|
Attorney-General and Minister for Justice and Minister for the Prevention of Domestic and Family Violence
Minister for Treaty, Minister for Aboriginal and Torres Strait Islander Partnerships, Minister for Communities and Minister for the Arts | |||
| See Appendix A: Datasets for metrics. | ||||||
Gender equality | Queensland Women’s Strategy 2022-27 provides a framework for all Queenslanders to strengthen and support the rights of Queensland women and girls and work towards achieving a gender-equal Queensland, with five impact areas.334,335
● women’s economic security ● women’s safety, health and wellbeing ● First Nations women ● women with diverse backgrounds and experiences ● empowerment and recognition. |
Outcomes: Queensland Women’s Strategy: 2022 report cards contain statistics on the four impact areas.336 These statistics include:
● 44.4% of the Queensland Cabinet (eight of the 18 cabinet ministers) including the Premier, and 31.2% (29 of 93 seats) of Queensland Parliament members, at 19 October 2022.337 ● Females comprised 48% of all employed persons in September 2022.338 ● Percentage of women appointed to Queensland Government Boards during 2021–22 was 56%339 2020–21: 53%340). |
Minister for Health, Mental Health and Ambulance Services and Minister for Women | |||
Future Directions for an Age- Friendly Queensland | Future Directions for an Age-Friendly Queensland outlines the Queensland Government’s commitment to continuing to create age-friendly communities in which seniors feel connected, cared for and can contribute in ways of their choosing.341,342 | Outcomes: The Queensland: an age-friendly community—provides a clear way forward to direct the implementation and delivery of age-friendly communities in Queensland.341,342 As at 30 June 2021:
● 26 Queensland Government agencies committed to 114 actions. ● 111 actions were completed (97 per cent completion rate). ● 79 actions were adopted as business-as-usual. ● 72 actions were expanded beyond their initial scope and continued.
|
Minister for Child Safety, Minister for Seniors and Disability Services and Minister for Multicultural Affairs | |||
Cost of Living Rebate and National Energy Bill Relief | The government is providing increased funding in 2023-24 to provide cost of living relief for Queensland households and small businesses through a Cost-of-Living Rebate (COLR). This measure includes contributions from the Australian Government under the National Energy Bill Relief plan, with the Queensland Government contributing an estimated $1.1 billion.343 | Outcomes:
● In 2023-24, all Queensland households will automatically receive a $550 COLR on their electricity bill, while around 600,000 vulnerable households will benefit from a higher $700 COLR. ● Approximately 205,000 small businesses will also receive a $650 rebate to assist with the higher cost of electricity.343 |
Minister for Energy and Clean Economy Jobs | |||
| For further information please visit www.queenslandsavers.qld.gov.au | ||||||
HOMES for Queenslanders | Homes for Queenslanders provides a plan that looks across the whole housing system and demonstrates how Queensland will | Targets: | ||||
| December 2023 | Page | 52 |
| Policy response | Strategies and goals | Targets and outcomes | Responsible minister | |||
play its part in the national housing challenge and ensure that Queenslanders can afford to live and work in the community that they love.
Home for Queenslanders is based on five key pillars: 344
● Build more homes, faster ● Support Queensland renters ● Help first homeowners into the market ● Boost social housing Bid Build ● Work towards ending homelessness | ● Review Queensland legislation to make sure it covers the full range of options available to meet Queensland’s housing needs and that enables growth and sustainability of social and affordable homes. ● Unlock land across the state by undertaking an audit of state government land and buildings for a mixture of social and private housing. ● One million new homes by 2046, including 53,500 social homes. | Minister for Housing, Local Government and Planning and Minister for Public Works | ||||
Queensland Housing and Homelessness Action Plan 2021–2025 | The Queensland Housing Strategy 2017–2027 sets out the Queensland Government’s commitment to work with communities, industry and the housing sector to deliver a better housing future for all Queenslanders.345 The Housing Strategy is being delivered through mechanisms including:
● Housing Strategy Action Plan 2017–2020346 ● Aboriginal and Torres Strait Islander Housing Action Plan 2019–2023347 ● Housing and Homelessness Action Plan 2021-2025.348
The Queensland Housing and Homelessness Action Plan 2021– 2025 covers a range of measures including:
● delivery of new social and affordable housing. ● delivering essential frontline services and providing enhanced housing and support options for vulnerable people, moving towards ending homelessness. ● dedicated actions for engaging with regional and rural local councils about their housing and accommodation needs and delivering flexible approaches to supporting their local communities. ● better integration across government and non-government services to provide vulnerable Queenslanders with a seamless service response to meet their needs holistically, particularly the commonly intersecting needs of housing and health. ● measures for promoting fairness and accessibility in the housing sector. ●
|
Targets:
● 3,265 social housing commencements by 30 June 2025 through QuickStarts Qld.349
Outcomes:
● Towards ending homelessness for young Queenslanders 2022-2027, a policy and framework, was released in October 2022 to improve housing outcomes for young people backed by a $29.8 million investment.350 ● 23 Local Housing Action Plans were completed and adopted by councils by June 2023, comprising plans for the Gympie Region and 22 member councils of the Western Queensland Alliance of Councils. A further 38 Local Housing Action Plans are underway with an additional $600,000 announced in March 2023, for the Local Government Association of Queensland to work with local governments to complete the plans by March 2024.351 |
Minister for Housing, Local Government and Planning and Minister for Public Works
Minister for Treaty, Minister for Aboriginal and Torres Strait Islander Partnerships, Minister for Communities and Minister for the Arts | |||
Housing Investment Fund | ● The Housing Investment Fund was established to support the increased delivery of social and affordable housing. It is a market-led program, established to provide support to proponents – including registered community housing |
Target:
● 5,600 new social and affordable home commencements across the State of Queensland by 30 June 2027.352,353 | Minister for Housing, Local Government and Planning and Minister for Public Works | |||
| December 2023 | Page | 53 |
| Policy response | Strategies and goals | Targets and outcomes | Responsible minister | |||
providers and the private sector to build, finance, own, operate and manage social and affordable housing.352
| ||||||
Coordinator-General | The Coordinator-General354 administers the Strong and Sustainable Resource Communities Act 2017 (Qld) (SSRC Act).355
● The SSRC Act prevents the use of 100% Fly In Fly Out (FIFO) workforce arrangements on operational large resource projects prevents discrimination against locals in the future recruitment of workers, through the Anti-Discrimination Act 1991 (Qld) makes social impact assessments (SIA) mandatory for large resource projects.
● The Coordinator-General also requires SIA for all non- resource projects undergoing an environmental impact statement (EIS) in Queensland. The SIA must be undertaken in accordance with the Coordinator-General’s Social Impact Assessment Guidelines (2018), which is a statutory guideline under the SSRC Act.
● The SIA must include a social baseline for communities affected by the project and assess and develop management plans for any potential impacts (positive and negative). The proponent must develop an inclusive and consultative engagement program with affected communities, including Aboriginal and Torres Strait Islander peoples.
The five key matters which must be considered in the SIA are: ● community and stakeholder engagement ● workforce management ● housing and accommodation ● local business and industry procurement ● health and community well-being.
|
Outcomes:
● A key component is legitimacy in that a project is understood to be subject to a robust assessment process and accepted legal framework. The SSRC Act and the Coordinator-General’s Social Impact Assessment Guidelines (2018) contribute legitimacy, and in turn support social licence to operate across Queensland regions.356 |
Minister for State Development and Infrastructure, Minister for Industrial Relations and Minister for Racing | |||
Good secure jobs in our traditional and emerging industries | ||||||
Queensland new-industry development strategy |
The Queensland New-Industry development strategy sets out the Queensland Government’s approach to proactively developing the industries that will be in demand in a decarbonising world.357
Key actions include:
● Legislation to support industry growth and economic activity through land acquisition, zoning, project facilitation and approvals. ● Land use certainty, through the delivery of statutory land use plans across each the regions. By combining these statutory plans with Regional Infrastructure Plans the state |
Target:
● Regional Economic Futures Fund to deliver initiatives that help regional economic transformation in communities that will be directly impacted by the transition to a low-emission economy.357
● Queensland Government in collaboration with Queensland University of Technology (QUT) and local industry partners to establish QUEST Hub to build on existing battery research, development and testing.357
Outcomes:
● Established a state-wide Local Economic Opportunities Network (LEO) to work with communities across the state to identify opportunities for |
Minister for State Development and Infrastructure, Minister for Industrial Relations and Minister for Racing | |||
| December 2023 | Page | 54 |
| Policy response | Strategies and goals | Targets and outcomes | Responsible minister | |||
will provide a clear foundation for regional growth, liveability and prosperity.
| economic diversification and promote these for investment consideration.358
| |||||
Quantum and advanced technologies |
The Queensland Quantum and Advanced Technologies Strategy, developed in partnership with Queensland universities, builds on the State of Queensland’s strengths in quantum research and advanced technology development.359,360
● Pillar 1: Deep science capability ● Pillar 2: Science commercialisation ● Pillar 3: Quantum workforce ● Pillar 4: Engagement and missions ● Pillar 5: Investment |
Targets:
The Queensland Government will undertake actions frame against the five pillars, including:
● Support the establishment of the ARC Centre of Excellence for Quantum Biotechnology.359
● Work with Queensland universities and industry to ensure advanced testing and fabrication infrastructure is optimised to support commercialisation.359
● Support a startup-focused quantum and advanced technologies incubator that supports scientist entrepreneurs and provides ready access to intellectual property and prototyping facilities.359
● Engage deep tech venture funds on becoming part of the Queensland ecosystem.359
Work with universities and TAFE under the Queensland Workforce Strategy to understand and build the technical skill base for quantum and advanced technologies.359
|
Premier
Minister for the Environment and the Great Barrier Reef and Minister for Science and Innovation | |||
Advanced Manufacturing 10-Year Roadmap and Action Plan |
The Advanced Manufacturing 10-Year Roadmap and Action Plan has a number of strategies including:361
● Driving advanced manufacturing in Queensland. ● Supporting manufacturers to grow in a carbon neutral future. ● Supporting manufacturers to take advantage of large scale and emerging industry and procurement opportunities. ● Increasing the participation of women in manufacturing. ● Marketing Queensland Manufacturing.
Specific actions which support the Advanced Manufacturing 10- Year Roadmap and Action Plan strategies include:
● Deliver a Battery Manufacturing Framework to support the delivery of the Queensland Battery Industry Strategy. ● Develop and deliver Queensland’s Zero Emission Vehicle Industry Roadmap for manufacturing and supply chains. ● Build capability and capacity for manufacturers to participate in supply chains to manufacture renewable energy technologies (including components for wind, solar and battery technologies, network infrastructure and hydrogen). ● Deliver training and support programs that assist manufacturers to move to carbon neutrality and environmental sustainability. |
Outcomes:
● The Made in Queensland (MIQ) grants program continued in 2022-23. As at June 2023, the program has supported 136 projects across Queensland, with 85 projects completed.362 ● The Manufacturing Hubs Grants Program in 2022–23, awarded funding to 14 regional manufacturing projects, expected to create 153 jobs and protect a further 514 jobs.362 ● The Manufacturing Capability Development and Industry Engagement and Development Programs provide tools, information and demonstrations to build capacity and capability in manufacturing businesses. In 2022-23, the department delivered 111 workshops, events and seminars attracting 3,197 people.362 ● The Manufacturing Sustainability Benchmark program supports manufacturers to benchmark their business’s resource use, waste and carbon emissions and develop a detailed action plan to reduce costs and their environmental footprint. ● Delivery of the $7.1 million Manufacturing Energy Efficiency Grant Program to support SME manufacturers to reduce energy costs and operational emissions and increase their competitiveness in a low carbon future.363 |
Minister for Regional Development and Manufacturing and Minister for Water | |||
| December 2023 | Page | 55 |
| Policy response | Strategies and goals | Targets and outcomes | Responsible minister | |||
● Identify and support targeted sectors of specialisation and build manufacturing capabilities in these sectors. Targeted sectors include renewables, rail manufacturing, metal fabrication and other identified emerging sectors.
| ||||||
Good people. Good jobs: Queensland Workforce Strategy 2022–2032 | Good people. Good jobs: Queensland Workforce Strategy 2022–2032 sets out how the government seeks to:364,365
● connect industry, community and government to more Queenslanders. ● educate the workforce through upskilling and reskilling. ● attract and retain a skilled workforce.
The strategy is underpinned by five focus areas:
● workforce participation ● local solutions ● school-to-work transitions ● workforce attraction and retention ● skilling Queenslanders now and into the future.
Delivery of the strategy is supported by multi-year action plans, the first of which runs from 2022–2025.366 | Outcomes: Information regarding the progress of the 33 actions of the Queensland Workforce Strategy Action Plan 2022-2025 is publicly available.366 Selected highlights are summarised below:
Workforce participation:
● Diverse Queensland Workforce program expanded to support 2,500 migrants, refugees and international students into work.367,368 ● Implementing Paving the Way – the First Nations Training strategy to support Aboriginal and Torres Strait Islander peoples’ skills development and respond to local and community employment needs.369
School to Work Transitions:
● In 2022, more than 30,000 students took part in industry-related GISP activities. ● 32 Queensland high schools have joined the Hydrogen Gateway to Industry Schools program, also a key action of the Hydrogen Industry Workforce Development Roadmap 2022-2032.370 ●
|
Minister for Employment and Small Business and Minister for Training and Skills Development | |||
Skills for Queensland | The government is ensuring Queenslanders have the skills they need to find meaningful jobs and set up pathways for the future.
Key initiatives include the Skilling Queenslanders for Work (SQW) initiative which is designed to achieve success on social, economic and fiscal fronts to increase workforce participation, drive job growth, improve skills development and work opportunities for disadvantaged Queenslanders. SQW funds the community sector and follows a place-based approach tailored to specific disadvantaged cohorts and communities.371,372
SQW is a permanent initiative with an annual budget of $80M to support up to 15,000 disadvantaged Queenslanders into work each year through a suite of targeted skills and training programs.
| Outcomes:
Skilling Queenslander for Work outcomes for 2022–23 include:373
● 391 projects approved to assist 12,260 disadvantaged Queenslanders. ● 9,886 people assisted with 76% participants engaged in employment, training or a combination of both, 12 months after exiting the program. ● Fee-Free TAFE has already achieved its target of 37,000 vocational education and training places delivered for Queenslanders in 2023. Free Apprenticeships for Under 25s has seen over 67,000 apprentices and trainees supported to undertake fee-free training since 2018.374 |
Deputy Premier, Treasurer and Minister for Trade and Investment
Minister for Employment and Small Business and Minister for Training and Skills Development | |||
Tourism industry development | The Department of Tourism and Sport plays a key role in driving the return and growth of a sustainable and competitive tourism industry, attracting capital investment and maximising the benefit of tourism and major events to boost Queensland’s economy.375
Released in November 2022, the Department is guided by the Towards Tourism 2032: Transforming Queensland’s visitor | Outcomes:
Achievements in 2022–23 include:377
● Commenced delivery of the Phase one Implementation Plan (2023–2025) of the Towards Tourism 2032 strategy to ‘build and focus’–a sustained effort to grow industry now and lay foundations for the future. |
Minister for Tourism and Sport | |||
| December 2023 | Page | 56 |
| Policy response | Strategies and goals | Targets and outcomes | Responsible minister | |||
| economy tourism industry strategy, which is a collective framework for industry and government to deliver long term growth and success for Queensland tourism.376 | ● Continued delivery of the $100 million Attracting Aviation Investment Fund, with 19 new services implemented during 2022-2023. ● Declared 2023 the Year of Accessible Tourism to create opportunities for the Queensland tourism industry to better cater to visitors of all abilities and provide greater destination experiences for all holidaymakers in Queensland. ● Attracted more than 3,500 workers to tourism jobs in regional Queensland through the Work in Paradise program. ● Implemented the Our Country Advisory Service to provide targeted support to emerging and established Indigenous tourism operators, sectoral aligned businesses, and community owned organisations.
| |||||
Cyber Security and Resilience | Cyber Security Unit: The Queensland Government Cyber Security Unit (CSU) sets cyber security policy and guidance for the Queensland public sector. The CSU also manages a number of whole-of-Government cyber security services, is developing a public sector cyber workforce and is supporting the development of the Queensland cyber security industry.378,379
In addition to the above the government has strategic policies contained in the following documents:380
● Digital Professional Workforce Action Plan 2020-2024 ● Queensland Government (Cyber Security) Hazard Plan ● Our Thriving Digital Future – Queensland’s Digital Economy Strategy and Action Plan
Queensland Government Customer and Digital Group:381 The group provides digital, strategic and service delivery leadership and capability to enable more responsive services across the Queensland Government.
| Outcomes:
The CSU team provides:382
● cyber security leadership. ● governance, policy and standards. ● coordinated response to cyber security incidents. ● progression of cyber security capability development across government. ● advocacy for cyber security awareness. |
Minister for Transport and Main Roads and Minister for Digital Services | |||
Deliver even better services right across Queensland | ||||||
Access to appropriate and relevant modes of learning | The Queensland Government is committed to supporting education service delivery as outlined in its state schooling strategy Equity and Excellence: realising the potential of every student383 and the Service Delivery Statement.384
The department is:
● Implementing the Investing for Success (I4S) program, that supports state schools to use funds to support students in achieving improved outcomes at all levels of schooling.385
● Delivering the Student Wellbeing Package to employ additional wellbeing professionals and support 50 state schools to provide free general practitioner services to |
Targets:
● 88% of state school students who, six months after completing Year 12, are participating in education, training or employment.384 ● Achieve a 95% proportion of enrolments in an early childhood education program
● Indigenous Children
● Children who reside in disadvantaged areas.
● Achieve a 95% participation rate for children, who reside in disadvantaged areas, in an early education program.384
● 95% of Aboriginal and Torres Strait Islander children engaged in quality kindergarten programs.384
|
Minister for Education and Minister for Youth Justice | |||
| December 2023 | Page | 57 |
| Policy response | Strategies and goals | Targets and outcomes | Responsible minister | |||
| secondary students at school over three years from 2021–22.386 | ● Deliver more than 6100 new FTE teachers and more than 1100 new teacher aides over four years from 2021–2024.384 | |||||
Education access outcomes:
| ||||||
● Proportion of students at or above the National Minimum for Years 3,5,7 and 9 are available from the Department of Education Service Delivery Statement.384 | ||||||
● Queensland schools (including non-state schools) employed 65,045 full- time equivalent teaching staff in 2022. Of this total, 32,426 were employed in primary schools and 32,619 in secondary schools, as of February 2023.387 | ||||||
● 88% of students, six months after completing Year 12, are participating in education, training or employment.384 | ||||||
● 99.7% of Queensland children were enrolled in an early childhood education program in 2022–23.384
Student Wellbeing Package Outcomes:
| ||||||
● An additional 250 wellbeing professionals have been employed through the Student Wellbeing Package to support the provision of additional support for students’ mental health in schools.388 | ||||||
● 50 schools are taking part of the General Practitioners (GP) in Schools Pilot389 | ||||||
See Appendix A: Datasets for metrics.
| ||||||
New schools and upgrades |
The Department of Education has a strategic plan that sets out its objective of providing a strong start for all children, ensuring every student realises their potential, provides fair and safe workplaces and communities and invests in capable people delivering the department’s vision.390
Building Future Schools Program:
Through the $3 billion Building Future Schools Program, the government is delivering new state schools in high-growth areas across Queensland.
The Department of Education is planning for the delivery of more new schools and additional classrooms to meet expected enrolment growth into the future.391 |
Targets:
● Deliver two new schools in 2024 and actively plan for the delivery of seven new schools in 2025 and 2026.392
● Delivering increased internet speeds at every state school in Queensland. Upgrades will see speeds increase on average 40 times greater than the previous bandwidth allocation standard by the end of 2023 and 200 times greater by 2026.393
Outcomes:
● In January 2023, four new state schools opened to meet community needs and offer contemporary learning environments.388
● The government has delivered 25 new schools since 2015, and a further two new schools will open in 2024.391
● The government continues to invest in additional classrooms to cater for enrolment growth through the Growth Program.391
● By 30 June 2023, a total of 1,002 state schools, representing 77% of all state schools, had received their initial upgrade. This equates to 92.5% |
Minister for Education and Minister for Youth Justice | |||
| December 2023 | Page | 58 |
| Policy response | Strategies and goals | Targets and outcomes | Responsible minister | |||
of students having access to internet speeds of at least one Megabit per second.388
| ||||||
Delivery of core health services and infrastructure | The Department of Health delivers expert health system governance, statewide clinical health support services, information and communication technologies, health promotion and disease prevention strategies, urgent patient retrieval services and health infrastructure planning.394
The department’s key actions include:
● operating the health and ambulance services and supporting frontline staff including doctors, nurses and paramedics ● providing improved mental health services ● increasing health system capacity.
Satellite Hospitals Program:395
● Supporting these actions, the Satellite Hospitals Program (SHP) is a Queensland Government commitment to deliver seven new facilities to support public healthcare delivery in rapidly growing communities across South East Queensland.
● Sites have been chosen that provide better access to healthcare for local communities, in convenient settings. They will offer a range of services based on the health needs of the community. Each Satellite Hospital has a minor injury and illness clinic which will deliver walk-in, urgent care and support emergency departments at major hospitals by giving people more options to access healthcare for minor injuries and illnesses close to home. |
Targets:
● Increase health care capacity including delivery of an additional 2,200 additional overnight beds at 15 facilities by 2028.396
Outcomes:
Between March 2015 and March 2023:397
● 10,638 (or 38.1 per cent) increase in the number of nurses ● 3,106 (or 39.2 per cent) increase in the number of doctors ● 1,242 (or 33.5 per cent) increase in the number of ambulance officers engaged under the Ambulance Service Act 1991 (Qld) ● 2,418 (or 24.5 per cent) increase in the number of allied health practitioners ● 1,350 increase in the number of available hospital beds between June 2015 and June 2022.
Satellite Hospitals Program Targets:
● The seven satellite hospitals are due to open in 2023–24.398 ● Operating hours and staff numbers will be determined ahead of opening, with extended hours expected to be available for people seven days a week.399 ● Satellite Hospitals in Bribie Island, Eight Mile Plains and Kallangur and will open later in 2023 and in 2024.400
Satellite Hospitals Program Outcomes:
Four Satellite Hospital have opened including:
● Caboolture Satellite Hospital.401 ● Redlands Satellite Hospital.402 ● Ripley Satellite Hospital.403 ● Tugun Satellite Hospital.404 |
Minister for Health, Mental Health and Ambulance Services and Minister for Women | |||
Health and wellbeing initiatives | Key initiatives include:
● Prevention Strategic Framework 2017–2026 – a pathway for reducing chronic diseases and improving health for all Queenslanders.405 ● Health and Wellbeing Queensland has developed a draft Queensland Obesity Prevention Strategy in response to the National Obesity Strategy 2022-32.406 ● The Rural and Remote Health and Wellbeing Strategy 2022– 2027 outlines a whole-of-system approach to achieving health equity for rural and remote Queenslanders.407 ● The Queensland Newborn Bloodspot Screening (NBS) Strategic Framework provides the strategic directions for |
Outcomes:
● 1.9 percentage point reduction in the number of children who are overweight (2011–12 to 2017–18). (See Appendix A: Datasets: Metric 36) ● 68.8% of children in 2022 and 47.5% of adults in 2021 were reported to have met daily recommendations for servings of fruit, 2.8% of children in 2022 and 7.4% of adults in 2021 met the recommendation for daily vegetable consumption, and 46.3% of children in 2022 and 56.6% of adults in 2021 met recommendations for physical activity.410 ● The health of Queensland. Report of the Chief Health Officer Queensland has been released digitally. It provides a public assessment
|
Minister for Health, Mental Health and Ambulance Services and Minister for Women | |||
| December 2023 | Page | 59 |
| Policy response | Strategies and goals | Targets and outcomes | Responsible minister | |||
NBS policy and guideline development, governance, quality, monitoring and evaluation to support NBS program delivery.408 | of the health status of the population and is used to inform strategic policy and planning within Queensland Health.411 | |||||
● The Queensland Cancer Screening Strategic Framework 2019-2026 provides a prevention and early detection pathway for improved cancer outcomes for Queenslanders. The framework focuses on increasing participation in the three national cancer screening programs (i.e., breast, bowel and cervical) and ensuring timely, safe and high- quality health service provision across the entire participant screening pathway.409 |
See Appendix A: Datasets for metrics. | |||||
Free Kindy | Kindergarten, known as kindy, is a part-time educational program for children in the year before commencement of schooling. Kindy is 15 hours per week, 40 weeks per year.
The Queensland Government is making kindy free for all Queensland children from 1 January 2024.412
| Outcome:
● From 1 January 2024, kindy will be free for all eligible kindy-age children who attend a government-approved free kindergarten program in a sessional kindergarten or long day care service. 412 |
Minister for Education and Minister for Youth Justice | |||
Social policy opportunities | ||||||
Investment in research and development (R&D) | Queensland Government’s investments in science and research, particularly over the last 15 years, have created a strong foundation from which to address future challenges. Queensland has established a global reputation for science excellence and research capability achieving outstanding results such as the development of the Hendra virus vaccine.413 | Outcomes:
Around $394 million was spent by the government on R&D in 2021–22 (2020–21: $444 million). As a proportion of total expenditure, the top two organisations were:414
● Queensland Health accounting for 50 per cent.
● Department of Agriculture and Fisheries accounting for 27 per cent.
See Appendix A: Datasets for metrics.
|
Minister for the Environment and the Great Barrier Reef and Minister for Science and Innovation Minister for Health, Mental Health and Ambulance Services and Minister for Women
Minister for Agricultural Industry Development and Fisheries and Minister for Rural Communities
| |||
Advance Queensland | To build Queensland’s competitive strengths, diversify the economy and create the knowledge-based jobs of the future, Advance Queensland is driving innovation-led economic growth through increased collaboration between government, industry and research organisations.415
| Outcomes:
● Advance Queensland has involved the delivery of more than 140 programs and activities supporting more than 28,500 jobs and leveraging over $1 billion in funds from external partners and investors.416
|
Minister for the Environment and the Great Barrier Reef and Minister for Science and Innovation | |||
Developing innovative and globally competitive agribusinesses | The Department of Agriculture and Fisheries (DAF) is supporting businesses to build natural capital, maintain high levels of biosecurity and enhance ecosystem protection to safeguard Queensland’s economy, environment, biodiversity and social amenity.
DAF is accessing improved practices, data and new technologies to enhance the productivity, profitability and sustainability of food and fibre value chains.417 | Targets:
● Provide Round 6 funding for the Rural Economic Development Grants program to fund the purchase of innovative equipment and new infrastructure.417
Outcomes:
● 41,891 agriculture, forestry and fishing businesses supported across Queensland in 2021–22.417
See Appendix A: Datasets for metrics.
|
Minister for Agriculture and Fisheries and Minister Rural communities | |||
| December 2023 | Page | 60 |
| Policy response | Strategies and goals | Targets and outcomes | Responsible minister | |||
Queensland Venture Capital Development Fund (VCDF) | The VCDF is a Queensland Government program, managed by QIC, which is seeking to accelerate, develop and enhance the venture capital industry in Queensland by:418,419
● Enhancing local venture capital funds’ capacity to attract external investment.
● Encourage venture capital firms to establish a presence in the region, leading to increased investment in local businesses.
● Address funding gaps by boosting venture capital inflow, resulting in job creation, innovative solutions, and new enterprises.
● Offer accelerator programs to expand investment-ready businesses, broadening opportunities for investors.
● Capitalize on economic, environmental, social, and diversity-related trends in the state’s priority industries.
|
Outcomes:
The VCDF comprises three core elements:419
● Matched Funding, Accelerator Funding a Development Program
● Accelerator Funding - funding to suitable accelerator programs to run at least 4 programs to increase deal flow for Queensland investors.
● Development Program - the appointed venture capital funds and accelerators will participate in the VCDF Development Program to accelerate, develop and enhance the venture capital industry in Queensland.
The VCDF request for proposal (RFP) period closed on Thursday 13 July 2023, followed by shortlisting of RFP respondents with a view to progressing further due diligence and making investments.
|
Deputy Premier, Treasurer and Minister for Trade and Investment | |||
| December 2023 | Page | 61 |
Social - Risk management
Key risks and opportunities are managed by Cabinet through responsible Ministers and administering departments with support from the Queensland Government’s Performance Management Framework Policy.
Service Delivery Statements establish key efficiency and effectiveness service standards for each Minister’s portfolio and provide information on progress toward achieving these targets.
Annual reports are prepared by each government agency on non-financial and financial performance towards achievement of government’s objectives.
Social - Metrics and targets
The Queensland Government uses a wide range of metrics and targets to assess, manage and monitor the government’s performance in managing its social risks. Targets and milestones are established for key policy responses to monitor their effectiveness over time. Key targets and milestones are identified in Social - Policy response.
| December 2023 | Page | 62 |
Governance
Queensland’s economic resilience and prosperity is based on a history of stable governance. This has been made possible through robust governance frameworks that support Ministers and accountable officers to provide oversight and discharge their obligations with due care and diligence.
Queensland Government’s approach to governance is built on effective Economic and Fiscal management. By ensuring prudent management of our economy and finances, the Queensland Government can respond to key challenges, drive growth, and deliver positive outcomes for all Queenslanders.
The Queensland Government has embedded economic and fiscal considerations into policy and budget settings to progress its governance sustainability priorities (Figure 17).
Figure 17: Queensland’s governance sustainability priorities
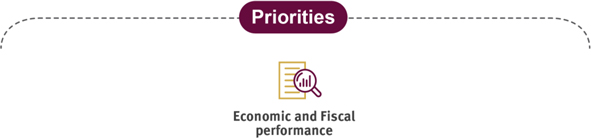
Economic and Fiscal - Management
Economic and fiscal matters are primarily managed by the Cabinet Budget Review Committee (CBRC) and the Deputy Premier, Treasurer and Minister for Trade and Investment.
Oversight of the Queensland Government’s economic and fiscal risks is provided by the Ministers noted in Figure 18, supported by the Cabinet Budget Review Committee (CBRC). CBRC is a standing committee of Cabinet that considers financial and budgetary decisions. It meets regularly at the discretion of the Premier of Queensland. For full list of ministers and their responsibilities please see Appendix B: Ministers and responsibilities or the Minister’s charter letter.
Figure 18: Queensland’s economic and fiscal management
| Ministers | ||
| Premier | Minister for State Development and Infrastructure, Minister for Industrial Relations and Minister for Racing | |
| Deputy Premier, Treasurer and Minister for Trade and Investment | Minister for Transport and Main Roads and Minister for Digital Services | |
Economic and Fiscal - Strategy
The Government’s fiscal principles and economic strategy provide the foundation for the state’s financial decision making. Strong economic outcomes provide government with the fiscal capacity to take positive actions and deliver continued targeted investment in climate change transition, social services and reforms that strengthen communities and support vulnerable Queenslanders. By implementing initiatives that attract investment and promote innovation, as well as focusing on economic opportunities and enablers aligned with long-term sustainability goals, the government is building a prosperous and sustainable future.
The Queensland Government economic and fiscal strategy is detailed in the annual Queensland Budget and is reflected in the economic and fiscal objectives and approach (Figure 19).
| December 2023 | Page | 63 |
Figure 19: Queensland Government’s economic and fiscal objectives and approach
| Type | Objective | Approach | Policy response | |||
Economic | Securing Queensland’s path to a prosperous future | The economic strategy will create more jobs by leveraging Queensland’s strengths and growing its traditional and emerging industries, expanding supply chains and seizing opportunities in the lead up to the Brisbane 2032 Olympic and Paralympic Games and beyond.
Key enablers to capitalise on these opportunities and drive future growth include: a larger, more skilled workforce; targeted infrastructure investment; a competitive investment environment; expanded trade networks; increased innovation and digitalisation; and maintaining strong Environmental, Social and Governance (ESG) credentials. | Economic and productivity | |||
Fiscal | Fiscal Principle 1 – Stabilise the General Government Sector net debt to revenue ratio at sustainable levels in the medium term, and target reductions in the net debt to revenue ratio in the long term. |
The fiscal strategy leverages Queensland’s strong economic performance to respond to key challenges facing
Queenslanders, including addressing cost-of-living pressures, enhancing health services, improving housing affordability and keeping communities safe. The strategy also provides for investment in healthcare and critical infrastructure across all regions to position Queensland on a clear path towards longer-term growth and prosperity.
Strategic policy priorities are:
● Tackling the cost of living - Cost-of-living pressures are being felt across the country, with all Australian households, businesses and industries.
● Infrastructure for a growing state - As Queensland continues to grow and diversify, continued investment in infrastructure will support productivity growth and enhanced standards of living.
● Delivering better services - Ongoing investment in essential services, including health, housing, education, justice, safety and social services, will continue delivering enduring social and economic benefits. These services support increased economic participation and aim to improve the wellbeing of Queenslanders.
● Investing in Queensland’s future –The government’s fiscal strategy continues to support the delivery of the government’s overarching community objectives. Investment in the state’s capital program supports the ongoing transformation of the Queensland economy, focuses on growing a sustainable and diversified economy that is resilient, productive, competitive and able to respond to future opportunities and challenges. | Budget decision making and financial risk management | |||
Fiscal Principle 2 – Ensure that average annual growth in General Government Sector expenditure in the medium term is below the average annual growth in General Government Sector revenue to deliver fiscally sustainable operating surpluses | ||||||
Fiscal Principle 3 – Target continual improvements in net operating surpluses to ensure that, in the medium term, net cash flows from investments in non-financial assets (capital) will be funded primarily from net cash inflows from operating activities. The capital program will focus on supporting a productive economy, jobs, and ensuring a pipeline of infrastructure that responds to population growth. | ||||||
Fiscal Principle 4 – Maintain competitive taxation by ensuring that, on a per capita basis, Queensland has lower taxation than the average of other states | ||||||
Fiscal Principle 5 – Target the full funding of long-term liabilities such as superannuation and workers’ compensation in accordance with actuarial advice. | ||||||
| December 2023 | Page | 64 |
Economic and Fiscal - Policy response
Below is a summary of the of Queensland Government policies that support the management of economic and fiscal risks and opportunities.
| Policy response | Strategies and goals | Targets and outcomes | Responsible minister | |||
Implementing economic policy | ||||||
Economic policy | The government’s direction on economic management is informed by the government objectives for the community.420 It is supported by the Queensland Government’s robust system of checks and balances, stewardship and transparency on the use of public funds, underpinned by a legislated financial accountability framework.
The Queensland Budget provides capital investment and funding in areas such as health, energy transformation, social and economic infrastructure, education, family services, justice and policing, protecting the environment and reducing the cost of living.
The Big Build – infrastructure for a growing state – is the Queensland Government’s capital program to support jobs growth and provide expected productivity- enhancing infrastructure across all regions of the state that will improve the competitiveness of Queensland’s traditional industries and support growth in new and emerging sectors, better connect communities across the state and strengthen their resilience in the face of future global challenges and natural disasters.421
|
Targets:
● The government’s economic strategy is focused on growing a sustainable and diversified economy that is resilient, productive, competitive and able to respond to future challenges and opportunities. The economic strategy will create more jobs by leveraging Queensland’s strengths and growing its traditional and emerging industries, expanding supply chains and seizing opportunities in the lead up to the Brisbane 2032 Olympic and Paralympic Games and beyond.422
Outcomes:
● Queensland GSP rose by 4.4% in 2021-22 (2.9% in 2020–21).423 (Appendix A: Datasets Metric 43)
See Appendix A: Datasets for metrics. |
Deputy Premier, Treasurer and Minister for Trade and Investment | |||
Implementing fiscal policy | ||||||
Fiscal policy | The Queensland Treasurer must prepare and table in the Legislative Assembly a Charter of Fiscal Responsibility pursuant to the Financial Accountability Act 2009 (Qld). The Charter sets out the fiscal principles that identify the government’s fiscal objectives and support budget decision making.
Each principle has its own target which are reported by government. | The Treasurer tabled the Charter of Fiscal Responsibility (including Fiscal Principles) to the Legislative Assembly on the 15 June 2021.424 |
Deputy Premier, Treasurer and Minister for Trade and Investment | |||
Fiscal Principles | Fiscal Principle 1: Stabilise the General Government Sector net debt to revenue ratio at sustainable levels in the medium term, and target reductions in the net debt to revenue ratio in the long term. | Principle 1: Ratio of GGS net debt to revenue
● Net Debt to revenue ratio was 3% in 2022-23.425 (2021–22: 15%).426
|
Deputy Premier, Treasurer and Minister for Trade and Investment | |||
| Fiscal Principle 2: Ensure that average annual growth in General Government Sector expenditure in the medium term is below the average annual growth in General Government Sector revenue to deliver fiscally sustainable operating surpluses. | Principle 2: Average annual growth in expenditure is below the average annual growth in revenue.
● In 2022-23, revenues grew by 21.1% and expenses by 8.6% compared to 2021- 22425 (in 2021-22: revenues grew by 18.1% and expenses by 9.7% compared to 2020-21426) ● See Appendix A: Datasets for metrics.
| Deputy Premier, Treasurer and Minister for Trade and Investment | ||||
Fiscal Principle 3: Target continual improvements in net operating surpluses to ensure that, in the medium term, net cash flows from investments in non-financial assets (capital) will be funded primarily from net cash inflows from operating activities.
The capital program to focus on supporting a productive economy, jobs, and ensuring a pipeline of infrastructure that responds to population growth. | Principle 3: A capital program increasingly being funded through cash surpluses.
● In 2022-23, the General Government Sector (GGS) net investments in non- financial assets were funded in full through net cash inflows from operating activities.427 (in 2021-22, the GGS net investments in non-financial assets were also funded in full through net cash inflows from operating activities428)
| Deputy Premier, Treasurer and Minister for Trade and Investment
| ||||
| December 2023 | Page | 65 |
| Policy response | Strategies and goals | Targets and outcomes | Responsible minister | |||
| Fiscal Principle 4: Maintain competitive taxation by ensuring that, on a per capita basis, Queensland has lower taxation than the average of other states. | Principle 4: Revenue efforts do not constrain economic activity or place an undue burden on households.
● Queensland’s taxation per capita in 2021-22 was $3,757, which was $720 less the average of other jurisdictions. On average, Queenslanders paid $1,087 less tax than New South Wales residents and $928 less than Victorian residents.429 | Deputy Premier, Treasurer and Minister for Trade and Investment | ||||
| Fiscal Principle 5: Target the full funding of long-term liabilities such as superannuation and workers’ compensation in accordance with actuarial advice. | Principle 5: A government priority to fully fund its long-term liabilities including superannuation and workers’ compensation.
● As at 30 June 2023, WorkCover Queensland was fully funded.425 ● The latest full actuarial review of the QSuper scheme was as at 30 June 2021 and found the scheme to be fully funded. The next triennial review will report on the funding status of the scheme as at 30 June 2024.425 | Deputy Premier, Treasurer and Minister for Trade and Investment | ||||
| Queensland Future Fund | The Queensland Future Fund (QFF) framework supports Queensland’s future economic success.
The Debt Retirement Fund (DRF) is the first fund established under the Queensland Future Fund Act 2020 (Qld) (QFF Act) with the sole purpose of debt reduction. It was established to grow investment assets to support the debt position and reduce relative net debt burden of the Queensland Government. | Outcomes:
● The balance of the DRF as at 30 June 2023 was $8.336 billion. 430 | Deputy Premier, Treasurer and Minister for Trade and Investment | |||
| Sustainable Investment | Queensland Government’s significant financial investments are managed by QIC Limited.
Investment decisions and portfolio structing is undertaken with a belief that material sustainability risk factors can impact the performance outcomes of investment portfolios.
Sustainability risks and opportunities are considered and managed as a fundamental part of the investment processes and form a primary consideration of investment decision-making. | Targets:
● Identify, consider and manage ESG risks and opportunities as part of the investment approaches of each investment team.431
Outcomes:
● QIC became a signatory to the Net Zero Asset Managers (NZAM) Initiative on 30 June 2023. This builds on QIC’s decarbonisation to date, with seven funds across the Real Estate and Infrastructure capabilities already having net zero emissions targets. 431
● Data management and ESG reporting: QIC is implementing a data strategy designed to facilitate greater analysis and depth of understanding across a broader range of ESG issues to further enhance decision making.431 |
Deputy Premier, Treasurer and Minister for Trade and Investment | |||
| Strengthening Integrity | The Queensland Government is committed to transparency and is working on implementing integrity plans which include:432
● release Cabinet submissions, agendas and decisions papers proactively ● strengthen lobbying and complains regulation ● develop a common framework to determine appropriate relationships among Ministers, their staff and senior public service officers. | Outcomes:
● The Integrity and Other Legislation Amendment Act 2022 (Qld) was assented to in December 2022, to implement some of the Yearbury Report and Coaldrake Report recommendations.433 ● The Integrity and Other Legislation Amendment Bill 2023 (Qld)433 was introduced on 16th June 2023 to implement the outstanding recommendations from the Coaldrake and Yearbury Reports to strengthen the regulation of lobbyists and lobbying activities through amendments to the Integrity Act 2009 (Qld) and enhance the independence of core integrity bodies through changes to the Auditor-General Act 2009 (Qld), Ombudsman Act 2001 (Qld), Right to Information Act 2009 (Qld), Integrity Act 2009 (Qld) and Crime and Corruption Act 2001 (Qld). |
Premier | |||
| December 2023 | Page | 66 |
Economic and Fiscal - Risk management
The government’s Economic and Fiscal risk management framework contains the following elements.
Figure 20: Examples of embedding economic and fiscal risk management into government operations
| Element | Description | |
Strong Controls |
● The Financial Accountability Act 2009 (Qld) (the FA Act) establishes the financial risk framework and primary control measures.434 | |
● Under the FA Act, the Treasurer prepares a Charter of Fiscal Responsibility. | ||
● The Treasurer regularly reports to Parliament on the outcomes the government has achieved against the objectives stated in the Charter of Fiscal Responsibility.435 | ||
● The Queensland Government’s Performance Management Framework Policy provides a structure for public sector planning, measuring and monitoring performance, and public reporting.436 | ||
| Public Reporting435 | ● The government publicly discloses its plans and intended results and achievements in the annual Queensland Budget, providing detail on its strategic direction, priorities, fiscal and economic policies, and major initiatives. | |
● Service Delivery Statements contain budgeted financial and non-financial information about each agency for the current and next financial year. | ||
● Each agency produces an annual report which documents its performance and includes audited financial statements. | ||
● The Queensland Government prepares an annual Report on State Finances (ROSF) and an annual mid-year Budget Update. The ROSF incorporates an Outcomes Report and audited financial statements. The Outcomes Report includes comparisons between financial years, as well as analysis of variances between budget and the outcomes. The mid-year Budget Update incorporates the changes to the state’s economic and fiscal position since the Queensland Budget. | ||
| Independent oversight and monitoring | ● Parliamentary Committees review the Budget by examining and reporting on the proposed expenditures, mainly through the estimates process. The committees hold public hearings at which Ministers and responsible senior public servants are questioned regarding the proposed expenditures for the relevant portfolio areas. | |
● The Auditor-General delivers public reports that contains findings, conclusions and recommendations on how the government can improve its performance. The Auditor- General is an independent officer, guided by professional auditing and accounting standards, that forms opinions about the reliability of financial statements.437 | ||
● The Queensland Ombudsman investigates complaints about the actions and decisions of Queensland agencies and provides the public timely, effective and independent review of administrative actions and decisions. They also review the management of public interest disclosures in the government. 438 | ||
● The Queensland Crime and Corruption Commission (CCC) deals with corruption that affects the Queensland public sector. It has the authority to deal with corruption in departments and statutory bodies, the Queensland Police Service, councils (local governments), universities, courts, tribunals and boards, and prisons.439 | ||
Economic and Fiscal - Metrics and targets
The Queensland Government uses a wide range of metrics and targets to assess, manage and monitor its economic and fiscal risks. Key targets and milestones are established by the Fiscal Principles and are identified in Economic and Fiscal - Policy response.
The government’s Fiscal Principles support economic and fiscal decision making. The determination of these principles is based on prudential benchmarks for sound financial management. Necessary measures to support the government’s strategy to drive recovery, restore its fiscal buffers and ensure its ongoing adequacy are being taken. The Fiscal Principles are reviewed each year as part of the annual Queensland Budget process.
The Queensland Budget and the Budget Update include metrics on the economic performance and outlook of the State of Queensland.
| December 2023 | Page | 67 |
Appendix A: Datasets
Queensland has a detailed and evolving set of sustainability datasets which readers can use to understand the Queensland Government’s risk profile. This appendix summarises the companion datasets and data dictionary, compiled by the Queensland Government Statistician’s Office and represents the latest available information at the time of release. The data dictionary provides a full set of definitions and sources for the indicators referenced in the datasets.
Note: Data and the department titles are accurate as at 10 November 2023
Metric 1: Total carbon dioxide emissions by gas type
Table: Total carbon dioxide equivalent emissions by gas type, Queensland
2004–05 (a) | 2013–14
| 2014–15
| 2015–16
| 2016–17
| 2017–18
| 2018–19
| 2019–20
| 2020–21
| ||||||||||||||||||||||||||||
CO2-e emissions (tonnes ‘000) | ||||||||||||||||||||||||||||||||||||
Carbon dioxide (CO2) | 146,990 | 116,590 | 115,186 | 105,823 | 109,919 | 114,537 | 104,532 | 101,581 | 88,121 | |||||||||||||||||||||||||||
Methane (CO2-e) | 42,333 | 46,143 | 45,558 | 45,152 | 45,472 | 48,505 | 46,709 | 45,640 | 44,569 | |||||||||||||||||||||||||||
Nitrous oxide (CO2-e) | 5,455 | 5,134 | 4,935 | 4,781 | 4,807 | 4,676 | 4,904 | 4,502 | 4,577 | |||||||||||||||||||||||||||
Other (CO2-e) | 1,208 | 1,828 | 1,930 | 2,012 | 2,063 | 2,078 | 2,262 | 2,278 | 2,399 | |||||||||||||||||||||||||||
Total carbon dioxide equivalent emissions (b) | 195,985 | 169,695 | 167,609 | 157,768 | 162,261 | 169,796 | 158,407 | 154,001 | 139,665 | |||||||||||||||||||||||||||
Population (persons) (c) | 3,918,494 | 4,719,653 | 4,777,692 | 4,845,152 | 4,926,380 | 5,006,623 | 5,088,847 | 5,165,613 | 5,215,814 | |||||||||||||||||||||||||||
Per capita CO2-e emissions (tonnes per person) | ||||||||||||||||||||||||||||||||||||
Carbon dioxide (CO2) | 37.51 | 24.70 | 24.11 | 21.84 | 22.31 | 22.88 | 20.54 | 19.66 | 16.89 | |||||||||||||||||||||||||||
Total carbon dioxide equivalent emissions (b) | 50.02 | 35.95 | 35.08 | 32.56 | 32.94 | 33.91 | 31.13 | 29.81 | 26.78 | |||||||||||||||||||||||||||
Source: CO2 – Australian Government, Department of Climate Change, Energy, the Environment and Water, Australia’s National Greenhouse Accounts, National Greenhouse Gas Inventory – UNFCCC classifications (as at 18 Sep 23).
Population – Australian Bureau of Statistics, National, state and territory population, March 2023.
(a) 2005 is the reference year. All emissions targets set by Queensland Government are based on emissions in the reference year.
(b) Total carbon dioxide equivalent emissions represent the State of Queensland’s direct emissions. Direct emissions, or total emissions, are the emissions released to the atmosphere as a direct result of an activity within the State of Queensland. Australia’s National Greenhouse accounts also provide information on industry indirect Scope 2 emissions. Industry emissions are captured within the greenhouse gas inventory and form part of the state’s direct carbon dioxide equivalent emissions.
(c) Population as at 30 June each year.
Note: For further information on the data presented in this table please refer to the Data Dictionary.
| December 2023 | Page | 68 |
Metric 2: Total carbon dioxide emissions by sector
Table: Total carbon dioxide equivalent emissions by sector, Queensland
| 2013–14 | 2014–15 | 2015–16 | 2016–17 | 2017–18 | 2018–19 | 2019–20 | 2020–21 | |||||||||||||||||||||||||
CO2-e emissions (tonnes ‘000) | ||||||||||||||||||||||||||||||||
Public electricity and heat production (CO2-e) | 42,708 | 48,232 | 50,159 | 51,156 | 53,146 | 51,701 | 49,439 | 46,944 | ||||||||||||||||||||||||
Stationary and industrial energy (CO2-e) (a) | 20,667 | 20,999 | 22,012 | 23,915 | 25,091 | 24,990 | 25,196 | 25,530 | ||||||||||||||||||||||||
Transport (CO2-e) | 21,000 | 21,183 | 22,223 | 22,316 | 23,655 | 23,581 | 22,050 | 21,761 | ||||||||||||||||||||||||
Agriculture (CO2-e) | 23,968 | 21,461 | 21,022 | 21,356 | 22,737 | 21,511 | 19,940 | 20,650 | ||||||||||||||||||||||||
Fugitive emissions (CO2-e) | 16,062 | 19,398 | 20,293 | 19,870 | 21,265 | 20,218 | 21,640 | 20,395 | ||||||||||||||||||||||||
Industrial processes (CO2-e) | 5,361 | 5,385 | 5,328 | 5,135 | 5,405 | 5,989 | 5,767 | 5,808 | ||||||||||||||||||||||||
Waste (CO2-e) | 3,026 | 3,065 | 3,109 | 2,955 | 3,087 | 3,137 | 3,338 | 3,097 | ||||||||||||||||||||||||
Land use (CO2-e) | 36,904 | 27,885 | 13,623 | 15,557 | 15,410 | 7,280 | 6,632 | -4,519 | ||||||||||||||||||||||||
Total direct carbon dioxide equivalent emissions (b) | 169,695 | 167,609 | 157,768 | 162,261 | 169,796 | 158,407 | 154,001 | 139,665 | ||||||||||||||||||||||||
Source: CO2 – Australian Government, Department of Climate Change, Energy, the Environment and Water, Australia’s National Greenhouse Accounts, National Greenhouse Gas Inventory – UNFCCC classifications (as at 26 Sep 2023).
| (a) | Stationary and Industrial Energy (CO2-e) are calculated by subtracting the sum of all other data items from the Total direct carbon dioxide equivalent emissions. |
| (b) | Total carbon dioxide equivalent emissions represent the State of Queensland’s direct emissions. Direct emissions, or total emissions, are the emissions released to the atmosphere as a direct result of an activity within the State of Queensland. Australia’s National Greenhouse accounts also provide information on industry indirect Scope 2 emissions. Industry emissions are captured within the greenhouse gas inventory and form part of the state’s direct carbon dioxide equivalent emissions. |
Note: For further information on the data presented in this table please refer to the Data Dictionary.
Metric 3: Sulphur dioxide emissions
Table: Sulphur dioxide emissions, Queensland
| 2013–14 | 2014–15 | 2015–16 | 2016–17 | 2017–18 | 2018–19 | 2019–20 | 2020–21 | |||||||||||||||||||||||||
Tonnes (‘000) | ||||||||||||||||||||||||||||||||
SO2emissions | 183.2 | 191.7 | 196.6 | 200.3 | 204.7 | 200.4 | 191.2 | 187.6 | ||||||||||||||||||||||||
Source: SO2 – Australian Government, Department of Climate Change, Energy, the Environment and Water, Australia’s National Greenhouse Accounts, National Greenhouse Gas Inventory – UNFCCC classifications (as at 18 Sep 2023).
Note: For further information on the data presented in this table please refer to the Data Dictionary.
| December 2023 | Page | 69 |
Metric 4: Non-methane volatile organic compound emissions
Table: Non-methane volatile organic compound (NMVOC) emissions Kt, Queensland
| 2013–14 | 2014–15 | 2015–16 | 2016–17 | 2017–18 | 2018–19 | 2019–20 | 2020–21 | |||||||||||||||||||||||||
Tonnes (‘000) | ||||||||||||||||||||||||||||||||
NMVOC emissions | 439.7 | 422.3 | 412.2 | 413.3 | 394.8 | 368.4 | 328.2 | 310.6 | ||||||||||||||||||||||||
Source: NMVOC - Australian Government, Department of Climate Change, Energy, the Environment and Water, Australia’s National Greenhouse Accounts, National Greenhouse Gas Inventory – UNFCCC classifications (as at 18 Sep 23).
Note: For further information on the data presented in this table please refer to the Data Dictionary.
Metric 5: Renewable energy as a share of total energy consumed in Queensland
Table: Renewable energy as a share of total energy consumed, Queensland (a)
| 2016–17 | 2017–18 | 2018–19 | 2019–20 | 2020–21 | 2021–22 | 2022–23 | ||||||||||||||||||||||
Per cent | ||||||||||||||||||||||||||||
Renewable energy as a share of total energy consumed in Queensland | 7.0 | 8.5 | 12.9 | 17.2 | 20.2 | 21.4 | 26.0 | |||||||||||||||||||||
Source: Department of Energy and Public Works Annual Report 2022–23, page 22.
PV = Photovoltaic
| (a) | Data are based on energy consumed. Energy consumed differs from electricity generated. |
| (b) | The government has not set annual targets for the 50% target by 2030. Output of renewable energy generation on an annual basis is a market outcome and can vary year-to-year depending on a range of factors including electricity demand, the rate of deployment of projects and climatic variations (for example, resulting in higher or lower solar/wind/water resource availability). |
Note: For further information on the data presented in this table please refer to the Data Dictionary.
| December 2023 | Page | 70 |
Metric 6: Electricity generation by fuel type (Non-renewable & Renewable), financial year
Table: Electricity generation by fuel type, physical units, Queensland (a)
| 2014–15 | 2015–16 | 2016–17 | 2017–18 | 2018–19 | 2019–20 | 2020–21 | 2021–22 | |||||||||||||||||||||||||
Gigawatt hours | ||||||||||||||||||||||||||||||||
Non-renewable fuels: | ||||||||||||||||||||||||||||||||
Black coal | 44,553.8 | 48,015.8 | 51,042.7 | 53,635.3 | 52,120.6 | 48,568.9 | 46,248.2 | 44,460.9 | ||||||||||||||||||||||||
Natural gas | 18,248.5 | 13,816.9 | 12,236.6 | 11,045.5 | 9,933.9 | 11,214.1 | 10,324.4 | 9,505.4 | ||||||||||||||||||||||||
Oil products | 1,197.2 | 1,199.1 | 1,215.9 | 1,047.7 | 1,000.6 | 983.7 | 1,034.9 | 1,098.3 | ||||||||||||||||||||||||
Total non-renewable | 63,999.5 | 63,031.9 | 64,495.2 | 65,728.5 | 63,055.1 | 60,766.8 | 57,607.5 | 55,064.6 | ||||||||||||||||||||||||
Renewable fuels: | ||||||||||||||||||||||||||||||||
Bagasse, wood | 1,550.3 | 1,656.3 | 1,291.8 | 1,252.9 | 1,157.9 | 1,029.8 | 1,076.4 | 990.3 | ||||||||||||||||||||||||
Biogas | 91.1 | 115.5 | 118.3 | 126.5 | 175.1 | 189.2 | 198.5 | 223.5 | ||||||||||||||||||||||||
Wind | 32.5 | 28.4 | 29.0 | 30.3 | 399.1 | 927.9 | 1,826.0 | 1,850.1 | ||||||||||||||||||||||||
Hydro | 649.1 | 491.7 | 672.2 | 646.1 | 1,057.3 | 634.6 | 950.2 | 1,118.9 | ||||||||||||||||||||||||
Large-scale solar PV | 5.9 | 7.3 | 34.1 | 171.5 | 1,491.7 | 3,334.5 | 3,395.8 | 3,766.1 | ||||||||||||||||||||||||
Small-scale solar PV | 1,788.0 | 2,055.9 | 2,335.9 | 2,760.9 | 3,330.2 | 4,120.2 | 5,160.9 | 6,219.6 | ||||||||||||||||||||||||
Geothermal | 0.6 | 0.2 | 0.5 | n.a. | n.a. | n.a. | n.a. | n.a. | ||||||||||||||||||||||||
Total renewable | 4,117.5 | 4,355.3 | 4,481.7 | 4,988.1 | 7,611.4 | 10,236.2 | 12,607.9 | 14,168.5 | ||||||||||||||||||||||||
Total | 68,117.0 | 67,387.1 | 68,976.8 | 70,716.6 | 70,666.5 | 71,003.0 | 70,215.4 | 69,233.1 | ||||||||||||||||||||||||
Renewable (per cent of total) | 6.0 | 6.5 | 6.5 | 7.1 | 10.8 | 14.4 | 18.0 | 20.5 | ||||||||||||||||||||||||
Source: Department of Climate Change, Energy, the Environment and Water, Australian Energy Update, 2023, Table O.
PV = Photovoltaic
| (a) | Data are based on electricity generation. Electricity generation differs from energy consumption. |
| (b) | Data are based on financial year. Financial year data will differ to data reported by calendar year. |
| (c) | Total electricity generation in Queensland includes off-grid systems and generation by businesses and households for their own use. These figures are different to the metric used for reporting against Queensland’s 50% renewable energy target by 2030 (Metric 5). The Queensland Government currently reports a measure of renewable energy generation in Queensland as a proportion of electricity consumption within Queensland (excluding exports). i.e. An estimate of the proportion of electricity consumed in Queensland that is generated from renewable sources. |
Note: For further information on the data presented in this table please refer to the Data Dictionary.
| December 2023 | Page | 71 |
Metric 7: Electricity generation by fuel type (Non-renewable & Renewable), calendar year
Table: Electricity generation (a) by fuel type, physical units, Queensland (b)(c)
| 2015 | 2016 | 2017 | 2018 | 2019 | 2020 | 2021 | 2022 | |||||||||||||||||||||||||
Gigawatt hours | ||||||||||||||||||||||||||||||||
Non-renewable fuels: | ||||||||||||||||||||||||||||||||
Black coal | 46,368.5 | 49,884.2 | 52,444.3 | 52,946.8 | 50,114.1 | 47,083.9 | 45,199.5 | 43,324.5 | ||||||||||||||||||||||||
Natural gas | 15,770.3 | 12,532.9 | 11,661.4 | 10,416.2 | 10,564.1 | 11,531.3 | 9,685.2 | 9,732.6 | ||||||||||||||||||||||||
Oil products | 1,080.3 | 1,172.0 | 1,164.2 | 1,024.1 | 1,000.8 | 985.0 | 1,084.3 | 1,042.6 | ||||||||||||||||||||||||
Total non-renewable | 63,219.1 | 63,589.1 | 65,269.8 | 64,387.1 | 61,679.0 | 59,600.2 | 55,969.0 | 54,099.8 | ||||||||||||||||||||||||
Renewable fuels: | ||||||||||||||||||||||||||||||||
Biomass | 1,639.6 | 1,540.8 | 1,422.2 | 1,378.7 | 1,269.4 | 1,218.2 | 1,237.9 | 1,231.3 | ||||||||||||||||||||||||
Wind | 30.8 | 26.6 | 28.5 | 140.6 | 624.5 | 1,364.5 | 1,761.2 | 1,916.3 | ||||||||||||||||||||||||
Hydro | 506.9 | 543.5 | 662.1 | 825.2 | 1,067.7 | 650.8 | 1,066.1 | 1,214.2 | ||||||||||||||||||||||||
Large-scale solar PV | 8.0 | 17.1 | 85.8 | 818.6 | �� | 2,733.4 | 3,396.0 | 3,449.1 | 4,438.9 | |||||||||||||||||||||||
Small-scale solar PV | 1,922.7 | 2,177.4 | 2,525.5 | 3,024.1 | 3,692.5 | 4,607.3 | 5,716.9 | 6,687.4 | ||||||||||||||||||||||||
Geothermal | 0.4 | 0.4 | 0.3 | n.a. | n.a. | n.a. | 0.0 | 0.0 | ||||||||||||||||||||||||
Total renewable | 4,108.4 | 4,305.8 | 4,724.4 | 6,187.1 | 9,387.4 | 11,236.7 | 13,231.3 | 15,488.1 | ||||||||||||||||||||||||
Total | 67,327.5 | 67,894.9 | 69,994.2 | 70,574.2 | 71,066.5 | 70,836.9 | 69,200.2 | 69,587.9 | ||||||||||||||||||||||||
Renewable (per cent of total) | 6.1 | 6.3 | 6.7 | 8.8 | 13.2 | 15.9 | 19.1 | 22.3 | ||||||||||||||||||||||||
Source: Department of Climate Change, Energy, the Environment and Water, Australian Energy Update, 2023, Table O.
PV = Photovoltaic
| (a) | Data are based on electricity generation. Electricity generation differs from energy consumption. |
| (b) | Calendar year data includes some estimates based on financial year data where detailed calendar year data is not available. Calendar year data will differ to data reported by financial year. |
| (c) | Total electricity generation in Queensland includes off-grid systems and generation by businesses and households for their own use. These figures are different to the metric used for reporting against Queensland’s 50% renewable energy target by 2030 (Metric 5). The Queensland Government currently reports a measure of renewable energy generation in Queensland as a proportion of electricity consumption within Queensland (excluding exports). i.e. An estimate of the proportion of electricity consumed in Queensland that is generated from renewable sources. |
Note: For further information on the data presented in this table please refer to the Data Dictionary.
| December 2023 | Page | 72 |
Metric 8: Primary energy consumption by fuel type, GSP, population and energy intensity
Table: Primary energy consumption by fuel type, Queensland (a)
| 2014–15 | 2015–16 | 2016–17 | 2017–18 | 2018–19 | 2019–20 | 2020–21 | 2021–22 | |||||||||||||||||||||||||
Petajoules | ||||||||||||||||||||||||||||||||
Coal | 485 | 518 | 544 | 571 | 554 | 524 | 506 | 486 | ||||||||||||||||||||||||
Oil | 556 | 543 | 564 | 579 | 577 | 544 | 502 | 505 | ||||||||||||||||||||||||
Gas | 295 | 296 | 310 | 302 | 294 | 313 | 313 | 306 | ||||||||||||||||||||||||
Renewables | 123 | 120 | 130 | 121 | 124 | 127 | 140 | 143 | ||||||||||||||||||||||||
Statistical discrepancy | -22 | -13 | -15 | -24 | -20 | -22 | -18 | -11 | ||||||||||||||||||||||||
Total | 1,436 | 1,465 | 1,532 | 1,548 | 1,530 | 1,486 | 1,443 | 1,428 | ||||||||||||||||||||||||
Population (million persons) (b) | 4.78 | 4.85 | 4.93 | 5.01 | 5.09 | 5.17 | 5.22 | 5.32 | ||||||||||||||||||||||||
Renewables on a per capita basis (GJ/person) | 25.6 | 24.8 | 26.3 | 24.1 | 24.3 | 24.6 | 26.8 | 26.9 | ||||||||||||||||||||||||
GSP ($ million) | 327,729 | 335,443 | 344,040 | 357,495 | 360,960 | 357,646 | 368,192 | 384,508 | ||||||||||||||||||||||||
Energy consumption per capita (GJ/person) | 300.6 | 302.3 | 311.0 | 309.3 | 300.6 | 287.7 | 276.6 | 268.3 | ||||||||||||||||||||||||
Energy intensity (GJ/GSP $ million) | 4,382 | 4,366 | 4,453 | 4,331 | 4,237 | 4,156 | 3,918 | 3,713 | ||||||||||||||||||||||||
Source: Department of Climate Change, Energy, the Environment and Water, Australian Energy Update, Table C, 2023.
PJ = Petajoules GJ = Gigajoules 1 Petajoule is equivalent to 1,000,000 Gigajoule.
Population – Australian Bureau of Statistics, National, state and territory population, March 2023.
GSP – Australian Bureau of Statistics, Australian National Accounts: State Accounts, 2021–22, CVM (2020–21 reference year). Note calculations for Energy Intensity (GJ/$ million) and Energy Productivity ($ million/PJ) are based on this dataset.
| (a) | These figures are different to the metric used for reporting against Queensland’s 50% renewable energy target by 2030 (Metric 5). The Queensland Government currently reports a measure of renewable energy generation in Queensland as a proportion of electricity consumption within Queensland (excluding exports). i.e. An estimate of the proportion of electricity consumed in Queensland that is generated from renewable sources. |
| (b) | Population as at 30 June each year. |
Note: For further information on the data presented in this table please refer to the Data Dictionary.
| December 2023 | Page | 73 |
Metric 9: Electricity consumption by industry and residential
Table: Electricity consumption by industry and residential, Queensland (a)
| 2014–15 | 2015–16 | 2016–17 | 2017–18 | 2018–19 | 2019–20 | 2020–21 | 2021–22 | |||||||||||||||||||||||||
Petajoules | ||||||||||||||||||||||||||||||||
Agriculture, forestry and fishing | 1.4 | 1.3 | 1.1 | 1.4 | 1.5 | 1.4 | 1.2 | 0.9 | ||||||||||||||||||||||||
Mining | 31.0 | 40.1 | 45.5 | 47.2 | 50.3 | 51.0 | 50.5 | 50.3 | ||||||||||||||||||||||||
Manufacturing | 58.2 | 57.9 | 54.0 | 50.8 | 49.6 | 49.1 | 49.4 | 48.9 | ||||||||||||||||||||||||
Electricity supply (b) | 25.9 | 24.5 | 25.9 | 26.2 | 26.1 | 26.1 | 26.5 | 27.5 | ||||||||||||||||||||||||
Gas supply | 0.1 | 0.1 | 0.1 | 0.1 | 0.0 | 0.0 | 0.1 | 0.1 | ||||||||||||||||||||||||
Water supply, sewerage and drainage services | 1.0 | 1.6 | 1.6 | 1.7 | 2.5 | 2.5 | 2.4 | 2.2 | ||||||||||||||||||||||||
Construction | 1.6 | 2.0 | 1.5 | 1.5 | 1.3 | 1.3 | 1.3 | 1.3 | ||||||||||||||||||||||||
Transport, postal and warehousing | 6.9 | 6.7 | 6.3 | 6.4 | 6.6 | 6.7 | 6.4 | 6.6 | ||||||||||||||||||||||||
Commercial and services (c) | 53.1 | 51.7 | 51.7 | 49.7 | 48.9 | 45.2 | 43.8 | 44.3 | ||||||||||||||||||||||||
Residential | 43.9 | 44.2 | 45.6 | 45.5 | 47.6 | 50.4 | 53.3 | 56.1 | ||||||||||||||||||||||||
Total | 223.1 | 230.1 | 233.2 | 230.4 | 234.5 | 233.8 | 234.8 | 238.1 | ||||||||||||||||||||||||
Source: Department of Climate Change, Energy, the Environment and Water, Australian Energy Update, Table F, 2023.
| (a) | Electricity consumption excludes solar energy produced by households and industry for own use |
| (b) | Electricity supply is treated as a separate industry sector that uses electricity in the process of generating the electricity consumed by all other sectors |
| (c) | Includes ANZSIC Divisions F, G, H, J, K, L, M, N, O, P, Q, R, S |
Note: For further information on the data presented in this table please refer to the Data Dictionary.
| December 2023 | Page | 74 |
Metric 10: Waste management
Table: Waste management, Queensland (a)
| 2014–15 | 2015–16 | 2016–17 | 2017–18 | 2018–19 | 2019–20 | 2020–21 | 2021–22 | |||||||||||||||||||||||||
Tonnes | ||||||||||||||||||||||||||||||||
Waste recovered (b) | 3,673,189 | 4,043,345 | 4,363,392 | 4,944,825 | 5,371,861 | 4,760,943 | 5,223,890 | 4,769,530 | ||||||||||||||||||||||||
Total waste | 8,439,043 | 9,165,361 | 9,813,843 | 10,891,988 | 11,036,686 | 8,798,319 | 9,300,311 | 9,259,601 | ||||||||||||||||||||||||
Waste recovered (b) (per cent) | 43.5 | 44.1 | 44.5 | 45.4 | 48.7 | 54.1 | 56.2 | 51.5 | ||||||||||||||||||||||||
Population (c) | 4,777,692 | 4,845,152 | 4,926,380 | 5,006,623 | 5,088,847 | 5,165,613 | 5,215,814 | 5,320,711 | ||||||||||||||||||||||||
Waste recovered per capita (b) | 0.77 | 0.83 | 0.89 | 0.99 | 1.06 | 0.92 | 1.00 | 0.90 | ||||||||||||||||||||||||
Total waste per capita | 1.77 | 1.89 | 1.99 | 2.18 | 2.17 | 1.70 | 1.78 | 1.74 | ||||||||||||||||||||||||
Source: Queensland Government, Recycling and waste in Queensland report 2022.
Population – Australian Bureau of Statistics, National, state and territory population, March 2023.
| (a) | Waste includes incoming interstate waste. |
| (b) | Waste recovered is waste that has been diverted from landfill. It includes material that has been recycled, reprocessed or stockpiled for future use. |
| (c) | Population as at 30 June each year. |
Note: For further information on the data presented in this table please refer to the Data Dictionary.
| December 2023 | Page | 75 |
Metric 11: Threatened species
Table: Threatened species by taxonomic group and conservation status, Queensland, as at 30 June 2023
| Extinct | Extinct in the wild | Critically endangered | Endangered | Vulnerable | Total | |||||||||||||||||||
Count of species | ||||||||||||||||||||||||
Fauna: | ||||||||||||||||||||||||
Amphibians | 0 | 3 | 11 | 7 | 17 | 38 | ||||||||||||||||||
Birds | 0 | 1 | 7 | 25 | 37 | 70 | ||||||||||||||||||
Cartilaginous fish | 0 | 0 | 0 | 1 | 0 | 1 | ||||||||||||||||||
Ray-finned fish | 0 | 0 | 2 | 6 | 3 | 11 | ||||||||||||||||||
Mammals | 5 | 5 | 2 | 22 | 24 | 58 | ||||||||||||||||||
Reptiles | 0 | 0 | 15 | 17 | 24 | 56 | ||||||||||||||||||
Insects | 0 | 0 | 1 | 2 | 5 | 8 | ||||||||||||||||||
Decapods | 0 | 0 | 5 | 6 | 1 | 12 | ||||||||||||||||||
Molluscs | 0 | 0 | 0 | 2 | 1 | 3 | ||||||||||||||||||
Fauna total | 5 | 9 | 43 | 88 | 112 | 257 | ||||||||||||||||||
Flora: | ||||||||||||||||||||||||
Ferns and fern allies | 0 | 7 | 10 | 10 | 35 | 62 | ||||||||||||||||||
Cycads, conifers | 0 | 0 | 0 | 10 | 15 | 25 | ||||||||||||||||||
Flowering plants | 0 | 10 | 86 | 189 | 419 | 704 | ||||||||||||||||||
Green algae | 0 | 0 | 0 | 0 | 1 | 1 | ||||||||||||||||||
Flora total | 0 | 17 | 96 | 209 | 470 | 792 | ||||||||||||||||||
Total | 5 | 26 | 139 | 297 | 582 | 1,049 | ||||||||||||||||||
Source: Queensland Department of Environment and Science, Nature Conservation (Animals) Regulation 2020 and Nature Conservation (Plants) Regulation 2020, unpublished data.
Note: For further information on the data presented in this table please refer to the Data Dictionary.
| December 2023 | Page | 76 |
Metric 12: Threatened species time series
Table: Threatened species by taxonomic group over time, Queensland
| 20-Sep-19 | 30-Apr-21 | 8-Apr-22 | 30-Jun-23 | |||||||||||||
Count of species | ||||||||||||||||
Fauna: | ||||||||||||||||
Amphibians | 35 | 36 | 37 | 38 | ||||||||||||
Birds | 65 | 65 | 65 | 70 | ||||||||||||
Cartilaginous fish | 1 | 1 | 1 | 1 | ||||||||||||
Ray-finned fish | 8 | 9 | 9 | 11 | ||||||||||||
Mammals | 54 | 54 | 57 | 58 | ||||||||||||
Reptiles | 52 | 50 | 52 | 56 | ||||||||||||
Insects | 8 | 8 | 8 | 8 | ||||||||||||
Decapods | 2 | 10 | 10 | 12 | ||||||||||||
Molluscs | 3 | 3 | 3 | 3 | ||||||||||||
Fauna total | 228 | 236 | 242 | 257 | ||||||||||||
Flora: | ||||||||||||||||
Ferns and fern allies | 65 | 61 | 62 | 62 | ||||||||||||
Cycads, conifers | 12 | 25 | 25 | 25 | ||||||||||||
Flowering plants | 655 | 697 | 704 | 704 | ||||||||||||
Green algae | 1 | 1 | 1 | 1 | ||||||||||||
Flora total | 733 | 784 | 792 | 792 | ||||||||||||
Total | 961 | 1,020 | 1,034 | 1,049 | ||||||||||||
Source: Queensland Department of Environment and Science, Nature Conservation (Wildlife) Regulation 2006 (unpublished data); Nature Conservation (Animals) Regulation 2020 and Nature Conservation (Plants) Regulation 2020, unpublished data.
Note: For further information on the data presented in this table please refer to the Data Dictionary.
| December 2023 | Page | 77 |
Metric 13: Forest conversions
Table: Forest conversions, Queensland
| 2013–14 | 2014–15 | 2015–16 | 2016–17 | 2017–18 | 2018–19 | 2019–20 | 2020–21 | |||||||||||||||||||||||||
Hectares (‘000) | ||||||||||||||||||||||||||||||||
Annual area of primary forest converted | 43 | 43 | 46 | 43 | 35 | 24 | 17 | 10 | ||||||||||||||||||||||||
Annual area of secondary forest converted | 263 | 262 | 305 | 297 | 277 | 208 | 155 | 75 | ||||||||||||||||||||||||
Annual area of identified regrowth | 376 | 343 | 331 | 212 | 175 | 166 | 157 | 64 | ||||||||||||||||||||||||
Net clearing of forests (conversions identified less regrowth) | -70 | -38 | 20 | 127 | 136 | 66 | 14 | 20 | ||||||||||||||||||||||||
Source: Australian Government, Department of Climate Change, Energy, the Environment and Water, Activity Table 1990-2021 - LULUCF.
Forest conversions: The clearing of natural forests (deforestation) to use the land for another purpose.
Net clearing: Conversions identified minus regrowth.
Note: For further information on the data presented in this table please refer to the Data Dictionary.
Metric 14: Forest area by estate type
Table: Protected areas - parks, forests and reserves by estate type, Queensland
| Estate type | 01-May-18 | 05-Jun-20 | 26-Jul-21 | 28-Mar-22 | 01-Feb-23 | |||||||||||||||
Land area (km2) | ||||||||||||||||||||
National Park | 97,683 | 98,071 | 98,227 | 97,177 | 97,593 | |||||||||||||||
State Forest | 31,037 | 31,045 | 31,046 | 30,984 | 31,040 | |||||||||||||||
Timber Reserve | 663 | 663 | 663 | 663 | 664 | |||||||||||||||
Forest Reserve | 541 | 540 | 540 | 540 | 501 | |||||||||||||||
Total | 129,924 | 130,320 | 130,477 | 129,364 | 129,799 | |||||||||||||||
Source: Former Queensland Department of Environment and Science, Protected Areas of Queensland.
Note: For further information on the data presented in this table please refer to the Data Dictionary.
| December 2023 | Page | 78 |
Metric 15: Agricultural land
Table: Agricultural land by use, Queensland
| 2014–15 | 2015–16 | 2016–17 | 2017–18 | 2018–19 | 2019–20 | 2020–21 | ||||||||||||||||||||||
Land area (km2) | ||||||||||||||||||||||||||||
Crops | 33,515 | 32,267 | 31,812 | 34,577 | 31,810 | 31,670 | 35,136 | |||||||||||||||||||||
Grazing | 1,187,167 | 1,166,021 | 1,293,725 | 1,296,509 | 1,230,342 | 1,204,036 | 1,256,549 | |||||||||||||||||||||
Forestry | 480 | 3,094 | 1,950 | 2,118 | 2,535 | 1,765 | 4,316 | |||||||||||||||||||||
Other | 206 | 342 | 231 | 157 | 231 | 215 | 292 | |||||||||||||||||||||
Total used for agriculture | 1,221,367 | 1,201,723 | 1,327,718 | 1,333,361 | 1,264,919 | 1,237,685 | 1,296,293 | |||||||||||||||||||||
Agricultural land area as a per cent of total land area (per cent) | 70.6 | 69.5 | 76.7 | 77.1 | 73.1 | 71.5 | 74.9 | |||||||||||||||||||||
Source: 2014–15 to 2016–17: Australian Bureau of Statistics, Land Management and Farming in Australia, various years; 2017–18 to 2020–21: Australian Bureau of Statistics, Agricultural Commodities, Australia, various years.
Note: For further information on the data presented in this table please refer to the Data Dictionary.
Metric 16: Water supply
Table: Physical water supply by water type, Queensland
| 2014–15 | 2015–16 | 2016–17 | 2017–18 | 2018–19 | 2019–20 | 2020–21 | 2021–22 | |||||||||||||||||||||||||
Megalitres | ||||||||||||||||||||||||||||||||
Self-extracted | 4,747,323 | 4,581,801 | 4,363,946 | 4,482,526 | 3,814,745 | 3,980,205 | 4,183,578 | 4,335,607 | ||||||||||||||||||||||||
Distributed | 2,520,114 | 2,346,911 | 2,206,781 | 2,181,332 | 1,879,255 | 2,158,604 | 2,277,073 | 2,518,307 | ||||||||||||||||||||||||
Waste water | 378,385 | 358,142 | 364,350 | 384,520 | 371,191 | 379,187 | 403,483 | 479,966 | ||||||||||||||||||||||||
Reuse | 68,074 | 68,472 | 64,042 | 57,720 | 61,166 | 59,809 | 59,724 | 55,445 | ||||||||||||||||||||||||
Return flows (a) | 1,155,577 | 1,117,363 | 1,023,274 | 1,119,557 | 1,093,059 | 1,114,831 | 1,102,684 | 1,269,148 | ||||||||||||||||||||||||
Total supply | 8,869,473 | 8,472,689 | 8,022,393 | 8,225,655 | 7,219,416 | 7,692,636 | 8,026,542 | 8,658,473 | ||||||||||||||||||||||||
Source: Australian Bureau of Statistics, Water Account, 2021–22, Table 5. Physical Supply and Use, by Water Type, Queensland.
(a) Return flows represents the flows of water from industries and households to the environment.
Note: For further information on the data presented in this table please refer to the Data Dictionary.
| December 2023 | Page | 79 |
Metric 17: Water use
Table: Physical water use by customer category, Queensland
| 2014–15 | 2015–16 | 2016–17 | 2017–18 | 2018–19 | 2019–20 | 2020–21 | 2021–22 | |||||||||||||||||||||||||
Megalitres | ||||||||||||||||||||||||||||||||
Agriculture, forestry and fishing (a) | 1,178,912 | 2,597,544 | 2,548,493 | 2,573,131 | 1,852,006 | 1,943,503 | 2,239,118 | 2,360,818 | ||||||||||||||||||||||||
Mining (b) | 265,459 | 263,370 | 256,932 | 261,650 | 247,490 | 259,729 | 256,794 | 237,855 | ||||||||||||||||||||||||
Manufacturing (c) | 184,327 | 169,181 | 169,210 | 182,411 | 182,929 | 198,154 | 202,279 | 177,141 | ||||||||||||||||||||||||
Water supply, sewerage and drainage services (d) | 3,267,636 | 3,083,608 | 2,878,978 | 2,857,675 | 2,594,574 | 2,906,234 | 3,025,723 | 3,317,540 | ||||||||||||||||||||||||
Other industries = Total industry - (a+b+c+d) | 2,485,725 | 901,353 | 806,623 | 890,427 | 900,375 | 900,877 | 837,201 | 949,464 | ||||||||||||||||||||||||
Total industry (e) | 7,382,058 | 7,015,055 | 6,660,236 | 6,765,293 | 5,777,374 | 6,208,497 | 6,561,116 | 7,042,818 | ||||||||||||||||||||||||
Households | 331,838 | 340,271 | 338,882 | 340,804 | 348,983 | 369,308 | 362,742 | 346,506 | ||||||||||||||||||||||||
Environment (f) | 1,155,577 | 1,117,363 | 1,023,274 | 1,119,557 | 1,093,059 | 1,114,831 | 1,102,684 | 1,269,148 | ||||||||||||||||||||||||
Total use | 8,869,473 | 8,472,689 | 8,022,393 | 8,225,655 | 7,219,416 | 7,692,636 | 8,026,542 | 8,658,473 | ||||||||||||||||||||||||
Source: Australian Bureau of Statistics, Water Account, 2021–22, Table 5. Physical Supply and Use, by Water Type, Queensland.
| (a) | Agriculture, forestry and fishing will be an under-estimate of use as the ABS has made sub-components for Distributed and/or Reuse supply not available for publication from 2014-15 and 2015-16. |
| (b) | Mining will be an under-estimate of use as the ABS has made sub-components for Reuse supply not available for publication from 2014-15 to 2016-17. |
| (c) | Manufacturing will be an under-estimate of use as the ABS has made sub-components for Reuse supply not available for publication in 2015-16. |
| (d) | Water supply, sewerage and drainage services will be an under-estimate of use as the ABS has made sub-components for Distributed and/or Reuse supply not available for publication in 2014-15. |
| (e) | Total industry includes, in addition to the four separately identified industries, industry users for which the ABS has decided are not available for publication. |
| (f) | Return flows represents the flows of water from industries and households to the environment. |
Note: For further information on the data presented in this table please refer to the Data Dictionary.
| December 2023 | Page | 80 |
Metric 18: Marine Park area
Table: Marine Park Area
| 2023 | ||||||
Land area (km2) | ||||||
Great Barrier Reef Coast | 63,262 | |||||
Moreton Bay | 3,463 | |||||
Great Sandy | 5,933 | |||||
Total | 72,658 | |||||
Source: Former Queensland Department of Environment and Science.
Note: For further information on the data presented in this table please refer to the Data Dictionary.
Metric 19: Particulate Matter
Table: Emissions of Particulate Matter (PM 2.5 and PM 10), Queensland
| 2013–14 | 2014–15 | 2015–16 | 2016–17 | 2017–18 | 2018–19 | 2019–20 | 2020–21 | |||||||||||||||||||||||||
Tonnes (‘000) | ||||||||||||||||||||||||||||||||
PM 2.5 | 780 | 708 | 682 | 685 | 622 | 576 | 447 | 406 | ||||||||||||||||||||||||
PM 10 | 360 | 348 | 347 | 316 | 273 | 278 | 302 | 290 | ||||||||||||||||||||||||
Source: PM2.5/PM10 – Australian Government, Department of Climate Change, Energy, the Environment and Water, Australia’s National Greenhouse Accounts, National Greenhouse Gas Inventory – UNFCCC classifications (as at 19 Sep 2023).
Note: For further information on the data presented in this table please refer to the Data Dictionary.
Metric 20: Labour force participation and unemployment
Table: Labour force participation and unemployment, Queensland
| 2015–16 | 2016–17 | 2017–18 | 2018–19 | 2019–20 | 2020–21 | 2021–22 | 2022–23 | |||||||||||||||||||||||||
Per cent | ||||||||||||||||||||||||||||||||
Participation rate (ages 15 to 64 years) |
| |||||||||||||||||||||||||||||||
Males | 82.5 | 81.6 | 82.9 | 82.5 | 82.6 | 83.4 | 83.9 | 83.6 | ||||||||||||||||||||||||
Females | 72.4 | 71.9 | 73.9 | 74.1 | 73.5 | 75.2 | 76.8 | 77.1 | ||||||||||||||||||||||||
Persons | 77.4 | 76.7 | 78.3 | 78.3 | 78.0 | 79.2 | 80.3 | 80.3 | ||||||||||||||||||||||||
Male and female gap | 10.1 | 9.6 | 9.1 | 8.3 | 9.1 | 8.2 | 7.1 | 6.5 | ||||||||||||||||||||||||
Unemployment rate (ages 15 to 64 years) |
| |||||||||||||||||||||||||||||||
Persons | 6.3 | 6.4 | 6.2 | 6.3 | 6.6 | 6.9 | 4.6 | 3.7 | ||||||||||||||||||||||||
Youth unemployment rate (ages 15 to 24 years) |
| |||||||||||||||||||||||||||||||
Persons | 12.8 | 13.5 | 13.1 | 13.1 | 15.2 | 13.6 | 10.1 | 8.2 | ||||||||||||||||||||||||
Source: Australian Bureau of Statistics, Labour Force, Australia, Detailed, September 2023.
Note: For further information on the data presented in this table please refer to the Data Dictionary.
| December 2023 | Page | 81 |
Metric 21: Employment by Indigenous status
Table: Employment (persons aged 25 to 64 years) by Indigenous status, Queensland
| 1991 | 1996 | 2001 | 2006 | 2011 | 2016 | 2021 | ||||||||||||||||||||||
Per cent | ||||||||||||||||||||||||||||
Aboriginal and Torres Strait Islander people | 46.9 | 49.3 | 50.4 | 57.7 | 54.1 | 52.1 | 57.2 | |||||||||||||||||||||
Non-Indigenous persons | 67.6 | 69.2 | 70.0 | 74.9 | 76.1 | 75.8 | 78.5 | |||||||||||||||||||||
Source: Australian Government Productivity Commission, Closing the Gap website (as at 23 Aug 2023); Australian Census of Population and Housing, 1991–2021.
Note: For further information on the data presented in this table please refer to the Data Dictionary.
Metric 22: Life expectancy - Aboriginal and Torres Strait Islander people
Table: Life expectancy at birth, Aboriginal and Torres Strait Islander people, Queensland
| 2005–2007 | 2010–2012 | 2015–2017 | ||||||||||
Years | ||||||||||||
Males | 68.3 | 68.7 | 72.0 | |||||||||
Females | 73.6 | 74.4 | 76.4 | |||||||||
Source: Australian Bureau of Statistics, Life Tables for Aboriginal and Torres Strait Islander Australians, various editions.
Note: For further information on the data presented in this table please refer to the Data Dictionary.
Metric 23: Family violence service use
Table: Domestic and family violence counselling service users with cases closed, Queensland (a)
| 2019–20 | 2020–21 | 2021–22 | 2022–23 | |||||||||||||
Number | ||||||||||||||||
Domestic and family violence counselling service users with cases closed | 24,442 | 23,816 | 26,762 | 26,567 | ||||||||||||
Source: Queensland Department of Justice and Attorney-General Annual Report 2019-20; 2020-21; 2021-22; and 2022-23
(a) Cases closed as a result of the majority of identified needs being met.
Note: For further information on the data presented in this table please refer to the Data Dictionary.
Metric 24: Women appointed to government boards
Table: Women appointed to government boards, Queensland
| 2017–18 | 2018–19 | 2019–20 | 2020–21 | 2021–22 | 2022–23(a) | |||||||||||||||||||
Per cent | ||||||||||||||||||||||||
Women appointed to Queensland Government boards | 47.5 | 52.0 | 54.5 | 53.0 | 56.0 | 56.0 | ||||||||||||||||||
Source: Queensland Health, Queensland Budget 2023–24, Service Delivery Statements, page 13; Queensland Department of Justice and Attorney-General Annual Report 2021-22; Queensland Department of Justice and Attorney-General Annual Report 2020-21; Queensland Department of Child Safety, Youth and Women 2018-19 Annual Report.
(a) 2022–23 is an estimated actual.
Note: For further information on the data presented in this table please refer to the Data Dictionary.
| December 2023 | Page | 82 |
Metric 25: Year 7 children achieving at or above the national minimum standards for reading
Table: Year 7 children achieving at or above the national minimum standards for reading, Queensland
| 2015 | 2016 | 2017 | 2018 | 2019 | 2020(a) | 2021(b) | 2022(b) | |||||||||||||||||||||||||
Per cent | ||||||||||||||||||||||||||||||||
Year 7 children | 95.8 | 94.6 | 93.9 | 94.1 | 95.0 | n.a. | 93.7 | 93.9 | ||||||||||||||||||||||||
Source: Australian Curriculum, Assessment and Reporting Authority, NAPLAN results, various years.
| (a) | Education Ministers made the decision to cancel NAPLAN in 2020 due to the COVID-19 pandemic. |
| (b) | The participation rate was less than 90% of enrolled students and did not meet the technical data standard to ensure unbiased results for the calendar year. |
Note: For further information on the data presented in this table please refer to the Data Dictionary.
Metric 26: Percentage of persons aged 20-64 years with a non-school qualification
Table: Persons aged 20-64 years with a non-school qualification (a), Queensland
| May 2016 | May 2017 | May 2018 | May 2019 | May 2020 | May 2021 | May 2022 | May 2023 | |||||||||||||||||||||||||
Per cent | ||||||||||||||||||||||||||||||||
Non-school qualification | 62.8 | 63.3 | 63.3 | 65.5 | 67.1 | 66.0 | 68.8 | 69.8 | ||||||||||||||||||||||||
Source: ABS, Education and Work, Australia, May 2023.
| (a) | As a per cent of total persons aged 20-64 years. |
Note: For further information on the data presented in this table please refer to the Data Dictionary.
Metric 27: School participation rates for students aged 12 to 18 years
Table: School participation rates for students aged 12 to 18 years (a), Queensland
| 2015 | 2016 | 2017 | 2018 | 2019 | 2020 | 2021 | 2022 | |||||||||||||||||||||||||
Per cent | ||||||||||||||||||||||||||||||||
Aged 12 years | 100.0 | 100.0 | 100.0 | 100.0 | 100.0 | 100.0 | 100.0 | 98.6 | ||||||||||||||||||||||||
Aged 13 years | 100.0 | 100.0 | 100.0 | 100.0 | 100.0 | 100.0 | 100.0 | 98.7 | ||||||||||||||||||||||||
Aged 14 years | 99.7 | 100.0 | 100.0 | 100.0 | 100.0 | 99.9 | 99.8 | 98.8 | ||||||||||||||||||||||||
Aged 15 years | 99.2 | 97.7 | 98.9 | 99.1 | 99.1 | 98.8 | 98.4 | 97.1 | ||||||||||||||||||||||||
Aged 16 years | 93.6 | 94.2 | 93.2 | 93.0 | 92.8 | 91.8 | 90.4 | 88.8 | ||||||||||||||||||||||||
Aged 17 years (b) | 58.5 | 59.4 | 61.0 | 59.1 | 61.0 | 82.6 | 82.4 | 80.0 | ||||||||||||||||||||||||
Aged 18 years (c) | 5.8 | 6.0 | 6.2 | 6.3 | 6.5 | 7.3 | 9.1 | 8.6 | ||||||||||||||||||||||||
Source: Australian Bureau of Statistics, Schools, 2022, Table 66a Capped School Participation Rates for students Aged 6-19 Years, 2011-2022.
Participation rates are determined using both part-time and full-time student counts
| (a) | The age reference date for students is 1 July. |
| (b) | Queensland enrolment requirements consider a child to be of compulsory school age from 6 years and 6 months until they turn 16, or they complete Year 10 (whichever comes first). |
| (c) | Queensland allows students to enrol in the first year of school if age 5 by 30 June, equivalent to age 17 in the last year of school. Students who commence school a year later than standard will be age 18 in the last year of school. |
Note: For further information on the data presented in this table please refer to the Data Dictionary.
| December 2023 | Page | 83 |
Metric 28: Main destination of Year 12 completers
Table: Main destination of Year 12 completers, Queensland
| 2015 | 2016 | 2017 | 2018 | 2019 | 2020 | 2021 | 2022 | |||||||||||||||||||||||||
Number | ||||||||||||||||||||||||||||||||
Bachelor degree | 16,287 | 15,920 | 16,273 | 15,538 | 15,666 | 11,508 | 15,139 | 15,853 | ||||||||||||||||||||||||
VET certificate IV+ | 2,997 | 2,782 | 2,341 | 2,146 | 2,075 | 1,323 | 2,039 | 1,982 | ||||||||||||||||||||||||
VET certificate III | 1,063 | 1,020 | 1,094 | 988 | 1,096 | 794 | 1,003 | 769 | ||||||||||||||||||||||||
VET certificate I-II/other | 1,080 | 1,072 | 931 | 905 | 836 | 613 | 950 | 815 | ||||||||||||||||||||||||
Apprenticeship | 2,388 | 2,538 | 2,577 | 2,701 | 2,492 | 1,729 | 2,942 | 3,431 | ||||||||||||||||||||||||
Traineeship | 970 | 983 | 1,092 | 1,016 | 958 | 545 | 1,138 | 1,110 | ||||||||||||||||||||||||
Full-time employment | 3,345 | 3,383 | 3,646 | 3,640 | 3,243 | 1,658 | 3,364 | 4,581 | ||||||||||||||||||||||||
Part-time employment | 6,815 | 7,137 | 7,671 | 7,648 | 7,687 | 4,738 | 6,498 | 7,274 | ||||||||||||||||||||||||
Seeking work | 4,315 | 4,305 | 4,563 | 4,388 | 4,243 | 3,951 | 2,722 | 2,563 | ||||||||||||||||||||||||
NILFET (a) | 897 | 970 | 1,178 | 1,091 | 1,160 | 1,592 | 946 | 1,138 | ||||||||||||||||||||||||
Total | 40,157 | 40,110 | 41,366 | 40,061 | 39,456 | 28,451 | 36,741 | 39,516 | ||||||||||||||||||||||||
Per cent | ||||||||||||||||||||||||||||||||
Bachelor degree | 40.6 | 39.7 | 39.3 | 38.8 | 39.7 | 40.4 | 41.2 | 40.1 | ||||||||||||||||||||||||
VET certificate IV+ | 7.5 | 6.9 | 5.7 | 5.4 | 5.3 | 4.7 | 5.5 | 5.0 | ||||||||||||||||||||||||
VET certificate III | 2.6 | 2.5 | 2.6 | 2.5 | 2.8 | 2.8 | 2.7 | 1.9 | ||||||||||||||||||||||||
VET certificate I-II/other | 2.7 | 2.7 | 2.3 | 2.3 | 2.1 | 2.2 | 2.6 | 2.1 | ||||||||||||||||||||||||
Apprenticeship | 5.9 | 6.3 | 6.2 | 6.7 | 6.3 | 6.1 | 8.0 | 8.7 | ||||||||||||||||||||||||
Traineeship | 2.4 | 2.5 | 2.6 | 2.5 | 2.4 | 1.9 | 3.1 | 2.8 | ||||||||||||||||||||||||
Full-time employment | 8.3 | 8.4 | 8.8 | 9.1 | 8.2 | 5.8 | 9.2 | 11.6 | ||||||||||||||||||||||||
Part-time employment | 17.0 | 17.8 | 18.5 | 19.1 | 19.5 | 16.7 | 17.7 | 18.4 | ||||||||||||||||||||||||
Seeking work | 10.7 | 10.7 | 11.0 | 11.0 | 10.8 | 13.9 | 7.4 | 6.5 | ||||||||||||||||||||||||
NILFET (a) | 2.2 | 2.4 | 2.8 | 2.7 | 2.9 | 5.6 | 2.6 | 2.9 | ||||||||||||||||||||||||
Total | 100.0 | 100.0 | 100.0 | 100.0 | 100.0 | 100.0 | 100.0 | 100.0 | ||||||||||||||||||||||||
Source: Queensland Department of Education, Next Step Year 12 Completers survey, various years.
| (a) | NILFET refers to those not in the labour force (that is not employed and not seeking work), education or training. |
Note: For further information on the data presented in this table please refer to the Data Dictionary.
| December 2023 | Page | 84 |
Metric 29: Student to teacher ratios
Table: Student to teaching staff ratios by affiliation and school level, Queensland
| 2015 | 2016 | 2017 | 2018 | 2019 | 2020 | 2021 | 2022 | |||||||||||||||||||||||||
Ratio | ||||||||||||||||||||||||||||||||
Primary school | ||||||||||||||||||||||||||||||||
Government | 14.8 | 14.5 | 14.4 | 14.2 | 14.3 | 14.3 | 14.4 | 14.2 | ||||||||||||||||||||||||
Non-Government | 16.5 | 16.4 | 16.0 | 15.9 | 15.9 | 15.9 | 16.0 | 15.9 | ||||||||||||||||||||||||
Catholic | 17.2 | 17.0 | 16.6 | 16.4 | 16.3 | 16.3 | 16.4 | 16.2 | ||||||||||||||||||||||||
Independent | 15.5 | 15.5 | 15.3 | 15.3 | 15.4 | 15.5 | 15.4 | 15.5 | ||||||||||||||||||||||||
All schools | 15.2 | 15.0 | 14.9 | 14.7 | 14.7 | 14.8 | 14.9 | 14.7 | ||||||||||||||||||||||||
Secondary school | ||||||||||||||||||||||||||||||||
Government | 12.7 | 12.5 | 12.4 | 12.2 | 12.1 | 12.1 | 12.1 | 12.1 | ||||||||||||||||||||||||
Non-Government | 12.4 | 12.2 | 12.1 | 12.0 | 11.9 | 12.1 | 12.1 | 12.1 | ||||||||||||||||||||||||
Catholic | 12.8 | 12.4 | 12.4 | 12.2 | 12.1 | 12.3 | 12.5 | 12.4 | ||||||||||||||||||||||||
Independent | 12.1 | 11.9 | 11.8 | 11.7 | 11.8 | 11.9 | 11.7 | 11.7 | ||||||||||||||||||||||||
All schools | 12.6 | 12.4 | 12.3 | 12.1 | 12.1 | 12.1 | 12.1 | 12.1 | ||||||||||||||||||||||||
Source: Australian Bureau of Statistics, Schools, 2022, Table 53a Student (FTE) to Teaching Staff (FTE) Ratios, 2006-2022.
Note: For further information on the data presented in this table please refer to the Data Dictionary.
Metric 30: Expenditure per student in government funded schools
Table: Expenditure per student in government funded schools, (2020-2021 dollars), Queensland
| 2013–14 | 2014–15 | 2015–16 | 2016–17 | 2017–18 | 2018–19 | 2019–20 | 2020–21 | |||||||||||||||||||||||||
$ per full-time equivalent student | ||||||||||||||||||||||||||||||||
Australian Government payments for school education services | 2,229 | 2,433 | 2,644 | 2,978 | 3,140 | 3,240 | 3,363 | 3,602 | ||||||||||||||||||||||||
Queensland Government recurrent expenditure | 15,006 | 15,270 | 15,551 | 15,647 | 15,902 | 16,074 | 16,811 | 16,281 | ||||||||||||||||||||||||
Total | 17,235 | 17,703 | 18,195 | 18,625 | 19,042 | 19,314 | 20,174 | 19,883 | ||||||||||||||||||||||||
Source: Productivity Commission, Report on Government Services, 2023, Section 4 School education (table 4A.14).
Note: For further information on the data presented in this table please refer to the Data Dictionary.
| December 2023 | Page | 85 |
Metric 31: Age dependency ratios
Table: Age dependency ratios, Queensland
| 2015–16 | 2016–17 | 2017–18 | 2018–19 | 2019–20 | 2020–21 | 2021–22 | 2022–23 | |||||||||||||||||||||||||
Per cent | ||||||||||||||||||||||||||||||||
Aged dependency ratio (labour force 15-64 years) | 28.8 | 29.8 | 29.9 | 30.7 | 31.6 | 32.1 | 32.5 | 32.7 | ||||||||||||||||||||||||
Aged dependency ratio (labour force total) | 27.8 | 28.8 | 28.8 | 29.4 | 30.3 | 30.7 | 31.0 | 31.3 | ||||||||||||||||||||||||
Source: Australian Bureau of Statistics, Labour Force, Australia, Detailed, September 2023.
Note: For further information on the data presented in this table please refer to the Data Dictionary.
Metric 32: Available beds per 1,000 persons, public hospitals
Table: Available beds per 1,000 persons, public hospitals (including psychiatric), Queensland
| 2013–14 | 2014–15 | 2015–16 | 2016–17 | 2017–18 | 2018–19 | 2019–20 | 2020–21 | |||||||||||||||||||||||||
Beds per 1,000 persons | ||||||||||||||||||||||||||||||||
Major cities (a) | 2.4 | 2.4 | 2.4 | 2.4 | 2.5 | 2.5 | 2.4 | 2.4 | ||||||||||||||||||||||||
All areas | 2.5 | 2.5 | 2.5 | 2.5 | 2.5 | 2.6 | 2.5 | 2.5 | ||||||||||||||||||||||||
Source: Productivity Commission, Report on Government Services, 2023, Section 12 Public Hospitals (table 12A.4).
| (a) | Major cities is a remoteness area classification from the 2016 edition of Australian Statistical Geography Standard (ASGS) remoteness area structure (RA). |
Note: For further information on the data presented in this table please refer to the Data Dictionary.
Metric 33: Emergency department presentations
Table: Emergency department presentations, Queensland
| 2014–15 | 2015–16 | 2016–17 | 2017–18 | 2018–19 | 2019–20 | 2020–21 | 2021–22 | |||||||||||||||||||||||||
Number | ||||||||||||||||||||||||||||||||
Presentations | 1,378,883 | 1,439,143 | 1,457,083 | 1,512,118 | 1,561,825 | 1,606,395 | 1,887,381 | 1,867,860 | ||||||||||||||||||||||||
Presentations per 1,000 persons (a)(b) | 288.6 | 297.0 | 295.8 | 302.0 | 306.9 | 311.0 | 361.9 | 351.1 | ||||||||||||||||||||||||
Source: AIHW, Australian hospital statistics, Emergency department care, Table 2.2 (various years).
Population - Australian Bureau of Statistics, National, state and territory population, March 2023.
| (a) | The outbreak of the coronavirus (COVID-19) in March 2020 has had an impact on emergency department presentations. |
| (b) | Presentations per 1,000 persons estimates have been derived using the March 2023 release of Australian Bureau of Statistics, National, state and territory estimated resident population data rather than the population estimates from the AIHW source. |
| (c) | Population as at 30 June each year. |
Note: For further information on the data presented in this table please refer to the Data Dictionary.
| December 2023 | Page | 86 |
Metric 34: Hospital Separations
Table: Acute separations, same day and overnight, public and private hospitals, Queensland
| 2014–15 | 2015–16 | 2016–17 | 2017–18 | 2018–19 | 2019–20 | 2020–21 | 2021–22 | |||||||||||||||||||||||||
Separations | ||||||||||||||||||||||||||||||||
Same day | ||||||||||||||||||||||||||||||||
Public hospitals | 631,178 | 683,937 | 761,481 | 826,257 | 895,582 | 927,405 | 990,622 | 974,685 | ||||||||||||||||||||||||
Private hospitals | 677,780 | 655,210 | 672,656 | 693,966 | 711,311 | 697,728 | 780,408 | 774,151 | ||||||||||||||||||||||||
All hospitals | 1,308,958 | 1,339,147 | 1,434,137 | 1,520,223 | 1,606,893 | 1,625,133 | 1,771,030 | 1,748,836 | ||||||||||||||||||||||||
Overnight | ||||||||||||||||||||||||||||||||
Public hospitals | 527,038 | 534,444 | 553,668 | 581,654 | 590,750 | 586,428 | 611,921 | 639,931 | ||||||||||||||||||||||||
Private hospitals | 301,348 | 297,256 | 298,633 | 299,859 | 300,083 | 285,275 | 307,993 | 300,198 | ||||||||||||||||||||||||
All hospitals | 828,386 | 831,700 | 852,301 | 881,513 | 890,833 | 871,703 | 919,914 | 940,129 | ||||||||||||||||||||||||
Separations per 1,000 persons |
| |||||||||||||||||||||||||||||||
Same day | ||||||||||||||||||||||||||||||||
Public hospitals | 132.1 | 141.2 | 154.6 | 165.0 | 176.0 | 179.5 | 189.9 | 183.2 | ||||||||||||||||||||||||
Private hospitals | 141.9 | 135.2 | 136.5 | 138.6 | 139.8 | 135.1 | 149.6 | 145.5 | ||||||||||||||||||||||||
All hospitals | 274.0 | 276.4 | 291.1 | 303.6 | 315.8 | 314.6 | 339.6 | 328.7 | ||||||||||||||||||||||||
Overnight | ||||||||||||||||||||||||||||||||
Public hospitals | 110.3 | 110.3 | 112.4 | 116.2 | 116.1 | 113.5 | 117.3 | 120.3 | ||||||||||||||||||||||||
Private hospitals | 63.1 | 61.4 | 60.6 | 59.9 | 59.0 | 55.2 | 59.0 | 56.4 | ||||||||||||||||||||||||
All hospitals | 173.4 | 171.7 | 173.0 | 176.1 | 175.1 | 168.8 | 176.4 | 176.7 | ||||||||||||||||||||||||
Source: AIHW, Australian hospital statistics, Admitted patient care, 2021-22 table 2.14 and table 2.16; 2018-19 table 2.11 and table 2.13.
Population - Australian Bureau of Statistics, National, state and territory population, March 2023.
| (a) | Population as at 30 June each year. |
Note: For further information on the data presented in this table please refer to the Data Dictionary.
| December 2023 | Page | 87 |
Metric 35: Public hospital workforce
Table: Public hospital workforce (a) per 1,000 persons, Queensland
| 2015–16 | 2016–17 | 2017–18 | 2018–19 | 2019–20 | 2020–21 | |||||||||||||||||||||||||||||||||||||||
FTE per 1,000 persons | ||||||||||||||||||||||||||||||||||||||||||||
Salaried medical officers | 2.0 | 2.0 | 2.1 | 2.2 | 2.2 | 2.3 | ||||||||||||||||||||||||||||||||||||||
Nurses | 6.2 | 6.4 | 6.6 | 6.8 | 6.9 | 7.1 | ||||||||||||||||||||||||||||||||||||||
Diagnostic and allied health | 1.9 | 2.0 | 2.0 | 2.1 | 2.1 | 2.2 | ||||||||||||||||||||||||||||||||||||||
Total | 10.1 | 10.4 | 10.7 | 11.1 | 11.2 | 11.6 | ||||||||||||||||||||||||||||||||||||||
Source: Productivity Commission, Report on Government Services, 2023, Section 12 Public Hospitals (table 12A.9).
(a) Average FTE.
FTE = Full-time equivalent.
Note: For further information on the data presented in this table please refer to the Data Dictionary.
| December 2023 | Page | 88 |
Metric 36: Prevalence of overweight or obese adults and children
Table: Prevalence of overweight or obese adults and children, Queensland
| 2011–12 | 2014–15 | 2017–18 | ||||||||||||||||||||
Per cent | ||||||||||||||||||||||
Adults | ||||||||||||||||||||||
Males | ||||||||||||||||||||||
| Overweight | 40.9 | 38.4 | 39.0 | |||||||||||||||||||
| Obese | 31.7 | 31.9 | 33.9 | |||||||||||||||||||
| Overweight or obese | 72.7 | 70.7 | 72.9 | |||||||||||||||||||
Females | ||||||||||||||||||||||
| Overweight | 28.0 | 28.6 | 28.2 | |||||||||||||||||||
| Obese | 29.1 | 28.4 | 30.7 | |||||||||||||||||||
| Overweight or obese | 57.1 | 56.6 | 59.3 | |||||||||||||||||||
Persons | ||||||||||||||||||||||
| Overweight | 34.5 | 33.4 | 33.5 | |||||||||||||||||||
| Obese | 30.4 | 30.2 | 32.4 | |||||||||||||||||||
| Overweight or obese | 64.9 | 63.6 | 65.9 | |||||||||||||||||||
Children | ||||||||||||||||||||||
Males | ||||||||||||||||||||||
| Overweight | 15.7 | 16.9 | 17.4 | |||||||||||||||||||
| Obese | 8.1 | 6.6 | 9.8 | |||||||||||||||||||
| Overweight or obese | 23.8 | 24.6 | 26.2 | |||||||||||||||||||
Females | ||||||||||||||||||||||
| Overweight | 19.0 | 17.7 | 13.9 | |||||||||||||||||||
| Obese | 9.0 | 8.2 | 8.4 | |||||||||||||||||||
| Overweight or obese | 28.0 | 25.3 | 21.7 | |||||||||||||||||||
Persons | ||||||||||||||||||||||
| Overweight | 17.3 | 17.9 | 15.4 | |||||||||||||||||||
| Obese | 8.6 | 7.5 | 8.7 | |||||||||||||||||||
| Overweight or obese | 25.9 | 24.6 | 24.5 | |||||||||||||||||||
Source: Australian Bureau of Statistics, National Health Survey (various editions); Australian Bureau of Statistics, Australian Health
Survey: Updated Results, 2011–12.
Note: This is the most current available data as at October 2023, for further information on the data presented in this table please refer to the Data Dictionary. The sum of components may not add to totals due to random adjustments by the Australian Bureau of Statistics to avoid the release of confidential data.
| December 2023 | Page | 89 |
Metric 37: Infant mortality rate
Table: Infant mortality rate (a), Queensland
| 2015 | 2016 | 2017 | 2018 | 2019 | 2020 | 2021 | 2022 | |||||||||||||||||||||||||
Rate per 1,000 live births | ||||||||||||||||||||||||||||||||
Infant mortality rate | 4.2 | 4.0 | 4.3 | 3.5 | 4.1 | 3.8 | 3.8 | 4.6 | ||||||||||||||||||||||||
Source: Australian Bureau of Statistics, Deaths, Australia, 2022.
(a) The number of deaths of children under one year of age per 1,000 live births.
Note: For further information on the data presented in this table please refer to the Data Dictionary.
Metric 38: Life expectancy at birth
Table: Life expectancy at birth, Queensland
| 2013–2015 | 2014–2016 | 2015–2017 | 2016–2018 | 2017–2019 | 2018–2020 | 2019–2021 | 2020–2022 | |||||||||||||||||||||||||
Years | ||||||||||||||||||||||||||||||||
Males | 80.0 | 80.1 | 80.0 | 80.2 | 80.3 | 80.6 | 80.9 | 80.7 | ||||||||||||||||||||||||
Females | 84.3 | 84.5 | 84.4 | 84.7 | 84.8 | 85.1 | 85.1 | 85.0 | ||||||||||||||||||||||||
Source: Australian Bureau of Statistics, Life Tables, States, Territories and Australia, various editions.
Note: For further information on the data presented in this table please refer to the Data Dictionary.
Metric 39: Research and experimental development (R&D) expenditure, businesses
Table: Research and experimental development (R&D) expenditure, current prices, businesses, Queensland
| 2011–12 | 2013–14 | 2015–16 | 2017–18 | �� | 2019–20 | 2021–22 | ||||||||||||||||||||||||||||||||||||||
$ million | ||||||||||||||||||||||||||||||||||||||||||||
R&D | 2,499 | 2,700 | 1,956 | 1,912 | 2,235 | 2,560 | ||||||||||||||||||||||||||||||||||||||
GSP | 277,341 | 288,805 | 301,095 | 349,911 | 360,907 | 447,487 | ||||||||||||||||||||||||||||||||||||||
| ||||||||||||||||||||||||||||||||||||||||||||
R&D as a per cent of GSP (per cent) | 0.9 | 0.9 | 0.6 | 0.5 | 0.6 | 0.6 | ||||||||||||||||||||||||||||||||||||||
Sources: R&D - Australian Bureau of Statistics, Research and Experimental Development, Businesses, Australia, various years.
GSP - Australian Bureau of Statistics, Australian National Accounts: State Accounts, 2021-22.
(a) GSP reported in this metric are expressed in current prices to align with the R&D values which have not been adjusted for inflation. GSP in this metric may differ to the GSP used in other metrics.
Note: For further information on the data presented in this table please refer to the Data Dictionary.
| December 2023 | Page | 90 |
Metric 40: Research and experimental development (R&D) expenditure, government and Non-Profit Organisations
Table: Research and experimental development (R&D) expenditure, current prices, businesses, Queensland
| 2012–13 | 2014–15 | 2016–17 | 2018–19 | 2020–21 | ||||||||||||||||||||||||||||||||
$ million | ||||||||||||||||||||||||||||||||||||
R&D | 568 | 563 | 590 | 673 | 680 | |||||||||||||||||||||||||||||||
GSP | 281,037 | 294,167 | 327,750 | 366,494 | 368,192 | |||||||||||||||||||||||||||||||
| ||||||||||||||||||||||||||||||||||||
R&D as a per cent of GSP (per cent) | 0.2 | 0.2 | 0.2 | 0.2 | 0.2 | |||||||||||||||||||||||||||||||
Sources: R&D - Australian Bureau of Statistics, Research and Experimental Development, Government and Private Non-Profit Organisations, Australia, various years.
GSP - Australian Bureau of Statistics, Australian National Accounts: State Accounts, 2021-22.
(a) GSP reported in this metric are expressed in current prices to align with the R&D values which have not been adjusted for inflation. GSP in this metric may differ to the GSP used in other metrics.
Note: For further information on the data presented in this table please refer to the Data Dictionary.
Metric 41: Exports - agriculture
Table: Overseas exports of agricultural commodities, Queensland
| 2015–16 | 2016–17 | 2017–18 | 2018–19 | 2019–20 | 2020–21 | 2021–22 | 2022–23p | |||||||||||||||||||||||||
$ millions (AUD) | ||||||||||||||||||||||||||||||||
Agriculture exports | 904 | 1,089 | 805 | 842 | 859 | 1,212 | 2,068 | 3,006 | ||||||||||||||||||||||||
Source: Queensland Government Statistician’s Office, Overseas exports by industry 4-digit ANZSIC 2006 edition, June 2023 (based on ABS International Trade in Goods and Services, Australia, unpublished data).
p = preliminary (as at June 2023 release)
Exports of Agricultural commodities using the ANSZIC classification, excludes agricultural production that has undergone manufacturing processing (e.g. beef and raw sugar exports). Applying this broader definition of agricultural exports, including processed agricultural production, agricultural exports were A$17,263 million in 2022-23.
Note: For further information on the data presented in this table please refer to the Data Dictionary.
Metric 42: Equivalised disposable household income
Table: Equivalised (a) disposable household income, Queensland
| 2007–08 | 2009–10 | 2011–12 | 2013–14 | 2015–16 | 2017–18 | 2019–20 | ||||||||||||||||||||||
$ per week | ||||||||||||||||||||||||||||
Mean income - adjusted lowest quintile (b) | 432 | 422 | 421 | 433 | 454 | 440 | 470 | |||||||||||||||||||||
Mean income - all persons | 1,046 | 997 | 1,040 | 1,060 | 1,024 | 1,027 | 1,087 | |||||||||||||||||||||
| ||||||||||||||||||||||||||||
Lowest income quintile as a per cent of all households mean income (per cent) | 41.3 | 42.3 | 40.5 | 40.8 | 44.3 | 42.8 | 43.2 | |||||||||||||||||||||
Source: Australian Bureau of Statistics, Household Income and Wealth, Australia, 2019–20.
(a) Equivalised disposable household income are calculated on a person weighted basis to ensure comparability across different household sizes. Disposable income refers to gross income minus taxes - sometimes referred to as ‘net income’.
(b) Adjusted refers to the lowest income quintile excluding the first and second percentiles.
Note: For further information on the data presented in this table please refer to the Data Dictionary.
| December 2023 | Page | 91 |
Metric 43: Growth of Gross State Product
Table: Growth of gross state product and gross domestic product, Queensland and Australia
| 2013–14 | 2014–15 | 2015–16 | 2016–17 | 2017–18 | 2018–19 | 2019–20 | 2020–21 | 2021–22 | ||||||||||||||||||||||||||||
Per cent | ||||||||||||||||||||||||||||||||||||
Queensland gross state product | 2.0 | 0.8 | 2.4 | 2.6 | 3.9 | 1.0 | -0.9 | 2.9 | 4.4 | |||||||||||||||||||||||||||
Australian gross domestic product | 2.6 | 2.2 | 2.7 | 2.3 | 2.9 | 2.2 | -0.1 | 2.2 | 3.6 | |||||||||||||||||||||||||||
Source: Australian Bureau of Statistics, Australian National Accounts: State Accounts 2021-22.
Note: For further information on the data presented in this table please refer to the Data Dictionary.
Metric 44: General Government Sector Net Operating Balance
Table: General government sector net operating balance, Queensland (a)
| 2015–16 | 2016–17 | 2017–18 | 2018–19 | 2019–20 | 2020–21 | 2021–22 | 2022–23 | |||||||||||||||||||||||||
$ million | ||||||||||||||||||||||||||||||||
Net operating balance | 668 | 2,825 | 1,750 | 985 | -5,728 | -915 | 4,296 | 13,930 | ||||||||||||||||||||||||
Source: Queensland Treasury, Queensland State Budget, 2023-24, Budget Paper 2 - Budget Strategy and Outlook, Appendix D, Page 244; 2022-23 Report on State Finances, Page 5-87.
(a) Based on the latest available actual data.
Note: For further information on the data presented in this table please refer to the Data Dictionary.
Metric 45: General Government Sector Borrowing Costs, Actual
Table: General government sector borrowing costs, Queensland (a)
| 2015–16 | 2016–17 | 2017–18 | 2018–19 | 2019–20 | 2020–21 | 2021–22 | 2022–23 | |||||||||||||||||||||||||
$ million | ||||||||||||||||||||||||||||||||
Borrowing costs | 2,220 | 1,722 | 1,614 | 1,581 | 1,486 | 1,619 | 1,508 | 1,688 | ||||||||||||||||||||||||
Source: Queensland Treasury, Queensland State Budget, 2023-24, Budget Paper 2 - Budget Strategy and Outlook, Table 9.1 (Page 173) and 9.10 (Page 183); 2022-23 Report on State Finances, Page 5-87.
(a) Based on the latest available actual data.
Note: For further information on the data presented in this table please refer to the Data Dictionary.
| December 2023 | Page | 92 |
Metric 46: Metallurgical, thermal and PCI coal, saleable production
Table: Metallurgical, thermal and PCI coal, saleable production, Queensland
| 2016 | 2017 | 2018 | 2019 | 2020 | 2021 | 2022 | ||||||||||||||||||||||
Volume (mega tonnes) | ||||||||||||||||||||||||||||
Metallurgical coal (a)(b) | 160.1 | 152.3 | 156.5 | 160.2 | 145.7 | 142.7 | 138.8 | |||||||||||||||||||||
Thermal coal | 83.6 | 84.5 | 92.4 | 88.6 | 78.9 | 78.1 | 83.0 | |||||||||||||||||||||
Total | 243.7 | 236.8 | 249.0 | 248.8 | 224.6 | 220.8 | 221.9 | |||||||||||||||||||||
Source: Queensland Department of Resources, April 2023.
n.a. = not available.
(a) Queensland Department of Resources refers to metallurgical coal as coking coal.
(b) Metallurgical coal includes PCI (pulverised coal for injection).
Note: For further information on the data presented in this table please refer to the Data Dictionary.
| December 2023 | Page | 93 |
Appendix B: Ministers and responsibilities
A full list of Queensland Government ministers is available from the Queensland Government’s website.440
| Minister | Role and focus | |
Premier | Responsibilities include: | |
● The overall management of Queensland, Cabinet and its committees, coordinating government communication, policy development, governance, legislative drafting and publishing, protocol, | ||
● intergovernmental relations, | ||
● Screen industry development, and | ||
● overall public service management.
| ||
Deputy Premier, Treasurer and Minister for Trade and Investment | Treasury | |
● Develop well researched economic policies and strategies that further the development of Queensland as a vibrant, productive, and sustainable economy focused on employment, engagement and quality of life. | ||
● Achieve the Government’s fiscal objectives to stabilise debt, restore operating surpluses, and maintain tax competitiveness. | ||
● Maintain and coordinate robust Budget processes that identify the Queensland Government’s highest priority initiatives and allocate public funds responsibly. | ||
● Proactively manage the Queensland Government balance sheet through the application of sound portfolio and risk management strategies of the state’s financial and non-financial assets and liabilities. | ||
● Lead implementation of the Queensland Renewable Energy and Hydrogen Jobs Fund, in consultation with the Minister for Energy and Clean Economy Jobs. | ||
● Work with the Minister for the Environment and the Great Barrier Reef and Minister for Science and Innovation to implement the flagship $500 million Land Restoration Fund. | ||
● Coordinate the annual Queensland Sustainability Report to ensure the state is appropriately reporting on its Environment, Social and Governance (ESG) policies.
| ||
Minister for State Development and Infrastructure, Minister for Industrial Relations and Minister for Racing | State Development | |
● Oversee strategic planning, policy, and service delivery for priority industry sectors, progressing major public and private projects and delivering planning and programs for priority industry sectors. | ||
● Support the development of Queensland’s hydrogen industry and support the implementation of relevant initiatives under the Queensland Energy and Jobs Plan including hydrogen industry development, renewables manufacturing and supply chain development and supporting regional transformation. | ||
Brisbane 2032 Olympic and Paralympic Games Infrastructure | ||
● Brisbane 2032 Olympic and Paralympic Games. | ||
● Support the delivery of a more sustainable Brisbane 2032 Olympic and Paralympic Games. | ||
Olympics and Paralympics Sport and Engagement | ||
| Lead the planning for, and realisation of legacy benefits. | ||
● Lead Brisbane 2032 engagement regarding community and high-performance sport opportunities in Queensland, including major sports events and national training opportunities. | ||
Industrial Relations | ||
● Oversee the ongoing delivery of the legislative reforms and regulatory improvements to Queensland’s industrial relations system and workplace health and safety.
| ||
| December 2023 | Page | 94 |
| Minister | Role and focus | |
| Minister for Health, Mental Health and Ambulance Services and Minister for Women | Health | |
● Work to ensure the timely provision of planned care through the public health system and continue to attract, retain and invest in new frontline staff to deliver a world-class level of public health care. | ||
● Collaborate with the Federal Government to strengthen partnerships with the primary care, aged care and disability services sectors. Advance health equity and improve the health and wellbeing of First Nations Queenslanders. | ||
● Implement a range of initiatives that include keeping Queenslanders out of hospital and providing alternatives to emergency departments. | ||
● Implement a First Nations Workforce Strategy | ||
● Work with the Minister for Child Safety,Minister for Seniors and Disability Services and Minister for Multicultural Affairs to develop an improved service delivery model for forensic disability services in Queensland. | ||
● Implement a Queensland women’s health strategy. | ||
● Continue to oversee Health and Wellbeing Queensland, and support delivery of plans to achieve real and measurable improvements in the health and wellbeing of Queenslanders.
| ||
| Mental Health | ||
● Support mental health, alcohol and other drug, and suicide prevention services. | ||
● Implement Shifting minds: The Queensland Mental Health Alcohol and Other Drugs Strategic Plan 2023-2028 and Better Care Together: A plan for Queensland’s state- funded mental health, alcohol and other drug services to 2027.
| ||
| Ambulance Services | ||
● Support the delivery of timely, quality and appropriate, patient focused services in the face of increasing demand, including through continued investment in additional frontline staff.
| ||
| Women | ||
● Support Queensland Government Ministers and agencies to implement women’s economic security initiatives.
| ||
Attorney-General and Minister for Justice and Minister for the Prevention of Domestic and Family Violence | Justice | |
● Deliver an effective, responsive, fair and efficient justice system that underpins a just and safe Queensland. | ||
● Deliver an efficient and effective justice system underpinned by contemporary technology and safe, accessible and functional infrastructure. | ||
● Provide regulatory oversight, compliance assessment and approvals to ensure the integrity of gaming in Queensland. | ||
● Implement initiatives to address justice-related targets to reduce incarceration rates of Aboriginal and Torres Strait Islander peoples. | ||
● Implement the regulatory framework for incorporated associations and co-operatives including governance, accountability and reporting obligations for the not-for-profit sector.
| ||
| Prevention of Domestic and Family Violence | ||
● Lead work with other Ministers to co-ordinate the Government’s roll-out of domestic, family and sexual violence reforms.
| ||
| December 2023 | Page | 95 |
| Minister | Role and focus | |
Minister for Energy and Clean Economy Jobs | Energy | |
● Work with other Ministers to implement the Queensland Energy and Jobs Plan in accordance with the Queensland SuperGrid Infrastructure Blueprint. | ||
● Lead the investment in the development of Queensland’s hydrogen industry and other sustainable fuels.
| ||
Clean Economy Jobs
| ||
● Oversee implementation of Queensland’s new emissions reduction target through delivery of clean economy and climate initiatives aimed at reducing the state’s emissions, securing existing industries and jobs and creating new jobs and supporting the social licence of the transition to a low carbon economy. | ||
● Work with the new Expert Panel on Clean Economy Jobs and stakeholders to identify least cost pathways for sectors and for Queensland to reduce emissions. | ||
● Work with other Ministers to implement the Queensland Climate Action Plan 2020- 2030, through delivery of climate initiatives aimed at reducing the state’s emissions and supporting the social licence of the transition to a low carbon economy. | ||
| Procurement | ||
● Evolution of Buy Queensland 2023 including the supporting implementation program, implementation of the best practice prequalification framework and expansion of the Ethical Supplier Mandate to strengthen the Buy Queensland procurement compliance function. | ||
● Implementation of the Queensland 2032 Procurement Strategy
| ||
Minister for Housing, Local Government and Planning and Minister for Public Works | Housing | |
● Drive delivery of additional social and affordable housing across the state. | ||
● Develop housing options to assist people to find safe, secure and affordable housing for rent, in particular, for priority groups including First Nations Queenslanders, older women, people experiencing domestic and family violence, people with disability and young people. | ||
● Increase home ownership outcomes for Aboriginal and Torres Strait Islander peoples, including those living on Indigenous communal lands.
| ||
| Public Works | ||
● Deliver the Resilient Homes Fund so that Queenslanders can access grants to rebuild more resilient homes, raise homes or arrange a buy back of their high-risk home, in response to the 2022 flooding disaster.
| ||
| Local Government | ||
● Oversee the implementation of the mandatory Code of Conduct for Councillors.
| ||
| Planning | ||
● Work with other Ministers and relevant local governments to ensure appropriate plans, strategies and initiatives are in place for supporting the infrastructure needs of the state.
| ||
Minister for Police and Community Safety | Police | |
● Prevent, disrupt, respond and investigate to make Queensland the safest state. | ||
● Contribute to effective and coordinated action to deliver the Government’s domestic and family violence reforms, including whole-of-service transformational change. | ||
● Work with other Ministers to support the implementation of youth justice initiatives to help prevent crime, improve outcomes and enhance community safety. | ||
● Ensure effective all-hazard disaster management arrangements are in place to support the state prepare, prevent, respond and recover from disaster events. | ||
● Provision of oversight and compliance in relation to registered weapons.
| ||
| December 2023 | Page | 96 |
| Minister | Role and focus | |
Minister for Treaty, Minister for Aboriginal and Torres Strait Islander Partnerships, Minister for Communities and Minister for the Arts
| Aboriginal and Torres Strait Islander Partnerships | |
● Partner with Aboriginal and Torres Strait Islander people, families and communities to support and foster a strong, safe, resilient and thriving Aboriginal and Torres Strait Islander communities. | ||
● Lead the governance, coordination and reporting arrangements for the National Agreement on Closing the Gap including Queensland’s annual Closing the Gap implementation plans. | ||
● Local leadership through the establishment of Local Decision-Making Bodies, to make decisions about the design and delivery of key services to better meet the needs of each community. | ||
● Lead the development and implementation of a new, whole-of-government First Nations Economic Strategy, in partnership and co-design with First Nations representatives from business, industry and communities, to support economic self- empowerment for Aboriginal peoples and Torres Strait Islander peoples. | ||
● Progress a comprehensive review of the regulatory framework to protect and conserve Queensland’s Aboriginal and Torres Strait Islander cultural heritage, while facilitating business and development activity. | ||
● Implement the First Nations First program at Queensland State Archives to foster truth telling and healing to improve outcomes for Aboriginal and Torres Strait Islander Queenslanders. | ||
Communities | ||
● Lead implementation of Communities 2032: A plan to strengthen the fabric of Queensland’s communities, which supports the government’s response to the Parliamentary Inquiry into Social Isolation and Loneliness. | ||
● Engage with non-government organisations to strengthen the Queensland community services sector, including through working with peak bodies and key stakeholders to improve service quality, grow the workforce and boost industry capacity and capability. | ||
● Ensure effective community recovery capability is in place, with emergency support services and financial assistance available to Queenslanders in response to natural disasters. | ||
● Implement the First Nations First Program at Queensland State Archives to foster truth telling and healing to improve outcomes for Aboriginal and Torres Strait Islander Queenslanders. | ||
Youth Affairs | ||
● Engage with young people and key stakeholders to facilitate social and economic opportunities for young Queenslanders. | ||
Arts | ||
● Lead the implementation of the Queensland Government’s Creative Together 2020- 2030: A 10-Year Roadmap for arts, culture and creativity in Queensland. | ||
● Facilitate delivery of the Queensland Government’s arts and cultural priorities and administer government investment in funding programs. | ||
● Manage the state’s arts and cultural assets. | ||
● Support the governance and compliance of arts companies and arts statutory bodies in the arts portfolio.
| ||
| December 2023 | Page | 97 |
| Minister | Role and focus | |
Minister for Education and Minister for Youth Justice | Education | |
● Pursue improved educational outcomes for Queensland students, including through long-term planning for the future of the Queensland education system. | ||
● Implement plans, policies and initiatives which focus on educational achievement, wellbeing and engagement, and culture and inclusion for every state school student. | ||
● Support the implementation and monitoring of the Domestic and Family Violence Prevention Strategy 2016–26. | ||
● Work with the Minister for Child Safety, Minister for Seniors and Disability Services and Minister for Multicultural Affairs in reporting on acceptance and implementation of recommendations arising from the Royal Commission into violence, abuse, neglect, and exploitation of people with disability.
| ||
| Youth Justice | ||
● Lead the development of initiatives to rehabilitate youth offenders and reintegrate young offenders into the community to help prevent offending, improve outcomes, and reduce demands in the youth justice system.
| ||
Minister for Agricultural Industry Development and Fisheries and Minister for Rural Communities | Agriculture | |
● Support local solutions to meet the seasonal workforce needs of Queensland’s agribusinesses. | ||
● Build and strengthen partnerships with research organisations, industry bodies and government agencies to leverage expertise and share responsibility for managing risk.
| ||
| Biosecurity | ||
● Enhance Queensland’s biosecurity capability to protect the state’s agriculture and the environment.
| ||
| Forestry | ||
● Implementation of the Native Timber Action Plan commitments including for native timber harvesting, plantation program and protected areas.
| ||
| Fisheries | ||
● Reduce red tape, support economic recovery and improved management, ensure the sustainability of Queensland’s fisheries resources and fishing industry, and play its role in helping to protect the Great Barrier Reef. | ||
● Deliver a legislative framework for recreational and commercial fishers that is contemporary, simple to understand, and reflective of community expectations.
| ||
| Rural Communities | ||
● Work with rural communities to identify regional economic opportunities, improve the competitiveness of rural business and support the creation of jobs in rural communities.
| ||
| December 2023 | Page | 98 |
| Minister | Role and focus | |
Minister for Regional Development and Manufacturing and Minister for Water | Regional Development | |
● Enhance engagement in regional communities, particularly working with key stakeholders including local government, industry, and peak bodies to create jobs and grow regional economies. | ||
● Support the building and upgrade of regional industry-linked school training facilities in priority industries such as hydrogen, aquaculture, agriculture, manufacturing, defence aviation and aerospace. | ||
● Support the primary school STEM program to provide educators with the tools and knowledge to teach specialist design and technology skills, contributing to creating future career interests in STEM. | ||
Manufacturing | ||
● Implement a comprehensive strategy to protect jobs in key regional industries to grow regional economies and create long-term jobs.
| ||
| Water | ||
● Continue to ensure that Queensland’s catchment-based water plans will provide sustainable water allocation for the environment, agriculture, industries, and population centres.
| ||
Minister for Resources and Critical Minerals | Resources | |
● Implement the Queensland Resources Industry Development Plan, working with peak industry bodies, mining unions and the community to ensure communities can maximise their economic and social well-being through the resources sector. | ||
● Implement the Queensland Critical Minerals Strategy that provides a path to the responsible use of Queensland’s critical minerals while creating sustainable economic prosperity for Queensland. | ||
● Investigate and deliver enhancements to the state’s land administration and valuation legislation and frameworks to better enable the delivery of government priorities that support economic and social outcomes. | ||
● Facilitate a sustainable coexistence between landholders, communities, and the onshore gas industry, in collaboration with Queensland’s coexistence institutions. | ||
● Provision of clearer pathways for investment in critical mineral exploration and production. | ||
● Ensure Queensland’s native vegetation is managed to maintain biodiversity, reduce land degradation, protect water quality, including in the Great Barrier Reef water catchment areas, and reduce greenhouse gas emissions. | ||
Resources Safety and Health Queensland | ||
● Regulate, educate and assist industry in meeting its obligations to protect and promote the safety and health of persons from risks associated with mining, quarrying, explosives and petroleum and gas.
| ||
| December 2023 | Page | 99 |
| Minister | Role and focus | |
| Minister for the Environment and the Great Barrier Reef and Minister for Science and Innovation | Environment | |
● Oversee the implementation of the Protected Area Strategy 2020–2030. | ||
● Advance Queensland’s Waste Management and Resource Recovery Strategy, Plastic Pollution Reduction Plan, Queensland Organics Strategy and Plan 2022–2032. | ||
● Work with the Minister for Resources and Critical Minerals to implement and oversee the Government’s reforms to mine rehabilitation and financial assurance. | ||
● Continue to implement Conserving Nature – a Biodiversity Strategy for Queensland, the Southeast Queensland Koala Conservation Strategy 2020–2025 and the Threatened Species Program to protect species at risk of extinction. | ||
● Continue to investigate and consult on the establishment of an independent Environmental Protection Agency to protect our environment, create jobs and support economic growth. | ||
● Continue to work with the Treasurer and Minister for Trade and Investment and stakeholders to implement the flagship $500 million Land Restoration Fund, including identifying opportunities to further develop Queensland’s carbon farming industry.
| ||
| Great Barrier Reef | ||
● Implement the Queensland Reef Water Quality Program and work with the Australian Government to fast-track commitments under the Reef 2050 Long-Term Sustainability Plan and the Reef 2050 Water Quality Improvement Plan. | ||
Science | ||
● Support priority industry-science centres of excellence and accelerate university commercialisation to grow Queensland businesses, exports and jobs. | ||
Innovation | ||
● Drive economic recovery and growth by delivering and attracting innovation investment to sustain and create Queensland jobs. | ||
Minister for Fire and Disaster Recovery and Minister for Corrective Services | Corrective Services | |
● Work to increase community safety, break the cycle of re-offending and make a real and measurable difference in people’s lives through their contact with the correctional system. | ||
Fire and Emergency Services | ||
● Contribute to the provision of a timely, coordinated and appropriate response to minimise the effects of fire and emergency events. | ||
● Implement Disaster Management strategies. | ||
● Maintain a risk-based approach to fire and emergency services and continue to support the State Emergency Service and Rural Fire Service. | ||
Disaster Recovery and Resilience | ||
● Implement the Queensland Strategy for Disaster Resilience.
| ||
| December 2023 | Page | 100 |
| Minister | Role and focus | |
Minister for Transport and Main Roads and Minister for Digital Services | Transport | |
● Work to deliver better road and transport infrastructure across Queensland. | ||
● Oversee implementation of programs to ensure an effective, efficient and accessible public transport system. | ||
Main Roads | ||
● Ensure planning for priority main road infrastructure projects consider the State Government’s delivery objectives for the Brisbane 2032 Olympic and Paralympic Games and the associated funding strategy. | ||
Ports and Marine Infrastructure | ||
● Oversee improvements to marine infrastructure across Queensland. | ||
● Implement the Reef 2050 Long-Term Sustainability Plan in conjunction with the Minister for the Environment and the Great Barrier Reefand Minister for Science and Innovation. | ||
● Oversee the Maritime Jobs Taskforce and implementation of Taskforce recommendations to revitalise Queensland’s coastal shipping industry. | ||
Cross River Rail. | ||
● Deliver Cross River Rail to improve network reliability and increase heavy rail accessibility to the Brisbane CBD and across the South East Queensland region. | ||
Digital Services | ||
● Continue to implement the Government’s agenda for digital technology in Government services and digital inclusion of disadvantaged Queenslanders. | ||
● Ensure Queensland Government information is publicly available through open data, providing Queenslanders with the opportunity to create apps, establish research programs and start new businesses. | ||
| Minister for Employment and Small Business and Minister for Training and Skills Development | Employment | |
● Lead the development of innovative employment policies and programs with a focus on supporting under-represented cohorts across Queensland’s workforce. | ||
● Support young people who are disengaged or at risk of disengaging in education, training, and employment. | ||
Small Business | ||
● Develop and implement the next Queensland Small Business Strategy to continue to build a strong and resilient small business sector to drive job creation and growth. | ||
Training and Skills Development | ||
● Oversee the Government’s Skilling Queenslanders for Work initiative to support disadvantaged Queenslanders to gain skills, qualifications and experience through program implementation and delivery.
| ||
| December 2023 | Page | 101 |
| Minister | Role and focus | |
Minister for Child Safety, Minister for Seniors and Disability Services and Minister for Multicultural Affairs | Child Safety | |
● Deliver family support services to help families earlier and moderate the number of children entering the child protection system. | ||
● Continue to identify and implement strategies to address and manage the current and future demand on child safety services.
| ||
| Seniors | ||
● Support older people to lead healthy and productive lives and ensure government policies and programs continue to be age friendly.
| ||
| Disability Services | ||
● Support vulnerable Queenslanders to lead better lives and maximise opportunities, by working with the Federal Government, and relevant Queensland Government agencies, to ensure effective governance and operation of the National Disability Insurance Scheme (NDIS).
| ||
| Multicultural Affairs | ||
● Lead actions and policy that will implement the principles of the Multicultural Queensland Charter and promote Queensland as a united, harmonious and inclusive community.
| ||
Minister for Tourism and Sport | Tourism Industry Development | |
● Drive the tourism sector’s recovery from COVID–19 and future growth.
| ||
| Sport | ||
● Support the sport and recreation industry to increase participation of different cultural groups to enhance social cohesion.
| ||
| December 2023 | Page | 102 |
Appendix C: Supporting Information
Queensland has detailed and evolving information available. Please see below for links used to source information in this report.

| 1 | https://www.treasury.qld.gov.au/about-treasury/acknowledgement-of-traditional-custodians/ |
| 2 | https://www.ifrs.org/issued-standards/ifrs-sustainability-standards-navigator/ifrs-s1-general-requirements/ |
| 3 | https://www.ifrs.org/issued-standards/ifrs-sustainability-standards-navigator/ifrs-s2-climate-related-disclosures/ |
| 4 | Queensland Snapshot sources: |
Queensland population, https://www.qgso.qld.gov.au/statistics/theme/population/population-estimates/state-territories/qld-population-counter
National, state and territory population, https://www.abs.gov.au/statistics/people/population/national-state-and-territory-population/latest-release
Queensland Gross State Product, https://www.abs.gov.au/statistics/economy/national-accounts/australian-national-accounts-state-accounts/latest-release | Table 4. Expenditure, Income and Industry Components of Gross State Product, Queensland, Chain volume measures and current prices | Total all industries; GROSS STATE PRODUCT: Current prices
Queensland Area, https://www.qld.gov.au/about/about-queensland/statistics-facts/facts
Appendix A: Datasets Metric 1: Total carbon dioxide emissions by gas type
Appendix A: Datasets Metric 5: Renewable energy as a share of total energy consumed
Gross state product at factor cost by industry and main components, https://www.qgso.qld.gov.au/statistics/theme/economy/economic-activity/queensland-state-accounts
2022-23 Report on State Finances of the Queensland Government (ROSF) – 30 June 2023, https://s3.treasury.qld.gov.au/files/Report-on-State-Finances-2022-23.pdf | Government Capital expenditure is referred to as Purchases of Non-financial Assets by Function Outcome in the ROSF.
| 5 | https://www.qld.gov.au/about/newsroom/regional-community-forums |
| 6 | https://www.qld.gov.au/about/how-government-works/government-responsibilities |
| 7 | The letters are publicly available from the Queensland Cabinet and Ministerial Directory (https://cabinet.qld.gov.au/ministers-portfolios.aspx) |
| 8 | https://www.parliament.qld.gov.au/ |
| 9 | https://www.qld.gov.au/about/how-government-works/government-structure |
| 10 | https://budget.qld.gov.au/files/Budget_2023-24_Strategy_Outlook.pdf |
| 11 | https://www.legislation.qld.gov.au/view/html/inforce/current/act-2009-009 |
| 12 | https://www.treasury.qld.gov.au/resource/guide-risk-management/ |
| 13 | https://www.forgov.qld.gov.au/__data/assets/pdf_file/0017/183212/performance-management-framework-policy.pdf |
| 14 | https://www.imf.org/en/Topics/climate-change/climate-and-the-economy |
| 15 | https://cabinet.qld.gov.au/ministers-portfolios.aspx |
| 16 | https://www.ipcc.ch/report/ar6/syr/downloads/report/IPCC_AR6_SYR_SPM.pdf |
| 17 | https://www.epw.qld.gov.au/climate/clean-economy-pathway |
| 18 | https://qro.qld.gov.au/royalty/overview |
| 19 | https://www.ga.gov.au/digital-publication/aecr2023/coal |
| 20 | https://budget.qld.gov.au/files/Budget_2023-24_Strategy_Outlook.pdf | Page 111 |
| 21 | https://www.dcceew.gov.au/climate-change/emissions-reporting/national-greenhouse-energy-reporting-scheme/safeguard-mechanism |
| 22 | https://www.cleanenergyregulator.gov.au/NGER/The-Safeguard-Mechanism |
| 23 | https://www.cleanenergyregulator.gov.au/NGER/The-Safeguard-Mechanism/safeguard-data/safeguard-facility-reported-emissions/safeguard- facility-reported-emissions-2021-22 |
| 24 | https://www.treasury.qld.gov.au/investment/investment-programs-and-support/low-emissions-investment-partnerships/ |
| 25 | https://www.resources.qld.gov.au/qridp |
| 26 | https://www.ilo.org/global/topics/green-jobs/WCMS_824102/lang--en/index.htm |
| 27 | https://www.epw.qld.gov.au/__data/assets/pdf_file/0010/33031/queensland-energy-plan-workers-charter.pdf |
| 28 | https://www.statedevelopment.qld.gov.au/industry/queensland-new-industry-opportunities/regional-economic-futures-fund |
| December 2023 | Page | 103 |
| 29 | https://www.publications.qld.gov.au/dataset/clean-energy-workforce-roadmap/resource/62a2ef56-8100-4171-9117-964afabd65ec |
| 30 | https://www.qld.gov.au/jobs/jobs-and-training-support |
| 31 | https://www.des.qld.gov.au/climateaction |
| 32 | https://www.des.qld.gov.au/climateaction/emissions-targets |
| 33 | https://www.epw.qld.gov.au/energyandjobsplan |
| 34 | https://www.epw.qld.gov.au/__data/assets/pdf_file/0015/39201/qejp-2023-update.pdf |
| 35 | https://statements.qld.gov.au/statements/96232 |
| 36 | https://www.epw.qld.gov.au/__data/assets/pdf_file/0010/33031/queensland-energy-plan-workers-charter.pdf |
| 37 | https://www.statedevelopment.qld.gov.au/industry/queensland-new-industry-opportunities/regional-economic-futures-fund |
| 38 | https://www.powerlink.com.au/news-media/new-copperstring-hq-sparks-more-employment-region |
| 39 | https://statements.qld.gov.au/statements/97857 |
| 40 | https://www.epw.qld.gov.au/energyandjobsplan/about/supergrid |
| 41 | https://www.epw.qld.gov.au/about/initiatives/borumba-dam-pumped-hydro |
| 42 | https://www.epw.qld.gov.au/about/initiatives/pioneer-burdekin-pumped-hydro-energy-storage |
| 43 | https://www.powerlink.com.au/sites/default/files/2023-09/Delivering%20a%20new%20500kV%20transmission.pdf |
| 44 | https://www.epw.qld.gov.au/__data/assets/pdf_file/0021/37524/2022-23-EPW-Annual-Report.pdf |
| 45 | https://statements.qld.gov.au/statements/98991 |
| 46 | https://yoursayhpw.engagementhq.com/energy-bill-consultation |
| 47 | https://www.legislation.qld.gov.au/view/html/bill.first/bill-2022-053/lh |
| 48 | https://cleancoqueensland.com.au/250mw-swanbank-battery-as-seq-joins-clean-energy-hub-revolution/ |
| 49 | https://www.csenergy.com.au/what-we-do/firming-and-storage/brigalow-peaking-power-plant |
| 50 | https://www.statedevelopment.qld.gov.au/news/what-is-copperstring-2032-and-why-is-it-important-for-queenslands-renewable-energy-future |
| 51 | https://www.powerlink.com.au/projects/copperstring-2032 |
| 52 | https://www.powerlink.com.au/sites/default/files/2023-09/Powerlink%20Queensland%20Annual%20Report%20and%20Financial%20Statements%202022-23.pdf | Page 1 |
| 53 | https://www.publications.qld.gov.au/dataset/clean-energy-workforce-roadmap/resource/62a2ef56-8100-4171-9117-964afabd65ec |
| 54 | https://www.qld.gov.au/transport/projects/electricvehicles/zero-emission-strategy |
| 55 | https://www.publications.qld.gov.au/dataset/zeroemissisonvehiclestrategy |
| 56 | https://www.hpw.qld.gov.au/__data/assets/pdf_file/0021/21882/qfleet-electric-vehicle-transition-strategy-2023-2026.pdf |
| 57 | https://www.publications.qld.gov.au/ckan-publications-attachments-prod/resources/cc180075-23bb-499f-8ac2-d1704973feca/zev- strategy.pdf?ETag=2194a593a5798b4a949ddac821181e55 |
| 58 | https://www.publications.qld.gov.au/dataset/annual-report-2022-2023-transport-and-main-roads | Page 30 |
| 59 | https://www.qld.gov.au/transport/projects/electricvehicles/co-funded-electric-vehicle-charging-locations |
| 60 | https://www.qrida.qld.gov.au/program/queensland-zero-emission-vehicle-rebate-scheme |
| 61 | https://www.des.qld.gov.au/climateaction/theplan/qld-climate-action-plan |
| 62 | https://www.epw.qld.gov.au/__data/assets/pdf_file/0021/37524/2022-23-EPW-Annual-Report.pdf | Page 31 |
| 63 | https://www.epw.qld.gov.au/about/initiatives/queensland-business-energy-savings-transformation |
| 64 | https://www.epw.qld.gov.au/about/strategy/building-plan/update |
| 65 | https://www.qld.gov.au/housing/buying-owning-home/energy-water-home/electricity/digital-meters |
| 66 | https://ecobiz.businesschamberqld.com.au/ |
| 67 | https://businesschamberqld.com.au/sustainability |
| 68 | https://www.qld.gov.au/housing/home-modifications-energy-savings/climate-smart-energy-savers |
| 69 | https://www.business.qld.gov.au/running-business/energy-business/energy-efficiency-rebate |
| 70 | https://www.epw.qld.gov.au/about/initiatives/modern-homes/modern-homes-standards |
| 71 | https://www.epw.qld.gov.au/__data/assets/pdf_file/0024/4839/qldbuildingplan.pdf |
| 72 | https://www.abcb.gov.au/news/2023/ncc-2022-adopted |
| 73 | https://www.epw.qld.gov.au/about/initiatives/modern-homes |
| 74 | https://www.epw.qld.gov.au/about/initiatives/modern-homes/modern-homes-standards |
| 75 | https://www.energyq.com.au/__data/assets/pdf_file/0011/1118828/Energy-Queensland-Ltd-Annual-Report-2022-23.pdf.pdf | Page 23 |
| December 2023 | Page | 104 |
| 76 | https://ecobiz.businesschamberqld.com.au/faqs/ecobiz-program-faqs/ |
| 77 | https://ecobiz.businesschamberqld.com.au/assets/Uploads/CCIQ-ecoBIZ-Resource-Kit-small.pdf |
| 78 | https://www.qld.gov.au/housing/home-modifications-energy-savings/climate-smart-energy-savers/about |
| 79 | https://www.treasury.qld.gov.au/investment/investment-programs-and-support/low-emissions-investment-partnerships/ |
| 80 | https://www.daf.qld.gov.au/news-media/campaigns/low-emissions-roadmap/about-the-roadmap |
| 81 | https://www.health.qld.gov.au/__data/assets/pdf_file/0025/1125961/climate-risk-strategy-2021-2026.pdf |
| 82 | https://www.qao.qld.gov.au/sites/default/files/2021- 03/Planning%20for%20sustainable%20health%20services%20%28Report%2016%E2%80%942020%E2%80%9321%29%E2%80%94Appendix%20A_ 0.pdf |
| 83 | https://www.tmr.qld.gov.au/Community-and-environment/Planning-for-the-future/Building-sustainable-roads |
| 84 | https://www.tmr.qld.gov.au/-/media/communityandenvironment/Environmental-Management/Waste-management/Waste-2-Resource- Strategy.pdf?la=en |
| 85 | https://www.publications.qld.gov.au/dataset/426087bb-e415-45a9-b83c-bf06fdf3fea1/resource/51f061db-e198-41b1-8101- 660a134c3c41/download/cspw-29-2022-2023-annual-report_v2.pdf |
| 86 | https://www.health.qld.gov.au/research-reports/reports/departmental/annual-report |
| 87 | https://www.health.qld.gov.au/__data/assets/pdf_file/0029/1267148/DOH_2022_23_annual_report.pdf | Page 75 |
| 88 | https://www.tmr.qld.gov.au/Community-and-environment/Planning-for-the-future/Building-sustainable-roads |
| 89 | https://www.tmr.qld.gov.au/_/media/communityandenvironment/environmental-management/waste-management/tmr-waste-2-resource- annual-status-report-2021-2022.pdf?sc_lang=en&hash=8195890549A5156EF0968D47217A46EF |
| 90 | https://www.qld.gov.au/__data/assets/pdf_file/0028/103798/qld-waste-management-resource-recovery-strategy.pdf |
| 91 | https://www.statedevelopment.qld.gov.au/industry/critical-industry-support/resource-recovery |
| 92 | https://www.statedevelopment.qld.gov.au/__data/assets/pdf_file/0014/17204/resource-recovery-roadmap.pdf |
| 93 | https://www.qld.gov.au/environment/circular-economy-waste-reduction/disposal-levy/about/overview/waste-resource-recovery-package |
| 94 | https://statements.qld.gov.au/statements/98545 |
| 95 | https://www.business.qld.gov.au/industries/manufacturing-retail/retail-wholesale/single-use-plastics-ban |
| 96 | https://www.statedevelopment.qld.gov.au/industry/critical-industry-support/resource-recovery/queensland-recycling-modernisation-fund |
| 97 | https://www.statedevelopment.qld.gov.au/industry/priority-industries/resource-recovery/regional-and-remote-recycling-modernisation-fund |
| 98 | https://www.statedevelopment.qld.gov.au/industry/critical-industry-support/resource-recovery |
| 99 | https://stillmed.olympics.com/media/Documents/International-Olympic-Committee/Commissions/Future-host-commission/The-Games-of-The- Olympiad/Brisbane-2032-FHC-Questionnaire-Response.pdf?_ga=2.247390020.1150708900.1695171226-1137852844.1691125125 |
| 100 | https://www.epw.qld.gov.au/about/strategy/buy-qld/q2032-procurement-strategy |
| 101 | https://console.q2032.au/documents/ELEVATE%202042%20Legacy%20Strategy_FULL%20LENGTH.pdf |
| 102 | https://www.des.qld.gov.au/climateaction/climate-sustainable-games |
| 103 | https://www.qld.gov.au/environment/management/funding/community-sustainability |
| 104 | https://apps.des.qld.gov.au/sustainability-action-grants/ |
| 105 | https://www.qld.gov.au/__data/assets/pdf_file/0017/67301/qld-climate-adaptation-strategy.pdf |
| 106 | https://www.des.qld.gov.au/climateaction/theplan/climate-adaptation |
| 107 | https://www.longpaddock.qld.gov.au/about/ |
| 108 | https://www.longpaddock.qld.gov.au/dcap/ |
| 109 | https://www.longpaddock.qld.gov.au/forage/myforage/ |
| 110 | https://www.business.qld.gov.au/industries/farms-fishing-forestry/agriculture/disaster/drought/assistance/farm-business-resilience-program |
| 111 | https://www.nacp.org.au/ |
| 112 | https://www.qld.gov.au/housing/buying-owning-home/financial-help-concessions/resilient-homes-fund/overview/resilient-retrofit |
| 113 | https://www.qld.gov.au/housing/buying-owning-home/financial-help-concessions/resilient-homes-fund/overview/home-raising |
| 114 | https://www.qld.gov.au/housing/buying-owning-home/financial-help-concessions/resilient-homes-fund/overview/buy-back |
| 115 | https://www.epw.qld.gov.au/__data/assets/pdf_file/0021/37524/2022-23-EPW-Annual-Report.pdf |
| 116 | https://www.qld.gov.au/housing/buying-owning-home/financial-help-concessions/resilient-homes-fund/overview/demolish-and-rebuild-or-relocate |
| 117 | https://statements.qld.gov.au/statements/98510 |
| 118 | https://www.epw.qld.gov.au/__data/assets/pdf_file/0021/37524/2022-23-EPW-Annual-Report.pdf |
| December 2023 | Page | 105 |
| 119 | https://statements.qld.gov.au/statements/98464 |
| 120 | https://www.disaster.qld.gov.au/__data/assets/pdf_file/0027/339336/Interim-2023-QSDMP-V1.2.pdf |
| 121 | https://www.qra.qld.gov.au/recovery/recovery-governance/queensland-recovery-plan |
| 122 | https://www.qra.qld.gov.au/qsdr |
| 123 | https://www.disaster.qld.gov.au/queensland-emergency-risk-management-framework |
| 124 | https://www.qfes.qld.gov.au/prepare/cyclone |
| 125 | https://www.disaster.qld.gov.au/warnings |
| 126 | https://www.disaster.qld.gov.au/plans |
| 127 | https://www.qra.qld.gov.au/resilience/sendai-framework-voluntary-commitments |
| 128 | https://www.disaster.qld.gov.au/ |
| 129 | https://www.disaster.qld.gov.au/queensland-emergency-risk-management-framework |
| 130 | https://www.disaster.qld.gov.au/__data/assets/pdf_file/0034/339298/QFES-Tropical-Cyclone-Preparedness-Guide.pdf |
| 131 | https://www.qra.qld.gov.au/funding/drfa |
| 132 | https://www.qra.qld.gov.au/funding-programs/event-specific-exceptional-circumstances-assistance |
| 133 | https://www.qra.qld.gov.au/sites/default/files/2022-03/0417%20DFRA%20%26%20SDRA_MAR_22_0.pdf |
| 134 | https://www.qra.qld.gov.au/funding-programs/state-disaster-relief-arrangements-sdra |
| 135 | https://www.qra.qld.gov.au/recovery/recovery-operations/2022-23-northern-and-central-queensland-monsoon-and-flooding |
| 136 | https://www.qra.qld.gov.au/sites/default/files/2023-08/qra_quarterly_report_june_2023_0.pdf |
| 137 | https://www.qra.qld.gov.au/sites/default/files/2023-08/doc_23_52086_0734_ceo_2023_monthly_report_july-2023_v12_6.pdf |
| 138 | https://www.qra.qld.gov.au/funding/drfa |
| 139 | https://www.qra.qld.gov.au/frmp-2021-22 |
| 140 | https://www.qcoast2100.com.au/ |
| 141 | https://www.tmr.qld.gov.au/business-industry/technical-standards-publications/climate-change |
| 142 | https://www.qra.qld.gov.au/regional-resilience-strategies |
| 143 | https://www.getready.qld.gov.au/ |
| 144 | https://qcrc.lgaq.asn.au/program-purpose.html |
| 145 | https://www.qcoast2100.com.au/funding/status-of-projects |
| 146 | https://www.qcoast2100.com.au/qcoast-20-projects/qcoast-20-eligibility-1 |
| 147 | https://www.qcoast2100.com.au/qcoast2100-20-1/qcoast2100-20-2 |
| 148 | https://www.qra.qld.gov.au/regional-resilience-strategies |
| 149 | https://qcrc.lgaq.asn.au/climate-risk-management-framework1.html |
| 150 | https://library-qcrc.lgaq.asn.au/qcrc-resources-directory |
| 151 | https://www.dtis.qld.gov.au/__data/assets/pdf_file/0003/1647120/22268-Towards-Tourism-2032-ONLINE-STRATEGY-v5-.pdf |
| 152 | https://www.dtis.qld.gov.au/news/latest/2023/online-platform-to-explore-tourism-opportunities-in-regions-impacted-by-natural-disasters |
| 153 | https://www.resources.qld.gov.au/mining-exploration/initiatives/critical-minerals-strategy |
| 154 | https://statements.qld.gov.au/statements/98059 |
| 155 | https://www.statedevelopment.qld.gov.au/regions/regional-priorities/a-strong-and-prosperous-north-west-queensland |
| 156 | https://www.statedevelopment.qld.gov.au/news/what-is-copperstring-2032-and-why-is-it-important-for-queenslands-renewable-energy-future |
| 157 | https://www.statedevelopment.qld.gov.au/regions/regional-priorities/a-strong-and-prosperous-north-west-queensland/achievements-and- deliverables |
| 158 | https://statements.qld.gov.au/statements/98946 |
| 159 | https://cabinet.qld.gov.au/documents/2019/May/HydrInd/Attachments/Strategy.PDF |
| 160 | https://statements.qld.gov.au/statements/97705 |
| 161 | https://www.legislation.qld.gov.au/view/html/bill.first/bill-2022-043/lh |
| 162 | https://www.gladstone.qld.gov.au/downloads/file/4153/item-3-1-attach-01-stanwell-corporation-limited-presentation |
| 163 | https://statements.qld.gov.au/statements/98222 |
| 164 | https://www.statedevelopment.qld.gov.au/industry/queensland-is-renewable-ready/fortescue-future-industries |
| 165 | https://www.statedevelopment.qld.gov.au/industry/priority-industries/hydrogen-industry-development/hydrogen-industry-development-fund |
| 166 | https://statements.qld.gov.au/statements/98949 |
| December 2023 | Page | 106 |
| 167 | https://statements.qld.gov.au/statements/97705 |
| 168 | https://www.legislation.qld.gov.au/view/html/bill.first/bill-2022-043/lh |
| 169 | https://statements.qld.gov.au/statements/95128 |
| 170 | https://www.statedevelopment.qld.gov.au/__data/assets/pdf_file/0017/13337/biofutures-10yr-roadmap-actionplan.pdf |
| 171 | https://www.statedevelopment.qld.gov.au/industry/critical-industry-support/biofutures |
| 172 | https://www.des.qld.gov.au/climateaction/take-action/business-industry |
| 173 | https://lowcarbonqld.com/ |
| 174 | https://www.qtc.com.au/institutional-investors/green-bonds/ |
| 175 | https://www.qtc.com.au/wp-content/uploads/2023/07/2023-QTC-Green-Bond-Annual-Report_Web.pdf |
| 176 | https://www.des.qld.gov.au/climateaction |
| 177 | https://www.longpaddock.qld.gov.au/qld-future-climate/adapting/impacts/ |
| 178 | https://www.des.qld.gov.au/climateaction/resources/science |
| 179 | https://www.disaster.qld.gov.au/__data/assets/pdf_file/0035/339299/QFES-Severe-Wind-Hazard-Exec-Summary.pdf |
| 180 | https://www.longpaddock.qld.gov.au/qld-future-climate/tropical-cyclone/ |
| 181 | https://www.climatereadyaustralia.com.au/queensland-climate-ready-program-update/ |
| 182 | https://dsdmipprd.blob.core.windows.net/general/what-is-the-state-planning-policy.pdf |
| 183 | https://www.qra.qld.gov.au/regional-resilience-strategies |
| 184 | https://www.tmr.qld.gov.au/business-industry/Technical-standards-publications/Climate-change |
| 185 | https://www.des.qld.gov.au/climateaction/emissions-targets |
| 186 | https://ageis.climatechange.gov.au/ |
| 187 | https://www.epw.qld.gov.au/about/initiatives/renewable-energy-targets |
| 188 | https://tnfd.global/wp-content/uploads/2023/09/Glossary_of_key_terms_v1.pdf?v=1695138274 |
| 189 | https://www.qld.gov.au/environment/plants-animals/biodiversity/strategy |
| 190 | https://www.qld.gov.au/__data/assets/pdf_file/0015/222081/queensland-biodiversity-conservation-strategy.pdf |
| 191 | https://www.resources.qld.gov.au/about-us/regulatory-role/land-resources |
| 192 | https://www.business.qld.gov.au/industries/mining-energy-water/water/industry-infrastructure/supply-planning/sources-queensland |
| 193 | https://www.business.qld.gov.au/industries/mining-energy-water/water/catchments-planning/water-plan-areas |
| 194 | https://www.stateoftheenvironment.des.qld.gov.au/biodiversity/estuarine-and-marine-ecosystems |
| 195 | https://www.qld.gov.au/environment/management/monitoring/air |
| 196 | https://www.qld.gov.au/__data/assets/pdf_file/0015/222081/queensland-biodiversity-conservation-strategy.pdf |
| 197 | https://parks.des.qld.gov.au/management/plans-strategies/protected-area-strategy |
| 198 | https://www.qld.gov.au/environment/climate/climate-change/land-restoration-fund |
| 199 | https://www.qld.gov.au/environment/plants-animals/conservation/threatened-wildlife/threatened-species/program |
| 200 | https://parks.des.qld.gov.au/management/plans-strategies/protected-area-strategy |
| 201 | https://parks.des.qld.gov.au/__data/assets/pdf_file/0016/212524/qld-protected-area-strategy-2020-30.pdf |
| 202 | https://parks.des.qld.gov.au/__data/assets/pdf_file/0025/306934/qld-protected-area-strategy-2022-report-card.pdf |
| 203 | https://statements.qld.gov.au/statements/97722 |
| 204 | https://statements.qld.gov.au/statements/97300 |
| 205 | https://statements.qld.gov.au/statements/98395 |
| 206 | https://statements.qld.gov.au/statements/97356 |
| 207 | https://www.qld.gov.au/environment/plants-animals/conservation/community/land-sea-rangers/grants-program/recipients?root=341821 |
| 208 | https://environment.des.qld.gov.au/__data/assets/pdf_file/0025/260683/regulatory-strategy-2022-2027.pdf |
| 209 | https://environment.des.qld.gov.au/management/policy-regulation/regulatory-strategy/progress-report |
| 210 | https://www.daf.qld.gov.au/business-priorities/biosecurity/enhancing-capability-capacity/qld-biosecurity-strategy |
| 211 | https://budget.qld.gov.au/files/Budget_2023-24_Strategy_Outlook.pdf |
| 212 | https://www.qld.gov.au/__data/assets/pdf_file/0022/209803/threatened-species-program-2020-2040.pdf |
| 213 | https://www.daf.qld.gov.au/business-priorities/biosecurity/programs |
| 214 | https://www.statedevelopment.qld.gov.au/coordinator-general |
| December 2023 | Page | 107 |
| 215 | https://www.statedevelopment.qld.gov.au/coordinator-general/state-development-areas/development-schemes-applications-and-requests |
| 216 | https://parks.des.qld.gov.au/__data/assets/pdf_file/0016/212524/qld-protected-area-strategy-2020-30.pdf |
| 217 | https://parks.des.qld.gov.au/management/managed-areas/world-heritage-areas/qld-first-nations-wh-strategy |
| 218 | https://statements.qld.gov.au/statements/98131 |
| 219 | https://www.qld.gov.au/environment/land/management/vegetation |
| 220 | https://www.qld.gov.au/environment/land/management/vegetation/clearing-laws |
| 221 | https://statements.qld.gov.au/statements/98323 |
| 222 | https://www.daf.qld.gov.au/business-priorities/forestry/native-timber-action-plan/state-owned-native-timber |
| 223 | https://www.daf.qld.gov.au/business-priorities/agriculture |
| 224 | https://www.business.qld.gov.au/industries/farms-fishing-forestry/agriculture/land-management |
| 225 | https://www.business.qld.gov.au/industries/farms-fishing-forestry/agriculture/business/expand/land-audit |
| 226 | https://www.resources.qld.gov.au/qridp |
| 227 | https://www.resources.qld.gov.au/mining-exploration/initiatives/critical-minerals-strategy |
| 228 | https://www.business.qld.gov.au/running-business/environment/natural-resource-funding |
| 229 | https://www.business.qld.gov.au/running-business/environment/natural-resource-funding/recipients |
| 230 | https://apps.des.qld.gov.au/public-register/ |
| 231 | https://www.business.qld.gov.au/running-business/environment/licences-permits |
| 232 | https://www.resources.qld.gov.au/__data/assets/pdf_file/0005/1552973/abandoned-mines-risk-prioritisation-framework.pdf |
| 233 | https://www.business.qld.gov.au/running-business/environment/licences-permits/rehabilitation/progressive-rehabilitation-closure-plans |
| 234 | https://www.qld.gov.au/environment/land/management/abandoned-mines/remediation-projects |
| 235 | https://www.qmrc.qld.gov.au |
| 236 | https://www.business.qld.gov.au/running-business/environment/licences-permits/rehabilitation/financial-provisioning-scheme |
| 237 | www.rdmw.qld.gov.au |
| 238 | https://www.rdmw.qld.gov.au/__data/assets/pdf_file/0007/1769317/drdmw-annual-report-2022-23.pdf |
| 239 | https://science.des.qld.gov.au/government/science-division/water-and-coastal/waters |
| 240 | https://www.rdmw.qld.gov.au/water/consultations-initiatives/qld-water-strategy |
| 241 | https://www.rdmw.qld.gov.au/water/managing-climate-change-risks |
| 242 | https://www.business.qld.gov.au/industries/mining-energy-water/water/industry-infrastructure/supply-planning/security/seq |
| 243 | https://www.rdmw.qld.gov.au/__data/assets/pdf_file/0007/1769317/drdmw-annual-report-2022-23.pdf | Page 23 |
| 244 | https://www.rdmw.qld.gov.au/water/consultations-initiatives/first-nations-water-strategy |
| 245 | https://www.business.qld.gov.au/industries/mining-energy-water/water/catchments-planning/qld-murray-darling-basin |
| 246 | https://www.business.qld.gov.au/industries/mining-energy-water/water/catchments-planning/planning |
| 247 | https://www.business.qld.gov.au/industries/mining-energy-water/water/catchments-planning/planning/developing |
| 248 | https://www.business.qld.gov.au/industries/mining-energy-water/water/catchments-planning/water-plan-areas |
| 249 | https://www.dcceew.gov.au/parks-heritage/great-barrier-reef/protecting/reef-2050-plan |
| 250 | https://www.dcceew.gov.au/sites/default/files/documents/reef-2050-long-term-sustainability-plan-2021-2025.pdf |
| 251 | https://whc.unesco.org/en/documents/197090 |
| 252 | https://www.qld.gov.au/environment/coasts-waterways/reef/gill-net-fishing-phase-out |
| 253 | https://www.reefplan.qld.gov.au/__data/assets/pdf_file/0017/46115/reef-2050-water-quality-improvement-plan-2017-22.pdf |
| 254 | https://www.qld.gov.au/environment/coasts-waterways/reef/reef-program |
| 255 | https://reportcard.reefplan.qld.gov.au/ |
| 256 | https://reportcard.reefplan.qld.gov.au/home?report=overview&year=611f443aba3074128316eb07 |
| 257 | https://reportcard.reefplan.qld.gov.au/home?report=condition&year=611f443aba3074128316eb07&measure=IMC&area=GBR |
| 258 | https://reportcard.reefplan.qld.gov.au/home?report=condition&year=611f443aba3074128316eb07&measure=WCND-State&area=GBR |
| 259 | https://reportcard.reefplan.qld.gov.au/home?report=target&year=611f443aba3074128316eb07&measure=DIN&area=GBR |
| 260 | https://reportcard.reefplan.qld.gov.au/home?report=target&year=611f443aba3074128316eb07&measure=FS&area=GBR |
| 261 | https://cabinet.qld.gov.au/documents/2017/Jun/FishPol/Attachments/Strategy.pdf |
| 262 | https://www.daf.qld.gov.au/business-priorities/fisheries/sustainable/sustainable-fisheries-strategy-overview |
| December 2023 | Page | 108 |
| 263 | https://www.daf.qld.gov.au/business-priorities/fisheries/sustainable/sustainable-fisheries-strategy-overview |
| 264 | https://apps.des.qld.gov.au/air-quality/ |
| 265 | https://apps.des.qld.gov.au/air-quality/health/about/ |
| 266 | https://www.qld.gov.au/environment/management/monitoring/air/air-programs |
| 267 | https://www.qld.gov.au/environment/climate/climate-change/land-restoration-fund/co- benefits/overview#:~:text=The%20first%20Co%2Dbenefit%20Standard,and%20First%20Nations%20co%2Dbenefits |
| 268 | https://www.qld.gov.au/environment/climate/climate-change/land-restoration-fund/about/overview |
| 269 | https://www.qld.gov.au/environment/climate/climate-change/land-restoration-fund/co-benefits/overview |
| 270 | https://www.qld.gov.au/environment/climate/climate-change/land-restoration-fund/funded-projects/investment-rounds-report |
| 271 | https://www.qld.gov.au/environment/climate/climate-change/land-restoration-fund/2023-investment-round-3/carbon-project-developers |
| 272 | https://www.des.qld.gov.au/__data/assets/pdf_file/0013/324040/annual-report-2022-2023.pdf | Page 76 |
| 273 | https://carbonmarketinstitute.org/app/uploads/2023/05/2023-Carbon-Farming-Scorecard-FINAL.pdf | Page 13 |
| 274 | https://budget.qld.gov.au/files/Budget_2023-24_SDS_Department_of_Tourism_Innovation_and_Sport.pdf |
| 275 | https://www.dtis.qld.gov.au/tourism/funds/act-eco-infrastructure |
| 276 | https://www.dtis.qld.gov.au/tourism/funds/eco-certified-tourism |
| 277 | https://www.dtis.qld.gov.au/__data/assets/pdf_file/0003/1647120/22268-Towards-Tourism-2032-ONLINE-STRATEGY-v5-.pdf | Page 10 |
| 278 | https:/www.qld.gov.au/environment/land/management/mapping/statewide-monitoring/slats/slats-data |
| 279 | https://www.qld.gov.au/environment/plants-animals/plants/herbarium |
| 280 | https://www.qld.gov.au/environment/plants-animals/plants/herbarium/mapping-ecosystems |
| 281 | https://www.qld.gov.au/environment/plants-animals/plants/ecosystems/remnant-vegetation |
| 282 | https://www.business.qld.gov.au/running-business/support-assistance/mapping-data-imagery/queensland-globe |
| 283 | https://qldglobe.information.qld.gov.au/ |
| 284 | https://www.qld.gov.au/environment/land/management/mapping/statewide-monitoring/qlump |
| 285 | https:/www.qld.gov.au/environment/land/management/mapping/statewide-monitoring/qlump/qlump-datasets |
| 286 | https://www.qld.gov.au/environment/land/management/mapping/statewide-monitoring/qlump/qlump-reports |
| 287 | https://wetlandinfo.des.qld.gov.au/wetlands/about-us/wetlandinfo.html |
| 288 | https://wetlandinfo.des.qld.gov.au/wetlands/ |
| 289 | https://www.reefplan.qld.gov.au/tracking-progress/reef-report-card |
| 290 | https://www2.gbrmpa.gov.au/our-work/programs-and-projects/reef-2050-integrated-monitoring-and-reporting-program |
| 291 | https://www.reefplan.qld.gov.au/tracking-progress/paddock-to-reef |
| 292 | https://apps.des.qld.gov.au/air-quality/ |
| 293 | https://www.forgov.qld.gov.au/finance-and-procurement/procurement/buy-for-queensland-government/buying-categories/social-services |
| 294 | https://www.legislation.qld.gov.au/view/html/inforce/current/act-2009-009 |
| 295 | https://www.justice.qld.gov.au/about-us/services/women-violence-prevention/women/queensland-womens-strategy/about |
| 296 | https://www.abs.gov.au/statistics/labour/employment-and-unemployment/labour-force-australia-detailed/latest-release |
| 297 | https://www.qhrc.qld.gov.au/ |
| 298 | https://www.qhrc.qld.gov.au/__data/assets/pdf_file/0003/40647/Queensland-Human-Rights-Commission-Annual-Report-2021-22.pdf | Page 19 |
| 299 | https://www.qhrc.qld.gov.au/__data/assets/pdf_file/0004/40666/QHRC_AnnualSnapshot_2021-22.pdf |
| 300 | https://www.forgov.qld.gov.au/finance-and-procurement/procurement/procurement-resources/procurement-policies-and- frameworks/eliminating-modern-slavery |
| 301 | https://www.forgov.qld.gov.au/finance-and-procurement/procurement/procurement-resources/search-for-procurement-policies-resources-tools- and-templates/eliminating-modern-slavery-in-government-supply-chains |
| 302 | https://www.forgov.qld.gov.au/finance-and-procurement/procurement/procurement-resources/search-for-procurement-policies-resources-tools- and-templates/queensland-procurement-policy-2023 |
| 303 | https://www.epw.qld.gov.au/about/strategy/buy-qld/queensland-procurement-strategy-2023/jobs/supporting-best-practice-principles |
| 304 | https://www.forgov.qld.gov.au/finance-and-procurement/procurement/procurement-resources/search-for-procurement-policies-resources-tools- and-templates/queensland-government-supplier-code-of-conduct-2023 |
| 305 | https://www.forgov.qld.gov.au/finance-and-procurement/procurement/procurement-resources/search-for-procurement-policies-resources-tools- and-templates/ethical-supplier-mandate |
| 306 | https://www.dsdsatsip.qld.gov.au/our-work/aboriginal-torres-strait-islander-partnerships/reconciliation-tracks-treaty/closing-gap |
| December 2023 | Page | 109 |
| 307 | https://www.niaa.gov.au/resource-centre/indigenous-affairs/commonwealth-closing-gap-2023-annual-report-and-2024-implementation-plan |
| 308 | https://www.pc.gov.au/closing-the-gap-data/annual-data-report/report |
| 309 | https://www.dsdsatsip.qld.gov.au/resources/dsdsatsip/work/atsip/reform-tracks-treaty/closing-gap/ctg-snapshot-2023.pdf |
| 310 | https://www.dsdsatsip.qld.gov.au/our-work/aboriginal-torres-strait-islander-partnerships/reconciliation-tracks-treaty/tracks-treaty/statement-commitment |
| 311 | https://www.dsdsatsip.qld.gov.au/our-work/aboriginal-torres-strait-islander-partnerships/reconciliation-tracks-treaty/tracks-treaty/local-thriving-communities |
| 312 | https://www.dcssds.qld.gov.au/our-work/child-safety/aboriginal-torres-strait-islander-families/queensland-first-children-families-board |
| 313 | https://www.health.qld.gov.au/public-health/groups/atsihealth |
| 314 | https://www.cyjma.qld.gov.au/resources/campaign/supporting-families/our-way.pdf |
| 315 | https://www.dsdsatsip.qld.gov.au/our-work/aboriginal-torres-strait-islander-partnerships/reconciliation-tracks-treaty/tracks-treaty/local-thriving-communities/action-plan |
| 316 | https://statements.qld.gov.au/statements/96956 |
| 317 | https://www.dsdsatsip.qld.gov.au/our-work/aboriginal-torres-strait-islander-partnerships/business-economic-development/queensland- indigenous-procurement-policy |
| 318 | https://www.health.qld.gov.au/__data/assets/pdf_file/0018/1145241/EndingRHD_QLD-FN-Strategy2021-2024.pdf |
| 319 | https://www.qld.gov.au/firstnations/environment-land-use-native-title/connecting-with-country/land-transfers |
| 320 | https://www.qld.gov.au/firstnations/environment-land-use-native-title/cultural-heritage/cultural-heritage-duty-of-care |
| 321 | https://hw.qld.gov.au/gather-grow/ |
| 322 | https://www.dsdsatsip.qld.gov.au/our-work/aboriginal-torres-strait-islander-partnerships/culture/many-voices-queensland-aboriginal-torres- strait-islander-languages-policy |
| 323 | https://www.forgov.qld.gov.au/__data/assets/pdf_file/0021/367023/queensland-procurement-policy-2023.pdf I Page 2 |
| 324 | https://statements.qld.gov.au/statements/96846 |
| 325 | https://www.housing.qld.gov.au/__data/assets/pdf_file/0020/33266/communities2032-strategy-report.pdf |
| 326 | https://www.housing.qld.gov.au/about/strategy/communities2032/action-plan |
| 327 | https://www.dcssds.qld.gov.au/our-work/disability-services/state-disability-plan/disability-service-plans |
| 328 | https://www.dcssds.qld.gov.au/our-work/disability-connect-queensland/state-disability-plan/disability-service-plans |
| 329 | https://statements.qld.gov.au/statements/98438 |
| 330 | https://www.justice.qld.gov.au/initiatives/end-domestic-family-violence/dfvp-strategy |
| 331 | https://www.publications.qld.gov.au/dataset/sexual-violence-prevention/resource/a22ad633-8529-4ab7-99d6-549fec75e709 |
| 332 | https://statements.qld.gov.au/statements/98399 |
| 333 | https://www.publications.qld.gov.au/ckan-publications-attachments-prod/resources/f1339f15-05f1-43d5-a70b-25da985e7df7/djag-annual- report-2022-23.pdf?ETag=a993146e9e703bd99bf0734ef11da263 |
| 334 | https://www.justice.qld.gov.au/about-us/services/women-violence-prevention/women/queensland-womens-strategy/about |
| 335 | https://www.publications.qld.gov.au/ckan-publications-attachments-prod/resources/95357068-d24b-4565-a991-7b8be088ced9/queensland- womens-strategy-2022-27.pdf?ETag=c655247f0b2cb9f9295b45147ce05295 | Page 6 |
| 336 | https://www.publications.qld.gov.au/ckan-publications-attachments-prod/resources/87bc7918-b1e4-4dd7-80e0-72fbfd25faaa/report-card-all- 2021.pdf?ETag=0b23ea6f174105c6721fd4f022b44844 |
| 337 | https://www.publications.qld.gov.au/dataset/queensland-womens-strategy-2022-27-report-cards/resource/63a0be2a-8348-4f4f-ad10- 4752a400162c |
| 338 | https://aifs.gov.au/research/facts-and-figures/employment-men-and-women-across-life-course |
| 339 | https://www.justice.qld.gov.au/publications-policies/reports/annual-report/2021-22-djag-annual-report |
| 340 | https://www.justice.qld.gov.au/publications-policies/reports/annual-report/2020-21-djag-annual-report |
| 341 | https://www.dcssds.qld.gov.au/our-work/seniors/queensland-age-friendly-community/queenslands-age-friendly-future |
| 342 | https://www.dcssds.qld.gov.au/resources/dcsyw/seniors/age-friendly-community/future-directions/future-directions-statement.pdf |
| 343 | https://budget.qld.gov.au/budget-papers/#budget-paper-4 | Page 37 |
| 344 | https://www.housing.qld.gov.au/__data/assets/pdf_file/0022/48163/homes-for-queenslanders.pdf |
| 345 | https://www.housing.qld.gov.au/news-publications/strategies-plans/housing/about |
| 346 | https://www.housing.qld.gov.au/__data/assets/pdf_file/0023/8186/qldhousingstrategyactionplan.pdf |
| 347 | https://www.housing.qld.gov.au/__data/assets/pdf_file/0012/5214/atsihousingactionplan.pdf |
| 348 | https://www.housing.qld.gov.au/__data/assets/pdf_file/0023/17429/QldHousingStrategyActionPlan2021-25.pdf |
| December 2023 | Page | 110 |
| 349 | https://budget.qld.gov.au/overview/alleviating-housing-pressures/ |
| 350 | https://www.housing.qld.gov.au/about/strategy/housing/towards-ending-homelessness |
| 351 | https://statements.qld.gov.au/statements/98354 |
| 352 | https://www.chde.qld.gov.au/about/initiatives/housing-investment/housing-investment-fund |
| 353 | https://statements.qld.gov.au/statements/96394 |
| 354 | https://www.statedevelopment.qld.gov.au/coordinator-general |
| 355 | https://www.statedevelopment.qld.gov.au/coordinator-general/strong-and-sustainable-resource-communities |
| 356 | https://www.statedevelopment.qld.gov.au/coordinator-general/strong-and-sustainable-resource-communities/social-impact-assessment |
| 357 | https://www.statedevelopment.qld.gov.au/__data/assets/pdf_file/0027/80766/queensland-new-industry-development-strategy.pdf |
| 358 | https://www.statedevelopment.qld.gov.au/industry/queensland-new-industry-development-strategy/local-economic-opportunities-network |
| 359 | https://science.des.qld.gov.au/__data/assets/pdf_file/0028/324397/qld-quantum-advanced-technologies-strategy-2023.pdf |
| 360 | https://science.des.qld.gov.au/research/key-areas/quantum |
| 361 | https://www.rdmw.qld.gov.au/__data/assets/pdf_file/0003/1644906/advanced-manufacturing-roadmap-2022-26.pdf |
| 362 | https://www.rdmw.qld.gov.au/__data/assets/pdf_file/0007/1769317/drdmw-annual-report-2022-23.pdf |
| 363 | https://www.rdmw.qld.gov.au/manufacturing/manufacturing-assistance-programs/meeg |
| 364 | https://desbt.qld.gov.au/employment/support-employers/workforce-strategy |
| 365 | https://www.publications.qld.gov.au/ckan-publications-attachments-prod/resources/ff453627-3e2a-4dc5-96c5-a3e7bdf963fa/final-queensland- workforce-strategy_2022-2032.pdf |
| 366 | https://desbt.qld.gov.au/employment/support-employers/workforce-strategy/action-plan |
| 367 | https://desbt.qld.gov.au/employment/support-employers/workforce-strategy?a=13573 |
| 368 | https://www.publications.qld.gov.au/dataset/efaa5148-f875-4625-b5fa-15a41f0bc44c/resource/7c76aea1-7aa2-4265-bc5d- 41a52b3ca3ba/download/dyjesbt_annual_report_2022-23.pdf | Page 23 |
| 369 | https://desbt.qld.gov.au/employment/support-employers/workforce-strategy?a=14836 |
| 370 | https://statements.qld.gov.au/statements/97384 |
| 371 | https://desbt.qld.gov.au/training/training-careers/incentives/sqw |
| 372 | https://www.publications.qld.gov.au/dataset/efaa5148-f875-4625-b5fa-15a41f0bc44c/resource/7c76aea1-7aa2-4265-bc5d- 41a52b3ca3ba/download/dyjesbt_annual_report_2022-23.pdf | Page 30 |
| 373 | https://www.publications.qld.gov.au/dataset/efaa5148-f875-4625-b5fa-15a41f0bc44c/resource/7c76aea1-7aa2-4265-bc5d- 41a52b3ca3ba/download/dyjesbt_annual_report_2022-23.pdf |
| 374 | https://desbt.qld.gov.au/training/training-careers/incentives/fee-free-tafe |
| 375 | https://budget.qld.gov.au/files/Budget_2023-24_SDS_Department_of_Tourism_Innovation_and_Sport.pdf |
| 376 | https://www.dtis.qld.gov.au/tourism/tourism-strategy/towards-tourism-2032 |
| 377 | https://www.publications.qld.gov.au/dataset/department-of-tourism-innovation-and-sport-dtis-annual-report-2022-2023 |
| 378 | https://www.forgov.qld.gov.au/information-and-communication-technology/cyber-security/about-the-cyber-security-unit |
| 379 | https://www.publications.qld.gov.au/ckan-publications-attachments-prod/resources/51f061db-e198-41b1-8101-660a134c3c41/cspw-29-2022- 2023-annual-report_v2.pdf?ETag=b915cdd08b253e75b4248ff44b7fcecb | Page 23 |
| 380 | https://www.publications.qld.gov.au/ckan-publications-attachments-prod/resources/51f061db-e198-41b1-8101-660a134c3c41/cspw-29-2022- 2023-annual-report_v2.pdf?ETag=b915cdd08b253e75b4248ff44b7fcecb | Page 5 |
| 381 | https://www.tmr.qld.gov.au/about-us/our-organisation/organisational-structure/queensland-government-customer-and-digital-group |
| 382 | https://www.forgov.qld.gov.au/information-and-communication-technology/cyber-security/about-the-cyber-security-unit |
| 383 | https://education.qld.gov.au/initiatives-and-strategies/strategies-and-programs/equity-and-excellence |
| 384 | https://budget.qld.gov.au/files/Budget_2023-24_SDS_Department_of_Education.pdf |
| 385 | https://education.qld.gov.au/about-us/budgets-funding-grants/grants/state-schools/core-funding/investing-success |
| 386 | https://education.qld.gov.au/students/student-health-safety-wellbeing/student-wellbeing-package |
| 387 | https://www.qgso.qld.gov.au/issues/3646/schools-qld-2022.pdf |
| 388 | https://alt-qed.qed.qld.gov.au/our-publications/reports/annualreport/Documents/annual-report/22-23/annual-report-2022-23.pdf |
| 389 | https://s3.treasury.qld.gov.au/files/Budget_2022-23_SDS_Department_of_Education.pdf |
| 390 | https://alt-qed.qed.qld.gov.au/our-publications/strategiesandplans/Documents/strategic-plan-23-27.pdf |
| 391 | https://budget.qld.gov.au/files/Budget_2023-24_Capital_Statement.pdf |
| 392 | https://alt-qed.qed.qld.gov.au/programsinitiatives/department/buildingeducation/new-schools/Pages/planning-for-new-schools.aspx |
| December 2023 | Page | 111 |
| 393 | https://education.qld.gov.au/initiatives-and-strategies/initiatives/bandwidth-upgrade-program |
| 394 | https://www.health.qld.gov.au/__data/assets/pdf_file/0029/1267148/DOH_2022_23_annual_report.pdf |
| 395 | https://www.health.qld.gov.au/system-governance/strategic-direction/improving-service/satellite-hospitals |
| 396 | https://budget.qld.gov.au/files/Budget_2023-24_Strategy_Outlook.pdf | Page 67 |
| 397 | https://www.health.qld.gov.au/__data/assets/pdf_file/0022/1161571/v15_SC2200194-Health- Budget_ONLINE.pdf?%20utm_medium=website&utm_source=qh_www_home_page&utm_campaign=dh-WWW- HOME&utm_term=&utm_content=2022_23_budget_mrec_QH_pdf |
| 398 | https://budget.qld.gov.au/files/Budget_2023-24_Capital_Statement.pdf |
| 399 | https://www.health.qld.gov.au/system-governance/strategic-direction/improving-service/satellite-hospitals |
| 400 | https://statements.qld.gov.au/statements/98494 |
| 401 | https://www.qld.gov.au/health/services/satellite-hospitals/caboolture-satellite-hospital |
| 402 | https://metrosouth.health.qld.gov.au/about-us/initiatives/redlands-satellite-hospital |
| 403 | https://www.qld.gov.au/health/services/satellite-hospitals/ripley-satellite-hospital |
| 404 | https://www.qld.gov.au/health/services/satellite-hospitals/tugun-satellite-hospital |
| 405 | https://www.health.qld.gov.au/__data/assets/pdf_file/0036/651798/prevention-strategic-framework.pdf |
| 406 | https://hw.qld.gov.au/queensland-obesity-prevention-strategy/ |
| 407 | https://www.health.qld.gov.au/__data/assets/pdf_file/0021/1142067/Rural-and-Remote-Health-and-Wellbeing-Strategy-2022-2027-Snapshot.pdf |
| 408 | https://www.health.qld.gov.au/system-governance/strategic-direction/plans/queensland-newborn-bloodspot-screening-nbs-strategic-framework |
| 409 | https://www.health.qld.gov.au/system-governance/strategic-direction/plans/cancer-screening-strategic-framework-2019-to-2026 |
| 410 | https://www.choreport.health.qld.gov.au/our-lifestyle |
| 411 | https://www.choreport.health.qld.gov.au/about-this-report |
| 412 | https://earlychildhood.qld.gov.au/freekindy#/search |
| 413 | https://www.chiefscientist.qld.gov.au/publications/rnd-expenditure-reports |
| 414 | https://www.chiefscientist.qld.gov.au/__data/assets/pdf_file/0020/312293/rd-expenditure-report-2021-22.pdf |
| 415 | https://advance.qld.gov.au/ |
| 416 | https://advance.qld.gov.au/advance-queensland-initiative |
| 417 | https://www.publications.qld.gov.au/dataset/annual-report-department-agriculture-fisheries/resource/e077ab11-b5c7-4363-a636-8ed1c306fb1c |
| 418 | https://statements.qld.gov.au/statements/98263 |
| 419 | https://www.qic.com/qvcdf |
| 420 | https://www.qld.gov.au/about/how-government-works/objectives-for-the-community |
| 421 | https://budget.qld.gov.au/files/Budget_2023-24_Strategy_Outlook.pdf | Page 1 |
| 422 | https://budget.qld.gov.au/files/Budget_2023-24_Strategy_Outlook.pdf | Page 2 |
| 423 | https://www.abs.gov.au/statistics/economy/national-accounts/australian-national-accounts-state-accounts/latest-release |
| 424 | https://documents.parliament.qld.gov.au/tp/2021/5721T873.pdf |
| 425 | https://s3.treasury.qld.gov.au/files/Report-on-State-Finances-2022-23.pdf | Page 3-3 |
| 426 | https://s3.treasury.qld.gov.au/files/Report-on-State-Finances-2021-22.pdf | Page 3-3 |
| 427 | https://s3.treasury.qld.gov.au/files/Report-on-State-Finances-2022-23.pdf | Page 3-3, Page 4-7 |
| 428 | https://s3.treasury.qld.gov.au/files/Report-on-State-Finances-2021-22.pdf | Page 3-3, Page 4-6 |
| 429 | https://budget.qld.gov.au/files/Budget_2023-24_Strategy_Outlook.pdf| Page 59 and Page 95 |
| 430 | https://s3.treasury.qld.gov.au/files/2022-23-Treasury-Annual-Report.pdf |Page 24 |
| 431 | https://www.qic.com/News-and-Insights/2023-QIC-Sustainability-Report |
| 432 | https://www.coaldrakereview.qld.gov.au/assets/custom/docs/coaldrake-review-final-report-28-june-2022.pdf?refresh |
| 433 | https://www.legislation.qld.gov.au/view/html/bill.first/bill-2022-027 |
| 434 | https://www.treasury.qld.gov.au/budget-and-financial-management/queensland-budget/budget-process |
| 435 | https://s3.treasury.qld.gov.au/files/Overview-of-Queensland-Financial-Accountability-Framework-as-at-Jan-2020.pdf |
| 436 | https://www.forgov.qld.gov.au/__data/assets/pdf_file/0017/183212/performance-management-framework-policy.pdf |
| 437 | https://www.qao.qld.gov.au/ |
| 438 | https://www.ombudsman.qld.gov.au/ |
| 439 | https://www.ccc.qld.gov.au/ |
| 440 | https://cabinet.qld.gov.au/ministers-portfolios.aspx |
| December 2023 | Page | 112 |