EXHIBIT (c)(viii)
Queensland’s Budget Papers for 2024-25
FORWARD-LOOKING STATEMENTS
This exhibit contains forward-looking statements. Statements that are not historical facts, including statements about the State of Queensland’s (the “State” or “Queensland”) beliefs and expectations, are forward-looking statements. These statements are based on current plans, budgets, estimates and projections and therefore you should not place undue reliance on them. The words “believe”, “may”, “will”, “should”, “estimate”, “continue”, “anticipate”, “intend”, “expect”, “forecast” and similar words are intended to identify forward-looking statements. Forward-looking statements speak only as of the date they are made, and neither the Queensland Treasury Corporation nor the State undertake any obligation to update publicly any of them in light of new information or future events.
Forward-looking statements are based on current plans, estimates and projections and, therefore, undue reliance should not be placed on them. Although the Queensland Treasury Corporation and the State believe that the beliefs and expectations reflected in such forward-looking statements are reasonable, no assurance can be given that such beliefs and expectations will prove to have been correct. Forward-looking statements involve inherent risks and uncertainties. We caution you that actual results may differ materially from those contained in any forward-looking statements.
A number of important factors could cause actual results to differ materially from those expressed in any forward-looking statement. Factors that could cause the actual outcomes to differ materially from those expressed or implied in forward-looking statements include:
| • | the international and Australian economies, and in particular the rates of growth (or contraction) of the State’s major trading partners; |
| • | the effects, both internationally and in Australia, of any economic downturn, as well as the effect of ongoing economic, banking and sovereign debt risk; |
| • | the effect of natural disasters, epidemics and geopolitical events, such as the Russian invasion of Ukraine and the Israel-Hamas conflict; |
| • | increases or decreases in international and Australian domestic interest rates; |
| • | changes in and increased volatility in currency exchange rates; |
| • | changes in the State’s domestic consumption; |
| • | changes in the State’s labor force participation and productivity; |
| • | downgrades in the credit ratings of the State or Australia; |
| • | changes in the rate of inflation in the State; |
| • | changes in environmental and other regulation; and |
| • | changes in the distribution of revenue from the Commonwealth of Australia Government to the State. |
(c)(viii)-1
DOING WHAT MATTERS FOR QUEENSLAND QUEENSLAND BUDGET 2024-25 |  |
BUDGET SPEECH
BUDGET PAPER NO. 1

2024-25 Queensland Budget Papers
1. Budget Speech
2. Budget Strategy and Outlook
3. Capital Statement
4. Budget Measures
Service Delivery Statements
Appropriation Bills
Budget Overview
Regional Action Plans
First Nations acknowledgement
Queensland Treasury acknowledges Aboriginal peoples and Torres Strait Islander peoples as the Traditional Owners and custodians of the land. We recognise their connection to land, sea and community, and pay our respects to Elders past, present and emerging.
© The State of Queensland (Queensland Treasury) 2024
Copyright
This publication is protected by the Copyright Act 1968
Licence
This document is licensed by the State of Queensland (Queensland Treasury) under a Creative Commons Attribution (CC BY 4.0) International licence.

In essence, you are free to copy, communicate and adapt this publication, as long as you attribute the work to the State of Queensland (Queensland Treasury).
Attribution
Content from this publication should be attributed to:
© The State of Queensland (Queensland Treasury) - 2024–25 Queensland Budget

Translating and interpreting assistance
The Queensland Government is committed to providing accessible services to Queenslanders from all cultural and linguistic backgrounds. If you have difficulty in understanding this publication, you can contact us on telephone (07) 3035 3503 and we will arrange an interpreter to effectively communicate the report to you.
Budget Speech
Budget Paper No. 1
ISSN 1445-4890 (Print)
ISSN 1445-4904 (Online)
APPROPRIATION BILL 2024–25
THE HONOURABLE CAMERON DICK MP
DEPUTY PREMIER, TREASURER
MINISTER FOR TRADE AND INVESTMENT
INTRODUCTION
This first Budget of the Miles Labor Government is focused on doing what matters for Queenslanders.
And what matters for Queenslanders the most, is cost-of-living relief.
Queenslanders deserve the right to make choices about their lives.
But in recent times, many have been robbed of those choices by the ever-present constraints of global and national cost-of-living pressures.
For many Queenslanders, the only choice has been which bill to pay next.
But our Government is relentlessly focused on doing what matters for Queenslanders.
So our Government has made the choice to reduce that cost-of-living pressure on Queensland families.
We have chosen to deliver nation-leading cost-of-living relief that will give all Queenslanders more choice.
In doing so, we have made the deliberate choice to put our Budget into deficit, to help Queensland households keep their budgets in balance.
Delivering a deficit, spending more than the government collects in revenue, is not, and should never be an easy choice.
Page 1 of 24
But in a contest between the balance sheet and doing what matters for Queenslanders, the Miles Labor Government will always be on Queenslanders’ side.
Weak governments leave people to fend for themselves.
Strong governments make the choice to intervene and invest.
Weak Governments may offer the promise of lower taxes and lower debt, but they do so by delivering less services and cutting frontline jobs.
Strong Governments recognise that people are always more important than numbers on a balance sheet.
Strong Governments recognise that putting fiscal figures over families can lead to communities being ripped apart, in a way that takes decades to repair.
The Miles Labor Government is a strong Labor Government.
And our strong Budget addresses the short-term pressures being faced by families across Queensland.
At the same time, this strong Budget also seizes the long-term opportunities that only our state has, to plan and build for Queensland’s future prosperity.
COST OF LIVING
The total value of new and existing cost-of-living concessions available to Queenslanders rises by 31 per cent in this Budget, to a total of $11.2 billion.
This cost-of-living relief starts with electricity rebates.
Together with the Albanese Labor Government, our Government will deliver electricity rebates of $1,300 to every household in this state.
Page 2 of 24
And for vulnerable Queenslanders, we will go further, delivering a total electricity rebate of $1,672.
This means that some vulnerable Queensland households, those households struggling the most with cost-of-living pressures, will be able to avoid paying anything for electricity in the 2024–25 Budget year.
In total, our landmark power rebates will provide almost $3 billion in cost-of-living relief to Queensland households and businesses.
One of the Premier’s first acts upon being sworn in last December was to freeze the cost of vehicle registration.
Today, we go further.
For 12 months, we will cut the cost of registration for all light vehicles by 20 per cent.
The total cost of this cost-of-living relief to Queenslanders will be $435 million.
That means a saving of $126 for a 6-cylinder ute, $85 for a 4-cylinder car, and $69 for an electric vehicle.
For 6 months, we will cut the cost of all Translink public transport fares across Queensland to almost nothing.
We will cut all Translink public transport fares across Queensland to a flat 50 cents, no matter where you live or how far you travel.
The total investment in this cost-of-living relief for Queenslanders will be $150 million.
And for the same period, we will halve the cost of travel on the Airtrain to and from Brisbane Airport, as we try to make the best of a dud deal that has dudded Queenslanders for decades.
Page 3 of 24
50 cent fares and half-price Airtrain travel will all take effect from 5 August this year, and our 20 per cent rego reduction will start to appear on renewal notices sent out from 5 August as well.
There is one important cost-of-living measure that does not appear in the Budget aggregates.
The people of Queensland will also pay no more when it comes to fees and charges.
For the 2024–25 financial year, the indexation for fees and charges in Queensland will be zero.
That means zero increase on the Emergency Management Levy introduced by the Newman Government, that appears on Council rates bills across Queensland.
And that means zero State Government impact on Council rates bills.
If Council rates bills rise, that is entirely a matter for those Councils.
INFLATION
As we deliver these cost-of-living relief measures, we are mindful that we do so in a way that reduces inflationary pressures.
Within the Brisbane Consumer Price Index basket used by the Australian Bureau of Statistics, roughly one-third is comprised of the Transport and Housing groups, the latter of which includes energy costs.
Queensland Treasury estimates the combined effect of cost-of-living measures from the Miles and Albanese Labor Governments will reduce Brisbane’s headline CPI growth in 2024–25 by around one and a quarter percentage points.
That is forecast to reduce Brisbane CPI growth for the year to just 2 per cent.
Page 4 of 24
HOUSING
The strong response of Queenslanders, and our Labor Government to COVID-19, meant we emerged from the pandemic in better shape than almost anywhere in the world.
But there was one unforeseeable impact of that time that continues to affect tens of thousands of Queenslanders every day.
After international migration ground to a halt when international borders were closed, it has now roared back to life, at a pace that defies economists and statisticians.
As Secretary of the Federal Treasury, Dr Stephen Kennedy, observed last week, this stunning surge in temporary migration took Federal Treasury forecasters by surprise.
For Queensland, the increase in population in 2022–23 was 60 per cent higher than forecast.
This year, population growth is rising so fast that upward revisions are being revised again, almost as soon as they are published.
Those numbers represent tens of thousands more people who need somewhere to call home.
That is why the first Budget of the Miles Labor Government includes a record investment of $2.8 billion, to get more Queenslanders into their own home.
The Budget will provide more support for renters and those unable to find a home.
And as part of the Miles Government’s Homes for Queenslanders initiative, this Budget provides for an additional 600 modular homes.
Homes for Queenslanders is our vision for delivering one million new homes by 2046.
It is a real plan backed by real investment, a total of $3.1 billion over 5 years.
This includes the delivery of 53,500 social homes by 2046.
Page 5 of 24
Homes for Queenslanders includes a downpayment of $1.3 billion to contribute to the ramp up to more than 2,000 social homes on average, every year, from 2028, to reach this target.
For Queenslanders looking to buy their first home, we have lifted the threshold for a full stamp duty concession with immediate effect.
The threshold is now $700,000, tapering to a new cap of $800,000.
While that threshold is still below the median house price in Brisbane, it provides more generous relief than the equivalent threshold in Sydney or Melbourne.
This is a thoughtful plan, a detailed plan, and a prudent plan to help young Queenslanders in particular, find a home that they can call their own.
And it is a plan that will not sacrifice the revenue that pays the wages of Queensland teachers, nurses and police officers.
From 1 July, we will bring our foreign owner transfer duty surcharge into line with Victoria and New South Wales.
And we will raise our foreign owner land tax surcharge from 2 per cent to 3 per cent, still more generous than New South Wales and Victoria.
This plan will provide $360 million in cost-of-living relief to Queenslanders, while helping 40,000 Queensland families into their first home over the next 4 years.
A fully-costed, revenue neutral plan to help first home buyers, without pushing up prices, is a policy that Queenslanders would only see from a strong Labor Government.
This Budget also includes a temporary 20 per cent increase in funding for Specialist Homelessness Services, an investment of almost $390 million.
This will allow for the expansion of the Immediate Housing Response, to individuals and couples, and more temporary supported accommodation.
Page 6 of 24
HEALTH
Queenslanders know that they can always trust Labor Governments to do what matters when it comes to their health care.
Through this Budget, the Miles Labor Government will continue to invest in the health of all Queenslanders.
A strong health system supports a healthy population.
And a healthy population means higher labour productivity and stronger economic growth.
Even in a time of rising cost-of-living pressures, the cost of providing health care continues to rise faster than other expenses.
So this Budget will once again deliver a record investment in health.
Our hospital Capacity Expansion Program now totals $11 billion over 6 years.
That program will deliver around 2,200 additional overnight beds at facilities across the Queensland health system, including:
| • | The new Bundaberg Hospital |
| • | The new Coomera Hospital |
| • | The new Toowoomba Hospital |
| • | The new Queensland Cancer Centre |
| • | The Cairns Hospital expansion |
| • | The Hervey Bay Hospital expansion |
| • | The Ipswich Hospital expansion |
| • | The Logan Hospital expansion |
| • | The Mackay Hospital expansion |
| • | The Princess Alexandra Hospital expansion |
| • | The QEII Hospital expansion |
Page 7 of 24
| • | The Redcliffe Hospital expansion |
| • | The Robina Hospital expansion |
| • | The Prince Charles Hospital expansion |
| • | And the Townsville University Hospital expansion. |
Through the $943 million Building Rural and Remote Health Program, we are building a new hospital in Moranbah, and health care centre in locations as diverse as Tara, Camooweal, Doomadgee and Childers.
This Budget also allocates $200 million to redevelop the Cooktown Multi-Purpose Health Service facility, expanding inpatient beds, and adding an operating theatre.
Within our hospitals, and from our Capital Expansion Program, $1 billion will be allocated to optimise patient flow within hospitals, to reduce wait times and improve healthcare delivery.
The 10.6 per cent increase in operating funding for Queensland Health in this Budget is well above the historical average of 6.9 per cent.
This Budget will also support culturally appropriate models of care through the Torres and Cape Health Care Commissioning Fund, known as TORCH.
This Budget will deliver free meningococcal B vaccines for eligible infants, children and adolescents.
Speaker, for all those members who say they support this budget, they should be proud of the health budget, and the important social reforms that it is progressing.
This budget will support the Women and Girls’ Health Strategy 2032, delivering 34 new initiatives to address existing health inequities and provide enhanced gender and trauma informed care.
That includes $21 million to enhance the workforce for termination of pregnancy.
Page 8 of 24
This funding shows that, for our Government, decriminalising the termination of pregnancy is more than a legal reform.
For it to be a real social reform, that delivers for all Queensland women, then it needs funding, and that’s exactly what this budget delivers.
And this Budget will provide $18 million over 4 years to support the operational delivery of the Voluntary Assisted Dying scheme, including support for the Queensland Voluntary Assisted Dying Scheme Support and Pharmacy Service.
We will also provide ongoing support for our nation-leading pill testing and ketamine trials.
These are all Labor budget initiatives, and initiatives that, by definition, Members will support when they cast their vote in favour of the appropriation.
HEALTH WORKFORCE STRATEGY
Our Government continues to invest in our health workforce, to deliver the care our community needs.
The new Health Workforce Strategy for Queensland to 2032 is backed by a $1.7 billion investment.
It will deliver more than 700 extra doctors, more than 2,600 nurses and midwives, and more than 1,000 allied health staff.
This is a huge investment in our staff and the Queenslanders they help every day.
The funding will also ensure minimum midwife to post-natal patient ratios, providing patients and families with individually-tailored, culturally-appropriate maternity care.
We are also expanding and boosting our schemes to attract the health workforce needed across Queensland.
Page 9 of 24
Interstate and international doctors who make the decision to take up a job in regional and remote Queensland continue to be eligible for payments up to $70,000.
In addition, in a landmark investment, our Government will offer $40,000 to attract and retain GP trainees across Queensland.
These investments will help attract, retain, and support a homegrown health workforce that will deliver world-class healthcare across Queensland.
QUEENSLAND AMBULANCE SERVICE
For Queenslanders unfortunate enough to experience a health emergency, their first connection is often with the dedicated paramedics of the Queensland Ambulance Service.
In the last 6 years, ambulance demand from priority code one and code two patients has risen over 22 per cent.
In the next 6 years, that demand is forecast to rise a further 19 per cent.
This first Budget of the Miles Labor Government will provide investment for an additional 268 full-time equivalent personnel in the Queensland Ambulance Service, to sustainably meet growth in demand.
We will also invest $30 million in the QAS capital program, which includes replacing ageing ambulances and delivering additional new vehicles.
Across vast expanses of our state, the best method of delivering emergency care is often not by road, but by air.
To ensure all Queenslanders get the care they need, when they need it, the 2024–25 Budget is continuing to invest in vital aeromedical ambulance services, including:
| • | LifeFlight Australia, from its bases in Bundaberg, the Sunshine Coast, Toowoomba, Mount Isa and Brisbane; |
Page 10 of 24
| • | The Capricorn Helicopter Rescue Service and Central Queensland Rescue Service, which operate from bases in Rockhampton and Mackay; and |
| • | The Royal Flying Doctor Service, which provides inter-hospital transfer services across Queensland. |
FIRST NATIONS
In 2023, this Parliament voted to establish the Path to Treaty Act, to prepare a framework for treaty negotiations with First Nations Queenslanders.
In keeping with that decision, $40 million has been allocated over 4 years for the First Nations Treaty Institute.
The Miles Labor Government is also providing $56 million over 4 years for the Truth-telling and Healing Inquiry, which commences on 1 July 2024.
The Budget also provides extra funding of $18 million over 4 years to help community members tell their stories to the Inquiry, through access to extra specialist research and archival officers, and additional resources for Community and Personal Histories.
These are Budget measures I am sure this House will support now, and across the Forward Estimates.
COMMUNITY SAFETY
Queenslanders deserve to feel safe in their home, and safe on the streets of our state.
That’s why our Government invests in frontline police and crime prevention.
We do so, not because we want to win seats in parliament, quote, “off the back of crime,” but because Queenslanders deserve to be safe, and to feel safe.
Page 11 of 24
That’s why our Community Safety Plan for Queensland, announced by the Premier earlier this year, provides an extra $1.3 billion over 5 years for community safety measures across 5 key pillars:
| • | Supporting victims; |
| • | Delivering for our frontline; |
| • | Detaining offenders; |
| • | Intervening when people offend; and |
| • | Preventing crime before it occurs. |
To help build safer communities, we are placing an increased focus on preventing domestic, family, and sexual violence.
We are placing an extra focus on the safety of women and girls and on dealing with young offenders.
The Community Safety Plan for Queensland builds on successful measures that have already helped to deliver a reduction in overall offences in the first quarter of 2024.
Our Government is determined to put more police officers on the frontline.
Like every employer, we have encountered extraordinary challenges in recruitment.
A low unemployment rate means a stronger economy, but it also means very high competition to attract employees.
Our Government will ensure that Queenslanders have the frontline police they deserve.
That’s why our Government has offered recruitment incentives of up to $40,000 for new police officers.
Our interventions have helped to turn the corner in police recruitment.
Page 12 of 24
I am advised by Queensland Police Service that the academy is full, with the largest number of recruits on record.
I am also advised that as those recruits graduate, by the end of this month, we will have achieved a net annual increase in the total number of police.
And that growth will continue as more recruits roll through, a significant achievement when unemployment is so low.
This Budget supports the recruitment of 900 additional police personnel, along with $48 million to upgrade police stations in Bundaberg and Hervey Bay.
This Budget provides additional equipment to increase community safety, including 3,000 wands for knife detection to support Jack’s Law, and 1,000 additional tasers.
To support more police boots on the ground, this Budget provides more police eyes in the sky.
To follow on from the resounding success of our Townsville-based police helicopter, Polair helicopter bases will be established in Far North Queensland, and on the Sunshine Coast and Wide Bay.
And this Budget will deliver a 20 per cent permanent uplift in funding for domestic, family and sexual violence service providers across the state.
Our Government is also investing $52 million to provide more resources and support for victims of crime, including:
| • | $16 million to expand the Victims of Crime Community Response Program; |
| • | $16 million to increase the capacity of Victims Assist Queensland to process financial assistance applications; and |
| • | $3 million to enhance the Victim Liaison Service to better connect victims and their families with prosecutors, while cases proceed through court. |
Locking up more offenders means more detention capacity is required.
Page 13 of 24
This Budget includes $628 million over 5 years for the new youth detention centre at the Woodford Correctional Precinct, and continues delivery of the $885 million Lockyer Valley Correctional Centre.
BIG BUILD
This Budget addresses the challenges Queensland families are facing today, but it also plans and delivers for our state’s future prosperity.
The record extraordinary population growth experienced by our state in the last 3 years – growth that was not predicted by anyone – means we must step up our investment.
This first Budget of the Miles Labor Government makes a deliberate choice to continue with the ambition of our Big Build, because it is our ambition for Queensland.
States like New South Wales and Victoria are putting major infrastructure projects on hold, because they lack Queensland’s balance sheet strength.
Those southern decisions to delay and cut may help their balance sheets today, but they will cause more expensive problems in the future.
With extraordinary and unforeseeable population growth, our Government will forge ahead with our Big Build, because ensuring the provision of essential infrastructure is what matters to Queenslanders.
In the 4 years to 2027–28, our Big Build will deliver $107 billion of investment in building projects across the length and breadth of our great state.
These are projects that will define Queensland’s future.
They will support our economic and energy transformation, while improving the access to essential services and utilities right across the state.
Page 14 of 24
This investment will drive generational change, creating more jobs, better communities and stronger regions.
Over the 13 years to 2027–28, our Government will have supported over $226 billion in infrastructure works.
In 2024–25, the government will invest a record $27 billion in building Queensland, directly supporting around 72,000 jobs.
This is the largest annual investment in capital works in Queensland’s history.
A record $19 billion, or almost 70 per cent of this capital program, will be invested outside of the Greater Brisbane region, supporting around 50,000 jobs.
Almost $10 billion in transport infrastructure will be delivered in 2024–25, including:
| • | $786 million towards the Queensland Train Manufacturing Program in Maryborough; |
| • | $650 million towards the construction of Stage 1 of the Coomera Connector; |
| • | $514 million to continue construction work on Cross River Rail; |
| • | $500 million towards the Logan and Gold Coast Faster Rail project; and |
| • | $308 million to continue Stage 3 of the Gold Coast Light Rail, a project our Government will not walk away from. |
And as is always the case in Labor Budgets delivered by our Labor Government, there is substantial ongoing investment to fund major upgrades to the Bruce Highway, and the M1.
CLEAN ENERGY
When it comes to renewable energy, Queensland has a global head start.
We have the sun, we have the wind, and we have the space to build industrial-scale generation.
Page 15 of 24
And most importantly of all, Queensland has the topography and rainfall to support deep storage pumped hydro.
Very significantly, we have a target of 75 per cent emissions reduction by 2035, a target that has bipartisan political support at a state level.
But in order to ensure we capitalise on our natural advantages, we must press ahead to cement our place on the global stage for renewable energy and the industries it will support.
To continue the delivery of the Queensland Energy and Jobs Plan, the 2024–25 Queensland Budget includes a landmark capital investment of $26 billion over 4 years.
And our state’s energy transformation will continue to be driven by our other great advantage, Queensland’s publicly-owned energy companies.
In 2024–25, significant clean energy investments include:
| • | $712 million for CopperString 2032, connecting Mount Isa and the North West to the national electricity grid; |
| • | $801 million by Stanwell, for the Wambo and Tarong West Wind Farms; |
| • | $500 million for CS Energy’s Lotus Creek Wind Farm; |
| • | $275 million for CleanCo’s Swanbank Battery; |
| • | $936 million to progress the Borumba Pumped Hydro Energy Storage scheme; and |
| • | $38.5 million for early works at the Pioneer Burdekin Pumped Hydro Energy Storage scheme, with a $1 billion equity commitment across the forward estimates. |
That investment in the Pioneer-Burdekin Pumped Hydro Storage scheme is fully detailed in the budget papers, fully funded – and fully supported.
PORTS AND WATER
If Queensland is to take full advantage of the opportunities our renewable energy revolution presents, we must have the capacity to send more high-end, future-economy manufactured goods to the world.
Page 16 of 24
Major seaport projects in the Big Build that will be progressed in 2024–25 include:
| • | $251 million to complete the Port of Townsville Channel Capacity Upgrade; |
| • | $360 million for the ongoing expansion of the Cairns Marine Precinct; |
| • | $116 million for the Northern Land Expansion at the Port of Gladstone; and |
| • | initial works for North Queensland Bulk Ports to progress the Bowen Wharf replacement project. |
Major water investments in 2024–25 include:
| • | $311 million for the Fitzroy to Gladstone Water Pipeline; |
| • | $26 million for the Mount Crosby Flood Resilience Program; |
| • | $56 million towards the Toowoomba to Warwick Water Pipeline; and |
| • | $303 million towards improvement programs at dams including Paradise, Burdekin Falls, Somerset and Wivenhoe. |
PUTTING QUEENSLAND KIDS FIRST
Investing in the development and education of Queensland children is a direct investment in Queensland’s future prosperity.
Clinically-informed research makes it clear that investing in the first 7 years of a child’s life is the greatest opportunity open to us to contribute to their future wellbeing and success.
In order to give Queensland kids that opportunity, the Miles Labor Government is investing more than $500 million in our Putting Queensland Kids First strategy.
This program will stretch across education, health and communities to support Queensland children from birth onwards.
Putting Queensland Kids First encompasses everything from health development checks to extended free kindy for four-year-olds, particularly in discrete Aboriginal and Torres Strait
Page 17 of 24
Islander communities, as well as supporting behavioural specialists and health practitioners in state schools.
It is the most comprehensive package of measures to help children that Queensland has ever seen.
And it is a signature policy of the Miles Labor Government.
CHILDREN AND EDUCATION
As a further cost of living measure to allow more Queensland children to enjoy a healthy lifestyle, this Budget will lift the investment in our successful FairPlay vouchers to $40 million in 2024–25.
This additional investment will increase the total number of vouchers from 50,000 to 200,000, and increase the value of each voucher to $200 to address rising costs.
50,000 FairPlay vouchers will continue to be reserved for vulnerable households in the greatest need of support.
To ensure that Queensland children are able to get everything they can out of each day at school, this budget allocates $15 million for subsidised school breakfasts and lunches.
$15 million is a small price to pay to ensure Queensland children are ready to learn each day.
Decades from now, there will be a direct benefit to the health of our economy if we focus on the health and nutrition of school kids today.
With a record investment of nearly $21 billion in education, this Budget will improve the lives of young Queenslanders and set them up for the future.
Our investment of almost $1.3 billion in school infrastructure in 2024–25 includes:
| • | $342 million for new facilities at schools experiencing the fastest enrolment growth; |
Page 18 of 24
| • | $273 million to upgrade facilities at existing schools; |
| • | $167 million for the Building Future Schools program to deliver world-class learning environments for students; |
| • | $144 million as part of the strategic land acquisition fund, to acquire land for new and expanded schools; and |
| • | $117 million to continue the rollout of our successful School Halls Program. |
This Budget will deliver the schools, teachers and student supports, that matter to Queenslanders.
Importantly, this Budget allocates $1 billion over 5 years to deliver more teachers and teacher aides to help every student realise their potential, including priority cohorts such as students with a disability.
To help recruit teachers to remote and regional Queensland where housing pressures can be greater than they are in the South East, we are investing $45 million over 3 years to subsidise teacher accommodation.
TRAINING
Just as education can set a child up for life, training can set a young Queenslander up for their career.
In the biggest skills and training reform in almost a decade, the Miles Labor Government will fund one million training places for Queenslanders.
As our economy transitions and evolves, the ability to upskill and retrain, to take advantage of emerging opportunities, has never been more important.
The Good Jobs, Great Training: Queensland Skills Strategy 2024–2028 will invest an additional $203 million over 2 years, to address skills needs and workforce priorities across every region of Queensland.
Page 19 of 24
Working with the Albanese Labor Government, we will continue to offer Free TAFE for around 200 courses, a program that has already enrolled almost 82,000 Queenslanders.
Our 50 per cent payroll tax rebate for apprentices and trainees will be extended for a further 12 months to 30 June 2025.
And first year apprentices this year in the housing industry will have access to a $1,000 rebate on their work tools, through our $4 million Free Tools for First Years program.
2032 OLYMPIC AND PARALYMPIC GAMES
The forward estimates contained within this budget bring Queensland to just over 4 years from the 2032 Olympic and Paralympic Games.
Together with the Federal Government, we are providing for a total capital expenditure of $7.1 billion for the Brisbane Games, to be delivered by the Games Venue and Legacy Delivery Authority.
In keeping with our Government’s response to the Sport Venue Review, the venues infrastructure program includes the upgrading of the Queensland State Athletics Centre, the refurbishment of the Gabba and Suncorp Stadium, and the construction of the Brisbane Arena.
Through this Budget, over $560 million is allocated to works that are now in procurement, including $42 million for the Brisbane Aquatic Centre, and $142 million for the Sunshine Coast Indoor Sports Centre.
ECONOMIC AND FISCAL UPDATE
In the face of persistent inflation and an uncertain global outlook, the fundamental strengths of the Queensland economy endure.
Queensland’s economic growth is forecast to strengthen from 2.3 per cent in 2022–23 to 3 per cent in both 2023–24 and 2024–25.
Page 20 of 24
This growth will be driven by a rebound in exports as capacity constraints unwind and increased public final demand, reflecting our Government’s deliberate decision to continue to fund public infrastructure investment.
Once again, this Budget is about choices.
And the Miles Labor Government is choosing to stay the course, and to invest in Queensland’s future growth and prosperity.
With inflation forecast to finally start easing, growth in consumption is expected to recover to around pre-pandemic averages in 2026–27.
Queensland’s economy is projected to continue to grow solidly at 21⁄2 per cent in 2025–26, sustained by continuing growth in domestic activity as household consumption regains its strength.
For the first time in Queensland’s history, Gross State Product has exceeded half a trillion dollars.
That means the Queensland economy is larger than that of Finland, of Portugal or of New Zealand.
As Australia’s growth state, Queensland has been the engine, driving employment growth across Australia.
As at April 2024, Queensland had recorded the largest employment growth of any state or territory since March 2020, a total of 366,900 people.
That employment growth is equivalent to the entire population of the Sunshine Coast.
With inflation moderating, real wage growth is expected to continue across the forward estimates, further helping Queensland families deal with cost-of-living pressures.
Page 21 of 24
Queensland’s place as the growth state of the Commonwealth has placed greater pressure on housing here than it has in any other jurisdiction.
That is the finding of Professor Hal Pawson from the University of New South Wales in his analysis done for the Queensland Council of Social Services.
Thankfully, the easing in the Commonwealth’s migration program is expected to take some pressure off housing supply in coming years.
FISCAL
After forecasting a deficit of almost $2.2 billion for the current 2023–24 financial year, the Miles Labor Government now expects to return an operating surplus of $564 million.
This surplus has been achieved through careful management of improved revenue, including royalties and taxes.
This estimated actual surplus represents Queensland’s third operating surplus in succession, but it is forecast to be the last in the current sequence.
For 2024–25, a deficit of $2.6 billion is forecast, a deficit that ensures we can help more Queensland families keep their budgets in balance.
If a deficit is the price to be paid to provide nation-leading cost-of-living relief, then that is a price we are willing to pay.
In 2024–25, growth in taxation revenue will be offset by an expected decline in royalties, and by expense measures including our record cost-of-living relief measures, and increased investments in housing, health and community safety.
The deficit is forecast to fall to $515 million in 2025–26.
A targeted $3 billion savings plan, over 4 years, to 2027–28, will be applied, to ensure returns to surplus from 2026–27.
Page 22 of 24
Despite these 2 forecasts deficits, Queensland remains well positioned compared to our peers, as the projected net debt to revenue metric for 2023–24 has fallen materially over recent budgets.
Queensland’s 2024–25 estimated net debt to revenue ratio of 31 per cent compares very favourably to our peers, given that the same ratio is 88 per cent for New South Wales and 163 per cent for Victoria.
Queensland’s credit ratings are all stable, with S&P Global and Fitch at AA+, and Moody’s at Aa1.
That stable outlook is the recognition by ratings agencies that Queensland, under the Miles Labor Government, will continue to be able to service its borrowings.
In the fiscal Olympics, as the 2032 host, Queensland holds a higher credit rating than this year’s host, France.
CONCLUSION
Speaker, this first Budget of the Miles Labor Government sets out our fully costed, fully detailed, and fully accountable plan for the next 4 years.
It delivers what Queenslanders deserve.
And Queenslanders deserve nothing less than unprecedented action on cost-of-living.
This Budget answers the questions about how our Government would proceed over the next 4 years.
As comprehensive as this Budget is, it is not the final word on what happens next to Queensland.
So let me end where I began.
Page 23 of 24
With the choice facing Queenslanders.
It is no secret that on 26 October, Queenslanders face a choice.
Queenslanders will be asked to make a choice about their future, not to express an opinion about the past.
This Budget makes clear the values and the plans that the Miles Labor Government will be putting forward, when Queenslanders are asked to make that choice.
Queenslanders deserve nothing less from anyone who seeks to lead our great state.
Page 24 of 24
Queensland Budget 2024–25 Budget Speech Budget Paper No.1
DOING WHAT MATTERS FOR QUEENSLAND QUEENSLAND BUDGET 2024-25 | |
BUDGET STRATEGY AND OUTLOOK
BUDGET PAPER NO. 2
2024-25 Queensland Budget Papers
1. Budget Speech
2. Budget Strategy and Outlook
3. Capital Statement
4. Budget Measures
Service Delivery Statements
Appropriation Bills
Budget Overview
Regional Action Plans
First Nations acknowledgement
Queensland Treasury acknowledges Aboriginal peoples and Torres Strait Islander peoples as the Traditional Owners and custodians of the land. We recognise their connection to land, sea and community, and pay our respects to Elders past, present and emerging.
© The State of Queensland (Queensland Treasury) 2024
Copyright
This publication is protected by the Copyright Act 1968
Licence
This document is licensed by the State of Queensland (Queensland Treasury) under a Creative Commons Attribution (CC BY 4.0) International licence.
In essence, you are free to copy, communicate and adapt this publication, as long as you attribute the work to the State of Queensland (Queensland Treasury).
Attribution
Content from this publication should be attributed to:
© The State of Queensland (Queensland Treasury) - 2024–25 Queensland Budget
Translating and interpreting assistance
The Queensland Government is committed to providing accessible services to Queenslanders from all cultural and linguistic backgrounds. If you have difficulty in understanding this publication, you can contact us on telephone (07) 3035 3503 and we will arrange an interpreter to effectively communicate the report to you.
Budget Strategy and Outlook
Budget Paper No. 2
ISSN 1445-4890 (Print)
ISSN 1445-4904 (Online)
Budget Strategy and Outlook 2024–25

State Budget
2024–25
Budget Strategy and Outlook
Budget Paper No. 2
Budget Strategy and Outlook 2024-25
Contents
Overview | 1 | |||||
Economic outlook | 3 | |||||
Fiscal outlook | 5 | |||||
1 | Budget priorities and economic strategy | 8 | ||||
1.1 | Our strong economy – laying a platform for growth and prosperity | 9 | ||||
1.2 | Addressing cost-of-living challenges and delivering more homes for Queenslanders | 15 | ||||
1.3 | Delivering better services and supporting stronger, safer communities | 23 | ||||
1.4 | Foundations for future success | 24 | ||||
1.5 | Delivering Queensland’s Big Build program | 26 | ||||
1.6 | Investing in skills and training | 29 | ||||
2 | Economic performance and outlook | 31 | ||||
2.1 | International conditions | 32 | ||||
2.2 | National conditions | 35 | ||||
2.3 | Key assumptions | 37 | ||||
2.4 | Queensland conditions and outlook | 37 | ||||
2.5 | Risks to the outlook | 66 | ||||
3 | Fiscal strategy and outlook | 69 | ||||
3.1 | Fiscal outlook | 70 | ||||
3.2 | Key fiscal aggregates | 77 | ||||
4 | Revenue | 92 | ||||
4.1 | 2023–24 Estimated actual | 93 | ||||
4.2 | 2024–25 Budget and outyears | 93 | ||||
Budget Strategy and Outlook 2024-25
4.3 | Revenue initiatives | 97 | ||||
4.4 | Revenue by operating statement category | 101 | ||||
5 | Expenses | 132 | ||||
5.1 | 2023–24 Estimated actual | 132 | ||||
5.2 | 2024–25 Budget and outyears | 133 | ||||
5.3 | Expenses by operating statement category | 134 | ||||
5.4 | Operating expenses by purpose | 141 | ||||
6 | Balance sheet and cash flows | 142 | ||||
6.1 | Overview | 143 | ||||
6.2 | Balance sheet | 143 | ||||
6.3 | Cash flows | 150 | ||||
7 | Intergovernmental financial relations | 151 | ||||
7.1 | Federal financial arrangements | 151 | ||||
7.2 | Australian Government funding to states and territories | 153 | ||||
7.3 | Australian Government funding to Queensland | 155 | ||||
7.4 | Payments to Queensland for specific purposes | 157 | ||||
7.5 | State-local government financial relations | 161 | ||||
8 | Public Non-financial Corporations Sector | 165 | ||||
8.1 | Context | 166 | ||||
8.2 | Finances and performance | 174 | ||||
9 | Uniform Presentation Framework | 182 | ||||
9.1 | Context | 182 | ||||
9.2 | Uniform Presentation Framework financial information | 182 | ||||
9.3 | General Government Sector time series | 192 | ||||
Budget Strategy and Outlook 2024-25
9.4 | Other General Government Sector Uniform Presentation Framework data | 194 | ||||
9.5 | Contingent liabilities | 198 | ||||
9.6 | Background and interpretation of Uniform Presentation Framework | 198 | ||||
9.7 | Sector classification | 199 | ||||
9.8 | Reporting entities | 200 | ||||
Appendix A: Concessions statement | 204 | |||||
Focus | 208 | |||||
Explanation of scope | 208 | |||||
A.1 Concessions summary | 209 | |||||
A.2 Concessions by agency | 210 | |||||
A.3 Concessions by government-owned corporation | 238 | |||||
Appendix B: Tax expenditure statement | 240 | |||||
Context | 240 | |||||
Methodology | 240 | |||||
The tax expenditure statement | 241 | |||||
Discussion of individual taxes | 244 | |||||
Appendix C: Revenue and expense assumptions and sensitivity analysis | 249 | |||||
Taxation revenue assumptions and revenue risks | 250 | |||||
Royalty assumptions and revenue risks | 251 | |||||
Parameters influencing Australian Government GST payments to Queensland | 252 | |||||
Sensitivity of expenditure estimates and expenditure risks | 252 | |||||
Appendix D: Fiscal aggregates and indicators | 254 | |||||
Budget Strategy and Outlook 2024-25
Overview
Queensland’s economic performance continues to be highlighted by stronger than national economic growth and nation-leading jobs growth, while challenged by an unprecedented increase in the population and global inflationary pressures.
The Queensland Government, through the 2024–25 Budget, is continuing to address immediate cost-of-living challenges facing Queenslanders, while also making significant additional investments to accommodate the rapid population growth and position the state for longer-term growth and prosperity.
This includes significant new and expanded cost-of-living relief for all Queensland households, and additional support for more vulnerable Queenslanders.
As population growth continues to drive demand for infrastructure and government services, the government is continuing to make substantial additional investments in essential services such as health and education, building stronger and safer communities, and strengthening the foundations that support positive life outcomes and the overall wellbeing of young Queenslanders across the state. Population growth has particularly challenged housing supply and affordability across the state, warranting a particular focus with a range of targeted initiatives and funding support.
Investments in productivity-enhancing infrastructure will continue to directly underpin Queensland’s economic growth opportunities while helping to increase overall living standards.
The government also continues to invest significantly in targeted skills and training initiatives to increase the capacity of the workforce to respond to future economic challenges.
Addressing cost-of-living challenges and delivering more homes for Queenslanders
The 2024–25 Budget cost-of-living measures are responding to the pressures confronting Queensland households arising from a unique set of circumstances.
In 2024–25, the government is providing a record $11.218 billion in concessions, an increase of 31.1 per cent compared with 2023–24.
The government is providing $3.739 billion in new and expanded measures in 2024–25 to support Queenslanders in tackling cost-of-living challenges.
Through the Cheaper Power (Supplementary Appropriation) Bill 2024, the government resolved to provide $2.267 billion in urgent cost-of-living relief through electricity rebates.
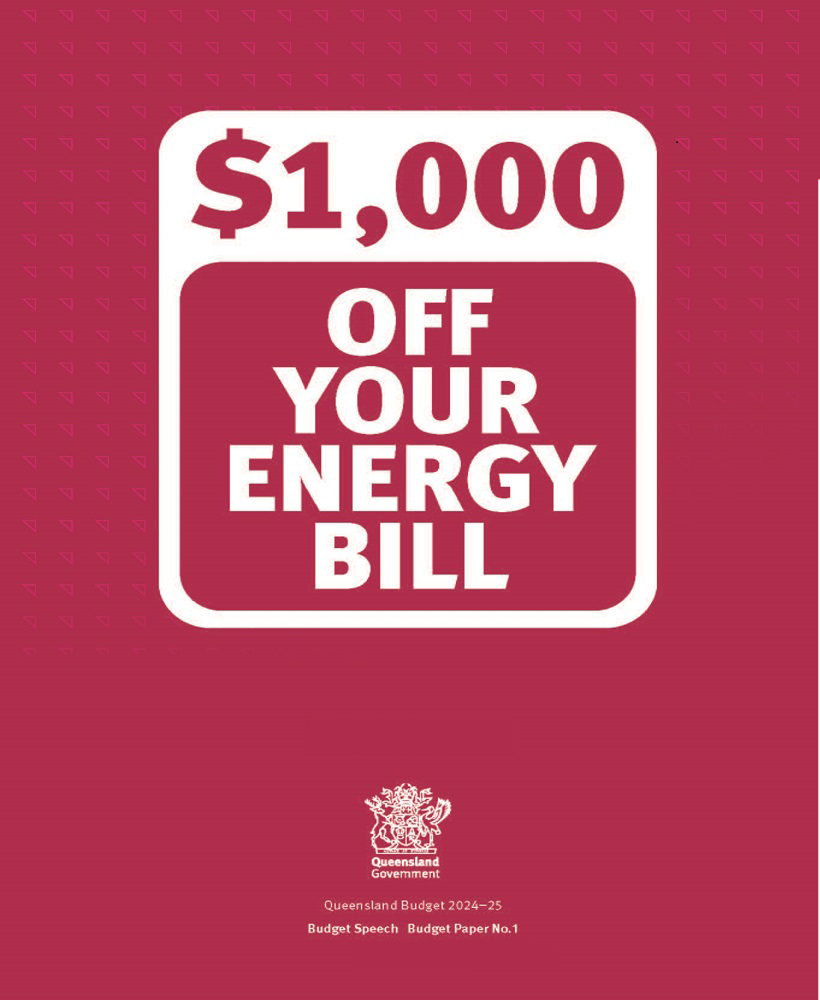
The $1,300 Cost of Living Rebate will be automatically credited to electricity bills for all Queensland households in 2024–25, consisting of an upfront $1,000 Cost of Living Rebate from the Queensland Government and a $300 rebate paid in quarterly instalments from the Australian Government.
Around 205,000 eligible Queensland small businesses will also continue to receive $650 off their electricity bills in 2024–25, co-funded by the Queensland and Australian Governments.
These temporary elevated levels of assistance are helping households meet these immediate pressures. The cost-of-living pressures will ease as inflation falls, real wages continue to grow,
1
Budget Strategy and Outlook 2024-25
significant Australian Government income tax cuts are delivered from 1 July 2024, and interest rates in time begin to fall.
To address ongoing pressures in the state’s housing system, the government is implementing its housing plan, Homes for Queenslanders, backed by an investment of over $3 billion. This represents a significant uplift on top of the already major investment in social and affordable housing, with total investment by the government in social housing and infrastructure increasing to $1.125 billion in 2024–25.
Delivering better services and supporting stronger, safer communities
Unprecedented population growth is driving extraordinary demand for core government services. The 2024–25 Queensland Budget aims to support these services through substantial investments and additional funding in key areas such as health and community safety.
This includes a record Queensland Health total operating budget of $26.710 billion in 2024–25, as well as additional funding of $247.9 million over 5 years to improve women’s health outcomes and experience of the healthcare system under the $1 billion Queensland Women and Girls’ Health Strategy 2032.
The government’s evidence-based Community Safety Plan for Queensland commits an extra $1.28 billion over 5 years for community safety measures across 5 key pillars: supporting victims; delivering for our frontline; detaining offenders; intervening when people offend; and preventing crime before it occurs.
Foundations for future success
The Budget is investing in young Queenslanders and the state’s future workforce through significant investments in education and training, and prevention and early support initiatives.
This includes total funding of $22.801 billion for education and training in 2024–25, and the $502 million Putting Queensland Kids First package to support children from their earliest years of life. This funding will ensure every Queensland child and family has the best possible opportunities for a great life.
By supporting the education, development and growth of young Queenslanders, the government’s investments will help drive sustained economic participation, productivity and income growth, and increased standards of living over time.
Delivering Queensland’s Big Build program
The record increase in the population and driving diversification of the Queensland economy requires continued investments in critical social and economic infrastructure.
The government’s flagship Big Build Program is meeting the demand of the larger population, while supporting the state’s ongoing economic and energy transformation.
The government is investing $107.3 billion over the 4 years to 2027–28 in new and ongoing health, transport, education, housing and energy transformation projects. The Big Build is improving the sustainability and liveability of Queensland’s communities and regions.
The Big Build, which includes $27.1 billion in 2024–25, is helping to drive the growth of Queensland’s traditional and emerging industries and create more jobs across the state. $18.568 billion or 68.5 per cent of the capital program is being invested outside the Greater
2
Budget Strategy and Outlook 2024-25
Brisbane region. The capital program is supporting around 72,000 direct jobs in 2024–25, with 50,000, or 69 per cent, of these jobs located outside of the Greater Brisbane region.
Delivery of productivity-enhancing economic and social infrastructure will help lower price pressures over the long term by reducing the cost of doing business and improving connectivity and labour mobility. In addition, the government’s Queensland Energy and Jobs Plan charts an infrastructure investment pathway to 2035 that will deliver clean, reliable, and affordable energy.
Economic strategy – laying the platform for growth and prosperity
By investing in the key enablers of growth, as outlined in the government’s overarching economic strategy, the Budget maintains the government’s focus on growing a more sustainable and diversified economy that is resilient, productive, competitive and able to respond to future opportunities and challenges.
The government’s investments in these key enablers of growth continue to support the ongoing transformation of the Queensland economy, as well as attracting new private sector investment opportunities across an increasingly diversified and decarbonised industrial base.
Economic outlook
Queensland’s economic growth is forecast to strengthen from 2.3 per cent in 2022–23 to 3 per cent in both 2023–24 and 2024–25, driven by a substantial rebound in exports, in part due to an unwinding of capacity constraints, and continued strong growth in public infrastructure spending.
Household budgets continue to be constrained by higher mortgage rates and other cost-of-living pressures, which have resulted in slower consumption growth in 2023–24. However, growth in consumption is expected to recover to around pre-pandemic averages in 2025–26.
Queensland’s economy is projected to continue to grow solidly at 21⁄2 per cent in 2025–26, sustained by continuing growth in domestic activity as household consumption strengthens.
3
Budget Strategy and Outlook 2024-25
Overview Table 1 Queensland economic forecasts/projections1
| Actuals | Forecasts | Projections | ||||||||||||||||||||||
| 2022–23 | 2023–24 | 2024–25 | 2025–26 | 2026–27 | 2027–28 | |||||||||||||||||||
Gross state product2 | 2.3 | 3 | 3 | 21⁄2 | 21⁄4 | 21⁄4 | ||||||||||||||||||
Employment | 3.7 | 23⁄4 | 11⁄2 | 1 | 11⁄4 | 11⁄2 | ||||||||||||||||||
Unemployment rate3 | 3.7 | 41⁄4 | 41⁄2 | 43⁄4 | 43⁄4 | 43⁄4 | ||||||||||||||||||
Inflation4 | 7.3 | 4 | 2 | 31⁄4 | 21⁄2 | 21⁄2 | ||||||||||||||||||
Wage Price Index | 3.6 | 43⁄4 | 33⁄4 | 31⁄2 | 31⁄4 | 3 | ||||||||||||||||||
Population | 2.4 | 21⁄2 | 11⁄2 | 11⁄2 | 11⁄4 | 11⁄4 | ||||||||||||||||||
Notes:
| 1. | Unless otherwise stated, all figures are annual percentage changes. |
| 2. | Chain volume measure (CVM), 2021–22 reference year. |
| 3. | Per cent, year-average. |
| 4. | Brisbane, per cent, year-average. |
Sources: ABS Annual State Accounts, National, State and Territory Population, Labour Force, Wage Price Index, Consumer Price Index and Queensland Treasury.
Queensland continues to enjoy exceptionally strong labour market conditions. As of April 2024, Queensland had recorded the largest employment growth of any state or territory since March 2020 at 366,900 persons.
The state’s unemployment rate averaged 3.7 per cent in 2022–23, its lowest year-average unemployment rate since ABS monthly data began in 1978. As tightness in the labour market continues to unwind gradually, the unemployment rate is expected to edge slightly higher over the forward estimates period but remain low by historical standards.
Following strong wages growth in 2023–24, Queensland’s Wage Price Index is expected to continue to grow solidly, with ongoing real wage growth expected across the remaining years of the forecast period.
Inflationary pressures eased significantly during 2023. This has largely been due to a marked slowing in goods inflation, whereas services inflation has been more persistent.
Importantly, the Queensland Government’s substantial cost-of-living relief measures, when combined with the Australian Government measures, are estimated to cumulatively reduce Brisbane’s headline Consumer Price Index growth in 2024–25 by around 11⁄4 percentage points, reducing CPI growth to 2 per cent.
Population growth, after reaching unexpected highs in 2022–23 and 2023–24, is expected to moderate in line with a significant easing in the Australian Government’s overseas migration program. However, there remain backlogs in housing and infrastructure to catch up with this population increase.
Global geopolitical tensions remain a key risk to the economic outlook. This includes the ongoing war in Ukraine as well as the ongoing risk of an escalation in the conflict in the Middle East, which could impact on oil prices as well as threaten global trade routes.
4
Budget Strategy and Outlook 2024-25
Global supply chain disruptions have generally eased, but labour supply shortages remain a problem, especially in the construction industry, where the rate of company failures remains relatively elevated compared with other industries. Combined with the ongoing shortages of skilled labour, this poses risks in terms of the capacity of the construction industry to meet the expected demand for housing, business and public sector investment.
Fiscal outlook
Fiscal capacity is being deployed to support Queenslanders with additional spending measures responding to immediate, but temporary challenges. Investment is focussed on delivering cost-of-living relief, along with services and infrastructure to clear demand backlogs in the short term, with longer term investment in long-lived transformational recurrent and capital spending programs.
Since the 2023–24 Budget the net operating position for 2023–24 has improved from a $2.182 billion deficit to a surplus of $564 million. This is being delivered though careful management of revenue improvements, some of which has been prioritised to fund $2.267 billion of electricity bill support as part of a record $3.739 billion cost-of-living package for Queenslanders.
This surplus represents the third consecutive operating surplus and follows a record surplus of $13.9 billion in 2022–23.
In 2024–25, a deficit of $2.631 billion is forecast, compared to a surplus of $135 million in the 2023–24 Budget. This change reflects a very significant response from government to prioritise the provision of elevated cost-of-living support when the community most needs it, as well as boosting health, housing and community safety measures in response to unprecedented and stronger than expected population growth.
Revenue growth is forecast to remain relatively flat in 2025–26 as coal prices continue to unwind, before returning to solid growth in 2026–27 and 2027–28, driven by growth in taxation revenue and GST.
From 2025–26 as temporary relief measures are wound back, Queensland’s net operating position is expected to improve. Compared to 2024–25 the deficit improves to a forecast $515 million in 2025–26. Surpluses of $0.9 billion and $2 billion are then forecast for 2026–27 and 2027–28 as revenue growth returns and expenses are managed within available resources.
The recovery in the net operating balance profile is also underpinned by a commitment to savings of $3 billion over 4 years to 2027–28, which represents a renewal of the government’s successful 2020 Savings and Debt Plan.
The capital program continues to respond to population growth and priority areas and strategically position Queensland to maintain a strong and diverse economy into the future and meet the needs of a growing population. This includes a large component of transformative infrastructure investment such as boosting health system capacity, decarbonisation of the state’s energy system, preparing for the Brisbane 2032 Olympic and Paralympic Games, Homes for Queenslanders, and major transport infrastructure investment such as Direct Sunshine Coast Rail.
5
Budget Strategy and Outlook 2024-25
The total capital program is now projected to be $107.3 billion over the four years to 2027–28 compared to the projected $96.2 billion over the four years to 2026–27 at the 2023–24 Budget Update. However, the annual capital program is expected to peak in 2025–26 at $29.4 billion before moderating to $23.7 billion by 2027–28, representing a 19 per cent reduction over that period.
The moderation reflects several factors including the clearing of an infrastructure backlog that arose from unprecedented population growth. There is also a greater degree of flexibility with medium term capital scheduling given the spending profile of significant programs such as the hospital capital expansion program, the completion of large projects such as Cross River Rail and the decline in capital works being funded under the disaster recovery arrangements as projects are completed.
The total expenditure on Olympics venues over the forward estimates makes up just 3 per cent of the Big Build.
The increase in the four-year capital program means the government’s debt profile has shifted up since the 2023–24 Budget Update. General Government borrowings are now expected to reach around $103.2 billion in 2026–27, which is $6.5 billion higher than in the 2023–24 Budget Update. However, as the peak in capital spending in 2025–26 passes there is a clear moderation in the general government debt burden trajectory. This leaves Queensland well positioned relative to its peers.
6
Budget Strategy and Outlook 2024-25
| Overview Table 2 | Key fiscal aggregates1 |
| 2022–23 | 2023–24 | 2023–24 | 2024–25 | 2025–26 | 2026–27 | 2027–28 | ||||||||||||||||||||||
| Outcome | Budget | Est. Act. | Budget | Projection | Projection | Projection | ||||||||||||||||||||||
| $ million | $ million | $ million | $ million | $ million | $ million | $ million | ||||||||||||||||||||||
Revenue | 89,810 | 82,079 | 89,059 | 88,107 | 88,717 | 90,670 | 95,332 | |||||||||||||||||||||
Expenses | 75,880 | 84,261 | 88,495 | 90,738 | 89,232 | 89,783 | 93,305 | |||||||||||||||||||||
Net operating balance | 13,930 | (2,182 | ) | 564 | (2,631 | ) | (515 | ) | 887 | 2,027 | ||||||||||||||||||
PNFA2 | 9,899 | 9,347 | 11,061 | 12,831 | 14,485 | 14,577 | 12,763 | |||||||||||||||||||||
Fiscal balance | 8,092 | (6,716 | ) | (5,717 | ) | (10,790 | ) | (9,547 | ) | (7,341 | ) | (4,054 | ) | |||||||||||||||
Borrowings3 | 53,726 | 65,479 | 61,958 | 77,118 | 91,507 | 103,221 | 111,383 | |||||||||||||||||||||
Net debt | 2,615 | 16,190 | 12,223 | 27,407 | 40,552 | 52,076 | 59,831 | |||||||||||||||||||||
Notes:
| 1. | Numbers may not add due to rounding. |
| 2. | PNFA: Purchases of non-financial assets. |
| 3. | Comprised of borrowing with QTC, leases and similar arrangements and securities and derivatives line items in the Balance Sheet. |
7
Budget Strategy and Outlook 2024-25
| 1 | Budget priorities and economic strategy |
Features
| • | Queensland’s strong overall economic performance continues to be highlighted by stronger than national economic growth and nation-leading jobs growth. |
| • | However, household budgets have come under significant pressure from escalating costs, especially for essentials such as housing and food. Queenslanders are also looking to the government to further enhance health services and improve community safety. |
| • | A record and stronger than expected post-COVID-19 population increase has ramped up demand for housing and infrastructure, and government services such as health. |
| • | A strong economy, positioned for the future, will provide the capacity to afford the improved services the community requires. |
| • | The 2024–25 Queensland Budget is providing a record $11.218 billion in concessions in 2024–25, an increase of 31.1 per cent compared with 2023–24. The Budget is delivering substantial cost-of-living relief, including a $1,300 electricity bill rebate in 2024–25 for all Queensland households. This is part of the government’s commitment to $3.739 billion in new and expanded cost-of-living measures in 2024–25 to support Queenslanders in tackling cost-of-living challenges. |
| • | To address record demand for new housing from unprecedented levels of population growth, the government is implementing its housing plan, Homes for Queenslanders, backed by an investment of over $3 billion, which represents a significant uplift on top of the already major investment in social and affordable housing. Total investment by the government for social and affordable housing infrastructure is $1.125 billion in 2024–25. |
| • | The Budget further highlights the government’s strong commitment to support healthy, strong and safe communities, including record health funding of $26.710 billion in 2024–25, as well as over $1 billion in initiatives over the next 5 years for the Queensland Women and Girls’ Health Strategy 2032 to improve women’s health outcomes and experience of the healthcare system. |
| • | The government’s evidence-based Community Safety Plan for Queensland commits an extra $1.28 billion over 5 years for community safety measures across 5 key pillars: supporting victims; delivering for our frontline; detaining offenders; intervening when people offend; and preventing crime before it occurs. |
| • | The Budget is investing in young Queenslanders and the state’s future workforce though significant investments in education and training, and prevention and early support initiatives. This includes total funding of $22.801 billion in 2024–25 for education and training, and the $502 million Putting Queensland Kids First early support package to support children from their earliest years of life and direct resources, services and supports to give every Queensland child and family the best possible opportunities for a great life. |
| • | The 2024–25 Budget also maintains the government’s focus on investing in the key enablers of economic growth, as identified in its overarching economic strategy, to support |
8
Budget Strategy and Outlook 2024-25
the state’s ongoing transformation to a more sustainable, diversified and low carbon economy that is resilient, productive, competitive and able to respond to future opportunities and challenges. |
| • | The ongoing delivery of the government’s Big Build capital program, with investment of $107.3 billion over the 4 years to 2027–28, will continue to support Queensland’s energy and economic transformation, enhance productivity and competitiveness, and improve the sustainability and liveability of communities across the state. |
| • | In 2024–25, the government will invest $27.1 billion in capital, directly supporting around 72,000 jobs. Of this capital program, $18.568 billion will be invested outside of the Greater Brisbane region, supporting around 50,000 jobs. |
| • | The government also continues to invest in targeted skills and training initiatives to support a flexible and productive workforce both now and in the future. This includes funding of more than $1.5 billion in 2024–25, as well as the ongoing implementation of key actions under the Good people. Good Jobs: Queensland Workforce Strategy 2022–2032. |
| 1.1 | Our strong economy – laying a platform for growth and prosperity |
Against a backdrop of risks in terms of global economic conditions, Queensland’s strong economic performance since the COVID-19 pandemic is continuing to drive growth and employment opportunities across the state.
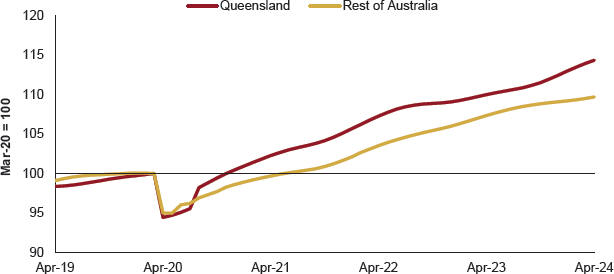
Chart 1.1 – Employment growth, Queensland and Rest of Australia1
Note:
| 1. | Trend, monthly, index. |
Source: ABS Labour Force.
9
Budget Strategy and Outlook 2024-25
This is reflected in Queensland’s exceptionally strong labour market performance, which has resulted in employment growth in Queensland as of April 2024 of 14.3 per cent (or 366,900 persons) since March 2020, well above the growth in the rest of Australia (9.7 per cent) and the strongest of any state or territory over this period.
Queensland has also experienced historically low unemployment rates across the state, including in many areas of regional Queensland.
The state’s overall unemployment rate averaged 3.7 per cent in 2022–23, the lowest year-average unemployment rate since ABS monthly records began in 1978.
Queensland’s traditional export industries, including mining, agriculture and tourism, continue to be important contributors to the state’s economy and its regions.
The agriculture, forestry and fishing industry has performed strongly in recent years, with real output growing by an average of 17.0 per cent per annum over the past 3 years. In nominal terms, the industry contributed $12.9 billion to Queensland’s economy in 2022–23, while in the year ended March quarter 2024, there were 68,000 people employed in the industry, 14.4 per cent higher than the corresponding previous year.
Nominal agriculture exports rose by 7.3 per cent to $14.8 billion in 2023, driven by increased beef and sorghum exports. This follows strong growth in the previous year, where the value of agriculture exports rose by 26.5 per cent, driven by higher prices and favourable weather conditions which aided increased exports of cotton and crops.
The state’s tourism sector has also rebounded strongly from the impacts of the COVID-19 pandemic and related border closures. The latest data from Tourism Research Australia show direct tourism gross value added in Queensland was worth $14.2 billion in 2022–23, a 62 per cent increase on 2021–22 and 13 per cent above the pre-COVID-19 level in 2018–19.
The Queensland resources sector is supporting strong labour market outcomes and driving ongoing economic growth, as it remains buoyed by elevated global commodity prices.
The elevated commodity prices seen in recent years, particularly for coal, have provided Queensland’s resources industry with a substantial boost in revenues and profitability. ABS data show that across the period from July 2021 to March 2024, Queensland’s coal industry benefitted from an additional $88 billion in export revenues compared with the same period just three years earlier (i.e. July 2018 to March 2021).
Queensland’s new progressive royalty tiers, announced in the 2022–23 Queensland Budget, are ensuring that Queenslanders are receiving a fair share of this windfall, reflecting an appropriate return on their valuable and non-renewable resources.
Coal prices are expected to continue to decline over the next 18 months. The premium hard coking coal spot price fell sharply in March 2024, from US$314 per tonne at the end of February to US$243 per tonne at the end of April. This reflected a decline in steel demand in China and India and improving supply conditions. Looking forward, as supply conditions continue to normalise, the hard coking coal spot price is expected to continue to moderate towards medium-term fundamentals.
10
Budget Strategy and Outlook 2024-25
Accordingly, the revenue raised from the new tiers — which only take effect during periods of high prices — will decline over time. However, their continuing operation will ensure Queenslanders share appropriately in the prosperity from any unforeseen spikes in coal prices into the future.
The 2024–25 Queensland Budget continues the government’s commitment to reinvest the additional revenue received from the high global prices for the state’s resources directly back into Queensland communities.
More specifically, the increased fiscal capacity provided by the new progressive royalty tiers has enabled the government to continue to address the immediate cost-of-living challenges facing Queenslanders and invest in the necessary foundations for long-term economic growth and prosperity, such as the Queensland Energy and Jobs Plan (QEJP).
In particular, this year’s Budget includes a commitment to $3.739 billion in new and expanded measures in 2024–25 to support Queenslanders in tackling cost-of-living challenges. This includes a $1,300 Cost of Living Rebate on electricity bills for all Queensland households in 2024–25, consisting of a $1,000 Cost of Living Rebate from the Queensland Government and a $300 rebate from the Australian Government.
The 2024–25 Budget cost-of-living measures are responding to the pressures confronting Queensland households arising from a unique set of circumstances. These pressures will ease as inflation falls, real wages continue to grow, significant Australian Government income tax cuts are delivered from 1 July 2024, and interest rates in time begin to fall. Further details on the government’s cost-of-living measures are included in Box 1.1.
The government has also committed to substantial additional investments to enhance delivery of essential services such as health and education and to build stronger, safer communities across the state. This includes implementation of government policies such as the Queensland Women and Girls’ Health Strategy 2032, the Community Safety Plan for Queensland, the Putting Queensland Kids First early support package, and the Free Kindy program.
This substantial support and investment will help ensure all Queenslanders can participate in, and benefit from, Queensland’s growing economy and enjoy enhanced quality of life delivered through increased economic and employment opportunities.
Through the ongoing implementation of the government’s economic strategy, the Budget maintains the government’s focus on growing a more sustainable and diversified economy that is resilient, productive, competitive and able to readily respond to future opportunities and challenges, including the ongoing decarbonisation of the global economy.
As well as underpinning Queensland’s recent economic success, the government’s investments in key enablers of growth continue to support the broader transformation of the Queensland economy. These investments are positioning the state as a highly dynamic and competitive investment location and attracting new private sector investment opportunities across an increasingly diversified and decarbonised industrial base.
Of note, this includes the ongoing implementation of industry and workforce strategies, including the QEJP, Queensland Resources Industry Development Plan, Queensland Critical Minerals Strategy, Queensland Trade and Investment Strategy 2022–2032, and the Queensland New-Industry Development Strategy.
11
Budget Strategy and Outlook 2024-25
The government also continues to invest in innovation and skills development to support ongoing growth, including through the Advance Queensland – Innovation for a Future Economy 2022–2032 Roadmap, Our Thriving Digital Future: Queensland’s Digital Economy Strategy, and the Good people. Good jobs: Queensland Workforce Strategy 2022–2032.
In line with the government’s focus on fostering innovation and skills, the Queensland and Australian Governments are investing approximately $465 million each to partner with PsiQuantum and make a major breakthrough in Australia’s quantum computing capabilities.
On the back of this investment, PsiQuantum will build the world’s first commercial-scale fault tolerant quantum computer, establish its Asia-Pacific headquarters and regional hub in Brisbane, and provide opportunities for advanced manufacturing, advanced technology supply chains and higher education to the Australian quantum ecosystem. With applications across health and pharmaceuticals, chemicals, energy, security, and food production, quantum computing will tackle some of the most urgent challenges faced by society.
The investment of $89.7 million over 5 years to develop and deliver the Quantum and Advanced Technologies Strategy, released in October 2023, and the Queensland Quantum Academy, has the potential to leverage billions of dollars in direct investment by the company and will create up to 400 new highly skilled ongoing jobs.
By delivering these ongoing and new initiatives, the government is facilitating the development of emerging industries that are anticipated to play an increasingly important role in the state’s economy, while also supporting traditional industries such as mining, agriculture and tourism, which will still continue to drive significant levels of economic activity and growth into the future.
Underpinning the ongoing transformation of the Queensland economy to a clean future are the Clean Economy Jobs Act 2024 and Energy (Renewable Transformation and Jobs) Act 2024 which enshrines the changes to Queensland’s energy grid into law.
The state’s legislated emissions reduction targets of 30 per cent below 2005 levels by 2030, 75 per cent below by 2035 and net zero by 2050 work in tandem with legislated renewable energy targets, 50 per cent renewable energy by 2030, 70 per cent by 2032 and 80 per cent by 2035. Together they drive direct action on climate change, support job creation and give local and international investors the confidence to invest in Queensland.
Queensland’s economy is more emissions-intensive than the rest of Australia due to its economic structure. Despite this, Queensland is successfully managing the decarbonisation of its key sectors and reducing emissions.
The latest 2022 Australian Government emission data show Queensland’s annual emissions have fallen by 67.8 million tonnes of carbon dioxide equivalent since 2005, more than any other state or territory. This translates to a 35 per cent reduction on 2005 levels and means that Queensland has not just met its 2030 emissions reduction target of 30 per cent 8 years early but has also overachieved by an additional 5 percentage points.
Between 2005 and 2022, while delivering the biggest reduction in emissions of any jurisdiction, Queensland’s economy grew by 63 per cent and employment grew by almost 42 per cent.
Consistent with the government’s economic strategy, the Clean Economy Jobs Act 2024 sets out a pathway to decarbonisation that will support jobs in the state’s traditional industries, while
12
Budget Strategy and Outlook 2024-25
simultaneously unlocking investment in new industries including renewables manufacturing, critical minerals, hydrogen and sustainable aviation fuel.
The Energy (Renewable Transformation and Jobs) Act 2024 targets that underpin the QEJP are already driving investment in green industries across the state and will enhance Queensland’s competitiveness by delivering clean, reliable and affordable power. This significant transformation will support new investment, jobs and growth for generations.
Overall, the 2024–25 Queensland Budget is balancing both immediate and longer-term priorities. It is providing significant levels of additional but targeted temporary support to help ease the cost of living and address unprecedented growth in the population, while continuing to implement the necessary policies to drive the state’s transition towards a more competitive and diversified low-carbon economy.
Consistent with the government’s overarching objectives for the community, the 2024–25 Budget priorities and longer-term economic strategy are: directly supporting good, secure jobs across traditional and emerging industries; delivering even better services right across Queensland; and protecting and enhancing Queensland’s great lifestyle as it grows.
13
Budget Strategy and Outlook 2024-25
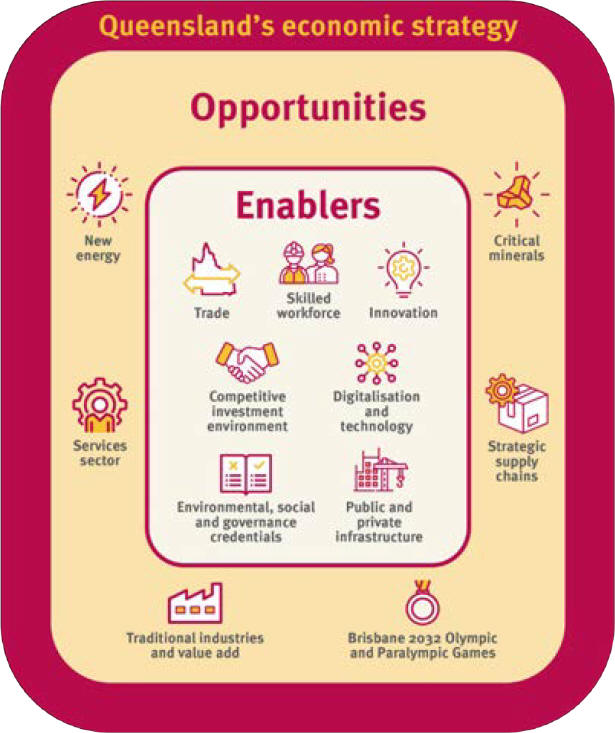
14
Budget Strategy and Outlook 2024-25
| 1.2 | Addressing cost-of-living challenges and delivering more homes for Queenslanders |
Despite the strength of the Queensland economy and labour market, the state’s households and businesses are continuing to deal with challenges associated with ongoing national and global cost-of-living pressures, and a record and unexpected increase in the population.
Between March 2021 and March 2024, consumer prices in Brisbane rose by 17.8 per cent. Housing, transport and food accounted for 10.5 percentage points of this increase while also comprising almost half of the consumption basket of an average Brisbane household.
Cost-of-living pressures are being felt across a wide range of Queensland households, including low-income households, renters and working households with a mortgage.
Higher interest rates continue to impact mortgagees, while tight rental market conditions are affecting affordability for households who rent.
The government remains committed to addressing these challenges by providing a record level of concessions to Queensland households and small businesses in 2024–25, including significant new and expanded cost-of-living relief for all Queensland households.
| Box 1.1 | Record cost-of-living relief for Queenslanders |
The Queensland Government recognises the challenges that global and national cost-of-living pressures are causing for Queenslanders.
While the rate of inflation has started to moderate, elevated price levels for a range of goods and services are still putting pressure on household budgets across the country.
In 2024–25, the government is providing a record $11.218 billion in concessions to Queensland families and businesses, an increase of 31.1 per cent compared with 2023–24.
The government is providing $3.739 billion in new and expanded measures in 2024–25 to support Queenslanders in tackling cost-of-living challenges.
This comprises electricity bill rebates, lower public transport fares and motor vehicle registration costs, additional support for first home buyers, an increase in the value of and access to FairPlay vouchers, school and community food relief program, and food, emergency, and financial relief measures for vulnerable cohorts.
Electricity rebates
The 2024–25 Budget delivers $2.965 billion for additional electricity bill support to households and small businesses.
This is the most significant electricity bill support package announced by any state or territory.
15
Budget Strategy and Outlook 2024-25
As part of this package, all Queensland households will automatically receive $1,300 off their electricity bills in 2024–25. This consists of an upfront $1,000 Cost of Living Rebate from the Queensland Government and a $300 rebate paid in quarterly instalments from the Australian Government.
Vulnerable households will continue to receive the $372 Queensland Electricity Rebate, bringing total support for this cohort to $1,672 in 2024–25.
Around 205,000 eligible Queensland small businesses will also receive $650 off electricity bills in 2024–25, co-funded by the Queensland and Australian Governments.
Reducing transport costs through 50 cent public transport fares and a 20 per cent reduction in motor vehicle registration costs
Transport costs are a key component of household budgets, making up around 12 per cent of an average household’s consumption expenditure.
To help address these costs, in the 2023–24 Budget Update the Queensland Government announced a freeze in the registration fee and traffic improvement fee (TIF) components of motor vehicle registration costs in 2024–25 and froze public transport fare increases in 2024.
In the 2024–25 Budget, the government is providing further substantial relief to Queenslanders through cost-of-living measures that reduce transport costs.
| • | $150 million in 2024–25 from lowering public transport fares to a flat fare of 50 cents per trip across the state from 5 August 2024 for 6 months. In addition to this initiative, the government is also providing half-price tickets on Airtrain services. |
| • | $435 million from a 20 per cent reduction in motor vehicle registration costs for all light vehicles for a 12-month period, which is scheduled to start appearing on renewal notices sent to customers from 5 August 2024. It is estimated that $399 million of benefit from this measure will be realised in the 2024–25 financial year, and the remaining $36 million in 2025–26. |
The Queensland Government understands that keeping a vehicle on the road is a major household cost. The reduction will apply to the registration fee and the TIF for all light vehicles, regardless of purpose of use and will include motorcycles and trailers.
The reduction will benefit owners of around 5.7 million vehicles across the state.
16
Budget Strategy and Outlook 2024-25
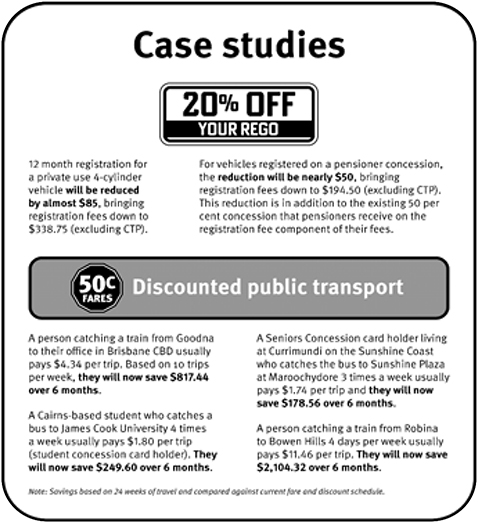
Expanded FairPlay vouchers for Queensland families and children
Under Activate! Queensland 2019–2029, the Queensland Government delivers direct financial support via FairPlay vouchers to help Queensland children and young people aged 5 to 17 years to participate in sport and active recreation activities.
The FairPlay voucher provides relief to vulnerable households facing cost-of-living pressures and helps young Queenslanders to pursue a healthy lifestyle. This will deliver tangible economic and social dividends over many years to come.
Building on the success of these vouchers, the government has committed a further $33.5 million in 2024–25, bringing the total funding to $40 million in 2024–25. This will increase the maximum value of the FairPlay voucher from $150 to $200 and increase the number of vouchers available from 50,000 to up to 200,000.
17
Budget Strategy and Outlook 2024-25
Importantly, 50,000 vouchers will be guaranteed to the current target eligible cohort, with an additional 150,000 vouchers to be made available to all households.
Other cost-of-living support
The Budget also includes a range of other measures that will reduce costs and help provide essential support, including the supply of food, emergency relief and financial resilience services, for disadvantaged Queenslanders facing cost-of-living pressures.
| • | $15 million in 2024–25 for the School and Community Food Relief Program. This initiative will assist children to access food relief from appropriate sources, ranging from subsidised lunches, breakfasts or tuckshop items. School food programs provide essential support to families as cost-of-living increases impact their ability to provide for their children. |
| • | An additional $3.3 million over two years from 2024–25 for food relief services delivered by OzHarvest and SecondBite. This significant additional investment recognises the vital role these organisations play in the food relief sector across Queensland. |
| • | $2.9 million over 4 years for Foodbank Queensland will allow increased warehousing space in Brisbane, as well as supporting increased food storage and supply through the establishment of a distribution point in North Queensland. |
| • | An additional $1.7 million in 2024–25 for Emergency Relief funding to allow for the continuation of increased provision of Emergency Relief in communities across Queensland, including through an additional 92 Neighbourhood Centres and into discrete First Nations communities. |
| • | A doubling of the funding to Queensland Meals on Wheels (QMoW), the peak body for Meals on Wheels services in Queensland, with the Queensland Government committing $1.2 million over 4 years to extend and increase QMoW’s funding to $300,000 per annum. This funding will also now be ongoing to enable greater support, guidance and coordination to be provided to the network of Meals on Wheels services across Queensland. |
| • | An additional $1.1 million in 2024–25 for the Queensland Financial Resilience Program, which will see this critical program continue through until 30 June 2025, delivering vital support to people experiencing financial hardship to improve their capacity to manage their personal finances. |
Additional support for first home buyers
The government will be providing substantial additional support to a wider range of Queenslanders purchasing their first home by increasing eligibility thresholds for 2 key transfer duty concessions:
| • | First home concession — eligibility will be extended to homes with a dutiable value up to $800,000, up from $550,000 currently |
| • | First home vacant land concession — eligibility will be extended to vacant land with a dutiable value up to $500,000, up from $400,000 currently. |
18
Budget Strategy and Outlook 2024-25
These changes will increase the maximum value of the first home concession by $8,600 (to a total of $17,350) and the maximum value of the first home vacant land concession by $3,500 (to a total of $10,675).
It is estimated these measures will deliver additional tax relief to Queensland first home buyers of $90 million in 2024–25 and $360 million over the 4 years to 2027–28, with around 10,000 first home buyers across the state benefitting from the increased concessions each year.
An increase in the rate of additional foreign acquirer duty and land tax surcharge for foreign companies, trustees of foreign trusts, and absentees, will offset the cost of extending the first home buyer concessions.
Details of the funding being provided in the 2024–25 Queensland Budget for the new and expanded cost-of-living measures are outlined below in Table 1.1.
Table 1.1 – Additional cost-of-living relief provided to Queenslanders in 2024–25
Measure | Description | ($ million) | ||
| Electricity bill support1 | Cost of Living rebates for Queensland households and small businesses | 2,965 | ||
| Lower vehicle registration costs2 | A 20 per cent reduction in registration costs for all light vehicles | 399 | ||
| Rego freeze announced in 2023–24 Budget Update | 66.7 | |||
| Discounted public transport3 | Reduction in all public transport fares to a flat fare of 50 cents per trip for a 6-month period | 150 | ||
| Freeze in public transport fares announced in 2023–24 Budget Update | 14.6 | |||
| Additional support for first home buyers | Increase in eligibility thresholds for first home concession and first home vacant land concession | 90 | ||
| FairPlay vouchers | Additional funding to increase the value of FairPlay vouchers and the number of vouchers available (excluding SwimStart) for a 12-month period | 33.5 | ||
| School and Community Food Relief Program | Supporting food programs in schools and the community in 2024–25 | 15 | ||
| Emergency relief providers | Continuation of funding arrangements for emergency relief providers to 30 June 2025 | 1.7 | ||
| Queensland Financial Resilience Program | To ensure continuation of this important program to 30 June 2025 | 1.1 | ||
| OzHarvest and SecondBite | Helping with the continuation of critical food recovery and distribution services across Queensland | 1.1 | ||
| Foodbank Queensland | To assist with warehousing and other operating costs | 0.8 |
19
Budget Strategy and Outlook 2024-25
| Queensland Meals on Wheels | Enabling greater support, guidance and coordination to be provided to the network of Meals on Wheels services across Queensland | 0.3 | ||
Total* | $3,739 | |||
*Total is subjected to rounding.
Notes:
| 1. | The $2.965 billion benefit to households and small business in 2024–25 includes: $2.267 billion contribution from the Queensland Government for the $1,000 Cost of Living Rebate to all households ($2.2 billion) and $325 rebate for small businesses ($67 million); and $698.1 million from the Australian Government for an additional $300 electricity rebate to all households and $325 rebate for small business. Vulnerable households will continue to receive the existing $372 Queensland Electricity Rebate, which is estimated to cost an additional $248.5 million in 2024–25. |
| 2. | The motor vehicle registration fee reduction applies to most types of motor vehicles, excluding nationally-regulated heavy vehicles, plate fees, miscellaneous fees, and other vehicle types (for example boats). The estimated benefits to these vehicle owners in 2024–25 includes: $399 million from a 20 per cent reduction in registration fees (with another $36 million in 2025–26); and $281.8 million over 4 years (including $66.7 million in 2024–25) due to a freeze in the registration fee and TIF components of motor vehicle registration costs announced in the 2023–24 Budget Update to be effective in 2024–25. |
| 3. | Benefits to public transport users in 2024–25 include: $150 million in revenue foregone due to a flat 50 cent fare for 6 months commencing from 5 August 2024; and $14.6 million in revenue foregone due to a freeze in public transport fares in 2024 announced in the 2023–24 Budget Update. |
A range of other existing government concessions have also been increased or expanded to help further address cost-of-living pressures for Queenslanders. Refer to Appendix A Concessions Statement for further details on the Queensland Government’s record $11.218 billion in concessions being provided in 2024–25.
The 2024–25 Budget is responding to the cost-of-living pressures confronting Queensland households arising from a unique set of circumstances.
These pressures will ease as inflation falls, real wages continue to grow, significant Australian Government income tax cuts are delivered from 1 July 2024, and interest rates in time begin to fall. Accordingly, these elevated levels of assistance are helping households meet these immediate pressures and are not ongoing.
The government is also prioritising housing supply and affordability across the state, including through the range of initiatives outlined in Homes for Queenslanders, aimed at ensuring that every Queenslander has a safe, secure and affordable place to call home.
As well as improving standards of living for individuals and families, access to affordable housing can support enhanced employment outcomes including greater labour mobility, while also helping to attract a skilled workforce and new investment opportunities.
20
Budget Strategy and Outlook 2024-25
| Box 1.2 | A fair and sustainable housing system for current and future generations of Queenslanders |
Queensland’s housing system, like many others in Australia and around the world, continues to face significant pressure.
Record low interest rates, substantial government stimulus and a decrease in the average household size during the pandemic, followed by a strong rebound in population growth — particularly migration from interstate and overseas — has driven a surge in demand for housing in Queensland in recent years.
Supply of housing has not kept pace with increasing demand, with ongoing constraints on construction activity stemming from pandemic-related material and labour shortages, poor weather and flooding, and construction company insolvencies. This ongoing shortage of housing supply relative to demand has driven strong dwelling and rent price growth, and low vacancy rates across the state.
These market issues reflect fundamental supply constraints, particularly in skilled labour and construction capacity, rather than a shortage of investor appetite or land.
In response to these challenges, the Queensland Government is implementing the Homes for Queenslanders (HFQ) plan. Backed by an investment of over $3 billion, it sets out a target of delivering one million new homes by 2046, including 53,500 new social homes.
HFQ is a whole-of-system housing plan designed to help enhance housing supply, address homelessness and improve planning and development outcomes. This includes a substantial uplift in funding for social housing capital delivery, homelessness responses and the release of a Disability Housing Action Plan to support the most vulnerable people in Queensland. The government has also announced a temporary doubling of the Queensland First Home Owner Grant from $15,000 to $30,000, effective until 30 June 2025, to support Queenslanders who wish to purchase their own new home.
The government has strengthened renters’ rights through the introduction of the Residential Tenancies and Rooming Accommodation and Other Legislation Amendment Act 2024, which includes applying the annual rent increase frequency limit to a rental property rather than tenancy, to give a fairer go to Queenslanders who rent.
All of these policies represent a significant uplift on top of the already major investment into social and affordable housing that the government has previously announced. The 2024–25 Queensland Budget provides funding of $1.125 billion for social and affordable housing infrastructure across Queensland.
In the 2024–25 Budget, the government is providing further substantial support to address housing affordability challenges, in particular for first home buyers.
21
Budget Strategy and Outlook 2024-25
To help a wider range of Queenslanders purchase their first home, the government is increasing eligibility thresholds for two key transfer duty concessions — the first home concession and the first home vacant land concession.
| • | First home concession — Eligibility will be extended to properties valued up to $800,000 up from $550,000 currently. The changes mean that a first home buyer will pay no duty on homes valued up to $700,000 (up from $500,000 currently) and will receive a partial concession for properties valued between $700,000 and $800,000. |
| • | First home vacant land concession — Eligibility will be extended to land valued up to $500,000, up from $400,000 currently. The changes mean that a first home buyer will pay no duty on land on which they build their home valued up to $350,000 (up from $250,000 currently) and will receive a partial concession for land valued between $350,000 and $500,000. |
These changes represent a substantial increase in the support available to Queensland’s first home buyers and could save a first home buyer as much as $17,350 if purchasing a home or $10,675 if purchasing vacant land on which to build their home. In total, the changes are estimated to help around 10,000 Queenslanders per year get into their first home sooner. Further information on this important measure is provided in Box 4.2 in Chapter 4.
The transfer duty revenue foregone due to these revenue reforms will be offset by increases in surcharges applying to foreign buyers and owners of property in Queensland.
Further to this, substantial investment is being made to unlock land supply. The government has already invested more than $359 million since 2015 in infrastructure to support Queensland’s growing areas through the Catalyst Infrastructure Fund, and the Building Acceleration and Growth Acceleration Funds. This has unlocked more than 25,000 new lots across South East Queensland.
Additionally, the government is progressing a range of key changes to planning regulation to help facilitate increased housing supply, including updating targets in regional plans, while also using priority development areas to deliver additional and affordable housing.
The Housing Availability and Affordability (Planning and other Amendment) Act 2024 further aims to reduce barriers to supply, enabling the Planning Minister to acquire land for essential infrastructure required to increase affordable housing supply. The Bill also introduces a new state facilitated and streamlined application process for affordable housing development that is an identified priority for the state, subject to meeting statutory criteria.
Queensland is also working with the Australian Government to support housing supply, including through the Social Housing Accelerator Payment, the Housing Australia Future Fund and being the first state to introduce referral legislation to Parliament to support the Australian Government’s Help to Buy shared equity program.
On 31 May 2024, Queensland signed a new 5-year National Agreement on Social Housing and Homelessness commencing 1 July 2024. The agreement will provide funding to contribute to the effective operation of Australia’s social housing and homelessness services and help those people who are at risk or are experiencing homelessness.
22
Budget Strategy and Outlook 2024-25
| 1.3 | Delivering better services and supporting stronger, safer communities |
The Queensland Government’s significant ongoing investment in the delivery of essential services aims to address unprecedented demand from unexpected levels of population growth, while underpinning improved social and economic outcomes across the state over both the short and long term.
The 2024–25 Budget supports the government’s commitment to meet growing demand, including through substantial investments and additional funding in key areas such as health, education and community safety.
The range of commitments outlined in the Budget to enhance delivery of these critical services will directly support improved living standards, facilitate greater participation in the economy, strengthen the resilience and liveability of communities across the state, and ultimately enhance the prosperity and wellbeing of all Queenslanders both now and into the future.
| 1.3.1 | Investing in essential health services |
The state’s world-class health system is continuing to support a healthy, active and productive Queensland, despite significant challenges to its capacity from unprecedented levels of population growth and an ageing and increasingly diverse population base.
Improving health outcomes through the provision of reliable and accessible quality health services delivers significant social and economic benefits for individuals and the community. It facilitates enhanced economic outcomes through improvements in workforce participation and productivity. As Queensland’s strong economic recovery from the COVID-19 pandemic demonstrated, the state’s economic performance is directly linked with the health and wellbeing of Queenslanders. The Budget includes a record Queensland Health total operating budget of $26.710 billion in 2024–25, including a $4.393 billion uplift to health funding across the forward estimates to meet demand and cost pressures in the health and hospital sector.
Reflecting the importance of health to economic, social and cultural participation, the government is also providing an additional $247.9 million over 5 years to address gender-based health inequity, rectifying disinvestment and underinvestment in women and girls’ health.
With this new funding, and combined with funding for existing services, the Queensland Government will spend more than $1 billion over the next 5 years to target and provide activities and services that focus on women’s health and wellbeing through the Queensland Women and Girls’ Health Strategy 2032 and Investment Plan.
The Strategy seeks to improve women’s access to and experience of the healthcare system. Initiatives aim to address existing health inequities, provide enhanced gender and trauma informed care, and empower women to overcome obstacles hindering their health potential.
23
Budget Strategy and Outlook 2024-25
| 1.3.2 | Keeping communities safe |
The government is focused on keeping Queensland communities safe and is prioritising targeted actions to prevent crime, support victims and reduce the economic and social costs associated with crime. This includes strengthening laws, deploying extra frontline workers, and taking a harder stance to prevent crime and hold offenders to account.
To address community safety concerns, the government has announced the Community Safety Plan for Queensland, which includes an extra $1.28 billion over 5 years for community safety measures across 5 key pillars: supporting victims; delivering for our frontline; detaining offenders; intervening when people offend; and preventing crime before it occurs.
The government will deliver on these pillars though the introduction of new legislative reforms and major investment in programs and systems that will help build safer communities.
Placing an increased focus on domestic, family and sexual violence, and safety for women and young offenders, the plan takes a whole-of-government approach that brings together education, health, sport, housing, community services, domestic violence and child protection services. The plan directly builds on the government’s existing investment of $446.4 million over 5 years, announced in last year’s Budget, to reduce youth crime and break the cycle of offending by young people.
In addition to the Community Safety Plan for Queensland, the government is investing in initiatives to meet the demand pressures facing the state’s correctional facilities, with $726 million over 5 years from 2023–24 ($78.726 million ongoing) for increased prisoner population costs, critical infrastructure upgrades and short-term to medium-term prison capacity relief.
Further, the government is investing $73.1 million over 5 years from 2023–24 ($20.1 million ongoing) to meet demand pressures, including additional decision maker resources and critical mediation services in minor civil disputes for the Queensland Civil and Administration Tribunal. The government is continuing to increase funding and alleviate pressure on state funded domestic, family and sexual violence service providers, with an additional $118.4 million over 4 years from 2024–25 ($38.4 million ongoing) to meet increased demand on these services, taking total funding for the 20 per cent uplift to $154.4 million over 4 years.
| 1.4 | Foundations for future success |
The Queensland Government is committed to strengthening the critical foundations that support the wellbeing and positive life outcomes of young Queenslanders.
The government is achieving this through the delivery of high-quality universal services across a range of areas including health, education, and family services, as well as through additional support for vulnerable Queenslanders.
Investments in early childhood development and education significantly drive improved economic and social outcomes for individuals, families and society by providing the necessary tools for individuals to succeed.
24
Budget Strategy and Outlook 2024-25
By supporting the education, development and growth of young Queenslanders, the government’s investments will help drive sustained economic participation, productivity and income growth, and increased standards of living over time.
| 1.4.1 | Providing a strong start through quality education |
Education is a cornerstone of economic growth and integral to ensuring every Queenslander can fulfill their potential. A quality education improves opportunities for future learning, employment and higher wages and supports a more productive workforce.
The government is continuing to invest in inclusive and high-quality education and training to support the learning and development of young Queenslanders and equip them with the skills and knowledge to successfully participate in the economy of the future. In 2024–25, this includes total funding of $22.801 billion for education and training.
Commencing in January 2024, the government’s $645.4 million investment in Free Kindy for 4-year-olds is providing Queensland children with a strong start to their education. As well as strengthening the foundations for children’s learning, development and wellbeing, this initiative is alleviating cost-of-living pressures for Queensland families and supporting labour market participation.
As part of this year’s Budget, other key initiatives to drive enhanced education outcomes for Queenslanders include $500 million for critical capacity growth projects to meet enrolment needs, including upgrades to ensure the availability of safe and accessible school facilities for all students and teachers.
The 2024–25 Budget is also investing over $1 billion in additional funding over 5 years from 2023–24 to support delivery of a high-performing state education system.
This funding will deliver more teachers and teacher aides to support delivery of the government’s education strategy for state schools – Equity and Excellence: realising the potential of every student. Funding will also help to improve outcomes for priority cohorts, including delivering reasonable adjustments for students with a disability.
| 1.4.2 | Investing in prevention and early support |
Investing in children and young people can transform life trajectories with lifelong and multigenerational health, social and economic benefits.
Targeted and effective investments in prevention and early supports can mitigate detrimental impacts of adversity and vulnerability experienced by children and young people.
Enhancing health and wellbeing outcomes and improving educational attainment and employment outcomes reduces the risks of contact with the child protection and criminal justice systems.
The 2024–25 Queensland Budget is building on existing investments in prevention and early support services to better address the complex challenges facing some Queenslanders and achieve better outcomes for vulnerable children, young people and families.
25
Budget Strategy and Outlook 2024-25
In particular, the government’s $502 million Putting Queensland Kids First early support package will support children from their earliest years of life and directs resources, services and supports to give every Queensland child and family the best possible opportunities for a great life.
These investments complement existing Queensland Government initiatives, including the $288.2 million package to support educational engagement for a range of students, including by expanding the successful Queensland Pathways State College and FlexiSpaces in schools for students unable to be in the classroom.
| 1.5 | Delivering Queensland’s Big Build program |
Unprecedented levels of population growth require significant investments in critical social and economic infrastructure across the state.
Through its flagship Big Build Program, the government is delivering on its commitment to provide the necessary infrastructure for a growing Queensland. Building on the announcement made in last year’s Budget, this $107.3 billion investment being delivered over the 4 years to 2027–28 is directly supporting the state’s ongoing economic and energy transformation, while also simultaneously improving the overall sustainability and liveability of Queensland communities and regions.
The Big Build, which includes $27.1 billion in 2024–25 — the state’s largest single year infrastructure investment on record — is supporting the growth of Queensland’s traditional and emerging industries and creating more jobs. The capital program is supporting around 72,000 direct jobs in 2024–25, with 50,000 of these jobs located outside of the Greater Brisbane region.
Importantly, many more additional employment opportunities will be supported by supply chain activity and broader connectivity generated through these infrastructure investments, particularly throughout the state’s regional economies, which are at the forefront of Queensland’s ongoing economic transformation and diversification.
Infrastructure initiatives being delivered through the QEJP will ensure that clean, reliable and affordable power can be accessed by future generations of Queenslanders, while simultaneously driving the economy’s overall level of resilience and competitiveness over the longer term.
The 2024–25 Budget includes a landmark capital investment of around $26 billion over the 4 years to 2027–28 to deliver on the QEJP. The government’s publicly-owned energy businesses are leading Queensland’s energy transformation by investing in new wind, solar, storage and transmission.
Government entities are progressing an investment pipeline of renewables, batteries, gas, pumped hydro energy storage and the transmission SuperGrid, including CopperString 2032 connecting the North West Minerals Province to the electricity grid.
To effectively facilitate the continued provision of world-class health facilities and services for all Queenslanders, the government has committed to a health capital program of $2.167 billion in 2024–25.
26
Budget Strategy and Outlook 2024-25
Additional funding for key capital projects in the 2024–25 Budget includes $200 million over 7 years from 2024–25 for the construction of the Cooktown Multipurpose Health Service facility and $60 million over 2 years from 2024–25 to commence delivery of the Cairns Health and Innovation Centre Stage 1.
Further, the government will invest over $1.274 billion in 2024–25 to ensure that facilities in Queensland’s state schools are world class and continue to meet demand and support contemporary learning requirements. Investment in new schools is being facilitated through the Building Future Schools Program.
As part of keeping Queenslanders connected through strong transport networks that support communities and industries across the state, the government is investing $9.494 billion in 2024–25 to deliver transport infrastructure that is integrated, efficient and safe.
This includes $786 million towards the Queensland Train Manufacturing Program, $650 million towards construction on Coomera Connector (Stage 1), $513.6 million to continue construction work on Cross River Rail, $500 million towards the Logan and Gold Coast Faster Rail project and $308.2 million to continue Gold Coast Light Rail (Stage 3). There is also substantial ongoing investment to fund major upgrades to the Bruce Highway and the M1 Pacific Motorway.
The government is also looking ahead to identify solutions to address road congestion in Brisbane’s north driven by population growth, investing an additional $318 million on pre-construction works for a new Gympie Road Bypass Tunnel between Kedron and Carseldine, and $17 million on a detailed business case to improve active and public transport outcomes along this corridor.
Through state-owned water businesses, the government is delivering increased water security, fortifying the flood resilience of water infrastructure and ensuring the ongoing safety and reliability of dams. Major investments in 2024–25 include $311.1 million for the Fitzroy to Gladstone Pipeline, $26.1 million for the Mount Crosby Flood Resilience Program, $56 million to deliver the Toowoomba to Warwick Pipeline, and $303.4 million towards the dam improvement programs of Sunwater, Seqwater and the Gladstone Area Water Board.
| Box 1.3 | Delivering a low carbon economy |
The Queensland Government is powering ahead with reducing emissions across the economy and supporting new investment, jobs, and growth.
Building on the momentum of the last Budget, the 2024–25 Budget includes a landmark capital investment of around $26 billion over the 4 years to 2027–28 to support the Queensland Energy and Jobs Plan. This includes new publicly-owned investments across wind, solar, storage and transmission.
In addition, the Queensland Government has established a suite of investment programs to partner with industry on significant projects. The $520 million Low Emissions Investment Partnerships program will fast-track emissions reductions from the state’s highest emitting facilities, with an initial focus on the metallurgical coal sector.
27
Budget Strategy and Outlook 2024-25
The government is also stimulating investment across the renewable energy supply chain through a range of measures including the $170 million Critical Minerals and Battery Technology Fund and $570 million Battery Industry Strategy. Leveraging our natural and competitive advantages, this funding will drive innovation, build supply chains, and attract new investment to Queensland.
Underpinning our state’s ongoing transition to a low carbon economy are the Clean Economy Jobs Act 2024 and Energy (Renewable Transformation and Jobs) Act 2024. The targets contained in this legislation work in tandem to ensure direct action on climate change, encourage renewable energy investment, maintain public ownership of energy assets, and provide further certainty for industry, investors and the community. These targets are outlined below.
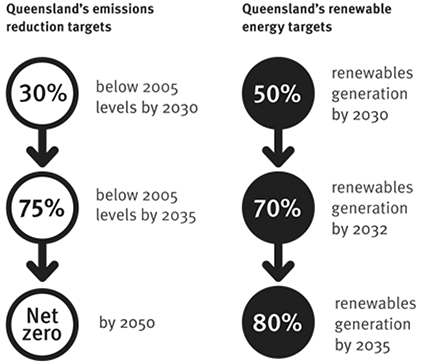
Queensland is achieving strong progress towards these targets while fostering new investment, creating jobs and delivering clean, reliable and affordable power.
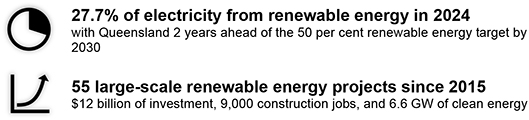
28
Budget Strategy and Outlook 2024-25
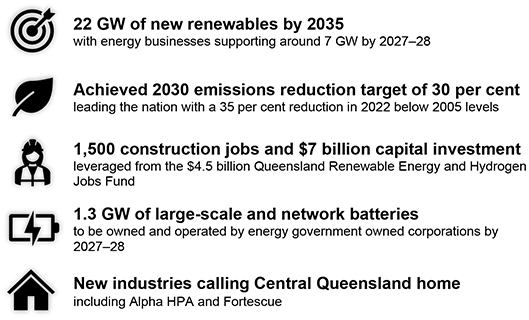
| 1.6 | Investing in skills and training |
A resilient, dynamic and skilled workforce is critical to ensure Queensland can respond to unprecedented levels of population growth, as well as the economic opportunities of the future.
The current labour market in Queensland remains very strong, characterised by strong jobs growth, low unemployment, an elevated job vacancy rate and skill shortages.
The job vacancy rate, a key indicator of labour demand, is the number of vacancies as a proportion of the total labour force. The job vacancy rate in Queensland remained elevated in March quarter 2024, at 2.3 per cent, down from its record high of 3.0 per cent in September quarter 2022 but well above the pre-COVID-19 rate of 1.4 per cent.
Queensland’s labour market is forecast to remain strong in the coming years, with the unemployment rate expected to remain low by historical standards.
The Queensland Government, through the Good people. Good Jobs: Queensland Workforce Strategy 2022–2032, recognises that investments in skills and training initiatives can help directly alleviate the current capacity and supply constraints within the state’s labour market, while also supporting longer-term growth in labour productivity and incomes.
Actions under this Strategy will drive enhanced labour market outcomes well into the future. For example, Queensland’s Clean Energy Workforce Roadmap, released in October 2023, sets out a $30 million roadmap to create a skilled, job-ready workforce to deliver Queensland’s clean energy transformation.
29
Budget Strategy and Outlook 2024-25
Further, the government’s recently released Good Jobs, Great Training: Queensland Skills Strategy 2024–2028 will ensure the state’s training system is skilling workers across the state to meet the requirements of industry now and into the future.
Across 5 focus areas and 5 years, the Strategy sets out to maximise productivity and participation, unlocking billions in annual skills investment. The Strategy is backed by a $370 million investment in training and skills.
The Strategy also extends the government’s Free TAFE program, which has seen more than 88,000 commencements in Queensland in around 200 courses. The Australian and Queensland governments have provided a further 30,000 Free TAFE places in 2024 through to 2026. This will offer cost-of-living support while giving more Queenslanders the opportunity to skill-up for future jobs in areas where the economy needs them most. This partnership builds on the government’s workforce strategy that aims to position it as a world-class economy out to 2032.
Further, the government’s Trade to Teach program offers paid teaching internships and a guaranteed permanent teaching position to support qualified and experienced tradies to transition to a teaching career. The program attracts experienced tradespeople to classrooms to share their industry experience and inspire students to take up a trade.
The government’s significant ongoing investments in skills and training initiatives — including more than $1.5 billion in 2024–25 — is helping to future-proof the state’s workforce.
Together, this will help accelerate the Queensland economy’s trajectory towards being more resilient, competitive and diversified, thereby supporting ongoing improvements in the standard of living for all Queenslanders.
30
Budget Strategy and Outlook 2024-25
| 2 | Economic performance and outlook |
Features
| • | Following growth of 2.3 per cent in 2022–23, Queensland’s overall economic growth is forecast to strengthen to 3 per cent in both 2023–24 and 2024–25, supported by recent and ongoing population growth. |
| • | The international economy has been resilient in the face of higher interest rates, elevated inflation and increased geo-political conflicts. However, it remains subject to ongoing uncertainty and potential risks. |
| • | The International Monetary Fund (IMF) has upgraded its global growth outlook for 2024 to 3.2 per cent, driven by an upward revision to the growth outlook in the United States. |
| • | National economic growth has slowed since the post-COVID-19 rebound in 2021, primarily reflecting weaker national household consumption growth. Australia’s economic growth is expected to continue to slow in the near term, with the Reserve Bank of Australia (RBA) forecasting growth of 1.3 per cent in 2024, slowing from the 2.0 per cent recorded in 2023. |
| • | In Queensland, household budgets continue to be constrained by recent substantial increases in mortgage rates and other cost-of-living pressures, which have resulted in slower consumption growth in 2023–24. However, growth in household consumption is expected to recover to around pre-COVID-19 averages in 2025–26. |
| • | In the dwelling sector, higher construction costs and ongoing capacity constraints have limited overall residential construction activity, particularly renovation activity. However, the large amount of work in the pipeline is supporting new and used dwelling investment, which is continuing to add to the housing stock. |
| • | Growth in business investment is expected to be modest over the next 2 years as interest rates, elevated construction costs and softening commodity prices impact investment intentions. |
| • | Reflecting the subdued household spending and dwelling investment, Queensland’s state final demand growth is expected to ease to 21⁄2 per cent in 2023–24, before strengthening to 31⁄4 per cent in 2024–25 and then grow by a further 23⁄4 per cent in 2025–26 in line with the recovery in household consumption. |
| • | Queensland’s overseas trade sector is forecast to be a substantial contributor to overall GSP growth in 2023–24, after detracting from real economic growth for 4 consecutive years. This improved trade performance is due to increased export volumes of coal, LNG, metals, and beef, as well as the continued recovery of services exports. |
| • | Queensland continues to enjoy exceptionally strong labour market conditions, building on employment of 5.1 per cent in 2021–22, the strongest in 17 years, and the further strong jobs growth of 3.7 per cent recorded in 2022–23. |
| • | With ongoing solid demand for labour, employment growth is expected to be 23⁄4 per cent in 2023–24 before moderating to 11⁄2 per cent in 2024–25 and 1 per cent in 2025–26. |
31
Budget Strategy and Outlook 2024-25
| • | The state’s unemployment rate averaged 3.7 per cent in 2022–23, its lowest year-average unemployment rate since ABS monthly data began in 1978. |
| • | The unemployment rate is expected to increase slightly to average 41⁄4 per cent in 2023–24 and then gradually move towards a rate more consistent with stable inflation, reaching 41⁄2 per cent in 2024–25 and then 43⁄4 per cent in 2025–26 and 2026–27. |
| • | Inflationary pressures eased significantly during 2023, with the annual rate of inflation in Brisbane moderating from a 30-year high of 7.9 per cent in September quarter 2022 to 3.4 per cent in March quarter 2024. This has largely been due to a marked slowing in goods inflation, whereas services inflation has been more persistent. |
| • | In year-average terms, inflation in Brisbane is forecast to ease from 7.3 per cent in 2022–23 to 4 per cent in 2023–24. Services inflation is expected to moderate going forward, while the Queensland Government’s cost-of-living measures, supported by the Australian Government’s additional electricity and rent support, is expected to detract around 11⁄4 percentage points from CPI growth next year. This results in forecast annual CPI growth falling to 2 per cent in 2024–25. |
| • | Queensland’s population growth is expected to strengthen to 21⁄2 per cent in 2023–24, reflecting the elevated levels of net overseas migration, before easing to 11⁄2 per cent in both 2024–25 and 2025–26. |
| 2.1 | International conditions |
The international economy has proven resilient in the face of higher interest rates, elevated inflation and increased geo-political conflicts. However, it remains subject to ongoing uncertainty and potential risks.
The International Monetary Fund’s (IMF) April 2024 forecasts expect global GDP growth in 2024 to be 3.2 per cent, an upward revision of 0.3 percentage point from their October 2023 forecasts.
The revision was primarily driven by a 1.2 percentage points upgrade to the growth outlook in the United States (US), reflecting the continued resilience of the US labour market and consumer spending in the face of higher interest rates.
Global growth is then expected to remain at 3.2 per cent in both 2025 and 2026. This is below the 20-year pre-COVID-19 average growth of 3.8 per cent.
The slightly more positive outlook for the global economy has also extended to the growth outlook amongst Queensland’s major trading partners (MTP), with the IMF upgrading its growth forecast for Queensland’s MTPs in 2024 by 0.2 percentage point to 3.5 per cent.
32
Budget Strategy and Outlook 2024-25
| Table 2.1: | Economic growth forecasts, April 2024 IMF World Economic Outlook Update |
| IMF | Consensus6 | |||||||||||||||||||||||||||
| Annual % change | %-pt revision5 | Annual % change | ||||||||||||||||||||||||||
| 2023 | 2024 | 2025 | 2024 | 2025 | 2024 | 2025 | ||||||||||||||||||||||
Queensland MTP | 3.7 | 3.5 | 3.4 | 0.2 | 0.0 | 3.5 | 3.5 | |||||||||||||||||||||
China1 | 5.2 | 4.6 | 4.1 | 0.4 | 0.0 | 4.9 | 4.4 | |||||||||||||||||||||
Japan | 1.9 | 0.9 | 1.0 | -0.1 | 0.3 | 0.5 | 1.2 | |||||||||||||||||||||
India2 | 7.8 | 6.8 | 6.5 | 0.5 | 0.2 | 6.8 | 6.6 | |||||||||||||||||||||
South Korea | 1.4 | 2.3 | 2.3 | 0.1 | 0.0 | 2.5 | 2.2 | |||||||||||||||||||||
Other Asia3 | 3.2 | 4.0 | 4.2 | 0.0 | -0.1 | 4.1 | 4.3 | |||||||||||||||||||||
Europe4 | 0.5 | 0.7 | 1.4 | -0.4 | -0.3 | 0.8 | 1.4 | |||||||||||||||||||||
United Kingdom | 0.1 | 0.5 | 1.5 | -0.1 | -0.5 | 0.5 | 1.1 | |||||||||||||||||||||
United States | 2.5 | 2.7 | 1.9 | 1.2 | 0.1 | 2.4 | 1.7 | |||||||||||||||||||||
Euro area | 0.4 | 0.8 | 1.5 | -0.4 | -0.3 | 0.6 | 1.4 | |||||||||||||||||||||
Global | 3.2 | 3.2 | 3.2 | 0.3 | 0.0 | n.a | n.a | |||||||||||||||||||||
Note:
| 1. | Following a staff visit to the country, the International Monetary Fund (IMF) has subsequently upgraded its outlook for China’s GDP growth. The IMF now expects China’s economy to grow 5.0 per cent in 2024 and 4.5 per cent in 2025, both upwardly revised by 0.4 percentage point compared with its April World Economic Outlook forecasts. |
| 2. | Forecasts for India are based on India’s fiscal year (starting April 1). |
| 3. | Weighted by Queensland’s MTP weights. Includes New Zealand. |
| 4. | Weighted by Queensland’s MTP weights. |
| 5. | Revision from October 2023 WEO, rounded to one decimal place. |
| 6. | May 2024 Consensus Economics release. |
Sources: International Monetary Fund, Consensus Economics and Queensland Treasury.
Global inflation fell faster than expected over 2023, primarily driven by falling goods inflation as global supply chain constraints that emerged during the COVID-19 pandemic gradually unwound.
With inflation across most major economies approaching central bank targets, official interest rates appear to have generally peaked, and discussion has shifted to a focus on when (and by how much) rates will need to be eased to successfully navigate a soft economic landing.
However, upside inflation risks have emerged in recent months, which threaten to delay the timing of interest rate cuts in some economies. In particular, services inflation and various measures of core inflation have generally remained sticky, indicating there are still some challenges to overcome to return inflation to central bank targets.
33
Budget Strategy and Outlook 2024-25
The challenge faced by central banks in guiding inflation back to target is most apparent in the US, where the interest rate outlook has changed significantly in recent months. At the start of 2024, the Federal Reserve was expected to begin cutting interest rates as early as March, with financial markets pricing in as many as 6 to 7 interest rate cuts over the course of 2024.
However, a series of recent US data confirming sticky services inflation and the continued resilience of the country’s labour market and consumer spending has seen these expectations pared back considerably. Financial market expectations are now for 2 interest rate cuts in the US in 2024, with the first cut expected to be pushed back to the September meeting of the Federal Reserve.
| Chart 2.1 | Key central bank interest rates |
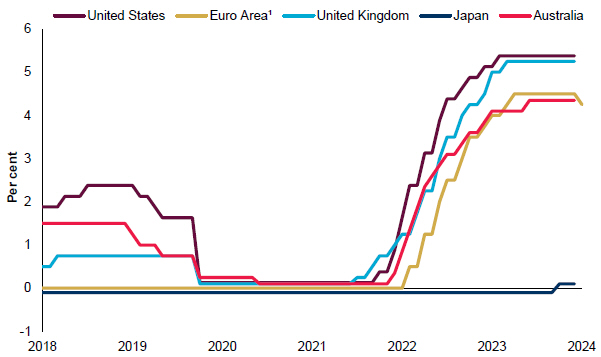
Note:
| 1. | Main refinancing operations. |
Sources: US Federal Reserve (US Fed), European Central Bank (ECB), Bank of England (BOE), Bank of Japan (BOJ) and Reserve Bank of Australia (RBA).
Various other uncertainties and downside risks remain for the global economy. There have been growing fears of renewed supply shocks, primarily driven by the Houthi militant group’s attacks on cargo ships travelling through the Red Sea — which accounts for 30 per cent of global container trade flows — and recent drought conditions at the Panama Canal causing reductions in transit through the canal from November 2023 to March 2024 of around 30-40 per cent from average daily levels in 2022. These events have caused ships to be diverted, resulting in delays and rising costs.
34
Budget Strategy and Outlook 2024-25
Similarly, the ongoing conflicts in Ukraine and Gaza also have the potential to generate new adverse supply shocks to the global recovery, including spikes in food, energy, and transportation costs.
Any resulting increases in shipping costs and commodity prices have the potential to lead to a renewed surge in goods inflation, which, in conjunction with sticky services inflation, could prolong the monetary tightening cycle.
One of the main risks to growth is the potential for China’s ongoing property sector challenges — which include high developer debt levels and overbuilding creating many vacant units — to worsen, with flow-on effects on its trading partners, including Australia.
In contrast to most other major economies, China has been battling deflation throughout much of 2023 and early 2024. The Chinese Government has reacted to falling consumer prices and moderating economic growth by implementing a range of fiscal and monetary policy measures to support the property and household sectors.
The IMF currently forecasts China’s economic growth to slow from 5.2 per cent in 2023 to 5.0 per cent in 2024 and 4.5 per cent in 2025. The IMF upwardly revised its 2024 and 2025 China GDP growth forecasts in May following a staff visit to the country. The IMF cited strong March quarter 2024 GDP data and recent policy measures as drivers of its upward revision but maintained that economic risks were tilted to the downside.
If concerns around the outlook for China’s housing construction sector were to materialise, this could decrease global demand for inputs to construction and, consequently, negatively impact Queensland’s exports, particularly given metallurgical coal — a key input to steel production — was Queensland’s largest commodity export in 2023 (valued at $50.7 billion).
Further weakness in China’s economy also risks impacting other key Queensland goods exports (including LNG, metals and agriculture) and services exports to China, which have been recovering following the re-opening of international borders.
In terms of services exports, China’s student commencements in Queensland rose to 11,005 in 2023, up from 8,977 in 2022. This is still 35 per cent below the pre-COVID-19 level of 16,964 commencements in 2019. Meanwhile, total tourism visitor nights to Queensland from China also rebounded to one million in 2023, up from just 125,000 in 2022. However, visitor nights from China are 80 per cent lower than the pre-COVID-19 level of 4.9 million in 2019.
| 2.2 | National conditions |
Growth of the Australian economy has slowed since the post-COVID-19 rebound in 2021, largely because of weaker household consumption growth. The slowdown in growth has progressed as expected, with activity supported by significant accumulated household savings and a large number of fixed rate mortgages, which has likely partially mitigated the immediate impact of interest rate increases on these households’ disposable incomes.
Australian economic growth slowed from 5.5 per cent in 2021 to 3.9 per cent in 2022 and then to 2.0 per cent in 2023. Quarterly real GDP has continued to rise modestly, but through the year
35
Budget Strategy and Outlook 2024-25
growth fell to just 1.1 per cent in March quarter 2024, the weakest outside the pandemic since the early 1990s recession.
Headline GDP growth has also been well supported by strong population growth since the Australian border was re-opened, rising 2.6 per cent since mid-2022. However, in per-capita terms, real output nationally has declined 1.6 per cent over this period.
Household budgets have come under increasing pressure from rising borrowing costs and high consumer price inflation. Real disposable incomes have trended lower, reflecting high inflation, an increased income tax burden and higher interest costs.
However, household wealth has risen strongly since late 2022, supported by increasing house prices, strong share market gains and rising superannuation contributions. In aggregate, households overall had built up significant savings buffers during the COVID-19 pandemic and, while some of these savings are likely being drawn down, it will take some time before liquid asset buffers are depleted. Further, data and analysis from the Australian Prudential Regulation Authority and the RBA show the expiry of very low fixed rate mortgages has progressed smoothly, and loan arrears remain well contained and below pre-COVID-19 levels.
National economic growth is expected to continue to slow in the near term, with the RBA forecasting growth of 1.3 per cent in 2024. Aside from ongoing weakness in consumption, dwelling construction remains impacted by labour constraints and high construction costs.
While business investment and public demand have grown robustly amid a large pipeline of work, high construction and finance costs are impacting new private sector investment and its contribution to growth is expected to ease.
In this environment, the current very strong labour market conditions are expected to ease somewhat and provide a more normal balance between labour supply and demand, with moderating employment growth likely to see the national unemployment rate edge up from its current low rate.
This should help relieve pressure on labour prices, with the Wage Price Index (WPI) expected to have possibly peaked at 4.2 per cent over the year to December quarter 2023. Elevated growth in nominal unit labour costs remains a contributor to domestically sourced inflation, with employee compensation per hour rising solidly and labour productivity weak. Consistent with this, services inflation remains stubbornly high and continues to be the major source of price pressures, mirroring the experience of economies overseas.
Combined with higher fuel prices, the RBA expects these factors to contribute to ongoing inflationary pressures in the near term. However, headline CPI growth has swiftly moderated to 3.6 per cent in March quarter 2024 and looks set to fall back within the RBA’s 2-3 per cent target range over the next year or so.
The RBA forecasts GDP growth to pick up to 2.1 per cent in 2025. Consumer spending should be better supported later in 2024 by rising real disposable incomes as income tax cuts, easing inflation and potentially lower interest rates provide relief. Further, rising demand for new dwelling investment is expected to be underpinned by recent strong population growth while the solid contribution from public demand is expected to be ongoing.
36
Budget Strategy and Outlook 2024-25
Having paused its increasing interest rate cycle in late 2023, the RBA’s next move is widely expected to be an easing of the cash rate, although markets have pared back the timing and scale of expected cuts.
Despite previous concerns about the pace of monetary tightening, so far, the reduction in inflation has coincided with ongoing, albeit soft, economic growth and strong labour market outcomes.
In the RBA’s assessment, risks to the domestic outlook are broadly balanced. The lagged impact of tighter monetary conditions remains a key uncertainty, particularly on consumption, while demand could also be interrupted if global risks materialise.
Meanwhile, the risk that inflation stays high for longer has risen, with the future path of inflation nationally vulnerable to weak productivity growth and additional supply-side shocks.
| 2.3 | Key assumptions |
Key assumptions underpinning the 2024–25 economic forecasts for Queensland include:
| • | the Australian Government’s reforms to immigration will help return population growth to normal levels |
| • | the cash rate is expected to have peaked at 4.35 per cent, with cuts likely to commence in late 2024 and continuing to gradually ease over the medium term |
| • | the A$ exchange rate to move toward its assumed medium-term anchor of around US$0.75 |
| • | Brent oil production is expected to outpace global consumption, with prices to gradually ease towards a medium-term level of US$75/bbl |
| • | despite high interest rates, residential property prices in Brisbane are expected to remain strong in the near term before seeing growth moderate over 2025 |
| • | according to the Bureau of Meteorology (BOM), the recent El Niño weather event, which resulted in much higher levels of summer rainfall than expected across Australia, has now ended. Forecasts have been produced on the assumption of median levels of rainfall for remainder of 2024 and 2024–25, consistent with BOM predictions. |
| 2.4 | Queensland conditions and outlook |
Following growth of 2.3 per cent in Gross State Product (GSP) in 2022–23, Queensland’s overall economic growth is forecast to strengthen to 3 per cent in both 2023–24 and 2024–25 (Chart 2.2).
The forecast strengthening of GSP growth in 2023–24 is attributable to a substantial rebound in net exports and continued growth in public final demand.
As consumption strengthens in 2024–25, private final demand becomes a more significant driver of overall growth in the economy, along with public final demand and exports.
Growth is projected to be 21⁄2 per cent in 2025–26, sustained by continuing growth in domestic activity but tempered by a moderation in population growth.
37
Budget Strategy and Outlook 2024-25
| Chart 2.2 | Economic growth, Queensland1 |
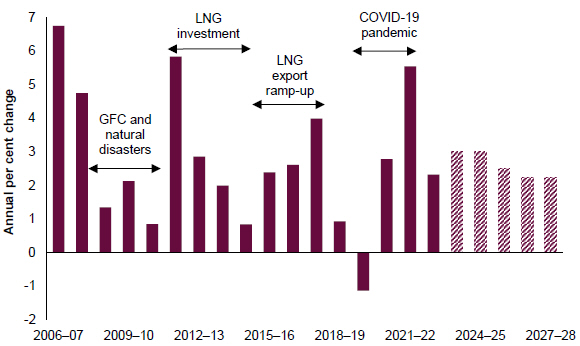
Note:
| 1. | Gross State Product, Chain volume measure (CVM), 2021–22 reference year. |
Sources: ABS Annual State Accounts and Queensland Treasury.
Household budgets continue to be constrained by the recent substantial increases in mortgage rates and other cost-of-living pressures, which have slowed consumption growth in 2023–24. However, growth in household consumption is expected to recover to around pre-COVID-19 averages in 2025–26 as a range of factors support real disposable incomes, including an easing in inflationary pressures and lending rates, along with the legislated national income tax cuts.
With higher construction and borrowing costs moderating demand, and ongoing capacity constraints limiting residential construction activity, total dwelling investment is expected to fall in 2023–24, but then return to growth at a modest rate in 2024–25 and 2025–26 as supply constraints ease and allow the large pipeline of residential work to progress steadily.
Importantly, new and used dwelling investment is expected to continue to grow throughout the forecast period, adding to the housing stock. In contrast, renovation activity is expected to continue to decline from its COVID-19-era record highs.
Business conditions and capacity utilisation rates have eased somewhat over the past year. Growth in business investment is expected to be modest over the next 2 years as elevated construction costs and softening commodity prices impact investment intentions.
Growth in public final demand has averaged 4.9 per cent per annum over the past 8 years and is expected to continue to be a key driver of overall economic growth in Queensland. This outlook is supported by the Queensland Government’s ongoing substantial capital program, committing
38
Budget Strategy and Outlook 2024-25
$107.3 billion over 4 years from 2024–25 to essential economic and social infrastructure investment across the state.
After detracting from overall real economic growth for 4 consecutive years, the overseas trade sector is forecast to be a substantial contributor to overall GSP growth in 2023–24.
This is due to increased export volumes of coal, LNG, metals and beef and the continued recovery of services exports from the COVID-19-driven low. As metallurgical coal exports rebound from supply constraints, and growth in services exports continues to recover, the trade sector is forecast to make a further contribution to GSP growth in 2024–25.
Queensland continues to enjoy exceptionally strong labour market conditions, building on employment growth of 5.1 per cent in 2021–22, the strongest growth in 17 years, and further strong jobs growth of 3.7 per cent in 2022–23.
With ongoing solid demand for labour, employment growth is expected to average 23⁄4 per cent in 2023–24 before moderating to 11⁄2 per cent in 2024–25 and 1 per cent in 2025–26.
As of April 2024, Queensland (up 366,900 persons) had recorded the largest employment growth of any state or territory since March 2020.
In percentage terms, Queensland’s employment growth (up 14.3 per cent) over the period was stronger than in the rest of Australia (9.7 per cent).
The state’s unemployment rate averaged 3.7 per cent in 2022–23, Queensland’s lowest year-average unemployment rate since ABS monthly data began in 1978. As tightness in the labour market continues to unwind gradually, the unemployment rate is expected to edge slightly higher over the forward estimates period but remain low by historical standards.
Inflationary pressures eased significantly during 2023, with the annual rate of inflation in Brisbane moderating from a 30-year high of 7.9 per cent September quarter 2022 to 3.4 per cent in March quarter 2024. This has largely been due to a marked slowing in goods inflation, whereas services inflation has been more persistent.
In year-average terms, inflation in Brisbane is forecast to ease from 7.3 per cent in 2022–23 to 4 per cent in 2023–24. In 2024–25, the gradual loosening of the Queensland labour market is expected to see services inflation moderate. Combined with an estimated 11⁄4 percentage points detraction from CPI growth due to the Queensland Government’s cost-of-living measures, when combined with the Australian Government’s measures, this is forecast to see annual CPI growth fall to 2 per cent next year.
While inflation is forecast to ease materially in 2023–24, growth in the WPI is forecast to strengthen from 3.6 per cent in 2022–23 to 43⁄4 per cent in 2023–24, delivering a return to real wages growth.
As capacity constraints in the labour market begin to ease and inflation slows further, wages growth is forecast to moderate to 33⁄4 per cent in 2024–25 and 31⁄2 per cent in 2025–26. Nevertheless, ongoing real wages growth is expected across the forward estimates period.
Queensland’s population growth is expected to strengthen to 21⁄2 per cent in 2023–24, reflecting elevated net overseas migration as the recovery in departures continues to lag the significant rebound in arrivals.
With interstate migration forecast to stabilise at around pre-COVID-19 levels and net overseas migration to normalise, Queensland’s population growth is forecast to then average around 11⁄4 to 11⁄2 per cent over the remainder of the forward estimates.
39
Budget Strategy and Outlook 2024-25
| Table 2.2 | Queensland economic forecasts/projections1 |
| Actuals | Forecasts | Projections | ||||||||||||||||||||||
| 2022–23 | 2023–24 | 2024–25 | 2025–26 | 2026–27 | 2027–28 | |||||||||||||||||||
Gross state product2 | 2.3 | 3 | 3 | 21⁄2 | 21⁄4 | 21⁄4 | ||||||||||||||||||
Employment | 3.7 | 23⁄4 | 11⁄2 | 1 | 11⁄4 | 11⁄2 | ||||||||||||||||||
Unemployment rate3 | 3.7 | 41⁄4 | 41⁄2 | 43⁄4 | 43⁄4 | 43⁄4 | ||||||||||||||||||
Inflation4 | 7.3 | 4 | 2 | 31⁄4 | 21⁄2 | 21⁄2 | ||||||||||||||||||
Wage Price Index | 3.6 | 43⁄4 | 33⁄4 | 31⁄2 | 31⁄4 | 3 | ||||||||||||||||||
Population | 2.4 | 21⁄2 | 11⁄2 | 11⁄2 | 11⁄4 | 11⁄4 | ||||||||||||||||||
Notes:
| 1. | Unless otherwise stated, all figures are annual percentage changes. |
| 2. | CVM, 2021–22 reference year. The comparable nominal GSP growth rates are 10.9 per cent in 2022–23, 31/4 per cent in 2023–24, 41/4 per cent in 2024–25 and 33/4 per cent in 2025–26. |
| 3. | Per cent, year-average. |
| 4. | Brisbane, per cent, year-average. |
Sources: ABS Annual State Accounts, National, State and Territory Population, Labour Force, Wage Price Index, Consumer Price Index and Queensland Treasury.
| 2.4.1 | Household consumption |
Growth in real household spending in Queensland averaged 4.2 per cent per annum between 2019–20 and 2022–23, well above the 21⁄2 per cent per annum average growth in the decade prior to COVID-19.
Tight labour market conditions and a pick-up in wages growth has underpinned ongoing strong growth in nominal labour income. Household savings accumulated during the COVID-19 pandemic have also been substantial. However, as consumers have curtailed discretionary spending in response to higher borrowing costs and elevated inflation, growth in real household consumption has slowed to 1.0 per cent in the first three quarters of 2023–24.
Subsiding inflationary pressures, lower lending rates and the impact of national income tax cuts are all expected to support a return to growth in real household disposable incomes beyond 2023–24. Consequently, as households’ financial position improves, consumption growth is expected to strengthen to 2 per cent in 2024–25 and 21⁄2 per cent in 2025–26 (Chart 2.3).
40
Budget Strategy and Outlook 2024-25
| Chart 2.3 | Real household consumption growth, Queensland1 |
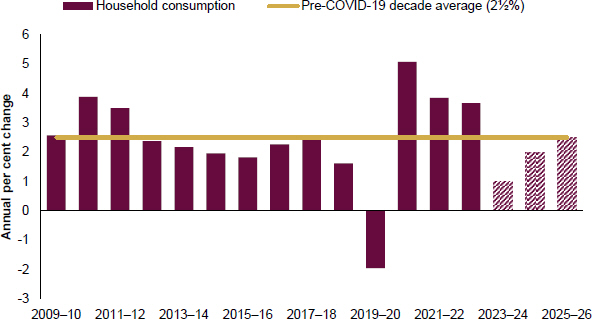
Note:
| 1. | Chain volume measure, year-average. |
Sources: ABS National Accounts and Queensland Treasury.
| Box 2.1 | Consumer spending trends in Queensland |
The economic recovery from COVID-19 in 2020–21 and 2021–22 saw strong gains in the volume of discretionary spending by Queensland households, due to household disposable incomes during that period being boosted by COVID-19 support payments, historically low interest rates, and strong increases in labour income and asset prices.
Over the two years to 2021–22, several discretionary components reported in the ABS National Accounts recorded double digit growth, with clothing and footwear, furnishings and household equipment, hotels, cafes and restaurants and recreation increasing by a combined 18.3 per cent in real terms.
However, more recently, as households continue to adapt to tighter financial conditions, there has been a noticeable slowing across these components.
Real spending on furnishings and household equipment (down 2.3 per cent), recreation (down 1.4 per cent) and clothing and footwear (down 0.1 per cent) have fallen in the first three quarters of 2023–24 compared with the same period in 2022–23, while at 3.7 per cent growth, spending at hotels, cafes and restaurants has slowed from previous highs (Chart 2.4).
Spending on furnishings and household equipment has been the only major component to fall consecutively over the past 2 years in Queensland. Due to its discretionary nature and the
41
Budget Strategy and Outlook 2024-25
generally higher priced nature of the items sold within this component, it has been one of the first components of expenditure to be reduced in volume terms as mortgage costs and wider price pressures increased.
Amidst elevated prices of consumer goods, households appear to have also cut back on some essential spending, with food consumption falling by 0.4 per cent in 2022–23 before edging higher in 2023–24.
Meanwhile, in real terms, growth in household spending on health has generally slowed from the higher rate seen in 2020–21. Spending on transport strengthened substantially across 2021–22 and 2022–23 (Chart 2.4). This was partly supported by higher spending on purchases of vehicles as supply bottlenecks have continued to ease.
A catch up in air travel from a very low base, after the COVID-19 related overseas border restrictions were unwound in early-2022, also contributed to the overall strengthening in the transport component during this period.
| Chart 2.4 | Real household spending by selected major components, Queensland1,2 |
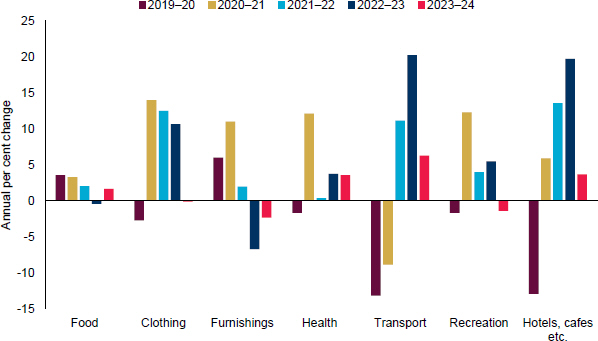
Notes:
| 1. | Chain volume measure, year-average. |
| 2. | The 2023–24 year-average growth rate refers to the first 3 quarters of 2023–24 compared with the same period a year earlier in seasonally adjusted terms. |
Source: ABS National Accounts.
42
Budget Strategy and Outlook 2024-25
| 2.4.2 | Dwelling investment |
Record low interest rates, substantial government stimulus and a decrease in the average household size during the COVID-19 pandemic, followed by a strong rebound in population growth drove a surge in demand for housing in Queensland in recent years.
However, construction activity has struggled to keep up with demand, significantly constrained by COVID-19-related material and labour shortages, poor weather and flooding, and construction company insolvencies. As a result, construction costs surged and residential work in the pipeline peaked at a nominal value of $13.8 billion in March quarter 2023 (Chart 2.5).
Growth in construction output costs for houses peaked at 28.4 per cent in the year to June quarter 2022. Growth in construction costs has slowed considerably to 2.3 per cent in the year to March quarter 2024. However, remaining supply constraints and strong competition for labour and materials from the non-residential and engineering construction sectors are likely to see construction costs continue to grow. These higher construction costs, in combination with the sharp increase in interest rates since May 2022, have impacted dwelling investment decisions and seen the number of dwelling commencements trend downwards in recent quarters. However, dwelling investment in the near term is being supported by the sizeable pipeline of existing projects. The number of dwellings completed totalled 9,913 in December quarter 2023, a rise of 13 per cent over the year and the highest quarterly total since 2019. While completions have started to increase following the surge of commencements in 2021, they are still below the level needed to fully accommodate the surge in demand for housing in Queensland.
Following a decline of 5.5 per cent in 2022–23, dwelling investment is forecast to fall by 21⁄2 per cent in 2023–24. This decline primarily reflects a decline in alterations and additions and detached dwelling investment. Strong growth in attached dwellings (i.e. units and apartments etc.) will continue to add to overall dwelling supply.
Dwelling investment is then forecast to rebound to 21⁄4 per cent growth in 2024–25 and grow by a further 1⁄4 per cent in 2025–26, supported by lower interest rates and the easing of supply constraints.
Importantly, new and used investment is expected to continue to grow throughout the forecast period with the growth rate reaching 71⁄4 per cent in 2024–25. This will continue to add to the housing stock, in contrast to renovation activity which is expected to continue to decline from its COVID-19-era record highs.
43
Budget Strategy and Outlook 2024-25
| Chart 2.5 | Queensland dwelling investment and work in the pipeline |
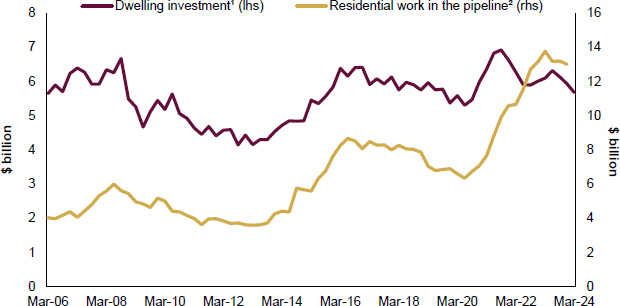
Notes:
| 1. | Quarterly, chain volume measure, seasonally adjusted |
| 2. | Quarterly, nominal, original |
Sources: ABS National Accounts and Building Activity.
| 2.4.3 | Business investment |
Business investment rebounded in the years following the initial downturn during the COVID-19 pandemic, supported by strong profitability and low interest rates, with total business investment growing by 8.5 per cent and 4.7 per cent in the years to December quarter 2021 and December quarter 2022 respectively.
However, following growth of 6.7 per cent in 2022–23, business investment growth has been subdued due to a combination of rising interest rates and construction costs, with building construction costs, as published in the ABS Producer Price Index, having risen by 31.2 per cent in the 3-year period ended March quarter 2024.
While the current level of overall business profitability in Queensland remains strong, this has disproportionately reflected the impact of high commodity prices on mining sector profits (Chart 2.6). These elevated levels of business profits are likely to moderate as commodity prices, particularly coal, normalise and indicators of business confidence and business conditions ease from exceptionally high levels.
44
Budget Strategy and Outlook 2024-25
| Chart 2.6 | Queensland Gross Operating Surplus and Mixed Income share of GSP1 |
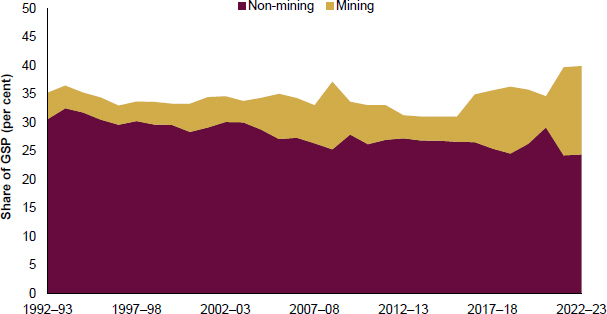
Note:
| 1. | Non-mining Gross Operating Surplus and Mixed Income excludes ownership of dwellings industry. |
Source: ABS State Accounts.
The combination of higher interest rates and softer business conditions points to moderating growth in business plant and equipment investment growth over the forecast horizon. The outlook for non-residential construction is more volatile. Recent materials and labour shortages, together with some weather-related disruptions have seen a growing backlog of work in the pipeline. This should support activity in the very near term. However leading indicators such as building approvals and commencements have recently eased, suggesting that higher construction costs will ultimately impact on activity in this component of business investment. As a result, overall business investment is expected to grow by 3 per cent in 2023–24 and then continue to grow only moderately across the forecast years.
| 2.4.4 | Public final demand |
Public final demand has continued to record strong growth in recent years, rising 4.8 per cent in 2022–23. The outlook is expected to remain strong, with public final demand growing 51⁄2 per cent in 2023–24 and 2024–25, supported by a range of initiatives including cost-of-living relief, spending in response to natural disasters and substantial ongoing investment in public infrastructure.
Over the medium term, growth in public final demand is expected to be underpinned by the Queensland Government’s ongoing Big Build program, which commits $107.3 billion over 4 years
45
Budget Strategy and Outlook 2024-25
from 2024–25 in infrastructure investment across key sectors of the economy, including health, education, transportation, and energy. Additionally, the upcoming Brisbane 2032 Olympic and Paralympic Games will support public investment across communities and local businesses, as well as the tourism, sports, and recreational sectors.
| 2.4.5 | Overseas exports and imports |
The nominal value of Queensland’s exports is expected to fall from the record high of $145 billion in 2022–23 to $134 billion in 2023–24, due to a moderation in prices for Queensland’s key commodity prices.
However, in real terms, overseas exports are estimated to grow by 101⁄2 per cent in 2023–24, driven by increased export volumes of thermal coal, LNG, metals, and beef, in addition to the continued recovery of services exports from the impacts of the COVID-19 pandemic international border closures.
Overseas exports are expected to grow a further 23⁄4 per cent in 2024–25, driven by a rebound in metallurgical coal exports — as supply constraints ease — and ongoing recovery in services exports.
Further growth in overseas exports beyond 2024–25 is supported by solid growth in services exports and metallurgical coal exports, largely offset by lower metals and agriculture exports. Growth in Queensland’s imports is expected to moderate from 15.8 per cent in 2022–23 to 71⁄2 per cent in 2023–24, reflecting subdued growth in household consumption but continued growth in services imports, before moderating further to 13⁄4 per cent in 2024–25.
Coal
Queensland’s coal exports are expected to grow by 21⁄2 per cent in 2023–24, reflecting increased production, partially offset by wet weather impacts restricting production.
Coal exports are then forecast to grow by 81⁄4 per cent in 2024–25, reflecting growth in hard coking coal exports due to the unwinding of supply constraints which have impacted production in recent years, and then grow by a further 41⁄4 per cent in 2025–26 as supply conditions normalise. Coal export growth is then expected to slow across 2026–27 and 2027–28.
Demand for Queensland’s hard coking coal is expected to be supported by growing steel production in India, and emerging markets such as Vietnam. However, ongoing concerns about China’s real estate industry and economy more broadly present downside risks for global steel demand.
In the short term, Queensland’s thermal coal exports have been supported by the easing of trade restrictions with China and continued coal-fired power generation in the fast-growing Asian region.
China removed its unofficial ban on Australian coal imports in January 2023, resulting in Queensland exporting 25.3 million tonnes (Mt) of coal to China in the year ended April 2024, primarily thermal coal (20.4Mt). This compares with no coal exports to China in 2022 but remains
46
Budget Strategy and Outlook 2024-25
well below the 56.6Mt of exports in 2019, the last full year of trade prior to the implementation of the ban in October 2020.
In the longer term, demand for thermal coal is expected to be impacted by ongoing global decarbonisation efforts leading to less coal-fired electricity generation, although most of this impact is expected outside of the forward estimates period.
In recent years, Queensland’s coal exporters have benefitted from extraordinarily high prices. Across 2021–22 and 2022–23, export prices averaged A$367 per tonne, compared with an average of A$171 per tonne over the previous 5 years. So far in 2023–24, coal prices while moderating, remain elevated.
The premium hard coking coal spot price fell sharply in March 2024, from US$313.50 per tonne at the end of February to US$243 per tonne at the end of April. This reflected a decline in steel demand in China and India and improving supply conditions. Looking forward, as supply conditions continue to normalise, the hard coking coal spot price is expected to continue to moderate towards medium-term fundamentals.
LNG
The volume of Queensland’s LNG exports is estimated to grow by 63⁄4 per cent in 2023–24 due to strong global demand for natural gas, rebounding from the lower volumes seen in 2022–23 due to maintenance issues at one of the LNG plants on Curtis Island amid tight domestic supply.
From 2024–25 onwards, it is assumed that production by the LNG projects will average around their contracted amounts. China represents a significant market for Queensland’s LNG exports, accounting for just under 60 per cent of Queensland’s total LNG exports over the last 3 years.
However, ongoing concerns about weakness in China’s economy and subsequent demand for LNG are unlikely to significantly impact Queensland’s LNG exports, with the majority of LNG production under contract and a number of Chinese firms being part-owners in the LNG projects themselves.
This was evidenced when China unofficially banned imports of numerous Australian commodities (including beef and coal) in 2020, but Queensland LNG was largely unaffected. While LNG exports to China did fall slightly in 2021–22, they were more than offset by increased exports to other markets in Asia, resulting in record total LNG export volumes for Queensland in 2021–22.
Most of Queensland’s LNG exports are sold under long-term contracts linked to global oil prices, with several months’ lag. Oil prices have declined from elevated levels in recent years, which will see the nominal value of LNG exports fall to $22 billion in 2023–24, down from their record high $24 billion in 2022–23.
However, OPEC+ production cuts and geopolitical tensions in Russia and the Middle East continue to support global oil prices in 2024, in turn resulting in somewhat elevated prices for Queensland’s LNG exports.
Looking further ahead, global production of oil, particularly from the US, is expected to grow by more than global demand, which will put further downward pressure on oil prices, and therefore LNG prices, over the forecast period.
47
Budget Strategy and Outlook 2024-25
Metals
Queensland metals exports have been subdued in recent years. Metals production was hampered in 2021–22 by COVID-19 pandemic related workforce disruptions, weather interruptions and outages at major refineries and smelters, resulting in a 12 per cent fall in export volumes.
While production rebounded in late 2022, flooding and widespread shutdowns in early 2023 resulted in metals exports growing by only 0.9 per cent in 2022–23.
Most operations returned to normal by the second half of 2023 but export volumes were once again constrained by poor weather in early 2024, the cyclone-related rail closure through February and a shutdown at Capricorn Copper, as well as gas shortages curtailing production at Queensland alumina refineries.
Despite these temporary supply constraints, metals exports are estimated to rebound a further 51⁄2 per cent in 2023–24, with aluminium boosted by strong bauxite production and increased unwrought aluminium exports, with a few other processors also increasing output.
The planned ramp-up of the Sun Metals zinc refinery expansion, along with ongoing growth in aluminium production, is expected to support metals output in coming years.
However, exports have trended lower over the past decade, and this is largely expected to continue as several significant base metal mines are scheduled to close. These include Glencore’s Lady Loretta zinc and Mount Isa copper mining operations, while the New Century tailings operation will also reach its end-of-life.
Queensland’s base metal exploration expenditure has been elevated in recent years, particularly for copper, and several new or expanded operations which are yet to reach a final investment decision are likely to offset some of the anticipated decline. These may include potentially significant additions, such as a restart to Glencore’s Black Star zinc mine, extensions of Eloise and Ernest Henry operations and the Eva copper mine among others.
Meanwhile, exploration and plans for critical minerals in Queensland continue to progress and may provide new opportunities beyond Queensland’s traditional industrial metals base. However, the extent to which some of these projects proceed, and whether the output is exported rather than used in domestic manufacturing, remains uncertain. As final investment decisions are made for projects, these will be incorporated into estimates.
Agriculture
The volume of agricultural exports rose by 12.8 per cent in 2022–23, driven by large increases in cotton, beef and crop exports. Cotton exports increased sharply in 2022–23 due to strong production in 2021–22 and 2022–23 aided by favourable weather conditions.
Agriculture exports are expected to strengthen by a further 73⁄4 per cent in 2023–24 to an all-time high, driven by surging beef, cotton, and sugar exports. In mid to late 2023, BOM predicted warmer and drier conditions for much of Australia and declared an El Niño was underway, prompting farmers to increase cattle processing rates heading into summer.
48
Budget Strategy and Outlook 2024-25
However, much of Australia and Queensland has experienced wet weather conditions instead, allowing farmers to continue increasing herd size despite the higher processing rates for cattle. Beef exports are expected continue to strengthen in 2024–25, before moderating in following years, as farmers look to re-build their herds.
International sugar prices have risen significantly since early 2023 following dry weather and supply issues in key sugar producing countries such as India and Thailand and port congestion in Brazil. As a result, nominal sugar exports are projected to significantly increase in 2023–24 on the back of these high prices. As global supply recovers, sugar prices are expected to moderate over the coming years.
From 2024–25, Queensland total agriculture exports are projected to moderate from record levels. This is in line with the Australian Bureau of Agricultural and Resource Economics and Sciences’ (ABARES) expectation that a return to more “neutral” weather conditions, as forecast by the BOM, will impact cotton production, while beef processing rates are expected to slow from 2025–26 onwards.
Services exports
International visitors and student arrivals have recovered strongly following the reopening of Australia’s borders at the start of 2022 (Chart 2.7).
Student arrivals are now at around 90 per cent of their pre-COVID-19 levels (March 2019) while the recovery in short-term visitors has been somewhat slower, now at around 79 per cent of pre-COVID-19 levels.
The recovery in short-term visitor arrivals have been hampered by international airline capacity limitations and high travel costs.
However, on average, visitors are staying longer so that the recovery in visitor nights spent in Queensland has been stronger than the recovery in visitor numbers.
49
Budget Strategy and Outlook 2024-25
| Chart 2.7 | Number of overseas arrivals, Queensland1 |
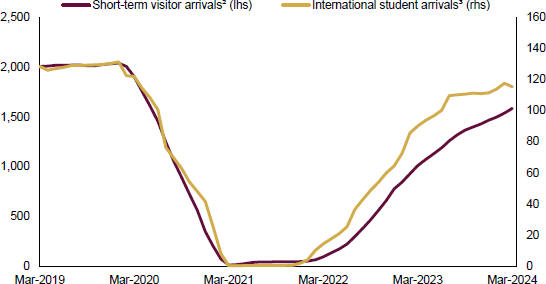
Note:
| 1. | 12-month rolling sum, ‘000s. |
| 2. | Overseas visitors who intend to stay in Australia for less than 12 months. |
| 3. | Overseas arrivals on temporary student visas who undertake full-time study in a recognised educational institution. |
Source: ABS Overseas Arrivals and Departures, Australia.
More recently, the pace of the recovery in student arrivals appears to have eased somewhat. While this may reflect a range of factors, it is noted that in late 2023, the Australian Government announced a series of measures that could impact on international student arrivals, including tighter English language scores, more scrutiny of student visa applications from high-risk providers, restrictions on onshore visa-hopping and an increase in the level of savings that international students need to be eligible for a visa.
With the number of international student and visitor arrivals approaching pre-COVID-19 levels, and given the recent changes made as part of the Australian Government’s migration strategy, it is likely that the pace of growth in services exports will slow from the exceptionally high rates over the past few years and move towards a more sustainable rate.
Imports
Imports have grown strongly in recent years, supported by solid domestic activity, improvement in global supply chains and the substantial recovery in services imports as international borders were reopened following the COVID-19 pandemic.
50
Budget Strategy and Outlook 2024-25
However, growth in Queensland’s imports is expected to moderate to 71⁄2 per cent in 2023–24. While services imports, primarily overseas tourism undertaken by Queenslanders, are forecast to continue to grow strongly, goods imports growth is expected to slow, reflecting the weak household consumption growth constrained by high inflation and interest rates.
In 2024–25, imports are expected to grow by 13⁄4 per cent, driven by services imports, while goods imports are expected to fall. Beyond 2024–25, imports are forecast to grow strongly, reflecting a return to more solid household consumption growth and continued strength in services imports.
| Box 2.2 | Economic impacts of Tropical Cyclone Jasper and South East Queensland storms |
Over the 2023–24 summer, parts of the state were impacted by severe weather events, which inflicted major flooding and storm damage to homes, businesses and infrastructure.
In addition to the financial costs to households, businesses, government and insurers of rebuilding and repairing the physical damage caused by these events, the severe weather events also resulted in losses in economic output as measured by Gross State Product (GSP). Given the nature and location of these events, the economic impacts primarily fell into 3 categories:
| • | impacts on agricultural production through crop and stock losses |
| • | impacts on tourism activity |
| • | general business disruption due to physical damage to property and loss of business due to closures, and transportation and power disruptions. |
Tropical Cyclone Jasper
Cyclone Jasper had significant, albeit largely temporary, impact on businesses in key areas of North Queensland.
Key crops in the impacted region include over 90 per cent of Queensland’s production of bananas, as well as a range of tropical fruits and sugarcane, while the region’s agricultural activities also include cattle and fisheries.
Advice from the Department of Agriculture and Fisheries indicated that losses to agricultural production in the region are likely to be in the order of up to $60 million.
Tourism Research Australia data indicate the number of visitor nights in Cairns in December quarter 2023 was 331,000 (9.4 per cent) lower than in the previous December quarter, while Cyclone Jasper may also have had some additional impact on activity in the subsequent March quarter 2024. However, a range of other factors may also influence changes in visitor arrivals and nights across years, so the decline is not necessarily all directly attributable to Cyclone Jasper.
It is also noted that from a whole-of-state economy perspective, these losses in the affected regions may have been partly offset by travellers altering their plans to travel at a later date or travel to an alternative destination within Queensland.
51
Budget Strategy and Outlook 2024-25
General business impacts of Cyclone Jasper include reduced output due to power outages, transport disruptions and damage to plant, equipment, and property. According to the Insurance Council of Australia, there were 892 commercial insurance claims lodged following Cyclone Jasper, noting not all losses would be covered by insurance.
While devastating for impacted local residents and business owners, the impact on the overall Queensland economy is mitigated by the relatively small size of the impacted area, which accounts for around 5 per cent of total Queensland employment and population. Therefore, the economic losses are not expected to be material in the context of overall growth in the Queensland economy, with GSP in excess of $500 billion per annum.
SEQ Christmas and New Year floods and storms
The Christmas/New Year floods and storms severely impacted areas of South East Queensland, with the key economic impacts of this event being on tourism activity and due to general business disruption.
Tourism Research Australia data indicates that the total number of visitor nights at the Gold Coast in December quarter 2023 was down 1,168,000 (18.9 per cent) compared with the previous December quarter. There may also have been some impact on tourism in the subsequent March quarter, given the event occurred relatively late in the December quarter.
As is the case with Cyclone Jasper, while there was significant damage and losses incurred by households and businesses in the impacted region, most of the disruption to economic activity was temporary.
In combination, the impact of natural disasters in Queensland in 2023–24 is not anticipated to have a material impact on overall GSP (i.e. less than 1⁄4 of a percentage point of GSP).
| 2.4.6 | Labour market |
Queensland’s labour market remains exceptionally strong by historical standards.
The trend unemployment rate remains low, at 4.1 per cent in April 2024, and employment growth is strong, up 4.0 per cent over the year to April 2024.
The number of people employed in Queensland in April 2024 had grown by 366,900 (14.3 per cent) since March 2020, the strongest growth in both absolute and percentage terms of any state or territory.
However, as higher interest rates impact the domestic economy, the tightness in the labour market has shown some signs of easing, with the unemployment rate having edged slightly higher from a very low 3.4 per cent in December quarter 2022.
Annual employment growth has moderated from a high of 5 per cent over the year to September quarter 2022. The job vacancy rate, which measures the number of job vacancies as a proportion of the labour force, has eased from an historic high of 3 per cent in September quarter 2022 to a still elevated 2.3 per cent in March quarter 2024.
Strong jobs growth so far in 2023–24 is expected to see employment grow by 23⁄4 per cent in the year. Employment growth is then expected to slow to 11⁄2 per cent in 2024–25 and 1 per cent in
52
Budget Strategy and Outlook 2024-25
2025–26, as the labour market continues to normalise. Employment growth is then expected to grow broadly in line with underlying population growth.
As employment growth slows, the state’s participation rate is expected to ease gradually from 661⁄2 per cent in 2023–24 to 66 per cent across the forward estimates.
The unemployment rate is expected to gradually increase from the 3.7 per cent recorded in 2022–23, Queensland’s lowest year-average unemployment rate since monthly records began in 1978.
The unemployment rate is expected to average 41⁄4 per cent in 2023–24 and then, going forward, continue to increase towards a rate more consistent with stable inflation, reaching 41⁄2 per cent in 2024–25, and 43⁄4 per cent in 2025–26, 2026–27 and 2027–28.
| Chart 2.8 | Employment growth and unemployment rate, Queensland1 |
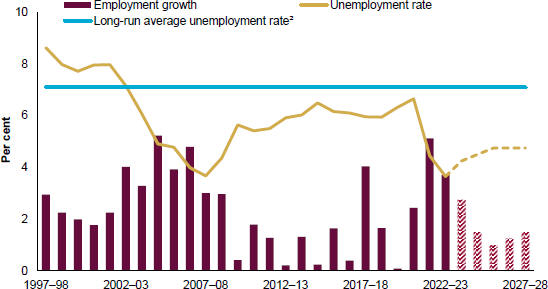
Note:
| 1. | Original, year-average. 2023–24 and beyond are forecasts/projections. |
| 2. | Long-run average unemployment rate since the inception of the ABS monthly series in 1978. |
Sources: ABS Labour Force and Queensland Treasury.
Regional labour markets
Employment outcomes and labour markets more broadly across the state have remained remarkably resilient despite the global macroeconomic headwinds.
Many regional areas of Queensland have recorded ongoing strong labour market outcomes, with key regional industries supported by elevated commodity prices, solid domestic tourism, improved rainfall and strong dwelling demand.
53
Budget Strategy and Outlook 2024-25
Employment in regional Queensland grew 0.9 per cent in the year ended April 2024 with Wide Bay (up 9,200 or 7.1 per cent) recording the strongest employment growth, followed by Darling Downs – Maranoa (up 1,400 or 2.2 per cent) and Queensland – Outback (up 500 or 1.2 per cent).
The average unemployment rate across regional Queensland rose slightly, by 0.4 percentage point, but remained very low at 4.0 per cent in the year to April 2024.
Darling Downs – Maranoa (2.1 per cent), Cairns (3.4 per cent) and Townsville (3.8 per cent) recorded the lowest unemployment rates in regional Queensland as of April 2024, while Wide Bay recorded its lowest ever unemployment rate at 4.8 per cent.
Employment in South East Queensland rose 3.6 per cent in the 12 months to April 2024, led by Sunshine Coast (up 19,500 or 9.5 per cent), Logan – Beaudesert (up 14,700 or 7.9 per cent) and Ipswich (up 13,100 or 7.1 per cent).
| Box 2.3 | Queensland’s ongoing strong labour market performance |
Queensland’s labour market has been exceptionally strong in the post-COVID-19 period.
As of April 2024, employment in Queensland was 366,900 persons (or 14.3 per cent) above the pre-COVID-19 level of March 2020, the strongest growth in absolute and percentage terms of all states and territories.
Queensland’s unemployment rate has been below 41⁄2 per cent for 29 consecutive months, the longest period in history apart from the 2006–2008 mining boom. In comparison, the unemployment rate has averaged 7 per cent since monthly estimates began in 1978.
Similarly, the youth (15-24 years) unemployment rate (year-average) has been below 10 per cent for 25 consecutive months, again the longest stretch in history apart from the mining boom.
The proportion of Queenslanders in employment is also near historic highs, at 64.3 per cent in April 2024, well above the pre-COVID-19 rate of 61.8 per cent and a rate only eclipsed during the mining boom. In comparison, the employment to population ratio has averaged 59.8 per cent since monthly estimates began in 1978.
54
Budget Strategy and Outlook 2024-25
| Chart 2.9 | Unemployment rate and employment to population ratio, Queensland1 |
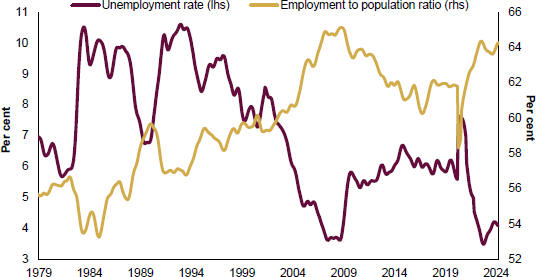
Note:
| 1. | Trend, monthly. Employment to population ratio is total employment as a proportion of the civilian population aged 15 years and older. |
Source: ABS Labour Force.
Labour demand in Queensland remains strong. The job vacancy rate (the number of job vacancies as a proportion of the labour force) was 2.3 per cent in March quarter 2024, well above the pre-COVID-19 rate of 1.4 per cent and above the pre-COVID-19 historic high of 1.9 per cent.
Wages growth has picked up to 4.6 per cent over the year to March quarter 2024, down slightly from 4.8 per cent over the year to December quarter 2023, the highest annual wages growth on record since the inception of the ABS data series.
The strength in Queensland’s labour market is reflected across all of Queensland’s regions.
All regions outside of South East Queensland had unemployment rates below 5 per cent in April 2024, which has only occurred on two other occasions (February 2023 and March 2024).
Darling Downs – Maranoa (2.1 per cent), Cairns (3.4 per cent), and Townsville (3.8 per cent) all had unemployment rates below 4 per cent, while Wide Bay recorded its lowest ever unemployment rate at 4.8 per cent.
Note: The ABS have released new modelled estimates of regional labour market data which are intended to replace the survey-based estimates over time. However, given the limited time series and demographic information (no age or sex estimates) currently available for the new modelled estimates, Queensland Treasury will continue to refer to the survey-based measures for regional labour market outcomes until the full suite of modelled estimates are available.
55
Budget Strategy and Outlook 2024-25
| 2.4.7 | Prices and wages |
In year-average terms, growth in Brisbane’s consumer price index (CPI) was 7.3 per cent in 2022–23, the highest year-average increase since 1989–90.
However, recent data show inflationary pressures subsiding over 2023, with annual growth in Brisbane’s CPI falling from the recent peak of 7.9 per cent in September quarter 2022 to 3.4 per cent in March quarter 2024.
The slowing in inflation evident in Brisbane over 2023 was primarily driven by goods prices, which saw annual growth fall from 10 per cent in September quarter 2022 to 2.8 per cent in March quarter 2024 (Chart 2.10).
While the easing of goods inflation has predominantly been driven by slower growth in the cost of new dwelling purchases by owner-occupiers and automotive fuel, the unwinding of global supply chain constraints has also seen price declines across some components, including furniture, household textiles and appliances, and computing equipment.
In contrast, while slowing in recent quarters, services inflation remains elevated and showing signs of persistence, consistent with inflation trends internationally. Annual growth in Brisbane services prices was 4.3 per cent in March quarter 2024, down from a peak of 7.6 per cent in March quarter 2023.
| Chart 2.10 | Brisbane’s consumer price index, by component1 |
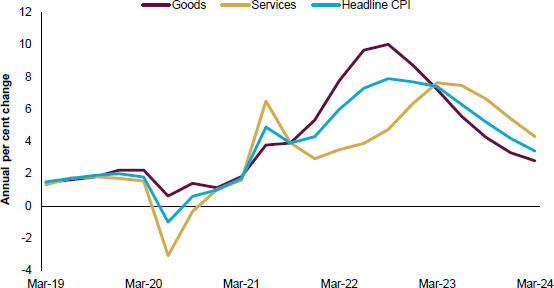
Note:
| 1. | Quarterly. |
Source: ABS Consumer Price Index.
56
Budget Strategy and Outlook 2024-25
Brisbane’s overall CPI growth is expected to fall substantially to 4 per cent in 2023–24. In 2024–25, the gradual loosening of the Queensland labour market is expected to see services inflation moderate.
When combined with an estimated 11⁄4 percentage points detraction from CPI growth due to the Queensland Government’s cost-of-living measures and the additional electricity and rent support from the Australian Government, this is forecast to see annual CPI growth fall to 2 per cent next year.
As previously stated, Queensland’s strong and tight labour market is providing upward pressure on wages growth. Annual growth in Queensland’s WPI was 4.6 per cent in March quarter 2024, down slightly from 4.8 per cent in December quarter 2023 which was the strongest growth since the inception of the ABS series.
In year-average terms, annual growth accelerated to 3.6 per cent in 2022–23, up from 2.5 per cent in 2021–22. Consistent with the expected easing in the labour market, Queensland’s WPI growth is expected to moderate from 43⁄4 per cent in 2023–24 to 33⁄4 per cent in 2024–25 and 31⁄2 per cent in 2025–26.
As such, the recent strengthening in wage growth at a time of falling inflation is expected to see the second consecutive year of real wages growth in Queensland in 2024–25. Ongoing real wage growth is expected across the remaining years of the forecast period.
| Box 2.4 | Impacts of the Queensland Government’s cost-of-living relief |
Understanding the Consumer Price Index
Inflation is an increase in the level of prices of the goods and services that households typically buy, with the most well-known indicator of inflation being the Consumer Price Index (CPI).
The CPI has been produced by the Australian Bureau of Statistics (ABS) since 1960 and is used by the RBA, government, and economists as the key indicator and tool in monitoring and evaluating inflation in the Australian economy.
The CPI provides a general measure of changes in prices of consumer goods and services purchased by Australian households. It measures prices in the eight state and territory capital cities, with the national index represented by a weighted average of these eight cities.
The CPI consists of 11 major expenditure groups. These main groups, and their relative weights within the Brisbane CPI basket, are shown in Chart 2.11.
57
Budget Strategy and Outlook 2024-25
| Chart 2.11 | Brisbane CPI basket weights by group1 |
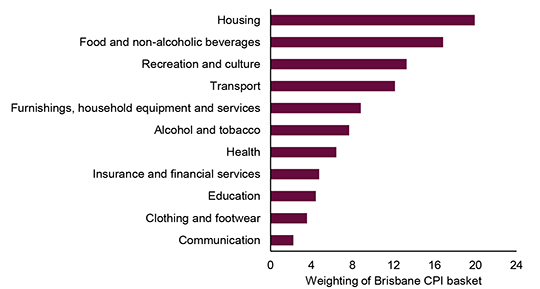
Note:
| 1. | Percentage contribution to the All groups CPI. Components may not add to 100 due to rounding. |
Source: ABS Consumer Price Index.
Impact of cost-of-living relief measures on the CPI
Importantly, given the Housing (which includes energy costs) and Transport groups both account for significant portions of Brisbane household budgets (combined, around 32 per cent of the Brisbane CPI basket of goods and services), the Queensland government’s cost-of-living relief measures will impact significantly on these two key components of the CPI.
The Queensland Government is delivering significant new and expanded measures in 2024–25 to support Queenslanders in tackling cost-of-living challenges. Some of the key elements of this initiative that directly impact measured inflation include:
| • | $1,300 electricity bill rebates for all Queensland households in 2024–25, consisting of an upfront $1,000 Cost of Living Rebate from the Queensland Government and a $300 rebate paid in quarterly instalments from the Australian Government |
| • | a 20 per cent reduction in registration fees for all light vehicles for a 12-month period, which is scheduled to start appearing on renewal notices sent to customers from 5 August 2024 |
| • | all public transport fares reduced to 50 cents from 5 August 2024 for six months as well as half-price tickets on Airtrain services. |
In addition, the Australian Government announced an increase in the maximum rate of Commonwealth Rent Assistance by 10 per cent.
58
Budget Strategy and Outlook 2024-25
Based on Queensland Treasury analysis, it is estimated the Queensland Government’s cost-of-living relief measures, when combined with the Australian Government measures, will reduce Brisbane’s headline CPI growth in 2024–25 by around 11⁄4 percentage-points, reducing CPI growth to 2 per cent in that year (Chart 2.12).
This comprises an estimated one percentage point reduction in annual CPI growth due to the electricity bill rebates substantially reducing housing-related costs and a further 1⁄4 percentage point reduction due to the combined impact of the Queensland Government’s transport-related cost-of-living relief measures.
| Chart 2.12 | Brisbane Headline Consumer Price Index Growth1 |

Note:
| 1. | Year-average. |
Sources: ABS Consumer Price Index and Queensland Treasury.
Comparison of Brisbane and national CPI outcomes
The Queensland Government’s substantial cost-of-living relief measures are expected to have a significant impact on CPI growth across 2024–25 and 2025–26.
Queensland Treasury forecast year-average CPI growth in Brisbane of 2 per cent in 2024–25 and 31⁄4 per cent in 2025–26.
In comparison, the 2024–25 Federal Budget forecasts national CPI growth of 23⁄4 per cent both through-the-year to June quarter 2025 and through-the-year to June quarter 2026.
59
Budget Strategy and Outlook 2024-25
However, across the 2-year period, these forecasts imply that CPI growth in Brisbane is expected to be cumulatively lower than national CPI growth, highlighting the benefits of the Queensland Government’s additional cost-of-living relief (Chart 2.13).
| Chart 2.13 | National and Brisbane CPI growth comparison, 2024–25 and 2025–261 |
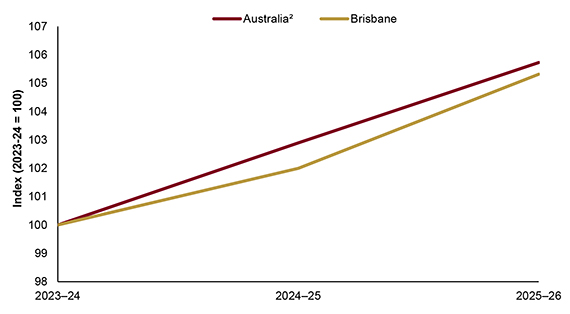
Note:
| 1. | Year-average. Index, 2023–24 = 100. |
| 2. | Australia year-average CPI growth has been interpolated using the Australian Government’s through-the-year to June quarter growth rates published in the 2024–25 Federal Budget. |
Sources: Queensland Treasury and Australian Government.
60
Budget Strategy and Outlook 2024-25
| 2.4.8 | Population |
A significant rebound in net overseas migration (Chart 2.14) led to Queensland’s overall year-average population growth accelerating to 2.4 per cent in 2022–23, the strongest rate of growth since 2008–09. In absolute terms, this represented 127,900 additional Queenslanders in 2022–23, the largest year-average increase in the number of people on record.
This followed a period in which COVID-19-related international border restrictions slowed population growth to only 1.0 per cent in 2020–21 before a surge in net interstate migration supported growth of 1.6 per cent in 2021–22.
Latest data show overseas arrivals have surged to be well-above pre-COVID-19 levels after the border restrictions were unwound in early 2022, but the level of departures is still lagging as there are fewer recently arrived temporary migrants who are due to leave.
Consequently, in contrast to the net outflow generally experienced during the pandemic, net overseas migration to Queensland has risen to 88,000 persons in the year to September quarter 2023, the largest annual increase on record.
The combination of rebounding arrivals and lagging departures is expected to provide near-term support for net overseas migration. In addition, the prevailing tight labour market conditions are encouraging local firms to seek skilled overseas workers to meet labour demand that cannot be met locally.
However, beyond the short term, flows of net overseas migration to Queensland are forecast to normalise, reflecting the likely impacts of the recent changes as part of the Australian Government’s migration strategy.
At 134,700 persons, Queensland’s net interstate migration since the onset of COVID-19 (i.e. June quarter 2020) has been the highest in Australia.
While this reflected Queensland’s relatively better COVID-19 health outcomes, along with strong labour market conditions and relative housing affordability, this is also consistent with the long-term trend of Queensland being a substantial net recipient of interstate migrants, particularly from New South Wales and Victoria.
Net interstate migration to Queensland has continued to normalise during the past few quarters and is expected to stabilise around pre-COVID-19 levels going forward.
Queensland’s birth rate picked up particularly during the second year of the pandemic. However, with tighter financial conditions having impacted household budgets, the increase in births seen during the COVID-19-period is generally expected to return to the longer-term downward trend seen prior to the pandemic.
Overall, the population increase attributed to natural increase is forecast to broadly return to pre-COVID-19 trends.
Reflecting the combination of these trends, Queensland’s resident population is forecast to grow by 21⁄2 per cent in 2023–24, supported by elevated net overseas migration, before moderating to average around 11⁄2 per cent growth per annum in the following 2 years.
61
Budget Strategy and Outlook 2024-25
| Chart 2.14 | Queensland’s population growth, by component1 |
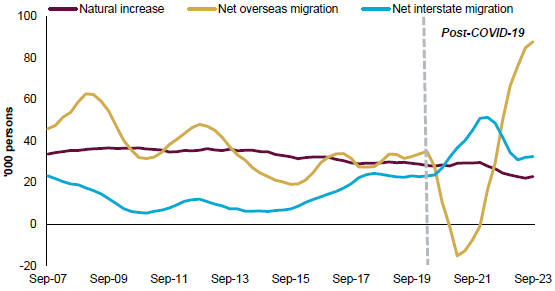
Note:
| 1. | Four-quarter rolling sum. The dotted vertical line represents March quarter 2020. |
Source: ABS National, State and Territory population.
| Box 2.5 | Population growth trends |
The Queensland Government Statisticians Office (QGSO) provides long-term population projections for the Queensland Government, based on underlying long-term demographic trends, with a major update typically occurring following a Census. These longer-term projections complement and are informed by annual Budget population forecasts which are more frequently refined with available data and incorporate short-term cyclical fluctuations and shocks. These forecasts published in the State Budget are the key considerations in determining Government investment in services within the budget cycle.
However, the COVID-19 pandemic drove divergent trends in key components of population growth, both nationally and in Queensland, across the period during and following the pandemic, which has significantly impacted the accuracy of budget population forecasts.
In particular, the recent stronger than expected increase in national net overseas migration, has resulted in volatility in the key components of population growth and stronger than expected overall population growth in 2022–23 and 2023–24.
To understand the factors driving recent trends and the outlook for population growth in Queensland, it is necessary to examine each of the 3 components of population growth (net
62
Budget Strategy and Outlook 2024-25
interstate migration, net overseas migration, and natural increase), including in the context of the Australian Government’s population forecasts and migration policy settings.
Net interstate migration
Around the same period that COVID-19 pandemic related international border closures significantly reduced the flow of overseas migrants, Queensland experienced one of the strongest surges in net interstate migration on record.
Between June quarter 2020 and the latest data up to September quarter 2023, net interstate migration to Queensland totalled 134,700 persons, which is more than 3 times higher than the next highest recorded over that period, by Western Australia at 38,500.
This was also the largest absolute increase in net interstate migration over a similar (14 quarter) period since 1996.
In comparison, over the same period, New South Wales and Victoria recorded net outflows of migrants to other states of 118,700 and 55,900 respectively.
A range of factors supported a strong increase in the flow of migrants from interstate during the initial stages of the pandemic. Queensland’s COVID-19-health outcomes were favourable compared with the major southern states, while the state also enjoyed relatively more affordable housing and stronger jobs growth.
More recently, net interstate migration to Queensland has largely returned to pre-COVID-19 trends. Going forward, the flow of migrants from interstate is expected to stabilise at around pre-COVID-19 levels but, consistent with longer-term trends, Queensland is still forecast to be a major net recipient of people moving from other states.
According to Australian Government forecasts published in the 2024–25 Federal Budget, in net terms, 110,900 people are expected to move from interstate to Queensland over the 5 years to 2027–28.
Net overseas migration
The unwinding of overseas border restrictions in early-2022 has led to net overseas migration again becoming the main driver of overall population growth in Queensland.
However, compared with historical outcomes and previous expectations, the extent to which overseas migration has impacted overall population growth has been exacerbated by the strong growth in national overseas migration.
While overseas arrivals to Queensland have rebounded to be well-above pre-COVID-19 levels, the level of departures (i.e. people leaving Queensland to move overseas) is still lagging (Chart 2.15). This reflects in part there being fewer recently arrived temporary overseas migrants, such as students, who are due to leave.
Between March quarter 2022, when the international border re-opened, and September quarter 2023 (latest data available), overseas arrivals to Queensland totalled 207,800, while overseas departures remained low at only 71,300 persons.
Consequently, in contrast to the net outflow of overseas migrants recorded during the pandemic, net overseas migration has contributed 136,500 persons to the state’s population over the 7 quarters to September quarter 2023.
This was the largest absolute increase in net overseas migration over a similar (7 quarter) period since the current data series commenced in June quarter 1981.
63
Budget Strategy and Outlook 2024-25
This imbalance between arrivals and departures is expected to persist in the near term and continue to support overall population growth. However, beyond the short term, flows of net overseas migration to Queensland are forecast to normalise, partially reflecting the likely impacts of recent changes made as part of the Australian Government’s migration strategy as outlined in the 2024–25 Federal Budget.
According to Australian Government forecasts published in the 2024–25 Federal Budget, net overseas migration to Queensland is forecast to moderate throughout the forward estimates period, from an elevated 61,500 persons in 2023–24 to 31,800 in 2025–26 and 28,600 in 2027–28.
| Chart 2.15 | Net overseas migration components, Queensland1 |
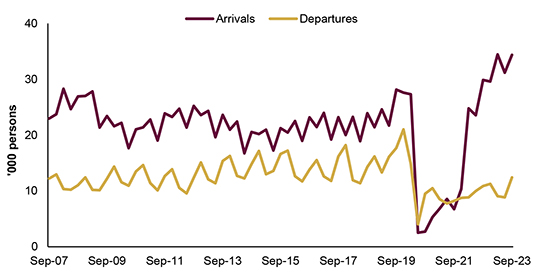
Note:
| 1. | Original, quarterly. |
Source: ABS National, State and Territory population.
Natural increase
The second year of the COVID-19 pandemic (i.e. 2021) saw a spike in Queensland’s birth rate, broadly consistent with trends observed across other major states. However, these trends have been normalising recently, and the number of births in Queensland is generally expected to return to the longer-term downward trend seen prior to the pandemic.
Overall, the population increase attributed to natural increase is forecast to broadly return to pre-COVID-19 trends.
National drivers of recent population growth and comparison to previous forecasts
With the recovery in overseas departures continuing to lag the significant increase in overseas arrivals, the stronger than expected growth in net overseas migration has resulted in Queensland’s overall population growth in 2022–23 and 2023–24 being revised upward materially since release of the 2023–24 Queensland Budget in June 2023.
64
Budget Strategy and Outlook 2024-25
In year-average terms, Queensland’s total resident population is now expected to grow by 21⁄2 per cent in 2023–24, upwardly revised from the 2 per cent growth forecast in the 2023–24 Budget Update, which already reflected an upward revision to the 13⁄4 per cent growth forecast in the 2023–24 Queensland Budget.
This strength in net overseas migration and overall population growth reflects national trends, with the 2024–25 Federal Budget indicating that recent levels of national net overseas immigration to Australia had been stronger than expected.
National net overseas migration was revised up by 207,800 across the two years ending June 2024, compared with the Australian Government forecasts 12 months earlier in the 2023–24 Federal Budget.
This higher than expected increase in national net overseas migration has contributed significantly to the post-COVID-19 phenomenon of stronger than forecast overall population growth.
Following the COVID-19 pandemic, there has been a clear surge in population across 2021–22 and 2022–23, with this trend expected to continue in 2023–24, with much of the more recent strength reflecting the unprecedented increase in national net overseas migration over the last 2 years, largely due to departures significantly lagging overseas arrivals.
The recent nature of this population growth is highlighted in Chart 2.16 below, which compares population growth outcomes over the past decade with the relevant Queensland Budget forecast published in each previous year.
Based on these comparisons, this indicates that cumulatively, across the three years to 2023–24, Queensland’s population growth is estimated to have exceeded forecasts by a total of 135,500 persons.
The Australian Government also made significant upward revisions in the 2024–25 Federal Budget to forecasts for Queensland’s annual population growth over the year to 30 June 2024.
However, importantly, partially reflecting changes to migration policy settings, the latest Federal Budget forecasts imply a reduction to national net overseas migration over 160,000 persons across the 5 years to 2027–28.
Beyond 2023–24, population growth in Queensland is forecast to ease to around 11⁄4 to 11⁄2 per cent per annum across the remainder of the forward estimates period. In comparison, Queensland’s population grew by an average of 1.7 per cent per annum in the decade prior to the COVID-19 pandemic.
Year-average growth is then expected to fall to 11⁄4 per cent in both 2026–27 and 2027–28. The lower growth expected in later years of the forecast period largely reflects the likely impacts on net overseas migration from the recent changes to the Australian Government’s migration strategy.
The easing profile in overall population growth across the forward estimates also reflect a stabilisation in net interstate migration around pre-COVID-19 levels and the return of the natural increase component towards the trend seen prior to the pandemic.
65
Budget Strategy and Outlook 2024-25
This outlook is consistent with the forecast growth profile for national population growth, which is forecast to fall from a peak of 2.4 per cent over the year to June quarter 2023 to 1.3 per cent by June quarter 2028.
This softening in Queensland’s population growth beyond 2023–24 is also in line with the outlook for Queensland published in the 2024–25 Federal Budget, where population growth was expected to moderate from 21⁄4 over the year to June 2024 to 11⁄2 per cent by June 2026 and then ease further to 11⁄4 per cent by June 2028.
| Chart 2.16 | Queensland population, Actual less Budget forecasts by iteration1,2 |
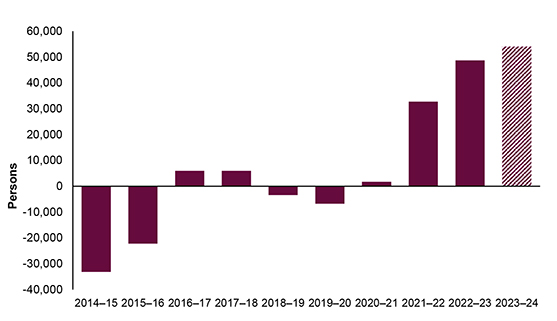
Note:
| 1. | Year-average. Persons. |
| 2. | There is only one quarter (September quarter 2023) of actual data currently published by the ABS for 2023–24. Therefore, 2023–24 in this chart represents Treasury’s current updated forecast less the level implied from the growth published in the 2023–24 Budget. |
Sources: ABS National, State and Territory population and various Queensland Budgets.
| 2.5 | Risks to the outlook |
Global geopolitical tensions remain a key risk to the economic outlook. This includes the ongoing war in Ukraine as well as the ongoing risk of an escalation in the conflict in the Middle East, which could impact on oil prices as well as threaten global trade routes.
With expectations that most central banks are close to the peak in the interest rate cycle, and that an easing of monetary policy may occur over the next year, concerns over a hard landing for the
66
Budget Strategy and Outlook 2024-25
international economy have eased. The key exception is in China where concerns remain about the potential for property market disruptions to impact China’s economy more widely.
Domestically, the risks of a hard landing have also lessened as interest rates are expected to have peaked.
However, both domestically and locally, there is a risk that inflation may be more persistent than expected, which would delay any monetary policy easing, potentially reducing economic growth.
Global supply chain disruptions have generally eased, but skilled labour supply shortages remain a problem, especially in the construction industry.
While the Australian Government’s immigration reforms are expected to help return population growth to historic norms, higher than expected population growth, outside of that required to address skill shortages, could increase demand for housing, government services and infrastructure.
Combined with the ongoing shortages of skilled labour, this poses risks in terms of the capacity of the construction industry to meet the expected demand for housing, business, and public sector investment.
67
Budget Strategy and Outlook 2024-25
| Table 2.3 | Queensland economic forecasts1 |
| Actuals 2022–23 | 2023–24 | Forecasts 2024–25 | 2025–26 | |||||||||||||
Economic output2 | ||||||||||||||||
Household consumption | 3.7 | 1 | 2 | 21⁄2 | ||||||||||||
Dwelling investment | -5.5 | -21⁄2 | 21⁄4 | 1⁄4 | ||||||||||||
New and used | 1.1 | 23⁄4 | 71⁄4 | 3⁄4 | ||||||||||||
Alterations and additions | -12.3 | -9 | -4 | -1⁄2 | ||||||||||||
Business investment | 6.7 | 3 | 13⁄4 | 21⁄2 | ||||||||||||
Non–dwelling construction | 5.6 | 31⁄4 | -11⁄2 | 11⁄2 | ||||||||||||
Machinery and equipment | 5.9 | 2 | 31⁄2 | 13⁄4 | ||||||||||||
Private final demand | 2.7 | 1 | 2 | 21⁄4 | ||||||||||||
Public final demand | 4.8 | 51⁄2 | 51⁄2 | 4 | ||||||||||||
State Final Demand | 3.3 | 21⁄2 | 31⁄4 | 23⁄4 | ||||||||||||
Overseas exports3 | -1.0 | 101⁄2 | 23⁄4 | 11⁄2 | ||||||||||||
Overseas imports3 | 15.8 | 71⁄2 | 13⁄4 | 51⁄2 | ||||||||||||
Gross state product | 2.3 | 3 | 3 | 21⁄2 | ||||||||||||
Employment | 3.7 | 23⁄4 | 11⁄2 | 1 | ||||||||||||
Unemployment rate4 | 3.7 | 41⁄4 | 41⁄2 | 43⁄4 | ||||||||||||
Inflation5 | 7.3 | 4 | 2 | 31⁄4 | ||||||||||||
Wage Price Index | 3.6 | 43⁄4 | 33⁄4 | 31⁄2 | ||||||||||||
Population | 2.4 | 21⁄2 | 11⁄2 | 11⁄2 | ||||||||||||
Notes:
| 1. | Unless otherwise stated, all figures are annual percentage changes. |
| 2. | CVM, 2021–22 reference year. The comparable nominal GSP growth rates are 10.9 per cent in 2022–23, 31⁄4 per cent in 2023–24, 41⁄4 per cent in 2024–25 and 33⁄4 per cent in 2025–26. |
| 3. | Includes goods and services. |
| 4. | Per cent, year-average. |
| 5. | Brisbane, per cent, year-average. |
Sources: ABS Annual State Accounts, Australian National Accounts, Balance of Payments and International Investment Position, National, State and Territory Population, Labour Force, Wage Price Index, Consumer Price Index and Queensland Treasury.
68
Budget Strategy and Outlook 2024-25
| 3 | Fiscal strategy and outlook |
Features
| • | The Queensland Government is deploying its fiscal capacity to support Queenslanders with additional spending measures that strike the right balance between providing strong responses to immediate, but temporary challenges and delivering on long-lived transformational recurrent and capital spending programs. |
| • | In 2024–25, the Queensland Government will provide record cost-of-living support and continue to progress delivery of the Big Build investment in economic and social infrastructure to strategically position the state to maintain a strong and diverse economy into the future and meet the needs of a growing population. |
| • | The Queensland Government is also increasing infrastructure and service investment to respond to record demand arising from stronger than expected population growth. |
| • | An operating surplus of $564 million is expected in 2023–24, compared to the $2.182 billion deficit forecast in the 2023–24 Budget. This is being delivered through careful management of revenue improvements, some of which has been prioritised to fund the government’s cost-of-living relief measures. |
| • | The 2023–24 estimated actual represents the third consecutive operating surplus of this term of Government and follows a record surplus of $13.9 billion in 2022–23. |
| • | The net operating balance profile across the period from 2023–24 to 2025–26 reflects the interaction of a number of years where annual revenue growth is fairly flat combined with a temporary elevation in cost-of-living support, and additional support for priority services. |
| • | In 2024–25, a deficit of $2.631 billion is forecast, compared to a surplus of $135 million in the 2023–24 Budget. The change reflects a very significant response from government to prioritise the provision of elevated cost-of-living support when the community most needs it, as well as boosting health, housing, and community safety measures in response to strong demand arising from stronger than expected population growth. |
| • | From 2025–26, as temporary relief measures are wound back, Queensland’s net operating position is expected to improve. Compared to 2024–25, the deficit improves to a forecast $515 million in 2025–26. Surpluses of $0.9 billion and $2.0 billion are then forecast for 2026–27 and 2027–28 as revenue growth returns and expenses are managed within available revenues. |
| • | The recovery of the net operating position is also underpinned by a targeted $3 billion savings plan over 4 years to 2027–28. |
| • | The 2024–25 Budget increases investment in the capital program to support transformative infrastructure investments boosting the health system capacity, decarbonising the state’s energy system, preparing for the 2032 Olympic and Paralympic Games, building homes for Queenslanders, and delivering major transport infrastructure investment such as Direct Sunshine Coast Rail. |
69
Budget Strategy and Outlook 2024-25
| • | The total capital program is now projected to be $107.3 billion over the 4 years to 2027–28 compared to the projected $96.2 billion over the 4 years to 2026–27 as at the 2023–24 Budget Update. |
| • | The capital program is expected to peak in 2025–26 at $29.4 billion before moderating to $23.7 billion by 2027–28, a 19 per cent reduction over that period. The moderation reflects several factors, but as population growth returns to normal, there is a greater degree of flexibility with medium term capital program scheduling given the spending profile of significant programs such as the Hospital Capacity Expansion Program, the completion of large projects such as Cross River Rail and the decline in capital works being funded under the disaster recovery arrangements. The capital spend in 2025–26 also reflects the delivery schedule of early phase energy projects as part of the longer-term plan for decarbonisation of the energy system. |
| • | The increase in the 4-year capital program means the government’s debt profile has shifted up since the 2023–24 Budget Update. General government borrowings are now expected to reach around $103.2 billion in 2026–27, which is $6.5 billion higher than in 2023–24 Budget Update. However, as the peak in capital spending in 2025–26 passes the General Government’s debt burden trajectory moderates. |
| • | Queensland continues to be well positioned to meet its recurrent and capital spending objectives. The projected net debt to revenue metric for 2023–24 has fallen materially over recent budgets. Queensland’s 2024–25 estimated net debt to revenue ratio of 31 per cent compares favourably to its peers at 88 per cent for New South Wales and 163 per cent for Victoria. |
| 3.1 | Fiscal outlook |
The government’s fiscal strategy continues to balance responding to immediate challenges, such as assisting households to manage cost-of-living pressures and responding to demand arising from stronger than expected population growth with delivering long-term transformational recurrent and capital spending programs within fiscally sustainable parameters.
A major factor in framing the 2024–25 Budget, which has also been apparent in the previous two budgets, has been managing significant revenue volatility. Exceptional revenue growth in recent years was primarily driven by increased royalties, due to the very high global prices being received by Queensland’s coal producers over the period from late 2021 to late 2023, combined with the impact of the new progressive coal royalty tiers introduced in the 2022–23 Budget. As expected, these temporarily high commodity prices have since fallen substantially, and will likely continue to decline to align more with historical levels across 2024–25 and 2025–26.
The expected decline in royalties is expected to outweigh strong near-term growth in taxation revenue. Total key revenues (taxation, GST and royalties) decline materially in 2023–24 and again in 2024–25 before remaining flat in 2025–26. This is the inevitable adjustment from the unprecedented upside in coal royalties enjoyed in 2021–22 and 2022–23 that delivered record surpluses. While a return to solid revenue growth is expected from 2026–27, total key revenues are not forecast to exceed 2022–23 levels until 2027–28.
70
Budget Strategy and Outlook 2024-25
Near-term challenges with the revenue outlook occur at a time when the government is committed to additional and critical limited-life recurrent spending programs focussed on helping households manage temporary cost-of-living impacts, easing current housing pressures, and responding to ongoing service demands arising from stronger than expected population growth.
In 2023–24, the net operating position has improved from a deficit of $138 million forecast in the 2023–24 Budget Update to a surplus of $564 million. This estimated outcome is the result of careful management of revenue improvements, including royalties and taxes, such that a surplus is expected to be delivered at the same time as providing an additional $2.267 billion in electricity bill support for Queenslanders. The 2023–24 estimated actual represents the third consecutive operating surplus and follows a record surplus of $13.9 billion in 2022–23.
The Queensland Government is providing an additional $3.739 billion in cost-of-living support in 2024–25 to help Queenslanders tackle cost-of-living challenges. Relief is headlined by additional electricity bill rebates, slashing public transport fares to a flat fare of 50 cents per trip for six months as well as a 20 per cent reduction in vehicle registration costs for all light vehicles for a 12-month period. The cost of new spending measures as well as a boost for health growth funding has exceeded upwards revisions to royalties and tax in 2024–25, resulting in a $2.631 billion operating deficit in 2024–25.
From 2025–26, as temporary relief measures are wound back, Queensland’s net operating position is expected to improve rapidly. An improved deficit of $515 million is forecast in 2025–26 compared to 2024–25 as temporary relief measures end. Substantial surpluses of $887 million and $2.027 billion are forecast for 2026–27 and 2027–28 as demand backlogs are cleared, population pressures ease and expenses are managed within available revenue.
A targeted savings plan will be applied to ensure the state’s limited resources are being managed responsibly and to ensure the state meets its Charter of Fiscal Responsibility. Savings of $3 billion over 4 years to 2027–28 will be delivered.
The 2024–25 Budget also sees further increases in the cost of the capital program compared to recent budget updates. The critical objectives are unchanged – responding to priority areas and strategically positioning Queensland to maintain a strong and diverse economy into the future and meet the needs of a growing population.
The capital program continues to include key transformative infrastructure investment such as boosting health system capacity, decarbonisation of the state’s energy system and preparing for the Brisbane 2032 Olympic and Paralympic Games. The total capital program is now projected to be $107.3 billion over the 4 years to 2027–28. The current program is expected to peak in 2025–26 at $29.4 billion before moderating to $23.7 billion by 2027–28, representing a 19 per cent reduction over that period.
The tapering of the expected annual levels of capital spending across the forward estimates reflects multiple factors including population growth and the spending profile of significant programs such as the Hospital Capacity Expansion Program, the completion of large projects such as Cross River Rail and the decline in capital works being funded under the disaster recovery arrangements as projects are finished. The capital spend in 2025–26 also reflects the delivery schedule of early phase energy projects as part of the longer-term plan for decarbonisation of the energy system.
71
Budget Strategy and Outlook 2024-25
The further increase in the 4 year capital program means the government’s debt profile has shifted up since the 2023–24 Budget Update. General government borrowing is now expected to reach around $103.2 billion in 2026–27, which is $6.5 billion higher than in 2023–24 Budget Update. However, with the peak of capital spending occurring in 2025–26 and tapering down by 2027–28, there is a very clear moderation in the General Government Sector debt burden trajectory.
| 3.1.1 | Fiscal principles |
The government’s medium-term fiscal strategy is guided by the Charter of Fiscal Responsibility (the Charter) with fiscal principles and objective measures to support the restoration of fiscal buffers. An update of progress towards achievement of medium-term goals is outlined below.
Fiscal Principle 1 – Stabilise the General Government Sector net debt to revenue ratio at sustainable levels in the medium term, and target reductions in the net debt to revenue ratio in the long term.
Stabilising debt at a sustainable level is an essential pre-condition to maintaining capacity to invest in public infrastructure and to respond effectively to future external shocks.
Since the introduction of the Charter in the 2021–22 Budget, Queensland’s net debt to revenue outcome has continually outperformed the budget forecasts. The 2022–23 net debt to revenue ratio outcome of 3 per cent was a significant reduction from the 51 and 27 per cent estimates in the 2021–22 and 2022–23 Budgets respectively.
In comparative terms, the projected net debt to revenue metric for the 2023–24 financial year has fallen materially over recent budgets. As reflected in Chart 3.1, the projected metric for the 2023–24 financial year has fallen from 77 per cent in the 2020–21 Budget to an estimated actual of 14 per cent in the 2024–25 Budget. This reflects prudent management of an extraordinary revenue uplift, particularly in 2021–22 and 2022–23, which was driven by higher royalties. These revenues have been used to substantially lower borrowing requirements in the near term, providing the capacity to then fund an expanded infrastructure program over time.
72
Budget Strategy and Outlook 2024-25
| Chart 3.1 | Time series of the 2023–24 projected net debt to revenue ratio |
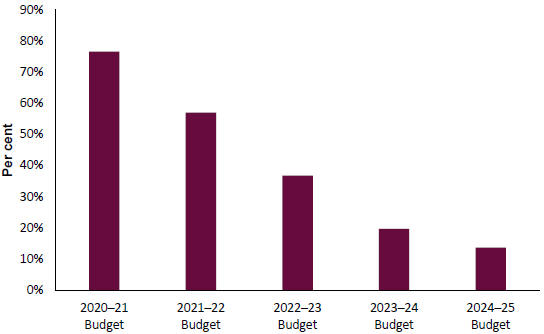
The net debt to revenue ratio is expected to remain broadly consistent with 2023–24 Budget Update forecasts across the forward estimates. In 2024–25, the ratio of 31 per cent is slightly improved from previous forecasts in the 2023–24 Budget and Budget Update.
The slight increases in the net debt to revenue ratio in 2025–26 and 2026–27 compared to the 2023–24 Budget are impacted by the temporary operating deficits in 2024–25 and 2025–26 as well as stepping up the capital program to invest in economic and social infrastructure to meet the needs of Queensland’s growing population and accelerate regional economic development.
Growth in the ratio is expected to slow appreciably as the capital program moderates from the peak expected in 2025–26, with the ratio reaching 63 per cent in 2027–28. The rate of increase in net debt slows in 2026–27 and more so in 2027–28. This is an important precursor to stabilising and then reducing this ratio.
Queensland’s 2024–25 estimated net debt to revenue ratio of 31 per cent compares favourably to its peers at 88 per cent for New South Wales (2023–24 Half-yearly Review) and 163 per cent for Victoria (2024–25 Budget). Relative to revenue, Queensland’s net debt forecast of 57 per cent in 2026–27 compares favourably to 97 per cent for New South Wales and 171 per cent for Victoria.
73
Budget Strategy and Outlook 2024-25
| Chart 3.2 | State comparison of General Government Sector net debt to revenue |
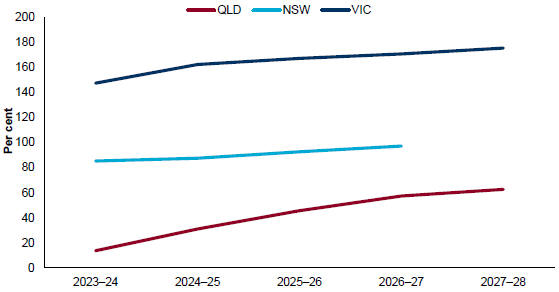
Fiscal Principle 2 – Ensure that average annual growth in General Government Sector expenditure in the medium term is below the average annual growth in General Government Sector revenue to deliver fiscally sustainable operating surpluses.
Maintaining a lower rate of expenses growth than revenue growth will in general support the achievement of an operating surplus and assist debt stabilisation. Revenue and expenses growth in the 2024–25 Budget is affected by near-term challenges such as stronger than expected population growth and cost-of-living relief on the expenses side, and royalty volatility on the revenue side. Over the 4 years to 2027–28, average annual revenue growth of 1.7 per cent is stronger than average expenses growth of 1.3 per cent.
Revenue growth over the forward estimates continues to reflect volatility underpinned by some temporary factors such as high commodity prices, which have fallen substantially since late 2023. As extraordinary and short-term high coal prices normalise, royalty revenue is expected to decline in 2024–25 to less than half of the 2022–23 level and remain at more moderate levels across the later years of the forecast period.
An adjusted measure removing royalties is included to better reflect underlying growth. Excluding royalties, average revenue growth is expected to be 4.0 per cent over the 4 years to 2027–28. Over the 5 years to 2027–28, average revenue growth excluding royalties of 4.5 per cent compares to average expenses growth of 4.2 per cent. This is a useful underlying comparison as it abstracts from both the volatility of royalty revenue and the very large cost-of-living energy rebates that are expensed in 2023–24.
Fiscal Principle 3 – Target continual improvements in net operating surpluses to ensure that, in the medium term, net cash flows from investments in non-financial assets (capital)
74
Budget Strategy and Outlook 2024-25
will be funded primarily from net cash inflows from operating activities. The capital program will focus on supporting a productive economy, jobs, and ensuring a pipeline of infrastructure that responds to population growth.
Capital investment is essential to support jobs, to maintain a strong and diverse economy into the future and to meet the needs of a growing population. The 2024–25 Budget’s capital program of $107.262 billion over the 4 years to 2027–28 includes a large component of unavoidable infrastructure that is required to respond to population growth as well as decarbonisation of the state’s energy system through the Queensland Energy and Jobs Plan.
Funding a large capital program primarily through operating cash surpluses rather than additional borrowings is key to stabilising net debt. However, volatility in revenue growth combined with the profile of capital expenditure, which is uneven by nature, provides a degree of volatility in the outcomes for Fiscal Principle 3 on an individual year basis.
Queensland’s 2022–23 record surplus enabled investments in non-financial assets to be more than fully funded by net cash inflows from operating activities. However, with the temporary surge in coal prices unwinding at the same time as cost-of-living support is provided and capital investment increases, the ratio is expected to fall to 35 per cent in 2023–24 and 13 per cent in 2024–25. The metric will trend up to 64 per cent by 2027–28 as revenue growth outpaces growth in expenses and the government’s capital program moderates.
| Chart 3.3 | Share of General Government Sector investments in non-financial assets funded from operating cash surpluses |
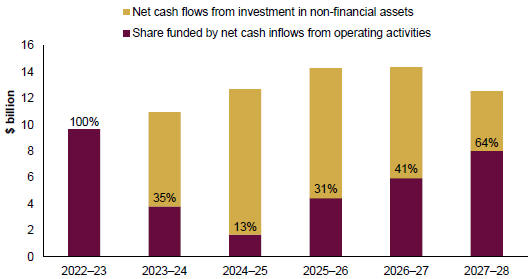
75
Budget Strategy and Outlook 2024-25
Fiscal Principle 4 – Maintain competitive taxation by ensuring that, on a per capita basis, Queensland has lower taxation than the average of other states.
Measurement of Queensland’s taxation against other jurisdictions provides a meaningful comparative indication of the state’s tax regime and policies.
Based on the latest available outcomes, Queensland’s taxation per capita continues to show the state’s competitive tax environment. Queenslanders paid $780 less tax than the average of other jurisdictions in 2022–23. On average, Queensland’s taxation per capita was $1,052 less than New South Wales’s and $1,061 less than Victoria’s.
This trend is expected to continue using the latest forecasts. The state’s taxation per capita of $4,410 in 2024–25 compares favourably to the average of other jurisdictions of $5,134 per capita. Chart 3.4 projects Queensland to maintain a highly competitive tax environment over the forward estimates.
| Chart 3.4 | Taxation per capita, Queensland and other states and territories |
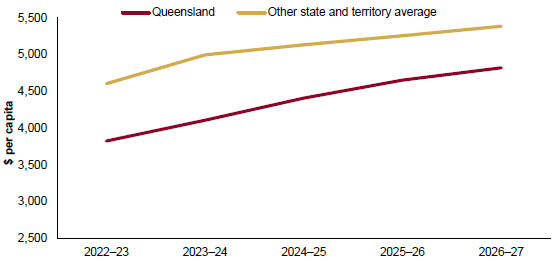
Fiscal Principle 5 – Target the full funding of long-term liabilities such as superannuation and workers’ compensation in accordance with actuarial advice.
The full funding of superannuation and other long-term liabilities is a long-standing Queensland Government priority and a key element of Queensland’s financial management.
The triennial actuarial investigation of the Defined Benefit Fund as at 30 June 2021 found it to be in a large surplus, which is expected to remain the case after allowing for suspending investment of defined benefit employer contributions from 2026–27. In accordance with established processes the next full actuarial investigation of the Defined Benefit Fund will be available in December 2024.
As at 30 June 2023, WorkCover Queensland was fully funded.
76
Budget Strategy and Outlook 2024-25
| 3.2 | Key fiscal aggregates |
The key aggregates for the 2024–25 Queensland Budget are outlined in Table 3.1.
| Table 3.1 | Key fiscal aggregates1 |
| 2022–23 Outcome $ million | 2023–24 Budget $ million | 2023–24 Est. Act. $ million | 2024–25 Budget $ million | 2025–26 Projection $ million | 2026–27 Projection $ million | 2027–28 Projection $ million | ||||||||||||||||||||||
Revenue | 89,810 | 82,079 | 89,059 | 88,107 | 88,717 | 90,670 | 95,332 | |||||||||||||||||||||
Expenses | 75,880 | 84,261 | 88,495 | 90,738 | 89,232 | 89,783 | 93,305 | |||||||||||||||||||||
Net operating balance | 13,930 | (2,182 | ) | 564 | (2,631 | ) | (515 | ) | 887 | 2,027 | ||||||||||||||||||
PNFA2 | 9,899 | 9,347 | 11,061 | 12,831 | 14,485 | 14,577 | 12,763 | |||||||||||||||||||||
Fiscal balance | 8,092 | (6,716 | ) | (5,717 | ) | (10,790 | ) | (9,547 | ) | (7,341 | ) | (4,054 | ) | |||||||||||||||
Borrowings3 | 53,726 | 65,479 | 61,958 | 77,118 | 91,507 | 103,221 | 111,383 | |||||||||||||||||||||
Net debt | 2,615 | 16,190 | 12,223 | 27,407 | 40,552 | 52,076 | 59,831 | |||||||||||||||||||||
Notes:
| 1. | Numbers may not add due to rounding. |
| 2. | PNFA: Purchases of non-financial assets. |
| 3. | Comprised of borrowing with QTC, leases and similar arrangements and securities and derivatives line items in the Balance Sheet. |
| 3.2.1 | Net operating balance |
Table 3.2 compares the General Government Sector net operating balance forecasts for the previous budget with the 2024–25 Budget forecasts.
| Table 3.2 | General Government Sector – net operating balance forecasts |
| 2023–24 $ million | 2024–25 $ million | 2025–26 $ million | 2026–27 $ million | 2027–28 $ million | ||||||||||||||||
2023–24 Budget | (2,182 | ) | 135 | 206 | 377 | — | ||||||||||||||
2023–24 Budget Update | (138 | ) | 122 | 91 | 621 | — | ||||||||||||||
2024–25 Budget | 564 | (2,631 | ) | (515 | ) | 887 | 2,027 | |||||||||||||
Since the 2023–24 Budget, the General Government Sector net operating balance has improved from a deficit of $2.182 billion to a surplus of $564 million. Stronger revenue, primarily driven by higher commodity prices, improved the 2023–24 outlook in the 2023–24 Budget Update to a deficit of $138 million.
Since then, improvements in royalties and taxation revenue have been directed towards providing $2.267 billion in electricity bill rebates for households and small businesses to assist with the cost of living, and improving the operating position.
77
Budget Strategy and Outlook 2024-25
In 2024–25, the net operating position temporarily moves to a deficit of $2.631 billion, compared to a surplus of $135 million in the 2023–24 Budget. This change is driven largely by additional measures, including further cost-of-living support, with reductions in motor vehicle registrations and public transport fares.
Health services receive a significant boost in 2024–25 to continue to meet the needs of Queensland’s growing population, and additional resourcing is being provided to support the delivery of a high performing state education system, ease housing pressures and respond to community safety priorities.
Revisions due to expense measures as well as downward revisions to net flows from government owned entities and Australian Government funding are only partially offset by upwards revisions to forecasts of royalties and land rents and taxation revenue.
The deficit is expected to reduce to $515 million in 2025–26 as temporary relief measures end and forecast savings from the Smarter Spending, Better Jobs Plan increase.
Substantial surpluses are forecast in 2026–27 and 2027–28 as revenue strengthens and expenses are managed within available revenue.
78
Budget Strategy and Outlook 2024-25
| Table 3.3 | Reconciliation of net operating balance, 2023–24 Budget Update to 2024–25 Budget1 |
| 2023–24 $ million | 2024–25 $ million | 2025–26 $ million | 2026–27 $ million | |||||||||||||
2023–24 Budget Update net operating balance | (138 | ) | 122 | 91 | 621 | |||||||||||
Taxation revisions2 | 460 | 1,379 | 1,321 | 1,339 | ||||||||||||
Royalty and land rent revisions | 1,381 | 2,128 | 563 | 382 | ||||||||||||
GST revisions | 185 | 287 | 40 | (57 | ) | |||||||||||
Revenue measures3 | (1 | ) | (384 | ) | 212 | 276 | ||||||||||
Expense measures3 | (3,640 | ) | (4,233 | ) | (2,803 | ) | (2,118 | ) | ||||||||
Savings | — | 300 | 750 | 1,000 | ||||||||||||
Natural disaster revisions (DRFA)4 | 224 | — | (376 | ) | (158 | ) | ||||||||||
Net flows from PNFC and PFC entities5 | 65 | (666 | ) | (314 | ) | (428 | ) | |||||||||
Australian Government funding revisions6 | 241 | (774 | ) | 329 | 198 | |||||||||||
Other parameter adjustments7 | 1,787 | (790 | ) | (328 | ) | (168 | ) | |||||||||
2024–25 Budget net operating balance | 564 | (2,631 | ) | (515 | ) | 887 | ||||||||||
Notes:
| 1. | Numbers may not add due to rounding. Numbers indicate the impact on the operating balance. A number in brackets indicates a negative impact on the operating balance. |
| 2. | Taxation revisions exclude impact of revenue measures contained in Budget Paper 4 (BP4). |
| 3. | Reflects the operating balance impact of government revenue and expense measures since the 2023–24 Budget Update (refer to BP4 Chapter 2 Budget Measures for details) except for Natural disasters and Transport Service Contract measures which are included elsewhere in the reconciliation, as per footnotes 4 and 5. |
| 4. | Net impact of Disaster Recovery Funding Arrangements. |
| 5. | Represents revisions to dividends and tax equivalent payments from, and community service obligations (CSOs) and Transport Service Contract (TSC) payments to, Public Non-financial Corporations and Public Financial Corporations, net of TSC expense measures. |
| 6. | Represents the net impact of funding provided by the Australian Government primarily for Specific Purpose Payments and National Partnership payments and excludes funding for disaster recovery expenses. |
| 7. | Refers to adjustments largely of a non-policy nature, primarily changes in interest paid on borrowings, depreciation, swaps, lapses and deferrals. |
Impact of disaster recovery on the net operating balance
Over the 2023–24 summer, parts of the state were impacted by severe weather events, which inflicted major flooding and storm damage on homes, businesses and infrastructure. This followed significant flood events in the 2021–22 and 2022–23 disaster seasons.
Table 3.4 details the impact of disaster expenses and Australian Government payments for Disaster Recovery Funding Arrangements (DRFA) on the net operating balance. Abstracting from disasters, the net operating balance is stronger in each year, and significantly on this basis, close to balance in 2025–26.
79
Budget Strategy and Outlook 2024-25
While disaster expenses are estimated to reach $5 billion over the 5 years to 2027–28, the majority is offset by $3.8 billion in disaster-related revenue. Including disaster capital expenditure, the combined cost of disasters over the period 2023–24 to 2027–28 is $6.7 billion compared to $4.1 billion in the 2023–24 Budget.
| Table 3.4 | Impact of disaster funding in the net operating balance1 |
| 2023–24 $ million | 2024–25 $ million | 2025–26 $ million | 2026–27 $ million | 2027–28 $ million | ||||||||||||||||
Net Operating Balance | 564 | (2,631 | ) | (515 | ) | 887 | 2,027 | |||||||||||||
less Disaster revenue | 1,399 | 1,347 | 874 | 176 | — | |||||||||||||||
add Disaster expenses | 1,620 | 1,551 | 1,301 | 411 | 158 | |||||||||||||||
Underlying Net Operating Balance | 785 | (2,427 | ) | (88 | ) | 1,122 | 2,185 | |||||||||||||
Disaster capital expenditure | 426 | 649 | 438 | 145 | — | |||||||||||||||
Notes:
| 1. | Numbers may not add due to rounding. |
| 3.2.2 | Revenue |
General Government Sector revenue is estimated to total $89.059 billion in 2023–24, $751 million lower than 2022–23, but $6.98 billion higher than estimated in the 2023–24 Budget. Most of this difference is because of higher 2023–24 coal royalty estimates compared to the 2023–24 Budget. Although commodity prices have fallen significantly and royalty revenue in 2023–24 will be 30 per cent lower than the peak in 2022–23, the adjustment has not been as rapid as expected in the 2023–24 Budget.
Primarily as a result of high coal and oil prices declining more slowly than expected, ongoing strength in property prices and activity and the exceptional performance of the state’s labour market, general government revenue is forecast to be $23.924 billion, or 7.2 per cent, higher than forecast in the 2023–24 Budget over the 4 years to 2026–27.
On an annual basis across the forward estimates, revenue is expected to decline slightly in 2024–25 before modest growth in 2025–26 that gathers momentum in later years. These movements are largely explained by the outlook for the key state revenue sources of taxation, GST and royalties.
Exceptional strength in royalty revenue in 2022–23 was temporary, with coal prices expected to continue adjusting to more sustainable levels. The decline in royalties in 2023–24 compared with 2022–23 more than offsets strength in taxation and GST revenue in 2023–24.
A further large decline in royalties of $4.366 billion is expected in 2024–25 as coal and oil prices continue to moderate, accompanied by a $934 million decline in GST revenue resulting from the Commonwealth Grants Commission’s recommendation that Queensland receive a smaller share of the GST pool in 2024–25. These declines in royalty and GST revenue are expected to be partially offset by increases in taxation revenue ($2.129 billion) and other Australian Government grants ($1.556 billion).
80
Budget Strategy and Outlook 2024-25
Revenue growth is forecast to remain relatively flat in 2025–26, as coal prices continue to moderate, and return to solid growth in 2026–27 and 2027–28, driven by growth in taxation revenue and GST, supported by the impacts of recent and ongoing population growth.
The 2024–25 Budget also includes revenue measures to provide cost-of-living relief for households and first home buyers. These are discussed in Chapter 4 which also provides more detail on revenue estimates.
| Chart 3.5 | Comparison of revenue forecasts |
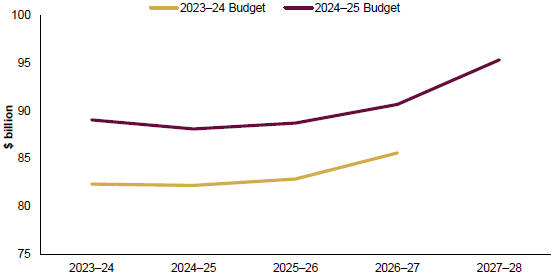
| 3.2.3 | Expenses |
Expenses in the 2024–25 Budget provide for additional limited-life recurrent programs focussed on alleviating cost-of-living impacts, easing current housing pressures, and responding to strong demand for government services arising from stronger than expected population growth.
General government expenses are 7.2 per cent higher than forecast in the 2023–24 Budget over the 4 years to 2026–27, primarily because of new spending measures to address community demand.
General Government Sector expenses are estimated to be $88.495 billion in 2023–24, which is $12.615 billion or about 16.6 per cent higher than 2022–23. The 2023–24 expenses are also $4.234 billion higher than estimated in the 2023–24 Budget.
A key driver of this increased spending is the delivery of significant cost-of-living relief for Queensland households and small businesses, which includes meeting the cost of both the 2023–24 and 2024–25 energy rebates in 2023–24.
81
Budget Strategy and Outlook 2024-25
As limited-life spending programs conclude, disaster-related expenses wind down and agency savings increase, expense growth moderates significantly.
It should be noted that as major funding agreements with the Australian Government relating to health and education are renegotiated in the next 12 months, it is expected that expense growth will become stronger, supported by additional funding from the Australian Government.
Average expense growth of 4.2 per cent over the 5 years to 2027–28 compares to average revenue growth of 4.5 per cent excluding the extraordinary impact of volatile royalty revenue.
As well as cost-of-living relief, other key new initiatives in the Budget include:
| • | an uplift to Queensland Health’s operating funding envelope of $4.393 billion to address emerging population growth and cost pressures, improve the flow of patients through hospitals and provide more timely access to care as well as boosting First Nations’ health and women’s health care |
| • | significant investments in education and training, and prevention and early support initiatives. This includes the $502 million Putting Queensland Kids First early support package to deliver stronger outcomes to support positive lift trajectories for Queensland children and families |
| • | committing an extra $1.28 billion over 5 years for the Community Safety Plan for Queensland. |
| • | $3.1 billion, including expenses and capital funding, towards Homes for Queenslanders, which responds to key housing pressures and represents a significant uplift on top of the already major investment into social and affordable housing. |
Further information on expense initiatives is provided in Budget Paper 4.
Salaries and wages are a large proportion of General Government Sector expenses. Increases in salaries and wages are negotiated through certified agreements. Outcomes reflect maintaining an effective public service through attraction and retention strategies offering competitive remuneration and employment conditions balanced with prudent management of growth in operating expenses.
The current bargaining cycle established certified agreements based on a public sector wages policy of 4 per cent headline wage increases in the first 2 years and 3 per cent in year 3 plus a Cost of Living Adjustment payment where inflation exceeds headline wage increases established in those certified agreements, capped at 3 per cent of base wages.
Smarter Spending, Better Jobs Plan
To enable delivery of new measures to address cost-of-living pressures and enhance service delivery, the Queensland Government is implementing the Smarter Spending, Better Jobs Plan to deliver savings of $3 billion across the next 4 years. These savings will ensure that the budget returns to surplus as economic pressures ease.
Savings have been incorporated into the budget aggregates. Queensland Treasury will chair a new Smarter Spending taskforce to guide agencies in implementation through the budget cycle.
While savings need to be broad based in application, agencies will be required to ensure savings are delivered in line with the below guidelines to ensure service delivery is not impacted.
82
Budget Strategy and Outlook 2024-25
Protect public sector jobs
Queensland Treasury will continue to ensure wage outcomes are fully funded for public servants across the sector in line with government wages policy, including for approved growth in employees. Agencies should seek savings in non-wage expenses, which typically represent over half of total government expenditure.
Reduce travel and advertising expenditure
Departments and agencies should reduce and phase down travel for meetings, which should be conducted by video or teleconference wherever possible.
No new advertising to be commenced from 1 August 2024, other than public safety and recruitment campaigns.
Reduce accommodation expenditure.
Departments and agencies should ensure any approved growth in staffing is managed within the existing accommodation footprint. Departments should explore greater use of flexible work arrangements to manage growth and reduce the need for office accommodation and explore opportunities for greater regionalisation.
Reduce the use of external consultants, contractors and labour hire
Agencies should reduce reliance of contractors and external consultants, in line with Coaldrake Review report recommendations. Queensland Treasury Corporation (QTC) will be given a revised mandate to work with agencies to build public sector capability, and reduce external consultant use, including through the direct provision of independent reviews and evaluations, commercial and strategic advisory, financial and risk analysis, and modelling.
Maximise the state’s financial and liquidity position
The state will continue to fully fund its defined benefit liability. Given the defined benefit fund is expected to remain in a strong funding surplus, the state will suspend contributions from 2026–27 to maximise liquidity and support the credit rating. The position will be reviewed annually to meet the states legislated requirement to fully fund the states defined benefit liability.
Since 1 July 2022, the state has also increased funding superannuation based on ordinary times earnings. That is an increase of over $980 million to 2025–26 to provide for shift allowances, weekend penalties and all forms of leave.
Funding decisions in budget process
Funding submissions will only be accepted by Government as part of annual budget processes, unless approved by the Chair of CBRC.
| 3.2.4 | Investment |
Queensland’s record level of investment in economic and social infrastructure aims to respond to unprecedented population growth, and strategically position Queensland to maintain a strong and diverse economy into the future.
83
Budget Strategy and Outlook 2024-25
The capital program underpins the development of the state, creation of new industries, delivery of more jobs, and building better and stronger communities and regions.
The capital program includes major components related to addressing record demand for health services, decarbonising the state’s energy system and preparing for the Brisbane 2032 Olympic and Paralympic Games.
Queensland’s total capital program has increased from an estimated $88.729 billion over the 4 years to 2026–27 in the 2023–24 Budget, to $107.262 billion over the 4 years to 2027–28.
Key areas of focus in the forward estimates period and over the medium term include:
| • | the Queensland Health Capacity Expansion Program to deliver around 2,200 additional overnight beds at 15 facilities across Queensland |
| • | Stage 1 of the Direct Sunshine Coast Rail Line |
| • | M1 Pacific Motorway upgrades, Coomera Connector and major upgrades to the Bruce Highway |
| • | new school infrastructure through the Building Future Schools Program providing new and upgraded learning environments |
| • | Queensland Energy and Jobs Plan including renewable energy projects, new pumped hydro infrastructure and CopperString 2032 |
| • | major water infrastructure projects for dam improvements and future water security |
| • | infrastructure investment for successful hosting of the Brisbane 2032 Olympic and Paralympic Games |
Further information about the government’s capital program is provided in the Capital Statement (Budget Paper 3).
| 3.2.5 | Environmental, Social and Governance |
Establishing and maintaining strong ESG credentials is central to driving the future competitiveness of Queensland business and industry.
The Queensland Government has embedded sustainability considerations into policy settings to promote sustainable economic growth and development for better communities now and into the future. At the centre of this are Queensland’s sustainability priorities (Figure 3.1).
84
Budget Strategy and Outlook 2024-25
| Figure 3.1 | Queensland’s Sustainability Priorities |
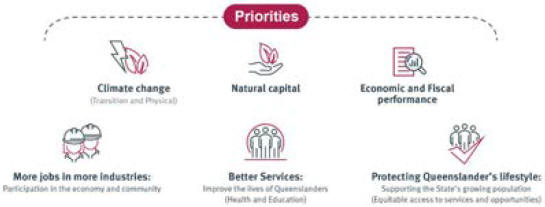
Sound financial and risk management requires the government to recognise and manage all issues that can materially impact the Queensland economy and the government’s fiscal position. Queensland is taking positive action by implementing policy measures to manage material sustainability risks.
ESG Risk Factor | Policy initiatives taken to - | |
| Climate Change | Move to a low carbon future, by lowering Greenhouse Gas emissions. Address the physical impacts arising from climate change by embedding adaption and resilience | |
| Natural Capital | Manage the balance of resources used between industry, the community and safeguarding the natural environment. This includes surface and underground water management, biosecurity, aquaculture, forestry management and environmental protection. | |
| Social | Support an educated, healthy, and skilled community, through education, health services, social welfare, public order, diversity and opportunity, cyber security and safety. | |
Governance (Economic and Fiscal) | Provide robust frameworks that support Ministers and accountable officers to provide oversight and discharge their obligations. Strong economic and fiscal management is fundamental to achieving government’s objectives and good governance. | |
Strong economic outcomes provide government with the fiscal capacity to take positive action on its sustainability priorities and continue targeted investment in climate change adaptation, social services (including health and education) and reforms that strengthen communities and support vulnerable Queenslanders.
Positive action includes:
| • | Queensland’s Economic Strategy to drive economic growth into the future |
| • | maximising opportunities and upside for Queensland’s economy and industries – based on Queensland’s competitive and comparative advantages |
85
Budget Strategy and Outlook 2024-25
| • | supporting innovation and new technology through Low Emissions Investment Partnerships |
| • | support for climate exposed industries via provision of assistance programs and options for funding assistance or support programs for impacted industries, for our workers and communities |
| • | The creation of a skilled, job ready workforce to deliver Queensland’s clean energy transformation via the implementation of Queensland’s Clean Energy Workforce Roadmap |
| • | The roll out of the Queensland Energy and Jobs Plan (QEJP) which outlines the pathway to transform the State’s energy system to deliver a clean, reliable and affordable power for generation. |
Queensland’s economy is more emissions intensive than the rest of Australia due to its economic structure. Despite this, Queensland is successfully reducing emissions while still growing the economy.
The latest emissions data from the Australian Government released in April 2024, shows Queensland’s emissions in 2022 were 35 per cent lower than the 2005 level. This means Queensland has not just met its 2030 emissions reduction target of 30 per cent 8 years earlier but has also overachieved by an additional 5 percentage points.
Queensland has been the largest contributor to Australia’s emissions reduction. Between 2005 and 2022, Queensland was able to reduce its emissions by 68 million tonnes, with the second largest decline coming from New South Wales (42 million tonnes), followed by Victoria (39 million tonnes) and South Australia (21 million tonnes).
Figure 3.2 sets out Queensland’s planned pathway to zero net emissions by 2050.
| Figure 3.2 | Queensland’s emissions pathway |
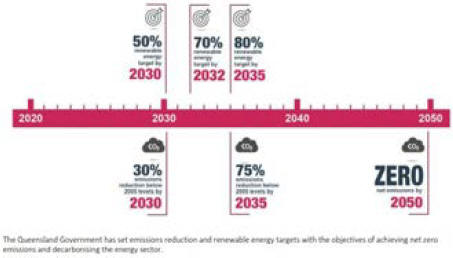
On 18 April 2024 the Queensland Parliament passed the Clean Economy Jobs Act 2024 and the Energy (Renewable Transformation and Jobs) Act 2024 to secure Queensland’s spot at the centre of a global energy transformation.
86
Budget Strategy and Outlook 2024-25
The Energy (Renewable Transformation and Jobs) Act 2024 supports the delivery of the QEJP by entrenching key commitments of the plan in law. The QEJP establishes frameworks to build the necessary infrastructure to transform Queensland to a clean economy future. It also creates the governance and advisory functions for a smooth, coordinated transformation, lays out a vision for Queensland’s energy future, and provides a clear pathway to clean, reliable and affordable power.
The Clean Economy Jobs Act 2024 sets out a pathway to decarbonisation that will support jobs in the state’s key traditional industries, including agriculture, resources and manufacturing, and unlocking investment in new industries including renewables, manufacturing, critical minerals, hydrogen and sustainable aviation fuel. The Act provides a critical foundation for the government to protect Queensland communities and mitigate the impacts of climate change by:
| • | enshrining in law emissions reduction targets of 30 per cent below 2005 levels by 2030, 75 per cent below by 2035 and net zero by 2050 |
| • | establishing a requirement to set emissions reduction targets for 2040 and 2045 at least 10 years in advance |
| • | requiring annual reporting to the Queensland Parliament on progress towards achieving Queensland’s emissions reduction targets |
| • | providing for the development of emissions reduction plans for sectors |
| • | establishing an expert panel to provide advice on emissions reduction progress, and efficient and cost-effective ways to reduce emissions that best support jobs and growth, without exacerbating cost-of-living pressures. |
The legislated emissions reduction targets will work in tandem with the government’s renewable energy targets to drive action and give local and international investors the confidence to invest in Queensland.
A strong economy provides the capacity to progress social priorities, consistent with the government’s overarching objectives for the community. By investing in the key enablers of economic growth, as identified in economic strategy, the government can support healthy, strong and safe communities and provide opportunities for employment and community participation.
Sustainability risk management is a strategic imperative for the state, with transparency in reporting sitting at its core. The Queensland Government publishes an annual Queensland Sustainability Report which outlines the Queensland Government’s approach to managing sustainability risks and opportunities, including the governance structures supporting policy, oversight, and implementation.
| 3.2.6 | Borrowings and net debt |
Elevated levels of public infrastructure investment by governments across Australia responding to the service needs of a growing population, energy transformation and improving transport infrastructure is translating into higher debt levels. However, strong revenue growth in recent years, combined with the government’s robust fiscal management have limited increases in Queensland’s debt level. Net debt is forecast to be $12.2 billion as at 30 June 2024, $4.0 billion lower than forecast in the 2023–24 Budget.
87
Budget Strategy and Outlook 2024-25
From this position of strength, Queensland’s borrowings and net debt position are expected to trend upward as operating cash surpluses for a time fund a smaller percentage of a growing capital program.
The rate of increase in net debt is expected to slow as the capital program moderates from its peak in 2025–26 and operating cash surpluses strengthen. Net debt is expected to reach $59.8 billion by 2027–28, with the net debt to revenue ratio reaching 63 per cent. Queensland’s strong starting position means that Queensland is well positioned to meet these challenges, with debt levels continuing to compare favourably to peers. Forecast net debt of $52.1 billion in 2026–27 compares to $117.9 billion for New South Wales (2023–24 Half-Yearly Review) and $179.2 billion for Victoria (2024–25 Budget).
| Chart 3.6 | State comparison of General Government Sector net debt |
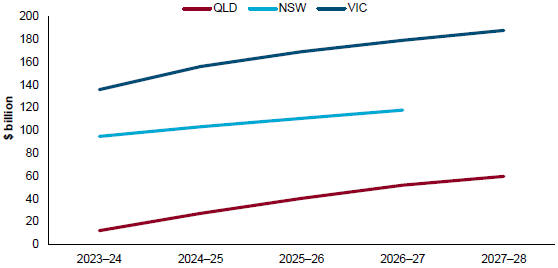
Total General Government Sector borrowings as at 30 June 2024 is forecast to be $62.0 billion, $3.5 billion lower than forecast in the 2023–24 Budget. Borrowing is then projected to be $1.1 billion higher by 30 June 2025 compared to the 2023–24 Budget and $8.4 billion higher by 2026–27 on the same basis.
General Government Sector borrowings compare well to interstate peers. Queensland’s forecast borrowings of $103.2 billion in 2026–27 is far lower than those of New South Wales ($189.2 billion) and for Victoria ($216 billion) in both absolute terms and as a percentage of revenue.
88
Budget Strategy and Outlook 2024-25
| Chart 3.7 | Interstate comparison of General Government Sector borrowing to revenue |
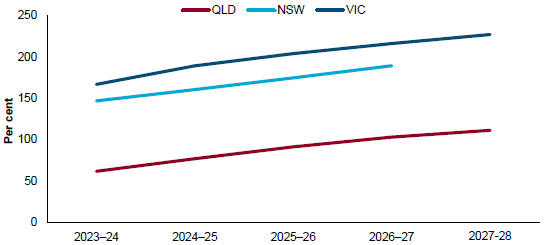
Managing debt to ensure debt-servicing costs remain sustainable is crucial to the Queensland Government, considering interest rate risk. The General Government Sector’s interest expense is estimated to increase to 5.0 percent in 2027–28 as total borrowings increase. The increase is from a relatively low base and moderates by 2027–28 as operating surpluses are forecast and the capital program also moderates. Similar to levels of debt, Queensland’s ratio of borrowing costs to revenue is well below that of New South Wales and Victoria.
| Chart 3.8 | General Government Sector ratio of borrowing costs to revenue |
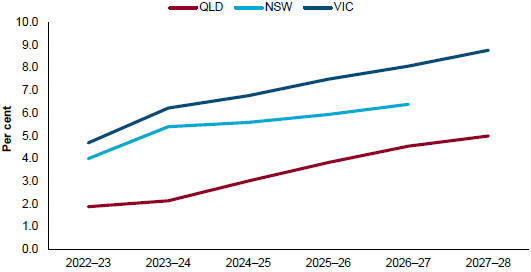
89
Budget Strategy and Outlook 2024-25
Queensland’s credit ratings
Credit rating agencies assess an issuer’s creditworthiness using proprietary methodologies comprising issuer-specific and broader operating environment considerations. A range of quantitative and qualitative assessments covers credit risk factors such as the economy, institutional frameworks, budgetary flexibility and performance, the debt profile, liquidity and financial management and governance.
Particular strengths feature consistently across Queensland’s credit ratings such as its strong and diversified economic base, robust liquidity, and effective and experienced financial management. Also, the Queensland Future Fund – Debt Retirement Fund continues to demonstrate a commitment to active debt management and supports Queensland’s credit rating.
Queensland’s credit ratings are all stable with S&P Global (AA+), Moody’s (Aa1) and Fitch (AA+).
In May 2024, Moody’s affirmed Queensland’s rating at Aa1 (stable), having noted in August 2023 Queensland’s credit strengths such as a mature and stable institutional framework underpinning fiscal strength and flexibility and a large and diverse economic base.
The stable outlook reflects an expectation that Queensland’s economy will continue to underpin its capacity to service its debt burden.
S&P Global last affirmed Queensland’s AA+ (stable) rating in January 2024, reflecting the expectation that projected debt levels will remain consistent with AA+ rated peers.
S&P Global notes Queensland’s wealthy and diversified economy and that experienced financial management and Australia’s institutional settings support its creditworthiness.
Fitch affirmed Queensland’s rating at AA+ (stable) in August 2023. The affirmation reflects Fitch’s view that debt should remain manageable given Queensland has a well-structured economy, proactive and disciplined fiscal management, and a conservatism in fiscal projections.
| 3.2.7 | Emerging fiscal pressures |
Beyond ongoing uncertainties related to budget parameter assumptions, key emerging fiscal issues include:
| • | Higher than anticipated population growth – Queensland has experienced a population surge in 2022–23 and 2023–24, which is continuing to drive demand for housing and government services |
| • | Native Title Compensation Settlement – the government has a potential liability with respect to compensation arising from acts that have extinguished or impaired native title since 1975. |
| • | Challenges arising from delivering significant capital investment in the medium term, including the transformation of the energy system away from a reliance on coal-fired generation, meeting future water demand and providing drought contingency, and preparing to host the Brisbane 2032 Olympic and Paralympic Games. |
90
Budget Strategy and Outlook 2024-25
| • | Expiring agreements – Queensland’s fiscal position is exposed to decisions made by the Australian Government, with a number of very significant National Partnership payments currently being negotiated. Further information on these agreements is provided in Chapter 7. |
| • | Adverse weather events are likely to occur in the future with resulting damage expected to impact on the delivery of state initiatives, noting disaster-related expenses are shared with the Australian Government under the DRFA. |
91
Budget Strategy and Outlook 2024-25
| 4 | Revenue |
Features
| • | Total key state revenues (taxes, GST and royalties) peaked in 2022–23, reaching $57.120 billion, contributing to a record total General Government Sector revenue of $89.810 billion. This outcome reflected significant growth in key revenues of 31.6 and 26.9 per cent respectively in 2021–22 and 2022–23, which were the highest 2 rates of annual growth in key revenues recorded since the GST was introduced in 2000–01. |
| • | This revenue growth was primarily driven by increased royalties, due to the higher global prices being received by coal producers from late 2021 to mid-2023, combined with the impact of the new progressive coal royalty tiers introduced in the 2022–23 Budget. |
| • | However, as previously expected, these temporarily high commodity prices have since fallen substantially, and are expected to continue to decline across 2024–25 and 2025–26. |
| • | As a result, the associated decline in royalties is expected to outweigh the strong growth in taxation revenue in the near term, with total key revenues declining materially in 2024–25 and remaining flat in 2025–26. |
| • | Although a return to solid growth is expected in 2026–27, total key revenues are not forecast to exceed 2022–23 levels again until 2027–28. |
| • | However, despite annual declines or softness in key revenues until 2026–27, revenue compared to the earlier estimates in the 2023–24 Budget Update have been revised up. The key reasons for this upward revision include a slower than expected decline in oil prices and coal prices since late 2023 (notwithstanding sharp coal price falls in March 2024), ongoing strength in property prices and activity and the exceptional performance of the state’s labour market. |
| • | Total General Government Sector revenue is estimated to total $89.059 billion in 2023–24, down $750.6 million (0.8 per cent) compared with 2022–23 but up $3.271 billion (3.8 per cent) compared with Queensland Budget Update forecasts for 2023–24. |
| • | In 2024–25, General Government Sector revenue is estimated to total $88.107 billion, a further decrease of $952.4 million (1.1 per cent) compared with 2023–24. This decline reflects the expected decrease in royalties and the Commonwealth Grants Commission’s assessment that Queensland requires a lower share of GST in 2024–25 compared to 2023–24, partly offset by ongoing growth in taxation revenue and an increase in non-GST Australian Government payments. |
| • | This year’s Budget provides significant support to Queensland’s first home buyers through reforms to existing transfer duty concessions — eligibility for the first home concession and the first home vacant land concession will be extended to homes valued up to $800,000 (up from $550,000), and vacant land up to $500,000 (up from $400,000), respectively. |
| • | Queensland continues to maintain its competitive tax status, with per capita state tax estimated to be $780 lower than the average of other states and territories in 2022–23. |
92
Budget Strategy and Outlook 2024-25
| 4.1 | 2023–24 Estimated actual |
Growth in key state revenues over the 2 years to 2022–23 was significant, reaching a peak of $57.120 billion in 2022–23.
Key state revenues grew by 31.6 per cent in 2021–22, followed by a further 26.9 per cent growth in 2022–23, representing historically high annual growth rates.
However, as previously expected, the exceptionally high coal prices and resulting strength in royalty revenues that drove this growth have been primarily due to a range of temporary factors.
The premium hard coking coal spot price fell sharply in March 2024, from US$313.50 per tonne at the end of February to US$243 per tonne at the end of April. This reflected a decline in steel demand in China and India and improving supply conditions. Looking forward, as supply conditions continue to normalise, the hard coking coal spot price is expected to continue to moderate towards medium-term fundamentals.
The decline in royalties in 2023–24, compared with 2022–23, is only partially offset by:
| • | a 10 per cent increase in taxation revenue, driven predominantly by ongoing strength in Queensland’s labour and housing markets |
| • | a 6.3 per cent increase in GST revenue, driven by a larger national GST pool, reflecting growth in taxable transactions. |
However, reflecting the substantial reduction in royalties and resulting overall key revenues, General Government Sector revenue is expected to fall in 2023–24 to $89.059 billion, down 0.8 per cent compared with 2022–23.
Despite the decline compared with 2022–23 levels, General Government Sector revenue is estimated to be $3.271 billion (3.8 per cent) higher in 2023–24 than forecast at the time of the 2023–24 Queensland Budget Update. This upward revision is primarily driven by coal prices being received by the state’s producers across 2023 and early 2024 not falling as quickly as expected.
| 4.2 | 2024–25 Budget and outyears |
General Government Sector revenue is forecast to decline by $952.4 million (1.1 per cent) in 2024–25, to be $88.107 billion, as outlined in Table 4.1. This decline in revenue is driven by:
| • | a further $4.366 billion fall in royalties, reflecting the expectation that elevated prices for coal and oil will continue to moderate towards levels more consistent with medium-term expectations |
| • | a $934 million decline in GST revenue due to the Commonwealth Grants Commission (CGC) recommending Queensland receive a smaller share of the GST pool in 2024–25 compared with 2023–24. |
These declines in royalty and GST revenue are expected to be partially offset by:
93
Budget Strategy and Outlook 2024-25
| • | a $2.129 billion increase in taxation revenue in 2024–25, reflecting underlying strength in payroll tax, transfer duty and a range of other key taxes and duties supported by the strength of activity in the labour market, property market and broader economy |
| • | a $1.556 billion increase in non-GST Australian Government payments, due to the Australian Government bringing forward financial assistance to local governments from 2023–24 to 2022–23, as well as increased Australian Government funding for health and schools. |
Total key revenues are forecast to decline by 5.8 per cent in 2024–25 and remain flat in 2025–26 as coal prices continue to unwind.
Following the decline in 2024–25 and softness in 2025–26, total key revenues are expected to return to solid growth in 2026–27 and 2027–28, driven by continued growth in both taxation revenues and GST. However, total key revenues will not exceed 2022–23 levels until 2027–28.
Chart 4.2 outlines the growth in revenue across the 3 key revenue streams and the share of growth attributable to each item across the period to 2027–28.
As can be seen, the majority of growth in 2021–22 and 2022–23, and the majority of the fall in 2023–24 and 2024–25 is due to changes in royalty revenue. Taxation is expected to continue growing steadily from 2024–25 onwards, while GST revenue returns to strong growth from 2026–27.
| Chart 4.1 | Outlook for growth in key revenues1 |
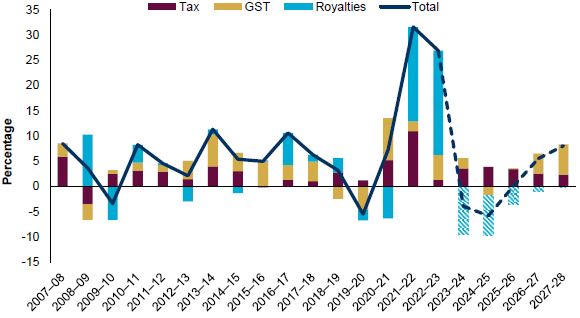
Note:
| 1. | Annual contribution to growth in key revenues. Total is the annual growth of the sum of the 3 categories. |
94
Budget Strategy and Outlook 2024-25
Table 4.1 details Queensland’s total General Government Sector revenue by component across the forward estimates period.
| Table 4.1 | General Government Sector revenue1 |
| 2022–23 Actual $ million | 2023–24 Est. Act $ million | 2024–25 Budget $ million | 2025–26 Projection $ million | 2026–27 Projection $ million | 2027–28 Projection $ million | |||||||||||||||||||
Taxation revenue | 20,601 | 22,670 | 24,799 | 26,573 | 27,910 | 29,202 | ||||||||||||||||||
Sales of goods and services | 6,483 | 6,946 | 7,333 | 7,663 | 7,325 | 7,314 | ||||||||||||||||||
Interest income | 3,226 | 3,532 | 3,501 | 3,370 | 3,422 | 3,498 | ||||||||||||||||||
Grants revenue | ||||||||||||||||||||||||
GST revenue | 18,306 | 19,459 | 18,525 | 18,610 | 20,647 | 23,906 | ||||||||||||||||||
Australian Government and other grants and contributions | 15,895 | 16,478 | 18,118 | 17,722 | 18,125 | 18,734 | ||||||||||||||||||
Australian Government capital grants, other grants and contributions | 4,133 | 3,612 | 3,635 | 4,354 | 3,691 | 3,461 | ||||||||||||||||||
Dividend and income tax equivalent income | ||||||||||||||||||||||||
Dividends | 606 | 1,142 | 1,209 | 1,190 | 1,135 | 1,013 | ||||||||||||||||||
Income tax equivalent income | 401 | 578 | 561 | 516 | 494 | 416 | ||||||||||||||||||
Other revenue | ||||||||||||||||||||||||
Royalties and land rents | 18,395 | 12,955 | 8,599 | 6,774 | 6,278 | 6,136 | ||||||||||||||||||
Other | 1,765 | 1,685 | 1,826 | 1,945 | 1,645 | 1,652 | ||||||||||||||||||
Total revenue | 89,810 | 89,059 | 88,107 | 88,717 | 90,670 | 95,332 | ||||||||||||||||||
Note:
| 1. | Numbers may not add due to rounding. |
95
Budget Strategy and Outlook 2024-25
The major sources of total General Government Sector revenue expected in 2024–25 are grants revenue, which includes GST and Australian Government Grants (45.7 per cent) and taxation revenue (28.1 per cent).
| Chart 4.2 | Revenue by operating statement category, 2024–251,2 |
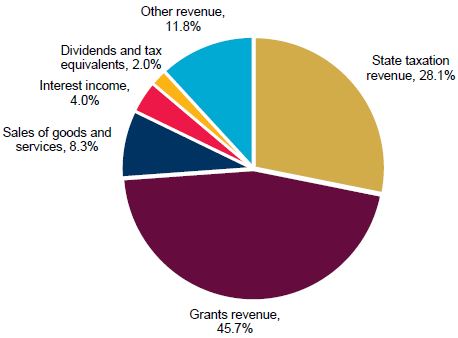
Notes:
| 1. | Numbers may not add up to 100 per cent due to rounding. |
| 2. | Chart prepared in line with Operating Statement categories. ‘Other revenue’ includes royalties and land rents, which comprise 9.8 per cent of total revenues. |
96
Budget Strategy and Outlook 2024-25
| 4.3 | Revenue initiatives |
Supporting first home buyers through increased transfer duty concession thresholds
The 2024–25 Queensland Budget provides substantial increased support for first home buyers through changes to eligibility thresholds for 2 key transfer duty concessions.
| • | First home concession — eligibility will be extended to homes with a dutiable value up to $800,000 (up from $550,000 currently). The changes mean that a first home buyer will pay no duty on homes valued up to $700,000 (up from $500,000 currently) and will receive a partial concession for homes valued between $700,000 and $800,000. This reform will see first home buyers now eligible for a maximum first home concession of up to $17,350, compared with the previous maximum first home concession of $8,750. |
| • | First home vacant land concession — eligibility will be extended to vacant land with a dutiable value up to $500,000 (up from $400,000 currently). The changes mean that a first home buyer will pay no duty on vacant land on which they build their first home, if they occupy the home constructed on the vacant land within 2 years, valued up to $350,000 (up from $250,000 currently), and will receive a partial concession for vacant land valued between $350,000 and $500,000. This reform will see first home buyers now eligible for a maximum first home vacant land concession of up to $10,675, compared with the previous maximum concession of $7,175. |
It is estimated the changes to the first home buyer concessions will result in total additional tax relief of $360 million over the 4 years ending 2027–28, and benefit around 10,000 first home buyers per year.
The increased eligibility thresholds will apply for contracts dated from the date of announcement inclusive, with effect from the date legislative amendments receive royal assent. More detailed information on this measure can be found in Box 4.2.
Land tax surcharge for foreign companies and trustees of foreign trusts, and absentees
The surcharge rate of land tax imposed in addition to general land tax rates for foreign companies and trustees of foreign trusts, and absentees, will be increased from 2 per cent to 3 per cent from 30 June 2024. This increase will mean that Queensland’s rate of surcharge land tax is still below that of New South Wales and Victoria, which both have a surcharge rate of 4 per cent.
Ex gratia relief from the land tax foreign surcharge will continue to be offered for Australian-based foreign entities whose commercial activities make a significant contribution to the Queensland economy and community, subject to eligibility criteria.
It is estimated this measure will result in additional taxation revenue of approximately $330 million over the 4 years ending 2027–28. When combined with additional taxation revenue from the increased additional foreign acquirer duty (AFAD) rate, these measures will offset the cost of extending the first home buyer concessions.
Additional foreign acquirer duty increase
Additional foreign acquirer duty, which is levied on direct and indirect purchases of residential property in Queensland by foreign owners, is being increased from 7 per cent to
97
Budget Strategy and Outlook 2024-25
8 per cent from 1 July 2024. This increase will align Queensland’s rate of additional duty on foreign purchases of residential land with that of New South Wales and Victoria.
Ex gratia relief from AFAD will continue to be offered to Australian-based foreign entities whose commercial activities involve significant development by adding to the supply of housing stock in Queensland, subject to eligibility criteria.
It is estimated this measure will result in additional taxation revenue of approximately $90 million over the 4 years ending 2027–28.
Extension of 50 per cent apprentice and trainee payroll tax rebate
The 50 per cent payroll tax rebate for wages paid to apprentices and trainees will be extended for 12 months until 30 June 2025. In addition to apprentice and trainee wages generally being exempt from payroll tax, this rebate provides additional support for businesses supporting youth employment and businesses who employ trainees and apprentices.
It is estimated this initiative will result in tax relief of $54.9 million for Queensland businesses employing trainees and apprentices in 2024–25.
Changes to payroll tax regional discount eligibility
In the 2019–20 Budget, the government introduced a one per cent discount on the payroll tax rate for regional employers that had an ABN registered business address in regional Queensland and at least 85 per cent of their taxable wages paid to employees located outside South East Queensland. In the 2023–24 Budget, the government extended this measure until 30 June 2030 (previous expiry date of 30 June 2023), to provide long term support for jobs and growth across regional Queensland.
From 2024–25, the regional discount eligibility criteria will exclude extremely large businesses who typically have substantially greater financial capacity to contribute to state revenues compared to smaller regional employers. As such, from 2024–25, businesses that pay Queensland taxable wages of more than $350 million on an annual basis will not be eligible for the discount.
It is estimated this measure will result in additional taxation revenue of approximately $5 million per annum across the forward estimates.
Motor vehicle registration fee reduction
The government has frozen the indexation of the registration fee and traffic improvement fee components of vehicle registration from 1 July 2024 at an estimated cost of $281.8 million over 4 years.
The government is also reducing the registration fee and traffic improvement fee components of motor vehicle registration for all light vehicles for 12 months by 20 per cent at an estimated cost of $435 million over 2 years.
Public transport fare freeze
The government has frozen the public transport fare increase in 2024 at an estimated cost of $62.3 million over 5 years.
98
Budget Strategy and Outlook 2024-25
The government is also implementing a temporary fare reduction across the state for 6 months from 5 August 2024 with a flat fare of 50 cents per trip at an estimated cost of $150 million in 2024–25. In addition to this initiative, the government is also providing half-price tickets on Airtrain services.
Queensland Revenue Office revenue and penalty debt administration and resourcing
The government is ensuring the Queensland Revenue Office’s capacity to deliver effective and sustainable revenue and penalty debt administration.
| Box 4.1 | Revenue reforms providing ongoing benefits for Queenslanders and businesses |
In addition to the new progressive coal royalty tiers introduced from 1 July 2022 and the substantial support provided to first home buyers in this Budget, a range of other key revenue reforms have been announced and implemented by the Queensland Government over recent years to help provide substantial additional support, services and infrastructure for the benefit of Queenslanders and Queensland businesses across the state.
This includes a range of targeted reforms to support and encourage business growth and employment, and to help ensure sustainable funding for mental health services and the racing industry.
Promoting business growth and employment
In 2019–20, the government introduced the Regional Payroll Tax Discount to support regional businesses and incentivise the hiring of local workers. To date this initiative has benefitted almost 6,000 businesses across regional Queensland, saving them a total of over $450 million.
In the 2023–24 Budget, the discount was extended over the long term to 30 June 2030 to provide ongoing certainty and support to Queensland’s regional businesses.
Importantly, the vast majority of businesses benefiting from the discount (around 75 per cent of eligible businesses) are businesses with annual wages of less than $6.5 million.
Since the introduction of the regional discount in 2019, the unemployment rate has reduced substantially across regional Queensland, with the average unemployment rate across Queensland’s regions outside South East Queensland being at a remarkably low 4 per cent over the 12 months to April 2024. In fact, many regional areas of the state have recently recorded their lowest unemployment rates on record since current detailed ABS regional Labour Force data commenced in 1998.
Apprenticeships and traineeships provide a great employment pathway, particularly for younger Queenslanders. This is why, since 2016–17, a 50 per cent payroll tax rebate has been offered on the wages paid to apprentices and trainees, on top of the normal payroll tax exemption for apprentice and trainee wages.
Over that time (to May 2024), the 50 per cent rebate has helped over 9,000 businesses take on more apprentices and trainees and grow their business, providing a total benefit to Queensland businesses of almost $250 million.
99
Budget Strategy and Outlook 2024-25
In recognition of the importance of small and medium businesses to the state’s economy, key changes to the payroll tax threshold and deductions have been introduced that have helped Queensland businesses grow and employ.
The payroll exemption threshold was increased from $1.1 million to $1.3 million in 2019–20. Further, from 1 January 2023, changes to the payroll tax deduction framework increased the benefit to eligible businesses and expanded the number of businesses benefitting by extending the ceiling for deduction eligibility to $10.4 million in annual Australian taxable wages (up from $6.5 million). In the second half of 2022–23 alone, this change is estimated to have benefitted almost 15,000 Queensland businesses.
Support for essential services, including mental health
Other important new revenue measures have been implemented in recent years that are providing critical funding for essential services, including mental health services across the state.
In the 2022–23 Budget, the government committed to provide ongoing sustainable funding for mental health and other drug and suicide prevention services through the imposition of a mental health levy.
The mental health levy is enabling and supporting the investment of $1.645 billion over 5 years for improved mental health services, including hospital and health centre facilities, crisis support spaces, health services for young people and First Nations peoples, tenancy sustainment and employment opportunities.
Ongoing sustainable funding of the racing industry
On 6 June 2022, the government also announced a new funding model to ensure ongoing sustainable funding for Queensland’s racing industry, to support 125 racing clubs across Queensland, particularly country racing clubs which play an important role in regional communities.
The new funding model and associated revenue reforms recognises the significant changes that have occurred in wagering markets through the growth in online betting and ensures all wagering operators are making an appropriate contribution to the future of the state’s racing industry.
From December 2022, an additional 5 per cent racing levy was applied in addition to the 15 per cent betting tax rate, along with other changes to include the taxing of bonus or free bets for betting tax.
To leverage the benefits of the additional revenue raised through these measures, the new funding model includes 80 per cent of annual betting tax revenue being hypothecated to Racing Queensland to provide sustainable funding to Queensland’s racing industry and the thousands of jobs it directly supports across the state, including in many regional areas.
100
Budget Strategy and Outlook 2024-25
| 4.4 | Revenue by operating statement category |
| 4.4.1 | Taxation revenue |
Chart 4.4 outlines the composition of estimated state taxation revenue for 2024–25, with the largest sources being payroll tax and transfer duty, together representing 56.6 per cent of the state’s total taxation revenue.
| Chart 4.3 | State taxation by tax category, 2024–251 |
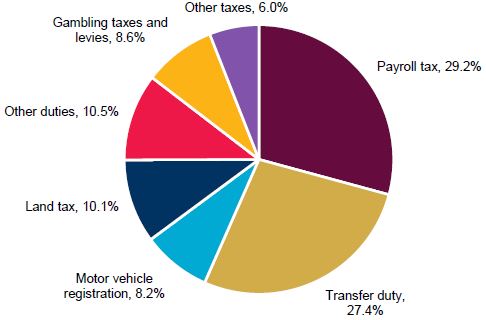
Note:
| 1. | Percentages may not add to 100 per cent due to rounding. ‘Other duties’ includes vehicle registration duty, insurance duty and other minor duties. ‘Other taxes’ includes the emergency management levy, waste disposal levy, guarantee fees and other minor taxes. ‘Payroll tax’ includes the mental health levy. |
Table 4.2 shows the main components of taxation revenue and the forecast revenues for each component across the forward estimates.
101
Budget Strategy and Outlook 2024-25
| Table 4.2 | State taxation revenue1 |
| 2022–23 Actual $ million | 2023–24 Est. Act $ million | 2024–25 Budget $ million | 2025–26 Projection $ million | 2026–27 Projection $ million | 2027–28 Projection $ million | |||||||||||||||||||
Payroll tax | ||||||||||||||||||||||||
Payroll tax | 5,669 | 6,221 | 6,713 | 7,113 | 7,485 | 7,824 | ||||||||||||||||||
Mental health levy | 182 | 495 | 533 | 564 | 594 | 620 | ||||||||||||||||||
Total payroll tax | 5,850 | 6,715 | 7,245 | 7,678 | 8,079 | 8,444 | ||||||||||||||||||
Duties | ||||||||||||||||||||||||
Transfer | 5,240 | 5,605 | 6,793 | 7,081 | 7,326 | 7,672 | ||||||||||||||||||
Vehicle registration | 791 | 896 | 905 | 932 | 960 | 989 | ||||||||||||||||||
Insurance2 | 1,371 | 1,531 | 1,650 | 1,755 | 1,843 | 1,935 | ||||||||||||||||||
Other duties3 | 70 | 50 | 41 | 42 | 42 | 43 | ||||||||||||||||||
Total duties | 7,472 | 8,083 | 9,389 | 9,810 | 10,172 | 10,639 | ||||||||||||||||||
Gambling taxes and levies | ||||||||||||||||||||||||
Gaming machine tax | 997 | 1,041 | 1,072 | 1,104 | 1,138 | 1,172 | ||||||||||||||||||
Health services levy | 157 | 165 | 176 | 186 | 196 | 206 | ||||||||||||||||||
Lotteries taxes | 375 | 415 | 436 | 457 | 480 | 504 | ||||||||||||||||||
Wagering taxes | 229 | 286 | 293 | 301 | 309 | 318 | ||||||||||||||||||
Casino taxes and levies | 127 | 114 | 136 | 142 | 147 | 153 | ||||||||||||||||||
Keno tax | 27 | 28 | 28 | 29 | 30 | 31 | ||||||||||||||||||
Total gambling taxes and levies | 1,911 | 2,048 | 2,141 | 2,220 | 2,301 | 2,384 | ||||||||||||||||||
Other taxes | ||||||||||||||||||||||||
Land tax | 1,732 | 2,032 | 2,499 | 2,832 | 3,120 | 3,300 | ||||||||||||||||||
Motor vehicle registration | 2,226 | 2,352 | 2,046 | 2,470 | 2,593 | 2,687 | ||||||||||||||||||
Emergency management levy | 625 | 656 | 666 | 694 | 722 | 751 | ||||||||||||||||||
Waste disposal levy | 394 | 423 | 452 | 474 | 493 | 508 | ||||||||||||||||||
Guarantee fees | 350 | 327 | 327 | 363 | 397 | 454 | ||||||||||||||||||
Other taxes4 | 40 | 34 | 33 | 33 | 34 | 34 | ||||||||||||||||||
Total taxation revenue | 20,601 | 22,670 | 24,799 | 26,573 | 27,910 | 29,202 | ||||||||||||||||||
Notes:
| 1. | Numbers may not add due to rounding. |
| 2. | Includes duty on accident insurance premiums. |
| 3. | Includes duty on life insurance premiums. |
| 4. | Includes the statutory insurance scheme levy and nominal defendant levy. |
102
Budget Strategy and Outlook 2024-25
Payroll tax and mental health levy
Queensland’s labour market remains exceptionally strong and tight by historical standards. Strong jobs growth so far in 2023–24 is expected to see employment grow by 23⁄4 per cent across the year, before growth slows in the outyears as labour market conditions normalise.
This strength in Queensland’s labour market, with the unemployment rate remaining at very low levels, has also supported a strengthening in wages.
Annual growth in Queensland’s Wage Price Index (WPI) accelerated to 4.8 per cent in December quarter 2023, the strongest growth on record. WPI growth is expected to slow across the forward estimates period but, given the easing of inflationary pressures, real wages growth is now expected in each year from 2024–25 to 2027–28.
Reflecting the strength of these key labour market outcomes across the state, payroll tax revenue is estimated to total $6.221 billion in 2023–24, $551.7 million (9.7 per cent) higher than in 2022–23.
In line with the outlook for ongoing strong labour market conditions, payroll tax is expected to grow by a further 7.9 per cent in 2024–25, with average annual growth of around 5.2 per cent forecast over the 3 years ending 2027–28.
Mental health levy
In the 2022–23 Queensland Budget, the Queensland Government announced the introduction of the mental health levy in order to provide a sustainable funding source to enhance the provision of mental health services and investment.
The levy only applies to large businesses with national payrolls of more than $10 million, with those businesses paying a 0.25 per cent levy on taxable wages above $10 million. Very large businesses with national payrolls of more than $100 million pay an extra 0.5 per cent levy on wages above $100 million.
The levy commenced from 1 January 2023 and, as such, 2023–24 revenue represents the first complete year of collections following its implementation. Mental health levy revenue in 2023–24 is estimated at $494.8 million, higher than expected at the 2023–24 Budget Update given the stronger than expected labour market performance.
Over the forward estimates, mental health levy revenue is expected to grow largely in line with broader payroll tax growth.
Duties
Transfer duty
Transfer duty is charged on ‘dutiable transactions’, including transfers of land and other dutiable property in Queensland.
Transfer duty revenue is estimated to be 7 per cent higher in 2023–24 than 2022–23, reflecting ongoing strength in the residential housing market, following a short period of falling prices in late
103
Budget Strategy and Outlook 2024-25
2022. Strong growth is forecast in 2024–25 as housing market activity continues to remain strong, and as interest rates and inflation stabilise, supporting broader market confidence.
In particular, residential dwelling prices are expected to be a key driver of growth in transfer duty over the forward estimates. After a period of heightened residential dwelling activity in early to mid-2022, followed by a decline in prices from mid-2022 to early 2023, residential prices have since rebounded.
In the 12-month period up to December 2023, the median dwelling price in Brisbane increased by 11 per cent. Residential dwelling prices are expected to grow more slowly from these elevated levels over the coming years, to be more in line with long-term historical trends.
Following a peak in 2021–22, property transaction volumes have remained relatively stable since late 2022. Volumes are expected to remain at a relatively steady level from 2023–24 onwards, but remain higher than pre-2020–21 levels, reflecting ongoing population growth.
The combination of these factors, along with ongoing recovery in the non-residential sector, is supporting an expected average annual growth of 4.1 per cent in transfer duty over the 3 years ending 2027–28.
Changes to the first home concession and first home vacant land concession commencing in 2024–25 will lower transfer duty revenue collections over the forward estimates, but this will be partially offset by the increase in AFAD rate.
104
Budget Strategy and Outlook 2024-25
| Box 4.2 | Substantial support for first home buyers |
Housing affordability has become a challenge for many Queenslanders in recent years, particularly for first-time buyers aiming to enter the housing market.
Residential dwelling prices in Brisbane have grown by more than 60 per cent compared to pre-COVID-19 March 2020 levels, driven by a combination of factors including supply constraints and strong demand.
Queensland continues to have favourable transfer duty settings that result in homebuyers paying substantially less duty than if they had purchased in other states (see Box 4.3). Queensland homebuyers are supported by the transfer duty home concession, which provides tax relief of up to $7,175, and is available on all home purchases, which the buyer will occupy as their home, with no value cap. Importantly, Queensland remains one of the few jurisdictions across Australia to offer a concession for home buyers.
Given recent increases in prices, the Queensland Government will be providing substantial additional support to a wider range of Queenslanders purchasing their first home by increasing eligibility thresholds for 2 key transfer duty concessions – the first home concession and the first home vacant land concession.
| • | First home concession — eligibility will be extended to homes with a dutiable value up to $800,000, up from $550,000 currently. The changes mean that a first home buyer will pay no duty on homes valued up to $700,000 (up from $500,000 currently) and will receive a partial concession for homes valued between $700,000 and $800,000. |
| • | First home vacant land concession — eligibility will be extended to vacant land with a dutiable value up to $500,000, up from $400,000 currently. The changes mean that a first home buyer will pay no duty on vacant land on which they will build their first home, if they occupy the home constructed on the vacant land within 2 years, valued up to $350,000 (up from $250,000 currently) and will receive a partial concession for vacant land valued between $350,000 and $500,000. |
These changes will increase the maximum value of the first home concession by $8,600 (to a total of $17,350) and the maximum value of the first home vacant land concession by $3,500 (to a total of $10,675).
The changes to the first home concession will also extend the phasing out of the concession over a wider price range, delivering more relief for more first home buyers in Queensland.
It is estimated that increasing the first home buyer concession eligibility thresholds will deliver additional tax relief to Queensland first home buyers of $360 million over the 4 years ended 2027–28. This will benefit around 10,000 first home buyers across the state each year.
The transfer duty revenue foregone due to these revenue reforms will be offset by increases in surcharges applying to foreign buyers and owners of property in Queensland.
The measure also ensures Queensland’s first home concession is generous compared with first home concessions in other states. For example, the new higher threshold in Queensland
105
Budget Strategy and Outlook 2024-25
to receive a full relief from transfer duty of $700,000 is significantly above Brisbane’s median unit price of around $600,000.
In comparison, the equivalent thresholds in New South Wales and Victoria are below their respective median capital city unit prices, meaning a first home buyer purchasing a median priced unit would still need to pay some transfer duty in those states.
As noted above, Queensland’s home concession provides tax relief of up to $7,175 on all home transactions, uncapped by the value of a home. This means that even for home purchases above the new first home concession threshold, Queensland’s generous home concession means that Queenslanders will pay much less in duty on their first home, relative to other states.
In combination with the home concession, an eligible first home purchase valued at $700,000 will now receive total savings in transfer duty of $24,525, which includes the maximum saving of $17,350 under the first home concession and the $7,175 saving from the home concession. Previously, the maximum saving for a first home purchase was $15,925 at a value of $500,000.
| Chart 4.4 | Transfer duty savings for a first home buyer |
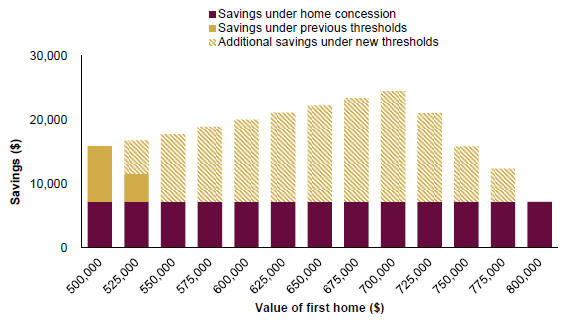
Sources: State revenue office websites (various), CoreLogic (May 2024).
This year’s Budget also outlines significant funding for the previously announced doubling of the Queensland First Home Owner Grant (FHOG) to $30,000.
The FHOG provides support to eligible first home buyers purchasing or building a new home which they will live in. Queensland’s $30,000 FHOG is now the equal highest in Australia (alongside Tasmania) and 3 times the grant available in New South Wales and Victoria. Further, Queensland’s $750,000 threshold compares favourably to median house prices when compared to thresholds in other major states.
106
Budget Strategy and Outlook 2024-25
Importantly, targeting the FHOG towards new homes ensures it assists in adding to housing supply, which will in turn help improve overall housing affordability in the medium to long term.
The boosted grant will be available for eligible transactions entered into between 20 November 2023 and 30 June 2025. However, payments of the boosted grant will continue to flow to eligible first home buyers over the forward estimates period, given the time taken for the construction of many eligible new homes to the point when the grant becomes payable.
In total, the boosted FHOG is expected to support around 12,000 Queenslanders purchase their first new home sooner.
Vehicle registration duty
Vehicle registration duty applies to applications to register or transfer a vehicle. Duty is imposed on the dutiable value, with the applicable rate dependent on the type of vehicle. An additional amount of registration duty is imposed on applications to register or transfer vehicles (other than special vehicles or heavy vehicles) with a dutiable value of more than $100,000.
Revenue from vehicle registration duty in 2023–24 is expected to be 13.2 per cent higher than in 2022–23, driven by the continued strength in vehicle sales in line with the high levels of broader consumption expenditure experienced as part of the recovery from COVID-19.
Vehicle registration duty is expected to remain relatively flat in 2024–25, due to a recalibration of activity towards more sustainable long-term levels and on the back of the robust growth seen in 2023–24. Revenues are then forecast to grow by around 3 per cent per annum over the 3 years ending 2027–28.
Land tax
Land tax is imposed on the taxable value of a landowner’s aggregated holdings of freehold land owned in Queensland as at 30 June each year. Importantly, the landowner’s home and some other specified types of landholdings are exempt. Different rates apply to individuals, and companies, trusts, and absentees.
Reflecting the impact of strong land value growth across the state in recent years, land tax revenue is expected to grow by 23 per cent in 2024–25. However, the impact of recent value growth has also been tempered by the 3-year averaging of land values applied in determining land tax liabilities.
Therefore, recent land value growth will continue to flow through to support ongoing solid growth in land tax revenue in future years, but the rate of growth in land tax is expected to moderate across the forecast period as property prices stabilise.
Average annual growth of 9.7 per cent is forecast for land tax over the 3 years ending 2027–28, with the rate of growth slowing over the forward estimates.
Gambling taxes and levies
A range of gambling activities are subject to state taxes and levies, including gambling in casinos, racing and sports betting, and electronic gaming machines in clubs and hotels.
107
Budget Strategy and Outlook 2024-25
After growing strongly in 2022–23, total gambling tax and levy collections are expected to grow by a further 7.2 per cent in 2023–24. This growth reflects ongoing solid growth in various forms of gambling activity, including in the state’s hotels and clubs, as well as partly reflecting the impact of the racing levy and changes to betting tax announced in the 2022–23 Budget.
Total gambling tax and levy collections are expected to grow by a further 4.5 per cent in 2024–25, with average annual growth of 3.6 per cent forecast over the 3 years ending 2027–28, with this period also incorporating increased revenue over time from the opening of the Queen’s Wharf Brisbane casino.
Waste disposal levy
The waste disposal levy commenced on 1 July 2019 and applies to 39 local government areas, covering more than 90 per cent of the state’s waste generation and population. The levy is paid by landfill operators on waste disposed to landfill. Exemptions from the levy exist for particular waste, such as waste from declared disasters, waste donations to charitable recyclers and lawfully managed and transported asbestos.
Queensland’s levy zone is divided into 2 areas – metropolitan and regional – with differential annual increases of levy rates. In 2023–24, the metropolitan levy rate increased by $10 to $105 per tonne and the regional levy rate increased by a government-approved indexation of 4.3 per cent to $91.
Revenue from the waste disposal levy is estimated to be $423 million in 2023–24, 7.2 per cent higher than in 2022–23, reflecting the annual increase in waste levy rates.
Revenue from the waste disposal levy is then forecast to grow by an average of 4.7 per cent per annum over the 4 years ending 2027–28. This is driven by continued planned increases in levy rates, which will be a combination of an annual fixed rate increase for the metro zone and the annually-indexed increase for the regional zone.
The government has committed to using 70 per cent of proceeds from the waste levy for resource recovery and other programs that reduce the impact of waste and protect the environment and local communities.
Queensland’s competitive tax status
Queensland continues to provide a highly competitive tax system compared with other jurisdictions.
Maintaining the competitiveness of Queensland’s tax system is critical to provide a competitive investment environment for business and to moderate the tax burden on citizens. As such, it is an important element of the Queensland Government’s economic strategy and its commitment to creating more jobs in more industries.
Importantly, as Chart 4.5 shows, taxation per capita in Queensland was significantly lower in 2022–23 than the average taxation per capita in the other states and territories, highlighting the ongoing competitiveness of Queensland’s taxation regime.
108
Budget Strategy and Outlook 2024-25
Based on the latest available actuals data for states and territories published by the Australian Bureau of Statistics, Queensland’s taxation per capita in 2022–23 was $780 lower than the average of other jurisdictions.
On average, Queenslanders paid $1,052 less tax than New South Wales residents and $1,061 less than Victorian residents.
| Chart 4.5 | Taxation per capita, 2022–231 |
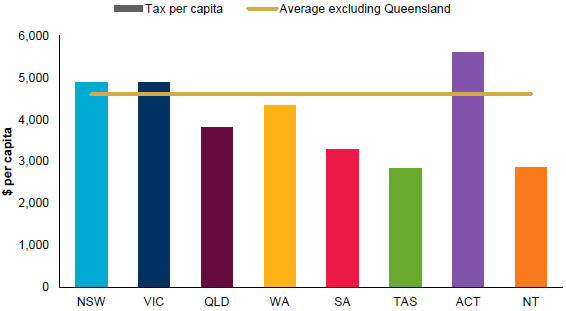
Note:
| 1. | ACT figures include municipal rates and other local government-level taxes |
Sources: ABS Government Finance Statistics and ABS National, State and Territory Population.
Queensland’s tax competitiveness is also highlighted through other key measures of tax competitiveness, including estimates by the Commonwealth Grants Commission (CGC) of Queensland’s tax effort compared with other jurisdictions, and taxation revenue as a proportion of the respective size of each jurisdiction’s economy.
The CGC’s revenue raising effort ratios are an indicator of the extent to which governments burden their revenue bases, with a lower ratio indicating a relatively lower taxation burden imposed by state taxes.
The CGC’s 2024 Update Report assessed that Queensland’s tax effort in 2022–23 (latest available CGC estimate, using total taxation revenue effort for CGC-assessed taxes) was 4.9 per cent below the national average.
An alternative measure of tax competitiveness (that is, taxation as a share of gross state product) also confirms that Queensland’s taxes are highly competitive, being below the average of the other states and territories, and significantly lower than the major southern states.
109
Budget Strategy and Outlook 2024-25
Table 4.3 summarises the estimates of these 3 measures compared with other states and territories, highlighting that the Queensland tax system is very competitive.
| Table 4.3 | Tax competitiveness, 2022–23 |
| NSW | VIC | QLD | WA | SA | TAS | ACT4 | NT | Avg5 | ||||||||||||||||||||||||||||
Taxation per capita1 ($) | 4,877 | 4,886 | 3,825 | 4,350 | 3,286 | 2,841 | 5,610 | 2,851 | 4,605 | |||||||||||||||||||||||||||
Taxation effort2 (%) | 97.1 | 108.0 | 95.1 | 98.6 | 96.0 | 84.2 | 135.3 | 82.0 | 100.0 | |||||||||||||||||||||||||||
Taxation % of GSP3 (%) | 5.2 | 5.8 | 4.1 | 2.8 | 4.2 | 4.0 | 5.1 | 2.2 | 4.7 | |||||||||||||||||||||||||||
Notes:
| 1. | 2022–23 data (latest available actuals). Sources: ABS Government Finance Statistics and ABS National, State and Territory Population. |
| 2. | 2022–23 data (latest available). Source: CGC 2024 Update — total taxation revenue effort for assessed taxes (payroll, transfer duty, land tax, insurance duty and motor vehicle taxes). Revenue raising effort ratios are an indicator of the extent to which governments burden their revenue bases. |
| 3. | 2022–23 data (latest available). Sources: ABS Annual State Accounts and ABS Government Finance Statistics |
| 4. | Figures include municipal rates. |
| 5. | Weighted average of states and territories, excluding Queensland (aside from taxation effort, which is the average of all states). |
| Box 4.3 | Queensland’s competitive tax system |
The Queensland Government is committed to maintaining a competitive tax system that ensures Queensland remains an attractive destination for investment, maintains an economic environment conducive to growth and creating employment opportunities, while supporting prudent financial management.
Taxation is an important revenue source for the state and is critical to enable the provision of essential government services across the state, as well as to sustain the maintenance and delivery of public infrastructure. The funds collected through state taxes are integral to investing in critical areas such as health, education, law and order, transport and community services.
However, through an appropriately balanced approach, Queensland’s competitive tax settings promote the state’s competitiveness, while underpinning the government’s ability to deliver critical infrastructure and high-quality services to all Queenslanders.
Importantly, only a very small number of Queenslanders are liable to pay most state taxes.
In particular, transfer duty is limited to a small number of Queenslanders (aged 18 plus), generally around 5 per cent, who transfer property each year, while only around one per cent of Queenslanders pay land tax annually.
Payroll tax is only paid by businesses and the tax-free threshold of $1.3 million means most Queensland small businesses are not liable for payroll tax, while the standard rate of 4.75 per cent is one of the lowest rates of all jurisdictions. Royalties are only paid by entities involved in the extraction of Queensland’s limited natural resources.
110
Budget Strategy and Outlook 2024-25
Transfer duty
Queensland has favourable transfer duty settings compared to other jurisdictions, with home and first home buyers having access to concessions that reduce costs of buying a home.
In particular, Queensland is one of the only jurisdictions that has a home concession for transfer duty, and this concession is available for dwellings of any value. The home concession means eligible home buyers pay a one per cent concessional rate on the first $350,000 of dutiable value, rather than the normal scheduled rates of between 1.5 per cent and 3.5 per cent. This saves homebuyers up to $7,175 for any eligible principal place of residence.
The relative extent of the benefit provided to home buyers in Queensland is apparent when comparing transfer duty on a typical dwelling across state and territory capitals. For a home buyer purchasing a principal place of residence reflecting median capital city dwelling prices as of May 2024, they would pay around $23,000 less transfer duty in Queensland than if they purchased in New South Wales, and around $18,000 less transfer duty than if they purchased in Victoria.
For the purchase of a median priced home across all state and territory capitals, Queensland’s transfer duty structure results in the lowest transfer duty amount being payable, as demonstrated in Chart 4.6, even allowing for the median dwelling price being lower in several other capitals.
| Chart 4.6 | Comparison of median dwelling prices and equivalent transfer duty on homes |
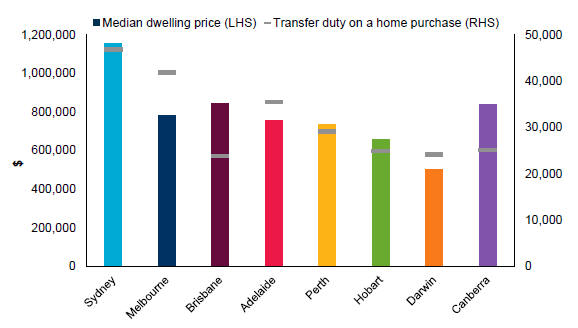
Sources: State revenue office websites (various), CoreLogic (May 2024)
111
Budget Strategy and Outlook 2024-25
Further to Queensland’s favourable transfer duty settings for home buyers generally, Queensland also offers generous concessions for the state’s first home buyers.
As discussed in detail in Box 4.2, the substantially increased eligibility value thresholds for first home concessions announced in this Budget means that eligible first home buyers in Queensland will pay no duty on home purchases up to $700,000. For purchases between $700,000 and $800,000, they will pay only a concessional amount relative to other home buyers.
Queensland’s new first home buyer concession thresholds are generous compared to other jurisdictions, particularly when compared with median dwelling prices in other major states. With the changes in this Budget, the home value threshold where full relief from transfer duty is provided for first home buyers (of $700,000) will be 83 per cent of the median capital city dwelling in Queensland. In comparison, in New South Wales the equivalent figure is 69 per cent, while in Victoria it is 77 per cent.
Payroll tax
Queensland’s payroll tax exemption threshold of $1.3 million is one of the highest of all jurisdictions, meaning most Queensland small businesses are not liable for payroll tax, while the standard rate of 4.75 per cent is one of the lowest rates of all jurisdictions.
For comparison, New South Wales and Victoria both currently have lower exemption thresholds and higher standard rates. New South Wales has an exemption threshold of $1.2 million and a standard rate of 5.45 per cent, while Victoria has an exemption threshold of $900,000 (from 1 July 2024) and a standard rate of 4.85 per cent.
Further, Queensland offers a one percentage point discount for eligible regional employers, which in the 2023–24 Queensland Budget was extended over the long term to 30 June 2030.
The competitiveness of Queensland’s payroll tax regime is enhanced by the deduction available for employers between the exemption threshold of $1.3 million and the current deduction threshold of $10.4 million in annual Australian taxable wages, that significantly reduces the amount of tax payable between this wage range.
The deduction was extended materially, from the previous $6.5 million ceiling to the new $10.4 million ceiling, in the 2022–23 Queensland Budget, benefitting almost 15,000 Queensland businesses.
Land tax
The home that Queenslanders live in is exempt from land tax, meaning the vast majority of Queensland homeowners are not liable for any land tax.
Further, the land tax thresholds and exemptions that apply in Queensland ensure that, despite recent increases in property values nationally, most Queensland landowners will not have a land tax liability, and those with small investment property holdings generally have only a minimal land tax liability.
For landholders that do own taxable land, the thresholds at which land tax becomes payable in Queensland are among the most generous in Australia. For individuals, the land tax-free threshold of $600,000 is one of the highest in the country.
112
Budget Strategy and Outlook 2024-25
In comparison, from 1 January 2024 Victoria’s general land tax threshold is just $50,000. Therefore, Queensland’s individual threshold is now 12 times higher than Victoria’s, despite many areas of Queensland generally having lower average land values.
In addition, land tax in Queensland is subject to a system of 3-year averaging of the land value, which helps further reduce the impacts of increasing land values on the tax payable by landholders.
Further, in applying the threshold, the value of each parcel of land is split between each individual owner by their proportional share. This means that joint owners (e.g. a couple who own a property together) each have to exceed the relevant threshold before being liable for land tax.
Tax expenditures
Tax expenditures are reductions in taxation revenue that result from the use of the tax system as a policy tool to deliver government policy objectives. Tax expenditures are provided through a range of mechanisms, including tax exemptions, reduced tax rates, tax rebates, tax deductions and provisions which defer payment of a tax liability to a future period.
Appendix B provides details of tax expenditure arrangements provided by the Queensland Government.
| 4.4.2 | Grants revenue |
Grants revenue is comprised of Australian Government grants (including GST), grants from the community and industry, and other miscellaneous grants.
A 1.8 per cent increase in total grants revenue is forecast for 2024–25, primarily driven by an expected 7.9 per cent growth in Australian Government grants and partially offset by an expected 4.8 per cent decrease in GST revenue.
113
Budget Strategy and Outlook 2024-25
| Table 4.4 | Grants revenue1,2 |
| 2022–23 Actual $ million | 2023–24 Est. Act $ million | 2024–25 Budget $ million | 2025–26 Projection $ million | 2026–27 Projection $ million | 2027–28 Projection $ million | |||||||||||||||||||
Current grants | ||||||||||||||||||||||||
GST revenue grants3 | 18,306 | 19,459 | 18,525 | 18,610 | 20,647 | 23,906 | ||||||||||||||||||
Australian Government grants4 | 15,455 | 16,145 | 17,750 | 17,410 | 17,821 | 18,390 | ||||||||||||||||||
Other grants and contributions | 440 | 333 | 367 | 312 | 303 | 343 | ||||||||||||||||||
Total current grants | 34,201 | 35,937 | 36,643 | 36,332 | 38,771 | 42,640 | ||||||||||||||||||
Capital grants | ||||||||||||||||||||||||
Australian Government capital grants | 4,089 | 3,585 | 3,535 | 4,313 | 3,686 | 3,461 | ||||||||||||||||||
Other grants and contributions | 44 | 28 | 100 | 42 | 5 | 0 | ||||||||||||||||||
Total capital grants | 4,133 | 3,612 | 3,635 | 4,354 | 3,691 | 3,461 | ||||||||||||||||||
Total Australian Government payments | 37,851 | 39,189 | 39,811 | 40,332 | 42,154 | 45,758 | ||||||||||||||||||
Total grants revenue | 38,335 | 39,550 | 40,278 | 40,686 | 42,462 | 46,101 | ||||||||||||||||||
Notes:
| 1. | Numbers may not add due to rounding. |
| 2. | Amounts in this table may differ to those outlined in Chapter 9 due to different classification treatments. |
| 3. | Includes entitlements to payments associated with the ‘no worse off’ guarantee as part of the Australian Government changes to the GST distribution. |
| 4. | Queensland Treasury estimates. Differs from Chapter 7 due to the inclusion of direct Australian Government payments to Queensland agencies for Australian Government own purpose expenditure. |
GST revenue
Queensland’s GST revenue in 2023–24 is expected to be $1.153 billion (6.3 per cent) higher than in 2022–23, reflecting a larger national GST pool due to growth in taxable transactions.
Consistent with expectations at the 2023–24 Budget Update, Queensland’s GST revenue is expected to decline by $934 million (4.8 per cent) in 2024–25, reflecting the CGC’s recommendation that Queensland receives a smaller share of the GST pool in 2024–25 compared with 2023–24.
GST revenue is expected to be flat in 2025–26. Following this, GST revenue is forecast to grow by 10.9 per cent in 2026–27 and then 15.8 per cent in 2027–28. These increases are driven by forecast growth in the GST pool and the expectation that the impacts of the higher coal royalties on Queensland’s share of GST will subside.
Queensland’s expected share of GST, and the key factors impacting on it over the remainder of the forecast period, are discussed in further detail below.
114
Budget Strategy and Outlook 2024-25
Revisions to the GST pool
The Australian Government’s national GST pool forecasts were downgraded substantially in the 2024–25 Federal Budget, to be $6.637 billion lower across the 4 years to 2026–27 compared with the 2023–24 Federal Budget estimates.
For 2023–24, the GST pool is expected to be around $0.3 billion (or 0.3 per cent) lower than forecast in the 2023–24 Federal Budget.
The 2024–25 Federal Budget stated that, from 2024–25, material downgrades in GST receipts are driven by the lower outlook for nominal consumption subject to GST, partially offset by higher nominal dwelling investment.
The Australian Government expects the GST pool to reach $104.5 billion by 2027–28.
| Chart 4.7 | Australian Government forecasts of national GST revenue pool1 |
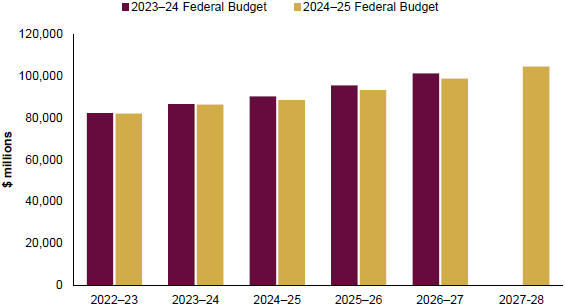
Note:
| 1. | The 2023–24 Federal Budget estimates are limited to the 2026–27 financial year. |
Source: 2022–23 Final Budget Outcome, 2023–24 Federal Budget, and 2024–25 Federal Budget.
115
Budget Strategy and Outlook 2024-25
| Box 4.4 | 2025 GST Methodology Review |
GST is a critical revenue source for all states and territories. In 2023–24, GST is estimated to represent approximately 22 per cent of Queensland’s total state revenue — providing critical funds for essential state government services such as health, education, law and order, transport and other services that are utilised by all Queenslanders.
GST is distributed between states and territories under a methodology administered by the Commonwealth Grants Commission (CGC). This methodology involves considering and balancing the fiscal capacities of states so that a similar standard of services and infrastructure can be delivered by each state to their population, no matter where they live. This is known as horizontal fiscal equalisation.
The GST methodology is multifaceted to account for the range of differing needs and costs of providing services across jurisdictions and their different revenue raising capacities. The GST methodology is reviewed in detail every 5 years. Since the introduction of the GST in 2000–01, the methodology has been reviewed 4 times, with the most recent finalised in 2020.
The latest review of the GST methodology is due to be finalised in the first half of 2025, with the outcomes to apply to the GST distribution methods to apply from 2025–26 onwards.
The review includes consideration of potential methodology changes to the CGC’s assessment of key service delivery expenses, such as transport and health, as well as each state’s revenue raising capacity, including in relation to coal and gas royalties and key state taxes.
In particular, this includes consideration of a differential assessment of coal royalties based on prices. This would have a significant impact on Queensland’s share of future GST if implemented due to Queensland’s production of high-quality metallurgical coal and the implementation of progressive coal royalty tiers.
Terms of reference for the 2025 Review were issued by the Australian Treasurer to the CGC on 9 February 2023 and are available on the CGC’s website.
2 formal rounds of consultation were undertaken with states and territories across 2023, facilitated through the issuance of detailed issues papers by the CGC on each of the assessments undertaken as part of the GST methodology.
Queensland Treasury also hosted a visit by the CGC in early 2024 as an important part of this consultation process, to highlight first hand to the CGC the substantial geographic, socio-demographic and climatic challenges faced in delivering essential services and infrastructure across a large, diverse state such as Queensland.
To ensure Queensland’s position is clearly communicated and advocated for, this consultation has involved significant input from a range of key departments, to ensure the data used and assumptions relied upon by the CGC appropriately reflect the needs of the people of Queensland. This includes taking into account the state’s growing population, socio-demographic composition and service delivery challenges in a large, decentralised state.
This significant body of work will continue to be a focus for Queensland Treasury over the next year to make sure Queensland receives its fair share of GST revenue.
116
Budget Strategy and Outlook 2024-25
GST – Queensland’s assessed fiscal capacity
In early 2024, the Australian Government accepted the CGC’s recommendation that Queensland requires a lower share of GST revenue in 2024–25 compared with 2023–24, with the CGC estimating Queensland’s share of the GST pool decreasing from 21.2 per cent in 2023–24 to 19.5 per cent in in 2024–25.
This was primarily driven by 2 factors:
| • | mining production – in the context of the increased value of coal production and higher coal prices, Queensland was determined to have a higher relative revenue raising capacity from mining-related activity, thereby reducing its assessed GST needs |
| • | capital improvements – strong growth in national urban transport investment reduced the relative needs of other states assessed as having below-average needs for urban transport, including Queensland. Weak growth in national investment in rural roads, for which Queensland has above-average needs, also reduced its assessed GST needs. |
The impact of these assessments on Queensland’s assessed GST need was partially offset by the following factors:
| • | taxable land value – below-average growth in taxable land values in Queensland decreased Queensland’s relative revenue raising capacity |
| • | population – an above average increase in Queensland’s population between 2019–20 and 2022–23 increased Queensland’s share of investment needs relative to other states |
| • | Census outcomes – new 2021 Census socio-demographic composition data showed Queensland’s population to be relatively more dispersed and its non-Indigenous population relatively more disadvantaged than in the 2016 Census. These changes increased Queensland’s assessed GST needs for a range of services and infrastructure, particularly in regard to health services and social housing. |
Importantly, states and territories’ shares of GST revenue fluctuate materially over time based on the CGC’s assessment of their fiscal capacity and expenditure needs.
As such, given the complex nature of the methodology, some key drivers of changes to Queensland’s and other states’ shares of GST are factors that are not Queensland specific. This includes such things as changes in iron ore royalty revenue in Western Australia and changes in transfer duty collections in New South Wales, both of which can materially impact other states’ (including Queensland’s) GST revenues in any given year.
Australian Government payments
Australian Government payments to Queensland in 2024–25 are expected to total $39.811 billion, representing an increase of $622.3 million (1.6 per cent) compared to payments in 2023–24. This increase is attributable to a 7.9 per cent increase in Australian Government grants, partially offset by a 4.8 per cent decrease in GST revenue.
Chapter 7 provides a detailed overview of federal financial arrangements, including Australian Government payments to Queensland.
117
Budget Strategy and Outlook 2024-25
Other grants and contributions
Other grants and contributions are funds received from other state and local government agencies, other bodies and individuals.
The main sources of contributions are those received from private enterprise and community groups to fund research projects and community services and contributed assets and goods and services received for a nominal amount. Contributions exclude Australian Government grants and user charges.
Other grants and contributions comprise only a small share of total grant revenue (forecast to be 1.2 per cent in 2024–25).
| 4.4.3 | Royalty revenue |
Royalties ensure that an appropriate share of the proceeds from the extraction of the state’s valuable and non-renewable resources are returned to the community.
The state earns royalties from the extraction of coal, base and precious metals, bauxite, petroleum and gas, mineral sands and other minerals. Land rents are also earned from pastoral holdings and mining and petroleum leases.
Royalty revenues are sensitive to movements in commodity prices traded on global markets, around which there is a high degree of uncertainty. Changes in commodity export volumes also have the potential to impact Queensland’s royalty estimates, while changes to export volumes, in particular if driven by supply side constraints, may in turn also impact global prices.
Appendix C outlines key parameter assumptions, and the sensitivity of coal royalty estimates to individual changes in price, volume and exchange rate parameters.
Significantly elevated coal and oil prices across 2021–22 and 2022–23 provided a substantial but short-term boost to Queensland’s royalty revenues. Global coal and oil prices have since moderated significantly with hard coking coal (HCC) spot prices falling from a peak of over US$670/t in early 2022 to around US$240/t in early 2024. This reflected a range of factors including a decline in steel demand in China and India and improving supply conditions.
Although trending down, the recent resilience in global coking coal prices has been largely driven by a range of short-term supply-side factors and disruptions. As such, prices are expected to unwind further and return to more sustainable levels across 2025–26, but the timing and extent of the decline remains uncertain.
Forecast royalties and land rents are detailed in Table 4.5.
118
Budget Strategy and Outlook 2024-25
| Table 4.5 | Royalties and land rents1 |
| 2022–23 Actual $ million | 2023–24 Est. Act $ million | 2024–25 Budget $ million | 2025–26 Projection $ million | 2026–27 Projection $ million | 2027–28 Projection $ million | |||||||||||||||||||
Coal | 15,360 | 10,541 | 6,233 | 4,810 | 4,595 | 4,512 | ||||||||||||||||||
Petroleum2 | 2,350 | 1,705 | 1,594 | 1,269 | 1,039 | 990 | ||||||||||||||||||
Other royalties3 | 504 | 526 | 579 | 499 | 442 | 427 | ||||||||||||||||||
Land rents | 181 | 184 | 193 | 197 | 201 | 206 | ||||||||||||||||||
Total royalties and land rents | 18,395 | 12,955 | 8,599 | 6,774 | 6,278 | 6,136 | ||||||||||||||||||
Notes:
| 1. | Numbers may not add due to rounding. |
| 2. | Includes liquefied natural gas (LNG). |
| 3. | Includes base and precious metal, other minerals, and other royalties. |
Coal royalties
As outlined above in Table 4.5, a large proportion of Queensland’s royalties comes from coal mining, particularly in recent years due to the period of high global coal prices that have delivered extraordinary and, in many cases, record returns and profits to the state’s coal producers.
In 2023, HCC used primarily in global steel production, accounted for around 47 per cent of Queensland’s total coal export tonnages, semi soft/ PCI coal accounted for around 20 per cent, and thermal coal accounted for around 33 per cent.
In terms of value of production, HCC accounted for around 59 per cent of the total in 2023, while semi-soft/ PCI coal accounted for around 21 per cent and thermal coal around 20 per cent.
Coal royalties are expected to total $10.541 billion in 2023–24, $4.819 billion (or 31.4 per cent) lower than collected in 2022–23 but $1.353 billion (14.7 per cent) higher than forecast at the 2023–24 Budget Update.
This uplift in royalties in 2023–24 compared with previous expectations at the time of the Budget Update in late 2023 has been primarily driven by coal prices being received by Queensland coal producers in late 2023 and early 2024 not falling as quickly as anticipated. However, it should be noted that the premium HCC spot price fell sharply in March 2024 due to a decline in steel demand in China and India and improving supply conditions.
119
Budget Strategy and Outlook 2024-25
| Box 4.5 | Progressive coal royalties continue to ensure a fair share for Queenslanders |
The new progressive coal royalty tiers announced in the 2022–23 Queensland Budget are ensuring that all Queenslanders are receiving a fair return on their valuable and non-renewable resources during the recent period of high global coal prices.
The high prices being received by producers since late 2021 have delivered significantly increased revenues to the state’s coal companies.
ABS data show that over the period from July 2021 to March 2024, the value of Queensland coal exports totalled $188 billion. In comparison, over the previous corresponding period (i.e. July 2018 to March 2021) Queensland coal exports totalled $100 billion.
This means that the coal industry has earned an additional $88 billion over the recent period of elevated global prices, compared to what they earned just a few years ago. The significant growth in coal industry revenue over recent years, as well as how this compares with the royalties to Queenslanders, is demonstrated in Chart 4.8.
| Chart 4.8 | Value of Queensland coal exports and coal royalties – year ended March1,2 |
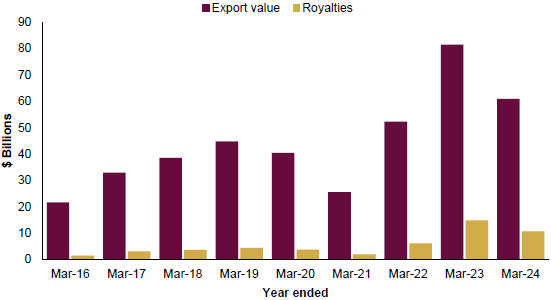
Notes:
| 1. | Recent coal export data are subject to revision. |
| 2. | Royalty data relates to royalties payable on coal sold, disposed of, or used in the relevant period. Payments are made at a later date. |
Source: Unpublished ABS trade data and Queensland Treasury
120
Budget Strategy and Outlook 2024-25
As outlined in the 2023–24 Budget Update, the new progressive royalty tiers delivered an additional $5.8 billion to Queenslanders in 2022–23. The new tiers are expected to deliver a further $3.6 billion in revenue in 2023–24, reflecting the ongoing strength in global prices across the second half of 2023 and early 2024.
Given the new tiers only take effect when prices are high, their impact is expected to decrease significantly over the forward estimates as coal prices normalise to around $1.3 billion in 2024–25, and an average of around $485 million per year over the 3 years ending 2027–28.
However, importantly, the new tiers will mean Queenslanders will also receive a fair share of the coal companies’ extraordinary revenues during any future periods of unexpectedly high coal prices over the longer term.
The additional fiscal capacity provided by Queensland’s progressive coal royalty tiers has previously enabled the government to invest more than $16 billion in infrastructure and essential services, as outlined in the 2023–24 Budget. These investments are benefitting all regions of Queensland, including key coal producing regions.
Building on this investment, the 2023–24 Budget Update also outlined a range of investments across regional Queensland that were supported by coal royalties, including:
| • | $210 million to temporarily double the First Home Owner Grant to $30,000 for eligible first home purchases until 30 June 2025 |
| • | $100 million to boost the 2024–27 Works for Queensland round for a total round of $300 million so regional councils can deliver more local infrastructure |
| • | an additional $79.1 million for a new mental health facility in Rockhampton |
| • | $70 million to increase the Queensland Critical Mineral and Battery Technology Fund to support the development of the critical mineral and battery technology industries |
| • | an additional $30 million for the Backing Bush Communities Fund for workforce training and invasive species management and community projects |
| • | up to $30 million to accelerate development of resource projects in the North West Minerals Province in the next 5 years |
| • | up to $20 million for an economic structural adjustment package for Mount Isa and North West Queensland. |
In this year’s Budget, the ongoing strength in coal prices and resulting royalties, including from the new progressive royalty tiers, has enabled the government to deliver significant new and expanded measures in 2024–25 to support Queenslanders in tackling cost-of-living challenges. Some of the key measures include:
| • | Funding towards the $2.965 billion in additional electricity rebates to Queensland households and small businesses. All Queensland households will automatically receive $1,300 off their electricity bills in 2024–25, consisting of an upfront $1,000 Cost of Living Rebate from the Queensland Government and a $300 rebate paid in quarterly instalments from the Australian Government. Around 205,000 eligible small businesses will also receive $650 off electricity bills in 2024–25, co-funded by the Queensland and Australian Governments |
121
Budget Strategy and Outlook 2024-25
| • | $435 million for a 20 per cent reduction in motor vehicle registration costs for all light vehicles for a 12-month period |
| • | $150 million in 2024–25 from lowering public transport fares to a flat fare of 50 cents per trip across the state from 5 August 2024 for 6 months |
| • | $33.5 million in new funding in 2024–25, bringing the total funding to $40 million in 2024–25, to increase the maximum value of the FairPlay voucher from $150 to $200, and to increase the number of vouchers available from 50,000 to up to 200,000 |
| • | $15 million in 2024–25 for the School and Community Food Relief Program. This initiative will assist children to access food relief from appropriate sources, ranging from subsidised lunches, breakfasts or tuckshop items |
| • | $10.1 million over 4 years from 2024–25 for food, emergency and financial relief measures for vulnerable cohorts. |
Queensland’s progressive coal royalties are a critical part of the Queensland Government’s general revenue base, and therefore, also help fund health, education, law and order, transport and other essential services for all Queenslanders.
Supported by funding from coal royalties since the 2022–23 Budget, publicly-owned entities continue to deliver productivity-enhancing infrastructure projects across the energy, water, and ports sectors. This includes CopperString 2032 to connect Queensland’s North West Minerals Province to the National Electricity Market, and large-scale pumped hydro energy storage projects critical to the decarbonisation of the state’s energy system.
As such, Queensland’s progressive coal royalties are enabling the Queensland Government to undertake significant investments across regional Queensland, including in resource producing regions, to improve living standards and create new employment opportunities.
Coal prices
Coking coal prices
Global coal prices have fallen significantly from the unprecedented surge experienced in mid-2021 and early 2022. HCC spot prices reached over US$670 per tonne (/t) in early 2022 but they have since fallen substantially and are now expected to average around US$286/t in 2023–24.
The decline in prices in late 2023 was slower than previously anticipated, reflecting a range of short term supply constraints, including:
| • | cyclone Jasper causing the temporary closure of some Queensland coal ports |
| • | lower production at BMA mines due to a significant a significant increase in planned maintenance |
| • | a stoppage at Peak Downs and operational and geo-technical factors that affected operations at Broadmeadow |
| • | rainfall in the Bowen Basin, temporarily impacting production at some mines. |
However, the HCC spot price fell sharply in March 2024, from US$313.50/t at the end of February to US$243/t at the end of April, leading to an average US$308/t across the March quarter. This
122
Budget Strategy and Outlook 2024-25
decline was driven by reduced supply constraints and weakening global steel demand, reflecting production controls in China.
HCC prices averaged around US$240/t in May 2024, with further falls in coal prices expected over the coming quarters.
As discussed in previous Budgets and Budget Updates, HCC prices are still expected to continue to moderate towards more sustainable levels over time. This expectation is consistent with the views of other key market analysts, for example:
| • | The Australian Government Department of Industry Science and Resources’ Office of the Chief Economist (OCE) stated that: |
| • | Prices are expected to broadly trend downwards in 2024, averaging US$277 a tonne for the year. Metallurgical coal prices are falling slowly as supply disruptions gradually diminish. Prices are expected to ease from US$277 a tonne in 2024 to US$185 a tonne (in real terms) by 20291. |
| • | Wood Mackenzie2 indicated that: |
| • | The market balance will start to loosen, with improving supply from Australia and slowing Chinese demand. This will push prices down to US$265/t in 2024, down by US$30/tonne [year-on-year]. |
| • | Prices will decline gradually to a low of US$185/t by 2032 as marginal costs ease, supply availability recovers, and demand growth flattens. |
| • | The 2024–25 Federal Budget3 stated that: |
| • | Iron ore and metallurgical coal prices have been elevated over the past 2 years due to strong demand from China and disruptions to supply both in Australia and globally. However, recent indications suggest that steel demand in China has likely peaked and a recovery in the supply of iron ore and metallurgical coal has put downward pressure on prices. |
In the medium term, prices are expected to return towards the marginal cost of production. However, the outlook for mining costs has increased over recent years. For example, according to the March 2024 ABS Producer Price Indexes, input costs to coal mines have risen by an average of 7.2 per cent per annum over the past 3 years.
In addition to this, the Australian Government’s Safeguard Mechanism policy, which requires Australia’s highest greenhouse gas emitting facilities to reduce their emissions in line with Australia’s emission reduction targets of 43% below 2005 levels by 2030 and net zero by 2050, is expected to lead to additional costs for coal operations.
Further, strip ratios — the ratio of saleable coal to waste material — of Australian coal mines are also increasing over time and this trend is expected to continue.
| 1 | Department of Industry, Science and Resources, Commonwealth of Australia (2024), Resources and Energy Quarterly March 2024. |
| 2 | Wood Mackenzie (2024). Global Metallurgical Coal Strategic Planning Outlook H1 2024. |
| 3 | The Commonwealth of Australia (2024). 2024–25 Budget – Budget Strategy and Outlook |
123
Budget Strategy and Outlook 2024-25
Reflecting these factors, the HCC spot price is now expected to return to a medium-term price of US$185/t by December 2025. This is higher and later than the expectation at the time of the Budget Update, where it was assumed HCC prices would return to a medium-term level of US$175/t by December 2024.
Chart 4.10 shows HCC price forecasts compared to the latest quarterly price forecasts from a range of other forecasters, including Consensus Economics, Wood Mackenzie, Westpac, OCE, and the Commonwealth Treasury.
This comparison shows that the expected sharp decline in coal prices from current levels is broadly consistent with the expectations of other major forecasters, with a clear consensus view that global coal prices will be substantially lower over coming quarters and years.
As illustrated in Chart 4.10, the latest forecasts from other major forecasters show a range of expectations in terms of where the medium-term price will settle, from US$140/t by the end of the March quarter of 2025 from Commonwealth Treasury ranging up to US$213/t across 2028 from Consensus Economics.
Queensland Treasury’s medium-term price expectation of reaching US$185/t for HCC is largely similar to most other forecasters, although the pace of adjustment to reach medium-term prices varies across forecasters.
| Chart 4.9 | Coking coal price forecasts1 |
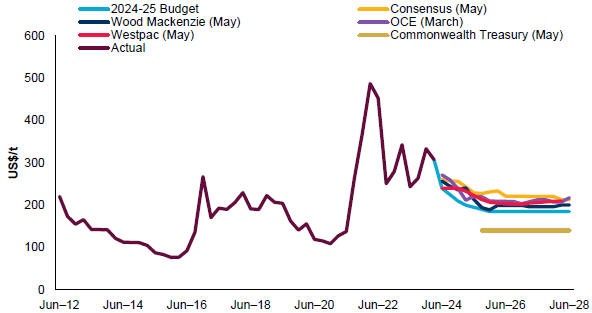
Notes:
| 1. | Spot prices used where possible. Where spot prices are unavailable, contract prices have been used. |
Sources: Consensus Economics, Wood Mackenzie, OCE, Westpac, Commonwealth Treasury, and Queensland Treasury.
124
Budget Strategy and Outlook 2024-25
Thermal coal prices
Premium thermal coal prices have tracked broadly in line with 2023–24 Budget Update forecasts, while spot prices for lower quality thermal coal have been somewhat stronger than anticipated.
In the lead up to the 2023–24 Budget Update, premium quality thermal coal was trading at a very high level, with global demand for premium-quality thermal coal being primarily driven by demand from Europe following Russia’s invasion of Ukraine and fears about electricity shortages.
Global trade flows have partially normalised, resulting in a softening in premium thermal prices. Reflecting this, the gap between premium thermal coal and lower quality thermal coal has narrowed, to be more in line with the historical average.
However, at the same time, thermal coal production costs have increased, driven by both input cost escalation and lower mine productivity, a trend which is expected to continue.
Reflecting these market dynamics and expectations of the ongoing return of thermal prices to more ‘normal’ levels, the medium-term assumption for spot prices of premium thermal coal remains unchanged at US$120/t by mid-2024, while the price outlook for lower quality thermal coal been upgraded marginally.
Coal export volumes
Chart 4.11 outlines the outlook for coal export tonnages1, highlighting that total coal export tonnages over the 4 years ending 2026–27 have been revised downwards, compared with the 2023–24 Budget Update forecasts, by around one per cent.
Metallurgical coal volumes have been downgraded in the near term, reflecting ongoing supply constraints which are expected to take longer to resolve than previously anticipated. Over the medium term, these constraints are expected to ease, resulting in a solid recovery in export volumes.
The downgrade to metallurgical coal volumes have been partly offset by an expected increase in thermal coal volumes across the forecast period, reflecting the recent stronger than expected thermal coal exports to China, and the faster than anticipated ramp-up of production at the Carmichael coal mine.
However, consistent with global trends, over the longer term beyond 2027–28, thermal coal exports are expected to begin to decline, reflecting falling global demand and mine depletions. This is driving an expected fall in coal export volumes of around 2 per cent in 2027–28.
As highlighted previously, commitments in place by key trading partners to reduce emissions will continue to dampen long term demand for thermal coal. This includes commitments to achieve net zero emissions by 2050 in Japan and South Korea, and by 2060 in China. These commitments continue to be a downside risk in terms of Queensland’s thermal coal exports.
As outlined in Appendix C, a one per cent variation in export coking and thermal coal volumes in 2024–25 would lead to a change in royalty revenue of approximately $61 million.
| 1 | All references to coal export volumes in this section relate to total export volumes and include coal exports where royalties are not paid to the government, i.e. private royalties. This will not align with tonnages presented in Appendix C which exclude private royalties. |
125
Budget Strategy and Outlook 2024-25
However, given the majority of Queensland’s coal exports are metallurgical coal, it is still expected that international demand for steelmaking coal should continue to support Queensland’s coal exports over coming decades.
| Chart 4.10 | Export coal tonnages1 |
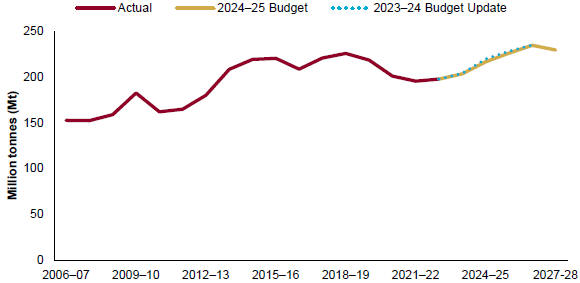
Note:
| 1. | Includes coal exports where royalties are not paid to the government, i.e. private royalties. This will not align with tonnages presented in Appendix C which exclude private royalties. |
Source: Unpublished ABS trade data and Queensland Treasury
Petroleum royalties
Compared to coal, petroleum royalties make up a smaller share of total royalties, even though petroleum royalties have grown strongly over recent years as the export industry has matured.
Global oil prices factor strongly into petroleum royalty forecasts, given most of the LNG produced in Queensland is sold under long-term contracts linked to oil prices. Meanwhile, in terms of volumes, the production level of the 3 major LNG plants is expected to be relatively stable across the forward estimates.
Revenue from petroleum royalties is estimated to total $1.705 billion in 2023–24, 27.5 per cent lower than 2022–23 but 3.3 per cent higher than forecast at the 2023–24 Budget Update.
The expected decline compared with 2022–23 revenues is in line with 2023–24 Budget Update expectations that oil prices, and therefore LNG prices, would unwind from recent highs. The upward revision compared with expectations in late 2023 is due to higher-than-expected LNG production, combined with a weaker than expected Australian dollar, leading to higher LNG prices in A$ terms.
126
Budget Strategy and Outlook 2024-25
OPEC+ production cuts and geopolitical tensions in Russia and the Middle East have seen global oil prices rebound so far in 2024. However, consistent with forecasts at the time of the 2023–24 Budget Update, oil prices are expected to unwind over the forward estimates due to increased global supply and reach US$75/barrel by September 2026.
Petroleum royalties are therefore expected to decline on average by around 12.7 per cent per annum over the 4 years ending 2027–28.
Other royalties
Other royalties include revenue from base and precious metals mined in Queensland such as gold, silver, copper, lead, and zinc, other minerals such as bauxite, and other royalties.
Revenue from other royalties is estimated to total $526 million in 2023–24, 4.2 per cent higher than in 2022–23. Other royalties are expected to grow by around 10.1 per cent in 2024–25, primarily driven by an expected increase in prices across metals.
Other royalties are then expected to decline by around 9.6 per cent per annum on average across the 3 years to 2027–28. The forecast decline is driven by an expected ongoing reduction in copper, lead, and zinc volumes due to depletion of ore reserves and scheduled mine closures over coming years. As final investment decisions for new mines or extensions are made this will flow through into the forecasts.
Land rents
Revenue from land rents, primarily related to mining and petroleum leases and pastoral holdings, is estimated to total $184 million in 2023–24. This is 1.7 per cent higher than in 2022–23 but 1.1 per cent lower than expected at the 2023–24 Budget Update.
The lower than previously expected revenue reflects an initiative implemented as part of the Queensland Critical Minerals Strategy, released in June 2023, which reduced rent to $0 for 5 years from 1 September 2023 for new and existing exploration permits for minerals other than coal.
Revenue from land rents is forecast to grow by 5 per cent in 2024–25 driven by higher rental valuations. Revenue from land rents is then expected to grow by 2.2 per cent per annum over the 3 years ending 2027–28.
127
Budget Strategy and Outlook 2024-25
| 4.4.4 | Sale of goods and services |
Sales of goods and services revenue comprises the cost recovery from the Queensland Government’s provision of a range of goods or services. Revenue from sales of goods and services are expected to be flat over the 3 years ending 2027–28. Table 4.6 provides a breakdown of the categories of goods and services captured in terms of these revenues.
| Table 4.6 | Sales of goods and services1 |
| 2022–23 Actual $ million | 2023–24 Est. Act $ million | 2024–25 Budget $ million | 2025–26 Projection $ million | 2026–27 Projection $ million | 2027–28 Projection $ million | |||||||||||||||||||
Fee for service activities | 2,959 | 3,349 | 3,662 | 3,752 | 3,242 | 3,121 | ||||||||||||||||||
Public transport: | ||||||||||||||||||||||||
South East Queensland | 295 | 324 | 194 | 357 | 376 | 389 | ||||||||||||||||||
Rent revenue | 593 | 599 | 609 | 672 | 750 | 775 | ||||||||||||||||||
Sale of land inventory | 30 | 75 | 99 | 122 | 93 | 66 | ||||||||||||||||||
Hospital fees | 932 | 904 | 912 | 927 | 941 | 954 | ||||||||||||||||||
Transport and traffic fees | 561 | 564 | 529 | 591 | 619 | 643 | ||||||||||||||||||
Other sales of goods and services | 1,113 | 1,132 | 1,328 | 1,242 | 1,304 | 1,366 | ||||||||||||||||||
Total | 6,483 | 6,946 | 7,333 | 7,663 | 7,325 | 7,314 | ||||||||||||||||||
Note:
| 1. | Numbers may not add due to rounding. |
The government provides substantial concessions in the form of discounts, rebates and subsidies to improve access to and the affordability of a range of services for individuals or families, based on eligibility criteria relating to factors such as age, income and special needs or disadvantage.
Appendix A provides details of the concession arrangements provided by the Queensland Government, which highlights that in 2024–25, the government will be providing more than $11.218 billion in concessions, including substantial additional direct cost-of-living relief, to Queensland households and small businesses.
Fee for service activities
Examples of major items of fee for service activities across the General Government Sector include:
| • | recoverable works carried out by the Department of Transport and Main Roads and the commercialised arm of the department |
| • | fees charged by TAFE colleges |
| • | fees charged by CITEC to commercial clients for information brokerage services. |
128
Budget Strategy and Outlook 2024-25
Other sales of goods and services
As shown in Table 4.6, revenue is also raised from a variety of other types of sales of goods and services. These include revenue from public transport ticketing arrangements, rent or lease of government property, hospital fees, transport and traffic fees, title registration fees and other licences and permits.
| 4.4.5 | Interest income |
Interest income primarily comprises interest earned on investments, including those held to support debt, superannuation and insurance liabilities.
Interest income is estimated to total $3.532 billion in 2023–24, 10.2 per cent higher than expected at the 2023–24 Budget, and 9.5 per cent higher than received in 2022–23. The increase in interest income in 2023–24 largely driven by the establishment of significant investments in 2023–24 from royalty windfalls to support the funding requirements of future infrastructure projects in regional Queensland.
Interest income is expected to reduce across the forward estimates reflecting the allocation of investment funds to infrastructure projects and associated reduction in investment returns.
| 4.4.6 | Dividend and income tax equivalent income |
Revenue from dividend and income tax equivalent income is estimated to total $1.720 billion in 2023–24, which is $714 million (70.9 per cent) higher than in 2022–23, and $199 million (13.1 per cent) higher than expected at the time of the 2023–24 Queensland Budget.
Higher dividends and income tax equivalent income in 2023–24 compared to 2022–23 reflects earnings growth in the Public Non-financial Corporations sector, including the electricity generation sector.
Over the forward estimates, dividends and income tax equivalents are expected to moderate to $1.429 billion in 2027–28. This aligns with a reduction in expected earnings from the energy generation government-owned corporations due to higher costs associated with accelerating capital investment in new renewable energy and storage assets combined with reduced output from coal generation assets. Ports and water sector dividends and income tax equivalents are expected to rise steadily to 2027–28.
Trends in dividends and income tax equivalent income are discussed in more detail in Chapter 8.
129
Budget Strategy and Outlook 2024-25
| 4.4.7 | Other revenue |
Other revenue, including royalty revenue, accounts for 11.8 per cent of total General Government Sector revenue in 2024–25 (see Table 4.7).
| Table 4.7 | Other revenue1 |
| 2022–23 Actual $ million | 2023–24 Est. Act $ million | 2024–25 Budget $ million | 2025–26 Projection $ million | 2026–27 Projection $ million | 2027–28 Projection $ million | |||||||||||||||||||
Royalties and land rents | 18,395 | 12,955 | 8,599 | 6,774 | 6,278 | 6,136 | ||||||||||||||||||
Fines and forfeitures | 815 | 741 | 794 | 912 | 913 | 913 | ||||||||||||||||||
Revenue not elsewhere classified | 950 | 945 | 1,032 | 1,033 | 732 | 739 | ||||||||||||||||||
Total other revenue | 20,160 | 14,640 | 10,425 | 8,719 | 7,923 | 7,788 | ||||||||||||||||||
Note:
1. Numbers may not add due to rounding. | ||||||||||||||||||||||||
Royalties and land rents account for 9.8 per cent of total revenue in 2024–25 and are discussed in more detail above in section 4.4.3.
The major fines included in the fines and forfeitures category include speeding, red light, mobile phone and seatbelt camera detected offences and tolling offences.
Revenue from fines and forfeitures is expected to total $741 million in 2023–24, $74 million (9.1 per cent) lower than in 2022–23 and $73 million (8.9 per cent) lower than expected at the time of the 2023–24 Queensland Budget.
The forecast decline in 2023–24 compared with the previous year is partly driven by behavioural changes associated with the impact of mobile phone and seatbelt camera infringements. The forecast decline in 2023–24 compared with the forecast in the 2023–24 Budget is partly driven by lower-than-expected revenue from speed camera fines.
Revenue from fines and forfeitures is expected to grow by 7.2 per cent in 2024–25 and by a further 14.9 per cent in 2025–26, driven by the expansion of the Camera Detected Offence Program (CDOP).
This expansion is aligned to keeping Queenslanders safe as the CDOP is a proven road safety initiative that contributes to reducing road trauma for Queensland. The CDOP is an important component of Queensland’s approach to manage and deter high risk behaviours on the road with the deployment of a range of cameras that focus on speed, red light, illegal use of mobile phones, the non-wearing of seatbelts and detecting unregistered, uninsured vehicles and vehicles transporting dangerous goods in tunnels.
130
Budget Strategy and Outlook 2024-25
All money collected for penalties imposed for camera-detected offences in excess of the administrative costs is required under legislation to be reinvested into road safety initiatives.
This focuses on keeping Queenslanders safe through road safety education and awareness programs; enabling practices and behaviours that improve road safety; road accident injury rehabilitation programs for people that have been injured in a crash; and infrastructure and related technologies to improve the safety of State-controlled roads.
Revenue not elsewhere classified includes assets contributed to the state and payments received for works delivered on behalf of GOCs.
131
Budget Strategy and Outlook 2024-25
| 5 | Expenses |
Features
| • | The 2024–25 Budget provides households with $3.739 billion in new and expanded cost-of-living measures. |
| • | From an expenses perspective, the most significant measure is the $1,300 Cost of Living Rebate automatically credited to electricity bills for all Queensland households in 2024–25. |
| • | Other key measures are in Health and Education services, support to build stronger and safer communities through the government’s Community Safety Plan for Queensland and a ramp up in support to increase Queensland’s housing supply and affordability. |
| • | General Government Sector expenses for 2024–25 are estimated to be $90.738 billion, an increase of $2.243 billion (or 2.5 per cent) on 2023–24. |
| • | New and expanded cost-of-living measures are temporary and largely contained across 2023–24 and 2024–25 years, with expenses expected to fall by 1.7 per cent in 2025–26 before growing moderately across the remainder of the forward estimates. |
| • | Total expenses are projected to grow at an average annual rate of 4.2 per cent over the 5 years to 2027–28. |
| • | A targeted savings plan will deliver savings of $3 billion over the period 2024–25 to 2027–28, with initial savings of $300 million in 2024–25 rising to $1 billion ongoing from 2026–27. |
| • | In 2024–25, the major areas of expenditure are in the key frontline services of health and education. Health, education, public order and safety, housing and community service and transport account for almost 85 per cent of expenditure. |
This chapter provides an overview of General Government Sector expenses for the forecast 2024–25 Budget year and projections for 2025–26 to 2027–28. The forward estimates are based on the economic projections outlined in Chapter 2.
| 5.1 | 2023–24 Estimated actual |
General Government Sector expenses in 2023–24 are estimated to total $88.495 billion, $4.234 billion or 5 per cent above the 2023–24 Budget estimate of $84.261 billion. The increase is largely attributable to the Queensland Government delivering another round of cost-of-living relief with all Queensland households and small businesses to receive a rebate on their electricity bills in 2024–25.
Initiatives under the government’s Homes for Queenslanders program, additional funding to support the Gladstone Area Water Board to complete construction of the Fitzroy to Gladstone Pipeline and higher depreciation costs following revaluations of infrastructure assets in 2022–23 also factor into higher expenses compared to the 2023–24 Budget estimate.
132
Budget Strategy and Outlook 2024-25
| 5.2 | 2024–25 Budget and outyears |
| Table 5.1 | General Government Sector expenses1 |
| 2022–23 Outcome $ million | 2023–24 Est. Act. $ million | 2024–25 Budget $ million | 2025–26 Projection $ million | 2026–27 Projection $ million | 2027–28 Projection $ million | |||||||||||||||||||
Employee expenses | 30,557 | 33,231 | 35,217 | 36,030 | 37,094 | 38,465 | ||||||||||||||||||
Superannuation interest costs | 776 | 787 | 758 | 676 | 638 | 596 | ||||||||||||||||||
Other superannuation expenses | 3,756 | 3,929 | 4,108 | 4,254 | 4,353 | 4,545 | ||||||||||||||||||
Other operating expenses | 20,014 | 26,612 | 25,153 | 23,002 | 22,180 | 22,951 | ||||||||||||||||||
Depreciation and amortisation | 5,018 | 5,436 | 5,716 | 5,996 | 6,344 | 6,739 | ||||||||||||||||||
Other interest expenses | 1,688 | 1,905 | 2,655 | 3,392 | 4,124 | 4,761 | ||||||||||||||||||
Grants expenses | 14,072 | 16,595 | 17,131 | 15,881 | 15,050 | 15,248 | ||||||||||||||||||
Total Expenses | 75,880 | 88,495 | 90,738 | 89,232 | 89,783 | 93,305 | ||||||||||||||||||
Note:
1. Numbers may not add due to rounding. | ||||||||||||||||||||||||
In 2024–25, General Government Sector expenses are estimated to be $90.738 billion, an expected increase of $2.243 billion (or 2.5 per cent) over the estimated actual for 2023–24. Key initiatives and frontline service delivery contributing to the growth in expenditure in 2024–25 include:
| • | $1.375 billion uplift to Queensland Health’s operating funding to address emerging demand and cost pressures and support priority investment areas such as the Queensland Health workforce, Queensland Ambulance Service, and Women and Girls’ Health Strategy |
| • | substantial funding for the Government’s Homes for Queenslanders program to further address housing supply and affordability pressures and demand for homelessness services in Queensland |
| • | funding to meet student needs and funding under the National School Reform Agreement and associated Bilateral Agreement, maintenance of school facilities and support for Queensland children and families through Putting Queensland Kids First package |
| • | measures to support building stronger and safer communities through the government’s Community Safety Plan for Queensland, including supporting victims, delivering for our frontline, detaining offenders, intervening when people offend and crime prevention |
| • | administering the Australian Government’s $300 rebate for households electricity bills in 2024–25 |
| • | additional funding for Queensland Skills Strategy 2024–2028 to deliver skills needed to power our economy and provide access to good jobs with better pay for Queenslanders. |
General Government Sector expenses are expected to decline 1.7 per cent in 2025–26 with cost-of-living relief measures not extending beyond 2024–25 and growth moderating in 2025–26 as disaster reconstruction works and Cross River Rail enabling works performed on behalf of
133
Budget Strategy and Outlook 2024-25
Queensland Rail near completion. From 2024–25, expenditure growth is further tempered by a targeted $3 billion savings plan.
| 5.3 | Expenses by operating statement category |
As outlined in Chart 5.1, employee and superannuation expenses account for 44.2 per cent of the General Government Sector expenses. Other operating expenses (27.7 per cent) is the next largest category, reflecting non-labour costs of providing goods and services to government and non-government recipients including, for example, repairs and maintenance but also transport service contract payments to Queensland Rail, subsidies to households and payments to contractors.
| Chart 5.1 | Expenses by operating statement category, 2024–25 |

134
Budget Strategy and Outlook 2024-25
| Chart 5.2 | Expenses by operating statement category, 2024–25 |
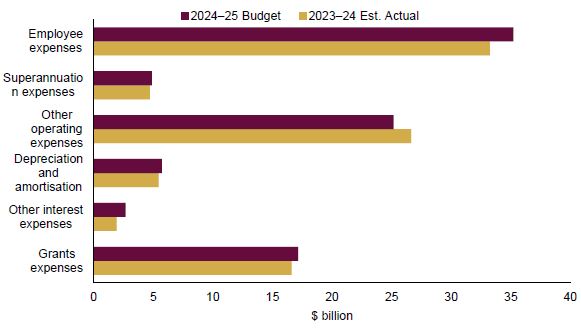
| 5.3.1 | Employee expenses |
Employee expenses include salaries and wages, annual leave and long service leave.
In 2024–25, employee expenses are expected to be $35.217 billion, $1.986 billion or 6.0 per cent higher than the 2023–24 estimated actual. This increase is due in part to the combination of public sector wages policy and growth of 3 per cent in full-time equivalent employees, largely in frontline service areas of health, education and community safety.
The majority of public sector certified agreements nominally expired during 2022 and 2023, and new agreements were established including the following elements:
| • | 3-year agreements with wage increases of 4 per cent in years one and two and 3 per cent in year three |
| • | a Cost of Living Adjustment payment for employees where inflation exceeds headline wage increases established in agreements. |
Employee expenses growth is expected to moderate from 2025–26, with wages growth in current agreements reducing from 4 per cent to 3 per cent in the final year before nominal expiry. Wages growth of 2.5 per cent, which is in line with inflation projections, is then assumed in later years.
Full-time equivalent
The government is continuing to deliver on its commitment to revitalise frontline service delivery. Approved funded full time equivalent (FTE) positions in departments (refer Table 5.2) are estimated to increase by 7,995 (or 3 per cent) in 2024–25, driven principally by increases in Queensland Health, Queensland Police Service and the Department of Education.
135
Budget Strategy and Outlook 2024-25
The Public Sector Commission (PSC) has primary responsibility for monitoring the number of FTEs and collating key human resource workforce metrics across the broader public sector. Between March 2015 and March 2024, FTEs have increased by 56,603, including an increase in frontline by 50,239 FTEs.
The PSC’s annual State of the Sector report provides a summary of the Queensland public sector workforce as at 31 March each year. The March 2024 report shows that:
| • | there was a total of 258,012 FTEs, representing an increase of 11,703 FTEs since March 2023 |
| • | the increase reflects growth of 9,655 FTEs in frontline and frontline support roles and 2,048 FTEs in non-frontline roles |
| • | in total, 90.7 per cent of public servants are engaged in frontline and frontline support roles, with 24,079 FTEs in corporate service roles. |
It is noted that the reporting basis of the State of the Sector report reflects active and paid FTEs engaged at March 2024 while FTEs levels reported in Table 5.2 reflect approved funded FTEs positions for the financial year.
136
Budget Strategy and Outlook 2024-25
| Table 5.2 | Funded Controlled FTE positions by Department1 |
| 2023–24 Adjusted Budget2 | 2023–24 Est. Act. | 2024–25 Budget | ||||||||||
Agriculture and Fisheries | 2,120 | 2,278 | 2,791 | |||||||||
Child Safety, Seniors and Disability Services | 5,375 | 5,421 | 5,480 | |||||||||
Education | 76,242 | 76,520 | 77,528 | |||||||||
Electoral Commission of Queensland | 101 | 101 | 88 | |||||||||
Employment, Small Business and Training | 4,940 | 5,001 | 5,002 | |||||||||
Energy and Climate | 702 | 721 | 440 | |||||||||
Environment, Science and Innovation | 2,960 | 2,974 | 3,034 | |||||||||
Housing, Local Government, Planning and Public Works | 3,587 | 3,684 | 4,565 | |||||||||
Justice and Attorney-General | 4,075 | 4,206 | 4,680 | |||||||||
Office of the Inspector-General Emergency Management | 22 | 22 | 22 | |||||||||
Premier and Cabinet | 496 | 495 | 496 | |||||||||
Public Sector Commission | 82 | 93 | 100 | |||||||||
Queensland Audit Office | 191 | 191 | 191 | |||||||||
Queensland Corrective Services | 7,249 | 7,712 | 8,299 | |||||||||
Queensland Fire Department | 4,145 | 4,145 | 4,121 | |||||||||
Queensland Health | 106,743 | 107,862 | 110,811 | |||||||||
Queensland Police Service | 18,350 | 18,469 | 19,595 | |||||||||
Queensland Treasury | 1,425 | 1,434 | 1,710 | |||||||||
Regional Development, Manufacturing and Water | 741 | 771 | 775 | |||||||||
Resources | 1,442 | 1,447 | 1,459 | |||||||||
State Development and Infrastructure | 1,717 | 1,800 | 1,812 | |||||||||
The Public Trustee of Queensland | 633 | 633 | 635 | |||||||||
Tourism and Sport | 481 | 481 | 477 | |||||||||
Transport and Main Roads | 9,560 | 9,731 | 9,814 | |||||||||
Treaty, Aboriginal and Torres Strait Islander Partnerships, Communities and the Arts | 696 | 803 | 797 | |||||||||
Youth Justice | 1,945 | 2,009 | 2,277 | |||||||||
Total | 256,020 | 259,004 | 266,999 | |||||||||
Notes:
| 1. | Explanations for variations in departmental FTEs can be found in the Service Delivery Statements (SDS). Department total may include multiple tables from SDS, due to separate FTE tables being provided for Departmental service areas and Commercialised Business Units. |
| 2. | Adjusted Budget reflects movements of FTEs following Machinery of Government changes only. |
137
Budget Strategy and Outlook 2024-25
| 5.3.2 | Superannuation expenses |
The superannuation interest cost represents the imputed interest on the government’s accruing defined benefit superannuation liabilities.
In determining the state’s defined benefit superannuation liabilities, Australian Accounting Standards Board (AASB) 119 Employee Benefits requires the discounting of future benefit obligations using yield rates on government bonds net of investment tax. Interest costs are calculated on a net liability approach by applying the discount rate to both the gross liability and superannuation plans.
Superannuation interest costs are dependent on the applicable discount rate at the beginning of the year. Superannuation interest costs decline modestly from 2024–25 and across the outyears as rates stabilise. Obligations of the defined benefit scheme, which is closed to new members, will decline over time as members leave.
Other superannuation expenses represent employer superannuation contributions to accumulated superannuation and the current service cost of the state’s defined benefit obligation (or the increase in the present value of the defined benefit obligation resulting from employee service in the current period), and increases steadily across the forward estimates.
| 5.3.3 | Other operating expenses |
Other operating expenses comprise the non-labour costs of providing goods and services including services to government and non-government organisations (NGO), repairs and maintenance, consultancies, contractors, electricity, communication and marketing.
The Queensland Government provides additional funding to departments each year to enable appropriate indexation of service delivery arrangements with community services sector organisations, in recognition of increasing costs. The NGO indexation rate, on which this funding is calculated, was approved at 3.75 per cent in the 2023–24 Budget Update. The government is considering a revision to the 2024–25 NGO indexation rate in light of the Fair Work Commission’s Annual Wage Review decision on 3 June 2024.
Other operating expenses in 2024–25 are estimated to total $25.153 billion, representing a decline of $1.459 billion or 5.5 per cent, compared to the 2023–24 estimated actual.
The decline in other operating expenses can be largely attributed to the 2 cost-of-living electricity bill rebates to Queensland households and small businesses. The rebates are deducted from consumers’ electricity bills in 2023–24 and 2024–25 at a cost to the budget of $3.750 billion in 2023–24.
This is in part offset by an increase in demand for health and homelessness services, transport service contract payments to Queensland Rail, works associated with delivery of Cross River Rail and funding to administer the Australian Government’s electricity bill rebates for Queensland households and small businesses.
138
Budget Strategy and Outlook 2024-25
| 5.3.4 | Depreciation and amortisation |
Depreciation and amortisation expenses are an estimate of the progressive consumption of the state’s assets through normal usage, wear and tear and obsolescence.
The size of the state’s capital program in combination with increases in asset values has seen depreciation increase significantly since the 2023–24 Budget.
| 5.3.5 | Other interest expenses |
Other interest expenses include interest paid on borrowings, finance leases and similar arrangements to acquire capital assets and infrastructure such as roads, hospitals and state schools.
Other interest expenses are estimated to increase $750 million in 2024–25 to $2.655 billion as borrowings increase to fund the expanded capital program. Interest expenses continue to increase across the forward estimates for the same reason.
| 5.3.6 | Grants expenses |
Current grants include grants and subsidies to the community (such as non-state schools, hospitals, benevolent institutions and local governments) and personal benefit payments. Community Service Obligations are provided where Public Non-financial Corporations (PNFCs) are required to provide non-commercial services or services at non-commercial prices for the benefit of the community (for further details refer to Chapter 8).
Capital grants also represent transfers to the PNFC Sector, local governments, not-for-profit institutions and non-state schools, businesses and households (including the Queensland First Home Owner Grant) for capital purposes.
139
Budget Strategy and Outlook 2024-25
Table 5.3 provides a breakdown of grants by category and recipient type.
| Table 5.3 | Grant expenses1 |
| 2022–23 Outcome $ million | 2023–24 Est. Act. $ million | 2024–25 Budget $ million | ||||||||||
Current | ||||||||||||
Grants to local government2 | 1,043 | 255 | 872 | |||||||||
Grants to private and not-for-profit organisations | ||||||||||||
State funding for non-state schools | 863 | 892 | 922 | |||||||||
Australian Government funding for non-state schools | 3,962 | 4,305 | 4,443 | |||||||||
Other | 2,408 | 3,228 | 3,162 | |||||||||
Grants to other sectors of government | ||||||||||||
Community service obligations to PNFCs | 644 | 624 | 633 | |||||||||
Other payments to PNFCs and PFCs | 158 | 190 | 75 | |||||||||
Other (includes payments to NDIA) | 2,119 | 2,279 | 2,381 | |||||||||
Other | 446 | 617 | 454 | |||||||||
Total current grants | 11,643 | 12,390 | 12,941 | |||||||||
Capital | ||||||||||||
Grants to local government3 | 1,615 | 2,123 | 2,678 | |||||||||
State funding for non-state schools | 123 | 131 | 138 | |||||||||
Grants to private and not-for-profit organisations | 496 | 1,135 | 1,051 | |||||||||
Grants to PNFCs | 67 | 664 | 47 | |||||||||
Queensland First Home Owner Grants | 73 | 60 | 155 | |||||||||
Other | 55 | 91 | 120 | |||||||||
Total capital grants | 2,429 | 4,204 | 4,189 | |||||||||
Total current and capital grants | 14,072 | 16,595 | 17,131 | |||||||||
Notes:
| 1. | Numbers may not add due to rounding. |
| 2. | Current grants to local governments were higher in 2022–23 due to the advance payment by the Australian Government of Financial Assistance Grants for the 2023–24 financial year on-passed to local councils. |
| 3. | Capital grants to local government in large part reflect Disaster Recovery Funding Arrangements grants. |
In 2024–25, grant expenses are estimated to total $17.131 billion, $536 million higher than the 2023–24 estimated actual. The increase is mainly due to:
| • | additional grant funding to support the delivery of social and affordable housing to address housing pressures including support for the Renters Relief package as part of the Homes for Queenslanders program |
| • | higher capital grants to local government councils for various initiatives including Works for Queensland, South East Queensland Liveability Fund and South East Queensland Community Stimulus Program |
| • | funding for Queensland Skills Strategy 2024–2028 to strengthen the state’s training system |
| • | higher Australian Government grants on-passed to non-government schools |
140
Budget Strategy and Outlook 2024-25
| • | additional funding to temporarily double the First Home Owner Grant from $15,000 to $30,000 for eligible transactions entered into between 20 November and 30 June 2025 |
| • | lower Australian Government Financial Assistance Grants to local councils in 2023–24 with the Australian Government making the 2023–24 Financial Assistance Grants payments in the 2022–23 financial year. |
In 2024–25, the increase in grants is partly offset by one-off grants in 2023–24 to PNFC entities for the transfer of Rookwood Weir water infrastructure and grant funding to support completion of the Fitzroy to Gladstone water pipeline.
Grants expenses are expected to decline from 2025–26 as some funding boosts conclude and the substantial DRFA program of work for the 2022 to 2024 disaster events draws closer to completion.
| 5.4 | Operating expenses by purpose |
Chart 5.3 indicates the proportion of expenditure by major purpose classification for the 2024–25 Budget. Health accounts for the largest share of expenses (29.5 per cent) followed by Education (23.4 per cent).
| Chart 5.3 | General Government Sector expenses by purpose, 2024–25 |
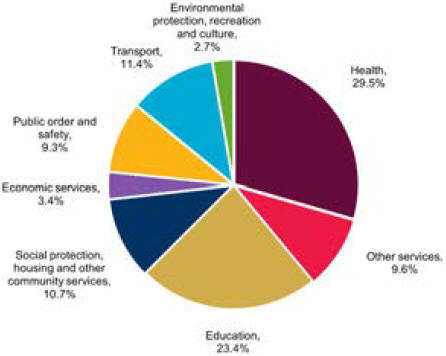
141
Budget Strategy and Outlook 2024-25
| 6 | Balance sheet and cash flows |
Features
| • | The increase in revenue is providing the capacity to support the delivery of expanded cost-of-living relief measures to Queensland households and businesses in 2024–25. |
| • | For 2023–24, General Government Sector (GGS) net debt is forecast to be $12.223 billion, which is $3.967 billion lower than expected at the time of the 2023–24 Budget. |
| • | From 2025–26 GGS net debt increases across the remainder of the forward estimates in support of the capital program, however the growth in net debt is expected to slow as the capital program moderates from the peak expected in 2025–26. |
| • | The projected net debt to revenue ratio for 2023–24 has fallen materially over recent budgets. The projected ratio for the 2023–24 financial year has fallen from 77 per cent in the 2020–21 Budget to an estimated actual of 14 per cent in the 2024–25 Budget. This reflects prudent management of an extraordinary revenue uplift, particularly in 2021–22 and 2022–23, which was driven by higher royalties. These revenue windfalls have been used to substantially lower borrowing requirements in the near term, providing the capacity to then fund an expanded infrastructure program over time. |
| • | Queensland’s 2024–25 estimated net debt to revenue ratio of 31 per cent is slightly improved from previous forecasts and compares very favourably to its peers at 88 per cent for New South Wales (2023–24 Half-yearly Review) and 163 per cent for Victoria (2024–25 Budget). |
| • | The Non-financial Public Sector (NFPS) capital program over the 4 years to 2027–28 totals $107.262 billion. The profile of the capital program over the forward estimates includes public infrastructure investment in projects associated with the Queensland Energy and Jobs Plan (QEJP), Homes For Queenslanders, new investment in the Direct Sunshine Coast Rail Line, delivering the health capacity expansion, providing critical water infrastructure and preparing for the Brisbane 2032 Olympic and Paralympic Games. |
| • | The NFPS capital program for the period 2024–25 to 2027–28 comprises $94.900 billion of purchases of non-financial assets (PNFA), $11.037 billion of capital grant expenses and acquisitions of non-financial assets under finance leases and similar arrangements of $1.325 billion. |
| • | The net worth of the state has increased in 2023–24 by over $44 billion compared to the 2023–24 Budget estimates. The increase is due to the increase in the value of non-financial assets and investments, including in other public sector entities. |
142
Budget Strategy and Outlook 2024-25
| 6.1 | Overview |
The balance sheet shows the projected assets, liabilities and net worth of the General Government Sector as at 30 June each year. A resilient balance sheet provides the government with the capacity to respond to immediate financial and economic events, such as those brought about by cost-of-living pressures, natural disasters, and previously the COVID-19 pandemic.
A strong balance sheet provides the government with capacity to:
| • | prioritise elevated cost-of-living support when the community most needs it |
| • | boosting health, housing and community safety measures in response to strong demand |
| • | support delivery of a transformational capital program. |
The cash flow statement shows the expected cash flows of the General Government Sector during each financial year of the forward estimates. While the operating statement is reported in accrual terms — that is, when revenues and expenses are recognised — the cash flow statement is reported in cash terms — that is, when revenues are received, and payments are made.
| 6.2 | Balance sheet |
Table 6.1 summarises the key balance sheet aggregates for the General Government Sector.
| Table 6.1 | General Government Sector – summary of budgeted balance sheet1 |
| 2023–24 Budget $ million | 2023–24 Est. Act. $ million | 2024–25 Budget $ million | 2025–26 Projection $ million | 2026–27 Projection $ million | 2027–28 Projection $ million | |||||||||||||||||||
Financial assets | 84,347 | 88,677 | 91,386 | 95,551 | 98,902 | 103,158 | ||||||||||||||||||
Non-financial assets | 304,312 | 343,262 | 355,190 | 367,897 | 380,195 | 390,113 | ||||||||||||||||||
Total assets | 388,659 | 431,939 | 446,575 | 463,447 | 479,097 | 493,271 | ||||||||||||||||||
Borrowings | 65,479 | 61,958 | 77,118 | 91,507 | 103,221 | 111,383 | ||||||||||||||||||
Advances | 1,734 | 2,752 | 1,662 | 1,251 | 1,419 | 1,812 | ||||||||||||||||||
Superannuation liability | 20,827 | 19,646 | 19,478 | 18,447 | 17,301 | 16,064 | ||||||||||||||||||
Other provisions and liabilities | 29,845 | 32,699 | 32,744 | 33,070 | 32,868 | 33,420 | ||||||||||||||||||
Total liabilities | 117,886 | 117,054 | 131,002 | 144,275 | 154,808 | 162,679 | ||||||||||||||||||
Net worth | 270,774 | 314,884 | 315,573 | 319,172 | 324,289 | 330,591 | ||||||||||||||||||
Net financial worth | (33,538 | ) | (28,377 | ) | (39,617 | ) | (48,724 | ) | (55,906 | ) | (59,522 | ) | ||||||||||||
Net financial liabilities | 61,953 | 59,211 | 74,164 | 86,504 | 96,702 | 103,798 | ||||||||||||||||||
Net debt | 16,190 | 12,223 | 27,407 | 40,552 | 52,076 | 59,831 | ||||||||||||||||||
Note:
| 1. | Numbers may not add due to rounding. |
143
Budget Strategy and Outlook 2024-25
| 6.2.1 | Financial assets |
The major categories of financial assets are investments, loans and placements and investments in other public sector entities. Investments, loans and placements incorporate investments held to meet future liabilities, including superannuation and insurance, as well as investments relating to the Queensland Future Fund (QFF) — Debt Retirement Fund (DRF), which have a positive impact on the state’s ratings metrics.
The General Government Sector holds the equity in the state’s public enterprises, principally the shareholding in government-owned corporations (GOCs) but also Public Financial Corporations like Queensland Treasury Corporation (QTC), in much the same manner as the parent or holding company in a group of companies.
Total financial assets of $88.677 billion are estimated for 2023–24, $4.33 billion higher than published in the 2023–24 Budget. Investments, loans and placements have increased by $1.489 billion since the 2023–24 Budget, predominantly due to strong returns of the State’s long term assets.
As the value of GOCs increases due to capital investment and revaluations, total financial assets are expected to increase by $2.708 billion to $91.386 billion by 30 June 2025.
Further increases in the value of public enterprises mean financial assets will continue to grow over the forward estimates and are projected to reach $103.158 billion by 30 June 2028.
Chart 6.1 shows forecast General Government Sector financial assets by category at 30 June 2025.
144
Budget Strategy and Outlook 2024-25
| Chart 6.1 | Forecast General Government Sector financial assets by category, at 30 June 2025 |
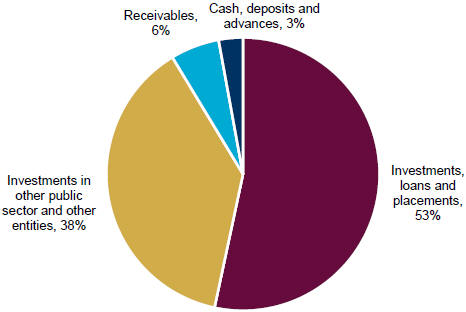
| 6.2.2 | Non-financial assets |
General Government Sector non-financial assets are estimated to be $343.262 billion at 30 June 2024, $38.949 billion higher than expected in the 2023–24 Budget.
Non-financial assets in 2024–25 are expected to increase by a further $11.928 billion to be $355.19 billion at 30 June 2025.
Total non-financial assets at 30 June 2025 consist primarily of land and other fixed assets of $344.437 billion, the majority of which are roads, schools, hospitals and other infrastructure. Other non-financial assets of $10.752 billion held by the state include prepayments and deferred income tax assets relating to GOCs.
General Government Sector capital expenditure for 2024–25 is forecast to be $17.021 billion, which comprises $12.831 billion of PNFA and $4.189 billion of capital grant expenses. In addition, acquisitions of non-financial assets under finance leases and similar arrangements are forecast to be $692 million, bringing the General Government Sector capital program for 2024–25 to $17.713 billion.
Over the 4 years to 2027–28, General Government Sector capital expenditure is forecast to be $65.790 billion, which comprises $54.656 billion of PNFA and $11.133 billion of capital grants expenses. Acquisitions of non-financial assets under finance leases and similar arrangements are forecast to be $976 million, bringing the total General Government Sector capital program over the period to $66.766 billion.
145
Budget Strategy and Outlook 2024-25
Over the forward estimates, the government will invest in:
| • | transformative transport infrastructure, including Direct Sunshine Coast Rail Line, the Coomera Connector, additional train rollingstock, Gold Coast Light Rail, M1 highway upgrades and Cross River Rail |
| • | delivery of new social housing including projects under Homes for Queenslanders |
| • | construction of new schools, including a new public school at Gracemere |
| • | critical infrastructure upgrades and construction, including the Woodford and Cairns Youth Detention Centres and hospitals |
| • | venue infrastructure for the Brisbane 2032 Olympic and Paralympic Games. |
The finance leases and similar arrangements are mainly in relation to Public Private Partnerships (PPPs). PPPs total $976 million over the period 2024–25 to 2027–28 and includes the Tunnel, Stations and Development components of Cross River Rail and construction of Gold Coast Light Rail Stage 3.
Over the 4 years to 2027–28, the capital program for the Public Non-financial Corporations sector is forecast to be $40.624 billion. This is $6.897 billion more than the 2023–24 Budget capital program for this sector, mainly due to further renewable energy infrastructure with the roll-out of the Queensland Energy and Jobs Plan, which will transform Queensland’s energy system over the next 10 to 15 years to deliver clean, reliable and affordable power.
Queensland’s publicly owned energy businesses are investing in new wind, solar, storage and transmission infrastructure. This includes large-scale, long duration pumped hydro, investment in CopperString 2032 connecting the North West Minerals Province to the national electricity grid, and a strong pipeline of renewable energy and storage projects.
The current estimate of the state’s total capital program over the 4 years to 2027–28 is $107.262 billion. The PNFA by the NFPS over this period are forecast to be $94.900 billion. With capital grant expenses of $11.037 billion, this brings total capital expenditure to $105.937 billion. In addition to this, acquisitions of non-financial assets under finance leases and similar arrangements of $1.325 billion bring the total capital program over the period to $107.262 billion.
Chart 6.2 shows the capital program is expected to peak in 2025–26 before moderating across the remaining outyears.
This moderation reflects several factors, but essentially, there is a greater degree of flexibility with medium term capital scheduling given the spending profile of significant programs such as the QEJP, the Hospital Capacity Expansion Program and the completion of large projects such as the Cross River Rail.
146
Budget Strategy and Outlook 2024-25
| Chart 6.2 | Non-financial Public Sector Annual Capital Program |
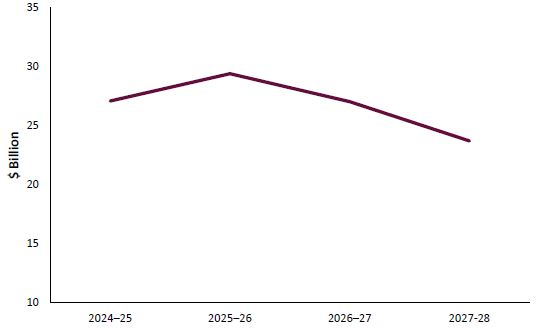
| 6.2.3 | Liabilities |
General Government Sector
Total General Government Sector liabilities are estimated to be $117.054 billion at 30 June 2024 of which the largest component is borrowings at $61.958 billion. Borrowing at 30 June 2024 is $3.521 billion lower than the 2023–24 Budget estimate and $1.415 billion lower than estimated at the 2023–24 Budget Update.
By 2024–25 borrowing is marginally higher at $277 million than the estimate at 2023–24 Budget Update even after incorporating elevated, but temporary, cost-of-living support. The increase in the 4-year capital program means the government’s debt profile has shifted up since the 2023–24 Budget Update. General Government borrowings are now expected to reach $103.2 billion in 2026–27, which is $6.5 billion higher than the 2023–24 Budget Update. However, as the peak in capital spending in 2025–26 passes, the debt burden trajectory reduces.
Over the forward estimates the annual call on new borrowing to fund the state’s capital program declines as operating cash flows improve. By 2027–28 operating cash flows are expected to fund 64 per cent of net purchase of non-financial assets in spite of provisioning an additional $2 billion in operating expenses and $150 million in 2026–27.
By 30 June 2028 borrowing is expected to be $111.383 billion.
The defined benefit superannuation liability is projected to be $19.646 billion at 30 June 2024, $1.181 billion lower than expected in the 2023–24 Budget. This is predominantly due to a change in actuarial assumptions. By 30 June 2025 the superannuation liability is projected to be $19.478 billion and is expected to continue to decline over the forward estimates as bond rates
147
Budget Strategy and Outlook 2024-25
continue to recover, and members of the defined benefit fund retire. The fund has been closed to new entrants since 2008.
The composition of the General Government Sector’s forecast liabilities at 30 June 2025 is illustrated in Chart 6.3.
| Chart 6.3 | Forecast General Government Sector liabilities by category, as at 30 June 2025 |
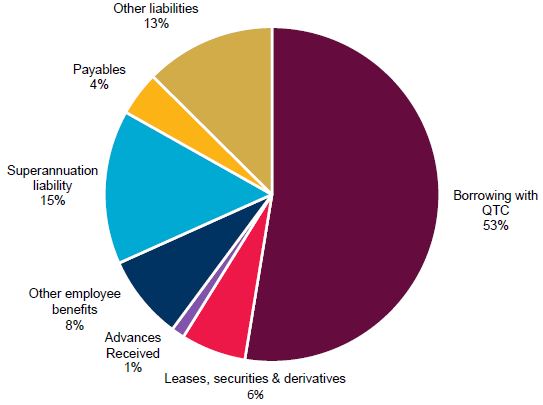
Non-financial Public Sector borrowing
The NFPS is a consolidation of the General Government and PNFC sectors, with transactions between these sectors eliminated.
PNFC debt is primarily held by GOCs and is supported by income-generating assets including key pieces of economic infrastructure.
NFPS borrowing is expected to be $108.569 billion by 30 June 2024, $2.069 billion lower than the 2023–24 Budget.
By 30 June 2028 NFPS borrowing is expected to be $171.987 billion.
148
Budget Strategy and Outlook 2024-25
| 6.2.4 | Net debt |
Net debt is the sum of borrowing and advances received, less the sum of cash and deposits, advances paid, and investments, loans and placements.
Net debt excludes certain assets and liabilities, such as superannuation and insurance liabilities. However, it still indicates the soundness of the government’s fiscal position, as high levels of net debt will require servicing through interest payments and limit flexibility to adjust expenditure.
Net debt for the General Government Sector in 2023–24 is estimated to be $12.223 billion, $3.967 billion lower than expected in the 2023–24 Budget. The lower net debt is predominantly due to lower borrowing requirements from improved net cash flows from operating activities and better than expected returns on the State’s long term assets.
The net debt to revenue ratio for the GGS in 2024–25 is forecast to be 31.1 per cent, an improvement compared to the ratio of 34.2 per cent in the 2023–24 Budget.
Queensland’s 2024–25 estimated net debt to revenue ratio of 31 per cent compares favourably to its peers at 88 per cent for New South Wales (2023–24 Half-yearly Review) and 163 per cent for Victoria (2024–25 Budget).
| 6.2.5 | Net financial liabilities |
Net financial liabilities are total liabilities, less financial assets other than equity instruments in other public sector entities. This measure is broader than net debt as it includes other significant liabilities rather than just borrowings (e.g. accrued employee liabilities such as superannuation and long service leave entitlements).
The net financial liabilities of the General Government Sector for 2023–24 are estimated to be $59.211 billion and are estimated to increase by $14.953 billion by 30 June 2025. This increase is commensurate with the expected increase in borrowings to invest in infrastructure to deliver economic growth and better services for Queenslanders.
| 6.2.6 | Net worth |
The net worth, or equity, of the state is the amount by which the state’s assets exceed its liabilities. This is the value of the investment held on behalf of the people of Queensland by public sector entities.
Changes in the state’s net worth occur for several reasons including:
| • | operating surpluses (deficits) that increase (decrease) the government’s equity |
| • | revaluation of assets and liabilities as required by accounting standards |
| • | movements in the net worth of the state’s investments in the PNFC and Public Financial Corporations sectors |
| • | gains or losses on disposal of assets – where the selling price of an asset is greater (less) than its value in an agency’s accounts, the resultant profit (loss) affects net worth. |
149
Budget Strategy and Outlook 2024-25
General Government Sector net worth was $303.973 billion at 30 June 2023. It is expected to increase to $314.884 billion in 2023–24.
Net worth has increased in 2023–24 with the increases in the value of non-financial assets and investments, including in other public sector entities.
The net worth of the NFPS is projected to steadily grow over the forward estimates to be $330.591 billion by 2027–28.
| 6.3 | Cash flows |
The cash flow statement provides the cash surplus (deficit) measure, which comprises the net cash flows from operating activities plus the net cash flows from investments in non-financial assets (or physical capital).
The General Government Sector cash deficit for 2023–24 is estimated to be $7.153 billion, which is $143 million higher than the deficit forecast at the time of the 2023–24 Budget. This followed a surplus of $10.167 billion in 2022–23.
A cash deficit of $11.076 billion is forecast for 2024–25, reducing to an estimated deficit of $4.565 billion in 2027–28.
Net cash flows from investments in financial assets for policy purposes include net cash flows from disposal or return of equity, net equity injections into GOCs and concessional loans and advances. Cash flows from the injection of equity into the PNFC and Public Financial Corporations sector are the primary driver of net outflows of $10.767 billion over the period from 2024–25 to 2027–28. These equity injections will largely support the QEJP and GOC infrastructure projects.
Net cash flows from investments in financial assets for liquidity purposes represent net investment in financial assets to, for example, cover liabilities such as superannuation and insurance, as well as deposits and withdrawals to or from the redraw facility with QTC and other specific investments.
Total General Government Sector PNFA of $12.831 billion are budgeted for 2024–25. Over the period from 2024–25 to 2027–28, General Government Sector PNFA are expected to total $54.656 billion as Queensland invests substantially in economic growth, health, housing, education, roads and rail infrastructure to provide better services and prepare for the Brisbane 2032 Olympic and Paralympic Games.
150
Budget Strategy and Outlook 2024-25
| 7 | Intergovernmental financial relations |
Features
| • | The federal financial relations framework recognises that coordinated action and clear lines of responsibility for funding and service delivery are crucial for maximising economic and social outcomes and to strategically position the nation for the future. |
| • | One of the Australian Government’s functions under this framework is to provide funding to states to deliver essential services and infrastructure, representing approximately 45 per cent of all Queensland’s General Government revenue in 2024–25. |
| • | It is estimated the Australian Government will provide the Queensland Government with $39.811 billion in 2024–25 ($622 million more than in 2023–24), comprising: |
| • | $19.923 billion1 in payments for specific purposes ($699 million more than 2023–24) |
| • | $1.364 billion in other Australian Government grants, including payments direct to Queensland Government agencies for Australian Government own-purpose expenditure ($857 million more than 2023–24) |
| • | $18.525 billion in payments for general purposes ($934 million less than 2023–24). Further detail is provided in Chapter 4. |
| • | Payments for specific purposes to Queensland in 2024–25 include: |
| • | $7.070 billion for National Health Reform funding |
| • | $6.980 billion for Quality Schools funding2 |
| • | $5.067 billion for National Partnership payments (including the Infrastructure Investment Program, Disaster Recovery Funding Arrangements (DRFA), National Energy Bill Relief, the South East Queensland City Deal and the Brisbane 2032 Olympic and Paralympic Games) |
| • | $450 million for National Skills Agreement funding |
| • | $355 million for National Agreement on Social Housing and Homelessness funding. |
| • | The Queensland Government provides considerable assistance to local governments, recognising the important services they provide to the community, and will provide a total of $3.550 billion to local governments in 2024–25. |
| 7.1 | Federal financial arrangements |
The Australian Government has greater capacity to raise revenue than is required to meet its service delivery responsibilities. Conversely, states and territories’ (states) ability to raise revenue is less than required to meet their service delivery and infrastructure responsibilities. This vertical
| 1 | Total payments for specific purposes may not add due to rounding. |
| 2 | Quality Schools funding includes payments for government schools (exclusive of GST) and non-government schools (inclusive of GST). |
151
Budget Strategy and Outlook 2024-25
fiscal imbalance (VFI) is addressed through a system of intergovernmental payments from the Australian Government to the states.
In 2022–23 the Australian Government collected 71.3 per cent of government revenue nationally, while states collected 23.3 per cent, with local governments responsible for the balance (5.4 per cent). Chart 7.1 illustrates the revenue and expense disparity between the different levels of government.
| Chart 7.1 | Own-source revenue and expenses by levels of government, 2022–231,2 |
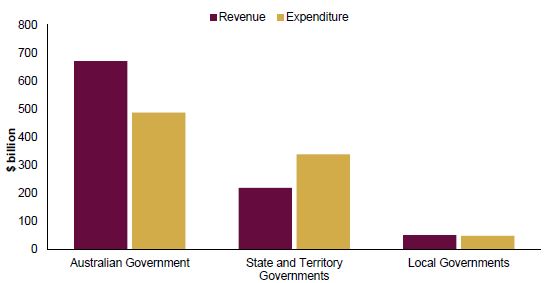
Notes:
| 1. | Revenue calculated as total revenue minus grant revenue. |
| 2. | Expenses calculated as total expenses minus grant expenses. |
Source: ABS Government Finance Statistics.
To address VFI, the Australian Government makes 2 types of payments:
| • | general revenue assistance payments (largely GST revenue) which can be used by states for any purpose (‘untied’ funding) |
| • | payments for specific purposes (‘tied’ funding) such as: |
| • | payments for National Health Reform, the National Skills Agreement, the National Agreement on Social Housing and Homelessness and Quality Schools funding, which are a contribution toward states’ service delivery priorities |
| • | National Partnership (NP) payments, which represent funding to support the delivery of specific priorities, outputs, or projects and to facilitate or incentivise reforms. |
Given the Australian Government’s significant revenue raising capability, states are heavily reliant on these intergovernmental transfers to provide essential services and infrastructure.
152
Budget Strategy and Outlook 2024-25
As part of the national governance arrangements, the Council on Federal Financial Relations — CFFR; chaired by the Australian Treasurer and comprising all state Treasurers — oversees national agreements and transfers between the Australian Government and states.
States have also formed the Board of Treasurers (the Board) to collaborate on common issues, advance national reform priorities from state perspectives, and promote united agenda setting in federal affairs. The Board is chaired by a state Treasurer on a rotational basis for a calendar year — Queensland was the Chair in 2023 and Western Australia is the Chair in 2024.
Key priority areas for CFFR and the Board in 2024 include health, housing, education, disability services, productivity and regulatory reform, and infrastructure. Part of Treasurers’ work on these priority areas includes overseeing negotiations of several major funding agreements that expire within the next 12 months (see Box 7.1).
This chapter largely focuses on the Australian Government’s payments for specific purposes (sections 7.2 to 7.4). Detail on GST revenue is provided in Chapter 4. Information on State–Local Government Relations is provided in section 7.5.
| 7.2 | Australian Government funding to states and territories |
In the 2024–25 Federal Budget Paper No.3: Federal Financial Relations, the Australian Government estimates it will provide funding of $185.931 billion in 2024–25 across all states, which is $9.859 billion (or 5.6 per cent) more than in 2023–24, comprising:
| • | $93.7 billion in payments as shares of general revenue assistance (i.e. GST revenue) ($2.369 billion more than in 2023–24) |
| • | $91.519 billion in payments for specific purposes ($7.554 billion more than in 2023–24) including: |
| • | $30.156 billion in Quality Schools funding |
| • | $30.149 billion in National Health Reform funding |
| • | $2.432 billion in National Skills Agreement funding |
| • | $1.778 billion in National Agreement on Social Housing and Homelessness funding |
| • | $3 billion in National Energy Bill Relief funding |
| • | $24.004 billion in National Partnership payments. |
| • | $711.4 million in other payments to states, including: |
| • | $666.1 million for certain royalty payments to Western Australia |
| • | $45.4 million for municipal services to the Australian Capital Territory. |
Australian Government payments for specific purposes may not fully fund all underlying programs. Most require states to provide matching financial or in-kind contributions. This reduces budget flexibility for states, particularly in cases where programs are not Queensland Government priorities or where the Australian Government dictates specific conditions related to the funding.
153
Budget Strategy and Outlook 2024-25
| Box 7.1 | Major funding agreements expiring in the next 12 months |
The Queensland Government is committed to collaborating with the Australian Government to secure sustainable and long-term funding arrangements for major service delivery and infrastructure funding agreements expiring within the next 12 months.
These agreements include the National Health Reform Agreement, National School Reform Agreement, National Housing and Homelessness Agreement and Land Transport Infrastructure Projects Agreement.
Combined, these 4 agreements account for $16.691 billion (83.8 per cent) of the $19.923 billion Queensland will receive in 2024–25 in specific purpose funding from the Australian Government.
Housing
The National Housing and Homelessness Agreement (NHHA) – an agreement between the Australian and state and territory governments to improve access to secure and affordable housing and homelessness services – will expire on 30 June 2024.
On 31 May 2024, Queensland signed a new 5-year National Agreement on Social Housing and Homelessness (NASHH), commencing 1 July 2024. Under the agreement, the Australian Government will contribute funding to the effective operation of Australia’s social housing and homelessness services and help those people who are at risk or are experiencing homelessness.
Health
The 2020–25 Addendum to the National Health Reform Agreement (NHRA) – an agreement between the Australian and state and territory governments to improve health outcomes for all Australians and ensure a sustainable health system – will expire on 30 June 2025.
Through this agreement the Australian Government contributes funds to states and territories for public hospital services, including services delivered through emergency departments, hospitals, and community health settings.
On 6 December 2023, National Cabinet endorsed reforms to strengthen the health system including increasing the Australian Government’s NHRA contribution to 45 per cent over a 10-year glide path from 1 July 2025 to 30 June 2035, with an achievement of 42.5 per cent before 2030, as well as a more generous approach to the funding cap.
The Queensland Government is working with the Australian Government to embed these long-term and system-wide structural health reforms in the new NHRA to achieve a sustainable and efficient health system that will give Australians better access to health services they need, when they need it.
154
Budget Strategy and Outlook 2024-25
Education
The National School Reform Agreement (NSRA) – an agreement between the Australian and state and territory governments to lift student outcomes across Australian schools – will expire at the end of 2024.
As the majority funder and operator of government schools, the Queensland Government is working with the Australian Government to ensure a well-resourced school system that enables better learning and wellbeing outcomes for all Queensland school students.
Land transport infrastructure
The National Partnership Agreement on Land Transport Infrastructure Projects – an agreement between the Australian and state and territory governments to deliver nationally significant infrastructure projects – will expire on 30 June 2024.
The Queensland Government will continue to advocate for the state’s fair share of national infrastructure funding to ensure Queensland will not be worse off and that the Australian Government maintains its current level of funding for transport corridors that connect the state’s dispersed population centres.
| 7.3 | Australian Government funding to Queensland |
It is estimated the Australian Government will provide the Queensland Government with $39.811 billion in 2024–25 ($622 million more than in 2023–24).
Australian Government funding is estimated to account for 45 per cent of Queensland’s total General Government Sector revenue sources in 2024–25 (shown in Chart 7.2).
155
Budget Strategy and Outlook 2024-25
| Chart 7.2 | General Government Sector revenue sources, Queensland 2024–251,2 |
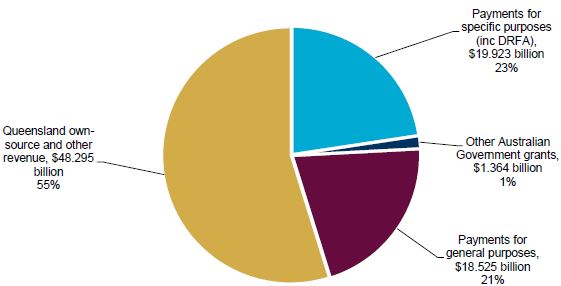
Notes:
| 1. | Queensland own-source and other revenue figure includes taxation revenue, sales of goods and services, royalties and land rents. |
| 2. | Queensland Treasury estimates. Other Australian Government grants include payments direct to Queensland Government agencies for Australian Government own-purpose expenditure. |
Sources: 2024–25 Federal Budget Paper No. 3 and Queensland Treasury estimates.
| Box 7.2 | Foundational supports for people with disability |
On 6 December 2023, National Cabinet agreed an initial response to the National Disability Insurance Scheme Review to secure the future of the NDIS and jointly develop and fund additional foundational supports for people with a disability. These were agreed alongside reforms to the National Health Reform Agreement (NHRA).
National Cabinet agreed funding for foundational supports would be split 50/50 by the Australian Government and states with costs to states capped and states and territories to be better off under the combined health and disability reforms.
National Cabinet tasked the Council on Federal Financial Relations (CFFR) to oversee the funding and costings for foundational supports and settle final funding details.
Queensland’s contribution is contingent on ongoing negotiation with the Australian Government on foundational supports and the finalisation of a new NHRA.
156
Budget Strategy and Outlook 2024-25
The Queensland Government is committed to working with the Australian Government to negotiate a deal that honours the National Cabinet agreement guaranteeing Queensland would be fiscally better off across both disability and health agreements and ensures Queenslanders with disability can access the right mix of support they need at the right time in a connected and inclusive way.
| 7.4 | Payments to Queensland for specific purposes |
In 2024–25, Queensland expects to receive $19.923 billion1 in payments for specific purposes, $699 million (3.6 per cent) more than in 2023–24.
Payments for specific purposes comprise funding for National Health Reform, Quality Schools, National Skills Agreement, National Agreement on Social Housing and Homelessness, and NP payments.
| 1 | Queensland Treasury estimates. |
157
Budget Strategy and Outlook 2024-25
| Table 7.1 | Estimated payments of Australian Government grants1 |
| 2022–23 Actual $ million | 2023–24 Est. Act. $ million | 2024–25 Budget $ million | ||||||||||
Payments for specific purposes | ||||||||||||
National Health Reform funding2 | 6,226 | 6,699 | 7,070 | |||||||||
Quality Schools funding3 | 6,255 | 6,769 | 6,980 | |||||||||
National Skills Agreement funding4 | 331 | 391 | 450 | |||||||||
National Agreement on Social Housing and Homelessness funding5 | 344 | 355 | 355 | |||||||||
National Partnership payments (incl. DRFA) | 4,927 | 5,009 | 5,067 | |||||||||
Total payments for specific purposes | 18,083 | 19,223 | 19,923 | |||||||||
Other Australian Government grants6 | 1,461 | 506 | 1,364 | |||||||||
Total payments for specific purposes and other Australian Government grants | 19,545 | 19,730 | 21,286 | |||||||||
Notes:
| 1. | Numbers may not add due to rounding. |
| 2. | Includes funding for the COVID-19 public health response of $188.707 million in 2022–23. The National Partnership on COVID-19 Response expired on 31 December 2022. |
| 3. | Quality Schools funding includes payments for government schools (exclusive of GST) and non-government schools (inclusive of GST). |
| 4. | The National Skills Agreement commenced on 1 January 2024, replacing the National Agreement on Skills and Workforce Development. |
| 5. | The National Agreement on Social Housing and Homelessness will replace the National Housing and Homelessness Agreement from 1 July 2024. |
| 6. | Includes direct Australian Government payments to Queensland agencies for Australian Government own-purpose expenditure (e.g. financial assistance to local governments and funding to Hospital and Health Services). |
Sources: 2024–25 Federal Budget Paper No. 3 and Queensland Treasury estimates.
In 2024–25, National Health Reform funding, which accounts for 35.5 per cent of the total payments for specific purposes, is estimated to increase by $371 million (5.5 per cent) from 2023–24.
Queensland Government projections of National Health Reform funding differ from the projections contained in the 2024–25 Federal Budget as Australian Government projections represent cash payments made in the financial year (rather than the entitlement amount for the financial year) and include adjustments for services delivered in prior years. Actual National Health Reform payments vary from estimates provided in budget papers as they are based on actual public hospital activity delivered each year.
Quality Schools funding, which accounts for around 35 per cent of total payments for specific purposes, is estimated to increase by $212 million (3.1 per cent) to $6.980 billion in 2024–25.
158
Budget Strategy and Outlook 2024-25
The National Skills Agreement (NSA) commenced on 1 January 2024, replacing the National Agreement on Skills and Workforce Development (NASWD). Funding in 2023–24 reflects combined estimates for NASWD (1 July 2023 to 31 December 2023) and the NSA (1 January 2024 to 30 June 2024). NSA funding is estimated to increase by $59 million (15 per cent) to $450 million in 2024–25.
The National Agreement on Social Housing and Homelessness (NASHH) will replace the National Housing and Homelessness Agreement (NHHA) from 1 July 2024. NASHH funding in 2024–25 is $355 million, which is unchanged from 2023–24.
NP payments (including DRFA) account for 25.4 per cent of the total payments for specific purposes in 2024–25. It is estimated to increase by $58 million (1.2 per cent) from 2023–24 to 2024–25. A significant proportion of NP payments in 2024–25 is allocated to infrastructure, DRFA and other (refer to Chart 7.3).
| Chart 7.3 | National Partnership Payments by sector, 2024–251 |
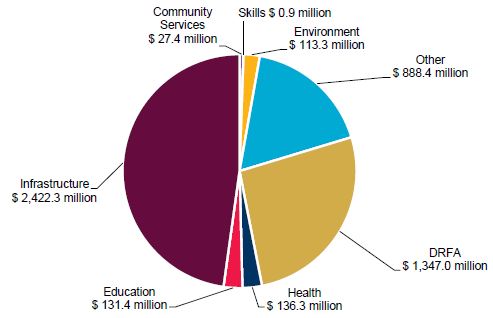
Note:
| 1. | Excludes Australian Government funding to local government and payments direct to Queensland Government agencies for Australian Government own-purpose expenditure. |
Sources: 2024–25 Federal Budget Paper No. 3 and Queensland Treasury estimates.
The increase in NP payments in 2024–25 is mainly due to the Australian Government extending its Energy Bill Relief Fund, to provide $300 to all Queensland households and $325 to small businesses in 2024–25. Increases in NP payments are partly offset by the cessation of Australian Government funding under the DisabilityCare Australia Fund.
Other Australian Government grants include payments direct to Queensland Government agencies for Australian Government own-purpose expenditure.
159
Budget Strategy and Outlook 2024-25
In 2024–25, Queensland expects to receive $1.364 billion in other Australian Government grants, $857 million (169.2 per cent) more than in 2023–24. The significant increase is mainly due to the Australian Government’s bring forward of financial assistance to local governments from 2023–24 to 2022–23.
| 7.4.1 | Projections of payments for specific purposes to Queensland |
Across the forward estimates, total payments for specific purposes (including DRFA payments) are expected to increase modestly, with average growth of approximately 1.2 per cent between 2024–25 and 2027–28. If the impact of DRFA payments is removed, the average growth of total payments for specific purposes is expected to be 3.6 per cent between 2024–25 and 2027–28.
National Health Reform funding is expected to grow by an average of 6.5 per cent over the forward estimates. Under the NHRA, the Australian Government will fund 45 per cent of efficient growth in hospital activity subject to a national growth cap of 6.5 per cent per annum. Current estimates are based on this methodology.
Growth in Quality Schools funding for Queensland is expected to average 3.8 per cent between 2024–25 and 2027–28 in line with enrolment changes, increased funding per student and legislated Australian Government funding shares. Queensland is expecting to receive $10.768 billion for state schools and $18.796 billion (including GST) for non-government schools from 2024–25 to 2027–28.
DRFA payments of $3.796 billion are estimated from 2023–24 to 2026–27. These mainly reflect Australian Government funding for eligible expenditure under DRFA for Queensland disaster events in 2021–22, 2022–23 and 2023–24.
| 7.4.2 | Expiring agreements |
Under the Intergovernmental Agreement on Federal Financial Relations, the Australian Government provides time-limited funding to states through NP payments to support the delivery of specific projects, facilitate reforms or reward states that deliver on nominated reforms or service delivery improvements.
Over time, some NPs have been extended beyond their intended time-limited purpose. NPs were never intended, and are not considered the optimal way, to fund ongoing services to meet community needs.
Expiring NP agreements that support long standing and effective services or programs leave states with limited opportunities to appropriately manage consequences as final funding decisions are made through the Australian Government’s budget process.
Early indication from the Australian Government as to the continuation, lapse, or other treatment of funding for an expiring agreement is necessary to enable states to effectively manage their service delivery responsibilities.
160
Budget Strategy and Outlook 2024-25
There are 29 agreements1 expected to expire in 2023–24. At the 2024–25 Federal Budget, the Australian Government allocated funding beyond 2023–24 for 17 expiring agreements, including the following key agreements:
| • | National Partnership Agreement on Land Transport Infrastructure Projects – a new 5-year agreement is currently under negotiation, with funding allocated over the forward estimates |
| • | Management of Torres Strait / Papua New Guinea cross-border health issues – funding extended to 2027–28 |
| • | Mosquito control in the Torres Strait Protected Zone – funding extended to 2027–28 |
| • | Addressing blood-borne viruses and sexually transmissible infections in the Torres Strait – funding extended to 2027–28 |
| • | Specialist dementia care program – national funding allocated over 3 years from 2024–25 to continue the program, with state allocations yet to be finalised |
| • | Comprehensive palliative care in aged care program – funding extended to 2025–26 |
| • | Hummingbird House – funding extended to 2024–25 |
| • | Implementing water reform in the Murray-Darling Basin – national funding allocated to continue implementation of the Murray-Darling Basin Plan, with state allocations yet to be finalised |
| • | Great Artesian Basin Water Security Program – funding extended to 2027–28. |
The 2024–25 Federal Budget did not allocate funding beyond 2023–24 for 4 expiring funding agreements:
| • | DisabilityCare Australia Fund |
| • | Primary Care Pilots |
| • | Disaster Risk Reduction |
| • | Ehrlichia Canis Pilot Program. |
A funding extension or renewal was not sought for the remaining 8 expiring agreements due to the short-term nature of the program or completion of the project. These include completion of the Cunnamulla Hot Springs and Warrego River Walk and the multi-use conveyor at Port of Bundaberg, one-off funding boost for the Student Wellbeing and BreastScreen Australia programs, and temporary funding for the Raine Island Recovery project.
| 7.5 | State-local government financial relations |
The Queensland Government allocates considerable funding in the 2024–25 Queensland Budget to support local governments across the state. This recognises the critical role local governments play in supporting their local communities.
In 2024–25, the Queensland Government will provide a total of $3.550 billion in grants to local governments.
| 1 | Includes any expiring schedules to Federation Funding Agreements. |
161
Budget Strategy and Outlook 2024-25
This includes recurrent and capital grants to local government authorities and Indigenous councils, as well as Australian Government grants paid through the state to local governments.
Grants to local governments are delivered through numerous Queensland Government departments and agencies for a variety of purposes, including through the programs discussed below.
A summary of Queensland Government grant programs that have been made exclusively available to local governments are listed in Table 7.2.
| Table 7.2 | Grant programs exclusively available to local governments |
Program name | Description | Total funding (from 2015–16 to 2027–28) | ||
| Works for Queensland | Supports local governments in regional areas to undertake job creating maintenance and minor infrastructure works. | $1.1 billion | ||
| COVID-19 Works for Queensland | Supports all local governments to respond to and recover from the COVID-19 pandemic to deliver job creating new infrastructure, maintenance or minor works projects. | $200 million1 | ||
| South East Queensland Community Stimulus Program | Supports South East Queensland local governments to fast-track investment in new infrastructure and community assets that create jobs and deliver economic stimulus to local communities. | $200 million | ||
| Unite and Recover Community Stimulus Package | Supports South East Queensland local governments to recover from the COVID-19 pandemic by fast-tracking investment in new infrastructure and community assets that create jobs and deliver economic stimulus to local communities. | $50 million2 | ||
| Transport Infrastructure Development Scheme | Provides targeted investment in regional local government transport infrastructure. | $939.8 million3 | ||
| Building our Regions | Provides funding for critical infrastructure in regional areas to support economic development, including generating jobs. | $418.3 million | ||
| Local Government Grants and Subsidies Program | Provides funding for priority infrastructure projects that will enhance sustainable and liveable communities. | $376.9 million3 | ||
| Coastal Hazard Adaptation Program – QCoast2100 | Assists coastal local governments to prepare plans and strategies for addressing the impact of climate change. | $20.2 million | ||
| Queensland Water Regional Alliances Program | Assists regional councils to collaborate and improve the efficiency and administration of water infrastructure. | $18 million | ||
Notes:
| 1. | This program is a stimulus measure in response to the COVID-19 pandemic and expenditure will cease in 2024–25. |
| 2. | This program has ceased in 2023–24. |
| 3. | Funding is ongoing. Figure is based on current projections. |
In addition to the above grant programs, the Queensland Reconstruction Authority (QRA) administers funding available under the Disaster Recovery Funding Arrangements, which is a
162
Budget Strategy and Outlook 2024-25
joint funding initiative of the Queensland and Australian Governments to provide disaster relief and recovery payments to help communities recover following the effects of natural disasters.
Under these arrangements, the Queensland Government administers significant funding to local governments (more than $1.214 billion expected in 2024–25), including to provide disaster relief and assist with reconstruction of local government infrastructure damaged during natural disasters. The amount of funding administered is dependent on the final number and value of claims submitted.
QRA also administers several resilience programs of the Queensland and Australian Governments to support disaster mitigation projects and build resilience to natural disasters. These programs include the Queensland Resilience and Risk Reduction Fund, the North Queensland Natural Disasters Mitigation Program, and the National Flood Mitigation Infrastructure Program.
The Queensland Government also understands there are added challenges and disadvantages faced by Indigenous councils to ensure their communities have access to essential services and critical infrastructure, including low populations, remoteness and dispersion. To help address these challenges, the Queensland Government has allocated substantial operating funding to specifically support Indigenous councils and their communities.
The 2024–25 Budget commits $25.8 million in 2024–25 and 2025–26 in addition to existing funding for the Indigenous Council Funding Program. The 2024–25 Budget also commits an additional $10 million over 2 years from 2024–25 to establish an entity to support Indigenous Councils.
A summary of grant programs that have been made available to Indigenous councils and their communities are listed in Table 7.3.
163
Budget Strategy and Outlook 2024-25
| Table 7.3 | Grant programs to support Indigenous councils and their communities |
Program name | Description | Total funding (from 2015–16 to 2027–28) | ||
| Indigenous Council Funding Program | Assists Indigenous councils to address financial sustainability and capacity issues. | $306.7 million | ||
| Indigenous Councils Critical Infrastructure Program | Contributes to the cost of water, wastewater and solid waste infrastructure in Indigenous communities. | $120 million | ||
| Indigenous Economic Development Grant | Contributes funding towards service positions to support permanent jobs that deliver local government services. | $11.51 million | ||
| Major Infrastructure Program | Deliver environmental, health and other infrastructure upgrades within the Torres Strait Island Regional Council, Torres Shire Council and Northern Peninsula Area Regional Council areas. | $15 million | ||
| Revenue Replacement Program | Provided funding to assist Indigenous councils that have divested or surrendered profitable liquor licenses. | $28.21 million | ||
| State Government Financial Aid | A financial contribution (in lieu of rates) to meet the costs incurred by Indigenous councils in the provision of local government services. | $265.71 million | ||
| Indigenous Local Government Sustainability Program (2016–18) | Assisted Indigenous councils to increase their capacity, capability and sustainability. | $7.7 million |
Note:
| 1. | These grant programs ceased at the end of the 2022–23 financial year and were replaced by the Indigenous Council Funding Program. The table reports Funding for the Indigenous Council Funding Program from the 2023–24 financial year to avoid double counting of the original ceased programs. |
164
Budget Strategy and Outlook 2024-25
| 8 | Public Non-financial Corporations Sector |
Features
| • | Entities in the Public Non-financial Corporations (PNFC) Sector provide essential services such as electricity supply and distribution, bulk water supply, rail, and port services. |
| • | The Queensland Government is committed to maintaining public ownership of its assets and expects businesses to operate commercially and efficiently, and to work towards continually improving services to Queenslanders. |
| • | The PNFC Sector is estimated to achieve earnings before interest and tax (EBIT) of $3.062 billion in 2024–25 and remain higher over the forward estimates. In 2024–25, PNFC Sector dividends are expected to be $1.048 billion, with cumulative dividends of $3.917 billion over the 4 years to 2027–28. |
| • | The 2024–25 Budget includes a landmark capital investment of around $26 billion over the 4 years to 2027–28 to deliver on the Queensland Energy and Jobs Plan (QEJP). The government’s publicly-owned energy businesses are leading Queensland’s energy transformation investing in new wind, solar, storage and transmission. |
| • | Government entities are progressing an investment pipeline of renewables, batteries, gas, pumped hydro energy storage and the transmission SuperGrid, including CopperString 2032 connecting the North West Minerals Province to the electricity grid. |
| • | Increased borrowings over the forward estimates primarily reflect capital requirements to deliver the QEJP, transform the rail network, and ensure water security across the state. |
| • | Key projects in the water sector in 2024–25 include construction of the Fitzroy to Gladstone and Toowoomba to Warwick pipelines, and dam improvement works across Paradise, Burdekin Falls, Somerset, Wivenhoe, North Pine and Lake Macdonald dams. |
| • | Major transport sector projects in 2024–25 include continued delivery of critical rail infrastructure to support the reconfiguration of the South East Queensland rail network, the expansion of the Cairns Marine Precinct, the Channel Capacity Upgrade at the Port of Townsville and the Northern Land Expansion Project at the Port of Gladstone. |
| • | The 2024–25 Budget delivers a record $2.965 billion in additional electricity support for Queensland households and small businesses facing cost-of-living pressures. |
| • | All Queensland households will automatically receive $1,300 off their electricity bills from July 2024, consisting of a $1,000 Cost of Living Rebate from the Queensland Government and a $300 rebate from the Australian Government. Vulnerable households will continue to receive the $372 Electricity Rebate for a total of $1,672 support in 2024–25. |
| • | Since 2018, all Queensland households will have received $2,425 in electricity bill rebates, including the $1,300 rebate in 2024–25. |
| • | Around 205,000 eligible small businesses will also receive $650 off electricity bills in 2024–25, co-funded by the Queensland and Australian Governments. |
165
Budget Strategy and Outlook 2024-25
| 8.1 | Context |
Entities comprising the PNFC Sector provide vital services such as electricity supply and distribution, water supply, rail, and port services.
Queensland government-owned corporations (GOCs), declared by regulation under the Government Owned Corporations Act 1993 (GOC Act), comprise a large share of the PNFC Sector. The sector also comprises commercialised statutory entities, including Queensland Rail, Queensland Bulk Water Supply Authority (trading as Seqwater), local water boards, and other public corporations (such as Queensland Hydro and Stadiums Queensland).
GOCs are accountable for their financial performance and must operate commercially and efficiently. These requirements are legislated under the GOC Act, with similar provisions made in the enabling legislation of Queensland Rail and Seqwater.
Entities incur costs and bear commercial risks in the delivery of their services or products, and target a commercial rate of return from the sale of these services or products to sustain ongoing investment and performance. Returns from the PNFC Sector contribute to consolidated revenue and are used to pay for various government services, including investment into critical infrastructure delivered by PNFC Sector entities.
The government uses Community Service Obligation (CSO) payments to subsidise particular services, ensuring they can be offered to the community at prices lower than would otherwise be possible if full cost recovery and normal margins were applied.
An example is the CSO paid to Energy Queensland Limited (EQL) to provide electricity in regional Queensland at prices based on the costs of supply in South East Queensland, in accordance with the government’s Uniform Tariff Policy. This policy ensures that electricity prices for most customers in regional Queensland are much lower than would otherwise be the case.
The commercial nature of the PNFC Sector entities ensures debt is self-supporting and net worth continues to grow over the forward estimates.
The Queensland Government has a strong ongoing commitment to maintain public ownership of the entities in the PNFC Sector. Public ownership of electricity, port, rail and water infrastructure provides the Queensland Government with opportunities to support strategic investment in a growing economy and achieve better outcomes for all Queenslanders.
166
Budget Strategy and Outlook 2024-25
| Box 8.1 | Delivering for the regions |
The new progressive coal royalty tiers announced in the 2022–23 Budget ensure that Queenslanders receive a fair return on their limited and valuable natural resource.
In the 2022–23 Budget Update, the government committed to utilise the uplift in royalty revenue to fund $4 billion in productivity enhancing investments across regional Queensland. This is supporting investments across energy, water and ports sectors which will underpin Queensland’s future economic prosperity.
In the 2023–24 Budget, the Queensland Government committed to an additional $6 billion in funding for the Borumba Pumped Hydro Energy Storage (PHES), bringing the government’s total equity commitment to $10 billion for regional PNFC Sector infrastructure projects directly funded by coal royalties.
These projects are continuing to progress and deliver benefits for the regions.
| • | $1.06 billion towards CopperString 2032, supporting the construction of a transmission line from Townsville to Mount Isa, connecting Queensland’s North West Minerals Province to the National Electricity Market. Construction is on track to begin later in 2024 with project completion in 2029. |
| • | $7 billion towards state-owned, large-scale, long-duration pumped hydro, including $6 billion for the Borumba PHES over the construction period and $1 billion for the Pioneer-Burdekin PHES. |
| • | $550 million supporting construction of the Fitzroy to Gladstone Pipeline, which commenced last year. The government has since committed a further $365 million to complete construction and operationalise the pipeline, improving long-term water security in the region. |
| • | $500 million for CleanCo to develop a 2.3-gigawatt (GW) portfolio of wind and solar projects in Central Queensland. In 2023–24, CleanCo announced the Moah Creek Wind Farm, to be publicly-owned and operated, is already being progressed through its development partnership with Central Queensland Power. |
| • | $440 million towards Sunwater’s Burdekin Falls Dam Raising and Improvement Project, improving and raising the dam by 2 metres to further support water security, bringing the total funding commitment on the project to $540 million. Sunwater will continue to progress design and environmental approvals in 2024–25. |
| • | $300 million to CS Energy towards 100 per cent public ownership of the $1.3 billion 285-megawatt (MW) Lotus Creek Wind Farm, with construction commencing mid-2024 and operations from 2027, supporting decarbonisation in Central Queensland. |
| • | $100 million for Gladstone Ports Corporation to progress the $116 million Northern Land Expansion Project. Approvals and design have progressed with construction to commence in late 2024. The project will provide additional land at the Port of Gladstone to assist the development of renewable energy and other industries. |
| • | $50 million for North Queensland Bulk Ports to replace the ageing Bowen Wharf. Investigations and a community-led design process have progressed throughout 2023–24. |
167
Budget Strategy and Outlook 2024-25
| Table 8.1 | Key financial aggregates1 |
| 2022–23 Outcome $ million | 2023–24 Budget $ million | 2023–24 Est. Act. $ million | 2024–25 Budget $ million | 2025–26 Projection $ million | 2026–27 Projection $ million | 2027–28 Projection $ million | ||||||||||||||||||||||
Revenue | 16,270 | 15,746 | 16,527 | 16,963 | 17,630 | 18,395 | 19,693 | |||||||||||||||||||||
Expenses | 15,222 | 15,116 | 15,269 | 16,347 | 17,136 | 18,188 | 19,519 | |||||||||||||||||||||
EBIT2 | 2,455 | 3,829 | 3,526 | 3,062 | 3,417 | 3,416 | 3,231 | |||||||||||||||||||||
PNFA3 | 4,497 | 5,849 | 6,366 | 9,410 | 11,269 | 10,029 | 9,568 | |||||||||||||||||||||
Assets | 84,526 | 82,492 | 88,870 | 94,090 | 102,484 | 110,330 | 118,034 | |||||||||||||||||||||
Borrowings | 49,101 | 45,166 | 46,618 | 47,596 | 52,141 | 56,659 | 60,611 | |||||||||||||||||||||
Notes:
| 1. | Numbers may not add due to rounding. |
| 2. | EBIT (earnings before interest and tax) reflects the commercial nature of the sector. Net operating balance is reported in Chapter 9. |
| 3. | PNFA: Purchases of non-financial assets. |
| 8.1.1 | Electricity networks |
The government owns 2 electricity network businesses, Powerlink Queensland and EQL, which are responsible for transporting safe, reliable electricity to consumers across the state.
Revenues for the network businesses are largely derived from network services that are regulated by the Australian Energy Regulator (AER). The AER determines these revenues on a 5-yearly basis, based on the businesses’ proposals and its view of the reasonable benchmark efficient costs for a network business.
Powerlink
Powerlink owns, develops, operates, and maintains the electricity transmission network in Queensland. Its network spans approximately 1,700km from north of Cairns to the New South Wales border and comprises 15,345km of transmission lines and 147 substations.
Powerlink’s role in the electricity supply chain is to transmit high voltage electricity through its transmission grid to distribution networks. Powerlink also transmits electricity to high-usage industrial customers such as rail companies, mines, and mineral processing facilities, and to New South Wales via the Queensland/New South Wales interconnector transmission line.
Under the QEJP, Powerlink is delivering the Queensland SuperGrid, CopperString 2032, and Renewable Energy Zones. Powerlink will drive coordinated and efficient development of network infrastructure to connect new renewable energy generation and storage to the electricity grid.
168
Budget Strategy and Outlook 2024-25
| Box 8.2 | CopperString 2032 |
The Queensland Government is investing $5 billion in CopperString 2032 to connect Queensland’s North West Minerals Province to the National Electricity Market.
Powerlink is delivering CopperString 2032, to be Australia’s largest transmission project and one of the most significant investments in economic infrastructure ever seen in North Queensland. It will unlock one of Australia’s largest renewable energy zones and potentially more than $500 billion in new critical minerals in North Queensland. The project has the potential to support around 800 direct jobs over its construction period (to 2029), and thousands more in critical minerals mining and renewable energy industries.
In October 2023, the government announced a $1.3 billion Delivery Launch Package to progress the project, which is supporting early works and construction later in 2024, and including 100 project jobs, procurement of electrical equipment with long lead times, completion of all site investigations, detailed planning and design, and advancement of site infrastructure works, including camps and access works.
This work package is supported by the $1.06 billion equity allocated to CopperString 2032 in the 2023–24 Budget, made available from revenues from progressive coal royalties.
As part of project delivery, Powerlink is working to maximise local employment and procurement opportunities. Powerlink has developed tailored engagement programs with Traditional Owners and First Nations stakeholders to ensure opportunities for Indigenous-owned businesses in the delivery of CopperString 2032.
Energy Queensland Limited
EQL owns and operates the low-voltage distribution network that transmits electricity from Powerlink’s transmission network to households and businesses across Queensland. EQL has several operating subsidiary businesses, including Ergon Energy Network, Ergon Energy Retail, Energex and Yurika. EQL is Australia’s largest, wholly government-owned electricity business with more than 8,700 employees across Queensland.
In regional Queensland, Ergon Energy Network and Ergon Energy Retail provide distribution network and customer retail services, respectively, while in South East Queensland, Energex provides distribution network services to customers.
Yurika provides a range of other service delivery functions including demand management services, large-scale connections, microgrid solutions, the provision of contestable metering services and telecommunications infrastructure.
EQL is delivering a significant capital works program to maintain a safe and reliable network and support Queensland’s energy transformation. Across Queensland, EQL is also connecting network batteries to store extra energy generated from household solar and increase electricity supply during peak periods and installing electric vehicle charging stations.
169
Budget Strategy and Outlook 2024-25
| 8.1.2 | Electricity generation |
Queensland has 3 electricity generation GOCs – CleanCo, CS Energy and Stanwell. Public ownership of generation assets positions Queensland to transform the state’s energy system and deliver the government’s decarbonisation objectives – 50 per cent renewables by 2030, 70 per cent by 2032, and 80 per cent by 2035 – and reach net zero emissions by 2050.
CleanCo
CleanCo owns and operates a portfolio of low and no emissions generation assets, and has offtake agreements with wind and solar farms in the Western Downs, Far North Queensland, and Wide Bay – Burnett region.
CleanCo is continuing to grow its renewable energy and storage portfolio, including to build, own and operate the 250 MW Swanbank Battery and working with partners to develop a publicly-owned and operated renewable energy portfolio of up to 2.3 GW in Central Queensland. By delivering clean and reliable energy, CleanCo is supporting the sustainable energy goals of major commercial customers, including BHP, Coles, Wesfarmers, and Frucor Suntory.
CS Energy
CS Energy is a major supplier of electricity across Queensland, with an energy portfolio of around 3,500 MW, including the wholly-owned Callide B and Kogan Creek Power Stations and a 50 per cent interest in the Callide C Power Station. CS Energy is party to the Gladstone Interconnection and Power Pooling Agreement, and trades output of the Gladstone Power Station that exceeds the electricity requirements of the Boyne Island Aluminium Smelter.
CS Energy is investing in new renewable energy, storage, gas and hydrogen. The Greenbank Battery, Brigalow Hydrogen-ready Gas Peaking Plant, Boulder Creek and Lotus Creek Wind Farms in Central Queensland, and Kogan Renewable Hydrogen Project are all being supported through the Queensland Renewable Energy and Hydrogen Jobs Fund.
CS Energy provides retail services to large commercial and industrial customers across Queensland, and has a 50/50 joint venture with Alinta Energy to supply electricity to residential and small business customers in South East Queensland.
Stanwell
Stanwell is a major supplier of electricity across Queensland, with an energy portfolio of around 3,300 MW from its 3 coal-fired power stations in Queensland. Stanwell also sells electricity directly to large commercial and industrial customers in Queensland and interstate.
Stanwell is advancing a pipeline of new energy projects across Queensland, focusing on renewable generation, storage and hydrogen. Stanwell has offtake agreements with several renewable projects, including the Mount Hopeful and Clarke Creek Wind Farms in Central Queensland, and Blue Grass Solar Farm and MacIntyre Wind Farms in Southern Queensland.
170
Budget Strategy and Outlook 2024-25
Stanwell is continuing progress on Tarong West Wind Farm, Wambo Wind Farm Stages 1 and 2 (in partnership with Cubico Sustainable Investments), and the Front End Engineering Design Study of the Central Queensland Hydrogen Project near Gladstone (alongside its consortium of international partners).
| Box 8.3 | Queensland Energy and Jobs Plan |
The Queensland Energy and Jobs Plan (QEJP) charts an infrastructure investment pathway to 2035, including 2 large-scale pumped hydro projects in regional Queensland, 22 GW of new renewable energy generation and major new transmission lines across the state which will form Queensland’s SuperGrid.
Queensland’s publicly-owned energy GOCs are leading the state’s energy transformation by building, owning, and operating new renewable energy and storage, and partnering with the private sector to deliver clean and reliable energy to customers across the state.
Through direct equity or offtake agreements, our energy GOCs are cornerstone investors supporting around 5 GW of new generation and 1.15 GW of large-scale battery storage in Queensland by 2027–28, while they continue to pursue substantial further opportunities across the state. This includes CleanCo’s 2.3 GW wind and solar development portfolio in Central Queensland.
Building on the momentum of the last budget, the 2024–25 Budget includes a landmark capital investment of around $26 billion over the 4 years to 2027–28 to support the QEJP, including:
| • | $16.5 billion for renewable energy and storage projects |
| • | $8.5 billion for transmission infrastructure, including CopperString 2032, SuperGrid and renewable energy zone transmission works |
| • | $500 million for distribution network storage, including EQL’s Local Network Battery Plan and Local Renewable Energy Zone Pilot Projects |
| • | $192 million for Powerlink to develop Transmission and Training Hubs in Townsville and Gladstone. |
These projects are being funded by a mix of coal royalties set aside in the 2023–24 Budget, the $4.5 billion Queensland Renewable Energy and Hydrogen Jobs Fund, and GOC borrowings.
During the energy transformation, the government is ensuring energy workers at existing publicly-owned coal fired power stations and associated coal mines have access to new jobs and training or financial assistance through the $150 million Job Security Guarantee Fund. This framework will complement the conversion of publicly-owned power station sites into clean energy hubs by 2035.
171
Budget Strategy and Outlook 2024-25
| 8.1.3 | Rail |
Queensland Rail is an integrated, publicly-owned rail operator, responsible for delivery of passenger transport in South East Queensland, long distance passenger services in rural and regional Queensland, and third-party access to networks for freight transport across the state.
Rail services form a critical part of South East Queensland public transport system. The reduction of all public transport fares to 50 cents will support commuters, reduce road congestion and increase rail patronage.
The majority of services are delivered under a Rail Transport Services Contract (TSC) with the government, represented by the Department of Transport and Main Roads. The Rail TSC provides funding for rail infrastructure, Citytrain (South East Queensland passenger services) and Traveltrain (regional passenger services).
In 2024–25, Queensland Rail will continue to work with external partners and support delivery of significant new rail infrastructure to transform the Citytrain network, including the Cross River Rail project, new stations and accessibility upgrades, modern signalling equipment and additional train stabling capacity. These investments will increase rail service delivery for the state’s growing population and support local manufacturing supply chains and jobs in regional areas.
| 8.1.4 | Ports |
Queensland has a large network of ports along its coastline that are owned and run by GOCs.
These businesses — Gladstone Ports Corporation (GPC), North Queensland Bulk Ports Corporation (NQBP), Port of Townsville Limited (POTL) and Far North Queensland Ports Corporation Limited (trading as Ports North) — own and operate a range of assets from small facilities serving local communities to large, world class multi-user and multi-cargo ports, which have public and privately owned import and export facilities.
Queensland’s ports play an essential role in our supply chain networks by planning and delivering strategic projects which facilitate trade activity. Their ongoing efficient and responsible operation is critical to economic growth, job creation and sustainable development across the state.
Major port projects continuing throughout 2024–25 include:
| • | commissioning of the new wider shipping channel to allow access for larger ships following completion of the $251 million Port of Townsville Channel Upgrade Project |
| • | GPC progressing the $116 million Northern Land Expansion Project involving the construction of a bund wall for a new reclamation area at Gladstone Port’s Northern Trade Precinct near Fisherman’s Landing, which supports the release of additional land at the port to assist the development of renewable energy and other industries |
| • | expansion of the Cairns Marine Precinct with the development of a Common User Facility. The facility will include a 5,000 tonne shiplift, 3 hardstand areas, 2 blast and paint sheds and wet berth capacity to cater for vessels up to 120 metres in length. The Queensland Government has committed $180 million towards the project with the Australian Government co-contributing a further $180 million. |
172
Budget Strategy and Outlook 2024-25
| 8.1.5 | Water |
The 2 largest entities in the Queensland bulk water supply industry are the Queensland Bulk Water Supply Authority (trading as Seqwater) and Sunwater Limited (Sunwater). Other water entities in the PNFC Sector include the Gladstone Area Water Board and Mount Isa Water Board.
Seqwater is primarily responsible for supplying safe, secure and reliable bulk drinking water for over 3 million people across South East Queensland. Its assets and operations are spread across a large geographic area from the New South Wales border to the base of the Toowoomba ranges and as far north as Gympie. In the future, the network will connect further west to Warwick via delivery of the Toowoomba to Warwick Pipeline.
Seqwater also provides essential flood mitigation services, manages 7 water supply schemes which provide irrigation services and provides a range of community recreation facilities.
Sunwater is the government’s major bulk water supply business for regions outside of South East Queensland. It supplies untreated bulk water to approximately 5,000 customers across the industrial, mining, urban and irrigation customer segments. Sunwater oversees an extensive regional asset base, owning and managing water infrastructure assets with a replacement value of around $14 billion.
In 2024–25, the Queensland Government is delivering increased water security, fortifying the flood resilience of water infrastructure and ensuring the ongoing safety and reliability of dams through state-owned water businesses. Major projects include:
| • | construction of the $983 million Fitzroy to Gladstone Pipeline, enabling long term water security and economic opportunity in the Central Queensland region |
| • | delivery of the $273.1 million Toowoomba to Warwick Pipeline, part of a more than $300 million investment for water security in the Toowoomba and Southern Downs regions |
| • | planning and delivery works for improvements to Paradise, Burdekin Falls, Somerset, Wivenhoe, North Pine, Lake Macdonald, Awoonga and other dams, totalling $303.4 million in 2024–25. |
| 8.1.6 | Other |
Queensland Hydro
Established as a publicly-owned entity in 2022, Queensland Hydro is tasked with the development, delivery, ownership, and operation of the large-scale, long-duration pumped hydro storage assets that will be the cornerstone of Queensland’s future energy system. These assets will be critical to Queensland’s energy transformation, supporting renewable energy and system security by absorbing excess renewable generation and dispatching it in peak demand periods.
In 2023–24, the government approved proceeding with the $14.2 billion, 2 GW, 24-hour Borumba PHES, subject to final approvals. The project is located south west of Gympie. In 2024–25, Queensland Hydro is investing $935.9 million to progress approvals, continue exploratory works and procure the main works for this project.
173
Budget Strategy and Outlook 2024-25
In 2023–24, the Queensland Government provisioned $1 billion of equity to support the assessment, feasibility and progress of the Pioneer-Burdekin Pumped Hydro Energy Storage project located west of Mackay. This work will continue in 2024–25 along with $38.5 million for early works. Staged construction is expected to commence in 2026–27 subject to a final investment decision.
| 8.2 | Finances and performance |
| 8.2.1 | Earnings before interest and tax |
Estimated total PNFC Sector EBIT of $3.526 billion for 2023–24 is $302 million lower than forecast at the 2023–24 Budget, primarily due to lower EBIT in the electricity generation sector. PNFC Sector EBIT is expected to increase from $3.062 billion in 2024–25 and remain higher over the remaining forward estimates.
The electricity network sector EBIT is estimated at $1.280 billion in 2024–25, and increasing to $1.811 billion by 2027–28, consistent with expected regulated revenue movements.
For the electricity generation sector, an estimated EBIT of $1.120 billion in 2023–24 is a material improvement on 2022–23, reflecting the value of hedging contracts as wholesale prices stabilise over time. Over the forward estimates, higher depreciation charges associated with accelerating capital investment in new renewable energy and storage assets dampen EBIT performance; however, before depreciation, earnings remain steady or rise to 2027–28.
Rail sector EBIT is forecast to increase from 2024–25 and remain stable over the forward estimates, consistent with revenue growth from the TSC.
Port sector EBIT in 2023–24 largely aligns with the 2023–24 Budget and is forecast to trend upwards over the forward estimates. This reflects the various long-term revenue contracts with customers and cost recoveries from the completion of revenue generating capital expansions.
Water sector EBIT is $428 million higher than estimated at the 2023–24 Budget mainly due to increased Queensland Government funding of $365 million to the Gladstone Area Water Board via capital grant, to complete construction of the Fitzroy to Gladstone Pipeline. Water sector EBIT is expected to decrease to $69 million in 2027–28 due to dam improvement costs.
Captured under ‘Other’, Queensland Hydro EBIT is forecast to be lower in 2023–24 than estimated at the 2023–24 Budget due to early works expenditure to progress the Pioneer-Burdekin PHES and Borumba PHES. Stadiums Queensland is the other major contributor here, and operates and maintains the state’s portfolio of major sporting stadiums and high performance and community venues. Over the forward estimates, earnings will be offset by expenses as venues continue to be updated and maintained to a contemporary standard to support ongoing events and activities as well as in the lead up to the Brisbane 2032 Olympic and Paralympic Games.
174
Budget Strategy and Outlook 2024-25
| Table 8.2 | Earnings before interest and tax1 |
| 2022–23 Outcome $ million | 2023–24 Budget $ million | 2023–24 Est. Act $ million | 2024–25 Projection $ million | 2025–26 Projection $ million | 2026–27 Projection $ million | 2027–28 Projection $ million | ||||||||||||||||||||||
Electricity Networks | 1,087 | 1,185 | 1,114 | 1,280 | 1,424 | 1,662 | 1,811 | |||||||||||||||||||||
Electricity Generation | 468 | 1,687 | 1,120 | 1,107 | 899 | 760 | 753 | |||||||||||||||||||||
Rail | 272 | 315 | 240 | 452 | 523 | 495 | 432 | |||||||||||||||||||||
Ports | 241 | 248 | 258 | 289 | 315 | 321 | 334 | |||||||||||||||||||||
Water | 413 | 548 | 977 | 221 | 358 | 346 | 69 | |||||||||||||||||||||
Other2 | (27 | ) | (154 | ) | (182 | ) | (288 | ) | (102 | ) | (169 | ) | (169 | ) | ||||||||||||||
Total PNFC sector | 2,455 | 3,829 | 3,526 | 3,062 | 3,417 | 3,416 | 3,231 | |||||||||||||||||||||
Notes:
| 1. | Numbers may not add due to rounding. |
| 2. | Includes other public corporations. |
| 8.2.2 | Borrowings |
Entities in the PNFC Sector use debt financing as a source of funds for asset renewal and capital investments and to maintain an optimal capital structure. Borrowings also include derivative liabilities associated with hedging activities undertaken by GOCs.
PNFC Sector entities are required to take a prudent and sound approach to debt management, including the establishment of borrowing arrangements which are appropriate to the business risk of the organisation. These arrangements consider the proposed capital expenditure program, together with the implications of borrowings on key financial and performance related indicators.
PNFC Sector entity asset values are a relevant factor in considering PNFC Sector borrowings, with PNFC Sector entities borrowing around 51 per cent of their asset values in 2024–25 (on average). Over the forward estimates, for the PNFC Sector as a whole, the ratio of borrowings to assets stays relatively constant to 2027–28.
Total PNFC Sector borrowing for 2023–24 is estimated at $46.618 billion, slightly above what was estimated at the 2023–24 Budget due to higher capital programs.
Electricity network and generation sector borrowings increase materially over the forward estimates in line with capital expenditure, particularly for connections and construction of renewable energy projects as part of the QEJP.
Borrowings in the water sector are largely attributable to Seqwater. Its borrowings result from the large investment in water infrastructure in response to the Millennium Drought and the associated price path. Forecast borrowings reduce across the forward estimates in line with debt repayment.
Ports borrowings have contributed to the funding of major capital works in the sector and are forecast to be stable at around $950 million over the forward estimates.
Rail sector borrowings are expected to increase over the forward estimates to support a large program of capital works for network reconfiguration and Cross River Rail.
175
Budget Strategy and Outlook 2024-25
Within the ‘Other’ section, Queensland Hydro borrowings for 2023–24 are forecast to be lower than estimated at the 2023–24 Budget, however they increase over the forward estimates to support early works and construction activities for the Borumba PHES.
| Table 8.3 | Borrowings and total assets1 |
| 2022–23 Outcome $ million | 2023–24 Budget $ million | 2023–24 Est. Act $ million | 2024–25 Projection $ million | 2025–26 Projection $ million | 2026–27 Projection $ million | 2027–28 Projection $ million | ||||||||||||||||||||||
Electricity Networks | 24,904 | 26,498 | 25,983 | 26,733 | 28,763 | 30,630 | 33,075 | |||||||||||||||||||||
Electricity Generation | 8,703 | 3,225 | 5,273 | 4,306 | 5,407 | 6,325 | 5,972 | |||||||||||||||||||||
Rail | 4,551 | 4,652 | 4,936 | 5,753 | 6,157 | 6,316 | 6,179 | |||||||||||||||||||||
Ports | 1,084 | 1,049 | 1,086 | 1,043 | 959 | 946 | 936 | |||||||||||||||||||||
Water | 9,657 | 9,472 | 9,145 | 8,767 | 8,435 | 8,208 | 8,073 | |||||||||||||||||||||
Other2 | 203 | 271 | 196 | 993 | 2,419 | 4,234 | 6,377 | |||||||||||||||||||||
Total PNFC sector | 49,101 | 45,166 | 46,618 | 47,596 | 52,141 | 56,659 | 60,611 | |||||||||||||||||||||
Total Assets | 84,526 | 82,492 | 88,870 | 94,090 | 102,484 | 110,330 | 118,034 | |||||||||||||||||||||
Notes:
| 1. | Numbers may not add due to rounding. |
| 2. | Includes other public corporations. |
| 8.2.3 | Returns to government |
PNFC Sector entities provide returns to government through dividends and tax equivalent payments.
Dividends
Dividends generated by the PNFC Sector form part of consolidated revenue used to fund a range of government services, including investment in critical infrastructure delivered by PNFC Sector entities. The GOC Act provides for the payment of dividends, with the dividend policies of GOCs determined by government. Each year, GOC boards make a dividend recommendation for government consideration.
PNFC Sector dividends are estimated at $1.021 billion in 2023–24 (which is $177 million higher than forecast at the 2023–24 Budget), with cumulative dividends of $3.917 billion over the 4 years to 2027–28.
Electricity network sector dividends for 2023–24 are slightly lower than forecast at the 2023–24 Budget. Dividend movements over the forward estimates align with assumed regulated revenue recovery and capital expenditure of network businesses, noting Powerlink’s next 5-year regulatory period commences from 2027–28.
In the electricity generation sector, dividends for 2023–24 are expected to be above the 2023–24 Budget, in accordance with approved dividend policies. Over the forward estimates, dividends moderate in line with earnings.
176
Budget Strategy and Outlook 2024-25
Rail dividends for 2023–24 are expected to broadly align with the 2023–24 Budget, increasing to 2025–26 but decreasing towards the end of the forward estimates, associated with major investments in the rail sector.
The ports sector is expected to provide reliable dividends over the forward estimates, rising from $139 million in 2023–24 to $186 million in 2027–28, with movements in line with earnings. Ports North will retain its 2023–24 dividend, estimated at $5.1 million, to support the Cairns tourism sector including Carins Marlin Marina fee relief during 2024.
In the water sector, dividends for 2023–24 are expected to be above the 2023–24 Budget due to a slightly higher-than-expected dividend from Sunwater. Dividends are expected to increase over the forward estimates in line with forecast profit.
| Table 8.4 | Dividends1 |
| 2022–23 Outcome $ million | 2023–24 Budget $ million | 2023–24 Est. Act $ million | 2024–25 Projection $ million | 2025–26 Projection $ million | 2026–27 Projection $ million | 2027–28 Projection $ million | ||||||||||||||||||||||
Electricity Networks | 132 | 93 | 61 | 39 | 41 | 99 | 237 | |||||||||||||||||||||
Electricity Generation | — | 463 | 665 | 520 | 441 | 349 | 140 | |||||||||||||||||||||
Rail | 150 | 146 | 132 | 221 | 254 | 188 | 90 | |||||||||||||||||||||
Ports | 165 | 138 | 139 | 162 | 177 | 182 | 186 | |||||||||||||||||||||
Water | 51 | 4 | 25 | 106 | 130 | 162 | 192 | |||||||||||||||||||||
Total PNFC sector | 498 | 844 | 1,021 | 1,048 | 1,044 | 980 | 845 | |||||||||||||||||||||
Note:
| 1. | Numbers may not add due to rounding. |
Tax equivalent payments
Tax equivalent payments (TEPs) are paid by the PNFC Sector entities to recognise the benefits derived because they are not liable to pay Australian Government tax. The primary objective of the payment is to promote competitive neutrality through a uniform application of income tax laws between government-owned businesses and their private sector counterparts.
Total forecast PNFC Sector TEPs for 2023–24 are estimated to be $529 million, slightly higher than projected at the 2023–24 Budget. Over the forward estimates, a decline in TEPs to $355 million by 2027–28 is primarily due to the electricity generation sector experiencing a modest downward trend in earnings, coupled with interest costs on new borrowings to support capital investment in renewable energy projects.
177
Budget Strategy and Outlook 2024-25
| Table 8.5 | Tax Equivalent Payments1 |
| 2022–23 Outcome $ million | 2023–24 Budget $ million | 2023–24 Est. Act $ million | 2024–25 Projection $ million | 2025–26 Projection $ million | 2026–27 Projection $ million | 2027–28 Projection $ million | ||||||||||||||||||||||
Electricity Networks | 24 | 64 | 31 | 15 | 18 | 43 | 101 | |||||||||||||||||||||
Electricity Generation | 167 | 261 | 285 | 241 | 192 | 170 | 74 | |||||||||||||||||||||
Rail | 72 | 102 | 46 | 155 | 152 | 118 | 70 | |||||||||||||||||||||
Ports | 71 | 68 | 80 | 90 | 98 | 99 | 103 | |||||||||||||||||||||
Water | 10 | 2 | 86 | 1 | 3 | 7 | 7 | |||||||||||||||||||||
Other2 | 1 | 0 | 0 | 0 | 1 | 1 | 1 | |||||||||||||||||||||
Total PNFC sector | 345 | 498 | 529 | 503 | 463 | 438 | 355 | |||||||||||||||||||||
Notes:
| 1. | Numbers may not add due to rounding. |
| 2. | Includes other public corporations |
Competitive neutrality fees
Competitive neutrality policy requires that public sector businesses, including GOCs, should not have a competitive advantage (or disadvantage) over the private sector solely due to their government ownership. An application of this policy is the competitive neutrality fee (CNF).
The CNF is applied to a GOC’s cost of debt to neutralise any costs of funds advantage by way of government ownership on the basis of GOCs’ ability to borrow funds at a lower rate than private sector competitors, given the government’s credit strength.
In general, changes in CNF payments reflect movements in borrowing amounts, interest rate spreads and the entity’s stand-alone credit rating. CNF payments by the PNFC Sector are expected to increase over the forward estimates in line with increased borrowing.
| Table 8.6 | Competitive neutrality fee payments1 |
| 2022–23 Outcome $ million | 2023–24 Budget $ million | 2023–24 Est. Act $ million | 2024–25 Projection $ million | 2025–26 Projection $ million | 2026–27 Projection $ million | 2027–28 Projection $ million | ||||||||||||||||||||||
Electricity Networks | 156 | 148 | 157 | 157 | 174 | 187 | 203 | |||||||||||||||||||||
Electricity Generation | 30 | 22 | 25 | 24 | 32 | 38 | 69 | |||||||||||||||||||||
Rail | 27 | 25 | 29 | 30 | 40 | 51 | 61 | |||||||||||||||||||||
Ports | 8 | 8 | 8 | 8 | 9 | 9 | 9 | |||||||||||||||||||||
Water | 4 | 6 | 7 | 5 | 6 | 10 | 10 | |||||||||||||||||||||
Total PNFC sector | 225 | 209 | 225 | 225 | 261 | 295 | 352 | |||||||||||||||||||||
Note:
| 1. | Numbers may not add due to rounding. |
178
Budget Strategy and Outlook 2024-25
| 8.2.4 | Community service obligation and rail transport services contract payments |
For public policy reasons, the government can direct GOCs to perform activities that are not in their commercial interests. In these situations, the government can compensate the GOC through the payment of a CSO for the cost of delivering the uncommercial part of the good or service.
In line with the Queensland Government’s Uniform Tariff Policy, a CSO payment is provided to EQL to compensate its retail subsidiary, Ergon Energy, for the higher cost of operating in regional Queensland. This subsidy is provided to ensure Queenslanders, regardless of their geographic location, pay a similar price for their electricity.
Seqwater and Sunwater also own and operate water supply schemes, where irrigation prices for some schemes are set below the level necessary to recover the costs of supply. The government provides a CSO to offset the reduced revenue and to ensure irrigation prices gradually transition towards cost recovery.
Prior to 2025–26, a substantial amount of Water CSO payments are due to the government’s rural irrigation water price discount for Sunwater and Seqwater customers which has been extended to 2024–25. There is no CSO forecast in 2026–27 or 2027–28 because irrigation prices have not yet been set for 2025–26 and beyond.
Similarly, TSC payments are made to Queensland Rail to deliver rail passenger services at non-commercial (subsidised) prices for commuter and tourism markets.
Total PNFC Sector CSO and TSC payments for 2023–24 are expected to be $2.916 billion, in line with the 2023–24 Budget forecast. Over the forward estimates, CSO and TSC payments are expected to increase to $3.474 billion by 2027–28.
This trend is largely driven by TSC payments, reflecting a range of adjustments for growth, maintenance and safety of the rail network. This includes delivery of significant capital projects, upgrades to existing assets, and operational activities associated with the South East Queensland network and Cross River Rail.
| Table 8.7 | Community service obligation payments and transport services contracts1 |
| 2022–23 Outcome $ million | 2023–24 Budget $ million | 2023–24 Est. Act $ million | 2024–25 Projection $ million | 2025–26 Projection $ million | 2026–27 Projection $ million | 2027–28 Projection $ million | ||||||||||||||||||||||
Electricity Networks | 621 | 537 | 599 | 605 | 618 | 644 | 684 | |||||||||||||||||||||
Rail | 2,082 | 2,306 | 2,291 | 2,662 | 2,790 | 2,790 | 2,790 | |||||||||||||||||||||
Water | 23 | 23 | 26 | 28 | 7 | — | — | |||||||||||||||||||||
Total PNFC sector | 2,726 | 2,866 | 2,916 | 3,295 | 3,415 | 3,434 | 3,474 | |||||||||||||||||||||
Note:
| 1. | Numbers may not add due to rounding. |
179
Budget Strategy and Outlook 2024-25
| 8.2.5 | Equity movements |
Corporations may apply different target capital structures to optimise value and support business operations. Equity movements account for changes in contributed equity and special dividends. The Queensland Government provides new equity to support Queensland’s publicly-owned businesses invest in critical new infrastructure projects across the state.
In 2023–24, total PNFC Sector net equity contributions are expected to be $2.984 billion, compared to $1.960 billion forecast at the 2023–24 Budget, due to timing of equity allocations from the Queensland Renewable Energy and Hydrogen Jobs Fund for new energy projects, as well as to fund construction of the Fitzroy to Gladstone Pipeline (Gladstone Area Water Board) and asset transfers from Cross River Rail to Queensland Rail.
Over the forward estimates, in the electricity networks and generation sectors, equity adjustments reflect new investments in renewable energy, hydrogen and storage assets, as well as to maintain target gearing ratios.
In the rail sector, equity movements primarily relate to new investments in significant capital projects associated with reconfiguration of the rail network and Cross River Rail.
In the ports sector, equity movements reflect new funding for NQBP’s Bowen Wharf replacement, Ports North’s Cairns Marine Precinct Common User Facility, GPC’s Northern Land Expansion Project at the Port of Gladstone, and pass through of funding under existing agreements with the Australian Government, such as the Bundaberg Port conveyor under the Hinkler Regional Deal.
In the water sector, equity movements reflect government commitments to Sunwater’s Paradise Dam Improvement Project and Burdekin Falls Dam Raising and Improvement Project, Seqwater’s Toowoomba to Warwick Pipeline, and Gladstone Area Water Board’s Fitzroy to Gladstone Pipeline.
Captured under ‘Other’, Queensland Hydro equity contributions are higher than the 2023–24 Budget estimates due to early works expenditure required to support a final investment decision on the Pioneer-Burdekin PHES, the voluntary acquisition of land and the carry-forward to 2023–24 of previously-committed funding for the Borumba and Pioneer-Burdekin projects.
Equity over the forward estimates will allow continued progress of the Borumba project and includes the Queensland Government’s equity commitment of $1 billion towards Pioneer-Burdekin, which is subject to a final investment decision.
This category also includes the transfer of state-owned Olympic venues to Stadiums Queensland.
180
Budget Strategy and Outlook 2024-25
| Table 8.8 | Equity movements1 |
| 2022–23 Outcome $ million | 2023–24 Budget $ million | 2023–24 Est. Act $ million | 2024–25 Projection $ million | 2025–26 Projection $ million | 2026–27 Projection $ million | 2027–28 Projection $ million | ||||||||||||||||||||||
Electricity Networks | (91 | ) | 372 | 447 | 795 | 250 | 915 | 509 | ||||||||||||||||||||
Electricity Generation | 783 | 682 | 1,205 | 1,808 | 928 | — | — | |||||||||||||||||||||
Rail | 35 | 202 | 168 | 225 | 25 | — | ||||||||||||||||||||||
Ports | 38 | 82 | 121 | 57 | 133 | 142 | 74 | |||||||||||||||||||||
Water | 21 | 570 | 683 | 363 | 207 | 220 | 419 | |||||||||||||||||||||
Other2 | 1 | 254 | 327 | 429 | 1,349 | 1,803 | 2,895 | |||||||||||||||||||||
Total PNFC sector | 787 | 1,960 | 2,984 | 3,618 | 3,092 | 3,105 | 3,896 | |||||||||||||||||||||
Notes:
| 1. | Numbers may not add due to rounding. |
| 2. | Includes other public corporations. |
181
Budget Strategy and Outlook 2024-25
| 9 | Uniform Presentation Framework |
| 9.1 | Context |
This chapter contains detailed financial statements for the Queensland Public Sector prepared under the Uniform Presentation Framework (UPF) first agreed to at the Premiers’ conference in 1991.
The UPF has been reviewed a number of times, more significantly following the release in October 2007 of the Australian Accounting Standards Board’s (AASB) accounting standard, AASB 1049 Whole of Government and General Government Sector Financial Reporting. The standard aims to harmonise Government Finance Statistics (GFS) and Generally Accepted Accounting Principles (GAAP) with the objective of improving the clarity and transparency of government financial statements. The UPF was reviewed more recently in February 2019 following the 2015 update to the Australian GFS framework.
In addition, this chapter provides:
| • | a time series for the General Government Sector using the revised UPF |
| • | details of General Government Sector grant revenue and expenses |
| • | details of General Government Sector dividend and income tax equivalent income |
| • | data on General Government Sector expenses and purchases of non-financial assets by function |
| • | details of taxation revenue collected by the General Government Sector |
| • | contingent liabilities |
| • | background information on the revised UPF and disclosure of differences arising from it, including the conceptual basis and sector definitions, along with a list of reporting entities. |
| 9.2 | Uniform Presentation Framework financial information |
The tables on the following pages present operating statements, balance sheets and cash flow statements prepared on the harmonised basis for the General Government Sector, Public Non-financial Corporations (PNFC) Sector and Non-financial Public Sector.
Budgeted financial information for the Public Financial Corporations Sector is not required by the UPF.
182
Budget Strategy and Outlook 2024-25
| Table 9.1 | General Government Sector Operating Statement1 |
| 2022–23 Outcome $ million | 2023–24 Budget $ million | 2023–24 Est. Actual $ million | 2024–25 Budget $ million | 2025–26 Projection $ million | 2026–27 Projection $ million | 2027–28 Projection $ million | ||||||||||||||||||||||
Revenue from Transactions | ||||||||||||||||||||||||||||
Taxation revenue | 20,601 | 21,938 | 22,670 | 24,799 | 26,573 | 27,910 | 29,202 | |||||||||||||||||||||
Grants revenue | 38,335 | 39,643 | 39,550 | 40,278 | 40,686 | 42,462 | 46,101 | |||||||||||||||||||||
Sales of goods and services | 6,483 | 6,921 | 6,946 | 7,333 | 7,663 | 7,325 | 7,314 | |||||||||||||||||||||
Interest income | 3,226 | 3,206 | 3,532 | 3,501 | 3,370 | 3,422 | 3,498 | |||||||||||||||||||||
Dividend and income tax equivalent income | 1,007 | 1,521 | 1,720 | 1,771 | 1,705 | 1,629 | 1,429 | |||||||||||||||||||||
Other revenue | 20,160 | 8,850 | 14,640 | 10,425 | 8,719 | 7,923 | 7,788 | |||||||||||||||||||||
Total Revenue from Transactions | 89,810 | 82,079 | 89,059 | 88,107 | 88,717 | 90,670 | 95,332 | |||||||||||||||||||||
Less Expenses from Transactions | ||||||||||||||||||||||||||||
Employee expenses | 30,557 | 32,175 | 33,231 | 35,217 | 36,030 | 37,094 | 38,465 | |||||||||||||||||||||
Superannuation expenses | ||||||||||||||||||||||||||||
Superannuation interest cost | 776 | 721 | 787 | 758 | 676 | 638 | 596 | |||||||||||||||||||||
Other superannuation expenses | 3,756 | 4,188 | 3,929 | 4,108 | 4,254 | 4,353 | 4,545 | |||||||||||||||||||||
Other operating expenses | 20,014 | 22,969 | 26,612 | 25,153 | 23,002 | 22,180 | 22,951 | |||||||||||||||||||||
Depreciation and amortisation | 5,018 | 5,039 | 5,436 | 5,716 | 5,996 | 6,344 | 6,739 | |||||||||||||||||||||
Other interest expenses | 1,688 | 1,974 | 1,905 | 2,655 | 3,392 | 4,124 | 4,761 | |||||||||||||||||||||
Grants expenses | 14,072 | 17,195 | 16,595 | 17,131 | 15,881 | 15,050 | 15,248 | |||||||||||||||||||||
Total Expenses from Transactions | 75,880 | 84,261 | 88,495 | 90,738 | 89,232 | 89,783 | 93,305 | |||||||||||||||||||||
Equals Net Operating Balance | 13,930 | (2,182 | ) | 564 | (2,631 | ) | (515 | ) | 887 | 2,027 | ||||||||||||||||||
Plus Other economic flows—included in operating result | 198 | (40 | ) | 1,549 | 85 | (216 | ) | (234 | ) | (212 | ) | |||||||||||||||||
Equals Operating Result | 14,128 | (2,222 | ) | 2,114 | (2,547 | ) | (731 | ) | 653 | 1,815 | ||||||||||||||||||
Plus Other economic flows—other movements in equity | 40,221 | 3,785 | 8,798 | 3,235 | 4,330 | 4,463 | 4,488 | |||||||||||||||||||||
Equals Comprehensive Result—Total Change In Net Worth | 54,349 | 1,563 | 10,911 | 689 | 3,600 | 5,117 | 6,302 | |||||||||||||||||||||
KEY FISCAL AGGREGATES | ||||||||||||||||||||||||||||
Net Operating Balance | 13,930 | (2,182 | ) | 564 | (2,631 | ) | (515 | ) | 887 | 2,027 | ||||||||||||||||||
Less Net Acquisition of Non-financial Assets | ||||||||||||||||||||||||||||
Purchases of non-financial assets | 9,899 | 9,347 | 11,061 | 12,831 | 14,485 | 14,577 | 12,763 | |||||||||||||||||||||
Less Sales of non-financial assets | 181 | 276 | 85 | 74 | 169 | 168 | 167 | |||||||||||||||||||||
Less Depreciation | 5,018 | 5,039 | 5,436 | 5,716 | 5,996 | 6,344 | 6,739 | |||||||||||||||||||||
Plus Change in inventories | 79 | (35 | ) | (3 | ) | 38 | (32 | ) | (23 | ) | 43 | |||||||||||||||||
Plus Other movements in non-financial assets | 1,058 | 538 | 744 | 1,079 | 743 | 186 | 181 | |||||||||||||||||||||
Equals Total Net Acquisition of Non-financial Assets | 5,838 | 4,534 | 6,281 | 8,159 | 9,032 | 8,228 | 6,081 | |||||||||||||||||||||
Equals Fiscal Balance | 8,092 | (6,716 | ) | (5,717 | ) | (10,790 | ) | (9,547 | ) | (7,341 | ) | (4,054 | ) | |||||||||||||||
Note:
| 1. | Numbers may not add due to rounding. |
183
Budget Strategy and Outlook 2024-25
| Table 9.2 | Public Non-financial Corporations Sector Operating Statement1 |
| 2022–23 Outcome $ million | 2023–24 Budget $ million | 2023–24 Est. Actual $ million | 2024–25 Budget $ million | 2025–26 Projection $ million | 2026–27 Projection $ million | 2027–28 Projection $ million | ||||||||||||||||||||||
Revenue from Transactions |
| |||||||||||||||||||||||||||
Grants revenue | 912 | 805 | 1,295 | 850 | 806 | 777 | 812 | |||||||||||||||||||||
Sales of goods and services | 14,735 | 13,664 | 14,324 | 15,377 | 16,398 | 17,226 | 18,515 | |||||||||||||||||||||
Interest income | 117 | 94 | 184 | 149 | 107 | 105 | 116 | |||||||||||||||||||||
Other revenue | 506 | 1,183 | 724 | 588 | 318 | 286 | 250 | |||||||||||||||||||||
Total Revenue from Transactions | 16,270 | 15,746 | 16,527 | 16,963 | 17,630 | 18,395 | 19,693 | |||||||||||||||||||||
Less Expenses from Transactions | ||||||||||||||||||||||||||||
Employee expenses | 2,532 | 2,692 | 2,921 | 3,241 | 3,367 | 3,451 | 3,560 | |||||||||||||||||||||
Superannuation expenses | ||||||||||||||||||||||||||||
Superannuation interest cost | (17 | ) | — | — | — | — | — | — | ||||||||||||||||||||
Other superannuation expenses | 308 | 320 | 352 | 413 | 433 | 449 | 466 | |||||||||||||||||||||
Other operating expenses | 7,608 | 6,575 | 6,482 | 6,628 | 6,551 | 6,656 | 7,265 | |||||||||||||||||||||
Depreciation and amortisation | 2,720 | 3,195 | 3,082 | 3,395 | 3,718 | 4,199 | 4,514 | |||||||||||||||||||||
Other interest expenses | 1,675 | 1,807 | 1,871 | 2,135 | 2,578 | 2,971 | 3,334 | |||||||||||||||||||||
Grants expenses | 29 | 25 | 27 | 28 | 22 | 22 | 22 | |||||||||||||||||||||
Other property expenses | 369 | 502 | 534 | 507 | 468 | 442 | 359 | |||||||||||||||||||||
Total Expenses from Transactions | 15,222 | 15,116 | 15,269 | 16,347 | 17,136 | 18,188 | 19,519 | |||||||||||||||||||||
Equals Net Operating Balance | 1,048 | 630 | 1,258 | 616 | 494 | 207 | 174 | |||||||||||||||||||||
Plus Other economic flows—included in operating result | (574 | ) | 691 | (114 | ) | (299 | ) | (141 | ) | (223 | ) | (702 | ) | |||||||||||||||
Equals Operating Result | 474 | 1,320 | 1,144 | 316 | 353 | (16 | ) | (528 | ) | |||||||||||||||||||
Plus Other economic flows—other movements in equity | 3,316 | 2,378 | 4,637 | 3,398 | 2,879 | 3,032 | 4,009 | |||||||||||||||||||||
Equals Comprehensive Result—Total Change In Net Worth | 3,790 | 3,698 | 5,780 | 3,714 | 3,232 | 3,016 | 3,480 | |||||||||||||||||||||
KEY FISCAL AGGREGATES | ||||||||||||||||||||||||||||
Net Operating Balance | 1,048 | 630 | 1,258 | 616 | 494 | 207 | 174 | |||||||||||||||||||||
Less Net Acquisition of Non-financial Assets | ||||||||||||||||||||||||||||
Purchases of non-financial assets | 4,497 | 5,849 | 6,366 | 9,410 | 11,269 | 10,029 | 9,568 | |||||||||||||||||||||
Less Sales of non-financial assets | 63 | 5 | 18 | 14 | 8 | 8 | 8 | |||||||||||||||||||||
Less Depreciation | 2,720 | 3,195 | 3,082 | 3,395 | 3,718 | 4,199 | 4,514 | |||||||||||||||||||||
Plus Change in inventories | 129 | (37 | ) | 42 | 1 | 95 | 41 | 16 | ||||||||||||||||||||
Plus Other movements in non-financial assets | 108 | 795 | 661 | 102 | 83 | 393 | 85 | |||||||||||||||||||||
Equals Total Net Acquisition of Non-financial Assets | 1,952 | 3,408 | 3,968 | 6,103 | 7,722 | 6,255 | 5,147 | |||||||||||||||||||||
Equals Fiscal Balance | (904 | ) | (2,778 | ) | (2,709 | ) | (5,487 | ) | (7,228 | ) | (6,049 | ) | (4,973 | ) | ||||||||||||||
Note:
| 1. | Numbers may not add due to rounding. |
184
Budget Strategy and Outlook 2024-25
| Table 9.3 | Non-financial Public Sector Operating Statement1 |
| 2022–23 Outcome $ million | 2023–24 $ million | 2023–24 Est. Actual $ million | 2024–25 $ million | 2025–26 Projection $ million | 2026–27 Projection $ million | 2027–28 Projection $ million | ||||||||||||||||||||||
Revenue from Transactions |
| |||||||||||||||||||||||||||
Taxation revenue | 20,189 | 21,553 | 22,245 | 24,345 | 26,073 | 27,367 | 28,593 | |||||||||||||||||||||
Grants revenue | 38,352 | 39,693 | 39,721 | 40,350 | 40,753 | 42,527 | 46,167 | |||||||||||||||||||||
Sales of goods and services | 18,161 | 17,557 | 17,772 | 19,010 | 20,182 | 21,267 | 22,703 | |||||||||||||||||||||
Interest income | 3,312 | 3,279 | 3,638 | 3,579 | 3,461 | 3,515 | 3,603 | |||||||||||||||||||||
Dividend and income tax equivalent income | 164 | 179 | 170 | 219 | 198 | 211 | 229 | |||||||||||||||||||||
Other revenue | 20,644 | 9,664 | 15,093 | 11,012 | 9,037 | 8,209 | 8,038 | |||||||||||||||||||||
Total Revenue from Transactions | 100,821 | 91,924 | 98,639 | 98,517 | 99,704 | 103,095 | 109,333 | |||||||||||||||||||||
Less Expenses from Transactions |
| |||||||||||||||||||||||||||
Employee expenses | 32,925 | 34,711 | 35,969 | 38,247 | 39,176 | 40,316 | 41,787 | |||||||||||||||||||||
Superannuation expenses |
| |||||||||||||||||||||||||||
Superannuation interest cost | 759 | 721 | 787 | 758 | 676 | 638 | 596 | |||||||||||||||||||||
Other superannuation expenses | 4,063 | 4,507 | 4,281 | 4,521 | 4,687 | 4,802 | 5,011 | |||||||||||||||||||||
Other operating expenses | 24,544 | 26,499 | 29,583 | 28,068 | 25,659 | 25,536 | 27,074 | |||||||||||||||||||||
Depreciation and amortisation | 7,737 | 8,234 | 8,518 | 9,111 | 9,714 | 10,542 | 11,253 | |||||||||||||||||||||
Other interest expenses | 3,107 | 3,551 | 3,474 | 4,496 | 5,693 | 6,789 | 7,733 | |||||||||||||||||||||
Grants expenses | 13,206 | 16,098 | 15,226 | 16,380 | 15,164 | 14,358 | 14,523 | |||||||||||||||||||||
Total Expenses from Transactions | 86,341 | 94,320 | 97,838 | 101,581 | 100,770 | 102,981 | 107,977 | |||||||||||||||||||||
Equals Net Operating Balance | 14,480 | (2,397 | ) | 802 | (3,064 | ) | (1,066 | ) | 114 | 1,356 | ||||||||||||||||||
Plus Other economic flows—included in operating result | (466 | ) | 580 | 1,365 | (215 | ) | (356 | ) | (456 | ) | (915 | ) | ||||||||||||||||
Equals Operating Result | 14,014 | (1,816 | ) | 2,167 | (3,279 | ) | (1,422 | ) | (343 | ) | 441 | |||||||||||||||||
Plus Other economic flows—other movements in equity | 40,333 | 3,379 | 8,745 | 3,967 | 5,022 | 5,459 | 5,861 | |||||||||||||||||||||
Equals Comprehensive Result—Total Change In Net Worth | 54,347 | 1,563 | 10,911 | 689 | 3,600 | 5,117 | 6,302 | |||||||||||||||||||||
KEY FISCAL AGGREGATES |
| |||||||||||||||||||||||||||
Net Operating Balance | 14,480 | (2,397 | ) | 802 | (3,064 | ) | (1,066 | ) | 114 | 1,356 | ||||||||||||||||||
Less Net Acquisition of Non-financial Assets |
| |||||||||||||||||||||||||||
Purchases of non-financial assets | 14,300 | 15,231 | 17,482 | 22,241 | 25,767 | 24,561 | 22,331 | |||||||||||||||||||||
Less Sales of non-financial assets | 243 | 281 | 103 | 88 | 177 | 177 | 175 | |||||||||||||||||||||
Less Depreciation | 7,737 | 8,234 | 8,518 | 9,111 | 9,714 | 10,542 | 11,253 | |||||||||||||||||||||
Plus Change in inventories | 208 | (72 | ) | 39 | 39 | 63 | 18 | 59 | ||||||||||||||||||||
Plus Other movements in non-financial assets | 1,167 | 1,333 | 1,404 | 1,181 | 827 | 578 | 266 | |||||||||||||||||||||
Equals Total Net Acquisition of Non-financial Assets | 7,694 | 7,977 | 10,304 | 14,261 | 16,766 | 14,439 | 11,228 | |||||||||||||||||||||
Equals Fiscal Balance | 6,786 | (10,373 | ) | (9,503 | ) | (17,325 | ) | (17,832 | ) | (14,325 | ) | (9,872 | ) | |||||||||||||||
Note:
| 1. | Numbers may not add due to rounding. |
185
Budget Strategy and Outlook 2024-25
| Table 9.4 | General Government Sector Balance Sheet1 |
| 2022–23 Outcome $ million | 2023–24 Budget $ million | 2023–24 Est. Actual $ million | 2024–25 Budget $ million | 2025–26 Projection $ million | 2026–27 Projection $ million | 2027–28 Projection $ million | ||||||||||||||||||||||
Assets | ||||||||||||||||||||||||||||
Financial Assets | ||||||||||||||||||||||||||||
Cash and deposits | 2,357 | 846 | 1,107 | 1,289 | 1,601 | 1,614 | 1,570 | |||||||||||||||||||||
Advances paid | 1,239 | 1,540 | 1,253 | 1,331 | 1,404 | 1,413 | 1,371 | |||||||||||||||||||||
Investments, loans and placements | 49,426 | 48,638 | 50,127 | 48,753 | 49,200 | 49,537 | 50,423 | |||||||||||||||||||||
Receivables | 4,320 | 4,744 | 5,182 | 5,289 | 5,391 | 5,368 | 5,342 | |||||||||||||||||||||
Equity | ||||||||||||||||||||||||||||
Investments in other public sector entities | 24,414 | 28,415 | 30,834 | 34,548 | 37,780 | 40,796 | 44,276 | |||||||||||||||||||||
Investments—other | 175 | 165 | 175 | 175 | 175 | 175 | 175 | |||||||||||||||||||||
Total Financial Assets | 81,930 | 84,347 | 88,677 | 91,386 | 95,551 | 98,902 | 103,158 | |||||||||||||||||||||
Non-financial Assets | ||||||||||||||||||||||||||||
Land and other fixed assets | 322,812 | 296,744 | 333,058 | 344,437 | 356,826 | 368,783 | 378,311 | |||||||||||||||||||||
Other non-financial assets | 9,743 | 7,568 | 10,204 | 10,752 | 11,070 | 11,412 | 11,802 | |||||||||||||||||||||
Total Non-financial Assets | 332,554 | 304,312 | 343,262 | 355,190 | 367,897 | 380,195 | 390,113 | |||||||||||||||||||||
| Total Assets | 414,484 | 388,659 | 431,939 | 446,575 | 463,447 | 479,097 | 493,271 | |||||||||||||||||||||
Liabilities | ||||||||||||||||||||||||||||
Payables | 5,921 | 5,328 | 5,651 | 5,596 | 5,723 | 5,762 | 5,906 | |||||||||||||||||||||
Superannuation liability | 20,913 | 20,827 | 19,646 | 19,478 | 18,447 | 17,301 | 16,064 | |||||||||||||||||||||
Other employee benefits | 10,419 | 10,028 | 10,067 | 10,680 | 11,131 | 11,020 | 11,562 | |||||||||||||||||||||
Advances received | 1,909 | 1,734 | 2,752 | 1,662 | 1,251 | 1,419 | 1,812 | |||||||||||||||||||||
Borrowing2 | 53,726 | 65,479 | 61,958 | 77,118 | 91,507 | 103,221 | 111,383 | |||||||||||||||||||||
Other liabilities | 17,622 | 14,489 | 16,981 | 16,467 | 16,216 | 16,085 | 15,952 | |||||||||||||||||||||
Total Liabilities | 110,511 | 117,886 | 117,054 | 131,002 | 144,275 | 154,808 | 162,679 | |||||||||||||||||||||
Net Worth | 303,973 | 270,774 | 314,884 | 315,573 | 319,172 | 324,289 | 330,591 | |||||||||||||||||||||
|
|
|
|
|
|
|
|
|
|
|
|
|
| |||||||||||||||
Net Financial Worth | (28,581 | ) | (33,538 | ) | (28,377 | ) | (39,617 | ) | (48,724 | ) | (55,906 | ) | (59,522 | ) | ||||||||||||||
Net Financial Liabilities | 52,995 | 61,953 | 59,211 | 74,164 | 86,504 | 96,702 | 103,798 | |||||||||||||||||||||
Net Debt | 2,615 | 16,190 | 12,223 | 27,407 | 40,552 | 52,076 | 59,831 | |||||||||||||||||||||
Notes: | ||||||||||||||||||||||||||||
1. Numbers may not add due to rounding. 2. Borrowing line comprised of: |
| |||||||||||||||||||||||||||
Borrowing with QTC | 46,166 | 57,494 | 54,100 | 68,902 | 84,301 | 96,176 | 104,641 | |||||||||||||||||||||
Leases and other similar arrangements | 7,519 | 7,892 | 7,819 | 8,177 | 7,166 | 7,006 | 6,703 | |||||||||||||||||||||
Securities and derivatives | 41 | 93 | 39 | 39 | 39 | 39 | 39 | |||||||||||||||||||||
|
|
|
|
|
|
|
|
|
|
|
|
|
| |||||||||||||||
| 53,726 | 65,479 | 61,958 | 77,118 | 91,507 | 103,221 | 111,383 | ||||||||||||||||||||||
186
Budget Strategy and Outlook 2024-25
| Table 9.5 | Public Non-financial Corporations Sector Balance Sheet1 |
| 2022–23 Outcome $ million | 2023–24 Budget $ million | 2023–24 Est. Actual $ million | 2024–25 Budget $ million | 2025–26 Projection $ million | 2026–27 Projection $ million | 2027–28 Projection $ million | ||||||||||||||||||||||
Assets | ||||||||||||||||||||||||||||
Financial Assets | ||||||||||||||||||||||||||||
Cash and deposits | 1,031 | 950 | 1,668 | 1,411 | 1,011 | 867 | 826 | |||||||||||||||||||||
Advances paid | 1,675 | 1,598 | 2,562 | 1,515 | 1,148 | 1,356 | 1,790 | |||||||||||||||||||||
Investments, loans and placements | 6,194 | 2,739 | 2,991 | 2,089 | 1,850 | 1,755 | 1,688 | |||||||||||||||||||||
Receivables | 2,742 | 2,419 | 2,603 | 2,926 | 3,081 | 3,204 | 3,309 | |||||||||||||||||||||
Equity | ||||||||||||||||||||||||||||
Investments—other | — | 66 | — | — | — | — | — | |||||||||||||||||||||
Other financial assets | ||||||||||||||||||||||||||||
Total Financial Assets | 11,642 | 7,772 | 9,824 | 7,941 | 7,089 | 7,181 | 7,613 | |||||||||||||||||||||
Non-financial Assets | ||||||||||||||||||||||||||||
Land and other fixed assets | 68,176 | 73,250 | 74,945 | 82,078 | 91,158 | 98,673 | 105,835 | |||||||||||||||||||||
Other non-financial assets | 4,707 | 1,470 | 4,102 | 4,071 | 4,236 | 4,476 | 4,586 | |||||||||||||||||||||
Total Non-financial Assets | 72,883 | 74,720 | 79,046 | 86,148 | 95,395 | 103,148 | 110,421 | |||||||||||||||||||||
Total Assets | 84,526 | 82,492 | 88,870 | 94,090 | 102,484 | 110,330 | 118,034 | |||||||||||||||||||||
Liabilities | ||||||||||||||||||||||||||||
Payables | 2,105 | 2,717 | 2,782 | 2,949 | 3,062 | 2,937 | 2,706 | |||||||||||||||||||||
Superannuation liability | (354 | ) | (400 | ) | (354 | ) | (354 | ) | (354 | ) | (354 | ) | (354 | ) | ||||||||||||||
Other employee benefits | 1,040 | 1,015 | 1,108 | 1,204 | 1,280 | 1,350 | 1,420 | |||||||||||||||||||||
Deposits held | 14 | 11 | 14 | 14 | 14 | 14 | 14 | |||||||||||||||||||||
Advances received | 25 | 3 | 3 | 3 | 2 | 1 | — | |||||||||||||||||||||
Borrowing2 | 49,101 | 45,166 | 46,618 | 47,596 | 52,141 | 56,659 | 60,611 | |||||||||||||||||||||
Other liabilities | 11,185 | 8,596 | 11,510 | 11,776 | 12,204 | 12,571 | 13,006 | |||||||||||||||||||||
Total Liabilities | 63,117 | 57,109 | 61,681 | 63,187 | 68,349 | 73,178 | 77,402 | |||||||||||||||||||||
Net Worth | 21,409 | 25,383 | 27,190 | 30,903 | 34,136 | 37,151 | 40,632 | |||||||||||||||||||||
|
|
|
|
|
|
|
|
|
|
|
|
|
| |||||||||||||||
Net Financial Worth | (51,474 | ) | (49,338 | ) | (51,857 | ) | (55,245 | ) | (61,259 | ) | (65,997 | ) | (69,790 | ) | ||||||||||||||
Net Debt | 40,240 | 39,893 | 39,415 | 42,597 | 48,148 | 52,697 | 56,322 | |||||||||||||||||||||
Notes:
| ||||||||||||||||||||||||||||
1. Numbers may not add due to rounding. 2. Borrowing line comprised of: |
| |||||||||||||||||||||||||||
Borrowing with QTC | 43,276 | 42,963 | 44,234 | 46,358 | 51,239 | 55,539 | 59,548 | |||||||||||||||||||||
Leases and other similar arrangements | 367 | 653 | 627 | 589 | 525 | 768 | 705 | |||||||||||||||||||||
Securities and derivatives | 5,458 | 1,550 | 1,758 | 649 | 376 | 352 | 358 | |||||||||||||||||||||
|
|
|
|
|
|
|
|
|
|
|
|
|
| |||||||||||||||
| 49,101 | 45,166 | 46,618 | 47,596 | 52,141 | 56,659 | 60,611 | ||||||||||||||||||||||
187
Budget Strategy and Outlook 2024-25
| Table 9.6 | Non-financial Public Sector Balance Sheet1 |
| 2022–23 Outcome $ million | 2023–24 Budget $ million | 2023–24 Est. Actual $ million | 2024–25 Budget $ million | 2025–26 Projection $ million | 2026–27 Projection $ million | 2027–28 Projection $ million | ||||||||||||||||||||||
Assets | ||||||||||||||||||||||||||||
Financial Assets | ||||||||||||||||||||||||||||
Cash and deposits | 3,388 | 1,796 | 2,775 | 2,700 | 2,612 | 2,481 | 2,396 | |||||||||||||||||||||
Advances paid | 1,215 | 1,542 | 1,251 | 1,330 | 1,404 | 1,413 | 1,371 | |||||||||||||||||||||
Investments, loans and placements | 55,619 | 51,377 | 53,118 | 50,842 | 51,049 | 51,291 | 52,111 | |||||||||||||||||||||
Receivables | 6,256 | 5,760 | 6,216 | 6,629 | 6,840 | 7,013 | 7,204 | |||||||||||||||||||||
Equity | ||||||||||||||||||||||||||||
Investments in other public sector entities | 3,006 | 3,033 | 3,645 | 3,645 | 3,645 | 3,645 | 3,645 | |||||||||||||||||||||
Investments—other | 174 | 231 | 174 | 174 | 174 | 174 | 174 | |||||||||||||||||||||
Other financial assets | ||||||||||||||||||||||||||||
Total Financial Assets | 69,657 | 63,738 | 67,178 | 65,320 | 65,724 | 66,017 | 66,901 | |||||||||||||||||||||
Non-financial Assets | ||||||||||||||||||||||||||||
Land and other fixed assets | 390,987 | 369,993 | 408,002 | 426,514 | 447,984 | 467,455 | 484,146 | |||||||||||||||||||||
Other non-financial assets | 1,229 | 1,205 | 1,164 | 1,448 | 1,535 | 1,750 | 1,891 | |||||||||||||||||||||
Total Non-financial Assets | 392,216 | 371,198 | 409,166 | 427,962 | 449,519 | 469,205 | 486,037 | |||||||||||||||||||||
Total Assets | 461,873 | 434,937 | 476,344 | 493,282 | 515,243 | 535,222 | 552,938 | |||||||||||||||||||||
Liabilities | ||||||||||||||||||||||||||||
Payables | 7,275 | 6,699 | 6,920 | 7,016 | 7,213 | 7,201 | 7,225 | |||||||||||||||||||||
Superannuation liability | 20,559 | 20,427 | 19,292 | 19,123 | 18,093 | 16,947 | 15,710 | |||||||||||||||||||||
Other employee benefits | 11,460 | 11,044 | 11,176 | 11,885 | 12,411 | 12,370 | 12,982 | |||||||||||||||||||||
Deposits held | 14 | 11 | 14 | 14 | 14 | 14 | 14 | |||||||||||||||||||||
Advances received | 235 | 142 | 192 | 148 | 104 | 64 | 24 | |||||||||||||||||||||
Borrowing2 | 102,821 | 110,638 | 108,569 | 124,707 | 143,640 | 159,873 | 171,987 | |||||||||||||||||||||
Other liabilities | 15,537 | 15,203 | 15,297 | 14,815 | 14,595 | 14,464 | 14,405 | |||||||||||||||||||||
Total Liabilities | 157,900 | 164,163 | 161,460 | 177,710 | 196,071 | 210,933 | 222,347 | |||||||||||||||||||||
Net Worth | 303,973 | 270,774 | 314,884 | 315,573 | 319,172 | 324,289 | 330,591 | |||||||||||||||||||||
|
|
|
|
|
|
|
|
|
|
|
|
|
| |||||||||||||||
Net Financial Worth | (88,243 | ) | (100,424 | ) | (94,282 | ) | (112,389 | ) | (130,347 | ) | (144,916 | ) | (155,446 | ) | ||||||||||||||
Net Financial Liabilities | 91,249 | 103,458 | 97,927 | 116,035 | 133,992 | 148,561 | 159,091 | |||||||||||||||||||||
Net Debt | 42,848 | 56,077 | 51,631 | 69,998 | 88,693 | 104,766 | 116,146 | |||||||||||||||||||||
Notes:
| ||||||||||||||||||||||||||||
1. Numbers may not add due to rounding. 2. Borrowing line comprised of:
| ||||||||||||||||||||||||||||
Borrowing with QTC | 89,442 | 100,457 | 98,334 | 115,260 | 135,540 | 151,714 | 164,188 | |||||||||||||||||||||
Leases and other similar arrangements | 7,887 | 8,545 | 8,446 | 8,766 | 7,691 | 7,774 | 7,408 | |||||||||||||||||||||
Securities and derivatives | 5,491 | 1,636 | 1,790 | 681 | 409 | 385 | 390 | |||||||||||||||||||||
|
|
|
|
|
|
|
|
|
|
|
|
|
| |||||||||||||||
| 102,821 | 110,638 | 108,569 | 124,707 | 143,640 | 159,873 | 171,987 | ||||||||||||||||||||||
188
Budget Strategy and Outlook 2024-25
| Table 9.7 | General Government Sector Cash Flow Statement1 |
| 2022–23 Outcome $ million | 2023–24 Budget $ million | 2023–24 Est. Actual $ million | 2024–25 Budget $ million | 2025–26 Projection $ million | 2026–27 Projection $ million | 2027–28 Projection $ million | ||||||||||||||||||||||
Cash Receipts from Operating Activities | ||||||||||||||||||||||||||||
Taxes received | 20,410 | 21,936 | 22,470 | 24,798 | 26,572 | 27,907 | 29,200 | |||||||||||||||||||||
Grants and subsidies received | 38,684 | 39,641 | 39,783 | 40,290 | 40,663 | 42,439 | 46,100 | |||||||||||||||||||||
Sales of goods and services | 6,886 | 7,196 | 7,451 | 7,520 | 7,910 | 7,704 | 7,715 | |||||||||||||||||||||
Interest receipts | 3,201 | 3,203 | 3,535 | 3,499 | 3,368 | 3,420 | 3,496 | |||||||||||||||||||||
Dividends and income tax equivalents | 922 | 1,080 | 792 | 1,584 | 1,771 | 1,682 | 1,535 | |||||||||||||||||||||
Other receipts | 22,502 | 9,790 | 17,313 | 12,842 | 11,192 | 10,588 | 10,383 | |||||||||||||||||||||
Total Operating Receipts | 92,604 | 82,846 | 91,344 | 90,532 | 91,476 | 93,739 | 98,429 | |||||||||||||||||||||
Cash Payments for Operating Activities | ||||||||||||||||||||||||||||
Payments for employees | (34,232 | ) | (37,332 | ) | (39,040 | ) | (40,342 | ) | (41,311 | ) | (43,113 | ) | (44,074 | ) | ||||||||||||||
Payments for goods and services | (23,090 | ) | (24,872 | ) | (30,019 | ) | (29,002 | ) | (26,630 | ) | (25,639 | ) | (26,438 | ) | ||||||||||||||
Grants and subsidies | (13,777 | ) | (16,689 | ) | (16,651 | ) | (17,005 | ) | (15,825 | ) | (15,004 | ) | (15,202 | ) | ||||||||||||||
Interest paid | (1,616 | ) | (1,892 | ) | (1,811 | ) | (2,501 | ) | (3,246 | ) | (4,012 | ) | (4,684 | ) | ||||||||||||||
Other payments | (4 | ) | — | — | — | — | — | — | ||||||||||||||||||||
Total Operating Payments | (72,719 | ) | (80,786 | ) | (87,521 | ) | (88,850 | ) | (87,012 | ) | (87,768 | ) | (90,398 | ) | ||||||||||||||
Net Cash Inflows from Operating Activities | 19,885 | 2,060 | 3,823 | 1,682 | 4,464 | 5,971 | 8,031 | |||||||||||||||||||||
Cash Flows from Investments in Non-Financial Assets | ||||||||||||||||||||||||||||
Purchases of non-financial assets | (9,899 | ) | (9,347 | ) | (11,061 | ) | (12,831 | ) | (14,485 | ) | (14,577 | ) | (12,763 | ) | ||||||||||||||
Sales of non-financial assets | 181 | 276 | 85 | 74 | 169 | 168 | 167 | |||||||||||||||||||||
Net Cash Flows from Investments in Non-financial Assets | (9,718 | ) | (9,071 | ) | (10,976 | ) | (12,757 | ) | (14,316 | ) | (14,408 | ) | (12,596 | ) | ||||||||||||||
Net Cash Flows from Investments in Financial Assets for Policy Purposes | (766 | ) | (2,264 | ) | (2,763 | ) | (2,984 | ) | (2,765 | ) | (2,532 | ) | (2,486 | ) | ||||||||||||||
Net Cash Flows from Investments in Financial Assets for Liquidity Purposes | (8,035 | ) | 4,657 | 6,162 | 1,394 | (435 | ) | (332 | ) | (894 | ) | |||||||||||||||||
Receipts from Financing Activities | ||||||||||||||||||||||||||||
Advances received (net) | 598 | (46 | ) | 843 | (1,088 | ) | (409 | ) | 170 | 395 | ||||||||||||||||||
Borrowing (net) | (1,318 | ) | 4,437 | 1,661 | 13,935 | 13,774 | 11,144 | 7,506 | ||||||||||||||||||||
Net Cash Flows from Financing Activities | (719 | ) | 4,391 | 2,505 | 12,847 | 13,364 | 11,314 | 7,902 | ||||||||||||||||||||
Net Increase/(Decrease) in Cash held | 647 | (226 | ) | (1,249 | ) | 181 | 312 | 13 | (44 | ) | ||||||||||||||||||
Net cash from operating activities | 19,885 | 2,060 | 3,823 | 1,682 | 4,464 | 5,971 | 8,031 | |||||||||||||||||||||
Net cash flows from investments in non-financial assets | (9,718 | ) | (9,071 | ) | (10,976 | ) | (12,757 | ) | (14,316 | ) | (14,408 | ) | (12,596 | ) | ||||||||||||||
Surplus/(Deficit) | 10,167 | (7,010 | ) | (7,153 | ) | (11,076 | ) | (9,852 | ) | (8,437 | ) | (4,565 | ) | |||||||||||||||
|
|
|
|
|
|
|
|
|
|
|
|
|
| |||||||||||||||
Derivation of ABS GFS Cash Surplus/Deficit | ||||||||||||||||||||||||||||
Cash surplus/(deficit) | 10,167 | (7,010 | ) | (7,153 | ) | (11,076 | ) | (9,852 | ) | (8,437 | ) | (4,565 | ) | |||||||||||||||
Acquisitions under finance leases and similar arrangements | (849 | ) | (814 | ) | (879 | ) | (692 | ) | (278 | ) | (5 | ) | (1 | ) | ||||||||||||||
ABS GFS Cash Surplus/(Deficit) Including Finance Leases and Similar Arrangements | 9,318 | (7,824 | ) | (8,033 | ) | (11,768 | ) | (10,129 | ) | (8,442 | ) | (4,566 | ) | |||||||||||||||
Note:
| 1. | Numbers may not add due to rounding. |
189
Budget Strategy and Outlook 2024-25
| Table 9.8 | Public Non-financial Corporations Sector Cash Flow Statement1 |
| 2022–23 Outcome $ million | 2023–24 Budget $ million | 2023–24 Est. Actual $ million | 2024–25 Budget $ million | 2025–26 Projection $ million | 2026–27 Projection $ million | 2027–28 Projection $ million | ||||||||||||||||||||||
Cash Receipts from Operating Activities | ||||||||||||||||||||||||||||
Grants and subsidies received | 841 | 799 | 1,360 | 836 | 793 | 764 | 798 | |||||||||||||||||||||
Sales of goods and services | 17,092 | 15,616 | 16,287 | 16,860 | 18,333 | 19,261 | 20,795 | |||||||||||||||||||||
Interest receipts | 106 | 94 | 185 | 152 | 108 | 105 | 116 | |||||||||||||||||||||
Other receipts | 402 | 687 | 415 | 576 | 278 | 240 | 165 | |||||||||||||||||||||
Total Operating Receipts | 18,442 | 17,195 | 18,246 | 18,425 | 19,512 | 20,369 | 21,873 | |||||||||||||||||||||
Cash Payments for Operating Activities | ||||||||||||||||||||||||||||
Payments for employees | (2,750 | ) | (2,953 | ) | (3,205 | ) | (3,558 | ) | (3,724 | ) | (3,830 | ) | (3,956 | ) | ||||||||||||||
Payments for goods and services | (9,727 | ) | (8,331 | ) | (8,662 | ) | (8,516 | ) | (8,617 | ) | (8,616 | ) | (9,301 | ) | ||||||||||||||
Grants and subsidies | (29 | ) | (25 | ) | (27 | ) | (28 | ) | (22 | ) | (22 | ) | (22 | ) | ||||||||||||||
Interest paid | (1,671 | ) | (1,793 | ) | (1,867 | ) | (2,111 | ) | (2,542 | ) | (2,944 | ) | (3,314 | ) | ||||||||||||||
Other payments | (1,149 | ) | (976 | ) | (646 | ) | (633 | ) | (645 | ) | (627 | ) | (638 | ) | ||||||||||||||
Total Operating Payments | (15,325 | ) | (14,078 | ) | (14,407 | ) | (14,846 | ) | (15,550 | ) | (16,038 | ) | (17,231 | ) | ||||||||||||||
Net Cash Inflows from Operating Activities | 3,117 | 3,117 | 3,839 | 3,579 | 3,962 | 4,331 | 4,642 | |||||||||||||||||||||
Cash Flows from Investments in Non-Financial Assets | ||||||||||||||||||||||||||||
Purchases of non-financial assets | (4,497 | ) | (5,849 | ) | (6,366 | ) | (9,410 | ) | (11,269 | ) | (10,029 | ) | (9,568 | ) | ||||||||||||||
Sales of non-financial assets | 63 | 5 | 18 | 14 | 8 | 8 | 8 | |||||||||||||||||||||
Net Cash Flows from Investments in Non-financial Assets | (4,434 | ) | (5,844 | ) | (6,348 | ) | (9,395 | ) | (11,261 | ) | (10,021 | ) | (9,560 | ) | ||||||||||||||
Net Cash Flows from Investments in Financial Assets for Policy Purposes | (711 | ) | (80 | ) | (886 | ) | 1,047 | 367 | (208 | ) | (434 | ) | ||||||||||||||||
Net Cash Flows from Investments in Financial Assets for Liquidity Purposes | 463 | 10 | 41 | 9 | 34 | 19 | (1 | ) | ||||||||||||||||||||
Receipts from Financing Activities | ||||||||||||||||||||||||||||
Advances received (net) | (1 | ) | (1 | ) | (1 | ) | (1 | ) | (1 | ) | (1 | ) | (1 | ) | ||||||||||||||
Borrowing (net) | 2,202 | 521 | 1,666 | 2,108 | 4,831 | 4,230 | 3,713 | |||||||||||||||||||||
Dividends paid | (246 | ) | (474 | ) | (458 | ) | (1,021 | ) | (1,044 | ) | (1,041 | ) | (946 | ) | ||||||||||||||
Deposits received (net) | 3 | — | — | — | — | — | — | |||||||||||||||||||||
Other financing (net) | (523 | ) | 2,850 | 2,782 | 3,417 | 2,713 | 2,546 | 2,545 | ||||||||||||||||||||
Net Cash Flows from Financing Activities | 1,435 | 2,896 | 3,990 | 4,504 | 6,499 | 5,734 | 5,312 | |||||||||||||||||||||
Net Increase/(Decrease) in Cash held | (131 | ) | 99 | 637 | (256 | ) | (400 | ) | (145 | ) | (41 | ) | ||||||||||||||||
Net cash from operating activities | 3,117 | 3,117 | 3,839 | 3,579 | 3,962 | 4,331 | 4,642 | |||||||||||||||||||||
Net cash flows from investments in non-financial assets | (4,434 | ) | (5,844 | ) | (6,348 | ) | (9,395 | ) | (11,261 | ) | (10,021 | ) | (9,560 | ) | ||||||||||||||
Dividends paid | (246 | ) | (474 | ) | (458 | ) | (1,021 | ) | (1,044 | ) | (1,041 | ) | (946 | ) | ||||||||||||||
Surplus/(Deficit) | (1,563 | ) | (3,201 | ) | (2,966 | ) | (6,837 | ) | (8,344 | ) | (6,730 | ) | (5,863 | ) | ||||||||||||||
Derivation of ABS GFS Cash Surplus/Deficit | ||||||||||||||||||||||||||||
Cash surplus/(deficit) | (1,563 | ) | (3,201 | ) | (2,966 | ) | (6,837 | ) | (8,344 | ) | (6,730 | ) | (5,863 | ) | ||||||||||||||
Acquisitions under finance leases and similar arrangements | (49 | ) | (360 | ) | (316 | ) | (25 | ) | (5 | ) | (313 | ) | (6 | ) | ||||||||||||||
ABS GFS Cash Surplus/(Deficit) Including Finance Leases and Similar Arrangements | (1,613 | ) | (3,562 | ) | (3,282 | ) | (6,862 | ) | (8,348 | ) | (7,044 | ) | (5,869 | ) | ||||||||||||||
Note:
| 1. | Numbers may not add due to rounding. |
190
Budget Strategy and Outlook 2024-25
| Table 9.9 | Non-financial Public Sector Cash Flow Statement1 |
| 2022–23 Outcome $ million | 2023–24 Budget $ million | 2023–24 Est. Actual $ million | 2024–25 Budget $ million | 2025–26 Projection $ million | 2026–27 Projection $ million | 2027–28 Projection $ million | ||||||||||||||||||||||
Cash Receipts from Operating Activities |
| |||||||||||||||||||||||||||
Taxes received | 20,002 | 21,552 | 22,046 | 24,344 | 26,072 | 27,366 | 28,592 | |||||||||||||||||||||
Grants and subsidies received | 38,701 | 39,679 | 39,948 | 40,351 | 40,718 | 42,492 | 46,153 | |||||||||||||||||||||
Sales of goods and services | 20,825 | 19,401 | 19,867 | 20,269 | 21,944 | 23,265 | 24,945 | |||||||||||||||||||||
Interest receipts | 3,279 | 3,276 | 3,646 | 3,577 | 3,460 | 3,513 | 3,601 | |||||||||||||||||||||
Dividends and income tax equivalents | 101 | 169 | 162 | 186 | 214 | 202 | 217 | |||||||||||||||||||||
Other receipts | 22,843 | 10,511 | 17,784 | 13,418 | 11,484 | 10,782 | 10,548 | |||||||||||||||||||||
Total Operating Receipts | 105,752 | 94,588 | 103,453 | 102,145 | 103,891 | 107,620 | 114,056 | |||||||||||||||||||||
Cash Payments for Operating Activities | ||||||||||||||||||||||||||||
Payments for employees | (36,818 | ) | (40,129 | ) | (42,063 | ) | (43,688 | ) | (44,814 | ) | (46,714 | ) | (47,792 | ) | ||||||||||||||
Payments for goods and services | (29,729 | ) | (29,776 | ) | (34,797 | ) | (33,396 | ) | (30,934 | ) | (30,540 | ) | (32,159 | ) | ||||||||||||||
Grants and subsidies | (12,984 | ) | (15,955 | ) | (15,485 | ) | (16,256 | ) | (15,110 | ) | (14,314 | ) | (14,481 | ) | ||||||||||||||
Interest paid | (3,036 | ) | (3,455 | ) | (3,380 | ) | (4,315 | ) | (5,511 | ) | (6,650 | ) | (7,637 | ) | ||||||||||||||
Other payments | (554 | ) | (534 | ) | (468 | ) | (251 | ) | (127 | ) | (183 | ) | (260 | ) | ||||||||||||||
Total Operating Payments | (83,120 | ) | (89,849 | ) | (96,193 | ) | (97,906 | ) | (96,496 | ) | (98,402 | ) | (102,329 | ) | ||||||||||||||
Net Cash Inflows from Operating Activities | 22,631 | 4,738 | 7,260 | 4,240 | 7,395 | 9,217 | 11,727 | |||||||||||||||||||||
Cash Flows from Investments in Non-Financial Assets | ||||||||||||||||||||||||||||
Purchases of non-financial assets | (14,300 | ) | (15,231 | ) | (17,482 | ) | (22,241 | ) | (25,767 | ) | (24,561 | ) | (22,331 | ) | ||||||||||||||
Sales of non-financial assets | 243 | 281 | 103 | 88 | 177 | 177 | 175 | |||||||||||||||||||||
Net Cash Flows from Investments in Non-financial Assets | (14,056 | ) | (14,950 | ) | (17,380 | ) | (22,152 | ) | (25,590 | ) | (24,384 | ) | (22,156 | ) | ||||||||||||||
Net Cash Flows from Investments in Financial Assets for Policy Purposes | 56 | (314 | ) | 19 | 433 | (53 | ) | 13 | 59 | |||||||||||||||||||
Net Cash Flows from Investments in Financial Assets for Liquidity Purposes | (7,573 | ) | 4,667 | 6,204 | 1,404 | (401 | ) | (313 | ) | (896 | ) | |||||||||||||||||
Receipts from Financing Activities | ||||||||||||||||||||||||||||
Advances received (net) | (28 | ) | (47 | ) | (43 | ) | (41 | ) | (42 | ) | (38 | ) | (39 | ) | ||||||||||||||
Borrowing (net) | 885 | 4,958 | 3,328 | 16,043 | 18,604 | 15,374 | 11,219 | |||||||||||||||||||||
Deposits received (net) | 3 | — | — | — | — | — | — | |||||||||||||||||||||
Other financing (net) | (1,401 | ) | 820 | — | — | — | — | — | ||||||||||||||||||||
Net Cash Flows from Financing Activities | (542 | ) | 5,731 | 3,285 | 16,002 | 18,562 | 15,336 | 11,181 | ||||||||||||||||||||
Net Increase/(Decrease) in Cash held | 516 | (127 | ) | (612 | ) | (75 | ) | (88 | ) | (132 | ) | (85 | ) | |||||||||||||||
Net cash from operating activities | 22,631 | 4,738 | 7,260 | 4,240 | 7,395 | 9,217 | 11,727 | |||||||||||||||||||||
Net cash flows from investments in non-financial assets | (14,056 | ) | (14,950 | ) | (17,380 | ) | (22,152 | ) | (25,590 | ) | (24,384 | ) | (22,156 | ) | ||||||||||||||
Surplus/(Deficit) | 8,575 | (10,211 | ) | (10,120 | ) | (17,913 | ) | (18,195 | ) | (15,167 | ) | (10,429 | ) | |||||||||||||||
Derivation of ABS GFS Cash Surplus/Deficit | ||||||||||||||||||||||||||||
Cash surplus/(deficit) | 8,575 | (10,211 | ) | (10,120 | ) | (17,913 | ) | (18,195 | ) | (15,167 | ) | (10,429 | ) | |||||||||||||||
Acquisitions under finance leases and similar arrangements | (899 | ) | (1,174 | ) | (1,195 | ) | (717 | ) | (282 | ) | (319 | ) | (7 | ) | ||||||||||||||
ABS GFS Cash Surplus/(Deficit) Including Finance Leases and Similar Arrangements | 7,676 | (11,386 | ) | (11,315 | ) | (18,630 | ) | (18,478 | ) | (15,486 | ) | (10,435 | ) | |||||||||||||||
Note:
| 1. | Numbers may not add due to rounding. |
191
Budget Strategy and Outlook 2024-25
| 9.3 | General Government Sector time series |
Data presented in Table 9.10 provides a time series from 2011–12 to 2022–23 for the General Government Sector on the key fiscal aggregates used by the government to measure financial performance. These aggregates have been back cast (as far as possible) to comply with AASB 1049 Whole of Government and General Government Sector Financial Reporting.
192
Budget Strategy and Outlook 2024-25
| Table 9.10 | General Government Sector Time Series1 |
| 2011–12 Actual $ million | 2012–13 Actual $ million | 2013–14 Actual $ million | 2014–15 Actual $ million | 2015–16 Actual $ million | 2016–17 Actual $ million | 2017–18 Actual $ million | 2018–19 Actual $ million | 2019-20 Actual $ million | 2020-21 Actual $ million | 2021-22 Actual $ million | 2022-23 Actual $ million | |||||||||||||||||||||||||||||||||||||
Revenue from Transactions | ||||||||||||||||||||||||||||||||||||||||||||||||
Taxation revenue | 10,608 | 10,937 | 11,840 | 12,598 | 12,547 | 12,919 | 13,244 | 14,165 | 14,585 | 16,249 | 20,011 | 20,601 | ||||||||||||||||||||||||||||||||||||
Grant revenue | 22,652 | 18,322 | 21,740 | 23,583 | 23,740 | 27,384 | 27,966 | 28,307 | 27,645 | 33,013 | 34,135 | 38,335 | ||||||||||||||||||||||||||||||||||||
Sales of goods and services | 5,002 | 5,087 | 5,039 | 5,443 | 5,712 | 5,642 | 5,884 | 5,783 | 5,618 | 6,105 | 5,896 | 6,483 | ||||||||||||||||||||||||||||||||||||
Interest income | 2,485 | 2,644 | 2,460 | 2,470 | 2,543 | 2,351 | 2,389 | 2,191 | 2,088 | 1,948 | 2,643 | 3,226 | ||||||||||||||||||||||||||||||||||||
Dividend and income tax equivalent income | 1,112 | 1,351 | 1,975 | 2,554 | 2,661 | 2,675 | 2,920 | 2,784 | 1,926 | 1,329 | 790 | 1,007 | ||||||||||||||||||||||||||||||||||||
Other revenue | 3,942 | 3,415 | 3,650 | 3,322 | 3,577 | 5,223 | 5,685 | 6,598 | 5,915 | 4,147 | 10,710 | 20,160 | ||||||||||||||||||||||||||||||||||||
Total Revenue | 45,801 | 41,755 | 46,705 | 49,970 | 50,780 | 56,194 | 58,087 | 59,828 | 57,778 | 62,791 | 74,185 | 89,810 | ||||||||||||||||||||||||||||||||||||
Expenses from Transactions | ||||||||||||||||||||||||||||||||||||||||||||||||
Employee expenses | 18,250 | 18,130 | 17,816 | 18,592 | 20,045 | 21,258 | 22,681 | 24,019 | 25,662 | 26,385 | 28,068 | 30,557 | ||||||||||||||||||||||||||||||||||||
Superannuation expenses | ||||||||||||||||||||||||||||||||||||||||||||||||
Superannuation interest costs | 1,216 | 923 | 963 | 878 | 767 | 514 | 667 | 653 | 354 | 246 | 377 | 776 | ||||||||||||||||||||||||||||||||||||
Other superannuation expenses | 2,301 | 2,420 | 2,277 | 2,319 | 2,507 | 2,661 | 2,741 | 3,012 | 3,183 | 3,073 | 3,387 | 3,756 | ||||||||||||||||||||||||||||||||||||
Other operating expenses | 9,497 | 12,817 | 13,108 | 14,539 | 14,811 | 15,578 | 17,259 | 16,480 | 17,085 | 16,500 | 18,229 | 20,014 | ||||||||||||||||||||||||||||||||||||
Depreciation and amortisation | 2,777 | 2,902 | 3,060 | 3,137 | 2,921 | 3,068 | 3,326 | 3,451 | 4,033 | 4,170 | 4,506 | 5,018 | ||||||||||||||||||||||||||||||||||||
Other interest expenses | 1,659 | 1,940 | 2,200 | 2,328 | 2,220 | 1,722 | 1,614 | 1,581 | 1,486 | 1,619 | 1,508 | 1,688 | ||||||||||||||||||||||||||||||||||||
Grant expenses | 10,327 | 7,182 | 6,792 | 7,758 | 6,841 | 8,568 | 8,048 | 9,647 | 11,702 | 11,713 | 13,827 | 14,072 | ||||||||||||||||||||||||||||||||||||
Total Expenses | 46,028 | 46,312 | 46,217 | 49,551 | 50,112 | 53,369 | 56,337 | 58,843 | 63,505 | 63,706 | 69,902 | 75,880 | ||||||||||||||||||||||||||||||||||||
Net Operating Balance | (226 | ) | (4,558 | ) | 488 | 420 | 668 | 2,825 | 1,750 | 985 | (5,728 | ) | (915 | ) | 4,284 | 13,930 | ||||||||||||||||||||||||||||||||
OTHER KEY AGGREGATES | ||||||||||||||||||||||||||||||||||||||||||||||||
Purchases of non-financial assets | 7,971 | 7,001 | 6,323 | 4,635 | 4,044 | 4,620 | 5,126 | 5,764 | 6,306 | 6,682 | 7,878 | 9,899 | ||||||||||||||||||||||||||||||||||||
Net acquisition of non-financial assets | 5,241 | 3,389 | 3,087 | 992 | 1,164 | 2,265 | 2,337 | 3,192 | 3,436 | 3,942 | 4,356 | 5,838 | ||||||||||||||||||||||||||||||||||||
Fiscal Balance | (5,467 | ) | (7,947 | ) | (2,599 | ) | (572 | ) | (497 | ) | 560 | (587 | ) | (2,207 | ) | (9,164 | ) | (4,857 | ) | (72 | ) | 8,092 | ||||||||||||||||||||||||||
Cash Surplus/(Deficit) | (4,951 | ) | (8,585 | ) | (3,213 | ) | (105 | ) | 866 | 1,448 | 337 | 302 | (6,228 | ) | (6,421 | ) | 2,816 | 10,167 | ||||||||||||||||||||||||||||||
Net Worth | 170,745 | 172,963 | 166,492 | 171,933 | 188,099 | 194,988 | 195,038 | 200,861 | 195,646 | 209,464 | 249,590 | 303,973 | ||||||||||||||||||||||||||||||||||||
Net Debt | (5,720 | ) | 2,399 | 5,208 | 5,749 | 653 | (355 | ) | (509 | ) | (198 | ) | 14,036 | 11,344 | 10,997 | 2,615 | ||||||||||||||||||||||||||||||||
Borrowing with QTC2 | 28,391 | 36,508 | 39,864 | 41,343 | 34,200 | 31,358 | 29,256 | 29,468 | 37,570 | 46,153 | 49,000 | 46,166 | ||||||||||||||||||||||||||||||||||||
Leases and similar arrangements | 637 | 734 | 882 | 1,126 | 1,370 | 1,503 | 2,142 | 2,612 | 6,485 | 7,703 | 7,671 | 7,519 | ||||||||||||||||||||||||||||||||||||
Borrowing with QTC (NFPS) | 60,205 | 67,116 | 70,668 | 73,256 | 71,160 | 69,107 | 66,964 | 67,576 | 76,464 | 85,901 | 90,851 | 89,442 | ||||||||||||||||||||||||||||||||||||
Leases and similar arrangements (NFPS) | 1,127 | 1,559 | 1,752 | 1,802 | 1,316 | 1,882 | 2,142 | 2,612 | 6,977 | 8,157 | 8,028 | 7,887 | ||||||||||||||||||||||||||||||||||||
Notes:
| 1. | Numbers may not add due to rounding. |
| 2. | Borrowing in 2013–14 includes bank overdraft of $1.434 billion. |
Source: Report on State Finances for Queensland 2011–12 to 2022–23. (Numbers have been recast for changes to UPF presentation.)
193
Budget Strategy and Outlook 2024-25
| 9.4 | Other General Government Sector Uniform Presentation Framework data |
Data in the following tables is presented in accordance with the UPF.
| 9.4.1 | Grants |
Tables 9.11 and 9.12 provide details of General Government Sector current and capital grant revenue and expenses.
| Table 9.11 | General Government Sector grant revenue1 |
| 2023-24 Est. Act. $ million | 2024-25 Budget $ million | |||||||
Current grant revenue | ||||||||
Current grants from the Commonwealth | ||||||||
General purpose grants | 19,464 | 18,528 | ||||||
Specific purpose grants | 11,807 | 12,653 | ||||||
Specific purpose grants for on-passing | 4,331 | 5,093 | ||||||
Total current grants from the Commonwealth | 35,602 | 36,273 | ||||||
Other contributions and grants | 335 | 370 | ||||||
Total current grant revenue | 35,937 | 36,643 | ||||||
Capital grant revenue | ||||||||
Capital grants from the Commonwealth | ||||||||
Specific purpose grants | 3,585 | 3,535 | ||||||
Total capital grants from the Commonwealth | 3,585 | 3,535 | ||||||
Other contributions and grants | 28 | 100 | ||||||
Total capital grant revenue | 3,612 | 3,635 | ||||||
Total grant revenue | 39,550 | 40,278 | ||||||
Note:
| 1. | Numbers may not add due to rounding. |
194
Budget Strategy and Outlook 2024-25
| Table 9.12 | General Government Sector grant expenses1 |
| 2023-24 Est. Act $ million | 2024-25 Budget $ million | |||||||
Current grant expense | ||||||||
Private and Not-for-profit sector | 4,068 | 4,028 | ||||||
Private and Not-for-profit sector on-passing | 4,357 | 4,497 | ||||||
Local Government | 229 | 222 | ||||||
Local Government on-passing | 26 | 650 | ||||||
Grants to other sectors of Government | 3,094 | 3,089 | ||||||
Other | 617 | 454 | ||||||
Total current grant expense | 12,390 | 12,941 | ||||||
Capital grant expense | ||||||||
Private and Not-for-profit sector | 1,265 | 1,189 | ||||||
Local Government | 2,123 | 2,678 | ||||||
Grants to other sectors of Government | 664 | 47 | ||||||
Other | 152 | 275 | ||||||
Total capital grant expense | 4,204 | 4,189 | ||||||
Total grant expense | 16,595 | 17,131 | ||||||
Note:
| 1. | Numbers may not add due to rounding. |
| 9.4.2 | Dividend and income tax equivalent income |
Tables 9.13 provides details of the source of dividend and income tax equivalent income in the General Government Sector.
| Table 9.13 | General Government Sector dividend and income tax equivalent income1 |
| 2023-24 Est. Act. $ million | 2024-25 Budget $ million | |||||||
Dividend and Income Tax Equivalent income from PNFC sector | 1,550 | 1,551 | ||||||
Dividend and Income Tax Equivalent income from PFC sector | 170 | 219 | ||||||
Total Dividend and Income Tax Equivalent income | 1,720 | 1,771 | ||||||
Note:
| 1. | Numbers may not add due to rounding. |
195
Budget Strategy and Outlook 2024-25
| 9.4.3 | Expenses by function |
Tables 9.14 provides details of General Government Sector expenses by function.
| Table 9.14 | General Government Sector expenses by function1 |
2023-24 Budget $ million | 2023-24 Est. Act. $ million | 2024-25 Budget $ million | 2025-26 Projection $ million | 2026-27 Projection $ million | 2027-28 Projection $ million | |||||||||||||||||||
General public services | 7,313 | 6,987 | 8,690 | 8,903 | 9,404 | 9,808 | ||||||||||||||||||
Public order and safety | 7,621 | 7,611 | 8,426 | 8,278 | 8,414 | 8,650 | ||||||||||||||||||
Economic affairs | 3,375 | 3,333 | 3,098 | 2,769 | 2,441 | 2,219 | ||||||||||||||||||
Environmental protection | 1,008 | 986 | 1,137 | 989 | 985 | 1,168 | ||||||||||||||||||
Housing and community amenities | 2,091 | 2,517 | 1,916 | 1,688 | 1,304 | 1,292 | ||||||||||||||||||
Health | 24,260 | 25,704 | 26,739 | 26,730 | 27,442 | 28,833 | ||||||||||||||||||
Recreation, culture and religion | 1,218 | 1,104 | 1,335 | 1,167 | 1,280 | 1,264 | ||||||||||||||||||
Education | 19,805 | 20,410 | 21,275 | 21,369 | 21,956 | 23,026 | ||||||||||||||||||
Social protection | 8,154 | 10,713 | 7,808 | 7,046 | 7,076 | 7,557 | ||||||||||||||||||
Transport | 9,415 | 9,130 | 10,313 | 10,292 | 9,480 | 9,488 | ||||||||||||||||||
Total Expenses | 84,261 | 88,495 | 90,738 | 89,232 | 89,783 | 93,305 | ||||||||||||||||||
Note:
| 1. | Numbers may not add due to rounding. |
| 9.4.4 | Purchases of non-financial assets by function |
Tables 9.15 provides details of General Government Sector purchases of non-financial assets by function.
| Table 9.15 | General Government Sector purchases of non-financial assets by function1 |
2023-24 Budget $ million | 2023-24 Est. Act. $ million | 2024-25 Budget $ million | 2025-26 Projection $ million | 2026-27 Projection $ million | 2027-28 Projection $ million | |||||||||||||||||||
General public services | 243 | 279 | 403 | 360 | 273 | 87 | ||||||||||||||||||
Public order and safety | 1,213 | 949 | 1,288 | 1,102 | 849 | 510 | ||||||||||||||||||
Economic affairs | 131 | 49 | 130 | 122 | 70 | 50 | ||||||||||||||||||
Environmental protection | 84 | 55 | 101 | 153 | 29 | 20 | ||||||||||||||||||
Housing and community amenities | 415 | 437 | 430 | 548 | 807 | 991 | ||||||||||||||||||
Health | 1,502 | 2,023 | 2,381 | 3,363 | 2,963 | 2,788 | ||||||||||||||||||
Recreation, culture and religion | 186 | 241 | 227 | 393 | 593 | 1,331 | ||||||||||||||||||
Education | 1,485 | 1,472 | 1,341 | 1,632 | 1,225 | 763 | ||||||||||||||||||
Social protection | 129 | 140 | 111 | 131 | 69 | 54 | ||||||||||||||||||
Transport | 3,959 | 5,416 | 6,420 | 6,681 | 7,698 | 6,170 | ||||||||||||||||||
Total Purchases | 9,347 | 11,061 | 12,831 | 14,485 | 14,577 | 12,763 | ||||||||||||||||||
Note:
| 1. | Numbers may not add due to rounding. |
196
Budget Strategy and Outlook 2024-25
| 9.4.5 | Taxes |
Tables 9.16 provides details of taxation revenue collected by the General Government Sector.
| Table 9.16 | General Government Sector taxes1 |
| 2023-24 Est. Act. $ million | 2024-25 Budget $ million | |||||||
Taxes on employers’ payroll and labour force | 6,715 | 7,245 | ||||||
Taxes on property | ||||||||
Land taxes | 2,032 | 2,499 | ||||||
Stamp duties on financial and capital transactions | 5,605 | 6,793 | ||||||
Other | 1,457 | 1,487 | ||||||
Taxes on the provision of goods and services | ||||||||
Taxes on gambling | 2,048 | 2,141 | ||||||
Taxes on insurance | 1,565 | 1,683 | ||||||
Taxes on use of goods and performance of activities | ||||||||
Motor vehicle taxes | 3,248 | 2,951 | ||||||
Total Taxation Revenue | 22,670 | 24,799 | ||||||
Note:
| 1. | Numbers may not add due to rounding. |
197
Budget Strategy and Outlook 2024-25
| 9.5 | Contingent liabilities |
Contingent liabilities represent items that are not included in the budget as significant uncertainty exists as to whether the government would sacrifice future economic benefits in respect of these items. Nevertheless, such contingencies need to be recognised and managed wherever possible in terms of their potential impact on the government’s financial position in the future.
The state’s quantifiable and non-quantifiable contingent liabilities are detailed in the 2022–23 Report on State Finances – whole-of-government financial statements (note 43).
A summary of the state’s quantifiable contingent liabilities as at 30 June 2023 is provided in Table 9.17.
| Table 9.17 | Contingent liabilities1 |
| 2022–23 $ million | ||||
Nature of contingent liability | ||||
Guarantees and indemnities | 12,747 | |||
Other | 120 | |||
Total | 12,867 | |||
| 9.6 | Background and interpretation of Uniform Presentation Framework |
As mentioned in the introduction to this chapter, the UPF was reviewed in 2007 following release of the accounting standard, AASB 1049 Whole of Government and General Government Sector Financial Reporting.
This standard aims to harmonise GFS and GAAP with the objective of improving the clarity and transparency of government financial statements.
| 9.6.1 | Accrual Government Finance Statistics Framework |
The GFS reporting framework, developed by the Australian Bureau of Statistics (ABS), is based on international statistics standards (the International Monetary Fund Manual on Government Finance Statistics and the United Nations System of National Accounts). This allows comprehensive assessments to be made of the economic impact of government.
The accrual GFS framework is based on an integrated recording of stocks and flows. Stocks refers to a unit’s holding of assets and liabilities at a point in time, while flows represent the movement in the stock of assets and liabilities between two points in time. Flows comprise two separate types, transactions and other economic flows. Transactions come about from mutually agreed interactions between units or within a single unit. Other economic flows would include revaluations and destruction or discovery of assets that do not result from a transaction.
198
Budget Strategy and Outlook 2024-25
In GFS operating statements, other economic flows, being outside the control of government, are excluded and do not affect the net operating balance or fiscal balance.
| 9.6.2 | Generally Accepted Accounting Principles |
In addition to the GFS framework, public sector entities were previously required to report at year end against AAS 31 Financial Reporting by Government, which meant complying with the Accounting Standards issued by the AASB.
| 9.6.3 | Harmonisation under AASB 1049 |
This dual reporting regime caused confusion for financial report users and the Financial Reporting Council asked the AASB to develop a framework harmonising GAAP and GFS and to issue an Australian accounting standard for a single set of government reports.
In the development of AASB 1049, the AASB adopted the following approaches:
| • | adoption of GAAP definition, recognition and measurement principles in almost all cases |
| • | amended presentation requirements to encompass a comprehensive result that retains GAAP classification system but overlays it with a transaction and other economic flows classification system based on GFS |
| • | expanding the disclosure requirements to incorporate key fiscal aggregates required by GFS. |
| 9.6.4 | Revisions to the Uniform Presentation Framework |
Following the introduction of AASB 1049, the Australian, state and territory governments consider that the UPF will continue to be an important framework for ensuring comparability of financial information across jurisdictions. The UPF continues to apply to financial statements produced by government in budget, mid-year budget updates and final budget outcome reports, whereas the accounting standard applies only to outcome reports.
Aligning the framework with the AASB 1049 was not intended to create a UPF that complies with all the reporting requirements of AASB 1049. For example, the UPF does not include the same level of detail in relation to disclosure requirements of AASB 1049. Instead, the revised UPF allows jurisdictions to utilise the framework as the base set of statements and add additional relevant information to comply with AASB 1049.
| 9.7 | Sector classification |
GFS data is presented by institutional sector, distinguishing between the General Government Sector and the PNFC Sector.
Budget reporting focuses on the General Government Sector, which provides regulatory services, and goods and services of a non-market nature that are provided at less than cost or at no cost. These services are largely financed by general revenue (Australian Government grants and state
199
Budget Strategy and Outlook 2024-25
taxation). This service comprises government departments, their commercialised business units/shared service providers and certain statutory bodies.
The PNFC Sector comprises bodies that provide mainly market goods and services that are of non-regulatory and non-financial nature. PNFCs are financed through sales to customers of their goods and services and may be supplemented by explicit government subsidy to satisfy community service obligations. In general, PNFCs are largely distinguishable from the governments that own them. Examples of PNFCs include the energy entities and Queensland Rail.
Together, the General Government Sector and the PNFC Sector comprise the Non-financial Public Sector.
| 9.8 | Reporting entities |
The reporting entities included in the General Government and the PNFC sectors in these budget papers are included below:
| 9.8.1 | General Government |
Departments
Agriculture and Fisheries
Child Safety, Seniors and Disability Services
Education
Employment, Small Business and Training (renamed from Youth Justice, Employment, Small Business and Training)
Energy and Climate (renamed from Energy and Public Works)
Environment, Science and Innovation (renamed from Environment and Science)
Housing, Local Government, Planning and Public Works (renamed from Housing)
Justice and Attorney-General
Premier and Cabinet
Queensland Corrective Services
Queensland Fire Department (renamed from Queensland Fire and Emergency Services)
Queensland Health
Queensland Police Service
Queensland Treasury
200
Budget Strategy and Outlook 2024-25
Regional Development, Manufacturing and Water
Resources
State Development and Infrastructure (renamed from State Development, Infrastructure, Local Government and Planning)
Tourism and Sport (renamed from Tourism, Innovation and Sport)
Transport and Main Roads
Treaty, Aboriginal and Torres Strait Islander Partnerships, Communities and the Arts
Youth Justice
Commercialised Business Units
CITEC
Economic Development Queensland
QBuild
QFleet
RoadTek
Shared Service Providers
Corporate Administration Agency
Queensland Shared Services
201
Budget Strategy and Outlook 2024-25
Other General Government entities
Board of the Queensland Museum
Crime and Corruption Commission
Cross River Rail Delivery Authority
Electoral Commission of Queensland
Gold Coast Waterways Authority
Health and Wellbeing Queensland
Hospital and Health Services
Cairns and Hinterland
Central Queensland
Central West
Children’s Health Queensland
Darling Downs
Gold Coast
Mackay
Metro North
Metro South
North West
South West
Sunshine Coast
Torres and Cape
Townsville
West Moreton
Wide Bay
Legal Aid Queensland
Legislative Assembly
Library Board of Queensland
Motor Accident Insurance Commission
Nominal Defendant
Office of the Governor
Office of the Health Ombudsman
Office of the Queensland Integrity Commissioner
Prostitution Licensing Authority
Public Sector Commission
Queensland Art Gallery Board of Trustees
Queensland Audit Office
Queensland Building and Construction Commission
Queensland Curriculum and Assessment Authority
Queensland Family and Child Commission
Queensland Human Rights Commission
Queensland Mental Health Commission
Queensland Performing Arts Trust
Queensland Racing Integrity Commission
Queensland Reconstruction Authority
Queensland Rural and Industry Development Authority
Residential Tenancies Authority
South Bank Corporation
TAFE Queensland
The Council of the Queensland Institute of Medical Research
The Public Trustee of Queensland
Tourism and Events Queensland
Trade and Investment Queensland
202
Budget Strategy and Outlook 2024-25
| 9.8.2 | Public Non-financial Corporations |
Brisbane Organising Committee for the 2032 Olympic and Paralympic Games
CleanCo Queensland Ltd
CS Energy Limited
Energy Queensland Limited
Far North Queensland Ports Corporations Limited
Gladstone Area Water Board
Gladstone Ports Corporation Limited
Mount Isa Water Board
North Queensland Bulk Ports Corporation Limited
Port of Townsville Limited
Powerlink Queensland
Queensland Bulk Water Supply Authority (Seqwater)
Queensland Hydro Pty Ltd
Queensland Rail
Queensland Treasury Holdings Pty Ltd
Stadiums Queensland
Stanwell Corporation Limited
Sunwater Limited
203
Budget Strategy and Outlook 2024-25
| Appendix A: | Concessions statement |
Substantial rebates, subsidies and discounts to address cost-of-living pressures for all Queenslanders and support small businesses
In the 2024–25 Queensland Budget, the government has committed to provide substantial support for Queenslanders in the context of the national cost-of-living challenge.
Building on the extensive program of existing concessions and subsidies, this year’s Budget delivers a record level of targeted and timely relief for households and small businesses. Inflationary pressures have been a significant challenge across the national and global economies in recent years, and Queensland has not been immune to these impacts. The rate of increase in prices has started to moderate but this follows 2 years of elevated price rises that are still impacting households through ongoing cost-of-living pressures. Queensland households, businesses and industry continue to face challenges including elevated interest rates, electricity costs and higher costs of goods and services.
While income support is the responsibility of the Australian Government, the Queensland Government provides a wide range of generous concessions, including subsidies, rebates and discounts across a variety of services and products, to assist households and small businesses across the state.
These concessions provide Queenslanders with cost-of-living support for essentials like electricity, transport, health, housing, education and training services.
The total value of all concessions provided to Queenslanders is estimated to be a record $11.218 billion in 2024–25, as highlighted in Chart A.1. This represents an increase of 31.1 per cent compared with estimated actual concessions of $8.555 billion in 2023–24, the largest increase in concessions spending on record.
The government is providing $3.739 billion1 in new and expanded measures in 2024–25 to support Queenslanders in tackling cost-of-living challenges.
This comprises electricity bill rebates, lower public transport fares and motor vehicle registration costs, additional support for first home buyers, an increase in value and access to FairPlay vouchers, school and community food relief program; and food, emergency, and financial relief measures for vulnerable cohorts.
The 2024–25 Budget delivers $2.965 billion for additional electricity bill support to households and small businesses, which is the most significant electricity bill support package announced by any state or territory.
As part of this package, all Queensland households will automatically receive $1,300 off their electricity bills in 2024–25. This consists of an upfront $1,000 Cost of Living Rebate from the Queensland Government and a $300 rebate paid in quarterly instalments from the Australian Government.
| 1 | Some elements of the cost-of-living measures included in this figure are grants and support measures not defined as concessions for the purposes of this chapter. |
204
Budget Strategy and Outlook 2024-25
Vulnerable households will continue to receive the $372 Queensland Electricity Rebate for a total of $1,672 support in 2024–25.
The government’s substantial cost-of-living relief measures will more than offset typical household electricity bill increases in 2024–25. In some cases, households will have zero bills or be in credit in 2024–25.
Including the $1,300 Cost of Living Rebate in 2024–25, the government will have provided all Queensland households with a total of $2,425 in electricity rebates since 2018.
Around 205,000 eligible Queensland small businesses will also receive $650 off electricity bills in 2024–25, co-funded by the Queensland and Australian Governments.
In addition to this, the government is providing substantial relief through significant cost-of-living measures that reduce transport costs:
| • | $150 million in 2024–25 from lowering public transport fares to a flat fare of 50 cents per trip across the state from 5 August 2024 for 6 months. In addition to this initiative, the government is also providing half-price tickets on Airtrain services |
| • | $435 million from a 20 per cent reduction in vehicle registration costs for all light vehicles for a 12-month period, which is scheduled to start appearing on renewal notices sent to customers from 5 August 2024. It is estimated that $399 million of benefit from this measure will be realised in 2024–25 financial year, and the remaining $36 million in 2025–26. |
| Chart A.1 | Total concessions value by year 1,2,3 |
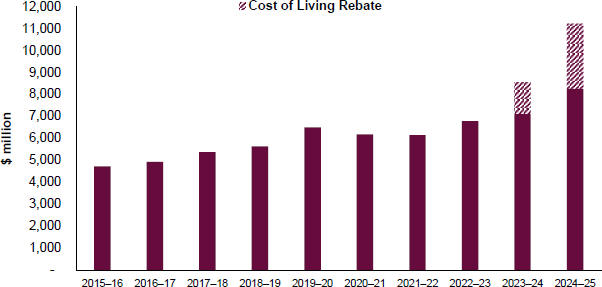
Note:
| 1. | Due to the timing of the 2020–21 Budget, an actual figure was calculated for the total concessions value in 2019–20. Values for all other years are estimated actuals aside from 2024–25, which is the budgeted amount. |
| 2. | The decrease from 2019–20 to 2020–21 reflects the gradual reduction of COVID-19 support measures, which ceased in 2023–24. |
| 3. | Funding for the Queensland electricity rebates has been provided to retailers in 2023–24 so that rebates can be applied to household bills in 2024–25. |
As highlighted above in Chart A.1, total government spending on concessions is expected to more than double between 2015–16 and 2024–25.
205
Budget Strategy and Outlook 2024-25
This represents an increase, on average, that exceeds inflation by 6.9 per cent per annum over that period, ensuring that the real value of concessions available to Queenslanders has grown materially over time.
Further detail regarding the Queensland Government’s cost-of-living measures that form part of this Budget can be found in Chapter 1.
| Box A.1 | Case studies – cost-of-living relief for all Queensland households |
The majority of Queenslanders benefit from at least one Queensland Government concession and, in many cases, may benefit from multiple concessions each year.
The following examples highlight the broad range of support potentially available to various types of Queensland households and businesses.
Retired couple
A retired couple in their seventies, living in Palmview on the Sunshine Coast with no dependents, both with a Queensland Seniors Card and on the pension, could be eligible for a broad range of concessions in 2024–25 providing a total benefit of more than $4,100 including:
| • | $1,300 Cost of Living Rebate on their electricity bill plus the existing $372 Queensland Electricity Rebate, bringing total support to $1,672 |
| • | $120 South East Queensland water subsidy |
| • | $200 for council rates |
| • | $89 for reticulated natural gas |
| • | an average benefit of $830 each for general dental care under the Oral Health Scheme |
| • | $49 registration fee concession for their 4-cylinder vehicle registered on a pensioner concession, bringing registration fees down to $195 (including traffic improvement fee (TIF) but excluding compulsory third party (CTP) insurance). This reduction is in addition to the existing 50 per cent concession that pensioners receive on the registration fee component of their fees |
| • | when catching the bus to explore their community – shopping in Maroochydore, swimming at Mooloolaba and visiting the hospital – on average 3 times a week at a usual cost of $1.74 per trip, they will now save a combined $357 over 6 months due to the 50 cent flat fare on Translink public transport services across the state for 6 months. |
Low-income family
A low-income family living in Robina on the Gold Coast with a Health Care Card and 3 children (aged 4, 13 and 16), could be eligible for a broad range of concessions in 2024–25 providing a total benefit of more than $9,150*, including:
| • | $1,300 Cost of Living Rebate on their electricity bill plus the existing $372 Queensland Electricity Rebate, bringing total support to $1,672 |
| • | $492 through the Textbook and Resource Allowance paid to the children’s school |
206
Budget Strategy and Outlook 2024-25
| • | 15 hours of free kindergarten per week. On average, a family attending a sessional kindergarten for 15 hours per week that charges $48 per day will save $4,800 a year in fees |
| • | $85 registration fee concession for their private use 4-cylinder vehicle, bringing registration fees down to $339 (including TIF but excluding CTP) |
| • | if one parent commutes by train from Robina 4 days per week to a work in Bowen Hills at a usual cost of $11,46 per trip, the family could save $2,104 over 6 months due to the 50 cent flat fare on Translink public transport services across the state for 6 months. |
* not all of the new and expanded cost-of-living measures included in the 2024–25 Budget are classified as concessions for the purpose of this Appendix A.
School-leaver
A low-income casual worker, living in Cairns who has just graduated from high school and has a Health Care Card could be eligible for a substantial range of concessions in 2024–25, providing a total benefit of more than $6,200 plus a loan of $1,600, comprising:
| • | $1,300 Cost of Living Rebate on their electricity bill plus the existing $372 Queensland Electricity Rebate, bringing total support to $1,672 |
| • | an interest-free and fee-free rental bond loan providing average support of $1,600 |
| • | an average subsidy of $3,483 to undertake their first post-school Certificate III qualification |
| • | an average benefit of $830 for general dental care under the Oral Health Scheme |
| • | $85 registration fee concessions for a private use 4-cylinder vehicle, bringing registration fees down to $339 (including TIF but excluding CTP) |
| • | if studying at the local TAFE and catching the bus to campus 4 days a week, at a usual cost of $1.20 each way, they could save $134 over 6 months due to the 50 cent flat fare on Translink public transport across the state for 6 months. |
Examples of other key concessions that individuals could be eligible for in 2024–25 include:
| • | an average subsidy of $10,609 to pre-approved public and private registered training organisations to subsidise the cost of training and assessment for eligible Queensland apprentices and trainees, or complementary pathways through the User Choice program |
| • | an average subsidy of $4,116 to undertake a priority Certificate IV, diploma or advanced diploma qualification or industry endorsed skillset through the VET – Higher Level Skills Tuition Fee Subsidy |
| • | financial assistance for apprentices and trainees to cover the cost of travel incurred in attending off-the-job training at a registered training organisation through the Travel and Accommodation Subsidy |
| • | an average rental rebate of around $14,486 per annum for people living in social housing through the Government Managed Housing Rental Rebate. |
207
Budget Strategy and Outlook 2024-25
Focus
The Concessions Statement highlights the cost and nature of concessions provided by the Queensland Government. It covers concessions that are direct budget outlays (e.g. fee subsidy payments) and concessions that are revenue foregone through fees and charges set at a lower rate than applies to the wider community and other businesses.
In the case of broader concessions, it also includes concessions related to the delivery of services to consumers at less than the full cost of service provision.
Section A.2 sets out the specific concessions provided by the Queensland Government, detailed by agency. Section A.3 sets out the concessions provided by government-owned corporations (GOCs) and is separated into concessions by GOC and concessional leases (industry, commercial and community) by GOC. Within each agency or GOC, concessions are listed in descending order of value.
Explanation of scope
For the purposes of this document, concessions include:
| • | discounts, rebates and subsidies provided by the government that improve access to, and affordability of, a range of services for certain individuals, families or businesses based on eligibility criteria (e.g. relating to factors such as age, income, special needs, location or business characteristic) |
| • | concessions where all consumers, including businesses, of a particular good or service pay a price that is below the full cost of service provision, that is, no eligibility criteria is applied. |
Both General Government and Public Non-financial Corporations (PNFC) Sector concessions are included in this statement. Where a payment is made from a General Government Sector agency to a PNFC entity for a concession arrangement, the expenditure is reported against the General Government Sector agency only to avoid double counting.
To be included in this statement, concessions must meet the minimum materiality threshold of estimated expenditure or revenue foregone of $50,000 in either the budget year or the year prior.
Varying methods have been used to estimate the cost of concessions, depending on the nature of the concessions, including:
| • | direct budget outlay cost (e.g. direct subsidy or rebate payments or the government’s contribution in the case of items such as rental subsidies) |
| • | revenue foregone (e.g. concessional fees and charges) |
| • | cost of goods and services provided. |
For the purposes of illustration, the document often uses averages to demonstrate the potential value of the concession to recipients. However, averages are not reflective of individual circumstances, meaning the actual dollar value of the concession to individual recipients may vary from person to person or business to business.
The Concessions Statement does not include tax expenditures (e.g. tax exemptions, reduced tax rates, tax rebates and deductions). Information on tax expenditures can be found in Appendix B.
208
Budget Strategy and Outlook 2024-25
| A.1 | Concessions summary |
| Table A.1.1 | Concession by entity1 |
Concession by entity | 2023–24 Est. Act. $ million | 2024–25 Estimate $ million | ||||||
Agency | ||||||||
Department of Agriculture and Fisheries | 27.0 | 32.2 | ||||||
Department of Child Safety, Seniors and Disability Services2 | 1,780.5 | 3,313.4 | ||||||
Department of Education | 301.8 | 377.9 | ||||||
Department of Employment, Small Business and Training | 575.2 | 613.0 | ||||||
Department of Energy and Climate | 669.2 | 623.5 | ||||||
Department of Environment, Science and Innovation | 2.1 | 2.1 | ||||||
Department of Housing, Local Government, Planning and Public Works | 877.7 | 879.0 | ||||||
Department of Justice and Attorney-General | 124.5 | 138.9 | ||||||
Department of Regional Development, Manufacturing and Water | 33.3 | 28.9 | ||||||
Department of Resources | 10.5 | 11.0 | ||||||
Department of State Development and Infrastructure | 0.7 | 0.5 | ||||||
Department of Tourism and Sport | 2.4 | 2.7 | ||||||
Department of Transport and Main Roads | 3,679.6 | 4,693.4 | ||||||
Department of Treaty, Aboriginal and Torres Strait Islander Partnerships, Communities and the Arts3 | 7.7 | 6.3 | ||||||
Queensland Fire Department | 11.5 | 11.7 | ||||||
Queensland Health | 325.5 | 350.3 | ||||||
Total Agency | 8,429.2 | 11,084.8 | ||||||
Government-owned corporations | ||||||||
Energy Queensland Limited | 21.7 | 23.4 | ||||||
Far North Queensland Ports Corporation Limited | 2.0 | 2.0 | ||||||
Gladstone Ports Corporation Limited | 39.3 | 43.4 | ||||||
North Queensland Bulk Ports Corporation Limited | 1.5 | 1.5 | ||||||
Port of Townsville Limited | 6.6 | 6.8 | ||||||
Queensland Rail | 2.6 | 2.7 | ||||||
Sunwater Limited | 51.6 | 53.8 | ||||||
Total government-owned corporations | 125.3 | 133.6 | ||||||
Total all entities | 8,554.5 | 11,218.4 | ||||||
Notes:
| 1. | Numbers may not add due to rounding. |
| 2. | The table reflects the period in which Queenslanders will benefit from the concessions. |
| 3. | For comparability purposes, all electricity rebates have been included under Department of Child Safety, Seniors and Disability Services |
209
Budget Strategy and Outlook 2024-25
| A.2 | Concessions by agency |
| Table A.2.1 | Department of Agriculture and Fisheries |
Concession | 2023–24 Est. Act. $ million | 2024–25 Estimate $ million | ||||||
Primary Industry Productivity Enhancement Scheme (PIPES)1 | 13.0 | 19.2 | ||||||
Sheep and Goat Electronic Identification (eID) Rebate Scheme2 | — | 5.4 | ||||||
Emergency Drought Assistance Loan Scheme1 | 0.1 | 2.8 | ||||||
Drought Carry-on Finance Loan Scheme1 | — | 2.2 | ||||||
Drought Ready and Recovery Finance Loan Scheme1 | 0.5 | 2.0 | ||||||
Drought Relief Assistance Scheme3 | 0.6 | 0.5 | ||||||
Stocked Impoundment Permit Scheme | 0.1 | 0.1 | ||||||
Drought Preparedness Grant Scheme4 | 12.6 | — | ||||||
Spanish Mackerel Commercial Fishing Fee Waiver5 | 0.1 | — | ||||||
Total | 27.0 | 32.2 | ||||||
Notes:
| 1. | The increase is mainly due to the anticipated increase in loan advances and higher interest rates. |
| 2. | This is a new scheme in 2024–25. The 2024–25 Estimate includes Queensland Government funding only. The Australian Government also contributes towards the funding for this program. |
| 3. | The reduction is mainly due to the anticipated reduced demand for this scheme. |
| 4. | Future drought assistance arrangements will be considered by the government in response to the Burke Review and the Australian Government’s Future Drought Fund Investment Strategy (2024 to 2028) expected to be released in mid-2024. |
| 5. | This concession will not be extended into the 2024–25 financial year. |
Primary Industry Productivity Enhancement Scheme (PIPES)
PIPES is administered by the Queensland Rural and Industry Development Authority and provides concessional rates of interest on loans to eligible primary producers in need of financial assistance. First Start Loans and Sustainability Loans, of up to $2 million and $1.3 million respectively, support applicants to enter primary production and to improve productivity and sustainability.
The average concessional interest rate for new lending is 5.6 per cent. The amounts in the above table represent the fair values of the interest rate concessions pertaining to loans issued in the PIPES portfolio in each of the financial years shown.
Sheep and Goat Electronic Identification (eID) Rebate Scheme
The Queensland Sheep and Goat eID Rebate Scheme supports the mandatory implementation of sheep and goat individual eID to enhance national biosecurity traceability in the event of an emergency animal disease outbreak. The scheme provides rebates to eligible sheep and goat producers and businesses to support the purchase of eligible items, including eID readers and devices:
| • | 50 per cent rebate up to $1,600 per property to sheep and managed goat producers, livestock agents and show societies |
| • | 50 per cent rebate ranging from $2,500 to $65,000 for saleyards |
| • | 50 per cent rebate ranging from $2,500 to $85,000 for processors. |
210
Budget Strategy and Outlook 2024-25
These rebates are funded by both the Queensland and Australian Governments.
Emergency Drought Assistance Loan Scheme
The Emergency Drought Assistance Loan Scheme provides an interest free concessional loan to eligible primary producers of up to $50,000 as emergency finance for carry-on activities like paying wages or creditors during drought.
The concession is calculated at a rate of 7.49 per cent per annum on the basis of a commercial reference rate of this amount and no interest being charged on the loan. The amount shown in the above table represents the fair values of the interest rate concessions pertaining to loans in the financial year shown.
Drought Carry-on Finance Loan Scheme
The Drought Carry-on Finance Loan Scheme provides a concessional loan to eligible primary producers of up to $250,000 for carry-on finance during drought. These loans would be available where the $50,000 available from the Emergency Drought Assistance Loan Scheme is insufficient to assist the producer to manage drought conditions.
The concession is calculated on the basis of a commercial reference rate of 7.79 per cent per annum and an average concessional interest rate for new lending of 5.37 per cent per annum. The amount shown in the above table represents the fair values of the interest rate concessions pertaining to loans in the financial year shown.
Drought Ready and Recovery Finance Loan Scheme
The Drought Ready and Recovery Finance Loan Scheme provides a concessional loan of up to $250,000 for eligible primary producers to undertake measures identified in their Farm Business Resilience Plan that will improve the drought preparedness of the producer’s property.
The concession is calculated on the basis of a commercial reference rate of 7.68 per cent per annum and an average concessional interest rate for new lending of 5.37 per cent per annum. The amount shown in the above table represents the fair values of the interest rate concessions pertaining to loans in the financial year shown.
Drought Relief Assistance Scheme
The Drought Relief Assistance Scheme provides freight subsidies and emergency water infrastructure rebates during drought declarations of up to 50 per cent to eligible applicants, between $20,000 and $50,000 per property, per financial year. Freight subsidies are available for 2 years after drought revocation for the movement of livestock. These concessions are only available to producers that do not access the new drought preparedness measures.
Stocked Impoundment Permit Scheme
The Stocked Impoundment Permit Scheme provides world class, sustainable fishing options in freshwater environments. It helps reduce fishing pressure on wild fish stocks through a requirement to hold a permit to fish in one of the state’s 63 impoundments. The scheme provides concessions if you have a Queensland Seniors Card, Pensioner Concession Card, Health Care Card or a Repatriation Health Card (Gold Card) and aims to encourage participation in recreational fishing for seniors and concession card holders. The concession provides a discount of $16.96 on the cost of an annual permit.
211
Budget Strategy and Outlook 2024-25
Drought Preparedness Grant Scheme
The Drought Preparedness Grant Scheme provides a rebate to eligible primary producers of up to $50,000 for on-farm capital improvements identified in their Farm Business Resilience Plan to improve the drought preparedness of the producer’s property.
Future drought assistance arrangements will be considered by the government in response to the Burke Review and the Australian Government’s Future Drought Fund Investment Strategy (2024 to 2028) expected to be released in mid-2024.
Spanish Mackerel Commercial Fishing Fee Waiver
As part of the East coast Spanish mackerel harvest strategy, the east coast Spanish mackerel total allowable commercial catch was reduced from 578 tonnes to 165 tonnes from 1 July 2023. To support impacted businesses along the east coast, a range of commercial fishing fees were waived for a 12-month period from 1 July 2023. These commercial fishing fees included quota fees and business adjustment fees (temporary or permanent transfers of symbols, licences, quota or tenders). The average value of the fee waiver provided to eligible businesses was $521.
| Table A.2.2 | Department of Child Safety, Seniors and Disability Services |
Concession | 2023–24 Est. Act. $ million | 2024–25 Estimate $ million | ||||||
Cost of Living Rebate and National Energy Bill Relief1,2 | 1,435.0 | 2,965.1 | ||||||
Electricity Rebate Scheme | 245.9 | 248.5 | ||||||
Pensioner Rate Subsidy Scheme | 59.7 | 59.7 | ||||||
South East Queensland Pensioner Water Subsidy Scheme | 20.5 | 20.5 | ||||||
Home Energy Emergency Assistance Scheme | 10.0 | 10.0 | ||||||
Medical Cooling and Heating Electricity Concession Scheme3 | 3.4 | 3.4 | ||||||
Electricity Life Support Concession Scheme3 | 3.1 | 3.1 | ||||||
Reticulated Natural Gas Rebate Scheme | 2.9 | 3.1 | ||||||
Total | 1,780.5 | 3,313.4 | ||||||
Notes:
| 1. | The variance is due to a continuation and increase in the value of the Cost of Living Rebate in 2024–25. The $2.965 billion benefit households and small business will receive in 2024–25 includes a $2.267 billion contribution from the Queensland Government for the $1,000 Cost of Living Rebate to all households ($2.2 billion) and $325 for small businesses ($67 million), and $698.1 million from the Australian Government for an additional $300 electricity rebate to all households and $325 rebate for small businesses. All rebates are being administered by the Queensland Government. |
| 2. | Funding for the Queensland $2.267 billion electricity bill rebate was appropriated in 2023–24 to the Department of Treaty, Aboriginal and Torres Strait Islander Partnerships, Communities and the Arts but is included above together with the Australian Government funding under the Department of Child Safety, Seniors and Disability Services for consistency and comparability. Funding for the Queensland electricity rebates is appropriated in 2023–24 but will be applied to household bills in 2024–25. |
| 3. | The Medical Cooling and Heating Electricity Concession Scheme and Electricity Life Support Concession Scheme are adjusted annually according to the QCA price determination for Tariff 11. For 2024–25, the QCA determined Tariff 11 will increase by 5.0%. |
Cost of Living Rebate and National Energy Bill Relief
The 2024–25 Budget delivers $2.965 billion for additional electricity bill support to households and small businesses.
212
Budget Strategy and Outlook 2024-25
As part of this package, all Queensland households will automatically receive $1,300 off their electricity bills in 2024–25. This consists of an upfront $1,000 Cost of Living Rebate from the Queensland Government and a $300 rebate paid in quarterly instalments from the Australian Government. The government’s substantial cost-of-living package will more than offset typical household electricity bill increases in 2024–25. In some cases, households will have zero bills or be in credit in 2024–25.
Around 205,000 eligible Queensland small businesses will also receive $650 off electricity bills in 2024–25, co-funded by the Queensland and Australian Governments.
Including the $1,300 Cost of Living Rebate in 2024–25, the government will have provided all Queensland households with a total of $2,425 in electricity rebates since 2018.
Electricity Rebate Scheme
The Electricity Rebate Scheme provides a rebate of up to approximately $372 per annum, to assist with the cost of domestic electricity supply to the homes of eligible holders of a Pensioner Concession Card, a Queensland Seniors Card, Commonwealth Health Care Card, Department of Veterans’ Affairs Gold Card (who receive a War Widow/er Pension or special rate Totally or Permanently Incapacitated Pension) and asylum seekers. It is estimated that over 600,000 households will receive an electricity rebate in 2024–25.
Pensioner Rate Subsidy Scheme
The Pensioner Rate Subsidy Scheme offers a 20 per cent subsidy (up to a maximum of $200 per annum) to lessen the impact of local government rates and charges on pensioners, thereby assisting them to continue to live in their own homes.
South East Queensland Pensioner Water Subsidy Scheme
The South East Queensland (SEQ) Pensioner Water Subsidy Scheme provides a subsidy of up to $120 per annum to eligible pensioner property owners in the SEQ Water Grid to lessen the impact of water prices. This subsidy is in addition to the Pensioner Rate Subsidy Scheme.
Home Energy Emergency Assistance Scheme
The Home Energy Emergency Assistance Scheme provides emergency assistance of up to $720 once in a 2-year period to assist low income households experiencing a short-term financial crisis and who are unable to pay their current electricity and/or reticulated natural gas account. It is not a requirement for the claimant to hold a concession card.
Medical Cooling and Heating Electricity Concession Scheme
The Medical Cooling and Heating Electricity Concession Scheme provides a rebate of up to approximately $503 per annum for eligible concession card holders with a medical condition who have dependence on air conditioning to regulate body temperature.
Electricity Life Support Concession Scheme
The Electricity Life Support Concession Scheme is aimed at assisting seriously ill people who use home-based life support systems by providing a rebate of up to approximately $1,024 per annum for users of oxygen concentrators and a rebate of up to approximately $686 per annum for users of kidney dialysis machines to meet their electricity costs. The concession is paid quarterly and is subject to the patient being medically assessed in accordance with Queensland Health eligibility criteria.
213
Budget Strategy and Outlook 2024-25
Reticulated Natural Gas Rebate Scheme
The Reticulated Natural Gas Rebate Scheme provides a rebate of up to approximately $89 per annum to assist with the cost of reticulated natural gas supplied to the home of eligible holders of a Pensioner Concession Card, Queensland Seniors Card or a Department of Veterans’ Affairs Gold Card (who receive the War Widow/er Pension or special rate Totally or Permanently Incapacitated Pension).
| Table A.2.3 | Department of Education |
Concession | 2023–24 Est. Act. $ million | 2024–25 Estimate $ million | ||||||
Queensland Kindergarten Funding1 | 125.6 | 193.3 | ||||||
Textbook and Resource Allowance2 | 85.7 | 90.0 | ||||||
School Transport Assistance for Students with Disability3 | 53.7 | 55.1 | ||||||
Living Away from Home Allowance Scheme4 | 10.2 | 11.8 | ||||||
Tuition Fee Exemptions/Waivers - Dependants of International Students5 | 9.9 | 10.2 | ||||||
Non-State Schools Transport Assistance Scheme6 | 8.3 | 8.9 | ||||||
Dalby State High School - Bunya Campus Residential Facility | 2.7 | 2.8 | ||||||
Distance Education - Information and Communication Technology Subsidy Scheme | 2.1 | 2.1 | ||||||
Spinifex State College - Mount Isa Student Residential Facility | 1.4 | 1.5 | ||||||
Western Cape College - Weipa Campus Student Residential College | 1.4 | 1.4 | ||||||
Distance Education - Non-Government Student Fee Subsidy | 0.8 | 0.8 | ||||||
Total | 301.8 | 377.9 | ||||||
Notes:
| 1. | The variance is due to the introduction of Free Kindy from 1 January 2024 extending fee relief to all eligible aged children participating in an Approved Kindergarten Program. |
| 2. | The increase is due to enrolment growth and CPI indexation. |
| 3. | The variance is due to increases in operational costs for providers, maximum taxi fares, payments for bus supervisors along with additional buses and student growth. |
| 4. | The increase is due to CPI indexation and an increase in the Remote Area Tuition Allowance. |
| 5. | The increase is due to the growth in estimated student numbers. |
| 6. | The increase is due to CPI indexation and increased demand for assistance under the scheme. |
Queensland Kindergarten Funding
Queensland Kindergarten Funding provides funding to eligible kindergarten service providers to ensure greater access to a quality kindergarten program for Queensland children and to reduce out-of-pocket fees for many families.
From 1 January 2024, the Queensland Government is providing an affordability subsidy of 15 hours per week to make kindergarten free for all 4-year-olds for up to 40 weeks or 600 hours per year. In 2024–25, on average a family attending a sessional kindergarten that charges $48 per day (15 hours per week) will save $4,800 a year in fees.
These subsidies are funded by both the Queensland Government and the Australian Government under the Preschool Reform Agreement 2022 to 2025.
214
Budget Strategy and Outlook 2024-25
Textbook and Resource Allowance
The Textbook and Resource Allowance is available for all parents/caregivers of secondary school age students attending state and non-government schools, and children registered in home education of equivalent age, to assist with the cost of textbooks and learning resources. In schools, parents may assign this allowance to the school to reduce the fees associated with participating in the school’s textbook and resource scheme. For children registered for home education, the allowance is paid directly to the parent.
In 2024, the rates per annum are $155 for students in Years 7 to 10 and $337 for students in Years 11 and 12.
School Transport Assistance for Students with Disability
The School Transport Assistance Program for Students with Disability assists eligible state school students whose disability impacts on their parents’ or carers’ ability to arrange their safe travel to and from school. This assistance includes coordinated service delivery in specially contracted taxis or minibuses, payment of fares on bus, ferry, tram and train, or an allowance for parents who make private travel arrangements for their children to school or a transport meeting point. The benefit level is to a maximum of $400 per week per student, however in exceptional circumstances higher amounts may be approved. A separate scheme is in place for students with disability attending non-state schools (refer ‘Non-State Schools Transport Assistance Scheme’).
Living Away from Home Allowance Scheme
The Living Away from Home Allowance Scheme provides financial assistance to support geographically isolated families. The scheme assists with the costs of children required to live away from home to attend school. This concession is available to Queensland students attending both state and non-state schools.
The benefits available for eligible students in 2024 are:
| • | Remote Area Tuition Allowance – assistance is available for primary students of up to $8,360 per annum and secondary students of up to $10,276 per annum for students who board at approved non-state schools |
| • | Remote Area Allowance – assistance of $2,913 per annum is available to students attending the campus of a Queensland state high school and undertaking an approved agriculture course in lieu of Years 11 and 12 |
| • | Remote Area Travel Allowance – available where the distance from the family home to the boarding location is at least 50km. Benefit levels depend on the distance travelled and range from $174 per annum to a maximum of $2,138 per annum |
| • | Remote Area Disability Supplement – available to students with disability who incur additional costs associated with living away from home to attend school. Benefits are up to $9,478 per student, per annum. |
Tuition Fee Exemptions/Waivers – Dependants of International Students
Adult International students who meet the approved exemption criteria and wish to enrol their child in Preparatory (Prep) Year to Year 12 of schooling are exempt from paying tuition fees for their dependent children. The exemption only applies for the duration of the main temporary visa holder’s (parent) course of study in Queensland. A dependant student (Prep to Year 12) of a temporary visa holder may also be eligible for a tuition fee waiver in certain circumstances, including financial hardship.
215
Budget Strategy and Outlook 2024-25
The estimated average amount exempted or waived per student is $13,085 for the 2024–25 financial year.
Non-State Schools Transport Assistance Scheme
The Non-State Schools Transport Assistance Scheme directly assists families through the provision of funding towards the transport costs incurred for eligible students enrolled in non-state schools. Under the Scheme, payments are made twice a year to the families of students enrolled in non-state schools located beyond the Brisbane City Council area where bus and ferry fare expenses are above the annual Queensland Catholic Education Commission set weekly threshold amount.
In Semester 1 2024, the weekly threshold is $35 per family, or $25 for families with a current Health Care Card, Pensioner Concession Card or Veterans’ Affairs Card. From Semester 2 2024, the weekly threshold rates will be adjusted to $25 per family, or $15 for families with a current Health Care Card, Pensioner Concession Card or Veterans’ Affairs Card.
The program also assists families of eligible students with disability enrolled in non-state schools. The level of assistance provided is dependent on the type of transport needed and travel assistance already provided by the Department of Transport and Main Roads (DTMR). For families using taxi travel, the benefit level is to a maximum of $300 per week, inclusive of any assistance provided through DTMR’s Taxi Subsidy Scheme.
Dalby State High School – Bunya Campus Residential Facility
The Dalby State High School – Bunya Campus Residential Facility provides affordable residential accommodation for secondary school students in a boarding facility. The concession targets secondary school students from rural and remote communities; however, any secondary age student is eligible. Students accommodated at the residential facility are enrolled at Dalby State High School and participate in agricultural education programs.
Distance Education – Information and Communication Technology Subsidy Scheme
The Distance Education Information and Communication Technology Subsidy provides assistance to Queensland state school students enrolled in a School of Distance Education and who are geographically isolated or in the medical category.
State Schools of Distance Education administer funds to eligible students currently enrolled at a State School of Distance Education for a minimum of 6 months continuous enrolment.
The scheme has 2 components:
| • | Computer Hardware Subsidy – An annual payment of $400 to eligible students to assist with purchasing, replacing or upgrading computer hardware. Hardware subsidies are available to support students who are identified as belonging to geographically isolated or medical categories. |
| • | Broadband Internet Subsidy – An annual payment of $500 to eligible students to assist with provision of broadband internet access. Internet subsidies are available to support students who are identified as belonging to the geographically isolated category. |
216
Budget Strategy and Outlook 2024-25
Spinifex State College – Mount Isa Student Residential Facility
The Spinifex State College – Mount Isa Student Residential Facility provides an affordable residential facility in Mount Isa for students from the North Western area of the state whose home community does not provide secondary schooling. The funding meets the cost of wages for the residential college, increasing the affordability of the accommodation rates charged to students.
Western Cape College – Weipa Campus Student Residential College
The Western Cape College – Weipa Campus Student Residential College provides a residential schooling option for students from the Torres Strait and Cape York. This college provides an option that is more familiar for students from remote locations with the intent to increase participation and retention of secondary students in schooling. The concession targets students from the Torres Strait and Cape York seeking secondary education when their home community does not provide secondary schooling.
Distance Education – Non-Government Student Fee Subsidy
The Distance Education Non-Government Student Fee Subsidy is available to students who are enrolled in non-government schools and also choose to access distance education subjects. It provides an average annual subsidy of approximately $1,560 per distance education subject enrolment.
This subsidises approximately 50 per cent of the total average cost per annum of providing a subject through distance education for non-government school students. The concession contributes towards the state continuing to make distance education available to non-government schools ensuring the widest possible subject choice for students, while recovering a proportion of the teaching and overhead costs.
| Table A.2.4 | Department of Employment, Small Business and Training |
Concession | 2023–24 Est. Act. $ million | 2024–25 Estimate $ million | ||||||
User Choice - Apprentice and Trainee Training Subsidy1 | 266.6 | 262.0 | ||||||
Vocation Education and Training (VET) - Certificate 3 Guarantee Tuition Fee Subsidy1 | 233.1 | 251.5 | ||||||
VET - Higher Level Skills Tuition Fee Subsidy1 | 69.0 | 90.0 | ||||||
Travel and Accommodation Subsidy | 6.0 | 6.0 | ||||||
Free Tools for First Years Program1 | 0.5 | 3.5 | ||||||
Total | 575.2 | 613.0 | ||||||
Note:
| 1. | The variance is due to the demand-driven nature of the programs. |
User Choice – Apprentice and Trainee Training Subsidy
The User Choice — Apprentice and Trainee Training Subsidy program provides government funding towards the costs of training and assessment for eligible Queensland apprentices and trainees, or complementary pathways leading to apprenticeship outcomes.
The subsidy is available to pre-approved public and private registered training organisations to subsidise tuition fees to reduce the cost of nationally recognised entry level training for apprentices and trainees. The program provides greater flexibility for apprentices, trainees and their employers to select a preferred registered training organisation and to negotiate the type of training to meet their specific needs.
217
Budget Strategy and Outlook 2024-25
The value of this subsidy for each qualification ranges from $1,300 to $50,720, depending on student eligibility and qualification subsidised. The average subsidy value is $10,609.
Vocational Education and Training (VET) – Certificate 3 Guarantee Tuition Fee Subsidy
The Vocational Education and Training (VET) Certificate 3 Guarantee Tuition Fee Subsidy provides a government subsidy to allow eligible Queenslanders to obtain their first post-school Certificate III qualification to help them gain a job or to improve their employment status, including pathways for disadvantaged learners and Queensland school students (VET in Schools).
The subsidy is available to pre-approved private and public registered training organisations to subsidise tuition fees paid by students undertaking eligible VET qualifications (primarily Certificate III qualifications).
The value of this subsidy for each qualification ranges from $512 to $7,310, depending on student eligibility and qualification subsidised. The average subsidy value is $3,483.
VET – Higher Level Skills Tuition Fee Subsidy
The VET Higher Level Skills Tuition Fee Subsidy provides a government subsidy to eligible students and employers to undertake a priority Certificate IV, diploma or advanced diploma qualification or industry endorsed skill set. This program assists individuals to gain employment in a critical occupation, career advancement in a priority industry or transition to university to continue their studies.
The subsidy is available to pre-approved private and public registered training organisations to subsidise tuition fees paid by students undertaking eligible VET qualifications at Certificate IV or above.
The value of this subsidy for each qualification ranges from $696 to $11,390, depending on student eligibility and qualification subsidised. The average subsidy value is $4,116.
Travel and Accommodation Subsidy
The Travel and Accommodation Subsidy provides financial assistance to Queensland apprentices and trainees for travel expenses incurred in attending off the job training at a registered training organisation. To be eligible, apprentices must attend the closest registered training organisation that offers the required qualification and travel a minimum of 100km return from their usual place of residence to the registered training organisation. The subsidy provides for:
| • | return land travel to the registered training organisation of 26 cents per km for distances between 100km - 649km, increasing to 32 cents per km for distances of 650km or more |
| • | a return economy air ticket to the location of the registered training organisation for distances of 1,100km or more if necessary |
| • | cost of ferry travel if necessary |
| • | accommodation assistance of $55 per day for overnight stay within Queensland and $105 for interstate travellers, if it is necessary to live away from their usual place of residence to attend training. |
Free Tools for First Years Program
As part of the Construction Workforce Fund, the $4 million Free Tools for First Years program will assist first year Queensland apprentices in the housing industry including construction, plumbing and electrical.
218
Budget Strategy and Outlook 2024-25
A rebate of up to $1,000 is available for apprentices who commenced on or after 1 January 2024 to purchase industry-relevant tools. Apprentices are only eligible once they have completed their mandatory 3-month probational period. Applications may be made until the funding has been exhausted.
| Table A.2.5 | Department of Energy and Climate |
Concession | 2023–24 Est. Act. $ million | 2024–25 Estimate $ million | ||||||
Uniform Tariff Policy - Energy Queensland (Excluding Isolated Systems) | 501.9 | 505.6 | ||||||
Uniform Tariff Policy - Energy Queensland (Isolated Systems) | 90.4 | 93.9 | ||||||
Queensland Business Energy Saving and Transformation Rebates Program1 | 6.0 | 10.0 | ||||||
Electricity Tariff Adjustment Scheme2 | 6.2 | 5.9 | ||||||
Uniform Tariff Policy - Origin Energy | 3.8 | 4.0 | ||||||
Climate Smart Energy Savers Program3 | 41.5 | 2.5 | ||||||
Battery Booster Program4 | 14.4 | 1.6 | ||||||
Drought Relief from Electricity Charge Scheme5 | 5.0 | — | ||||||
Total | 669.2 | 623.5 | ||||||
Notes:
| 1. | The Queensland Business Energy Saving and Transformation Rebates Scheme opened on 5 October 2023 and has been delivered throughout 2023–24. Funding allocated to 2024–25 covers ongoing QBEST support for businesses. |
| 2. | Reductions are in line with program expectations as more participants move out of the scheme over time. |
| 3. | The Program opened on 4 September 2023 and was closed on 4 December 2023, with funding in 2024–25 to cover remaining program costs. |
| 4. | The Program has been delivered throughout 2023–24, with funding in 2024–25 to cover remaining program costs. The program closed to new conditional approval applications on 8 May 2024. |
| 5. | Future drought assistance arrangements will be considered by the government in response to the Burke Review and the Australian Government’s Future Drought Fund Investment Strategy (2024 to 2028) expected to be released in mid-2024. |
Uniform Tariff Policy – Energy Queensland (Excluding Isolated Systems)
The Uniform Tariff Policy ensures that, where possible, all Queensland non-market electricity customers of a similar type pay a similar price for electricity regardless of where they are located. As the notified prices do not reflect the full cost of electricity supply for most regional and remote Queenslanders, a subsidy is provided through a community service obligation (CSO) payment.
The CSO payment is provided to the regional retailer, Ergon Energy, through Energy Queensland, and covers the difference between the revenue earned by charging customers notified prices and the actual costs in the regional areas (due to differences in network costs and energy losses).
Uniform Tariff Policy – Energy Queensland (Isolated Systems)
The Uniform Tariff Policy ensures that, where possible, all Queensland non-market electricity customers of a similar type pay a similar price for electricity regardless of where they are located. As the notified prices do not reflect the full cost of electricity supply for most regional and remote Queenslanders, a subsidy is provided through a CSO payment.
Energy Queensland, through the regional retailer Ergon Energy, owns and operates 33 isolated power systems which supply electricity in remote and isolated communities, and provides retail
219
Budget Strategy and Outlook 2024-25
electricity services to customers in those communities at notified electricity prices. This CSO payment is provided to Ergon Energy, through Energy Queensland, and covers the difference between the revenue earned by charging customers notified prices and the actual cost of operating the isolated power systems.
Queensland Business Energy Saving and Transformation Rebates Program
The $35 million Queensland Business Energy Saving and Transformation (QBEST) program, part of the Queensland Energy and Jobs Plan, will support businesses to purchase energy-efficient appliances and equipment, smart technology and energy management systems to reduce their energy costs.
The $16 million Queensland Business Energy Saving and Transformation Rebates scheme provides rebates to eligible small and medium-sized Queensland businesses to install energy-efficient equipment.
Rebates of up to $12,500 are available for eligible businesses which purchase (and install if required) eligible energy-efficient equipment.
Electricity Tariff Adjustment Scheme
The Electricity Tariff Adjustment Scheme provides targeted support to regional businesses materially impacted by the phase-out of obsolete electricity tariffs from 30 June 2021. This initiative provides eligible customers with individually tailored transitional rebates to help offset the removal of obsolete tariffs and incentivise a pathway to self-sufficiency over time. Eligible businesses will receive a subsidy payment for up to 9 years.
Uniform Tariff Policy – Origin Energy
Origin Energy retails electricity to approximately 4,700 Queensland non-market customers in the Goondiwindi, Texas and Inglewood areas who are supplied electricity through the New South Wales Essential Energy distribution network. The government provides a subsidy to these customers, via a CSO payment to Origin Energy, to ensure they pay a similar price for electricity as other Queenslanders. Therefore, the CSO amount depends on the relative difference between Queensland and New South Wales retail electricity tariffs for non-market customers.
The Uniform Tariff Policy ensures that, where possible, all Queensland non-market electricity customers of a similar type pay a similar price for electricity regardless of where they are located. As the notified prices do not reflect the full cost of electricity supply for most regional and remote Queenslanders, a subsidy is provided through a CSO payment.
Climate Smart Energy Savers Program
The Climate Smart Energy Savers rebate program supports eligible Queenslanders to replace old appliances with 4 star-rated (or higher) energy-efficient appliances and hot water systems.
This initiative is part of the Queensland Energy and Jobs Plan, helping Queenslanders manage their energy use and bills, and reduce their carbon emissions.
Battery Booster Program
The $16 million Battery Booster Rebate Scheme is an initiative under the Queensland Energy and Jobs Plan. The Scheme aims to encourage Queensland homeowners to install approved battery systems and manage their energy consumption by offering rebates to offset the costs associated with investing in a battery energy storage system.
220
Budget Strategy and Outlook 2024-25
A standard rebate of up to $3,000 is available to eligible applicants to offset the cost of having an approved battery system suitably installed at their residential premises.
For households where the income earner earned $66,667 or less for the most recently ended financial year, a low-income rebate of up to $4,000 is available.
The program closed to new conditional approval applications on 8 May 2024.
Drought Relief from Electricity Charge Scheme
Drought Relief from Electricity Charges Scheme provides farmers and irrigators with relief from fixed charges for electricity accounts that are used to pump water for farm or irrigation purposes during periods of drought. The concessions can vary depending on the shires that are drought declared and the number of eligible customers.
Future drought assistance arrangements will be considered by the government in response to the Burke Review and the Australian Government’s Future Drought Fund Investment Strategy (2024 to 2028) expected to be released in mid-2024.
| Table A.2.6 | Department of Environment, Science and Innovation |
Concession | 2023–24 Est. Act. $ million | 2024–25 Estimate $ million | ||||||
Queensland Parks and Wildlife Service - Tour Fee and Access Permits1 | 2.1 | 2.1 | ||||||
Total | 2.1 | 2.1 | ||||||
Note:
| 1. | Value of concessions is not expected to materially change in 2024–25 due to freeze of indexation on fees and charges. |
Queensland Parks and Wildlife Service – Tour Fee and Access Permits
A range of concessions are available through the Department of Environment, Science and Innovation.
Visitor admission and ranger guided tour fees concessions of 10 to 100 per cent are available at several attractions and visitor centres for eligible persons including infants, children, pensioners, concession card holders and groups undertaking educational purposes.
Vehicle access permit concessions of up to 100 per cent are available in the Cooloola Recreation Area, Bribie, Moreton (Mulgumpin) and K’gari Islands for approved applicants including First Nations peoples and local residents required to traverse the protected area estate.
Camping concessions of 45 to 100 per cent are available in all national park and state forest camping areas for educational purposes and children under 5 years of age.
221
Budget Strategy and Outlook 2024-25
| Table A.2.7 | Department of Housing, Local Government, Planning and Public Works |
Concession | 2023–24 Est. Act. $ million | 2024–25 Estimate $ million | ||||||
Government Managed Housing Rental Rebate1 | 777.2 | 807.2 | ||||||
Home Assist Secure2 | 27.3 | 25.9 | ||||||
Helping Seniors Secure Their Homes3 | 45.2 | 22.3 | ||||||
Non-residential Buildings - Subsidised Rents | 8.2 | 8.2 | ||||||
National Rental Affordability Scheme4 | 12.8 | 6.2 | ||||||
Youth Subsidy - Community Housing5 | 4.4 | 4.5 | ||||||
Rental Bond Loans | 2.6 | 4.0 | ||||||
Growth Acceleration Fund - Concessional Loan Scheme6 | — | 0.7 | ||||||
Non-Government Managed Housing7 | — | — | ||||||
Total | 877.7 | 879.0 | ||||||
Notes:
| 1. | The variance is due to an increase in private market rents based on prevailing conditions. |
| 2. | The variance is based on the anticipated year on year demand for services provided under this scheme. |
| 3. | The variance is based on the current and anticipated demand for services under the trial which is scheduled to close in December 2024. The extension of the trial delivers on the Queensland Government’s Community Safety Plan. |
| 4. | The variance is primarily due to a decrease in the number of incentives paid as the scheme winds down. The cessation of the scheme was a decision of the Australian Government. |
| 5. | This concession was introduced during the 2023–24 financial year as a new initiative under the Homes for Queenslanders plan. |
| 6. | New item for 2024–25. |
| 7. | The value of this concession arrangement cannot be easily quantified. |
Government Managed Housing Rental Rebate
The Government Managed Housing Rental Rebate targets low-income families and individuals and represents the difference between the estimated rents that would be payable in the private market and rent that is charged by the government based on household income.
Assistance is provided to approximately 55,700 households. The estimated average yearly subsidy per household for 2024–25 is $14,486.
Home Assist Secure
Home Assist Secure provides free safety related information, referral and subsidised assistance for eligible clients unable to undertake or pay for critical maintenance services without assistance. To be considered for subsidised assistance, people with a disability or 60 years or over must hold a Pensioner Concession Card and be unable to complete the work themselves. In addition, they must be unable to access assistance from other services.
Labour costs (up to $500 per household per year) for the assistance provided are subsidised by Home Assist Secure while the balance of the costs (including the materials) are met by the client. Clients can also get a one-off subsidy of $80 for the cost of materials for security related work (Security Hardware Subsidy).
Home Assist Secure targets homeowners and those in rental housing who are 60 years of age or older or have disability, and who require assistance to remain living in their home. In 2024–25, it is estimated that up to 40,000 households will be assisted.
222
Budget Strategy and Outlook 2024-25
Helping Seniors Secure Their Homes
Helping Seniors Secure Their Homes trial provides assistance to eligible homeowners aged 60 years and over who are Pensioner Concession Card holders to subsidise the cost to improve the safety and security features of their homes, allowing them to remain safe and secure in their homes. The program provides financial assistance of up to $10,000 per household to allow them to implement a range of security measures to increase home security, including door and window locks, security screening on doors and windows, security lighting and sensor lights, alarm systems and CCTV cameras.
The trial commenced from April 2023 in Cairns, Townsville and Mount Isa Local Government Areas (LGAs) and in July 2023 was expanded to include Mareeba, Atherton and Toowoomba LGAs. The trial has been extended to December 2024.
Non-residential Buildings – Subsidised Rents
Accommodation is provided to 40 community, education, arts and not-for-profit organisations in government-owned non-residential buildings. Tenures for the occupancies are by way of leases, licences or month-to-month arrangements. Rents paid by the organisations are often below independently assessed market rent levels. Subsidised rental arrangements are provided to 26 properties comprising a total floor area of approximately 41,800 square meters. The total subsidy is calculated by deducting the actual amount paid by the occupants from the total estimated annual market rent for office space.
National Rental Affordability Scheme
The National Rental Affordability Scheme (NRAS) is an Australian Government initiative, delivered in partnership with the Queensland Government, to increase the supply of new affordable rental housing. The scheme provides financial incentives to investors to build well located dwellings and rent them to eligible low to moderate income households, at a discounted rate at least 20 per cent below market rent.
Under the scheme, the concession to the tenant is provided by the property owner. Due to the nature of the arrangement, the overall value of the concession to the tenant cannot be quantified. In 2024–25, the government has allocated $6.2 million for the payment of financial incentives to NRAS investors who are then required to discount rents to tenants.
Youth Subsidy – Community Housing
Homes for Queenslanders, a $3.1 billion investment into the housing system over five years, includes a $23.2 million funding boost over five years for Registered Community Housing Providers (RCHPs) to help house more young people through a Youth Subsidy. Young people can face additional barriers when it comes to finding safe and affordable housing, including lower incomes, often while balancing study and work commitments, completing training and establishing their careers.
The subsidy will assist young people to access community housing by making it financially possible for RCHPs to house more young people. The department will provide RCHPs with a weekly subsidy for each eligible household where a young person is the primary tenant. In 2024–25, the government has allocated $4.5 million for purposes of housing an estimated 1,300 young people under this program.
223
Budget Strategy and Outlook 2024-25
Rental Bond Loans
The government provides interest-free rental bond loans to people who cannot afford to pay a full bond to move into private rental accommodation, thereby reducing the need for more costly, subsidised housing assistance, through 2 products:
| • | Bond Loans: equivalent to a maximum amount of 4 weeks rent |
| • | Bond Loan Plus: equivalent to a maximum amount of 6 weeks rent. |
The interest-free bond loan targets low-income households and can stabilise tenancies, preventing households from entering the cycle of homelessness and engaging with fringe, high interest credit providers. The concession represents the interest saving for the client on the bond loan. In 2024–25, $21.4 million in bond loans and bond loan plus may be advanced to an estimated 13,000 clients, averaging over $1,600 support per client.
Growth Acceleration Fund – Concessional Loan Scheme
The Growth Acceleration Fund (GAF) is a $35 million fund offering low-interest loans to accelerate the delivery of essential infrastructure such as roads, water supply, wastewater and stormwater, required to unlock land for housing in South East Queensland (SEQ) high-growth areas. GAF was announced as part of the 2022–23 State Budget in response to the land and housing supply challenges faced in growth areas across SEQ.
The concession represents the interest saving for the client on the low-interest loan. In 2024–25, approximately $23.3 million in low-interest loans will be provided to unlock essential infrastructure, providing over $670,000 in estimated interest savings to recipients.
Non-Government Managed Housing
The government provides contributions to social housing providers, including capital grants, granted land or properties, or recurrent funding, to assist in increasing housing affordability and access to social housing.
Due to the nature of the arrangement, particularly varying rents charged by providers based on individual circumstances of each household, the overall value of the concession provided by the government cannot be easily quantified.
Rents charged for social housing managed by the providers are based on 25 per cent of a household’s assessable income, 30 per cent of a household’s gross income, or the market rent, whichever is lower, which substantially reduces accommodation costs for eligible individuals and families. Many of these families may also be eligible for Commonwealth Rent Assistance to assist in the cost of their accommodation. Assistance is expected to be provided to approximately 16,500 households to access non-government managed housing in 2024–25.
224
Budget Strategy and Outlook 2024-25
| Table A.2.8 | Department of Justice and Attorney-General |
Concession | 2023–24 Est. Act. $ million | 2024–25 Estimate $ million | ||||||
Public Trustee of Queensland - Concessions | 44.7 | 45.3 | ||||||
Queensland Civil and Administrative Tribunal1 | 29.3 | 41.4 | ||||||
Court Services - Civil Court2 | 33.5 | 35.4 | ||||||
Blue Card - Volunteer Applicants | 11.6 | 11.7 | ||||||
Body Corporate and Community Management - Dispute Resolution3 | 4.9 | 4.6 | ||||||
Liquor Gaming and Fair Trading - Rural Hotel Concessions | 0.4 | 0.4 | ||||||
Registry of Births, Deaths and Marriages - Fee Waivers | 0.1 | 0.1 | ||||||
Total | 124.5 | 138.9 | ||||||
Notes:
| 1. | The variance is due to additional funding provided in the 2024–25 Queensland Budget. |
| 2. | The variance is due to indexation and increased court expenditure costs. |
| 3. | The variance is due to end of project funding which was linked with legislative changes to Building Units and Group Titles Act 1980. |
Public Trustee of Queensland – Concessions
The Public Trustee of Queensland (The Public Trustee) uses a scale of fees which is designed to reflect a fair cost for the services provided.
The Public Trustee has established a safety net limit on the annual fees payable by certain customers which provides for a rebate of fees for some customers with limited assets. The rebate is applied to customers such as financial administration customers with impaired capacity, or estate administration customers of limited means. The Public Trustee also provides Will making services at no cost for all Queenslanders.
Queensland Civil and Administrative Tribunal
The Queensland Civil and Administrative Tribunal (QCAT) is an independent tribunal which makes decisions and resolves disputes across a wide range of jurisdictions for the community. Fees for these services are set below cost recovery to ensure services are accessible, fair and inexpensive. QCAT provides human rights services with no application fees for matters related to guardianship and administration of adults, children and young people and anti-discrimination.
Court Services – Civil Court
The Supreme, District and Magistrates Courts hear civil disputes between 2 or more parties (people or organisations) where one party sues the other, usually to obtain compensation, or seek some other remedy. These disputes may involve anything from defamation to outstanding debts. Civil Court Fees are prescribed under the Uniform Civil Procedure (Fees) Regulation 2019 for proceedings commenced in civil matters and are set below full cost recovery to ensure that civil remedies are accessible to all Queenslanders.
Blue Card – Volunteer Applicants
Individuals providing child-related services or conducting child-related activities in regulated service environments are required to undergo an assessment of their police record and relevant
225
Budget Strategy and Outlook 2024-25
disciplinary information, and if approved, are issued with a blue card. A blue card is valid for 3 years unless cancelled or suspended earlier.
The Queensland Government has met the cost of blue card assessment for volunteer applicants since the inception of the blue card system in 2001. This is to ensure children can continue to receive services and participate in activities which are essential to their development and well-being, in a safe and supportive environment.
Body Corporate and Community Management – Dispute Resolution
The Office of the Commissioner for Body Corporate and Community Management provides a dispute resolution service to parties unable to resolve disputes themselves. The service consists of conciliation, with the aim of achieving a voluntary agreement, and adjudication, which results in a formal order. The service is delivered below full cost recovery so as to not restrict access to justice due to affordability reasons. The commissioner has the discretion to waive application fees on the grounds of financial hardship.
Liquor Gaming and Fair Trading – Rural Hotel Concessions
The Office of Liquor and Gaming Regulation licenses hotels and clubs under the Liquor Act 1992. Under the Liquor (Rural Hotels Concession) Amendment Act 2019, the Rural Hotels Concession provides licence fee relief to establishments in remote communities by reducing the base licence fees for hotels and community clubs with no more than 2,000 members, for eligible licences since July 2019. .
Registry of Births, Deaths and Marriages – Fee Waivers
The Registry of Births, Deaths and Marriages waives the fees for certificates provided to disadvantaged groups in the Queensland Community (e.g. Aboriginal peoples, Torres Strait Islander peoples, people who are homeless, domestic and family violence victims, etc) and those impacted by major emergencies (e.g. natural disasters such as cyclones and bushfires). The majority of concession waivers relate to the provision of birth certificates ($54.40 per certificate in 2023–24) and approximately 2,000 individuals in Queensland have received a benefit.
| Table A.2.9 | Department of Regional Development, Manufacturing and Water |
Concession | 2023–24 Est. Act. $ million | 2024–25 Estimate $ million | ||||||
Sunwater Rural Irrigation Water Price Subsidy | 19.0 | 18.9 | ||||||
Cloncurry Pipeline Water Supply Subsidy | 7.0 | 7.0 | ||||||
Seqwater Rural Irrigation Water Price Subsidy | 2.4 | 2.3 | ||||||
Disaster Relief Arrangements - Annual Water Licence Fee Waiver | 0.5 | 0.7 | ||||||
Horticulture Rural Irrigation Water Price Rebate Scheme administered by the Queensland Rural and Industry Development Authority | 4.0 | — | ||||||
Drought Relief Arrangements - Water Licence Fee Waiver1 | 0.4 | — | ||||||
Total | 33.3 | 28.9 | ||||||
Note:
| 1. | Future drought assistance arrangements will be considered by the government in response to the Burke Review and the Australian Government’s Future Drought Fund Investment Strategy (2024 to 2028) expected to be released in mid-2024. |
226
Budget Strategy and Outlook 2024-25
Sunwater Rural Irrigation Water Price Subsidy
Sunwater’s irrigation water prices for some schemes are set below the level necessary to recover the cost of supplying water to the irrigators.
Government funding is provided to Sunwater to offset the reduced revenue and to ensure that irrigation prices gradually transition towards cost recovery.
Funding is also provided to continue a 15 per cent discount on Sunwater irrigation prices for a 4-year period ending 2024–25.
Cloncurry Pipeline Water Supply Subsidy
North West Queensland Water Pipeline Limited (NWQWP), a Sunwater Limited (Sunwater) subsidiary, owns and operates the Cloncurry Pipeline between the Ernest Henry Mine and Cloncurry. The pipeline guarantees Cloncurry Shire Council’s water supply and supports industrial development in the region. The government provides funding to NWQWP to ensure the pipeline remains commercially viable to operate while providing an affordable and safe water supply to Cloncurry.
Seqwater Rural Irrigation Water Price Subsidy
Seqwater’s irrigation water prices for some schemes are set below the level necessary to recover the cost of supplying water to the irrigators.
Government funding is provided to Seqwater to offset the reduced revenue and to ensure that irrigation prices gradually transition towards cost recovery.
Funding is also provided to continue a 15 per cent discount on Seqwater irrigation prices for a 4-year period ending 2024–25.
Disaster Relief Arrangements – Annual Water License Fee Waiver
Fees associated with annual water licences ($92.01) will be waived for 2024–25 for disaster declared areas. The waiver is available to landholders in Local Government Areas where Category B of the Disaster Recovery Funding Arrangements for Disaster Assistance (Primary Producer) Loans or Disaster Assistance (Essential Working Capital) Loans Scheme for Small Business is activated. In 2024–25, it is estimated 7,500 waivers will be issued to landholders.
Horticulture Rural Irrigation Water Price Rebate Scheme administered by the Queensland Rural and Industry Development Authority
Payments to the Queensland Rural and Industry Development Authority to deliver an additional 35 per cent rebate on Sunwater and Seqwater irrigation water prices related to horticulture production for a 3-year period ending 2023–24, bringing the total irrigation discount provided to 50 per cent for approved applicants.
Drought Relief Arrangements – Water Licence Fee Waiver
The Drought Relief Assistance Scheme provides relief from annual water licences and applications for stock or domestic water licences for primary producers in either a drought declared area or an individually droughted property (IDP).
Future drought assistance arrangements will be considered by the government in response to the Burke Review and the Australian Government’s Future Drought Fund Investment Strategy (2024 to 2028) expected to be released in mid-2024.
227
Budget Strategy and Outlook 2024-25
| Table A.2.10 | Department of Resources |
Concession | 2023–24 Est. Act. $ million | 2024–25 Estimate $ million | ||||||
Exploration permit for minerals | 10.0 | 11.0 | ||||||
Land Rental Rebates | 0.5 | — | ||||||
Total | 10.5 | 11.0 | ||||||
Exploration permit for minerals
An initiative of the Queensland Critical Minerals Strategy reduced rent to $0 for 5 years from 1 September 2023 for new and existing exploration permits for minerals other than coal. This initiative also partially implements an action of the Queensland Resources Industry Development Plan, which commits to a review of fees and charges paid by the resources sector.
Land Rental Rebates
Land rent rebates are available to Grazing and Primary Production lessees, other than those on minimum rent, located in a drought declared local government area and to individually drought declared properties.
Future drought assistance arrangements will be considered by the government in response to the Burke Review and the Australian Government’s Future Drought Fund Investment Strategy (2024 to 2028) expected to be released in mid-2024.
| Table A.2.11 | Department of State Development and Infrastructure |
Concession | 2023–24 Est. Act. $ million | 2024–25 Estimate $ million | ||||||
South Bank Corporation - Concessional Event Hire1 | 0.7 | 0.5 | ||||||
Total | 0.7 | 0.5 | ||||||
Notes:
| 1. | On 1 August 2023, all land tenure for the Parklands was returned to the South Bank Corporation (SBC). This included responsibility for all event management and activations. The 2023–24 Budget therefore did not include this item as SBC were not responsible for events at that time. SBC has therefore reported actual concessions in 2023–24 versus a nil budget for the same period. |
South Bank Corporation – Concessional event hire
Concessional event hire is offered for special events held in the South Bank Parklands by not-for-profit entities. The level of concession varies depending on the number and size of events being held each year.
| Table A.2.12 | Department of Tourism and Sport |
Concession | 2023–24 Est. Act. $ million | 2024–25 Estimate $ million | ||||||
Sport and Recreation venues - Concessional Usage Rates & Gym Fees | 2.4 | 2.7 | ||||||
Total | 2.4 | 2.7 | ||||||
Sport and Recreation venues – Concessional Usage Rates & Gym Fees
Concessional usage rates are offered to clients who meet the strategic objectives of the Activate! Queensland strategy, including not-for-profit sport and recreation organisations, Queensland
228
Budget Strategy and Outlook 2024-25
schools and Queensland state sporting organisations, for the use of Sport and Recreation owned and operated venues, including Queensland Recreation Precincts at Currimundi and Tallebudgera.
The estimated increase is due to higher venue usage following completion of recent capital improvements.
| Table A.2.13 | Department of Transport and Main Roads |
Concession | 2023–24 Est. Act. $ million | 2024–25 Estimate $ million | ||||||
General Public Transport Concessions (South East Queensland)1 | 1,920.6 | 2,440.5 | ||||||
Rail Network and Infrastructure Funding2 | 837.1 | 946.3 | ||||||
Vehicle and Boat Registration Concessions3 | 209.3 | 619.2 | ||||||
General Public Transport Concessions (Regional Queensland) | 331.9 | 347.0 | ||||||
School Transport Assistance Scheme | 163.7 | 167.0 | ||||||
TransLink Transport Concessions (South East Queensland)4 | 85.8 | 60.4 | ||||||
Livestock and Regional Freight Contracts5 | 43.2 | 41.5 | ||||||
Rail Concession Scheme | 27.8 | 27.8 | ||||||
Other Transport Concessions (Regional Queensland) and Taxi Subsidies4 | 23.5 | 25.1 | ||||||
Zero Emission Vehicle Rebate Scheme6 | 26.3 | 7.5 | ||||||
Practical Driving Test7 | 6.0 | 6.6 | ||||||
Designated Public Transport Concessions for Seniors Card Holders | 4.4 | 4.5 | ||||||
Total | 3,679.6 | 4,693.4 | ||||||
Notes:
| 1. | The increase is due to a cost-of-living measure that will result in a significant decrease in fare revenue whilst operating costs remain unchanged, increasing the value of travel subsidised by the government. There is also significant investment in the South East Queensland rail network to make it reliable both in the near term and in the future when the expanded network is live. The increase also continues to improve service availability whilst maintaining affordability for all modes. |
| 2. | The increase is due to operating costs associated with an increased investment in rail infrastructure and other general cost increases. |
| 3. | The increase is due to reducing the registration fee and traffic improvement fee components of motor vehicle registration for all light vehicles by 20 per cent for 12 months from 16 September 2024, but the reduction is scheduled to start appearing on renewal notices sent to customers from 5 August 2024. |
| 4. | The decrease is driven by the cost-of-living measure resulting in lower fares from which concessions are calculated (concession rates are not impacted). |
| 5. | The decrease is due to the reduction in Remote Community Freight Contact funding due to one-off funding requirements in 2023–24 for terminal development. |
| 6. | New concession for 2024–25. The decrease is due to the expected wrap up of this scheme with the final payment to the Queensland Rural and Industry Development Authority occurring in 2024–25. |
| 7. | The increase is due to increased test volumes and a freeze in the test fee to support cost of living. |
General Public Transport Concessions (South East Queensland)
The General Public Transport Concessions (South East Queensland) represents the direct funding contribution that the government makes towards the cost of operating public transport services within South East Queensland. This contribution effectively reduces the ticket price paid by all public transport users on bus, rail and ferry services, increasing the affordability of these services.
229
Budget Strategy and Outlook 2024-25
In addition, the Queensland Government is implementing a temporary fare reduction across the SEQ public transport network for 6 months commencing 5 August 2024 with a flat fare of 50 cents per trip to assist with cost-of-living pressures. In addition to this initiative, the government is also providing half-price tickets on Airtrain services.
Rail Network and Infrastructure Funding
Rail network and infrastructure funding ensures that the state-supported rail network is safe, reliable and fit for purpose. The contract also provides funding to Queensland Rail to support major capital projects and related asset strategies. The funding provided via this contract directly benefits customers of the state-supported rail network, including both freight and passengers. Without this funding, rail access charges (including public transport fares) would be significantly higher for all users of the rail network.
Rail network and infrastructure funding ensures that the state-supported rail network is safe, reliable and fit for purpose. The contract also provides funding to Queensland Rail to support major capital projects and related asset strategies. The funding provided via this contract directly benefits customers of the state-supported rail network, including both freight and passengers. Without this funding, rail access charges (including public transport fares) would be significantly higher for all users of the rail network.
Vehicle and Boat Registration Concessions
Vehicle registration concessions for light and heavy motor vehicles and recreational boats are provided to a wide variety of individuals and organisations, including holders of the Pensioner Concession Card, Queensland Seniors Card and to those assessed by the Department of Veterans’ Affairs as meeting the necessary degree of incapacity or impairment, primary producers and charitable organisations. As at 31 March 2024, the Queensland Government is providing vehicle registration concessions on approximately 703,816 vehicles.
Person based concessions, such as those aimed at improving access to travel for pensioners, seniors and persons with a disability, provide a reduced rate of registration fees. For most eligible card holders, a concession for a 4-cylinder vehicle would reduce the 12-month registration fee, excluding the Traffic Improvement Fee (TIF), by 50 per cent from $360.60 to $180.30. For a recreational boat up to and including 4.5 metres in length, the concession reduces the registration fee by 50 per cent from $97.35 to $48.70. As at 31 March 2024, these concessions apply to approximately 585,907 vehicles and 34,799 vessels.
A Special Interest Vehicle (SIV) registration concession is offered for motor vehicles that have low use associated with vintage and historic and street rod car club events. A SIV concession would reduce the 12-month registration fee for a 6-cylinder SIV over 80 per cent from 1 October 2024 from $456.75 to $81.25. As at 31 March 2024, this concession applies to approximately 43,350 vehicles.
A registration concession is also available for prescribed heavy vehicles that are solely used for the purpose of carrying on the business of a primary producer. A primary production business consists mainly of the production of raw materials for clothing or food (derived from agriculture, dairying, fishing, raising of livestock or viticulture), where transportation is incidental to the main activity. Eligible primary producers receive registration concessions for prescribed heavy vehicles, reducing their registration fees by 50 to 75 per cent. For example, a primary producer’s 12-month registration fee for a 2-axle truck with a Gross Vehicle Mass over 12 tonne reduces from $1,218.55 to $650.55. This is a 47 per cent reduction in the registration fee. As at 31 March 2024, this concession applies to approximately 30,349 heavy vehicles.
230
Budget Strategy and Outlook 2024-25
Other motor vehicle registration concessions are also provided to local governments, charitable and community service organisations, and people living in remote areas. Vessel registration concessions may be provided to accredited surf lifesaving clubs and schools.
Registration Fees Reduction
In addition to the general vehicle and boat registration concessions, the Queensland Government will be reducing light vehicle registration fees by 20 per cent for registration terms commencing from 16 September 2024, and is schedule to start being reflected on renewal notices issued to customers from 5 August. This measure will provide cost-of-living relief to Queensland vehicle owners across the state and will be applied for 12 months at an estimated cost of $435 million. The reduction will see a 12-month registration bill for a private use 4-cylinder vehicle reduce by almost $85, bringing registration fees down to $338.75, including the TIF and excluding CTP. For vehicles registered on a pensioner concession, the reduction will be nearly $50 and will reduce registration fees down to $194.50, including the TIF and excluding CTP.
The reduction will apply to the registration fee and the traffic improvement fee for all light vehicles, regardless of purpose of use and will include motorcycles and trailers. The reduction will benefit owners of around 5.7 million vehicles across the state and builds on the previously announced freeze on registration fee increases, which will be implemented from 1 July 2024.
General Public Transport Concessions (Regional Queensland)
The General Public Transport Concessions (Regional Queensland) represents the financial contribution that government provides across a range of transport services in regional Queensland. The impact of this contribution benefits all public transport users through reduced transport fares. This concession covers:
| • | subsidies for regional bus and ferry operators (excluding concessional top up amounts and School Transport Assistance Scheme related amounts) |
| • | subsidies for air services to remote and rural communities within the state |
| • | subsidies for Kuranda Scenic Railway |
| • | TravelTrain (excluding the ‘Rail Concession Scheme’ for eligible pensioners, veterans and seniors) |
| • | subsidies for long distance coach services to rural and remote communities within the state |
| • | subsidies for Heritage Rail Services |
| • | subsidies for the Rail XPT Service (Sydney-Brisbane) and Savannahlander (Atherton Tableland). |
The Queensland Government is implementing a temporary fare reduction on contracted regional bus services for 6 months commencing 5 August 2024 with a flat fare of 50 cents per trip to assist with cost-of-living pressures.
School Transport Assistance Scheme
The School Transport Assistance Scheme (STAS) assists students that do not have a school in their local area or who are from defined low income groups with travel costs. The scheme provides funding to reduce the cost of travelling to school on bus, rail and/or ferry services, with allowances for private vehicle transport in certain circumstances. A typical concession would be to fully fund the cost of travel from home to the nearest state primary or high school where no local primary or high school is available (e.g. from Bargara to Bundaberg High School). In 2024–25, approximately 122,000 students will be STAS eligible.
231
Budget Strategy and Outlook 2024-25
TransLink Transport Concessions (South East Queensland)
The TransLink Transport Concessions (South East Queensland) are provided by the government to ensure access and mobility for Queenslanders who require assistance because of age, disability, or fixed low income. Passengers entitled to receive public transport concessions include holders of a Pensioner Concession Card, Veterans’ Affairs Gold Card, Seniors Card, Companion Card, Vision Impairment Travel Pass, Total Permanent Incapacitated (TPI) Veteran Travel Pass, children, secondary and tertiary students, JobSeeker and Youth Allowance recipients, asylum seekers and White Card holders. Under current fare arrangements, approved concession groups receive at least a 50 per cent discount when compared to the same applicable adult fare.
Livestock and Regional Freight Contracts
The Livestock and Regional Freight Contracts provide funding to support the movement of cattle (via rail only) and freight (via road and rail) to and from regional areas of Queensland. The funding provided directly benefits the cattle industry and enables regional Queensland communities to maintain employment and directly benefits those communities who are reliant on rail freight services by reducing the cost of these freight services for users.
Rail Concession Scheme
The Queensland Rail Concession Scheme improves the affordability of long distance and urban rail services for eligible pensioners, veterans, seniors and current/past rail employees with 25 years of service. Assistance for long distance rail services is provided through discounted fares and free travel vouchers. For TravelTrain (long distance rail) services, depending on the service, the concession may be for free travel for up to 4 trips per year for Queensland pensioners (subject to availability of seats and payment of an administration fee).
Other Transport Concessions (Regional Queensland) and Taxi Subsidies
Other transport concessions (Regional Queensland) and taxi subsidies are provided by the government to ensure access and mobility for Queenslanders who require assistance because of age, disability or fixed low income. Passengers entitled to receive public transport concessions include holders of a Pensioner Concession Card, Veterans’ Affairs Gold Card, Seniors Card, Companion Card, Vision Impairment Travel Pass, TPI Veteran Travel Pass, children, secondary and tertiary students, JobSeeker and Youth Allowance recipients, asylum seekers and White Card holders. The Taxi Subsidy Scheme aims to improve the mobility of persons with severe disabilities by providing a 50 per cent concession fare up to a maximum subsidy of $30 per trip.
Zero Emission Vehicle Rebate Scheme
As part of Queensland’s Zero Emission Vehicle Strategy 2022–2032, the Queensland Government’s Zero Emission Vehicle (ZEV) rebate is intended to reduce the upfront costs of purchasing a new, full battery, light passenger, or light commercial ZEV. The upfront purchase price of ZEVs has been a significant barrier to many Queenslanders who wish to transition to or purchase a ZEV as their next vehicle.
The rebate aims to encourage both individuals and businesses to purchase ZEVs instead of internal combustion engine vehicles, making entry level ZEVs more affordable. Over time, ZEVs are becoming more accessible at lower prices due to a wider range of ZEV models available in Australia, competition between carmakers and surplus inventory. These factors are contributing to
232
Budget Strategy and Outlook 2024-25
the gradual decline in ZEV prices, with the rebate scheme likely to be exhausted around August-September 2024.
Rebates are available for eligible vehicles under $68,000 which effectively targets the lower end of the ZEV market, to assist more middle to lower income Queenslanders to access ZEVs. A rebate of $6,000 is available for eligible households earning up to a total taxable household income of $180,000 per year, and a $3,000 rebate is available for households earning more than a total taxable household income of $180,000 per year. A $3,000 rebate is also available to Queensland businesses.
As at 3 June 2024, there were a total of 8,042 recipients of the rebate, of which 3,502 Queenslanders received the $6,000 rebate. This scheme is administered by the Queensland Rural and Industry Development Authority.
Practical Driving Test
As part of the state’s driver licensing arrangements, applicants for new licences are required to undertake a practical driving test. The total cost to pre-book driver examinations and to perform the practical driver assessment is not fully recovered by the fee charged ($64.95 (including GST) current at 1 July 2024), providing a direct concession to applicants.
Designated Public Transport Concessions for Seniors Card Holders
Designated Public Transport Concessions for Interstate Seniors Card Holders allows visitors from interstate, who hold a state or territory Seniors Card, to access public transport concessions within Queensland and is fully funded by the Queensland Government. Under current fare arrangements, this enables eligible interstate visitors to receive at least a 50 per cent discount when compared to the same applicable adult fare.
233
Budget Strategy and Outlook 2024-25
| Table A.2.14 | Department of Treaty, Aboriginal and Torres Strait Islander Partnerships, Communities and the Arts1,2 |
Concession | 2023–24 Est. Act. $ million | 2024–25 Estimate $ million | ||||||
Queensland Museum - Arts Concessional Entry Fees3 | 3.1 | 2.6 | ||||||
Queensland Performing Arts Trust - Arts Concessional Entry Fees4 | 1.8 | 1.3 | ||||||
Arts Queensland - Discount on Property Lease Rentals | 0.7 | 0.7 | ||||||
Queensland Performing Arts Trust - Venue Hire Rebates | 0.5 | 0.5 | ||||||
Arts Queensland - Venue Hire Rebates5 | 0.5 | 0.4 | ||||||
Queensland Art Gallery - Arts Concessional Entry Fees6 | 0.7 | 0.4 | ||||||
State Library of Queensland - Venue Hire Rebates | 0.4 | 0.4 | ||||||
Total | 7.7 | 6.3 | ||||||
Notes:
| 1. | Numbers may not add up due to rounding. |
| 2. | Funding for the Queensland energy rebate was appropriated to the Department of Treaty, Aboriginal and Torres Strait Islander Partnerships, Communities and the Arts but is presented together with the Australian Government funding under the Department of Child Safety, Seniors and Disability Services in Table A.2.2 for consistency and comparability. |
| 3. | The variance is due to building works being conducted in 2024–25 resulting in lower ticketed revenue and concessions offered. |
| 4. | Concessions are dependent on the type of shows QPAC provides in the year; it is not expected there will be similar major shows presented in 2024–25 as there was in 2023–24. |
| 5. | Judith Wrigth Art Centre is being refurbished in 2024–25 resulting in lower concessions due to unavailable performance space. |
| 6. | Ticket sales were higher than expected in 2023–24. In 2024–25 the Asia Pacific Triennial exhibition is a free show which reduces the number of ticketed exhibitions and results in lower concessions offered. |
Queensland Museum – Arts Concessional Entry Fee
Queensland Museum provides concessional entry fees to seniors, students, children, families and a variety of concession card holders for ticketed exhibitions at Queensland Museum and Sciencentre and for general entry to Cobb & Co Museum Toowoomba, the Workshops Rail Museum Ipswich and Museum of Tropical Queensland Townsville. Concessions are also provided to targeted groups, such as schools, to encourage visits to museums. The level of concession provided varies depending on the venue and the event.
Queensland Performing Arts Trust – Arts Concessional Entry Fees
Concessional entry fees are offered for specific Queensland Performing Arts Trust productions and to provide support for other not for profit theatre companies to enable tickets to be sold at concessional prices. The level of concession provided varies depending on the number and size of events being held each year.
Arts Queensland – Discount on Property Lease Rentals
Property lease rentals are provided to arts and cultural organisations at a discount from market rental rates at the Judith Wright Arts Centre, Festival House, and Bulmba-ja Arts Centre. Further discounts on specialist rehearsal and gallery space are given as negotiated at the time of entering the lease and dependent on the individual arts or cultural organisation and its funding.
234
Budget Strategy and Outlook 2024-25
Queensland Performing Arts Trust – Venue Hire Rebates
Venue hire rebates are offered to government-funded cultural organisations, charitable organisations, government departments and educational institutions. Organisations currently receiving discounts are Queensland Symphony Orchestra, Opera Queensland, Queensland Theatre Company and Queensland Ballet.
Arts Queensland – Venue Hire Rebates
Venue hire rebates support Queensland Government-funded arts organisations and professional artists to develop and present new work at the Judith Wright Arts Centre and Bulmba-ja Arts Centre.
Queensland Art Gallery – Arts Concessional Entry Fees
Queensland Art Gallery’s ticket prices are set to ensure that they are affordable and to maximise attendance, with additional concessions provided to seniors, students, children, families, and a variety of concession card holders. The purpose of the Queensland Art Gallery Arts entry fees concession is to contribute to the cultural, social, and intellectual development of Queenslanders, and encourage diverse audiences.
State Library of Queensland – Venue Hire Rebates
State Library of Queensland provides venue hire concessions to targeted community and non-profit groups including cultural and charitable organisations and educational institutions in order to support events and programs directly linked to State Library of Queensland’s services, programs, and activities.
| Table A.2.15 | Queensland Fire Department |
Concession | 2023–24 Est. Act. $ million | 2024–25 Estimate $ million | ||||||
Emergency Management Levy Concession | 11.5 | 11.7 | ||||||
Total | 11.5 | 11.7 | ||||||
Emergency Management Levy Concession
The Emergency Management Levy (EML) is applied to all prescribed Queensland property via council rates to ensure there is a secure funding base for fire and emergency services when Queenslanders are at risk during emergencies such as fire and accidents, as well as floods, cyclones, storms. A 20 per cent discount is available on the EML for a property that is the owner’s principal place of residence and where the owner holds a Commonwealth Pensioner Concession Card or a Repatriation Health Card (Gold Card). In 2024–25, 285,000 property owners are estimated to receive the concession.
235
Budget Strategy and Outlook 2024-25
| Table A.2.16 | Queensland Health |
Concession | 2023–24 Est. Act. $ million | 2024–25 Estimate $ million | ||||||
Oral Health Scheme1 | 186.6 | 188.3 | ||||||
Patient Travel Subsidy Scheme2 | 99.8 | 118.5 | ||||||
Medical Aids Subsidy Scheme3 | 28.0 | 31.1 | ||||||
Spectacle Supply Scheme4 | 9.3 | 10.6 | ||||||
Hospital Car Parking Concession Scheme5 | 1.8 | 1.8 | ||||||
Total | 325.5 | 350.3 | ||||||
Notes:
| 1. | The increase in 2024–25 estimate is primarily due to an escalation in state funding for the Oral Health Scheme. In the 2024–25 financial year, Commonwealth funding available under the Federation Funding Agreement on Public Dental Services for Adults will be the same as previous years. |
| 2. | The increase in Patient Travel Subsidy Scheme (PTSS) expenditure is due to increased PTSS claims, driven by increased demand projections and increased concession rate subsidies. |
| 3. | The 2023–24 estimated actual of $28.0 million is lower than the 2023–24 estimate by $2.5 million due to residual impacts of the COVID-19 pandemic in July to December 2023. 2024–25 estimate represents a return to normal operations utilising the full year MASS budget. |
| 4. | 2024–25 estimate represents a return to normal operations utilising the full year Spectacle Supply Scheme budget. |
| 5. | Actual expenditure varies slightly from year to year in response to demand by eligible patients, the value of parking tickets, and the level of subsidy provided, at each site. |
Oral Health Scheme
The Oral Health Scheme provides free dental care to eligible clients and their dependants who possess a current Health Care Card, Pensioner Concession Card, Queensland Seniors Card or Commonwealth Seniors Card.
The average value of a course of treatment for eligible clients is approximately $830 for general care; $2,200 for treatment involving dentures; and $290 for emergency dental care. In rural and remote areas where no private dental practitioner exists, access to dental care for the general public is provided at a concessional rate, generally 15 per cent to 20 per cent less than average private dental fees.
Patient Travel Subsidy Scheme
The Patient Travel Subsidy Scheme (PTSS) provides financial assistance to patients travelling for specialist medical services that are not available locally. The PTSS provides a financial subsidy toward the cost of travel and accommodation for patients and, in some cases, an approved escort when patients are required to travel more than 50 kilometres from their nearest public hospital or public health facility to access specialist medical services.
Patients receive fully subsidised commercial transport for the most clinically appropriate cost-effective mode or will be subsidised at the economy/government discount rate (less GST and fees). The mileage subsidy is 34 cents per kilometre where patients travel by private car. Accommodation subsidies are $70 per person, per night, for the patient and approved escort if they stay in commercial accommodation. Should the patient or escort stay with family or friends, a subsidy of $10 per person per night is available.
236
Budget Strategy and Outlook 2024-25
Repatriation costs for deceased patients under the PTSS scheme to their Queensland place of residence; or their Queensland Traditional Homelands; or their Queensland First Nations Country is also provided for.
Medical Aids Subsidy Scheme
The Medical Aids Subsidy Scheme (MASS) provides access to funding assistance for the provision of a range of aids and equipment to eligible Queensland residents with permanent and established conditions or disabilities. Aids and equipment are provided primarily to assist people to live at home, therefore avoiding premature or inappropriate residential care or hospitalisation.
Subsidies vary based on service category and clinical criteria and are provided to assist with the costs of communication aids, continence aids, daily living aids, medical grade footwear, mobility aids, orthoses and oxygen. Actual expenditure for 2023–24 reflects the changing impacts of the National Disability Insurance Scheme (NDIS) as MASS clients are competing with NDIS participants for prescriber services.
Based on demand in 2023–24, and current applications, the scheme is estimated to provide 66,500 occasions of service to approximately 45,755 clients. The scheme is estimated to provide approximately 60,000 occasions of service to approximately 47,000 clients in 2024–25.
Spectacle Supply Scheme
The Spectacle Supply Scheme (SSS) provides eligible Queensland residents with free access to a comprehensive range of basic spectacles every 2 years including bifocals and trifocals. Applicants must be holders of an eligible concession card and be deemed by a prescriber to have a clinical need for spectacles.
The SSS provides around 90,000 items each year to approximately 70,000 clients (some clients require more than one pair of spectacles due to clinical need). With eligibility on a 2 year basis, demand can fluctuate across financial years. During 2023–24, it is estimated that SSS will provide approximately 63,000 items to 59,000 clients. The average cost of services provided to applicants during 2023–24, is approximately $139 per item, including the costs of administering the scheme through the Medical Aids Subsidy Scheme.
Hospital Car Parking Concession Scheme
The Hospital Car Parking Concession Scheme supports Hospital and Health Services to provide affordable car parking for eligible patients and their carers at 17 Queensland public hospitals with paid parking. Car parking concessions are available to eligible patients and their carers who attend hospital frequently, or for an extended period of time; patients and their carers with special needs who require assistance; and patients and carers experiencing financial hardship. The scheme provides access to discounted parking with an average discount of approximately 50 to 60 per cent of the commercial cost of parking, with a 60 per cent average discount realised across all sites in 2023–24.
237
Budget Strategy and Outlook 2024-25
A.3 Concessions by government-owned corporation
| Table A.3.1 | Energy Queensland Limited |
Concession | 2023–24 Est. Act. $ million | 2024–25 Estimate $ million | ||||||
Regulated Service Charges - Energex | 11.4 | 12.1 | ||||||
Regulated Service Charges - Ergon Energy | 10.3 | 11.3 | ||||||
Total | 21.7 | 23.4 | ||||||
Regulated Service Charges – Energex
Under Schedule 8 of the Electricity Regulation 2006, charges for a range of services provided by Energex Limited (Energex) to energy retailers, for example disconnection and reconnection of supply, are capped. The maximum amount Energex is able to charge for these services is, on average, less than the value which the Australian Energy Regulator ascribes to the provision of these services by Energex, resulting in a concession provided to energy retailers and in turn, to households.
Regulated Service Charges – Ergon Energy
Under Schedule 8 of the Electricity Regulation 2006, service charges for a range of services provided by Ergon Energy Corporation Limited (Ergon Energy) to energy retailers, for example disconnection and reconnection of supply, are capped. The maximum amount Ergon Energy is able to charge for these services is, on average, less than the value which the Australian Energy Regulator ascribes to the provision of these services by Ergon Energy, resulting in a concession provided to energy retailers and in turn, to households.
| Table A.3.3 | Gladstone Ports Corporation Limited |
Concession | 2023–24 Est. Act. $ million | 2024–25 Estimate $ million | ||||||
Concessional Port Charges | 36.0 | 38.0 | ||||||
Total | 36.0 | 38.0 | ||||||
Concessional Port Charges
The Gladstone Ports Corporation Limited (GPC) is subject to a number of long-term major industry contracts where port charges are significantly lower than market rates. These historical contracts were entered into to support various industries and government initiatives from time to time. The amounts shown are estimates of the revenue foregone by GPC as a result of being unable to charge commercial rates.
238
Budget Strategy and Outlook 2024-25
| Table A.3.4 | Sunwater Limited |
Concession | 2023–24 Est. Act. $ million | 2024–25 Estimate $ million | ||||||
Water Supply Contracts1,2 | 51.6 | 53.8 | ||||||
Total | 51.6 | 53.8 | ||||||
Notes:
| 1. | No CSO values are included in these concessions. |
| 2. | The movement takes into account prices increasing in line with CPI. |
Water Supply Contracts
Sunwater has a number of historic non-commercial water supply contracts that benefit specific entities (including local governments). The amount shown represents the difference between the estimated revenue under these contracts and what could potentially be recovered under a commercial cost allocation pricing model.
| Table A.3.5 | Concessional Leases by Entity (Industry, Commercial and Community) |
Concession | 2023–24 Est. Act. $ million | 2024–25 Estimate $ million | ||||||
Port of Townsville Limited | 6.6 | 6.8 | ||||||
Gladstone Ports Corporation Limited | 3.3 | 5.4 | ||||||
Queensland Rail Limited | 2.6 | 2.7 | ||||||
Far North Queensland Ports Corporation Limited | 2.0 | 2.0 | ||||||
North Queensland Bulk Ports Corporation Limited | 1.5 | 1.5 | ||||||
Total | 16.0 | 18.4 | ||||||
Concessional Leases (Industry, Commercial and Community)
The above government-owned corporation entities provide leases to various community organisations, local councils, government departments and industry participants at below commercial rates. The amounts shown are estimates of the revenue foregone by not charging commercial rates.
239
Budget Strategy and Outlook 2024-25
Appendix B: Tax expenditure statement
Context
Governments employ a range of policy tools to achieve social and economic objectives. These include the use of direct budgetary outlays, regulatory mechanisms and taxation.
This Tax Expenditure Statement (TES) details revenue forgone as a result of Queensland Government decisions relating to the provision of tax exemptions or concessions. The TES is designed to improve transparency in the use of tax expenditures and increase public understanding of the fiscal process.
Tax expenditures are reductions in tax revenue that result from the use of the taxation system as a policy tool to deliver government policy objectives. Tax expenditures are provided through a range of measures, including:
| • | tax exemptions, rebates or deductions |
| • | the application of reduced tax rates to certain groups or sectors of the community |
| • | provisions, which defer payment of a tax liability to a future period. |
Labelling an exemption or concession as a tax expenditure does not necessarily imply any judgement as to its appropriateness. It merely makes the amount of the exemption or concession explicit and thereby facilitates its scrutiny as part of the annual budget process.
Methodology
Revenue forgone approach
The method used almost exclusively by governments to quantify the value of their tax expenditures is the revenue forgone approach. This method estimates the revenue forgone through use of the concession by applying the benchmark rate of taxation to the volume of activities or assets affected by the concession.
One of the deficiencies of the revenue forgone approach is that effects on taxpayer behaviour resulting from tax expenditures are not factored into the estimate. Consequently, the aggregation of costings for individual tax expenditure items presented in the TES will not necessarily provide an accurate estimate of the total level of assistance provided through tax expenditures.
Measuring tax expenditures requires the identification of:
| • | a benchmark tax base |
| • | concessionally taxed components of the benchmark tax base such as a specific activity or class of taxpayer |
| • | a benchmark tax rate to apply to the concessionally taxed components of the tax base. |
240
Budget Strategy and Outlook 2024-25
Defining the tax benchmark
The most important step in the preparation of a TES is the establishment of a benchmark for each tax included in the statement. The benchmark provides a basis against which each tax concession can be evaluated. The aim of the benchmark is to determine which concessions are tax expenditures as opposed to structural elements of the tax. The key features of a tax benchmark are:
| • | the tax rate structure |
| • | any specific accounting conventions applicable to the tax |
| • | the deductibility of compulsory payments |
| • | any provisions to facilitate administration |
| • | provisions relating to any fiscal obligations. |
By definition, tax expenditures are those tax concessions not included as part of the tax benchmark.
Identification of what features of a tax constitute a tax expenditure, as well as the relevant benchmark revenue bases and rates, requires a degree of judgement and is not definitive. Furthermore, data limitations mean that the tax expenditures are approximations and are not exhaustive. This statement does not include estimates of revenue forgone from exemptions or concessions provided to government agencies. Very small exemptions or concessions are also excluded.
The tax expenditure statement
This year’s statement includes estimates of tax expenditures in 2022–23 and 2023–24 for payroll tax, the mental health levy, land tax, duties, the waste disposal levy and gambling taxes. A summary of the major tax expenditures valued on the basis of revenue forgone is presented in Table B.1. Not all expenditures can be quantified at this time. Accordingly, the total value of tax expenditures should be considered as indicative only.
241
Budget Strategy and Outlook 2024-25
| Table B.18 | Tax expenditure summary1 |
| 2022–232 $ million | 2023–24 $ million | |||||||
Payroll tax | ||||||||
Exemption threshold | 1,077 | 1,159 | ||||||
Graduated tax scale | 31 | 33 | ||||||
Deduction scheme | 585 | 651 | ||||||
Regional discount | 106 | 117 | ||||||
Section 14 exemptions | 900 | 969 | ||||||
Local government | 162 | 175 | ||||||
Education | 241 | 260 | ||||||
Hospitals (excluding public hospitals) | 72 | 77 | ||||||
Charities | 425 | 457 | ||||||
Apprentice and trainee exemption | 112 | 119 | ||||||
Apprentice and trainee rebate | 48 | 51 | ||||||
General practitioner payroll tax amnesty3 | 100 | 100 | ||||||
Total payroll tax | 2,959 | 3,199 | ||||||
Mental health levy4 | ||||||||
Graduated scale | 93 | 199 | ||||||
Total mental health levy | 93 | 199 | ||||||
Land tax | ||||||||
Liability threshold5 | 889 | 939 | ||||||
Graduated land tax scale | 1,770 | 2,163 | ||||||
Principal place of residence exemption | 428 | 525 | ||||||
Primary production exemption | 206 | 267 | ||||||
Part 6 Divisions 2 and 3 exemptions not included elsewhere6 | 173 | 182 | ||||||
Land developers’ concession | 5 | 9 | ||||||
Total land tax | 3,471 | 4,085 | ||||||
Duties | ||||||||
Transfer duty | ||||||||
Home concession | 517 | 538 | ||||||
First home concession7 | 189 | 144 | ||||||
First home vacant land | 14 | 13 | ||||||
AFAD exemption/ex gratia | 14 | 18 | ||||||
Insurance duty | ||||||||
WorkCover | 93 | 108 | ||||||
Health insurance | 488 | 503 | ||||||
Compulsory third party (CTP)8 | 91 | 92 | ||||||
Total duties | 1,406 | 1,416 | ||||||
242
Budget Strategy and Outlook 2024-25
| 2022–232 $ million | 2023–24 $ million | |||||||
Queensland waste levy |
| |||||||
Exempt waste – general9 | 92 | 17 | ||||||
Approved exemptions9 | 94 | 172 | ||||||
Approved discounts | 10 | 9 | ||||||
Total waste levy | 196 | 199 | ||||||
Taxes on gambling | ||||||||
Gaming machine taxes | 135 | 139 | ||||||
Casino taxes | 12 | 14 | ||||||
Total gambling tax | 147 | 153 | ||||||
Total | 8,272 | 9,251 | ||||||
Notes:
| 1. | Numbers may not add due to rounding. |
| 2. | 2022–23 estimates may have been revised since the 2023–24 Queensland Budget. |
| 3. | Estimates reflect the amnesty period covering the five years prior to 30 June 2025 (i.e. including 2022–23 and 2023–24). |
| 4. | 2022–23 estimates reflect implementation from 1 January 2023 (i.e. half a financial year). |
| 5. | Land tax is payable only on the value of taxable land above a threshold, depending on ownership structure. |
| 6. | Applicable, but not limited to; religious bodies, public benevolent institutions, and other exempt charitable institutions. |
| 7. | Decline in 2023–24 reflects fewer transactions being eligible for the concession in 2023–24 than in 2022–23. Revenue foregone in 2024–25 is expected to increase due to the raising of the property value threshold as announced under this Budget. |
| 8. | CTP duty is levied at a rate of 10 cents per policy. |
| 9. | Decrease in Exempt waste and increase in Approved exemptions in 2023–24 are due to changes to the waste levy exemption for clean earth which commenced 1 July 2023. Clean earth no longer has a general exemption, instead an exemption can be applied for by landfill operators to use clean earth for operational purposes on their site. |
243
Budget Strategy and Outlook 2024-25
Discussion of individual taxes
Payroll tax
The benchmark tax base for payroll tax is assumed to be all taxable wages, salaries and supplements (including employer superannuation contributions) paid in Queensland, as defined in the Payroll Tax Act 1971.
Payroll tax exemption threshold
From 1 July 2019, employers who employ in Queensland with an annual Australian payroll of $1.3 million or less are exempt from payroll tax. On the basis of November 2023 average weekly adult total earnings, the threshold corresponded to businesses with payrolls equivalent to employing approximately 13 full-time equivalent employees. This exemption is designed to assist small and medium sized businesses.
Graduated payroll tax scale
Queensland employers with Australian payrolls between $1.3 million and $6.5 million are liable for payroll tax at a rate of 4.75 per cent, and those with payrolls above $6.5 million are liable at a rate of 4.95 per cent. The benchmark tax rate for payroll tax is assumed to be 4.95 per cent.
Deduction scheme
Until 1 January 2023, Queensland employers with Australian payrolls between $1.3 million and $6.5 million benefit from a deduction of $1.3 million, which reduces by $1 for every $4 by which the annual payroll exceeds $1.3 million, with no deduction for employers or groups that have annual payroll in excess of $6.5 million.
From 1 January 2023, the deduction applies to payrolls between $1.3 million and $10.4 million, reducing by $1 in every $7 by which the annual payroll exceeds $1.3 million. No deduction is available for employers or groups that have annual payroll in excess of $10.4 million.
Regional discount
Employers who are based in regional Queensland and pay over 85 per cent of taxable wages to regional areas may be entitled to a discount on the rate of payroll tax imposed on their taxable wages. The discounted payroll tax rates for regional businesses are 3.75 per cent for employers who pay $6.5 million or less in Australian taxable wages, or 3.95 per cent for employers who pay more than $6.5 million in Australian taxable wages.
244
Budget Strategy and Outlook 2024-25
Section 14 exemptions
A number of organisations are provided with exemptions from payroll tax under Section 14 of the Payroll Tax Act 1971. The activities for which estimates have been calculated are wages paid by charities for employees working in hospitals, non-tertiary private educational institutions and for other qualifying exempt purposes, and for local governments (excluding commercial activities).
Apprentice and trainee exemptions
Most apprentice and trainee wages are exempt from payroll tax. To be eligible the employee must sign a training contract with their employer to undertake an apprenticeship or traineeship declared under the Further Education and Training Act 2014.
Apprentice and trainee rebate
In addition to being exempt wages for payroll tax, a rebate can be claimed that reduces the overall payroll tax liability of an employer. The rebate is calculated by multiplying 50 per cent of the apprentice and trainee wages by the applicable payroll tax rate for each return period.
General practitioner payroll tax amnesty
An amnesty is being provided to qualifying medical practices, otherwise liable to pay payroll tax on payments made to contracted general practitioners (GPs), up to 30 June 2025 and for the previous 5 years (i.e. 2018–2025). The amnesty recognises a potential lack of awareness of the payroll tax treatment of contractors among GPs and the need to support these practices to come into compliance with the least disruption possible.
Mental health levy
The benchmark tax base for the mental health levy is assumed to be taxable wages, salaries and supplements (including employer superannuation contributions) paid in Queensland, as defined in the Payroll Tax Act 1971 that are paid by employers or groups of employers with Australian taxable wages of at least $10 million (on an annual basis).
A number of organisations are provided with exemptions from the mental health levy under Section 14 of the Payroll Tax Act 1971. Further, most apprentice and trainee wages are exempt from the mental health levy. The revenue foregone as a result of these exemptions cannot be quantified at this time.
Graduated scale
Queensland employers with Australian payrolls between $10 million and $100 million are liable for a primary rate of 0.25 per cent, and those with payrolls above $100 million are liable for the primary rate of 0.25 per cent plus an additional rate of 0.5 per cent. The benchmark rate for the mental health levy is assumed to be 0.75 per cent.
For the 2022–23 financial year, the thresholds are adjusted to accommodate the levy commencing during the financial year. For wages paid or payable for the period 1 January to 30 June 2023, Queensland employers with Australian payrolls between $5 million and $50 million
245
Budget Strategy and Outlook 2024-25
are liable for a primary rate of 0.25 per cent, and those with payrolls above $50 million are liable for the primary rate of 0.25 per cent plus an additional rate of 0.5 per cent.
Land tax
The benchmark tax base is assumed to be all freehold land within Queensland. As outlined below for each specific tax expenditure, the appropriate benchmark tax rate for land tax is either the top rate of land tax applicable in Queensland (excluding surcharges) in each financial year, or the effective rate under the graduated scale of land tax rates for revenue foregone.
Liability threshold
Land tax is payable on the value of taxable land equal to or above a threshold which depends on the land’s ownership. The threshold for companies, trusts and absentees is $350,000 and for resident individuals the threshold is $600,000.
Graduated land tax scale
A graduated (concessional) scale of land tax rates is applicable to land holdings with a taxable value of less than $10 million for resident individuals and companies, trustees and absentees. The benchmark rates used for estimating the tax expenditures were the highest rates applicable for different types of owner, 2.25 per cent for individuals, 2.5 per cent for absentees and 2.75 per cent for companies and trustees.
Principal place of residence exemption
Land owned by resident individuals as their principal place of residence is excluded from the estimate of taxable land value in calculating land tax. The benchmark rates used for estimating the tax expenditures were the effective rate under the graduated scale of land tax rates.
Primary production deduction
The taxable value of land owned by a resident individual, trustee or some absentees and companies does not include all or part of their land that is used for the business of agriculture, pasturage or dairy farming. The benchmark rates used for estimating the tax expenditures were the effective rate under the graduated scale of land tax rates.
246
Budget Strategy and Outlook 2024-25
Part 6 Divisions 2 and 3 exemptions (not elsewhere included)
A number of land tax exemptions are granted in Part 6 Divisions 2 and 3 of the Land Tax Act 2010 to eligible organisations. These include, but are not limited to, public benevolent institutions, religious institutions and other exempt charitable institutions, retirement villages, trade unions and showgrounds.
Land developers’ concession
Land tax payable by land developers is calculated on the basis that the unimproved value of undeveloped land subdivided in the previous financial year and which remains unsold at 30 June of that year is 60 per cent of the Valuer-General’s value. This concession is outlined in Section 30 of the Land Tax Act 2010.
Duties
Home concession
A concessional rate of duty applies to purchases of a principal place of residence. A one per cent concessional rate applies on dutiable values up to $350,000, rather than the normal schedule of rates between 1.5 per cent and 3.5 per cent. For properties valued over $350,000, the scheduled rates of transfer duty apply on the excess.
First home concession
Where a purchaser has not previously owned a residence in Queensland or elsewhere, the purchaser of a home receives a more generous concession on duty. This concession comprises a rebate in addition to the home concession on properties (this concession may not be applicable if the purchase price is less than the full market value of the property). The size of the rebate depends on the value of the property. For 2023–24 and earlier, a full concession is provided for purchases of a first principal place of residence valued up to $500,000, phasing out at $550,000.
From 2024–25, a full concession will be provided for eligible purchases of a first principal place of residence valued up to $700,000, phasing out at $800,000.
First home vacant land concession
A first home concession is available for the purchase of certain vacant land up to the value of $400,000, with a full concession available on certain vacant land up to the value of $250,000 — for years up to and including 2023–24.
From 2024–25, a full concession will be provided for eligible vacant land purchases valued up to $350,000, phasing out at $500,000.
Additional foreign acquirer duty exemption
An Australian-based foreign corporation or trust whose commercial activities involve significant development by adding to the supply of housing stock in Queensland, where such development is
247
Budget Strategy and Outlook 2024-25
primarily residential, may be eligible for ex-gratia relief from the additional 7 per cent foreign acquirer duty.
Insurance duty
The benchmark tax base is assumed to be all premiums for general insurance policies (not for life insurance). The benchmark tax rate is 9 per cent.
Queensland Waste Levy
The Queensland waste levy is payable by landfill operators on waste disposed to landfill, except waste generated and disposed in the non-levy zone. In 2023–24, the levy rate was $105 per tonne in the metropolitan levy area and $91 per tonne in the regional levy area (higher for regulated wastes).
General levy exemptions exist for particular wastes, such as those from declared disasters and severe local weather events. Also, levy exemptions are available on application for other particular wastes, such as waste from charitable recycling organisations and community clean-up events.
Levy discounts of 50 per cent are available on application for residue wastes from particular recycling activities. Seventy per cent of proceeds from the waste levy will be used for waste programs, environmental priorities and community purposes.
Gambling taxes
Gaming machine tax concessions for licensed clubs
The benchmark tax base is assumed to be all gaming machines operated by licensed clubs and hotels in Queensland. The benchmark tax rate is assumed to be the highest marginal tax rate (as is applied to hotels) that actually applied in each financial year.
A progressive tax rate scale applies to gaming machines operated by licensed clubs. The tax rate is calculated monthly on the gaming machine taxable metered win and the top tax rate is only applied to the portion of gaming machine revenue where the monthly metered win exceeds $1.4 million for any licensed club.
Casino tax concessions
The benchmark tax base is assumed to be all casinos operating in Queensland. The benchmark tax rate is assumed to be the highest tax rate that is actually applied in each financial year.
A tax rate of 20 per cent of gross revenue applies for standard transactions in the Brisbane and Gold Coast casinos. A concessional tax rate of 10 per cent applies for gross revenue from standard transactions in the Cairns and Townsville casinos. The tax rate applicable to gaming machines in casinos is 30 per cent of gross revenue in the Brisbane and Gold Coast casinos, and 20 per cent in the Cairns and Townsville casinos.
In addition, concessional rates of 10 per cent also apply for revenue from high rollers table game play in all casinos. A GST credit is provided to casinos that approximates a reduction in the above tax rates of 9.09 per cent.
248
Budget Strategy and Outlook 2024-25
Appendix C: Revenue and expense assumptions and sensitivity analysis
The 2024–25 Queensland Budget, similar to all other jurisdictions, is based in part on assumptions made about parameters, both internal and external to Queensland, which can impact directly on economic and fiscal forecasts.
The sensitivity of revenue and expense forecasts to movements in underlying assumptions is particularly relevant given the ongoing uncertainty in global and national economic conditions and other factors that can directly or indirectly impact key revenues.
The forward estimates in the 2024–25 Queensland Budget are framed on a no-policy-change basis. That is, the expenditure and revenue policies in place at the time of the budget (including those announced in the budget) are applied consistently throughout the forward estimates period.
Table C.1 shows the main components of taxation and royalty revenue, and the forecast revenues for each component across the forward estimates.
| Table C.1 | Taxation and royalty revenue1 |
| 2022–23 Actual $ million | 2023–24 Est. Act. $ million | 2024–25 Budget $ million | 2025–26 Projection $ million | 2026–27 Projection $ million | 2027–28 Projection $ million | |||||||||||||||||||
Payroll tax and mental health levy | 5,850 | 6,715 | 7,245 | 7,678 | 8,079 | 8,444 | ||||||||||||||||||
Transfer duty | 5,240 | 5,605 | 6,793 | 7,081 | 7,326 | 7,672 | ||||||||||||||||||
Other duties | 2,232 | 2,478 | 2,596 | 2,729 | 2,845 | 2,967 | ||||||||||||||||||
Gambling taxes and levies | 1,911 | 2,048 | 2,141 | 2,220 | 2,301 | 2,384 | ||||||||||||||||||
Land tax | 1,732 | 2,032 | 2,499 | 2,832 | 3,120 | 3,300 | ||||||||||||||||||
Motor vehicle registration | 2,226 | 2,352 | 2,046 | 2,470 | 2,593 | 2,687 | ||||||||||||||||||
Other taxes | 1,409 | 1,440 | 1,478 | 1,564 | 1,645 | 1,747 | ||||||||||||||||||
Total tax revenue | 20,601 | 22,670 | 24,799 | 26,573 | 27,910 | 29,202 | ||||||||||||||||||
Royalties | ||||||||||||||||||||||||
Coal | 15,360 | 10,541 | 6,233 | 4,810 | 4,595 | 4,512 | ||||||||||||||||||
Petroleum2 | 2,350 | 1,705 | 1,594 | 1,269 | 1,039 | 990 | ||||||||||||||||||
Other royalties3 | 504 | 526 | 579 | 499 | 442 | 427 | ||||||||||||||||||
Total royalties | 18,214 | 12,771 | 8,406 | 6,578 | 6,076 | 5,929 | ||||||||||||||||||
Land rents | 181 | 184 | 193 | 197 | 201 | 206 | ||||||||||||||||||
Total royalties and land rents | 18,395 | 12,955 | 8,599 | 6,774 | 6,278 | 6,136 | ||||||||||||||||||
Notes:
| 1. | Numbers may not add due to rounding. |
| 2. | Includes liquefied natural gas (LNG). |
| 3. | Includes base and precious metal and other mineral royalties. |
The remainder of this chapter outlines the key assumptions, estimates and risks associated with key revenue and expenditure forecasts.
249
Budget Strategy and Outlook 2024-25
Taxation revenue assumptions and revenue risks
The rate of growth in tax revenues is dependent on a range of factors linked to the rate of growth in economic activity in the state. Some taxes are closely related to activity in specific sectors of the economy, whilst others are broadly related to the general rate of economic growth, employment, inflation or wages.
Therefore, any change in the level of economic activity compared with that reflected in the economic forecasts outlined in this paper would impact a broad range of taxation receipts.
Wages and employment growth – payroll tax
Wages and employment growth have a direct impact on payroll tax collections. In 2024–25, wages in Queensland are forecast to increase by 33⁄4 per cent, while employment is forecast to rise 11⁄2 per cent in 2024–25.
The composition of the payroll tax base is also important as businesses in sectors such as tourism, retail and hospitality are often outside the tax base because they are below the specified threshold. A one percentage point variation in either Queensland wages growth or employment is estimated to change total payroll tax collections by approximately $72 million in 2024–25.
Property prices and transaction volumes – transfer duty
Transfer duty, as a transaction-based tax, can be volatile from year to year reflecting cyclical residential and non-residential market conditions. In 2024–25, transfer duty is expected to grow strongly, reflecting ongoing strength and activity in the property market, including strength in residential property prices.
After a modest decline in 2022–23, residential prices have grown strongly across 2023–24, while growth is expected to continue at more moderate levels over the coming years.
Residential transaction volumes have remained relatively stable, but remain higher than pre-COVID-19 levels, underpinned by ongoing strong population growth.
A one percentage point variation in either the average value of property transactions or the volume of transactions is estimated to change transfer duty collections by approximately $68 million in 2024–25.
250
Budget Strategy and Outlook 2024-25
Royalty assumptions and revenue risks
Table C.2 provides the key assumptions adopted for the 2024–25 Queensland Budget in relation to coal and petroleum royalties, which represent the bulk of Queensland’s royalty revenue.
| Table C.2 | Coal royalty assumptions1 |
| 2022–23 Actual | 2023–24 Est. Act. | 2024–25 Budget | 2025–26 Projection | 2026–27 Projection | 2027–28 Projection | |||||||||||||||||||
Tonnages—crown export2 coal (Mt) | 190 | 197 | 209 | 220 | 229 | 225 | ||||||||||||||||||
Exchange rate US$ per A$3 | 0.67 | 0.66 | 0.69 | 0.72 | 0.75 | 0.75 | ||||||||||||||||||
Year average coal prices (US$ per tonne)4 | ||||||||||||||||||||||||
Hard coking | 279 | 286 | 208 | 186 | 185 | 185 | ||||||||||||||||||
PCI/Semi-soft | 259 | 168 | 141 | 134 | 133 | 133 | ||||||||||||||||||
Thermal | 304 | 133 | 120 | 120 | 120 | 120 | ||||||||||||||||||
Year average oil price | ||||||||||||||||||||||||
Brent (US$ per barrel)5 | 102 | 84 | 87 | 80 | 75 | 75 | ||||||||||||||||||
Notes:
| 1. | Numbers in this table may be affected by rounding. |
| 2. | Excludes coal produced for domestic consumption and where royalties are not paid to the government (private royalties). The 2024–25 estimated domestic coal volume is approximately 24.4 Mt and private coal is 7.0 Mt. |
| 3. | Estimated year-average. |
| 4. | Estimated year-average spot prices for highest quality coking and thermal coal. Lower quality coal can be sold below this price, with indicative average prices for 2023–24 as follows: hard coking US$195/t and thermal US$93/t. |
| 5. | Published Brent oil prices are lagged by 4 months to better align with royalty revenue. |
Exchange rate and commodity prices and volumes
Estimates of mining royalties are sensitive to movements in the A$-US$ exchange rate and commodity prices and volumes.
Since mid-2021, there has been an unprecedented surge in coal prices. While prices have since moderated from these exceptionally high levels, they remain elevated compared to historical levels.
The recent strength in global coal prices is primarily driven by a range of short-term supply side factors and disruptions. As such, prices are expected to return to more sustainable levels across the forward estimates. However, the timing and extent of the decline remains uncertain.
Coal royalties are based on progressive rates with higher royalty rates applying to higher coal prices. This means coal royalty estimates are even more sensitive to price movements at times when prices are very high, therefore providing increased returns to Queenslanders from royalties on this valuable and limited resource during times when coal producers are also benefitting from the high prices in terms of increased revenues and profits.
Contracts for the supply of commodities are generally written in US dollar terms. Accordingly, a change in the exchange rate impacts on the Australian dollar price of commodities and, therefore, expected royalty collections.
251
Budget Strategy and Outlook 2024-25
Potential impact on coal royalty revenue1
For each one cent movement in the A$-US$ exchange rate in 2024–25, the impact on royalty revenue would be approximately $192 million.
A one per cent variation in export coking and thermal coal volumes would lead to an estimated change in royalty revenue of approximately $61 million. A one million tonne variation in export volumes would lead to an estimated change in royalty revenue of approximately $29 million.
A one per cent variation in the average price of export coal would lead to an estimated change in royalty revenue of approximately $129 million.
Parameters influencing Australian Government GST payments to Queensland
The 2024–25 Queensland Budget incorporates estimates of GST revenue grants to Queensland based on 2024–25 Federal Budget estimates of national GST collections and Queensland Treasury assumptions of Queensland’s share. The estimates of collections are primarily determined by the value of national consumption subject to GST.
Since the Australian Government payments are based on the amount actually collected, it is the Queensland Budget that bears the risks of fluctuations in GST collections. As with all other tax estimates, there is a risk of lower collections than estimated if national economic growth and consumption are weaker than expected.
Due to the complexities associated with the GST base, the information provided in the Federal Budget papers is insufficient to prepare indicative estimates of the sensitivity of GST forecasts to key variables.
Sensitivity of expenditure estimates and expenditure risks
Public sector wage costs
Salaries and wages form a large proportion of General Government Sector operating expenses. Increases in salaries and wages are negotiated through enterprise bargaining agreements.
The 2024–25 Budget and forward estimates reflect growth in full-time equivalent and wage increases consistent with existing agreements, the government’s wages policy, and an allowance for future bargaining agreements. It is estimated that a one percentage point increase in wage rates above expectation would increase employee expenses by around $352 million per annum.
Interest rates
The General Government Sector has a total debt servicing cost forecast at $2.655 billion in 2024–25. The current average duration of General Government Sector borrowing with the Queensland Treasury Corporation (QTC) is 6.0 years.
The majority of General Government Sector debt is held under fixed interest rates and, therefore, the impact of interest rate variations on debt servicing costs in 2024–25 would be relatively modest, with the impact occurring progressively across the forward estimates.
| 1 | Sensitivities represent the estimated change to royalty revenue accruing over the 2024–25 return period. |
252
Budget Strategy and Outlook 2024-25
Actuarial estimates of superannuation and long service leave
Liabilities for superannuation and long service leave are estimated by the State Actuary with reference to, among other things, assumed rates of investment returns, salary growth, inflation and the discount rate. These liabilities are therefore subject to changes in these parameters. Similarly, the long service leave liabilities are subject to the risk that the actual rates of employee retention will vary from those assumed in the liability calculation.
253
Budget Strategy and Outlook 2024-25
Appendix D: Fiscal aggregates and indicators
| 2016–17 Actual1 $ million | 2017–18 Actual1 $ million | 2018–19 Actual1 $ million | 2019–20 Actual1 $ million | 2020–21 Actual1 $ million | 2021–22 Actual1 $ million | 2022–23 Actual1 $ million | 2023–24 Est. Act. $ million | 2024–25 Projection $ million | 2025–26 Projection $ million | 2026–27 Projection $ million | 2027–28 Projection $ million | |||||||||||||||||||||||||||||||||||||
General Government | ||||||||||||||||||||||||||||||||||||||||||||||||
Total revenue | 56,194 | 58,087 | 59,828 | 57,778 | 62,791 | 74,185 | 89,810 | 89,059 | 88,107 | 88,717 | 90,670 | 95,332 | ||||||||||||||||||||||||||||||||||||
Tax revenue | 12,919 | 13,244 | 14,165 | 14,585 | 16,249 | 20,011 | 20,601 | 22,670 | 24,799 | 26,573 | 27,910 | 29,202 | ||||||||||||||||||||||||||||||||||||
Total expenses | 53,369 | 56,337 | 58,843 | 63,505 | 63,706 | 69,902 | 75,880 | 88,495 | 90,738 | 89,232 | 89,783 | 93,305 | ||||||||||||||||||||||||||||||||||||
Employee expenses | 21,258 | 22,681 | 24,019 | 25,662 | 26,385 | 28,068 | 30,557 | 33,231 | 35,217 | 36,030 | 37,094 | 38,465 | ||||||||||||||||||||||||||||||||||||
Net operating balance | 2,825 | 1,750 | 985 | (5,728 | ) | (915 | ) | 4,284 | 13,930 | 564 | (2,631 | ) | (515 | ) | 887 | 2,027 | ||||||||||||||||||||||||||||||||
Capital purchases | 4,620 | 5,126 | 5,764 | 6,306 | 6,682 | 7,878 | 9,899 | 11,061 | 12,831 | 14,485 | 14,577 | 12,763 | ||||||||||||||||||||||||||||||||||||
Net capital purchases | 2,265 | 2,337 | 3,192 | 3,436 | 3,942 | 4,356 | 5,838 | 6,281 | 8,159 | 9,032 | 8,228 | 6,081 | ||||||||||||||||||||||||||||||||||||
Fiscal balance | 560 | (587 | ) | (2,207 | ) | (9,164 | ) | (4,857 | ) | (72 | ) | 8,092 | (5,717 | ) | (10,790 | ) | (9,547 | ) | (7,341 | ) | (4,054 | ) | ||||||||||||||||||||||||||
Borrowing with QTC | 31,358 | 29,256 | 29,468 | 37,570 | 46,153 | 49,000 | 46,166 | 54,100 | 68,902 | 84,301 | 96,176 | 104,641 | ||||||||||||||||||||||||||||||||||||
Leases and similar arrangements2 | 1,882 | 2,142 | 2,612 | 6,485 | 7,703 | 7,671 | 7,519 | 7,819 | 8,177 | 7,166 | 7,006 | 6,703 | ||||||||||||||||||||||||||||||||||||
Securities and Derivatives | (0 | ) | 122 | 121 | 198 | 220 | 93 | 41 | 39 | 39 | 39 | 39 | 39 | |||||||||||||||||||||||||||||||||||
Net debt | (355 | ) | (509 | ) | (198 | ) | 14,036 | 11,344 | 10,997 | 2,615 | 12,223 | 27,407 | 40,552 | 52,076 | 59,831 | |||||||||||||||||||||||||||||||||
Non-financial Public Sector | ||||||||||||||||||||||||||||||||||||||||||||||||
Total revenue | 64,855 | 66,164 | 68,329 | 66,171 | 71,318 | 85,485 | 100,821 | 98,639 | 98,517 | 99,704 | 103,095 | 109,333 | ||||||||||||||||||||||||||||||||||||
Capital purchases | 7,291 | 7,643 | 8,460 | 9,482 | 9,877 | 11,130 | 14,300 | 17,482 | 22,241 | 25,767 | 24,561 | 22,331 | ||||||||||||||||||||||||||||||||||||
Borrowing with QTC | 69,107 | 66,964 | 67,576 | 76,464 | 85,901 | 90,851 | 89,442 | 98,334 | 115,260 | 135,540 | 151,714 | 164,188 | ||||||||||||||||||||||||||||||||||||
Leases and similar arrangements2 | 1,882 | 2,142 | 2,612 | 6,977 | 8,157 | 8,028 | 7,887 | 8,446 | 8,766 | 7,691 | 7,774 | 7,408 | ||||||||||||||||||||||||||||||||||||
Securities and Derivatives | 895 | 405 | 720 | 1,503 | 1,570 | 17,374 | 5,491 | 1,790 | 681 | 409 | 385 | 390 | ||||||||||||||||||||||||||||||||||||
Notes:
| 1. | With the implementation of the latest GFS Manual (AGFS15), some categories have been restated to ensure comparability. |
| 2. | Approximately $2.2 billion increase in General Government and $2.6 billion in NFPS in 2019-20 on adoption of the new lease accounting standard AASB 16. |
254
Budget Strategy and Outlook 2024-25
| 2016–17 Actual1 % | 2017–18 Actual1 % | 2018–19 Actual1 % | 2019–20 Actual1 % | 2020–21 Actual1 % | 2021–22 Actual1 % | 2022–23 Actual1 % | 2023–24 Est. Act. % | 2024–25 Projection % | 2025–26 Projection % | 2026–27 Projection % | 2027–28 Projection % | |||||||||||||||||||||||||||||||||||||
General Government | ||||||||||||||||||||||||||||||||||||||||||||||||
Revenue/GSP | 17.1 | 16.6 | 16.3 | 16.0 | 17.1 | 16.3 | 17.8 | 17.1 | 16.3 | 15.8 | 15.5 | 15.5 | ||||||||||||||||||||||||||||||||||||
Tax/GSP | 3.9 | 3.8 | 3.9 | 4.0 | 4.4 | 4.4 | 4.1 | 4.4 | 4.6 | 4.7 | 4.8 | 4.7 | ||||||||||||||||||||||||||||||||||||
Own source revenue/GSP | 8.8 | 8.6 | 8.6 | 8.4 | 8.1 | 8.8 | 10.2 | 9.5 | 8.8 | 8.6 | 8.2 | 8.0 | ||||||||||||||||||||||||||||||||||||
Expenses/GSP | 16.3 | 16.1 | 16.1 | 17.6 | 17.3 | 15.4 | 15.1 | 17.0 | 16.8 | 15.9 | 15.3 | 15.2 | ||||||||||||||||||||||||||||||||||||
Employee expenses/GSP | 6.5 | 6.5 | 6.6 | 7.1 | 7.2 | 6.2 | 6.1 | 6.4 | 6.5 | 6.4 | 6.3 | 6.3 | ||||||||||||||||||||||||||||||||||||
Net operating balance/GSP | 0.9 | 0.5 | 0.3 | (1.6 | ) | (0.2 | ) | 0.9 | 2.8 | 0.1 | (0.5 | ) | (0.1 | ) | 0.2 | 0.3 | ||||||||||||||||||||||||||||||||
Capital purchases/GSP | 1.4 | 1.5 | 1.6 | 1.7 | 1.8 | 1.7 | 2.0 | 2.1 | 2.4 | 2.6 | 2.5 | 2.1 | ||||||||||||||||||||||||||||||||||||
Net cash inflows from operating activities/Net cash flows from investments in non-financial assets | 134.2 | 107.0 | 105.5 | (2.5 | ) | 0.7 | 136.9 | 204.6 | 34.8 | 13.2 | 31.2 | 41.4 | 63.8 | |||||||||||||||||||||||||||||||||||
Fiscal balance/GSP | 0.2 | (0.2 | ) | (0.6 | ) | (2.5 | ) | (1.3 | ) | (0.0 | ) | 1.6 | (1.1 | ) | (2.0 | ) | (1.7 | ) | (1.3 | ) | (0.7 | ) | ||||||||||||||||||||||||||
Total borrowings/GSP | 10.1 | 9.0 | 8.8 | 12.3 | 14.7 | 12.5 | 10.7 | 11.9 | 14.3 | 16.3 | 17.6 | 18.1 | ||||||||||||||||||||||||||||||||||||
Total Borrowings/Revenue | 59.2 | 54.3 | 53.8 | 76.6 | 86.1 | 76.5 | 59.8 | 69.6 | 87.5 | 103.1 | 113.8 | 116.8 | ||||||||||||||||||||||||||||||||||||
Lease and other liabilities/revenue | 3.3 | 3.7 | 4.4 | 11.2 | 12.3 | 10.3 | 8.4 | 8.8 | 9.3 | 8.1 | 7.7 | 7.0 | ||||||||||||||||||||||||||||||||||||
Net debt/revenue | (0.6 | ) | (0.9 | ) | (0.3 | ) | 24.3 | 18.1 | 14.8 | 2.9 | 13.7 | 31.1 | 45.7 | 57.4 | 62.8 | |||||||||||||||||||||||||||||||||
Revenue growth | 10.7 | 3.4 | 3.0 | (3.4 | ) | 8.7 | 18.1 | 21.1 | (0.8 | ) | (1.1 | ) | 0.7 | 2.2 | 5.1 | |||||||||||||||||||||||||||||||||
Tax growth | 3.0 | 2.5 | 7.0 | 3.0 | 11.4 | 23.1 | 2.9 | 10.0 | 9.4 | 7.2 | 5.0 | 4.6 | ||||||||||||||||||||||||||||||||||||
Expenses growth | 6.5 | 5.6 | 4.4 | 7.9 | 0.3 | 9.7 | 8.6 | 16.6 | 2.5 | (1.7 | ) | 0.6 | 3.9 | |||||||||||||||||||||||||||||||||||
Employee expenses growth | 6.1 | 6.7 | 5.9 | 6.8 | 2.8 | 6.4 | 8.9 | 8.8 | 6.0 | 2.3 | 3.0 | 3.7 | ||||||||||||||||||||||||||||||||||||
Non-Financial Public Sector | ||||||||||||||||||||||||||||||||||||||||||||||||
Capital purchases/GSP | 2.2 | 2.2 | 2.3 | 2.6 | 2.7 | 2.5 | 2.8 | 3.4 | 4.1 | 4.6 | 4.2 | 3.6 | ||||||||||||||||||||||||||||||||||||
Total borrowings/GSP | 21.9 | 19.9 | 19.4 | 23.5 | 26.0 | 25.6 | 20.4 | 20.9 | 23.1 | 25.6 | 27.3 | 28.0 | ||||||||||||||||||||||||||||||||||||
Total Borrowings/Revenue | 110.8 | 105.1 | 103.8 | 128.4 | 134.1 | 136.0 | 102.0 | 110.1 | 126.6 | 144.1 | 155.1 | 157.3 | ||||||||||||||||||||||||||||||||||||
Net financial liabilities/revenue | 111.2 | 111.5 | 114.9 | 158.3 | 142.5 | 117.8 | 90.5 | 99.3 | 117.8 | 134.4 | 144.1 | 145.5 | ||||||||||||||||||||||||||||||||||||
Notes:
| 1. | With the implementation of the latest GFS Manual (AGFS15), some categories have been restated to ensure comparability. GSP figures reflect 2022–23 ABS National Accounts: State Accounts and Queensland Treasury forecasts. |
255
Queensland Budget 2024–25 Budget Strategy and Outlook Budget Paper No.2
20% OFF YOUR REGO Queensland Budget 2024–25 Budget Strategy and Outlook Budget Paper No.2
DOING WHAT MATTERS
FOR QUEENSLAND
QUEENSLAND BUDGET 2024–25
BUDGET CAPITAL STATEMENT
BUDGET PAPER NO. 3

2024–25 Queensland Budget Papers
1. Budget Speech
2. Budget Strategy and Outlook
3. Capital Statement
4. Budget Measures
Service Delivery Statements
Appropriation Bills
Budget Overview
Regional Action Plans
First Nations acknowledgement
Queensland Treasury acknowledges Aboriginal peoples and Torres Strait Islander peoples as the Traditional Owners and custodians of the land. We recognise their connection to land, sea and community, and pay our respects to Elders past, present and emerging.
© The State of Queensland (Queensland Treasury) 2024
Copyright
This publication is protected by the Copyright Act 1968
Licence
This document is licensed by the State of Queensland (Queensland Treasury) under a Creative Commons Attribution (CC BY 4.0) International licence.

In essence, you are free to copy, communicate and adapt this publication, as long as you attribute the work to the State of Queensland (Queensland Treasury).
Attribution
Content from this publication should be attributed to:
© The State of Queensland (Queensland Treasury)—2023–24 Queensland Budget
 Translating and interpreting assistance
The Queensland Government is committed to providing accessible services to Queenslanders from all cultural and linguistic backgrounds. If you have difficulty in understanding this publication, you can contact us on telephone (07) 3035 3503 and we will arrange an interpreter to effectively communicate the report to you.
Capital Statement
Budget Paper No. 3
ISSN 1445-4890 (Print)
ISSN 1445-4904 (Online)
Capital Statement 2024-25

State Budget
2024–25
Capital Statement
Budget Paper No. 3
Capital Statement 2024-25
Contents | ||||||
1 | Approach and highlights | 1 | ||||
| Features | 1 | |||||
1.1 | Introduction | 3 | ||||
1.2 | Queensland’s infrastructure frameworks | 4 | ||||
1.3 | Key capital projects and programs | 6 | ||||
2 | 2024–25 Capital program overview | 19 | ||||
2.1 | Introduction | 19 | ||||
2.2 | Capital purchases | 20 | ||||
2.3 | Capital grants | 24 | ||||
3 | Capital outlays by entity | 28 | ||||
3.1 | Agriculture and Fisheries | 28 | ||||
3.2 | Child Safety, Seniors and Disability Services | 31 | ||||
3.3 | Education | 33 | ||||
3.4 | Employment, Small Business and Training | 41 | ||||
3.5 | Energy and Climate | 43 | ||||
3.6 | Environment, Science and Innovation | 52 | ||||
3.7 | Housing, Local Government, Planning and Public Works | 55 | ||||
3.8 | Justice and Attorney-General | 60 | ||||
3.9 | Legislative Assembly of Queensland | 63 | ||||
3.10 | Premier and Cabinet | 64 | ||||
3.11 | Queensland Corrective Services | 65 | ||||
3.12 | Queensland Fire Department | 67 | ||||
3.13 | Queensland Health | 72 | ||||
3.14 | Queensland Police Service | 78 | ||||
3.15 | Queensland Treasury | 82 | ||||
3.16 | Regional Development, Manufacturing and Water | 83 | ||||
Capital Statement 2024-25
3.17 | Resources | 89 | ||||
3.18 | State Development and Infrastructure | 90 | ||||
3.19 | Tourism and Sport | 94 | ||||
3.20 | Transport and Main Roads | 97 | ||||
3.21 | Treaty, Aboriginal and Torres Strait Islander Partnerships, Communities and the Arts | 117 | ||||
3.22 | Youth Justice | 122 |
Appendix A: | Entities included in capital outlays 2024–25 | 123 | ||||
Appendix B: | Key concepts and coverage | 126 | ||||
Appendix C: | Capital purchases by entity by region 2024–25 | 127 |
Capital Statement 2024-25
| 1 | Approach and highlights |
Features
| • | The Queensland Government is investing in a record level of economic and social infrastructure as it continues to deliver the transformational Big Build. The 2024-25 Queensland Budget will underpin the development of the state, with a total capital program of $107.262 billion over 4 years. |
| • | This investment will bring a generational change, creating more jobs, better communities and stronger regions. Over the 13 years to 2027–28, the government will have supported over $225 billion in infrastructure works. |
| • | In 2024–25, the government will invest $27.1 billion in capital, directly supporting around 72,000 jobs. A record $18.568 billion, or 68.5 per cent (up from 65.5 per cent in 2023-24) of this capital program will be invested outside of the Greater Brisbane region, supporting around 50,000 jobs. |
| • | Capital expenditure on health infrastructure in 2024–25 will total $2.167 billion with a focus on increasing bed capacity across the state. Queensland Health is committed to delivering an additional 3,378 beds by 2031–32 including more than 230 beds scheduled to come online in 2024–25. Work is continuing on the government’s $11.215 billion Capacity Expansion Program delivering around 2,200 additional beds. |
| • | Capital expenditure by the transport portfolio is budgeted to total $9.494 billion in 2024–25. This includes significant capital investment in rail, with $786 million towards the Queensland Train Manufacturing Program, $513.6 million to continue construction work on Cross River Rail, $500 million towards the Logan and Gold Coast Faster Rail project, $115 million towards the Beerburrum to Nambour Rail Upgrade (Stage 1) and $110.8 million towards the Direct Sunshine Coast Rail Line (Stage 1) funding commitment. There is also substantial ongoing investment to fund major upgrades to the Bruce Highway and the M1 Pacific Motorway, including $650 million towards construction on Coomera Connector (Stage 1). |
| • | In 2024–25, the government will invest $1.274 billion to ensure that facilities in Queensland’s state schools are world-class and continue to meet demand and support contemporary learning requirements. Investment in new schools is being facilitated through the Building Future Schools Program. |
| • | The 2024–25 Budget also includes a landmark capital investment of around $26 billion over the four years to 2027–28 to deliver the Queensland Energy and Jobs Plan, with Queensland’s publicly-owned energy businesses leading the state’s energy transformation. |
| • | In 2024–25, significant investments include $712 million for Powerlink to progress CopperString 2032, $800.7 million for Stanwell’s Wambo and Tarong West Wind Farms, $500 million for CS Energy’s Lotus Creek Wind Farm, $274.8 million for CleanCo’s Swanbank Battery and $935.9 million for Queensland Hydro to progress the Borumba Pumped Hydro Energy Storage. |
1
Capital Statement 2024-25
| • | Major seaport capital projects in 2024–25 include finalisation of the $251.2 million Port of Townsville Channel Capacity Upgrade, the $360 million expansion of the Cairns Marine Precinct, the $116 million Northern Land Expansion at Gladstone Port and initial works for North Queensland Bulk Ports to progress the Bowen Wharf replacement project. |
| • | Through state-owned water businesses, the Queensland Government is delivering increased water security, fortifying the flood resilience of water infrastructure and ensuring the ongoing safety and reliability of dams. Major investments in 2024–25 include $311.1 million for the Fitzroy to Gladstone Pipeline, $26.1 million for the Mount Crosby Flood Resilience Program, $56 million to deliver the Toowoomba to Warwick Pipeline, and $303.4 million towards the dam improvement programs of Sunwater, Seqwater and the Gladstone Area Water Board. |
| • | To address ongoing pressures in the state’s housing system, the government is implementing its housing plan, Homes for Queenslanders, backed by an investment of over $3 billion. This represents a significant uplift on top of the already major investment in social and affordable housing, with total investment by the government for social and affordable housing infrastructure increasing to $1.125 billion in 2024–25. |
| • | The government is investing in initiatives to meet demand pressures facing the correctional and detention systems. This includes $627.6 million over 5 years from 2023–24 for the new youth detention centre at the Woodford Correctional Precinct and $97.3 million in 2024–25 to complete the $885.3 million Lockyer Valley Correctional Centre. |
| • | The government is continuing to implement the Women’s Safety and Justice Taskforce, Hear her voice – Report one – Addressing coercive control and domestic and family violence in Queensland recommendations, including $49.1 million over 4 years from 2022-23 to complete capital upgrades to court rooms. |
| • | A key element of the government’s capital program is providing grants to local governments and non-government organisations to support their work in communities across Queensland. In total, the government will provide $4.142 billion in capital grants in 2024–25, including $2.707 billion outside of the Greater Brisbane region. This includes more than $1.281 billion to support the Queensland Government program of infrastructure renewal and recovery within disaster-affected communities. |
2
Capital Statement 2024-25
| 1.1 | Introduction |
The Capital Statement presents an overview of the Queensland Government’s infrastructure delivery program and proposed capital outlays for 2024–25.
The Queensland Government is continuing to deliver its flagship Big Build capital program, investing in infrastructure to provide vital services for a growing state. The 2024–25 capital program is a record investment across a range of asset classes, regions and sectors. This includes investment in new and ongoing projects in health, transport, the clean energy transformation, education and social and affordable housing.
The $27.1 billion of investment outlined in the 2024–25 Capital Statement is estimated to directly support around 72,000 jobs, with 50,000 of these jobs located outside of the Greater Brisbane region.
Cost pressures
Nationally, a combination of strong demand with ongoing domestic and international supply chain disruptions has resulted in increases in construction costs and prices. Queensland is not immune to these challenges.
Building construction costs in Queensland, as published in the ABS Producer Price Index, have risen by 31.2 per cent over the 3-year period ended March quarter 2024. This has been an issue not only for Queensland. Nationally, building construction costs have increased by a similar amount of 27.6 per cent over the same period.
The government has responded to these challenges by using clear assessment frameworks to ensure economic benefits and costs are understood, alternative (non-infrastructure) solutions are assessed and delivery models reflect best practice. Appropriate contingency amounts are included in project budgets to minimise uncertainty over the final cost of projects.
Where costs have increased to levels beyond project budgets, managing these costs at a program level has provided further capacity to meet cost pressures. Where program and project management practices have been exhausted, the government has provided additional funding supplementation to deliver on the government’s commitments.
Across the 2023-24 and 2024-25 budgets, supplementation of over $2 billion has been provided for cost escalation where it could not otherwise be managed within agency budgets, including transport, housing, education and health.
The government remains committed to maximising the benefits for Queenslanders by using best practices in procurement to support local jobs and businesses and drive economic and social outcomes. The government is delivering the 2024–25 capital program in partnership with suppliers that can ensure projects deliver on best practice industrial relations, including adopting modern and progressive industrial relations practices and ensuring terms of employment are at least equivalent to best practice industry conditions.
Government must continue to provide vital services and invest in strengthening and diversifying our economy and meet the needs of a growing population in the face of these increasing costs and infrastructure capacity constraints.
3
Capital Statement 2024-25
| 1.2 | Queensland’s infrastructure frameworks |
The Queensland Government’s infrastructure frameworks focus on achieving robust capital planning, quality investment decisions and economic development.
The government has established the Big Build Cabinet Committee to provide oversight of the capital program. This will ensure that infrastructure programs and proposals reflect the priorities of the government and that infrastructure is delivered in line with those priorities.
The government’s infrastructure frameworks and planning processes are critical in prioritising the continued delivery of this infrastructure program. This is informed by, and responding to, the latest population projections from the Queensland Government Statistician’s Office.
State Infrastructure Strategy
The State Infrastructure Strategy (SIS) sets the vision and statewide priorities for infrastructure. It provides a framework for how the Queensland Government will plan and invest in infrastructure over the 20-year period to 2042. The SIS was developed with infrastructure providers and informed by industry and the community, aligning priorities across agencies while also seeking partnerships with all levels of government and the private sector.
State-significant priorities and initiatives focus on realising infrastructure opportunities and addressing challenges that Queensland will face into the future.
Regional Infrastructure Plans
Queensland is a diverse state and its regions have different priorities. Supporting the SIS, the introduction of 7 Regional Infrastructure Plans (RIPs)/Regional Infrastructure Supplements covering all of Queensland recognises the significant role infrastructure plays in catalysing regional economic resilience, growth and liveability.
As one of the SIS priority actions, these plans are being progressively developed as part of a coordinated program, alongside statutory regional plan reviews and Regional Transformation Strategies, in consultation with stakeholders (industry, peak bodies and local government) through a place-based approach to help prioritise regionally significant infrastructure needs.
The Queensland Government Infrastructure Pipeline
The Queensland Government Infrastructure Pipeline (QGIP) provides industry with visibility of the government’s infrastructure pipeline, creating confidence and enabling workforce planning. QGIP complements the SIS and RIPs and demonstrates the government’s commitment to delivering Queensland’s infrastructure needs.
4
Capital Statement 2024-25
Infrastructure Proposal Development Policy
The Infrastructure Proposal Development Policy (IPDP) sets the government’s objectives for planning and assessing major infrastructure, including:
| • | aligning agency infrastructure programs with whole-of-government objectives to maximise outcomes for the state |
| • | supporting agencies to mature their infrastructure planning and assessment capabilities |
| • | providing targeted assistance and assurance advice to agencies on major infrastructure proposal development |
| • | ensuring frameworks and systems are in place and applied to give government confidence in infrastructure investment decisions. |
Project Assessment Framework
The Project Assessment Framework (PAF) is used across the Queensland Government to ensure a common and rigorous approach to assessing projects at critical stages in their development lifecycle.
The PAF is administered by Queensland Treasury and applied by government departments to evaluate proposals for infrastructure projects and proposals for the procurement of goods and services. The PAF may also be used by other government entities when developing and implementing project assessment methodologies.
Business Case Development Framework
The Business Case Development Framework (BCDF) supports the implementation of the PAF by providing agencies with detailed guidance and tools to complete assessment and assurance of infrastructure proposals. The BCDF informs the development of proposals from early assessment stages through to detailed business case stage. It is scalable and can be applied to all infrastructure proposals.
The BCDF ensures that major infrastructure proposals are thoroughly assessed to provide a firm basis for government investment decisions. The BCDF guidance materials and templates are published and maintained by the Department of State Development and Infrastructure.
5
Capital Statement 2024-25
| 1.3 | Key capital projects and programs |
Queensland Health Capacity Expansion Program
As Queensland’s population expands, so does the demand on the health system. In the 2024-25
Budget, the Queensland Government is providing a $1 billion boost to this program to optimise patient flow within hospitals, reduce wait times and improve healthcare delivery.
Along with additional funding committed by the Australian Government and philanthropic contributions to the Queensland Cancer Centre, the Capacity Expansion Program now totals $11.215 billion over 6 years to deliver around 2,200 additional overnight beds at 15 facilities across the Queensland health system:
| • | New Bundaberg Hospital |
| • | New Coomera Hospital |
| • | New Toowoomba Hospital |
| • | New Queensland Cancer Centre |
| • | Cairns Hospital expansion |
| • | Hervey Bay Hospital expansion |
| • | Ipswich Hospital expansion |
| • | Logan Hospital expansion |
| • | Mackay Hospital expansion |
| • | Princess Alexandra Hospital expansion |
| • | QEII Hospital expansion |
| • | Redcliffe Hospital expansion |
| • | Robina Hospital expansion |
| • | The Prince Charles Hospital expansion |
| • | Townsville University Hospital expansion. |
Accelerated Infrastructure Delivery Program
Queensland Health is continuing to deliver the Accelerated Infrastructure Delivery Program to increase bed capacity by 289 overnight beds across several projects. In 2024-25, works continue at the Ripley Satellite Hospital site on the Sub-Acute Expansion and Multi-Storey Car Park, and at the Gold Coast University Hospital on the Sub-Acute Expansion.
Regional, Rural and Remote Health Infrastructure
To ensure Queenslanders receive world-class health care no matter where they live, Queensland Health continues to invest in health infrastructure, capital works and projects across regional, rural and remote Queensland. In 2024-25, the government’s continued funding of the $943 million Building Rural and Remote Health Program (Phase 2) will see construction continue, including:
6
Capital Statement 2024-25
| • | Blackwater Multipurpose Health Service |
| • | Camooweal Primary Health Care Centre |
| • | Childers Multipurpose Health Service |
| • | Cow Bay Primary Healthcare Centre |
| • | Doomadgee Hospital |
| • | Millmerran Multipurpose Health Service |
| • | Moranbah Hospital Redevelopment |
| • | Normanton Hospital |
| • | Pormpuraaw Primary Health Care Centre |
| • | Tara Hospital |
| • | Staff Accommodation to support recruitment and retention in rural and remote areas |
| • | other rural and remote investments to replace, upgrade or expand aging infrastructure, including locations at Bamaga, Chinchilla, Hughenden, Jandowae, Laidley, Richmond, Home Hill, Badu Island, Boigu, Horn Island, Laura, Biloela, Lockhart River and Boonah. |
Cross River Rail
Cross River Rail is the largest transport project in South East Queensland. It is funded via a capital contribution of $6.349 billion along with private financing of $1.499 billion secured through a public private partnership.
This transformative transport project involves a new 10.2 kilometre rail line from Dutton Park to Bowen Hills, including 5.9 kilometres of twin tunnels under the Brisbane River and CBD and 4 new high capacity underground stations (at Boggo Road, Woolloongabba, Albert Street and Roma Street).
The Cross River Rail project is being delivered in partnership with the private sector through 2 major infrastructure packages of work: Tunnel, Stations and Development (TSD) with Pulse Consortium through a public private partnership; and Rail, Integration and Systems (RIS) through an alliance model with Unity Alliance.
The project will also support the introduction of a new world-class signalling system, the
European Train Control System (ETCS), which will allow trains to run more frequently, efficiently and with improved safety.
Each of Cross River Rail’s high-capacity stations will generate unique opportunities for urban renewal, economic development, inner-city precinct revitalisation and new employment.
Cross River Rail is into its fifth year of major construction, with work underway at 17 worksites across South East Queensland.
Cross River Rail is estimated to support up to 7,700 full-time equivalent jobs and 450 new apprenticeship and traineeship opportunities during construction.
7
Capital Statement 2024-25
Queensland Transport and Roads Investment Program
The Queensland Transport and Roads Investment Program (QTRIP) is a four-year program released annually outlining current and planned investments in transport infrastructure. QTRIP spans road, rail, bus, cycling and marine infrastructure on freight, commuter and recreational networks. QTRIP includes works for the Department of Transport and Main Roads, Queensland Rail and the Gold Coast Waterways Authority.
The program of works detailed in QTRIP 2024-25 to 2027-28 represents a $37.4 billion investment over the 4 years. QTRIP is developed in accordance with funding allocations identified by the Queensland and Australian Governments in their annual budgets, which align to both governments’ policy objectives and agendas. The strategic intent of QTRIP is shaped by state infrastructure planning processes and specific transport strategies and plans developed in accordance with state legislation.
M1 Pacific Motorway Upgrades and Coomera Connector
A safe, efficient and reliable M1 Pacific Motorway plays an important role in driving productivity and competitiveness across South East Queensland. The program of works, jointly funded by the Queensland and Australian Governments, is delivering major projects, such as the Varsity Lakes (Exit 85) to Tugun (Exit 95) upgrade, Eight Mile Plains to Daisy Hill upgrade and the Exit 49 interchange upgrade at Pimpama. The Queensland and Australian Governments have also committed $1 billion towards upgrades between Daisy Hill and the Logan Motorway.
The M1 program of works is complemented by the Queensland and Australian Governments’ commitment of $3.026 billion (on a 50:50 basis) to plan and construct Coomera Connector (Stage 1) between Coomera and Nerang. Coomera Connector (Stage 1) will provide an alternative route for the growing communities and commercial hubs of Helensvale and Coomera. This includes an additional $864 million committed by both the Queensland and Australian Governments on a 50:50 basis to deliver the project. This brings the state’s total contribution to $1.513 billion, to ensure the project can be delivered for the community.
Bruce Highway Upgrades
The Bruce Highway is Queensland’s major north-south freight and commuter corridor, connecting coastal population centres from Brisbane to Cairns over almost 1,700 kilometres. The Queensland Government will continue to work with the Australian Government to deliver the Bruce Highway Upgrade Program, aimed at improving safety, flood resilience and capacity along the length of the highway.
8
Capital Statement 2024-25
The 2024-25 capital program includes investment towards several key projects on the Bruce Highway, improving safety and access and supporting jobs across the regions, including the following example investments (noting the total budgets):
| • | $1.730 billion to construct the Rockhampton Ring Road |
| • | $1.162 billion to construct Cooroy to Curra (Section D) |
| • | $948 million for the upgrade between the Gateway Motorway and Dohles Rocks Road (Stage 1) |
| • | $733 million funding commitment towards the upgrade between Anzac Avenue and Uhlmann Road |
| • | $336 million towards a bypass of Tiaro, to increase the flood immunity, safety and efficiency of the Bruce Highway |
| • | $290 million for the upgrade between Dohles Rocks Road and Anzac Avenue (Stage 1). |
Gold Coast Light Rail (Stage 3)
The Australian Government ($395.6 million contribution), Queensland Government
($713.3 million contribution) and City of Gold Coast ($110.1 million contribution) are co-funding the project, with a total project cost of $1.219 billion.
Stage 3 of Gold Coast Light Rail will connect to the existing Gold Coast Light Rail network (from Helensvale to Broadbeach South), delivering a 6.7-kilometre extension from Broadbeach South to Burleigh Heads and providing 8 additional stations.
Logan and Gold Coast Faster Rail (Kuraby to Beenleigh) Upgrade
The Australian Government and Queensland Government have committed a total of $5.75 billion (on a 50:50 basis) towards the Logan and Gold Coast Faster Rail (Kuraby to Beenleigh) upgrade.
To support growing population and rail patronage demand between Brisbane, Logan and the Gold Coast, the number of Beenleigh and Gold Coast train services needs to be doubled over the next 20 years. The rail line between Kuraby and Beenleigh is a capacity bottleneck on the rail corridor.
The Logan and Gold Coast Faster Rail project will increase the number of tracks from 2 to 4 and allow the free movement of both all-stops and express trains, so that more of our fastest services can run more frequently and more reliably.
The project will also improve train station accessibility by upgrading stations between Kuraby and Beenleigh, removing 5 level crossings, improving park ‘n’ ride facilities and providing a new continuous active travel path connecting to stations along the 20-kilometre section of upgraded tracks.
By connecting the largest centres in South East Queensland, the Gold Coast rail line will also play a significant role in servicing the travel needs of the Brisbane 2032 Olympic and Paralympic Games.
9
Capital Statement 2024-25
Queensland Train Manufacturing Program
The Queensland Government’s Queensland Train Manufacturing Program (QTMP) was established to meet the increasing demand for rail transport in South East Queensland over the next 10 years.
The QTMP will build 65 new 6-car passenger trains at a purpose-built manufacturing facility at Torbanlea, in the Maryborough region. As part of the program, a new rail facility will also be constructed at Ormeau, in the Gold Coast region.
The QTMP will support South East Queensland’s population and economic growth, as well as Cross River Rail and the Brisbane 2032 Olympic and Paralympic Games.
Construction of the facilities, trains and maintenance of the fleet will support Queensland jobs now and into the future. The program brings with it a pipeline of training and development opportunities to Queensland.
The Queensland Government has committed $4.869 billion for the manufacturing phase of the QTMP.
Direct Sunshine Coast Rail Line (Stage 1)
The Direct Sunshine Coast Rail Line will transform travel to and from the Sunshine Coast, making the peak-hour commute by train between Brisbane and Caloundra 45 minutes faster than by car.
The Direct Sunshine Coast Rail Line will extend the South East Queensland rail network from the North Coast Line at Beerwah to Maroochydore. The first stage will see a 19-kilometre dual track built from Beerwah to Caloundra, making it the longest spur line in the south-east passenger rail network. Stage 1 will also see protection of the updated rail alignment all the way to Maroochydore and includes further planning, design and engagement with the market to confirm delivery costs and timeframes to deliver the Direct Sunshine Coast Rail Line to Birtinya. Stage 1 also includes enhancements to the bus network and new active transport facilities, to ensure communities around the Sunshine Coast have convenient and reliable connections to the stations.
The Queensland and Australian Governments have each committed $2.75 billion to deliver the first-stage of the rail line from Beerwah to Caloundra by 2032. Stage 1 is expected to cost between $5.5 billion to $7 billion, with cost estimates to be finalised following further design development, market engagement and procurement.
The project is now in pre-delivery and major construction activities are expected to commence in 2026.
Beerburrum to Nambour Rail Upgrade (Stage 1)
The Beerburrum to Nambour (B2N) rail upgrade will provide a range of benefits for the community by increasing track capacity and improving reliability on the North Coast Line for passengers and freight in the growing Sunshine Coast region.
Works are progressing well on Stage 1 of B2N rail upgrade with preconstruction and design works currently underway for the main construction works. These works will duplicate the North Coast Line between Beerburrum and Beerwah, address level crossings on the alignment, expand the park ‘n’ ride facility in Beerburrum and undertake associated road works. B2N early works completed in August 2023 delivered new park ‘n’ ride facilities at Landsborough and Nambour
10
Capital Statement 2024-25
stations – creating 350 additional car parks, a new bus interchange at Landsborough station and a realigned one-kilometre section of Steve Irwin Way near Glass House Mountains. The timing for delivery and staging of construction works will be finalised following the completion of detailed design and after a construction contract is awarded.
The Australian and Queensland Governments have now committed $1.004 billion towards the Beerburrum to Nambour Rail Upgrade (B2N) Stage 1, including a commitment of $387.5 million from the Queensland Government. Future stages of the Beerburrum to Nambour Rail Upgrade will be confirmed as part of the $6.3 million duplication study. This study will review demand to develop a blueprint for investment on the North Coast Line beyond the completion of B2N Stage 1 to 2046. The pathway to full duplication will also be considered within this study.
Social and Affordable Housing
The Queensland Government’s recently announced housing plan, Homes for Queenslanders, sets a target of one million new homes by 2046, including 53,500 social homes. This is not a task the Queensland Government can deliver alone. It will work with the Australian Government and the community housing sector to deliver homes for Queenslanders.
Importantly, this new commitment reinforces previous social housing investment made by the Queensland Government. Since July 2021, the QuickStarts Queensland program has commenced 2,357 social homes, with 929 homes delivered and a further 560 homes in construction. The total social housing capital program in 2024-25 is almost 52 per cent greater than the 2023-24 housing capital program budget, including capital grants.
At the Queensland Housing Summit in October 2022, the Queensland Government boosted the Housing Investment Fund (HIF) to $2 billion. Under the expanded HIF, $130 million per annum is available to support an increased target of 5,600 new social and affordable home commencements by 30 June 2027. As at 30 April 2024, 846 social and affordable homes supported by the HIF have commenced. This includes 295 homes in construction and 375 homes which are delivered providing housing for approximately 675 people.
Southport Supportive Accommodation Project
As part of the 2024-25 Queensland Budget, the government has committed to the development of the Southport Supportive Accommodation Project. Importantly, this will be delivered on the Gold Coast, a region experiencing some of the greatest housing pressures across the state.
The Southport Supportive Accommodation Project will deliver approximately 200 social and affordable dwellings, subject to final design, to support people experiencing or at risk of homelessness and those experiencing housing instability. It will assist some of the community’s most vulnerable cohorts including older women and women who have experienced domestic and family violence.
The Southport Supportive Accommodation Project will be underpinned by a best-practice supportive housing model. It will include wrap-around services for people with high needs and offer onsite support services to residents and specialised tenancy management support.
The Southport Supportive Accommodation Project forms part of the Queensland Government’s Homes for Queenslanders plan, which is targeting 53,500 social homes by 2046, including supported accommodation places.
11
Capital Statement 2024-25
Government Employee Housing
In 2024-25, the Queensland Government will invest $162.9 million to deliver secure and fit-for-purpose government employee housing in remote and regional communities, as part of its commitment to attract and retain key frontline staff.
This program will include new accommodation for staff delivering critical services, replacement or refurbishment of residences at the end of their useful life to modern design standards. It will also include the upgrade of residences to ensure they remain of an appropriate amenity for government workers in locations across Queensland.
New School Infrastructure
Through the Building Future Schools Program, the government is delivering new state schools in high-growth areas across Queensland.
The government has delivered 27 new schools since 2015 and a further 2 new schools will open in 2025.
The Department of Education is planning for the delivery of more new schools and additional classrooms to meet expected enrolment growth into the future. This year’s Budget includes $334 million over 4 years to deliver new and upgraded, fit-for-purpose, learning environments that support educational outcomes.
Queensland Energy and Jobs Plan
The Queensland Energy and Jobs Plan (QEJP) outlines the pathway over the next 10 to 15 years to transform Queensland’s energy system to deliver clean, reliable and affordable power, create a platform for strong economic growth and continued investment, and support the achievement of the state’s renewable energy and emissions reduction targets.
Through publicly-owned energy entities, the 2024-25 capital program continues to deliver on the QEJP with investments across a range of renewable energy, storage and network projects that will support the decarbonisation of the State’s energy system, including:
| • | $712 million for Powerlink to continue delivery of the CopperString 2032 transmission line from Townsville to Mt Isa, connecting the Queensland North West Minerals Province to the national electricity grid |
| • | $935.9 million for Queensland Hydro to progress the 2 gigawatt, 24-hour Borumba Pumped Hydro Energy Storage project |
| • | $500 million for CS Energy to invest in the 285 megawatt Lotus Creek Wind Farm in Central Queensland |
| • | $424 million for Stanwell to develop the 436.5 megawatt Tarong West Wind Farm near Kingaroy |
| • | $376.7 million for Stanwell to develop Stages 1 and 2 of the Wambo Wind Farm near Dalby, with a combined capacity of 506 megawatts, in partnership with global renewables developer, Cubico |
| • | $369.9 million for Stanwell to develop the 300 megawatt, 4-hour Central Renewable Energy Zone Battery at Stanwell Power Station – Queensland’s largest grid-scale battery project |
12
Capital Statement 2024-25
| • | $274.8 million for CleanCo to continue construction of the 250 megawatt, 2-hour Swanbank Battery |
| • | $254.7 million for Energy Queensland to continue delivery of the Local Network Battery Plan across Queensland |
| • | $174.3 million for CS Energy develop the 228 megawatt Boulder Creek Wind Farm near Rockhampton |
| • | $131.4 million for CS Energy to develop the 200 megawatt, 2-hour Greenbank Battery. |
Borumba Pumped Hydro Energy Storage
In 2023-24, the Queensland Government proceeded with the 2 gigawatt, 24-hour Borumba Pumped Hydro Energy Storage project located southwest of Gympie. This project will be delivered by the Queensland Government-owned Queensland Hydro and is a cornerstone investment of the QEJP. The project, which is subject to final approvals by the Queensland and Australian Governments, plays a fundamental role in meeting the Queensland Government’s renewable energy and emission reduction targets.
The total cost to deliver the Borumba Pumped Hydro Energy Storage project is estimated to be
$14.159 billion. The 2023–24 Queensland Budget approved up to $6 billion in equity funding over the project’s construction phase. In 2024–25, Queensland Hydro is investing $935.9 million to progress approvals, continue exploratory works and procure the main works for this project.
In addition to supporting the transition of Queensland’s electricity grid towards renewables, the project will provide benefits to the local economy. The construction workforce will peak at over 2,000. Exploratory works are expected to continue through 2024–25, with main works targeted to commence in 2025.
Pioneer-Burdekin Pumped Hydro Energy Storage
In 2023-24, the Queensland Government provisioned $1 billion of equity to support the assessment, feasibility and progress of the Pioneer-Burdekin Pumped Hydro Energy Storage project located west of Mackay. This work will continue in 2024-25, with staged construction expected to commence in 2026-27 subject to a final investment decision.
CopperString 2032
The Queensland Government is investing $5 billion in CopperString 2032, a transmission line from Townsville to Mount Isa that will connect Queensland’s North West Minerals Province to the national electricity grid. In 2024-25, Powerlink is investing $712 million on construction works for the project.
This project, to be delivered by Queensland Government-owned Powerlink, will unlock one of Australia’s largest renewable energy zones and potentially more than $500 billion in new critical minerals in North Queensland. It will connect vast renewable wind and solar resources with critical minerals mining and processing that can be used to make batteries and renewables. CopperString 2032 has the potential to support around 800 direct jobs during construction (to 2029) and thousands more in critical minerals mining and renewable energy industries.
In October 2023, the government announced a $1.3 billion Delivery Launch Package to progress the project, which is supporting early works and construction later in 2024. Through this package, Powerlink is establishing 100 permanent project jobs, procuring electrical equipment, undertaking
13
Capital Statement 2024-25
site investigations and detailed planning and design activities, and advancing site infrastructure works, including camps and access works.
This project will support the QEJP and the State’s transition to clean, reliable and affordable power.
Works for Queensland
The $1.1 billion Works for Queensland program will continue to support local governments outside South East Queensland by funding job-creating maintenance and minor infrastructure projects relating to assets owned or controlled by local governments. In 2024-25, $124.5 million will be delivered towards Works for Queensland projects.
Disaster Resilience Program
As one of the most disaster impacted states in Australia, it is imperative to help local Queensland communities better prepare for future natural disasters. Increasing the resilience of infrastructure and investing in innovative programs to lessen the impacts of natural disasters means that communities can recover more quickly after a natural disaster strikes.
The Queensland Reconstruction Authority (QRA) will administer a suite of programs in 2024-25 aimed at promoting disaster recovery and resilience of Queensland communities.
QRA will allocate $38.2 million in 2024-25 as part of $95.4 million to be administered over 3 years towards high priority disaster resilience and mitigation infrastructure projects jointly funded by the Queensland and Australian Governments from Disaster Recovery Funding Arrangements efficiencies.
A further $6.7 million is allocated in 2024-25 towards 6 projects worth $16.8 million being delivered over 3 years, to assist recovery and post-disaster initiatives in communities significantly impacted by the South East Queensland Rainfall and Flooding event, funded by the Australian Government’s Emergency Response Fund.
The $10 million North Queensland Natural Disaster Mitigation Program will allocate $2 million in 2024-25 to help local governments in North and Far North Queensland reduce their disaster risk and assist in reducing the growth of insurance costs for residents, businesses and the community.
Lockyer Valley Correctional Centre
In 2023, the Southern Queensland Correctional Precinct - Stage 2 was formally named the Lockyer Valley Correctional Centre in recognition of the region in which it is located. Construction of the over 1,500-bed facility commenced in early 2021 and will continue into 2024–25, with the centre forecast to commence commissioning in late 2024.
Upon completion, the $885.3 million centre will continue to provide significant economic benefits to the Lockyer Valley region, with more than 900 operational staff required, including custodial correctional officers, trade instructors, psychologists, occupational therapists and social workers.
This new state-of-the-art facility will enable a health and rehabilitation operating model, which will help to address complex prisoner needs such as mental health and substance abuse and reduce the risk of reoffending. It will also ease overcrowding across Queensland’s correctional services system and deliver a safer environment for staff, prisoners and the community.
14
Capital Statement 2024-25
Domestic and Family Violence Courthouse Improvements
As part of the continued response to the Queensland Women’s Safety and Justice Taskforce,
Hear her voice – Report one – Addressing coercive control and domestic and family violence in Queensland, the Queensland Government is committed to a range of domestic and family violence (DFV) courthouse capital upgrades to support enhanced delivery of DFV services at selected locations. These capital improvements to existing courthouse infrastructure will make facilities functional, client-centred and trauma-informed and support the safety of victims of domestic and family violence attending court.
This includes $49.1 million over 4 years from 2022-23 to complete DFV capital upgrades to
Mackay, Ipswich, Cairns, Caboolture, Maroochydore, Toowoomba, Rockhampton and Brisbane courthouses, including new DFV courtrooms and safe rooms, reconfigured registry counters, public waiting areas and interview rooms, improved stakeholder facilities, public amenities and security infrastructure, to maximise victim safety.
Construction was completed at Ipswich and Caboolture Courthouses in 2023-24. Construction is anticipated to commence in 2024-25 at the remaining sites.
Youth Detention Centre
The government will continue to progress work on a new youth detention centre for Queensland. The facility will be built at the Woodford Correctional Precinct, north west of Brisbane, with a projected construction cost of $627.6 million over 5 years from 2023-24.
Construction of the new 80-bed youth detention centre at Woodford commenced in early 2024, with Stage 1 of the centre expected to be complete by 2026.
The centre will include therapeutic design elements aimed at supporting the rehabilitation of young people and improving community safety. These include smaller, home-like accommodation units; consultation and treatment rooms; multi-purpose spaces for education, skills development, and training; and areas for physical activity. The design of the centre also considers and incorporates First Nations knowledge and culture. The Jinibara People Aboriginal Corporation provided guidance and expertise on important elements, including spaces for community, cultural connection and green spaces and landscaping.
The government is also providing additional funding for the construction of a 40-bed youth detention centre at Cairns, however expenditure for this measure is subject to commercial negotiations.
Port of Townsville Channel Capacity Upgrade
Delivery of the Townsville Channel Capacity Upgrade (TCCU), which commenced in early 2019, is nearing completion with the dredging component of works concluding in March 2024 and reclamation area works continuing throughout 2024. The TCCU, the largest infrastructure project in the port’s history, widens the shipping channel to allow access for larger vessels and facilitate future trade growth in the region.
The TCCU project is jointly funded by the Queensland and Australian Governments and the Port of Townsville Limited (POTL), and forms part of the Townsville City Deal signed in December 2016. The total project cost of the TCCU project is $251.2 million with the Queensland Government contributing $105 million, the Australian Government committing $75 million, and
15
Capital Statement 2024-25
POTL funding the remainder. The TCCU project will continue to support the local economy and jobs, with more than 2,000 people having worked on the project to-date.
Gladstone Port Northern Land Expansion Project
The Queensland Government committed $100 million in the 2023–24 Budget for Gladstone Ports Corporation Limited to facilitate the $116 million Port of Gladstone Northern Land Expansion Project.
Funded through coal royalty revenues, the Northern Land Expansion Project involves construction of a bund wall for development of a new reclamation area at the port’s Northern Trade Precinct near Fisherman’s Landing. This development supports the release of additional land at the Port of Gladstone for prospective users and will facilitate the development of renewable energy projects such as hydrogen and other industries.
Cairns Marine Precinct – Common User Facility
The Queensland Government has committed $180 million to deliver an expansion of the Cairns Marine Precinct with the development of a Common User Facility delivered by Far North Queensland Ports Corporation Limited. The proposed Common User Facility will include a 5,000 tonne shiplift, a new wharf, 3 hardstand areas and 2 blast and paint sheds.
The Queensland Government is working with the Australian Government, which has committed to a co-contribution of $180 million, bringing total funding to $360 million to progress the project.
This investment, including $37 million in 2024–25, will help diversify the Cairns economy and take advantage of emerging commercial and defence-related opportunities for the precinct as an Australian Navy Regional Maintenance Centre. It will ensure that the Port of Cairns continues to be the leading maintenance, repair and overhaul facility in Northern Australia.
Bowen Wharf replacement project
In the 2023–24 Budget, the Queensland Government committed $50 million from coal royalty revenues for North Queensland Bulk Ports Corporation to progress plans, designs and approvals for the replacement of the Bowen Wharf which is nearing the end of its useful life.
Following extensive consultation with stakeholders on design options, the 2024–25 Budget includes $2 million to progress detailed design works and approvals to replace the Bowen Wharf. Construction works are planned to occur between 2025 and 2028.
Dam Improvement Program
To ensure state-owned dams continue to operate safely during extreme weather events, the 2024–25 Budget allocates $303.4 million to the Dam Improvement Programs of Sunwater, Seqwater and Gladstone Area Water Board. This includes further planning, early and enabling works, and commencement of major improvement works.
Construction is expected to commence later this year on the Lake Macdonald Dam improvement project, with budgeted expenditure of $71.4 million in 2024–25.
The Queensland Government has allocated $540 million towards raising and improving Burdekin Falls Dam. The 2-metre raise will create an additional 150,000 megalitres of water supply, supporting long-term economic development in North Queensland. Sunwater is forecasting expenditure of $73.9 million in 2024–25 to continue planning and preconstruction activities, including finalising the Environmental Impact Statement process.
16
Capital Statement 2024-25
The 2024–25 Budget also supports the government’s commitment to build a new Paradise Dam wall, with $109.6 million allocated to continue planning and enabling works in 2024–25. The Queensland and Australian Governments have each committed $600 million to the project, which will ensure safe and secure water supply to support economic growth in the Bundaberg region. Planning work and preconstruction activities will also continue for future upgrades to Somerset, Wivenhoe, North Pine and Awoonga Dams.
South West Pipeline
The $95.2 million South West Pipeline project is nearing completion and will be the largest addition to the South East Queensland Water Grid since completion of the Northern Pipeline Interconnector in 2012.
The 24-kilometre pipeline will connect Beaudesert to the South East Queensland Water Grid to improve regional water security as well as supporting the Bromelton State Development Area. Up to 100 jobs were supported during construction which is on track to be completed in mid–2024.
Toowoomba to Warwick Pipeline (formerly the Southern Downs Drought Resilience Package)
The Queensland Government committed $273.1 million for construction of the Toowoomba to Warwick Pipeline, part of a more than $300 million investment into water security in the Toowoomba and Southern Downs regions. The project will provide a permanent water supply to 3,400 residents in parts of the Toowoomba region and a much-needed drought contingency supply to 24,000 residents in the Southern Downs region.
Seqwater is delivering the pipeline, with an average of 400 jobs during construction, and targeted completion in 2026–27.
Mount Crosby Flood Resilience Program
The 2024–25 Budget provides $26.1 million of investment for projects under Seqwater’s Mount Crosby Flood Resilience Program.
This program is delivering major works to improve the flood resilience of critical infrastructure located at Mount Crosby, including the replacement and relocation of the existing East Bank substation, construction of a new 2-lane road bridge adjacent to the Mount Crosby Weir which was completed earlier this year and electrical upgrades to the East Bank Pump Station.
Fitzroy to Gladstone Pipeline
The Fitzroy to Gladstone Pipeline is a 117-kilometre raw water pipeline with capacity to transfer 30 gigalitres of water per annum from the Lower Fitzroy River to Gladstone. The pipeline will provide long term water security to Gladstone’s large industrial base and its urban areas. The pipeline is also expected to meet some early-stage water demands of the region’s emerging clean energy industry, including hydrogen.
The Queensland Government has approved $550 million of equity funding and a capital grant of up to $365 million in 2023-24, along with debt funding from the Gladstone Area Water Board, to complete and operationalise the pipeline which will also support an estimated 400 jobs during construction. Expenditure to 30 June 2024 is estimated at $592 million. Gladstone Area Water Board will deliver and operate the pipeline. The pipeline is expected to be commissioned by mid-2026.
17
Capital Statement 2024-25
Brisbane 2032 Olympic and Paralympic Games
The 2024–25 Queensland Budget provides for total capital expenditure for Brisbane 2032 Olympic and Paralympic Games (Brisbane 2032) venues infrastructure of $7.1 billion over the 9 years to 2032–33 to be delivered by the Games Venue and Legacy Delivery Authority, once established.
Funding contributions have been agreed between the Queensland and Australian Governments for the jointly funded $7.1 billion venues infrastructure program to support the hosting of Brisbane 2032. The allocation of funding for specific venues projects is subject to government investment decisions following completion of project assessment activities.
Consistent with the government’s response to the Sport Venue Review, the venues infrastructure program comprises the Brisbane Arena ($2.5 billion), upgrades to the Queensland State Athletics Centre and refurbishment of the Gabba Stadium and Suncorp Stadium ($2.7 billion), and 15 new or upgraded venues under the Minor Venues Program ($1.9 billion). Of this, total funding of $560.6 million is allocated for minor venues works now in procurement, including Chandler Indoor Sports Centre ($214 million), Brisbane Aquatic Centre ($42.5 million), Sunshine Coast Indoor Sports Centre ($142.3 million), Sunshine Coast Mountain Bike Centre ($13.9 million) and Sunshine Coast Stadium ($147.9 million).
18
Capital Statement 2024-25
| 2 | 2024–25 Capital program overview |
| 2.1 | Introduction |
In this Budget, the Queensland Government has allocated a total of $27.1 billion in 2024–25 to provide productivity-enhancing economic and social infrastructure and a broad range of capital works projects across the state.
This investment will help create jobs, support Queensland businesses and grow the economy, including in Queensland’s vital regional areas. The 2024–25 capital program is estimated to directly support around 72,000 jobs across the state.
The 2024–25 capital program comprises $22.958 billion of purchases of non-financial assets (PNFA) and acquisitions of non-financial assets under finance leases, and $4.142 billion of capital grants expenses.
Importantly, the 2024–25 capital program demonstrates the government’s commitment to growing the state’s regions, with a record $18.568 billion, or 68.5 per cent (up from 65.5 per cent in 2023-24) of the capital program in 2024–25 to be spent outside of the Greater Brisbane region (Brisbane and Redlands, Logan and Ipswich), supporting an estimated 50,000 jobs across those regions.
The government’s capital program includes a range of critical infrastructure projects in the port, rail, water and energy sectors being delivered through the state’s Public Non-financial Corporations (PNFC) sector (that is, commercial entities of government, including government owned corporations).
19
Capital Statement 2024-25
| 2.2 | Capital purchases |
The Queensland Government is continuing to provide the essential economic and social infrastructure needed to support economic growth, deliver essential services, and ensure ongoing improvements in the quality of life enjoyed by Queensland’s growing population.
The 2024–25 capital program includes $22.958 billion of PNFA and acquisitions of non-financial assets under finance leases.
Capital purchases in 2024–25, categorised according to purpose, are outlined in Chart 1. Transport continues to account for the largest share of purchases. The significant investment in the Queensland Energy and Jobs Plan has increased the overall share of energy infrastructure to 35 per cent of capital purchases, followed by health.
| Chart 1 | Capital purchases by purpose 2024–25 |
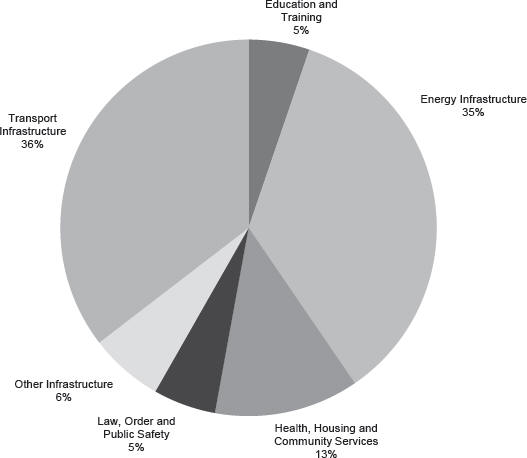
20
Capital Statement 2024-25
Table 1 outlines the capital purchases by Queensland Government entity, including the 2023–24 year (estimated actual) and the Budget for 2024–25. Transport and Main Roads has the largest proportion of total capital purchases.
| Table 1 | Capital purchases by Queensland Government entity1,2,3 |
Entity | 2023–24 Est. Actual $‘000 | 2024–25 Budget $‘000 | ||||||
Agriculture and Fisheries | 43,430 | 32,418 | ||||||
Child Safety, Seniors and Disability Services | 51,735 | 20,952 | ||||||
Education | 1,446,877 | 1,275,608 | ||||||
Employment, Small Business and Training | 82,302 | 95,656 | ||||||
Energy and Climate | ||||||||
Energy and Climate | 89,477 | — | ||||||
Energy Generation Sector | 2,118,974 | 4,121,091 | ||||||
Energy Transmission and Distribution | 3,488,987 | 4,564,497 | ||||||
Environment, Science and Innovation | 161,963 | 102,181 | ||||||
Housing, Local Government, Planning and Public Works | 612,720 | 757,341 | ||||||
Justice and Attorney-General | 48,805 | 75,985 | ||||||
Legislative Assembly of Queensland | 56,322 | 3,646 | ||||||
Premier and Cabinet | 331 | 1,060 | ||||||
Queensland Corrective Services | 395,856 | 227,906 | ||||||
Queensland Fire Department | 144,063 | 138,402 | ||||||
Queensland Health | 2,114,113 | 2,166,612 | ||||||
Queensland Police Service | 323,672 | 663,410 | ||||||
Queensland Treasury | 5,922 | 40,978 | ||||||
Regional Development, Manufacturing and Water | ||||||||
Regional Development, Manufacturing and Water | 7,463 | 3,500 | ||||||
Water Distribution and Supply | 920,154 | 1,034,256 | ||||||
Resources | 10,007 | 19,107 | ||||||
State Development and Infrastructure | 132,944 | 142,783 | ||||||
Tourism and Sport | 48,857 | 71,969 | ||||||
Transport and Main Roads | ||||||||
Transport and Main Roads | 5,521,683 | 6,273,337 | ||||||
Port Authorities | 196,819 | 281,321 | ||||||
Queensland Rail | 1,149,259 | 1,748,048 | ||||||
Cross River Rail Delivery Authority | 1,010,679 | 455,322 | ||||||
Treaty, Aboriginal and Torres Strait Islander Partnerships, Communities and the Arts | 97,585 | 130,487 | ||||||
Youth Justice | 33,110 | 221,114 | ||||||
Other agencies4 | 2,945 | 886 | ||||||
Other adjustments5 | (1,239,729 | ) | (1,112,013 | ) | ||||
Anticipated contingency reserve6 | (400,000 | ) | (600,000 | ) | ||||
|
|
|
| |||||
Total capital purchases | 18,677,325 | 22,957,860 | ||||||
|
|
|
| |||||
21
Capital Statement 2024-25
Total capital purchases breakdown | 2023–24 Est. Actual $‘000 | 2024–25 Budget $‘000 | ||||||
Consisting of: | ||||||||
Purchases of non-financial assets per Non-financial Public Sector Cash Flow Statement (BP2 Table 9.9) | 17,482,488 | 22,240,712 | ||||||
New leases | 1,194,837 | 717,148 | ||||||
|
|
|
| |||||
Total capital purchases | 18,677,325 | 22,957,860 | ||||||
|
|
|
| |||||
Notes
| 1. | Includes all associated statutory bodies. |
| 2. | Numbers may not add due to rounding. |
| 3. | The 2023-24 estimated actuals are presented on a post-machinery-of-government basis. |
| 4. | Includes other Government entities with non-material capital programs. |
| 5. | Representing inter-agency eliminations, movements in capital payable and receivable, funds held centrally, potential underspends in the PNFC sector and other accounting adjustments to align with Uniform Presentation Framework Statements. |
| 6. | Contingency recognises that for General Government there is likely to be under spending resulting in a carryover of capital allocations. |
22
Capital Statement 2024-25
Table 2 shows capital purchases by Regional Action Plan (RAP) region and statistical area. The government’s commitment to supporting growth in Queensland’s vital regional areas is highlighted by the fact that $15.861 billion (69.1 per cent) of capital purchases in 2024–25 will be spent outside of Greater Brisbane (Brisbane and Redlands, Logan and Ipswich).
| Table 2 | Capital purchases by RAP region and statistical area for 2024–251,2 |
Regional Action Plan region | Capital purchases $‘000 | Statistical area | Capital purchases $‘000 | |||||||||||
Brisbane and Redlands | 4,201,320 | 301 | Brisbane East | 420,869 | ||||||||||
| 302 | Brisbane North | 524,464 | ||||||||||||
| 303 | Brisbane South | 706,620 | ||||||||||||
| 304 | Brisbane West | 312,326 | ||||||||||||
| 305 | Inner Brisbane | 2,237,041 | ||||||||||||
Ipswich | 1,539,164 | 310 | Ipswich | 1,539,164 | ||||||||||
Wide Bay | 3,293,893 | 319 | Wide Bay | 3,293,893 | ||||||||||
Darling Downs | 1,605,102 | 307 | Darling Downs Maranoa | 941,858 | ||||||||||
| 317 | Toowoomba | 663,244 | ||||||||||||
Gold Coast | 2,410,056 | 309 | Gold Coast | 2,410,056 | ||||||||||
Logan | 1,356,433 | 311 | Logan Beaudesert | 1,356,433 | ||||||||||
Mackay-Whitsunday | 1,141,720 | 312 | Mackay | 1,141,720 | ||||||||||
Outback Queensland3 | 660,612 | 315 | Outback | 1,109,821 | ||||||||||
Far North Queensland3 | 1,323,679 | 306 | Cairns | 874,470 | ||||||||||
Central Queensland | 2,085,815 | 308 | Central Queensland | 2,085,815 | ||||||||||
Sunshine Coast | 1,037,197 | 316 | Sunshine Coast | 1,037,197 | ||||||||||
Moreton Bay | 1,045,672 | 313 | Moreton Bay North | 541,524 | ||||||||||
| 314 | Moreton Bay South | 504,147 | ||||||||||||
Townsville | 1,257,198 | 318 | Townsville | 1,257,198 | ||||||||||
|
| |||||||||||||
Total capital purchases | 22,957,860 | |||||||||||||
|
| |||||||||||||
Notes
| 1. | Numbers may not add due to rounding. |
| 2. | The anticipated capital contingency reserve and other adjustments have been spread across statistical areas proportionate to capital spends |
| 3. | $449,210,000 of capital purchases in Outback statistical area belong to the Far North Queensland RAP region. |
23
Capital Statement 2024-25
| 2.3 | Capital grants |
The Queensland Government provides a range of grants to non-government entities (i.e. not government departments or statutory bodies) and individuals for capital acquisitions.
Total capital grants are expected to be $4.142 billion in 2024–25, with Chart 2 below outlining the capital grants to local governments (LG) and non-government organisations (NGOs).
| Chart 2 | Capital grants by purpose and recipient |
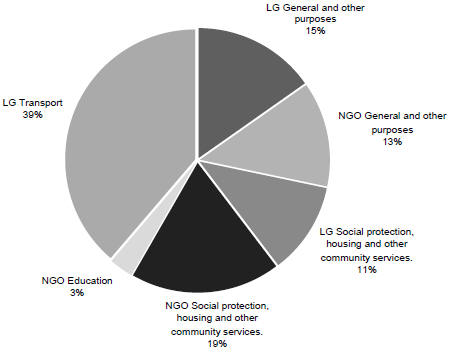
24
Capital Statement 2024-25
Table 3 shows the planned expenditure on capital grants by Queensland Government entity for 2024–25. Queensland Reconstruction Authority within Queensland Fire Department has the highest proportion of capital grants, followed by Housing, Local Government, Planning and Public Works.
| Table 3 | Expenditure on capital grants by Queensland Government entity1,2 |
Entity | 2023–24 Est. Actual $‘000 | 2024–25 Budget $‘000 | ||||||
Agriculture and Fisheries | 4,945 | 100 | ||||||
Child Safety, Seniors and Disability Services | 650 | 7,940 | ||||||
Education | 156,498 | 137,893 | ||||||
Employment, Small Business and Training | 11,822 | 2,475 | ||||||
Energy and Climate | 42,287 | 18,000 | ||||||
Environment, Science and Innovation | 41,455 | 51,925 | ||||||
Housing, Local Government, Planning and Public Works | 589,135 | 984,848 | ||||||
Premier and Cabinet | 5,759 | — | ||||||
Queensland Fire Department | 1,376,777 | 1,280,946 | ||||||
Queensland Police Service | — | 20,786 | ||||||
Queensland Treasury | 65,556 | 154,756 | ||||||
Regional Development, Manufacturing and Water | 123,279 | 147,171 | ||||||
Resources | — | 500 | ||||||
State Development and Infrastructure | 329,947 | 642,610 | ||||||
Tourism and Sport | 156,050 | 230,490 | ||||||
Transport and Main Roads | ||||||||
Transport and Main Roads | 534,859 | 678,009 | ||||||
Cross River Rail Delivery Authority | 25,053 | 58,254 | ||||||
Treaty, Aboriginal and Torres Strait Islander Partnerships, Communities and the Arts | 5,832 | 14,178 | ||||||
Other adjustments3 | 70,445 | (288,786 | ) | |||||
|
|
|
| |||||
Total capital grants | 3,540,349 | 4,142,095 | ||||||
|
|
|
| |||||
Notes
| 1. | Includes associated statutory bodies. |
| 2. | Numbers may not add due to rounding. |
| 3. | Includes assets transferred, funds held centrally and other technical accounting adjustments. |
25
Capital Statement 2024-25
Table 4 shows expenditure on capital grants by RAP region and statistical area. The government’s commitment to support growth in Queensland’s vital regional areas is highlighted by the fact that $2.707 billion (65.4 per cent) of capital grants in 2024–25 will be spent outside of Greater Brisbane (Brisbane and Redlands, Logan and Ipswich).
| Table 4 | Capital grants by RAP region and statistical area for 2024–251,2 |
Regional Action Plan region | Capital grants $‘000 | Statistical area | Capital grants $‘000 | |||||||||||
Brisbane and Redlands | 1,021,417 | 301 | Brisbane East | 175,186 | ||||||||||
| 302 | Brisbane North | 148,104 | ||||||||||||
| 303 | Brisbane South | 245,915 | ||||||||||||
| 304 | Brisbane West | 75,481 | ||||||||||||
| 305 | Inner Brisbane | 376,731 | ||||||||||||
Ipswich | 231,503 | 310 | Ipswich | 231,503 | ||||||||||
Wide Bay | 209,225 | 319 | Wide Bay | 209,225 | ||||||||||
Darling Downs | 323,435 | 307 | Darling Downs Maranoa | 235,127 | ||||||||||
| 317 | Toowoomba | 88,307 | ||||||||||||
Gold Coast | 344,274 | 309 | Gold Coast | 344,274 | ||||||||||
Logan | 182,013 | 311 | Logan Beaudesert | 182,013 | ||||||||||
Mackay-Whitsunday | 114,315 | 312 | Mackay | 114,315 | ||||||||||
Outback Queensland3 | 286,418 | 315 | Outback | 483,956 | ||||||||||
Far North Queensland3 | 471,166 | 306 | Cairns | 273,628 | ||||||||||
Central Queensland | 202,843 | 308 | Central Queensland | 202,843 | ||||||||||
Sunshine Coast | 268,497 | 316 | Sunshine Coast | 268,497 | ||||||||||
Moreton Bay | 236,766 | 313 | Moreton Bay North | 105,446 | ||||||||||
| 314 | Moreton Bay South | 131,320 | ||||||||||||
Townsville | 250,218 | 318 | Townsville | 250,218 | ||||||||||
|
| |||||||||||||
Total capital grants | 4,142,095 | |||||||||||||
|
| |||||||||||||
Notes
| 1. | Numbers may not add due to rounding. |
| 2. | The anticipated capital contingency reserve and other adjustments have been spread across statistical areas proportionate to capital spends. |
| 3. | $197,538,000 of capital grants in Outback statistical area belong to the Far North Queensland RAP region. |
Chart 3 shows the distribution of the total 2024–25 capital program (capital purchases and capital grants) across the geographical regions of Queensland, as classified for Budget Paper 3 purposes.
26
Capital Statement 2024-25
Chart 3 Map of 2024–25 capital program by Queensland regions
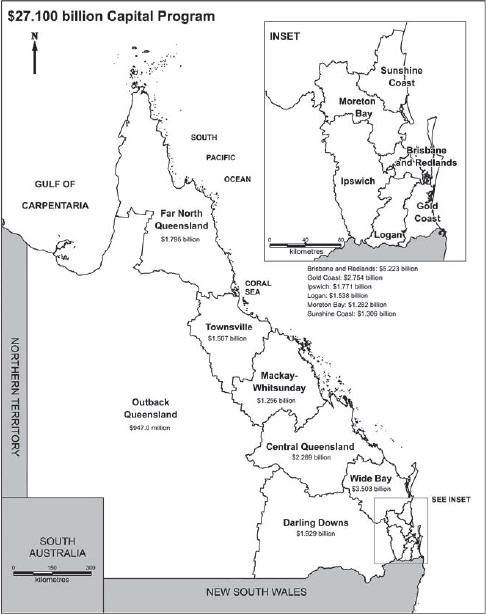
Note: Boundaries are based on Regional Action Plans, 2024-25
27
Capital Statement 2024-25
| 3 | Capital outlays by entity |
| 3.1 | AGRICULTURE AND FISHERIES |
Department of Agriculture and Fisheries
Capital purchases and grants for the Department of Agriculture and Fisheries, reporting to the Minister for Agricultural Industry Development and Fisheries and Minister for Rural Communities are $28.5 million for 2024-25. The department’s capital program is focused on developing and upgrading departmental infrastructure to deliver outcomes for agriculture, biosecurity, fisheries and forestry.
The department has facilities located throughout rural and regional Queensland. These require continual minor works, mechanical items and plant and equipment upgrades to keep them operating effectively.
Program Highlights (Property, Plant and Equipment)
| • | $5.1 million for new and replacement computer hardware to support the Infrastructure and Technology Partnership in the delivery of IT services across multiple departments. |
| • | $4 million to finalise long-term decisions on the future of assets formerly held by the Queensland Agricultural Training Colleges, including a new Central Queensland Smart Cropping Centre at Emerald. |
| • | $3.2 million for construction of infrastructure to support the Building Resilience to Manage Fruit Fly Project at Redlands Research Centre. |
| • | $2.3 million to continue upgrades to the department’s research and operational facilities through the research facilities development, scientific equipment and minor works programs. |
| • | $2 million for new and replacement heavy plant and equipment including trucks, tractors, irrigators, all-terrain vehicles and other machinery. |
| • | $1.6 million to upgrade the Wild Dog Barrier Fence. |
| • | $1.4 million to upgrade infrastructure and equipment at Gatton Smart Farm. |
| • | $1.3 million to continue to replace and upgrade vessels and marine equipment for fisheries research and support of regulatory functions. |
| • | $1.3 million to develop and replace the Brands Information System. |
| • | $1 million for climate related initiatives across the department. |
| • | $965,000 to Aquaculture Transformation towards the development of a diverse aquaculture industry at Bribie Island Research Centre. |
| • | $769,000 to upgrade the high voltage electrical system at Hermitage Research Facility. |
| • | $650,000 to upgrade the fire hydrant at Gatton Research Facility. |
Program Highlights (Capital Grants)
| • | $100,000 to contribute towards the upgrade of adoption facilities at the Young Animal Protection Society in Cairns. |
Queensland Racing Integrity Commission
Capital purchases for the Queensland Racing Integrity Commission, reporting to the Minister for State Development and Infrastructure, Minister for Industrial Relations and Minister for Racing are $4 million for 2024-25.
28
Capital Statement 2024-25
Program Highlights (Property, Plant and Equipment)
| • | $3.3 million for upgrades to laboratory equipment to support drug testing services. |
| • | $650,000 for system customisation of the Registration and Licensing Environment (RandLE). |
Agriculture and Fisheries
Project | Statistical Area | Total Estimated Cost $‘000 | Expenditure to 30-06-24 $‘000 | Budget 2024-25 $‘000 | Post 2024-25 $‘000 | |||||||||||||||
DEPARTMENT OF AGRICULTURE AND FISHERIES |
| |||||||||||||||||||
Property, Plant and Equipment | ||||||||||||||||||||
Assets formerly held by Queensland | 308 | 5,850 | 1,621 | 3,984 | 245 | |||||||||||||||
Agricultural Training Colleges | ||||||||||||||||||||
Gatton Smart Farm | 317 | 2,000 | 642 | 1,358 | ||||||||||||||||
Minor works | Various | 422 | Ongoing | |||||||||||||||||
Heavy plant and equipment | Various | 2,048 | Ongoing | |||||||||||||||||
Other property, plant and equipment | Various | 892 | Ongoing | |||||||||||||||||
Computer equipment | Various | 5,077 | Ongoing | |||||||||||||||||
Vessels and marine equipment | Various | 257 | Ongoing | |||||||||||||||||
Scientific equipment | Various | 1,680 | Ongoing | |||||||||||||||||
Research facilities development | Various | 216 | Ongoing | |||||||||||||||||
Longreach Office Upgrade | 315 | 1,756 | 1,616 | 140 | ||||||||||||||||
Wild Dog Barrier Fence | 307 | 1,610 | Ongoing | |||||||||||||||||
Gatton Research Facility Fire Hydrant Upgrade | 317 | 650 | 650 | |||||||||||||||||
Maroochy Research Facility Fire Hydrant Water Mains Upgrade | 316 | 354 | 108 | 246 | ||||||||||||||||
Aquaculture Transformation | 313 | 965 | 965 | |||||||||||||||||
Brands Information System Replacement | 305 | 1,566 | 298 | 1,268 | ||||||||||||||||
Climate Initiative Program | Various | 3,000 | 1,000 | 2,000 | ||||||||||||||||
Tor Street Toowoomba Office Upgrade | 317 | 250 | 250 | |||||||||||||||||
Tor Street Toowoomba Carbon Dioxide and Methane Isotopic Analyser | 317 | 534 | 267 | 267 | ||||||||||||||||
Health and Food Science Precinct Steriliser Replacement | 303 | 400 | 21 | 379 | ||||||||||||||||
Hermitage Research Facility High Voltage Electrical System | 307 | 769 | 769 | |||||||||||||||||
Electric Vehicle Infrastructure Installation | Various | 750 | 350 | 400 | ||||||||||||||||
Yeppoon Rigid Hull Inflatable Boat | 308 | 344 | 344 | |||||||||||||||||
Infrastructure for the Building Resilience to Manage Fruit Fly Project | 301 | 4,700 | 1,500 | 3,200 | ||||||||||||||||
Patrol Vessel Flinders Half Life Refit | 306 | 700 | 700 | |||||||||||||||||
29
Capital Statement 2024-25
Agriculture and Fisheries
Project | Statistical Area | Total Estimated Cost $‘000 | Expenditure to 30-06-24 $‘000 | Budget 2024-25 $‘000 | Post 2024-25 $‘000 | |||||
Kingaroy Research Facility Precision Plot Planter | 319 | 300 | 300 | |||||||
| ||||||||||
Total Property, Plant and Equipment | 28,421 | |||||||||
| ||||||||||
Capital Grants | ||||||||||
Young Animal Protection Society upgrade | 306 | 1,000 | 900 | 100 | ||||||
| ||||||||||
Total Capital Grants | 100 | |||||||||
| ||||||||||
QUEENSLAND RACING INTEGRITY COMMISSION | ||||||||||
Property, Plant and Equipment | ||||||||||
Racing Science Centre laboratory technology upgrades | 305 | 3,250 | Ongoing | |||||||
Other asset replacement | Various | 97 | Ongoing | |||||||
Registration and licensing environment | Various | 4,629 | 3,979 | 650 | ||||||
| ||||||||||
Total Property, Plant and Equipment | 3,997 | |||||||||
| ||||||||||
TOTAL AGRICULTURE AND FISHERIES (PPE) | 32,418 | |||||||||
| ||||||||||
TOTAL AGRICULTURE AND FISHERIES (CG) | 100 | |||||||||
| ||||||||||
30
Capital Statement 2024-25
| 3.2 | CHILD SAFETY, SENIORS AND DISABILITY SERVICES |
Child Safety, Seniors and Disability Services
The total capital outlay for the Department of Child Safety, Seniors and Disability Services is $28.9 million in 2024-25.
Total capital purchases for the portfolio are $21.0 million.These funds provide the infrastructure and systems to support our vision for Queensland’s children, young people, seniors, carers and people with disability and people from culturally and linguistically diverse backgrounds to be safe, empowered in their families, communities and culture and thriving socially and economically.
Total capital grants for the portfolio are $7.9 million. These funds include a grant to AEIOU Foundation for infrastructure projects, contributions to the establishment of a Holocaust Museum and Education Centre and a grant to BestLife Incorporated for the Helena’s House project.
Program highlights (Property, Plant and Equipment)
| • | $7.4 million to enhance and develop information systems and programs to provide additional system functionality, information security and contemporary technology to improve service delivery, including a continuous improvement pipeline for the Unify program. |
| • | $5.5 million for Child and Family Services facilities, including fit out and upgrade of Child Safety service centres and office accommodation. |
| • | $4.1 million in 2024-25 of a total $4.7 million to complete major repairs and upgrade works at Forensic Disability Services House 2 to ensure optimal service capacity can be achieved. |
| • | $2.1 million for Disability Services facilities including upgrade, improvement and modification of accommodation facilities for Disability Services clients and fit out of office accommodation |
| • | $1.9 million in 2024-25 of a total $90.3 million to finalise and complete Tranche 1 of Unify |
(Integrated Client Management System (ICMS) Replacement Program).
Program highlights (Capital Grants)
| • | $6 million in 2024-25 of a total $6.5 million capital grant to AEIOU Foundation as a contribution to provide infrastructure projects to support increased demand for children with autism requiring early intervention. |
| • | $1.6 million in 2024-25 of a total of $2 million contribution to BestLife Incorporated for the Helena’s House project to support the safe transition of young people with a disability from the family home to a living solution of their choice. |
| • | $390,000 in 2024-25 of a total $3.5 million contribution to establish a Holocaust Museum and Education Centre in Brisbane to honour victims of the Holocaust and support students and the broader community to explore and understand the impact of racism. |
31
Capital Statement 2024-25
| Child Safety, Seniors and Disability Services | ||||||||||||||||||||
Project | Statistical Area | Total Estimated Cost $‘000 | Expenditure to 30-06-24 $‘000 | Budget 2024-25 $‘000 | Post 2024-25 $‘000 | |||||||||||||||
DEPARTMENT OF CHILD SAFETY, SENIORS AND DISABILITY SERVICES | ||||||||||||||||||||
Property, Plant and Equipment | ||||||||||||||||||||
Information Systems and Technology | ||||||||||||||||||||
Unify (Integrated Client Management System replacement) Program | Various | 90,259 | 88,377 | 1,882 | ||||||||||||||||
Information system enhancements | Various | 7,368 | Ongoing | |||||||||||||||||
|
| |||||||||||||||||||
Sub-total Information Systems and Technology | 9,250 | |||||||||||||||||||
|
| |||||||||||||||||||
Child and Family Services | ||||||||||||||||||||
Child and Family Services facilities | Various | 5,510 | Ongoing | |||||||||||||||||
|
| |||||||||||||||||||
Sub-total Child and Family Services | 5,510 | |||||||||||||||||||
|
| |||||||||||||||||||
Disability Services | ||||||||||||||||||||
Forensic Disability Services House 2 major repairs and upgrade works | 310 | 4,670 | 608 | 4,062 | ||||||||||||||||
Disability Services facilities | Various | 2,130 | Ongoing | |||||||||||||||||
|
| |||||||||||||||||||
Sub-total Disability Services | 6,192 | |||||||||||||||||||
|
| |||||||||||||||||||
Total Property, Plant and Equipment | 20,952 | |||||||||||||||||||
|
| |||||||||||||||||||
Capital Grants | ||||||||||||||||||||
Disability Services | ||||||||||||||||||||
AEIOU Foundation—Infrastructure Projects | Various | 6,500 | 6,000 | 500 | ||||||||||||||||
Helena’s House | 303 | 2,000 | 450 | 1,550 | ||||||||||||||||
Multicultural Affairs | ||||||||||||||||||||
Holocaust Museum | 305 | 3,500 | 3,110 | 390 | ||||||||||||||||
|
| |||||||||||||||||||
Total Capital Grants | 7,940 | |||||||||||||||||||
|
| |||||||||||||||||||
TOTAL CHILD SAFETY, SENIORS AND DISABILITY SERVICES (PPE) | 20,952 | |||||||||||||||||||
|
| |||||||||||||||||||
TOTAL CHILD SAFETY, SENIORS AND DISABILITY SERVICES (CG) | 7,940 | |||||||||||||||||||
|
| |||||||||||||||||||
32
Capital Statement 2024-25
| 3.3 | EDUCATION |
Total capital purchases for the Education portfolio (including the Department of Education and related entities) are $1.276 billion in 2024-25. Total capital grants for the portfolio are $137.9 million in 2024-25.
Department of Education
The 2024-25 capital purchases of $1.274 billion includes $1.192 billion for the construction and refurbishment of school educational facilities and early childhood education and care services. Capital works planning targets government priorities through consideration of population growth and shifts, changes in educational needs and addressing high priority needs for student and staff health and safety.
Program Highlights (Property, Plant and Equipment)
| • | $342.2 million for the provision of additional facilities at existing state schools experiencing faster enrolment growth. |
| • | $273.2 million to replace and enhance facilities at existing schools; including $144.8 million for critical infrastructure upgrades to create contemporary learning environments as part of the Special School Renewal, Contemporary Specialist Spaces and Discrete Indigenous Community Renewal programs. |
| • | $166.6 million for the Building Future Schools Program to deliver world-class learning environments for students. |
| • | $144.2 million as part of the strategic land acquisition fund, to acquire land for future new and expanded schools. |
| • | $117 million as part of the School Halls Program to boost education infrastructure investment across Queensland. |
Program Highlights (Capital Grants)
| • | $137.9 million is provided for the non-state schooling sector and student hostels. |
Queensland Curriculum and Assessment Authority
The Authority’s capital program of $1.2 million for 2024-25 includes enhancements to software applications that support the delivery of high-quality curriculum, assessment and reporting services to Queensland schools and teachers.
| Education | ||||||||||||||||||||
Project | Statistical Area | Total Estimated Cost $‘000 | Expenditure to 30-06-24 $‘000 | Budget 2024-25 $‘000 | Post 2024-25 $‘000 | |||||||||||||||
DEPARTMENT OF EDUCATION | ||||||||||||||||||||
Property, Plant and Equipment | ||||||||||||||||||||
Capital Works Program | ||||||||||||||||||||
Aitkenvale State School - Refurbish learning space | 318 | 387 | 34 | 353 | ||||||||||||||||
33
Capital Statement 2024-25
| Education | ||||||||||||||||||
Project | Statistical Area | Total Estimated Cost $‘000 | Expenditure to 30-06-24 $‘000 | Budget 2024-25 $‘000 | Post 2024-25 $‘000 | |||||||||||||
Annandale State School - Refurbish learning space | 318 | 559 | 24 | 535 | ||||||||||||||
Barambah Environmental Education Centre - Upgrade water reticulation | 319 | 275 | 275 | |||||||||||||||
Beechmont State School - Amenities upgrades | 309 | 480 | 480 | |||||||||||||||
Biggenden State School - Amenities upgrades | 319 | 600 | 600 | |||||||||||||||
Blackwater State High School - Amenities upgrades | 308 | 600 | 600 | |||||||||||||||
Bray Park State High School - Additional classrooms | 314 | 20,580 | 1,935 | 14,965 | 3,680 | |||||||||||||
Bremer State High School - Additional specialist classrooms | 310 | 9,647 | 2,914 | 4,408 | 2,325 | |||||||||||||
Buddina State School - Security fence | 316 | 930 | 930 | |||||||||||||||
Burnside State High School - New hall facility | 316 | 15,657 | 8,849 | 5,008 | 1,800 | |||||||||||||
Bwgcolman Community School - Administration upgrades | 318 | 8,802 | 4,405 | 2,304 | 2,093 | |||||||||||||
Bwgcolman Community School - New home economics building | 318 | 7,740 | 3,070 | 4,670 | ||||||||||||||
Cavendish Road State High School - Site renewal | 303 | 420 | 420 | |||||||||||||||
Charters Towers Central State School - Refurbish learning space | 318 | 430 | 43 | 387 | ||||||||||||||
Charters Towers State High School - Upgrade sports courts | 318 | 430 | 43 | 387 | ||||||||||||||
Claremont Special School - Additional classrooms | 310 | 22,264 | 2,338 | 15,326 | 4,600 | |||||||||||||
Cleveland District State High School - Refurbish auditorium building | 301 | 1,978 | 1,507 | 471 | ||||||||||||||
Clifton State High School - Amenities upgrades | 307 | 2,728 | 558 | 1,642 | 528 | |||||||||||||
Collinsville State High School - Refurbish learning space | 312 | 559 | 301 | 258 | ||||||||||||||
Coorparoo State School - Refurbish learning space | 303 | 774 | 774 | |||||||||||||||
Cranbrook State School - Refurbish learning space | 318 | 344 | 34 | 310 | ||||||||||||||
Cunnamulla P-12 State School - Amenities upgrades | 315 | 640 | 640 | |||||||||||||||
Currimundi State School - Refurbish learning space | 316 | 860 | 860 | |||||||||||||||
34
Capital Statement 2024-25
| Education | ||||||||||||||||||
Project | Statistical Area | Total Estimated Cost $‘000 | Expenditure to 30-06-24 $‘000 | Budget 2024-25 $‘000 | Post 2024-25 $‘000 | |||||||||||||
Darling Point Special School - Additional classrooms | 301 | 27,600 | 19,911 | 7,689 | ||||||||||||||
Deception Bay State High School - Additional classrooms | 313 | 10,839 | 6,326 | 4,513 | ||||||||||||||
Discrete communities renewal | Various | 36,680 | 10,303 | 14,239 | 12,138 | |||||||||||||
Everleigh State School - New primary school | 311 | 54,813 | 44,916 | 6,144 | 3,753 | |||||||||||||
Flood Resilience | Various | 50,000 | 750 | 5,950 | 43,300 | |||||||||||||
Gatton State School - Security fence | 307 | 930 | 930 | |||||||||||||||
General and minor works - Early Childhood Education and Care ¹ | Various | 29,156 | Ongoing | |||||||||||||||
General and Minor Works - Education | Various | 143,882 | Ongoing | |||||||||||||||
Gladstone Central State School - New hall facility | 308 | 13,500 | 11,700 | 1,800 | ||||||||||||||
Gladstone State High School - Additional specialist classrooms | 308 | 22,500 | 4,304 | 12,196 | 6,000 | |||||||||||||
Go for Gold (School Sports Infrastructure) | Various | 71,503 | 4,715 | 29,250 | 37,538 | |||||||||||||
Goondiwindi State High School - Additional specialist classrooms | 307 | 673 | 420 | 253 | ||||||||||||||
Gordonvale State High School - Security fence | 306 | 1,116 | 1,116 | |||||||||||||||
Greenlands State School - Upgrade water reticulation | 307 | 275 | 275 | |||||||||||||||
Griffin State School - Additional classrooms | 314 | 22,990 | 3,284 | 16,935 | 2,771 | |||||||||||||
Growth projects in Brisbane and Redlands | Various | 179,735 | 11,202 | 96,230 | 72,303 | |||||||||||||
Growth projects in Central Queensland | 308 | 17,783 | 2,864 | 10,101 | 4,818 | |||||||||||||
Growth Projects in Darling Downs - Maranoa | 307 | 1,670 | 835 | 835 | ||||||||||||||
Growth projects in Far North Queensland | 306 | 13,630 | 1,273 | 8,847 | 3,510 | |||||||||||||
Growth projects in Gold Coast | 309 | 65,729 | 1,958 | 43,000 | 20,771 | |||||||||||||
Growth projects in Ipswich | 310 | 124,451 | 4,601 | 42,511 | 77,339 | |||||||||||||
Growth projects in Logan | 311 | 36,001 | 933 | 18,162 | 16,906 | |||||||||||||
Growth projects in Moreton Bay | Various | 20,204 | 1,777 | 14,967 | 3,460 | |||||||||||||
Growth projects in Queensland Outback | 315 | 14,385 | 438 | 3,188 | 10,759 | |||||||||||||
Growth Projects in Sunshine Coast | 316 | 2,250 | 1,125 | 1,125 | ||||||||||||||
Growth projects in Wide Bay | 319 | 14,975 | 1,079 | 5,475 | 8,421 | |||||||||||||
Hall projects in Brisbane and Redlands | Various | 49,308 | 437 | 9,425 | 39,446 | |||||||||||||
Hall projects in Darling Downs - Maranoa | 307 | 20,792 | 360 | 7,354 | 13,078 | |||||||||||||
Hall projects in Far North Queensland | 306 | 11,632 | 299 | 3,510 | 7,823 | |||||||||||||
Hall projects in Gold Coast | 309 | 9,977 | 177 | 3,527 | 6,273 | |||||||||||||
35
Capital Statement 2024-25
| Education | ||||||||||||||||||
Project | Statistical Area | Total Estimated Cost $‘000 | Expenditure to 30-06-24 $‘000 | Budget 2024-25 $‘000 | Post 2024-25 $‘000 | |||||||||||||
Hall projects in Ipswich | 310 | 16,702 | 322 | 5,400 | 10,980 | |||||||||||||
Hall projects in Logan | 311 | 34,571 | 416 | 12,331 | 21,824 | |||||||||||||
Hall projects in Mackay - Whitsunday | 312 | 17,226 | 180 | 4,515 | 12,531 | |||||||||||||
Hall projects in Townsville | 318 | 31,685 | 1,118 | 14,307 | 16,260 | |||||||||||||
Happy Valley State School - Security fence | 315 | 930 | 930 | |||||||||||||||
Hilder Road State School - Security fence | 304 | 930 | 930 | |||||||||||||||
Hopevale Campus of Cape York Aboriginal Australian Academy - Refurbish learning space | 315 | 1,462 | 1,462 | |||||||||||||||
Indooroopilly State High School - Security fence | 304 | 1,209 | 1,209 | |||||||||||||||
Indooroopilly State School - Administration upgrades | 304 | 22,045 | 604 | 6,885 | 14,556 | |||||||||||||
Indooroopilly State School - Site renewal | 304 | 440 | 80 | 360 | ||||||||||||||
Inglewood State School - Additional specialist classrooms | 307 | 741 | 401 | 340 | ||||||||||||||
Ipswich East State School - Security fence | 310 | 930 | 930 | |||||||||||||||
Ipswich State High School - Amenities upgrades | 310 | 840 | 840 | |||||||||||||||
James Nash State High School - Security fence | 319 | 1,116 | 1,116 | |||||||||||||||
Kalbar State School - Amenities upgrades | 310 | 320 | 12 | 308 | ||||||||||||||
Kenmore South State School - Additional classrooms | 304 | 14,286 | 7,777 | 6,509 | ||||||||||||||
Kepnock State High School - Additional specialist classrooms | 319 | 14,850 | 7,764 | 3,000 | 4,086 | |||||||||||||
Kilcoy State High School -New hall facility | 313 | 10,835 | 8,855 | 1,980 | ||||||||||||||
Kilkivan State School - Covered area over courts | 319 | 849 | 428 | 421 | ||||||||||||||
Koumala State School - Amenities upgrades | 312 | 731 | 731 | |||||||||||||||
Land acquisition | Various | 144,225 | Ongoing | |||||||||||||||
Laura State School - Amenities upgrades | 315 | 360 | 60 | 300 | ||||||||||||||
Lockyer District State High School - Security fence | 307 | 1,116 | 1,116 | |||||||||||||||
Marburg State School - Amenities upgrades | 310 | 560 | 560 | |||||||||||||||
Miami State School - Site renewal | 309 | 360 | 360 | |||||||||||||||
Millmerran State School - Amenities upgrades | 307 | 3,127 | 798 | 1,689 | 640 | |||||||||||||
Mirani State High School - Refurbish learning space | 312 | 1,892 | 172 | 1,720 | ||||||||||||||
36
Capital Statement 2024-25
Education
Project | Statistical Area | Total Estimated Cost $‘000 | Expenditure to 30-06-24 $‘000 | Budget 2024-25 $‘000 | Post 2024-25 $‘000 | |||||||||||||
Miriam Vale State School - Amenities upgrades | 308 | 308 | 308 | |||||||||||||||
Moranbah East State School - Additional classrooms | 312 | 10,762 | 3,160 | 3,002 | 4,600 | |||||||||||||
Moranbah State High School - Additional classrooms | 312 | 12,277 | 4,181 | 6,256 | 1,840 | |||||||||||||
Morningside State School - Amenities upgrades | 305 | 720 | 720 | |||||||||||||||
Mornington Island State School - Refurbish learning space | 315 | 568 | 568 | |||||||||||||||
Mount Gravatt East State School - Carpark upgrade | 303 | 1,290 | 91 | 1,199 | ||||||||||||||
Mount Gravatt State High School - Amenities upgrades | 303 | 720 | 720 | |||||||||||||||
Mount Isa Central State School - Refurbish learning space | 315 | 568 | 43 | 525 | ||||||||||||||
Mundingburra State School - Refurbish learning space | 318 | 568 | 52 | 516 | ||||||||||||||
Nerang State High School - Upgrade existing hall facility | 309 | 8,937 | 173 | 6,336 | 2,428 | |||||||||||||
New primary school in Bellbird Park | 310 | 77,636 | 67,794 | 3,485 | 6,357 | |||||||||||||
New primary school in Park Ridge | 311 | 84,337 | 44,340 | 22,240 | 17,757 | |||||||||||||
New schools ² | Various | 300,752 | 5,816 | 52,228 | 242,708 | |||||||||||||
New secondary school in Collingwood Park | 310 | 115,467 | 34,929 | 40,696 | 39,842 | |||||||||||||
Northern Peninsula Area State College - Senior Campus - Site renewal and amenities upgrade | 315 | 1,500 | 182 | 1,318 | ||||||||||||||
Oakleigh State School - New hall facility | 305 | 8,730 | 1,290 | 7,440 | ||||||||||||||
One Mile State School - Amenities upgrades | 319 | 1,600 | 1,600 | |||||||||||||||
Palmview State Secondary College - New secondary school | 316 | 99,534 | 52,350 | 14,728 | 32,456 | |||||||||||||
Pialba State School - Amenities upgrades | 319 | 560 | 560 | |||||||||||||||
Pimlico State High School - Refurbishment of specialist classrooms and water reticulation upgrade | 318 | 953 | 100 | 853 | ||||||||||||||
Proserpine State School - Carpark upgrade | 312 | 1,135 | 34 | 1,101 | ||||||||||||||
Queensland Pathways State College - Townsville Campus - Site renewal | 318 | 800 | 518 | 282 | ||||||||||||||
Rathdowney State School - Amenities upgrades | 311 | 1,200 | 1,200 | |||||||||||||||
Redlynch State College - New hall facility | 306 | 12,842 | 297 | 6,622 | 5,923 | |||||||||||||
37
Capital Statement 2024-25
| Education | ||||||||||||||||||
Project | Statistical Area | Total Estimated Cost $‘000 | Expenditure to 30-06-24 $‘000 | Budget 2024-25 $‘000 | Post 2024-25 $‘000 | |||||||||||||
Richmond State School - Refurbish learning space | 315 | 568 | 26 | 542 | ||||||||||||||
Ripley Central State School - New primary school | 310 | 64,107 | 51,854 | 9,438 | 2,815 | |||||||||||||
Rockhampton Special School - Additional classrooms | 308 | 15,296 | 11,277 | 4,019 | ||||||||||||||
Sarina State High School - Refurbish learning space | 312 | 5,568 | 620 | 4,948 | ||||||||||||||
Scenic Shores State School - New primary school | 301 | 63,967 | 54,996 | 7,735 | 1,236 | |||||||||||||
School infrastructure enhancement | Various | 20,000 | Ongoing | |||||||||||||||
School playground and tuckshop upgrades | Various | 102,296 | 9,555 | 26,219 | 66,522 | |||||||||||||
School Subsidy Scheme | Various | 12,740 | Ongoing | |||||||||||||||
School Upgrade Fund ³ | Various | 46,387 | 8,387 | 15,000 | 23,000 | |||||||||||||
Seville Road State School - Refurbish learning space | 303 | 1,376 | 1,376 | |||||||||||||||
Shovel Ready Program - Various minor works | Various | 48,025 | 45,900 | 2,125 | ||||||||||||||
Special school renewal | Various | 166,812 | 18,278 | 38,640 | 109,894 | |||||||||||||
Springfield Central State School - Site renewal | 310 | 800 | 280 | 520 | ||||||||||||||
Springfield Lakes State School - Site renewal | 310 | 1,040 | 620 | 420 | ||||||||||||||
Swayneville State School - Carpark upgrade | 312 | 344 | 65 | 279 | ||||||||||||||
Tagai State College - Kubin Campus - Upgrade water reticulation | 315 | 550 | 550 | |||||||||||||||
Tagai State College - Mabuiag Island Campus - Upgrade water reticulation | 315 | 550 | 550 | |||||||||||||||
Tagai State College - Poruma Campus - Upgrade water reticulation | 315 | 550 | 550 | |||||||||||||||
Tagai State College - Saibai Island Campus - Upgrade water reticulation | 315 | 550 | 550 | |||||||||||||||
Tagai State College - St Pauls Campus - Upgrade water reticulation | 315 | 550 | 550 | |||||||||||||||
Tagai State College - Thursday Island Primary Campus - Amenities upgrades | 315 | 800 | 480 | 320 | ||||||||||||||
Tagai State College - Thursday Island Secondary - Amenities upgrades | 315 | 860 | 860 | |||||||||||||||
Tagai State College - Yam Island Campus - Upgrade water reticulation | 315 | 550 | 550 | |||||||||||||||
Taranganba State School - Refurbish learning space | 308 | 602 | 602 | |||||||||||||||
38
Capital Statement 2024-25
| Education | ||||||||||||||||||
Project | Statistical Area | Total Estimated Cost $‘000 | Expenditure to 30-06-24 $‘000 | Budget 2024-25 $‘000 | Post 2024-25 $‘000 | |||||||||||||
The Willows State School - Refurbish learning space | 318 | 559 | 43 | 516 | ||||||||||||||
Toolooa State High School - Additional classrooms | 308 | 14,193 | 4,993 | 9,200 | ||||||||||||||
Townsville South State School - Refurbish learning space | 318 | 387 | 26 | 361 | ||||||||||||||
Trinity Bay State High School - New hall facility | 306 | 14,832 | 6,562 | 4,390 | 3,880 | |||||||||||||
Upper Brookfield State School - Amenities upgrades | 304 | 960 | 960 | |||||||||||||||
Veresdale Scrub State School - Refurbish learning space | 311 | 1,290 | 1,290 | |||||||||||||||
Warwick State High School - Amenities upgrades | 307 | 602 | 602 | |||||||||||||||
Western Cape College - Mapoon - Amenities upgrades | 315 | 640 | 152 | 488 | ||||||||||||||
William Ross State High School - Security fence | 318 | 1,116 | 1,116 | |||||||||||||||
Wilston State School -New hall facility | 305 | 17,575 | 5,340 | 8,375 | 3,860 | |||||||||||||
Wishart State School - Additional classrooms | 303 | 10,202 | 6,272 | 3,930 | ||||||||||||||
Woodcrest State College - Security fence | 310 | 1,674 | 1,674 | |||||||||||||||
Wowan State School - Amenities upgrades | 308 | 890 | 623 | 267 | ||||||||||||||
Yandina State School -New hall facility | 316 | 11,973 | 1,012 | 6,573 | 4,388 | |||||||||||||
Yarrabah State School - Secondary Campus - Amenities upgrades | 306 | 640 | 640 | |||||||||||||||
Youth Engagement | Various | 27,875 | 14,750 | 13,125 | ||||||||||||||
|
| |||||||||||||||||
Sub-total Capital Works Program | 1,192,380 | |||||||||||||||||
|
| |||||||||||||||||
Plant and Equipment | ||||||||||||||||||
Education plant and equipment | Various | 82,028 | Ongoing | |||||||||||||||
|
| |||||||||||||||||
Total Property, Plant and Equipment | 1,274,408 | |||||||||||||||||
|
| |||||||||||||||||
Capital Grants | ||||||||||||||||||
Capital grants - Education | Various | 137,893 | Ongoing | |||||||||||||||
|
| |||||||||||||||||
Total Capital Grants | 137,893 | |||||||||||||||||
|
| |||||||||||||||||
39
Capital Statement 2024-25
| Education | ||||||||||||||||||||
Project | Statistical Area | Total Estimated Cost $‘000 | Expenditure to 30-06-24 $‘000 | Budget 2024-25 $‘000 | Post 2024-25 $‘000 | |||||||||||||||
QUEENSLAND CURRICULUM AND ASSESSMENT AUTHORITY |
| |||||||||||||||||||
Property, Plant and Equipment | ||||||||||||||||||||
Plant and Equipment - Queensland Curriculum and Assessment Authority | Various | 1,200 | Ongoing | |||||||||||||||||
|
| |||||||||||||||||||
Total Property, Plant and Equipment | 1,200 | |||||||||||||||||||
|
| |||||||||||||||||||
TOTAL EDUCATION (PPE) | 1,275,608 | |||||||||||||||||||
|
| |||||||||||||||||||
TOTAL EDUCATION (CG) | 137,893 | |||||||||||||||||||
|
| |||||||||||||||||||
Notes:
| 1. | Includes funding for the Aurukun and Kowanyama early years hub. |
| 2. | Refers to funding allocated for four new schools (primary schools in the Caloundra South, Ripley, and Holmview, and secondary school in Park Ridge). |
| 3. | Australian Government funding received to provide more equitable access to resources to support schools to help keep students and school staff safe, and get students’ education back on track after disruptions caused by COVID-19. |
40
Capital Statement 2024-25
| 3.4 | EMPLOYMENT, SMALL BUSINESS AND TRAINING |
EMPLOYMENT, SMALL BUSINESS AND TRAINING
In 2024-25, the Employment, Small Business and Training portfolio, including TAFE Queensland, has capital purchases of $95.7 million and capital grants of $2.5 million.
Department of Employment, Small Business and Training
The 2024-25 capital program for the Department of Employment, Small Business and Training of $80.5 million includes $78 million of capital purchases and $2.5 million of capital grants for the continued delivery of the Equipping TAFE for Our Future program.
Program Highlights (Property, Plant and Equipment)
| • | $41.4 million for the delivery of the Annual Training Infrastructure Program including building and fire compliance works and asset lifecycle condition upgrades for various TAFE locations across Queensland. The program focuses on improving safety, sustainability and resilience by the renewal and upgrades of roofs, roads, carparks, electrical works, building management and heating, ventilation and air conditioning systems. |
| • | $14.8 million for the commencement and delivery of the Great Barrier Reef International Marine College expansion project. |
| • | $11.9 million for the continued delivery of Equipping TAFE for Our Future Eagle Farm Robotics and Advanced Manufacturing Centre project (noting that the Annual Training Infrastructure Program funding also contributes to Equipping TAFE for Our Future Program). |
| • | $9.8 million for the continued delivery of TAFE Technology Fund projects including Loganlea clinical skills laboratory, Pimlico visual arts precinct and Thursday Island health hub. |
Program Highlights (Capital Grants)
| • | $2.5 million for the continued delivery of Equipping TAFE for Our Future grant project for the Central Queensland University Rockhampton Campus Consolidation and Training Centre. |
41
Capital Statement 2024-25
| Employment, Small Business and Training | ||||||||||||||||||||
Project | Statistical Area | Total Estimated Cost $‘000 | Expenditure to 30-06-24 $‘000 | Budget 2024-25 $‘000 | Post 2024-25 $‘000 | |||||||||||||||
DEPARTMENT OF EMPLOYMENT, SMALL BUSINESS AND TRAINING | ||||||||||||||||||||
Property, Plant and Equipment | ||||||||||||||||||||
Equipping TAFE for Our Future | ||||||||||||||||||||
Eagle Farm Robotics and Advanced Manufacturing Centre | 302 | 40,020 | 28,096 | 11,924 | ||||||||||||||||
Great Barrier Reef International Marine College expansion | 306 | 16,000 | 1,200 | 14,800 | ||||||||||||||||
TAFE Technology Fund | ||||||||||||||||||||
Pimlico visual arts precinct | 318 | 4,500 | 700 | 3,800 | ||||||||||||||||
Loganlea clinical skills laboratory | 311 | 3,800 | 284 | 3,516 | ||||||||||||||||
Thursday Island health hub | 315 | 3,500 | 1,000 | 2,500 | ||||||||||||||||
Annual Training Infrastructure Program | Various | 41,417 | Ongoing | |||||||||||||||||
|
| |||||||||||||||||||
Total Property, Plant and Equipment | 77,957 | |||||||||||||||||||
|
| |||||||||||||||||||
Capital Grants | ||||||||||||||||||||
Central Queensland University Rockhampton Campus Consolidation and Training Centre | 308 | 8,400 | 5,925 | 2,475 | ||||||||||||||||
|
| |||||||||||||||||||
Total Capital Grants | 2,475 | |||||||||||||||||||
|
| |||||||||||||||||||
TAFE QUEENSLAND | ||||||||||||||||||||
Property, Plant and Equipment | ||||||||||||||||||||
Training and operational equipment acquisition, replacement and modernisation | ||||||||||||||||||||
Rolling replacement program | Various | 4,794 | Ongoing | |||||||||||||||||
Modernisation and reinvigoration projects | Various | 6,699 | Ongoing | |||||||||||||||||
Product development | Various | 5,706 | Ongoing | |||||||||||||||||
Aviation Australia capital program | Various | 500 | Ongoing | |||||||||||||||||
|
| |||||||||||||||||||
Total Property, Plant and Equipment | 17,699 | |||||||||||||||||||
|
| |||||||||||||||||||
TOTAL EMPLOYMENT, SMALL BUSINESS AND TRAINING (PPE) | 95,656 | |||||||||||||||||||
|
| |||||||||||||||||||
TOTAL EMPLOYMENT, SMALL BUSINESS AND TRAINING (CG) | 2,475 | |||||||||||||||||||
|
| |||||||||||||||||||
42
Capital Statement 2024-25
| 3.5 | ENERGY AND CLIMATE |
The Energy and Climate Portfolio includes the Department of Energy and Climate and the energy government owned corporations reporting to the Minister for Energy and Clean Economy Jobs. The portfolio’s capital program for 2024-25 is $8.686 billion. The portfolio’s capital grants for 2024-25 are $18 million.
Department of Energy and Climate
Total capital grants for the Department of Energy and Climate are $18 million in 2024-25.
Program Highlights (Capital Grants)
| • | $10 million to support communities in seizing industry development opportunities presented by global decarbonisation as part of the Regional Economic Futures Fund. |
| • | $8 million to support businesses to purchase energy efficient appliances and equipment, smart technology and energy management systems to reduce their energy costs as part of the Queensland Business Energy Savings and Transformation program (QBEST). |
CleanCo Queensland Limited
Total capital expenditure planned for 2024-25 is $452.1 million. CleanCo’s capital program is focused on building new renewable energy and firming, maintaining exising assets and enhancing trading and asset management systems.
Program Highlights (Property, Plant and Equipment)
| • | $274.8 million to build, own and operate the 250-megawatt, 2-hour Swanbank Battery, as part of the Swanbank Future Clean Energy Hub. |
| • | $92 million to progress the development of new wind and solar farms in Central Queensland. |
| • | $31.2 million to maintain existing generation assets. |
| • | $26.7 million to undertake a major overhaul at Swanbank E Power Station and to procure components for the next major overhaul at Wivenhoe Power Station. |
CS Energy Limited
Total capital expenditure planned for 2024-25 is $1.126 billion. This reflects CS Energy’s continued commitment to expanding its renewable energy and firming portfolio and the ongoing reliability and efficiency of existing generation assets.
Program highlights (Property, Plant and Equipment)
| • | $674.3 million to develop the 285-megawatt Lotus Creek Wind Farm and 228-megawatt Boulder Creek Wind Farm. |
| • | $306 million to progress the 400-megawatt Brigalow hydrogen-ready gas peaking plant and 200-megawatt, 2-hour Greenbank Battery. |
| • | $108.3 million to replace and refurbish existing infrastructure at Callide Power Station to ensure continued reliability of supply to Queensland and the National Electricity Market. |
| • | $25.5 million to replace and refurbish existing infrastructure at Kogan Creek Power Station to ensure continued reliability of supply to Queensland and the National Electricity Market. |
43
Capital Statement 2024-25
Energy Queensland Limited
Total capital expenditure planned for 2024-25 is $2.683 billion. This forms part of Energy Queensland’s commitment to providing safe, secure and reliable electricity to all Queensland customers. The capital program aims to improve and reinforce electricity supplies across Queensland to meet customer needs, and to support the transformation of Queensland’s energy system to deliver clean, reliable and affordable energy.
Program Highlights (Property, Plant and Equipment)
| • | $254.7 million to continue delivery of the Local Network Battery Plan across Queensland. |
| • | $54.8 million to decarbonise isolated communities. |
| • | $53 million to establish a new substation at Bells Creek Central to support regional growth. |
| • | $44.5 million to upgrade the gas-fired Barcaldine Power Station. |
| • | $25.4 million to redevelop the depot and training facilities at Rocklea. |
| • | $16.3 million to refurbish the Ergon Energy Cairns operational depot. |
| • | $15.3 million to refurbish the Mossman Substation. |
| • | $12.4 million upgrade the 66-kilovolt Cannonvale to Jubilee Pocket powerline. |
| • | $10 million to progress a Local Renewable Energy Zone Pilot Project. |
Powerlink Queensland
Total capital expenditure planned for 2024-25 is $1.881 billion. Powerlink Queensland’s capital program is focused on the delivery of CopperString 2032, the Queensland Energy and Jobs Plan SuperGrid Stage 1, and the replacement of equipment and assets to ensure the continued reliable supply of electricity.
Program Highlights (Property, Plant and Equipment)
| • | $712 million for the CopperString 2032 project, to construct a transmission line from Townsville to Mt Isa to connect the Queensland North West Minerals Province to the national electricity grid. |
| • | $109.4 million for QEJP SuperGrid Stage 1 projects which include early works and the construction of transmission lines and connections to and from the Borumba PHES. |
| • | $40.8 million to replace the Advance Energy Management System to ensure continuing effective management of the transmission network in real time. |
| • | $20 million to construct the Gladstone Transmission Training Hub to deliver regional employment and training opportunities and support the growth of the network. |
| • | $14.2 million to upgrade infrastructure on the Davies Creek to Bayview Heights Transmission Line to ensure continued reliability of supply to the surrounding area. |
| • | $8.9 million to replace primary plant at the Lilyvale Substation in Central Queensland to ensure continued reliability of supply to the surrounding area. |
| • | $4.8 million to construct the Calvale to Calliope River 275 kilovolt Transmission Line, supporting reinforcement of the transmission network in the Gladstone region. |
Queensland Hydro Pty Ltd
Total capital expenditure planned for 2024-25 is $974.4 million. This includes progress of approvals, exploratory works, and procurement for the main works of the Borumba Pumped Hydro Energy Storage project.
44
Capital Statement 2024-25
Program Highlights (Property, Plant and Equipment)
| • | $935.9 million to continue progress on environmental approvals and procurement for exploratory works and main works for the 2-gigawatt, 24-hour Borumba Pumped Hydro Energy Storage project. |
| • | $38.5 million for early works for the Pioneer-Burdekin Pumped Hydro Energy Storage project. |
Stanwell Corporation Limited
Total capital expenditure planned for 2024-25 is $1.568 billion. This reflects Stanwell’s commitment to delivering a balanced portfolio for the future, through investment in the reliability and efficiency of its generation plant, along with new renewable generation and energy storage.
Program Highlights (Property, Plant and Equipment)
| • | $424 million for the 436.5-megawatt Tarong West Wind Farm. |
| • | $376.7 million for Stage 1 and Stage 2 of the Wambo Wind Farm, with a combined capacity of 506-megawatts. |
| • | $369.9 million for the 300-megawatt, 4-hour Central Renewable Energy Zone Battery. |
| • | $131.4 million to replace and refurbish existing infrastructure at Tarong Power Station to ensure the continued reliability of supply to Queensland and the National Electricity Market. |
| • | $116.4 million for the 300-megawatt, 2-hour Southern Renewable Energy Zone Battery. |
| • | $52.9 million to replace and refurbish existing infrastructure at Stanwell Power Station to ensure the continued reliability of supply to Queensland and the National Electricity Market. |
| • | $29.7 million for the Future Energy and Innovation Training Hub (FEITH). |
| Energy and Climate | ||||||||||||||||||||
Project | Statistical Area | Total Estimated Cost $‘000 | Expenditure to 30-06-24 $‘000 | Budget 2024-25 $‘000 | Post 2024-25 $‘000 | |||||||||||||||
DEPARTMENT OF ENERGY AND CLIMATE | ||||||||||||||||||||
Capital Grants | ||||||||||||||||||||
Regional Economic Futures Fund | Various | 163,750 | 10,000 | 153,750 | ||||||||||||||||
Queensland Business Energy Saving and Transformation Program (QBEST) | Various | 13,000 | 5,000 | 8,000 | ||||||||||||||||
|
| |||||||||||||||||||
Total Capital Grants | 18,000 | |||||||||||||||||||
|
| |||||||||||||||||||
CLEANCO QUEENSLAND LIMITED | ||||||||||||||||||||
Property, Plant and Equipment | ||||||||||||||||||||
New Renewables | ||||||||||||||||||||
Central Queensland renewable projects | 308 | 91,998 | Ongoing | |||||||||||||||||
Swanbank Battery Storage | 310 | 403,394 | 128,633 | 274,761 | ||||||||||||||||
|
| |||||||||||||||||||
Sub-total New Renewables | 366,759 | |||||||||||||||||||
|
| |||||||||||||||||||
Existing Plant and Offices | ||||||||||||||||||||
Wivenhoe major overhauls | 310 | 5,620 | Ongoing | |||||||||||||||||
45
Capital Statement 2024-25
| Energy and Climate | ||||||||||||||||||
Project | Statistical Area | Total Estimated Cost $‘000 | Expenditure to 30-06-24 $‘000 | Budget 2024-25 $‘000 | Post 2024-25 $‘000 | |||||||||||||
Wivenhoe other projects | 310 | 7,966 | Ongoing | |||||||||||||||
Swanbank E major overhauls | 310 | 21,097 | Ongoing | |||||||||||||||
Swanbank E other projects | 310 | 4,911 | Ongoing | |||||||||||||||
Kareeya Hydro other projects | 306 | 11,595 | Ongoing | |||||||||||||||
Barron Gorge Hydro other projects | 306 | 5,737 | Ongoing | |||||||||||||||
Koombooloomba Dam other projects | 306 | 944 | Ongoing | |||||||||||||||
Other corporate projects | 305 | 13,036 | Ongoing | |||||||||||||||
Brisbane Office lease | 305 | 7,531 | 7,531 | |||||||||||||||
Kogan North Gas Fields development | 307 | 62,416 | 13,951 | 6,934 | 41,531 | |||||||||||||
|
| |||||||||||||||||
Sub-total Existing Plant and Offices | 85,370 | |||||||||||||||||
|
| |||||||||||||||||
Total Property, Plant and Equipment | 452,129 | |||||||||||||||||
|
| |||||||||||||||||
CS ENERGY LIMITED | ||||||||||||||||||
Property, Plant and Equipment | ||||||||||||||||||
New Renewables and Firming | ||||||||||||||||||
Lotus Creek Wind Farm | 312 | 1,305,389 | 500,000 | 805,389 | ||||||||||||||
Brigalow Hydrogen-ready Gas Peaking Plant | 307 | 642,376 | 49,140 | 174,585 | 418,651 | |||||||||||||
Boulder Creek Wind Farm | 308 | 406,901 | 85,914 | 174,341 | 146,647 | |||||||||||||
Greenbank Battery | 311 | 325,403 | 194,000 | 131,403 | ||||||||||||||
|
| |||||||||||||||||
Sub-total New Renewables and Firming | 980,328 | |||||||||||||||||
|
| |||||||||||||||||
Callide Power Station enhancements, overhauls, refurbishment and rebuild | 308 | 108,267 | Ongoing | |||||||||||||||
Kogan Creek Power Station enhancements, overhauls and refurbishment | 307 | 25,539 | Ongoing | |||||||||||||||
Upgrade of corporate information technology systems | 305 | 8,571 | Ongoing | |||||||||||||||
Callide energy transformational learning hub | 308 | 2,500 | 2,500 | |||||||||||||||
Kogan Creek Mine developments and refurbishment | 307 | 1,020 | Ongoing | |||||||||||||||
|
| |||||||||||||||||
Total Property, Plant and Equipment | 1,126,226 | |||||||||||||||||
|
| |||||||||||||||||
ENERGY QUEENSLAND LIMITED | ||||||||||||||||||
Property, Plant and Equipment | ||||||||||||||||||
System augmentation | ||||||||||||||||||
Network augmentation - Cairns | 306 | 24,818 | Ongoing | |||||||||||||||
Network augmentation - Darling Downs | 307 | 6,204 | Ongoing | |||||||||||||||
Network augmentation - Central Queensland | 308 | 6,204 | Ongoing | |||||||||||||||
46
Capital Statement 2024-25
| Energy and Climate | ||||||||||||||||||
Project | Statistical Area | Total Estimated Cost $‘000 | Expenditure to 30-06-24 $‘000 | Budget 2024-25 $‘000 | Post 2024-25 $‘000 | |||||||||||||
Network augmentation - Mackay | 312 | 24,818 | Ongoing | |||||||||||||||
Network augmentation - Outback Queensland | 315 | 24,818 | Ongoing | |||||||||||||||
Network augmentation - Toowoomba | 317 | 12,409 | Ongoing | |||||||||||||||
Network augmentation - Townsville | 318 | 24,818 | Ongoing | |||||||||||||||
Network augmentation - Wide Bay | 319 | 12,409 | Ongoing | |||||||||||||||
Network augmentation - Brisbane | 305 | 80,144 | Ongoing | |||||||||||||||
Network augmentation - Sunshine Coast | 316 | 30,889 | Ongoing | |||||||||||||||
Network augmentation - Ipswich | 310 | 11,075 | Ongoing | |||||||||||||||
Network augmentation - Gold Coast | 309 | 25,758 | Ongoing | |||||||||||||||
Microgrid Pilot Projects | 306 | 4,280 | Ongoing | |||||||||||||||
Bells Creek Central - Establish 132/11 kilovolt Zone Substation | 316 | 109,755 | 6,705 | 53,008 | 50,041 | |||||||||||||
Cannonvale-Jubilee Pocket 66 kilovolt reinforcement | 312 | 52,796 | 40,370 | 12,426 | ||||||||||||||
Establish 33/11 kilovolt Zone Substation at Petrie | 314 | 22,744 | 2,388 | 5,531 | 14,825 | |||||||||||||
System replacements | ||||||||||||||||||
Network replacement - Cairns | 306 | 111,273 | Ongoing | |||||||||||||||
Network replacement - Darling Downs | 307 | 27,818 | Ongoing | |||||||||||||||
Network replacement - Central Queensland | 308 | 27,818 | Ongoing | |||||||||||||||
Network replacement - Mackay | 312 | 111,273 | Ongoing | |||||||||||||||
Network replacement - Outback Queensland | 315 | 111,273 | Ongoing | |||||||||||||||
Network replacement - Toowoomba | 317 | 55,637 | Ongoing | |||||||||||||||
Network replacement - Townsville | 318 | 111,273 | Ongoing | |||||||||||||||
Network replacement - Wide Bay - Ergon | 319 | 55,637 | Ongoing | |||||||||||||||
Network replacement - Brisbane | 305 | 138,053 | Ongoing | |||||||||||||||
Network replacement - Gold Coast | 309 | 40,353 | Ongoing | |||||||||||||||
Network replacement - Ipswich | 310 | 20,963 | Ongoing | |||||||||||||||
Network replacement - Sunshine Coast | 316 | 38,417 | Ongoing | |||||||||||||||
Network replacement - Wide Bay - Energex | 319 | 4,285 | Ongoing | |||||||||||||||
Barcaldine Substation Refurbishment | 315 | 12,590 | 7,608 | 4,517 | 465 | |||||||||||||
Biloela Substation Refurbishment | 308 | 18,090 | 1,724 | 2,942 | 13,425 | |||||||||||||
Caboolture Zone Substation Refurbishment | 313 | 14,018 | 148 | 1,928 | 11,942 | |||||||||||||
Cape River Substation Replacement | 318 | 15,000 | 3,269 | 5,363 | 6,369 | |||||||||||||
East Bundaberg Substation refurbishment | 319 | 22,591 | 7,772 | 2,470 | 12,349 | |||||||||||||
Emerald Comet Substation upgrade | 308 | 6,730 | 4,003 | 1,218 | 1,508 | |||||||||||||
47
Capital Statement 2024-25
| Energy and Climate | ||||||||||||||||||
Project | Statistical Area | Total Estimated Cost $‘000 | Expenditure to 30-06-24 $‘000 | Budget 2024-25 $‘000 | Post 2024-25 $‘000 | |||||||||||||
Establish 33 kilovolt feeder (Kilcoy to Woodford) | 313 | 26,523 | 17,021 | 1,838 | 7,664 | |||||||||||||
Establish new Mount Crosby East Substation | 310 | 22,290 | 9,776 | 5,408 | 7,106 | |||||||||||||
Childers - Gayndah - line rebuild | 319 | 82,390 | 60,894 | 21,496 | ||||||||||||||
Kilkivan Substation Replacement | 319 | 35,128 | 25,240 | 3,435 | 6,453 | |||||||||||||
Establish new Kleinton Substation | 317 | 16,092 | 1,093 | 2,127 | 12,872 | |||||||||||||
Mossman Substation, transmission plant and sections of timber feeder replacement | 306 | 45,498 | 20,452 | 15,319 | 9,726 | |||||||||||||
Rebuild Maleny Substation | 316 | 16,424 | 5,478 | 3,270 | 7,677 | |||||||||||||
Rebuild Pialba Substation | 319 | 22,591 | 12,409 | 3,801 | 6,382 | |||||||||||||
Rebuild Rosewood Substation | 310 | 12,986 | 1,763 | 3,546 | 7,677 | |||||||||||||
Replace 11 kilovolt switchgear Nudgee Substation | 302 | 14,899 | 10,913 | 1,473 | 2,512 | |||||||||||||
Replace 66 kilovolt outdoor switchgear at Garbutt | 318 | 38,250 | 31,853 | 5,042 | 1,355 | |||||||||||||
Replace circuit breakers at Lindum Substation | 301 | 13,511 | 1,019 | 1,238 | 11,254 | |||||||||||||
Rockhampton Glenmore Substation Refurbishment | 308 | 10,158 | 876 | 853 | 8,428 | |||||||||||||
Rockhampton South Substation Refurbishment | 308 | 13,800 | 1,811 | 2,781 | 9,208 | |||||||||||||
Stradbroke Island Transformer Replacement | 301 | 12,994 | 7,233 | 1,540 | 4,221 | |||||||||||||
Tarampa Substation Upgrade | 310 | 12,105 | 1,807 | 1,381 | 8,917 | |||||||||||||
Telco Ethernet Replacement Parcel 2 | Various | 13,205 | 1,402 | 5,327 | 6,476 | |||||||||||||
West Toowoomba 11 kilovolt Plant Replacement | 317 | 19,192 | 14,744 | 2,242 | 2,206 | |||||||||||||
Network connections | ||||||||||||||||||
Network Connections - Brisbane | 305 | 66,675 | Ongoing | |||||||||||||||
Network Connections - Gold Coast | 309 | 14,925 | Ongoing | |||||||||||||||
Network Connections - Sunshine Coast | 316 | 20,112 | Ongoing | |||||||||||||||
Network Connections - Ipswich | 310 | 7,951 | Ongoing | |||||||||||||||
Network Connections - Ergon Energy | Various | 126,217 | Ongoing | |||||||||||||||
Non-system | ||||||||||||||||||
Tools and equipment – Energex | Various | 3,565 | Ongoing | |||||||||||||||
Tools and equipment - Ergon Energy | Various | 9,304 | Ongoing | |||||||||||||||
Vehicles - Energex | Various | 53,123 | Ongoing | |||||||||||||||
Vehicles - Ergon Energy | Various | 86,675 | Ongoing | |||||||||||||||
Property program - Ergon funded | Various | 30,276 | Ongoing | |||||||||||||||
48
Capital Statement 2024-25
| Energy and Climate | ||||||||||||||||||
Project | Statistical Area | Total Estimated Cost $‘000 | Expenditure to 30-06-24 $‘000 | Budget 2024-25 $‘000 | Post 2024-25 $‘000 | |||||||||||||
Property and buildings program - Energex funded | Various | 60,329 | Ongoing | |||||||||||||||
Ergon Energy Cairns operational depot redevelopment | 306 | 51,151 | 34,823 | 16,328 | ||||||||||||||
Rocklea depot & training facility redevelopment | 303 | 38,928 | 6,100 | 25,447 | 7,380 | |||||||||||||
ICT | ||||||||||||||||||
Digital office capital expenditure - Energy Queensland | Various | 183,820 | Ongoing | |||||||||||||||
Alternative control services | ||||||||||||||||||
Customer initiated works - Brisbane | 305 | 50,092 | Ongoing | |||||||||||||||
Customer initiated works - Gold Coast | 309 | 10,929 | Ongoing | |||||||||||||||
Customer initiated works - Ipswich | 310 | 6,375 | Ongoing | |||||||||||||||
Customer initiated works - Sunshine Coast | 316 | 20,037 | Ongoing | |||||||||||||||
Customer initiated works - Wide Bay | 319 | 3,643 | Ongoing | |||||||||||||||
Customer initiated works - Ergon Energy | Various | 76,496 | Ongoing | |||||||||||||||
Non-regulated | ||||||||||||||||||
Ergon Energy Retail information communications and technology | 305 | 8,323 | Ongoing | |||||||||||||||
Metering Dynamics | 305 | 61,948 | Ongoing | |||||||||||||||
Other isolated systems capital work | Various | 55,229 | Ongoing | |||||||||||||||
Yurika infrastructure services - build, own, operate and maintain | Various | 7,001 | Ongoing | |||||||||||||||
Barcaldine Power Station Upgrade | 315 | 75,396 | 8,652 | 44,483 | 22,261 | |||||||||||||
Network Battery Plan | Various | 254,663 | Ongoing | |||||||||||||||
Local Renewable Energy Zone pilot | 318 | 10,000 | Ongoing | |||||||||||||||
Isolated Communities Decarbonisation | 315 | 54,794 | Ongoing | |||||||||||||||
|
| |||||||||||||||||
Total Property, Plant and Equipment | 2,682,998 | |||||||||||||||||
|
| |||||||||||||||||
POWERLINK QUEENSLAND | ||||||||||||||||||
Property, Plant and Equipment | ||||||||||||||||||
Gladstone South secondary systems replacement | 308 | 20,800 | 12,771 | 3,300 | 4,729 | |||||||||||||
Ross 275 kilovolt primary plant replacement | 318 | 28,800 | 19,970 | 4,800 | 4,030 | |||||||||||||
Advanced energy management system replacement | 302 | 234,000 | 85,020 | 40,800 | 108,180 | |||||||||||||
Lilyvale selected primary plant replacement | 308 | 39,800 | 15,522 | 8,900 | 15,378 | |||||||||||||
Dense Wave Division Multiplexing Network replacement | Various | 35,000 | 30,418 | 1,200 | 3,382 | |||||||||||||
49
Capital Statement 2024-25
| Energy and Climate | ||||||||||||||||||
Project | Statistical Area | Total Estimated Cost $‘000 | Expenditure to 30-06-24 $‘000 | Budget 2024-25 $‘000 | Post 2024-25 $‘000 | |||||||||||||
Davies Creek to Bayview Heights 275 kilovolt refit | 306 | 70,000 | 28,952 | 14,200 | 26,848 | |||||||||||||
Gladstone Transmission Training Hub | 308 | 90,000 | 7,047 | 20,000 | 62,953 | |||||||||||||
CopperString 2032 | Various | 5,000,000 | 264,089 | 712,000 | 4,023,911 | |||||||||||||
Calvale to Calliope River 275 kilovolt Transmission Line | 308 | 464,373 | 1,830 | 4,800 | 457,743 | |||||||||||||
SuperGrid Stage 1: Halys-Woolooga Easement Acquisition | 319 | 193,222 | 8,284 | 64,300 | 120,637 | |||||||||||||
SuperGrid Stage 1: Halys to Borumba Transmission Line | 319 | 592,560 | 12,000 | 36,900 | 543,660 | |||||||||||||
SuperGrid Stage 1: Borumba Pumped Hydro Energy Storage Connection | 319 | 147,645 | 250 | 4,100 | 143,295 | |||||||||||||
SuperGrid Stage 1: Borumba to Woolooga Transmission Line | 319 | 681,680 | 6,000 | 4,100 | 671,580 | |||||||||||||
Total Non Prescribed Transmission Network Connections | Various | 212,370 | Ongoing | |||||||||||||||
Total Other Projects | Various | 749,729 | 749,729 | |||||||||||||||
|
| |||||||||||||||||
Total Property, Plant and Equipment | 1,881,499 | |||||||||||||||||
|
| |||||||||||||||||
QUEENSLAND HYDRO PTY LTD | ||||||||||||||||||
Property, Plant and Equipment | ||||||||||||||||||
Borumba Pumped Hydro Energy Storage | 319 | 14,159,006 | 95,563 | 935,900 | 13,127,543 | |||||||||||||
Pioneer-Burdekin Early Works ¹ | 312 | 1,000,000 | 55,540 | 38,450 | Ongoing | |||||||||||||
|
| |||||||||||||||||
Total Property, Plant and Equipment | 974,350 | |||||||||||||||||
|
| |||||||||||||||||
STANWELL CORPORATION LIMITED | ||||||||||||||||||
Property, Plant and Equipment | ||||||||||||||||||
New Renewables and Firming | ||||||||||||||||||
Southern Renewable Energy Zone Battery | 319 | 514,107 | 359,693 | 116,419 | 37,995 | |||||||||||||
Central Renewable Energy Zone Battery | 308 | 746,932 | 74,345 | 369,944 | 302,643 | |||||||||||||
Wambo Wind Farm Stage 1 | 307 | 488,728 | 312,047 | 126,807 | 49,875 | |||||||||||||
Wambo Wind Farm Stage 2 | 307 | 462,206 | 129,173 | 249,867 | 83,165 | |||||||||||||
Tarong West Wind Farm | 319 | 424,020 | Ongoing | |||||||||||||||
|
| |||||||||||||||||
Sub-total New Renewables and Firming | 1,287,056 | |||||||||||||||||
|
| |||||||||||||||||
Future Energy and Innovation Training Hub | 308 | 29,747 | Ongoing | |||||||||||||||
Service and Maintenance for Renewable Projects | Various | 2,875 | Ongoing | |||||||||||||||
Tarong Power Station - Overhauls | 319 | 75,716 | Ongoing | |||||||||||||||
Stanwell Power Station - Overhauls | 308 | 31,371 | Ongoing | |||||||||||||||
50
Capital Statement 2024-25
| Energy and Climate | ||||||||||||||||||||
Project | Statistical Area | Total Estimated Cost $‘000 | Expenditure to 30-06-24 $‘000 | Budget 2024-25 $‘000 | Post 2024-25 $‘000 | |||||||||||||||
Meandu Mine - Dragline Overhaul | 319 | 1,467 | Ongoing | |||||||||||||||||
Tarong Power Station - Other Sustaining Projects | 319 | 55,635 | Ongoing | |||||||||||||||||
Stanwell Power Station - Other Sustaining Projects | 308 | 21,540 | Ongoing | |||||||||||||||||
Meandu Mine - minor works | 319 | 45,377 | Ongoing | |||||||||||||||||
Tarong Power Station - Cooling Tower Refurbishment | 319 | 8,042 | 7,957 | 85 | ||||||||||||||||
Meandu Mine - Development Program | 319 | 3,241 | Ongoing | |||||||||||||||||
Meandu Mine - Ash Management | 319 | 100 | Ongoing | |||||||||||||||||
ICT - Hardware and Software Upgrades | 305 | 11,590 | Ongoing | |||||||||||||||||
Other capital projects | Various | 2,585 | Ongoing | |||||||||||||||||
|
| |||||||||||||||||||
Total Property, Plant and Equipment | 1,568,386 | |||||||||||||||||||
|
| |||||||||||||||||||
TOTAL ENERGY AND CLIMATE (PPE) | 8,685,588 | |||||||||||||||||||
|
| |||||||||||||||||||
TOTAL ENERGY AND CLIMATE (CG) | 18,000 | |||||||||||||||||||
|
| |||||||||||||||||||
Notes:
| 1. | The Total Estimated Cost figure represents the government’s $1 billion equity commitment to the project. |
51
Capital Statement 2024-25
| 3.6 | ENVIRONMENT, SCIENCE AND INNOVATION |
Department of Environment, Science and Innovation
The Department of Environment, Science and Innovation has a capital program of $154.1 million in 2024-25. This includes $102.2 million in capital purchases and $51.9 million in capital grants. The capital program will allow the department to deliver on conserving and restoring Queensland’s unique biodiversity, heritage and protected areas, protecting World Heritage areas, growing the circular economy, strengthening and harnessing Queensland’s scientific excellence and driving economic transition and innovation.
The government has previously set aside $250 million over 4 years, held centrally, of which $139.1 million remains across 2024-25 and 2025-26 for land acquisitions and capital works to support the Protected Area Strategy 2020-2030.
Program Highlights (Property, Plant and Equipment):
| • | $20 million under the Cape York Peninsula Tenure Resolution Program to acquire land to become jointly managed protected area as National Park (Cape York Peninsula Aboriginal Land). |
| • | $18.1 million for the purchase of additional fire vehicles, fire units and support equipment as well as upgrades to road and fireline networks and management infrastructure to support critical firefighter needs and bushfire risk, to improve community safety and safeguard natural and cultural values. |
| • | $7.5 million for additional facilities and equipment to support rangers and to enhance visitor information in relation to dingoes (wongari) on K’gari. |
| • | $5 million towards the construction of the Girraween National Park Information Hub. |
| • | $4.8 million for the vessel replacement program supporting marine parks and wildlife and threatened species management. |
| • | $4.2 million for the major upgrade of visitor infrastructure at Central Station on K’gari. |
| • | $3.5 million to provide camping facilities and continued enhancements to the Ngaro track in the Whitsunday Islands National Park. |
| • | $3.2 million towards building and park infrastructure to support visitor recreation, management and access of the Quandamooka Country parks and recreation areas jointly managed with Traditional Owners on Minjerribah (North Stradbroke Island) and Mulgumpin (Moreton Island). |
| • | $1.8 million to upgrade and build new nature-based visitor experiences and facilities along the Thorsborne trail on Hinchinbrook Island National Park. |
| • | $1.6 million to replace the Jindalba Boardwalk in Daintree National Park (Cape York Peninsula Aboriginal Land). |
Program Highlights (Capital Grants):
| • | $33.5 million for Resource Recovery Infrastructure to increase resource recovery rates, facilitate organics recycling and progress the South East Queensland region towards a circular economy. |
| • | $10 million for the delivery of the Blue Heart Sunshine Coast project being delivered on the Maroochy River floodplain. |
| • | $5.5 million for the Resilient Rivers Initiative to improve the health of the South East Queensland region’s catchments, waterways and Moreton Bay. |
52
Capital Statement 2024-25
| Environment, Science and Innovation | ||||||||||||||||||||
Project | Statistical Area | Total Estimated Cost $‘000 | Expenditure to 30-06-24 $‘000 | Budget 2024-25 $‘000 | Post 2024-25 $‘000 | |||||||||||||||
DEPARTMENT OF ENVIRONMENT, SCIENCE AND INNOVATION | ||||||||||||||||||||
Property, Plant and Equipment | ||||||||||||||||||||
Land ¹ | ||||||||||||||||||||
Cape York Peninsula Tenure Resolution Program - land acquisitions | 315 | 20,000 | 20,000 | |||||||||||||||||
|
| |||||||||||||||||||
Sub-total Land | 20,000 | |||||||||||||||||||
|
| |||||||||||||||||||
Buildings and Infrastructure ¹ | ||||||||||||||||||||
K’gari - Dingo (wongari) management program | 319 | 14,650 | 2,325 | 7,500 | 4,825 | |||||||||||||||
K’gari - Central Station area upgrade | 319 | 11,096 | 3,946 | 4,220 | 2,930 | |||||||||||||||
Girraween National Park Information Hub | 307 | 7,857 | 657 | 5,000 | 2,200 | |||||||||||||||
Whitsunday Islands National Park - Ngaro track | 312 | 6,301 | 2,801 | 3,500 | ||||||||||||||||
Quandamooka Country | Various | 3,242 | Ongoing | |||||||||||||||||
Better Queensland Parks - Fire Management Uplift Program | Various | 2,716 | 2,716 | |||||||||||||||||
Hinchinbrook Island National Park - Thorsborne trail and visitor facilities upgrade | 306 | 3,200 | 1,378 | 1,822 | ||||||||||||||||
Daintree National Park (Cape York Peninsula Aboriginal Land) - Jindalba boardwalk | 306 | 7,340 | 1,340 | 1,550 | 4,450 | |||||||||||||||
Noosa National Park - Coastal walk upgrades | 316 | 1,150 | 50 | 1,100 | ||||||||||||||||
David Fleay Wildlife Park Nocturnal House | 309 | 2,600 | 300 | 1,000 | 1,300 | |||||||||||||||
Daintree National Park (Cape York Peninsula Aboriginal Land) - Culture and Tourism Hub | 306 | 3,446 | 646 | 920 | 1,880 | |||||||||||||||
Springbrook National Park visitor facilities upgrade | 309 | 16,440 | 1,380 | 850 | 14,210 | |||||||||||||||
Magnetic Island National Park trails network | 318 | 1,437 | 850 | 587 | ||||||||||||||||
Girringun National Park - Wallaman Falls visitor facilities upgrade | 318 | 4,175 | 380 | 450 | 3,345 | |||||||||||||||
Crater Lakes National Park visitor facilities upgrade | 306 | 10,316 | 832 | 400 | 9,084 | |||||||||||||||
Parks and forests - other management facilities | Various | 7,088 | Ongoing | |||||||||||||||||
Parks and forests - other recreation and visitor facilities | Various | 6,334 | Ongoing | |||||||||||||||||
|
| |||||||||||||||||||
Sub-total Buildings and Infrastructure | 48,279 | |||||||||||||||||||
|
| |||||||||||||||||||
53
Capital Statement 2024-25
| Environment, Science and Innovation | ||||||||||||||||||||
Project | Statistical Area | Total Estimated Cost $‘000 | Expenditure to 30-06-24 $‘000 | Budget 2024-25 $‘000 | Post 2024-25 $‘000 | |||||||||||||||
Plant and equipment | ||||||||||||||||||||
Better Queensland Parks - Fire Management Uplift Program | Various | 15,402 | 15,402 | |||||||||||||||||
Vessel replacement program | Various | 11,749 | 2,930 | 4,769 | 4,050 | |||||||||||||||
Queensland Reef Water Quality monitoring equipment | Various | 1,412 | 1,308 | 104 | ||||||||||||||||
General plant and equipment | Various | 7,534 | Ongoing | |||||||||||||||||
|
| |||||||||||||||||||
Sub-total Plant and equipment | 27,809 | |||||||||||||||||||
|
| |||||||||||||||||||
General systems development | Various | 6,093 | Ongoing | |||||||||||||||||
|
| |||||||||||||||||||
Total Property, Plant and Equipment | 102,181 | |||||||||||||||||||
|
| |||||||||||||||||||
Capital Grants | ||||||||||||||||||||
SEQ City Deal - Resource Recovery Infrastructure | Various | 70,000 | 33,500 | 36,500 | ||||||||||||||||
SEQ City Deal - Blue Heart Sunshine Coast | 316 | 20,000 | 10,000 | 10,000 | ||||||||||||||||
SEQ City Deal - Resilient Rivers Initiative | Various | 20,000 | 3,000 | 5,500 | 11,500 | |||||||||||||||
Waste and Recycling program | Various | 2,925 | Ongoing | |||||||||||||||||
|
| |||||||||||||||||||
Total Capital Grants | 51,925 | |||||||||||||||||||
|
| |||||||||||||||||||
TOTAL ENVIRONMENT, SCIENCE AND INNOVATION (PPE) |
| 102,181 | ||||||||||||||||||
|
| |||||||||||||||||||
TOTAL ENVIRONMENT, SCIENCE AND INNOVATION (CG) |
| 51,925 | ||||||||||||||||||
|
| |||||||||||||||||||
Notes:
| 1. | Previously approved, held centrally, funding of $139.1 million will also contribute to land acquisitions and capital works in 2024-25 and 2025-26 as part of the total capital funding of $250 million committed to support the Protected Area Strategy 2020-2030 to expand the protected area estate. |
54
Capital Statement 2024-25
| 3.7 | HOUSING, LOCAL GOVERNMENT, PLANNING AND PUBLIC WORKS |
The Housing, Local Government, Planning and Public Works portfolio includes the Department of Housing, Local Government, Planning and Public Works together with statutory bodies reporting to the Minister for Housing, Local Government and Planning and the Minister for Public Works.
The portfolio’s capital program for 2024-25 is $1.742 billion, including capital purchases of property, plant and equipment of $757.3 million and capital grants of $984.8 million.
Department of Housing, Local Government, Planning and Public Works
Program Highlights (Property, Plant and Equipment)
| • | $407.8 million to deliver social housing dwellings, commence and continue construction, and upgrade social housing dwellings. |
| • | $162.9 million investment to deliver safe and secure government employee housing including in remote and regional communities as part of government’s commitment to attract and retain key frontline staff. This program will include new accommodation for staff delivering critical services, replacement or refurbishment of residences at the end of their useful life to modern design standards and the upgrade of residences to ensure they remain fit-for-purpose and appropriate for employees. |
| • | $93.6 million to deliver social housing dwellings in Aboriginal and Torres Strait Islander communities, commence and continue construction of dwellings, and upgrade existing social housing dwellings. |
| • | $17.1 million to support the delivery of a levee to reduce the impact of flooding on parts of Bundaberg East and Bundaberg South. |
| • | $15.8 million to make Zero Emission Vehicle (ZEV) charging infrastructure available in Queensland government buildings. |
Program Highlights (Capital Grants)
| • | $545.2 million to deliver social housing dwellings, commence and continue construction, and upgrade existing dwellings in partnership with registered housing providers. |
| • | $124.5 million as part of the $1.1 billion Works for Queensland program to support local governments in regional Queensland to deliver priority infrastructure, planning and capability projects that create jobs and support vibrant local communities. |
| • | $78.8 million to deliver social housing dwellings in Aboriginal and Torres Strait Islander communities, commence and continue construction, upgrade existing dwellings, and undertake land infrastructure development. |
| • | $76.3 million for the Local Government Grants and Subsidies Program, which provides funding for priority infrastructure projects to meet identified community needs and supports projects that will create sustainable and livable communities. |
| • | $72 million towards the $200 million South East Queensland Community Stimulus Program to fast track South East Queensland councils’ investment in new infrastructure and community assets that create jobs and deliver economic stimulus. |
| • | $63.4 million to eligible homeowners to raise, repair or retrofit their homes to incorporate flood resilient design and materials to reduce the impacts of future flood events. |
55
Capital Statement 2024-25
| Housing, Local Government, Planning and Public Works | ||||||||||||||||||||
Project | Statistical Area | Total Estimated Cost $‘000 | Expenditure to 30-06-24 $‘000 | Budget 2024-25 $‘000 | Post 2024-25 $‘000 | |||||||||||||||
DEPARTMENT OF HOUSING, LOCAL GOVERNMENT, PLANNING AND PUBLIC WORKS |
| |||||||||||||||||||
Property, Plant and Equipment | ||||||||||||||||||||
Housing and Homelessness Services | ||||||||||||||||||||
Construct social housing | ||||||||||||||||||||
Brisbane - East | 301 | 9,674 | Ongoing | |||||||||||||||||
Brisbane - North | 302 | 263 | Ongoing | |||||||||||||||||
Brisbane - South | 303 | 1,164 | Ongoing | |||||||||||||||||
Brisbane - West | 304 | 9,888 | Ongoing | |||||||||||||||||
Brisbane Inner City | 305 | 27,508 | Ongoing | |||||||||||||||||
Cairns | 306 | 76,889 | Ongoing | |||||||||||||||||
Darling Downs - Maranoa | 307 | 2,919 | Ongoing | |||||||||||||||||
Central Queensland | 308 | 13,703 | Ongoing | |||||||||||||||||
Gold Coast | 309 | 24,952 | Ongoing | |||||||||||||||||
Ipswich | 310 | 12,474 | Ongoing | |||||||||||||||||
Logan - Beaudesert | 311 | 19,166 | Ongoing | |||||||||||||||||
Mackay | 312 | 15,321 | Ongoing | |||||||||||||||||
Moreton Bay - North | 313 | 17,249 | Ongoing | |||||||||||||||||
Moreton Bay - South | 314 | 18,504 | Ongoing | |||||||||||||||||
Queensland - Outback | 315 | 27,839 | Ongoing | |||||||||||||||||
Sunshine Coast | 316 | 8,448 | Ongoing | |||||||||||||||||
Toowoomba | 317 | 1,902 | Ongoing | |||||||||||||||||
Townsville | 318 | 18,397 | Ongoing | |||||||||||||||||
Wide Bay | 319 | 7,710 | Ongoing | |||||||||||||||||
Statewide | Various | 904 | Ongoing | |||||||||||||||||
|
| |||||||||||||||||||
Sub-total Construct social housing | 314,874 | |||||||||||||||||||
|
| |||||||||||||||||||
Upgrade existing social housing | ||||||||||||||||||||
Brisbane - East | 301 | 3,772 | Ongoing | |||||||||||||||||
Brisbane - North | 302 | 4,873 | Ongoing | |||||||||||||||||
Brisbane - South | 303 | 6,716 | Ongoing | |||||||||||||||||
Brisbane - West | 304 | 1,879 | Ongoing | |||||||||||||||||
Brisbane Inner City | 305 | 4,279 | Ongoing | |||||||||||||||||
Cairns | 306 | 33,846 | Ongoing | |||||||||||||||||
Darling Downs - Maranoa | 307 | 1,011 | Ongoing | |||||||||||||||||
Central Queensland | 308 | 5,888 | Ongoing | |||||||||||||||||
Gold Coast | 309 | 5,656 | Ongoing | |||||||||||||||||
66
Capital Statement 2024-25
Housing, Local Government, Planning and Public Works |
| |||||||||||||||||
Project | Statistical Area | Total Estimated Cost $‘000 | Expenditure to 30-06-24 $‘000 | Budget 2024-25 $‘000 | Post 2024-25 $‘000 | |||||||||||||
Ipswich | 310 | 6,557 | Ongoing | |||||||||||||||
Logan - Beaudesert | 311 | 6,816 | Ongoing | |||||||||||||||
Mackay | 312 | 2,836 | Ongoing | |||||||||||||||
Moreton Bay - North | 313 | 4,986 | Ongoing | |||||||||||||||
Moreton Bay - South | 314 | 1,537 | Ongoing | |||||||||||||||
Queensland - Outback | 315 | 8,760 | Ongoing | |||||||||||||||
Sunshine Coast | 316 | 4,078 | Ongoing | |||||||||||||||
Toowoomba | 317 | 2,335 | Ongoing | |||||||||||||||
Townsville | 318 | 10,887 | Ongoing | |||||||||||||||
Wide Bay | 319 | 4,117 | Ongoing | |||||||||||||||
|
| |||||||||||||||||
Sub-total Upgrade existing social housing | 120,829 | |||||||||||||||||
|
| |||||||||||||||||
Social housing land acquisition | ||||||||||||||||||
Brisbane - North | 302 | 2,250 | Ongoing | |||||||||||||||
Brisbane - South | 303 | 2,250 | Ongoing | |||||||||||||||
Cairns | 306 | 4,000 | Ongoing | |||||||||||||||
Central Queensland | 308 | 1,500 | Ongoing | |||||||||||||||
Gold Coast | 309 | 4,500 | Ongoing | |||||||||||||||
Ipswich | 310 | 1,250 | Ongoing | |||||||||||||||
Mackay | 312 | 800 | Ongoing | |||||||||||||||
Moreton Bay - South | 314 | 750 | Ongoing | |||||||||||||||
Townsville | 318 | 4,000 | Ongoing | |||||||||||||||
Wide Bay | 319 | 1,700 | Ongoing | |||||||||||||||
Statewide | Various | 2,500 | Ongoing | |||||||||||||||
|
| |||||||||||||||||
Sub-total Social housing land acquisition | 25,500 | |||||||||||||||||
|
| |||||||||||||||||
Purchase of existing properties | ||||||||||||||||||
Brisbane Inner City | 301 | 1,998 | Ongoing | |||||||||||||||
Cairns | 306 | 2,500 | Ongoing | |||||||||||||||
Logan - Beaudesert | 311 | 3,257 | Ongoing | |||||||||||||||
Townsville | 318 | 2,500 | Ongoing | |||||||||||||||
Statewide | Various | 30,000 | Ongoing | |||||||||||||||
|
| |||||||||||||||||
Sub-total Purchase of existing properties | 40,255 | |||||||||||||||||
|
| |||||||||||||||||
Other Plant and Equipment and Intangibles | Various | 6,300 | Ongoing | |||||||||||||||
|
| |||||||||||||||||
Sub-total Housing and Homelessness Services | 507,758 | |||||||||||||||||
|
| |||||||||||||||||
Public Works | ||||||||||||||||||
57
Capital Statement 2024-25
| Housing, Local Government, Planning and Public Works | ||||||||||||||||||
Project | Statistical Area | Total Estimated Cost $‘000 | Expenditure to 30-06-24 $‘000 | Budget 2024-25 $‘000 | Post 2024-25 $‘000 | |||||||||||||
Thomas Dixon Centre refurbishment | 305 | 96,407 | 91,130 | 5,277 | ||||||||||||||
Government Employee Housing | Various | 162,904 | Ongoing | |||||||||||||||
Bundaberg East Levee | 319 | 114,000 | 2,555 | 17,108 | 94,337 | |||||||||||||
Government Buildings ZEV ready | Various | 28,100 | 2,000 | 15,750 | 10,350 | |||||||||||||
Office Accommodation Program | Various | 7,778 | Ongoing | |||||||||||||||
Building works and capital replacements | Various | 500 | Ongoing | |||||||||||||||
Regional Infrastructure Upgrades | Various | 22,497 | 3,659 | 10,180 | 8,658 | |||||||||||||
Other property, plant and equipment | Various | 9,480 | Ongoing | |||||||||||||||
|
| |||||||||||||||||
Sub-total Public Works | 228,977 | |||||||||||||||||
|
| |||||||||||||||||
Total Property, Plant and Equipment | 736,735 | |||||||||||||||||
|
| |||||||||||||||||
Capital Grants | ||||||||||||||||||
Housing and Homelessness Services | ||||||||||||||||||
Brisbane - East | 301 | 7,516 | Ongoing | |||||||||||||||
Cairns | 306 | 73,917 | Ongoing | |||||||||||||||
Darling Downs - Maranoa | 307 | 370 | Ongoing | |||||||||||||||
Central Queensland | 308 | 3,058 | Ongoing | |||||||||||||||
Gold Coast | 309 | 30,986 | Ongoing | |||||||||||||||
Ipswich | 310 | 8,665 | Ongoing | |||||||||||||||
Logan - Beaudesert | 311 | 1,587 | Ongoing | |||||||||||||||
Mackay | 312 | 4,589 | Ongoing | |||||||||||||||
Moreton Bay - North | 313 | 10,636 | Ongoing | |||||||||||||||
Queensland - Outback | 315 | 2,113 | Ongoing | |||||||||||||||
Sunshine Coast | 316 | 14,741 | Ongoing | |||||||||||||||
Toowoomba | 317 | 10,193 | Ongoing | |||||||||||||||
Townsville | 318 | 4,780 | Ongoing | |||||||||||||||
Wide Bay | 319 | 23,283 | Ongoing | |||||||||||||||
Statewide | Various | 427,515 | Ongoing | |||||||||||||||
|
| |||||||||||||||||
Sub-total Housing and Homelessness Services | 623,949 | |||||||||||||||||
|
| |||||||||||||||||
Local Government and Planning | ||||||||||||||||||
Local Government Grants and Subsidies Program | Various | 76,297 | Ongoing | |||||||||||||||
Works for Queensland | Various | 1,098,578 | 774,088 | 124,490 | 200,000 | |||||||||||||
South East Queensland Community Stimulus Program | Various | 200,000 | 78,000 | 72,000 | 50,000 | |||||||||||||
Hinchinbrook Harbour new sewage plant | 306 | 6,433 | 3,857 | 2,576 | ||||||||||||||
58
Capital Statement 2024-25
| Housing, Local Government, Planning and Public Works | ||||||||||||||||||
Project | Statistical Area | Total Estimated Cost $‘000 | Expenditure to 30-06-24 $‘000 | Budget 2024-25 $‘000 | Post 2024-25 $‘000 | |||||||||||||
Splash Parks in Mareeba and Douglas Shires | 306 | 3,000 | 1,950 | 1,050 | ||||||||||||||
Northern Peninsula Area water supply system – replacement of asbestos cement pipelines | 315 | 5,010 | 3,010 | 2,000 | ||||||||||||||
Indigenous Councils Critical Infrastructure Program | Various | 117,534 | 107,534 | 10,000 | ||||||||||||||
COVID-19 Works for Queensland | Various | 199,900 | 198,283 | 1,617 | ||||||||||||||
Kenrick Park Masterplan (Stage 1) | 306 | 3,000 | 1,900 | 1,100 | ||||||||||||||
Trinity Beach Community Activity Space | 306 | 935 | 841 | 94 | ||||||||||||||
Torres Strait Ferry Funding Program | 315 | 500 | 500 | |||||||||||||||
Local Government Community Safety | Various | 5,000 | 5,000 | |||||||||||||||
Kuranda infrastructure levy | 306 | 744 | Ongoing | |||||||||||||||
|
| |||||||||||||||||
Sub-total Local Government and Planning | 297,468 | |||||||||||||||||
|
| |||||||||||||||||
Public Works | ||||||||||||||||||
Resilient Homes Fund | Various | 172,764 | 40,535 | 63,431 | 68,798 | |||||||||||||
|
| |||||||||||||||||
Total Capital Grants | 984,848 | |||||||||||||||||
|
| |||||||||||||||||
QBUILD | ||||||||||||||||||
Property, Plant and Equipment | ||||||||||||||||||
Regional Infrastructure Upgrades | Various | 6,537 | 844 | 5,693 | ||||||||||||||
QBuild Rapid Accommodation and Apprenticeship Centres | Various | 7,570 | 7,570 | |||||||||||||||
Other property, plant and equipment | Various | 6,444 | 4,847 | 1,597 | ||||||||||||||
|
| |||||||||||||||||
Total Property, Plant and Equipment | 14,861 | |||||||||||||||||
|
| |||||||||||||||||
QUEENSLAND BUILDING AND CONSTRUCTION COMMISSION |
| |||||||||||||||||
Property, Plant and Equipment | ||||||||||||||||||
Other property, plant and equipment | Various | 18,553 | 3,308 | 5,745 | 9,500 | |||||||||||||
|
| |||||||||||||||||
Total Property, Plant and Equipment | 5,745 | |||||||||||||||||
|
| |||||||||||||||||
TOTAL HOUSING, LOCAL GOVERNMENT, PLANNING AND PUBLIC WORKS (PPE) |
| 757,341 | ||||||||||||||||
|
| |||||||||||||||||
TOTAL HOUSING, LOCAL GOVERNMENT, PLANNING AND PUBLIC WORKS (CG) |
| 984,848 | ||||||||||||||||
|
| |||||||||||||||||
59
Capital Statement 2024-25
| 3.8 | JUSTICE AND ATTORNEY-GENERAL |
The 2024-25 capital acquisitions budget for the Justice and Attorney-General portfolio (including the Department of Justice and Attorney-General, Legal Aid Queensland, Crime and Corruption Commission, Public Trustee of Queensland and Office of the Queensland Ombudsman) is $76 million.
Department of Justice and Attorney-General
The Department of Justice and Attorney-General capital acquisitions budget for 2024-25 is $68.3 million.
Program Highlights (Property, Plant and Equipment)
| • | $23.6 million to continue the ongoing program of minor capital works in courthouses. |
| • | $13.5 million to continue the replacement of the Beaudesert courthouse. |
| • | $11.2 million to expand and upgrade existing audio-visual capacity in the justice system, which includes video conferencing and in-custody court appearances. |
| • | $9 million to continue the domestic and family violence courthouse improvements in Toowoomba, Cairns, Brisbane, Rockhampton, Maroochydore, Caboolture, Mackay and Ipswich. This forms part of the government’s response to the Queensland Women’s Safety and Justice Taskforce, Hear Her Voice - Report One - Addressing coercive control and domestic and family violence in Queensland. |
| • | $2.5 million to commence courtroom expansions at Townsville courthouse and Brisbane Supreme and District courthouse. |
Crime and Corruption Commission
The Crime and Corruption Commission 2024-25 capital acquisitions budget is $4 million.
Program Highlights (Property, Plant and Equipment)
| • | $3.2 million to replace computer and other information technology equipment. |
| • | $780,000 to replace vehicles. |
Legal Aid Queensland
Legal Aid Queensland’s 2024-25 capital acquisitions budget is $1.5 million.
Program Highlights (Property, Plant and Equipment)
| • | $1.1 million to fit out office accommodation in Brisbane and regions. |
| • | $400,000 for new and replacement vehicles. |
Public Trustee of Queensland
The Public Trustee of Queensland 2024-25 capital acquisitions budget is $1 million. This capital budget will enable the Public Trustee of Queensland to continue to provide a wide range of efficient services to the Queensland community, as well as continuing to maintain appropriate workplace health and safety standards for customers and staff.
60
Capital Statement 2024-25
Program Highlights (Property, Plant and Equipment)
| • | $700,000 in support of leasehold improvements - for the fit out of leased premises. |
| • | $300,000 in support of replacement of property, plant and equipment. |
Office of the Queensland Ombudsman
The Office of the Queensland Ombudsman’s 2024-25 capital acquisitions budget is $1.2 million.
Program Highlights (Property, Plant and Equipment)
| • | $1.1 million to fit out office accommodation in Brisbane. |
| • | $90,000 to maintain current information technology systems and infrastructure. |
| Justice and Attorney-General | ||||||||||||||||||
Project | Statistical Area | Total Estimated Cost $‘000 | Expenditure to 30-06-24 $‘000 | Budget 2024-25 $‘000 | Post 2024-25 $‘000 | |||||||||||||
DEPARTMENT OF JUSTICE AND ATTORNEY-GENERAL | ||||||||||||||||||
Property, Plant and Equipment | ||||||||||||||||||
Domestic and family violence courthouse improvements | Various | 49,050 | 5,975 | 9,000 | 34,075 | |||||||||||||
Brisbane Supreme and District Court - courtroom expansion | 305 | 25,318 | 2,010 | 23,308 | ||||||||||||||
Beaudesert courthouse replacement | 311 | 21,446 | 4,406 | 13,521 | 3,519 | |||||||||||||
Townsville courthouse - courtroom expansion | 318 | 7,500 | 500 | 7,000 | ||||||||||||||
Courthouses - minor capital works | Various | 23,555 | Ongoing | |||||||||||||||
Justice System - audio visual capacity expansion and upgrades | Various | 11,207 | Ongoing | |||||||||||||||
Leasehold improvements | 305 | 3,879 | Ongoing | |||||||||||||||
Minor capital works - software | 305 | 2,065 | Ongoing | |||||||||||||||
Other acquisitions of property, plant and equipment | Various | 1,080 | Ongoing | |||||||||||||||
Courthouses - information systems upgrades and replacements | 305 | 795 | Ongoing | |||||||||||||||
Forensic Services new and upgraded equipment | Various | 650 | 650 | |||||||||||||||
|
| |||||||||||||||||
Total Property, Plant and Equipment | 68,262 | |||||||||||||||||
|
| |||||||||||||||||
CRIME AND CORRUPTION COMMISSION | ||||||||||||||||||
Property, Plant and Equipment | ||||||||||||||||||
Other plant and equipment | Various | 3,220 | Ongoing | |||||||||||||||
Vehicle replacements | Various | 780 | Ongoing | |||||||||||||||
|
| |||||||||||||||||
Total Property, Plant and Equipment | 4,000 | |||||||||||||||||
|
| |||||||||||||||||
61
Capital Statement 2024-25
| Justice and Attorney-General | ||||||||||||||||||||
Project | Statistical Area | Total Estimated Cost $‘000 | Expenditure to 30-06-24 $‘000 | Budget 2024-25 $‘000 | Post 2024-25 $‘000 | |||||||||||||||
LEGAL AID QUEENSLAND | ||||||||||||||||||||
Property, Plant and Equipment | ||||||||||||||||||||
Office accommodation fit out | Various | 1,100 | 1,100 | |||||||||||||||||
Vehicles replacement | Various | 400 | 400 | |||||||||||||||||
|
| |||||||||||||||||||
Total Property, Plant and Equipment | 1,500 | |||||||||||||||||||
|
| |||||||||||||||||||
PUBLIC TRUSTEE OF QUEENSLAND | ||||||||||||||||||||
Property, Plant and Equipment | ||||||||||||||||||||
Leasehold improvements | Various | 700 | Ongoing | |||||||||||||||||
Other acquisitions of property, plant and equipment | Various | 300 | Ongoing | |||||||||||||||||
|
| |||||||||||||||||||
Total Property, Plant and Equipment | 1,000 | |||||||||||||||||||
|
| |||||||||||||||||||
OFFICE OF THE QUEENSLAND OMBUDSMAN |
| |||||||||||||||||||
Property, Plant and Equipment | ||||||||||||||||||||
Accommodation fit out | 305 | 2,243 | 227 | 1,133 | 883 | |||||||||||||||
Information technology plant and equipment purchases | 305 | 90 | Ongoing | |||||||||||||||||
|
| |||||||||||||||||||
Total Property, Plant and Equipment | 1,223 | |||||||||||||||||||
|
| |||||||||||||||||||
TOTAL JUSTICE AND ATTORNEY-GENERAL (PPE) |
| 75,985 | ||||||||||||||||||
|
| |||||||||||||||||||
62
Capital Statement 2024-25
| 3.9 | LEGISLATIVE ASSEMBLY OF QUEENSLAND |
Legislative Assembly of Queensland
The total planned 2024–25 capital expenditure for the Legislative Assembly of Queensland is $3.7 million.
In 2024–25, the Queensland Parliamentary Service will complete the modernisation of audio visual broadcast infrastructure as part of the Queensland Parliament digital transformation program. Other major capital projects include information technology network infrastructure upgrades (including network consolidation, servers and firewall replacement), and other capital improvements and plant and equipment in the Parliamentary Precinct.
| Legislative Assembly of Queensland | ||||||||||||||||||||
Project | Statistical Area | Total Estimated Cost $‘000 | Expenditure to 30-06-24 $‘000 | Budget 2024-25 $‘000 | Post 2024-25 $‘000 | |||||||||||||||
LEGISLATIVE ASSEMBLY OF QUEENSLAND |
| |||||||||||||||||||
Property, Plant and Equipment | ||||||||||||||||||||
Other property, plant and equipment | 305 | 1,577 | Ongoing | |||||||||||||||||
Information technology network infrastructure | 305 | 1,043 | Ongoing | |||||||||||||||||
Queensland Parliament digital transformation program | 305 | 1,891 | 865 | 1,026 | ||||||||||||||||
|
| |||||||||||||||||||
Total Property, Plant and Equipment | 3,646 | |||||||||||||||||||
|
| |||||||||||||||||||
TOTAL LEGISLATIVE ASSEMBLY OF QUEENSLAND (PPE) |
| 3,646 | ||||||||||||||||||
|
| |||||||||||||||||||
63
Capital Statement 2024-25
| 3.10 | PREMIER AND CABINET |
The Department of the Premier and Cabinet (including Ministerial Offices and Office of the Leader of the Opposition) has planned capital purchases of $1.1 million in 2024-25.
Department of the Premier and Cabinet
Program Highlights (Property, Plant and Equipment)
| • | $749,000 for ongoing upgrades to and maintenance of departmental ICT systems and other minor works. |
| • | $311,000 for ongoing upgrades and maintenance of existing Ministerial Services ICT systems and other minor works. |
| Premier and Cabinet | ||||||||||||||||||||
Project | Statistical Area | Total Estimated Cost $‘000 | Expenditure to 30-06-24 $‘000 | Budget 2024-25 $‘000 | Post 2024-25 $‘000 | |||||||||||||||
DEPARTMENT OF PREMIER AND CABINET | ||||||||||||||||||||
Property, Plant and Equipment | ||||||||||||||||||||
Departmental ICT systems and other minor works | 305 | 749 | Ongoing | |||||||||||||||||
Ministerial Offices and Office of the Leader of the Opposition - ICT systems and other minor works | 305 | 311 | Ongoing | |||||||||||||||||
|
| |||||||||||||||||||
Total Property, Plant and Equipment | 1,060 | |||||||||||||||||||
|
| |||||||||||||||||||
TOTAL PREMIER AND CABINET (PPE) | 1,060 | |||||||||||||||||||
|
| |||||||||||||||||||
64
Capital Statement 2024-25
| 3.11 | QUEENSLAND CORRECTIVE SERVICES |
Queensland Corrective Services’ 2024-25 capital program of $227.9 million will primarily focus on correctional centre expansion and enhancements.
Queensland Corrective Services
Program Highlights (Property, Plant and Equipment)
| • | $97.3 million of a total $885.3 million to complete construction of Lockyer Valley Correctional Centre (formerly Southern Queensland Correctional Precinct – Stage 2) and acquire video conference suites and other property, plant and equipment for prison industries. The new centre will be a modern, purpose-built facility with over 1,500 beds and will enable a focus on health and rehabilitation to reduce reoffending. |
| • | $46 million of a total $246.4 million for infrastructure upgrades as part of the asset improvement program. |
| • | $22.5 million of a total $79.8 million to construct additional prison capacity to sustainably manage a growing prisoner population. |
| • | $22.6 million of a total $71.8 million to progress infrastructure works and support ongoing maintenance and replacement programs. |
| • | $19.2 million of a total $31.8 million to install information technology infrastructure in correctional centres to enhance the provision of health care. |
| • | $13.9 million to acquire other property, plant and equipment. |
| • | $4.5 million of a total $8 million to install additional bunk beds in high security correctional centres across Queensland to manage the increasing prisoner population. |
| • | $1.9 million of a total $2.8 million for office accommodation to support the management of dangerous prisoners (sexual offenders) at the Wacol precinct. |
| Queensland Corrective Services | ||||||||||||||||||||
Project | Statistical Area | Total Estimated Cost $‘000 | Expenditure to 30-06-24 $‘000 | Budget 2024-25 $‘000 | Post 2024-25 $‘000 | |||||||||||||||
QUEENSLAND CORRECTIVE SERVICES | ||||||||||||||||||||
Property, Plant and Equipment | ||||||||||||||||||||
Major works - correctional centres | ||||||||||||||||||||
Lockyer Valley Correctional Centre (formerly Southern Queensland Correctional Precinct – Stage 2) | ||||||||||||||||||||
Lockyer Valley Correctional Centre construction | 310 | 879,878 | 787,978 | 91,900 | ||||||||||||||||
Lockyer Valley Correctional Centre property, plant and equipment | 310 | 5,390 | 5,390 | |||||||||||||||||
|
| |||||||||||||||||||
Sub-total Lockyer Valley Correctional Centre (formerly Southern Queensland Correctional Precinct – Stage 2) | 97,290 | |||||||||||||||||||
|
| |||||||||||||||||||
Information technology infrastructure | Various | 31,750 | 770 | 19,217 | 11,763 | |||||||||||||||
|
| |||||||||||||||||||
Sub-total Major works - correctional centres | 116,507 | |||||||||||||||||||
|
| |||||||||||||||||||
65
Capital Statement 2024-25
| Queensland Corrective Services | ||||||||||||||||||||
Project | Statistical Area | Total Estimated Cost $‘000 | Expenditure to 30-06-24 $‘000 | Budget 2024-25 $‘000 | Post 2024-25 $‘000 | |||||||||||||||
Correctional centre enhancements | ||||||||||||||||||||
Prison capacity uplift | ||||||||||||||||||||
Palen Creek Correctional Centre | 311 | 27,200 | 10,000 | 17,200 | ||||||||||||||||
Townsville Correctional Centre | 318 | 21,950 | 5,200 | 16,750 | ||||||||||||||||
Numinbah Correctional Centre | 309 | 17,900 | 4,580 | 13,320 | ||||||||||||||||
Lotus Glen Correctional Centre | 315 | 12,700 | 2,700 | 10,000 | ||||||||||||||||
|
| |||||||||||||||||||
Sub-total Prison capacity uplift | 22,480 | |||||||||||||||||||
|
| |||||||||||||||||||
Infrastructure works | Various | 71,770 | 49,123 | 22,647 | ||||||||||||||||
Additional bunk beds | Various | 8,000 | 3,500 | 4,500 | ||||||||||||||||
|
| |||||||||||||||||||
Sub-total Correctional centre enhancements | 49,627 | |||||||||||||||||||
|
| |||||||||||||||||||
Asset improvement program | ||||||||||||||||||||
Asset improvement program | Various | 246,413 | 46,000 | 200,413 | ||||||||||||||||
|
| |||||||||||||||||||
Sub-total Asset improvement program | 46,000 | |||||||||||||||||||
|
| |||||||||||||||||||
Community corrections enhancements | ||||||||||||||||||||
High Risk Offender Management Unit resourcing | 310 | 2,838 | 946 | 1,892 | ||||||||||||||||
|
| |||||||||||||||||||
Sub-total Community corrections enhancements | 1,892 | |||||||||||||||||||
|
| |||||||||||||||||||
Other acquisitions of property, plant and equipment | ||||||||||||||||||||
Other acquisitions of property, plant and equipment | Various | 13,880 | Ongoing | |||||||||||||||||
|
| |||||||||||||||||||
Sub-total Other acquisitions of property, plant and equipment | 13,880 | |||||||||||||||||||
|
| |||||||||||||||||||
Total Property, Plant and Equipment | 227,906 | |||||||||||||||||||
|
| |||||||||||||||||||
TOTAL QUEENSLAND CORRECTIVE SERVICES (PPE) |
| 227,906 | ||||||||||||||||||
|
| |||||||||||||||||||
66
Capital Statement 2024-25
| 3.12 | QUEENSLAND FIRE DEPARTMENT |
The 2024–25 Queensland Fire Department capital program of $138.4 million supports the provision of fire and rescue, and rural fire services throughout Queensland. The program will fund facilities, fire appliances and essential operational equipment.
Queensland Fire and Rescue
Program Highlights (Property, Plant and Equipment)
| • | $23.8 million for replacement and new fire and rescue appliances. |
| • | $7.6 million to complete the delivery of the replacement permanent and auxiliary fire and rescue station at Airlie Beach. |
| • | $6.2 million for operational equipment including specialised firefighting, scientific analysis and detection, breathing apparatus, and rescue equipment. |
| • | $5 million for enhanced firefighter safety equipment such as thermal imaging cameras and rapid intervention team kits. |
| • | $5 million to continue the delivery of the new permanent fire and rescue station at Greater Springfield. |
| • | $4.3 million for minor works across permanent and auxiliary fire and rescue stations across Queensland. |
| • | $4 million for remediation works associated with per- and polyfluoroalkyl substances (PFAS) at the Ayr Fire and Rescue Station, with further planning around the future of the site to be undertaken. |
| • | $3 million to continue the delivery of the replacement permanent and auxiliary fire and rescue station at Drayton. |
| • | $3 million to continue the delivery of the replacement permanent fire and rescue station at Gympie South. |
| • | $3 million for land acquisitions for replacement facilities at Babinda, Highfields, and other future strategic areas. |
| • | $2.5 million to commence the upgrade and refurbishment of the auxiliary fire and rescue station at Boonah. |
| • | $2.5 million to commence the delivery of the replacement permanent fire and rescue station at Beerwah. |
| • | $2.3 million to complete the new permanent fire and rescue station at Caloundra South. |
| • | $2 million to commence the replacement of the permanent fire and rescue station at Caloundra. |
| • | $1.1 million to complete the delivery of the upgrade and refurbishment to the auxiliary station at Mitchell. |
Rural Fire Service Queensland
Program Highlights (Property, Plant and Equipment)
| • | $19.5 million for replacement and new rural fire appliances. |
| • | $6.4 million for operational equipment including specialised firefighting, breathing apparatus, and rescue equipment. |
| • | $5.9 million to complete the delivery of new or upgraded rural fire brigade stations across Queensland. |
67
Capital Statement 2024-25
| • | $4.2 million to continue the delivery of the fire and emergency services complex at Bamaga. |
| • | $1.6 million for the retrofitting of cabin deluge systems into rural fire appliances. |
| • | $1.5 million to continue the delivery of the new Maryborough area brigade headquarters. |
| • | $1.5 million to upgrade rural fire service facilities. |
| • | $500,000 for rural land acquisitions. |
Queensland Fire Department
Program Highlights (Property, Plant and Equipment)
| • | $17.5 million to commence refurbishment of the new Queensland Fire Department State Headquarters |
| • | $4.5 million to commence the delivery of the replacement Fire Communications Centre at Cairns. |
Queensland Reconstruction Authority
In 2024-25, the Queensland Reconstruction Authority has capital grants of more than $1.281 billion to support the Queensland Government’s program of infrastructure renewal and recovery within disaster-affected communities, and to help build disaster resilience across Queensland.
Program Highlights (Capital Grants)
| • | $1.214 billion for Disaster Recovery Funding Arrangements (DRFA), will be paid to councils for reconstruction, betterment and other projects relating to natural disaster events between 2020 and 2024. This program is jointly funded by the Queensland Government and the Australian Government. |
| • | $38.2 million towards high priority disaster resilience and mitigation infrastructure projects jointly funded by the Queensland and Australian Governments from DRFA Efficiencies. |
| • | $13.1 million for the Queensland Resilience and Risk Reduction Fund, as part of a National Partnership Agreement, jointly funded with the Australian Government, to support disaster mitigation projects and build resilience to natural disasters over 5 years. |
| • | $7 million for Recovery and Resilience Grants to support 14 local government areas hardest hit by the 2019 North Queensland Monsoon Trough, funded by the Australian Government. |
| • | $6.7 million for the Emergency Response Fund, to assist recovery and post-disaster initiatives in communities significantly impacted by the South East Queensland Rainfall and Flooding event, funded by the Australian Government. |
| • | $2 million for the North Queensland Natural Disasters Mitigation Program to help councils in North and Far North Queensland reduce their disaster risk and assist in reducing the growth of insurance costs for residents, businesses and the community. |
| • | $268,000 for the National Flood Mitigation Infrastructure Program to deliver projects that assist communities to prepare for future flood events, funded by the Australian Government. |
68
Capital Statement 2024-25
| Queensland Fire Department | ||||||||||||||||||||
Project | Statistical Area | Total Estimated Cost $‘000 | Expenditure to 30-06-24 $‘000 | Budget 2024-25 $‘000 | Post 2024-25 $‘000 | |||||||||||||||
QUEENSLAND FIRE DEPARTMENT | ||||||||||||||||||||
Property, Plant and Equipment | ||||||||||||||||||||
Buildings | ||||||||||||||||||||
Queensland Fire and Rescue Facilities | ||||||||||||||||||||
Airlie Beach replacement permanent and auxiliary fire and rescue station | 312 | 10,100 | 2,550 | 7,550 | ||||||||||||||||
Ayr Fire and Rescue Station remediation works | 318 | 4,000 | 4,000 | |||||||||||||||||
Beerwah replacement permanent fire and rescue station | 316 | 10,000 | 2,500 | 7,500 | ||||||||||||||||
Boonah auxiliary fire and rescue station upgrade and refurbishment | 310 | 2,500 | 2,500 | |||||||||||||||||
Caloundra replacement permanent fire and rescue station | 316 | 7,500 | 2,000 | 5,500 | ||||||||||||||||
Caloundra South new permanent fire and rescue station | 316 | 8,500 | 6,200 | 2,300 | ||||||||||||||||
Drayton replacement permanent and auxiliary fire and rescue station | 317 | 7,500 | 747 | 3,000 | 3,753 | |||||||||||||||
Greater Springfield new permanent fire and rescue station | 310 | 10,000 | 400 | 5,000 | 4,600 | |||||||||||||||
Gympie South replacement permanent fire and rescue station | 319 | 7,500 | 100 | 3,000 | 4,400 | |||||||||||||||
Mitchell auxiliary fire and rescue station upgrade and refurbishment | 307 | 2,200 | 1,100 | 1,100 | ||||||||||||||||
Minor works | Various | 4,317 | Ongoing | |||||||||||||||||
|
| |||||||||||||||||||
Sub-total Queensland Fire and Rescue Facilities | 37,267 | |||||||||||||||||||
|
| |||||||||||||||||||
Rural Fire Service Queensland Facilities | ||||||||||||||||||||
Abbot Point rural fire brigade station | 312 | 600 | 600 | |||||||||||||||||
Bamaga fire and emergency services complex | 315 | 4,900 | 300 | 4,200 | 400 | |||||||||||||||
Bell Town rural fire brigade station | 307 | 600 | 600 | |||||||||||||||||
Biddaddaba rural fire brigade station | 311 | 600 | 600 | |||||||||||||||||
Biggenden rural fire brigade station | 319 | 400 | 400 | |||||||||||||||||
Delaneys Creek rural fire brigade station | 313 | 1,000 | 1,000 | |||||||||||||||||
Maryborough area brigade headquarters | 319 | 7,150 | 2,500 | 1,500 | 3,150 | |||||||||||||||
Moore Linville rural fire brigade station | 313 | 700 | 150 | 550 | ||||||||||||||||
Mount Alford rural fire brigade station | 310 | 700 | 100 | 600 | ||||||||||||||||
Mount Ossa rural fire brigade station | 312 | 600 | 600 | |||||||||||||||||
Mulgowie rural fire brigade station | 310 | 600 | 600 | |||||||||||||||||
69
Capital Statement 2024-25
| Queensland Fire Department | ||||||||||||||||||||
Project | Statistical Area | Total Estimated Cost $‘000 | Expenditure to 30-06-24 $‘000 | Budget 2024-25 $‘000 | Post 2024-25 $‘000 | |||||||||||||||
Rural Fire Service Queensland facilities program | Various | 1,500 | Ongoing | |||||||||||||||||
Swan and Emu Creek rural fire brigade station | 307 | 350 | 350 | |||||||||||||||||
|
| |||||||||||||||||||
Sub-total Rural Fire Service Queensland Facilities | 13,100 | |||||||||||||||||||
|
| |||||||||||||||||||
Queensland Fire Department | ||||||||||||||||||||
Cairns Fire Communications Centre replacement | 306 | 8,500 | 4,500 | 4,000 | ||||||||||||||||
Queensland Fire Department State Headquarters | 305 | 27,500 | 17,500 | 10,000 | ||||||||||||||||
|
| |||||||||||||||||||
Sub-total Queensland Fire Department | 22,000 | |||||||||||||||||||
|
| |||||||||||||||||||
Sub-total Buildings | 72,367 | |||||||||||||||||||
|
| |||||||||||||||||||
Strategic Land Acquisitions | ||||||||||||||||||||
Babinda replacement fire and rescue station land acquisition | 306 | 250 | 250 | |||||||||||||||||
Highfields replacement fire and rescue station land acquisition | 317 | 2,000 | 2,000 | |||||||||||||||||
Rural Fire Service Queensland operations land acquisitions | Various | 500 | Ongoing | |||||||||||||||||
Queensland Fire and Rescue strategic land acquisitions | Various | 750 | Ongoing | |||||||||||||||||
|
| |||||||||||||||||||
Sub-total Strategic Land Acquisitions | 3,500 | |||||||||||||||||||
|
| |||||||||||||||||||
Plant and Equipment | ||||||||||||||||||||
Queensland Fire and Rescue | ||||||||||||||||||||
Queensland Fire and Rescue appliances | Various | 23,800 | Ongoing | |||||||||||||||||
Operational equipment | Various | 6,235 | Ongoing | |||||||||||||||||
Enhanced Firefighter Safety Equipment | Various | 5,000 | 5,000 | |||||||||||||||||
|
| |||||||||||||||||||
Sub-total Queensland Fire and Rescue | 35,035 | |||||||||||||||||||
|
| |||||||||||||||||||
Rural Fire Service Queensland | ||||||||||||||||||||
Rural Fire Service Queensland appliances | Various | 19,500 | Ongoing | |||||||||||||||||
Operational equipment | Various | 6,400 | Ongoing | |||||||||||||||||
Rural Fire Service Queensland deluge system retrofit | Various | 5,800 | 2,800 | 1,600 | 1,400 | |||||||||||||||
|
| |||||||||||||||||||
Sub-total Rural Fire Service Queensland | 27,500 | |||||||||||||||||||
|
| |||||||||||||||||||
Sub-total Plant and Equipment | 62,535 | |||||||||||||||||||
|
| |||||||||||||||||||
Total Property, Plant and Equipment | 138,402 | |||||||||||||||||||
|
| |||||||||||||||||||
70
Capital Statement 2024-25
| Queensland Fire Department | ||||||||||||||||||
Project | Statistical Area | Total Estimated Cost $‘000 | Expenditure to 30-06-24 $‘000 | Budget 2024-25 $‘000 | Post 2024-25 $‘000 | |||||||||||||
QUEENSLAND RECONSTRUCTION AUTHORITY | ||||||||||||||||||
Capital Grants | ||||||||||||||||||
Disaster Recovery Funding Arrangements | Various | 1,213,694 | Ongoing | |||||||||||||||
Efficiencies Fund | Various | 95,389 | 38,156 | 57,233 | ||||||||||||||
Queensland Resilience and Risk Reduction Fund | Various | 65,507 | 46,544 | 13,101 | 5,862 | |||||||||||||
Recovery and Resilience Grants | Various | 28,000 | 21,000 | 7,000 | ||||||||||||||
Emergency Response Fund | Various | 16,817 | 2,725 | 6,727 | 7,365 | |||||||||||||
North Queensland Natural Disasters Mitigation Program | Various | 10,000 | 8,000 | 2,000 | ||||||||||||||
National Flood Mitigation Infrastructure Program | Various | 10,794 | 10,526 | 268 | ||||||||||||||
|
| |||||||||||||||||
Total Capital Grants | 1,280,946 | |||||||||||||||||
|
| |||||||||||||||||
TOTAL QUEENSLAND FIRE DEPARTMENT (PPE) | 138,402 | |||||||||||||||||
|
| |||||||||||||||||
TOTAL QUEENSLAND FIRE DEPARTMENT (CG) | 1,280,946 | |||||||||||||||||
|
| |||||||||||||||||
71
Capital Statement 2024-25
| 3.13 | QUEENSLAND HEALTH |
QUEENSLAND HEALTH
Queensland Health is comprised of the Department of Health, the Queensland Ambulance Service (QAS) and 16 independent Hospital and Health Services (HHSs) situated across the state. The remainder of the Queensland Health portfolio includes the Queensland Mental Health Commission, the Office of the Health Ombudsman, the Council of the Queensland Institute of Medical Research (QIMR Berghofer) and Health and Wellbeing Queensland.
In 2024-25, the total capital investment program for the Queensland Health portfolio is $2.167 billion.
Queensland Health and Hospital and Health Services
The Queensland Health Capital Program delivers built infrastructure and digital technologies to enable the delivery of safe, high-quality health services to Queenslanders. The built infrastructure, equipment and technology requirements of Queensland Health are driven by clinical services planning and models of care. The demand on Queensland’s public health system is projected to increase significantly over the coming years, and Queensland Health continues to strategically position itself to respond to these pressures with innovative approaches to managing existing assets, leveraging emerging healthcare technology, and utilising contemporary building practices and driving optimal design outcomes.
Queensland Health also uses a strategic approach to forward planning which considers the needs of all Queenslanders, including efficiencies that can be leveraged across the statewide network. This ensures healthcare infrastructure and equipment programs are delivered at the right place, at the right time, for Queensland communities.
Program Highlights (Property, Plant and Equipment)
In 2024-25, Queensland Health will continue to invest in health infrastructure, capital works and purchases across a broad range of areas including hospitals, ambulance stations and vehicles, health technology, research and scientific services, mental health services, staff accommodation, and ICT.
Hospital and Health facility highlights in 2024-25 include:
$1.152 billion for the Capacity Expansion Program, a significant investment to help future proof our world-class health system, support patient flow services, and deliver around 2,200 additional beds. The program includes the new Bundaberg, Toowoomba, and Coomera hospitals, the new Queensland Cancer Centre, major hospital expansions at 11 sites across Queensland – including Brisbane, Cairns, Fraser Coast, Gold Coast, Ipswich, Logan, Mackay, Moreton Bay, Robina, Toowoomba, and Townsville.
$215 million under the Sustaining Capital Program for:
| • | Hospital and Health Services and the Department of Health to fund a range of minor capital projects, to efficiently replace and renew Queensland Health’s existing asset base to maintain business and service delivery. The program will seek to enhance, optimise, renew, and replace the asset base to ensure facilities and equipment are fit for purpose. |
| • | Enhancement of ageing rural and regional health facilities and staff accommodation as part of the next stage of the Queensland Health Building Rural and Remote Health Program. Locations include Darling Downs, Cairns and Hinterland, Central Queensland, Mackay, North West, South West, Central West, Torres and Cape, Townsville, West Moreton and |
72
Capital Statement 2024-25
Wide Bay Hospital and Health Services.
| • | Continued funding of the Accelerated Infrastructure Delivery Program with ongoing delivery of the Ripley Sub Acute Expansion and the Gold Coast University Hospital Sub Acute Expansion. |
$53.2 million in hospital car parking projects to meet increasing demand for parking, including:
| • | $43.2 million towards the Prince Charles Hospital Car Park, providing 1,503 car parks. |
| • | $10 million towards the construction of a multi-storey car park at the Queen Elizabeth II Jubilee Hospital, which will deliver 1,379 car parks to provide easier and more secure parking for patients, visitors and staff. |
$40.3 million towards the Gold Coast Secure Mental Health Unit to support delivery of a new 40 bed facility to help the recovery of consumers with severe and complex mental health disorders.
$39.8 million towards the Rockhampton Hospital Mental Health Ward Expansion, which will provide high quality treatment and care to more consumers in Rockhampton and surrounding areas experiencing mental illness.
$31.7 million towards the Caboolture Hospital Redevelopment Stage 1, delivering 130 additional beds and refurbishing critical clinal support services.
$28.8 million in Alcohol and Other Drug Community Treatment Facilities in Cairns, Ipswich and Bundaberg to help better meet the needs of young people and their families.
$27 million towards the Redland Hospital Expansion Stage 1, supporting delivery of 37 additional beds.
$24.3 million towards the Queensland Spinal Cord Injury Service, delivering infrastructure upgrades to existing facilities at the Princess Alexandra Hospital.
$19.7 million towards the Kirwan Health Campus Expansion and Refurbishment at Townsville to help deliver stronger public health services for north Queenslanders.
$16.6 million towards the Rockhampton Hospital Cardiac Hybrid Theatre, providing 6 new beds and delivering enhanced cardiac services that will allow patients to be treated closer to home.
$12 million to replace existing staff accommodation in Torres and Cape to provide appropriate, safe, and fit-for-purpose accommodation.
$11.2 million towards the Cairns Health and Innovation Centre which will deliver additional capacity for clinical services within the existing Cairns Hospital Precinct and provide necessary health education, training, and research facilities for future medical professionals in Cairns. This investment will support delivery of extensive master planning, design development and land acquisition which will all assist in determining the optimum location for the Cairns Health and Innovation Centre in close proximity to Cairns Hospital.
$11 million towards the Redland Hospital Expansion Project Stage 2, delivering a new 3 level, 43 bed Mental Health and Allied Health building.
$10.1 million towards the Cairns Hospital Mental Health Unit that will help provide additional capacity and a better environment to help people in their recovery from mental illness.
$8 million to completely redevelop and deliver a contemporary Cooktown Multi-Purpose Health Service facility to support modern models of care including maternity, paediatrics, mental health
73
Capital Statement 2024-25
and palliative care, increasing bed numbers by 50%. This redevelopment will also support culturally safe services for the local Cook Shire catchment in Far North Queensland.
$6.6 million for the Satellite Hospitals Program, to finalise the program and deliver additional chemotherapy services at the Bribie Island Satellite Hospital.
$6 million for the Fraser Coast Mental Health Project, supporting delivering of a new 22 bed facility that will enhance mental health services in Hervey Bay.
$6 million for the Cairns Operational Centre and Regional Office Redevelopment for Queensland Ambulance Services.
Queensland Ambulance Service
In 2024-25, the QAS will invest $99.5 million in enabling critical infrastructure to support essential frontline services to provide timely, quality, and appropriate patient focused pre-hospital emergency and non-emergency care and services to the community. Highlights of the capital program include:
| • | $39.8 million to commission 155 new and replacement ambulance vehicles including the continued rollout of power assisted stretchers incorporating $1.5 million for the fit out of emergency response vehicles. |
| • | $13 million for the planning, design, and construction phases for the redevelopment of the Gold Coast Operations Centre (Coomera) and investigations required for the replacement of Southport Ambulance Station and Pimpama Ambulance Station. |
| • | $14.3 million for the planning, design, and construction phases for the relocation of the Springwood Ambulance Station and Sandgate Ambulance Station and planning works for the replacement of Beenleigh Ambulance Station. |
| • | $12.5 million investment in minor works at various existing stations to improve functionality, amenities and prolong useful life. |
| • | $8 million in operational equipment to support frontline services. |
| • | $6 million investment in the acquisition of strategically located land to accommodate future expansion of services aligned with identified growth areas. |
| • | $5.8 million investment in information and communication technology for software. development projects to enhance patient care and service delivery. |
Council of the Queensland Institute of Medical Research
The 2024-25 QIMR Berghofer capital program will invest $21 million for the acquisition of new and/or replacement state-of-the-art scientific equipment and research facilities, including a provision to complete the building cladding replacement program.
Queensland Health
Project | Statistical Area | Total Estimated Cost $‘000 | Expenditure to 30-06-24 $‘000 | Budget 2024-25 $‘000 | Post 2024-25 $‘000 | |||||||||||||||
QUEENSLAND HEALTH AND HOSPITAL AND HEALTH SERVICES |
| |||||||||||||||||||
Property, Plant and Equipment ¹ | ||||||||||||||||||||
Hospital and Health Services | ||||||||||||||||||||
Advancing Queensland Health Infrastructure Program | Various | 238,225 | 220,709 | 7,893 | 9,623 | |||||||||||||||
74
Capital Statement 2024-25
| Queensland Health | ||||||||||||||||||
Project | Statistical Area | Total Estimated Cost $‘000 | Expenditure to 30-06-24 $‘000 | Budget 2024-25 $‘000 | Post 2024-25 $‘000 | |||||||||||||
Alcohol and Other Drug Community Treatment Program | Various | 54,904 | 7,308 | 18,800 | 28,796 | |||||||||||||
Better Care Together | Various | 262,501 | 64,053 | 66,691 | 131,757 | |||||||||||||
Building Better Hospitals | ||||||||||||||||||
Caboolture Hospital Redevelopment Stage 1 ² | 313 | 367,700 | 318,388 | 31,666 | 17,646 | |||||||||||||
Ipswich Hospital Expansion Stage 1A ² | 310 | 100,964 | 91,726 | 3,500 | 5,738 | |||||||||||||
Logan Hospital Expansion and Maternity Services Upgrade ² ³ | 311 | 479,759 | 383,201 | 24,252 | 72,306 | |||||||||||||
Building Rural and Remote Health Program | Various | 95,219 | 72,801 | 8,600 | 13,818 | |||||||||||||
Cairns Bay Village Project | 306 | 12,000 | 450 | 3,000 | 8,550 | |||||||||||||
Cairns Hospital Emergency Department Expansion | 306 | 30,000 | 19,658 | 2,554 | 7,788 | |||||||||||||
Cairns Hospital Mental Health Unit | 306 | 82,200 | 62,153 | 10,050 | 9,997 | |||||||||||||
Cairns Hospital Research Education and Innovation Centre Stage 1 | 306 | 77,361 | 11,892 | 11,200 | 54,269 | |||||||||||||
Cairns Youth Alcohol and Other Drug (AOD) Community Treatment Facility | 306 | 17,821 | 4,952 | 10,000 | 2,869 | |||||||||||||
Capacity Expansion Program | ||||||||||||||||||
New Bundaberg Hospital | 319 | 1,200,000 | 78,548 | 68,125 | 1,053,327 | |||||||||||||
New Coomera Hospital | 309 | 1,300,000 | 84,277 | 120,000 | 1,095,723 | |||||||||||||
New Toowoomba Hospital | 317 | 1,300,000 | 58,531 | 180,000 | 1,061,469 | |||||||||||||
Capacity Expansion Program - Rest of Program 4 | Various | 7,415,000 | 299,990 | 784,226 | 6,330,784 | |||||||||||||
Capital Infrastructure Projects - CHQ | 305 | 3,911 | 2,246 | 1,665 | ||||||||||||||
Community Health and Hospitals Program | ||||||||||||||||||
Caboolture Hospital Chemotherapy Chairs | 313 | 10,000 | 7,410 | 2,000 | 590 | |||||||||||||
Logan Urgent and Specialist Care Centre | 311 | 33,400 | 4,077 | 29,323 | ||||||||||||||
Redland Hospital Expansion - Stage 1 5 | 301 | 77,943 | 38,007 | 27,000 | 12,936 | |||||||||||||
Cooktown Multipurpose Health Service facility | 315 | 200,000 | 8,000 | 192,000 | ||||||||||||||
Dakabin Family and Community Place | 314 | 9,874 | 3,330 | 5,800 | 744 | |||||||||||||
Fraser Coast Mental Health Project | 319 | 54,478 | 35,877 | 5,973 | 12,628 | |||||||||||||
Gold Coast Secure Mental Health Rehabilitation Unit | 309 | 122,744 | 66,486 | 40,255 | 16,003 | |||||||||||||
Kirwan Health Campus | 318 | 45,220 | 19,505 | 19,715 | 6,000 | |||||||||||||
Mackay Community Mental Health Refurbishment | 312 | 6,000 | 465 | 5,535 | ||||||||||||||
Moura Multi-Purpose Healthcare Service | 308 | 17,200 | 983 | 10,436 | 5,781 | |||||||||||||
75
Capital Statement 2024-25
| Queensland Health | ||||||||||||||||||
Project | Statistical Area | Total Estimated Cost $‘000 | Expenditure to 30-06-24 $‘000 | Budget 2024-25 $‘000 | Post 2024-25 $‘000 | |||||||||||||
Princess Alexandra Hospital Limited Care Dialysis Unit Refurbishment | 303 | 8,504 | 4,854 | 642 | 3,008 | |||||||||||||
Proserpine Hospital Acute Primary Care Clinic Upgrade | 312 | 5,000 | 25 | 4,975 | ||||||||||||||
QAS Cairns Operational Centre and Regional Office Redevelopment | 306 | 14,711 | 1,289 | 6,000 | 7,422 | |||||||||||||
Queen Elizabeth II Jubilee Hospital Car Park | 303 | 29,810 | 10,000 | 19,810 | ||||||||||||||
Queensland Spinal Cord Injury Service | 303 | 29,297 | 5,000 | 24,297 | ||||||||||||||
Redland Hospital Expansion Project – Stage 2 | 301 | 150,000 | 1,000 | 11,000 | 138,000 | |||||||||||||
Rockhampton Hospital Cardiac Hybrid Theatre | 308 | 28,937 | 1,199 | 16,635 | 11,103 | |||||||||||||
Rockhampton Hospital Mental Health Ward Expansion | 308 | 91,900 | 1,004 | 39,839 | 51,057 | |||||||||||||
Rural and Regional Renal Program | Various | 22,052 | 7,756 | 6,570 | 7,726 | |||||||||||||
Satellite Hospitals Program | Various | 363,900 | 336,716 | 6,584 | 20,600 | |||||||||||||
Staff Accommodation Program | Various | 21,104 | 2,477 | 2,160 | 16,467 | |||||||||||||
The Prince Charles Hospital Car park | 302 | 92,840 | 47,428 | 43,233 | 2,179 | |||||||||||||
Townsville University Hospital Hybrid Theatre | 318 | 17,000 | 7,965 | 6,683 | 2,352 | |||||||||||||
Woorabinda Multi-Purpose Health Service | 308 | 17,241 | 3,632 | 11,109 | 2,500 | |||||||||||||
Workforce Accommodation (Torres) | Various | 12,000 | 12,000 | |||||||||||||||
Yeronga Child and Youth Community Health Hub | 303 | 7,835 | 1,067 | 3,620 | 3,148 | |||||||||||||
Statewide Other Construction and Acquisitions 6 | Various | 8,077 | Ongoing | |||||||||||||||
Sustaining Capital Program | Various | 215,042 | Ongoing | |||||||||||||||
Information Communication and Technology | ||||||||||||||||||
Information Communication and Technology | 305 | 501,227 | 204,756 | 97,778 | 198,693 | |||||||||||||
Central Queensland | ||||||||||||||||||
Central Queensland - ROU Lease | Various | 590 | 412 | 178 | ||||||||||||||
Central West | ||||||||||||||||||
Central West - ROU Lease | 315 | 1,562 | 429 | 406 | 727 | |||||||||||||
Mackay | ||||||||||||||||||
Mackay - ROU Lease | 312 | 4,741 | 1,183 | 1,315 | 2,243 | |||||||||||||
Metro North | ||||||||||||||||||
Caboolture Hospital Redevelopment Digital Project | 305 | 20,000 | 13,318 | 6,682 | ||||||||||||||
Metro South | ||||||||||||||||||
76
Capital Statement 2024-25
| Queensland Health | ||||||||||||||||||||
Project | Statistical Area | Total Estimated Cost $‘000 | Expenditure to 30-06-24 $‘000 | Budget 2024-25 $‘000 | Post 2024-25 $‘000 | |||||||||||||||
Metro South - Capital Projects | 305 | 55,549 | 53,291 | 1,650 | 608 | |||||||||||||||
Sunshine Coast | ||||||||||||||||||||
Sunshine Coast University Hospital Group 4 ICT Project | 316 | 57,000 | 54,954 | 2,046 | ||||||||||||||||
Sunshine Coast - Capital Projects | 316 | 12,975 | 11,659 | 1,316 | ||||||||||||||||
Queensland Ambulance Service | ||||||||||||||||||||
Beenleigh Ambulance Station Replacement | 311 | 16,500 | 468 | 200 | 15,832 | |||||||||||||||
Sandgate Ambulance Station Replacement | 302 | 10,807 | 671 | 8,136 | 2,000 | |||||||||||||||
Pimpama Redevelopment | 309 | 5,500 | 198 | 100 | 5,202 | |||||||||||||||
Springwood Station Replacement | 311 | 8,089 | 242 | 6,012 | 1,835 | |||||||||||||||
Southport Ambulance Station Redevelopment | 309 | 14,000 | 494 | 100 | 13,406 | |||||||||||||||
Operational Equipment | 305 | 7,950 | Ongoing | |||||||||||||||||
Ambulance Vehicles Purchases | 305 | 39,800 | Ongoing | |||||||||||||||||
Information Systems Development | 305 | 5,750 | Ongoing | |||||||||||||||||
Minor Works | 305 | 12,500 | Ongoing | |||||||||||||||||
Strategic Land Acquisitions | 305 | 6,000 | Ongoing | |||||||||||||||||
Gold Coast Operations Centre Redevelopment (Coomera) | 309 | 19,870 | 5,542 | 13,000 | 1,328 | |||||||||||||||
|
| |||||||||||||||||||
Total Property, Plant and Equipment | 2,145,644 | |||||||||||||||||||
|
| |||||||||||||||||||
COUNCIL OF THE QUEENSLAND INSTITUTE OF MEDICAL RESEARCH |
| |||||||||||||||||||
Property, Plant and Equipment | ||||||||||||||||||||
Other scientific equipment - QIMRB | 305 | 20,968 | Ongoing | |||||||||||||||||
|
| |||||||||||||||||||
Total Property, Plant and Equipment | 20,968 | |||||||||||||||||||
|
| |||||||||||||||||||
TOTAL QUEENSLAND HEALTH (PPE) | 2,166,612 | |||||||||||||||||||
|
| |||||||||||||||||||
Notes:
| 1. | Total estimated cost may include both capital and non-capital components. |
| 2. | Total estimated cost includes funding of $3 million from South-East Queensland - Planning for Growth. |
| 3. | Total funding for the Logan Maternity Services Upgrade includes funding of $1.5 million from the Hospital and Health Services. |
| 4. | Total funding includes $375 million Australian Government funding and $55 million philanthropic contributions. |
| 5. | Total funding includes $30 million Australian Government funding. |
| 6. | Amount is net of non-capital component of project expenditure. |
77
Capital Statement 2024-25
| 3.14 | QUEENSLAND POLICE SERVICE |
Queensland Police Service
The 2024-25 Queensland Police Service capital program of $684.2 million will support the delivery of quality frontline services throughout Queensland. The program will fund facilities, motor vehicles, aviation assets, vessels and other essential equipment.
Police and Community Safety
Program Highlights (Property, Plant and Equipment)
| • | $200 million to complete the Youth Remand Facility at Wacol. |
| • | $124.6 million for the Police Aerial Support Capability - POLAIR SEQ. |
| • | $78.2 million for the aircraft capability program. |
| • | $47.7 million for new and replacement police service vehicles. |
| • | $32.4 million to continue the replacement police facilities at Cunnamulla, Hervey Bay and Kirwan. |
| • | $25 million to continue the new police facility at Ripley and the upgrade of the Warwick police facility. |
| • | $22 million for minor capital works and other plant and equipment across the state. |
| • | $18.1 million for the Public Safety Network. |
| • | $16.9 million for information and communications technology. |
| • | $16 million for new and replacement police service vessels. |
| • | $14.6 million for Camera Detected Offence Program equipment. |
| • | $14.3 million to complete the replacement police facilities at Clermont, Cooroy, Dayboro and Rosewood and the new police facility at Caloundra South. |
| • | $9.8 million to complete the upgrade of the police facilities at Cairns, Mackay and Maryborough. |
| • | $8.3 million to continue the replacement police facilities at Longreach, Proserpine, Rainbow Beach and Winton, and the multi-agency community safety facility at Palm Island. |
| • | $5.5 million for upgrades and replacements to air conditioning and closed circuit cameras at police facilities across the state. |
| • | $5.5 million for the new residential accommodation at Mount Isa. |
| • | $3.3 million for Queensland Ambulance Service information systems development. |
| • | $2.8 million for Queensland Fire Department information and communications systems and equipment. |
| • | $2.7 million for mobile capability and the development of new applications for the Queensland Police Service QLiTe mobile tablet devices. |
| • | $2.6 million for land acquisitions. |
| • | $2.5 million to modernise and upgrade the police network of watchhouses. |
| • | $2.1 million for aviation capability - Remotely Piloted Aircraft System. |
| • | $1.2 million for aircraft maintenance. |
| • | $300,000 to commence the upgrade of the police facilities at Bundaberg and the replacement water police facility at Hervey Bay. |
78
Capital Statement 2024-25
Program Highlights (Capital Grant)
| • | $15 million for PCYC Caloundra. |
| • | $2 million for PCYC Redcliffe. |
Marine Rescue Queensland
Program Highlights (Property, Plant and Equipment)
| • | $7.1 million for the Marine Rescue Vessel Replacement Program. |
State Emergency Service
Program Highlights (Capital Grant)
| • | $3.8 million for State Emergency Service capital grants. |
| Queensland Police Service |
Project | Statistical Area | Total Estimated Cost $‘000 | Expenditure to 30-06-24 $‘000 | Budget 2024-25 $‘000 | Post 2024-25 $‘000 | |||||||||||||||
QUEENSLAND POLICE SERVICE | ||||||||||||||||||||
Property, Plant and Equipment | ||||||||||||||||||||
Buildings/General Works | ||||||||||||||||||||
Bundaberg police facility upgrade | 319 | 20,000 | 100 | 19,900 | ||||||||||||||||
Cairns police facility upgrade | 306 | 21,000 | 18,744 | 2,256 | ||||||||||||||||
Caloundra South new police facility | 316 | 13,500 | 10,365 | 3,135 | ||||||||||||||||
Clermont replacement police facility | 312 | 5,755 | 801 | 4,954 | ||||||||||||||||
Cooroy replacement police facility | 316 | 6,100 | 4,873 | 1,227 | ||||||||||||||||
Cunnamulla replacement police facility | 315 | 16,500 | 540 | 1,200 | 14,760 | |||||||||||||||
Dayboro replacement police facility | 314 | 6,700 | 4,309 | 2,391 | ||||||||||||||||
Hervey Bay replacement police facility | 319 | 28,000 | 150 | 1,000 | 26,850 | |||||||||||||||
Hervey Bay replacement water police facility | 319 | 3,800 | 200 | 3,600 | ||||||||||||||||
Kirwan replacement police facility | 318 | 45,000 | 3,277 | 30,180 | 11,543 | |||||||||||||||
Longreach replacement police facility | 315 | 13,800 | 19 | 1,081 | 12,700 | |||||||||||||||
Mackay police facility upgrade | 312 | 4,000 | 605 | 3,395 | ||||||||||||||||
Maryborough police facility upgrade | 319 | 4,800 | 668 | 4,132 | ||||||||||||||||
Mount Isa new residential accommodation | 315 | 5,750 | 232 | 5,518 | ||||||||||||||||
Palm Island multi-agency community safety facility | 318 | 18,000 | 100 | 200 | 17,700 | |||||||||||||||
Proserpine replacement police facility | 312 | 7,600 | 511 | 5,989 | 1,100 | |||||||||||||||
79
Capital Statement 2024-25
Queensland Police Service
Project | Statistical Area | Total Estimated Cost $‘000 | Expenditure to 30-06-24 $‘000 | Budget 2024-25 $‘000 | Post 2024-25 $‘000 | |||||||||||||||
Rainbow Beach replacement police facility | 319 | 2,300 | 50 | 500 | 1,750 | |||||||||||||||
Ripley new police facility | 310 | 34,000 | 1,616 | 15,000 | 17,384 | |||||||||||||||
Rosewood replacement police facility | 310 | 5,433 | 2,854 | 2,579 | ||||||||||||||||
Wacol Youth Remand Facility | 310 | 260,500 | 60,500 | 200,000 | ||||||||||||||||
Watchhouse Modernisation Program | Various | 2,500 | 2,500 | |||||||||||||||||
Warwick police facility upgrade | 307 | 21,000 | 1,629 | 10,000 | 9,371 | |||||||||||||||
Winton replacement police facility | 315 | 4,600 | 57 | 500 | 4,043 | |||||||||||||||
|
| |||||||||||||||||||
Sub-total Buildings/General Works | 298,037 | |||||||||||||||||||
|
| |||||||||||||||||||
Land | ||||||||||||||||||||
Land acquisition | Various | 2,603 | Ongoing | |||||||||||||||||
|
| |||||||||||||||||||
Sub-total Land | 2,603 | |||||||||||||||||||
|
| |||||||||||||||||||
Plant and Equipment | ||||||||||||||||||||
Marine Rescue Queensland | ||||||||||||||||||||
Marine Rescue Vessel Replacement Program | Various | 7,064 | Ongoing | |||||||||||||||||
Police and Community Safety | ||||||||||||||||||||
Air conditioning plant replacement program | Various | 4,000 | Ongoing | |||||||||||||||||
Police Aerial Support Capability - POLAIR SEQ | Various | 124,599 | 124,599 | |||||||||||||||||
Aircraft Capability Program | Various | 146,301 | 68,089 | 78,212 | ||||||||||||||||
Aircraft Maintenance | Various | 1,200 | Ongoing | |||||||||||||||||
Aviation Capability - Remotely Piloted Aircraft System | Various | 2,289 | 189 | 2,100 | ||||||||||||||||
Camera Detected Offence Program | Various | 14,567 | Ongoing | |||||||||||||||||
Closed circuit camera upgrades in various police facilities | Various | 1,500 | Ongoing | |||||||||||||||||
Information and communication technology | Various | 16,877 | Ongoing | |||||||||||||||||
Minor works | Various | 10,350 | Ongoing | |||||||||||||||||
Mobile capability | Various | 2,720 | Ongoing | |||||||||||||||||
New and replacement vehicles | Various | 47,682 | Ongoing | |||||||||||||||||
Police vessel management program | Various | 16,005 | Ongoing | |||||||||||||||||
Public Safety Network | Various | 18,124 | Ongoing | |||||||||||||||||
Queensland Ambulance Service information systems development | Various | 3,250 | Ongoing | |||||||||||||||||
Queensland Fire Department information and communications systems and equipment | Various | 2,828 | Ongoing | |||||||||||||||||
80
Capital Statement 2024-25
Queensland Police Service
Project | Statistical Area | Total Estimated Cost $‘000 | Expenditure to 30-06-24 $‘000 | Budget 2024-25 $‘000 | Post 2024-25 $‘000 | |||||||||||||||
Other plant and equipment | Various | 11,692 | Ongoing | |||||||||||||||||
|
| |||||||||||||||||||
Sub-total Plant and Equipment | 362,770 | |||||||||||||||||||
|
| |||||||||||||||||||
Total Property, Plant and Equipment | 663,410 | |||||||||||||||||||
|
| |||||||||||||||||||
Capital Grants | ||||||||||||||||||||
Police and Community Safety | ||||||||||||||||||||
PCYC Caloundra | 316 | 15,000 | 15,000 | |||||||||||||||||
PCYC Redcliffe | 313 | 2,000 | 2,000 | |||||||||||||||||
State Emergency Service | ||||||||||||||||||||
State Emergency Service capital grants | Various | 3,786 | 3,786 | |||||||||||||||||
|
| |||||||||||||||||||
Total Capital Grants | 20,786 | |||||||||||||||||||
|
| |||||||||||||||||||
TOTAL QUEENSLAND POLICE SERVICE (PPE) |
| 663,410 | ||||||||||||||||||
|
| |||||||||||||||||||
TOTAL QUEENSLAND POLICE SERVICE (CG) |
| 20,786 | ||||||||||||||||||
|
| |||||||||||||||||||
81
Capital Statement 2024-25
| 3.15 | QUEENSLAND TREASURY |
Queensland Treasury has capital purchases of $41 million and capital grants of $154.8 million in 2024-25.
Program Highlights (Total Property, Plant and Equipment)
| • | $41 million to develop a Queensland Resources Common User Facility to support pilot and demonstration scale trials of processing methods and technologies for critical minerals and rare earth elements. |
Program Highlights (Capital Grants)
| • | $154.8 million through the Queensland First Home Owners’ Grant to assist first-time home buyers buying or building a new home with grants to get into the market sooner. |
| • | Preconstruction works on the Gympie Road Bypass Tunnel regarding voluntary land acquisitions. |
Queensland Treasury
Project | Statistical Area | Total Estimated Cost $‘000 | Expenditure to 30-06-24 $‘000 | Budget 2024-25 $‘000 | Post 2024-25 $‘000 | |||||||||||||||
QUEENSLAND TREASURY | ||||||||||||||||||||
Property, Plant and Equipment | ||||||||||||||||||||
Queensland Resources Common User Facility | 318 | 63,287 | 4,747 | 40,978 | 17,562 | |||||||||||||||
|
| |||||||||||||||||||
Total Property, Plant and Equipment | 40,978 | |||||||||||||||||||
|
| |||||||||||||||||||
Capital Grants | ||||||||||||||||||||
Queensland First Home Owners’ Grant | Various | 154,756 | Ongoing | |||||||||||||||||
Gympie Road Bypass voluntary land acquisitions 1 | 302 | — | Ongoing | |||||||||||||||||
|
| |||||||||||||||||||
Total Capital Grants | 154,756 | |||||||||||||||||||
|
| |||||||||||||||||||
TOTAL QUEENSLAND TREASURY (PPE) | 40,978 | |||||||||||||||||||
|
| |||||||||||||||||||
TOTAL QUEENSLAND TREASURY (CG) | 154,756 | |||||||||||||||||||
|
| |||||||||||||||||||
Note:
| 1. | Land acquisitions for the Gympie Road Bypass are voluntary in nature and subject to commercial negotiations. |
82
Capital Statement 2024-25
| 3.16 | REGIONAL DEVELOPMENT, MANUFACTURING AND WATER |
The Regional Development, Manufacturing and Water portfolio includes the Department of Regional Development, Manufacturing and Water, Gladstone Area Water Board, Mount Isa Area Water Board, Seqwater and Sunwater Limited. In 2024–25, the portfolio’s capital program includes capital purchases of $1.038 billion and capital grants of $147.2 million.
Department of Regional Development, Manufacturing and Water
The Regional Development, Manufacturing and Water has capital purchases of $3.5 million and capital grants of $147.2 million.
Program Highlights (Capital Grants)
| • | $195 million over 3 years, held centrally, subject to conditions to complete stage one of the Cairns Water Security Program. |
| • | $34.7 million through the Made in Queensland grants program to assist small to medium sized manufacturers to increase international competitiveness, productivity and innovation via the adoption of new technologies, systems and processes, and to generate high-skilled jobs for the future. |
| • | $26.4 million to continue the Mount Morgan Pipeline project, in partnership with the Australian Government, for Rockhampton Regional council to construct a drinking water pipeline from Gracemere to Mount Morgan providing reliability of water supply. |
| • | $20.1 million for Stage 1 of the Ayr Water Treatment Plant to support the Burdekin Shire Council in the delivery of safe and reliable drinking water to the community through the construction of a new water treatment plant and refurbishing of South Ayr bores. |
| • | $16.1 million as part of the $70 million Building our Regions program (Round 6) to assist water service providers to deliver water and sewerage projects that create regional and economic development opportunities, support local industry growth, generate jobs, and improve liveability in Queensland’s regional communities. |
| • | $15.3 million as part of the $26 million for the Lansdown Eco-Industrial Estate Precinct construction of a 13 kilometre raw water pipeline and pumping station connecting the Lansdown Eco-Industrial Precinct to the Haughton Pipeline, and a water reservoir. |
| • | $11.3 million through the Manufacturing Hubs Grant Program to assist regional small to medium sized manufacturers to become productive, build their advanced manufacturing capabilities and create the jobs of the future. |
| • | $6 million for the Toowoomba Regional Council to continue construction of water treatment and supply works for its 4 satellite communities of Cambooya, Greenmount, Nobby and Clifton. |
Gladstone Area Water Board
Total expenditure planned for 2024–25 is $354.8 million, and is focused on continuing and improving water security and the effective, reliable, and safe operation of Gladstone Area Water Board’s infrastructure, as well as ensuring the network meets the current and future needs of customers.
Program Highlights (Property, Plant and Equipment)
| • | $311.1 million for construction of the Fitzroy to Gladstone Pipeline, a water security initiative to address the single source supply risk from Lake Awoonga, delivering water from the |
83
Capital Statement 2024-25
Lower Fitzroy River to Gladstone Area Water Board’s existing network. |
| • | $5.9 million to continue planning for the augmentation of Gladstone Area Water Board’s network to supply water to new hydrogen and other industrial customers. |
| • | $5.5 million end of life replacement of the potable water pipeline from Boat Creek to East End and installation of a new raw water pipeline to service the northern industrial zone. |
| • | $3.4 million for construction of a solar installation at Awoonga Dam to facilitate the reduction of carbon emissions in line with Gladstone Area Water Board’s Climate Change Strategy and Action Plan 2021. |
| • | $1.6 million for planning and preparatory works for the Awoonga Dam improvement project to comply with dam safety standards for extreme weather events. |
Mount Isa Water Board
Total capital expenditure planned for 2024–25 is $7.9 million, and is focused on continuing and improving the cost-efficient, reliable, and safe operation of Mount Isa Water Board’s bulk water infrastructure.
Program Highlights (Property, Plant and Equipment)
| • | $1 million to continue replacing the aged timber poles and cross-arms of the Lake Julius 66kV power line with bushfire-resistant materials (concrete and steel). |
| • | $658,000 for planning work to install solar array systems at Mount Isa Terminal Reservoir and Clear Water Lagoon to improve energy reliability and efficiency. |
| • | $390,000 to finalise the renewal of Fred Haigh pump station high voltage yard and electromechanical equipment to improve operational reliability and efficiency. Complete compliance of the low voltage system and installation of the auto change over switch. |
| • | $342,000 for planning work to refurbish and renew the electro-mechanical equipment and civil structures of Col Popple pump station to improve operational reliability and efficiency. |
Seqwater
Total capital expenditure planned for 2024–25 is $421.2 million. The capital program is focused on delivering a safe, secure, and reliable water supply across South East Queensland, as well as planning and delivering dam improvement projects. Seqwater operates the South East Queensland Water Grid and has facilities located throughout the region. This requires a large program of renewals as well as upgrades and compliance-driven works to ensure effective operation.
Program Highlights (Property, Plant and Equipment)
| • | $71.4 million to commence construction on the Lake Macdonald Dam Improvement project to comply with dam safety standards for extreme weather events. |
| • | $56 million to continue pre-construction activities on the Toowoomba to Warwick Pipeline to provide a drought contingency for Warwick and surrounding communities and a permanent water supply for 4 Toowoomba satellite communities. |
| • | $38.8 million to continue planning and investigatory works for improvement projects to Wivenhoe, Somerset, and North Pine Dams to comply with dam safety standards for extreme weather events. |
| • | $30.5 million to continue planning and investigatory works for the Gold Coast Desalination Plant augmentation and associated infrastructure. |
| • | $6.3 million to continue planning and investigatory works for a new desalination plant in South East Queensland. |
| • | $1.1 million to complete construction of the South West Pipeline, a 24 kilometre pipeline to |
84
Capital Statement 2024-25
connect Beaudesert to the South East Queensland Water Grid. |
Sunwater Limited
Total capital expenditure planned for 2024–25 is $250.3 million. The capital program is focused on providing reliable water supply to regional Queensland and enhancing Sunwater’s dam infrastructure to continue operating safely during extreme weather conditions. It will also support the expansion of Sunwater’s Rocklea laboratory facility to produce commercial modelling for dam safety design and development programs.
Program Highlights (Property, Plant and Equipment)
| • | $109.6 million to continue planning and enabling works for a new Paradise Dam wall to meet dam safety standards and support economic growth, as part of the Queensland and Federal Government’s existing $1.2 billion commitment towards the project. |
| • | $73.9 million to continue planning and investigatory works for the raising and improvement of Burdekin Falls Dam, as part of the Queensland Government’s existing $540 million commitment towards the project. |
| Regional Development, Manufacturing and Water | ||||||||||||||||||
Project | Statistical Area | Total Estimated Cost $‘000 | Expenditure to 30-06-24 $‘000 | Budget 2024-25 $‘000 | Post 2024-25 $‘000 | |||||||||||||
DEPARTMENT OF REGIONAL DEVELOPMENT, MANUFACTURING AND WATER |
| |||||||||||||||||
Property, Plant and Equipment | ||||||||||||||||||
Other property, plant and equipment | Various | 3,500 | Ongoing | |||||||||||||||
|
| |||||||||||||||||
Total Property, Plant and Equipment | 3,500 | |||||||||||||||||
|
| |||||||||||||||||
Capital Grants | ||||||||||||||||||
Ayr Water Treatment Plant (Stage 1) | 318 | 33,444 | 10,033 | 20,067 | 3,344 | |||||||||||||
Building our Regions (Round 6) | Various | 70,000 | 33,889 | 16,111 | 20,000 | |||||||||||||
Fish-friendly water extraction project: | 307 | 6,774 | 5,351 | 704 | 719 | |||||||||||||
Condamine-Balonne and Border Rivers | ||||||||||||||||||
Great Artesian Basin Industry Partnership Program | Various | 9,000 | 5,000 | 2,000 | 2,000 | |||||||||||||
Great Artesian Basin Water Security Program | Various | 32,000 | 3,829 | 28,171 | ||||||||||||||
Lansdown Eco-Industrial Estate Precinct | 318 | 26,000 | 15,250 | 10,750 | ||||||||||||||
Made in Queensland | Various | 121,500 | 75,875 | 34,719 | 10,906 | |||||||||||||
Manufacturing Hub Grant Program | Various | 33,500 | 21,647 | 11,256 | 597 | |||||||||||||
Mount Morgan Pipeline | 308 | 70,350 | 41,500 | 26,350 | 2,500 | |||||||||||||
ReMade in Queensland | Various | 10,000 | 6,000 | 4,000 | ||||||||||||||
Southern Downs Drought Resilience Package | 307 | 7,640 | 5,730 | 1,910 | ||||||||||||||
Southern Downs smart reticulation and network monitoring | 307 | 8,500 | 3,400 | 2,975 | 2,125 | |||||||||||||
Toowoomba water treatment to four communities | 317 | 15,000 | 5,250 | 6,000 | 3,750 | |||||||||||||
|
| |||||||||||||||||
Total Capital Grants | 147,171 | |||||||||||||||||
|
| |||||||||||||||||
85
Capital Statement 2024-25
| Regional Development, Manufacturing and Water | ||||||||||||||||||||
Project | Statistical Area | Total Estimated Cost $‘000 | Expenditure to 30-06-24 $‘000 | Budget 2024-25 $‘000 | Post 2024-25 $‘000 | |||||||||||||||
GLADSTONE AREA WATER BOARD | ||||||||||||||||||||
Property, Plant and Equipment | ||||||||||||||||||||
Aldoga raw water pump station and pipeline | 308 | 10,130 | 150 | 5,482 | 4,498 | |||||||||||||||
Awoonga Dam improvement project - planning | 308 | 9,796 | 8,200 | 1,596 | ||||||||||||||||
Awoonga Dam pipeline remediation | 308 | 2,241 | 1,265 | 976 | ||||||||||||||||
Awoonga Dam solar farm | 308 | 4,200 | 775 | 3,425 | ||||||||||||||||
Benaraby Creek Main Crossing potable water pipeline replacement | 308 | 1,320 | 20 | 1,300 | ||||||||||||||||
Boyne Island raw and potable water pipeline replacements | 308 | 12,626 | 126 | 4,330 | 8,170 | |||||||||||||||
East End Pipeline replacement | 308 | 9,919 | 4,409 | 5,510 | ||||||||||||||||
Fitzroy to Gladstone Pipeline | 308 | 983,000 | 591,646 | 311,094 | 80,260 | |||||||||||||||
Flowmeter replacement | 308 | 2,711 | 1,517 | 1,194 | ||||||||||||||||
Golegumma pipeline replacement | 308 | 5,112 | 664 | 3,200 | 1,248 | |||||||||||||||
Hydrogen short term capital program - planning | 308 | 9,960 | 100 | 5,860 | 4,000 | |||||||||||||||
Program of smaller capital works projects | 308 | 2,724 | Ongoing | |||||||||||||||||
Queensland Alumina Limited raw water pipeline replacement | 308 | 9,005 | 570 | 4,269 | 4,166 | |||||||||||||||
Raw water pipeline, Glen Eden and Moura rail reline | 308 | 2,812 | 1,812 | 1,000 | ||||||||||||||||
Right of use lease assets | 308 | 1,565 | Ongoing | |||||||||||||||||
South-tree Bridge cathodic protection installation | 308 | 1,948 | 46 | 1,299 | 603 | |||||||||||||||
|
| |||||||||||||||||||
Total Property, Plant and Equipment | 354,823 | |||||||||||||||||||
|
| |||||||||||||||||||
MOUNT ISA WATER BOARD | ||||||||||||||||||||
Property, Plant and Equipment | ||||||||||||||||||||
Chlorine dose equipment upgrade | 315 | 1,790 | 819 | 971 | ||||||||||||||||
Col Popple pump station upgrade - planning | 315 | 342 | 342 | |||||||||||||||||
Fred Haigh pump station electro-mechanical overhaul | 315 | 12,400 | 12,010 | 390 | ||||||||||||||||
Lake Julius power pole replacement | 315 | 2,718 | 78 | 1,015 | 1,625 | |||||||||||||||
Mount Isa City Council supply - diesel backup | 315 | 2,168 | 1,831 | 336 | ||||||||||||||||
Other asset enhancements | 315 | 1,315 | Ongoing | |||||||||||||||||
Other asset renewals | 315 | 1,795 | Ongoing | |||||||||||||||||
Other plant and equipment upgrades | 315 | 511 | Ongoing | |||||||||||||||||
Pipeline instrumentation and automation enhancements | 315 | 1,074 | 74 | 1,000 | ||||||||||||||||
86
Capital Statement 2024-25
| Regional Development, Manufacturing and Water | ||||||||||||||||||
Project | Statistical Area | Total Estimated Cost $‘000 | Expenditure to 30-06-24 $‘000 | Budget 2024-25 $‘000 | Post 2024-25 $‘000 | |||||||||||||
Solar systems installation - planning | 315 | 658 | 658 | |||||||||||||||
Supervisory Control and Data Acquisition (SCADA) system upgrade | 315 | 1,431 | 496 | 935 | ||||||||||||||
|
| |||||||||||||||||
Total Property, Plant and Equipment | 7,903 | |||||||||||||||||
|
| |||||||||||||||||
SEQWATER | ||||||||||||||||||
Property, Plant and Equipment | ||||||||||||||||||
Gold Coast Desalination Plant augmentation and associated infrastructure - planning | 309 | 38,700 | 8,200 | 30,500 | ||||||||||||||
Information and communication technology capital program | 310 | 25,834 | Ongoing | |||||||||||||||
Lake Macdonald Dam improvement project | 316 | 427,700 | 61,059 | 71,394 | 295,247 | |||||||||||||
Mount Crosby East Bank sub-station and enabling works | 310 | 35,600 | 24,918 | 1,891 | 8,791 | |||||||||||||
Mount Crosby East Bank sub-station critical electrical infrastructure upgrade | 310 | 61,804 | 18,082 | 24,210 | 19,512 | |||||||||||||
Non-infrastructure capital works | 310 | 18,565 | Ongoing | |||||||||||||||
North Pine Dam improvement project - planning | 314 | 15,917 | 7,957 | 7,960 | ||||||||||||||
North Pine Dam staged strengthening project - planning | 314 | 12,964 | 6,627 | 6,337 | ||||||||||||||
Other infrastructure improvements - other infrastructure projects | 310 | 34,778 | Ongoing | |||||||||||||||
Other infrastructure improvements - water storage projects | 310 | 18,234 | Ongoing | |||||||||||||||
Other infrastructure improvements - water transport projects | 310 | 22,874 | Ongoing | |||||||||||||||
Other infrastructure improvements - water treatment projects | 310 | 70,646 | Ongoing | |||||||||||||||
Somerset Dam improvement project - planning | 310 | 51,519 | 38,442 | 13,077 | ||||||||||||||
South East Queensland Desalination Plant - planning | 316 | 35,459 | 29,122 | 6,337 | ||||||||||||||
South West Pipeline | 311 | 95,200 | 93,171 | 1,087 | 942 | |||||||||||||
Toowoomba to Warwick Pipeline | 317 | 273,100 | 29,289 | 56,021 | 187,790 | |||||||||||||
Wivenhoe Dam improvement project - planning | 310 | 18,245 | 6,781 | 11,464 | ||||||||||||||
|
| |||||||||||||||||
Total Property, Plant and Equipment | 421,209 | |||||||||||||||||
|
| |||||||||||||||||
SUNWATER LIMITED | ||||||||||||||||||
Property, Plant and Equipment | ||||||||||||||||||
Burdekin Falls Dam raising and improvement project – planning and investigatory works ¹ | 318 | 161,800 | 73,957 | 73,914 | 13,929 | |||||||||||||
87
Capital Statement 2024-25
| Regional Development, Manufacturing and Water | ||||||||||||||||||
Project | Statistical Area | Total Estimated Cost $‘000 | Expenditure to 30-06-24 $‘000 | Budget 2024-25 $‘000 | Post 2024-25 $‘000 | |||||||||||||
Burdekin Moranbah Pipeline - inline storage | 312 | 4,000 | 4,000 | |||||||||||||||
Burdekin Moranbah Pipeline - pumping reliability improvement project | 312 | 34,292 | 3,224 | 6,000 | 25,068 | |||||||||||||
Eungella Water Pipeline (stage 3) | 312 | 12,344 | 8,095 | 4,249 | ||||||||||||||
Lower Burdekin rising groundwater mitigation project | 318 | 18,874 | 2,759 | 6,000 | 10,115 | |||||||||||||
Non-infrastructure capital works | Various | 10,079 | Ongoing | |||||||||||||||
Non-routine capital works - bulk water infrastructure | Various | 5,506 | Ongoing | |||||||||||||||
Non-routine capital works - industrial pipelines | Various | 2,206 | Ongoing | |||||||||||||||
Non-routine capital works - irrigation systems | Various | 8,635 | Ongoing | |||||||||||||||
Other dam improvement projects - planning | 308 | 8,000 | 8,000 | |||||||||||||||
Paradise Dam improvement project - planning and enabling works ² | 319 | 313,300 | 113,658 | 109,624 | 90,018 | |||||||||||||
Right of use leased assets | Various | 2,107 | Ongoing | |||||||||||||||
Rocklea laboratory facility upgrade | 303 | 21,907 | 6,758 | 10,000 | 5,149 | |||||||||||||
|
| |||||||||||||||||
Total Property, Plant and Equipment | 250,320 | |||||||||||||||||
|
| |||||||||||||||||
TOTAL REGIONAL DEVELOPMENT, MANUFACTURING AND WATER (PPE) |
| 1,037,756 | ||||||||||||||||
|
| |||||||||||||||||
TOTAL REGIONAL DEVELOPMENT, MANUFACTURING AND WATER (CG) |
| 147,171 | ||||||||||||||||
|
| |||||||||||||||||
Notes:
| 1. | The $161.8 million total estimated cost for the Burdekin Falls Dam raising and improvement project reflects expenditure to date and forecast expenditure for planning and investigatory works. The total estimated cost and project timing will be updated upon completion of the updated detailed business case. |
| 2. | The $313.3 million total estimated cost for the Paradise Dam improvement project reflects expenditure to date and forecast expenditure for planning and enabling works. The total estimated cost and project timing will be updated upon completion of the detailed business case currently underway. |
88
Capital Statement 2024-25
| 3.17 | RESOURCES |
Department of Resources
The Department of Resources has a capital program of $19.6 million in 2024–25, including $19.1 million in capital purchases and $500,000 in capital grants.
The program includes investments in upgrades and maintenance of the state’s stock route network, digital solutions to support the vast datasets used to stimulate economic development in Queensland, and other critical property, plant and equipment assets to meet service delivery requirements.
Program Highlights (Property, Plant and Equipment)
| • | $2.9 million in 2024–25 to continue managing significant public health and safety, property and environmental risks at high-risk abandoned mine sites, as part of the Abandoned Mine Lands Program. |
| • | $900,000 in 2024–25 to continue improving and maintaining stock route water facilities across the state to ensure their safe and efficient operation. |
Program Highlights (Capital Grants)
| • | $500,000 for a capital grant to support the restoration of camping amenities at the Adam’s Beach camping reserve, which were demolished to allow for the remediation of historical impacts of sand mining. |
| Resources | ||||||||||||||||||||
Project | Statistical Area | Total Estimated Cost $‘000 | Expenditure to 30-06-24 $‘000 | Budget 2024-25 $‘000 | Post 2024-25 $‘000 | |||||||||||||||
DEPARTMENT OF RESOURCES | ||||||||||||||||||||
Property, Plant and Equipment | ||||||||||||||||||||
Abandoned Mine Lands Program | Various | 4,170 | 100 | 2,920 | 1,150 | |||||||||||||||
Other property, plant and equipment | Various | 6,406 | Ongoing | |||||||||||||||||
Stock route network | Various | 900 | Ongoing | |||||||||||||||||
Systems development | Various | 8,881 | Ongoing | |||||||||||||||||
|
| |||||||||||||||||||
Total Property, Plant and Equipment | 19,107 | |||||||||||||||||||
|
| |||||||||||||||||||
Capital Grants | ||||||||||||||||||||
Adam’s Beach camping amenities | 301 | 500 | 500 | |||||||||||||||||
|
| |||||||||||||||||||
Total Capital Grants | 500 | |||||||||||||||||||
|
| |||||||||||||||||||
TOTAL RESOURCES (PPE) | 19,107 | |||||||||||||||||||
|
| |||||||||||||||||||
TOTAL RESOURCES (CG) | 500 | |||||||||||||||||||
|
| |||||||||||||||||||
89
Capital Statement 2024-25
| 3.18 | STATE DEVELOPMENT AND INFRASTRUCTURE |
In 2024-25, the State Development and Infrastructure portfolio, including Economic Development Queensland and South Bank Corporation, has capital purchases of $142.8 million and capital grants of $642.6 million.
Department of State Development and Infrastructure
The Department of State Development and Infrastructure has capital purchases of $12.3 million and capital grants of $545.5 million in 2024-25.
Program Highlights (Capital Grants)
| • | $85 million as part of the $200 million South East Queensland Liveability Fund to support Local Government projects that create liveable, creative, sustainable and healthy communities (jointly funded with the Australian Government). |
| • | $63.5 million as part of the $195 million Haughton Pipeline Project Stage 2 for construction of a water pipeline and associated infrastructure from the Burdekin River at Clare, connecting to Stage 1 of the pipeline near Haughton pump station. |
| • | $47 million as part of the $218.2 million Resources Community Infrastructure Fund to support regional communities by improving economic and social infrastructure across Queensland’s resources communities. |
| • | $41.6 million as part of the $82.2 million Recycling Modernisation Fund to support businesses to improve recycling infrastructure for waste streams impacted by waste export bans (jointly funded with the Australian Government). |
| • | $37.5 million as part of the $73.9 million Translational Manufacturing facility at the Translational Research Institute for the establishment and operation of a scale-up biomedical manufacturing facility. |
| • | $25 million as part of the $80 million Queensland Battery Industry Strategy Implementation to help grow and diversify the industry. |
| • | $25 million as part of the $50 million Local Digital Priority Projects to invest in digital solutions that address specific local economic, business and social projects (jointly funded with the Australian Government). |
Economic Development Queensland
In 2024-25, Economic Development Queensland has capital purchases of $117.8 million and capital grants of $97.1 million.
Program Highlights (Property, Plant and Equipment and Capital Grants)
| • | $97.1 million as part of the $215.6 million in capital grants for Social and Affordable Housing on developments led by EDQ in consultation with the Department of Housing, Local Government, Planning and Public Works. |
| • | $44.3 million as part of the $410.8 million for the urban renewal development at Northshore Hamilton including the delivery of supporting civil and precinct infrastructure. |
| • | $25.4 million as part of the $37.3 million for the development of Coolum Eco Industrial Park (Stage 2) to provide industrial land supply and support economic development on the Sunshine Coast. |
90
Capital Statement 2024-25
South Bank Corporation
In 2024-25, the South Bank Corporation has budgeted capital purchases of $12.7 million to enhance the South Bank Parklands, the Corporation’s commercial assets and the Brisbane Convention and Exhibition Centre.
| State Development and Infrastructure | ||||||||||||||||||||
Project | Statistical Area | Total Estimated Cost $‘000 | Expenditure to 30-06-24 $‘000 | Budget 2024-25 $‘000 | Post 2024-25 $‘000 | |||||||||||||||
DEPARTMENT OF STATE DEVELOPMENT AND INFRASTRUCTURE |
| |||||||||||||||||||
Property, Plant and Equipment | ||||||||||||||||||||
Brisbane 2032 Olympic and Paralympic Games Minor Venues Program | 301 | 256,500 | 100 | 6,553 | 249,847 | |||||||||||||||
Office of Industrial Relations plant and equipment | 305 | 3,446 | Ongoing | |||||||||||||||||
Gladstone State Development Area acquisitions | Various | 1,424 | 1,424 | |||||||||||||||||
Callide Infrastructure Corridor | Various | 799 | 799 | |||||||||||||||||
State development area property management | 308 | 200 | 150 | 50 | ||||||||||||||||
|
| |||||||||||||||||||
Total Property, Plant and Equipment | 12,272 | |||||||||||||||||||
|
| |||||||||||||||||||
Capital Grants | ||||||||||||||||||||
South East Queensland Liveability Fund | Various | 200,000 | 85,000 | 115,000 | ||||||||||||||||
Haughton Pipeline Project (Stage 2) | 318 | 195,000 | 127,500 | 63,500 | 4,000 | |||||||||||||||
Resources Community Infrastructure Fund | Various | 218,200 | 66,035 | 47,000 | 105,165 | |||||||||||||||
Recycling Modernisation Fund | Various | 82,226 | 9,467 | 41,565 | 31,194 | |||||||||||||||
Translational Manufacturing facility at the Translational Research Institute | 303 | 73,900 | 9,500 | 37,483 | 26,917 | |||||||||||||||
Queensland Battery Industry Strategy Implementation | Various | 80,000 | 25,000 | 55,000 | ||||||||||||||||
Local Digital Priority Projects | Various | 50,000 | 25,000 | 25,000 | ||||||||||||||||
Loganlea - Meadowbrook Infrastructure | 311 | 40,000 | 5,000 | 21,600 | 13,400 | |||||||||||||||
Brisbane 2032 Olympic and Paralympic Games Minor Venues Program | 316 | 304,120 | 150 | 20,053 | 283,917 | |||||||||||||||
Racing Infrastructure Fund | Various | 180,144 | 127,421 | 19,573 | 33,150 | |||||||||||||||
Growth Area Compact | 314 | 100,000 | 15,000 | 85,000 | ||||||||||||||||
Lansdown Eco-Industrial Precinct | 318 | 34,000 | 20,031 | 13,969 | ||||||||||||||||
Modern Manufacturing Initiative | Various | 41,700 | 4,000 | 13,500 | 24,200 | |||||||||||||||
Industry Partnership Program | Various | 156,800 | 10,800 | 12,334 | 133,666 | |||||||||||||||
Building our Regions (Rounds 1-5) | Various | 329,609 | 317,609 | 12,000 | ||||||||||||||||
Kangaroo Point Green Bridge | 305 | 63,200 | 51,600 | 11,600 | ||||||||||||||||
Regional Recovery Partnerships Program | Various | 20,225 | 9,794 | 10,431 | ||||||||||||||||
91
Capital Statement 2024-25
| State Development and Infrastructure | ||||||||||||||||||||
Project | Statistical Area | Total Estimated Cost $‘000 | Expenditure to 30-06-24 $‘000 | Budget 2024-25 $‘000 | Post 2024-25 $‘000 | |||||||||||||||
Public Art Initiatives | Various | 10,000 | 10,000 | |||||||||||||||||
Green Urban Infrastructure | Various | 10,000 | 10,000 | |||||||||||||||||
Toowoomba Railway Parklands | 317 | 20,000 | 7,000 | 13,000 | ||||||||||||||||
National Battery Testing Centre | 302 | 10,000 | 6,500 | 3,500 | ||||||||||||||||
Emerging Hydrogen Industry | Various | 23,135 | 2,985 | 5,134 | 15,016 | |||||||||||||||
Barcaldine Renewable Energy Zone | 315 | 7,000 | 5,000 | 2,000 | ||||||||||||||||
Industry Partnership Program (Round 2) | Various | 53,539 | 5,000 | 48,539 | ||||||||||||||||
Southport Spit | 309 | 26,572 | 21,927 | 4,502 | 143 | |||||||||||||||
Planning for Future Region-Shaping Infrastructure | Various | 4,000 | 500 | 3,500 | ||||||||||||||||
Bromelton State Area Development Area Business Case | 309 | 4,500 | 3,250 | 1,250 | ||||||||||||||||
Hydrogen Ecosystem Pilot Project | 308 | 3,650 | 3,146 | 504 | ||||||||||||||||
Cairns Marine Precinct Shipyards | 306 | 4,000 | 1,600 | 2,400 | ||||||||||||||||
Community Infrastructure Investment Partnership | Various | 15,000 | 8,237 | 2,363 | 4,400 | |||||||||||||||
Recycling and Jobs Fund | Various | 135,000 | 2,300 | 132,700 | ||||||||||||||||
Queensland Battery Industry Development Strategy | Various | 1,730 | 1,200 | 530 | ||||||||||||||||
Smart Region Digital Plan | Various | 500 | 300 | 200 | ||||||||||||||||
Road Safety Mapping | Various | 110 | 110 | |||||||||||||||||
|
| |||||||||||||||||||
Total Capital Grants | 545,543 | |||||||||||||||||||
|
| |||||||||||||||||||
ECONOMIC DEVELOPMENT QUEENSLAND | ||||||||||||||||||||
Property, Plant and Equipment | ||||||||||||||||||||
Northshore Hamilton | 302 | 410,751 | 116,484 | 44,344 | 249,923 | |||||||||||||||
Coolum Eco Industrial Park (Stage 2) | 316 | 37,267 | 4,829 | 25,375 | 7,063 | |||||||||||||||
Clinton Industrial Estate | 308 | 19,570 | 3,958 | 12,026 | 3,586 | |||||||||||||||
Currumbin Eco-Parkland | 309 | 39,538 | 17,477 | 9,416 | 12,645 | |||||||||||||||
Southport West Tower | 309 | 26,653 | 17,397 | 9,256 | ||||||||||||||||
Yeerongpilly Green | 303 | 77,128 | 60,706 | 4,560 | 11,862 | |||||||||||||||
Gold Coast Health and Knowledge Precinct | 309 | 42,177 | 29,237 | 4,022 | 8,918 | |||||||||||||||
Yeronga Priority Development Area | 303 | 32,205 | 28,843 | 3,362 | ||||||||||||||||
Carseldine Village | 302 | 36,290 | 32,553 | 2,717 | 1,020 | |||||||||||||||
Oxley Priority Development Area | 310 | 34,443 | 32,362 | 2,081 | ||||||||||||||||
Salisbury Plains Industrial Precinct | 312 | 6,813 | 3,063 | 250 | 3,500 | |||||||||||||||
Townsville Regional Industrial Estate | 318 | 8,751 | 4,751 | 200 | 3,800 | |||||||||||||||
92
Capital Statement 2024-25
| State Development and Infrastructure | ||||||||||||||||||||
Project | Statistical Area | Total Estimated Cost $‘000 | Expenditure to 30-06-24 $‘000 | Budget 2024-25 $‘000 | Post 2024-25 $‘000 | |||||||||||||||
Gladstone State Development Area | 308 | 86,745 | 78,945 | 200 | 7,600 | |||||||||||||||
|
| |||||||||||||||||||
Total Property, Plant and Equipment | 117,809 | |||||||||||||||||||
|
| |||||||||||||||||||
Capital Grants | ||||||||||||||||||||
Social and Affordable Housing | Various | 215,600 | 97,067 | 118,533 | ||||||||||||||||
|
| |||||||||||||||||||
Total Capital Grants | 97,067 | |||||||||||||||||||
|
| |||||||||||||||||||
SOUTH BANK CORPORATION | ||||||||||||||||||||
Property, Plant and Equipment | ||||||||||||||||||||
Brisbane Convention and Exhibition Centre enhancements and replacements | 305 | 8,299 | Ongoing | |||||||||||||||||
South Bank Parklands enhancements and replacements | 305 | 2,269 | Ongoing | |||||||||||||||||
Investment properties - other enhancements and replacements | 305 | 1,896 | Ongoing | |||||||||||||||||
Car park upgrades and replacements | 305 | 238 | Ongoing | |||||||||||||||||
|
| |||||||||||||||||||
Total Property, Plant and Equipment | 12,702 | |||||||||||||||||||
|
| |||||||||||||||||||
TOTAL STATE DEVELOPMENT AND INFRASTRUCTURE (PPE) | 142,783 | |||||||||||||||||||
|
| |||||||||||||||||||
TOTAL STATE DEVELOPMENT AND INFRASTRUCTURE (CG) | 642,610 | |||||||||||||||||||
|
| |||||||||||||||||||
93
Capital Statement 2024-25
| 3.19 | TOURISM AND SPORT |
Department of Tourism and Sport
Total capital purchases for the Department of Tourism and Sport are estimated to be $39.4 million in 2024-25. Total capital grants for the department are estimated to be $230.5 million in 2024-25.
Program Highlights (Property, Plant and Equipment)
| • | $28.3 million for Queensland Active Precincts to enhance existing state-owned sport and active recreation facilities at the Gold Coast, Sunshine Coast and Townsville, to deliver quality experiences that inspire physical activity. |
| • | $11 million for development of the Wangetti Trail, a 94 kilometre walking and mountain biking trail from Palm Cove to Port Douglas, with public and eco-accommodation facilities. |
Program Highlights (Capital Grants)
| • | $43.1 million for the Stage 1 redevelopment of Browne Park including building a contemporary 3,500 seat grandstand, public amenities, food and beverage outlets, media and coach facilities, and increasing the ground capacity. |
| • | $27.9 million for the Sport Minor Infrastructure Program for minor facility improvements that support increased opportunities for Queenslanders to participate in sport and active recreation. |
| • | $25 million for the construction of new Police Citizen Youth Clubs and the upgrade of existing facilities. |
| • | $18 million to support new and upgraded facilities as part of the Minor Infrastructure and Inclusive Facilities Fund to make community sport and active recreation more inclusive, accessible, safe and efficient. |
| • | $16.9 million to support the clean up and repair of community and recreational assets damaged by the extraordinary 2021-22 disaster events, in partnership with the Australian Government. |
| • | $14.1 million for local community sporting infrastructure to encourage Queenslanders to be more active, more often as well as working to increase health and wellbeing outcomes across the state in line with key government priorities. |
Stadiums Queensland
Stadiums Queensland’s 2024-25 capital outlay of $32.6 million represents the minimum capital investment required to assist in ensuring that Queensland’s major sports and entertainment facilities continue to provide world-class fan experiences, support high performance development and facilitate community participation in sport and physical activity.
94
Capital Statement 2024-25
| Tourism and Sport | ||||||||||||||||||
Project | Statistical Area | Total Estimated Cost $‘000 | Expenditure to 30-06-24 $‘000 | Budget 2024-25 $‘000 | Post 2024-25 $‘000 | |||||||||||||
DEPARTMENT OF TOURISM AND SPORT | ||||||||||||||||||
Property, Plant and Equipment | ||||||||||||||||||
Queensland Active Precincts | Various | 88,585 | 46,842 | 28,285 | 13,458 | |||||||||||||
Wangetti Trail | 306 | 27,048 | 4,792 | 11,000 | 11,256 | |||||||||||||
Queensland Academy of Sport - specialist equipment | 303 | 457 | 157 | 75 | 225 | |||||||||||||
|
| |||||||||||||||||
Total Property, Plant and Equipment | 39,360 | |||||||||||||||||
|
| |||||||||||||||||
Capital Grants | ||||||||||||||||||
Browne Park Redevelopment | 308 | 54,326 | 6,206 | 43,120 | 5,000 | |||||||||||||
Sport Minor Infrastructure Program | Various | 47,988 | 14,792 | 27,945 | 5,251 | |||||||||||||
PCYC Queensland Capital Works | Various | 50,000 | 25,000 | 25,000 | ||||||||||||||
Minor Infrastructure and Inclusive Facilities Fund | Various | 29,000 | 8,000 | 18,000 | 3,000 | |||||||||||||
Community Recreational Assets Recovery and Resilience Program | Various | 86,077 | 69,153 | 16,924 | ||||||||||||||
Local community sporting infrastructure | Various | 55,980 | 41,879 | 14,101 | ||||||||||||||
Binna Burra Lodge rebuild | 309 | 18,000 | 5,339 | 12,661 | ||||||||||||||
Minjerribah Futures Program | 301 | 26,324 | 17,823 | 8,501 | ||||||||||||||
Growing Future Tourism Program | Various | 28,500 | 650 | 8,450 | 19,400 | |||||||||||||
QRA Tropical Cyclone Jasper Tourism Resilience Recovery | Various | 11,600 | 300 | 8,300 | 3,000 | |||||||||||||
Women’s Football Legacy Fund | Various | 5,900 | 5,900 | |||||||||||||||
Activate Ecotourism | Various | 9,194 | 4,194 | 5,000 | ||||||||||||||
Rockhampton Sports Precinct | 308 | 5,000 | 5,000 | |||||||||||||||
Sporting infrastructure | Various | 14,360 | 9,610 | 4,750 | ||||||||||||||
Drive It NQ | 318 | 10,400 | 6,000 | 4,400 | ||||||||||||||
Year of Accessible Tourism | Various | 4,940 | 940 | 4,000 | ||||||||||||||
Building Bush Tourism Fund | Various | 9,850 | 350 | 3,800 | 5,700 | |||||||||||||
Tourism Experience Development Fund | Various | 9,613 | 6,327 | 3,286 | ||||||||||||||
Great Barrier Reef Marine infrastructure | Various | 3,000 | 3,000 | |||||||||||||||
Active Community Infrastructure - Round 1 | Various | 26,736 | 25,048 | 1,688 | ||||||||||||||
Pajinka infrastructure | 315 | 1,650 | 1,650 | |||||||||||||||
Growing Indigenous Tourism in Queensland Fund | Various | 6,393 | 5,254 | 1,139 | ||||||||||||||
Surf Lifesaving infrastructure | Various | 5,999 | 4,699 | 1,125 | 175 | |||||||||||||
Lamington National Park and surrounds - Pats Farm Cabins | 309 | 2,000 | 1,000 | 1,000 | ||||||||||||||
95
Capital Statement 2024-25
| Tourism and Sport | ||||||||||||||||||
Project | Statistical Area | Total Estimated Cost $‘000 | Expenditure to 30-06-24 $‘000 | Budget 2024-25 $‘000 | Post 2024-25 $‘000 | |||||||||||||
Active Game Day Schools | Various | 8,369 | 7,474 | 895 | ||||||||||||||
Mapoon Aboriginal Shire Council | Various | 632 | 60 | 572 | ||||||||||||||
Australian Workers Heritage Centre | 315 | 1,300 | 1,136 | 164 | ||||||||||||||
Abbey Museum Art Gallery & Cafe and Abbey Medieval Festival Site Redevelopment | 313 | 2,100 | 1,981 | 119 | ||||||||||||||
|
| |||||||||||||||||
Total Capital Grants | 230,490 | |||||||||||||||||
|
| |||||||||||||||||
STADIUMS QUEENSLAND | ||||||||||||||||||
Property, Plant and Equipment | ||||||||||||||||||
Stadiums Queensland - Annual capital program | Various | 32,609 | Ongoing | |||||||||||||||
|
| |||||||||||||||||
Total Property, Plant and Equipment | 32,609 | |||||||||||||||||
|
| |||||||||||||||||
TOTAL TOURISM AND SPORT (PPE) | 71,969 | |||||||||||||||||
|
| |||||||||||||||||
TOTAL TOURISM AND SPORT (CG) | 230,490 | |||||||||||||||||
|
| |||||||||||||||||
96
Capital Statement 2024-25
| 3.20 | TRANSPORT AND MAIN ROADS |
TRANSPORT AND MAIN ROADS
In 2024-25, total capital purchases for the Transport and Main Roads portfolio are $9.494 billion including capital grants of $736.3 million. The portfolio includes the Department of Transport and Main Roads, Queensland Rail, Cross River Rail Delivery Authority, Far North Queensland Ports Corporation Limited, Gladstone Ports Corporation Limited, North Queensland Bulk Ports Corporation Limited, Port of Townsville Limited, RoadTek, Gold Coast Waterways Authority and CITEC
Department of Transport and Main Roads
In 2024-25, capital purchases total $6.896 billion towards infrastructure investment across the state. The Department of Transport and Main Roads designs, delivers and maintains transport infrastructure with a vision of creating a single integrated network accesible to everyone.
Program Highlights (Property, Plant and Equipment)
| • | $786 million towards Queensland Train Manufacturing Program, at a total estimated capital cost of $4.869 billion. |
| • | $650 million towards Coomera Connector (Stage 1), Coomera to Nerang, at a total estimated cost of $3.026 billion (jointly funded with the Australian Government). |
| • | $500 million towards Logan and Gold Coast Faster Rail, as part of a total commitment of $5.750 billion (jointly funded with the Australian Government). |
| • | $308.2 million towards Gold Coast Light Rail (Stage 3), Broadbeach South to Burleigh Heads, at a total estimated cost of $1.219 billion (jointly funded with the Australian Government and Gold Coast City Council). |
| • | $191.2 million towards Rockhampton Ring Road, at a total estimated cost of $1.730 billion (jointly funded with the Australian Government). |
| • | $168.3 million towards New Gold Coast Stations (Pimpama, Hope Island and Merrimac), at a total estimated cost of $500 million. |
| • | $165 million towards Pacific Motorway, Varsity Lakes (Exit 85) to Tugun (Exit 95) upgrade, at a total estimated cost of $1.500 billion (jointly funded with the Australian Government). |
| • | $115 million towards Beerburrum to Nambour Rail Upgrade (Stage 1), as part of a total commitment of $1.004 billion (jointly funded with the Australian Government). |
| • | $110.8 million towards Direct Sunshine Coast Rail Line (Stage 1), as part of a total commitment of $5.5 billion (jointly funded with the Australian Government). Stage 1 is expected to cost between $5.5 billion to $7 billion, with cost estimates to be finalised following further design development, market engagement and procurement. |
| • | $110.6 million towards Bruce Highway (Cooroy to Curra) Section D construction, at a total estimated cost of $1.162 billion (jointly funded with the Australian Government). |
| • | $105 million towards Pacific Motorway, Eight Mile Plains to Daisy Hill upgrade, at a total estimated cost of $750 million (jointly funded with the Australian Government). |
| • | $104 million towards New Generation Rollingstock, European Train Control System fitment, install new signalling, at a total estimated cost of $380.5 million. |
| • | $83.3 million towards New Generation Rollingstock, Automatic Train Operation and Platform Screen Doors fitment, at a total estimated cost of $275.7 million. |
| • | $80.9 million towards Bruce Highway (Brisbane - Gympie), Dohles Rocks Road to Anzac Avenue upgrade (Stage 1), as part of a total commitment of $290 million (jointly funded with the Australian Government). |
97
Capital Statement 2024-25
| • | $65 million towards Centenary Bridge Upgrade, at a total estimated cost of $298.5 million (jointly funded with the Australian Government). |
| • | $55 million towards Gateway Motorway, Bracken Ridge to Pine River upgrade, as part of a total commitment of $1 billion (jointly funded with the Australian Government). |
| • | $52.3 million towards Walkerston Bypass, at a total estimated cost of $251.7 million (jointly funded with the Australian Government). |
Program Highlights (Capital Grants)
| • | $76 million towards Transport Infrastructure Development Scheme to local governments, including Aboriginal and Torres Strait Islander community assistance. |
| • | $63.1 million towards Boundary Road (Coopers Plains), upgrade rail level crossing, as part of a total commitment of $399 million (jointly funded with the Australian Government and Brisbane City Council). |
| • | $56.2 million towards Beams Road (Carseldine and Fitzgibbon), upgrade rail level crossing, as part of a total commitment of $235 million (jointly funded with the Australian Government and Brisbane City Council). |
| • | $44.7 million towards development of the cycle network throughout Queensland. |
| • | $21.6 million towards the School Bus Upgrade Program. |
RoadTek
In 2024-25, $26 million is allocated to replace construction plant and equipment for road construction and maintenance throughout Queensland.
CITEC
CITEC has capital purchases of $19.7 million in 2024-25, comprising right of use lease assets and hardware replacement.
Program Highlights (Property, Plant and Equipment)
| • | $18.7 million of right of use lease assets for ICT services. |
| • | $1 million for hardware replacement. |
Queensland Rail
In 2024-25, $1.748 billion is allocated towards capital purchases for Queensland Rail.
Program Highlights (Property, Plant and Equipment)
$1.160 billion is provided towards projects that will grow or enhance the Queensland Rail network including:
| • | $272.4 million towards implementing the European Train Control System Signalling Program: Phase 1 in the Brisbane Inner City Network. |
| • | $123 million towards constructing Clapham Yard Stabling at Moorooka. |
| • | $165.7 million towards station accessibility upgrades at Banyo, Bundamba, Buranda, Burpengary, Lindum and Morningside. |
| • | $61.4 million towards signalling integration works to enable delivery of the European Train Control System. |
| • | $50.2 million towards delivery of necessary Queensland Train Manufacturing Program |
98
Capital Statement 2024-25
enabling works for the integration and operational readiness of new trains being delivered by the Department of Transport and Main Roads. |
$588.5 million to replace, renew and upgrade rail infrastructure, rollingstock, buildings, facilities, and other network assets including:
| • | $172.7 million to invest in the South East Queensland network including rollingstock, operational facilities, track infrastructure, civil structures and signalling. |
| • | $328.4 million to invest in the regional network including rollingstock, operational facilities, track infrastructure, civil structures and signalling. |
| • | $87.4 million for business enabling investment on corporate, property and ICT works across Queensland. |
Gold Coast Waterways Authority
In 2024-25, the Gold Coast Waterways Authority has allocated $10.1 million to improve management of, and provide better access to, the Gold Coast Waterway, canals and rivers and to deliver The Spit Works Program.
| • | $4.6 million to deliver The Spit Works Program, including Doug Jennings Park revitalisation, Muriel Henchman Boating Facilities and Marine Stadium foreshore surrounds upgrade. |
| • | $3.6 million to deliver Hope Island, Santa Barbara, Loders Creek, Tallebudgera (Murlong Crescent) boat ramp replacements, and Wave Break Island keyhole anchorage dredging. |
| • | $1.9 million to deliver improvements to vessels and the Sand Bypass System. |
Cross River Rail Delivery Authority
In 2024-25, $513.6 million has been allocated to construct a new 10.2 kilometre rail line from Dutton Park to Bowen Hills, including 5.9 kilometres of twin tunnels under the Brisbane River and CBD, and four new underground stations.
Program Highlights (Property, Plant and Equipment)
| • | $455.3 million in 2024-25 to continue delivery of Cross River Rail, at a total estimated cost of $7.669 billion. |
Program Highlights (Capital Grants)
| • | $58.3 million towards third party returnable works for Cross River Rail, at a total estimated cost of $179.2 million. |
Far North Queensland Ports Corporation
In 2024-25, Far North Queensland Ports Corporation Limited has allocated $69.9 million towards new and continuing development within its ports in Far North Queensland.
Program Highlights (Property, Plant & Equipment)
| • | $37 million for the Cairns Marine Precinct - Common User Facility, with commitments from the Queensland and Australian Governments totalling $360 million. |
| • | $10 million for Channel Navigation Improvements at the Port of Cairns, at a total estimated cost of $12 million. |
| • | $5.1 million for the Horn Island Passenger Jetty and Cargo Wharf, at a total estimated cost |
99
Capital Statement 2024-25
| of $11.1 million. |
| • | $4.5 million for Marina Configuration and Expansion at the Port of Cairns, at a total estimated cost of $5.9 million. |
Gladstone Ports Corporation
In 2024-25, Gladstone Ports Corporation Limited has allocated $122 million towards ongoing development of the Port of Gladstone and additional works at the Port of Rockhampton (Port Alma).
Program highlights (Property, Plant & Equipment)
| • | $60.5 million towards RG Tanna Coal Terminal projects at the Port of Gladstone. |
| • | $33.9 million towards the Northern Land Expansion Project at the Port of Gladstone at a total estimated cost of $116 million. |
North Queensland Bulk Ports Corporation
In 2024-25, North Queensland Bulk Ports Corporation has allocated $33.4 million to continue planning and development initiatives to meet industry requirements for export facilities.
Program Highlights (Property, Plant and Equipment)
| • | $8 million for development of new Heavy Duty Hardstand at Mackay to cater for container storage and handling of break bulk cargo, at a total estimated cost of $18 million. |
| • | $6 million for undergrounding and relocation of fuel pipelines at Mackay, at a total estimated cost of $6.7 million. |
| • | $2 million to progress consultation, detailed designs and required approvals to replace the Bowen Wharf facility, as part of initial works up to $5 million. |
| • | $2 million to progress feasibility, development planning and expansion designs for the Material Offloading Facility at Abbot Point, as part of initial works up to $4 million. |
| • | $1 million to progress feasibility, development and designs for potential extension of Wharf 1 at Mackay, as part of initial works up to $1.9 million. |
Port of Townsville Limited
In 2024-25, Port of Townsville Limited has allocated $56 million towards ongoing development at the Port of Townsville.
Program Highlights (Property, Plant and Equipment)
| • | $18.4 million to complete the capital dredging and reclamation works to widen the shipping channels for access by larger vessels, at a total estimated cost of $251.2 million. |
100
Capital Statement 2024-25
| Transport and Main Roads | ||||||||||||||||||
Project | Statistical Area | Total Estimated Cost $‘000 | Expenditure to 30-06-24 $‘000 | Budget 2024-25 $‘000 | Post 2024-25 $‘000 | |||||||||||||
DEPARTMENT OF TRANSPORT AND MAIN ROADS | ||||||||||||||||||
Property, Plant and Equipment | ||||||||||||||||||
South Coast District | ||||||||||||||||||
Beaudesert - Beenleigh Road, Milne Street to Tallagandra Road, duplicate to four lanes ¹ | 311 | 20,000 | 2,994 | 7,212 | 9,794 | |||||||||||||
Beenleigh Connection Road and City Road (Beenleigh), upgrade intersection ² | 311 | 30,000 | 679 | 3,156 | 26,165 | |||||||||||||
Brisbane - Beenleigh Road, improve safety | 311 | 14,813 | 543 | 6,950 | 7,320 | |||||||||||||
Brisbane - Beenleigh Road, Kingston Road and Compton Road, upgrade intersection ³ | 311 | 20,000 | 2,383 | 12,287 | 5,330 | |||||||||||||
Coomera Connector (Stage 1), Coomera to Nerang 4 | 309 | 3,026,000 | 821,018 | 650,000 | 1,554,982 | |||||||||||||
Cunningham Highway (Ipswich - Warwick), 2020 Disaster Recovery Funding Arrangements reconstruction works 4 | 310 | 134,400 | 77,444 | 46,392 | 10,564 | |||||||||||||
Currumbin Creek - Tomewin Road (Part A), 2022 Disaster Recovery Funding Arrangements reconstruction works 4 | 309 | 5,872 | 2,435 | 2,386 | 1,051 | |||||||||||||
Currumbin Creek Road and Bienvenue Drive, upgrade intersection ¹ | 309 | 10,000 | 988 | 3,012 | 6,000 | |||||||||||||
Currumbin Creek Road, 2022 Disaster Recovery Funding Arrangements reconstruction works 4 | 309 | 28,058 | 17,058 | 9,672 | 1,328 | |||||||||||||
Gold Coast Light Rail (Stage 3), Broadbeach South to Burleigh Heads 5 | 309 | 1,219,000 | 665,036 | 308,167 | 245,797 | |||||||||||||
Loganlea train station relocation 6 | 311 | 173,760 | 28,908 | 29,524 | 115,328 | |||||||||||||
Loganlea train station, upgrade park ‘n’ ride 7 | 311 | 15,750 | 8,250 | 7,500 | ||||||||||||||
Mount Lindesay Highway (Brisbane - Beaudesert), Johanna Street to South Street (Jimboomba), duplication 8 | 311 | 95,000 | 14,359 | 12,520 | 68,121 | |||||||||||||
Nerang - Murwillumbah Road, various locations, safety treatments | 309 | 38,118 | 34,922 | 2,804 | 392 | |||||||||||||
New Gold Coast Stations (Pimpama, Hope Island and Merrimac) 9 | 309 | 500,000 | 214,634 | 168,348 | 117,018 | |||||||||||||
Pacific Motorway, Daisy Hill to Logan Motorway, funding commitment 10 | 311 | 1,000,000 | 84,100 | 31,900 | 884,000 | |||||||||||||
Pacific Motorway, Eight Mile Plains to Daisy Hill upgrade 4 | 311 | 750,000 | 587,046 | 105,000 | 57,954 | |||||||||||||
Pacific Motorway, Exit 49, upgrade interchange ¹¹ | 309 | 140,768 | 83,767 | 27,001 | 30,000 | |||||||||||||
Pacific Motorway, Varsity Lakes (Exit 85) to Tugun (Exit 95) upgrade 4 | 309 | 1,500,000 | 1,044,617 | 165,000 | 290,383 | |||||||||||||
101
Capital Statement 2024-25
| Transport and Main Roads | ||||||||||||||||||
Project | Statistical Area | Total Estimated Cost $‘000 | Expenditure to 30-06-24 $‘000 | Budget 2024-25 $‘000 | Post 2024-25 $‘000 | |||||||||||||
Smith Street Connection, Village Boulevard to Olsen Avenue, construct pedestrian and cycleway facilities 4 | 309 | 13,300 | 800 | 6,250 | 6,250 | |||||||||||||
Other construction - South Coast District (Transport and Main Roads) | Various | 175,014 | Ongoing | |||||||||||||||
|
| |||||||||||||||||
Sub-total South Coast District | 1,780,846 | |||||||||||||||||
|
| |||||||||||||||||
Metropolitan | ||||||||||||||||||
Brisbane Metro, Woolloongabba Station, funding commitment ¹² | 303 | 450,000 | 56,817 | 4,183 | 389,000 | |||||||||||||
Butterfield Street Layover, construct bus layover and facilities | 305 | 10,200 | 1,141 | 9,059 | ||||||||||||||
Centenary Bridge upgrade 4 | 304 | 298,500 | 126,443 | 65,000 | 107,057 | |||||||||||||
Chermside Bus Layover, Gympie Road and Murphy Road intersection, construct bus facilities | 302 | 17,480 | 5,772 | 7,425 | 4,283 | |||||||||||||
Chermside bus stop, construct southbound platform | 302 | 16,536 | 5,042 | 7,002 | 4,492 | |||||||||||||
Cleveland - Redland Bay Road, Anita Street to Giles Road, duplicate lanes ¹³ | 301 | 80,000 | 2,351 | 10,289 | 67,360 | |||||||||||||
Cleveland - Redland Bay Road, Anita Street to Magnolia Parade, duplicate to four lanes | 301 | 84,311 | 52,259 | 27,198 | 4,855 | |||||||||||||
Gateway Motorway, Bracken Ridge to Pine River upgrade 14 | 302 | 1,000,000 | 40,453 | 55,000 | 904,547 | |||||||||||||
Gympie Arterial Road, Telegraph Road to Strathpine Road, improve drainage | 302 | 15,000 | 574 | 2,026 | 12,400 | |||||||||||||
Inner Northern Busway, Roma Street, improve bus station | 305 | 12,000 | 8,000 | 2,000 | 2,000 | |||||||||||||
Linkfield Road Overpass upgrade 8 | 302 | 176,000 | 15,965 | 5,821 | 154,214 | |||||||||||||
Riverview - Moggill Ferry Road, River Road to Brisbane River, improve drainage, pavement stabilisation and strengthening | 310 | 10,000 | 1,000 | 9,000 | ||||||||||||||
Samford Sub-Arterial Road (Samford Road) and Glen Holm Street, upgrade intersection | 304 | 10,000 | 4,600 | 5,400 | ||||||||||||||
Veloway 1 (V1) Cycleway, Birdwood Road cycle bridge and approaches, construction 15 | 303 | 36,146 | 3,615 | 32,532 | ||||||||||||||
Warrego Highway (Ipswich - Toowoomba) and Mount Crosby Road interchange 14 | 310 | 277,000 | 13,687 | 2,729 | 260,584 | |||||||||||||
Warrego Highway (Ipswich - Toowoomba), Bremer River Bridge, strengthening 10 | 310 | 85,000 | 25,000 | 60,000 | ||||||||||||||
102
Capital Statement 2024-25
| Transport and Main Roads | ||||||||||||||||||
Project | Statistical Area | Total Estimated Cost $‘000 | Expenditure to 30-06-24 $‘000 | Budget 2024-25 $‘000 | Post 2024-25 $‘000 | |||||||||||||
Other construction - Metropolitan District (Transport and Main Roads) | Various | 128,151 | Ongoing | |||||||||||||||
|
| |||||||||||||||||
Sub-total Metropolitan | 368,897 | |||||||||||||||||
|
| |||||||||||||||||
North Coast District | ||||||||||||||||||
Beerburrum to Nambour Rail Upgrade (Stage 1) 8 | 316 | 1,004,191 | 166,159 | 114,977 | 723,055 | |||||||||||||
Bruce Highway (Brisbane - Gympie), Anzac Avenue to Uhlmann Road upgrade, funding commitment 10 | 313 | 733,000 | 8,500 | 724,500 | ||||||||||||||
Bruce Highway (Brisbane - Gympie), Dohles Rocks Road to Anzac Avenue upgrade (Stage 1) 8 | 314 | 290,000 | 30,165 | 80,898 | 178,937 | |||||||||||||
Bruce Highway (Brisbane - Gympie), Gateway Motorway to Dohles Rocks Road upgrade (Stage 1) 14 | 314 | 948,000 | 36,205 | 30,000 | 881,795 | |||||||||||||
Bruce Highway (Brisbane - Gympie), Gateway Motorway to Dohles Rocks Road upgrade (Stage 2), detailed design 14 | 314 | 30,000 | 20,000 | 10,000 | ||||||||||||||
Caboolture - Bribie Island Road, Hickey Road to King Johns Creek, upgrade ² | 313 | 59,000 | 12 | 1,300 | 57,689 | |||||||||||||
Caboolture - Bribie Island Road, upgrade program 8 | 313 | 48,230 | 16,124 | 3,000 | 29,106 | |||||||||||||
Coominya Connection Road, Buaraba Creek, replace timber bridge ³ | 310 | 12,000 | 640 | 3,000 | 8,360 | |||||||||||||
Direct Sunshine Coast Rail Line (Stage 1), funding commitment ¹6 | 316 | 5,500,000 | 5,000 | 110,800 | 5,384,200 | |||||||||||||
Esk - Kilcoy Road, 2022 Disaster Recovery Funding Arrangements reconstruction works 4 | 310 | 13,657 | 2,180 | 11,477 | ||||||||||||||
Eumundi - Noosa Road, Emu Mountain Road to Beckmans Road, widen existing pavement 4 | 316 | 25,000 | 1,500 | 14,250 | 9,250 | |||||||||||||
Glass House Mountains Road (Steve Irwin Way), widen existing pavement 4 | 316 | 38,000 | 1,750 | 15,625 | 20,625 | |||||||||||||
Nicklin Way, Third Avenue extension, new intersection 17 | 316 | 11,200 | 553 | 2,000 | 8,647 | |||||||||||||
Samford Road, Lomandra Park to Camp Mountain Road, improve safety | 314 | 11,133 | 3,792 | 3,979 | 3,362 | |||||||||||||
Strathpine - Samford Road, Eatons Crossing Road and Mount Samson Road intersection, improve safety | 314 | 75,200 | 37,733 | 32,267 | 5,200 | |||||||||||||
Sunshine Motorway, Mooloolah River Interchange Upgrade (Stage 1) 18 | 316 | 176,750 | 76,477 | 10,150 | 90,123 | |||||||||||||
103
Capital Statement 2024-25
| Transport and Main Roads | ||||||||||||||||||
Project | Statistical Area | Total Estimated Cost $‘000 | Expenditure to 30-06-24 $‘000 | Budget 2024-25 $‘000 | Post 2024-25 $‘000 | |||||||||||||
Other construction - North Coast District (Transport and Main Roads) | Various | 209,491 | Ongoing | |||||||||||||||
|
| |||||||||||||||||
Sub-total North Coast District | 671,715 | |||||||||||||||||
|
| |||||||||||||||||
Wide Bay Burnett District | ||||||||||||||||||
Booral Road and Boundary Road (Urangan), upgrade intersection ³ | 319 | 27,000 | 2,526 | 1,905 | 22,569 | |||||||||||||
Bruce Highway (Cooroy to Curra) Section D, construction 4 | 319 | 1,162,000 | 969,392 | 110,608 | 82,000 | |||||||||||||
Bruce Highway (Gympie - Maryborough), Tiaro Bypass, construct bypass 14 | 319 | 336,000 | 16,013 | 5,600 | 314,387 | |||||||||||||
D’Aguilar Highway (Yarraman - Kingaroy), Alexander Lane to Bunya Highway, improve safety | 319 | 23,910 | 21,033 | 383 | 2,495 | |||||||||||||
D’Aguilar Highway (Yarraman - Kingaroy), Bushnell Road to Homley Road, strengthen and widen pavement | 319 | 11,500 | 4,802 | 1,698 | 5,000 | |||||||||||||
Isis Highway (Bundaberg - Childers), various locations, improve safety | 319 | 41,943 | 8,056 | 8,000 | 25,887 | |||||||||||||
Maryborough - Hervey Bay Road and Pialba - Burrum Heads Road, upgrade intersection ¹ | 319 | 55,353 | 785 | 8,195 | 46,373 | |||||||||||||
Maryborough - Hervey Bay Road, upgrade various intersections and improve safety 4 | 319 | 10,000 | 100 | 9,900 | ||||||||||||||
Monto - Mount Perry Road (Stage 3), upgrade to sealed standard 4 | 319 | 27,000 | 5,250 | 10,875 | 10,875 | |||||||||||||
Pialba - Burrum Heads Road, O’Regan Creek, upgrade existing floodway 15 | 319 | 28,950 | 1,400 | 800 | 26,750 | |||||||||||||
Other construction - Wide Bay Burnett District (Transport and Main Roads) | 319 | 105,466 | Ongoing | |||||||||||||||
|
| |||||||||||||||||
Sub-total Wide Bay Burnett District | 263,429 | |||||||||||||||||
|
| |||||||||||||||||
Darling Downs District | ||||||||||||||||||
Bowenville - Norwin Road, 2022 Disaster Recovery Funding Arrangements reconstruction works 4 | 307 | 33,437 | 1,916 | 26,912 | 4,610 | |||||||||||||
Cunningham Highway (Ipswich - Warwick), Tregony to Maryvale, improve safety 8 | 307 | 15,350 | 749 | 8,494 | 6,108 | |||||||||||||
Cunningham Highway (Warwick - Inglewood), improve safety | 307 | 16,885 | 870 | 4,500 | 11,515 | |||||||||||||
Gatton - Helidon Road, improve safety 4 | 317 | 34,107 | 3,752 | 16,791 | 13,564 | |||||||||||||
Gatton - Helidon Road, Stage 2, undertake safety treatments on high speed sections 4 | 317 | 32,991 | 569 | 16,211 | 16,211 | |||||||||||||
104
Capital Statement 2024-25
| Transport and Main Roads | ||||||||||||||||||
Project | Statistical Area | Total Estimated Cost $‘000 | Expenditure to 30-06-24 $‘000 | Budget 2024-25 $‘000 | Post 2024-25 $‘000 | |||||||||||||
Gore Highway (Millmerran - Goondiwindi), Wyaga Creek, upgrade floodway 4 | 307 | 52,400 | 29,473 | 13,577 | 9,350 | |||||||||||||
Gore Highway (Toowoomba - Millmerran) and Toowoomba - Athol Road, improve safety ¹5 | 307 | 23,359 | 814 | 2,550 | 19,994 | |||||||||||||
Leichhardt Highway (Miles - Goondiwindi), 2022 Disaster Recovery Funding Arrangements reconstruction works 4 | 307 | 11,846 | 1,478 | 3,839 | 6,529 | |||||||||||||
Mount Sylvia Road, various floodways, 2022 Disaster Recovery Funding Arrangements reconstruction works 4 | 317 | 13,807 | 880 | 11,751 | 1,177 | |||||||||||||
Toowoomba - Cecil Plains Road, improve safety | 307 | 27,031 | 850 | 6,000 | 20,181 | |||||||||||||
Other construction - Darling Downs District (Transport and Main Roads) | Various | 156,326 | Ongoing | |||||||||||||||
|
| |||||||||||||||||
Sub-total Darling Downs District | 266,950 | |||||||||||||||||
|
| |||||||||||||||||
South West District | ||||||||||||||||||
Castlereagh Highway (St George - Hebel), 2022 Disaster Recovery Funding Arrangements betterment works 4 | 307 | 9,914 | 1,362 | 7,020 | 1,532 | |||||||||||||
Warrego Highway (Miles - Roma), pavement widening and culverts 4 | 307 | 30,238 | 709 | 14,765 | 14,765 | |||||||||||||
Warrego Highway (Mitchell - Morven), rehabilitate pavement | 315 | 13,803 | 3,340 | 5,313 | 5,150 | |||||||||||||
Other construction - South West District (Transport and Main Roads) | Various | 35,083 | Ongoing | |||||||||||||||
|
| |||||||||||||||||
Sub-total South West District | 62,181 | |||||||||||||||||
|
| |||||||||||||||||
Fitzroy District | ||||||||||||||||||
Access to Gladstone Port, improve heavy vehicle access, funding commitment 10 | 308 | 125,000 | 2,000 | 123,000 | ||||||||||||||
Bruce Highway (Gin Gin - Benaraby), Station Creek and Boyne River, upgrade bridges 4 | 308 | 13,800 | 1,000 | 6,494 | 6,306 | |||||||||||||
Bruce Highway (Rockhampton - St Lawrence) and Bolsover Street, upgrade intersection 10 | 308 | 37,616 | 3,851 | 2,730 | 31,036 | |||||||||||||
Bruce Highway, Gladstone to Rockhampton, funding commitment 19 | 308 | 250,000 | 6,600 | 1,400 | 242,000 | |||||||||||||
Capricorn Highway (Duaringa - Emerald) and Gregory Highway (Springsure - Emerald), improve intersection 4 | 308 | 14,880 | 1,341 | 3,000 | 10,539 | |||||||||||||
Capricorn Highway (Duaringa - Emerald), undertake road safety improvements 4 | 308 | 24,000 | 3,000 | 10,500 | 10,500 | |||||||||||||
105
Capital Statement 2024-25
| Transport and Main Roads | ||||||||||||||||||
Project | Statistical Area | Total Estimated Cost $‘000 | Expenditure to 30-06-24 $‘000 | Budget 2024-25 $‘000 | Post 2024-25 $‘000 | |||||||||||||
Dawson Developmental Road (Springsure - Tambo), priority upgrades, funding commitment 4 | 308 | 25,538 | 760 | 8,090 | 16,688 | |||||||||||||
Rockhampton - Yeppoon Road, Musgrave Street, upgrade cyclist and pedestrian facilities 4 | 308 | 10,200 | 450 | 9,750 | ||||||||||||||
Rockhampton - Yeppoon Road, Yeppoon Road upgrade 4 | 308 | 122,000 | 56,592 | 39,500 | 25,908 | |||||||||||||
Rockhampton Railyards, rail maintenance, manufacturing and logistics centre | 308 | 33,400 | 32,007 | 1,393 | ||||||||||||||
Rockhampton Railyards Rejuvenation, capital upgrades | 308 | 14,331 | 13,152 | 1,179 | ||||||||||||||
Rockhampton Ring Road 4 | 308 | 1,730,000 | 252,081 | 191,200 | 1,286,719 | |||||||||||||
Other construction - Fitzroy District (Transport and Main Roads) | 308 | 74,530 | Ongoing | |||||||||||||||
|
| |||||||||||||||||
Sub-total Fitzroy District | 363,738 | |||||||||||||||||
|
| |||||||||||||||||
Central West District | ||||||||||||||||||
Capricorn Highway (Emerald - Alpha) (Package 2), strengthen and widen pavement, funding commitment 19 | 315 | 45,000 | 500 | 3,000 | 41,500 | |||||||||||||
Other construction - Central West District (Transport and Main Roads) | 315 | 38,981 | Ongoing | |||||||||||||||
|
| |||||||||||||||||
Sub-total Central West District | 41,981 | |||||||||||||||||
|
| |||||||||||||||||
Mackay Whitsunday District | ||||||||||||||||||
Bruce Highway (Mackay - Proserpine), Palm Tree and Blackrock Creek bridges, strengthen bridges 4 | 312 | 13,500 | 7,873 | 2,227 | 3,400 | |||||||||||||
Mackay Port Access, Bruce Highway to Mackay - Slade Point Road (Stage 1) 10 | 312 | 350,000 | 21,804 | 8,000 | 320,196 | |||||||||||||
Mackay Ring Road (Stage 1) 20 | 312 | 497,375 | 426,709 | 21,446 | 49,221 | |||||||||||||
Peak Downs Highway (Nebo - Mackay), Kirkup Bridge (Walkerston), replace timber bridge 15 | 312 | 11,000 | 1,709 | 1,000 | 8,291 | |||||||||||||
Peak Downs Highway (Nebo - Mackay), Walkerston to Racecourse, improve road safety 4 | 312 | 14,500 | 2,200 | 6,150 | 6,150 | |||||||||||||
Proserpine - Shute Harbour Road, Paluma Road to Valley Drive (Cannonvale), duplicate to four lanes 14 | 312 | 39,700 | 13,669 | 4,000 | 22,031 | |||||||||||||
Proserpine - Shute Harbour Road, Valley Drive to Tropic Road (Cannonvale), duplicate to four lanes ³ | 312 | 34,000 | 5,734 | 2,713 | 25,553 | |||||||||||||
106
Capital Statement 2024-25
| Transport and Main Roads | ||||||||||||||||||||
Project | Statistical Area | Total Estimated Cost $‘000 | Expenditure to 30-06-24 $‘000 | Budget 2024-25 $‘000 | Post 2024-25 $‘000 | |||||||||||||||
Proserpine - Shute Harbour Road, Hamilton Plains, flood immunity upgrade 8 | 312 | 24,000 | 5,440 | 2,000 | 16,560 | |||||||||||||||
Walkerston Bypass 4 | 312 | 251,700 | 160,577 | 52,320 | 38,803 | |||||||||||||||
Other construction - Mackay Whitsunday District (Transport and Main Roads) | 312 | 63,804 | Ongoing | |||||||||||||||||
|
| |||||||||||||||||||
Sub-total Mackay Whitsunday District | 163,659 | |||||||||||||||||||
|
| |||||||||||||||||||
Northern District | ||||||||||||||||||||
Burdekin River Bridge, rehabilitation program ²¹ | 318 | 96,931 | 60,891 | 4,000 | 32,040 | |||||||||||||||
Garbutt - Upper Ross Road (Riverway Drive) (Stage 2), Allambie Lane to Dunlop Street, duplicate to four lanes 8 | 318 | 95,000 | 7,140 | 15,011 | 72,849 | |||||||||||||||
Garbutt - Upper Ross Road, Halliday Street to Gouldian Avenue, improve safety ³ | 318 | 43,210 | 715 | 4,339 | 38,156 | |||||||||||||||
Hervey Range Developmental Road (Townsville - Battery), various locations, (Package 1), undertake safety upgrades 4 | 318 | 30,000 | 19,632 | 5,184 | 5,184 | |||||||||||||||
Ross River Road, Mabin Street to Rolfe Street, improve safety 15 | 318 | 19,320 | 1,167 | 2,100 | 16,053 | |||||||||||||||
Townsville Connection Road (Stuart Drive), Bowen Road Bridge (Idalia), duplicate bridge and approaches | 318 | 99,800 | 5,757 | 20,000 | 74,043 | |||||||||||||||
Townsville Connection Road (Stuart Drive), University Road to Bowen Road Bridge (Idalia), improve safety | 318 | 96,000 | 27,895 | 29,550 | 38,555 | |||||||||||||||
Other construction - Northern District (Transport and Main Roads) | 318 | 50,305 | Ongoing | |||||||||||||||||
|
| |||||||||||||||||||
Sub-total Northern District | 130,490 | |||||||||||||||||||
|
| |||||||||||||||||||
North West District | ||||||||||||||||||||
Burke Developmental Road (Cloncurry - Normanton), various locations, widen pavement | 315 | 11,240 | 100 | 4,640 | 6,500 | |||||||||||||||
Burke Developmental Road (Normanton - Dimbulah), 2023 Disaster Recovery Funding Arrangements reconstruction works 4 | 315 | 14,574 | 4,084 | 8,993 | 1,498 | |||||||||||||||
Richmond - Winton Road, strengthen and widen pavement 4 | 315 | 13,000 | 8,404 | 1,861 | 2,735 | |||||||||||||||
Other construction - North West District (Transport and Main Roads) | 315 | 62,131 | Ongoing | |||||||||||||||||
|
| |||||||||||||||||||
Sub-total North West District | 77,625 | |||||||||||||||||||
|
| |||||||||||||||||||
Far North District | ||||||||||||||||||||
107
Capital Statement 2024-25
| Transport and Main Roads | ||||||||||||||||||
Project | Statistical Area | Total Estimated Cost $‘000 | Expenditure to 30-06-24 $‘000 | Budget 2024-25 $‘000 | Post 2024-25 $‘000 | |||||||||||||
Bruce Highway (Ingham - Innisfail), Dallachy Road, install floodway ¹ | 306 | 18,000 | 3,419 | 50 | 14,531 | |||||||||||||
Bruce Highway, Cairns Southern Access Corridor (Stage 5), Foster Road, funding commitment 10 | 306 | 225,000 | 11,253 | 1,597 | 212,150 | |||||||||||||
Cairns Southern Access Cycleway, construct cycleway ²² | 306 | 41,529 | 26,119 | 4,200 | 11,210 | |||||||||||||
Cairns Western Arterial Road, Redlynch Connector Road to Captain Cook Highway, funding commitment ²³ | 306 | 300,000 | 26,673 | 15,000 | 258,327 | |||||||||||||
Captain Cook Highway, Cairns CBD to Smithfield, funding commitment 10 | 306 | 359,000 | 23,728 | 2,605 | 332,667 | |||||||||||||
Gillies Range Road, widen pavement and install guardrail 4 | 306 | 10,935 | 6,561 | 4,374 | ||||||||||||||
Gulf Developmental Road (Georgetown - Mount Garnet) (Package 4), strengthen and widen pavement 14 | 315 | 12,060 | 605 | 2,000 | 9,455 | |||||||||||||
Kennedy Highway (Cairns - Mareeba) and Kennedy Highway (Mareeba - Ravenshoe), upgrade intersection 4 | 306 | 15,000 | 9,000 | 3,000 | 3,000 | |||||||||||||
Kennedy Highway (Cairns - Mareeba), Barron River bridge, preconstruction 24 | 306 | 15,000 | 200 | 6,000 | 8,800 | |||||||||||||
Kuranda Range Road, safety and resilience upgrades, funding commitment 19 | 306 | 262,500 | 750 | 2,000 | 259,750 | |||||||||||||
Peninsula Developmental Road (Coen - Weipa), Archer River Crossing, construct bridge 4 | 315 | 131,252 | 69,967 | 24,867 | 36,419 | |||||||||||||
Peninsula Developmental Road (Laura - Coen), Yarraden to Three Sisters (Part A), pave and seal 4 | 315 | 17,641 | 3,786 | 8,903 | 4,952 | |||||||||||||
Other construction - Far North District (Transport and Main Roads) | Various | 126,812 | Ongoing | |||||||||||||||
|
| |||||||||||||||||
Sub-total Far North District | 201,407 | |||||||||||||||||
|
| |||||||||||||||||
Statewide District | ||||||||||||||||||
Cooperative and Automated Vehicles (CAV) Project | Various | 45,330 | 5,762 | 10,000 | 29,568 | |||||||||||||
Inland Freight Route (Charters Towers to Mungindi), funding commitment 25 | Various | 1,000,000 | 19,135 | 30,801 | 950,063 | |||||||||||||
Installation of Enforcement infrastructure, various locations | Various | 13,244 | 5,244 | 8,000 | ||||||||||||||
Local Congestion Busting Program, funding commitment 26 | Various | 100,000 | 3,000 | 97,000 | ||||||||||||||
Logan and Gold Coast Faster Rail 8 | 311 | 5,750,155 | 355,390 | 500,000 | 4,894,765 | |||||||||||||
108
Capital Statement 2024-25
| Transport and Main Roads | ||||||||||||||||||
Project | Statistical Area | Total Estimated Cost $‘000 | Expenditure to 30-06-24 $‘000 | Budget 2024-25 $‘000 | Post 2024-25 $‘000 | |||||||||||||
New Generation Rollingstock, Automatic Train Operation and Platform Screen Doors fitment 27 | Various | 275,700 | 89,599 | 83,297 | 102,803 | |||||||||||||
New Generation Rollingstock, European Train Control System fitment, install new signalling 27 | Various | 380,484 | 164,923 | 104,049 | 111,512 | |||||||||||||
New Generation Rollingstock, integration and ancillary works | Various | 51,600 | 2,560 | 25,240 | 23,800 | |||||||||||||
Productivity Enhancement Program, funding commitment 26 | Various | 100,000 | 3,000 | 97,000 | ||||||||||||||
Queensland Train Manufacturing Program | 319 | 4,869,000 | 771,860 | 786,000 | 3,311,140 | |||||||||||||
Red Light Enforcement Camera Upgrade, installation of enforcement infrastructure, funding commitment | Various | 23,000 | 140 | 5,610 | 17,250 | |||||||||||||
Transport Corridor Acquisition Fund | Various | 45,400 | Ongoing | |||||||||||||||
Other construction - Statewide (Transport and Main Roads) | Various | 165,052 | Ongoing | |||||||||||||||
|
| |||||||||||||||||
Sub-total Statewide District | 1,766,694 | |||||||||||||||||
|
| |||||||||||||||||
Other Plant and Equipment | ||||||||||||||||||
Corporate buildings | Various | 14,000 | Ongoing | |||||||||||||||
Information technology | Various | 10,000 | Ongoing | |||||||||||||||
Plant and Equipment | Various | 33,313 | Ongoing | |||||||||||||||
|
| |||||||||||||||||
Sub-total Other Plant and Equipment | 57,313 | |||||||||||||||||
|
| |||||||||||||||||
Customer and Digital Group | ||||||||||||||||||
Asset replacement for Smart Service Queensland | Various | 600 | Ongoing | |||||||||||||||
|
| |||||||||||||||||
Sub-total Customer and Digital Group | 600 | |||||||||||||||||
|
| |||||||||||||||||
Total Property, Plant and Equipment | 6,217,524 | |||||||||||||||||
|
| |||||||||||||||||
Capital Grants | ||||||||||||||||||
Active Transport Rail Trails | Various | 11,460 | Ongoing | |||||||||||||||
Black Spot Program | Various | 26,463 | Ongoing | |||||||||||||||
Cycling Program | Various | 44,677 | Ongoing | |||||||||||||||
Passenger Transport Accessible Infrastructure Program | Various | 5,195 | Ongoing | |||||||||||||||
School Bus Upgrade Program | Various | 21,586 | Ongoing | |||||||||||||||
School Transport Infrastructure Program | Various | 55,036 | 32,256 | 6,580 | 16,200 | |||||||||||||
Transport Infrastructure Development Scheme | Various | 75,950 | Ongoing | |||||||||||||||
109
Capital Statement 2024-25
| Transport and Main Roads | ||||||||||||||||||
Project | Statistical Area | Total Estimated Cost $‘000 | Expenditure to 30-06-24 $‘000 | Budget 2024-25 $‘000 | Post 2024-25 $‘000 | |||||||||||||
Wheelchair accessible taxi sustainability funding | Various | 20,890 | 18,890 | 2,000 | ||||||||||||||
Zero Emission Vehicle Action Plan | Various | 55,000 | 47,500 | 7,500 | ||||||||||||||
Beams Road (Carseldine and Fitzgibbon), upgrade rail level crossing 28 | 302 | 235,000 | 37,598 | 56,237 | 141,165 | |||||||||||||
Boundary Road (Coopers Plains), upgrade rail level crossing, funding commitment 29 | 303 | 399,000 | 17,896 | 63,084 | 318,020 | |||||||||||||
Lindum rail level crossing, upgrade signalisation, funding commitment 28 | 301 | 40,000 | 8,750 | 3,600 | 27,650 | |||||||||||||
Saraji Road, Phillips Creek, replace bridge 4 | 312 | 18,000 | 1,200 | 15,800 | 1,000 | |||||||||||||
Capital grants - Transport and Roads | Various | 337,878 | Ongoing | |||||||||||||||
|
| |||||||||||||||||
Total Capital Grants | 678,009 | |||||||||||||||||
|
| |||||||||||||||||
ROADTEK | ||||||||||||||||||
Property, Plant and Equipment | ||||||||||||||||||
Construction Plant Works | Various | 26,000 | Ongoing | |||||||||||||||
|
| |||||||||||||||||
Total Property, Plant and Equipment | 26,000 | |||||||||||||||||
|
| |||||||||||||||||
CITEC | ||||||||||||||||||
Property, Plant and Equipment | ||||||||||||||||||
Hardware replacement | 305 | 1,022 | Ongoing | |||||||||||||||
Right of use lease assets | 305 | 18,699 | Ongoing | |||||||||||||||
|
| |||||||||||||||||
Total Property, Plant and Equipment | 19,721 | |||||||||||||||||
|
| |||||||||||||||||
QUEENSLAND RAIL LIMITED | ||||||||||||||||||
Property, Plant and Equipment | ||||||||||||||||||
Growth - Externally Led | ||||||||||||||||||
Clapham Yard Stabling (Moorooka), construct stabling yard 30 | 303 | 532,356 | 204,779 | 123,000 | 204,577 | |||||||||||||
Station Upgrades Fairfield to Salisbury 30 | 303 | 105,355 | 58,064 | 25,680 | 21,610 | |||||||||||||
Inner City signalling upgrades 30 | Various | 74,739 | 48,160 | 13,531 | 13,048 | |||||||||||||
Mayne Yard Relocations 30 | 305 | 27,337 | 17,307 | 5,190 | 4,839 | |||||||||||||
Mayne Yard Accessibility 30 | 305 | 173,411 | 128,839 | 28,794 | 15,779 | |||||||||||||
Breakfast Creek Bridge, realign track 30 | 305 | 48,455 | 32,733 | 9,188 | 6,534 | |||||||||||||
New Generation Rollingstock compatible stabling yard upgrades | Various | 76,900 | 2,500 | 26,500 | 47,900 | |||||||||||||
Other rail network enhancements | Various | 10,226 | Ongoing | |||||||||||||||
Other station and network improvements | Various | 8,347 | Ongoing | |||||||||||||||
Rail station access improvements ³¹ | Various | 155,818 | 65,012 | 57,906 | 32,900 | |||||||||||||
110
Capital Statement 2024-25
| Transport and Main Roads | ||||||||||||||||||
Project | Statistical Area | Total Estimated Cost $‘000 | Expenditure to 30-06-24 $‘000 | Budget 2024-25 $‘000 | Post 2024-25 $‘000 | |||||||||||||
Signalling Integration Works | Various | 153,259 | 24,908 | 61,351 | 67,000 | |||||||||||||
Other park ‘n’ rides | Various | 16,939 | Ongoing | |||||||||||||||
European Train Control System Signalling Program: Phase 1 (Pilot line, Tunnel, and Sector 1 to Moorooka) ³² | 305 | 1,318,323 | 688,555 | 272,400 | 357,368 | |||||||||||||
Other European Train Control System Level 2 - Inner City | 305 | 36,393 | Ongoing | |||||||||||||||
Roma Street surface station integration ³³ | 305 | 35,000 | 10,443 | 24,557 | ||||||||||||||
Other Rail Growth - External | Various | 81,838 | Ongoing | |||||||||||||||
Growth - Internally Led | ||||||||||||||||||
Breakfast Creek Bridge Replacement | 305 | 28,000 | 3,813 | 24,187 | ||||||||||||||
Inner City Rail Corridor, upgrade signalling and interlocking planning 34 | Various | 1,500 | 1,370 | 130 | ||||||||||||||
Mount Isa Line, resilience improvements and track renewals | 315 | 50,000 | 4,914 | 37,654 | 7,431 | |||||||||||||
Cross River Rail Tunnel Maintenance Plant | Various | 12,050 | 100 | 3,100 | 8,850 | |||||||||||||
Station Accessibility Upgrades Other | Various | 26,821 | Ongoing | |||||||||||||||
Buranda train station, Arne Street (Woolloongabba), upgrade station | 303 | 70,079 | 26,581 | 43,448 | 50 | |||||||||||||
Lindum train station, Sibley Road, upgrade station | 301 | 62,381 | 33,774 | 28,109 | 497 | |||||||||||||
Morningside train station, Waminda Street, upgrade station | 305 | 68,025 | 38,016 | 29,734 | 275 | |||||||||||||
Burpengary train station, Burpengary Road, upgrade station | 313 | 45,972 | 31,338 | 14,584 | 50 | |||||||||||||
Bundamba train station, Mining Street, upgrade station | 310 | 53,745 | 34,118 | 19,577 | 50 | |||||||||||||
Banyo train station, St Vincents Road, upgrade station | 302 | 65,656 | 35,363 | 30,243 | 50 | |||||||||||||
Albion train station, Mawarra Street, upgrade station | 305 | 16,840 | 1,030 | 1,801 | 14,010 | |||||||||||||
Train Crew Capacity Upgrades | Various | 4,000 | 350 | 3,300 | 350 | |||||||||||||
Queensland Train Manufacturing Program Enabling works, Ormeau 35 | 309 | 246,900 | 840 | 50,186 | 195,874 | |||||||||||||
Other Rail Growth - Internal | Various | 82,457 | Ongoing | |||||||||||||||
Regional Network | ||||||||||||||||||
Maintenance of below rail assets - Townsville - Mount Isa Rail Line | Various | 21,792 | Ongoing | |||||||||||||||
Rail Network Maintenance Program, North Coast Line, maintain below rail assets | Various | 96,665 | Ongoing | |||||||||||||||
111
Capital Statement 2024-25
| Transport and Main Roads | ||||||||||||||||||||
Project | Statistical Area | Total Estimated Cost $‘000 | Expenditure to 30-06-24 $‘000 | Budget 2024-25 $‘000 | Post 2024-25 $‘000 | |||||||||||||||
Rail Network Maintenance Program, Regional network, maintain above rail assets | Various | 83,789 | Ongoing | |||||||||||||||||
Rail Network Maintenance Program, West Moreton, maintain below rail assets | Various | 56,522 | Ongoing | |||||||||||||||||
Rail Network Maintenance Program, Western region, maintain below rail assets | Various | 31,962 | Ongoing | |||||||||||||||||
South East Queensland Network | ||||||||||||||||||||
Rail Network Maintenance Program, South East Queensland network, maintain below rail assets | Various | 54,650 | Ongoing | |||||||||||||||||
Rail Network Maintenance Program, South East Queensland network, maintain above rail assets | Various | 118,081 | Ongoing | |||||||||||||||||
Enterprise | ||||||||||||||||||||
Enterprise Assets | Various | 24,823 | Ongoing | |||||||||||||||||
Enterprise Other | Various | 31,146 | Ongoing | |||||||||||||||||
Information and Technology | Various | 31,446 | Ongoing | |||||||||||||||||
|
| |||||||||||||||||||
Total Property, Plant and Equipment | 1,748,048 | |||||||||||||||||||
|
| |||||||||||||||||||
GOLD COAST WATERWAYS AUTHORITY | ||||||||||||||||||||
Property, Plant and Equipment | ||||||||||||||||||||
Boating Infrastructure Program, various locations | 309 | 2,200 | Ongoing | |||||||||||||||||
Navigational Access and Safety Program, various locations, dredging navigation channels | 309 | 1,370 | Ongoing | |||||||||||||||||
Plant, equipment and minor works | 309 | 1,900 | Ongoing | |||||||||||||||||
Spit Masterplan (Southport), northern end of Main Beach, implement spit masterplan 36 | 309 | 26,536 | 12,541 | 4,622 | 9,373 | |||||||||||||||
|
| |||||||||||||||||||
Total Property, Plant and Equipment | 10,092 | |||||||||||||||||||
|
| |||||||||||||||||||
CROSS RIVER RAIL DELIVERY AUTHORITY | ||||||||||||||||||||
Property, Plant and Equipment | ||||||||||||||||||||
Cross River Rail | 305 | 7,669,315 | 6,648,927 | 455,322 | 565,066 | |||||||||||||||
|
| |||||||||||||||||||
Total Property, Plant and Equipment | 455,322 | |||||||||||||||||||
|
| |||||||||||||||||||
Capital Grants | ||||||||||||||||||||
Cross River Rail - third party returnable works | 305 | 179,159 | 120,905 | 58,254 | ||||||||||||||||
|
| |||||||||||||||||||
Total Capital Grants | 58,254 | |||||||||||||||||||
|
| |||||||||||||||||||
FAR NORTH QUEENSLAND PORTS CORPORATION LIMITED | ||||||||||||||||||||
112
Capital Statement 2024-25
| Transport and Main Roads | ||||||||||||||||||||
Project | Statistical Area | Total Estimated Cost $‘000 | Expenditure to 30-06-24 $‘000 | Budget 2024-25 $‘000 | Post 2024-25 $‘000 | |||||||||||||||
Property, Plant and Equipment | ||||||||||||||||||||
Cairns Marine Precinct – Common User Facility | 306 | 360,000 | 24,050 | 37,000 | 298,950 | |||||||||||||||
Cairns shipping development project - fine sediment offset | 306 | 110,590 | 109,840 | 750 | ||||||||||||||||
Channel Navigation Improvements | 306 | 12,000 | 10,000 | 2,000 | ||||||||||||||||
Horn Island Passenger Jetty and Cargo Wharf Upgrade | 315 | 11,100 | 6,000 | 5,100 | ||||||||||||||||
Marina Reconfiguration & Expansion | 306 | 5,890 | 4,500 | 1,390 | ||||||||||||||||
Mourilyan Land Development for Bulk Cargo | 306 | 5,000 | 2,500 | 2,500 | ||||||||||||||||
Plant, equipment and minor works | 306 | 610 | Ongoing | |||||||||||||||||
Smith’s Creek Cargo Land Consolidation | 306 | 12,050 | 50 | 3,000 | 9,000 | |||||||||||||||
Tingira Street Subdivision Development | 306 | 15,778 | 5,138 | 1,450 | 9,190 | |||||||||||||||
Tingira Street Warehouse/Shops | 306 | 5,000 | Ongoing | |||||||||||||||||
|
| |||||||||||||||||||
Total Property, Plant and Equipment | 69,910 | |||||||||||||||||||
|
| |||||||||||||||||||
GLADSTONE PORTS CORPORATION LIMITED |
| |||||||||||||||||||
Property, Plant and Equipment | ||||||||||||||||||||
Auckland Point 3 projects | 308 | 2,890 | Ongoing | |||||||||||||||||
Auckland Point Central projects | 308 | 300 | Ongoing | |||||||||||||||||
Barney Point projects | 308 | 2,500 | Ongoing | |||||||||||||||||
Gladstone Ports Corporation Limited - Northern Land Expansion Project | 308 | 116,000 | 10,000 | 33,875 | 72,125 | |||||||||||||||
Information systems projects | 308 | 3,025 | Ongoing | |||||||||||||||||
Marina projects | 308 | 950 | Ongoing | |||||||||||||||||
Marine pilot services projects | 308 | 3,500 | Ongoing | |||||||||||||||||
Plant, equipment and minor works | 308 | 2,285 | Ongoing | |||||||||||||||||
Port Alma projects | 308 | 3,865 | Ongoing | |||||||||||||||||
Port Services projects | 308 | 650 | Ongoing | |||||||||||||||||
Quarry projects | 308 | 2,200 | Ongoing | |||||||||||||||||
RG Tanna Coal Terminal Projects | ||||||||||||||||||||
Conveyor life extension | 308 | 140 | Ongoing | |||||||||||||||||
Process control systems, stockpile management and upgrades | 308 | 54,922 | Ongoing | |||||||||||||||||
Ship loader (SL1) replacement | 308 | 63,921 | 5,392 | 58,529 | ||||||||||||||||
Right-of-use lease assets | 308 | 5,472 | Ongoing | |||||||||||||||||
Tug facility projects | 308 | 1,416 | 774 | 642 | ||||||||||||||||
|
| |||||||||||||||||||
Total Property, Plant and Equipment | 121,966 | |||||||||||||||||||
|
| |||||||||||||||||||
113
Capital Statement 2024-25
| Transport and Main Roads | ||||||||||||||||||||
Project | Statistical Area | Total Estimated Cost $‘000 | Expenditure to 30-06-24 $‘000 | Budget 2024-25 $‘000 | Post 2024-25 $‘000 | |||||||||||||||
NORTH QUEENSLAND BULK PORTS CORPORATION LIMITED |
| |||||||||||||||||||
Property, Plant and Equipment | ||||||||||||||||||||
5 Yearly Dredging at Hay Point | 312 | 3,329 | Ongoing | |||||||||||||||||
Bowen Wharf - planning and designs | 312 | 4,961 | 961 | 2,000 | 2,000 | |||||||||||||||
Grain rail loop end of life upgrade | 312 | 2,000 | 2,000 | |||||||||||||||||
Hydrogen trade studies | 312 | 250 | Ongoing | |||||||||||||||||
Louisa Creek Acquisition Program | 312 | 1,052 | Ongoing | |||||||||||||||||
Marine Offloading Facility Expansion - Stage 1 | 312 | 4,046 | 46 | 2,000 | 2,000 | |||||||||||||||
Middle Breakwater Fuel Line Supports Replacement | 312 | 6,667 | 667 | 6,000 | ||||||||||||||||
Mulherin Park Improvement | 312 | 250 | Ongoing | |||||||||||||||||
New Container Heavy Duty Laydown Area | 312 | 18,000 | 8,000 | 10,000 | ||||||||||||||||
North Queensland Bulk Ports Corporation Limited - Port Development General | 312 | 2,529 | Ongoing | |||||||||||||||||
Port of Mackay New Administration Building | 312 | 2,500 | Ongoing | |||||||||||||||||
Wharf 1 Laydown Area | 312 | 1,000 | Ongoing | |||||||||||||||||
Wharf 1 Western Deck Extension - planning | 312 | 1,900 | 1,000 | 900 | ||||||||||||||||
Wharf 5 Dolphin Walkways | 312 | 1,500 | 1,500 | |||||||||||||||||
|
| |||||||||||||||||||
Total Property, Plant and Equipment | 33,410 | |||||||||||||||||||
|
| |||||||||||||||||||
PORT OF TOWNSVILLE LIMITED | ||||||||||||||||||||
Property, Plant and Equipment | ||||||||||||||||||||
Channel capacity upgrade | 318 | 251,180 | 232,809 | 18,371 | ||||||||||||||||
Other infrastructure and maintenance works | 318 | 13,198 | Ongoing | |||||||||||||||||
Plant, equipment and minor works | 318 | 2,992 | Ongoing | |||||||||||||||||
Road network upgrades | 318 | 7,919 | Ongoing | |||||||||||||||||
Wharf facilities upgrades | 318 | 13,555 | Ongoing | |||||||||||||||||
|
| |||||||||||||||||||
Total Property, Plant and Equipment | 56,036 | |||||||||||||||||||
|
| |||||||||||||||||||
TOTAL TRANSPORT AND MAIN ROADS (PPE) |
| 8,758,028 | ||||||||||||||||||
|
| |||||||||||||||||||
TOTAL TRANSPORT AND MAIN ROADS (CG) |
| 736,263 | ||||||||||||||||||
|
| |||||||||||||||||||
Notes:
| 1. | Jointly funded with the Australian Government. The project is in the post-business case stage, with cost and timing subject to confirmation following market engagement and consideration. Funding splits under negotiation. |
| 2. | Jointly funded with the Australian Government. The project has a business case, with scope, cost and timing subject to further project development and site investigations, and consideration and negotiation with the Australian Government, including funding splits. |
| 3. | The project is in the post-business case stage, with cost and timing subject to confirmation following market |
114
Capital Statement 2024-25
| engagement and consideration. |
| 4. | Jointly funded with the Australian Government. |
| 5. | This project is being delivered as a Public Private Partnership. Jointly funded with the Australian Government and Gold Coast City Council. |
| 6. | Jointly funded with the Australian Government. The project is in the post-business case stage, with cost and timing subject to confirmation following market engagement and consideration. It includes an agreed contribution from Queensland Rail. |
| 7. | Jointly funded with the Australian Government. Project scope, cost and timing are subject to further planning and consideration. |
| 8. | Jointly funded with the Australian Government. The project is in the post-business case stage, with cost and timing subject to confirmation following market engagement and consideration. |
| 9. | Includes an agreed contribution from Queensland Rail of $73 million. |
| 10. | Jointly funded with the Australian Government. The project is in the pre-business case stage, with scope, cost and timing subject to further planning and business case development, and consideration. |
| 11. | Jointly funded with the Australian Government. Funding contributions subject to further consideration and negotiation with the Australian Government. |
| 12. | Jointly funded with the Australian Government and Brisbane City Council. The project is in the pre-business case stage, with scope, cost and timing subject to further planning and business case development, and consideration and negotiation with the Australian Government and Brisbane City Council. |
| 13. | The project is in the pre-business case stage, with scope, cost and timing subject to further planning and business case development, and consideration. |
| 14. | Jointly funded with the Australian Government. The project has a business case, with scope, cost and timing subject to further project development and site investigations, and consideration. |
| 15. | The project has a business case, with scope, cost and timing subject to further project development and site investigations, and consideration |
| 16. | Jointly funded with the Australian Government. The project has a business case, with scope, cost and timing subject to further project development and site investigations, and consideration. Stage 1 is expected to cost between $5.5 billion to $7 billion, with cost estimates to be finalised following further design development, market engagement and procurement. |
| 17. | The project has a business case, with scope, cost and timing subject to further project development and site investigations, and consideration and negotiation with the Sunshine Coast Council. |
| 18. | Project details and timing subject to further planning and negotiation with funding partners. |
| 19. | Jointly funded with the Australian Government. Project details and timing subject to further planning and negotiation with the Australian Government. |
| 20. | Jointly funded with the Australian Government. Construction of the Mackay Ring Road is complete, with remaining works associated with the connection to Bald Hill Road. |
| 21. | Jointly funded with the Australian Government. Includes an agreed contribution from Queensland Rail. |
| 22. | Jointly funded with the Australian Government. Forms part of the Bruce Highway, Cairns Southern Access Stage 2 (Robert Road to Foster Road) project. |
| 23. | Jointly funded with the Australian Government. The project has a business case, with scope, cost and timing subject to further project development and site investigations, and consideration and negotiation with the Australian Government. |
| 24. | Funding is for progressing pre-construction activities only. Project details, cost and timing subject to further planning and consideration. |
| 25. | Jointly funded with the Australian Government. Queensland Government has commenced early works package. |
| 26. | Project details and timing subject to further planning. |
| 27. | This project is being delivered as a Public Private Partnership. |
| 28. | Jointly funded with the Australian Government and Brisbane City Council |
| 29. | Jointly funded with the Australian Government and Brisbane City Council. The project has a business case, with scope, cost and timing subject to further project development and site investigations, and consideration and negotiation with the Australian Government and Brisbane City Council. |
| 30. | This project is being delivered by Cross River Rail Delivery Authority. |
| 31. | Rail station access improvements include Roma Street subway, Dutton Park train station and Boggo Road train station. |
| 32. | This is the same project as European Control System Level 2, but also includes new cyber security/operational readiness scope, full integration with other Cross River Rail contract schedules to Moorooka, and addresses inflationary signalling costs. There is also a reallocation of $47m of funding from QR’s existing Network Efficiencies program. |
| 33. | This project is delivered by the Department of Transport and Main Roads. |
| 34. | This project will undertake initial planning works for future funding consideration. |
115
Capital Statement 2024-25
| 35. | The Ormeau Mainline Connection Works and Ormeau Feeder Substation have been merged to form Queensland Train Manufacturing Program Enabling works |
| 36. | This capital value makes up part of the overall $60 million Spit Master Plan works program being implemented by Gold Coast Waterways Authority and other delivery entities. |
116
Capital Statement 2024-25
| 3.21 | TREATY, ABORIGINAL AND TORRES STRAIT ISLANDER PARTNERSHIPS, COMMUNITIES AND THE ARTS |
The Treaty, Aboriginal and Torres Strait Islander Partnerships, Communities and the Arts portfolio includes the Department of Treaty, Aboriginal and Torres Strait Islander Partnerships, Communities and the Arts together with Arts Queensland, and statutory bodies reporting to the Minister for Treaty, Minister for Aboriginal and Torres Strait Islander Partnerships, Minister for Communities and Minister for the Arts.
The portfolio’s capital purchases for 2024-25 are $130.5 million. The portfolio’s capital grants for 2024-25 are $14.2 million.
The government has set aside $12 million, held centrally, for the Queensland Cultural Centre capital works to support asset renewal works, compliance upgrade and safety improvements in 2024-25.
Department of Treaty, Aboriginal and Torres Strait Islander Partnerships, Communities and the Arts
Total capital purchases for the Department of Treaty, Aboriginal and Torres Strait Islander Partnerships, Communities and the Arts are $119.6 million in 2024-25. Total capital grants for the department are $14.2 million in 2024-25.
Program Highlights (Property, Plant and Equipment)
| • | $30.7 million for capital asset renewal works, compliance upgrades and safety improvements and amenities upgrades across the Queensland Cultural Centre. An additional $12 million is being held centrally for capital asset renewal works during 2024-25. |
| • | $20.4 million for stage 2 end of life asset replacement and renewal works at the Queensland Cultural Centre. |
| • | $21.8 million to continue a program of works to progress the establishment of new and replacement neighbourhood centres throughout Queensland including Manunda, Agnes Water, Kowanyama, Emerald, Manoora and Labrador. |
| • | $11.8 million for end of life asset replacement and building fabric renewal works at the Queensland Cultural Centre. |
| • | $8 million to deliver priority infrastructure projects across state owned arts and cultural facilities as part of the Arts Infrastructure Investment Fund. |
| • | $6.8 million to continue with upgrades to existing neighbourhood centres and other key social infrastructure. |
| • | $5.4 million to continue delivery of the new performing arts venue at the Queensland Performing Arts Centre, benefiting Queensland artists and audiences. |
| • | $3.5 million towards the upgrade of the Mount Isa Diversionary Centre to enable a specific service offering for women. |
| • | $3.2 million towards the construction of a new neighbourhood centre in Rockhampton. |
| • | $3.1 million to deliver security enhancement measures across the Queensland Cultural Centre precinct. |
| • | $2.4 million to complete the redevelopment of the Bribie Island Neighbourhood Centre. |
| • | $1.2 million to complete the reconfiguration of the Grey and Russell Street intersection, South Brisbane to enhance vehicular access to the Queensland Performing Arts Centre. |
117
Capital Statement 2024-25
| • | $707,000 for fit-out works and other property, plant and equipment to support the department’s office accommodation requirements. |
| • | $500,000 for the acquisition of property, plant and equipment to support whole-of-department service delivery. |
Program Highlights (Capital Grants)
| • | $6.7 million towards the construction of the Coen Art Centre. |
| • | $5 million for capital grants in 2024-25 available to small to medium Gold Coast screen businesses with capital grants between $250,000 and $750,000, supporting infrastructure works and new or upgraded capital equipment that directly supports screen industry growth on the Gold Coast. |
| • | $2 million for the Orange Sky Headquarters of the Future. |
| • | $500,000 for the Queensland Remembers Grants Program, to support ex-service organisations and not-for-profit organisations that provide services to veterans to upgrade their building, facilities and equipment. |
Library Board of Queensland
The Library Board of Queensland has capital purchases of $2.2 million in 2024-25, to purchase heritage collections, information collections, intangible assets in the form of digital collections, and replace information technology equipment.
Program Highlights (Property, Plant and Equipment)
| • | $1.6 million to acquire new items for the digital, heritage and information collections. |
| • | $638,000 to replace information technology equipment. |
Queensland Art Gallery
The Queensland Art Gallery has capital purchases of $2.8 million in 2024-25, for the acquisition of artworks for the State Art Collection, and for life-cycle replacement of other property, plant and equipment assets.
Program Highlights (Property, Plant and Equipment)
| • | $2.5 million for artwork acquisitions. |
| • | $300,000 to replace other property, plant and equipment. |
Queensland Performing Arts Trust
The Queensland Performing Arts Trust has capital purchases of $4 million in 2024-25, for strategic capability enhancements to technical equipment, towards service of spaces offered by the Melbourne Street Green Cafe, as well as life-cycle replacement of other property, plant and equipment assets.
Program Highlights (Property, Plant and Equipment)
| • | $1 million for the lifecycle replacement of operational property, plant and equipment assets, such as theatre equipment and food and beverage equipment. |
| • | $1 million to service the dining, event and entertainment spaces offered by the Melbourne Street Green Cafe. |
| • | $2 million for purchases to drive the strategic capability enhancement of specialised |
118
Capital Statement 2024-25
technical equipment.
Queensland Museum
The Queensland Museum has capital purchases of $1.9 million in 2024-25 to effectively safeguard the State Collection and preserve State-owned infrastructure.
Program Highlights (Property, Plant and Equipment)
| • | $1.7 million for building fabric works at Queensland Museum Cobb+Co and the Queensland Museum Rail Workshops. |
| • | $200,000 for lifecycle replacement of operational property, plant and equipment. |
| Treaty, Aboriginal and Torres Strait Islander Partnerships, Communities and the Arts | ||||||||||||||||||||
Project | Statistical Area | Total Estimated Cost $‘000 | Expenditure to 30-06-24 $‘000 | Budget 2024-25 $‘000 | Post 2024-25 $‘000 | |||||||||||||||
DEPARTMENT OF TREATY, ABORIGINAL AND TORRES STRAIT ISLANDER PARTNERSHIPS, COMMUNITIES AND THE ARTS |
| |||||||||||||||||||
Property, Plant and Equipment | ||||||||||||||||||||
Treaty, Aboriginal and Torres Strait Islander Partnerships, Communities and the Arts | ||||||||||||||||||||
Land and building acquisitions and upgrades | Various | 500 | Ongoing | |||||||||||||||||
Fit-out and minor capital works | Various | 402 | Ongoing | |||||||||||||||||
Community Services | ||||||||||||||||||||
New and replacement Neighbourhood Centres | Various | 21,824 | Ongoing | |||||||||||||||||
Community Services - General property upgrades | Various | 6,820 | Ongoing | |||||||||||||||||
Community Services - Office accommodation, fixtures and fittings | Various | 305 | Ongoing | |||||||||||||||||
Mount Isa Diversionary Centre upgrade | 315 | 4,000 | 500 | 3,500 | ||||||||||||||||
Rockhampton Neighbourhood Centre | 308 | 4,556 | 1,376 | 3,180 | ||||||||||||||||
Bribie Island Neighbourhood Centre | 313 | 2,850 | 450 | 2,400 | ||||||||||||||||
Arts Queensland | ||||||||||||||||||||
New Performing Arts Venue at QPAC ¹ | 305 | 159,000 | 153,558 | 5,442 | ||||||||||||||||
Queensland Cultural Centre – Capital works, asset upgrades and refurbishment projects ² | 305 | 53,700 | 2,131 | 30,719 | 20,850 | |||||||||||||||
Queensland Cultural Centre critical infrastructure works - Stage 2 2021 to 2025 | 305 | 30,519 | 10,133 | 20,386 | ||||||||||||||||
Queensland Cultural Centre - End of life asset replacement and building fabric renewal works | 305 | 11,750 | 11,750 | |||||||||||||||||
Queensland Cultural Centre – Security upgrades | 305 | 4,010 | 870 | 3,140 | ||||||||||||||||
119
Capital Statement 2024-25
| Treaty, Aboriginal and Torres Strait Islander Partnerships, Communities and the Arts | ||||||||||||||||||||
Project | Statistical Area | Total Estimated Cost $‘000 | Expenditure to 30-06-24 $‘000 | Budget 2024-25 $‘000 | Post 2024-25 $‘000 | |||||||||||||||
Arts Infrastructure Investment Fund - Stage 2 2021 to 2024 | 305 | 9,509 | 1,461 | 8,048 | ||||||||||||||||
Realignment of Grey and Russell Street Intersection | 305 | 1,400 | 221 | 1,179 | ||||||||||||||||
|
| |||||||||||||||||||
Total Property, Plant and Equipment | 119,595 | |||||||||||||||||||
|
| |||||||||||||||||||
Capital Grants | ||||||||||||||||||||
Screen Queensland Capital Grants Program, Gold Coast | 309 | 5,000 | 5,000 | |||||||||||||||||
Orange Sky | Various | 3,000 | 1,000 | 2,000 | ||||||||||||||||
Queensland Remembers Grants Program | Various | 5,108 | 3,258 | 500 | 1,350 | |||||||||||||||
Coen Art Centre | 315 | 8,178 | 6,678 | 1,500 | ||||||||||||||||
|
| |||||||||||||||||||
Total Capital Grants | 14,178 | |||||||||||||||||||
|
| |||||||||||||||||||
LIBRARY BOARD OF QUEENSLAND | ||||||||||||||||||||
Property, Plant and Equipment | ||||||||||||||||||||
Information technology equipment | 305 | 638 | Ongoing | |||||||||||||||||
Information collection | 305 | 349 | Ongoing | |||||||||||||||||
Heritage collection | 305 | 465 | Ongoing | |||||||||||||||||
Digital collection | 305 | 795 | Ongoing | |||||||||||||||||
|
| |||||||||||||||||||
Total Property, Plant and Equipment | 2,247 | |||||||||||||||||||
|
| |||||||||||||||||||
QUEENSLAND ART GALLERY | ||||||||||||||||||||
Property, Plant and Equipment | ||||||||||||||||||||
Acquisitions for the Queensland Art Gallery’s collection | 305 | 2,500 | Ongoing | |||||||||||||||||
Ongoing replacement of plant and equipment | 305 | 300 | Ongoing | |||||||||||||||||
|
| |||||||||||||||||||
Total Property, Plant and Equipment | 2,800 | |||||||||||||||||||
|
| |||||||||||||||||||
QUEENSLAND PERFORMING ARTS TRUST | ||||||||||||||||||||
Property, Plant and Equipment | ||||||||||||||||||||
Lifecycle replacement of operational property, plant and equipment | 305 | 1,000 | Ongoing | |||||||||||||||||
Strategic capability specialised technical equipment | 305 | 5,940 | 500 | 1,970 | 3,470 | |||||||||||||||
Queensland Performing Arts Venue - Melbourne Street Green Café | 305 | 1,700 | 700 | 1,000 | ||||||||||||||||
|
| |||||||||||||||||||
Total Property, Plant and Equipment | 3,970 | |||||||||||||||||||
|
| |||||||||||||||||||
QUEENSLAND MUSEUM | ||||||||||||||||||||
Property, Plant and Equipment | ||||||||||||||||||||
120
Capital Statement 2024-25
| Treaty, Aboriginal and Torres Strait Islander Partnerships, Communities and the Arts | ||||||||||||||||||
Project | Statistical Area | Total Estimated Cost $‘000 | Expenditure to 30-06-24 $‘000 | Budget 2024-25 $‘000 | Post 2024-25 $‘000 | |||||||||||||
Building fabric works at Queensland Museum Cobb+Co and the Queensland Museum Rail Workshops | Various | 4,950 | 1,675 | 3,275 | ||||||||||||||
Lifecycle replacement of operational property, plant and equipment | 305 | 200 | Ongoing | |||||||||||||||
|
| |||||||||||||||||
Total Property, Plant and Equipment | 1,875 | |||||||||||||||||
|
| |||||||||||||||||
TOTAL TREATY, ABORIGINAL AND TORRES STRAIT ISLANDER PARTNERSHIPS, COMMUNITIES AND THE ARTS (PPE) | 130,487 | |||||||||||||||||
|
| |||||||||||||||||
TOTAL TREATY, ABORIGINAL AND TORRES STRAIT ISLANDER PARTNERSHIPS, COMMUNITIES AND THE ARTS (CG) | 14,178 | |||||||||||||||||
|
| |||||||||||||||||
Notes:
| 1. | The Total Estimated Cost of $184 million, includes a State Contribution of $159 million and a contribution by the Queensland Performing Arts Trust of $25 million. |
| 2. | An additional $12 million held centrally, will also contribute to the Queensland Cultural Centre capital works in support of asset renewal works, compliance upgrade and safety improvements in 2024-25, as part of total capital funding of $65.7 million. |
121
Capital Statement 2024-25
| 3.22 | YOUTH JUSTICE |
Department of Youth Justice
The capital works program for the Department of Youth Justice is $221.1 million in 2024-25. These funds provide the infrastructure to support young people and help prevent and respond to crime and violence.
Program Highlights (Property, Plant and Equipment)
| • | $185.1 million for the continued construction of the Woodford Youth Detention Centre. |
| • | $36.1 million for ongoing upgrades and minor works to Youth Detention centres and Youth Justice services centres. |
| Youth Justice | ||||||||||||||||||||
Project | Statistical Area | Total Estimated Cost $‘000 | Expenditure to 30-06-24 $‘000 | Budget 2024-25 $‘000 | Post 2024-25 $‘000 | |||||||||||||||
DEPARTMENT OF YOUTH JUSTICE | ||||||||||||||||||||
Property, Plant and Equipment | ||||||||||||||||||||
Woodford Youth Detention Centre - 80 bed construction project | 313 | 627,610 | 27,264 | 185,050 | 415,296 | |||||||||||||||
Woodford Youth Detention Centre - establishment costs | 313 | 409 | 409 | |||||||||||||||||
Youth Justice facilities | Various | 36,064 | Ongoing | |||||||||||||||||
|
| |||||||||||||||||||
Total Property, Plant and Equipment | 221,114 | |||||||||||||||||||
|
| |||||||||||||||||||
TOTAL YOUTH JUSTICE (PPE) | 221,114 | |||||||||||||||||||
|
| |||||||||||||||||||
122
Capital Statement 2024-25
Appendices
| Appendix A: | Entities included in capital outlays 2024–25 |
Agriculture and Fisheries
| • | Department of Agriculture and Fisheries |
| • | Queensland Racing Integrity Commission |
Child Safety, Seniors and Disability Services
| • | Department of Child Safety, Seniors and Disability Services |
Education
| • | Department of Education |
| • | Queensland Curriculum and Assessment Authority |
Employment, Small Business and Training
| • | Department of Employment, Small Business and Training |
| • | TAFE Queensland |
Energy and Climate
| • | Department of Energy and Climate |
| • | CleanCo Queensland Limited |
| • | CS Energy Limited |
| • | Energy Queensland Limited |
| • | Powerlink Queensland |
| • | Queensland Hydro Pty Ltd |
| • | Stanwell Corporation Limited |
Environment, Science and Innovation
| • | Department of Environment, Science and Innovation |
Housing, Local Government, Planning and Public Works
| • | Department of Housing, Local Government, Planning and Public Works |
Justice and Attorney-General
| • | Department of Justice and Attorney-General |
| • | Crime and Corruption Commission |
| • | Legal Aid Queensland |
123
Capital Statement 2024-25
| • | Public Trustee of Queensland |
| • | Office of the Queensland Ombudsman |
Legislative Assembly of Queensland
| • | Legislative Assembly of Queensland |
Premier and Cabinet
| • | Department of the Premier and Cabinet |
Queensland Corrective Services
| • | Queensland Corrective Services |
Queensland Fire Department
| • | Queensland Fire Department |
| • | Queensland Reconstruction Authority |
Queensland Health
| • | Queensland Health and Hospital and Health Services |
| • | Council of the Queensland Institute of Medical Research |
Queensland Police Service
| • | Queensland Police Service |
Queensland Treasury
| • | Queensland Treasury |
Regional Development, Manufacturing and Water
| • | Department of Regional Development, Manufacturing and Water |
| • | Gladstone Area Water Board |
| • | Mount Isa Water Board |
| • | Seqwater |
| • | SunWater Limited |
Resources
| • | Department of Resources |
State Development and Infrastructure
| • | Department of State Development and Infrastructure |
| • | Economic Development Queensland |
| • | South Bank Corporation |
Tourism and Sport
| • | Department of Tourism and Sport |
124
Capital Statement 2024-25
| • | Stadiums Queensland |
Transport and Main Roads
| • | Department of Transport and Main Roads |
| • | RoadTek |
| • | CITEC |
| • | Queensland Rail Limited |
| • | Gold Coast Waterways Authority |
| • | Cross River Rail Delivery Authority |
| • | Far North Queensland Ports Corporation Limited |
| • | Gladstone Ports Corporation Limited |
| • | North Queensland Bulk Ports Corporation Limited |
| • | Port of Townsville Limited |
Treaty, Aboriginal and Torres Strait Islander Partnerships, Communities and the Arts
| • | Department of Treaty, Aboriginal and Torres Strait Islander Partnerships, Communities and the Arts |
| • | Library Board of Queensland |
| • | Queensland Art Gallery |
| • | Queensland Performing Arts Trust |
| • | Queensland Museum |
Youth Justice
| • | Department of Youth Justice |
125
Capital Statement 2024-25
| Appendix B: | Key concepts and coverage |
Coverage of the capital statement
Under accrual output budgeting, capital is the stock of assets including property, plant and equipment and intangible assets that any agency owns and/or controls and uses in the delivery of services, as well as capital grants made to other entities. The following definitions are applicable throughout this document:
| • | capital purchases – property, plant and equipment outlay as per the financial statements excluding asset sales, depreciation and revaluations |
| • | capital grants – capital grants to other entities and individuals (excluding grants to other government departments and statutory bodies) |
| • | right of use assets – property, plant and equipment to which government agencies have a right to use through lease or similar arrangements. |
Capital contingency
Consistent with the approach adopted in previous years, a capital contingency reserve has been included. This reserve recognises that while agencies budget to fully use their capital works allocation, circumstances such as project lead-in times, project management constraints, unexpected weather conditions and capacity constraints such as the supply of labour and materials may prevent full usage. On a whole-of-government basis, there is likely to be underspending, resulting in a carry-over of capital allocations.
Estimated jobs supported by capital works
The $27.1 billion capital works program in 2024–25 is estimated to directly support around 72,000 jobs, equating to around 66,600 full-time equivalent jobs. The estimate of jobs supported by the Government’s capital works program in 2024–25 is based on Queensland Treasury’s Guidelines for estimating the full-time equivalent (FTE) jobs directly supported by the construction component of the capital works program.
The estimate of jobs supported by the capital works program is presented both in terms of FTEs and total jobs. Further, in some cases, jobs estimates quoted for specific projects throughout the Capital Statement and in other budget papers may reflect other approaches, including proponents’ estimates or project specific information, rather than the methodology in the Queensland Treasury Guidelines for estimating jobs supported by capital works.
126
Capital Statement 2024-25
| Appendix C: | Capital purchases by entity by region 2024–251 |
| Brisbane and Redlands | ||||||||||||||||||||||||
| East | North | South | West | Inner city | Sub total | |||||||||||||||||||
Entity2 | $‘000 | $‘000 | $‘000 | $‘000 | $‘000 | $‘000 | ||||||||||||||||||
Agriculture and Fisheries | 3,861 | 361 | 1,406 | 305 | 5,004 | 10,937 | ||||||||||||||||||
Child Safety, Seniors and Disability Services | 771 | 715 | 1,202 | 603 | 961 | 4,252 | ||||||||||||||||||
Education | 63,981 | 45,970 | 75,816 | 61,759 | 74,825 | 322,351 | ||||||||||||||||||
Employment, Small Business and Training | 2,699 | 14,425 | 4,207 | 2,110 | 3,363 | 26,805 | ||||||||||||||||||
Energy and Climate | 59,027 | 95,254 | 106,574 | 46,532 | 642,721 | 950,108 | ||||||||||||||||||
Environment, Science and Innovation | 3,906 | 2,117 | 3,561 | 1,786 | 2,847 | 14,217 | ||||||||||||||||||
Housing, Local Government, Planning and Public Works | 27,232 | 18,431 | 27,580 | 21,344 | 58,076 | 152,664 | ||||||||||||||||||
Justice and Attorney-General | 2,374 | 2,200 | 3,700 | 1,856 | 12,930 | 23,059 | ||||||||||||||||||
Legislative Assembly of Queensland | — | — | — | — | 3,646 | 3,646 | ||||||||||||||||||
Premier and Cabinet | — | — | — | — | 1,060 | 1,060 | ||||||||||||||||||
Queensland Corrective Services | 4,851 | 4,495 | 7,560 | 3,793 | 6,044 | 26,744 | ||||||||||||||||||
Queensland Fire Department | 3,178 | 2,945 | 4,953 | 2,485 | 21,460 | 35,020 | ||||||||||||||||||
Queensland Health | 87,457 | 90,000 | 104,389 | 32,595 | 282,792 | 597,233 | ||||||||||||||||||
Queensland Police Service | 16,797 | 15,565 | 26,178 | 13,133 | 20,928 | 92,601 | ||||||||||||||||||
Queensland Treasury | — | — | — | — | — | — | ||||||||||||||||||
Regional Development, Manufacturing and Water | 1,463 | 1,355 | 12,279 | 1,144 | 1,822 | 18,063 | ||||||||||||||||||
Resources | 739 | 685 | 1,152 | 578 | 921 | 4,075 | ||||||||||||||||||
State Development and Infrastructure | 6,655 | 47,155 | 8,080 | 79 | 16,274 | 78,244 | ||||||||||||||||||
Tourism and Sport | 2,780 | 2,576 | 4,408 | 2,174 | 3,464 | 15,403 | ||||||||||||||||||
Transport and Main Roads | 161,432 | 216,499 | 361,513 | 140,956 | 1,151,040 | 2,031,440 | ||||||||||||||||||
Treaty, Aboriginal and Torres Strait Islander Partnerships, Communities and the Arts | 1,363 | 1,263 | 2,124 | 1,066 | 91,579 | 97,395 | ||||||||||||||||||
Youth Justice | 1,647 | 1,526 | 2,566 | 1,287 | 2,052 | 9,078 | ||||||||||||||||||
Other Agencies3 | 40 | 38 | 64 | 32 | 52 | 227 | ||||||||||||||||||
Anticipated capital contingency reserve and other adjustments4 | ||||||||||||||||||||||||
Funds allocated | 420,869 | 524,464 | 706,620 | 312,326 | 2,237,041 | 4,201,320 | ||||||||||||||||||
Notes
| 1. | Numbers may not add due to rounding and allocations of adjustments. |
| 2. | Includes all associated statutory bodies. |
| 3. | Includes other government entities with non-material capital programs. |
| 4. | The anticipated contingency reserve and other adjustments have been spread across statistical areas proportionate to capital spends. |
127
Capital Statement 2024-25
| Darling Downs | ||||||||||||||||||||||||
| Ipswich | Wide Bay | DD Maranoa | Toowoomba | Sub total | Gold Coast | |||||||||||||||||||
Entity2 | $‘000 | $‘000 | $‘000 | $‘000 | $‘000 | $‘000 | ||||||||||||||||||
Agriculture and Fisheries | 670 | 1,259 | 3,004 | 3,357 | 6,361 | 1,108 | ||||||||||||||||||
Child Safety, Seniors and Disability Services | 5,387 | 966 | 406 | 508 | 913 | 2,157 | ||||||||||||||||||
Education | 176,061 | 49,176 | 30,214 | 18,981 | 49,195 | 134,375 | ||||||||||||||||||
Employment, Small Business and Training | 4,637 | 3,381 | 1,421 | 1,776 | 3,197 | 7,550 | ||||||||||||||||||
Energy and Climate | 476,092 | 2,008,896 | 683,339 | 161,189 | 844,528 | 265,201 | ||||||||||||||||||
Environment, Science and Innovation | 3,925 | 14,582 | 6,202 | 1,504 | 7,706 | 8,241 | ||||||||||||||||||
Housing, Local Government, Planning and Public Works | 39,198 | 45,336 | 10,942 | 13,746 | 24,687 | 65,462 | ||||||||||||||||||
Justice and Attorney-General | 4,078 | 2,974 | 1,249 | 1,562 | 2,812 | 6,640 | ||||||||||||||||||
Legislative Assembly of Queensland | — | — | — | — | — | — | ||||||||||||||||||
Premier and Cabinet | — | — | — | — | — | — | ||||||||||||||||||
Queensland Corrective Services | 107,516 | 6,077 | 2,553 | 3,193 | 5,746 | 18,149 | ||||||||||||||||||
Queensland Fire Department | 14,160 | 8,881 | 3,723 | 7,092 | 10,814 | 8,890 | ||||||||||||||||||
Queensland Health | 87,187 | 139,226 | 32,692 | 224,640 | 257,332 | 304,287 | ||||||||||||||||||
Queensland Police Service | 246,435 | 26,974 | 18,840 | 11,055 | 29,895 | 46,985 | ||||||||||||||||||
Queensland Treasury | — | — | — | — | — | — | ||||||||||||||||||
Regional Development, Manufacturing and Water | 244,086 | 111,456 | 770 | 56,984 | 57,753 | 34,591 | ||||||||||||||||||
Resources | 1,270 | 926 | 389 | 486 | 875 | 2,067 | ||||||||||||||||||
State Development and Infrastructure | 2,255 | 127 | 53 | 67 | 120 | 22,978 | ||||||||||||||||||
Tourism and Sport | 4,777 | 3,483 | 1,463 | 1,830 | 3,293 | 7,777 | ||||||||||||||||||
Transport and Main Roads | 230,137 | 1,111,980 | 213,229 | 201,890 | 415,118 | 1,644,789 | ||||||||||||||||||
Treaty, Aboriginal and Torres Strait Islander Partnerships, Communities and the Arts | 3,179 | 1,707 | 717 | 1,735 | 2,452 | 3,813 | ||||||||||||||||||
Youth Justice | 2,829 | 2,063 | 867 | 1,084 | 1,950 | 4,606 | ||||||||||||||||||
Other Agencies3 | 65 | 52 | 21 | 28 | 49 | 111 | ||||||||||||||||||
Anticipated capital contingency reserve and other adjustments4 | ||||||||||||||||||||||||
Funds allocated | 1,539,164 | 3,293,893 | 941,858 | 663,244 | 1,605,102 | 2,410,056 | ||||||||||||||||||
Notes
| 1. | Numbers may not add due to rounding and allocations of adjustments. |
| 2. | Includes all associated statutory bodies. |
| 3. | Includes other government entities with non-material capital programs. |
| 4. | The anticipated contingency reserve and other adjustments have been spread across statistical areas proportionate to capital spends. |
128
Capital Statement 2024-25
| Logan - | Mackay - | Outback and Far North Queensland | Central | |||||||||||||||||||||
| Beaudesert | Whitsunday | Outback | Cairns | Sub total | Queensland | |||||||||||||||||||
Entity2 | $‘000 | $‘000 | $‘000 | $‘000 | $‘000 | $‘000 | ||||||||||||||||||
Agriculture and Fisheries | 646 | 864 | 266 | 1,493 | 1,759 | 5,126 | ||||||||||||||||||
Child Safety, Seniors and Disability Services | 1,196 | 570 | 249 | 839 | 1,087 | 727 | ||||||||||||||||||
Education | 106,112 | 44,140 | 23,739 | 56,486 | 80,224 | 66,272 | ||||||||||||||||||
Employment, Small Business and Training | 7,704 | 1,996 | 3,370 | 17,735 | 21,105 | 2,544 | ||||||||||||||||||
Energy and Climate | 267,735 | 779,371 | 703,835 | 294,054 | 997,889 | 1,030,844 | ||||||||||||||||||
Environment, Science and Innovation | 3,545 | 5,190 | 20,737 | 7,176 | 27,913 | 2,153 | ||||||||||||||||||
Housing, Local Government, Planning and Public Works | 46,468 | 29,156 | 41,895 | 132,695 | 174,589 | 33,356 | ||||||||||||||||||
Justice and Attorney-General | 17,204 | 1,756 | 765 | 2,581 | 3,347 | 2,237 | ||||||||||||||||||
Legislative Assembly of Queensland | — | — | — | — | — | — | ||||||||||||||||||
Premier and Cabinet | — | — | — | — | — | — | ||||||||||||||||||
Queensland Corrective Services | 17,526 | 3,588 | 4,264 | 5,275 | 9,539 | 4,572 | ||||||||||||||||||
Queensland Fire Department | 5,531 | 11,100 | 5,225 | 8,206 | 13,430 | 2,995 | ||||||||||||||||||
Queensland Health | 128,567 | 46,959 | 56,262 | 109,640 | 165,902 | 130,209 | ||||||||||||||||||
Queensland Police Service | 26,060 | 26,761 | 13,714 | 20,521 | 34,235 | 15,830 | ||||||||||||||||||
Queensland Treasury | — | — | — | — | — | — | ||||||||||||||||||
Regional Development, Manufacturing and Water | 3,356 | 15,331 | 8,375 | 1,590 | 9,965 | 364,202 | ||||||||||||||||||
Resources | 1,147 | 547 | 1,038 | 1,954 | 2,993 | 697 | ||||||||||||||||||
State Development and Infrastructure | 157 | 325 | 33 | 110 | 143 | 12,372 | ||||||||||||||||||
Tourism and Sport | 4,314 | 2,056 | 896 | 14,023 | 14,920 | 2,620 | ||||||||||||||||||
Transport and Main Roads | 815,583 | 254,893 | 303,438 | 261,986 | 565,424 | 558,548 | ||||||||||||||||||
Treaty, Aboriginal and Torres Strait Islander Partnerships, Communities and the Arts | 2,115 | 1,008 | 3,939 | 1,482 | 5,422 | 4,464 | ||||||||||||||||||
Youth Justice | 2,555 | 1,218 | 531 | 1,791 | 2,321 | 1,552 | ||||||||||||||||||
Other Agencies3 | 65 | 31 | 13 | 43 | 56 | 38 | ||||||||||||||||||
Anticipated capital contingency reserve and other adjustments4 | ||||||||||||||||||||||||
Funds allocated | 1,356,433 | 1,141,720 | 1,109,821 | 874,470 | 1,984,291 | 2,085,815 | ||||||||||||||||||
Notes
| 1. | Numbers may not add due to rounding and allocations of adjustments. |
| 2. | Includes all associated statutory bodies. |
| 3. | Includes other government entities with non-material capital programs. |
| 4. | The anticipated contingency reserve and other adjustments have been spread across statistical areas proportionate to capital spends. |
129
Capital Statement 2024-25
| Sunshine Coast | Moreton Bay South | Moreton Bay Moreton Bay North | Sub total | Townsville | Totals1 | |||||||||||||||||||
Entity2 | $‘000 | $‘000 | $‘000 | $‘000 | $‘000 | $‘000 | ||||||||||||||||||
Agriculture and Fisheries | 1,249 | 1,402 | 363 | 1,765 | 675 | 32,418 | ||||||||||||||||||
Child Safety, Seniors and Disability Services | 1,325 | 864 | 718 | 1,582 | 788 | 20,952 | ||||||||||||||||||
Education | 78,788 | 46,297 | 66,234 | 112,531 | 56,382 | 1,275,608 | ||||||||||||||||||
Employment, Small Business and Training | 4,639 | 3,025 | 2,513 | 5,538 | 6,560 | 95,656 | ||||||||||||||||||
Energy and Climate | 272,328 | 59,540 | 52,856 | 112,396 | 680,202 | 8,685,588 | ||||||||||||||||||
Environment, Science and Innovation | 5,027 | 4,182 | 2,127 | 6,309 | 3,373 | 102,181 | ||||||||||||||||||
Housing, Local Government, Planning and Public Works | 31,450 | 35,247 | 32,079 | 67,326 | 47,649 | 757,341 | ||||||||||||||||||
Justice and Attorney-General | 4,080 | 2,660 | 2,210 | 4,871 | 2,927 | 75,985 | ||||||||||||||||||
Legislative Assembly of Queensland | — | — | — | — | — | 3,646 | ||||||||||||||||||
Premier and Cabinet | — | — | — | — | — | 1,060 | ||||||||||||||||||
Queensland Corrective Services | 8,337 | 5,437 | 4,516 | 9,953 | 10,159 | 227,906 | ||||||||||||||||||
Queensland Fire Department | 12,262 | 5,112 | 2,959 | 8,070 | 7,249 | 138,402 | ||||||||||||||||||
Queensland Health | 83,610 | 81,044 | 52,381 | 133,426 | 92,673 | 2,166,612 | ||||||||||||||||||
Queensland Police Service | 33,229 | 18,824 | 18,029 | 36,853 | 47,552 | 663,410 | ||||||||||||||||||
Queensland Treasury | — | — | — | — | 40,978 | 40,978 | ||||||||||||||||||
Regional Development, Manufacturing and Water | 80,245 | 1,639 | 15,659 | 17,298 | 81,409 | 1,037,756 | ||||||||||||||||||
Resources | 1,270 | 828 | 688 | 1,516 | 1,725 | 19,107 | ||||||||||||||||||
State Development and Infrastructure | 25,549 | 114 | 94 | 208 | 304 | 142,783 | ||||||||||||||||||
Tourism and Sport | 4,778 | 3,116 | 2,589 | 5,705 | 2,843 | 71,969 | ||||||||||||||||||
Transport and Main Roads | 461,137 | 81,543 | 323,051 | 404,594 | 264,386 | 8,758,028 | ||||||||||||||||||
Treaty, Aboriginal and Torres Strait Islander Partnerships, Communities and the Arts | 2,342 | 3,927 | 1,269 | 5,196 | 1,393 | 130,487 | ||||||||||||||||||
Youth Justice | 2,830 | 186,895 | 1,533 | 188,428 | 1,683 | 221,114 | ||||||||||||||||||
Other Agencies3 | 69 | 46 | 38 | 84 | 39 | 886 | ||||||||||||||||||
Anticipated capital contingency reserve and other adjustments4 | (1,712,013 | ) | ||||||||||||||||||||||
Funds allocated | 1,037,197 | 504,147 | 541,524 | 1,045,672 | 1,257,198 | 22,957,860 | ||||||||||||||||||
Notes
| 1. | Numbers may not add due to rounding and allocations of adjustments. |
| 2. | Includes all associated statutory bodies. |
| 3. | Includes other government entities with non-material capital programs. |
| 4. | The anticipated contingency reserve and other adjustments have been spread across statistical areas proportionate to capital spends. |
130
Queensland Budget 2023–24 Capital Statement Budget Paper No.3
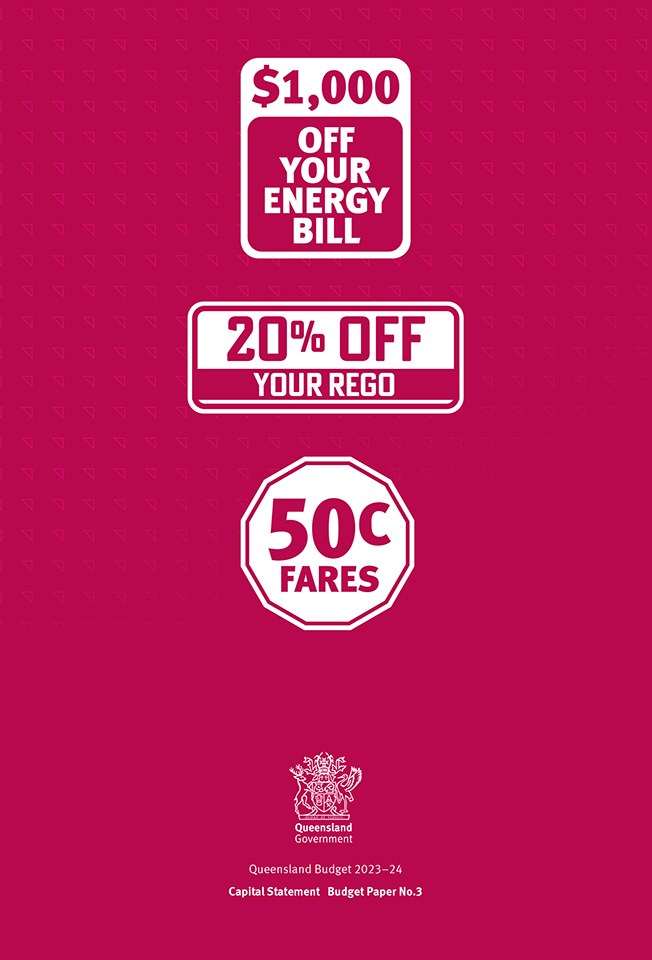
$1,000 OFF YOUR ENERGY BILL 20% OFF YOUR REGO 50C FARES Queensland Budget 2023–24 Capital Statement Budget Paper No.3
DOING WHAT MATTERS FOR QUEENSLAND QUEENSLAND BUDGET 2024–25 |  |
BUDGET MEASURES
BUDGET PAPER NO. 4
 |
2024–25 Queensland Budget Papers
1. Budget Speech
2. Budget Strategy and Outlook
3. Capital Statement
4. Budget Measures
Service Delivery Statements
Appropriation Bills
Budget Overview
Regional Action Plans
First Nations acknowledgement
Queensland Treasury acknowledges Aboriginal peoples and Torres Strait Islander peoples as the Traditional Owners and custodians of the land. We recognise their connection to land, sea and community, and pay our respects to Elders past, present and emerging.
© The State of Queensland (Queensland Treasury) 2024
Copyright
This publication is protected by the Copyright Act 1968
Licence
This document is licensed by the State of Queensland (Queensland Treasury) under a Creative Commons Attribution (CC BY 4.0) International licence.

In essence, you are free to copy, communicate and adapt this publication, as long as you attribute the work to the State of Queensland (Queensland Treasury).
Attribution
Content from this publication should be attributed to:
© The State of Queensland (Queensland Treasury) - 2024–25 Queensland Budget

Translating and interpreting assistance
The Queensland Government is committed to providing accessible services to Queenslanders from all cultural and linguistic backgrounds. If you have difficulty in understanding this publication, you can contact us on telephone (07) 3035 3503 and we will arrange an interpreter to effectively communicate the report to you.
Budget Measures
Budget Paper No. 4
ISSN 1445-4890 (Print)
ISSN 1445-4904 (Online)
Budget Measures 2024-25

State Budget
2024–25
Budget Measures
Budget Paper No. 4
Budget Measures 2024-25
Contents
Key Features | 1 | |||||
1 | Introduction | 2 | ||||
Explanation of scope and terms | 2 | |||||
Overview | 4 | |||||
Whole-of-Government Measures | 7 | |||||
Government Indexation Policy | 11 | |||||
Summary Tables | 12 | |||||
2 | Expense Measures | 31 | ||||
Introduction | 31 | |||||
Department of Agriculture and Fisheries | 32 | |||||
Department of Child Safety, Seniors and Disability Services | 37 | |||||
Department of Education | 44 | |||||
Department of Employment, Small Business and Training | 50 | |||||
Department of Energy and Climate | 54 | |||||
Department of Environment, Science and Innovation | 55 | |||||
Department of Housing, Local Government, Planning and Public Works | 59 | |||||
Department of Justice and Attorney-General | 62 | |||||
Department of Regional Development, Manufacturing and Water | 76 | |||||
Department of Resources | 79 | |||||
Department of State Development and Infrastructure | 82 | |||||
Department of the Premier and Cabinet | 87 | |||||
Department of Tourism and Sport | 89 | |||||
Department of Transport and Main Roads | 93 | |||||
Department of Treaty, Aboriginal and Torres Strait Islander Partnerships, Communities and the Arts | 99 | |||||
Department of Youth Justice | 108 | |||||
Legislative Assembly of Queensland | 113 | |||||
Budget Measures 2024-25
Office of the Governor | 114 | |||||
Office of the Queensland Ombudsman | 115 | |||||
Public Sector Commission | 117 | |||||
Queensland Corrective Services | 118 | |||||
Queensland Fire Department | 122 | |||||
Queensland Health | 123 | |||||
Queensland Police Service | 132 | |||||
Queensland Treasury | 143 | |||||
3 | Capital measures | 147 | ||||
Introduction | 147 | |||||
Department of Child Safety, Seniors and Disability Services | 148 | |||||
Department of Education | 149 | |||||
Department of Environment, Science and Innovation | 150 | |||||
Department of Housing, Local Government, Planning and Public Works | 151 | |||||
Department of Justice and Attorney-General | 152 | |||||
Department of Resources | 155 | |||||
Department of State Development and Infrastructure | 156 | |||||
Department of Transport and Main Roads | 157 | |||||
Department of Treaty, Aboriginal and Torres Strait Islander Partnerships, Communities and the Arts | 160 | |||||
Department of Youth Justice | 162 | |||||
Legislative Assembly of Queensland | 163 | |||||
Office of the Queensland Ombudsman | 164 | |||||
Queensland Corrective Services | 165 | |||||
Queensland Fire Department | 166 | |||||
Queensland Health | 167 | |||||
Queensland Police Service | 170 | |||||
Queensland Treasury | 176 | |||||
Budget Measures 2024-25
4 | Revenue measures | 177 | ||||
Introduction | 177 | |||||
Department of Agriculture and Fisheries | 178 | |||||
Department of Transport and Main Roads | 179 | |||||
Queensland Treasury | 181 | |||||
Budget Measures 2024-25
Key Features
| • | The 2024–25 Budget measures will deliver cost-of-living relief, make our communities safer, invest in educating for the future and in Queenslanders’ health and wellbeing. |
| • | This Budget provides a record $11.218 billion in concessions in 2024–25, an increase of 31.1 per cent. |
| • | Substantial cost-of-living relief is delivered in this Budget including a $1,300 electricity bill rebate in 2024–25 for all Queensland households across the state. |
| • | The government is providing an uplift to Queensland Health’s operating funding envelope of $4.393 billion to address emerging demand and cost pressures, improve the flow of patients through hospitals and provide more timely access to care as well as boosting First Nations health and women’s health care. |
| • | This uplift means a record operating health budget of $26.710 billion, a 10.6 per cent boost to the health system. |
| • | The Budget is investing in young Queenslanders and the state’s future workforce through education and training, and prevention and early support initiatives. This includes total funding of $22.801 billion for education and training in 2024–25. The $502 million Putting Queensland Kids First early support package aims to deliver stronger outcomes with positive life trajectories for Queensland children and families. |
| • | The government’s evidence-based Community Safety Plan for Queensland commits an extra $1.28 billion over 5 years for community safety measures across 5 key pillars: supporting victims; delivering for our frontline; detaining offenders; intervening when people offend; and preventing crime before it occurs. |
| • | The government has committed $3.1 billion towards the new whole-of-system housing plan, Homes for Queenslanders. The plan responds to key housing pressures, including supply, affordability, and homelessness, and enhances the focus on planning and development outcomes. Homes for Queenslanders represents a significant uplift on top of the existing major investment into social and affordable housing, setting a target of 53,500 new social homes by 2046. |
| • | This budget sets out a landmark capital investment of around $26 billion over 4 years to deliver the Queensland Energy and Jobs Plan, which sets out the pathway to transform Queensland’s energy system and achieve the State’s renewable energy and emissions reduction targets. |
1
Budget Measures 2024-25
| 1 | Introduction |
This document provides a consolidated view of policy decisions with budgetary impacts made by the government since the 2023–24 Budget. It complements other budget papers, in particular Budget Paper No. 2 Budget Strategy and Outlook, Budget Paper No. 3 Capital Statement and the Service Delivery Statements.
This paper includes only new policy decisions and does not detail the full amount of additional funding being provided to agencies to deliver services and infrastructure.
Other adjustments, including those that are parameter based and where the funding formula remains unchanged, are similarly excluded.
The total funding impact of new measures is summarised in Tables 1.3 to 1.5 at the conclusion of this chapter.
For details on the total funding available to agencies, refer to agencies’ Service Delivery Statements.
| 1.1 | Explanation of scope and terms |
Scope
This document includes measures with the following features:
| • | Sector. Only Queensland General Government sector agencies are included. Measures involving government-owned corporations or other Public Non-Financial Corporations sector agencies are within scope only if the measures are being funded directly by the General Government sector or if there is a flow through effect (for example, community service obligations). |
| • | Timeframe. Measures based on decisions made by the government since the 2023–24 Budget. |
| • | Type. Measures with budgetary impacts, in particular: |
| (i) | expense and capital measures with service delivery, capital enhancement, grant or subsidy impacts on the community and |
| (ii) | revenue measures involving a significant change in revenue policy, including changes in the tax rate. |
| • | Materiality. Minor measures or measures with non-significant community impacts are not included in this document. |
| • | Technical initiatives or non-policy-based adjustments, such as parameter-based funding adjustments, are not included if the formula to calculate these adjustments has not changed, as they do not reflect changes in government policy. The focus is on measures reflecting policy decisions that impact directly on the community through service delivery or other means. |
2
Budget Measures 2024-25
Funding basis
Tables in this document are presented on a net funding basis.
| • | Net funding refers to the impact that the funding of measures has on appropriations to relevant General Government agencies from the Consolidated Fund. Net funding also includes funding held centrally in the Consolidated Fund for future appropriation to the relevant agency once a prescribed action is undertaken or event occurs. |
| • | The tables do not include funding directed to the measure from existing agency resources or other sources. |
| • | Amounts refer to additional funding being provided to agencies for a particular program or project, as a result of decisions by government since the 2023–24 Budget. The amount provided for a measure may differ from other budget papers, such as Budget Paper No. 3 Capital Statement, that may refer to total funding. |
| • | Where a measure involves material expenditure or revenue collections by more than one department, the measure is reported under each department involved. The addition of each individual department’s portion of a particular measure may not equate to the reported total whole-of-government figure due to the omission of some departments’ portions that did not meet Budget Paper 4’s materiality threshold (i.e. $250,000 over 5 years). |
| • | Amounts included in the tables relating to revenue measures represent the impact of the measure on government revenue (with a positive amount representing additional revenue). |
| • | Tables 1.3 to 1.5 identify expense, capital and revenue measures separately, categorised as: up to and including 2023–24 Budget Update, and since the 2023–24 Budget Update. |
3
Budget Measures 2024-25
| 1.2 | Overview |
The following section presents selected measures relating to decisions taken since the 2023–24 Budget.
| 1.2.1 | Cost-of-living measures |
The Queensland Government recognises the challenges that cost-of-living pressures are causing for Queenslanders. While the rate of inflation has started to moderate, elevated price levels for a range of goods and services are still putting pressure on household budgets across the country.
In 2024–25, the government is providing a record $11.218 billion in concessions to Queensland families and businesses, an increase of 31.1 per cent compared with 2023–24.
The government is providing $3.739 billion in new and expanded measures in 2024–25 to support Queenslanders in tackling cost-of-living challenges.
This comprises electricity bill rebates, lower public transport fares and motor vehicle registration costs, additional support for first home buyers, an increase in the value of and access to FairPlay vouchers, school and community food relief program; and food, emergency, and financial relief measures for vulnerable cohorts. Some of the key measures include:
| • | $2.965 billion for additional electricity bill support to households and small businesses. Queensland households will automatically receive $1,300 off their electricity bills in 2024–25. This consists of an upfront $1,000 Cost of Living Rebate from the Queensland Government and a $300 rebate paid in quarterly instalments from the Australian Government. |
| • | The Queensland Electricity Rebate Scheme provides a rebate of $372 per annum, to assist with the cost of domestic electricity supply to the home of eligible holders of a Pensioner Concession Card, a Queensland Seniors Card, Commonwealth Health Care Card, Department of Veterans’ Affairs Gold Card (who receive a War Widow/er Pension or special rate Totally or Permanently Incapacitated Pension) and asylum seekers. This brings total electricity bill support for this cohort to $1,672 in 2024–25. |
| • | $150 million in 2024–25 from lowering public transport fares to a flat fare of 50 cents per trip across the state from 5 August 2024 for 6 months. In addition to this initiative, the government is also providing half-price tickets on Airtrain services. |
| • | $435 million from a 20 per cent reduction in motor vehicle registration costs for all light vehicles for a 12-month period, which is scheduled to start appearing on renewal notices sent to customers from 5 August 2024. It is estimated that $399 million of benefit from this measure will be realised in 2024–25 financial year, and the remaining $36 million in 2025–26. |
| • | An additional $33.5 million to expand the FairPlay program to up to $40 million in 2024–25. The maximum value of vouchers will increase from $150 to $200 for every voucher and the number of vouchers available will be increased from 50,000 to up to 200,000. Importantly, 50,000 vouchers will be guaranteed to the current target eligible cohort, with an additional up to 150,000 vouchers made available to all households. |
4
Budget Measures 2024-25
| • | $15 million in 2024–25 for the School and Community Food Relief Program. This initiative will assist children to access food relief from appropriate sources, ranging from subsidised lunches, breakfasts or tuckshop items. School food programs provide essential support to families as cost-of-living increases impact their ability to provide for their children. |
| • | Reducing costs and providing essential support through a range of targeted food, emergency and financial relief measures. |
| • | Substantial additional support to a wider range of Queenslanders purchasing their first home by increasing eligibility thresholds for first home concession, and first home vacant land concession. It is estimated these measures will deliver additional tax relief to Queensland first home buyers of $90 million in 2024–25. |
| • | For a complete list of cost-of-living relief measures provided in the 2024–25 Budget refer to Budget Paper No. 2. |
| 1.2.2 | Health |
The government continues to deliver a world class health system for our community, ensuring patients get treated at the right place, at the right time. The 2024–25 Budget delivers a $4.393 billion uplift to the Queensland Health operating funding envelope to address demand and cost pressures as well as support a suite of programs and initiatives, including:
| • | $222.4 million over 4 years to address Queensland Health workforce challenges, including supporting and retaining the current workforce, building and attracting new talent and adapting and innovating new ways to deliver |
| • | $209.9 million in new funding and $114.8 million from internal resources to accelerate efforts to address inequity in health and wellbeing outcomes with First Nations Queenslanders, by putting First Nations First and putting the Queensland Government back on track to close the gap by 2031 |
| • | $95.9 million in new funding and $40 million from internal resources over 4 years to deliver free Meningococcal B and RSV vaccines for eligible infants, children, and adolescents, alongside a continuation of the free influenza vaccination for all Queenslanders. This is the largest State Government funded vaccination program in Queensland’s history |
| • | $20 million over 4 years to expand hospital discharge initiatives under the successful Long Stay Rapid Response Program and Queensland Civil and Administration Tribunal Hospital Hearings Program |
| • | $142.2 million over 4 years to further support Queensland’s aeromedical providers to deliver specialist retrieval doctors, and emergency helicopter services from the Torres Strait, Bundaberg, Mount Isa, Sunshine Coast, Toowoomba, Rockhampton, Mackay, and Brisbane. |
5
Budget Measures 2024-25
| 1.2.3 | Education |
Education is key to ensuring every Queenslander can fulfill their potential and is a cornerstone of economic growth. The government is investing in a progressive, high performing education system that supports a positive future for our youngest Queenslanders. The 2024–25 Budget delivers on this commitment with:
| • | $500 million over 4 years for planning and delivery of critical capacity growth projects to meet enrolment needs including ensuring access to safe and accessible school facilities for students and teachers |
| • | $45.1 million over 3 years from 2024–25 to support eligible teachers moving to work in rural and remote schools through the Teacher Housing Leasing Program |
| • | $21 million over 4 years from 2024–25 to support the continuation of GPs in Secondary Schools Program. |
| 1.2.4 | Gender responsive budgeting |
The Queensland Government has committed to key initiatives expected to have gendered impacts and in support of the Queensland Women’s Strategy 2022–27, including:
| • | $502 million Putting Queensland Kids First early support package will deliver stronger outcomes to support positive life trajectories for Queensland children and families |
| • | $247.9 million investment over 5 years to drive women’s health reform through the Queensland Women and Girls’ Health Strategy 2032 to respond to the health needs of women and girls, address the wider determinants of women and girl’s health, improve access to health care, and improve health equity |
| • | $118.4 million over 4 years from 2024-25 (and $38.4 million ongoing) to uplift funding on an ongoing basis for Domestic, Family and Sexual Violence services, taking total funding for the uplift to $154.4 million over 4 years. |
In addition to these commitments and as part of its commitment to gender responsive budgeting, the 2024–25 Budget bids were assessed to determine gender equality impacts and alignment with the impact areas and priority cohorts identified in the Queensland Women’s Strategy 2022–27. This information was available to be considered alongside other policy and financial implications of bids.
The aim of this work was to provide balanced consideration of funding and highlight initiatives that were supportive of the impact areas of economic security, safety, health, and wellbeing, elevating First Nations women, women with diverse backgrounds and experiences, and empowerment and recognition. Some initiatives with positive gender impacts include:
| • | $81.2 million over 3 years from 2023–24 for the Department of Employment, Small Business and Training to meet the cost of free training in the Diploma of Nursing |
| • | $14.8 million over 2 years commencing 2024–25 to provide baseline resources for the delivery of Domestic and Family Violence perpetrator programs |
| • | $1.9 million in 2024–25 to continue the Social Enterprise Jobs Fund and Queensland Social Enterprise Council, supporting small business. |
6
Budget Measures 2024-25
| 1.3 | Whole-of-Government Measures |
| 1.3.1 | Homes for Queenslanders |
The Queensland Government has committed $3.1 billion towards the new whole-of-system housing plan, Homes for Queenslanders.
Homes for Queenslanders responds to key housing pressures, including supply, affordability, and homelessness, and enhances the focus on planning and development outcomes. Importantly, Homes for Queenslanders represents a significant uplift on top of the already major investment into social and affordable housing, setting a target of 53,500 new social homes by 2046. Partnerships with the Australian Government and community housing provider sector will be important in delivering on this target.
The initiatives in Homes for Queenslanders cover every aspect of the housing system: housing affordability, rental market, home ownership, social housing, homelessness, and legislation and reform. The initiatives are grouped under 5 key pillars including: build more homes, faster; support Queenslander rents; help first homeowners into the market; boost our social housing Big Build; and work towards ending homelessness.
Key initiatives in Homes for Queenslanders include:
| • | Substantially uplifting funding for social housing capital delivery over the forward estimates, including for new youth foyers, domestic and family violence shelters and specialist homelessness accommodation |
| • | Creating a fund to incentivise infill development and establishing a State Facilitated Development Program to speed up housing supply |
| • | Providing a Renters Relief Package, including establishing a new bond loan product |
| • | Providing a 20 per cent uplift to homelessness responses while an independent review into homelessness service delivery is undertaken |
| • | Expanding immediate and emergency housing responses |
| • | Delivering a Disability Housing Action Plan and Our Place: A First Nations Housing and Homelessness Action Plan 2024–2027. |
| 1.3.2 | Community Safety Plan for Queensland |
To address community safety concerns, the government has announced the Community Safety Plan for Queensland which includes an extra $1.28 billion over 5 years for community safety measures across 5 key pillars: supporting victims; delivering for our frontline; detaining offenders; intervening when people offend; and preventing crime before it occurs. The government will deliver on these pillars through the introduction of new legislative reforms and major investment in programs and systems that will help build safer communities.
Placing an increased focus on domestic, family and sexual violence, safety for women and on young offenders the plan takes a whole-of-government approach that brings together education, health, sport, housing, community services, domestic violence and child protection services.
7
Budget Measures 2024-25
| 1.3.3 | Putting Queensland Kids First: Giving our kids the opportunity of a lifetime Plan |
The government’s $502 million Putting Queensland Kids First Plan will support children from their earliest years of life and directs resources, services and supports to give every Queensland child and family the best possible opportunities for a great life.
| Table 1.1 | Putting Queensland Kids First Package |
| 2024-25 | 2025-26 | 2026-27 | 2027-28 | Total | ||||||||||||||||
| $‘000 | $‘000 | $‘000 | $‘000 | $‘000 | ||||||||||||||||
Expense Measures | ||||||||||||||||||||
Family Connections | 1,020 | 1,020 | — | — | 2,040 | |||||||||||||||
Safe Pathways | 4,500 | 4,500 | — | — | 9,000 | |||||||||||||||
Health Practitioners in Primary Schools | 1,525 | 3,483 | 3,838 | 1,879 | 10,725 | |||||||||||||||
Extended Free Kindy for Four-year-olds | 1,619 | 4,060 | 6,691 | 6,956 | 19,326 | |||||||||||||||
Early Childhood Coordinators | 7,135 | 7,341 | 7,640 | 7,744 | 29,860 | |||||||||||||||
Family Support Coordinators | 3,116 | 10,128 | 14,530 | 14,890 | 42,664 | |||||||||||||||
Behaviour Specialists | 8,200 | 19,142 | 19,873 | 20,115 | 67,330 | |||||||||||||||
Housing and Support Link | 1,194 | 1,196 | 1,201 | — | 3,591 | |||||||||||||||
Supported Tenancies | 2,159 | 3,156 | 3,161 | 3,165 | 11,641 | |||||||||||||||
Partnership Fund and Implementation | 12,500 | 7,500 | — | — | 20,000 | |||||||||||||||
Social Prescribing | 2,697 | 2,703 | — | — | 5,400 | |||||||||||||||
Scaffolding the Next Generation of First Nations Leaders | 200 | 70 | — | — | 270 | |||||||||||||||
Connecting2U | 1,025 | 1,025 | 1,025 | 1,025 | 4,101 | |||||||||||||||
Access to Material Support, Pepipods® and Safe Sleeping Education | 2,560 | 2,797 | 2,813 | 2,921 | 11,091 | |||||||||||||||
Community Hearing Screening and Diagnostic Services in Community Settings | 1,369 | 2,381 | 3,012 | 3,177 | 9,939 | |||||||||||||||
Supporting healthier pregnancies | 4,385 | 4,531 | 4,681 | 4,839 | 18,436 | |||||||||||||||
Enhance Child Development Services in Priority Locations | 5,970 | 12,489 | 17,178 | 20,909 | 56,546 | |||||||||||||||
Enhanced Child Health Services and Development Checks | 7,646 | 16,818 | 21,732 | 25,205 | 71,401 | |||||||||||||||
Early Intervention for First Nations Families | 5,800 | — | — | — | 5,800 | |||||||||||||||
Support for Parents with mental ill health | 2,600 | 2,600 | 2,600 | 2,600 | 10,400 | |||||||||||||||
Sustained Health Home Visting | 5,609 | 13,871 | 21,127 | 24,915 | 65,522 | |||||||||||||||
|
|
|
|
|
|
|
|
|
| |||||||||||
Sub Total – Expense Measures | 82,829 | 120,811 | 131,102 | 140,340 | 475,083 | |||||||||||||||
|
|
|
|
|
|
|
|
|
| |||||||||||
8
Budget Measures 2024-25
| 2024-25 | 2025-26 | 2026-27 | 2027-28 | Total | ||||||||||||||||
| $‘000 | $‘000 | $‘000 | $‘000 | $‘000 | ||||||||||||||||
Capital Measures | ||||||||||||||||||||
Hubs in Aurukun & Kowanyama | 20,000 | — | — | — | 20,000 | |||||||||||||||
Extended Free Kindy for Four-year-olds | — | 6,900 | — | — | 6,900 | |||||||||||||||
|
|
|
|
|
|
|
|
|
| |||||||||||
Sub Total – Capital Measures | 20,000 | 6,900 | — | — | 26,900 | |||||||||||||||
|
|
|
|
|
|
|
|
|
| |||||||||||
Total | 102,829 | 127,711 | 131,102 | 140,340 | 501,983 | |||||||||||||||
|
|
|
|
|
|
|
|
|
| |||||||||||
Note:
| 1. | Table 1.1 presents the total funding allocated to each of the commitments in the Putting Queensland Kids First plan. |
| 2. | Commitments are funded through $203 million in additional funding and $299 million of funding redirected to this government priority. |
| 1.3.4 | Brisbane 2032 Olympic and Paralympic Games |
The Queensland Government is providing an additional $62 million over 4 years from 2024–25 and $14 million per annum ongoing to 2032–33 to the Department of State Development and Infrastructure for the preparation of additional Project Validation Reports and establishment costs for the Games Venue and Legacy Delivery Authority, to be transferred to the Authority once established.
| Table 1.2 | Brisbane 2032 – Project Validation Reports and Authority Establishment |
| 2024-25 | 2025-26 | 2026-27 | 2027-28 | Total | ||||||||||||||||
| $‘000 | $‘000 | $‘000 | $‘000 | $‘000 | ||||||||||||||||
Department of State Development and Infrastructure – operating | 31,200 | 10,000 | 10,000 | 10,800 | 62,000 | |||||||||||||||
| 1.3.5 | Disability Reforms |
The Queensland Government has provisioned over $160 million towards a package of disability reforms as an initial response to the recommendations of the Royal Commission into Violence, Abuse, Neglect and Exploitation of People with Disability (Disability Royal Commission) and the NDIS Review.
The Queensland Government is working with other state and territory governments and the Australian Government to finalise responses to the Disability Royal Commission. Responses are expected to be released later this year, along with the design of additional Foundational Supports for people with disability, as agreed to by National Cabinet.
An immediate package of investment will be made across a number of initiatives to improve services for people with a disability, across key areas including advocacy, the Queensland Community Support Scheme, the Medical Aids and Subsidies Scheme and initiatives to support Queensland’s role in the disability reform agenda. Further detail on these initiatives can be found in Chapter 2 – Expense Measures.
Further initiatives to be delivered as part of the over $160 million package will be confirmed alongside the Queensland Government’s response to the Disability Royal Commission.
9
Budget Measures 2024-25
| 1.3.6 | Public Sector Wages Policy |
New reproductive health leave entitlements
The government recognises the need for Queensland public sector workers to have access to dedicated leave for reproductive health. By 30 September 2024, the Government will implement 10 days per year of reproductive health leave for Queensland public sector workers. The leave will be non-cumulative and may be used for fertility and IVF treatment; chronic reproductive health conditions including endometriosis; preventative screening for breast and prostate cancers and treatments associated with reproductive health.
Superannuation on parental leave
From 1 July 2024, superannuation will be applied to all parental leave for the first 52 weeks for Queensland public sector workers, including both paid and unpaid leave. Currently, superannuation payments are only made during periods of paid parental leave. This measure will help to ensure that new parents are not left with gaps in their retirement savings and will help address the superannuation balance gap between men and women.
10
Budget Measures 2024-25
| 1.4 | Government Indexation Policy |
To alleviate cost-of-living pressures the government has set the Government Indexation Rate (GIR) for 2024–25 to zero per cent for many government fees and charges and the Emergency Management Levy (EML).
This means that a range of fees and charges applied to individuals, households and businesses will be unchanged in 2024–25, including the EML and some specific transport related fees. The GIR for other purposes for 2024–25 is 3.4 per cent.
11
Budget Measures 2024-25
| Table 1.3: | Expense measures since the 2023–24 Budget |
Expense measures up to and including 2023-24 Budget Update | 2023-24 $‘000 | 2024-25 $‘000 | 2025-26 $‘000 | 2026-27 $‘000 | 2027-28 $‘000 | |||||||||||||||
Department of Agriculture and Fisheries | ||||||||||||||||||||
Backing Bush Communities Fund - Invasive Species Management | 1,679 | 4,892 | 4,693 | 736 | — | |||||||||||||||
Backing Bush Communities Fund - Workforce Training | 1,960 | 2,701 | 2,382 | 957 | — | |||||||||||||||
Dangerous Dogs Laws | 895 | 2,651 | 1,983 | 816 | 921 | |||||||||||||||
Drought Preparedness Grants Program | 7,000 | — | — | — | — | |||||||||||||||
|
|
|
|
|
|
|
|
|
| |||||||||||
Portfolio Total | 11,534 | 10,244 | 9,058 | 2,509 | 921 | |||||||||||||||
|
|
|
|
|
|
|
|
|
| |||||||||||
Department of Child Safety, Seniors and Disability Services | ||||||||||||||||||||
Disability Advocacy 1 | 539 | 1,078 | — | — | — | |||||||||||||||
National Disability Insurance Scheme (NDIS) Worker Screening | 354 | 734 | — | — | — | |||||||||||||||
Australian South Sea Islander Peoples Support Plan | — | 190 | 190 | — | — | |||||||||||||||
Disability Stakeholder Engagement Strategy 1 | 300 | — | — | — | — | |||||||||||||||
|
|
|
|
|
|
|
|
|
| |||||||||||
Portfolio Total | 1,193 | 2,002 | 190 | — | — | |||||||||||||||
|
|
|
|
|
|
|
|
|
| |||||||||||
Department of Education | ||||||||||||||||||||
Capital Assistance Supplementary Scheme for Non-State Schools | — | 60,000 | — | — | — | |||||||||||||||
Preventing Youth Justice Involvement Through Educational Engagement | 8,530 | 37,642 | 46,571 | 49,147 | 53,477 | |||||||||||||||
Playgrounds and Tuckshops Program | 4,776 | 13,119 | 15,413 | 2,346 | — | |||||||||||||||
Caboolture Watchhouse Hub | 937 | 1,569 | — | — | — | |||||||||||||||
Non-State Schools Accreditation Board 1 | 963 | — | — | — | — | |||||||||||||||
State School Infrastructure Renewal 1 | 21,077 | — | — | — | — | |||||||||||||||
|
|
|
|
|
|
|
|
|
| |||||||||||
Portfolio Total | 36,283 | 112,330 | 61,984 | 51,493 | 53,477 | |||||||||||||||
|
|
|
|
|
|
|
|
|
| |||||||||||
Department of Employment, Small Business and Training | ||||||||||||||||||||
Regional Jobs Expos | 950 | 410 | — | — | — | |||||||||||||||
|
|
|
|
|
|
|
|
|
| |||||||||||
Portfolio Total | 950 | 410 | — | — | — | |||||||||||||||
|
|
|
|
|
|
|
|
|
| |||||||||||
Department of Energy and Climate | ||||||||||||||||||||
Buy Queensland Procurement: Enabling ICT platform | — | 1,130 | 1,214 | 1,300 | 1,365 | |||||||||||||||
|
|
|
|
|
|
|
|
|
| |||||||||||
Portfolio Total | — | 1,130 | 1,214 | 1,300 | 1,365 | |||||||||||||||
|
|
|
|
|
|
|
|
|
| |||||||||||
Department of Environment, Science and Innovation | ||||||||||||||||||||
Queensland Quantum and Advanced Technologies Strategy | 902 | 26,925 | 31,976 | 22,119 | 1,806 | |||||||||||||||
Saving Queensland’s Koalas | — | 7,497 | 7,716 | 7,935 | 8,157 | |||||||||||||||
Saving Queensland’s Threatened Species | — | 5,672 | 5,848 | 5,876 | 6,116 | |||||||||||||||
K’gari Dingo Management Enhanced Actions | 2,000 | 3,000 | 3,090 | 3,167 | 3,246 | |||||||||||||||
Queensland Quantum Academy | 730 | 933 | 983 | 984 | 2,370 | |||||||||||||||
|
|
|
|
|
|
|
|
|
| |||||||||||
Portfolio Total | 3,632 | 44,027 | 49,613 | 40,081 | 21,695 | |||||||||||||||
|
|
|
|
|
|
|
|
|
| |||||||||||
Department of Housing, Local Government, Planning and Public Works | ||||||||||||||||||||
Implementation of Shaping SEQ 2023 Update | 2,708 | 4,309 | 1,196 | — | — | |||||||||||||||
Immediate Housing Response for Families | 23,200 | — | — | — | — | |||||||||||||||
12
Budget Measures 2024-25
Expense measures up to and including 2023-24 Budget Update | 2023-24 $‘000 | 2024-25 $‘000 | 2025-26 $‘000 | 2026-27 $‘000 | 2027-28 $‘000 | |||||||||||||||
Works for Queensland | — | — | 20,000 | 80,000 | — | |||||||||||||||
|
|
|
|
|
|
|
|
|
| |||||||||||
Portfolio Total | 25,908 | 4,309 | 21,196 | 80,000 | — | |||||||||||||||
|
|
|
|
|
|
|
|
|
| |||||||||||
Department of Justice and Attorney-General | ||||||||||||||||||||
Support for Victims of Crime 1 | 27,912 | 43,358 | 41,908 | 41,957 | 42,009 | |||||||||||||||
Commission of Inquiry - Forensic DNA Testing | 13,496 | 15,503 | 845 | 861 | 861 | |||||||||||||||
Support for the Queensland Civil and Administrative Tribunal Workforce 1 | 2,046 | 4,247 | 4,373 | 4,485 | 4,607 | |||||||||||||||
Supporting Escalating Workloads within the District Court of Queensland | 2,321 | 3,654 | 3,766 | 3,863 | 3,967 | |||||||||||||||
Permanently Establish the Justice Reform Office 1 | 842 | 3,066 | 4,896 | 5,046 | 5,198 | |||||||||||||||
Rental Reforms - Stage 2 Rental Law Reform Implementation | 39 | 2,546 | 3,157 | 3,219 | 3,156 | |||||||||||||||
The Public Trustee of Queensland - Supporting Vulnerable Queenslanders | 10,000 | 1,850 | 1,910 | 1,970 | 1,970 | |||||||||||||||
First Nations Justice Office | — | 1,587 | 1,612 | 1,658 | 1,703 | |||||||||||||||
Queensland Human Rights Commission - Sustainable Supporting Functions | 650 | 1,045 | 1,070 | 1,111 | 1,115 | |||||||||||||||
Accommodation to Support the Domestic and Family Violence Courthouse Upgrade | 395 | 825 | 1,461 | 2,008 | 2,083 | |||||||||||||||
Support increased watchhouse visits | 335 | 678 | 698 | 717 | 737 | |||||||||||||||
Meriba Omasker Kaziw Kazipa (Torres Strait Islander Traditional Child Rearing Practices) Act 2020 - Ongoing Implementation | — | 408 | — | — | — | |||||||||||||||
Engagement with Community Justice Groups & Torres Strait Island Communities | 438 | — | — | — | — | |||||||||||||||
|
|
|
|
|
|
|
|
|
| |||||||||||
Portfolio Total | 58,474 | 78,767 | 65,696 | 66,895 | 67,406 | |||||||||||||||
|
|
|
|
|
|
|
|
|
| |||||||||||
Department of Regional Development, Manufacturing and Water | ||||||||||||||||||||
Regional Water Infrastructure: Cairns Water Security Program | — | 40,000 | 40,000 | 7,500 | — | |||||||||||||||
Ayr Water Treatment Plant Stage 1 | 10,033 | 20,067 | 16,784 | — | — | |||||||||||||||
PFAS Groundwater Monitoring and Modelling | 178 | 665 | 533 | — | — | |||||||||||||||
|
|
|
|
|
|
|
|
|
| |||||||||||
Portfolio Total | 10,211 | 60,732 | 57,317 | 7,500 | — | |||||||||||||||
|
|
|
|
|
|
|
|
|
| |||||||||||
Department of Resources | ||||||||||||||||||||
Abandoned Mine Lands Program 1 | — | 17,540 | — | — | — | |||||||||||||||
Adam’s Beach Camping Amenities | — | 500 | — | — | — | |||||||||||||||
|
|
|
|
|
|
|
|
|
| |||||||||||
Portfolio Total | — | 18,040 | — | — | — | |||||||||||||||
|
|
|
|
|
|
|
|
|
| |||||||||||
Department of State Development and Infrastructure | ||||||||||||||||||||
Queensland Battery Industry Strategy Implementation | 9,000 | 29,500 | 26,000 | 20,500 | 25,000 | |||||||||||||||
Effective regulation of Queensland workplaces and communities 1 | 7,710 | 14,208 | 14,477 | 14,745 | 14,961 | |||||||||||||||
Place Renewal Framework | 448 | 896 | 896 | — | — | |||||||||||||||
River Reach Corridor Walkable Spine | 1,800 | — | — | — | — | |||||||||||||||
|
|
|
|
|
|
|
|
|
| |||||||||||
Portfolio Total | 18,958 | 44,604 | 41,373 | 35,245 | 39,961 | |||||||||||||||
|
|
|
|
|
|
|
|
|
| |||||||||||
Department of the Premier and Cabinet | ||||||||||||||||||||
Office of the Queensland Parliamentary Counsel Attraction and Retention Incentive Scheme | 1,537 | 1,854 | 1,912 | 1,960 | 2,017 | |||||||||||||||
|
|
|
|
|
|
|
|
|
| |||||||||||
Portfolio Total | 1,537 | 1,854 | 1,912 | 1,960 | 2,017 | |||||||||||||||
|
|
|
|
|
|
|
|
|
| |||||||||||
13
Budget Measures 2024-25
Expense measures up to and including 2023-24 Budget Update | 2023-24 $‘000 | 2024-25 $‘000 | 2025-26 $‘000 | 2026-27 $‘000 | 2027-28 $‘000 | |||||||||||||||
Department of Tourism and Sport | ||||||||||||||||||||
Growing Future Tourism Program | 7,000 | 8,000 | — | — | — | |||||||||||||||
Backing Bush Communities - Building Bush Tourism Fund | — | 4,000 | 6,000 | — | — | |||||||||||||||
SwimStart Program | 2,000 | 3,000 | — | — | — | |||||||||||||||
QAS 2032 High Performance Strategy | — | — | 17,434 | 17,468 | 18,500 | |||||||||||||||
Tourism Recovery and Development initiatives - Strategic Indigenous Tourism Projects Fund | — | — | — | — | — | |||||||||||||||
|
|
|
|
|
|
|
|
|
| |||||||||||
Portfolio Total | 9,000 | 15,000 | 23,434 | 17,468 | 18,500 | |||||||||||||||
|
|
|
|
|
|
|
|
|
| |||||||||||
Department of Treaty, Aboriginal and Torres Strait Islander Partnerships, Communities and the Arts | ||||||||||||||||||||
Community Recovery | 3,750 | 3,750 | 3,750 | 3,750 | 3,750 | |||||||||||||||
Stronger Places, Stronger People Extension 1 | — | 1,950 | 1,950 | 1,950 | 1,950 | |||||||||||||||
Emergency Relief 1 | — | 1,650 | — | — | — | |||||||||||||||
Ongoing operation of the Meriba Omasker Kaziw Kazipa (Torres Strait Islander Traditional Child Rearing Practices) Act 2020 | — | 1,500 | — | — | — | |||||||||||||||
Financial Resilience Services 1 | 557 | 1,113 | — | — | — | |||||||||||||||
Food Recovery and Redistribution 1 | — | 300 | — | — | — | |||||||||||||||
Orange Sky | 3,000 | — | — | — | — | |||||||||||||||
|
|
|
|
|
|
|
|
|
| |||||||||||
Portfolio Total | 7,307 | 10,263 | 5,700 | 5,700 | 5,700 | |||||||||||||||
|
|
|
|
|
|
|
|
|
| |||||||||||
Department of Youth Justice | ||||||||||||||||||||
Youth Detention Centre Support 1 | — | 4,820 | 13,551 | 15,039 | 14,993 | |||||||||||||||
Caboolture Watchhouse Hub | 7,567 | 4,101 | — | — | — | |||||||||||||||
|
|
|
|
|
|
|
|
|
| |||||||||||
Portfolio Total | 7,567 | 8,921 | 13,551 | 15,039 | 14,993 | |||||||||||||||
|
|
|
|
|
|
|
|
|
| |||||||||||
Queensland Corrective Services | ||||||||||||||||||||
High Risk Offender Management Unit Resourcing | 569 | 2,397 | 2,669 | 2,742 | 2,893 | |||||||||||||||
Capacity Management Unit | 565 | 2,345 | 2,418 | 2,490 | 2,634 | |||||||||||||||
First Nations Community Work Camp | 122 | 221 | — | — | — | |||||||||||||||
|
|
|
|
|
|
|
|
|
| |||||||||||
Portfolio Total | 1,256 | 4,963 | 5,087 | 5,232 | 5,527 | |||||||||||||||
|
|
|
|
|
|
|
|
|
| |||||||||||
Queensland Health | ||||||||||||||||||||
Commission of Inquiry - Forensic DNA Testing | 3,214 | 3,362 | 3,517 | 2,976 | 2,981 | |||||||||||||||
Caboolture Watchhouse Hub | 76 | 43 | — | — | — | |||||||||||||||
Centre for Women & Co Grant | 3,000 | — | — | — | — | |||||||||||||||
|
|
|
|
|
|
|
|
|
| |||||||||||
Portfolio Total | 6,290 | 3,405 | 3,517 | 2,976 | 2,981 | |||||||||||||||
|
|
|
|
|
|
|
|
|
| |||||||||||
Queensland Police Service | ||||||||||||||||||||
Community Support Funding for Non-Government Organisations 1 | 12,000 | 14,578 | 9,882 | 9,882 | 9,882 | |||||||||||||||
Commission of Inquiry into Forensic DNA Testing in Queensland Recommendation Implementation and Associated Resourcing | 7,901 | 7,231 | 7,434 | 7,625 | 7,625 | |||||||||||||||
Implementation of the Commission of Inquiry Recommendations into Queensland Police Service to Domestic and Family Violence | 4,374 | 6,227 | — | — | — | |||||||||||||||
Bullyproof Australia | 4,000 | 2,800 | 2,600 | 2,600 | — | |||||||||||||||
Advanced Data Analytics Capability | 726 | 2,408 | 1,190 | 1,675 | 1,675 | |||||||||||||||
Weapons Licensing Management System Replacement Project | 832 | 1,790 | 1,287 | 1,012 | 1,053 | |||||||||||||||
14
Budget Measures 2024-25
Expense measures up to and including 2023-24 Budget Update | 2023-24 $‘000 | 2024-25 $‘000 | 2025-26 $‘000 | 2026-27 $‘000 | 2027-28 $‘000 | |||||||||||||||
Queensland Government Air Funding and Operating Model | 1,624 | 1,176 | 1,176 | — | — | |||||||||||||||
Aeromedical Hub | — | — | 3,562 | 3,704 | 3,852 | |||||||||||||||
Caboolture Watchhouse Hub 1 | — | — | — | — | — | |||||||||||||||
National Firearms Register | — | — | — | — | — | |||||||||||||||
|
|
|
|
|
|
|
|
|
| |||||||||||
Portfolio Total | 31,457 | 36,210 | 27,131 | 26,498 | 24,087 | |||||||||||||||
|
|
|
|
|
|
|
|
|
| |||||||||||
Queensland Treasury | ||||||||||||||||||||
Temporary Doubling of the First Home Owner Grant | 12,300 | 85,300 | 75,600 | 26,800 | 9,700 | |||||||||||||||
Commercial and Investment Due Diligence and Projects | 4,000 | 4,000 | — | — | — | |||||||||||||||
Mount Isa Acceleration Fund 1 | — | — | — | — | — | |||||||||||||||
|
|
|
|
|
|
|
|
|
| |||||||||||
Portfolio Total | 16,300 | 89,300 | 75,600 | 26,800 | 9,700 | |||||||||||||||
|
|
|
|
|
|
|
|
|
| |||||||||||
Total impact on Expense up to and including 2023-24 Budget Update | 247,857 | 546,511 | 463,573 | 386,696 | 268,330 | |||||||||||||||
15
Budget Measures 2024-25
Expense measures since 2023-24 Budget Update | 2023-24 $‘000 | 2024-25 $‘000 | 2025-26 $‘000 | 2026-27 $‘000 | 2027-28 $‘000 | |||||||||||||||
Department of Agriculture and Fisheries | ||||||||||||||||||||
Rural Economic Development Grants Program | — | 3,300 | — | — | — | |||||||||||||||
Native Title and State-owned Quarry Materials | — | 3,000 | — | — | — | |||||||||||||||
Strengthening Enforcement and Prosecution Services to Safeguard Animal Welfare | — | 1,931 | — | — | — | |||||||||||||||
Strengthening Leadership Across Queensland’s and Australia’s Biosecurity Systems | — | 1,625 | 1,625 | 1,625 | 1,625 | |||||||||||||||
Rural Financial Counsellors | — | 1,200 | 1,200 | — | — | |||||||||||||||
Collective Action to Manage Varroa Destructor Through Shared Responsibility | — | 771 | 134 | 1,485 | — | |||||||||||||||
Queensland Boating and Fisheries Officers | — | 392 | 402 | 426 | 468 | |||||||||||||||
Drought Mapping Tools | — | — | — | — | — | |||||||||||||||
|
|
|
|
|
|
|
|
|
| |||||||||||
Portfolio Total | — | 12,219 | 3,361 | 3,536 | 2,093 | |||||||||||||||
|
|
|
|
|
|
|
|
|
| |||||||||||
Department of Child Safety, Seniors and Disability Services | ||||||||||||||||||||
Carer Allowance for Foster and Kinship Carers | — | 42,636 | 46,478 | 49,182 | 52,539 | |||||||||||||||
Future delivery of Accommodation Support Services | — | 14,658 | 14,784 | 15,708 | 13,663 | |||||||||||||||
Continuity of Disability Supports for Children with Autism in Queensland | — | 7,000 | 500 | — | — | |||||||||||||||
Unify Program - Continuous Improvement Pipeline | — | 5,719 | 7,861 | 6,826 | 7,319 | |||||||||||||||
Child and Family Services - Extended Post Care Support | 490 | 5,423 | 7,985 | 9,969 | 7,909 | |||||||||||||||
Disability Advocacy 2 | — | 5,000 | 1,078 | 1,078 | 1,078 | |||||||||||||||
Disability Strategic Leadership | — | 3,349 | 4,574 | 3,913 | 3,304 | |||||||||||||||
Reform of Queensland’s Positive Behaviour Support and Restrictive Practices - Authorisation Framework | — | 2,967 | 3,056 | 3,132 | 3,210 | |||||||||||||||
Strengthening Community Cohesion in Queensland | — | 2,907 | 2,907 | — | — | |||||||||||||||
Family Reunification | — | 2,863 | 2,867 | — | — | |||||||||||||||
Child Protection Litigation Model | — | 2,557 | — | — | — | |||||||||||||||
Supporting Families, Changing Futures (ICT Digital Applications) | — | 1,701 | 1,779 | 1,880 | 1,988 | |||||||||||||||
African Villages (Youth and Community) | — | 1,300 | 1,300 | — | — | |||||||||||||||
Disability Stakeholder Engagement Strategy 2 | — | 1,300 | 1,300 | 1,300 | 1,300 | |||||||||||||||
Physical and Sexual Abuse Insurance, Out of Home Care and Youth Homelessness Services | — | 623 | — | — | — | |||||||||||||||
Disability Data Improvement Project | — | 526 | 1,155 | 1,163 | 956 | |||||||||||||||
Child and Family Services - Out of Home Care | 212,300 | — | — | — | — | |||||||||||||||
|
|
|
|
|
|
|
|
|
| |||||||||||
Portfolio Total | 212,790 | 100,529 | 97,624 | 94,151 | 93,266 | |||||||||||||||
|
|
|
|
|
|
|
|
|
| |||||||||||
Department of Education | ||||||||||||||||||||
Investment in our State Education System | 178,240 | 395,646 | 246,892 | 55,601 | 172,977 | |||||||||||||||
State School Infrastructure Renewal 2 | — | 78,683 | — | — | — | |||||||||||||||
Sustainable Investment in Schools | — | 40,000 | 42,000 | 42,000 | 42,000 | |||||||||||||||
Teacher Housing Leasing Program | — | 11,404 | 15,179 | 18,521 | — | |||||||||||||||
School Lunch Food Programs | — | 10,655 | — | — | — | |||||||||||||||
Wacol Youth Remand Centre | — | 9,355 | 9,582 | 5,386 | — | |||||||||||||||
GPs in Schools | — | 5,033 | 5,178 | 5,327 | 5,481 | |||||||||||||||
Promoting Quality and Safety in Early Childhood Education and Care | — | 3,326 | — | — | — | |||||||||||||||
Homework Centres | — | 2,382 | 2,565 | — | — | |||||||||||||||
16
Budget Measures 2024-25
Expense measures since 2023-24 Budget Update | 2023-24 $‘000 | 2024-25 $‘000 | 2025-26 $‘000 | 2026-27 $‘000 | 2027-28 $‘000 | |||||||||||||||
Non-State Schools Accreditation Board 2 | — | — | — | — | — | |||||||||||||||
Woodford Youth Detention Centre | — | — | 3,203 | 8,037 | — | |||||||||||||||
|
|
|
|
|
|
|
|
|
| |||||||||||
Portfolio Total | 178,240 | 556,484 | 324,599 | 134,872 | 220,458 | |||||||||||||||
|
|
|
|
|
|
|
|
|
| |||||||||||
Department of Employment, Small Business and Training | ||||||||||||||||||||
Queensland Skills Strategy 2024-2028 | — | 96,717 | 106,425 | — | — | |||||||||||||||
Free TAFE Nursing | 22,050 | 42,050 | 17,050 | — | — | |||||||||||||||
TAFE Big Build | — | 24,500 | 25,113 | 25,740 | 26,384 | |||||||||||||||
Construction Workforce Fund | 500 | 7,400 | 3,100 | — | — | |||||||||||||||
Queensland Small Business Strategy 2024-27 | — | 4,262 | 2,762 | 761 | — | |||||||||||||||
Cyber Security Support for Queensland Small to Medium Enterprises | — | 2,500 | 3,750 | 3,750 | — | |||||||||||||||
Social Enterprise Support and Development | — | 1,900 | — | — | — | |||||||||||||||
Mossman Region Community Transition | 150 | 732 | 618 | — | — | |||||||||||||||
|
|
|
|
|
|
|
|
|
| |||||||||||
Portfolio Total | 22,700 | 180,061 | 158,818 | 30,251 | 26,384 | |||||||||||||||
|
|
|
|
|
|
|
|
|
| |||||||||||
Department of Energy and Climate | ||||||||||||||||||||
Queensland Energy and Jobs Plan Implementation | 2,547 | 11,125 | 7,236 | 8,808 | 13,584 | |||||||||||||||
Drought Mapping Tools | — | — | — | — | — | |||||||||||||||
|
|
|
|
|
|
|
|
|
| |||||||||||
Portfolio Total | 2,547 | 11,125 | 7,236 | 8,808 | 13,584 | |||||||||||||||
|
|
|
|
|
|
|
|
|
| |||||||||||
Department of Environment, Science and Innovation | ||||||||||||||||||||
Better Queensland Parks - Fire Management Uplift Program | — | 21,080 | — | — | — | |||||||||||||||
Waste Package, including the Recycling and Jobs Fund | 8,000 | 8,875 | 12,200 | 8,625 | 210,114 | |||||||||||||||
Revitalising Queensland’s Private Protected Area Program | — | 2,607 | 207 | — | — | |||||||||||||||
Cape York World Heritage Nomination | — | 1,200 | 1,200 | — | — | |||||||||||||||
Bioregional Planning | — | 926 | 1,052 | — | — | |||||||||||||||
Queensland Mine Rehabilitation Commissioner and Supporting Office | — | 878 | 865 | — | — | |||||||||||||||
|
|
|
|
|
|
|
|
|
| |||||||||||
Portfolio Total | 8,000 | 35,566 | 15,524 | 8,625 | 210,114 | |||||||||||||||
|
|
|
|
|
|
|
|
|
| |||||||||||
Department of Housing, Local Government, Planning and Public Works | ||||||||||||||||||||
Homes for Queenslanders : a fair and sustainable housing system | 398,727 | 578,722 | 397,880 | 191,794 | 120,651 | |||||||||||||||
Long-term Sustainability of Queensland’s Indigenous Local Governments | — | 30,800 | 30,800 | — | — | |||||||||||||||
Helping Seniors Secure Their Homes | 17,700 | 22,300 | — | — | — | |||||||||||||||
Social Housing Headleasing | 4,200 | 5,740 | — | — | — | |||||||||||||||
Local Government Community Safety | — | 5,000 | — | — | — | |||||||||||||||
Stage 2 Rental Law Reforms - Residential Tenancies Authority | — | 2,732 | 1,615 | 1,103 | 974 | |||||||||||||||
Strengthening and Sustaining Court Reforms Tackling Youth and Adult Crime | — | 493 | 802 | — | — | |||||||||||||||
|
|
|
|
|
|
|
|
|
| |||||||||||
Portfolio Total | 420,627 | 645,787 | 431,097 | 192,897 | 121,625 | |||||||||||||||
|
|
|
|
|
|
|
|
|
| |||||||||||
Department of Justice and Attorney-General | ||||||||||||||||||||
Support for the domestic, family and sexual violence sector | — | 34,374 | 38,289 | 38,345 | 38,403 | |||||||||||||||
Supporting the community legal sector | — | 24,642 | 441 | 458 | 475 | |||||||||||||||
Supporting Court Reforms Tackling Youth and Adult Crime | — | 16,693 | 18,618 | — | — | |||||||||||||||
Victims of Crime Community Response | — | 15,362 | — | — | — | |||||||||||||||
17
Budget Measures 2024-25
Expense measures since 2023-24 Budget Update | 2023-24 $‘000 | 2024-25 $‘000 | 2025-26 $‘000 | 2026-27 $‘000 | 2027-28 $‘000 | |||||||||||||||
Support for Victims of Crime 2 | 4,213 | 14,028 | 11,294 | 3,588 | 3,687 | |||||||||||||||
Support for the Queensland Civil and Administrative Tribunal Workforce 2 | — | 9,693 | 12,329 | 12,803 | 15,471 | |||||||||||||||
Gambling Harm Minimisation | — | 8,060 | 8,060 | 8,060 | 8,060 | |||||||||||||||
Queensland Women and Girls’ Health Strategy 2032 | 97 | 6,494 | 6,624 | 6,749 | 6,985 | |||||||||||||||
Safeguarding Vulnerable Children and Adults | — | 5,905 | — | — | — | |||||||||||||||
Domestic and Family Violence Training and Management Framework | 162 | 4,872 | 4,483 | 4,284 | 3,109 | |||||||||||||||
Child Protection Litigation | — | 4,581 | — | — | — | |||||||||||||||
Recording and Transcription Services | — | 3,422 | 3,180 | 13,206 | 13,639 | |||||||||||||||
Donor Conception Register | — | 3,400 | 4,500 | — | — | |||||||||||||||
Permanently Establish the Justice Reform Office 2 | — | 2,826 | 2,927 | — | — | |||||||||||||||
Enhancing the Victim Liaison Service | — | 2,759 | — | — | — | |||||||||||||||
Expansion of the Electronic Monitoring Program - Youth | — | 2,342 | — | — | — | |||||||||||||||
Continuation of the Queensland Intermediary Scheme | — | 2,185 | — | — | — | |||||||||||||||
Blue Card Review Implementation | — | 1,622 | — | — | — | |||||||||||||||
Support for First Nations Children | — | 1,517 | — | — | — | |||||||||||||||
Queensland Courts and Tribunals - Support for Circuit Court Sitting Days | — | 1,100 | 1,175 | 1,254 | 1,336 | |||||||||||||||
New Childrens Court for Mount Isa | — | 981 | 995 | 1,023 | 1,051 | |||||||||||||||
Woodford Youth Detention Centre | — | 960 | 989 | 1,015 | 1,042 | |||||||||||||||
Supporting Coronial Justice Reform | — | 853 | 1,005 | 1,032 | 1,055 | |||||||||||||||
Victims Commissioner and Sexual Violence Case Review Board | — | 665 | 1,993 | 2,020 | 2,074 | |||||||||||||||
Brisbane Supreme and District Court - Courtroom Expansion | — | 614 | 758 | 776 | 441 | |||||||||||||||
Queensland Housing Plan | — | 600 | — | — | — | |||||||||||||||
Support for the Child Death Review Board | — | 583 | 590 | 202 | 206 | |||||||||||||||
Support for Courts and Tribunals for Proposed Legislative Reform | — | 409 | 1,656 | 1,245 | — | |||||||||||||||
Supporting the Office of the Information Commissioner | — | 402 | — | — | — | |||||||||||||||
Townsville Courthouse - Courtroom Expansion | — | 162 | 200 | 205 | — | |||||||||||||||
Independent Review of the Crime and Corruption Commission | 1,029 | — | — | — | — | |||||||||||||||
Video Recorded Evidence-in-Chief Pilot | — | — | — | — | — | |||||||||||||||
|
|
|
|
|
|
|
|
|
| |||||||||||
Portfolio Total | 5,501 | 172,106 | 120,106 | 96,265 | 97,034 | |||||||||||||||
|
|
|
|
|
|
|
|
|
| |||||||||||
Department of Regional Development, Manufacturing and Water | ||||||||||||||||||||
Make it in Queensland | — | 25,000 | — | — | — | |||||||||||||||
Great Artesian Basin Water Security Program | — | 3,829 | 9,202 | 9,422 | 9,547 | |||||||||||||||
Establishment of the Office of the Cross Border Commissioner | 791 | 1,227 | 1,245 | — | — | |||||||||||||||
Hughenden Irrigation Project | — | 825 | 825 | — | — | |||||||||||||||
River Improvement Trusts | — | 300 | — | — | — | |||||||||||||||
Minjerribah Water of Life Program | — | 200 | — | — | — | |||||||||||||||
Fitzroy to Gladstone Pipeline | 365,000 | — | — | — | — | |||||||||||||||
|
|
|
|
|
|
|
|
|
| |||||||||||
Portfolio Total | 365,791 | 31,381 | 11,272 | 9,422 | 9,547 | |||||||||||||||
|
|
|
|
|
|
|
|
|
| |||||||||||
Department of Resources | ||||||||||||||||||||
Abandoned Mine Lands Program 2 | 1,249 | 5,204 | 21,310 | 21,130 | — | |||||||||||||||
Former Great Keppel Island Resort Pty Ltd Lease Areas Remediation | — | 5,000 | — | — | — | |||||||||||||||
Indigenous Land Use Agreements Support Package | — | 2,157 | 1,910 | 1,910 | 1,910 | |||||||||||||||
18
Budget Measures 2024-25
Expense measures since 2023-24 Budget Update | 2023-24 $‘000 | 2024-25 $‘000 | 2025-26 $‘000 | 2026-27 $‘000 | 2027-28 $‘000 | |||||||||||||||
Natural Hydrogen: Assessment of Queensland’s Potential | — | 1,600 | 2,400 | — | — | |||||||||||||||
Queensland Resources Common User Facility Operational Readiness | — | 1,480 | 515 | — | — | |||||||||||||||
Review of Greenhouse Gas Storage in Queensland | — | 1,000 | — | — | — | |||||||||||||||
Sunnybank Recreation Reserve | — | 250 | — | — | — | |||||||||||||||
|
|
|
|
|
|
|
|
|
| |||||||||||
Portfolio Total | 1,249 | 16,691 | 26,135 | 23,040 | 1,910 | |||||||||||||||
|
|
|
|
|
|
|
|
|
| |||||||||||
Department of State Development and Infrastructure | ||||||||||||||||||||
Games Venue and Legacy Delivery Authority | — | 31,200 | 10,000 | 10,000 | 10,800 | |||||||||||||||
Ground Lease Delivery Model | — | 16,500 | — | — | — | |||||||||||||||
Mount Isa Transition Fund | — | 10,000 | 10,000 | — | — | |||||||||||||||
Effective regulation of Queensland workplaces and communities 2 | — | 7,096 | 7,293 | 7,932 | 8,317 | |||||||||||||||
Mossman Region Transition Program | 420 | 4,920 | 4,260 | 1,000 | — | |||||||||||||||
Queensland Industrial Relations Commission Funding | 1,854 | 3,139 | 3,182 | 3,226 | 3,259 | |||||||||||||||
Waraba Priority Development Area | — | 2,500 | — | — | — | |||||||||||||||
Queen’s Wharf Brisbane | — | 1,914 | 1,497 | — | — | |||||||||||||||
Queensland Energy and Jobs Plan | — | 1,848 | 1,848 | 1,848 | 1,846 | |||||||||||||||
Coordinator-General Land and Asset Management | — | 1,300 | 1,450 | 1,600 | 1,700 | |||||||||||||||
Brisbane 2032 Venue User Displacement | — | — | — | — | — | |||||||||||||||
Infill Development Strategy | 1,111 | — | — | — | — | |||||||||||||||
Legacy Outcomes - Brisbane 2032 Olympic and Paralympic games | — | — | — | — | — | |||||||||||||||
|
|
|
|
|
|
|
|
|
| |||||||||||
Portfolio Total | 3,385 | 80,417 | 39,530 | 25,606 | 25,922 | |||||||||||||||
|
|
|
|
|
|
|
|
|
| |||||||||||
Department of the Premier and Cabinet | ||||||||||||||||||||
Policy and Reform Priorities | — | 8,530 | 6,800 | 6,800 | 6,800 | |||||||||||||||
Establishment of the Implementation Division | — | 3,488 | 3,593 | 3,688 | 3,795 | |||||||||||||||
Office of the Queensland Integrity Commissioner | — | 1,601 | 1,631 | 764 | 768 | |||||||||||||||
Governance and Engagement Division - Capability Enhancement | — | 900 | 900 | 900 | 900 | |||||||||||||||
|
|
|
|
|
|
|
|
|
| |||||||||||
Portfolio Total | — | 14,519 | 12,924 | 12,152 | 12,263 | |||||||||||||||
|
|
|
|
|
|
|
|
|
| |||||||||||
Department of Tourism and Sport | ||||||||||||||||||||
FairPlay | — | 33,500 | — | — | — | |||||||||||||||
North Ipswich Sport and Entertainment Precinct | — | 10,000 | — | — | — | |||||||||||||||
Sport Minor Infrastructure Program | — | 9,500 | — | — | — | |||||||||||||||
Activate! Queensland | — | 5,500 | — | — | — | |||||||||||||||
Rockhampton Sports Precinct | — | 5,000 | — | — | — | |||||||||||||||
Youth Development Partnership Fund | — | 3,000 | — | — | — | |||||||||||||||
|
|
|
|
|
|
|
|
|
| |||||||||||
Portfolio Total | — | 66,500 | — | — | — | |||||||||||||||
|
|
|
|
|
|
|
|
|
| |||||||||||
Department of Transport and Main Roads | ||||||||||||||||||||
Rail Transport Service Contract | 5,069 | 153,332 | 214,842 | 256,057 | 284,126 | |||||||||||||||
Critical Cyber Security Protections for Customers | — | 50,000 | — | — | — | |||||||||||||||
Sustainment of Smart Ticketing Project Delivery | — | 22,750 | — | — | — | |||||||||||||||
Service Queensland Action Plan | 19,000 | 18,500 | 11,275 | 11,557 | 11,846 | |||||||||||||||
Gympie Road Bypass Business Case for Surface Corridor Transformation | — | 10,000 | 7,000 | — | — | |||||||||||||||
19
Budget Measures 2024-25
Expense measures since 2023-24 Budget Update | 2023-24 $‘000 | 2024-25 $‘000 | 2025-26 $‘000 | 2026-27 $‘000 | 2027-28 $‘000 | |||||||||||||||
School Bus Upgrade Scheme | 2,962 | 9,839 | 18,108 | 24,106 | 29,461 | |||||||||||||||
Rockhampton Railyards Rejuvenation | — | 9,401 | — | — | — | |||||||||||||||
Transport Infrastructure Development Scheme | — | 5,950 | — | — | — | |||||||||||||||
Bus Service Growth | — | 5,606 | 16,507 | 23,115 | 24,292 | |||||||||||||||
Transport Registration and Integrated Licensing System Data Integrity Assurance Program | — | 5,000 | — | — | — | |||||||||||||||
Camera Detected Offence Program | — | 3,913 | 9,983 | 14,711 | 15,730 | |||||||||||||||
Rail Replacement Buses | 2,400 | 2,482 | 2,544 | 2,608 | 2,673 | |||||||||||||||
Gold Coast On Demand Transport Trial | — | 2,095 | — | — | — | |||||||||||||||
Public Transport Infrastructure Disability Standards Compliance | — | 2,000 | — | — | — | |||||||||||||||
Lift Payment for Wheelchair Accessible Taxi Drivers | — | 1,883 | 1,883 | 1,883 | 1,883 | |||||||||||||||
Implementing 3-sector Rail Timetable Enabling Cross River Rail Opening | — | 1,821 | 5,584 | 1,852 | 2,453 | |||||||||||||||
Gold Coast Sand Bypass System Jetty | — | 1,800 | 1,800 | 1,800 | 500 | |||||||||||||||
Queensland School Bus Ticketing System | — | 1,137 | — | — | — | |||||||||||||||
Queensland Government Agent Program Service Delivery | — | 834 | — | — | — | |||||||||||||||
|
|
|
|
|
|
|
|
|
| |||||||||||
Portfolio Total | 29,431 | 308,343 | 289,526 | 337,689 | 372,964 | |||||||||||||||
|
|
|
|
|
|
|
|
|
| |||||||||||
Department of Treaty, Aboriginal and Torres Strait Islander Partnerships, Communities and the Arts | ||||||||||||||||||||
Screen Queensland - Production Attraction Strategy | — | 28,000 | — | — | — | |||||||||||||||
Queensland Community Support Scheme | — | 10,000 | — | — | — | |||||||||||||||
Screen Queensland - Post, Digital and Special Effects | — | 8,000 | — | — | — | |||||||||||||||
Path to Treaty - Truth-telling and Healing Inquiry | — | 7,157 | 2,518 | 2,136 | — | |||||||||||||||
Coen Art Centre | — | 6,678 | 1,500 | — | — | |||||||||||||||
Live Music Support Package - Industry Grants | — | 3,225 | — | — | — | |||||||||||||||
Queensland Performing Arts Centre First Nations Programming Initiatives | — | 2,000 | — | — | — | |||||||||||||||
Screen Queensland - Digital Games Program | — | 2,000 | — | — | — | |||||||||||||||
Emergency Relief 2 | — | 1,650 | — | — | — | |||||||||||||||
Community Food Education Program | — | 1,300 | — | — | — | |||||||||||||||
Queensland Veterans Council Secretariat | — | 1,230 | 1,230 | 1,230 | 1,230 | |||||||||||||||
Financial Resilience Services 2 | — | 1,113 | — | — | — | |||||||||||||||
Food Recovery and Redistribution 2 | — | 1,090 | 2,180 | — | — | |||||||||||||||
Foodbank Warehousing and Operating Costs | — | 774 | 773 | 773 | 563 | |||||||||||||||
Queensland Cultural Centre Flood Resilience Business Case | — | 750 | 750 | — | — | |||||||||||||||
Braille House and Vision Australia | — | 611 | — | — | — | |||||||||||||||
Strengthening Support for Victims of Crime | — | 597 | — | — | — | |||||||||||||||
LGBTQIA+ Alliance | — | 532 | 503 | — | — | |||||||||||||||
Australian Cinematheque and Children’s Arts Centre | — | 500 | — | — | — | |||||||||||||||
Queensland Indigenous Youth Leadership Program | — | 302 | — | — | — | |||||||||||||||
Queensland Meals on Wheels- Peak Body | — | 300 | 300 | 300 | 300 | |||||||||||||||
Queensland Cultural Centre Emergency Service Officers | — | 276 | 276 | 276 | 276 | |||||||||||||||
Preservation and Protection of Significant Indigenous Heritage Sites | — | 250 | 250 | — | — | |||||||||||||||
Initiatives to support the National Agreement on Closing the Gap | — | 107 | 107 | — | — | |||||||||||||||
Cost of Living Package - Electricity Bill Support | 2,267,000 | — | — | — | — | |||||||||||||||
Stronger Places, Stronger People Extension 2 | — | — | — | — | — | |||||||||||||||
|
|
|
|
|
|
|
|
|
| |||||||||||
Portfolio Total | 2,267,000 | 78,442 | 10,387 | 4,715 | 2,369 | |||||||||||||||
|
|
|
|
|
|
|
|
|
| |||||||||||
20
Budget Measures 2024-25
Expense measures since 2023-24 Budget Update | 2023-24 $‘000 | 2024-25 $‘000 | 2025-26 $‘000 | 2026-27 $‘000 | 2027-28 $‘000 | |||||||||||||||
Department of Youth Justice | ||||||||||||||||||||
Wacol Youth Remand Centre | — | 32,870 | 39,876 | 21,228 | — | |||||||||||||||
Targeted Responses to Emerging Youth Crime | 6,000 | 12,000 | 6,000 | — | — | |||||||||||||||
Youth Detention Centre Readiness and Interim Arrangements | — | 8,550 | 9,124 | — | — | |||||||||||||||
Youth Co-Responder Teams Expansion | — | 5,901 | 5,285 | — | — | |||||||||||||||
Youth After Hours Services | — | 3,000 | 3,000 | — | — | |||||||||||||||
Restorative Justice Services Expansion | — | 2,500 | 2,500 | — | — | |||||||||||||||
Electronic Monitoring Expansion | — | 2,400 | — | — | — | |||||||||||||||
Intensive Case Management Expansion | — | 1,178 | 2,343 | — | — | |||||||||||||||
Responding to serious violent offenders | — | 955 | 2,650 | 2,663 | 2,529 | |||||||||||||||
Woodford Youth Detention Centre Operational and Establishment Funding | — | 750 | 54,932 | 80,974 | 87,105 | |||||||||||||||
Extension of Culture-focused Youth Justice Family Partnership Responses | — | 660 | 920 | 1,220 | 460 | |||||||||||||||
Youth Detention Centre Support 2 | — | 385 | 385 | 835 | 831 | |||||||||||||||
Strengthening and Sustaining Court Reforms Tackling Youth and Adult Crime | — | — | 1,152 | — | — | |||||||||||||||
|
|
|
|
|
|
|
|
|
| |||||||||||
Portfolio Total | 6,000 | 71,149 | 128,167 | 106,920 | 90,925 | |||||||||||||||
|
|
|
|
|
|
|
|
|
| |||||||||||
Legislative Assembly of Queensland | ||||||||||||||||||||
Electorate office staff | — | 12,597 | 12,970 | 13,295 | 13,627 | |||||||||||||||
|
|
|
|
|
|
|
|
|
| |||||||||||
Portfolio Total | — | 12,597 | 12,970 | 13,295 | 13,627 | |||||||||||||||
|
|
|
|
|
|
|
|
|
| |||||||||||
Office of the Governor | ||||||||||||||||||||
Office of the Governor | — | 583 | 600 | 615 | 631 | |||||||||||||||
|
|
|
|
|
|
|
|
|
| |||||||||||
Portfolio Total | — | 583 | 600 | 615 | 631 | |||||||||||||||
|
|
|
|
|
|
|
|
|
| |||||||||||
Office of the Queensland Ombudsman | ||||||||||||||||||||
Funding for Critical Business Needs | — | 1,016 | 1,313 | 1,207 | 1,234 | |||||||||||||||
Wacol Youth Remand Facility | — | 592 | 608 | 311 | — | |||||||||||||||
Woodford Youth Detention Centre | — | — | — | 1,023 | 1,049 | |||||||||||||||
|
|
|
|
|
|
|
|
|
| |||||||||||
Portfolio Total | — | 1,608 | 1,921 | 2,541 | 2,283 | |||||||||||||||
|
|
|
|
|
|
|
|
|
| |||||||||||
Public Sector Commission | ||||||||||||||||||||
Queensland Complaints Clearinghouse Foundation Stage | — | 6,223 | — | — | — | |||||||||||||||
|
|
|
|
|
|
|
|
|
| |||||||||||
Portfolio Total | — | 6,223 | — | — | — | |||||||||||||||
|
|
|
|
|
|
|
|
|
| |||||||||||
Queensland Corrective Services | ||||||||||||||||||||
Additional Prisoner Growth Funding | 9,846 | 128,706 | 44,246 | 42,068 | 45,650 | |||||||||||||||
Asset Improvement Program | 10,000 | 21,234 | 29,535 | 18,089 | 18,313 | |||||||||||||||
Domestic and Family Violence Perpetrator Programs | — | 5,420 | 9,420 | — | — | |||||||||||||||
End-to-End Case Management | — | 5,260 | 5,529 | 5,481 | 5,704 | |||||||||||||||
Electronic Monitoring - Youth | — | 2,232 | — | — | — | |||||||||||||||
Improving Services for Victims of Crime | — | 431 | 593 | 608 | 624 | |||||||||||||||
Gangs Exit Program | — | 389 | 400 | — | — | |||||||||||||||
21
Budget Measures 2024-25
Expense measures since 2023-24 Budget Update | 2023-24 $‘000 | 2024-25 $‘000 | 2025-26 $‘000 | 2026-27 $‘000 | 2027-28 $‘000 | |||||||||||||||
Homes for Queenslanders | 80 | 199 | 206 | 213 | 218 | |||||||||||||||
Prison Capacity Uplift | — | — | 9,954 | 10,233 | 10,482 | |||||||||||||||
|
|
|
|
|
|
|
|
|
| |||||||||||
Portfolio Total | 19,926 | 163,871 | 99,883 | 76,692 | 80,991 | |||||||||||||||
|
|
|
|
|
|
|
|
|
| |||||||||||
Queensland Fire Department | ||||||||||||||||||||
Disaster Recovery Funding Arrangements Efficiencies | — | 40,000 | 40,000 | 20,000 | — | |||||||||||||||
Queensland Reconstruction Authority Capacity Uplift | — | — | 4,635 | 4,751 | — | |||||||||||||||
|
|
|
|
|
|
|
|
|
| |||||||||||
Portfolio Total | — | 40,000 | 44,635 | 24,751 | — | |||||||||||||||
|
|
|
|
|
|
|
|
|
| |||||||||||
Queensland Health | ||||||||||||||||||||
Queensland Health Growth Funding Uplift | — | 1,375,165 | 755,277 | 562,652 | 1,700,046 | |||||||||||||||
Expansion of Mental and Physical Health Services across Youth Detention Centres | — | 3,500 | — | — | — | |||||||||||||||
Wacol Detention Centre - Operational and Establishment Funding | — | 2,861 | 3,348 | 1,791 | — | |||||||||||||||
Strengthening and Sustaining Court Reforms Tackling Youth and Adult Crime | — | 136 | 350 | — | — | |||||||||||||||
Woodford Youth Detention Centre - Operational and Establishment Funding | — | — | — | 10,064 | 9,849 | |||||||||||||||
Access to Aids and Equipment for Queenslanders with Disability | — | 6,475 | — | — | — | |||||||||||||||
Aeromedical Contracts | — | — | — | — | — | |||||||||||||||
Assisted Reproductive Technology Regulation | — | — | — | — | — | |||||||||||||||
Better Cancer Care | — | — | — | — | — | |||||||||||||||
First Nations First | — | — | — | — | — | |||||||||||||||
Free Vaccinations for Queenslanders | — | — | — | — | — | |||||||||||||||
HealthPathways Statewide Licence | — | — | — | — | — | |||||||||||||||
Hospital Discharge Initiatives | — | — | — | — | — | |||||||||||||||
Queensland Ambulance Service | — | — | — | — | — | |||||||||||||||
Queensland Community Pharmacy Scope of Practice Pilot | — | — | — | — | — | |||||||||||||||
Queensland Health Cyber Security Program | — | — | — | — | — | |||||||||||||||
Queensland Health Workforce | — | — | — | — | — | |||||||||||||||
Sexual Assault Response | — | — | — | — | — | |||||||||||||||
Specialist Palliative Care in Aged Care | — | — | — | — | — | |||||||||||||||
Voluntary Assisted Dying | — | — | — | — | — | |||||||||||||||
Women and Girls’ Health Strategy | — | — | — | — | — | |||||||||||||||
|
|
|
|
|
|
|
|
|
| |||||||||||
Portfolio Total | — | 1,388,137 | 758,975 | 574,507 | 1,709,895 | |||||||||||||||
|
|
|
|
|
|
|
|
|
| |||||||||||
Queensland Police Service | ||||||||||||||||||||
900 New Police Personnel | — | 26,887 | 98,675 | 179,092 | 183,244 | |||||||||||||||
Caboolture Watchhouse Hub 2 | 29,850 | 15,085 | — | — | — | |||||||||||||||
Queensland Police-Citizens Youth Club (PCYC) Caloundra | — | 15,000 | — | — | — | |||||||||||||||
Towing Scheme for Victims of Property Crime | 10,500 | 10,500 | 10,500 | 10,500 | 10,500 | |||||||||||||||
Integrated Strategy Addressing Youth Crime in North Queensland | 13,097 | 8,556 | 1,056 | 1,056 | 1,056 | |||||||||||||||
Community Safety Initiatives in the South West Brisbane and Ipswich Areas | 468 | 8,456 | 8,663 | 8,870 | 9,083 | |||||||||||||||
Wacol Youth Remand Facility Operating and Maintenance Costs | — | 5,278 | 10,696 | 5,419 | — | |||||||||||||||
Camera Detected Offence Program | — | 4,449 | 634 | 321 | 321 | |||||||||||||||
Community Support Funding for Non-Government Organisations 2 | — | 4,100 | 4,100 | 4,100 | 4,100 | |||||||||||||||
22
Budget Measures 2024-25
Expense measures since 2023-24 Budget Update | 2023-24 $‘000 | 2024-25 $‘000 | 2025-26 $‘000 | 2026-27 $‘000 | 2027-28 $‘000 | |||||||||||||||
Prevention of Knife Crime | 2,250 | 3,400 | 350 | — | — | |||||||||||||||
From Frontline to Family - Building Our Workforce for a Sustainable and Family-centred Coronial System | — | 3,171 | 3,258 | 3,337 | 3,417 | |||||||||||||||
Emergency Management and Coordination Command Enhancement | — | 3,029 | — | — | — | |||||||||||||||
Watchhouse Modernisation Program | — | 3,000 | — | — | — | |||||||||||||||
Conducted Electrical Weapon Fleet Replacement Project | — | 2,833 | 2,833 | 2,834 | — | |||||||||||||||
Queensland Police-Citizens Youth Club (PCYC) Redcliffe | — | 2,000 | — | — | — | |||||||||||||||
Project Booyah Linked Early Intervention Program | 371 | 1,354 | 1,490 | 1,526 | 1,573 | |||||||||||||||
Police Youth Co-responder Teams Extension and Expansion | — | 1,060 | 1,005 | — | — | |||||||||||||||
Digital Evidence Capability Program | — | 992 | — | — | — | |||||||||||||||
Expansion of Metal Detection Program | — | 900 | — | — | — | |||||||||||||||
Additional POLAIR Flight Hours in South East Queensland | — | 753 | 776 | 799 | 839 | |||||||||||||||
Gangs Exit Program | — | 638 | 638 | — | — | |||||||||||||||
Electronic Monitoring of Adult Bailees | — | 587 | 927 | 927 | 927 | |||||||||||||||
Court Reforms Tackling Youth and Adult Crime | — | 176 | 717 | — | — | |||||||||||||||
Interim Police Aerial Support Capability | — | — | — | — | — | |||||||||||||||
|
|
|
|
|
|
|
|
|
| |||||||||||
Portfolio Total | 56,536 | 122,204 | 146,318 | 218,781 | 215,060 | |||||||||||||||
|
|
|
|
|
|
|
|
|
| |||||||||||
Queensland Treasury | ||||||||||||||||||||
Gympie Road Bypass Pre-construction Works | — | 33,000 | 33,000 | 252,000 | — | |||||||||||||||
Queensland Revenue Office - Revenue and Penalty Debt Administration and Resourcing | — | 19,661 | 28,004 | 34,131 | 35,188 | |||||||||||||||
Mount Isa Acceleration Fund 2 | — | 10,000 | 20,000 | — | — | |||||||||||||||
Camera Detected Offence Program | — | 7,135 | 7,184 | 7,163 | 7,352 | |||||||||||||||
Queensland Revenue Office - Digital and Data Uplift | — | 5,764 | 2,048 | 2,061 | 2,074 | |||||||||||||||
Mental Health Levy Administration and Resourcing | — | 4,127 | 4,248 | 4,355 | 4,465 | |||||||||||||||
Combustible Cladding | — | 1,200 | — | — | — | |||||||||||||||
Townsville North Rail Yards | — | 500 | — | — | — | |||||||||||||||
Backing Business in the Bush Fund | — | — | — | — | — | |||||||||||||||
|
|
|
|
|
|
|
|
|
| |||||||||||
Portfolio Total | — | 81,387 | 94,484 | 299,710 | 49,079 | |||||||||||||||
|
|
|
|
|
|
|
|
|
| |||||||||||
Whole-of-government program | — | 88,979 | 139,491 | 36,306 | 39,356 | |||||||||||||||
Total decisions made but not yet announced | 47,716 | 142,191 | 82,079 | 58,142 | 37,357 | |||||||||||||||
Total impact on Expense since 2023-24 Budget Update | 3,647,439 | 4,429,099 | 3,057,662 | 2,394,289 | 3,448,737 | |||||||||||||||
Total impact on Expense since the 2023-24 Budget | 3,895,296 | 4,975,610 | 3,521,235 | 2,780,985 | 3,717,067 | |||||||||||||||
| 1. | Further funding for this measure can be found in the Post Budget Update section of this table. |
| 2. | Further funding for this measure can be found in the up to and including Budget Update section of this table. |
23
Budget Measures 2024-25
| Table 1.4: | Capital measures since the 2023–24 Budget |
Capital measures up to and including 2023-24 Budget Update | 2023-24 $‘000 | 2024-25 $‘000 | 2025-26 $‘000 | 2026-27 $‘000 | 2027-28 $‘000 | |||||||||||||||
Department of Child Safety, Seniors and Disability Services | ||||||||||||||||||||
Forensic Disability Services Precinct at Wacol - Upgrade Facilities | 635 | 2,862 | — | — | — | |||||||||||||||
|
|
|
|
|
|
|
|
|
| |||||||||||
Portfolio Total | 635 | 2,862 | — | — | — | |||||||||||||||
|
|
|
|
|
|
|
|
|
| |||||||||||
Department of Education | ||||||||||||||||||||
Playgrounds and Tuckshops Program | 6,555 | 26,219 | 32,772 | — | — | |||||||||||||||
Preventing Youth Justice Involvement Through Educational Engagement | — | 22,500 | 53,438 | 16,875 | — | |||||||||||||||
|
|
|
|
|
|
|
|
|
| |||||||||||
Portfolio Total | 6,555 | 48,719 | 86,210 | 16,875 | — | |||||||||||||||
|
|
|
|
|
|
|
|
|
| |||||||||||
Department of Environment, Science and Innovation | ||||||||||||||||||||
K’gari Dingo Management Enhanced Actions | 2,325 | 7,500 | 4,825 | — | — | |||||||||||||||
|
|
|
|
|
|
|
|
|
| |||||||||||
Portfolio Total | 2,325 | 7,500 | 4,825 | — | — | |||||||||||||||
|
|
|
|
|
|
|
|
|
| |||||||||||
Department of Justice and Attorney-General | ||||||||||||||||||||
Accommodation to support the domestic and family violence courthouse upgrade | 1,089 | 3,900 | 1,386 | — | — | |||||||||||||||
Support for the Queensland Civil and Administrative Tribunal workforce 1 | 135 | 1,365 | — | — | — | |||||||||||||||
Victims Commissioner and Sexual Violence Case Review | — | — | — | — | — | |||||||||||||||
|
|
|
|
|
|
|
|
|
| |||||||||||
Portfolio Total | 1,224 | 5,265 | 1,386 | — | — | |||||||||||||||
|
|
|
|
|
|
|
|
|
| |||||||||||
Department of Resources | ||||||||||||||||||||
Abandoned Mine Lands Program 1 | — | 1,270 | — | — | — | |||||||||||||||
|
|
|
|
|
|
|
|
|
| |||||||||||
Portfolio Total | — | 1,270 | — | — | — | |||||||||||||||
|
|
|
|
|
|
|
|
|
| |||||||||||
Department of State Development and Infrastructure | ||||||||||||||||||||
Queensland Industrial Relations Commission Funding | 300 | — | — | — | — | |||||||||||||||
|
|
|
|
|
|
|
|
|
| |||||||||||
Portfolio Total | 300 | — | — | — | — | |||||||||||||||
|
|
|
|
|
|
|
|
|
| |||||||||||
Department of Youth Justice | ||||||||||||||||||||
Woodford Youth Detention Centre | 27,264 | 185,050 | 289,819 | 80,171 | 45,306 | |||||||||||||||
|
|
|
|
|
|
|
|
|
| |||||||||||
Portfolio Total | 27,264 | 185,050 | 289,819 | 80,171 | 45,306 | |||||||||||||||
|
|
|
|
|
|
|
|
|
| |||||||||||
Queensland Corrective Services | ||||||||||||||||||||
High Risk Offender Management Unit Resourcing | 946 | 1,892 | — | — | — | |||||||||||||||
|
|
|
|
|
|
|
|
|
| |||||||||||
Portfolio Total | 946 | 1,892 | — | — | — | |||||||||||||||
|
|
|
|
|
|
|
|
|
| |||||||||||
Queensland Health | ||||||||||||||||||||
Rockhampton Mental Health Unit | — | 50,000 | 29,100 | — | — | |||||||||||||||
Emergent Issues and Cost Escalation of Health Capital Projects | 15,660 | 44,505 | 1,757 | — | — | |||||||||||||||
Commission of Inquiry - Forensic DNA Testing | 17,148 | 650 | 650 | 650 | 650 | |||||||||||||||
|
|
|
|
|
|
|
|
|
| |||||||||||
Portfolio Total | 32,808 | 95,155 | 31,507 | 650 | 650 | |||||||||||||||
|
|
|
|
|
|
|
|
|
| |||||||||||
Queensland Police Service | ||||||||||||||||||||
Weapons Licensing Management System Replacement Project | 1,240 | 3,703 | — | — | — | |||||||||||||||
Advanced Data Analytics Capability | 1,899 | 3,344 | 1,500 | — | — | |||||||||||||||
24
Budget Measures 2024-25
Capital measures up to and including 2023-24 Budget Update | 2023-24 $‘000 | 2024-25 $‘000 | 2025-26 $‘000 | 2026-27 $‘000 | 2027-28 $‘000 | |||||||||||||||
Caboolture Watchhouse Hub 1 | — | — | — | — | — | |||||||||||||||
Commission of Inquiry into Forensic DNA Testing in Queensland Recommendation Implementation and Associated Resourcing | 1,500 | — | — | — | — | |||||||||||||||
Implementation of the Commission of Inquiry Recommendations into Queensland Police Service to Domestic and Family Violence | 1,189 | — | — | — | — | |||||||||||||||
Wacol Youth Remand Facility 1 | 10,500 | — | — | — | — | |||||||||||||||
|
|
|
|
|
|
|
|
|
| |||||||||||
Portfolio Total | 16,328 | 7,047 | 1,500 | — | — | |||||||||||||||
|
|
|
|
|
|
|
|
|
| |||||||||||
Queensland Treasury | ||||||||||||||||||||
Queensland Critical Minerals and Battery Technology Fund | 70,000 | — | — | — | — | |||||||||||||||
Queensland Venture Capital Development Fund | — | — | — | — | — | |||||||||||||||
|
|
|
|
|
|
|
|
|
| |||||||||||
Portfolio Total | 70,000 | — | — | — | — | |||||||||||||||
|
|
|
|
|
|
|
|
|
| |||||||||||
Total impact on Capital up to and including 2023-24 Budget Update | 158,385 | 354,760 | 415,247 | 97,696 | 45,956 | |||||||||||||||
25
Budget Measures 2024-25
Capital measures since 2023-24 Budget Update | 2023-24 $‘000 | 2024-25 $‘000 | 2025-26 $‘000 | 2026-27 $‘000 | 2027-28 $‘000 | |||||||||||||||
Department of Child Safety, Seniors and Disability Services | ||||||||||||||||||||
Unify Program - Continuous Improvement Pipeline | — | 4,889 | 7,373 | 4,943 | 5,141 | |||||||||||||||
|
|
|
|
|
|
|
|
|
| |||||||||||
Portfolio Total | — | 4,889 | 7,373 | 4,943 | 5,141 | |||||||||||||||
|
|
|
|
|
|
|
|
|
| |||||||||||
Department of Education | ||||||||||||||||||||
Sustainable Investment in Schools | — | 34,000 | 100,000 | 100,000 | 100,000 | |||||||||||||||
|
|
|
|
|
|
|
|
|
| |||||||||||
Portfolio Total | — | 34,000 | 100,000 | 100,000 | 100,000 | |||||||||||||||
|
|
|
|
|
|
|
|
|
| |||||||||||
Department of Environment, Science and Innovation | ||||||||||||||||||||
Better Queensland Parks - Fire Management Uplift Program | — | 18,118 | — | — | — | |||||||||||||||
|
|
|
|
|
|
|
|
|
| |||||||||||
Portfolio Total | — | 18,118 | — | — | — | |||||||||||||||
|
|
|
|
|
|
|
|
|
| |||||||||||
Department of Housing, Local Government, Planning and Public Works | ||||||||||||||||||||
Homes for Queenslanders: a fair and sustainable housing system | — | 109,304 | 99,630 | 357,376 | 799,512 | |||||||||||||||
Convention Centres: Capital Replacement | — | — | — | — | — | |||||||||||||||
|
|
|
|
|
|
|
|
|
| |||||||||||
Portfolio Total | — | 109,304 | 99,630 | 357,376 | 799,512 | |||||||||||||||
|
|
|
|
|
|
|
|
|
| |||||||||||
Department of Justice and Attorney-General | ||||||||||||||||||||
Brisbane Supreme and District Court - courtroom expansion | — | 2,010 | 8,941 | 10,972 | 3,395 | |||||||||||||||
Support for the Queensland Civil and Administrative Tribunal workforce 2 | — | 1,500 | — | — | — | |||||||||||||||
Townsville Courthouse - courtroom expansion | — | 500 | 2,750 | 4,000 | 250 | |||||||||||||||
Court Recording and transcription services | — | 250 | — | — | — | |||||||||||||||
Support for Victims of Crime | 150 | — | — | — | — | |||||||||||||||
|
|
|
|
|
|
|
|
|
| |||||||||||
Portfolio Total | 150 | 4,260 | 11,691 | 14,972 | 3,645 | |||||||||||||||
|
|
|
|
|
|
|
|
|
| |||||||||||
Department of Resources | ||||||||||||||||||||
Abandoned Mine Lands Program 2 | 100 | 1,650 | 880 | 270 | — | |||||||||||||||
|
|
|
|
|
|
|
|
|
| |||||||||||
Portfolio Total | 100 | 1,650 | 880 | 270 | — | |||||||||||||||
|
|
|
|
|
|
|
|
|
| |||||||||||
Department of State Development and Infrastructure | ||||||||||||||||||||
Racing Infrastructure | 30,000 | — | — | — | — | |||||||||||||||
|
|
|
|
|
|
|
|
|
| |||||||||||
Portfolio Total | 30,000 | — | — | — | — | |||||||||||||||
|
|
|
|
|
|
|
|
|
| |||||||||||
Department of Transport and Main Roads | ||||||||||||||||||||
Rail Replacement Buses | 45,427 | 88,773 | — | — | — | |||||||||||||||
Pacific Motorway (M1) Varsity Lakes to Tugun | 202,308 | 82,500 | 60,000 | 85,192 | — | |||||||||||||||
Direct Sunshine Coast Rail Line | 5,000 | 52,900 | 91,000 | 400,000 | 522,700 | |||||||||||||||
Rockhampton Railyards Rejuvenation | — | 13,152 | 408 | 314 | 457 | |||||||||||||||
Multi-level Car Park at Weinam Creek Priority Development Area | — | 5,000 | 5,000 | 5,000 | — | |||||||||||||||
Coomera Connector Stage 1 | — | 3,000 | 179,095 | 144,905 | 91,000 | |||||||||||||||
Beerburrum to Nambour Rail Upgrade Stage 1 Project | — | — | 144,595 | 36,105 | 26,000 | |||||||||||||||
European Train Control System - future phases | — | — | — | — | — | |||||||||||||||
|
|
|
|
|
|
|
|
|
| |||||||||||
Portfolio Total | 252,735 | 245,325 | 480,098 | 671,516 | 640,157 | |||||||||||||||
|
|
|
|
|
|
|
|
|
| |||||||||||
Department of Treaty, Aboriginal and Torres Strait Islander Partnerships, Communities and the Arts | ||||||||||||||||||||
Cultural Infrastructure Renewal Works | — | 23,750 | — | — | — | |||||||||||||||
26
Budget Measures 2024-25
Capital measures since 2023-24 Budget Update | 2023-24 $‘000 | 2024-25 $‘000 | 2025-26 $‘000 | 2026-27 $‘000 | 2027-28 $‘000 | |||||||||||||||
Queensland Museum Infrastructure Renewal and Transformation | — | 1,675 | 2,570 | 705 | — | |||||||||||||||
Cultural and Performing Arts - Queensland Cultural Centre precinct works | 11,700 | — | — | — | — | |||||||||||||||
New Performing Arts Venue - Project management and technical advisory services | 9,000 | — | — | — | — | |||||||||||||||
|
|
|
|
|
|
|
|
|
| |||||||||||
Portfolio Total | 20,700 | 25,425 | 2,570 | 705 | — | |||||||||||||||
|
|
|
|
|
|
|
|
|
| |||||||||||
Department of Youth Justice | ||||||||||||||||||||
Cairns Youth Detention Centre | — | — | — | — | — | |||||||||||||||
Woodford Youth Detention Centre Operational and Establishment Funding | — | — | 285 | 124 | — | |||||||||||||||
|
|
|
|
|
|
|
|
|
| |||||||||||
Portfolio Total | — | — | 285 | 124 | — | |||||||||||||||
|
|
|
|
|
|
|
|
|
| |||||||||||
Legislative Assembly of Queensland | ||||||||||||||||||||
Annexe Critical Infrastructure and Services Upgrade | 15,770 | — | — | — | — | |||||||||||||||
|
|
|
|
|
|
|
|
|
| |||||||||||
Portfolio Total | 15,770 | — | — | — | — | |||||||||||||||
|
|
|
|
|
|
|
|
|
| |||||||||||
Office of the Queensland Ombudsman | ||||||||||||||||||||
Funding for Fit-out of New Office Accommodation | — | 950 | 933 | 50 | 50 | |||||||||||||||
|
|
|
|
|
|
|
|
|
| |||||||||||
Portfolio Total | — | 950 | 933 | 50 | 50 | |||||||||||||||
|
|
|
|
|
|
|
|
|
| |||||||||||
Queensland Corrective Services | ||||||||||||||||||||
Asset Improvement Program | — | 46,000 | 115,863 | 66,050 | 18,500 | |||||||||||||||
Prison Capacity Uplift | — | 23,980 | 57,270 | — | — | |||||||||||||||
|
|
|
|
|
|
|
|
|
| |||||||||||
Portfolio Total | — | 69,980 | 173,133 | 66,050 | 18,500 | |||||||||||||||
|
|
|
|
|
|
|
|
|
| |||||||||||
Queensland Fire Department | ||||||||||||||||||||
Enhanced Firefighter Safety Equipment | — | 5,000 | — | — | — | |||||||||||||||
Ayr Fire and Rescue Station remediation works | — | 4,000 | — | — | — | |||||||||||||||
|
|
|
|
|
|
|
|
|
| |||||||||||
Portfolio Total | — | 9,000 | — | — | — | |||||||||||||||
|
|
|
|
|
|
|
|
|
| |||||||||||
Queensland Health | ||||||||||||||||||||
Queensland Ambulance Service Base Capital Funding Investment | — | 30,000 | — | — | — | |||||||||||||||
Rural and Remote Workforce Accommodation | — | 12,000 | — | — | — | |||||||||||||||
Cairns Health and Innovation Centre (CHIC) Stage 1 | — | 8,000 | 52,000 | — | — | |||||||||||||||
Cooktown Multipurpose Health Service Facility | — | 8,000 | 30,000 | 40,000 | 40,000 | |||||||||||||||
Capacity Expansion Program | — | — | — | — | 1,000,000 | |||||||||||||||
Queensland Health’s Sustaining Capital Program | 115,000 | — | — | — | — | |||||||||||||||
|
|
|
|
|
|
|
|
|
| |||||||||||
Portfolio Total | 115,000 | 58,000 | 82,000 | 40,000 | 1,040,000 | |||||||||||||||
|
|
|
|
|
|
|
|
|
| |||||||||||
Queensland Police Service | ||||||||||||||||||||
Wacol Youth Remand Facility 2 | 50,000 | 200,000 | — | — | — | |||||||||||||||
Police Capital Project Funding | — | 15,000 | 9,500 | 9,500 | — | |||||||||||||||
QPS Youth Coordination Hub | — | 10,000 | — | — | — | |||||||||||||||
Watchhouse Modernisation Program | — | 2,500 | — | — | — | |||||||||||||||
Digital Evidence Capability Program | — | 1,220 | — | — | — | |||||||||||||||
Community Safety Initiatives in the South West Brisbane and Ipswich Areas | — | 1,000 | — | — | — | |||||||||||||||
Police Youth Co-responder Teams Extension and Expansion | — | 154 | 154 | — | — | |||||||||||||||
27
Budget Measures 2024-25
Capital measures since 2023-24 Budget Update | 2023-24 $‘000 | 2024-25 $‘000 | 2025-26 $‘000 | 2026-27 $‘000 | 2027-28 $‘000 | |||||||||||||||
900 New Police Personnel | — | — | 4,950 | — | — | |||||||||||||||
Caboolture Watchhouse Hub 2 | 395 | — | — | — | — | |||||||||||||||
Integrated Strategy Addressing Youth Crime in North Queensland | 3,100 | — | — | — | — | |||||||||||||||
Interim Police Aerial Support Capability | — | — | — | — | — | |||||||||||||||
|
|
|
|
|
|
|
|
|
| |||||||||||
Portfolio Total | 53,495 | 229,874 | 14,604 | 9,500 | — | |||||||||||||||
|
|
|
|
|
|
|
|
|
| |||||||||||
Queensland Treasury | ||||||||||||||||||||
Boost to the Business Investment Fund | — | 50,000 | — | — | — | |||||||||||||||
|
|
|
|
|
|
|
|
|
| |||||||||||
Portfolio Total | — | 50,000 | — | — | — | |||||||||||||||
|
|
|
|
|
|
|
|
|
| |||||||||||
Whole-of-government program | — | 20,300 | 6,900 | — | — | |||||||||||||||
Total decisions made but not yet announced | 202,723 | 184,736 | 322,889 | 293,650 | 16,944 | |||||||||||||||
Total impact on Capital since 2023-24 Budget Update | 690,673 | 1,065,811 | 1,302,986 | 1,559,156 | 2,623,949 | |||||||||||||||
Total impact on Capital since the 2023-24 Budget | 849,058 | 1,420,571 | 1,718,233 | 1,656,852 | 2,669,905 | |||||||||||||||
| 1. | Further funding for this measure can be found in the Post Budget Update section of this table. |
| 2. | Further funding for this measure can be found in the up to and including Budget Update section of this table. |
28
Budget Measures 2024-25
| Table 1.5: | Revenue measures since the 2023–24 Budget |
Revenue measures up to and including 2023-24 Budget Update | 2023-24 $‘000 | 2024-25 $‘000 | 2025-26 $‘000 | 2026-27 $‘000 | 2027-28 $‘000 | |||||||||||||||
Department of Transport and Main Roads | ||||||||||||||||||||
Public Transport Fare Freeze | (13,413 | ) | (14,641 | ) | (14,960 | ) | (9,535 | ) | (9,738 | ) | ||||||||||
Motor Vehicle Registration Fee Freeze | — | (66,678 | ) | (69,133 | ) | (71,680 | ) | (74,320 | ) | |||||||||||
|
|
|
|
|
|
|
|
|
| |||||||||||
Portfolio Total | (13,413 | ) | (81,319 | ) | (84,093 | ) | (81,215 | ) | (84,058 | ) | ||||||||||
|
|
|
|
|
|
|
|
|
| |||||||||||
Total impact on Revenue up to and including 2023-24 Budget Update | (13,413 | ) | (81,319 | ) | (84,093 | ) | (81,215 | ) | (84,058 | ) | ||||||||||
29
Budget Measures 2024-25
Revenue measures since 2023-24 Budget Update | 2023-24 $‘000 | 2024-25 $‘000 | 2025-26 $‘000 | 2026-27 $‘000 | 2027-28 $‘000 | |||||||||||||||
Department of Agriculture and Fisheries | ||||||||||||||||||||
Restructure of Commercial Fishing Licence Fees as part of Future Fisheries | (840 | ) | (1,540 | ) | (1,540 | ) | (1,540 | ) | (1,560 | ) | ||||||||||
|
|
|
|
|
|
|
|
|
| |||||||||||
Portfolio Total | (840 | ) | (1,540 | ) | (1,540 | ) | (1,540 | ) | (1,560 | ) | ||||||||||
|
|
|
|
|
|
|
|
|
| |||||||||||
Department of Transport and Main Roads | ||||||||||||||||||||
Public Transport Temporary Fare Reduction | — | (150,000 | ) | — | — | — | ||||||||||||||
Motor Vehicle Registration Fee Reduction | — | (399,000 | ) | (36,000 | ) | — | — | |||||||||||||
|
|
|
|
|
|
|
|
|
| |||||||||||
Portfolio Total | — | (549,000 | ) | (36,000 | ) | — | — | |||||||||||||
|
|
|
|
|
|
|
|
|
| |||||||||||
Queensland Treasury | ||||||||||||||||||||
Queensland Revenue Office - Revenue and Penalty Debt Administration and Resourcing | — | 211,800 | 231,600 | 252,500 | 274,200 | |||||||||||||||
Land Tax Surcharge for Foreign Companies and Trustees of Foreign Trusts, and Absentees | — | 74,500 | 81,300 | 87,000 | 90,400 | |||||||||||||||
Additional Foreign Acquirer Duty Increase | — | 20,200 | 22,100 | 23,000 | 24,400 | |||||||||||||||
Changes to Regional Payroll Tax Discount Eligibility | — | 5,000 | 5,000 | 5,000 | 5,000 | |||||||||||||||
50 Per Cent Payroll Tax Rebate for Apprentices and Trainees Extension | — | (54,900 | ) | — | — | — | ||||||||||||||
Increased First Home Buyer Transfer Duty Concession Thresholds | — | (90,000 | ) | (90,000 | ) | (90,000 | ) | (90,000 | ) | |||||||||||
|
|
|
|
|
|
|
|
|
| |||||||||||
Portfolio Total | — | 166,600 | 250,000 | 277,500 | 304,000 | |||||||||||||||
|
|
|
|
|
|
|
|
|
| |||||||||||
Total decisions made but not yet announced | — | — | — | — | — | |||||||||||||||
Total impact on Revenue since 2023-24 Budget Update | (840 | ) | (383,940 | ) | 212,460 | 275,960 | 302,440 | |||||||||||||
Total impact on Revenue since the 2023-24 Budget | (14,253 | ) | (465,259 | ) | 128,367 | 194,745 | 218,382 | |||||||||||||
30
Budget Measures 2024-25
| 2 | Expense Measures |
Introduction
The following tables present the relevant portfolio expense measures relating to decisions taken since the 2023–24 Budget. This does not represent the full amount of additional funding provided to agencies since the 2023–24 Budget. For further explanation, refer to Explanation of Scope and Terms in Chapter 1.
31
Budget Measures 2024-25
Department of Agriculture and Fisheries
| 2023-24 $‘000 | 2024-25 $‘000 | 2025-26 $‘000 | 2026-27 $‘000 | 2027-28 $‘000 | ||||||||||||||||
Backing Bush Communities Fund - Invasive Species Management | 1,679 | 4,892 | 4,693 | 736 | — | |||||||||||||||
The government is providing additional funding of $12 million over 4 years to build rural and regional capacity and resilience to proactively manage biosecurity threats. This includes assisting local governments to manage invasive pests, providing exclusion fencing grants, enhancing biosecurity surveillance, increasing traceability, helping maintain the Wild Dog Barrier Fence and providing agribusiness digital solutions grants.
This forms part of the government’s total funding of $30 million over 4 years for the Backing Bush Communities Fund towards workforce training, invasive species management and community projects.
Further details can be found in the Department of Tourism and Sport section of this chapter.
| 2023-24 $‘000 | 2024-25 $‘000 | 2025-26 $‘000 | 2026-27 $‘000 | 2027-28 $‘000 | ||||||||||||||||
Rural Economic Development Grants Program | — | 3,300 | — | — | — | |||||||||||||||
The government is providing increased funding of $3.3 million in 2024-25 to increase regional employment and agribusiness development in regional Queensland.
32
Budget Measures 2024-25
| 2023-24 $‘000 | 2024-25 $‘000 | 2025-26 $‘000 | 2026-27 $‘000 | 2027-28 $‘000 | ||||||||||||||||
Native Title and State-owned Quarry Materials | — | 3,000 | — | — | — | |||||||||||||||
The government is providing additional funding of $3 million in 2024-25 to negotiate Indigenous Land Use Agreements to validly address native title when supplying state-owned quarry materials.
| 2023-24 $‘000 | 2024-25 $‘000 | 2025-26 $‘000 | 2026-27 $‘000 | 2027-28 $‘000 | ||||||||||||||||
Backing Bush Communities Fund - Workforce Training | 1,960 | 2,701 | 2,382 | 957 | — | |||||||||||||||
The government is providing additional funding of $8 million over 4 years for workforce training initiatives to be delivered by the Queensland Farmers’ Federation, its members and AgForce, to upskill Queensland’s agricultural workforce.
This forms part of the government’s total funding of $30 million over 4 years for the Backing Bush Communities Fund towards workforce training, invasive species management and community projects.
Further details can be found in the Department of Tourism and Sport section of this chapter.
| 2023-24 $‘000 | 2024-25 $‘000 | 2025-26 $‘000 | 2026-27 $‘000 | 2027-28 $‘000 | ||||||||||||||||
Dangerous Dogs Laws | 895 | 2,651 | 1,983 | 816 | 921 | |||||||||||||||
The government is providing additional funding of $7.3 million over 5 years, which will provide more coordinated, consistent and effective government action in response to dog attacks. This includes a strong community education campaign designed to build awareness, prevent harm and provide targeted support for dog management initiatives in First Nations communities.
33
Budget Measures 2024-25
| 2023-24 $‘000 | 2024-25 $‘000 | 2025-26 $‘000 | 2026-27 $‘000 | 2027-28 $‘000 | ||||||||||||||||
Strengthening Enforcement and Prosecution Services to Safeguard Animal Welfare | — | 1,931 | — | — | — | |||||||||||||||
The government is providing increased funding of $1.9 million in 2024-25 to provide a contribution to the RSPCA for animal welfare enforcement activities and upgrade of systems to support the RSPCA’s regulatory activities.
| 2023-24 $‘000 | 2024-25 $‘000 | 2025-26 $‘000 | 2026-27 $‘000 | 2027-28 $‘000 | ||||||||||||||||
Strengthening Leadership Across Queensland’s and Australia’s Biosecurity Systems | — | 1,625 | 1,625 | 1,625 | 1,625 | |||||||||||||||
The government is providing additional funding of $6.5 million over 4 years and $1.6 million per annum ongoing for stronger enforcement and evidence-related initiatives to improve biosecurity leadership, including prosecutorial, enforcement, investigative and intelligence capabilities.
| 2023-24 $‘000 | 2024-25 $‘000 | 2025-26 $‘000 | 2026-27 $‘000 | 2027-28 $‘000 | ||||||||||||||||
Rural Financial Counsellors | — | 1,200 | 1,200 | — | — | |||||||||||||||
The government is providing increased funding of $2.4 million over 2 years to continue services to primary producers in financial difficulty due to drought and disasters. This is conditional on matching funding from the Australian Government.
34
Budget Measures 2024-25
| 2023-24 $‘000 | 2024-25 $‘000 | 2025-26 $‘000 | 2026-27 $‘000 | 2027-28 $‘000 | ||||||||||||||||
Collective Action to Manage Varroa Destructor Through Shared Responsibility | — | 771 | 134 | 1,485 | — | |||||||||||||||
The government is providing additional funding of $2.4 million over 3 years for the collective action to manage Varroa destructor through shared responsibility.
In addition, funding of $3.1 million over 3 years is being provided to manage Varroa destructor (released from centrally held funds that were initially allocated to the National Biosecurity System).
Total funding for this program is $5.5 million over 3 years from 2024-25.
| 2023-24 $‘000 | 2024-25 $‘000 | 2025-26 $‘000 | 2026-27 $‘000 | 2027-28 $‘000 | ||||||||||||||||
Queensland Boating and Fisheries Officers | — | 392 | 402 | 426 | 468 | |||||||||||||||
The government is providing additional funding of $1.7 million over 4 years and $457,000 per annum ongoing for authorised field officer positions to support stations in Weipa and Karumba.
| 2023-24 $‘000 | 2024-25 $‘000 | 2025-26 $‘000 | 2026-27 $‘000 | 2027-28 $‘000 | ||||||||||||||||
Drought Mapping Tools | — | — | — | — | — | |||||||||||||||
Funding of $800,000 in 2024-25 is being met internally by the department to support the initial development of improved drought mapping tools, which will consider various factors to determine if an area is impacted by drought.
This forms part of the government’s total funding of $1.6 million in 2024-25 for the initial development of improved drought mapping tools. The associated expense in the Department of Environment, Science and Innovation is $183,000, which is also being met internally by that department.
Further details can be found in the Department of Energy and Climate section of this chapter.
35
Budget Measures 2024-25
| 2023-24 $‘000 | 2024-25 $‘000 | 2025-26 $‘000 | 2026-27 $‘000 | 2027-28 $‘000 | ||||||||||||||||
Drought Preparedness Grants Program | 7,000 | — | — | — | — | |||||||||||||||
The government has provided increased funding of $7 million in 2023-24 to assist eligible primary producers purchase on-farm capital improvements identified in their Farm Business Resilience Plan, improving the drought preparedness of the producer’s property.
Future drought assistance arrangements will be considered by the government in response to the Burke Review and the Australian Government’s Future Drought Fund Investment Strategy (2024 to 2028) expected to be released in mid-2024.
36
Budget Measures 2024-25
Department of Child Safety, Seniors and Disability Services
| 2023-24 $‘000 | 2024-25 $‘000 | 2025-26 $‘000 | 2026-27 $‘000 | 2027-28 $‘000 | ||||||||||||||||
Carer Allowance for Foster and Kinship Carers | — | 42,636 | 46,478 | 49,182 | 52,539 | |||||||||||||||
The government is providing increased funding of $190.8 million over 4 years and $52.5 million per annum ongoing to ensure that care allowance payments reflect eligibility based on the Child Strengths and Needs Assessment including High Support Needs Allowances and Complex Support Needs Allowances.
| 2023-24 $‘000 | 2024-25 $‘000 | 2025-26 $‘000 | 2026-27 $‘000 | 2027-28 $‘000 | ||||||||||||||||
Future delivery of Accommodation Support Services | — | 14,658 | 14,784 | 15,708 | 13,663 | |||||||||||||||
The government is providing increased funding of $58.8 million over 4 years and $13.7 million per annum ongoing to continue the provision of Accommodation Services allowing for continuity of care for people with a disability ($48.8 million over 4 years and $13.7 million per annum ongoing) and to support the department to continue to operate as a registered National Disability Insurance Scheme provider ($10 million over 3 years).
| 2023-24 $‘000 | 2024-25 $‘000 | 2025-26 $‘000 | 2026-27 $‘000 | 2027-28 $‘000 | ||||||||||||||||
Continuity of Disability Supports for Children with Autism in Queensland | — | 7,000 | 500 | — | — | |||||||||||||||
The government is providing additional funding of $7.5 million over 2 years to continue disability supports for children with autism in Queensland. This includes $6.5 million over 2 years for AEIOU Foundation as a contribution towards infrastructure projects. It also includes $1 million in 2024-25 for Autism Queensland to continue to enable a greater focus on early intervention services for children with autism in line with the agreed establishment of a foundational supports system.
This initiative is part of over $160 million provisioned towards a package of disability reforms as an initial response to the recommendations of the Royal Commission into Violence, Abuse, Neglect and Exploitation of People with Disability and the NDIS review.
37
Budget Measures 2024-25
| 2023-24 $‘000 | 2024-25 $‘000 | 2025-26 $‘000 | 2026-27 $‘000 | 2027-28 $‘000 | ||||||||||||||||
Disability Advocacy | 539 | 6,078 | 1,078 | 1,078 | 1,078 | |||||||||||||||
The government is providing increased funding of $9.9 million over 5 years and $1.1 million per annum ongoing for disability advocacy. This includes $4.9 million over 5 years and $1.1 million per annum ongoing to continue the Queensland Disability Advocacy Program. It also includes $5 million in 2024-25 to expand individual and systemic advocacy. Funding will support Queenslanders with disability to understand their rights, navigate service systems, address discrimination, conflict and unfair treatment, make informed decisions, safeguard well-being and build capacity to self-advocate.
This initiative is part of over $160 million provisioned towards a package of disability reforms as an initial response to the recommendations of the Royal Commission into Violence, Abuse, Neglect and Exploitation of People with Disability and the NDIS review.
| 2023-24 $‘000 | 2024-25 $‘000 | 2025-26 $‘000 | 2026-27 $‘000 | 2027-28 $‘000 | ||||||||||||||||
Unify Program - Continuous Improvement Pipeline | — | 5,719 | 7,861 | 6,826 | 7,319 | |||||||||||||||
The government is providing increased funding of $27.7 million over 4 years and $7.3 million per annum ongoing to support the Unify system, the new contemporary integrated case and client management system for all children who come in contact with the child protection and youth justice systems in Queensland. Funding will meet increased licensing costs and support the gradual ramp down of current program resourcing to enable the delivery of high-priority business needs that were not in scope for the first functional release in Tranche 1.
The capital component to this measure can be found in Chapter 3 Capital measures.
38
Budget Measures 2024-25
| 2023-24 $‘000 | 2024-25 $‘000 | 2025-26 $‘000 | 2026-27 $‘000 | 2027-28 $‘000 | ||||||||||||||||
Child and Family Services - Extended Post Care Support | 490 | 5,423 | 7,985 | 9,969 | 7,909 | |||||||||||||||
The government is providing increased funding of $31.8 million over 5 years and $7.9 million per annum ongoing to ensure support is provided for all children exiting care between the ages of 18 and 21 and to index the Living Independently Allowance in line with the Consumer Price Index.
| 2023-24 $‘000 | 2024-25 $‘000 | 2025-26 $‘000 | 2026-27 $‘000 | 2027-28 $‘000 | ||||||||||||||||
Disability Strategic Leadership | — | 3,349 | 4,574 | 3,913 | 3,304 | |||||||||||||||
The government is providing increased funding of $15.1 million over 4 years and $3.3 million per annum ongoing to support strategic leadership, implementation and monitoring of disability reforms.
This initiative is part of over $160 million provisioned towards a package of disability reforms as an initial response to the recommendations of the Royal Commission into Violence, Abuse, Neglect and Exploitation of People with Disability and the NDIS review.
| 2023-24 $‘000 | 2024-25 $‘000 | 2025-26 $‘000 | 2026-27 $‘000 | 2027-28 $‘000 | ||||||||||||||||
Reform of Queensland’s Positive Behaviour Support and Restrictive Practices - Authorisation Framework | — | 2,967 | 3,056 | 3,132 | 3,210 | |||||||||||||||
The government is providing increased funding of $12.4 million over 4 years and $3.2 million per annum ongoing to meet demand under the current Positive Behaviour Support and Restrictive Practices authorisation framework, with a further $20.1 million over 4 years (in both expense and capital funding) held centrally to support reform of the authorisation framework.
39
Budget Measures 2024-25
| 2023-24 $‘000 | 2024-25 $‘000 | 2025-26 $‘000 | 2026-27 $‘000 | 2027-28 $‘000 | ||||||||||||||||
Strengthening Community Cohesion in Queensland | — | 2,907 | 2,907 | — | — | |||||||||||||||
The government is providing increased funding of $5.8 million over 2 years to expand support under the Asylum Seeker and Refugee Assistance Program ($4.8 million over 2 years) and broaden engagement with children through the Queensland Program of Assistance to Survivors of Torture and Trauma ($1 million over 2 years).
| 2023-24 $‘000 | 2024-25 $‘000 | 2025-26 $‘000 | 2026-27 $‘000 | 2027-28 $‘000 | ||||||||||||||||
Family Reunification | — | 2,863 | 2,867 | — | — | |||||||||||||||
The government is providing additional funding of $5.7 million over 2 years to design, implement and procure a family reunification pilot service targeted at children aged 12 to 15 years.
This initiative is part of the $1.28 billion Community Safety Plan for Queensland.
| 2023-24 $‘000 | 2024-25 $‘000 | 2025-26 $‘000 | 2026-27 $‘000 | 2027-28 $‘000 | ||||||||||||||||
Child Protection Litigation Model | — | 2,557 | — | — | — | |||||||||||||||
The government is providing increased funding of $2.6 million in 2024-25 for the Office of the Child and Family Official Solicitor for legal services to deliver critical capacity enhancements to the current Child Protection Litigation Model to manage the increasing volume and complexity of child protection cases being considered by the court.
This forms part of the government’s total increased funding of $7.1 million in 2024-25 for the Child Protection Litigation Model to assist in responding to the increasing number of court ordered conferences and the increased volume of cases being considered by the court.
40
Budget Measures 2024-25
| 2023-24 $‘000 | 2024-25 $‘000 | 2025-26 $‘000 | 2026-27 $‘000 | 2027-28 $‘000 | ||||||||||||||||
Supporting Families, Changing Futures (ICT Digital Applications) | — | 1,701 | 1,779 | 1,880 | 1,988 | |||||||||||||||
The government is providing increased funding of $7.3 million over 4 years and $2 million per annum ongoing for the continuation of digital applications established through Supporting Families Changing Futures. These applications provide key systemic functions within the child protection system providing a platform which is current, accessible and responsive to children, young people, foster and kinship carers and other stakeholders. The efficient and effective mechanisms provided through these applications strengthen client experiences allowing seamless sharing of information required for the provision of direct care of children and young people.
| 2023-24 $‘000 | 2024-25 $‘000 | 2025-26 $‘000 | 2026-27 $‘000 | 2027-28 $‘000 | ||||||||||||||||
African Villages (Youth and Community) | — | 1,300 | 1,300 | — | — | |||||||||||||||
The government is providing additional funding of $2.6 million over 2 years to support the African Youth Support Council’s African Villages in Moorooka, Geebung and Redbank Plains. These villages build a sense of belonging, identity, establish strategic partnerships, engage with the system and build positive relationships in safe spaces for African youth and community members.
This initiative is part of the $1.28 billion Community Safety Plan for Queensland.
| 2023-24 $‘000 | 2024-25 $‘000 | 2025-26 $‘000 | 2026-27 $‘000 | 2027-28 $‘000 | ||||||||||||||||
Disability Stakeholder Engagement Strategy | 300 | 1,300 | 1,300 | 1,300 | 1,300 | |||||||||||||||
The government is providing increased funding of $5.5 million over 5 years and $300,000 per annum ongoing for stakeholder engagement activities to develop and implement responses to the National Disability Insurance Scheme (NDIS) review and recommendations of the Royal Commission into Violence, Abuse, Neglect and Exploitation of People with Disability ($4.3 million over 5 years) and for the continuation of the delivery of languages services ($1.2 million over 4 years and $300,000 per annum ongoing).
This initiative is part of over $160 million provisioned towards a package of disability reforms as an initial response to the recommendations of the Royal Commission into Violence, Abuse, Neglect and Exploitation of People with Disability and the NDIS review.
41
Budget Measures 2024-25
| 2023-24 $‘000 | 2024-25 $‘000 | 2025-26 $‘000 | 2026-27 $‘000 | 2027-28 $‘000 | ||||||||||||||||
National Disability Insurance Scheme (NDIS) Worker Screening | 354 | 734 | — | — | — | |||||||||||||||
The government is providing increased funding of $1.1 million over 2 years for additional resourcing to assist in managing increased demand for the National Disability Insurance Scheme Worker Screening program.
| 2023-24 $‘000 | 2024-25 $‘000 | 2025-26 $‘000 | 2026-27 $‘000 | 2027-28 $‘000 | ||||||||||||||||
Physical and Sexual Abuse Insurance, Out of Home Care and Youth Homelessness Services | — | 623 | — | — | — | |||||||||||||||
The government is providing additional funding of $623,000 in 2024-25 to support development of a long-term indemnity scheme and scoping of an appropriate record keeping system. This is in response to the withdrawal of physical and sexual abuse insurance cover for funded out-of-home care and youth homelessness providers.
| 2023-24 $‘000 | 2024-25 $‘000 | 2025-26 $‘000 | 2026-27 $‘000 | 2027-28 $‘000 | ||||||||||||||||
Disability Data Improvement Project | — | 526 | 1,155 | 1,163 | 956 | |||||||||||||||
The government is providing additional funding of $3.8 million over 4 years and $360,000 per annum ongoing for increasing data analysis and reporting capability for Queensland’s disability data holdings.
This initiative is part of over $160 million provisioned towards a package of disability reforms as an initial response to the recommendations of the Royal Commission into Violence, Abuse, Neglect and Exploitation of People with Disability and the NDIS review.
42
Budget Measures 2024-25
| 2023-24 $‘000 | 2024-25 $‘000 | 2025-26 $‘000 | 2026-27 $‘000 | 2027-28 $‘000 | ||||||||||||||||
Australian South Sea Islander Peoples Support Plan | — | 190 | 190 | — | — | |||||||||||||||
The government is providing increased funding of $380,000 over 2 years to enable the Queensland United Australian South Sea Islander Council to continue to represent Australian South Sea Islander community organisations in a viable financial position and be fully independent by 30 June 2026.
| 2023-24 $‘000 | 2024-25 $‘000 | 2025-26 $‘000 | 2026-27 $‘000 | 2027-28 $‘000 | ||||||||||||||||
Child and Family Services - Out of Home Care | 212,300 | — | — | — | — | |||||||||||||||
The government has provided increased funding of $212.3 million in 2023-24 for out-of-home care services in response to ongoing pressures in the child protection system.
43
Budget Measures 2024-25
Department of Education
| 2023-24 $‘000 | 2024-25 $‘000 | 2025-26 $‘000 | 2026-27 $‘000 | 2027-28 $‘000 | ||||||||||||||||
Investment in our State Education System | 178,240 | 395,646 | 246,892 | 55,601 | 172,977 | |||||||||||||||
The government is providing increased funding of over $1 billion over 5 years from 2023-24 to support delivery of a high performing state school education system.
This funding will deliver more teachers and teacher aides to support delivery of the government’s education strategy for state schools Equity and Excellence: realising the potential of every student. Funding will also help to improve outcomes for priority cohorts, including delivering reasonable adjustments for students with a disability.
Total government funding for state school education will continue to grow over the forward estimates, rising each year from $12.633 billion in 2024-25 to $13.170 billion in 2027-28. The Queensland Government is currently in negotiations with the Australian Government to deliver secure, sustainable long-term funding for Queensland schools as part of a next National School Reform Agreement.
| 2023-24 $‘000 | 2024-25 $‘000 | 2025-26 $‘000 | 2026-27 $‘000 | 2027-28 $‘000 | ||||||||||||||||
State School Infrastructure Renewal | 21,077 | 78,683 | — | — | — | |||||||||||||||
The government is providing increased funding of $99.8 million over 2 years for the maintenance of state school buildings and grounds.
44
Budget Measures 2024-25
| 2023-24 $‘000 | 2024-25 $‘000 | 2025-26 $‘000 | 2026-27 $‘000 | 2027-28 $‘000 | ||||||||||||||||
Capital Assistance Supplementary Scheme for Non-State Schools | — | 60,000 | — | — | — | |||||||||||||||
The government is providing increased funding of $60 million in 2024-25 to continue the Capital Assistance Supplementary Scheme assisting non-state schools with the cost of building or upgrading educational facilities.
| 2023-24 $‘000 | 2024-25 $‘000 | 2025-26 $‘000 | 2026-27 $‘000 | 2027-28 $‘000 | ||||||||||||||||
Sustainable Investment in Schools | — | 40,000 | 42,000 | 42,000 | 42,000 | |||||||||||||||
The government is providing increased funding of $166 million over 4 years to prioritise delivery and planning of high-quality learning environments to meet enrolment needs including, where necessary, safety and accessibility upgrades to ensure the availability of safe and accessible school facilities for all students and teachers.
Total funding for this initiative is $500 million over 4 years. The capital component of this measure can be found in Chapter 3 Capital Measures.
| 2023-24 $‘000 | 2024-25 $‘000 | 2025-26 $‘000 | 2026-27 $‘000 | 2027-28 $‘000 | ||||||||||||||||
Preventing Youth Justice Involvement Through Educational Engagement | 8,530 | 37,642 | 46,571 | 49,147 | 53,477 | |||||||||||||||
The government is providing additional funding of $195.4 million over 5 years for youth engagement activities. This includes $184.7 million over 5 years and $49.4 million per annum ongoing to support a range of youth engagement initiatives and $10.6 million over 5 years, held centrally, for 4 additional Queensland Pathways State College campuses. This initiative will enable the department to lift capacity to support at-risk students across the state acknowledging the increased demand for specialist support.
Total funding for this initiative is $288.2 million over 5 years. The capital component of this measure can be found in Chapter 3 Capital Measures.
45
Budget Measures 2024-25
| 2023-24 $‘000 | 2024-25 $‘000 | 2025-26 $‘000 | 2026-27 $‘000 | 2027-28 $‘000 | ||||||||||||||||
Playgrounds and Tuckshops Program | 4,776 | 13,119 | 15,413 | 2,346 | — | |||||||||||||||
The government is providing increased funding of $35.7 million over 4 years for additional projects under the Playgrounds and Tuckshops Program.
Total funding for this initiative is $101.2 million over 4 years. The capital component of this measure can be found in Chapter 3 Capital Measures.
| 2023-24 $‘000 | 2024-25 $‘000 | 2025-26 $‘000 | 2026-27 $‘000 | 2027-28 $‘000 | ||||||||||||||||
Teacher Housing Leasing Program | — | 11,404 | 15,179 | 18,521 | — | |||||||||||||||
The government is providing increased funding of $45.1 million over 3 years to meet increased demand and costs for teacher accommodation.
| 2023-24 $‘000 | 2024-25 $‘000 | 2025-26 $‘000 | 2026-27 $‘000 | 2027-28 $‘000 | ||||||||||||||||
School Lunch Food Programs | — | 10,655 | — | — | — | |||||||||||||||
The government is providing additional funding of $10.7 million in 2024-25 to deliver food programs in schools from Term 3 of 2024.
This forms part of the $15 million School and Community Food Relief Program, comprised of $10.7 million for the Department of Education, $1.3 million for the Department of Treaty, Aboriginal and Torres Strait Islander Partnerships, Communities and the Arts, and a further $3 million held centrally to support initiatives generated by the School and Community Food Taskforce.
46
Budget Measures 2024-25
| 2023-24 $‘000 | 2024-25 $‘000 | 2025-26 $‘000 | 2026-27 $‘000 | 2027-28 $‘000 | ||||||||||||||||
Wacol Youth Remand Centre | — | 9,355 | 9,582 | 5,386 | — | |||||||||||||||
The government is providing increased funding of $24.3 million over 3 years to deliver educational services for young people while in detention at the Wacol Youth Remand Centre.
This forms part of total additional funding of $149.2 million over 3 years for the Wacol Youth Remand Centre.
This initiative is part of the $1.28 billion Community Safety Plan for Queensland.
| 2023-24 $‘000 | 2024-25 $‘000 | 2025-26 $‘000 | 2026-27 $‘000 | 2027-28 $‘000 | ||||||||||||||||
GPs in Schools | — | 5,033 | 5,178 | 5,327 | 5,481 | |||||||||||||||
The government is providing increased funding of $21.0 million over 4 years to continue to support 50 Queensland state schools with secondary-aged students to provide students with free access to a General Practitioner or alternative primary healthcare provider at school 1 day per week.
| 2023-24 $‘000 | 2024-25 $‘000 | 2025-26 $‘000 | 2026-27 $‘000 | 2027-28 $‘000 | ||||||||||||||||
Promoting Quality and Safety in Early Childhood Education and Care | — | 3,326 | — | — | — | |||||||||||||||
The government is providing increased funding of $3.3 million in 2024-25 to continue to enhance regulation in early childhood education and care services. Regulation aims to ensure children’s health, safety and wellbeing, and supports educational outcomes in early childhood education and care services.
47
Budget Measures 2024-25
| 2023-24 $‘000 | 2024-25 $‘000 | 2025-26 $‘000 | 2026-27 $‘000 | 2027-28 $‘000 | ||||||||||||||||
Homework Centres | — | 2,382 | 2,565 | — | — | |||||||||||||||
The government is providing increased funding of $4.9 million over 2 years to continue to deliver the Homework Centre Programs in schools. This program provides funding for on-site support for students in up to 120 state schools to complete homework outside of school hours.
| 2023-24 $‘000 | 2024-25 $‘000 | 2025-26 $‘000 | 2026-27 $‘000 | 2027-28 $‘000 | ||||||||||||||||
Caboolture Watchhouse Hub | 937 | 1,569 | — | — | — | |||||||||||||||
The government is providing additional funding of $2.5 million over 2 years from 2023-24 (including $618,000 held centrally) to provide services to young people accommodated in the Caboolture Watchhouse Hub.
This forms part of the government’s total funding of $59.3 million over 2 years to provide interim capacity at the Caboolture Watchhouse Hub.
| 2023-24 $‘000 | 2024-25 $‘000 | 2025-26 $‘000 | 2026-27 $‘000 | 2027-28 $‘000 | ||||||||||||||||
Non-State Schools Accreditation Board | 963 | — | — | — | — | |||||||||||||||
The government has provided increased funding of $963,000 in 2023-24 to support the operation of the Non-State Schools Accreditation Board.
Funding of $992,000 in 2024-25 is being met internally by the department to meet the demands of growth and complexity in the non-state school sector.
48
Budget Measures 2024-25
| 2023-24 $‘000 | 2024-25 $‘000 | 2025-26 $‘000 | 2026-27 $‘000 | 2027-28 $‘000 | ||||||||||||||||
Woodford Youth Detention Centre | — | — | 3,203 | 8,037 | — | |||||||||||||||
The government is providing funding of $11.2 million over 2 years from 2025-26 to support the establishment and operation of the Woodford Youth Detention Centre.
A further $222,000 in 2025-26 is being met internally by the department.
This forms part of total additional funding of $261.4 million over 4 years and $89.2 million per annum ongoing to support operations of the Woodford Youth Detention Centre.
This initiative is part of the $1.28 billion Community Safety Plan for Queensland.
49
Budget Measures 2024-25
Department of Employment, Small Business and Training
| 2023-24 $‘000 | 2024-25 $‘000 | 2025-26 $‘000 | 2026-27 $‘000 | 2027-28 $‘000 | ||||||||||||||||
Queensland Skills Strategy 2024-2028 | — | 96,717 | 106,425 | — | — | |||||||||||||||
The government is providing additional funding of $203.1 million over 2 years, as part of a total investment of $370 million, to further strengthen the state’s training system to deliver skills needed to power our economy and provide access to good jobs with better pay for Queenslanders.
The strategy is also Queensland’s roadmap to deliver on the National Skills Agreement, unlocking billions of dollars in areas of national priority, and is a key action under the Good people. Good jobs: Queensland Workforce Strategy 2022-2032.
| 2023-24 $‘000 | 2024-25 $‘000 | 2025-26 $‘000 | 2026-27 $‘000 | 2027-28 $‘000 | ||||||||||||||||
Free TAFE Nursing | 22,050 | 42,050 | 17,050 | — | — | |||||||||||||||
The government is providing additional funding of $81.2 million over 3 years from 2023-24 for 6,500 training places for eligible Queenslanders who are passionate about healthcare to study the Diploma of Nursing for free in 2024 and 2025.
Funding of $46.9 million in 2023-24 has been internally funded by the department to support this initiative.
Queensland Health is contributing another $34.5 million to this initiative from internal resources.
Total funding for the Diploma of Nursing under the Free TAFE initiative is $162.6 million over 3 years from 2023-24.
50
Budget Measures 2024-25
| 2023-24 $‘000 | 2024-25 $‘000 | 2025-26 $‘000 | 2026-27 $‘000 | 2027-28 $‘000 | ||||||||||||||||
TAFE Big Build | — | 24,500 | 25,113 | 25,740 | 26,384 | |||||||||||||||
The government is providing additional funding of $101.7 million over 4 years and $26.4 million per annum ongoing to continue to maintain state-owned TAFE Queensland facilities.
| 2023-24 $‘000 | 2024-25 $‘000 | 2025-26 $‘000 | 2026-27 $‘000 | 2027-28 $‘000 | ||||||||||||||||
Construction Workforce Fund | 500 | 7,400 | 3,100 | — | — | |||||||||||||||
The government is providing additional funding of $11 million over 3 years to support the construction industry workforce to position for the future by funding initiatives to increase the number of apprentices and skilled workers, and address barriers to workforce participation, with guidance from industry.
This forms part of the government’s total funding package of $3.1 billion over 5 years for Homes For Queenslanders, the Queensland Government’s whole-of-system housing plan.
| 2023-24 $‘000 | 2024-25 $‘000 | 2025-26 $‘000 | 2026-27 $‘000 | 2027-28 $‘000 | ||||||||||||||||
Queensland Small Business Strategy 2024-27 | — | 4,262 | 2,762 | 761 | — | |||||||||||||||
The government is providing additional funding of $7.8 million over 3 years to help support small businesses manage the cost of doing business, and build their capability, capacity and resilience.
This forms part of the government’s total investment of over $250 million over 3 years under the Queensland Small Business Strategy 2024-27, which aims to build a thriving, resilient small business sector supporting local jobs and contributing to a strong economy across Queensland.
51
Budget Measures 2024-25
| 2023-24 $‘000 | 2024-25 $‘000 | 2025-26 $‘000 | 2026-27 $‘000 | 2027-28 $‘000 | ||||||||||||||||
Cyber Security Support for Queensland Small to Medium Enterprises | — | 2,500 | 3,750 | 3,750 | — | |||||||||||||||
The government is providing additional funding of up to $10 million, held centrally, over 3 years from 2024-25 to develop and implement cyber security infrastructure for small to medium enterprises, bringing the total allocation to $15 million.
This forms part of the government’s total investment of over $250 million over 3 years under the Queensland Small Business Strategy 2024-27, which aims to build a thriving, resilient small business sector supporting local jobs and contributing to a strong economy across Queensland.
| 2023-24 $‘000 | 2024-25 $‘000 | 2025-26 $‘000 | 2026-27 $‘000 | 2027-28 $‘000 | ||||||||||||||||
Social Enterprise Support and Development | — | 1,900 | — | — | — | |||||||||||||||
The government is providing increased funding of $1.9 million in 2024-25 to continue the Social Enterprise Jobs Fund and Queensland Social Enterprise Council.
This forms part of the government’s total investment of over $250 million over 3 years under the Queensland Small Business Strategy 2024-27, which aims to build a thriving, resilient small business sector supporting local jobs and contributing to a strong economy across Queensland.
| 2023-24 $‘000 | 2024-25 $‘000 | 2025-26 $‘000 | 2026-27 $‘000 | 2027-28 $‘000 | ||||||||||||||||
Mossman Region Community Transition | 150 | 732 | 618 | — | — | |||||||||||||||
The government is providing additional funding of $1.5 million over 3 years to support mill workers transition into new jobs, access training and upskilling and gain counselling support.
This forms part of the government’s total funding of up to $12.1 million over 4 years from 2023-24 to support the Mossman region to transition away from dependence on the Mossman Mill and foster new economic and employment opportunities.
Further details can be found in the Department of State Development and Infrastructure section of this chapter.
52
Budget Measures 2024-25
| 2023-24 $‘000 | 2024-25 $‘000 | 2025-26 $‘000 | 2026-27 $‘000 | 2027-28 $‘000 | ||||||||||||||||
Regional Jobs Expos | 950 | 410 | — | — | — | |||||||||||||||
The government is providing additional funding of $1.4 million over 2 years to deliver the Regional Jobs Expos initiative to showcase current and future employment opportunities.
53
Budget Measures 2024-25
Department of Energy and Climate
| 2023-24 $‘000 | 2024-25 $‘000 | 2025-26 $‘000 | 2026-27 $‘000 | 2027-28 $‘000 | ||||||||||||||||
Queensland Energy and Jobs Plan Implementation | 2,547 | 11,125 | 7,236 | 8,808 | 13,584 | |||||||||||||||
The government is providing additional funding of $43.3 million over 5 years from 2023-24 for government policy priorities under the Queensland Energy and Jobs Plan, including an Office of the SuperGrid, climate action planning, and hydrogen futures.
| 2023-24 $‘000 | 2024-25 $‘000 | 2025-26 $‘000 | 2026-27 $‘000 | 2027-28 $‘000 | ||||||||||||||||
Buy Queensland Procurement: Enabling ICT platform | — | 1,130 | 1,214 | 1,300 | 1,365 | |||||||||||||||
The government is providing additional funding of $5.0 million over 4 years from 2024-25 to fund the ongoing operating costs of the Future Procurement System.
| 2023-24 $‘000 | 2024-25 $‘000 | 2025-26 $‘000 | 2026-27 $‘000 | 2027-28 $‘000 | ||||||||||||||||
Drought Mapping Tools | — | — | — | — | — | |||||||||||||||
Funding of $580,000 in 2024-25 is being met internally by the department to support the initial development of improved drought mapping tools which will consider various factors to determine if an area is impacted by drought.
This forms part of the government’s total funding of $1.6 million in 2024-25 for the initial development of improved drought mapping tools. The associated expense in the Department of Environment, Science and Innovation is $183,000, which is also being met internally by that department.
Further details can be found in the Department of Agriculture and Fisheries section of this chapter.
54
Budget Measures 2024-25
Department of Environment, Science and Innovation
| 2023-24 $‘000 | 2024-25 $‘000 | 2025-26 $‘000 | 2026-27 $‘000 | 2027-28 $‘000 | ||||||||||||||||
Queensland Quantum and Advanced Technologies Strategy | 902 | 26,925 | 31,976 | 22,119 | 1,806 | |||||||||||||||
The government is providing additional funding of $83.7 million over 5 years from 2023-24 to 2027-28 and $1.8 million ongoing to support the implementation of the Queensland Quantum and Advanced Technologies Strategy.
| 2023-24 $‘000 | 2024-25 $‘000 | 2025-26 $‘000 | 2026-27 $‘000 | 2027-28 $‘000 | ||||||||||||||||
Better Queensland Parks - Fire Management Uplift Program | — | 21,080 | — | — | — | |||||||||||||||
The government is providing increased funding of $21.1 million to support critical firefighter needs and manage bushfire risk in a changing climate, improve community safety and safeguard natural and cultural values, including World Heritage values.
The capital component of this measure can be found in Chapter 3 Capital Measures.
| 2023-24 $‘000 | 2024-25 $‘000 | 2025-26 $‘000 | 2026-27 $‘000 | 2027-28 $‘000 | ||||||||||||||||
Waste Package, including the Recycling and Jobs Fund | 8,000 | 8,875 | 12,200 | 8,625 | 210,114 | |||||||||||||||
The government is providing increased funding of $247.8 million over 5 years for continued delivery of the $2.1 billion Waste Package, announced in 2022-23. This includes funding for programs supporting waste management including local government waste management plans and grants to address illegal dumping and $131.4 million in 2027-28 in planned annual payments to councils to ensure no impact on households.
55
Budget Measures 2024-25
| 2023-24 $‘000 | 2024-25 $‘000 | 2025-26 $‘000 | 2026-27 $‘000 | 2027-28 $‘000 | ||||||||||||||||
Saving Queensland’s Koalas | — | 7,497 | 7,716 | 7,935 | 8,157 | |||||||||||||||
The government is providing increased funding of $31.3 million over 4 years and $8.4 million per annum ongoing to continue planned actions under the South East Queensland Koala Conservation Strategy that address the decline in koala populations and preserve and restore key koala habitat.
| 2023-24 $‘000 | 2024-25 $‘000 | 2025-26 $‘000 | 2026-27 $‘000 | 2027-28 $‘000 | ||||||||||||||||
Saving Queensland’s Threatened Species | — | 5,672 | 5,848 | 5,876 | 6,116 | |||||||||||||||
The government is providing increased funding of $23.5 million over 4 years and $6.3 million per annum ongoing to continue implementation of the Threatened Species Program 2020-2040 to protect and recover Queensland’s most threatened flora and fauna.
| 2023-24 $‘000 | 2024-25 $‘000 | 2025-26 $‘000 | 2026-27 $‘000 | 2027-28 $‘000 | ||||||||||||||||
K’gari Dingo Management Enhanced Actions | 2,000 | 3,000 | 3,090 | 3,167 | 3,246 | |||||||||||||||
The government is providing additional funding of $14.5 million over 5 years from 2023-24 (indexed ongoing), with funding to support the conservation of dingoes (wongari) and management of public safety on K’gari through additional Butchulla and Queensland Parks and Wildlife Service wongari education rangers to improve visitor understanding of wongari risks and the cultural significance of wongari to the Butchulla people.
The capital component of this measure can be found in Chapter 3 Capital Measures.
56
Budget Measures 2024-25
| 2023-24 $‘000 | 2024-25 $‘000 | 2025-26 $‘000 | 2026-27 $‘000 | 2027-28 $‘000 | ||||||||||||||||
Revitalising Queensland’s Private Protected Area Program | — | 2,607 | 207 | — | — | |||||||||||||||
The government is providing increased funding of $2.8 million over 2 years to support environmental conservation on private land and implement the Australian Government’s Other Effective Area-Based Conservation Measures.
| 2023-24 $‘000 | 2024-25 $‘000 | 2025-26 $‘000 | 2026-27 $‘000 | 2027-28 $‘000 | ||||||||||||||||
Cape York World Heritage Nomination | — | 1,200 | 1,200 | — | — | |||||||||||||||
The government is providing additional funding of $2.4 million over 2 years, held centrally subject to the Cape York Peninsula being added to Australia’s UNESCO State Party Tentative list, to progress World Heritage Nomination.
| 2023-24 $‘000 | 2024-25 $‘000 | 2025-26 $‘000 | 2026-27 $‘000 | 2027-28 $‘000 | ||||||||||||||||
Queensland Quantum Academy | 730 | 933 | 983 | 984 | 2,370 | |||||||||||||||
The government is providing increased funding of $6 million over 5 years to develop and deliver the Queensland Quantum Academy as part of the Queensland Quantum and Advanced Technologies Strategy to introduce quantum materials and learning opportunities into schools and TAFEs and support the workforce needs of the growing quantum industry.
57
Budget Measures 2024-25
| 2023-24 $‘000 | 2024-25 $‘000 | 2025-26 $‘000 | 2026-27 $‘000 | 2027-28 $‘000 | ||||||||||||||||
Bioregional Planning | — | 926 | 1,052 | — | — | |||||||||||||||
The government is providing additional funding of $2.0 million over 2 years to develop 3 pilot bioregional plans focussed on renewable energy, critical minerals and urban development.
| 2023-24 $‘000 | 2024-25 $‘000 | 2025-26 $‘000 | 2026-27 $‘000 | 2027-28 $‘000 | ||||||||||||||||
Queensland Mine Rehabilitation Commissioner and Supporting Office | — | 878 | 865 | — | — | |||||||||||||||
The government is providing increased funding of $1.7 million over 2 years for the continuation of the Office of Queensland Mine Rehabilitation Commissioner to provide best practice advice and support world class progressive rehabilitation of mined land in Queensland.
58
Budget Measures 2024-25
Department of Housing, Local Government, Planning and Public Works
| 2023-24 $‘000 | 2024-25 $‘000 | 2025-26 $‘000 | 2026-27 $‘000 | 2027-28 $‘000 | ||||||||||||||||
Homes for Queenslanders: a fair and sustainable housing system | 398,727 | 578,722 | 397,880 | 191,794 | 120,651 | |||||||||||||||
The government is providing additional funding of $1.688 billion over 5 years and $130.4 million per annum on-going towards housing and homelessness services and responses, addressing key housing pressures including supply, and enhancing the focus on planning and development outcomes.
The capital component of this measure can be found in Chapter 3 Capital Measures.
This forms part of the government’s total funding package of $3.1 billion over 5 years for Homes for Queenslanders, the Queensland Government’s whole-of-system housing plan.
| 2023-24 $‘000 | 2024-25 $‘000 | 2025-26 $‘000 | 2026-27 $‘000 | 2027-28 $‘000 | ||||||||||||||||
Long-term Sustainability of Queensland’s Indigenous Local Governments | — | 30,800 | 30,800 | — | — | |||||||||||||||
The government is providing increased funding of $61.6 million over 2 years to continue delivery of the needs-based Indigenous Councils funding program and to establish an entity to support Indigenous Councils.
| 2023-24 $‘000 | 2024-25 $‘000 | 2025-26 $‘000 | 2026-27 $‘000 | 2027-28 $‘000 | ||||||||||||||||
Helping Seniors Secure Their Homes | 17,700 | 22,300 | — | — | — | |||||||||||||||
The government is providing increased funding of $40 million over 2 years from 2023-24 to extend the Helping Seniors Secure their Homes Trial to December 2024.
This initiative is part of the $1.28 billion Community Safety Plan for Queensland.
59
Budget Measures 2024-25
| 2023-24 $‘000 | 2024-25 $‘000 | 2025-26 $‘000 | 2026-27 $‘000 | 2027-28 $‘000 | ||||||||||||||||
Social Housing Headleasing | 4,200 | 5,740 | — | — | — | |||||||||||||||
The government is providing increased funding of $9.9 million over 2 years for extension of existing headleases in the Help to Home and Helping Hand Headlease Programs.
| 2023-24 $‘000 | 2024-25 $‘000 | 2025-26 $‘000 | 2026-27 $‘000 | 2027-28 $‘000 | ||||||||||||||||
Local Government Community Safety | — | 5,000 | — | — | — | |||||||||||||||
The government is providing additional funding of $5 million in 2024-25 for administration of the Local Government Community Safety Fund, for security equipment upgrades.
This initiative is part of the $1.28 billion Community Safety Plan for Queensland.
| 2023-24 $‘000 | 2024-25 $‘000 | 2025-26 $‘000 | 2026-27 $‘000 | 2027-28 $‘000 | ||||||||||||||||
Implementation of Shaping SEQ 2023 Update | 2,708 | 4,309 | 1,196 | — | — | |||||||||||||||
The government is providing additional funding of $8.2 million over 3 years to implement the Shaping SEQ 2023 Update, including the delivery of a dedicated Project Management Office.
| 2023-24 $‘000 | 2024-25 $‘000 | 2025-26 $‘000 | 2026-27 $‘000 | 2027-28 $‘000 | ||||||||||||||||
Stage 2 Rental Law Reforms - Residential Tenancies Authority | — | 2,732 | 1,615 | 1,103 | 974 | |||||||||||||||
The government is providing additional funding of $6.4 million over 4 years, held centrally, to successfully implement Stage 2 rental law reforms. This will allow the Residential Tenancies Authority to deliver targeted communication and education to Queensland’s rental sector about changes to rental laws, and enforce and uphold compliance with these laws.
This forms part of the government’s total funding package of $18.5 million over 5 years to implement Stage 2 rental law reforms.
Further details can be found in the Department of Justice and Attorney-General section of this chapter.
60
Budget Measures 2024-25
| 2023-24 $‘000 | 2024-25 $‘000 | 2025-26 $‘000 | 2026-27 $‘000 | 2027-28 $‘000 | ||||||||||||||||
Strengthening and Sustaining Court Reforms Tackling Youth and Adult Crime | — | 493 | 802 | — | — | |||||||||||||||
The government is providing additional funding of $1.3 million over 2 years for focused housing and tenancy sustainment support for participants of the Court Link Program.
This initiative is part of the $1.28 billion Community Safety Plan for Queensland.
| 2023-24 $‘000 | 2024-25 $‘000 | 2025-26 $‘000 | 2026-27 $‘000 | 2027-28 $‘000 | ||||||||||||||||
Immediate Housing Response for Families | 23,200 | — | — | — | — | |||||||||||||||
The government has provided increased funding of $23.2 million for emergency accommodation for families experiencing homelessness.
| 2023-24 $‘000 | 2024-25 $‘000 | 2025-26 $‘000 | 2026-27 $‘000 | 2027-28 $‘000 | ||||||||||||||||
Works for Queensland | — | — | 20,000 | 80,000 | — | |||||||||||||||
The government will provide additional funding of $100 million over 2 years for the 2024-27 Works for Queensland grant program, bringing total funding for this grant round to $300 million.
61
Budget Measures 2024-25
Department of Justice and Attorney-General
| 2023-24 $‘000 | 2024-25 $‘000 | 2025-26 $‘000 | 2026-27 $‘000 | 2027-28 $‘000 | ||||||||||||||||
Support for Victims of Crime | 32,125 | 57,386 | 53,202 | 45,545 | 45,696 | |||||||||||||||
The government is providing increased funding of $234 million over 5 years and $45.7 million per annum ongoing to Victims Assist Queensland to support victims of crime.
The capital component of this measure can be found in Chapter 3 Capital Measures.
| 2023-24 $‘000 | 2024-25 $‘000 | 2025-26 $‘000 | 2026-27 $‘000 | 2027-28 $‘000 | ||||||||||||||||
Support for the domestic, family and sexual violence sector | — | 34,374 | 38,289 | 38,345 | 38,403 | |||||||||||||||
The government is providing increased funding of $149.4 million over 4 years and $38.4 million per annum ongoing to support the domestic, family and sexual violence sector. A further $5 million is being internally funded by the department in 2024-25.
For this initiative, $31 million in new funding and $5 million internally funded for the 20 per cent uplift in funding in 2024-25 forms part of the $1.28 billion Community Safety Plan for Queensland.
| 2023-24 $‘000 | 2024-25 $‘000 | 2025-26 $‘000 | 2026-27 $‘000 | 2027-28 $‘000 | ||||||||||||||||
Supporting the community legal sector | — | 24,642 | 441 | 458 | 475 | |||||||||||||||
The government is providing increased funding of $22.6 million in 2024-25 including $12.4 million for the Community Legal Centres and $10.2 million for the Aboriginal and Torres Strait Islander Legal Service. In addition, the government is providing increased funding of $2 million in 2024-25 and $441,000 from 2025-26 indexed ongoing for costs associated with replacing the Community Legal Assistance Services system.
This initiative is part of the $1.28 billion Community Safety Plan for Queensland.
62
Budget Measures 2024-25
| 2023-24 $‘000 | 2024-25 $‘000 | 2025-26 $‘000 | 2026-27 $‘000 | 2027-28 $‘000 | ||||||||||||||||
Supporting Court Reforms Tackling Youth and Adult Crime | — | 16,693 | 18,618 | — | — | |||||||||||||||
The government is providing increased funding of $35.3 million over 2 years ($7.5 million of this is centrally held) to strengthen and support court reform initiatives to address increases in adult and youth crime. This includes $8.4 million over 2 years for Legal Aid Queensland.
This initiative is part of the $1.28 billion Community Safety Plan for Queensland.
| 2023-24 $‘000 | 2024-25 $‘000 | 2025-26 $‘000 | 2026-27 $‘000 | 2027-28 $‘000 | ||||||||||||||||
Commission of Inquiry - Forensic DNA Testing | 13,496 | 15,503 | 845 | 861 | 861 | |||||||||||||||
The government is providing additional funding of $31.6 million over 5 years and $861,000 per annum ongoing to support the further implementation of its recommendations from the Commission of Inquiry into Forensic DNA Testing in Queensland. This includes $15 million for Legal Aid Queensland.
This forms part of the government’s total funding package of $202.7 million over 6 years (2022-23 to 2027-28), with a recurrent funding boost of $22.3 million from 2027-28, in response to the Commission of Inquiry into Forensic DNA Testing in Queensland.
| 2023-24 $‘000 | 2024-25 $‘000 | 2025-26 $‘000 | 2026-27 $‘000 | 2027-28 $‘000 | ||||||||||||||||
Victims of Crime Community Response | — | 15,362 | — | — | — | |||||||||||||||
The government is providing additional funding of $15.4 million in 2024-25 to deliver and expand the Victims of Crime Community Response Program to provide immediate support to victims of crime.
This initiative is part of the $1.28 billion Community Safety Plan for Queensland.
63
Budget Measures 2024-25
| 2023-24 $‘000 | 2024-25 $‘000 | 2025-26 $‘000 | 2026-27 $‘000 | 2027-28 $‘000 | ||||||||||||||||
Support for the Queensland Civil and Administrative Tribunal Workforce | 2,046 | 13,940 | 16,702 | 17,288 | 20,078 | |||||||||||||||
The government is providing additional funding of $70.1 million over 5 years and $20.1 million per annum ongoing to the Queensland Civil and Administrative Tribunal to enable a sustainable response to address increasing service demands.
The capital component of this measure can be found in Chapter 3 Capital Measures.
| 2023-24 $‘000 | 2024-25 $‘000 | 2025-26 $‘000 | 2026-27 $‘000 | 2027-28 $‘000 | ||||||||||||||||
Gambling Harm Minimisation | — | 8,060 | 8,060 | 8,060 | 8,060 | |||||||||||||||
The government is providing additional funding of $8.1 million in 2024-25 for a doubling of funding for the Gambling Help Service System. It is intended that increased gambling harm minimisation funding will continue on an ongoing basis.
| 2023-24 $‘000 | 2024-25 $‘000 | 2025-26 $‘000 | 2026-27 $‘000 | 2027-28 $‘000 | ||||||||||||||||
Queensland Women and Girls’ Health Strategy 2032 | 97 | 6,494 | 6,624 | 6,749 | 6,985 | |||||||||||||||
The government is providing additional funding of $26.9 million over 5 years from the Mental Health Levy, to support the development and implementation of the Queensland Women and Girls’ Health Strategy 2032.
This forms part of the government’s total additional funding of $247.9 million over 5 years to support initiatives under the Queensland Women and Girls’ Health Strategy 2032.
Further details can be found in the Queensland Health section of this chapter.
64
Budget Measures 2024-25
| 2023-24 $‘000 | 2024-25 $‘000 | 2025-26 $‘000 | 2026-27 $‘000 | 2027-28 $‘000 | ||||||||||||||||
Safeguarding Vulnerable Children and Adults | — | 5,905 | — | — | — | |||||||||||||||
The government is providing increased funding of $5.9 million in 2024-25 to support the Office of the Public Guardian secure the protection of vulnerable Queensland children and adults with impaired decision-making capacity.
| 2023-24 $‘000 | 2024-25 $‘000 | 2025-26 $‘000 | 2026-27 $‘000 | 2027-28 $‘000 | ||||||||||||||||
Permanently Establish the Justice Reform Office | 842 | 5,892 | 7,823 | 5,046 | 5,198 | |||||||||||||||
The government is providing increased funding of $24.8 million over 5 years and $5.2 million per annum ongoing to support the functions of the Independent Ministerial Advisory Council and develop, test and implement potential reforms, programs and initiatives aimed at reducing demand across the criminal justice system.
| 2023-24 $‘000 | 2024-25 $‘000 | 2025-26 $‘000 | 2026-27 $‘000 | 2027-28 $‘000 | ||||||||||||||||
Domestic and Family Violence Training and Management Framework | 162 | 4,872 | 4,483 | 4,284 | 3,109 | |||||||||||||||
The government is providing additional funding of $16.9 million over 5 years ($23 million over 6 years) to deliver Domestic and Family Violence foundational training modules, including coercive control and legislative change modules, and to establish a state-wide domestic and family violence training and support and coordination service.
Total funding for this initiative is $28.7 million over 5 years ($34.7 million over 6 years), which includes $11.8 million previously held centrally for responses to the Women’s Safety and Justice Taskforce recommendations.
65
Budget Measures 2024-25
| 2023-24 $‘000 | 2024-25 $‘000 | 2025-26 $‘000 | 2026-27 $‘000 | 2027-28 $‘000 | ||||||||||||||||
Child Protection Litigation | — | 4,581 | — | — | — | |||||||||||||||
The government is providing increased funding of $4.6 million in 2024-25. This includes $3.6 million for the Director of Child Protection Litigation for legal services to deliver critical capacity enhancements to the current Child Protection Litigation Model to manage the increasing volume and complexity of child protection cases being considered by the court. It also includes $963,000 for Court Services Queensland and the Dispute Resolution Branch to support an increased volume of court ordered conferences.
This forms part of the government’s total increased funding of $7.1 million in 2024-25 for the Child Protection Litigation Model to assist in responding to increasing number of court ordered conferences and the increased volume of cases being considered by the Court.
Further details can be found in the Department of Child Safety, Seniors and Disability Services section of this chapter.
| 2023-24 $‘000 | 2024-25 $‘000 | 2025-26 $‘000 | 2026-27 $‘000 | 2027-28 $‘000 | ||||||||||||||||
Supporting Escalating Workloads within the District Court of Queensland | 2,321 | 3,654 | 3,766 | 3,863 | 3,967 | |||||||||||||||
The government is providing increased funding of $17.6 million over 5 years and $4 million per annum ongoing to address sustained growth in demand in the criminal justice system.
| 2023-24 $‘000 | 2024-25 $‘000 | 2025-26 $‘000 | 2026-27 $‘000 | 2027-28 $‘000 | ||||||||||||||||
Recording and Transcription Services | — | 3,422 | 3,180 | 13,206 | 13,639 | |||||||||||||||
The government is providing increased funding of $33.4 million over 4 years and $13.6 million per annum ongoing to support the continuation of the court recording and transcription services .
The capital component of this measure can be found in Chapter 3 Capital Measures.
66
Budget Measures 2024-25
| 2023-24 $‘000 | 2024-25 $‘000 | 2025-26 $‘000 | 2026-27 $‘000 | 2027-28 $‘000 | ||||||||||||||||
Donor Conception Register | — | 3,400 | 4,500 | — | — | |||||||||||||||
The government is providing additional funding of $7.9 million over 2 years for the design and build of a donor conception register.
This forms part of the government’s total additional funding of $247.9 million over 5 years to support initiatives under the Queensland Women and Girls’ Health Strategy 2032.
Further details can be found in the Queensland Health section of this chapter.
| 2023-24 $‘000 | 2024-25 $‘000 | 2025-26 $‘000 | 2026-27 $‘000 | 2027-28 $‘000 | ||||||||||||||||
Enhancing the Victim Liaison Service | — | 2,759 | — | — | — | |||||||||||||||
The government is providing increased funding of $2.8 million in 2024-25 to the Office of the Director of Public Prosecutions to support the Victim Liaison Service.
This initiative is part of the $1.28 billion Community Safety Plan for Queensland.
| 2023-24 $‘000 | 2024-25 $‘000 | 2025-26 $‘000 | 2026-27 $‘000 | 2027-28 $‘000 | ||||||||||||||||
Rental Reforms - Stage 2 Rental Law Reform Implementation | 39 | 2,546 | 3,157 | 3,219 | 3,156 | |||||||||||||||
The government is providing additional funding of $12.1 million over 5 years, held centrally, to successfully implement Stage 2 rental law reforms. This will enable the department to continue to resolve minor civil disputes relating to residential tenancy matters for installing modifications and personalisation changes in a way that is fair, just, accessible, quick and inexpensive for tribunal users across Queensland and to provide statutory information and dispute resolution services with regards to rental reforms.
This forms part of the government’s total funding package of $18.5 million over 5 years to implement stage 2 rental law reforms.
Further details can be found in the Department of Housing, Local Government, Planning and Public Works section of this chapter.
67
Budget Measures 2024-25
| 2023-24 $‘000 | 2024-25 $‘000 | 2025-26 $‘000 | 2026-27 $‘000 | 2027-28 $‘000 | ||||||||||||||||
Expansion of the Electronic Monitoring Program - Youth | — | 2,342 | — | — | — | |||||||||||||||
The government is providing increased funding of $2.3 million in 2024-25 to strengthen the court and administrative support provided during the expansion of the youth electronic monitoring program (including $822,000 for Legal Aid Queensland).
This forms part of increased funding of $7 million (increased funding of $3 million and $4 million of centrally held funds) to support the expanded use of electronic monitoring of young offenders.
This initiative is part of the $1.28 billion Community Safety Plan for Queensland.
| 2023-24 $‘000 | 2024-25 $‘000 | 2025-26 $‘000 | 2026-27 $‘000 | 2027-28 $‘000 | ||||||||||||||||
Continuation of the Queensland Intermediary Scheme | — | 2,185 | — | — | — | |||||||||||||||
The government is providing increased funding of $2.2 million in 2024-25 for the continuation of the Queensland Intermediary Scheme to support vulnerable victims through the court process .
This initiative is part of the $1.28 billion Community Safety Plan for Queensland.
| 2023-24 $‘000 | 2024-25 $‘000 | 2025-26 $‘000 | 2026-27 $‘000 | 2027-28 $‘000 | ||||||||||||||||
The Public Trustee of Queensland - Supporting Vulnerable Queenslanders | 10,000 | 1,850 | 1,910 | 1,970 | 1,970 | |||||||||||||||
The government is providing increased funding of $17.7 million over 5 years and $2 million per annum ongoing to support the Public Trustee of Queensland fund strategic customer-focused initiatives.
68
Budget Measures 2024-25
| 2023-24 $‘000 | 2024-25 $‘000 | 2025-26 $‘000 | 2026-27 $‘000 | 2027-28 $‘000 | ||||||||||||||||
Blue Card Review Implementation | — | 1,622 | — | — | — | |||||||||||||||
The government is providing increased funding of $1.6 million in 2024-25 to address the increase in service demand pressures, provide culturally appropriate individual support to First Nations applicants and for community engagement with First Nations organisations and stakeholders.
| 2023-24 $‘000 | 2024-25 $‘000 | 2025-26 $‘000 | 2026-27 $‘000 | 2027-28 $‘000 | ||||||||||||||||
First Nations Justice Office | — | 1,587 | 1,612 | 1,658 | 1,703 | |||||||||||||||
The government is providing increased funding of $6.6 million over 4 years and $1.7 million per annum ongoing to the First Nations Justice Office to make the temporary domestic and family violence focused positions permanent.
| 2023-24 $‘000 | 2024-25 $‘000 | 2025-26 $‘000 | 2026-27 $‘000 | 2027-28 $‘000 | ||||||||||||||||
Support for First Nations Children | — | 1,517 | — | — | — | |||||||||||||||
The government is providing increased funding of $1.5 million in 2024-25 to support the Queensland Family and Child Commission’s First Nations focused work, including continuation of the Young, Black and Proud scholarship program.
This initiative is part of the $1.28 billion Community Safety Plan for Queensland.
69
Budget Measures 2024-25
| 2023-24 $‘000 | 2024-25 $‘000 | 2025-26 $‘000 | 2026-27 $‘000 | 2027-28 $‘000 | ||||||||||||||||
Queensland Courts and Tribunals - Support for Circuit Court Sitting Days | — | 1,100 | 1,175 | 1,254 | 1,336 | |||||||||||||||
The government is providing increased funding of $4.9 million over 4 years and $1.3 million per annum ongoing to support existing circuit court sitting days and associated travel costs.
| 2023-24 $‘000 | 2024-25 $‘000 | 2025-26 $‘000 | 2026-27 $‘000 | 2027-28 $‘000 | ||||||||||||||||
Queensland Human Rights Commission - Sustainable Supporting Functions | 650 | 1,045 | 1,070 | 1,111 | 1,115 | |||||||||||||||
The government is providing increased funding of $5.0 million over 5 years and $1.1 million per annum ongoing to support the operations of the Queensland Human Rights Commission.
| 2023-24 $‘000 | 2024-25 $‘000 | 2025-26 $‘000 | 2026-27 $‘000 | 2027-28 $‘000 | ||||||||||||||||
New Childrens Court for Mount Isa | — | 981 | 995 | 1,023 | 1,051 | |||||||||||||||
The government is providing additional funding of $4.1 million over 4 years and $1.1 million per annum to appoint an additional magistrate to service Mount Isa and other high-risk vulnerable communities in the Gulf of Carpentaria (including $2.4 million for Legal Aid Queensland and $1.651 million for Aboriginal and Torres Strait Islander Legal Services).
This initiative is part of the $1.28 billion Community Safety Plan for Queensland.
70
Budget Measures 2024-25
| 2023-24 $‘000 | 2024-25 $‘000 | 2025-26 $‘000 | 2026-27 $‘000 | 2027-28 $‘000 | ||||||||||||||||
Woodford Youth Detention Centre | — | 960 | 989 | 1,015 | 1,042 | |||||||||||||||
The government is providing additional funding of $4.0 million over 4 years and $1.0 million per annum ongoing to the Office of the Public Guardian to support the operation of the Woodford Youth Detention Centre.
This forms part of total increased funding of $261.4 million over 4 years and $89.2 million per annum ongoing to support operations of the Woodford Youth Detention Centre.
This initiative is part of the $1.28 billion Community Safety Plan for Queensland.
| 2023-24 $‘000 | 2024-25 $‘000 | 2025-26 $‘000 | 2026-27 $‘000 | 2027-28 $‘000 | ||||||||||||||||
Supporting Coronial Justice Reform | — | 853 | 1,005 | 1,032 | 1,055 | |||||||||||||||
The government is providing additional funding of $3.9 million over 4 years and $1.1 million per annum ongoing to manage increased demand and strengthen case management support for the delivery of Coronial Services to Queensland.
| 2023-24 $‘000 | 2024-25 $‘000 | 2025-26 $‘000 | 2026-27 $‘000 | 2027-28 $‘000 | ||||||||||||||||
Accommodation to Support the Domestic and Family Violence Courthouse Upgrade | 395 | 825 | 1,461 | 2,008 | 2,083 | |||||||||||||||
The government is providing additional funding of $6.8 million over 5 years and $2.1 million per annum ongoing to support the enhancement of Queensland Courts to ensure the safety of victims.
The capital component of this measure can be found in Chapter 3 Capital Measures.
71
Budget Measures 2024-25
| 2023-24 $‘000 | 2024-25 $‘000 | 2025-26 $‘000 | 2026-27 $‘000 | 2027-28 $‘000 | ||||||||||||||||
Support increased watchhouse visits | 335 | 678 | 698 | 717 | 737 | |||||||||||||||
The government is providing increased funding of $3.2 million over 5 years and $737,000 per annum ongoing to the Office of the Public Guardian, in response to increased demand related to watchhouse visits.
| 2023-24 $‘000 | 2024-25 $‘000 | 2025-26 $‘000 | 2026-27 $‘000 | 2027-28 $‘000 | ||||||||||||||||
Victims Commissioner and Sexual Violence Case Review Board | — | 665 | 1,993 | 2,020 | 2,074 | |||||||||||||||
The government is providing additional funding of $6.8 million over 4 years and up to $4 million per annum ongoing to establish and support the Office of the Victims Commissioner and the Sexual Violence Case Review Board.
Total funding for these initiatives is $25.1 million over 5 years and up to $4 million per annum ongoing, which includes $18.3 million previously held centrally for responses to the Women’s Safety and Justice Taskforce recommendations. The capital component of this measure can be found in Chapter 3 Capital Measures.
The capital component of this measure can be found in Chapter 3 Capital Measures.
The additional funding for this initiative is part of the $1.28 billion Community Safety Plan for Queensland.
| 2023-24 $‘000 | 2024-25 $‘000 | 2025-26 $‘000 | 2026-27 $‘000 | 2027-28 $‘000 | ||||||||||||||||
Brisbane Supreme and District Court - Courtroom Expansion | — | 614 | 758 | 776 | 441 | |||||||||||||||
The government is providing additional funding of $2.6 million over 4 years to expand courtroom capacity at the Brisbane Supreme and District Court to help mitigate demand on the Beenleigh courthouse.
The capital component of this measure can be found in Chapter 3 Capital Measures.
72
Budget Measures 2024-25
| 2023-24 $‘000 | 2024-25 $‘000 | 2025-26 $‘000 | 2026-27 $‘000 | 2027-28 $‘000 | ||||||||||||||||
Queensland Housing Plan | — | 600 | — | — | — | |||||||||||||||
The government is providing additional funding of $600,000 in 2024-25 to support improved housing outcomes for people with disability experiencing domestic and family violence in Queensland .
This forms part of the government’s total funding package of $3.1 billion over 5 years for Homes For Queenslanders, the Queensland Government’s whole-of-system housing plan.
| 2023-24 $‘000 | 2024-25 $‘000 | 2025-26 $‘000 | 2026-27 $‘000 | 2027-28 $‘000 | ||||||||||||||||
Support for the Child Death Review Board | — | 583 | 590 | 202 | 206 | |||||||||||||||
The government is providing increased funding of $1.6 million over 4 years and $206,000 per annum ongoing to the Queensland Family and Child Commission to support the Child Death Review Board.
| 2023-24 $‘000 | 2024-25 $‘000 | 2025-26 $‘000 | 2026-27 $‘000 | 2027-28 $‘000 | ||||||||||||||||
Support for Courts and Tribunals for Proposed Legislative Reform | — | 409 | 1,656 | 1,245 | — | |||||||||||||||
The government is providing additional funding of $3.3 million over 3 years to support the implementation and operation of legislative proposals and to improve the safety of vulnerable court users.
73
Budget Measures 2024-25
| 2023-24 $‘000 | 2024-25 $‘000 | 2025-26 $‘000 | 2026-27 $‘000 | 2027-28 $‘000 | ||||||||||||||||
Meriba Omasker Kaziw Kazipa (Torres Strait Islander Traditional Child Rearing Practices) Act 2020 - Ongoing Implementation | — | 408 | — | — | — | |||||||||||||||
The government is providing increased funding of $408,000 in 2024-25 for legal assistance services to provide community legal education and support for applicants under the Meriba Omasker Kaziw Kazipa (Torres Strait Islander Traditional Child Rearing Practices) Act 2020.
This forms part of the government’s total funding package of $1.9 million in 2024-25 for this initiative .
Further details can be found in the Department of Treaty, Aboriginal and Torres Strait Islander Partnerships, Communities and the Arts section of this chapter.
| 2023-24 $‘000 | 2024-25 $‘000 | 2025-26 $‘000 | 2026-27 $‘000 | 2027-28 $‘000 | ||||||||||||||||
Supporting the Office of the Information Commissioner | — | 402 | — | — | — | |||||||||||||||
The government is providing increased funding to the Office of the Information Commissioner of $402,000 to fund increased costs of employee expenses.
| 2023-24 $‘000 | 2024-25 $‘000 | 2025-26 $‘000 | 2026-27 $‘000 | 2027-28 $‘000 | ||||||||||||||||
Townsville Courthouse - Courtroom Expansion | — | 162 | 200 | 205 | — | |||||||||||||||
The government is providing additional funding of $567,000 over 3 years to mitigate demand on the Townsville courthouse.
The capital component of this measure can be found in Chapter 3 Capital Measures.
74
Budget Measures 2024-25
| 2023-24 $‘000 | 2024-25 $‘000 | 2025-26 $‘000 | 2026-27 $‘000 | 2027-28 $‘000 | ||||||||||||||||
Engagement with Community Justice Groups & Torres Strait Island Communities | 438 | — | — | — | — | |||||||||||||||
The government has provided increased funding of $438,000 in 2023-24 to support engagement with Community Justice Groups.
| 2023-24 $‘000 | 2024-25 $‘000 | 2025-26 $‘000 | 2026-27 $‘000 | 2027-28 $‘000 | ||||||||||||||||
Independent Review of the Crime and Corruption Commission | 1,029 | — | — | — | — | |||||||||||||||
The government has provided additional funding of $1.0 million in 2023-24 to enable an independent review into issues relating to public reporting by the Crime and Corruption Commission on corruption matters.
| 2023-24 $‘000 | 2024-25 $‘000 | 2025-26 $‘000 | 2026-27 $‘000 | 2027-28 $‘000 | ||||||||||||||||
Video Recorded Evidence-in-Chief Pilot | — | — | — | — | — | |||||||||||||||
The government has approved a 12-month extension of the Video Recorded Evidence-in-Chief pilot in 2024-25, for which funding will be met internally by the department.
75
Budget Measures 2024-25
Department of Regional Development, Manufacturing and Water
| 2023-24 $‘000 | 2024-25 $‘000 | 2025-26 $‘000 | 2026-27 $‘000 | 2027-28 $‘000 | ||||||||||||||||
Regional Water Infrastructure: Cairns Water Security Program | — | 40,000 | 40,000 | 7,500 | — | |||||||||||||||
The government is providing increased funding of $87.5 million over 3 years, held centrally, subject to conditions to complete stage 1 of the Cairns Water Security Program. This brings the total state funding available for this program to $195 million.
| 2023-24 $‘000 | 2024-25 $‘000 | 2025-26 $‘000 | 2026-27 $‘000 | 2027-28 $‘000 | ||||||||||||||||
Make it in Queensland | — | 25,000 | — | — | — | |||||||||||||||
The government is providing increased funding of $25 million in 2024-25 to continue the Made in Queensland grants program and Manufacturing Hubs grant program to assist small and medium-sized manufacturers to increase their international competitiveness, productivity and innovation.
| 2023-24 $‘000 | 2024-25 $‘000 | 2025-26 $‘000 | 2026-27 $‘000 | 2027-28 $‘000 | ||||||||||||||||
Ayr Water Treatment Plant Stage 1 | 10,033 | 20,067 | 16,784 | — | — | |||||||||||||||
The government is providing additional funding of $46.9 million over 3 years to support the Burdekin Shire Council for Stage 1 of a new water treatment plant in Ayr, with $13.4 million held centrally to assist with maintenance and operation costs, to be released when construction is complete.
76
Budget Measures 2024-25
| 2023-24 $‘000 | 2024-25 $‘000 | 2025-26 $‘000 | 2026-27 $‘000 | 2027-28 $‘000 | ||||||||||||||||
Great Artesian Basin Water Security Program | — | 3,829 | 9,202 | 9,422 | 9,547 | |||||||||||||||
The government is providing increased funding of up to $32 million over 4 years, with funding matched by the Australian Government, to continue the successful bore capping program in the Great Artesian Basin to support regional economies and protect cultural and environmental values.
| 2023-24 $‘000 | 2024-25 $‘000 | 2025-26 $‘000 | 2026-27 $‘000 | 2027-28 $‘000 | ||||||||||||||||
Establishment of the Office of the Cross Border Commissioner | 791 | 1,227 | 1,245 | — | — | |||||||||||||||
The government is providing additional funding of $3.3 million over 3 years to establish the Office of the Cross Border Commissioner to lead coordination with the New South Wales Government on issues and opportunities affecting border communities.
| 2023-24 $‘000 | 2024-25 $‘000 | 2025-26 $‘000 | 2026-27 $‘000 | 2027-28 $‘000 | ||||||||||||||||
Hughenden Irrigation Project | — | 825 | 825 | — | — | |||||||||||||||
The government is providing additional funding of $1.7 million over 2 years, with a further $1.1 million from existing resources, for a total of $2.8 million over two years to continue development of the Hughenden Irrigation Project while a review of the Gulf Water Plan and Regional Water Assessment are conducted in the region.
77
Budget Measures 2024-25
| 2023-24 $‘000 | 2024-25 $‘000 | 2025-26 $‘000 | 2026-27 $‘000 | 2027-28 $‘000 | ||||||||||||||||
PFAS Groundwater Monitoring and Modelling | 178 | 665 | 533 | — | — | |||||||||||||||
The government is providing additional funding of $1.4 million over 3 years to undertake groundwater monitoring and modelling of PFAS in the Ayr aquifer.
| 2023-24 $‘000 | 2024-25 $‘000 | 2025-26 $‘000 | 2026-27 $‘000 | 2027-28 $‘000 | ||||||||||||||||
River Improvement Trusts | — | 300 | — | — | — | |||||||||||||||
The government is providing increased funding of $300,000 in 2024-25 to continue operational support to the River Improvement Trusts.
| 2023-24 $‘000 | 2024-25 $‘000 | 2025-26 $‘000 | 2026-27 $‘000 | 2027-28 $‘000 | ||||||||||||||||
Minjerribah Water of Life Program | — | 200 | — | — | — | |||||||||||||||
The government is providing additional funding of $200,000 in 2024-25 to undertake planning work to implement the use of unallocated water reserves in Minjerribah for cultural, economic and care of country outcomes.
| 2023-24 $‘000 | 2024-25 $‘000 | 2025-26 $‘000 | 2026-27 $‘000 | 2027-28 $‘000 | ||||||||||||||||
Fitzroy to Gladstone Pipeline | 365,000 | — | — | — | — | |||||||||||||||
The government has provided increased funding of $365 million in 2023-24 to support the Gladstone Area Water Board to complete construction of the Fitzroy to Gladstone Pipeline and make it operational.
78
Budget Measures 2024-25
Department of Resources
| 2023-24 $‘000 | 2024-25 $‘000 | 2025-26 $‘000 | 2026-27 $‘000 | 2027-28 $‘000 | ||||||||||||||||
Abandoned Mine Lands Program | 1,249 | 22,744 | 21,310 | 21,130 | — | |||||||||||||||
The government is providing increased funding of $66.4 million over 4 years to continue the management and mitigation of significant public health and safety, and environmental risks at high-risk abandoned mine sites.
The capital component of this measure can be found in Chapter 3 Capital measures.
| 2023-24 $‘000 | 2024-25 $‘000 | 2025-26 $‘000 | 2026-27 $‘000 | 2027-28 $‘000 | ||||||||||||||||
Former Great Keppel Island Resort Pty Ltd Lease Areas Remediation | — | 5,000 | — | — | — | |||||||||||||||
The government is providing additional funding of $5 million in 2024-25 to undertake site security and safety works and pest and vegetation management associated with the former Great Keppel Island Resort Pty Ltd lease areas.
| 2023-24 $‘000 | 2024-25 $‘000 | 2025-26 $‘000 | 2026-27 $‘000 | 2027-28 $‘000 | ||||||||||||||||
Indigenous Land Use Agreements Support Package | — | 2,157 | 1,910 | 1,910 | 1,910 | |||||||||||||||
The government is providing additional funding of $7.9 million over 4 years for a package of measures to improve economic and cultural outcomes. This includes contributions to costs incurred by native title groups in the negotiation, authorisation and implementation of Indigenous Land Use Agreements, and support for capacity and capability building in Registered Native Title Body Corporates for land management.
79
Budget Measures 2024-25
| 2023-24 $‘000 | 2024-25 $‘000 | 2025-26 $‘000 | 2026-27 $‘000 | 2027-28 $‘000 | ||||||||||||||||
Natural Hydrogen: Assessment of Queensland’s Potential | — | 1,600 | 2,400 | — | — | |||||||||||||||
The government is providing additional funding of $4 million over 2 years to undertake an assessment of natural hydrogen occurrence and production potential in Queensland.
| 2023-24 $‘000 | 2024-25 $‘000 | 2025-26 $‘000 | 2026-27 $‘000 | 2027-28 $‘000 | ||||||||||||||||
Queensland Resources Common User Facility Operational Readiness | — | 1,480 | 515 | — | — | |||||||||||||||
The government is providing additional funding of $2.0 million over 2 years to support preparations for the operation of the Queensland Resources Common User Facility in Townsville, a key action of the Queensland Resources Industry Development Plan, which also supports the delivery of the Queensland Critical Minerals Strategy.
| 2023-24 $‘000 | 2024-25 $‘000 | 2025-26 $‘000 | 2026-27 $‘000 | 2027-28 $‘000 | ||||||||||||||||
Review of Greenhouse Gas Storage in Queensland | — | 1,000 | — | — | — | |||||||||||||||
The government is providing additional funding of $1 million in 2024-25 to establish an independent Technical Expert Panel to review the safety aspects of greenhouse gas storage for areas outside the Great Artesian Basin.
80
Budget Measures 2024-25
| 2023-24 $‘000 | 2024-25 $‘000 | 2025-26 $‘000 | 2026-27 $‘000 | 2027-28 $‘000 | ||||||||||||||||
Adam’s Beach Camping Amenities | — | 500 | — | — | — | |||||||||||||||
The government is providing additional funding of $500,000 in 2024-25 to support the restoration of camping amenities at the Adam’s Beach camping reserve, which were demolished to allow for the remediation of historical impacts of sand mining.
| 2023-24 $‘000 | 2024-25 $‘000 | 2025-26 $‘000 | 2026-27 $‘000 | 2027-28 $‘000 | ||||||||||||||||
Sunnybank Recreation Reserve | — | 250 | — | — | — | |||||||||||||||
The government is providing additional funding of $250,000 in 2024-25 as the State’s contribution towards upgrade works to carpark and toilet facilities at the Sunnybank Recreation Reserve.
81
Budget Measures 2024-25
Department of State Development and Infrastructure
| 2023-24 $‘000 | 2024-25 $‘000 | 2025-26 $‘000 | 2026-27 $‘000 | 2027-28 $‘000 | ||||||||||||||||
Games Venue and Legacy Delivery Authority | — | 31,200 | 10,000 | 10,000 | 10,800 | |||||||||||||||
The government is providing additional funding of $62 million over 4 years from 2024-25 and $14 million per annum ongoing to 2032-33 for the preparation of additional Project Validation Reports and establishment costs for the Games Venue and Legacy Delivery Authority, to be transferred to the authority once established.
| 2023-24 $‘000 | 2024-25 $‘000 | 2025-26 $‘000 | 2026-27 $‘000 | 2027-28 $‘000 | ||||||||||||||||
Queensland Battery Industry Strategy Implementation | 9,000 | 29,500 | 26,000 | 20,500 | 25,000 | |||||||||||||||
The government is providing additional funding of $110 million over 5 years to lead implementation of the Queensland Battery Industry Strategy (QBIS). QBIS actions will help to deliver the Queensland Government’s community objectives, particularly around supporting jobs that diversify the Queensland economy and build on existing strengths in resources, helping small business to thrive in a changing environment, growing manufacturing and our regions, and investing in the skills of the future.
| 2023-24 $‘000 | 2024-25 $‘000 | 2025-26 $‘000 | 2026-27 $‘000 | 2027-28 $‘000 | ||||||||||||||||
Effective regulation of Queensland workplaces and communities | 7,710 | 21,304 | 21,770 | 22,677 | 23,278 | |||||||||||||||
The government is providing additional funding of $96.7 million over 5 years and $23.6 million per annum ongoing to meet ongoing workplace safety programs and services, electrical safety programs and services, and workers’ compensation services.
82
Budget Measures 2024-25
| 2023-24 $‘000 | 2024-25 $‘000 | 2025-26 $‘000 | 2026-27 $‘000 | 2027-28 $‘000 | ||||||||||||||||
Ground Lease Delivery Model | — | 16,500 | — | — | — | |||||||||||||||
The government is providing additional funding of $16.5 million in 2024-25 to support Economic Development Queensland to investigate delivery of social and affordable housing through public-private partnerships. The government will pilot Ground Lease Delivery Models on 3 priority sites or other identified state-owned sites.
This forms part of the government’s total funding package of $3.1 billion over 5 years for Homes For Queenslanders, the Queensland Government’s whole-of-system housing plan.
| 2023-24 $‘000 | 2024-25 $‘000 | 2025-26 $‘000 | 2026-27 $‘000 | 2027-28 $‘000 | ||||||||||||||||
Mount Isa Transition Fund | — | 10,000 | 10,000 | — | — | |||||||||||||||
The government is providing additional funding of $20 million, held centrally, through the Mount Isa Transition Fund to enable delivery of projects to support job creation for the local workforce, strengthen the economy, liveability and community resilience in Mount Isa in the short-to-medium term.
This forms part of the government’s total funding package of $50 million to support workers affected by the pending closure of Glencore’s Mount Isa copper mine and copper concentrator and the Lady Loretta zinc mine.
Further details on this initiative can be found in the Queensland Treasury section of this chapter.
| 2023-24 $‘000 | 2024-25 $‘000 | 2025-26 $‘000 | 2026-27 $‘000 | 2027-28 $‘000 | ||||||||||||||||
Mossman Region Transition Program | 420 | 4,920 | 4,260 | 1,000 | — | |||||||||||||||
The government is providing additional funding of $4.1 million over 3 years to provide new services towards assistance measures such as a worker transition scheme.
The government is also providing additional funding of up to $6.5 million over 3 years from 2024-25, held centrally, to develop and implement a transition program.
This forms part of the government’s total funding of up to $12.1 million over 4 years from 2023-24 to support mill workers, farmers and the Mossman region transition away from dependence on the Mossman Mill and foster new economic and employment opportunities.
Further details can be found in the Department of Employment, Small Business and Training section of this Chapter.
83
Budget Measures 2024-25
| 2023-24 $‘000 | 2024-25 $‘000 | 2025-26 $‘000 | 2026-27 $‘000 | 2027-28 $‘000 | ||||||||||||||||
Queensland Industrial Relations Commission Funding | 1,854 | 3,139 | 3,182 | 3,226 | 3,259 | |||||||||||||||
The government is providing additional funding of $14.7 million over 5 years and $3.3 million per annum ongoing to meet the increasing complexity of matters brought before the Queensland Industrial Relations Commission.
| 2023-24 $‘000 | 2024-25 $‘000 | 2025-26 $‘000 | 2026-27 $‘000 | 2027-28 $‘000 | ||||||||||||||||
Waraba Priority Development Area | — | 2,500 | — | — | — | |||||||||||||||
The government is providing additional funding of $2.5 million in 2024-25 to support Economic Development Queensland to undertake planning activities required to support the Waraba Priority Development Area declaration.
This forms part of the government’s total funding package of $3.1 billion over 5 years for Homes For Queenslanders, the Queensland Government’s whole-of-system housing plan.
| 2023-24 $‘000 | 2024-25 $‘000 | 2025-26 $‘000 | 2026-27 $‘000 | 2027-28 $‘000 | ||||||||||||||||
Queen’s Wharf Brisbane | — | 1,914 | 1,497 | — | — | |||||||||||||||
The government is providing additional funding of $3.4 million over 2 years for continuing management of development agreements for the Queen’s Wharf Brisbane Integrated Development Project.
84
Budget Measures 2024-25
| 2023-24 $‘000 | 2024-25 $‘000 | 2025-26 $‘000 | 2026-27 $‘000 | 2027-28 $‘000 | ||||||||||||||||
Queensland Energy and Jobs Plan | — | 1,848 | 1,848 | 1,848 | 1,846 | |||||||||||||||
The government is providing additional funding of $7.4 million over 4 years for the Office of the Coordinator-General for an enhanced role in facilitating key energy projects. This forms part of the government’s ongoing implementation of the Queensland Energy and Jobs Plan.
| 2023-24 $‘000 | 2024-25 $‘000 | 2025-26 $‘000 | 2026-27 $‘000 | 2027-28 $‘000 | ||||||||||||||||
Coordinator-General Land and Asset Management | — | 1,300 | 1,450 | 1,600 | 1,700 | |||||||||||||||
The government is providing additional funding of $6.1 million over 4 years and $1.8 million per annum ongoing from 2028-29 for essential land maintenance across Coordinator-General controlled State Development Areas.
| 2023-24 $‘000 | 2024-25 $‘000 | 2025-26 $‘000 | 2026-27 $‘000 | 2027-28 $‘000 | ||||||||||||||||
Place Renewal Framework | 448 | 896 | 896 | — | — | |||||||||||||||
The government is providing additional funding of $2.2 million over 3 years for Economic Development Queensland to create the Place Renewal Framework for the Woolloongabba Place Renewal Area with a commitment to establish it as a self-funded program by the end of 2026.
| 2023-24 $‘000 | 2024-25 $‘000 | 2025-26 $‘000 | 2026-27 $‘000 | 2027-28 $‘000 | ||||||||||||||||
Brisbane 2032 Venue User Displacement | — | — | — | — | — | |||||||||||||||
Centrally held funding has been allocated to manage displacement impacts for existing tenants during the construction of new or upgraded venues under the Venues Program.
85
Budget Measures 2024-25
| 2023-24 $‘000 | 2024-25 $‘000 | 2025-26 $‘000 | 2026-27 $‘000 | 2027-28 $‘000 | ||||||||||||||||
Infill Development Strategy | 1,111 | — | — | — | — | |||||||||||||||
The government has provided additional funding of $1.1 million in 2023-24 to support Economic Development Queensland to identify and bring forward a development facilitation strategy to establish medium scale, mixed use tenure housing projects in key growth areas to support infill development/gentle density via land consolidation, planning and infrastructure.
This forms part of the government’s total funding package of $3.1 billion over 5 years for Homes For Queenslanders, the Queensland Government’s whole-of-system housing plan.
| 2023-24 $‘000 | 2024-25 $‘000 | 2025-26 $‘000 | 2026-27 $‘000 | 2027-28 $‘000 | ||||||||||||||||
Legacy Outcomes - Brisbane 2032 Olympic and Paralympic games | — | — | — | — | — | |||||||||||||||
Centrally held funding has been allocated for a legacy program to support and drive positive, ongoing legacy outcomes as identified in Elevate 2042: Brisbane 2032 Olympic and Paralympic Games Legacy Strategy.
| 2023-24 $‘000 | 2024-25 $‘000 | 2025-26 $‘000 | 2026-27 $‘000 | 2027-28 $‘000 | ||||||||||||||||
River Reach Corridor Walkable Spine | 1,800 | — | — | — | — | |||||||||||||||
The government has provided additional funding of $1.8 million in 2023-24 for Economic Development Queensland to prepare a concept design for the River Reach Corridor Walkable Spine, connecting the Gabba to Roma Street via South Bank and the Cultural Centre.
86
Budget Measures 2024-25
Department of the Premier and Cabinet
| 2023-24 $‘000 | 2024-25 $‘000 | 2025-26 $‘000 | 2026-27 $‘000 | 2027-28 $‘000 | ||||||||||||||||
Policy and Reform Priorities | — | 8,530 | 6,800 | 6,800 | 6,800 | |||||||||||||||
The government is providing funding of $28.9 million over 4 years and $6.8 million per annum ongoing to deliver a range of high priority policy and reform initiatives and a All Hazards Permanent Crisis capability, Queensland Leaders Forum, an enhanced Community Cabinet Program and extension of the Taskforce responsible for supporting the implementation of Putting Queensland Kids First.
| 2023-24 $‘000 | 2024-25 $‘000 | 2025-26 $‘000 | 2026-27 $‘000 | 2027-28 $‘000 | ||||||||||||||||
Establishment of the Implementation Division | — | 3,488 | 3,593 | 3,688 | 3,795 | |||||||||||||||
The government is providing additional funding of $14.6 million over 4 years and $3.8 million per annum ongoing to establish an Implementation Division in the Department of the Premier and Cabinet. The Division will work closely with delivery agencies to progress service priorities and to improve in-house implementation and program evaluation capability.
| 2023-24 $‘000 | 2024-25 $‘000 | 2025-26 $‘000 | 2026-27 $‘000 | 2027-28 $‘000 | ||||||||||||||||
Office of the Queensland Parliamentary Counsel Attraction and Retention Incentive Scheme | 1,537 | 1,854 | 1,912 | 1,960 | 2,017 | |||||||||||||||
The government is providing additional funding of $9.3 million over 5 years and $2.0 million ongoing to deliver an attraction and retention incentive scheme for the legislation drafting cohort within the Office of the Queensland Parliamentary Counsel.
87
Budget Measures 2024-25
| 2023-24 $‘000 | 2024-25 $‘000 | 2025-26 $‘000 | 2026-27 $‘000 | 2027-28 $‘000 | ||||||||||||||||
Office of the Queensland Integrity Commissioner | — | 1,601 | 1,631 | 764 | 768 | |||||||||||||||
The government is providing increased funding of $4.8 million over 4 years from 2024-25, and $768,000 per annum ongoing to enable the Office of the Queensland Integrity Commissioner (OQIC) to implement changes relating to the Integrity Act 2009 and enhance the capability of the OQIC in upholding the highest standards of integrity as an independent statutory body.
| 2023-24 $‘000 | 2024-25 $‘000 | 2025-26 $‘000 | 2026-27 $‘000 | 2027-28 $‘000 | ||||||||||||||||
Governance and Engagement Division - Capability Enhancement | — | 900 | 900 | 900 | 900 | |||||||||||||||
The government is providing funding of $3.6 million over 4 years and $900,000 per annum ongoing to enhance capability and service delivery of governance support and advisory services.
88
Budget Measures 2024-25
Department of Tourism and Sport
| 2023-24 $‘000 | 2024-25 $‘000 | 2025-26 $‘000 | 2026-27 $‘000 | 2027-28 $‘000 | ||||||||||||||||
FairPlay | — | 33,500 | — | — | — | |||||||||||||||
The government is providing increased funding of $33.5 million in 2024-25 to increase the value of the FairPlay voucher from $150 to $200, to guarantee 50,000 vouchers under current eligibility requirements, and to provide a further up to 150,000 vouchers for Queensland children and young people aged between 5 and 17 years to participate in sport and active recreation. This brings total funding for the FairPlay program in 2024-25 to $40 million.
| 2023-24 $‘000 | 2024-25 $‘000 | 2025-26 $‘000 | 2026-27 $‘000 | 2027-28 $‘000 | ||||||||||||||||
North Ipswich Sport and Entertainment Precinct | — | 10,000 | — | — | — | |||||||||||||||
The government is providing additional funding of up to $10 million in 2024-25, held centrally, as the state’s contribution towards the proposed redevelopment of sporting facilities at North Ipswich, subject to confirmation of a matching co-contribution from the Ipswich City Council and a $20 million contribution from the Australian Government.
| 2023-24 $‘000 | 2024-25 $‘000 | 2025-26 $‘000 | 2026-27 $‘000 | 2027-28 $‘000 | ||||||||||||||||
Sport Minor Infrastructure Program | — | 9,500 | — | — | — | |||||||||||||||
The government is providing increased funding of $9.5 million in 2024-25 to provide targeted funding to eligible organisations to help the sport and active recreation industry deliver new, upgraded and end of life infrastructure projects and works.
89
Budget Measures 2024-25
| 2023-24 $‘000 | 2024-25 $‘000 | 2025-26 $‘000 | 2026-27 $‘000 | 2027-28 $‘000 | ||||||||||||||||
Growing Future Tourism Program | 7,000 | 8,000 | — | — | — | |||||||||||||||
The government is providing increased funding of $15 million over 2 years to provide financial support to eligible Queensland tourism operators, not-for-profit organisations and local governments to deliver new and enhanced tourism infrastructure or experiences. This brings the total program value to $30 million.
| 2023-24 $‘000 | 2024-25 $‘000 | 2025-26 $‘000 | 2026-27 $‘000 | 2027-28 $‘000 | ||||||||||||||||
Activate! Queensland | — | 5,500 | — | — | — | |||||||||||||||
The government is providing increased funding of $5.5 million in 2024-25 to support grassroots sport and recreation clubs, young athletes on a talent pathway, and innovation in the active industry to increase sport and active recreation participation.
| 2023-24 $‘000 | 2024-25 $‘000 | 2025-26 $‘000 | 2026-27 $‘000 | 2027-28 $‘000 | ||||||||||||||||
Rockhampton Sports Precinct | — | 5,000 | — | — | — | |||||||||||||||
The government is providing additional funding of up to $5 million in 2024-25 to the Rockhampton City Council as the state’s contribution towards design, costing and gaining relevant approvals for a new home of netball in Rockhampton.
90
Budget Measures 2024-25
| 2023-24 $‘000 | 2024-25 $‘000 | 2025-26 $‘000 | 2026-27 $‘000 | 2027-28 $‘000 | ||||||||||||||||
Backing Bush Communities - Building Bush Tourism Fund | — | 4,000 | 6,000 | — | — | |||||||||||||||
The government is providing additional funding of $10 million over 2 years to support the delivery of the Bush Boost and Queensland’s long term Towards Tourism 2032: Transforming Queensland’s visitor economy future tourism industry strategy by providing support for the development of new and enhanced tourism products or supporting infrastructure that will increase visitation in Queensland’s regions outside South East Queensland.
This forms part of the government’s total funding of $30 million over 4 years for the Backing Bush Communities Fund towards workforce training, invasive species management and community projects.
Further details can be found in the Department of Agriculture and Fisheries section of this chapter.
| 2023-24 $‘000 | 2024-25 $‘000 | 2025-26 $‘000 | 2026-27 $‘000 | 2027-28 $‘000 | ||||||||||||||||
SwimStart Program | 2,000 | 3,000 | — | — | — | |||||||||||||||
The government is providing increased funding of $5 million over 2 years to further extend the availability of the SwimStart program to be used towards learn to swim lessons for children aged zero to 4 years who meet the program’s eligibility criteria.
| 2023-24 $‘000 | 2024-25 $‘000 | 2025-26 $‘000 | 2026-27 $‘000 | 2027-28 $‘000 | ||||||||||||||||
Youth Development Partnership Fund | — | 3,000 | — | — | — | |||||||||||||||
The government is providing increased funding of $3 million in 2024-25 to coordinate and facilitate the delivery of community-identified physical activity opportunities for at-risk youth.
| 2023-24 $‘000 | 2024-25 $‘000 | 2025-26 $‘000 | 2026-27 $‘000 | 2027-28 $‘000 | ||||||||||||||||
QAS 2032 High Performance Strategy | — | — | 17,434 | 17,468 | 18,500 | |||||||||||||||
The government will provide increased funding of $72 million over 4 years from 2025-26 to continue delivery of the Queensland Academy of Sport 2032 High Performance Strategy ensuring elite sporting success in Brisbane 2032.
91
Budget Measures 2024-25
| 2023-24 $‘000 | 2024-25 $‘000 | 2025-26 $‘000 | 2026-27 $‘000 | 2027-28 $‘000 | ||||||||||||||||
Tourism Recovery and Development initiatives - Strategic Indigenous Tourism Projects Fund | — | — | — | — | — | |||||||||||||||
The government will release $3 million in centrally held funds in 2024-25, matched by a co-contribution from the Australian Government, to continue to work closely with community and Traditional Owners to improve the quality of First Nations tourism experiences, deliver a range of initiatives and new events and support employment across Queensland.
92
Budget Measures 2024-25
Department of Transport and Main Roads
| 2023-24 $‘000 | 2024-25 $‘000 | 2025-26 $‘000 | 2026-27 $‘000 | 2027-28 $‘000 | ||||||||||||||||
Rail Transport Service Contract | 5,069 | 153,332 | 214,842 | 256,057 | 284,126 | |||||||||||||||
The government is providing increased funding of $913.4 million over 5 years and $284.1 million per annum ongoing for the Transport Service Contract with Queensland Rail.
| 2023-24 $‘000 | 2024-25 $‘000 | 2025-26 $‘000 | 2026-27 $‘000 | 2027-28 $‘000 | ||||||||||||||||
Critical Cyber Security Protections for Customers | — | 50,000 | — | — | — | |||||||||||||||
The government is providing additional funding of $50 million in 2024-25 ($40 million for a Cyber Security Fund to be held centrally), for the Queensland Government Customer and Digital Group’s Cyber Security Unit (CSU) to prioritise Queensland Government agencies’ critical cyber security initiatives and for the CSU to administer the Cyber Security Fund.
| 2023-24 $‘000 | 2024-25 $‘000 | 2025-26 $‘000 | 2026-27 $‘000 | 2027-28 $‘000 | ||||||||||||||||
Sustainment of Smart Ticketing Project Delivery | — | 22,750 | — | — | — | |||||||||||||||
The government is providing increased funding of $22.8 million in 2024-25 to complete the Smart Ticketing project, which has incurred substantial delays due to ongoing international supply chain issues arising from the COVID-19 pandemic.
93
Budget Measures 2024-25
| 2023-24 $‘000 | 2024-25 $‘000 | 2025-26 $‘000 | 2026-27 $‘000 | 2027-28 $‘000 | ||||||||||||||||
Service Queensland Action Plan | 19,000 | 18,500 | 11,275 | 11,557 | 11,846 | |||||||||||||||
The government is providing increased funding of $72.2 million over 5 years and $11.8 million per annum ongoing indexed annually to enhance government services through technological investments.
These include:
| • | the Queensland Digital Licence app to create a Queensland Government digital wallet |
| • | the Queensland Digital Identity platform |
| • | investments in the Transport Registration and Integrated Licensing System |
| • | a high-level model for future improvements in services. |
| 2023-24 $‘000 | 2024-25 $‘000 | 2025-26 $‘000 | 2026-27 $‘000 | 2027-28 $‘000 | ||||||||||||||||
Gympie Road Bypass Business Case for Surface Corridor Transformation | — | 10,000 | 7,000 | — | — | |||||||||||||||
The government is providing additional funding of $17 million over 2 years for the department to prepare a detailed business case for the Surface Corridor Transformation Project.
This forms part of the government’s total funding of $335 million over 3 years to progress the Gympie Road Bypass project to the next stage. Further details can be found in the Queensland Treasury section of this chapter.
| 2023-24 $‘000 | 2024-25 $‘000 | 2025-26 $‘000 | 2026-27 $‘000 | 2027-28 $‘000 | ||||||||||||||||
School Bus Upgrade Scheme | 2,962 | 9,839 | 18,108 | 24,106 | 29,461 | |||||||||||||||
The government is providing increased funding of $84.5 million over 5 years to continue the delivery of the School Bus Upgrade Scheme, to fund the replacement of vehicles for school services.
94
Budget Measures 2024-25
| 2023-24 $‘000 | 2024-25 $‘000 | 2025-26 $‘000 | 2026-27 $‘000 | 2027-28 $‘000 | ||||||||||||||||
Rockhampton Railyards Rejuvenation | — | 9,401 | — | — | — | |||||||||||||||
The government is providing additional funding of $9.4 million in 2024-25 for site management and high priority remediation works.
The capital component of this measure can be found in Chapter 3 Capital measures.
| 2023-24 $‘000 | 2024-25 $‘000 | 2025-26 $‘000 | 2026-27 $‘000 | 2027-28 $‘000 | ||||||||||||||||
Transport Infrastructure Development Scheme | — | 5,950 | — | — | — | |||||||||||||||
The government has provided increased funding of $6.0 million in 2024-25 for the Transport Infrastructure Development Scheme to enable better management of ongoing demands and timely delivery of transport infrastructure priorities across the state. In addition, an ongoing funding increase has been committed from the Queensland Transport and Roads Investment Program.
| 2023-24 $‘000 | 2024-25 $‘000 | 2025-26 $‘000 | 2026-27 $‘000 | 2027-28 $‘000 | ||||||||||||||||
Bus Service Growth | — | 5,606 | 16,507 | 23,115 | 24,292 | |||||||||||||||
The government is providing increased funding of $69.5 million over 4 years and $24.3 million per annum ongoing for the department to increase bus services and associated infrastructure in Ipswich and Logan.
95
Budget Measures 2024-25
| 2023-24 $‘000 | 2024-25 $‘000 | 2025-26 $‘000 | 2026-27 $‘000 | 2027-28 $‘000 | ||||||||||||||||
Transport Registration and Integrated Licensing System Data Integrity Assurance Program | — | 5,000 | — | — | — | |||||||||||||||
The government is providing additional funding of $5 million in 2024-25, of which $2.5 million is to be held centrally, for a program of work to provide assurance over the accuracy of data contained within the existing Transport Registration and Integrated Licensing System.
| 2023-24 $‘000 | 2024-25 $‘000 | 2025-26 $‘000 | 2026-27 $‘000 | 2027-28 $‘000 | ||||||||||||||||
Camera Detected Offence Program | — | 3,913 | 9,983 | 14,711 | 15,730 | |||||||||||||||
The government is providing increased funding of $44.3 million over 4 years and $15.7 million per annum ongoing for road safety education and awareness programs and to improve the safety of the sections of state-controlled roads where accidents happen most frequently.
This forms part of the government’s total funding of $78.9 million over 4 years, and $23.1 million per annum ongoing, as part of the Camera Detected Offence Program. Further details can be found in the Queensland Police Service and Queensland Treasury sections of this chapter.
| 2023-24 $‘000 | 2024-25 $‘000 | 2025-26 $‘000 | 2026-27 $‘000 | 2027-28 $‘000 | ||||||||||||||||
Rail Replacement Buses | 2,400 | 2,482 | 2,544 | 2,608 | 2,673 | |||||||||||||||
The government is providing additional funding of $12.7 million over 5 years from 2023-24 (indexed annually from 2028-29) to procure 200 buses directly from local manufacturers. Buses are required to ensure coverage for rail replacement services for multiple significant track closures to support major rail construction projects.
The capital component of this measure can be found in Chapter 3 Capital measures.
96
Budget Measures 2024-25
| 2023-24 $‘000 | 2024-25 $‘000 | 2025-26 $‘000 | 2026-27 $‘000 | 2027-28 $‘000 | ||||||||||||||||
Gold Coast On Demand Transport Trial | — | 2,095 | — | — | — | |||||||||||||||
The government is providing increased funding of $2.1 million in 2024-25 to continue the Gold Coast On Demand Transport Trial.
| 2023-24 $‘000 | 2024-25 $‘000 | 2025-26 $‘000 | 2026-27 $‘000 | 2027-28 $‘000 | ||||||||||||||||
Public Transport Infrastructure Disability Standards Compliance | — | 2,000 | — | — | — | |||||||||||||||
The government is providing additional funding of $2 million in 2024-25 to support the department to undertake an audit of all state public transport infrastructure to assess compliance requirements to meet the relevant Disability Standards for Accessible Public Transport.
| 2023-24 $‘000 | 2024-25 $‘000 | 2025-26 $‘000 | 2026-27 $‘000 | 2027-28 $‘000 | ||||||||||||||||
Lift Payment for Wheelchair Accessible Taxi Drivers | — | 1,883 | 1,883 | 1,883 | 1,883 | |||||||||||||||
The government is providing increased funding of $7.5 million over 4 years and $1.9 million per annum ongoing to increase the Lift Payment rate for Wheelchair Accessible Taxi drivers from $20 to $25.
| 2023-24 $‘000 | 2024-25 $‘000 | 2025-26 $‘000 | 2026-27 $‘000 | 2027-28 $‘000 | ||||||||||||||||
Implementing 3-sector Rail Timetable Enabling Cross River Rail Opening | — | 1,821 | 5,584 | 1,852 | 2,453 | |||||||||||||||
The government is providing additional funding of $11.7 million over 4 years for program management, patronage modelling, independent timetable validation, community and customer communications and the increase in the total New Generation Rollingstock train kilometres.
97
Budget Measures 2024-25
| 2023-24 $‘000 | 2024-25 $‘000 | 2025-26 $‘000 | 2026-27 $‘000 | 2027-28 $‘000 | ||||||||||||||||
Gold Coast Sand Bypass System Jetty | — | 1,800 | 1,800 | 1,800 | 500 | |||||||||||||||
The government is providing increased funding of $5.9 million over 4 years and $500,000 per annum ongoing to the Gold Coast Waterways Authority for essential asset maintenance associated with the annual protection paint coating of the Sand Bypass System Jetty.
| 2023-24 $‘000 | 2024-25 $‘000 | 2025-26 $‘000 | 2026-27 $‘000 | 2027-28 $‘000 | ||||||||||||||||
Queensland School Bus Ticketing System | — | 1,137 | — | — | — | |||||||||||||||
The government is providing increased funding of $1.1 million in 2024-25 to extend the Queensland School Bus Ticketing pilot until June 2025.
| 2023-24 $‘000 | 2024-25 $‘000 | 2025-26 $‘000 | 2026-27 $‘000 | 2027-28 $‘000 | ||||||||||||||||
Queensland Government Agent Program Service Delivery | — | 834 | — | — | — | |||||||||||||||
The government is providing increased funding of $834,000 in 2024-25 to support the Queensland Government Agent Program to maintain its current level of service delivery in regional and remote areas.
98
Budget Measures 2024-25
Department of Treaty, Aboriginal and Torres Strait Islander Partnerships, Communities and the Arts
| 2023-24 $‘000 | 2024-25 $‘000 | 2025-26 $‘000 | 2026-27 $‘000 | 2027-28 $‘000 | ||||||||||||||||
Screen Queensland - Production Attraction Strategy | — | 28,000 | — | — | — | |||||||||||||||
The government is providing increased funding of $28 million for the Production Attraction Strategy to help grow a pipeline of large-scale film and high-end television productions in Queensland.
| 2023-24 $‘000 | 2024-25 $‘000 | 2025-26 $‘000 | 2026-27 $‘000 | 2027-28 $‘000 | ||||||||||||||||
Queensland Community Support Scheme | — | 10,000 | — | — | — | |||||||||||||||
The government is providing increased funding of $10 million in 2024-25 to provide a temporary uplift to the Queensland Community Support Scheme.
This initiative is part of over $160 million provisioned towards a package of disability reforms as an initial response to the recommendations of the Royal Commission into Violence, Abuse, Neglect and Exploitation of People with Disability and the National Disability Insurance Scheme review.
| 2023-24 $‘000 | 2024-25 $‘000 | 2025-26 $‘000 | 2026-27 $‘000 | 2027-28 $‘000 | ||||||||||||||||
Screen Queensland - Post, Digital and Special Effects | — | 8,000 | — | — | — | |||||||||||||||
The government is providing increased funding of $8 million to continue the Post, Digital and Visual Effects (PDV) incentive to harness the economic, industry and employment benefits of Queensland’s PDV industry.
99
Budget Measures 2024-25
| 2023-24 | 2024-25 | 2025-26 | 2026-27 | 2027-28 | ||||||||||||||||
| $‘000 | $‘000 | $‘000 | $‘000 | $‘000 | ||||||||||||||||
Path to Treaty - Truth-telling and Healing Inquiry | — | 7,157 | 2,518 | 2,136 | — | |||||||||||||||
The government is providing additional funding of $11.8 million over 3 years and release of $6 million over 2 years from centrally held funds to support the government response to the Truth-telling and Healing Inquiry. This funding will support additional specialist research and archival officers, additional resources for Community and Personal Histories to improve access for community members as well as legal and trauma and wellbeing support.
Funding of $56.1 million over 4 years has also been released for the establishment of the Truth-telling and Healing Inquiry, with the majority drawn from Path to Treaty Fund distributions, and a further $40 million over 4 years has been released from Path to Treaty Fund distributions to support the establishment of the First Nations Treaty Institute.
| 2023-24 | 2024-25 | 2025-26 | 2026-27 | 2027-28 | ||||||||||||||||
| $‘000 | $‘000 | $‘000 | $‘000 | $‘000 | ||||||||||||||||
Coen Art Centre | — | 6,678 | 1,500 | — | — | |||||||||||||||
The government is providing additional funding of $8.2 million over 2 years for the construction of the Coen Art Centre.
| 2023-24 | 2024-25 | 2025-26 | 2026-27 | 2027-28 | ||||||||||||||||
| $‘000 | $‘000 | $‘000 | $‘000 | $‘000 | ||||||||||||||||
Community Recovery | 3,750 | 3,750 | 3,750 | 3,750 | 3,750 | |||||||||||||||
The government is providing increased funding of $18.8 million over 5 years and $3.8 million per annum ongoing to strengthen the delivery of frontline Community Recovery services following disasters.
100
Budget Measures 2024-25
| 2023-24 | 2024-25 | 2025-26 | 2026-27 | 2027-28 | ||||||||||||||||
| $‘000 | $‘000 | $‘000 | $‘000 | $‘000 | ||||||||||||||||
Emergency Relief | — | 3,300 | — | — | — | |||||||||||||||
The government is providing increased funding of $3.3 million in 2024-25 for the continuation of funding arrangements for emergency relief providers.
Of this, $1.7 million is part of the 2024-25 Cost of Living new and expanded measures.
| 2023-24 | 2024-25 | 2025-26 | 2026-27 | 2027-28 | ||||||||||||||||
| $‘000 | $‘000 | $‘000 | $‘000 | $‘000 | ||||||||||||||||
Live Music Support Package - Industry Grants | — | 3,225 | — | — | — | |||||||||||||||
The government is providing additional funding of $1.6 million in 2024-25 to support infrastructure upgrades at the Woodford Folk Festival’s Woodfordia. Further funding of up to $1.6 million is held centrally for live music business support grants.
| 2023-24 | 2024-25 | 2025-26 | 2026-27 | 2027-28 | ||||||||||||||||
| $‘000 | $‘000 | $‘000 | $‘000 | $‘000 | ||||||||||||||||
Financial Resilience Services | 557 | 2,226 | — | — | — | |||||||||||||||
The government is providing increased funding of $2.8 million over 2 years to continue the Queensland Financial Resilience Program.
Of this, $1.1 million is part of the 2024-25 Cost of Living new and expanded measures.
| 2023-24 | 2024-25 | 2025-26 | 2026-27 | 2027-28 | ||||||||||||||||
| $‘000 | $‘000 | $‘000 | $‘000 | $‘000 | ||||||||||||||||
Queensland Performing Arts Centre First Nations Programming Initiatives | — | 2,000 | — | — | — | |||||||||||||||
The government is providing increased funding of $2 million to the Queensland Performing Arts Centre in 2024-25 for continuation of the Clancestry Festival and other First Nations events and programs.
101
Budget Measures 2024-25
| 2023-24 | 2024-25 | 2025-26 | 2026-27 | 2027-28 | ||||||||||||||||
| $‘000 | $‘000 | $‘000 | $‘000 | $‘000 | ||||||||||||||||
Screen Queensland - Digital Games Program | — | 2,000 | — | — | — | |||||||||||||||
The government is providing increased funding of $2 million in 2024-25 for the Digital Games Program, designed to harness the economic, industry and employment benefits of Queensland’s growing games industry. Funding of $2 million in 2024-25 is being met internally by Screen Queensland, bringing total funding for this program to $4 million in 2024-25.
| 2023-24 | 2024-25 | 2025-26 | 2026-27 | 2027-28 | ||||||||||||||||
| $‘000 | $‘000 | $‘000 | $‘000 | $‘000 | ||||||||||||||||
Stronger Places, Stronger People Extension | — | 1,950 | 1,950 | 1,950 | 1,950 | |||||||||||||||
The government is providing increased funding of $7.8 million over 4 years ($9.8 million over 5 years), held centrally, to continue the Stronger Places Stronger People initiative in Logan, Rockhampton and Gladstone.
| 2023-24 | 2024-25 | 2025-26 | 2026-27 | 2027-28 | ||||||||||||||||
| $‘000 | $‘000 | $‘000 | $‘000 | $‘000 | ||||||||||||||||
Ongoing operation of the Meriba Omasker Kaziw Kazipa (Torres Strait Islander Traditional Child Rearing Practices) Act 2020 | — | 1,500 | — | — | — | |||||||||||||||
The government is providing increased funding of $1.5 million in 2024-25 to support ongoing operations of the Meriba Omasker Kaziw Kazipa (Torres Strait Islander Traditional Child Rearing Practices) Act 2020 to provide ongoing legal recognition of Torres Strait Islander traditional child rearing practices.
This forms part of the government’s total funding package of $1.9 million in 2024-25 for this initiative. Further details can be found in the Department of Justice and Attorney-General section of this chapter.
102
Budget Measures 2024-25
| 2023-24 | 2024-25 | 2025-26 | 2026-27 | 2027-28 | ||||||||||||||||
| $‘000 | $‘000 | $‘000 | $‘000 | $‘000 | ||||||||||||||||
Food Recovery and Redistribution | — | 1,390 | 2,180 | — | — | |||||||||||||||
The government is providing increased funding of $3.6 million over 2 years from 2024-25 for the continuation of critical food recovery and distribution services across Queensland.
Of this, $1.1 million is part of the 2024-25 Cost of Living new and expanded measures.
| 2023-24 | 2024-25 | 2025-26 | 2026-27 | 2027-28 | ||||||||||||||||
| $‘000 | $‘000 | $‘000 | $‘000 | $‘000 | ||||||||||||||||
Community Food Education Program | — | 1,300 | — | — | — | |||||||||||||||
The government is providing additional funding of $1.3 million in 2024-25 for the Department of Treaty, Aboriginal and Torres Strait Islander Partnerships, Communities and the Arts to work with community organisations to deliver community focused food programs.
This forms part of the $15 million School and Community Food Relief Program, comprised of $10.7 million for the Department of Education, $1.3 million for the Department of Treaty, Aboriginal and Torres Strait Islander Partnerships, Communities and the Arts, and a further $3 million held centrally to support initiatives generated by the School and Community Food Taskforce.
| 2023-24 | 2024-25 | 2025-26 | 2026-27 | 2027-28 | ||||||||||||||||
| $‘000 | $‘000 | $‘000 | $‘000 | $‘000 | ||||||||||||||||
Queensland Veterans Council Secretariat | — | 1,230 | 1,230 | 1,230 | 1,230 | |||||||||||||||
The government is providing increased funding of $4.9 million over 4 years and $1.2 million per annum ongoing for the Queensland Veterans Council Secretariat.
103
Budget Measures 2024-25
| 2023-24 | 2024-25 | 2025-26 | 2026-27 | 2027-28 | ||||||||||||||||
| $‘000 | $‘000 | $‘000 | $‘000 | $‘000 | ||||||||||||||||
Foodbank Warehousing and Operating Costs | — | 774 | 773 | 773 | 563 | |||||||||||||||
The government is providing additional funding of $2.9 million over 4 years from 2024-25 for warehousing and other operating costs for Foodbank Queensland.
| 2023-24 | 2024-25 | 2025-26 | 2026-27 | 2027-28 | ||||||||||||||||
| $‘000 | $‘000 | $‘000 | $‘000 | $‘000 | ||||||||||||||||
Queensland Cultural Centre Flood Resilience Business Case | — | 750 | 750 | — | — | |||||||||||||||
The government is providing increased funding of $1.5 million over 2 years for the continuation of the flood resilience business case for the Queensland Cultural Centre.
| 2023-24 | 2024-25 | 2025-26 | 2026-27 | 2027-28 | ||||||||||||||||
| $‘000 | $‘000 | $‘000 | $‘000 | $‘000 | ||||||||||||||||
Braille House and Vision Australia | — | 611 | — | — | — | |||||||||||||||
The government is providing increased funding of $611,000 to provide specialised services to improve reading experience for people who are blind, have low vision and have a print disability.
| 2023-24 | 2024-25 | 2025-26 | 2026-27 | 2027-28 | ||||||||||||||||
| $‘000 | $‘000 | $‘000 | $‘000 | $‘000 | ||||||||||||||||
Strengthening Support for Victims of Crime | — | 597 | — | — | — | |||||||||||||||
The government is providing additional funding of $597,000 in 2024-25 to undertake community response coordination.
This initiative is part of the $1.28 billion Community Safety Plan for Queensland.
104
Budget Measures 2024-25
| 2023-24 | 2024-25 | 2025-26 | 2026-27 | 2027-28 | ||||||||||||||||
| $‘000 | $‘000 | $‘000 | $‘000 | $‘000 | ||||||||||||||||
LGBTQIA+ Alliance | — | 532 | 503 | — | — | |||||||||||||||
The government is providing additional funding of $1.0 million over 2 years from 2024-25 to establish the inaugural LGBTQIA+ Alliance.
| 2023-24 | 2024-25 | 2025-26 | 2026-27 | 2027-28 | ||||||||||||||||
| $‘000 | $‘000 | $‘000 | $‘000 | $‘000 | ||||||||||||||||
Australian Cinematheque and Childrens Arts Centre | — | 500 | — | — | — | |||||||||||||||
The government is providing increased funding of $500,000 to the Queensland Art Gallery | Gallery of Modern Art in 2024-25 to support continued service delivery at the Australian Cinematheque and the Children’s Art Centre.
| 2023-24 | 2024-25 | 2025-26 | 2026-27 | 2027-28 | ||||||||||||||||
| $‘000 | $‘000 | $‘000 | $‘000 | $‘000 | ||||||||||||||||
Queensland Indigenous Youth Leadership Program | — | 302 | — | — | — | |||||||||||||||
The government is providing increased funding of $302,000 in 2024-25 to support the Queensland Indigenous Youth Leadership Program.
| 2023-24 | 2024-25 | 2025-26 | 2026-27 | 2027-28 | ||||||||||||||||
| $‘000 | $‘000 | $‘000 | $‘000 | $‘000 | ||||||||||||||||
Queensland Meals on Wheels - Peak Body | — | 300 | 300 | 300 | 300 | |||||||||||||||
The government is providing additional funding of $1.2 million over 4 years and $300,000 per annum ongoing for Queensland Meals on Wheels as the peak body for meals on wheels services.
105
Budget Measures 2024-25
| 2023-24 | 2024-25 | 2025-26 | 2026-27 | 2027-28 | ||||||||||||||||
| $‘000 | $‘000 | $‘000 | $‘000 | $‘000 | ||||||||||||||||
Queensland Cultural Centre Emergency Service Officers | — | 276 | 276 | 276 | 276 | |||||||||||||||
The government is providing additional funding of $1.1 million over 4 years and $276,000 per annum ongoing for Emergency Services Officers at the Queensland Cultural Centre.
| 2023-24 | 2024-25 | 2025-26 | 2026-27 | 2027-28 | ||||||||||||||||
| $‘000 | $‘000 | $‘000 | $‘000 | $‘000 | ||||||||||||||||
Preservation and Protection of Significant Indigenous Heritage Sites | — | 250 | 250 | — | — | |||||||||||||||
The government is providing additional funding of $500,000 over 2 years for the management of discovered ancestral remains.
| 2023-24 | 2024-25 | 2025-26 | 2026-27 | 2027-28 | ||||||||||||||||
| $‘000 | $‘000 | $‘000 | $‘000 | $‘000 | ||||||||||||||||
Initiatives to support the National Agreement on Closing the Gap | — | 107 | 107 | — | — | |||||||||||||||
The government is providing increased funding of $214,000 over 2 years to deliver initiatives to support targets under the National Agreement on Closing the Gap.
A further $11 million has also been repurposed from existing centrally held funds, bringing the total funding for this initiative to $11.2 million. This funding will support the Queensland Aboriginal and Torres Strait Islander Coalition, the Doomadgee Place Based Partnership and Aboriginal and Torres Strait Islander Wellbeing programs and Alcohol Management programs.
106
Budget Measures 2024-25
| 2023-24 | 2024-25 | 2025-26 | 2026-27 | 2027-28 | ||||||||||||||||
| $‘000 | $‘000 | $‘000 | $‘000 | $‘000 | ||||||||||||||||
Cost of Living Package - Electricity Bill Support | 2,267,000 | — | — | — | — | |||||||||||||||
The government has provided increased funding of $2.267 billion to deliver electricity bill support for Queensland households and small businesses, as part of a total $2.965 billion package. All Queensland households will automatically receive $1,300 off their electricity bills in 2024-25. This consists of an upfront $1,000 Cost of Living Rebate from the Queensland Government and a $300 rebate paid in quarterly instalments from the Australian Government. Around 205,000 eligible Queensland small businesses will also receive a $650 credit on electricity bills in 2024-25, co-funded by the Queensland and Australian Governments.
| 2023-24 | 2024-25 | 2025-26 | 2026-27 | 2027-28 | ||||||||||||||||
| $‘000 | $‘000 | $‘000 | $‘000 | $‘000 | ||||||||||||||||
Orange Sky | 3,000 | — | — | — | — | |||||||||||||||
The government has provided additional funding of $3 million in 2023-24 for the Orange Sky Headquarters of the Future.
107
Budget Measures 2024-25
Department of Youth Justice
| 2023-24 | 2024-25 | 2025-26 | 2026-27 | 2027-28 | ||||||||||||||||
| $‘000 | $‘000 | $‘000 | $‘000 | $‘000 | ||||||||||||||||
Wacol Youth Remand Centre | — | 32,870 | 39,876 | 21,228 | — | |||||||||||||||
The government is providing additional funding of $94 million over 3 years to operate the Wacol Youth Remand Centre as a youth detention centre. This forms part of total additional funding of $149.2 million over 3 years for the Wacol Youth Remand Centre.
This initiative is part of the $1.28 billion Community Safety Plan for Queensland.
| 2023-24 | 2024-25 | 2025-26 | 2026-27 | 2027-28 | ||||||||||||||||
| $‘000 | $‘000 | $‘000 | $‘000 | $‘000 | ||||||||||||||||
Targeted Responses to Emerging Youth Crime | 6,000 | 12,000 | 6,000 | — | — | |||||||||||||||
The government has provided increased funding of $24 million over 2 years, held centrally, to enable targeted and immediate responses to emerging youth crime and to expand the On Country Program.
| 2023-24 $‘000 | 2024-25 $‘000 | 2025-26 $‘000 | 2026-27 $‘000 | 2027-28 $‘000 | ||||||||||||||||
Youth Detention Centre Readiness and Interim Arrangements | — | 8,550 | 9,124 | — | — | |||||||||||||||
The government is providing increased funding of $17.7 million over 2 years to continue current services supporting young people in watchhouses and to continue work on establishment of the new Woodford and Cairns Youth Detention Centres.
This initiative is part of the $1.28 billion Community Safety Plan for Queensland.
108
Budget Measures 2024-25
| 2023-24 | 2024-25 | 2025-26 | 2026-27 | 2027-28 | ||||||||||||||||
| $‘000 | $‘000 | $‘000 | $‘000 | $‘000 | ||||||||||||||||
Youth Co-Responder Teams Expansion | — | 5,901 | 5,285 | — | — | |||||||||||||||
The government is providing increased funding of $11.2 million over 2 years to establish Youth Co-Responder Teams in the Sunshine Coast and South West and expansion in Gold Coast, Brisbane South and Cairns. This forms part of total increased funding of $13.6 million over 2 years for the Youth Co-Responder Teams.
This initiative is part of the $1.28 billion Community Safety Plan for Queensland.
| 2023-24 | 2024-25 | 2025-26 | 2026-27 | 2027-28 | ||||||||||||||||
| $‘000 | $‘000 | $‘000 | $‘000 | $‘000 | ||||||||||||||||
Youth Detention Centre Support | — | 5,205 | 13,936 | 15,874 | 15,824 | |||||||||||||||
The government is providing increased funding of $50.8 million over 4 years and $15.8 million per annum ongoing to establish dedicated and centralised frontline support for the expanding network of Youth Detention Centres.
| 2023-24 | 2024-25 | 2025-26 | 2026-27 | 2027-28 | ||||||||||||||||
| $‘000 | $‘000 | $‘000 | $‘000 | $‘000 | ||||||||||||||||
Caboolture Watchhouse Hub | 7,567 | 4,101 | — | — | — | |||||||||||||||
The government has provided additional funding of $11.7 million over 2 years to provide services to young people accommodated in the Caboolture Watchhouse Hub. This includes $1.3 million over 2 years for outsourced welfare support, cultural support and legal advocacy services .
This forms part of the government’s total funding of $59.3 million over 2 years to provide interim capacity at the Caboolture Watchhouse Hub.
109
Budget Measures 2024-25
| 2023-24 | 2024-25 | 2025-26 | 2026-27 | 2027-28 | ||||||||||||||||
| $‘000 | $‘000 | $‘000 | $‘000 | $‘000 | ||||||||||||||||
Youth After Hours Services | — | 3,000 | 3,000 | — | — | |||||||||||||||
The government is providing increased funding of $6 million over 2 years to enhance after hours services in high needs communities experiencing increases in youth offending.
This initiative is part of the $1.28 billion Community Safety Plan for Queensland.
| 2023-24 | 2024-25 | 2025-26 | 2026-27 | 2027-28 | ||||||||||||||||
| $‘000 | $‘000 | $‘000 | $‘000 | $‘000 | ||||||||||||||||
Restorative Justice Services Expansion | — | 2,500 | 2,500 | — | — | |||||||||||||||
The government is providing increased funding of $5 million over 2 years to reduce delays and improve the experiences of victims who participate in these processes.
This initiative is part of the $1.28 billion Community Safety Plan for Queensland.
| 2023-24 | 2024-25 | 2025-26 | 2026-27 | 2027-28 | ||||||||||||||||
| $‘000 | $‘000 | $‘000 | $‘000 | $‘000 | ||||||||||||||||
Electronic Monitoring Expansion | — | 2,400 | — | — | — | |||||||||||||||
The government is providing increased funding of $2.4 million in 2024-25 to expand the required bail support services for the expanded use of electronic monitoring of young offenders on bail. This forms part of increased funding of $7 million (increased funding of $3 million and $4 million of centrally held funds) to support the expanded use of electronic monitoring of young offenders.
This initiative is part of the $1.28 billion Community Safety Plan for Queensland.
110
Budget Measures 2024-25
| 2023-24 | 2024-25 | 2025-26 | 2026-27 | 2027-28 | ||||||||||||||||
| $‘000 | $‘000 | $‘000 | $‘000 | $‘000 | ||||||||||||||||
Intensive Case Management Expansion | — | 1,178 | 2,343 | — | — | |||||||||||||||
The government is providing increased funding of $3.5 million over 2 years to expand the Intensive Case Management program for young offenders and families across 7 locations, including: Bundaberg, Redlands, Sunshine Coast, Central West/Emerald, Gladstone Central, and Brisbane and Cleveland Youth Detention Centres.
This initiative is part of the $1.28 billion Community Safety Plan for Queensland.
| 2023-24 | 2024-25 | 2025-26 | 2026-27 | 2027-28 | ||||||||||||||||
| $‘000 | $‘000 | $‘000 | $‘000 | $‘000 | ||||||||||||||||
Responding to serious violent offenders | — | 955 | 2,650 | 2,663 | 2,529 | |||||||||||||||
The government is providing additional funding of $8.8 million over 4 years to establish a trial of a program response to serious violent youth offending in two locations, including program support and evaluation, with the department to prioritise locations based on need.
| 2023-24 | 2024-25 | 2025-26 | 2026-27 | 2027-28 | ||||||||||||||||
| $‘000 | $‘000 | $‘000 | $‘000 | $‘000 | ||||||||||||||||
Woodford Youth Detention Centre Operational and Establishment Funding | — | 750 | 54,932 | 80,974 | 87,105 | |||||||||||||||
The government is providing increased funding of $223.8 million over 4 years and $87.1 million per annum ongoing to support the establishment and operation of the Woodford Youth Detention Centre. This forms part of total increased funding of $261.4 million over 4 years and $89.2 million per annum ongoing to support operations of the Woodford Youth Detention Centre.
The capital component to this measure can be found in Chapter 3 Capital measures.
This initiative is part of the $1.28 billion Community Safety Plan for Queensland.
111
Budget Measures 2024-25
| 2023-24 | 2024-25 | 2025-26 | 2026-27 | 2027-28 | ||||||||||||||||
| $‘000 | $‘000 | $‘000 | $‘000 | $‘000 | ||||||||||||||||
Extension of Culture-focused Youth Justice Family Partnership Responses | — | 660 | 920 | 1,220 | 460 | |||||||||||||||
The government is providing increased funding of $3.3 million over 4 years to continue a trial of the existing Cultural Family Partnership services in Hervey Bay, Logan and South West Brisbane.
| 2023-24 | 2024-25 | 2025-26 | 2026-27 | 2027-28 | ||||||||||||||||
| $‘000 | $‘000 | $‘000 | $‘000 | $‘000 | ||||||||||||||||
Strengthening and Sustaining Court Reforms Tackling Youth and Adult Crime | — | — | 1,152 | — | | — | | |||||||||||||
The government is providing increased funding of $1.2 million in 2025-26 for the continuation of the Townsville Youth Court.
This initiative is part of the $1.28 billion Community Safety Plan for Queensland.
112
Budget Measures 2024-25
Legislative Assembly of Queensland
| 2023-24 $‘000 | 2024-25 $‘000 | 2025-26 $‘000 | 2026-27 $‘000 | 2027-28 $‘000 | ||||||||||||||||
Electorate office staff | — | 12,597 | 12,970 | 13,295 | 13,627 | |||||||||||||||
The government is providing additional funding of $52.5 million over 4 years and $13.6 million ongoing for 93 additional electorate office staff across Queensland.
113
Budget Measures 2024-25
Office of the Governor
| 2023-24 $‘000 | 2024-25 $‘000 | 2025-26 $‘000 | 2026-27 $‘000 | 2027-28 $‘000 | ||||||||||||||||
Office of the Governor | — | 583 | 600 | 615 | 631 | |||||||||||||||
The government is providing increased funding of $2.4 million over 4 years and $631,000 ongoing to meet increased Office of the Governor commitments for employees and to implement organisational changes.
114
Budget Measures 2024-25
Office of the Queensland Ombudsman
| 2023-24 $‘000 | 2024-25 $‘000 | 2025-26 $‘000 | 2026-27 $‘000 | 2027-28 $‘000 | ||||||||||||||||
Funding for Critical Business Needs | — | 1,016 | 1,313 | 1,207 | 1,234 | |||||||||||||||
The government is providing increased funding of $4.8 million over 4 years and $793,000 per annum ongoing for the Office of the Queensland Ombudsman to maintain current information technology (IT) systems and infrastructure and facilitate future IT investment to support the security of data and service delivery, and $441,000 per annum ongoing for depreciation costs and additional floor space rental at 53 Albert Street.
The capital component of this measure can be found in Chapter 3 Capital measures.
| 2023-24 $‘000 | 2024-25 $‘000 | 2025-26 $‘000 | 2026-27 $‘000 | 2027-28 $‘000 | ||||||||||||||||
Wacol Youth Remand Facility | — | 592 | 608 | 311 | — | |||||||||||||||
The government is providing additional funding of $1.5 million over 3 years for the Office of the Queensland Ombudsman to fulfill its statutory responsibilities under the Inspector of Detention Services Act 2022 and conduct inspections of the Wacol Youth Remand Facility.
This forms part of total additional funding of $149.2 million over 3 years for the Wacol Youth Remand Centre.
This initiative is part of the $1.28 billion Community Safety Plan for Queensland.
115
Budget Measures 2024-25
| 2023-24 $‘000 | 2024-25 $‘000 | 2025-26 $‘000 | 2026-27 $‘000 | 2027-28 $‘000 | ||||||||||||||||
Woodford Youth Detention Centre | — | — | — | 1,023 | 1,049 | |||||||||||||||
The government is providing additional funding of $2.1 million over 2 years from 2026-27 and $1 million per annum ongoing for the Office of the Queensland Ombudsman to fulfill its statutory responsibilities under the Inspector of Detention Services Act 2022 and conduct inspections of new youth detention centres including the Woodford Youth Detention Centre.
This forms part of total additional funding of $261.4 million over 4 years and $89.2 million per annum ongoing to support operations of the Woodford Youth Detention Centre.
This initiative is part of the $1.28 billion Community Safety Plan for Queensland.
116
Budget Measures 2024-25
Public Sector Commission
| 2023-24 $‘000 | 2024-25 $‘000 | 2025-26 $‘000 | 2026-27 $‘000 | 2027-28 $‘000 | ||||||||||||||||
Queensland Complaints Clearinghouse Foundation Stage | — | 6,223 | — | — | — | |||||||||||||||
The government is providing additional funding of $6.2 million in 2024-25 for the Queensland Complaints Clearinghouse Foundation Stage to progress the implementation of recommendation 6 of Professor Coaldrake AO report, Let the sunshine in: Review of culture and accountability in the Queensland public sector.
117
Budget Measures 2024-25
Queensland Corrective Services
| 2023-24 $‘000 | 2024-25 $‘000 | 2025-26 $‘000 | 2026-27 $‘000 | 2027-28 $‘000 | ||||||||||||||||
Additional Prisoner Growth Funding | 9,846 | 128,706 | 44,246 | 42,068 | 45,650 | |||||||||||||||
The government is providing additional funding of $270.5 million over 5 years and $45.7 million per annum ongoing to support and safely manage the demands of a growing prisoner population. This relates to the government’s approval of a new Prisoner Fluctuation Funding Model, which will enable funding to vary in accordance with the actual number of prisoners above a correctional centre’s built design capacity
| 2023-24 $‘000 | 2024-25 $‘000 | 2025-26 $‘000 | 2026-27 $‘000 | 2027-28 $‘000 | ||||||||||||||||
Asset Improvement Program | 10,000 | 21,234 | 29,535 | 18,089 | 18,313 | |||||||||||||||
The government is providing additional funding of $97.2 million over 5 years and $12.6 million per annum ongoing for infrastructure upgrades as part of the asset improvement program.
The capital component of this measure can be found in Chapter 3 Capital Measures.
| 2023-24 $‘000 | 2024-25 $‘000 | 2025-26 $‘000 | 2026-27 $‘000 | 2027-28 $‘000 | ||||||||||||||||
Domestic and Family Violence Perpetrator Programs | — | 5,420 | 9,420 | — | — | |||||||||||||||
The government is providing additional funding of $14.8 million over 2 years for the delivery of domestic and family violence perpetrator programs that support rehabilitation and re-entry into the community.
118
Budget Measures 2024-25
| 2023-24 $‘000 | 2024-25 $‘000 | 2025-26 $‘000 | 2026-27 $‘000 | 2027-28 $‘000 | ||||||||||||||||
End-to-End Case Management | — | 5,260 | 5,529 | 5,481 | 5,704 | |||||||||||||||
The government is providing increased funding of $22.0 million over 4 years and $9.6 million per annum ongoing to continue a therapeutic and trauma-informed approach to case managing people that aims to reduce recidivism, make communities safer and improve outcomes for people in contact with corrective services.
Total funding for this initiative is $37.7 million over 4 years, which includes $15.7 million previously held centrally.
| 2023-24 $‘000 | 2024-25 $‘000 | 2025-26 $‘000 | 2026-27 $‘000 | 2027-28 $‘000 | ||||||||||||||||
High Risk Offender Management Unit Resourcing | 569 | 2,397 | 2,669 | 2,742 | 2,893 | |||||||||||||||
The government is providing increased funding of $11.3 million over 5 years and $2.9 million per annum ongoing to support the management of dangerous prisoners (sexual offenders) at the Wacol precinct.
The capital component of this measure can be found in Chapter 3 Capital measures.
| 2023-24 $‘000 | 2024-25 $‘000 | 2025-26 $‘000 | 2026-27 $‘000 | 2027-28 $‘000 | ||||||||||||||||
Capacity Management Unit | 565 | 2,345 | 2,418 | 2,490 | 2,634 | |||||||||||||||
The government is providing additional funding of $10.5 million over 5 years and $2.6 million per annum ongoing to establish the Capacity Management Unit within Queensland Corrective Services to oversee the system and reconfiguration requirements associated with Queensland’s growing and increasingly complex prisoner population.
119
Budget Measures 2024-25
| 2023-24 $‘000 | 2024-25 $‘000 | 2025-26 $‘000 | 2026-27 $‘000 | 2027-28 $‘000 | ||||||||||||||||
Electronic Monitoring - Youth | — | 2,232 | — | — | — | |||||||||||||||
The government is providing increased funding of $2.2 million in 2024-25 to provide operational support and monitoring services for the electronic monitoring trial.
This forms part of increased funding of $7 million (increased funding of $3 million and $4 million of centrally held funds) to support the expanded use of electronic monitoring of young offenders.
This initiative is part of the $1.28 billion Community Safety Plan for Queensland.
| 2023-24 $‘000 | 2024-25 $‘000 | 2025-26 $‘000 | 2026-27 $‘000 | 2027-28 $‘000 | ||||||||||||||||
Improving Services for Victims of Crime | — | 431 | 593 | 608 | 624 | |||||||||||||||
The government is providing increased funding of $2.3 million over 4 years and $624,000 per annum ongoing to enhance the capacity of the Queensland Corrective Services victims register to directly support victims of crime.
This initiative is part of the $1.28 billion Community Safety Plan for Queensland.
| 2023-24 $‘000 | 2024-25 $‘000 | 2025-26 $‘000 | 2026-27 $‘000 | 2027-28 $‘000 | ||||||||||||||||
Gangs Exit Program | — | 389 | 400 | — | — | |||||||||||||||
The government is providing increased funding of $789,000 over 2 years to coordinate the Gangs Exit Program activities to continue the program in Queensland correctional centres.
This forms part of the government’s total funding of $2.1 million over 2 years to pilot the introduction of the Exit program into selected correctional centres.
This initiative is part of the $1.28 billion Community Safety Plan for Queensland.
120
Budget Measures 2024-25
| 2023-24 $‘000 | 2024-25 $‘000 | 2025-26 $‘000 | 2026-27 $‘000 | 2027-28 $‘000 | ||||||||||||||||
First Nations Community Work Camp | 122 | 221 | — | — | — | |||||||||||||||
The government is providing additional funding of $343,000 over 2 years to conduct consultation with First Nations groups to determine the viability of establishing a work camp in a discrete community.
| 2023-24 $‘000 | 2024-25 $‘000 | 2025-26 $‘000 | 2026-27 $‘000 | 2027-28 $‘000 | ||||||||||||||||
Homes for Queenslanders | 80 | 199 | 206 | 213 | 218 | |||||||||||||||
The government is providing additional funding of $916,000 over 5 years and $223,000 per annum ongoing to implement integrated pathways from institutional settings into sustainable community housing.
This forms part of the government’s total funding package of $3.1 billion over 5 years for Homes For Queenslanders, the Queensland Government’s whole-of-system housing plan.
| 2023-24 $‘000 | 2024-25 $‘000 | 2025-26 $‘000 | 2026-27 $‘000 | 2027-28 $‘000 | ||||||||||||||||
Prison Capacity Uplift | — | — | 9,954 | 10,233 | 10,482 | |||||||||||||||
The government is providing additional funding of $30.7 million over 3 years and $10.5 million per annum ongoing to operate increased prison capacity to sustainably manage a growing prisoner population.
The capital component of this measure can be found in Chapter 3 Capital measures.
121
Budget Measures 2024-25
Queensland Fire Department
| 2023-24 $‘000 | 2024-25 $‘000 | 2025-26 $‘000 | 2026-27 $‘000 | 2027-28 $‘000 | ||||||||||||||||
Disaster Recovery Funding Arrangements Efficiencies | — | 40,000 | 40,000 | 20,000 | — | |||||||||||||||
The government is providing additional funding of $100 million over 3 years from the Disaster Recovery Funding Arrangements Efficiencies jointly funded by the Queensland and Australian Governments to support a suite of high priority disaster resilience and mitigation infrastructure and non-infrastructure programs and projects.
| 2023-24 $‘000 | 2024-25 $‘000 | 2025-26 $‘000 | 2026-27 $‘000 | 2027-28 $‘000 | ||||||||||||||||
Queensland Reconstruction Authority Capacity Uplift | — | — | 4,635 | 4,751 | — | |||||||||||||||
The government is providing additional funding of $9.4 million over 2 years from 2025-26 to maintain the Queensland Reconstruction Authority’s staffing capacity, supporting Queensland’s extensive recovery effort arising from severe disaster events that have impacted the state.
122
Budget Measures 2024-25
Queensland Health
| 2023-24 $‘000 | 2024-25 $‘000 | 2025-26 $‘000 | 2026-27 $‘000 | 2027-28 $‘000 | ||||||||||||||||
Queensland Health Growth Funding Uplift | — | 1,375,165 | 755,277 | 562,652 | 1,700,046 | |||||||||||||||
The government is providing an uplift to Queensland Health’s operating funding envelope of $4.393 billion over 4 years from 2024-25. This increase in funding will address emerging demand and cost pressures and will support additional investment in quality health services across Queensland. This additional funding will also support the following priority investment areas:
| • | First Nations First |
| • | Queensland Health Workforce |
| • | Queensland Ambulance Service |
| • | Women and Girls’ Health Strategy |
| • | Putting Queensland Kids First |
| • | Aeromedical Contracts |
| • | Better Cancer Care |
| • | Free Vaccinations for Queenslanders |
| • | Queensland Community Pharmacy Scope of Practice Pilot |
| • | Hospital Discharge Initiatives |
| • | Voluntary Assisted Dying |
| • | Queensland Health Cyber Security Program |
| • | Health Pathways Statewide Licence |
| • | Specialist Palliative Care in Aged Care |
| • | Sexual Assault Response |
| • | Assisted Reproductive Technology Regulation. |
123
Budget Measures 2024-25
| 2023-24 $‘000 | 2024-25 $‘000 | 2025-26 $‘000 | 2026-27 $‘000 | 2027-28 $‘000 | ||||||||||||||||
Expansion of Mental and Physical Health Services across Youth Detention Centres | — | 3,500 | — | — | — | |||||||||||||||
The government is providing additional funding of $3.5 million in 2024-25 to deliver mental health, cognitive disability and physical health screening checks and services in Youth Detention Centres in Brisbane and Townsville. This forms part of a $7.1 million, 2-year initiative to employ 2 senior medical officers and 2 nurses across Brisbane and Townsville, with $3.6 million in 2025-26 internally funded by Queensland Health.
This initiative is part of the $1.28 billion Community Safety Plan for Queensland.
| 2023-24 $‘000 | 2024-25 $‘000 | 2025-26 $‘000 | 2026-27 $‘000 | 2027-28 $‘000 | ||||||||||||||||
Wacol Detention Centre - Operational and Establishment Funding | — | 2,861 | 3,348 | 1,791 | — | |||||||||||||||
The government is providing additional funding of $8.0 million over 3 years from 2024-25 to support the operations of the Wacol Youth Detention Centre.
This initiative is part of the $1.28 billion Community Safety Plan for Queensland.
| 2023-24 $‘000 | 2024-25 $‘000 | 2025-26 $‘000 | 2026-27 $‘000 | 2027-28 $‘000 | ||||||||||||||||
Strengthening and Sustaining Court Reforms Tackling Youth and Adult Crime | — | 136 | 350 | — | — | |||||||||||||||
The government is providing additional funding of $486,000 over 2 years from 2024-25 to support the Court Link Program.
This initiative is part of the $1.28 billion Community Safety Plan for Queensland.
124
Budget Measures 2024-25
| 2023-24 $‘000 | 2024-25 $‘000 | 2025-26 $‘000 | 2026-27 $‘000 | 2027-28 $‘000 | ||||||||||||||||
Woodford Youth Detention Centre - Operational and Establishment Funding | — | — | — | 10,064 | 9,849 | |||||||||||||||
The government will provide additional funding of $19.9 million over 2 years from 2026-27 for Queensland Health to support operations of the Woodford Youth Detention Centre.
This forms part of the total additional funding of $261.4 million over 4 years and $89.2 million per annum ongoing to support operations of the Woodford Youth Detention Centre.
This initiative is part of the $1.28 billion Community Safety Plan for Queensland.
| 2023-24 $‘000 | 2024-25 $‘000 | 2025-26 $‘000 | 2026-27 $‘000 | 2027-28 $‘000 | ||||||||||||||||
Access to Aids and Equipment for Queenslanders with Disability | — | 6,475 | — | — | — | |||||||||||||||
The government is providing additional funding of $6.5 million in 2024-25 for a pilot of a Hospital Assistive Technology Loan Pool and expansion of supports provided under the Medical Aids Subsidy Scheme.
This initiative is part of over $160 million provisioned towards a package of disability reforms as an initial response to the recommendations of the Royal Commission into Violence, Abuse, Neglect and Exploitation of People with Disability and the NDIS review.
| 2023-24 $‘000 | 2024-25 $‘000 | 2025-26 $‘000 | 2026-27 $‘000 | 2027-28 $‘000 | ||||||||||||||||
Commission of Inquiry - Forensic DNA Testing | 3,214 | 3,362 | 3,517 | 2,976 | 2,981 | |||||||||||||||
The government is providing additional funding of $16.1 million over 5 years from 2023-24 and $3.0 million per annum from 2027-28 to Queensland Health for a range of measures to support and expand forensic DNA service delivery.
This forms part of the government’s total funding package of $202.7 million over 6 years (2022-23 to 2027-28), with a recurrent funding boost of $22.3 million from 2027-28, in response to the Commission of Inquiry into Forensic DNA Testing in Queensland.
125
Budget Measures 2024-25
| 2023-24 $‘000 | 2024-25 $‘000 | 2025-26 $‘000 | 2026-27 $‘000 | 2027-28 $‘000 | ||||||||||||||||
Caboolture Watchhouse Hub | 76 | 43 | — | — | — | |||||||||||||||
The government is providing additional funding of $118,991 over 2 years from 2023-24 for Queensland Health to provide services to young people accommodated in the Caboolture Watchhouse.
This forms part of the government’s total funding of $59.3 million over 2 years to provide interim capacity at the Caboolture Watchhouse Hub.
| 2023-24 $‘000 | 2024-25 $‘000 | 2025-26 $‘000 | 2026-27 $‘000 | 2027-28 $‘000 | ||||||||||||||||
Aeromedical Contracts | — | — | — | — | — | |||||||||||||||
The government is providing additional funding of $142.2 million over 4 years, from within the $4.393 billion Growth Funding Uplift, to further support Queensland’s aeromedical providers to deliver specialist retrieval doctors, and emergency helicopter services from Torres Strait, Bundaberg, Mount Isa, Sunshine Coast, Toowoomba, Rockhampton, Mackay, and Brisbane.
| 2023-24 $‘000 | 2024-25 $‘000 | 2025-26 $‘000 | 2026-27 $‘000 | 2027-28 $‘000 | ||||||||||||||||
Assisted Reproductive Technology Regulation | — | — | — | — | — | |||||||||||||||
The government is providing additional funding of $6.4 million, from within the $4.393 billion Growth Funding Uplift, to go toward Assisted Reproductive Technology Regulation.
126
Budget Measures 2024-25
| 2023-24 $‘000 | 2024-25 $‘000 | 2025-26 $‘000 | 2026-27 $‘000 | 2027-28 $‘000 | ||||||||||||||||
Better Cancer Care | — | — | — | — | — | |||||||||||||||
The government is providing additional funding of $20.0 million over 4 years, from within the $4.393 billion Growth Funding Uplift, to deliver better cancer care services to Queenslanders, closer to home.
| 2023-24 $‘000 | 2024-25 $‘000 | 2025-26 $‘000 | 2026-27 $‘000 | 2027-28 $‘000 | ||||||||||||||||
Centre for Women & Co Grant | 3,000 | — | — | — | — | |||||||||||||||
The government has provided additional funding of $3.0 million in 2023-24 for a one-off capital grant to the Centre for Women & Co towards the purchase of 8 Cinderella Drive, Springwood.
| 2023-24 $‘000 | 2024-25 $‘000 | 2025-26 $‘000 | 2026-27 $‘000 | 2027-28 $‘000 | ||||||||||||||||
First Nations First | — | — | — | — | — | |||||||||||||||
The government is providing additional funding of $209.9 million over 4 years from 2024-25, from within the $4.393 billion Growth Funding Uplift, to accelerate efforts to address inequity in health and wellbeing outcomes with First Nations Queenslanders, by putting First Nations First and putting the Queensland Government back on track to Close the Gap by 2031.
A further $114.8 million over 4 years for this initiative will be met from existing Queensland Health resources.
Total funding for this initiative is $324.7 million over 4 years.
127
Budget Measures 2024-25
| 2023-24 $‘000 | 2024-25 $‘000 | 2025-26 $‘000 | 2026-27 $‘000 | 2027-28 $‘000 | ||||||||||||||||
Free Vaccinations for Queenslanders | — | — | — | — | — | |||||||||||||||
The government is providing additional funding of $95.9 million over 4 years, from within the $4.393 billion Growth Funding Uplift, to deliver free Meningococcal B and RSV vaccines for eligible infants, children, and adolescents.
Funding of $40.0 million in 2024-25 is being met internally by Queensland Health to continue the free influenza vaccination for all Queenslanders.
Total funding for this program is $135.9 million over 4 years from 2024-25.
| 2023-24 $‘000 | 2024-25 $‘000 | 2025-26 $‘000 | 2026-27 $‘000 | 2027-28 $‘000 | ||||||||||||||||
HealthPathways Statewide Licence | — | — | — | — | — | |||||||||||||||
The government is providing additional funding of $8.8 million over 4 years, from within the $4.393 billion Growth Funding Uplift, to maintain the HealthPathways statewide licence.
| 2023-24 $‘000 | 2024-25 $‘000 | 2025-26 $‘000 | 2026-27 $‘000 | 2027-28 $‘000 | ||||||||||||||||
Hospital Discharge Initiatives | — | — | — | — | — | |||||||||||||||
The government is providing additional funding of $20.0 million over 4 years, from within the $4.393 billion Growth Funding Uplift, to enhance patient flow through the expansion of the Long Stay Rapid Response program and Queensland Civil and Administrative Tribunal Bedside Hearing program.
128
Budget Measures 2024-25
| 2023-24 $‘000 | 2024-25 $‘000 | 2025-26 $‘000 | 2026-27 $‘000 | 2027-28 $‘000 | ||||||||||||||||
Queensland Ambulance Service | — | — | — | — | — | |||||||||||||||
The government is providing additional funding of $265.9 million over 4 years, from within the $4.393 billion Growth Funding Uplift, to the Queensland Ambulance Service to respond to the growing and changing demand for pre-hospital health care service and maintain activity growth and performance.
| 2023-24 $‘000 | 2024-25 $‘000 | 2025-26 $‘000 | 2026-27 $‘000 | 2027-28 $‘000 | ||||||||||||||||
Queensland Community Pharmacy Scope of Practice Pilot | — | — | — | — | — | |||||||||||||||
The government is providing additional funding of $13.0 million over 2 years, from within the $4.393 billion Growth Funding Uplift, to expand and implement a statewide trial of community pharmacists working to their full scope.
The Pharmacy Scope of Practice Pilot provides a nation-first opportunity to optimise the scope of practice for pharmacists to increase access to high quality, integrated and cost-effective primary healthcare and lessen the impact of workforce shortages and distribution problems across Queensland communities.
| 2023-24 $‘000 | 2024-25 $‘000 | 2025-26 $‘000 | 2026-27 $‘000 | 2027-28 $‘000 | ||||||||||||||||
Queensland Health Cyber Security Program | — | — | — | — | — | |||||||||||||||
The government is providing additional funding of $13.6 million over 4 years, from within the $4.393 billion Growth Funding Uplift, to ensure security capabilities and technologies keep pace with digitising healthcare security needs and that critical infrastructure and services are safe, secure, reliable, highly available and fit for purpose.
129
Budget Measures 2024-25
| 2023-24 $’000 | 2024-25 $’000 | 2025-26 $’000 | 2026-27 $’000 | 2027-28 $’000 | ||||||||||||||||
Queensland Health Workforce | — | — | — | — | — | |||||||||||||||
The government is providing additional funding of $222.4 million over 4 years, from within the $4.393 billion Growth Funding Uplift, in response to Queensland Health’s workforce challenges; with a focus on supporting and retaining the current workforce; building and attracting new pipelines of talent; and adapting and innovating new ways to deliver. This includes funding to implement a new electronic workforce rostering system to enable best practice in rostering frontline staff to deliver safe, affordable, sustainable and high-quality care to Queenslanders.
A further $215.9 million over 4 years will be met by Queensland Health to continue the Workforce Attraction Incentive Scheme; school-based traineeship programs; and supporting the fee-free Free Diploma of Nursing TAFE course. This will also fund the Queensland Government’s new Reproductive Leave policy.
Total funding for these initiatives is $438.3 million over 4 years from 2024-25.
| 2023-24 $’000 | 2024-25 $’000 | 2025-26 $’000 | 2026-27 $’000 | 2027-28 $’000 | ||||||||||||||||
Sexual Assault Response | — | — | — | — | — | |||||||||||||||
The government is providing additional funding of $56.0 million over 4 years, from within the $4.393 billion Growth Funding Uplift, to establish a new statewide forensic examination model of care, as a component of a new sexual assault response service, for both adults and children.
130
Budget Measures 2024-25
| 2023-24 $‘000 | 2024-25 $‘000 | 2025-26 $‘000 | 2026-27 $‘000 | 2027-28 $‘000 | ||||||||||||||||
Specialist Palliative Care in Aged Care | — | — | — | — | — | |||||||||||||||
The government is providing additional funding of $12.8 million over 4 years, from within the $4.393 billion Growth Funding Uplift, to continue Specialist Palliative Care in Aged Care (SPACE) and improve palliative and end-of-life care for people living in residential aged care facilities across Queensland. Under the SPACE model, each Hospital and Health Service delivers contextually appropriate models of care in their local area, partnering with residential aged care staff, families, general practitioners, as well as statewide services to manage complex care needs, support the provision of generalist palliative care, build capacity, and streamline care coordination.
Additional funding of $8.4 million is being met by the Australian Government over 2 years from 2024-25. This brings total funding for SPACE to $21.2 million.
| 2023-24 $‘000 | 2024-25 $‘000 | 2025-26 $‘000 | 2026-27 $‘000 | 2027-28 $‘000 | ||||||||||||||||
Voluntary Assisted Dying | — | — | — | — | — | |||||||||||||||
The government is providing additional funding of $18.0 million over 4 years, from within the $4.393 billion Growth Funding Uplift, toward the Voluntary Assisted Dying program.
| 2023-24 $‘000 | 2024-25 $‘000 | 2025-26 $‘000 | 2026-27 $‘000 | 2027-28 $‘000 | ||||||||||||||||
Women and Girls’ Health Strategy | — | — | — | — | — | |||||||||||||||
The government is providing additional funding of $157.3 million over 4 years, from within the $4.393 billion Growth Funding Uplift, for the Women and Girls’ Health Strategy aimed at improving women’s experience of the healthcare system and to address gender-based health inequity. This includes mental health and wellbeing, chronic health conditions such as endometriosis and pelvic pain, maternity care for mums and bubs, and sexual and reproductive health.
A further $56.2 million will be met internally by Queensland Health to support these initiatives.
This forms part of the government’s total additional funding of $247.9 million over 5 years, which commenced in 2023-24, for the Queensland Women and Girls’ Health Strategy 2032.
Further details can be found in the Department of Justice and Attorney-General section of this chapter.
131
Budget Measures 2024-25
Queensland Police Service
| 2023-24 $‘000 | 2024-25 $‘000 | 2025-26 $‘000 | 2026-27 $‘000 | 2027-28 $‘000 | ||||||||||||||||
900 New Police Personnel | — | 26,887 | 98,675 | 179,092 | 183,244 | |||||||||||||||
The government is providing additional funding of $487.9 million over 4 years and $183.2 million per annum ongoing for 900 additional police personnel to meet increasing policing demands in serving communities and keeping Queenslanders safe.
This initiative is part of the $1.28 billion Community Safety Plan for Queensland. The capital component to this measure can be found in Chapter 3 Capital measures.
| 2023-24 $‘000 | 2024-25 $‘000 | 2025-26 $‘000 | 2026-27 $‘000 | 2027-28 $‘000 | ||||||||||||||||
Community Support Funding for Non-Government Organisations | 12,000 | 18,678 | 13,982 | 13,982 | 13,982 | |||||||||||||||
The government is providing additional funding of $72.6 million over 5 years and $14 million per annum ongoing to support non-government community organisations which provide services to keep Queenslanders safe. These include Surf Life Saving Queensland, Royal Life Saving Society Queensland, Emergency Services Cadets Program delivered by the Police-Citizens Youth Club, Neighbourhood Watch Queensland, Crime Stoppers Queensland, Queensland Homicide Victims Support Group and the Stop the Coward Punch Campaign.
| 2023-24 $‘000 | 2024-25 $‘000 | 2025-26 $‘000 | 2026-27 $‘000 | 2027-28 $‘000 | ||||||||||||||||
Caboolture Watchhouse Hub | 29,850 | 15,085 | — | — | — | |||||||||||||||
The government has provided additional funding of $1.8 million in 2023-24 to operationalise the Caboolture Watchhouse Hub for young people.
The government is providing a further $43.2 million, held centrally, to be remitted on an acquittal basis for actual costs incurred. This brings the total funding available for this program to $45 million over 2 years.
This forms part of the government’s total funding of $59.3 million over 2 years to provide interim capacity at the Caboolture Watchhouse Hub. The capital component of this measure can be found in Chapter 3 Capital measures.
132
Budget Measures 2024-25
| 2023-24 $‘000 | 2024-25 $‘000 | 2025-26 $‘000 | 2026-27 $‘000 | 2027-28 $‘000 | ||||||||||||||||
Queensland Police-Citizens Youth Club (PCYC) Caloundra | — | 15,000 | — | — | — | |||||||||||||||
The government is providing additional grant funding of $15 million in 2024-25 to construct a new PCYC at Caloundra that will offer youth development programs, sport, recreation and community run activities as well as youth engagement opportunities to prevent crime and target youth offending, recidivism, and victimisation.
This initiative is part of the $1.28 billion Community Safety Plan for Queensland.
| 2023-24 $‘000 | 2024-25 $‘000 | 2025-26 $‘000 | 2026-27 $‘000 | 2027-28 $‘000 | ||||||||||||||||
Towing Scheme for Victims of Property Crime | 10,500 | 10,500 | 10,500 | 10,500 | 10,500 | |||||||||||||||
The government is providing additional funding of $2.5 million over 5 years and $500,000 per annum ongoing from 2028-29 and up to a further $50 million over 5 years and $10 million per annum ongoing from 2028-29 held centrally for the expanded Police Towing of Motor Vehicles Scheme.
| 2023-24 $‘000 | 2024-25 $‘000 | 2025-26 $‘000 | 2026-27 $‘000 | 2027-28 $‘000 | ||||||||||||||||
Integrated Strategy Addressing Youth Crime in North Queensland | 13,097 | 8,556 | 1,056 | 1,056 | 1,056 | |||||||||||||||
The government is providing additional funding of $9.8 million over 5 years and $1.1 million ongoing, and up to $15 million held centrally over 2 years, for the immediate establishment of an interim police aerial support capability for POLAIR based in Townsville, including contemporary communication and aerial video downlink capability. The government is also providing additional funding, held centrally (not for publication at this time due to ongoing procurement), to make this capability permanent. This capability will assist police in tracking vehicles, arrest offenders and locate missing persons to enhance community safety, including periodic deployment to other North Queensland locations as required.
The capital component of this measure can be found in Chapter 3 Capital measures.
133
Budget Measures 2024-25
| 2023-24 $‘000 | 2024-25 $‘000 | 2025-26 $‘000 | 2026-27 $‘000 | 2027-28 $‘000 | ||||||||||||||||
Community Safety Initiatives in the South West Brisbane and Ipswich Areas | 468 | 8,456 | 8,663 | 8,870 | 9,083 | |||||||||||||||
The government is providing additional funding of $35.5 million over 5 years and $9.3 million per annum ongoing from 2028-29 to deliver extra police resources for South West Brisbane and Ipswich areas, including additional police officers, Mobile Police Beats and police vehicles to deploy high visibility proactive activities.
The capital component to this measure can be found in Chapter 3 Capital measures.
| 2023-24 $‘000 | 2024-25 $‘000 | 2025-26 $‘000 | 2026-27 $‘000 | 2027-28 $‘000 | ||||||||||||||||
Commission of Inquiry into Forensic DNA Testing in Queensland Recommendation Implementation and Associated Resourcing | 7,901 | 7,231 | 7,434 | 7,625 | 7,625 | |||||||||||||||
The government is providing additional funding of $37.5 million over 5 years from 2023-24 and $7.6 million ongoing from 2028-29 to implement case management forensic investigation, and streamline collection processes to realise recommendations arising from the Commission of Inquiry into Forensic DNA Testing in Queensland.
This forms part of the government’s total funding package of $202.7 million over 6 years (2022-23 to 2027-28), with a recurrent funding boost of $22.3 million from 2027-28, in response to the Commission of Inquiry into Forensic DNA Testing in Queensland.
| 2023-24 $‘000 | 2024-25 $‘000 | 2025-26 $‘000 | 2026-27 $‘000 | 2027-28 $‘000 | ||||||||||||||||
Implementation of the Commission of Inquiry Recommendations into Queensland Police Service to Domestic and Family Violence | 4,374 | 6,227 | — | — | — | |||||||||||||||
The government is providing increased funding of $10.6 million over 2 years to support the establishment of specialist implementation teams to deliver A Call for Change - Commission of Inquiry into the Queensland Police Service responses to domestic and family violence recommendations. This investment will support the delivery of more victim liaison officers, domestic and family violence support workers in police stations, specialist domestic and family violence officers and specialist police prosecutors.
Further details can be found in the Queensland Police Service section of Chapter 3 Capital measures.
134
Budget Measures 2024-25
| 2023-24 $‘000 | 2024-25 $‘000 | 2025-26 $‘000 | 2026-27 $‘000 | 2027-28 $‘000 | ||||||||||||||||
Wacol Youth Remand Facility Operating and Maintenance Costs | — | 5,278 | 10,696 | 5,419 | — | |||||||||||||||
The government is providing additional funding of $21.4 million over 3 years for the operating and maintenance costs for the Wacol Youth Remand Centre to boost capacity and provide best-practice services to young people in detention.
| 2023-24 $‘000 | 2024-25 $‘000 | 2025-26 $‘000 | 2026-27 $‘000 | 2027-28 $‘000 | ||||||||||||||||
Camera Detected Offence Program | — | 4,449 | 634 | 321 | 321 | |||||||||||||||
The government is providing increased funding of $5.7 million over 4 years to deliver the Camera Detected Offence Program initiatives in conjunction with the Department of Transport and Main Roads, to help keep Queensland roads safe.
This forms part of the government’s total funding of $78.9 million over 4 years, and $23.1 million per annum ongoing, as part of the Camera Detected Offence Program.
Further details can be found in the Department of Transport and Main Roads section of this chapter.
| 2023-24 $‘000 | 2024-25 $‘000 | 2025-26 $‘000 | 2026-27 $‘000 | 2027-28 $‘000 | ||||||||||||||||
Prevention of Knife Crime | 2,250 | 3,400 | 350 | — | — | |||||||||||||||
The government is providing additional funding of $6 million over 3 years for an education campaign about the Summary Offences (Prevention of Knife Crime) and Other Legislation Amendment Act 2024 and grants to the Jack Beasley Foundation and the Balin Stewart Foundation.
135
Budget Measures 2024-25
| 2023-24 $‘000 | 2024-25 $‘000 | 2025-26 $‘000 | 2026-27 $‘000 | 2027-28 $‘000 | ||||||||||||||||
From Frontline to Family - Building Our Workforce for a Sustainable and Family-centred Coronial System | — | 3,171 | 3,258 | 3,337 | 3,417 | |||||||||||||||
The government is providing additional funding of $13.2 million over 4 years and $3.4 million per annum ongoing to support a sustainable and family-centred coronial system, enhancing public safety for Queenslanders and improving community confidence.
| 2023-24 $‘000 | 2024-25 $‘000 | 2025-26 $‘000 | 2026-27 $‘000 | 2027-28 $‘000 | ||||||||||||||||
Emergency Management and Coordination Command Enhancement | — | 3,029 | — | — | — | |||||||||||||||
The government is providing increased funding of $3.0 million in 2024-25 to support the national Emergency Alert Telephone Warning System and to develop a plan for an Australian Warning System digital platform for Queensland.
| 2023-24 $‘000 | 2024-25 $‘000 | 2025-26 $‘000 | 2026-27 $‘000 | 2027-28 $‘000 | ||||||||||||||||
Watchhouse Modernisation Program | — | 3,000 | — | — | — | |||||||||||||||
The government is providing additional initial funding of $3 million in 2024-25 to modernise and upgrade the Queensland Police Service’s network of watchhouses to improve safety and security for all detainees and staff.
The capital component to this measure can be found in Chapter 3 Capital measures.
136
Budget Measures 2024-25
| 2023-24 $‘000 | 2024-25 $‘000 | 2025-26 $‘000 | 2026-27 $‘000 | 2027-28 $‘000 | ||||||||||||||||
Conducted Electrical Weapon Fleet Replacement Project | — | 2,833 | 2,833 | 2,834 | — | |||||||||||||||
The government is providing additional funding of $8.5 million over 3 years to purchase an enhanced fleet of less lethal Taser 10 weapons which will save lives and reduce harm to police officers and the community.
This initiative is part of the $1.28 billion Community Safety Plan for Queensland.
| 2023-24 $‘000 | 2024-25 $‘000 | 2025-26 $‘000 | 2026-27 $‘000 | 2027-28 $‘000 | ||||||||||||||||
Bullyproof Australia | 4,000 | 2,800 | 2,600 | 2,600 | — | |||||||||||||||
The government is providing additional funding of $12 million over 4 years to deliver resilience programs that prevent and manage bullying situations, improve mental wellbeing of students and teachers and improve academic performance in Queensland primary and secondary schools.
| 2023-24 $‘000 | 2024-25 $‘000 | 2025-26 $‘000 | 2026-27 $‘000 | 2027-28 $‘000 | ||||||||||||||||
Advanced Data Analytics Capability | 726 | 2,408 | 1,190 | 1,675 | 1,675 | |||||||||||||||
The government is providing additional funding of $7.7 million over 5 years and $1.7 million per annum ongoing for enhanced data analytic capability to support strategic decision making and frontline policing operations.
The capital component of this measure can be found in Chapter 3 Capital measures.
137
Budget Measures 2024-25
| 2023-24 $‘000 | 2024-25 $‘000 | 2025-26 $‘000 | 2026-27 $‘000 | 2027-28 $‘000 | ||||||||||||||||
Queensland Police-Citizens Youth Club (PCYC) Redcliffe | — | 2,000 | — | — | — | |||||||||||||||
The government is providing additional grant funding of $2 million in 2024-25 to revitalise the Redcliffe PCYC to improve social program delivery and intervention initiatives targeting youth offending, recidivism, and victimisation.
This initiative is part of the $1.28 billion Community Safety Plan for Queensland.
| 2023-24 $‘000 | 2024-25 $‘000 | 2025-26 $‘000 | 2026-27 $‘000 | 2027-28 $‘000 | ||||||||||||||||
Weapons Licensing Management System Replacement Project | 832 | 1,790 | 1,287 | 1,012 | 1,053 | |||||||||||||||
The government is providing increased funding of $6.0 million over 5 years and $1.1 million ongoing per annum to continue support for the weapons licensing function and to integrate online services and digital identity initiatives.
The capital component of this measure can be found in Chapter 3 Capital measures.
| 2023-24 $‘000 | 2024-25 $‘000 | 2025-26 $‘000 | 2026-27 $‘000 | 2027-28 $‘000 | ||||||||||||||||
Project Booyah Linked Early Intervention Program | 371 | 1,354 | 1,490 | 1,526 | 1,573 | |||||||||||||||
The government is providing additional funding of $6.3 million over 5 years, held centrally, to expand the Project Booyah program, including the Bike School and Adventure Journey in Inala to improve support for vulnerable Queensland kids.
138
Budget Measures 2024-25
| 2023-24 $‘000 | 2024-25 $‘000 | 2025-26 $‘000 | 2026-27 $‘000 | 2027-28 $‘000 | ||||||||||||||||
Queensland Government Air Funding and Operating Model | 1,624 | 1,176 | 1,176 | — | — | |||||||||||||||
The government is providing increased funding of $4.0 million over 3 years to deliver lifesaving community support to Queenslanders including search and rescue, natural disaster relief, police and aeromedical operations, including organ retrievals, and transport services for government.
| 2023-24 $‘000 | 2024-25 $‘000 | 2025-26 $‘000 | 2026-27 $‘000 | 2027-28 $‘000 | ||||||||||||||||
Police Youth Co-responder Teams Extension and Expansion | — | 1,060 | 1,005 | — | — | |||||||||||||||
The government is providing increased funding of $2.1 million over 2 years to establish new Youth Co-Responder Teams in the Sunshine Coast and South West, expand the Youth Co-Responder Teams in the Gold Coast, Cairns and South Brisbane to deal with or divert high risk young people, including those on bail and those subject to electronic monitoring.
This initiative is part of the $1.28 billion Community Safety Plan for Queensland. The capital component to this measure can be found in Chapter 3 Capital measures.
| 2023-24 $‘000 | 2024-25 $‘000 | 2025-26 $‘000 | 2026-27 $‘000 | 2027-28 $‘000 | ||||||||||||||||
Digital Evidence Capability Program | — | 992 | — | — | — | |||||||||||||||
The government is providing additional funding of $1.0 million in 2024-25 to continue updates to the current digital evidence management system, and undertake a business case for a longer-term future digital evidence capability.
The capital component to this measure can be found in Chapter 3 Capital measures.
139
Budget Measures 2024-25
| 2023-24 $‘000 | 2024-25 $‘000 | 2025-26 $‘000 | 2026-27 $‘000 | 2027-28 $‘000 | ||||||||||||||||
Expansion of Metal Detection Program | — | 900 | — | — | — | |||||||||||||||
The government is providing additional funding of $900,000 in 2024-25 to provide an additional 3,000 metal detecting devices across Queensland for expansion of the wanding program to address the 2024 ‘Jack’s Law’ amendments and further combat knife crime and youth offending to help protect the community.
This initiative is part of the $1.28 billion Community Safety Plan for Queensland.
| 2023-24 $‘000 | 2024-25 $‘000 | 2025-26 $‘000 | 2026-27 $‘000 | 2027-28 $‘000 | ||||||||||||||||
Additional POLAIR Flight Hours in South East Queensland | — | 753 | 776 | 799 | 839 | |||||||||||||||
The government is providing additional funding of $8.7 million over 10 years from 2024-25 to provide additional flight hours for POLAIR capability in South East Queensland to assist police to track vehicles, arrest offenders and locate missing persons to enhance community safety.
| 2023-24 $‘000 | 2024-25 $‘000 | 2025-26 $‘000 | 2026-27 $‘000 | 2027-28 $‘000 | ||||||||||||||||
Gangs Exit Program | — | 638 | 638 | — | — | |||||||||||||||
The government is providing increased funding of $1.3 million over 2 years to continue the crime reduction Exit Program and to coordinate with Queensland Corrective Services to pilot the program in Queensland correctional centres. This forms part of the government’s total funding of $2.1 million over 2 years to pilot the introduction of the Exit Program in selected correctional centres.
This initiative is part of the $1.28 billion Community Safety Plan for Queensland.
140
Budget Measures 2024-25
| 2023-24 $‘000 | 2024-25 $‘000 | 2025-26 $‘000 | 2026-27 $‘000 | 2027-28 $‘000 | ||||||||||||||||
Electronic Monitoring of Adult Bailees | — | 587 | 927 | 927 | 927 | |||||||||||||||
The government is providing increased funding of $3.4 million over 4 years and $927,000 per annum ongoing for the continuation of the existing Electronic Monitoring of Adult Bailees Program.
This initiative is part of the $1.28 billion Community Safety Plan for Queensland.
| 2023-24 $‘000 | 2024-25 $‘000 | 2025-26 $‘000 | 2026-27 $‘000 | 2027-28 $‘000 | ||||||||||||||||
Court Reforms Tackling Youth and Adult Crime | — | 176 | 717 | — | — | |||||||||||||||
The government is providing $893,000 over 2 years from 2024-25 to support the court reforms tackling youth and adult crime, including the continuation of the Townsville Youth Court and Court Link.
This initiative is part of the $1.28 billion Community Safety Plan for Queensland.
| 2023-24 $‘000 | 2024-25 $‘000 | 2025-26 $‘000 | 2026-27 $‘000 | 2027-28 $‘000 | ||||||||||||||||
Aeromedical Hub | — | — | 3,562 | 3,704 | 3,852 | |||||||||||||||
The government will provide additional funding of $3.6 million per annum from 2025-26 onwards with the annual allocation to be escalated at a rate of 4 percent per annum to 2046-47 for facility rental costs to enable Queensland Government agencies and not for profit organisations to operate lifesaving services through the Queensland Aeromedical Hub.
141
Budget Measures 2024-25
| 2023-24 $‘000 | 2024-25 $‘000 | 2025-26 $‘000 | 2026-27 $‘000 | 2027-28 $‘000 | ||||||||||||||||
Interim Police Aerial Support Capability | — | — | — | — | — | |||||||||||||||
The government is providing additional funding (not for publication at this time due to ongoing procurement) to deliver interim Police aerial enforcement capabilities, including two helicopters for response work in Far North Queensland and Wide Bay/Sunshine Coast and new drone capability in priority regions across Queensland.
This initiative is part of the $1.28 billion Community Safety Plan for Queensland. The capital component to this measure can be found in Chapter 3 Capital measures.
| 2023-24 $‘000 | 2024-25 $‘000 | 2025-26 $‘000 | 2026-27 $‘000 | 2027-28 $‘000 | ||||||||||||||||
National Firearms Register | — | — | — | — | — | |||||||||||||||
The government is providing additional funding for the costs associated with Queensland’s support for the National Firearms Register.
This funding contribution is not for publication at this time due to being subject to ongoing negotiation, between the Commonwealth and all States and Territories, of a Federal Financial Relations agreement to confirm the funding arrangements for the implementation of the National Firearms Register.
142
Budget Measures 2024-25
Queensland Treasury
| 2023-24 $‘000 | 2024-25 $‘000 | 2025-26 $‘000 | 2026-27 $‘000 | 2027-28 $‘000 | ||||||||||||||||
Temporary Doubling of the First Home Owner Grant | 12,300 | 85,300 | 75,600 | 26,800 | 9,700 | |||||||||||||||
The government is providing additional funding to temporarily double the First Home Owner Grant from $15,000 to $30,000 for eligible transactions entered into between 20 November 2023 and 30 June 2025 (inclusive). The increased grant provides financial support to eligible first home buyers purchasing or building a new home.
Payments of the boosted grant will continue to flow to eligible first home buyers over the forward estimates period given the time taken for the construction of many eligible new homes to the point when the grant becomes payable.
It is estimated this measure will provide additional support of around $210 million over 4 years to approximately 12,000 first home buyers.
| 2023-24 $‘000 | 2024-25 $‘000 | 2025-26 $‘000 | 2026-27 $‘000 | 2027-28 $‘000 | ||||||||||||||||
Gympie Road Bypass Pre-construction Works | — | 33,000 | 33,000 | 252,000 | — | |||||||||||||||
The government is providing funding of $318 million over 3 years from 2024-25 to progress the Gympie Road Bypass Project to the next stage.
The next stage involves Queensland Investment Corporation (QIC) progressing pre-construction works supported by Queensland Treasury. As part of this stage, Queensland Treasury, the Department of Transport and Main Roads, and QIC will investigate opportunities to optimise the commercial value of tolling rights on existing SEQ toll roads following the conclusion of existing concessional arrangements. QIC will also undertake related activities such as geo-technical investigations, development of a detailed reference design, voluntary land acquisitions, preparatory works for required approvals and continued community consultation.
This forms part of the government’s total funding of $335 million over 3 years to progress the Gympie Road Bypass project. Further details on this initiative can be found in the Department of Transport and Main Roads section of this chapter.
143
Budget Measures 2024-25
| 2023-24 $‘000 | 2024-25 $‘000 | 2025-26 $‘000 | 2026-27 $‘000 | 2027-28 $‘000 | ||||||||||||||||
Queensland Revenue Office - Revenue and Penalty Debt Administration and Resourcing | — | 19,661 | 28,004 | 34,131 | 35,188 | |||||||||||||||
The government is providing additional funding of $117.0 million over 4 years and $35.2 million per annum ongoing to ensure effective and sustainable revenue and penalty debt administration, including to help fund government responses to address cost-of-living pressures and housing.
The revenue component of this measure can be found in Chapter 4 Revenue measures.
| 2023-24 $‘000 | 2024-25 $‘000 | 2025-26 $‘000 | 2026-27 $‘000 | 2027-28 $‘000 | ||||||||||||||||
Mount Isa Acceleration Fund | — | 10,000 | 20,000 | — | — | |||||||||||||||
The government is providing funding of $30 million to accelerate development of resource projects in the North West Minerals Province. Funding is expected to be distributed over 2 years based on individual agreement and the achievement of milestones by recipients.
This forms part of the government’s total funding package of $50 million to support workers affected by the pending closure of Glencore’s Mount Isa copper mine and copper concentrator and the Lady Loretta zinc mine.
Further details on this initiative can be found in the Department of State Development and Infrastructure section of this chapter.
| 2023-24 $‘000 | 2024-25 $‘000 | 2025-26 $‘000 | 2026-27 $‘000 | 2027-28 $‘000 | ||||||||||||||||
Camera Detected Offence Program | — | 7,135 | 7,184 | 7,163 | 7,352 | |||||||||||||||
The government is providing increased funding of $28.8 million over 4 years and $7.4 million per annum ongoing to Queensland Revenue Office for the Camera Detected Offence Program.
This forms part of the government’s total funding of $78.9 million over 4 years, and $23.1 million per annum ongoing, as part of the Camera Detected Offence Program. Further details can be found in Department of Transport and Main Roads and Queensland Police Service sections of this chapter. The capital component of this measure can be found in the Department of Transport and Main Roads section of Chapter 3 Capital measures.
144
Budget Measures 2024-25
| 2023-24 $‘000 | 2024-25 $‘000 | 2025-26 $‘000 | 2026-27 $‘000 | 2027-28 $‘000 | ||||||||||||||||
Queensland Revenue Office - Digital and Data Uplift | — | 5,764 | 2,048 | 2,061 | 2,074 | |||||||||||||||
The government is providing additional funding of $11.9 million over 4 years and $2.1 million per annum ongoing to improve and secure Queensland Revenue Office’s technology, data, and telephony systems to enable effective and efficient revenue administration.
| 2023-24 $‘000 | 2024-25 $‘000 | 2025-26 $‘000 | 2026-27 $‘000 | 2027-28 $‘000 | ||||||||||||||||
Mental Health Levy Administration and Resourcing | — | 4,127 | 4,248 | 4,355 | 4,465 | |||||||||||||||
The government is providing increased funding of $17.2 million over 4 years and $4.5 million per annum ongoing for Queensland Revenue Office to retain ongoing capacity to administer the Mental Health Levy, and to ensure effective collection of revenue for Queensland and to continue to deliver on the government’s commitment to provide a sustainable funding source for mental health services.
| 2023-24 $‘000 | 2024-25 $‘000 | 2025-26 $‘000 | 2026-27 $‘000 | 2027-28 $‘000 | ||||||||||||||||
Commercial and Investment Due Diligence and Projects | 4,000 | 4,000 | — | — | — | |||||||||||||||
The government is providing additional funding of $8 million over 2 years from 2023-24 for due diligence and project analysis related to major commercial and investment transactions.
145
Budget Measures 2024-25
| 2023-24 $‘000 | 2024-25 $‘000 | 2025-26 $‘000 | 2026-27 $‘000 | 2027-28 $‘000 | ||||||||||||||||
Combustible Cladding | — | 1,200 | — | — | — | |||||||||||||||
The government is providing additional funding of $1.2 million in 2024-25 to undertake further analysis on options to ensure cladding fire risk in privately-owned buildings is appropriately addressed.
| 2023-24 $‘000 | 2024-25 $‘000 | 2025-26 $‘000 | 2026-27 $‘000 | 2027-28 $‘000 | ||||||||||||||||
Townsville North Rail Yards | — | 500 | — | — | — | |||||||||||||||
The government is providing additional funding of $500,000 in 2024-25 to support delivery of the project. A further $35 million is available, held centrally, representing the State’s contribution to the project subject to due diligence and contributions from the proponent.
| 2023-24 $‘000 | 2024-25 $‘000 | 2025-26 $‘000 | 2026-27 $‘000 | 2027-28 $‘000 | ||||||||||||||||
Backing Business in the Bush Fund | — | — | — | — | — | |||||||||||||||
Funding of $50 million over 4 years is being reprioritised to the Backing Business in the Bush Fund to support Queensland-based Small to Medium Enterprises to deliver business improvement projects in regional Queensland.
146
Budget Measures 2024-25
| 3 | Capital Measures |
Introduction
The following tables present the relevant portfolio capital measures relating to decisions taken since the 2023-24 Budget. This does not represent the full amount of additional funding provided to agencies since the 2023-24 Budget. For further explanation, refer to Explanation of Scope and Terms in Chapter.
147
Budget Measures 2024-25
Department of Child Safety, Seniors and Disability Services
| 2023-24 $‘000 | 2024-25 $‘000 | 2025-26 $‘000 | 2026-27 $‘000 | 2027-28 $‘000 | ||||||||||||||||
Unify Program - Continuous Improvement Pipeline | — | 4,889 | 7,373 | 4,943 | 5,141 | |||||||||||||||
The government is providing increased funding of $22.3 million over 4 years and $5.1 million per annum ongoing for enhancements to the Unify system, the new contemporary integrated case and client management system for all children who come in contact with the child protection and youth justice systems in Queensland. The increased funding will also support the gradual ramp down of current program resourcing to enable the delivery of high-priority business needs that were not in scope for the first functional release in Tranche 1.
The expense component to this measure can be found in Chapter 2 Expense measures.
| 2023-24 $‘000 | 2024-25 $‘000 | 2025-26 $‘000 | 2026-27 $‘000 | 2027-28 $‘000 | ||||||||||||||||
Forensic Disability Services Precinct at Wacol - Upgrade Facilities | 635 | 2,862 | — | — | — | |||||||||||||||
The government is providing increased funding of $3.5 million over 2 years to restore and upgrade facilities within the Forensic Disability Services at Wacol, including major repairs and upgrade works at House 2, to maximise capacity for service delivery.
148
Budget Measures 2024-25
Department of Education
| 2023-24 $‘000 | 2024-25 $‘000 | 2025-26 $‘000 | 2026-27 $‘000 | 2027-28 $‘000 | ||||||||||||||||
Sustainable Investment in Schools | — | 34,000 | 100,000 | 100,000 | 100,000 | |||||||||||||||
The government is providing increased funding of $334 million over 4 years to prioritise delivery and planning of high-quality learning environments to meet enrolment needs including, where necessary, safety and accessibility upgrades to ensure the availability of safe and accessible school facilities for all students and teachers.
Total funding for this initiative is $500 million over 4 years. The expense component of this measure can be found in Chapter 2 Expense measures.
| 2023-24 $‘000 | 2024-25 $‘000 | 2025-26 $‘000 | 2026-27 $‘000 | 2027-28 $‘000 | ||||||||||||||||
Playgrounds and Tuckshops Program | 6,555 | 26,219 | 32,772 | — | — | |||||||||||||||
The government is providing increased funding of $65.5 million over 3 years for additional projects under the Playgrounds and Tuckshops Program.
Total funding provided for this initiative is $101.2 million over 4 years. The expense component of this measure can be found in Chapter 2 Expense measures.
| 2023-24 $‘000 | 2024-25 $‘000 | 2025-26 $‘000 | 2026-27 $‘000 | 2027-28 $‘000 | ||||||||||||||||
Preventing Youth Justice Involvement Through Educational Engagement | — | 22,500 | 53,438 | 16,875 | — | |||||||||||||||
The government is providing additional funding of $92.8 million over 3 years for youth engagement activities. This includes $27.9 million over 2 years to support arrange of youth engagement initiatives and $64.9 million over 3 years, held centrally, for the delivery of 4 additional Queensland Pathways State College campuses.
This initiative will enable the department to lift capacity to support at-risk students across the state acknowledging the increased demand for specialist support.
Total funding for this initiative is $288.2 million over 5 years. The expense component of this measure can be found in Chapter 2 Expense measures.
149
Budget Measures 2024-25
Department of Environment, Science and Innovation
| 2023-24 $‘000 | 2024-25 $‘000 | 2025-26 $‘000 | 2026-27 $‘000 | 2027-28 $‘000 | ||||||||||||||||
Better Queensland Parks - Fire Management Uplift Program | — | 18,118 | — | — | — | |||||||||||||||
The government is providing increased funding of $18.1 million to support critical firefighter needs and bushfire risk in a changing climate, improve community safety and safeguard natural and cultural values, including World Heritage values, through the purchase of specialised plant and equipment and infrastructure upgrades.
The expense component of this measure can be found in Chapter 2 Expense measures.
| 2023-24 $‘000 | 2024-25 $‘000 | 2025-26 $‘000 | 2026-27 $‘000 | 2027-28 $‘000 | ||||||||||||||||
K’gari Dingo Management Enhanced Actions | 2,325 | 7,500 | 4,825 | — | — | |||||||||||||||
The government is providing additional funding of $14.7 million over 3 years to support expanded ranger accommodation, vehicles, signage and an upgrade of the Visitor Information Centre to enable enhanced K’gari visitor safety and dingo (wongari) conservation actions.
The expense component of this measure can be found in Chapter 2 Expense measures.
150
Budget Measures 2024-25
Department of Housing, Local Government, Planning and Public Works
| 2023-24 $‘000 | 2024-25 $‘000 | 2025-26 $‘000 | 2026-27 $‘000 | 2027-28 $‘000 | ||||||||||||||||
Homes for Queenslanders: a fair and sustainable housing system | — | 109,304 | 99,630 | 357,376 | 799,512 | |||||||||||||||
The government is providing additional funding of $1.366 billion over 4 years towards the delivery of new social housing and the social housing capital program.
The expense component of this measure can be found in Chapter 2 Expense measures.
This forms part of the government’s total funding package of $3.1 billion over 5 years for Homes for Queenslanders, the Queensland Government’s whole-of-system housing plan.
| 2023-24 $‘000 | 2024-25 $‘000 | 2025-26 $‘000 | 2026-27 $‘000 | 2027-28 $‘000 | ||||||||||||||||
Convention Centres: Capital Replacement | — | — | — | — | — | |||||||||||||||
Funding of $5.5 million in 2024-25 is being met internally for capital replacement works at the Gold Coast Convention and Exhibition Centre and the Cairns Convention Centre.
151
Budget Measures 2024-25
Department of Justice and Attorney-General
| 2023-24 $‘000 | 2024-25 $‘000 | 2025-26 $‘000 | 2026-27 $‘000 | 2027-28 $‘000 | ||||||||||||||||
Accommodation to support the domestic and family violence courthouse upgrade | 1,089 | 3,900 | 1,386 | — | — | |||||||||||||||
The government is providing additional funding of $6.4 million over 3 years to support the enhancement of Queensland Courts to ensure the safety of victims.
The expense component of this measure can be found in Chapter 2 Expense measures.
| 2023-24 $‘000 | 2024-25 $‘000 | 2025-26 $‘000 | 2026-27 $‘000 | 2027-28 $‘000 | ||||||||||||||||
Support for the Queensland Civil and Administrative Tribunal workforce | 135 | 2,865 | — | — | — | |||||||||||||||
The government is providing additional funding of $3 million over 2 years to the Queensland Civil and Administrative Tribunal to address demand pressures.
The expense component of this measure can be found in Chapter 2 Expense measures.
| 2023-24 $‘000 | 2024-25 $‘000 | 2025-26 $‘000 | 2026-27 $‘000 | 2027-28 $‘000 | ||||||||||||||||
Brisbane Supreme and District Court - courtroom expansion | — | 2,010 | 8,941 | 10,972 | 3,395 | |||||||||||||||
The government is providing additional funding of $25.3 million over 4 years to expand courtroom capacity at the Brisbane Supreme and District Court to help mitigate demand on the Beenleigh courthouse.
The expense component of this measure can be found in Chapter 2 Expense measures.
152
Budget Measures 2024-25
| 2023-24 $‘000 | 2024-25 $‘000 | 2025-26 $‘000 | 2026-27 $‘000 | 2027-28 $‘000 | ||||||||||||||||
Townsville Courthouse - courtroom expansion | — | 500 | 2,750 | 4,000 | 250 | |||||||||||||||
The government is providing additional funding of $7.5 million over 4 years to mitigate demand on the Townsville courthouse.
The expense component of this measure can be found in Chapter 2 Expense measures.
| 2023-24 $‘000 | 2024-25 $‘000 | 2025-26 $‘000 | 2026-27 $‘000 | 2027-28 $‘000 | ||||||||||||||||
Court Recording and transcription services | — | 250 | — | — | — | |||||||||||||||
The government is providing increased funding of $250,000 in 2024-25 to support the continuation of the court recording and transcription services.
The expense component of this measure can be found in Chapter 2 Expense measures.
| 2023-24 $‘000 | 2024-25 $‘000 | 2025-26 $‘000 | 2026-27 $‘000 | 2027-28 $‘000 | ||||||||||||||||
Support for Victims of Crime | 150 | — | — | — | — | |||||||||||||||
The government has provided increased funding of $150,000 to Victims Assist Queensland to support victims of crime.
The expense component of this measure can be found in Chapter 2 Expense measures.
153
Budget Measures 2024-25
| 2023-24 $‘000 | 2024-25 $‘000 | 2025-26 $‘000 | 2026-27 $‘000 | 2027-28 $‘000 | ||||||||||||||||
Victims Commissioner and Sexual Violence Case Review | — | — | — | — | — | |||||||||||||||
The government has provided $540,000 in 2023-24, from funds previously held centrally for responses to the Women’s Safety and Justice Taskforce recommendations, to establish an Office of the Victim’s Commissioner and sexual violence case review board
Total funding for these initiatives is $25.1 million over 5 years and up to $4 million per annum ongoing, which includes $15 million previously held centrally for responses to the Women’s Safety and Justice Taskforce recommendations.
The expense component of this measure can be found in Chapter 2 Expense measures.
154
Budget Measures 2024-25
Department of Resources
| 2023-24 $‘000 | 2024-25 $‘000 | 2025-26 $‘000 | 2026-27 $‘000 | 2027-28 $‘000 | ||||||||||||||||
Abandoned Mine Lands Program | 100 | 2,920 | 880 | 270 | — | |||||||||||||||
The government is providing increased funding of $4.2 million over 4 years to continue managing significant public health and safety, property and environmental risks at high-risk abandoned mine sites.
The expense component of this measure can be found in Chapter 2 Expense measures.
155
Budget Measures 2024-25
Department of State Development and Infrastructure
| 2023-24 $‘000 | 2024-25 $‘000 | 2025-26 $‘000 | 2026-27 $‘000 | 2027-28 $‘000 | ||||||||||||||||
Queensland Industrial Relations Commission Funding | 300 | — | — | — | — | |||||||||||||||
The government has provided additional funding of $300,000 in 2023-24 to accommodate the new Commissioners and associated staff.
| 2023-24 $‘000 | 2024-25 $‘000 | 2025-26 $‘000 | 2026-27 $‘000 | 2027-28 $‘000 | ||||||||||||||||
Racing Infrastructure | 30,000 | — | — | — | — | |||||||||||||||
The government has provided additional funding of $30 million in 2023-24 to Racing Queensland to deliver priority racing infrastructure.
156
Budget Measures 2024-25
Department of Transport and Main Roads
| 2023-24 $‘000 | 2024-25 $‘000 | 2025-26 $‘000 | 2026-27 $‘000 | 2027-28 $‘000 | ||||||||||||||||
Rail Replacement Buses | 45,427 | 88,773 | — | — | — | |||||||||||||||
The government is providing additional funding of $134.2 million over 2 years to procure 200 buses directly from local manufacturers. Buses are required to ensure coverage for rail replacement services for multiple significant track closures to support major rail construction projects.
The expense component of this measure can be found in Chapter 2 Expense measures.
| 2023-24 $‘000 | 2024-25 $‘000 | 2025-26 $‘000 | 2026-27 $‘000 | 2027-28 $‘000 | ||||||||||||||||
Pacific Motorway (M1) Varsity Lakes to Tugun | 202,308 | 82,500 | 60,000 | 85,192 | — | |||||||||||||||
The government is providing increased funding of $430 million over 4 years towards completion of the Varsity Lakes to Tugun upgrade project.
Funding includes $750 million funded by the Australian Government and $750 million from the State Government.
This brings total funding for the project to $1.5 billion.
| 2023-24 $‘000 | 2024-25 $‘000 | 2025-26 $‘000 | 2026-27 $‘000 | 2027-28 $‘000 | ||||||||||||||||
Direct Sunshine Coast Rail Line | 5,000 | 52,900 | 91,000 | 400,000 | 522,700 | |||||||||||||||
The government is providing additional funding of $2.750 billion over 8 years for the Direct Sunshine Coast Rail Line Project, which includes protection of the updated rail alignment all the way to Maroochydore.
Funding includes $2.75 billion funded by the Australian Government and $2.75 billion from the State Government.
This brings total funding for the project to $5.5 billion.
157
Budget Measures 2024-25
| 2023-24 $‘000 | 2024-25 $‘000 | 2025-26 $‘000 | 2026-27 $‘000 | 2027-28 $‘000 | ||||||||||||||||
Rockhampton Railyards Rejuvenation | — | 13,152 | 408 | 314 | 457 | |||||||||||||||
The government is providing additional funding of $14.3 million over 4 years for capital upgrades to facilitate leasing the industrial precinct.
The expense component of this measure can be found in Chapter 2 Expense measures.
| 2023-24 $‘000 | 2024-25 $‘000 | 2025-26 $‘000 | 2026-27 $‘000 | 2027-28 $‘000 | ||||||||||||||||
Multi-level Car Park at Weinam Creek Priority Development Area | — | 5,000 | 5,000 | 5,000 | — | |||||||||||||||
The government is providing additional funding of $15 million over 3 years from 2024-25, held centrally, to contribute towards the delivery of a planned multi-level car park at the Weinam Creek Priority Development Area.
| 2023-24 $‘000 | 2024-25 $‘000 | 2025-26 $‘000 | 2026-27 $‘000 | 2027-28 $‘000 | ||||||||||||||||
Coomera Connector Stage 1 | — | 3,000 | 179,095 | 144,905 | 91,000 | |||||||||||||||
The government is providing increased funding of $432 million over 5 years towards completion of the Coomera Connector Stage 1 project.
Funding includes $1.513 billion funded by the Australian Government and $1.513 billion from the State Government.
This brings total funding for the project to $3.026 billion.
158
Budget Measures 2024-25
| 2023–24 | 2024–25 | 2025–26 | 2026–27 | 2027–28 | ||||||||||||||||
| $‘000 | $‘000 | $‘000 | $‘000 | $‘000 | ||||||||||||||||
Beerburrum to Nambour Rail Upgrade Stage 1 Project | — | — | 144,595 | 36,105 | 26,000 | |||||||||||||||
The government will provide increased funding of $226.7 million over 4 years for the Beerburrum to Nambour Rail Upgrade Stage 1 project.
Funding includes $616.7 million funded by the Australian Government and $387.5 million from the State Government.
This brings total funding for the project to $1.004 billion.
| 2023–24 | 2024–25 | 2025–26 | 2026–27 | 2027–28 | ||||||||||||||||
| $‘000 | $‘000 | $‘000 | $‘000 | $‘000 | ||||||||||||||||
European Train Control System - future phases | — | — | — | — | — | |||||||||||||||
The government has approved an additional allocation to deliver the European Train Control System between Beenleigh and Varsity Lakes. The funds are centrally held and not disclosed due to ongoing procurement processes.
This is in addition to the increased funding of $554 million over 4 years for Phase 1 of the European Train Control System Signalling Program, included as part of the Transport Services Contract with Queensland Rail. Additional phases and specific funding requirements will be considered as the network develops and the system is rolled out across the expanded network.
159
Budget Measures 2024-25
Department of Treaty, Aboriginal and Torres Strait Islander Partnerships, Communities and the Arts
| 2023–24 | 2024–25 | 2025–26 | 2026–27 | 2027–28 | ||||||||||||||||
| $‘000 | $‘000 | $‘000 | $‘000 | $‘000 | ||||||||||||||||
Cultural Infrastructure Renewal Works | — | 23,750 | — | — | — | |||||||||||||||
The government is providing increased funding of $11.8 million in 2024-25 for priority capital works at the Queensland Cultural Centre, and further funding of $12 million in 2024-25, held centrally, for the asset renewal program.
| 2023–24 | 2024–25 | 2025–26 | 2026–27 | 2027–28 | ||||||||||||||||
| $‘000 | $‘000 | $‘000 | $‘000 | $‘000 | ||||||||||||||||
Queensland Museum Infrastructure Renewal and Transformation | — | 1,675 | 2,570 | 705 | — | |||||||||||||||
The government is providing additional funding of $5.0 million over 3 years for building fabric works at Queensland Museum Cobb + Co (Toowoomba) and the Queensland Museum Workshop (Ipswich).
| 2023–24 | 2024–25 | 2025–26 | 2026–27 | 2027–28 | ||||||||||||||||
| $‘000 | $‘000 | $‘000 | $‘000 | $‘000 | ||||||||||||||||
Cultural and Performing Arts - Queensland Cultural Centre precinct works | 11,700 | — | — | — | — | |||||||||||||||
The government has provided increased funding of $11.7 million in 2023-24 for capital works across the Queensland Cultural Centre precinct, including but not limited to Hostile Vehicle Mitigation and roadworks along Grey Street.
160
Budget Measures 2024-25
| 2023–24 | 2024–25 | 2025–26 | 2026–27 | 2027–28 | ||||||||||||||||
| $‘000 | $‘000 | $‘000 | $‘000 | $‘000 | ||||||||||||||||
New Performing Arts Venue - Project management and technical advisory services | 9,000 | — | — | — | — | |||||||||||||||
The government has provided increased funding of $9 million in 2023-24 for project management and technical advisory services.
161
Budget Measures 2024-25
Department of Youth Justice
| 2023–24 | 2024–25 | 2025–26 | 2026–27 | 2027–28 | ||||||||||||||||
| $‘000 | $‘000 | $‘000 | $‘000 | $‘000 | ||||||||||||||||
Woodford Youth Detention Centre | 27,264 | 185,050 | 289,819 | 80,171 | 45,306 | |||||||||||||||
The government has provided additional funding of $627.6 million over 5 years for projected costs of construction of a new youth detention centre at Woodford to address pressures on youth detention centre capacity.
| 2023–24 | 2024–25 | 2025–26 | 2026–27 | 2027–28 | ||||||||||||||||
| $‘000 | $‘000 | $‘000 | $‘000 | $‘000 | ||||||||||||||||
Cairns Youth Detention Centre | — | — | — | — | — | |||||||||||||||
The government is providing additional funding over 5 years from 2023-24 for the construction of a 40 bed youth detention centre at Cairns. Expenditure for this measure is subject to commercial negotiations.
| 2023–24 | 2024–25 | 2025–26 | 2026–27 | 2027–28 | ||||||||||||||||
| $‘000 | $‘000 | $‘000 | $‘000 | $‘000 | ||||||||||||||||
Woodford Youth Detention Centre Operational and Establishment Funding | — | — | 285 | 124 | — | |||||||||||||||
The government is providing increased funding of $400,000 over 2 years to support the establishment and operation of the Woodford Youth Detention Centre. This forms part of total increased funding of $261.4 million over 4 years and $89.2 million per annum ongoing to support operations of the Woodford Youth Detention Centre.
The operating component to this measure can be found in Chapter 2 Expense measures.
This initiative is part of the $1.28 billion Community Safety Plan for Queensland.
162
Budget Measures 2024-25
Legislative Assembly of Queensland
| 2023–24 $‘000 | 2024–25 $‘000 | 2025–26 $‘000 | 2026–27 $‘000 | 2027–28 $‘000 | ||||||||||||||||
Annexe Critical Infrastructure and Services Upgrade | 15,770 | — | — | — | — | |||||||||||||||
The government has provided increased funding of $15.8 million in 2023-24 to undertake the necessary repairs and upgrades to the external façade of the Parliamentary Annexe including the level 7 podium area, and the refurbishment of Members’ office and overnight accommodation floors.
163
Budget Measures 2024-25
Office of the Queensland Ombudsman
| 2023–24 $‘000 | 2024–25 $‘000 | 2025–26 $‘000 | 2026–27 $‘000 | 2027–28 $‘000 | ||||||||||||||||
Funding for Fit-out of New Office Accommodation | — | 950 | 933 | 50 | 50 | |||||||||||||||
The government is providing additional equity funding of $2.0 million over 4 years and $50,000 per annum ongoing funding to support the fit-out of new office accommodation located at 53 Albert Street and to facilitate future investment in IT plant and equipment.
The expense component of the measure can be found in Chapter 2 Expense measures.
164
Budget Measures 2024-25
Queensland Corrective Services
| 2023–24 $‘000 | 2024–25 $‘000 | 2025–26 $‘000 | 2026–27 $‘000 | 2027–28 $‘000 | ||||||||||||||||
Asset Improvement Program | — | 46,000 | 115,863 | 66,050 | 18,500 | |||||||||||||||
The government is providing additional funding of $246.4 million over 4 years and $10 million per annum ongoing for infrastructure upgrades as part of the asset improvement program.
The expense component of this measure can be found in Chapter 2 Expense measures.
| 2023–24 $‘000 | 2024–25 $‘000 | 2025–26 $‘000 | 2026–27 $‘000 | 2027–28 $‘000 | ||||||||||||||||
Prison Capacity Uplift | — | 23,980 | 57,270 | — | — | |||||||||||||||
The government is providing additional funding of $81.3 million over 2 years to construct additional prison capacity to sustainably manage a growing prisoner population.
The expense component of this measure can be found in Chapter 2 Expense measures.
| 2023–24 $‘000 | 2024–25 $‘000 | 2025–26 $‘000 | 2026–27 $‘000 | 2027–28 $‘000 | ||||||||||||||||
High Risk Offender Management Unit Resourcing | 946 | 1,892 | — | — | — | |||||||||||||||
The government is providing increased funding of $2.8 million over 2 years for office accommodation to support the management of dangerous prisoners (sexual offenders) at the Wacol precinct.
The expense component of this measure can be found in Chapter 2 Expense measures.
165
Budget Measures 2024-25
Queensland Fire Department
| 2023–24 $‘000 | 2024–25 $‘000 | 2025–26 $‘000 | 2026–27 $‘000 | 2027–28 $‘000 | ||||||||||||||||
Enhanced Firefighter Safety Equipment | — | 5,000 | — | — | — | |||||||||||||||
The government is providing additional funding of $5 million in 2024-25 for the purchase of priority fire safety equipment such as thermal imaging cameras and rapid intervention team kits.
| 2023–24 $‘000 | 2024–25 $‘000 | 2025–26 $‘000 | 2026–27 $‘000 | 2027–28 $‘000 | ||||||||||||||||
Ayr Fire and Rescue Station remediation works | — | 4,000 | — | — | — | |||||||||||||||
The government is providing additional funding of $4 million in 2024-25 for remediation works at Ayr Fire and Rescue Station, associated with per- and polyfluoroalkyl substances (PFAS) contamination, with further planning around the future of the site to be undertaken.
166
Budget Measures 2024-25
Queensland Health
| 2023–24 $‘000 | 2024–25 $‘000 | 2025–26 $‘000 | 2026–27 $‘000 | 2027–28 $‘000 | ||||||||||||||||
Rockhampton Mental Health Unit | — | 50,000 | 29,100 | — | — | |||||||||||||||
The government is providing additional funding of $79.1 million over 2 years from 2024-25 for the replacement of the Rockhampton Mental Health Unit, which will deliver nine additional beds as part of a new 32-bed facility and take the total funding for the project to $91.9 million.
| 2023–24 $‘000 | 2024–25 $‘000 | 2025–26 $‘000 | 2026–27 $‘000 | 2027–28 $‘000 | ||||||||||||||||
Emergent Issues and Cost Escalation of Health Capital Projects | 15,660 | 44,505 | 1,757 | — | — | |||||||||||||||
The government has provided an additional $61.9 million over 3 years from 2023-24, comprising of $51.0 million for priority capital projects experiencing emergent and escalating construction costs and $10.9 million over 2 years for The Prince Charles Hospital Carpark.
| 2023–24 $‘000 | 2024–25 $‘000 | 2025–26 $‘000 | 2026–27 $‘000 | 2027–28 $‘000 | ||||||||||||||||
Queensland Ambulance Service Base Capital Funding Investment | — | 30,000 | — | — | — | |||||||||||||||
The government is providing additional funding of $30.0 million in 2024-25 as a boost to the Queensland Ambulance Service base capital program.
167
Budget Measures 2024-25
| 2023–24 $‘000 | 2024–25 $‘000 | 2025–26 $‘000 | 2026–27 $‘000 | 2027–28 $‘000 | ||||||||||||||||
Rural and Remote Workforce Accommodation | — | 12,000 | — | — | — | |||||||||||||||
The government is providing one-off funding of $12 million in 2024-25 to replace existing staff accommodation in Torres and Cape Hospital and Health Service to meet current and projected workforce demand.
| 2023–24 $‘000 | 2024–25 $‘000 | 2025–26 $‘000 | 2026–27 $‘000 | 2027–28 $‘000 | ||||||||||||||||
Cairns Health and Innovation Centre (CHIC) Stage 1 | — | 8,000 | 52,000 | — | — | |||||||||||||||
The government is providing additional funding of $60 million over 2 years from 2024-25 to commence delivery of the Cairns Health innovation Centre Stage 1, which when complete will deliver additional capacity for clinical services within the existing Cairns Hospital Precinct and provide necessary health education, training and research facilities for future medical professionals in Cairns.
| 2023–24 $‘000 | 2024–25 $‘000 | 2025–26 $‘000 | 2026–27 $‘000 | 2027–28 $‘000 | ||||||||||||||||
Cooktown Multipurpose Health Service Facility | — | 8,000 | 30,000 | 40,000 | 40,000 | |||||||||||||||
The government is providing additional funding of $200 million over 7 years from 2024-25 to redevelop and deliver a contemporary Cooktown Multi-Purpose Health Service facility to support modern models of care including maternity, paediatrics, mental health and palliative care, increasing bed numbers by 50 per cent.
168
Budget Measures 2024-25
| 2023–24 | 2024–25 | 2025–26 | 2026–27 | 2027–28 | ||||||||||||||||
| $‘000 | $‘000 | $‘000 | $‘000 | $‘000 | ||||||||||||||||
Commission of Inquiry - Forensic DNA Testing | 17,148 | 650 | 650 | 650 | 650 | |||||||||||||||
The government has provided additional funding of $17.1 million in 2023-24 and $650,000 per annum ongoing to support capital works at the Queensland forensic science facility, including remedial renovations to address critical deficiencies in the existing forensic biology and chemistry infrastructure.
This forms part of the government’s total funding package of $202.7 million over 6 years (2022-23 to 2027-28), with a recurrent funding boost of $22.3 million from 2027-28, in response to the Commission of Inquiry into Forensic DNA Testing in Queensland.
| 2023–24 | 2024–25 | 2025–26 | 2026–27 | 2027–28 | ||||||||||||||||
| $‘000 | $‘000 | $‘000 | $‘000 | $‘000 | ||||||||||||||||
Capacity Expansion Program | — | — | — | — | 1,000,000 | |||||||||||||||
The government will provide additional funding of $1.0 billion of equity funding for the Capacity Expansion Program in 2027-28. This funding will further support the Patient Flow Enhancement Program.
| 2023–24 | 2024–25 | 2025–26 | 2026–27 | 2027–28 | ||||||||||||||||
| $‘000 | $‘000 | $‘000 | $‘000 | $‘000 | ||||||||||||||||
Queensland Health’s Sustaining Capital Program | 115,000 | — | — | — | — | |||||||||||||||
The government has provided additional funding of $115 million in 2023-24 to support Queensland Health’s Sustaining Capital Program.
169
Budget Measures 2024-25
Queensland Police Service
| 2023–24 | 2024–25 | 2025–26 | 2026–27 | 2027–28 | ||||||||||||||||
| $‘000 | $‘000 | $‘000 | $‘000 | $‘000 | ||||||||||||||||
Wacol Youth Remand Facility | 60,500 | 200,000 | — | — | — | |||||||||||||||
The government is providing additional funding of $10.5 million in 2023-24 to enable the accelerated detailed design, planning and early site works and up to $250 million in 2023-24 and 2024-25, held centrally, for the Wacol Youth Remand Centre.
| 2023–24 | 2024–25 | 2025–26 | 2026–27 | 2027–28 | ||||||||||||||||
| $‘000 | $‘000 | $‘000 | $‘000 | $‘000 | ||||||||||||||||
Police Capital Project Funding | — | 15,000 | 9,500 | 9,500 | — | |||||||||||||||
The government is providing additional funding of $34 million over 3 years to upgrade and enhance the function of Hervey Bay and Bundaberg police stations to support police capability in the Wide Bay area.
This initiative is part of the $1.28 billion Community Safety Plan for Queensland.
| 2023–24 | 2024–25 | 2025–26 | 2026–27 | 2027–28 | ||||||||||||||||
| $‘000 | $‘000 | $‘000 | $‘000 | $‘000 | ||||||||||||||||
QPS Youth Coordination Hub | — | 10,000 | — | — | — | |||||||||||||||
The government is providing $10 million in 2024-25, held centrally, for a new, purpose built statewide Queensland Police Service Youth Coordination Hub to allow for greater collaboration across government of youth focused programs delivered by the Queensland Police Service.
170
Budget Measures 2024-25
| 2023–24 | 2024–25 | 2025–26 | 2026–27 | 2027–28 | ||||||||||||||||
| $‘000 | $‘000 | $‘000 | $‘000 | $‘000 | ||||||||||||||||
Weapons Licensing Management System Replacement Project | 1,240 | 3,703 | — | — | — | |||||||||||||||
The government is providing increased funding of $4.9 million over 2 years to integrate online services and digital identity initiatives.
The expense component of this measure can be found in Chapter 2 Expense measures.
| 2023–24 | 2024–25 | 2025–26 | 2026–27 | 2027–28 | ||||||||||||||||
| $‘000 | $‘000 | $‘000 | $‘000 | $‘000 | ||||||||||||||||
Advanced Data Analytics Capability | 1,899 | 3,344 | 1,500 | — | — | |||||||||||||||
The government is providing additional funding of $6.7 million over 3 years for enhanced data analytic capability to support strategic decision-making and frontline policing operations.
The expense component of this measure can be found in Chapter 2 Expense measures.
| 2023–24 | 2024–25 | 2025–26 | 2026–27 | 2027–28 | ||||||||||||||||
| $‘000 | $‘000 | $‘000 | $‘000 | $‘000 | ||||||||||||||||
Watchhouse Modernisation Program | — | 2,500 | — | — | — | |||||||||||||||
The government is providing increased initial funding of $2.5 million in 2024-25 to modernise and upgrade the Queensland Police Service’s network of watchhouses to improve safety and security for all detainees and staff.
The expense component to this measure can be found in Chapter 2 Expense measures.
171
Budget Measures 2024-25
| 2023–24 | 2024–25 | 2025–26 | 2026–27 | 2027–28 | ||||||||||||||||
| $‘000 | $‘000 | $‘000 | $‘000 | $‘000 | ||||||||||||||||
Digital Evidence Capability Program | — | 1,220 | — | — | — | |||||||||||||||
The government is providing additional funding of $1.2 million in 2024-25 to continue updates to the current digital evidence management system.
The expense component to this measure can be found in Chapter 2 Expense measures.
| 2023–24 | 2024–25 | 2025–26 | 2026–27 | 2027–28 | ||||||||||||||||
| $‘000 | $‘000 | $‘000 | $‘000 | $‘000 | ||||||||||||||||
Community Safety Initiatives in the South West Brisbane and Ipswich Areas | — | 1,000 | — | — | — | |||||||||||||||
The government is providing additional funding of $1 million in 2024-25, for additional operational police vehicles and Mobile Police Beats to enable police to conduct more high visibility police activities in the South West Brisbane and Ipswich Areas.
The expense component to this measure can be found in Chapter 2 Expense measures.
| 2023–24 | 2024–25 | 2025–26 | 2026–27 | 2027–28 | ||||||||||||||||
| $‘000 | $‘000 | $‘000 | $‘000 | $‘000 | ||||||||||||||||
Police Youth Co-responder Teams Extension and Expansion | — | 154 | 154 | — | — | |||||||||||||||
The government is providing increased funding of $308,000 over 2 years from 2024-25 to expand services in the existing Youth Co-Responder Teams in Gold Coast, Cairns and South Brisbane.
This initiative is part of the $1.28 billion Community Safety Plan for Queensland. The expense component to this measure can be found in Chapter 2 Expense measures.
172
Budget Measures 2024-25
| 2023–24 | 2024–25 | 2025–26 | 2026–27 | 2027–28 | ||||||||||||||||
| $‘000 | $‘000 | $‘000 | $‘000 | $‘000 | ||||||||||||||||
900 New Police Personnel | — | — | 4,950 | — | — | |||||||||||||||
The government is providing additional funding of $5.0 million in 2025-26 to equip the 900 additional police personnel to meet increasing policing demands in serving communities and keeping Queenslanders safe.
This initiative is part of the $1.28 billion Community Safety Plan for Queensland. The expense component to this measure can be found in Chapter 2 Expense measures.
| 2023–24 | 2024–25 | 2025–26 | 2026–27 | 2027–28 | ||||||||||||||||
| $‘000 | $‘000 | $‘000 | $‘000 | $‘000 | ||||||||||||||||
Caboolture Watchhouse Hub | 395 | — | — | — | — | |||||||||||||||
The government is providing additional funding of $395,000 over 2 years, held centrally, to support the management of young people at the Caboolture Watchhouse.
The expense component of this measure can be found in Chapter 2 Expense measures.
| 2023–24 | 2024–25 | 2025–26 | 2026–27 | 2027–28 | ||||||||||||||||
| $‘000 | $‘000 | $‘000 | $‘000 | $‘000 | ||||||||||||||||
Commission of Inquiry into Forensic DNA Testing in Queensland Recommendation Implementation and Associated Resourcing | 1,500 | — | — | — | — | |||||||||||||||
The government has provided additional funding of $1.5 million in 2023-24 to upgrade laboratory equipment based on recommendations arising from the Commission of Inquiry into Forensic DNA Testing in Queensland.
This forms part of the government’s total funding package of $202.7 million over 6 years (2022-23 to 2027-28), with a recurrent funding boost of $22.3 million from 2027-28, in response to the Commission of Inquiry into Forensic DNA Testing in Queensland.
173
Budget Measures 2024-25
| 2023–24 | 2024–25 | 2025–26 | 2026–27 | 2027–28 | ||||||||||||||||
| $‘000 | $‘000 | $‘000 | $‘000 | $‘000 | ||||||||||||||||
Implementation of the Commission of Inquiry Recommendations into Queensland Police Service to Domestic and Family Violence | 1,189 | — | — | — | — | |||||||||||||||
The government has provided increased funding of $1.2 million in 2023-24 to support the establishment of specialist implementation teams to deliver A Call for Change - Commission of Inquiry into the Queensland Police Service responses to the domestic and family violence recommendations. This investment will support a whole of government effort to deliver more victim liaison officers, domestic and family violence support workers in police stations, specialist domestic and family violence officers and specialist police prosecutors.
Further details can be found in the Queensland Police Service section of Chapter 2 Expense measures.
| 2023–24 | 2024–25 | 2025–26 | 2026–27 | 2027–28 | ||||||||||||||||
| $‘000 | $‘000 | $‘000 | $‘000 | $‘000 | ||||||||||||||||
Integrated Strategy Addressing Youth Crime in North Queensland | 3,100 | — | — | — | — | |||||||||||||||
The government has provided additional funding of $3.1 million in 2023-24 to enable the immediate establishment of an interim police aerial support capability for POLAIR based in Townsville, including contemporary communications and aerial video downlink capability. The government is also providing additional funding, held centrally (not for publication at this time due to ongoing procurement), to make this capability permanent. This capability will assist police in tracking vehicles, arrest offenders and locate missing persons to enhance community safety, including periodic deployment in other North Queensland locations as required.
The expense component of this measure can be found in Chapter 2 Expense measures.
174
Budget Measures 2024-25
| 2023–24 | 2024–25 | 2025–26 | 2026–27 | 2027–28 | ||||||||||||||||
| $‘000 | $‘000 | $‘000 | $‘000 | $‘000 | ||||||||||||||||
Interim Police Aerial Support Capability | — | — | — | — | — | |||||||||||||||
The government is providing additional funding (not for publication at this time due to ongoing procurement) to deliver interim police aerial enforcement capabilities, including two helicopters for response work in Far North Queensland and Wide Bay/Sunshine Coast and new drone capability in priority regions across Queensland.
The expense component to this measure can be found in Chapter 2 Expense measures. This initiative is part of the $1.28 billion Community Safety Plan for Queensland.
175
Budget Measures 2024-25
Queensland Treasury
| 2023–24 | 2024–25 | 2025–26 | 2026–27 | 2027–28 | ||||||||||||||||
| $‘000 | $‘000 | $‘000 | $‘000 | $‘000 | ||||||||||||||||
Boost to the Business Investment Fund | — | 50,000 | — | — | — | |||||||||||||||
The government is providing increased funding of $50 million in 2024-25 to continue investing across new and follow-on investment opportunities. Total funding for this program, managed by Queensland Investment Corporation, is $150 million over 6 years from 2021-22.
| 2023–24 | 2024–25 | 2025–26 | 2026–27 | 2027–28 | ||||||||||||||||
| $‘000 | $‘000 | $‘000 | $‘000 | $‘000 | ||||||||||||||||
Queensland Critical Minerals and Battery Technology Fund | 70,000 | — | — | — | — | |||||||||||||||
The government has provided increased funding of $70 million in 2023-24 to assist in positioning Queensland for the next resources boom in the critical minerals, battery technology and advanced materials needed for the clean energy revolution, including manufacturing. Total funding for this program, managed jointly with Queensland Investment Corporation, is $170 million over 3 years from 2023-24.
| 2023–24 | 2024–25 | 2025–26 | 2026–27 | 2027–28 | ||||||||||||||||
| $‘000 | $‘000 | $‘000 | $‘000 | $‘000 | ||||||||||||||||
Queensland Venture Capital Development Fund | — | — | — | — | — | |||||||||||||||
Funding of $55 million in 2024-25 is being reprioritised to the Queensland Venture Capital Development Fund to further accelerate, develop and enhance Queensland’s venture capital industry, managed by Queensland Investment Corporation. Total funding for this program is $130 million over 2 years from 2023-24.
176
Budget Measures 2024-25
| 4 | Revenue Measures |
Introduction
The following tables present the relevant portfolio revenue measures relating to decisions taken since the 2023-24 Budget. For further explanation, refer to Explanation of Scope and Terms in Chapter 1.
177
Budget Measures 2024-25
Department of Agriculture and Fisheries
| 2023–24 | 2024–25 | 2025–26 | 2026–27 | 2027–28 | ||||||||||||||||
| $‘000 | $‘000 | $‘000 | $‘000 | $‘000 | ||||||||||||||||
Restructure of Commercial Fishing Licence Fees as part of Future Fisheries | (840 | ) | (1,540 | ) | (1,540 | ) | (1,540 | ) | (1,560 | ) | ||||||||||
The government is restructuring commercial fishing licence fees as part of the implementation of the Future Fisheries reforms to support enhanced protections for the Great Barrier Reef World Heritage Area and a more environmentally sensitive and sustainable fishing industry. This includes the phasing out of commercial gillnet fishing in the Great Barrier Reef and the parallel rezoning of the Great Sandy Marine Park, and increased protection from gillnet fishing in the interconnected environment of the Gulf of Carpentaria in accordance with the Future Fisheries Taskforce recommendations.
This is expected to reduce revenue at an estimated cost of $7.0 million over 5 years and $1.6 million per annum ongoing mainly due to the removal of various symbols and licences, partially offset by the introduction of the transitional NX licences for commercial fishers due to expire in mid-2027.
178
Budget Measures 2024-25
Department of Transport and Main Roads
| 2023–24 | 2024–25 | 2025–26 | 2026–27 | 2027–28 | ||||||||||||||||
| $‘000 | $‘000 | $‘000 | $‘000 | $‘000 | ||||||||||||||||
Public Transport Fare Freeze | (13,413 | ) | (14,641 | ) | (14,960 | ) | (9,535 | ) | (9,738 | ) | ||||||||||
The government is freezing the public transport fare increase in 2024 for 12 months at an estimated cost of $62.3 million over 5 years.
| 2023–24 | 2024–25 | 2025–26 | 2026–27 | 2027–28 | ||||||||||||||||
| $‘000 | $‘000 | $‘000 | $‘000 | $‘000 | ||||||||||||||||
Motor Vehicle Registration Fee Freeze | — | (66,678 | ) | (69,133 | ) | (71,680 | ) | (74,320 | ) | |||||||||||
The government is freezing the indexation of the registration fee and traffic improvement fee components of motor vehicle registration in 2024-25 at an estimated cost of $281.8 million over 4 years.
| 2023–24 | 2024–25 | 2025–26 | 2026–27 | 2027–28 | ||||||||||||||||
| $‘000 | $‘000 | $‘000 | $‘000 | $‘000 | ||||||||||||||||
Public Transport Temporary Fare Reduction | — | (150,000 | ) | — | — | — | ||||||||||||||
The government is implementing a temporary fare reduction across the South East Queensland public transport network and on contracted regional bus services for 6 months from 5 August 2024 with a flat fare of 50 cents per trip at an estimated cost of $150 million in 2024-25. In addition to this initiative, the government is also providing half-price tickets on Airtrain services.
179
Budget Measures 2024-25
| 2023–24 | 2024–25 | 2025–26 | 2026–27 | 2027–28 | ||||||||||||||||
| $‘000 | $‘000 | $‘000 | $‘000 | $‘000 | ||||||||||||||||
Motor Vehicle Registration Fee Reduction | — | (399,000 | ) | (36,000 | ) | — | — | |||||||||||||
The government is reducing the registration fee and traffic improvement fee components of motor vehicle registration for all light vehicles for 12 months by 20 per cent at an estimated cost of $435 million over 2 years.
180
Budget Measures 2024-25
Queensland Treasury
| 2023–24 | 2024–25 | 2025–26 | 2026–27 | 2027–28 | ||||||||||||||||
| $‘000 | $‘000 | $‘000 | $‘000 | $‘000 | ||||||||||||||||
Queensland Revenue Office - Revenue and Penalty Debt Administration and Resourcing | — | 211,800 | 231,600 | 252,500 | 274,200 | |||||||||||||||
The government is ensuring the Queensland Revenue Office’s capacity to deliver effective and sustainable revenue and penalty debt administration. The measure is expected to support revenue benefits of $970.1 million over 4 years. The expenses component to this measure can be found in Chapter 2 Expense measures.
| 2023–24 | 2024–25 | 2025–26 | 2026–27 | 2027–28 | ||||||||||||||||
| $‘000 | $‘000 | $‘000 | $‘000 | $‘000 | ||||||||||||||||
Land Tax Surcharge for Foreign Companies and Trustees of Foreign Trusts, and Absentees | — | 74,500 | 81,300 | 87,000 | 90,400 | |||||||||||||||
The government is increasing the surcharge rate of land tax applied in addition to land tax rates for foreign companies and trustees of foreign trusts, and absentees, from 2 per cent to 3 per cent. Ex gratia relief will continue to be offered for Australian-based foreign entities whose commercial activities make a significant contribution to the Queensland economy and community (subject to eligibility criteria). It is estimated this measure will result in additional taxation revenue of approximately $330 million over the 4 years ending 2027-28.
The change is subject to the passage of legislative amendments.
181
Budget Measures 2024-25
| 2023–24 | 2024–25 | 2025–26 | 2026–27 | 2027–28 | ||||||||||||||||
| $‘000 | $‘000 | $‘000 | $‘000 | $‘000 | ||||||||||||||||
Additional Foreign Acquirer Duty Increase | — | 20,200 | 22,100 | 23,000 | 24,400 | |||||||||||||||
The government is increasing the rate of additional foreign acquirer duty (AFAD) from 7 per cent to 8 per cent. AFAD is levied on foreign buyers of residential property in Queensland, with ex gratia relief offered to Australian-based foreign entities whose commercial activities involve significant development by adding to the supply of housing stock in Queensland (subject to eligibility criteria). It is estimated this measure will result in additional taxation revenue of approximately $90 million over the 4 years ending 2027-28.
The change is subject to the passage of legislative amendments.
| 2023–24 | 2024–25 | 2025–26 | 2026–27 | 2027–28 | ||||||||||||||||
| $‘000 | $‘000 | $‘000 | $‘000 | $‘000 | ||||||||||||||||
Changes to Regional Payroll Tax Discount Eligibility | — | 5,000 | 5,000 | 5,000 | 5,000 | |||||||||||||||
The government is adjusting the eligibility criteria for the regional payroll tax discount to exclude extremely large businesses, who typically have substantially greater financial capacity to contribute to state revenues compared to smaller regional employers. From 2024-25, businesses with Queensland taxable wages of more than $350 million on an annual basis will not be eligible for the discount. It is estimated this measure will result in additional taxation revenue of approximately $20 million over 4 years.
The change is subject to the passage of legislative amendments.
| 2023–24 | 2024–25 | 2025–26 | 2026–27 | 2027–28 | ||||||||||||||||
| $‘000 | $‘000 | $‘000 | $‘000 | $‘000 | ||||||||||||||||
50 Per Cent Payroll Tax Rebate for Apprentices and Trainees Extension | — | (54,900 | ) | — | — | — | ||||||||||||||
The government is extending the 50 per cent payroll tax rebate on the exempt wages of apprentices and trainees until 30 June 2025. The extension of the rebate provides $54.9 million in additional support for businesses employing trainees and apprentices, and forms part of the government’s ongoing commitment to building Queensland’s skills base, including for Queensland’s youth, across all regions of the state.
The change is subject to the passage of legislative amendments.
182
Budget Measures 2024-25
| 2023–24 | 2024–25 | 2025–26 | 2026–27 | 2027–28 | ||||||||||||||||
| $‘000 | $‘000 | $‘000 | $‘000 | $‘000 | ||||||||||||||||
Increased First Home Buyer Transfer Duty Concession Thresholds | — | (90,000 | ) | (90,000 | ) | (90,000 | ) | (90,000 | ) | |||||||||||
The government is increasing the eligibility thresholds for the first home concession and first home vacant land concession.
Eligibility for the first home concession will be extended to properties valued up to $800,000, with no duty payable on homes valued up to $700,000 and a partial concession for homes between $700,000 and $800,000. Eligibility for the first home vacant land concession will be extended to $500,000, with no duty payable on land valued up to $350,000 and a partial concession for land valued between $350,000 and $500,000.
It is estimated that these changes will provide $360 million in tax relief for first home buyers over the 4 years to 2027-28, and benefit around 10,000 first home buyers per annum.
The changes are subject to the passage of legislative amendments.
183
| Queensland Budget 2024–25 Budget Measures Budget Paper No.4 | ||
50c FARES Queensland Government Queensland Budget 2024–25 Budget Measures Budget Paper No.4