Table of Contents
As filed with the Securities and Exchange Commission on February 28, 2006
UNITED STATES
SECURITIES AND EXCHANGE COMMISSION
WASHINGTON, D.C. 20549
FORM 20-F/A
Amendment No. 1
¨ REGISTRATION STATEMENT PURSUANT TO SECTION 12(b) OR (g) OF
THE SECURITIES EXCHANGE ACT OF 1934
OR
x ANNUAL REPORT PURSUANT TO SECTION 13 OR 15(d) OF
THE SECURITIES EXCHANGE ACT OF 1934
For the fiscal year ended March 31, 2005
OR
¨ TRANSITION REPORT PURSUANT TO SECTION 13 OR 15(d) OF
THE SECURITIES EXCHANGE ACT OF 1934
For the transition period to
OR
¨ SHELL COMPANY REPORT PURSUANT TO SECTION 13 OR 15(d) OF
THE SECURITIES EXCHANGE ACT OF 1934
Date of event requiring this shell company report
Commission file number 333-11072
KABUSHIKI KAISHA MITSUBISHI TOKYO UFJ GINKO
(Exact name of Registrant as specified in its charter)
THE BANK OF TOKYO-MITSUBISHI UFJ, LTD.
(Translation of Registrant’s name into English)
Japan
(Jurisdiction of incorporation or organization)
7-1, Marunouchi 2-chome
Chiyoda-ku, Tokyo 100-8388
Japan
(Address of principal executive offices)
Securities registered or to be registered pursuant to Section 12(b) of the Act: None
Securities registered or to be registered pursuant to Section 12(g) of the Act: None
Securities for which there is a reporting obligation pursuant to Section 15(d) of the Act:
$2,000,000,000 aggregate principal amount of 8.40% Global Senior Subordinated Notes due April 15, 2010
Indicate the number of outstanding shares of each of the issuer’s classes of capital or common stock as of the close of the period covered by the annual report:
At July 31, 2005, (1) 5,100,869,546 shares of common stock and (2) 100,000,000 shares of preferred stock were issued.
Indicate by check mark whether the registrant (1) has filed all reports required to be filed by Section 13 or 15(d) of the Securities Exchange Act of 1934 during the preceding 12 months (or for such short period that the registrant was required to file such reports), and (2) has been subject to such filing requirements for the past 90 days:
Yes x No ¨
Indicate by check mark which financial statement item the registrant has elected to follow:
Item 17 ¨ Item 18 x
If this is an annual report, indicate by check mark whether the registrant is a shell company (as defined in Rule 12b-2 of the Exchange Act).
Yes ¨ No x
Table of Contents
| Page | ||||
| 3 | ||||
Operating and Financial Review and Prospects | 6 | |||
Financial Statements | 59 | |||
Exhibits | 59 | |||
| A-1 | ||||
| F-1 | ||||
2
Table of Contents
We are filing this Form 20-F/A to correct the following inadvertent errors found in our Form 20-F for the fiscal year ended March 31, 2005 previously filed on August 25, 2005:
| 1. | In Note 5 to the consolidated financial statements, the details of loans by domicile and type of industry of borrower at March 31, 2004 and 2005 have been corrected from the amounts previously reported as follows: |
| 2004 | 2005 | |||||||||||
| As previously reported | As restated | As previously reported | As restated | |||||||||
| (in millions) | ||||||||||||
Domestic: | ||||||||||||
Banks and other financial institutions | ¥ | 1,765,377 | ¥ | 1,676,785 | ¥ | 2,447,443 | ¥ | 2,364,504 | ||||
Other industries | 4,750,575 | 4,750,575 | 5,261,648 | 5,344,587 | ||||||||
Consumer | 7,473,998 | 7,562,590 | 7,662,809 | 7,662,809 | ||||||||
Foreign: | ||||||||||||
Banks and other financial institutions | 904,841 | 904,841 | 1,075,339 | 780,666 | ||||||||
Commercial and industrial | 7,063,034 | 7,063,034 | 8,259,006 | 8,553,679 | ||||||||
| 2. | In Note 10 to the consolidated financial statements, the following items at March 31, 2005 have been corrected from the amounts previously reported as follows: |
| (1) | Assets mortgaged, pledged, or otherwise subject to lien: |
| 2005 | ||||||
| As previously reported | As restated | |||||
| (in millions) | ||||||
Trading account securities | ¥ | 2,658,751 | ¥ | 2,301,452 | ||
Investment securities | 4,858,397 | 4,991,587 | ||||
Loans | 4,731,949 | 4,598,759 | ||||
| (2) | Type of liabilities the above pledged assets relate to: |
| 2005 | ||||||
| As previously reported | As restated | |||||
| (in millions) | ||||||
Payables under repurchase agreements and securities lending transactions | ¥ | 3,906,993 | ¥ | 3,549,694 | ||
| (3) | Pledged assets that may not be sold or repledged by the secured parties: |
| 2005 | ||||||
| As previously reported | As restated | |||||
| (in billions) | ||||||
Pledged assets that may not be sold or repledged by the secured parties | ¥ | 12,835 | ¥ | 12,816 | ||
| (4) | Fair value of collateral accepted by the Group which was sold or repledged: |
| 2005 | ||||||
| As previously reported | As restated | |||||
| (in billions) | ||||||
Fair value of collateral accepted by the Group which was sold or repledged | ¥ | 4,937 | ¥ | 5,072 | ||
3
Table of Contents
| 3. | In the parenthetic note to the consolidated balance sheet, the following items at March 31, 2005 have been corrected from the amounts previously reported as follows: |
| 2005 | ||||||
| As previously reported | As restated | |||||
| (in millions) | ||||||
Trading account assets pledged that secured parties are permitted to sell or repledge ………….. | ¥ | 2,626,534 | ¥ | 2,269,235 | ||
Securities available for sale pledged that secured parties are permitted to sell or repledge ……… | 1,557,907 | 1,571,463 | ||||
| 4. | In Note 23 to the consolidated financial statements, the following items at March 31, 2004 and 2005 have been corrected from the amounts previously reported as follows: |
| (1) | Contractual amounts of obligations under guarantees: |
Maximum potential/Contractual | Amount by expiration period | |||||||||||||||||||||||||||||||||||
| Less than 1 year | 1-2 years | 2-3 years | 3-5 years | Over 5 years | ||||||||||||||||||||||||||||||||
| As previously reported | As restated | As previously reported | As restated | As previously reported | As restated | As previously reported | As restated | As previously reported | As restated | As previously reported | As restated | |||||||||||||||||||||||||
| (in billions) | ||||||||||||||||||||||||||||||||||||
March 31, 2004: | ||||||||||||||||||||||||||||||||||||
Standby letters of credit and financial guarantees | ¥ | 2,561 | ¥ | 2,561 | ¥ | 1,043 | ¥ | 1,340 | ¥ | 198 | ¥ | 120 | ¥ | 159 | ¥ | 75 | ¥ | 252 | ¥ | 127 | ¥ | 909 | ¥ | 899 | ||||||||||||
Performance guarantees | 1,192 | 1,192 | 654 | 669 | 199 | 191 | 128 | 125 | 126 | 122 | 85 | 85 | ||||||||||||||||||||||||
March 31, 2005: | ||||||||||||||||||||||||||||||||||||
Standby letters of credit and financial guarantees | ¥ | 3,754 | ¥ | 2,482 | ¥ | 928 | ¥ | 1,247 | ¥ | 659 | ¥ | 124 | ¥ | 257 | ¥ | 97 | ¥ | 686 | ¥ | 244 | ¥ | 1,224 | ¥ | 770 | ||||||||||||
Performance guarantees | 1,353 | 1,353 | 264 | 773 | 564 | 214 | 191 | 113 | 203 | 175 | 131 | 78 | ||||||||||||||||||||||||
| (2) | Commitment amounts of resale and repurchase agreements: |
| 2004 | 2005 | |||||||||||
| As previously reported | As restated | As previously reported | As restated | |||||||||
| (in billions) | ||||||||||||
Resale and repurchase agreements | ¥ | 206 | ¥ | 186 | ¥ | 372 | ¥ | — | ||||
| (3) | Approximate remaining terms of these commitments: |
| 2005 | ||||||||||||||||||
| Within one year | From one year to five years | After five years | ||||||||||||||||
| As previously reported | As restated | As previously reported | As restated | As previously reported | As restated | |||||||||||||
Approximate remaining terms of these commitments | 65 | % | 75 | % | 29 | % | 23 | % | 6 | % | 2 | % | ||||||
In addition, certain reclassifications have been made in the consolidated balance sheets, Notes 3 and 29 to the consolidated financial statements.
4
Table of Contents
As a result of the corrections and reclassifications described above, the relevant figures in Item 5 and Selected Statistical Data have also been corrected or reclassified.
With the exceptions of the foregoing corrections and reclassifications, no other changes have been made to the Form 20-F for the fiscal year ended March 31, 2005.
5
Table of Contents
| Item 5. | Operating and Financial Review and Prospects. |
The following discussion and analysis should be read in conjunction with “Item 3.A. Key Information—Selected Financial Data,” “Selected Statistical Data” and our consolidated financial statements and related notes included elsewhere in this Annual Report.
| Page | ||
Roadmap to Reading the Discussion of Our Operating and Financial Review and Prospects | ||
| 6 | ||
| 6 | ||
| 9 | ||
| 12 | ||
| 14 | ||
| 18 | ||
| 20 | ||
| 21 | ||
| 31 | ||
| 36 | ||
Effect of the Change in Exchange Rates on Foreign Currency Translation | 37 | |
| 38 | ||
| 38 | ||
| 51 | ||
| 54 | ||
| 57 | ||
| 57 | ||
| 58 | ||
| 58 | ||
| 58 | ||
| 58 | ||
G. Safe Harbor | 58 | |
| A. | Operating Results |
We are a wholly owned subsidiary of Mitsubishi Tokyo Financial Group, Inc. We engage in a broad range of financial operations, including commercial banking, investment banking and asset management services, and provide related services to individual and corporate customers.
6
Table of Contents
Key Financial Figures
The following are some key figures in accordance with US GAAP relating to our business:
| Fiscal year ended March 31, | ||||||||||
| 2003 | 2004 | 2005 | ||||||||
| (in billions) | ||||||||||
Net interest income | ¥ | 825.6 | ¥ | 781.3 | ¥ | 808.7 | ||||
Provision (credit) for credit losses | 287.3 | (142.4 | ) | 125.1 | ||||||
Non-interest income | 724.6 | 983.1 | 804.0 | |||||||
Non-interest expense | 973.3 | 1,035.0 | 960.7 | |||||||
Net income | 249.0 | 537.6 | 287.1 | |||||||
Total assets (at end of period) | 77,680.4 | 85,058.6 | 92,050.3 | |||||||
Our revenues consist of net interest income and non-interest income.
Net interest income is a function of:
| • | the amount of interest-earning assets, |
| • | the general level of interest rates, |
| • | the so-called “spread,” or the difference between the rate of interest earned on interest-earning assets and the rate of interest paid on interest-bearing liabilities, and |
| • | the proportion of interest-earning assets financed by non-interest-bearing liabilities and equity. |
Non-interest income consists of:
| • | fees and commissions, including |
| • | trust fees, |
| • | fees on funds transfer and service charges for collections, |
| • | fees and commissions on international business, |
| • | fees and commissions on credit card business, |
| • | service charges on deposits, |
| • | fees and commissions on securities business, and |
| • | other fees and commissions; |
| • | foreign exchange gains (losses)—net, which primarily include net gains (losses) on currency derivative instruments entered into for trading purposes and transaction gains (losses) on the translation into Japanese yen of monetary assets and liabilities denominated in foreign currencies; |
| • | trading account profits—net, which primarily include net gains (losses) on trading securities and interest rate derivative instruments entered into for trading purposes; |
| • | investment securities gains (losses)—net, which primarily include net gains on sales of marketable securities, particularly marketable equity securities; |
| • | equity in earnings (losses) of equity method investees; and |
| • | other non-interest income. |
Provision (credit) for credit losses are charged to operations to maintain the allowance for credit losses at a level deemed appropriate by management. Although in recent periods, we generally recorded a provision for credit losses, we recorded a reversal of allowance for credit losses in the fiscal year ended March 31, 2004.
7
Table of Contents
Business Trends and Challenges
Reduction of nonperforming loans. We have been actively working on disposing nonperforming loans. We met the guideline for the disposal of nonperforming loans, which was based on a Japanese regulation established under the program for financial revival announced by the Japanese government in October 2002. Under the program, the Financial Services Agency stated that it would strive to normalize the problems with nonperforming loans by March 31, 2005, by reducing major Japanese banks’ ratio of nonperforming loans to total loans by about half. The following table sets forth a summary of our nonaccrual and restructured loans, and accruing loans that are contractually past due 90 days or more as to principal or interest payments, and allowance for credit losses at March 31, 2003, 2004 and 2005:
| At March 31, | |||||||||
| 2003 | 2004 | 2005 | |||||||
| (in billions, except percentages) | |||||||||
Nonaccrual loans | ¥1,069.1 | ¥790.5 | ¥631.1 | ||||||
Restructured loans | 1,028.5 | 426.8 | 365.3 | ||||||
Accruing loans contractually past due 90 days or more | 18.1 | 12.0 | 10.1 | ||||||
Nonaccrual and restructured loans, and accruing loans contractually past due 90 days or more as a percentage of loans | 5.29 | % | 3.08 | % | 2.32 | % | |||
Allowance for credit losses | ¥1,058.6 | ¥649.3 | ¥568.5 | ||||||
Allowance for credit losses as a percentage of loans | 2.65 | % | 1.63 | % | 1.31 | % | |||
Allowance for credit losses as a percentage of nonaccrual and restructured loans and accruing loans contractually past due 90 days or more | 50.04 | % | 52.82 | % | 56.48 | % | |||
In the future, we may suffer additional losses due to new nonperforming loans, and our allowance for credit losses may be insufficient to cover future loan losses.
Broader range of products. The reduction of barriers since the late 1990s among the banking, securities and insurance businesses has enabled us to engage in businesses such as sales of annuity and investment trusts to retail banking customers, which we were not permitted to conduct before. We have been seeking, and will continue to seek, to increase our fees and commissions by taking advantage of the reduction of barriers and other deregulatory trends.
Greater competition. We face strong competition in all of our principal areas of operation as a result of the relaxation of regulations relating to Japanese financial institutions. Deregulation has eliminated barriers between different types of Japanese financial institutions, which are now able to compete directly against one another. Deregulation and market factors have also facilitated the entry of various large foreign financial institutions into the Japanese domestic market. Greater competition may prevent us from increasing our level of fee income in the future.
External economic conditions. The financial services industry and the global financial markets are influenced by many unpredictable factors, including economic conditions, monetary policy, international political events, liquidity in global markets and regulatory developments. Our operations are significantly affected by external factors, such as the level and volatility of interest rates, currency exchange rates, stock and real estate markets and other economic and market conditions. In addition, we hold a significant number of shares in some of our customers for strategic purposes, in particular to maintain long-term relationships. These shareholdings expose us to risk of losses resulting from a decline in market prices of the shares. Accordingly, our results of operations may vary significantly from period to period because of unpredictable events, including unexpected failures of large corporate borrowers, defaults in emerging markets and market volatility.
8
Table of Contents
Management Integration of Mitsubishi Tokyo Financial Group and the UFJ Group
Signing of Basic Agreement. On August 12, 2004, Mitsubishi Tokyo Financial Group, Inc., UFJ Holdings, we, UFJ Bank, Mitsubishi Trust Bank, UFJ Trust Bank, Mitsubishi Securities and UFJ Tsubasa Securities concluded a basic agreement with regard to the management integration of the holding companies, banks, trust banks and securities companies of the two groups.
Preferred Stock Investment into UFJ Bank. On September 17, 2004, Mitsubishi Tokyo Financial Group, Inc. purchased 3.5 billion non-voting class E preferred shares issued by UFJ Bank for ¥700 billion. This capital injection to UFJ Bank is part of the proposed management integration with the UFJ group. The investment is based on the assumption that the management integration of the two groups will proceed, and is intended to maximize the benefits of the management integration.
Signing of Integration Agreement. On February 18, 2005, Mitsubishi Tokyo Financial Group, Inc., UFJ Holdings, we, UFJ Bank, Mitsubishi Trust Bank, UFJ Trust Bank, Mitsubishi Securities and UFJ Tsubasa Securities entered into an integration agreement, which sets forth various terms of the management integration, including the merger ratios, company names and other material terms. The merger ratios with respect to the common stock set forth in the integration agreement are as follows:
| • | Holding companies: 0.62 shares of Mitsubishi Tokyo Financial Group, Inc. common stock for each share of UFJ Holdings common stock; |
| • | Banks: 0.62 shares of our common stock for each share of UFJ Bank common stock; |
| • | Trust banks: 0.62 shares of Mitsubishi Trust Bank common stock for each share of UFJ Trust Bank common stock; and |
| • | Securities companies: 0.42 shares of Mitsubishi Securities common stock for each share of UFJ Tsubasa Securities common stock. |
On April 20, 2005, the parties to the integration agreement amended several technical provisions in the integration agreement to make the terms consistent with the merger agreements entered into on April 20, 2005 between the holding companies, banks, trust banks and securities companies.
Announcement of Integration Strategy. On February 18, 2005, Mitsubishi Tokyo Financial Group, Inc. and UFJ Holdings also announced some details about implementing the combined group’s integration strategy. In particular, Mitsubishi Tokyo Financial Group, Inc. and UFJ Holdings announced the following cost saving measures:
| • | A group-wide reduction and reassignment of roughly 10,000 employees by streamlining back office operations mainly in the head office, including a reduction of staff by approximately 6,000 and a reassignment of approximately 4,000 to strategic business areas and marketing sections by the end of the fiscal year ending March 31, 2009. |
| • | Integration of systems relating to treasury activities and overseas activities by the closing of the merger, and integration of the domestic settlement and information systems by the end of the fiscal year ending March 31, 2008. |
| • | Consolidation of approximately 170 retail branches and 100 corporate branches in Japan, and approximately 30 overseas branches by the end of the fiscal year ending March 31, 2009. |
| • | Integration of head office functions and overlapping subsidiaries. |
In implementing the integration strategy, Mitsubishi Tokyo Financial Group, Inc. expects that the combined group’s integration-related costs will exceed cost synergies for the first one to two years following the merger
9
Table of Contents
until the cost saving effects begin to materialize. In addition, Mitsubishi Tokyo Financial Group, Inc. expects that the combined group’s revenues will decrease for the first one to two years after the merger as the combined group adjusts loan exposures to certain borrowers.
Signing of Merger Agreement. On April 20, 2005, we and UFJ Bank entered into a merger agreement setting forth the final terms of the merger, including the detailed terms of our shares to be issued to UFJ Bank’s shareholder and other proposed amendments to our articles of incorporation upon the merger, as well as the details of the shareholders meetings at which the merger agreement and related matters necessary to complete the merger were to be approved.
Approval of Merger Agreement at General Shareholders Meeting. On June 29, 2005, the merger agreement between Mitsubishi Tokyo Financial Group, Inc. and UFJ Holdings, Inc. was approved at the general shareholders meetings of Mitsubishi Tokyo Financial Group, Inc. and UFJ Holdings. The merger agreement between us and UFJ Bank was also approved at the general shareholders meeting of UFJ Bank and at our general shareholders meeting. The general shareholders meetings of Mitsubishi Trust Bank, UFJ Trust Bank, Mitsubishi Securities and UFJ Tsubasa Securities, which were also held in late June 2005, also approved the merger agreements of the respective trust banks and securities companies.
Effect of the Merger. Pursuant to the merger agreement, we will combine our business with that of UFJ Bank by consummating a statutory merger under the Commercial Code of Japan, with The Bank of Tokyo-Mitsubishi, Ltd. being the surviving entity. As a result of the merger, UFJ Bank shareholders of record as of the date one day prior to the date of the merger will become entitled to receive 0.62 shares of our common stock in exchange for each share of UFJ Bank common stock. Concurrently, the surviving entity will be renamed “The Bank of Tokyo-Mitsubishi UFJ, Ltd.”
Postponement of the Merger. Although we originally planned to complete our merger with UFJ Bank on October 1, 2005, we postponed the merger to January 1, 2006 in order to enable additional testing of the two banks’ systems intended to minimize risks arising from the merger. Our merger agreement with UFJ Bank was amended to reflect the postponement, and the amendment is subject to shareholder approval. However, the merger between the parent companies, Mitsubishi Tokyo Financial Group, Inc. and UFJ Holdings, the merger between Mitsubishi Trust Bank and UFJ Trust Bank and the merger between Mitsubishi Securities and UFJ Tsubasa Securities are still expected to occur on October 1, 2005. Additional delays or other difficulties in integrating the systems with UFJ Bank may result in additional costs or cause delays in achieving targeted cost savings and other merger synergies.
Introduction of Integrated Business Groups
Effective April 1, 2004, Mitsubishi Tokyo Financial Group implemented a new integrated business group system, which currently integrates our operations together with the operations of Mitsubishi Trust Bank and Mitsubishi Securities in the following three areas—Retail, Corporate, and Trust Assets.
Issuance of“Non-dilutive” Preferred Securities by a Funding Vehicle of Mitsubishi Tokyo Financial Group, Inc.
On August 24, 2005, MTFG Capital Finance Limited, a special purpose company of Mitsubishi Tokyo Financial Group, Inc. established in the Cayman Islands, issued ¥165 billion in non-cumulative perpetual preferred securities in a private placement to institutional investors. The proceeds will be provided to us through BTM Preferred Capital Limited, our wholly-owned vehicle, to strengthen our capital base under the BIS capital adequacy requirements, and thus the flexibility of our capital management.
Mitsubishi Securities Becomes a Directly-Held Subsidiary of Mitsubishi Tokyo Financial Group, Inc.
On July 1, 2005, Mitsubishi Tokyo Financial Group, Inc. made Mitsubishi Securities a directly-held subsidiary by acquiring all of the shares of Mitsubishi Securities common stock held by us and Mitsubishi Trust Bank. As a result of the transaction, Mitsubishi Tokyo Financial Group holds Mitsubishi Securities common stock representing 57.43% of the voting rights as of July 1, 2005, and we no longer hold any shares of Mitsubishi Securities common stock. For the fiscal year ended March 31, 2005, however, Mitsubishi Securities is reported as one of our consolidated subsidiaries.
10
Table of Contents
Strategic Business and Capital Alliance between Mitsubishi Tokyo Financial Group, Inc. and ACOM
In March 2004, Mitsubishi Tokyo Financial Group, Inc. reached an agreement with ACOM, a consumer finance company in Japan, with respect to a strategic business alliance in retail financial services and a capital alliance. The main elements of the business alliance are undertaken by ACOM and us. As part of the capital alliance, in April 2004, Mitsubishi Tokyo Financial Group, Inc. acquired an additional 12.9% of the common shares of ACOM, resulting in an aggregate ownership interest of 15.1% in ACOM.
Basic Agreement Regarding the Combination of Operations and Reorganization to Strengthen the Consumer Finance Business
On October 29, 2004, Mitsubishi Tokyo Financial Group, Inc., we, DC Card Co., Ltd. and Tokyo-Mitsubishi Cash One Ltd., or Cash One, reached a basic agreement with ACOM to integrate and reorganize the business operations of our consumer finance business. Cash One will integrate its business operations with DC Card’s processing centers, call centers and guarantee divisions during the first half of the fiscal year ending March 31, 2006. On January 31, 2005, ACOM acquired shares in DC Card and Cash One. After the acquisition of the shares, ACOM owns approximately 55% and Mitsubishi Tokyo Financial Group owns approximately 45% of the common shares of Cash One, which has changed its name to DC Cash One Ltd.
Transfer of Shareholdings in Diamond Computer Service
During the fiscal year ended March 31, 2005, Mitsubishi Tokyo Financial Group, Inc. acquired 100% of Diamond Computer Service Co., Ltd., or DCS, which provides data processing and IT development services, through a share exchange. 26,205 shares of Mitsubishi Tokyo Financial Group Inc. common stock were issued in exchange for all of the outstanding shares of DCS’s common stock based on the exchange ratio of 0.00135 shares of Mitsubishi Tokyo Financial Group Inc. common stock for each share of DCS’s common stock. Following the completion of the exchange offer, in accordance with a business alliance between DCS and Mitsubishi Research Institute, Inc., or MRI, a research and consulting company headquartered in Tokyo, Japan, Mitsubishi Tokyo Financial Group Inc. sold 60% of its shares of DCS to MRI.
Planned Merger of Mitsubishi Asset Management and UFJ Partners Asset Management
On July 1, 2005, Mitsubishi Asset Management Co., Ltd. and UFJ Partners Asset Management Co., Ltd. signed a merger agreement, which was subsequently approved at the general meeting of shareholders of the respective companies on July 25, 2005.
Mitsubishi Asset Management was created on October 1, 2004 by the merger of Tokyo-Mitsubishi Asset Management Ltd. and Mitsubishi Trust Asset Management Co., Ltd., and we own 15% of Mitsubishi Asset Management. The merger of Mitsubishi Asset Management and UFJ Partners Asset Management is scheduled to be completed on October 1, 2005. The name of the new asset management company will be Mitsubishi UFJ Asset Management Co., Ltd.
Business Revitalization Plan of Mitsubishi Motors
On January 28, 2005, Mitsubishi Motors Corporation announced a new business revitalization plan through the fiscal year ending March 31, 2008. The new revitalization plan includes measures for stabilizing Mitsubishi Motors’ operations and improving its financial position over the medium- and long-term. In connection with the revitalization plan, and at the request of Mitsubishi Motors, we, Mitsubishi Heavy Industries, Ltd. and Mitsubishi Corporation participated in a capital enhancement of ¥274 billion by purchasing newly issued common and preferred shares of Mitsubishi Motors on March 10, 2005. As a result, we subscribed to common and preferred shares of Mitsubishi Motors for an aggregate amount of ¥154 billion, of which ¥54 billion consisted of a debt-for-equity swap. In addition, on March 22, 2005, Mitsubishi Trust Bank purchased, in a debt-for-equity swap, newly issued preferred shares of Mitsubishi Motors for an aggregate amount of ¥10.2 billion.
11
Table of Contents
Suspension of Consolidated Corporate-Tax System
In February 2005, Mitsubishi Tokyo Financial Group, Inc.’s application to suspend the consolidated corporate-tax system, which has been adopted since the fiscal year ended March 31, 2003, was approved by the Japanese tax authorities. Mitsubishi Tokyo Financial Group, Inc. filed for the fiscal year ended March 31, 2005, its tax returns under the consolidated corporate-tax system, which allows companies to base tax payments on the combined profits or losses of a parent company and its wholly-owned domestic subsidiaries. Due to the suspension of the consolidated corporate-tax system, deferred income taxes have been calculated separately based on temporary differences as of March 31, 2005 and future taxable income at each company.
Transfer to the Japanese Government of the Substitutional Portion of Employee Pension Fund Liabilities
As discussed under “Accounting Changes” below, the substitutional portion of our employee pension fund liabilities was transferred to the Japanese government in March 2005. Since the transfer was completed after the measurement date in the fiscal year ended March 31, 2005, the impact of the transfer, an increase in pre-tax income of ¥36.1 billion, will be reflected to our consolidated financial statements for the fiscal year ending March 31, 2006.
Strengthening of Corporate Governance in the United States
Mitsubishi Tokyo Financial Group, Inc. has decided to strengthen its corporate governance function in the United States by appointing a managing officer with responsibility for corporate governance in the United States as of June 29, 2005. This managing officer will be resident in the United States and will oversee governance-related matters with respect to Mitsubishi Tokyo Financial Group’s U.S. consolidated subsidiaries, including risk management, and legal and other compliance issues. In conjunction with this appointment, Mitsubishi Tokyo Financial Group, Inc. has also established a Corporate Governance Division for the United States to carry out support functions for the managing officer.
Purchase of 50% of Our Head Office and Nihonbashi Annex
On July 21, 2005, we announced that we reached an agreement to purchase from Mitsubishi Estate Co., Ltd., or Mitsubishi Estate, the equivalent of 50% of the land and building of each of our head office and Nihonbashi annex. These assets are currently jointly owned by us and Mitsubishi Estate. The purchase is scheduled to take place on August 31, 2005 and the total purchase price will be ¥111.3 billion. For further information, see note 7 to our consolidated financial statements.
We engage in a wide range of financial operations, including commercial banking, investment banking, asset management and securities-related businesses, and provide related services to individual and corporate customers around the world. Our results of operations and financial condition are exposed to changes in various external economic factors, including:
| • | General economic conditions; |
| • | Interest rates; |
| • | Currency exchange rates; and |
| • | Stock and real estate prices. |
12
Table of Contents
Economic Environment in Japan
In the Japanese economy, exports and capital expenditures rose due to increased overseas demand in the early part of the current period. Private consumption also steadily increased as consumer confidence improved. Nevertheless, a certain degree of uncertainty prevailed over the Japanese economy from the latter part of the fiscal year ended March 31, 2005 and deflation continued.
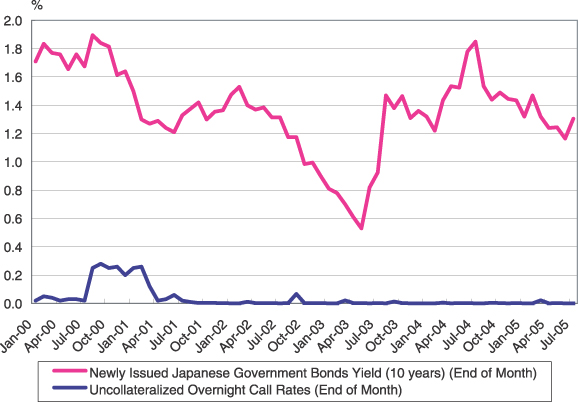
With respect to interest rates, the Bank of Japan continued its current easy monetary policy and kept short-term interest rates at near zero percent. On the other hand, the yield on ten-year Japanese government bonds which was approximately 1.4% in April 2004, rose temporarily to approximately 1.9% in June and July 2004, before declining to approximately 1.3% in March 2005. As of mid-August 2005, the yield was around 1.4%. The following chart shows the interest rate trends in Japan since January 2000:
The Japanese stock markets were relatively stable during the fiscal year ended March 31 2005. The Nikkei Stock Average, which is an average of 225 blue chip stocks listed on the Tokyo Stock Exchange, declined from ¥11,715.39 at March 31, 2004 to ¥11,668.95 at March 31, 2005. Conversely, the Tokyo Stock Price Index, or TOPIX, a composite index of all stocks listed on the First Section of the Tokyo Stock Exchange, rose from 1,179.23 at March 31, 2004 to 1,182.18 at March 31, 2005. As of mid-August 2005, the Nikkei Stock Average was around ¥12,000, and TOPIX was around 1,200.
In the foreign exchange markets, although the yen initially depreciated against the U.S. dollar mainly due to the rise in the U.S. federal funds rate, the exchange rate subsequently stabilized and remained within a narrow range. See “Item 3. A. Key Information—Selected Financial Data—Exchange Rate Information” for the historical noon buying rates of the Federal Reserve Bank of New York.
Land prices in Japan continued to decline during the fiscal year ended March 31, 2005, but the extent of the decline was smaller than the previous fiscal year. Based on the average government-set official land prices as of
13
Table of Contents
January 1, 2005, nationwide residential land prices declined 4.6%, compared to a 5.7% decline in the previous fiscal year, and nationwide land prices for commercial properties declined 5.6%, compared to a 7.4% decline in the previous fiscal year.
The number of corporate bankruptcy filings in Japan during the fiscal year ended March 31, 2005 was approximately 13,000 representing a 16% decline compared with the previous fiscal year.
International Financial Markets
With respect to the financial and economic environment for the fiscal year ended March 31, 2005, overseas economies moved toward recovery in the early part of this period, particularly in the United States where the recovery was driven by large-scale tax cuts, and in China where domestic demand continued to expand. In the latter part of the fiscal year, however, a certain degree of uncertainty prevailed in overseas economies as the positive effects of the tax cuts in the United States began to wane, as China began to restrain investments and as crude oil prices rose sharply.
In the United States, the 10-year U.S. treasury note, a benchmark for long-term interest rates, started at around 3.8% in April 2004 and rose to around 4.5% in March 2005. As of mid-July 2005, the yield was around 4.2%. The target for the federal funds rate has been steadily increased since the end of the previous fiscal year, rising from 1.0% in April 2004 to 3.5% as of August 2005.
In the EU, the European Central Bank’s policy rate remained at 2% during the fiscal year ended March 31, 2005 and has remained unchanged as of July 2005.
Our financial statements are prepared in accordance with US GAAP. Many of the accounting policies require management to make difficult, complex or subjective judgments regarding the valuation of assets and liabilities. The accounting policies are fundamental to understanding our operating and financial review and prospects. The notes to our consolidated financial statements provide a summary of our significant accounting policies. The following is a summary of the critical accounting estimates.
Allowance for Credit Losses
The allowance for credit losses represents management’s estimate of probable losses in our loan portfolio. The evaluation process involves a number of estimates and judgments. The allowance is based on two principles of accounting: (1) Statement of Financial Accounting Standards, or SFAS, No. 5, “Accounting for Contingencies,” which requires that losses be accrued when they are probable of occurring and can be estimated; and (2) SFAS No. 114, “Accounting by Creditors for Impairment of a Loan” and SFAS No. 118, “Accounting by Creditors for Impairment of a Loan—Income Recognition and Disclosures,” which require that losses be accrued based on the difference between the present value of expected future cash flows discounted at the loan’s effective interest rate, the fair value of collateral or the loan’s value that is observable in the secondary market and the loan balance.
Our allowance for credit losses consists of an allocated allowance and an unallocated allowance. The allocated allowance comprises (a) the allowance for specifically identified problem loans, (b) the allowance for large groups of smaller balance homogeneous loans, (c) the allowance for loans exposed to specific country risk and (d) the formula allowance. Both the allowance for loans exposed to specific country risk and formula allowance are provided to performing loans, that are not subject to either the allowance for specifically identified problem loans or the allowance for large groups of smaller balance homogeneous loans. The allowance for loans exposed to specific country risk covers transfer risk which is not specifically covered by other types of allowance. Each of these components is determined based upon estimates that can and do change when actual events occur.
The allowance for specifically identified problem loans, which represent large-balance, non-homogeneous loans that have been individually determined to be impaired, uses various techniques to arrive at an estimate of loss. Historical loss information, discounted cash flows, fair value of collateral and secondary market information are all used to estimate those losses.
14
Table of Contents
Large groups of smaller balance homogeneous loans are collectively evaluated for impairment, and the allowance for such loans is established through a process that begins with estimates of probable losses inherent in the portfolio, based upon various analyses, including historical delinquency and credit loss experience.
The allowance for loans exposed to specific country risk is based on an estimate of probable losses relating to our exposure to countries that we identify as having a high degree of transfer risk. We use a country risk grading system that assigns risk ratings to individual countries. To determine the risk rating, we consider the instability of foreign currency and difficulties regarding our borrowers’ ability to service their debt.
The formula allowance uses a model based on historical losses as an indicator of future probable losses. However, the use of historical losses is inherently uncertain and as a result could differ from losses incurred in the future. However, since this history is updated with the most recent loss information, the differences that might otherwise occur are mitigated.
Our actual losses could be more or less than the estimates. The unallocated allowance captures losses that are attributable to various economic events, industry or geographic sectors whose impact on the portfolio have occurred but have yet to be recognized in the allocated allowance. For further information regarding our allowance for credit losses, see “Item 5.B. Liquidity and Capital Resources—Financial Condition—Allowance for Credit Losses, Nonperforming and Past Due Loans.”
In addition to the allowance for credit losses on our loan portfolio, we maintain an allowance for credit losses on off-balance-sheet credit instruments, including commitments to extend credit, a variety of guarantees and standby letters of credit. Such allowance is included in other liabilities. With regard to the allocated allowance for specifically identified credit exposure and the allocated formula allowance, we apply the same methodology that we use in determining the allowance for loan credit losses.
To the extent that actual losses differ from management’s estimates, additional provisions for credit losses may be required that would adversely impact our operating results and financial condition in future periods.
Impairment of Investment Securities
US GAAP requires the recognition in earnings of an impairment loss on investment securities for a decline in fair value that is other than temporary. Determinations of whether a decline is other than temporary often involves estimating the outcome of future events. Management judgment is required in determining whether factors exist that indicate that an impairment loss has been incurred at the balance sheet date. These judgments are based on subjective as well as objective factors. We conduct a review semi-annually to identify and evaluate investment securities that have indications of possible impairment.
Debt and marketable equity securities. In determining whether a decline in fair value is other than temporary for a particular security, indicators of an other-than-temporary decline for both debt and marketable equity securities include the extent of decline in fair value below cost and the length of time that the decline has continued. If a decline in fair value is 20% or more or a decline in fair value has continued for six months or more, we generally deem such decline as an indicator of other-than-temporary decline. We also consider the financial condition and near-term prospects of issuers primarily based on the credit standing of the issuers as determined by our credit rating system.
Prior to the fiscal year ended March 31, 2004, we did not take the lengths of time that a decline continued into consideration with respect to debt securities because a substantial majority of our investments in debt securities are in high-grade fixed-rate bonds, including sovereign bonds such as U.S. treasury bonds and we generally had the intent to hold such investments for a period longer than that inherent in cyclical short-term market price fluctuations due to market interest rate and foreign exchange rate changes. However, in light of the recent decline in the bond market, which made it difficult for us to hold debt securities for a period longer than that necessary for recovery, during the fiscal year ended March 31, 2004, we determined that the length of period that a decline
15
Table of Contents
in fair value continued should be considered in identifying other-than temporary decline in fair value of debt securities. The aggregate amount of unrealized losses at March 31, 2005 that we determined to be temporary was ¥34,884 million.
The determination of other-than-temporary impairment for certain securities held by UnionBanCal Corporation, our U.S. subsidiary, which primarily consists of securities backed by the full faith and credit of the U.S. government and corporate asset-backed and debt securities, are made on the basis of a cash flow analysis of securities and/or the ability of UnionBanCal Corporation to hold such securities to maturity.
Non-marketable equity securities. We consider the credit standing of issuers and the extent of decline in net assets of issuers to determine whether the decline is other than temporary. When we determine that the decline is other than temporary, non-marketable equity securities are written down to our share of the amount of the issuer’s net assets, which approximates fair value.
The markets for equity securities and debt securities are inherently volatile, and the values of both types of securities have fluctuated significantly in recent years. Accordingly, our assessment of potential impairment involves risks and uncertainties depending on the market condition. If we later conclude that a decline is other than temporary, the impairment loss may significantly affect our operating results and financial condition in future periods.
Valuation of Deferred Tax Assets
A valuation allowance for deferred tax assets is recognized if, based on the weight of available evidence, it is more likely than not that some portion or all of the deferred tax assets will not be realized. All available evidence, both positive and negative, is considered to determine whether, based on the weight of that evidence, a valuation allowance is needed. Future realization of the tax benefit of existing deductible temporary differences or carryforwards ultimately depends on the existence of sufficient taxable income in future periods.
In determining a valuation allowance, we perform a review of future taxable income (exclusive of reversing temporary differences and carryforwards) and future reversals of existing taxable temporary differences. Due to losses in recent years and continuing weak economic conditions, the determination of the valuation allowance involves difficult judgments to estimate future taxable income.
At March 31, 2005, we had operating loss carryforwards of ¥982.2 billion. Based on our estimates of future taxable income, we recognized a valuation allowance for a portion of the operating loss carryforwards.
Because the establishment of the valuation allowance is an inherently uncertain process involving estimates, currently established allowance may not be sufficient. If the estimated allowance is not sufficient, we will incur additional deferred tax expenses, which could materially affect our operating results and financial condition in future periods.
Accounting for Goodwill
US GAAP requires us to test goodwill for impairment at least annually using a two-step process that begins with an estimation of the fair value of a reporting unit of our business, which is to be compared with the carrying amount of the unit, to identify potential impairment of goodwill. The fair value of a reporting unit is defined as the amount at which the unit as a whole could be bought or sold in a current transaction between willing parties. Since an observable quoted market price for units is not always available, the estimate of fair value is based on the best information available, including prices for comparable units and the results of using other valuation techniques including the present value technique, which requires an estimate of future cash flows and other assumptions. If the carrying amount of a reporting unit exceeds its estimated fair value, the second step of the goodwill impairment test is performed to measure the amount of impairment loss. This test requires comparison
16
Table of Contents
of the implied fair value of the unit’s goodwill with the carrying amount of that goodwill. The estimate of the implied fair value of the reporting unit’s goodwill requires us to allocate the fair value of a reporting unit to all of the assets and liabilities of that unit, including unrecognized intangible assets, if any, since the implied fair value is determined as the excess of the fair value of a reporting unit over the net amounts assigned to its assets and liabilities in the allocation. Accordingly, the second step of the impairment test also requires an estimate of the fair value of individual assets and liabilities, including any unrecognized intangible assets that belong to that unit.
At March 31, 2005, we had goodwill of ¥56.1 billion. In connection with our merger with UFJ Bank, we expect to record a significant amount of additional goodwill.
Accrued Severance Indemnities and Pension Liabilities
We have defined benefit retirement plans, including lump-sum severance indemnities and pension plans, which cover substantially all of our employees. Severance indemnities and pension costs are calculated based upon a number of actuarial assumptions, including discount rates, expected long-term rates of return on our plan assets and rates of increase in future compensation levels. In accordance with US GAAP, actual results that differ from the assumptions are accumulated and amortized over future periods, and affect our recognized net periodic pension costs and accrued severance indemnities and pension obligations in future periods. We had an unrecognized net actuarial loss for domestic severance indemnities and pension plans of ¥281.8 billion at March 31, 2005. Differences in actual experience or changes in assumptions may affect our financial condition and operating results in future periods.
The discount rates for the domestic plans are set to reflect the interest rates of high-quality fixed-rate instruments with maturities that correspond to the timing of future benefit payments.
In developing our assumptions for expected long-term rates of return, we refer to the historical average returns earned by the plan assets and the rates of return expected to be available for reinvestment of existing plan assets, which reflect recent changes in trends and economic conditions, including market price. We also evaluate input from our actuaries, including their reviews of asset class return expectations.
Valuation of Financial Instruments with No Available Market Prices
Some assets and liabilities, including available-for-sale securities, trading accounts and derivatives, are reflected at their estimated fair values in our financial statements. Fair values for the substantial majority of our portfolio of financial instruments with no available market prices are determined based upon externally verifiable model inputs and quoted prices. All financial models, which are used for independent risk monitoring, must be validated and periodically reviewed by qualified personnel independent of the area that created the model. The fair value of derivatives is determined based upon liquid market prices evidenced by exchange-traded prices, broker-dealer quotations or prices of other transactions with similarly rated counterparties. If available, quoted market prices provide the best indication of value. If quoted market prices are not available for fixed maturity securities and derivatives, we discount expected cash flows using market interest rates commensurate with the credit quality and maturity of the investment. Alternatively, we may use matrix or model pricing to determine an appropriate fair value. In determining fair values, we consider various factors, including time value, volatility factors and underlying options, warrants and derivatives.
The estimated fair values of financial instruments without quoted market prices are as follows:
| At March 31, | ||||||
| 2004 | 2005 | |||||
| (in billions) | ||||||
Financial assets: | ||||||
Trading account assets, excluding derivatives | ¥ | 5,544 | ¥ | 5,006 | ||
Investment securities | 18,568 | 20,909 | ||||
Derivative financial instruments, net | 108 | 49 | ||||
Financial liabilities: | ||||||
Trading account liabilities, excluding derivatives | 153 | 5 | ||||
Obligations to return securities received as collateral | 2,317 | 3,015 | ||||
17
Table of Contents
A significant portion of trading account assets and liabilities, excluding derivatives, investment securities and obligations to return securities received as collateral consists of Japanese national government and agency bonds, and foreign government and official institutions bonds, for which prices are actively quoted among brokers and are readily available but are not publicly reported and therefore are not considered quoted market prices. Additionally, a substantial portion of derivative financial instruments are comprised of over-the-counter interest rate and currency swaps and options. Estimates of fair value of these derivative transactions are determined using quantitative models with multiple market inputs, which can be validated through external sources, including brokers and market transactions with third parties.
Variable Interest Entities—In January 2003, the Financial Accounting Standards Board, or FASB, issued FASB Interpretation, or FIN, No. 46, “Consolidation of Variable Interest Entities, an interpretation of ARB No. 51.” FIN No. 46 addresses consolidation by business enterprises of variable interest entities, or VIEs. The consolidation requirements of FIN No. 46 apply immediately to VIEs created after January 31, 2003. We have applied, as required, FIN No. 46 to all VIEs created after January 31, 2003. The consolidation requirements apply to older entities in the first fiscal year or interim period beginning after June 15, 2003, which has been amended by the FASB as described below.
In December 2003, the FASB issued FIN No. 46 (revised December 2003), “Consolidation of Variable Interest Entities, an interpretation of ARB No. 51,” or FIN No. 46R. FIN No. 46R modifies FIN No. 46 in certain respects including the scope exception, the definition of VIEs, and other factors that would affect the determination of VIEs and primary beneficiaries that must consolidate VIEs. FIN No. 46R, as written, applies to VIEs created before February 1, 2003 no later than the end of the first reporting period that ends after March 15, 2004, and to all special purpose entities no later than the first reporting period that ends after December 15, 2003. Subsequent to the issuance of FIN No. 46R, the Chief Accountant of the U.S. Securities and Exchange Commission, or SEC, stated the SEC staff’s position in a letter to the American Institute of Certified Public Accountants, or AICPA, dated March 3, 2004, that the SEC staff does not object to the conclusion that FIN No. 46R should not be required to be applied at a date earlier than the original FIN No. 46 and that foreign private issuers would be required to apply FIN No. 46R at various dates depending on the entity’s year-end and the frequency of interim reporting. In accordance with the letter, we adopted FIN No. 46R on April 1, 2004, except for its variable interest in certain investment companies, for which the effective date of FIN No. 46R is deferred. Under FIN No. 46R, any difference between the net amount added to the balance sheet and the amount of any previously recognized interest in the VIE is to be recognized as a cumulative effect of a change in accounting principle. The cumulative effect of the change in accounting principle was to decrease net income by ¥977 million. See note 24 to our consolidated financial statements for further discussion of VIEs in which we hold variable interests.
Certain Financial Instruments with Characteristics of both Liabilities and Equity—In May 2003, the FASB issued SFAS No. 150, “Accounting for Certain Financial Instruments with Characteristics of both Liabilities and Equity.” SFAS No. 150 establishes standards for how an issuer classifies and measures certain financial instruments with characteristics of both liabilities and equity. SFAS No. 150 is effective at the beginning of the first interim period beginning after June 15, 2003, which is our fiscal year ended March 31, 2005. On November 7, 2003, FASB Staff Position No. 150-3, “Effective Date, Disclosures, and Transition for Mandatorily Redeemable Financial Instruments of Certain Nonpublic Entities and Certain Mandatorily Redeemable Noncontrolling Interests under FASB Statement No. 150, Accounting for Certain Financial Instruments with Characteristics of Both Liabilities and Equity,” delayed the effective date of certain provisions of SFAS No. 150 for certain mandatorily redeemable noncontrolling interests. The adoption of SFAS No. 150 did not have a material impact on our financial position and results of operations.
Disclosure about Pension and Other Postretirement Benefit—In December 2003, the FASB issued SFAS No. 132 (revised 2003), “Employers’ Disclosures about Pensions and Other Postretirement Benefits, an amendment of FASB Statements No. 87, 88, and 106,” or SFAS No. 132R, which replaces existing FASB disclosure requirements for pensions. SFAS No. 132R requires disclosure of more details about plan assets,
18
Table of Contents
benefit obligations, cash flows, benefit costs and other relevant information. SFAS No. 132R is generally effective for the fiscal years ending after December 15, 2003, and for interim periods beginning after December 15, 2003. See note 15 to our consolidated financial statements for the required disclosure.
Impairment of securities investments—In November 2003, the FASB Emerging Issues Task Force, or the EITF, reached a consensus on Issue No. 03-1, “The Meaning of Other-Than-Temporary Impairment and Its Application to Certain Investments,” or EITF 03-1. EITF 03-1 requires certain additional quantitative and qualitative disclosures in addition to the disclosures already required by SFAS No. 115, “Accounting for Certain Investments in Debt and Equity Securities.” The new disclosure requirements are applied to financial statements for the fiscal years ending after December 15, 2003. See note 4 to our consolidated financial statements for the required disclosure. In March 2004, the EITF also reached a consensus on additional accounting guidance for other-than-temporary impairments, which requires an evaluation and recognition of other-than-temporary impairment by a three-step impairment test. The guidance should be applied for reporting periods beginning after June 15, 2004. On September 30, 2004, FASB Staff Position EITF Issue 03-1-1, “The Meaning of Other-Than-Temporary Impairment and its Application to Certain Investments” delayed the effective date for the measurement and recognition guidance contained in paragraphs 10 through 20 of EITF 03-1. The FASB will be issuing implementation guidance related to this topic. Once issued, we will evaluate the effect of the measurement and recognition provision of EITF 03-1.
Goodwill and Other Intangible Assets—Effective April 1, 2002, we adopted SFAS No. 142, “Goodwill and Other Intangible Assets.” SFAS No. 142 requires that goodwill, formerly amortized over its useful life, no longer be amortized but rather tested for impairment at least annually. Further, SFAS No. 142 requires that intangible assets that have finite useful lives will continue to be amortized over their useful lives while intangible assets with indefinite lives will no longer be amortized and are subject to impairment testing at least annually.
We performed the required transitional impairment tests of goodwill and intangible assets with indefinite lives upon adoption of SFAS No. 142. The initial adoption resulted in a cumulative adjustment charge to earnings of ¥532 million for the fiscal year ended March 31, 2003.
Derivative Instruments and Hedging Activities— In April 2003, the FASB issued SFAS No. 149, “Amendment of Statement 133 on Derivative Instruments and Hedging Activities.” SFAS No. 149 amends and clarifies accounting for derivative instruments, including certain derivative instruments embedded in other contracts, and for hedging activities under SFAS No. 133. In particular, SFAS No. 149 (1) clarifies under what circumstances a contract with an initial net investment meets the characteristics of a derivative, (2) clarifies when a derivative contains a financing component that warrants special reporting in the statement of cash flows, (3) amends the definition of underlyings, one of the components of the three characteristics of a derivative instrument, to include the occurrence or non-occurrence of a specified event such as a scheduled payment under a contract, and (4) amends certain other existing pronouncements, in particular, those related to the scope of instruments that are subject to the requirements of SFAS No. 133. SFAS No. 149 is generally effective for contracts entered into or modified after June 30, 2003. The adoption of SFAS No. 149 did not have a material impact on our financial position or results of operations.
Transfer to the Japanese Government of the Substitutional Portion of Employee Pension Fund Liabilities—In January 2003, the EITF reached a consensus on Issue No. 03-2, “Accounting for the Transfer to the Japanese Government of the Substitutional Portion of Employee Pension Fund Liabilities,” or EITF 03-2, which was ratified by the FASB in February 2003. EITF 03-2 addresses accounting for a transfer to the Japanese government of a substitutional portion of an employee pension fund and requires employers to account for the entire separation process of the substitutional portion from an entire plan upon completion of the transfer to the government of the substitutional portion of the benefit obligation and related plan assets as the culmination of a series of steps in a single settlement transaction. It also requires that the difference between the fair value of the obligation and the assets required to be transferred to the government, if any, should be accounted for as a subsidy from the government, separately from gain or loss on settlement of the substitutional portion of the obligation, upon completion of the transfer.
19
Table of Contents
In June 2003, we submitted to the government an application to transfer the obligation to pay benefits for future employee service related to the substitutional portion and the application was approved in August 2003. In August 2004, we made another application for transfer to the government of the remaining substitutional portion and the application was approved in November 2004. Substitutional obligation and related plan assets were transferred to a government agency in March 2005 and we were released from paying the substitutional portion of the benefits to our employees. The completion of the transfer to the Japanese Government of the substitutional portion of the employee pension plan constituted a settlement of such plan. However, since there remains a defined benefit plan and the settlement occurred subsequent to December 31, 2004 (the measurement date of such plan), the impact of the transfer / settlement of a pre-tax income of ¥36.1 billion will be recognized in the fiscal year ending March 31, 2006. See note 15 to our consolidated financial statements for the required disclosure.
Recently Issued Accounting Pronouncements
Accounting for Certain Loans and Debt Securities Acquired in a Transfer—In December 2003, the AICPA issued Statement of Position 03-3, “Accounting for Certain Loans or Debt Securities Acquired in a Transfer,” or SOP 03-3, which supersedes AICPA Practice Bulletin 6, “Amortization of Discounts on Certain Acquired Loans” and addresses accounting for differences between contractual cash flows and cash flows expected to be collected from an investor’s initial investment in loans or debt securities acquired in a transfer if those differences are attributable, at least, in part, to credit quality. SOP 03-3 requires acquired impaired loans for which it is probable that the investor will be unable to collect all contractually required payments receivable to be recorded at the present value of amounts expected to be received and prohibits carrying over or creation of valuation allowances in the initial accounting for these loans. SOP 03-3 also limits accretable yield to the excess of the investor’s estimate of undiscounted cash flows over the investor’s initial investment in the loan and prohibits the recognition of the non-accretable difference. Subsequent increases in cash flows expected to be collected generally should be recognized prospectively through adjustment of the loan’s yield over its remaining life while any decreases in cash flows expected to be collected should be recognized as impairments. SOP 03-3 also provides guidance with regard to presentation and disclosures. SOP 03-3 is effective for loans acquired in the fiscal years beginning after December 15, 2004. We have not completed the study of what effect SOP 03-3 will have on our financial position and results of operations.
Share-Based Payment—In December 2004, the FASB issued SFAS No. 123 (revised 2004), “Share-Based Payment,” or SFAS No. 123R. SFAS No. 123R replaces SFAS No. 123, “Accounting for Stock-Based Compensation,” and supersedes Accounting Principles Board Opinion, or APB, No. 25, “Accounting for Stock Issued to Employees.” SFAS No. 123 preferred a fair-value-based method of accounting for share-based payment transactions with employees, but it permitted the option of continuing to apply the guidance of using intrinsic-value-based measurement method in APB No. 25, as long as the footnotes to the financial statements disclosed what net income would have been had the preferable fair-value-based method been used. SFAS No. 123R establishes fair value as the measurement objective in accounting for share-based payment arrangements and requires a fair-value-based measurement method in accounting for share-based payment transactions with employees. As a result, the cost resulting from all share-based payment transactions shall be recognized in the financial statements. SFAS No. 123R is effective as of the beginning of the interim or annual reporting periods beginning after June 15, 2005. Seenote 1 to our consolidated financial statements for the pro forma information as if the fair value based method had been applied to all awards in accordance with SFAS No. 123.
Exchanges of Nonmonetary Assets—In December 2004, the FASB issued SFAS No. 153, “Exchanges of Nonmonetary Assets, an amendment of APB Opinion No. 29.” The guidance in APB No. 29, “Accounting for Nonmonetary Transactions,” is based on the principle that exchanges of nonmonetary assets should be measured based on the fair value of the assets exchanged. The guidance in APB No. 29, however, included certain exceptions to that principle. SFAS No. 153 amends APB No. 29 to eliminate the exception for nonmonetary exchanges of similar productive assets and replaces it with a general exception for exchanges of nonmonetary assets that do not have commercial substance. A nonmonetary exchange has commercial substance if the future cash flows of the entity are expected to change significantly as a result of the exchange. SFAS No. 153 is
20
Table of Contents
effective for nonmonetary asset exchanges occurring in fiscal periods beginning after June 15, 2005, with earlier adoption permitted. We have not completed the study of what effect SFAS No. 153 will have on our financial position and results of operations.
Accounting Changes and Error Corrections—In May 2005, the FASB issued SFAS No. 154, “Accounting Changes and Error Corrections—a replacement of APB Opinion No. 20 and FASB Statement No. 3.” SFAS No. 154 replaces APB No. 20, “Accounting Changes,” and SFAS No. 3, “Reporting Accounting Changes in Interim Financial Statements,” and changes the requirements for the accounting for and reporting of a change in accounting principle. This Statement applies to all voluntary changes in accounting principle. It also applies to changes required by an accounting pronouncement in the unusual instance that the pronouncement does not include specific transition provisions. SFAS No. 154 is effective for accounting changes and corrections of errors made in fiscal years beginning after December 15, 2005, with earlier adoption permitted. Accordingly, we can not reasonably estimate the ultimate impact of SFAS No. 154.
Accounting for Conditional Asset Retirement Obligations—In March 2005, the FASB issued FIN No. 47, “Accounting for Conditional Asset Retirement Obligations—an interpretation of FASB Statement No. 143.” This Interpretation clarifies that the term “conditional asset retirement obligation” as used in SFAS No. 143, “Accounting for Asset Retirement Obligations,” refers to a legal obligation to perform an asset retirement activity in which the timing and (or) method of settlement are conditional on a future event that may or may not be within the control of the entity. The obligation to perform the asset retirement activity is unconditional even though uncertainty exists about the timing and (or) method of settlement. SFAS No. 143 acknowledges that in some cases, sufficient information may not be available to reasonably estimate the fair value of an asset retirement obligation. This Interpretation also clarifies when an entity would have sufficient information to reasonably estimate the fair value of an asset retirement obligation. This Interpretation is effective no later than the end of fiscal years ending after December 15, 2005. We have not completed the study of what effect FIN No. 47 will have on our financial position and results of operations.
The following table sets forth a summary of our results of operations for the fiscal years ended March 31, 2003, 2004 and 2005:
| Fiscal years ended March 31, | ||||||||||||
| 2003 | 2004 | 2005 | ||||||||||
| (in billions) | ||||||||||||
Interest income | ¥ | 1,260.7 | ¥ | 1,120.2 | ¥ | 1,198.4 | ||||||
Interest expense | 435.1 | 338.9 | 389.7 | |||||||||
Net interest income | 825.6 | 781.3 | 808.7 | |||||||||
Provision (credit) for credit losses | 287.3 | (142.4 | ) | 125.1 | ||||||||
Non-interest income | 724.6 | 983.1 | 804.0 | |||||||||
Non-interest expense | 973.3 | 1,035.0 | 960.7 | |||||||||
Income from continuing operations before income tax expense and cumulative effect of a change in accounting principle | 289.6 | 871.8 | 526.9 | |||||||||
Income tax expense | 50.5 | 333.6 | 238.8 | |||||||||
Income from continuing operations before cumulative effect of a change in accounting principle | 239.1 | 538.2 | 288.1 | |||||||||
Income (loss) from discontinued operations—net | 10.4 | (0.6 | ) | — | ||||||||
Cumulative effect of a change in accounting principle, net of tax | (0.5 | ) | — | (1.0 | ) | |||||||
Net income | ¥ | 249.0 | ¥ | 537.6 | ¥ | 287.1 | ||||||
21
Table of Contents
We reported net income of ¥287.1 billion for the fiscal year ended March 31, 2005, compared to net income of ¥537.6 billion for the fiscal year ended March 31, 2004. Our basic earnings per common share (net income available to common shareholders) for the fiscal year ended March 31, 2005 was ¥55.87 compared to an earnings per share of ¥105.10 for the fiscal year ended March 31, 2004. Income from continuing operations before income tax expense and cumulative effect of a change in accounting principle for the fiscal year ended March 31, 2005 was ¥526.9 billion, compared with ¥871.8 billion for the fiscal year ended March 31, 2004. The changes in our operating results were primarily attributable to the following:
| • | Non-interest income decreased ¥179.1 billion from ¥983.1 billion for the fiscal year ended March 31, 2004 to ¥804.0 billion for the fiscal year ended March 31, 2005. This decrease was primarily attributable to a decrease of ¥246.2 billion in net foreign exchange gains, from a gain of ¥247.4 billion for the fiscal year ended March 31, 2004 to a gain of ¥1.2 billion for the fiscal year ended March 31, 2005. This decrease in foreign exchange gains was due to the depreciation of the yen against foreign currencies in the fiscal year ended March 31, 2005, compared to an appreciation of the yen in the fiscal year ended March 31, 2004. All transaction gains or losses on translation of monetary liabilities denominated in foreign currencies are included in current earnings. However, the transaction gains or losses on translation of securities available for sale, such as bonds denominated in foreign currencies, are not included in current earnings but are reflected in other changes in equity from nonowner sources. As we maintain monetary liabilities denominated in foreign currencies for our asset liability management, net foreign exchange gains (losses) fluctuate with the appreciation (depreciation) of the yen. This decrease in foreign exchange gains was partially offset by the increase in fees and commissions of ¥40.7 billion and an increase in net investment securities gains of ¥92.7 billion compared to the fiscal year ended March 31, 2004. |
| • | For the fiscal year ended March 31, 2005, provision for credit losses of ¥125.1 billion was recorded. In contrast, for the fiscal year ended March 31, 2004, a reversal of allowance for credit losses of ¥142.4 billion was recorded. Although the reversals of allowance for credit losses were recorded for both March 31, 2004 and 2005 due to improvements in our loan portfolio as evidenced by the reduction in our nonperforming loans, for the fiscal year ended March 31, 2005, additional provisions were recognized as downgrades of several borrowers to which we extended relatively large amounts of loans were greater than the reversals recognized. |
Net Interest Income
Net interest income is a function of:
| • | the amount of interest-earning assets; |
| • | the general level of interest rates; |
| • | the so-called “spread,” or the difference between the rate of interest earned on interest-earning assets and the rate of interest paid on interest-bearing liabilities; and |
| • | the proportion of interest-earning assets financed by non-interest-bearing liabilities and equity. |
Our net interest income for the fiscal years ended March 31, 2003, 2004 and 2005 were not materially affected by gains or losses resulting from derivative financial instruments used for hedging purposes.
22
Table of Contents
The following is a summary of the interest rate spread for the fiscal years ended March 31, 2003, 2004 and 2005:
| Fiscal years ended March 31, | ||||||||||||||||||
| 2003 | 2004 | 2005 | ||||||||||||||||
| Average balance | Average rate | Average balance | Average rate | Average balance | Average rate | |||||||||||||
| (in billions, except percentages) | ||||||||||||||||||
Interest-earning assets: | ||||||||||||||||||
Domestic | ¥ | 49,643.3 | 1.21 | % | ¥ | 54,930.7 | 1.07 | % | ¥ | 63,582.4 | 0.97 | % | ||||||
Foreign | 18,686.8 | 3.53 | 17,660.7 | 3.02 | 18,841.2 | 3.07 | ||||||||||||
Total | ¥ | 68,330.1 | 1.84 | % | ¥ | 72,591.4 | 1.54 | % | ¥ | 82,423.6 | 1.45 | % | ||||||
Financed by: | ||||||||||||||||||
Interest-bearing funds: | ||||||||||||||||||
Domestic | ¥ | 50,100.6 | 0.34 | % | ¥ | 55,267.0 | 0.30 | % | ¥ | 62,838.8 | 0.30 | % | ||||||
Foreign | 12,286.4 | 2.17 | 11,874.3 | 1.45 | 12,933.2 | 1.56 | ||||||||||||
Total | 62,387.0 | 0.70 | 67,141.3 | 0.50 | 75,772.0 | 0.51 | ||||||||||||
Non-interest-bearing funds | 5,943.1 | — | 5,450.1 | — | 6,651.6 | — | ||||||||||||
Total | ¥ | 68,330.1 | 0.63 | % | ¥ | 72,591.4 | 0.46 | % | ¥ | 82,423.6 | 0.47 | % | ||||||
Spread on: | ||||||||||||||||||
Interest-bearing funds | 1.14 | % | 1.04 | % | 0.94 | % | ||||||||||||
Total funds | 1.21 | % | 1.08 | % | 0.98 | % | ||||||||||||
Fiscal Year Ended March 31, 2005 Compared to Fiscal Year Ended March 31, 2004
Net interest income for the fiscal year ended March 31, 2005 was ¥808.7 billion, an increase of ¥27.4 billion, or 3.5%, from ¥781.3 billion for the fiscal year ended March 31, 2004. This increase was due primarily to an increase in the average balance of interest-earning assets.
The average interest rate spread decreased 10 basis points from 1.04% for the fiscal year ended March 31, 2004 to 0.94% for the fiscal year ended March 31, 2005. This decrease was due primarily to the increase in average rate of foreign interest-bearing funds, reflecting the rise in interest rates on foreign deposits as interest rates in foreign markets such as the United States rose, and also due to the decline in average rate of domestic investment securities and domestic loans. The decline in average rate of domestic investment securities was mainly due to the increase in our holdings of Japanese government bonds, as the interest rates on Japanese government bonds are generally lower compared to other domestic investment securities reflecting the low risk. The decline in average rate of domestic loans was mainly due to the reduction of loans with relatively high interest rates and due to increased competition in lending to large corporations and in retail housing loans, which negatively affected the interest rate spread of our loans.
Net interest income as a percentage of average total funds decreased 10 basis points from 1.08% for the fiscal year ended March 31, 2004 to 0.98% for the fiscal year ended March 31, 2005.
Average interest-earning assets for the fiscal year ended March 31, 2005 were ¥82,423.6 billion, an increase of ¥9,832.2 billion, or 13.5%, from ¥72,591.4 billion for the fiscal year ended March 31, 2004. The increase was primarily attributable to an increase of ¥6,290.1 billion in domestic investment securities, which reflected an increase in our holdings of Japanese government bonds, and an increase of ¥2,108.3 billion in domestic loans. The increase in domestic loans was primarily due to an increase in loans to industries such as manufacturing, real estate, wholesale and retail, other industries, reflecting the consolidation of certain VIEs in accordance with FIN No. 46R. An increase of ¥730.5 billion in foreign investment securities, which reflected an increase in our holdings of mortgage-backed securities, also contributed to the increase in interest-earning assets.
Average interest-bearing liabilities for the fiscal year ended March 31, 2005 were ¥75,772.0 billion, an increase of ¥8,630.7 billion, or 12.9%, from ¥67,141.3 billion for the fiscal year ended March 31, 2004. The increase in average interest-bearing liabilities primarily reflected an increase of ¥5,540.6 billion in domestic other short-term borrowings and trading account liabilities, reflecting an increase of funding from the Bank of Japan in connection with our daily money market operations, and an increase in commercial paper issued by VIEs consolidated in accordance with FIN No. 46R.
23
Table of Contents
Fiscal Year Ended March 31, 2004 Compared to Fiscal Year Ended March 31, 2003
Net interest income for the fiscal year ended March 31, 2004 was ¥781.3 billion, a decrease of ¥44.3 billion, or 5.4%, from ¥825.6 billion for the fiscal year ended March 31, 2003. This decrease was due primarily to a decline in the average interest rate spread. In addition, a decrease in average foreign loans, which earn relatively higher yields, contributed to the decrease in net interest income.
The average interest rate spread decreased 10 basis points from 1.14% for the fiscal year ended March 31, 2003 to 1.04% for the fiscal year ended March 31, 2004. The average rate of both the foreign interest-earning assets and foreign interest-bearing liabilities declined during the fiscal year ended March 31, 2004, primarily due to the decline in short-term interest rates in most foreign markets. Since the average balance of foreign interest-earning assets for the fiscal year ended March 31, 2004 was about 1.49 times larger than the average balance of foreign interest-bearing liabilities for the same period, the decline in the average rate had a negative effect on our net interest income.
Net interest income as a percentage of average total interest-earning assets decreased 13 basis points from 1.21% for the fiscal year ended March 31, 2003 to 1.08% for the fiscal year ended March 31, 2004.
The increase in average interest-earning assets for the fiscal year ended March 31, 2004 was primarily attributable to increases in average trading account assets, average investment securities and average call loans, funds sold, and receivables under resale agreements and securities borrowing transactions, which yield relatively low rate of interest income. These increases were partially offset by decreases in average interest-earning deposits and average loans, which yield relatively high rate of interest income. The shift in investment from relatively high yielding assets to low yielding assets more than offset an increase in average interest-earning assets and had a negative impact on interest income.
The increase in average interest-bearing liabilities for the fiscal year ended March 31, 2004 primarily reflected an increase in average call money, funds purchased, and payables under repurchase agreements and securities lending transactions, average deposits and average other short-term borrowings and trading account liabilities.
Provision (Credit) for Credit Losses
Provision (credit) for credit losses are charged to operations to maintain the allowance for credit losses at a level deemed appropriate by management. For a description of the approach and methodology used to establish the allowance for credit losses, see “Item 5.B. Liquidity and Capital Resources—Financial Condition—Allowance for Credit Losses, Nonperforming and Past Due Loans.”
Fiscal Year Ended March 31, 2005 Compared to Fiscal Year Ended March 31, 2004
For the fiscal year ended March 31, 2005, provision for credit losses of ¥125.1 billion was recorded. In contrast, for the fiscal year ended March 31, 2004, a reversal of allowance for credit losses of ¥142.4 billion was recorded. Although the reversals of allowance for credit losses were recorded for both March 31, 2004 and 2005 due to improvements in our loan portfolio as evidenced by the reduction in our nonperforming loans, for the fiscal year ended March 31, 2005, additional provisions were recognized as downgrades of several borrowers to which we extended relatively large amounts of loans were greater than the reversals recognized.
For a further discussion of allowance for credit losses, see “Item 5.B. Liquidity and Capital Resources—Financial Condition—Allowance for Credit Losses, Nonperforming and Past Due Loans.”
Fiscal Year Ended March 31, 2004 Compared to Fiscal Year Ended March 31, 2003
A reversal of allowance for credit losses of ¥142.4 billion was recorded for the fiscal year ended March 31, 2004, compared with a provision for credit losses of ¥287.3 billion for the fiscal year ended March 31, 2003. This change was due mainly to a decrease in our specific allowance as a result of our reduction of nonperforming loans and a decrease in our formula allowance reflecting a decline in loans classified as special mention or substandard.
24
Table of Contents
Non-Interest Income
The following table is a summary of our non-interest income for the fiscal years ended March 31, 2003, 2004 and 2005:
| Fiscal years ended March 31, | ||||||||||
| 2003 | 2004 | 2005 | ||||||||
| (in billions) | ||||||||||
Fees and commissions: | ||||||||||
Trust fees | ¥ | 21.4 | ¥ | 19.5 | ¥ | 18.2 | ||||
Fees on funds transfer and service charges for collections | 54.9 | 57.0 | 59.4 | |||||||
Fees and commissions on international business | 53.6 | 53.1 | 51.3 | |||||||
Fees and commissions on credit card business | 57.1 | 60.5 | 61.7 | |||||||
Service charges on deposits | 34.6 | 36.2 | 37.1 | |||||||
Fees and commissions on securities business | 49.2 | 79.0 | 104.3 | |||||||
Other fees and commissions | 113.6 | 135.6 | 149.6 | |||||||
Total | 384.4 | 440.9 | 481.6 | |||||||
Foreign exchange gains (losses)—net | (0.6 | ) | 247.4 | 1.2 | ||||||
Trading account profits—net | 273.7 | 117.3 | 31.3 | |||||||
Investment securities gains—net | 33.8 | 97.8 | 190.5 | |||||||
Refund of the local taxes by the Tokyo Metropolitan Government | — | 32.1 | — | |||||||
Other non-interest income | 33.3 | 47.6 | 99.4 | |||||||
Total non-interest income | ¥ | 724.6 | ¥ | 983.1 | ¥ | 804.0 | ||||
Net foreign exchange gains (losses) primarily include net gains (losses) on currency derivative instruments entered into for trading purposes and transaction gains (losses) on the translation into Japanese yen of monetary assets and liabilities denominated in foreign currencies. The transaction gains (losses) on the translation into Japanese yen fluctuate from period to period depending upon the spot rates at the end of each fiscal year. This is primarily because the transaction gains (losses) on translation of securities available for sale, such as bonds denominated in foreign currencies, are not included in current earnings, but are reflected in other changes in equity from nonowner sources, while in principle all transaction gains (losses) on translation of monetary liabilities denominated in foreign currencies are included in current earnings.
Net trading account profits primarily include net gains (losses) on trading securities and interest rate derivative instruments entered into for trading purposes. Trading account assets or liabilities are carried at fair value and any changes in the value of trading account assets or liabilities, including interest rate derivatives, are recorded in net trading account profits. Derivative instruments for trading purposes also include those used as hedges of net exposures rather than for specifically identified assets or liabilities, which do not meet the specific criteria for hedge accounting.
Net investment securities gains (losses) primarily include net gains on sales of marketable securities, particularly marketable equity securities. In addition, impairment losses are recognized as an offset of net investment securities gains when management concludes that declines in fair value of investment securities are other than temporary.
Fiscal Year Ended March 31, 2005 Compared to Fiscal Year Ended March 31, 2004
Non-interest income for the fiscal year ended March 31, 2005 was ¥804.0 billion, a decrease of ¥179.1 billion, or 18.2%, from ¥983.1 billion for the fiscal year ended March 31, 2004. This decrease was primarily attributable to a decrease in net foreign exchange gains of ¥246.2 billion and a decrease in net trading account profits of ¥86.0 billion. These decreases were partially offset by an increase in net investment securities gains of ¥92.7 billion and an increase in fees and commissions of ¥40.7 billion.
25
Table of Contents
Fees and commissions for the fiscal year ended March 31, 2005 increased ¥40.7 billion from the previous fiscal year. This increase primarily reflected an increase in fees and commissions on securities business as well as other fees and commissions. Fees and commissions on securities business increased ¥25.3 billion from the previous fiscal year primarily due to an increase in commissions in brokerage, underwriting and distribution at Mitsubishi Securities, which were in line with the increased trading volume of the Japanese stock markets during the same period and the increase in fees related to securitization business at Mitsubishi Securities. As discussed above, all of our Mitsubishi Securities shares were transferred to Mitsubishi Tokyo Financial Group, Inc. subsequent to the end of the fiscal year. Other fees and commissions increased ¥14.0 billion from the previous fiscal year, as fees related to the sales of investment and insurance products to retail customers, and fees in investment banking business, such as arrangement of syndicated loans increased.
Net foreign exchange gains for the fiscal year ended March 31, 2005 were ¥1.2 billion, compared to net foreign exchange gains of ¥247.4 billion for the fiscal year ended March 31, 2004. The decrease in foreign exchange gains was due to the depreciation of the yen against foreign currencies in the fiscal year ended March 31, 2005, compared to an appreciation of the yen in the fiscal year ended March 31, 2004. This decrease in net foreign exchange gains primarily reflected a decrease in transaction gains on translation of monetary liabilities denominated in foreign currencies. All transaction gains or losses on translation of monetary liabilities denominated in foreign currencies are included in current earnings. However, the transaction gains or losses on translation of securities available for sale, such as bonds denominated in foreign currencies, are not included in current earnings but are reflected in other changes in equity from nonowner sources. As we maintain monetary liabilities denominated in foreign currencies for our asset liability management, net foreign exchange gains (losses) fluctuate with the appreciation (depreciation) of the yen.
Net trading account profits for the fiscal year ended March 31, 2005 were ¥31.3 billion, a decrease of ¥86.0 billion, or 73.3%, from ¥117.3 billion for the fiscal year ended March 31, 2004. The net trading account profits for the fiscal years ended March 31, 2004 and 2005 consisted of the following:
| Fiscal years ended March 31, | |||||||
| 2004 | 2005 | ||||||
| (in billions) | |||||||
Net profits (losses) on derivative instruments, primarily interest-rate futures, swaps and options | ¥ | 14.7 | ¥ | (20.3 | ) | ||
Net profits on trading securities | 102.6 | 51.6 | |||||
Net trading account profits | ¥ | 117.3 | ¥ | 31.3 | |||
The decrease in net profits on trading securities primarily reflected the decrease in profits of trading in debt and equity securities at Mitsubishi Securities compared to the previous fiscal year.
Net investment securities gains for the fiscal year ended March 31, 2005 were ¥190.5 billion, an increase of ¥92.7 billion, from a gain of ¥97.8 billion for the fiscal year ended March 31, 2004. Major components of net investment securities gains for the fiscal years ended March 31, 2004 and 2005 are summarized below:
| Fiscal years ended March 31, | ||||||||
| 2004 | 2005 | |||||||
| (in billions) | ||||||||
Net gains on sales of marketable equity securities | ¥ | 269.8 | ¥ | 182.1 | ||||
Impairment losses on marketable equity securities | (10.2 | ) | (7.9 | ) | ||||
Other | (161.8 | ) | 16.3 | |||||
Net investment securities gains | ¥ | 97.8 | ¥ | 190.5 | ||||
26
Table of Contents
The increase in net investment securities gains for the fiscal year ended March 31, 2005 mainly reflected a decrease in losses on debt securities compared to the previous fiscal year, which in turn was primarily a result of smaller impairment losses on Japanese government bonds, as long-term interest rates in Japan remained relatively low and stable compared to the previous fiscal year. This improvement was partially offset by the decrease in net gains on sales of marketable equity securities and impairment losses on equity securities which are not classified as marketable equity securities, such as preferred stocks.
Other non-interest income increased by ¥51.8 billion reflecting, among other items, a ¥10.1 billion gain on the sale of a merchant card portfolio at UnionBanCal Corporation and an increase of ¥3.3 billion in net gains on sales of premises and equipment.
Fiscal Year Ended March 31, 2004 Compared to Fiscal Year Ended March 31, 2003
Non-interest income for the fiscal year ended March 31, 2004 was ¥983.1 billion, an increase of ¥258.5 billion, or 35.7%, from ¥724.6 billion for the fiscal year ended March 31, 2003. This increase was primarily attributable to an increase in net foreign exchange gains of ¥248.0 billion and an increase in net investment securities gains of ¥64.0 billion. These gains were partially offset by a decrease in net trading account profits of ¥156.4 billion.
Fees and commissions for the fiscal year ended March 31, 2004 increased ¥56.5 billion from the previous fiscal year. This increase primarily reflected an increase in fees and commissions on securities business, of which ¥26.5 billion was due to an increase in fees earned by Mitsubishi Securities. This increase was mainly because only seven months of fees and commissions generated by Mitsubishi Securities were recorded for the previous fiscal year, while its fees and commissions for twelve months were recorded for the fiscal year ended March 31, 2004. In addition, fees and commissions on securities business in Mitsubishi Securities increased for the fiscal year ended March 31, 2004, primarily due to an increase in equity-related commissions, which was in line with increased trading volume of the Japanese stock markets in general during the same period. Other factors contributing to the increase in other fees and commissions included expanding fee businesses such as agency fees earned on the sale of annuities to individual customers at our branches which act as sales agents for insurance companies, and fees from our investment banking activities.
Net trading account profits for the fiscal year ended March 31, 2004 were ¥117.3 billion, a decrease of ¥156.4 billion, or 57.2%, from ¥273.7 billion for the fiscal year ended March 31, 2003. The net trading account profits for the fiscal years ended March 31, 2003 and 2004 consisted of the following:
| Fiscal years ended March 31, | ||||||
| 2003 | 2004 | |||||
| (in billions) | ||||||
Net profits on derivative instruments, primarily interest-rate futures, swaps and options | ¥ | 262.7 | ¥ | 14.7 | ||
Net profits on trading securities | 11.0 | 102.6 | ||||
Net trading account profits | ¥ | 273.7 | ¥ | 117.3 | ||
Profits on derivative instruments were largely affected by the impact of the rise in Japanese long-term interest rates on interest rate swaps principally held for risk management purposes. Although such contracts were entered into for risk management purposes, a majority of them did not meet the conditions to qualify for hedge accounting under US GAAP and thus were accounted for as trading positions.
For the fiscal year ended March 31, 2004, we generally maintained net receive-fix and pay-variable positions in our interest rate swap portfolios for the purpose of managing interest rate risks on domestic deposits, and our interest rate swap positions resulted in losses in value in a rising Japanese long-term interest rate environment during the fiscal year ended March 31, 2004. The decrease in net profits on derivative instruments of ¥248.0 billion was partially offset by an increase in net profits on trading securities of ¥91.6 billion, primarily reflecting
27
Table of Contents
improved performance of trading in debt and equity securities at Mitsubishi Securities supported by high interest rate volatility and improvements in the Japanese stock markets during the fiscal year ended March 31, 2004.
Net foreign exchange gains for the fiscal year ended March 31, 2004 were ¥247.4 billion, an increase of ¥248.0 billion from net loss of ¥0.6 billion for the fiscal year ended March 31, 2003. The increase in net foreign exchange gains primarily reflected an increase in transaction gains on translation of monetary liabilities denominated in foreign currencies due to the appreciation of the yen. All transaction gains or losses on translation of monetary liabilities denominated in foreign currencies are included in current earnings. However, the transaction gains or losses on translation of securities available for sale, such as bonds denominated in foreign currencies, are not included in current earnings but are reflected in other changes in equity from nonowner sources.
Net investment securities gains for the fiscal year ended March 31, 2004 were ¥97.8 billion, an increase of ¥64.0 billion, from net gains of ¥33.8 billion for the fiscal year ended March 31, 2003. Major components of net investment securities gains for the fiscal years ended March 31, 2003 and 2004 are summarized below:
| Fiscal years ended March 31, | ||||||||
| 2003 | 2004 | |||||||
| (in billions) | ||||||||
Net gains on sales of marketable equity securities | ¥ | 116.6 | ¥ | 269.8 | ||||
Impairment losses on marketable equity securities | (208.1 | ) | (10.2 | ) | ||||
Other—net, principally gains (losses) on debt securities | 125.3 | (161.8 | ) | |||||
Net investment securities gains | ¥ | 33.8 | ¥ | 97.8 | ||||
The increase in net investment securities gains during the fiscal year ended March 31, 2004 reflected the improvement in the Japanese stock market, as net gains on sales of marketable equity securities increased and impairment losses on marketable equity securities decreased compared to the previous fiscal year. These gains were partially offset by losses on debt securities, which were mainly due to impairment losses on Japanese government bonds, reflecting the rise in long-term interest rates in Japan.
Non-interest income also increased due to the refund of the local taxes by the Tokyo Metropolitan Government of ¥32.1 billion in October 2003.
Non-Interest Expense
The following table shows a summary of our non-interest expense for the fiscal years ended March 31, 2003, 2004 and 2005:
| Fiscal years ended March 31, | |||||||||
| 2003 | 2004 | 2005 | |||||||
| (in billions) | |||||||||
Salaries and employee benefits | ¥ | 397.8 | ¥ | 412.5 | ¥ | 399.3 | |||
Occupancy expenses—net | 88.9 | 86.6 | 88.1 | ||||||
Fees and commission expenses | 70.3 | 68.9 | 77.3 | ||||||
Amortization of intangible assets | 38.7 | 54.2 | 58.7 | ||||||
Insurance premiums, including deposit insurance | 38.8 | 45.1 | 47.9 | ||||||
Minority interest in income of consolidated subsidiaries | 6.0 | 45.8 | 39.1 | ||||||
Communications | 19.6 | 25.5 | 25.9 | ||||||
Other non-interest expenses | 313.2 | 296.4 | 224.4 | ||||||
Total non-interest expense | ¥ | 973.3 | ¥ | 1,035.0 | ¥ | 960.7 | |||
28
Table of Contents
Fiscal Year Ended March 31, 2005 Compared to Fiscal Year Ended March 31, 2004
Non-interest expense for the fiscal year ended March 31, 2005 was ¥960.7 billion, a decrease of ¥74.3 billion from the previous fiscal year. This decrease was primarily due to a decrease in other non-interest expenses, principally reflecting a decrease in the provision for off-balance-sheet credit instruments caused by the decrease in off-balance-sheet exposure.
In addition, a decrease of ¥13.2 billion in salaries and employee benefits contributed to the decrease in non-interest expense. The decrease in salaries and employee benefits was as primarily due to a decrease in the net periodic pension cost. The reduction in the net periodic pension cost was primarily the result of lower amortization charges, reflecting a decrease in the unrecognized net actuarial loss at the beginning of the fiscal year ended March 31, 2004 and 2005. The decrease in the unrecognized net actuarial loss was mainly caused by an increase in the discount rate and in the actual return on plan assets.
Fiscal Year Ended March 31, 2004 Compared to Fiscal Year Ended March 31, 2003
Non-interest expense for the fiscal year ended March 31, 2004 was ¥1,035.0 billion, an increase of ¥61.7 billion from the previous fiscal year. This increase was primarily attributable to an increase in minority interest in income of consolidated subsidiaries of ¥39.8 billion. The increases in salaries and employee benefits, amortization of intangible assets and insurance premiums, including deposit insurance, also caused the increase in non-interest expense compared to the previous fiscal year.
Salaries and employee benefits increased primarily due to an increase of ¥14.4 billion in salaries and employee benefits in Mitsubishi Securities, as only seven months of salaries and employee benefits of Mitsubishi Securities were recorded for the previous fiscal year, while its salaries and employee benefits for twelve months were recorded for the fiscal year ended March 31, 2004.
Amortization of intangible assets increased primarily due to an increase in the capitalized cost of software as we continued to invest in new information systems, such as investment in the new IT system for our foreign offices.
Minority interest in income of consolidated subsidiaries increased ¥39.8 billion from ¥6.0 billion for the fiscal year ended March 31, 2003 to ¥45.8 billion for the fiscal year ended March 31, 2004. This increase was primarily attributable to the improvement in the results of operations at Mitsubishi Securities from a net loss for the fiscal year ended March 31, 2003 to positive net income for the fiscal year ended March 31, 2004. A significant recovery in the stock markets during the fiscal year ended March 31, 2004 contributed primarily to the improvement.
Insurance premiums, including that for deposit insurance, increased reflecting an increase in our deposits.
These increases were partially offset by a decrease of ¥16.1 billion in other non-interest expenses. Although there was an increase in sundry expenses for the fiscal year ended March 31, 2004, absences of major and temporary expense items which were incurred only for the previous fiscal year led to the decrease in other non-interest expenses. Other non-interest expenses for the previous fiscal year included a ¥19.6 billion loss resulting from the decrease in net assets in a subsidiary that was accounted for as having been sold in connection with the merger of the four securities companies to form Mitsubishi Securities on September 1, 2002, and the additional post-merger expense of ¥10.6 billion that was incurred in completing the merger.
29
Table of Contents
Income Tax Expense
The following table presents a summary of our income tax expense:
| Fiscal years ended March 31, | ||||||||||||
| 2003 | 2004 | 2005 | ||||||||||
| (in billions, except percentages) | ||||||||||||
Income from continuing operations before income tax expense | ¥ | 289.6 | ¥ | 871.8 | ¥ | 526.9 | ||||||
Income tax expense | ¥ | 50.4 | ¥ | 333.6 | ¥ | 238.8 | ||||||
Effective tax rate | 17.4 | % | 38.3 | % | 45.3 | % | ||||||
Normal effective statutory tax rate | 38.0 | % | 38.0 | % | 40.6 | % | ||||||
Our holding company, Mitsubishi Tokyo Financial Group, Inc. elected to file consolidated corporate-tax returns starting from the fiscal year ended March 31, 2003, and we are a member of the consolidated group. We, however, have used a separate return method of allocation. Under the separate return method of allocation, current and deferred taxes for the fiscal years ended March 31, 2003, 2004 and 2005 were determined by applying the requirements of SFAS No. 109 as if we were filing a separate tax return. Although the consolidated corporate-tax system requires us to pay, for the fiscal years ended March 31, 2003 and 2004, a surcharge tax of 2.0% of taxable income in addition to the national corporate income tax rate of 30.0% applied to separate tax returns filers, we do not take such surcharge tax into consideration in determining current and deferred income taxes under the separate return method of allocation.
In February 2005, the Japanese tax authorities approved application to suspend the consolidated corporate-tax system by Mitsubishi Tokyo Financial Group, Inc. We filed, for the fiscal year ended March 31, 2005, our tax returns as part of Mitsubishi Tokyo Financial Group, Inc.’s consolidated corporate-tax system. Due to the suspension of the consolidated corporate-tax system, deferred income taxes have been calculated separately based on temporary differences as of March 31, 2005 and future taxable income at each company.
In addition, under the new local tax laws which was enacted in March 2003 for the fiscal years beginning after March 31, 2004, new uniform local taxes become effective. These new rules introduce value-added taxes and replace part of the existing local taxes based on income. The new local taxes are computed based on three components: (a) amount of profit, (b) amount of value-added (total payroll, net interest paid or received, net rent paid and income before use of net operating losses) and (c) amount of total paid-in capital. The taxes are computed by adding together the totals of each of the three components which are calculated separately.
The enactment of the new uniform local tax laws mentioned above, which will supersede the current local taxes, including the local taxes levied by Tokyo Metropolitan Government, resulted in a decrease of ¥63.9 billion in income tax expense for the fiscal year ended March 31, 2003 through an increase in deferred tax assets.
30
Table of Contents
Reconciling items between the combined normal effective statutory tax rates and the effective income tax rates for the fiscal years ended March 31, 2003, 2004 and 2005 are summarized as follows:
| Fiscal years ended March 31, | |||||||||
| 2003 | 2004 | 2005 | |||||||
Combined normal effective statutory tax rate | 38.0 | % | 38.0 | % | 40.6 | % | |||
Reconciling items: | |||||||||
Nondeductible expenses | 3.0 | 0.1 | 0.5 | ||||||
Dividends from foreign subsidiaries | 3.5 | 0.9 | 1.5 | ||||||
Foreign tax credit and payments | 7.9 | 0.7 | 1.1 | ||||||
Higher (lower) tax rates applicable to income of subsidiaries | (0.6 | ) | 0.3 | (1.1 | ) | ||||
Foreign tax refund | (1.1 | ) | — | — | |||||
Minority interest | 1.1 | 1.9 | 2.0 | ||||||
Change in valuation allowance | 2.1 | (4.9 | ) | 0.5 | |||||
Enacted change in tax rates | (22.1 | ) | (0.3 | ) | — | ||||
Liquidation of subsidiaries | (14.3 | ) | (1.7 | ) | 0.3 | ||||
Change in foreign exchange rate | (0.2 | ) | 1.5 | 0.9 | |||||
Other—net | 0.1 | 1.8 | (1.0 | ) | |||||
Effective income tax rate | 17.4 | % | 38.3 | % | 45.3 | % | |||
The effective income tax rate of 45.3% for the fiscal year ended March 31, 2005 was 4.7 percentage points higher than the normal effective statutory tax rate of 40.6%. This increase resulted from certain reconciliation items, including reconciliation due to minority interest, change in valuation allowance, dividends from foreign subsidiaries and foreign tax credit and payments.
The effective income tax rate of 38.3% for the fiscal year ended March 31, 2004 was approximately the same level with the normal effective statutory tax rate of 38.0%. Although there was a 4.9 percentage points equivalent of downward reconciliation due to the change in valuation allowance, the decrease was substantially offset by some other upward reconciliations, including reconciliations related to minority interest, change in foreign exchange rate, dividends from foreign subsidiaries, and foreign tax credit and payments.
We measure the performance of each of our business segments primarily in terms of “operating profit” in accordance with the regulatory reporting requirements of the Financial Services Agency. Operating profit and other segment information are based on Japanese GAAP and are not consistent with our financial statements prepared on the basis of US GAAP. For example, operating profit under Japanese GAAP does not reflect items such as a part of provisions (credit) for credit losses (primarily an equivalent of formula allowance under US GAAP), foreign exchange gains (losses) and equity investment securities gains (losses).
We maintain our business unit system based on customer and product segmentation. Our major business units during the fiscal year ended March 31, 2005 were:
| • | retail banking, which provides banking products and services to individual customers in Japan; |
| • | commercial banking, which provides banking products and services to large corporations and some small and medium-sized companies; |
| • | global corporate banking, which provides banking services to large Japanese corporations and their overseas operations as well as non-Japanese corporations who do business on a global basis, excluding UNBC’s customers; |
| • | investment banking and asset management, which provides advisory and other services related to securities services of us, syndicated loans, project financing, derivatives and securitization and other investment banking activities, and which provides asset management and trust products and services mainly to high net worth individuals, branch customers and corporate clients in Japan; |
31
Table of Contents
| • | UNBC, which includes our subsidiaries in California, UnionBanCal Corporation and Union Bank of California, N.A.; |
| • | operations services, which provides operations and settlement services to its other business units, including settlement and foreign exchange; |
| • | treasury,which conducts its asset and liability management and liquidity management; and |
| • | other, which consists of: |
| • | systems services, which is responsible for its computer systems; |
| • | eBusiness & IT Initiatives, which is responsible for developing information technology business opportunities; |
| • | the corporate center, which retains functions such as strategic planning, overall risk management, internal auditing and compliance; and |
| • | the elimination of duplicated amounts of net revenue among business segments. |
For each of the three fiscal years ended March 31, 2003, 2004 and 2005, Mitsubishi Securities has been presented as a separate operating segment which includes Mitsubishi Securities and its subsidiaries that provide a broad range of retail and corporate securities services and products including retail brokerage, securitization, M&A advisory and derivatives. In July 2005, however, we transferred all of our Mitsubishi Securities common stock to our parent company, Mitsubishi Tokyo Financial Group, Inc.
In July 2004, we transferred our overseas securities subsidiary, Tokyo-Mitsubishi International plc, to Mitsubishi Securities. Tokyo-Mitsubishi International plc has since been renamed in line with the name of its new parent company, to Mitsubishi Securities International plc. We have reclassified the business segment information for the fiscal years ended March 31, 2003 and 2004 based on the current fiscal year’s presentation.
In addition, we transferred our custody business, which had been included in the operations services business unit, to investment banking and asset management business unit during the fiscal year ended March 31, 2005. We have reclassified the business segment information for the fiscal years ended March 31, 2003 and 2004 based on the current fiscal year’s presentation.
The following table shows the business segment information for the fiscal years ended March 31, 2003, 2004 and 2005:
| Retail Banking | Commercial Banking | Global Corporate Banking | Investment Banking and Asset Management | UNBC | Operations Services | Treasury | Mitsubishi Securities | Other | Total | ||||||||||||||
| (in billions) | |||||||||||||||||||||||
Fiscal year ended March 31, 2003: | |||||||||||||||||||||||
Net revenue | ¥280.0 | ¥286.6 | ¥262.9 | ¥78.7 | ¥269.8 | ¥19.8 | ¥287.8 | ¥68.2 | ¥ | (88.1 | ) | ¥ | 1,465.7 | ||||||||||
Operating expenses | 211.7 | 127.0 | 129.9 | 45.8 | 155.5 | 16.9 | 26.7 | 82.9 | 80.0 | 876.4 | |||||||||||||
Operating profit (loss) | ¥68.3 | ¥159.6 | ¥133.0 | ¥32.9 | ¥114.3 | ¥2.9 | ¥261.1 | ¥(14.7) | ¥ | (168.1 | ) | ¥ | 589.3 | ||||||||||
Fiscal year ended March 31, 2004: | |||||||||||||||||||||||
Net revenue | ¥302.9 | ¥297.7 | ¥246.4 | ¥104.8 | ¥253.5 | ¥18.1 | ¥186.3 | ¥157.2 | ¥ | (95.1 | ) | ¥ | 1,471.8 | ||||||||||
Operating expenses | 204.1 | 119.6 | 120.2 | 37.0 | 150.9 | 18.4 | 26.3 | 124.3 | 40.7 | 841.5 | |||||||||||||
Operating profit (loss) | ¥98.8 | ¥178.1 | ¥126.2 | ¥67.8 | ¥102.6 | ¥(0.3) | ¥160.0 | ¥32.9 | ¥ | (135.8 | ) | ¥ | 630.3 | ||||||||||
Fiscal year ended March 31, 2005: | |||||||||||||||||||||||
Net revenue | ¥336.8 | ¥321.2 | ¥247.9 | ¥135.8 | ¥274.9 | ¥16.7 | ¥190.9 | ¥151.8 | ¥ | (114.4 | ) | ¥ | 1,561.6 | ||||||||||
Operating expenses | 215.7 | 121.9 | 121.3 | 41.1 | 158.8 | 14.5 | 25.3 | 127.2 | 46.6 | 872.4 | |||||||||||||
Operating profit (loss) | ¥121.1 | ¥199.3 | ¥126.6 | ¥94.7 | ¥116.1 | ¥2.2 | ¥165.6 | ¥24.6 | ¥ | (161.0 | ) | ¥ | 689.2 | ||||||||||
32
Table of Contents
When our business units work together to provide services to customers, we assign the total amount of net revenue derived from those services to each participating business unit without dividing the net revenue. As a result, some items of net revenue are duplicated among the participating segments. The duplicated amounts are eliminated in the “Other” column. The following is a summary of the duplicated amounts between those segments. The total of such duplicated amounts is included in “Other” in the table above.
| Retail Banking | Commercial Banking | Global Corporate Banking | Total Amount Eliminated | |||||||||||
| (in billions) | ||||||||||||||
Fiscal year ended March 31, 2003: | ||||||||||||||
Investment Banking and Asset Management and Mitsubishi Securities | ¥ | — | ¥ | 9.7 | ¥ | 28.7 | ¥ | 38.4 | ||||||
Fiscal year ended March 31, 2004: | ||||||||||||||
Investment Banking and Asset Management and Mitsubishi Securities | ¥ | 0.3 | ¥ | 25.3 | ¥ | 38.0 | ¥ | 63.6 | ||||||
Fiscal year ended March 31, 2005: | ||||||||||||||
Investment Banking and Asset Management and Mitsubishi Securities | ¥ | 0.7 | ¥ | 53.4 | ¥ | 39.2 | ¥ | 93.3 | ||||||
Fiscal Year Ended March 31, 2005 Compared to Fiscal Year Ended March 31, 2004
Total net revenue increased ¥89.8 billion, or 6.1%, from ¥1,471.8 billion for the fiscal year ended March 31, 2004 to ¥1,561.6 billion for the fiscal year ended March 31, 2005. Net revenue increased ¥33.9 billion in the retail business unit and ¥31.0 billion in the investment banking and asset management business unit, while it decreased ¥19.3 billion in the “Other” column.
Total operating expenses increased ¥30.9 billion, or 3.7%, from ¥841.5 billion for the fiscal year ended March 31, 2004 to ¥872.4 billion for the fiscal year ended March 31, 2005. This increase was due mainly to an increase of ¥11.6 billion in the retail business unit, which primarily reflected an increase of an advertising fee. Operating expenses also increased ¥4.1 billion in the investment banking and asset management unit. These increases were partially offset by a decrease of ¥3.9 billion in the operation services unit. Credit losses are allocated to the corporate center rather than being reflected in each business segment.
Net revenue of the retail banking business unit increased ¥33.9 billion, or 11.2%, from ¥302.9 billion for the fiscal year ended March 31, 2004 to ¥336.8 billion for the fiscal year ended March 31, 2005. This increase was due mainly to an increase in interest income of ¥12.2 billion, which primarily reflected an increase of interest income on commercial deposits, and fee income of ¥11.5 billion, reflecting an increase of fee income on insurance products and the investment trust business.
Net revenue of the commercial banking business unit increased ¥23.5 billion, or 7.9%, from ¥297.7 billion for the fiscal year ended March 31, 2004 to ¥321.2 billion for the fiscal year ended March 31, 2005. This increase was due mainly to an increase of ¥17.8 billion in other income, which primarily reflected an increase in derivatives sales and currency options sales. This increase was partially offset by a decrease in net interest income of ¥8.6 billion, reflecting weak corporate cash demand.
Net revenue of the global corporate banking business unit increased ¥1.5 billion, or 0.6%, from ¥246.4 billion for the fiscal year ended March 31, 2004 to ¥247.9 billion for the fiscal year ended March 31, 2005. This increase was due mainly to an increase of fee income of ¥6.0 billion and the depreciation of the yen against the European currencies during the fiscal year ended March 31, 2005 compared to that of the previous year.
33
Table of Contents
Net revenue of the investment banking and asset management business unit increased ¥31.0 billion, or 29.6%, from ¥104.8 billion for the fiscal year ended March 31, 2004 to ¥135.8 billion for the fiscal year ended March 31, 2005. This increase was due mainly to an increase of ¥16.1 billion in fee income, which primarily reflected an increase of investment banking related fee income such as syndicate loans, and an increase of ¥12.6 billion in other income, reflecting an increase in fees from sales of derivative products.
Net revenue of the UNBC business unit increased ¥21.4 billion, or 8.5%, from ¥253.5 billion for the fiscal year ended March 31, 2004 to ¥274.9 billion for the fiscal year ended March 31, 2005. This increase was due mainly to an increase of fee income such as service charges on deposit accounts and an increase on interest income, which was favorably influenced by higher earning asset volumes and strong deposit growth. Gains on sales of the merchant card portfolio as well as gains on the sale of real property also contributed to the increase in net revenue.
Net revenue of the operations services unit decreased ¥1.4 billion, or 7.7%, from ¥18.1 billion for the fiscal year ended March 31, 2004 to ¥16.7 billion for the fiscal year ended March 31, 2005, due mainly to a decline in revenue of our domestic subsidiaries.
Net revenue of the treasury unit increased ¥4.6 billion, or 2.5%, from ¥186.3 billion for the fiscal year ended March 31, 2004 to ¥190.9 billion for the fiscal year ended March 31, 2005. This increase was largely due to an increase of interest income of ¥45.5 billion, which primarily reflected an interest income on investment bonds and ALM operations. This increase was partially offset by a decrease in other income of ¥41.0 billion, reflecting loss on foreign currencies’ hedging operations against interest rate rising.
Net revenue of Mitsubishi Securities decreased ¥5.4 billion, or 3.5%, from ¥157.2 billion for the fiscal year ended March 31, 2004 to ¥151.8 billion for the fiscal year ended March 31, 2005. This decrease was due mainly to a decrease in profits on trading of bonds and stocks.
Fiscal Year Ended March 31, 2004 Compared to Fiscal Year Ended March 31, 2003
Total net revenue increased ¥6.1 billion, or 0.4%, from ¥1,465.7 billion for the fiscal year ended March 31, 2003 to ¥1,471.8 billion for the fiscal year ended March 31, 2004. Net revenue increased ¥89.0 billion at Mitsubishi Securities (reflecting, however, only seven months of fees and commissions in the prior year) and ¥26.1 billion in the investment banking and asset management business unit, while it decreased ¥101.5 billion in the treasury unit.
Total operating expenses decreased ¥34.9 billion, or 4.0%, from ¥876.4 billion for the fiscal year ended March 31, 2003 to ¥841.5 billion for the fiscal year ended March 31, 2004. This decrease was due mainly to a decrease of ¥39.3 billion in the “Other” column, which primarily reflected a decrease in the general provision for credit losses of ¥49.7 billion. Credit losses are allocated to the corporate center rather than being reflected in each business segment. Operating expenses also decreased ¥9.7 billion in the global corporate banking unit. These decreases were partially offset by an increase of ¥41.4 billion in Mitsubishi Securities.
Net revenue of the retail banking business unit increased ¥22.9 billion, or 8.2%, from ¥280.0 billion for the fiscal year ended March 31, 2003 to ¥302.9 billion for the fiscal year ended March 31, 2004. This increase was largely due to an increase in fee income of ¥11.2 billion, reflecting an increase of fee income on insurance products and the investment trust business.
Net revenue of the commercial banking business unit increased ¥11.1 billion, or 3.9%, from ¥286.6 billion for the fiscal year ended March 31, 2003 to ¥297.7 billion for the fiscal year ended March 31, 2004. This increase was due mainly to an increase of ¥13.6 billion in other income, which primarily reflected an increase in derivatives sales and currency options sales. This increase was partially offset by a decrease in net interest income of ¥5.0 billion, reflecting our continued effort to reduce problem loans.
34
Table of Contents
Net revenue of the global corporate banking business unit decreased ¥16.5 billion, or 6.3%, from ¥262.9 billion for the fiscal year ended March 31, 2003 to ¥246.4 billion for the fiscal year ended March 31, 2004. This decrease was due mainly to the appreciation of the yen against the US dollar and Asian currencies during the fiscal year ended March 31, 2004 compared to that of the previous year.
Net revenue of the investment banking and asset management business unit increased ¥26.1 billion, or 33.2%, from ¥78.7 billion for the fiscal year ended March 31, 2003 to ��104.8 billion for the fiscal year ended March 31, 2004. This increase was largely due to an increase of ¥16.6 billion in other income, reflecting an increase in fees from sales of derivative products.
Net revenue of the UNBC business unit decreased ¥16.3 billion, or 6.0%, from ¥269.8 billion for the fiscal year ended March 31, 2003 to ¥253.5 billion for the fiscal year ended March 31, 2004. This decrease was due mainly to the appreciation of the yen against the US dollar at the end of UNBC’s 2003 fiscal year compared to that of the previous year. In terms of the noon buying rate of the Federal Reserve Bank of New York, the value of the yen against the US dollar appreciated approximately 9.8%, from ¥118.75 on December 31, 2002 to ¥107.13 on December 31, 2003.
Net revenue of the operations services unit decreased ¥1.7 billion, or 9.1%, from ¥19.8 billion for the fiscal year ended March 31, 2003 to ¥18.1 billion for the fiscal year ended March 31, 2004, due mainly to a decline in revenue of our domestic subsidiaries.
Net revenue of the treasury unit decreased ¥101.5 billion, or 35.3%, from ¥287.8 billion for the fiscal year ended March 31, 2003 to ¥186.3 billion for the fiscal year ended March 31, 2004. In the previous fiscal year, the declining foreign currency interest rate environment was one of the primary reasons for the increase in net revenue from foreign currency bond trading and net interest income. In the fiscal year ended March 31, 2004, foreign currency interest rates generally remained stable, causing a decline in such net revenue compared to the previous fiscal year.
Net revenue of Mitsubishi Securities increased ¥89.0 billion, or 130.5%, from ¥68.2 billion for the fiscal year ended March 31, 2003 to ¥157.2 billion for the fiscal year ended March 31, 2004. This increase was mainly because only seven months of fees and commissions generated by KOKUSAI Securities Co., Ltd., one of the predecessors of Mitsubishi Securities, were recorded for the previous fiscal year, while its fees and commissions for twelve months were recorded for the fiscal year ended March 31, 2004. In addition, there was an increase in profits on trading of bonds and stocks and an increase in commissions and fees in stock brokerage.
35
Table of Contents
The following table sets forth our total revenue, income from continuing operations before income tax expense (benefit) and cumulative effect of a change in accounting principle and net income on a geographic basis, based principally on the domicile of activities for the fiscal years ended March 31, 2003, 2004 and 2005:
| Fiscal years ended March 31, | |||||||||
| 2003 | 2004 | 2005 | |||||||
| (in billions) | |||||||||
Total revenue (interest income and non-interest income): | |||||||||
Domestic | ¥ | 1,025.5 | ¥ | 1,309.1 | ¥ | 1,297.9 | |||
Foreign: | |||||||||
United States | 455.9 | 396.5 | 413.2 | ||||||
Europe | 292.2 | 217.0 | 126.6 | ||||||
Asia/Oceania excluding Japan | 131.4 | 72.0 | 100.6 | ||||||
Other areas* | 80.3 | 108.7 | 64.1 | ||||||
Total foreign | 959.8 | 794.2 | 704.5 | ||||||
Total | ¥ | 1,985.3 | ¥ | 2,103.3 | ¥ | 2,002.4 | |||
Income from continuing operations before income tax expense (benefit) and cumulative effect of a change in accounting principle: | |||||||||
Domestic | ¥ | 18.2 | ¥ | 601.2 | ¥ | 205.9 | |||
Foreign: | |||||||||
United States | 86.1 | 31.7 | 146.5 | ||||||
Europe | 114.6 | 146.9 | 55.3 | ||||||
Asia/Oceania excluding Japan | 48.0 | 52.0 | 71.9 | ||||||
Other areas* | 22.7 | 40.0 | 47.3 | ||||||
Total foreign | 271.4 | 270.6 | 321.0 | ||||||
Total | ¥ | 289.6 | ¥ | 871.8 | ¥ | 526.9 | |||
Net income: | |||||||||
Domestic | ¥ | 22.0 | ¥ | 370.1 | ¥ | 91.1 | |||
Foreign: | |||||||||
United States | 55.6 | 25.7 | 90.6 | ||||||
Europe | 112.2 | 90.3 | 30.5 | ||||||
Asia/Oceania excluding Japan | 37.8 | 30.9 | 46.0 | ||||||
Other areas* | 21.4 | 20.6 | 28.9 | ||||||
Total foreign | 227.0 | 167.5 | 196.0 | ||||||
Total | ¥ | 249.0 | ¥ | 537.6 | ¥ | 287.1 | |||
| * | Other areas primarily include Canada, Latin America and the Caribbean. |
Fiscal Year Ended March 31, 2005 Compared to Fiscal Year Ended March 31, 2004
Domestic net income for the fiscal year ended March 31, 2005 was ¥91.1 billion, compared to ¥370.1 billion for the fiscal year ended March 31, 2004. This decline primarily reflected a decrease in non-interest income due to a decrease in foreign exchange gains and an increase in the provision for credit losses compared to the previous fiscal year.
Foreign net income for the fiscal year ended March 31, 2005 was ¥196.0 billion, compared to ¥167.5 billion for the fiscal year ended March 31, 2004. This increase primarily reflected increases in net income in the United States and in the Asia/Oceania region excluding Japan, which were partially offset by a decrease in Europe.
36
Table of Contents
Fiscal Year Ended March 31, 2004 Compared to Fiscal Year Ended March 31, 2003
Domestic total revenue increased ¥283.6 billion, or 27.7%, from ¥1,025.5 billion for the fiscal year ended March 31, 2003 to ¥1,309.1 billion for the fiscal year ended March 31, 2004. This increase primarily reflected increases in net investment securities gains and net foreign exchange gains. The increase was partially offset by a decrease in net trading account profits.
Foreign total revenue decreased ¥165.6 billion, or 17.3%, from ¥959.8 billion for the fiscal year ended March 31, 2003 to ¥794.2 billion for the fiscal year ended March 31, 2004. This decrease primarily reflected decreases in net investment securities gains and interest income. The decrease was partially offset by an increase in net foreign exchange gains.
Domestic income from continuing operations before income tax expense (benefit) and cumulative effect of a change in accounting principle increased ¥583.0 billion, or 3,203.1%, from ¥18.2 billion for the fiscal year ended March 31, 2003 to ¥601.2 billion for the fiscal year ended March 31, 2004. In addition to the above mentioned increase in revenue, a reversal of allowance for credit losses contributed to the marked increase in income from continuing operations before income tax expense (benefit) and cumulative effect of a change in accounting principle.
Foreign income from continuing operations before income tax expense and cumulative effect of a change in accounting principle for the fiscal year ended March 31, 2004 was ¥270.6 billion, representing substantially the same level compared to ¥271.4 billion for the fiscal year ended March 31, 2003. Although the foreign total revenue decreased as noted above, a decrease in interest expense as well as an improvement in the provision for credit losses offset the decrease in revenue.
Effect of the Change in Exchange Rates on Foreign Currency Translation
Fiscal Year Ended March 31, 2005 Compared to Fiscal Year Ended March 31, 2004
The average exchange rate for the fiscal year ended March 31, 2005 was ¥107.55 per $1.00, compared to the prior fiscal year’s average exchange rate of ¥113.07 per $1.00. The average exchange rate for the conversion of the US dollar financial statements of some of our foreign subsidiaries for the fiscal year ended December 31, 2004 was ¥108.24 per $1.00, compared to the average exchange rate for the fiscal year ended December 31, 2003 of ¥115.98 per $1.00.
The change in the average exchange rate of the yen against the US dollar and other foreign currencies resulted in translation losses on total revenue of approximately ¥34 billion, net interest income of approximately ¥16 billion and income before income taxes of approximately ¥13 billion for the fiscal year ended March 31, 2005.
Fiscal Year Ended March 31, 2004 Compared to Fiscal Year Ended March 31, 2003
The average exchange rate for the fiscal year ended March 31, 2004 was ¥113.07 per $1.00, compared to the prior fiscal year’s average exchange rate of ¥121.94 per $1.00. The average exchange rate for the conversion of the US dollar financial statements of some of our foreign subsidiaries for the fiscal year ended December 31, 2003 was ¥115.98 per $1.00, compared to the average exchange rate for the fiscal year ended December 31, 2002 of ¥125.34 per $1.00.
The change in the average exchange rate of the yen against the US dollar and other foreign currencies resulted in translation losses on total revenue of approximately ¥39 billion, net interest income of approximately ¥19 billion and income before income taxes of approximately ¥15 billion for the fiscal year ended March 31, 2004.
37
Table of Contents
| B. | Liquidity and Capital Resources |
Total Assets
Our total assets at March 31, 2005 were ¥92.05 trillion, representing an increase of ¥6.99 trillion, from ¥85.06 trillion at March 31, 2004. This increase was due primarily to an increase of ¥3.57 trillion in net loans, an increase of ¥1.26 trillion in cash and due from banks, and an increase of ¥2.32 trillion in investment securities. This increase was partially offset by a decrease of ¥0.92 trillion in receivables under resale agreements.
We have allocated a substantial portion of our assets to international activities. As a result, reported amounts are affected by changes in the value of the yen against the US dollar and other foreign currencies. Foreign assets are denominated primarily in US dollars. The following table shows our total assets at March 31, 2004 and 2005 by geographic region based principally on the domicile of the obligors:
| At March 31, | ||||||
| 2004 | 2005 | |||||
| (in trillions) | ||||||
Japan | ¥ | 66.42 | ¥ | 70.97 | ||
Foreign: | ||||||
United States of America | 9.52 | 11.75 | ||||
Europe | 4.63 | 4.35 | ||||
Asia/Oceania excluding Japan | 2.73 | 3.23 | ||||
Other areas* | 1.76 | 1.75 | ||||
Total foreign | 18.64 | 21.08 | ||||
Total | ¥ | 85.06 | ¥ | 92.05 | ||
| * | Other areas primarily include Canada, Latin America and the Caribbean. |
At March 31, 2005, the noon buying rate of the Federal Reserve Bank of New York was ¥107.22 per $1.00, as compared with ¥104.18 per $1.00 at March 31, 2004. The yen equivalent amount of foreign currency denominated assets and liabilities increases as the relevant exchange rate indicating the yen value per one foreign currency unit becomes higher, evidencing a “weaker” yen, and decreases as the relevant exchange rate indicating the yen value per one foreign currency unit becomes lower, evidencing a “stronger” yen. The depreciation of the yen against the US dollar and other foreign currencies during the fiscal year ended March 31, 2005 increased the yen value of our total assets by approximately ¥0.37 trillion. See “Item 3.A. Key Information—Selected Financial Data—Exchange Rate Information.”
38
Table of Contents
Loan Portfolio
The following table sets forth our loans outstanding, before deduction of allowance for credit losses, at March 31, 2004 and 2005, based on classification by industry segment as defined by the Bank of Japan for regulatory reporting purposes, which is not necessarily based on use of proceeds:
| At March 31, | ||||||
2004 (Restated) | 2005 (Restated) | |||||
| (in billions) | ||||||
Domestic: | ||||||
Manufacturing | ¥ | 4,692.4 | ¥ | 5,280.6 | ||
Construction | 832.8 | 815.1 | ||||
Real estate | 3,515.7 | 4,157.0 | ||||
Services | 3,661.8 | 2,965.8 | ||||
Wholesale and retail | 4,312.0 | 4,527.4 | ||||
Banks and other financial institutions | 1,676.8 | 2,364.5 | ||||
Communication and information services | 651.0 | 605.9 | ||||
Other industries | 4,750.5 | 5,344.5 | ||||
Consumer | 7,562.6 | 7,662.8 | ||||
Total domestic | 31,655.6 | 33,723.6 | ||||
Foreign: | ||||||
Governments and official institutions | 178.4 | 209.1 | ||||
Banks and other financial institutions | 904.8 | 780.6 | ||||
Commercial and industrial | 7,063.0 | 8,553.7 | ||||
Other | 156.4 | 171.5 | ||||
Total foreign | 8,302.6 | 9,714.9 | ||||
Total | 39,958.2 | 43,438.5 | ||||
Less unearned income and deferred loan fees—net | 27.2 | 17.0 | ||||
Total | ¥ | 39,931.0 | ¥ | 43,421.5 | ||
Domestic loans within the “consumer” category in the above table include loans to individuals who utilize loan proceeds to finance their proprietor activities and not for their personal financing needs. During the fiscal year ended March 31, 2004, our credit administration system was upgraded and became able to present a precise breakdown of the balance of such consumer loans by the type of proprietor business. This breakdown at March 31, 2004 and 2005 is presented below in accordance with our classification by industry segment.
| Manufacturing | Construction | Real estate | Services | Wholesale and retail | Banks and other financial institutions | Communication and information services | Other industries | Total included in Consumer | |||||||||||||||||||
| (in billions) | |||||||||||||||||||||||||||
March 31, 2004 | ¥ | 28.2 | ¥ | 19.3 | ¥ | 738.4 | ¥ | 230.7 | ¥ | 52.3 | ¥ | 1.2 | ¥ | 4.1 | ¥ | 10.6 | ¥ | 1,084.8 | |||||||||
March 31, 2005 | ¥ | 23.0 | ¥ | 16.2 | ¥ | 543.0 | ¥ | 193.4 | ¥ | 39.8 | ¥ | 1.1 | ¥ | 3.7 | ¥ | 7.8 | ¥ | 828.0 | |||||||||
Loans are our primary use of funds. The average loan balance accounted for 55.7% of total interest-earning assets for the fiscal year ended March 31, 2004 and 51.7% for the fiscal year ended March 31, 2005.
At March 31, 2005, our total loans were ¥43.42 trillion, representing an increase of ¥3.49 trillion, or 8.7%, from ¥39.93 trillion at March 31, 2004. Before the deduction of unearned income and deferred loan fees—net, our loan balance at March 31, 2005, consisted of ¥33.72 trillion of domestic loans and ¥9.71 trillion of foreign loans while the loan balance at March 31, 2004, consisted of ¥31.66 trillion of domestic loans and ¥8.30 trillion of foreign loans.
39
Table of Contents
Domestic loans increased ¥2.06 trillion and foreign loans increased ¥1.41 trillion compared to the previous fiscal year-end. This increase was primarily due to increases in loans to industries such as manufacturing and wholesale and retail, reflecting consolidation of certain VIEs. In accordance with the consolidation requirements of FIN No. 46R, we consolidated several multi-seller finance entities, primarily commercial paper conduits, where we are deemed to be the primary beneficiary. See note 24 to our consolidated financial statements for further discussion of these VIEs.
Analyzing the change of domestic loans by industry segments, domestic loans increased mainly in manufacturing, real estate, wholesale and retail, banks and other financial institutions, other industries and consumer. Besides the effect of VIEs, domestic loans decreased mainly in manufacturing and wholesale and retail. This is mainly due to decrease of nonperforming loans and loans to large enterprises. Increase of loans in real estate was due to increase of non-recourse loans. Consumer loans increased due to promotion of residential mortgage loans. The decrease of loans in services and the increase of loans in other industries were both due to the change in loan balance to several public sector borrowers, to which we had extended relatively large amounts of loans.
As for foreign loans, loans increased due to the effect of VIEs and due to the acquisition of Business Bank of California and Jackson Federal Bank by Union Bank of California, which is our largest foreign subsidiary.
Allowance for Credit Losses, Nonperforming and Past Due Loans
The following table shows a summary of the changes in the allowance for credit losses for the fiscal years ended March 31, 2003, 2004 and 2005:
| Fiscal year ended March 31, | ||||||||||||
| 2003 | 2004 | 2005 | ||||||||||
| (in billions) | ||||||||||||
Balance at beginning of fiscal year | ¥ | 1,341.6 | ¥ | 1,058.6 | ¥ | 649.3 | ||||||
Provision (credit) for credit losses | 287.3 | (142.4 | ) | 125.1 | ||||||||
Charge-offs: | ||||||||||||
Domestic | (523.9 | ) | (206.9 | ) | (181.5 | ) | ||||||
Foreign | (116.2 | ) | (70.8 | ) | (52.1 | ) | ||||||
Total | (640.1 | ) | (277.7 | ) | (233.6 | ) | ||||||
Recoveries: | ||||||||||||
Domestic | 49.1 | 11.3 | 14.3 | |||||||||
Foreign | 17.6 | 18.7 | 9.6 | |||||||||
Total | 66.7 | 30.0 | 23.9 | |||||||||
Net charge-offs | (573.5 | ) | (247.7 | ) | (209.7 | ) | ||||||
Others* | 3.2 | (19.2 | ) | 3.8 | ||||||||
Balance at end of fiscal year | ¥ | 1,058.6 | ¥ | 649.3 | ¥ | 568.5 | ||||||
| * | Others principally include foreign currency translation and discontinued operations adjustments. |
For the fiscal year ended March 31, 2005, provision for credit losses of ¥125.1 billion was recorded. In contrast, for the fiscal year ended March 31, 2004, a reversal of allowance for credit losses of ¥142.4 billion was recorded. Although the reversals of allowance for credit losses were recorded for both March 31, 2004 and 2005 due to improvements in our loan portfolio as evidenced by the reduction in our nonperforming loans, for the fiscal year ended March 31, 2005, additional provisions were recognized as downgrades of several borrowers to which we extended relatively large amounts of loans were greater than the reversals recognized.
The ratio of provision for credit losses of ¥125.1 billion is 0.3% to the average loan balance of ¥42.64 trillion and 0.2% to the total interest-earning assets of ¥82.42 trillion.
40
Table of Contents
Charge-offs for the fiscal year ended March 31, 2005 were ¥233.6 billion, a decrease of ¥44.1 billion, or 15.9% from ¥277.7 billion for the fiscal year ended March 31,2004.
Charge-offs has decreased for the last two fiscal years, reflecting the general recovery of businesses in Japan, which has also led to a decrease in bankruptcies.
Analyzing charge-offs by industry segments, though total charge-offs decreased, charge-offs in domestic manufacturing sector increased significantly. This increase was mainly due to debt-for-equity swap with regards to a particular borrower to which we extended a relatively large amount of loans, in order to support its business revitalization plan.
The following table presents comparative data in relation to the principal amount of nonperforming loans sold and additional provision for credit losses (reversal of allowance).
| Principal amount of loans(1) | Allowance for credit losses(2) | Loans, net of allowance | Additional provision for credit losses (reversal of allowance) | ||||||||||
| (in billions) | |||||||||||||
For the fiscal year ended March 31, 2003 | ¥ | 580.7 | ¥ | 266.3 | ¥ | 314.4 | ¥ | 36.7 | |||||
For the fiscal year ended March 31, 2004 | 292.8 | 125.5 | 167.3 | (5.6 | ) | ||||||||
For the fiscal year ended March 31, 2005 | 89.9 | 34.3 | 55.6 | (9.2 | ) | ||||||||
| (1) | Represents principal amount after the deduction of charge-offs made before the sales of nonperforming loans. |
| (2) | Represents allowance for credit losses at the latest balance sheet date. |
Through the sale of nonperforming loans to the Resolution and Collection Corporation and to other third parties, additional provisions or gains may arise from factors such as a change in the credit quality of the borrowers or the value of the underlying collateral subsequent to the prior reporting date, and the risk appetite and investment policy of the purchasers. For the fiscal year ended March 31, 2003, we recorded additional provisions of ¥36.7 billion because the unexpected adverse change in borrowers’ credit-worthiness was severe. However, as sales of nonperforming loans has decreased in line with our reduction of nonperforming loans, conditions surrounding the sales of loans has improved in recent years. During the fiscal year ended March 31, 2004 and 2005, we realized a gain of ¥5.6 billion and ¥9.2 billion, respectively.
Due to the inherent uncertainty of factors that may affect negotiated prices, which reflect the borrowers’ financial condition, and the value of underlying collateral, the results during the reported periods are not necessarily indicative of the results that we may record in the future.
In connection with the sale of loans including performing loans, we recorded a gain of ¥5.5 billion and ¥9.1 billion for the fiscal year ended March 31, 2004 and 2005, respectively.
The following table summarizes the allowance for credit losses by component at March 31, 2003, 2004 and 2005:
| At March 31, | |||||||||
| 2003 | 2004 | 2005 | |||||||
| (in billions) | |||||||||
Allocated allowance: | |||||||||
Specific—specifically identified problem loans | ¥ | 675.8 | ¥ | 380.9 | ¥ | 343.2 | |||
Large groups of smaller balance homogeneous loans | 37.5 | 38.8 | 37.4 | ||||||
Loans exposed to specific country risk | 12.5 | 5.9 | 0.1 | ||||||
Formula—substandard, special mention and other loans | 309.5 | 205.2 | 179.2 | ||||||
Unallocated allowance | 23.3 | 18.5 | 8.6 | ||||||
Total allowance | ¥ | 1,058.6 | ¥ | 649.3 | ¥ | 568.5 | |||
41
Table of Contents
Allowance policy
Our credit rating system is closely linked to the risk grading standards set by the Japanese regulatory authorities for asset evaluation and assessment, and is used as a basis for establishing the allowance for credit losses and charge-offs. The categorization is based on conditions that may affect the ability of borrowers to service their debt, such as current financial condition and results of operations, historical payment experience, credit documentation, other public information and current trends. For a discussion of our credit rating system, see “Item 11. Quantitative and Qualitative Disclosures about Credit, Market and Other Risk—Credit Risk Management—Credit Rating System.”
Change in total allowance and provision for credit losses
At March 31, 2005, the total allowance for credit losses was ¥568.5 billion, representing 1.31% of our total loan portfolio or 56.48% of our total nonaccrual and restructured loans and accruing loans contractually past due 90 days or more. At March 31, 2004, the total allowance for credit losses was ¥649.3 billion, representing 1.63% of our total loan portfolio or 52.82% of our total nonaccrual and restructured loans and accruing loans contractually past due 90 days or more.
Although we actively disposed of nonperforming loans, we newly recognized nonperforming loans at the same time. In recent years, large borrowers with relatively high allowance ratio had been downgraded and newly recognized as nonperforming loans. As a result, the percentage of nonperforming loans to total loans has decreased, but at the same time, the rate of allowance on nonperforming loans has increased in recent fiscal years.
This decrease in total allowance was mainly due to decrease of total amounts of nonaccrual and restructured loans and accruing loans contractually past due 90 days or more.
During the fiscal years ended March 31, 2003, 2004 and 2005, there were no significant additions to the allowance for credit losses resulting from directives, advice or counsel from governmental or regulatory bodies.
For the fiscal year ended March 31, 2005, provision for credit losses of ¥125.1 billion was recorded. In contrast, for the fiscal year ended March 31, 2004, a reversal of allowance for credit losses of ¥142.4 billion was recorded. Although the reversals of allowance for credit losses were recorded for both March 31, 2004 and 2005 due to improvements in our loan portfolio as evidenced by the reduction in our nonperforming loans, for the fiscal year ended March 31, 2005, additional provisions were recognized as downgrades of several borrowers to which we extended relatively large amounts of loans were greater than the reversals recognized.
Allocated allowance for specifically identified problem loans
The allocated credit loss allowance for specifically identified problem loans represents the allowance against impaired loans called for in SFAS No. 114, “Accounting by Creditors for Impairment of a Loan.” Impaired loans primarily include nonaccrual loans and restructured loans. We generally discontinue accrual of interest income on loans when substantial doubt exists as to the full and timely collection of either principal or interest, or when principal or interest is contractually past due one month or more with respect to loans made by us or by certain domestic subsidiaries, and 90 days or more with respect to loans of certain foreign subsidiaries. Loans are classified as restructured loans when we grant a concession to the borrowers for economic or legal reasons related to the borrowers’ financial difficulties. Detailed reviews of impaired loans are performed on a daily basis after a borrower’s annual or semi-annual financial statements first become available. In addition, as part of an ongoing credit review process, our credit officers monitor changes in all customers’ creditworthiness including bankruptcy, past due principal or interest, downgrading of external credit rating, declining stock price, business restructuring and other events and reassesses borrowers’ ratings in response to such events. This credit monitoring process form an integral part of our overall control process. An impaired loan is evaluated individually based on the present value of expected future cash flows discounted at the loan’s effective interest rate, the loan’s observable market price or the fair value of the collateral if the loan is collateral-dependent at a balance-sheet date.
42
Table of Contents
The following table summarizes nonaccrual and restructured loans, and accruing loans that are contractually past due 90 days or more as to principal or interest payments, at March 31, 2003, 2004 and 2005:
| At March 31, | ||||||||||||
| 2003 | 2004 | 2005 | ||||||||||
| (in billions, except percentages) | ||||||||||||
Nonaccrual loans: | ||||||||||||
Domestic: | ||||||||||||
Manufacturing | ¥ | 73.6 | ¥ | 98.9 | ¥ | 77.8 | ||||||
Construction | 63.0 | 42.6 | 38.8 | |||||||||
Real estate | 198.8 | 125.4 | 92.6 | |||||||||
Services | 65.5 | 39.5 | 94.5 | |||||||||
Wholesale and retail | 195.4 | 84.1 | 74.4 | |||||||||
Banks and other financial institutions | 15.0 | 15.8 | 4.3 | |||||||||
Communication and information services | 13.9 | 5.1 | 11.4 | |||||||||
Other industries | 30.9 | 14.5 | 13.3 | |||||||||
Consumer | 147.1 | 137.7 | 115.8 | |||||||||
Total domestic | 803.2 | 563.6 | 522.9 | |||||||||
Foreign | 265.9 | 226.9 | 108.2 | |||||||||
Total nonaccrual loans | 1,069.1 | 790.5 | 631.1 | |||||||||
Restructured loans: | ||||||||||||
Domestic: | ||||||||||||
Manufacturing | 149.1 | 42.6 | 22.4 | |||||||||
Construction | 64.0 | 9.1 | 35.3 | |||||||||
Real estate | 245.9 | 114.9 | 113.0 | |||||||||
Services | 118.8 | 42.3 | 30.3 | |||||||||
Wholesale and retail | 241.2 | 112.7 | 67.3 | |||||||||
Banks and other financial institutions | 15.0 | — | 0.3 | |||||||||
Communication and information services | 11.1 | 4.7 | 3.6 | |||||||||
Other industries | 25.3 | 3.9 | 26.4 | |||||||||
Consumer | 74.9 | 50.9 | 45.0 | |||||||||
Total domestic | 945.3 | 381.1 | 343.6 | |||||||||
Foreign | 83.2 | 45.7 | 21.7 | |||||||||
Total restructured loans | 1,028.5 | 426.8 | 365.3 | |||||||||
Accruing loans contractually past due 90 days or more: | ||||||||||||
Domestic | 15.2 | 11.1 | 9.2 | |||||||||
Foreign | 2.9 | 0.9 | 0.9 | |||||||||
Total accruing loans contractually past due 90 days or more | 18.1 | 12.0 | 10.1 | |||||||||
Total | ¥ | 2,115.7 | ¥ | 1,229.3 | ¥ | 1,006.5 | ||||||
Total loans | ¥ | 39,992.4 | ¥ | 39,931.0 | ¥ | 43,421.5 | ||||||
Nonaccrual and restructured loans, and accruing loans contractually past due 90 days or more as a percentage of total loans | 5.29 | % | 3.08 | % | 2.32 | % | ||||||
43
Table of Contents
Domestic nonaccrual loans and restructured loans within the “consumer” category in the above table include loans to individuals who utilize loan proceeds to finance their proprietor activities and not for their personal financing needs. During the fiscal year ended March 31, 2004, our credit administration system was upgraded and became able to present a precise breakdown of the balance of such consumer loans by the type of proprietor business. This breakdown at March 31, 2004 and 2005 is presented below:
| Manufacturing | Construction | Real estate | Services | Wholesale and retail | Banks and other financial institutions | Communication and information services | Other industries | Total included in Consumer | ||||||||||||||||||
| (in billions) | ||||||||||||||||||||||||||
March 31, 2004 | ||||||||||||||||||||||||||
Nonaccrual loans | ¥ | 1.6 | ¥ | 0.9 | ¥ | 52.3 | ¥ | 14.2 | ¥ | 5.8 | — | ¥ | 0.2 | — | ¥ | 75.0 | ||||||||||
Restructured loans | 1.0 | 0.3 | 21.0 | 4.1 | 1.5 | — | — | — | 27.9 | |||||||||||||||||
March 31, 2005 | ||||||||||||||||||||||||||
Nonaccrual loans | ¥ | 1.3 | ¥ | 1.0 | ¥ | 43.3 | ¥ | 13.7 | ¥ | 3.2 | — | ¥ | 0.2 | ¥ | 0.5 | ¥ | 63.2 | |||||||||
Restructured loans | 1.2 | 0.3 | 19.2 | 2.9 | 1.9 | — | — | — | 25.5 | |||||||||||||||||
We have been making efforts to dispose of nonperforming loans actively. These efforts have been made to improve the quality of our own loan assets, which conforms to the policy to decrease nonperforming loans under the program for financial revival announced by the Japanese government in October 2002. As a result, nonaccrual and restructured loans, and accruing loans contractually past due 90 days or more decreased ¥222.8 billion since March 31, 2004, to ¥1,006.5 billion, or 2.32% of total loans, as of March 31, 2005.
Total nonaccrual loans were ¥631.1 billion at March 31, 2005, a decrease of ¥159.4 billion, or 20.2%, from ¥790.5 billion at March 31, 2004. The decrease was ¥40.7 billion for domestic loans and ¥118.7 billion for foreign loans.
Analyzing by industry segments, decrease of ¥21.1 billion in domestic manufacturing was due to collection of loans and the debt-for-equity swap with regards to a particular borrower to which we extended relatively large amount of loans in order to support its business revitalization plan. The increase of ¥55.0 billion in services was due to unexpected downgrades of several borrowers to which we had extended relatively large amount of loans during the fiscal year. The decrease of ¥118.7 billion of foreign loans was mainly due to partial collection of loans from the overseas subsidiaries of some Japanese borrowers to whom we had extended relatively large amounts of loans.
Total restructured loans were ¥365.3 billion at March 31, 2005, a decrease of ¥61.5 billion, or 14.4%, from ¥426.8 billion at March 31, 2004. The decrease was mainly due to domestic factors. Decrease of domestic loans was ¥37.5 billion. Decrease of foreign restructured loans was ¥24.0 billion. Analyzing by industry segments, restructured loans decreased ¥20.2 billion in manufacturing. This was due to collection of loans and upgrades of some borrowers based on improved operating performance. As for wholesale and retail, restructured loans decreased ¥45.4 billion also due to upgrades of some borrowers. The increase of ¥22.5 billion in other industries was due to downgrades of several borrowers to which we extended relatively large amount of loans during the fiscal year ended March 31, 2005.
The following table summarizes the balances of impaired loans and related impairment allowances at March 31, 2003, 2004 and 2005, excluding smaller-balance homogeneous loans:
| At March 31, | |||||||||||||||||||||
| 2003 | 2004 | 2005 | |||||||||||||||||||
| Loan balance | Impairment allowance | Loan balance | Impairment allowance | Loan balance | Impairment allowance | ||||||||||||||||
| (in billions) | |||||||||||||||||||||
Requiring an impairment allowance | ¥ | 1,855.6 | ¥ | 675.8 | ¥ | 972.7 | ¥ | 380.9 | ¥ | 790.8 | ¥ | 343.2 | |||||||||
Not requiring an impairment allowance | 133.0 | — | 144.7 | — | 126.3 | — | |||||||||||||||
Total | ¥ | 1,988.6 | ¥ | 675.8 | ¥ | 1,117.4 | ¥ | 380.9 | ¥ | 917.1 | ¥ | 343.2 | |||||||||
Percentage of the allocated allowance to total impaired loans | 34.0 | % | 34.1 | % | 37.4 | % | |||||||||||||||
44
Table of Contents
In addition to impaired loans presented in the above table, there were loans held for sale that were impaired of ¥3.2 billion, ¥9.7 billion and ¥12.1 billion at March 31, 2003, 2004 and 2005, respectively.
Impaired loans decreased ¥200.3 billion, or 17.9%, from ¥1,117.4 billion at March 31, 2004 to ¥917.1 billion at March 31, 2005, reflecting decreases in nonaccrual loans and restructured loans as set forth above.
The percentage of the allocated allowance to total impaired loans at March 31, 2005 was 37.4%, an increase of 3.3 percentage points from 34.1% at March 31, 2004. The percentage of impairment allowance allocated to nonaccrual loans at March 31, 2005 was 48.8%, an increase of 7.7 percentage points from 41.1% at March 31, 2004. The percentage of impairment allowance allocated to restructured loans at March 31, 2005 was 15.8%, a decrease of 3.2 percentage points from 19.0% at March 31, 2004.
Based upon a review of borrowers’ financial status, from time to time we grant various concessions to troubled borrowers at the borrowers’ request, including reductions in the stated interest rates or the principal amount of loans, and extensions of the maturity date. According to our policies, such modifications are made to mitigate the near-term burden of the loans provided to the borrowers and to better match the payment terms with the borrowers’ expected future cash flows or, in cooperation with other creditors, to reduce the overall debt burden of the borrowers so that they may normalize their operations, in each case to improve the likelihood that the loans will be repaid in accordance with the revised terms. The nature and amount of the concessions depend on the particular financial condition of each borrower. In principle, however, we do not modify the terms of loans to borrowers that are considered “Likely to Become Bankrupt,” “Virtually Bankrupt” or “Bankrupt” because in these cases there is little likelihood that the modification of loan terms would enhance recovery of the loans.
Allocated allowance for large groups of smaller-balance homogeneous loans
The allocated allowance for large groups of smaller-balance homogeneous loans is focused on loss experience for the pool rather than on an analysis of individual loans. Large groups of smaller-balance homogeneous loans primarily consist of first mortgage housing loans to individuals. The allowance for groups of performing loans is based on historical loss experience over a period. In determining the level of the allowance for delinquent groups of loans, we classify groups of homogeneous loans based on the risk rating and/or the number of delinquencies. We determine the credit loss allowance for delinquent groups of loans based on the probability of insolvency by the number of actual delinquencies and actual loss experience. The loss experience is usually determined by reviewing the historical loss rate. The allocated credit loss allowance for large groups of smaller-balance homogeneous loans was ¥37.4 billion at March 31, 2005, a slight decrease from ¥38.8 billion at March 31, 2004.
Allocated allowance for country risk exposure
The allocated credit loss allowance for country risk exposure is based on an estimate of probable losses relating to the exposure to countries that we identify as having a high degree of transfer risk. We use a country risk grading system that assigns risk ratings to individual countries. To determine the risk rating, we consider the instability of foreign currency and difficulties regarding debt servicing. The allowance is determined based on the assessment of individual country risks, taking into consideration various factors such as the political and macroeconomic situation and debt repayment capability. It is generally based on a function of default probability and expected recovery ratios, taking external credit ratings into account. The allocated allowance for country risk exposure decreased ¥5.8 billion from ¥5.9 billion at March 31, 2004 to ¥0.1 billion at March 31, 2005. This decrease was due to the improved conditions in countries such as Indonesia.
45
Table of Contents
The following is a summary of cross-border outstandings to counterparties in major Asian and Latin American countries at March 31, 2004 and 2005:
| At March 31, | ||||||
| 2004 | 2005 | |||||
| (in billions) | ||||||
Hong Kong | ¥ | 300.6 | ¥ | 325.4 | ||
People’s Republic of China | 194.6 | 277.4 | ||||
Singapore | 211.4 | 271.9 | ||||
Thailand | 145.6 | 224.1 | ||||
South Korea | 191.1 | 221.3 | ||||
Malaysia | 84.7 | 88.1 | ||||
Philippines | 41.2 | 42.4 | ||||
Indonesia | 22.5 | 29.1 | ||||
Brazil | 82.0 | 71.5 | ||||
Mexico | 45.0 | 46.4 | ||||
Argentina | 18.2 | 0.9 | ||||
| Note: | We record allocated allowance for country risk exposure for specific countries, not all of the countries above. |
Our cross-border outstandings to emerging countries has increased with the general improvement in the credit risk of emerging countries. Our cross-border outstandings to countries such as China, Hong Kong and Singapore has increased due to the stable credit risk in those countries. Our cross-border outstandings to Argentina has decreased due to the decrease in loans to non-Japanese borrowers in Argentina.
Formula allowance for substandard, special mention and unclassified loans
The formula allowance is calculated by applying estimated loss factors to outstanding substandard, special mention and unclassified loans. In evaluating of inherent loss for these loans, we rely on a statistical analysis that incorporates a percentage of total loans based on historical loss experience.
We have computed the formula allowance based on estimated credit losses using a methodology defined by the credit rating system. Estimated losses inherent in the loan portfolio at the balance sheet date are calculated by multiplying the default ratio by the irrecoverable ratio (determined as a complement of the recovery ratio). The default ratio is determined by each credit risk rating, taking into account the historical number of defaults of borrowers within each credit risk rating divided by the total number of borrowers within that credit risk rating existing at the beginning of the five-year observation period. The recovery ratio is determined by the historical experience of collections against loans in default.
UnionBanCal Corporation, our largest overseas subsidiary, calculates the formula allowance by applying loss factors to outstanding loans and certain unused commitments, in each case based on the internal risk grade of such loans, leases and commitments. Changes in risk grades affect the amount of the formula allowance. Loss factors are based on our historical loss experience and may be adjusted for significant factors that, in management’s judgment, affect the collectibility of the portfolio as of the evaluation date. Loss factors are developed in the following ways:
| • | loss factors for individually graded credits are derived from a migration model that tracks historical losses over a period, which we believe captures the inherent losses in our loan portfolio; and |
| • | pooled loan loss factors (not individually graded loans) are based on expected net charge-offs. Pooled loans are loans that are homogeneous in nature, such as consumer installment, home equity, residential mortgage loans and certain small commercial and commercial real estate loans. |
46
Table of Contents
Though there are a few technical differences in the methodology used for the allowance for credit losses as mentioned above, we examine overall sufficiency of the formula allowance periodically by back-test comparison with the actual loss experience subsequent to the balance sheet date.
The formula allowance decreased ¥26.0 billion from ¥205.2 billion at March 31, 2004 to ¥179.2 billion at March 31, 2005. This decrease was due to a reduction of some performing loans for which credit risk and percentage of allowance were comparatively high, and the general improvement in the quality of our loan assets.
Unallocated allowance
The unallocated allowance is based on management’s evaluation of conditions that are not directly reflected in the determination of the formula and specific allowances. Certain losses that had previously been considered in the determination of the unallocated allowance have been incorporated into our formula allowance through the change made to recognize losses based on a loss confirmation period, thereby eliminating the need to reflect them in our unallocated allowance. The evaluation of the inherent loss with respect to these conditions is subject to a higher degree of uncertainty because they may not be identified with specific problem credits or portfolio segments. The conditions evaluated in connection with the unallocated allowance include the following, which existed at the balance sheet date:
| • | general economic and business conditions affecting our key lending areas; |
| • | credit quality trends (including trends in nonperforming loans expected to result from existing conditions); |
| • | collateral values; |
| • | loan volumes and concentrations; |
| • | seasoning of the loan portfolio; |
| • | specific industry conditions within portfolio segments; |
| • | recent loss experience in particular segments of the portfolio; |
| • | duration of the current economic cycle; |
| • | bank regulatory examination results; and |
| • | findings of our internal credit examiners. |
Executive management reviews these conditions quarterly in discussion with our senior credit officers. To the extent that any of these conditions is evidenced by a specifically identifiable problem credit or portfolio segment as of the evaluation date, management’s estimate of the effect of such condition may be reflected as a specific allowance, applicable to the specific credit or portfolio segment. Where any of these conditions is not evidenced by a specifically identifiable problem credit or portfolio segment as of the evaluation date, management’s evaluation of the probable loss related to the condition is reflected in the unallocated allowance.
The unallocated allowance decreased ¥9.9 billion from ¥18.5 billion at March 31, 2004 to ¥8.6 billion at March 31, 2005. This decrease was due mainly to refinement of formula allowance and allocated allowance, which has eliminated the need to consider certain losses, such as a certain share of inherent probable loss associated with the credit migration.
Allowance for Off-balance-sheet Credit Instruments
In addition to the allowance for credit losses on the loan portfolio, we maintain an allowance for credit losses on off-balance-sheet credit instruments, including commitments to extend credit, a variety of guarantees and standby letters of credit. This allowance is included in other liabilities. With regard to the specific allocated allowance for specifically identified credit exposure and the allocated formula allowance, we apply the same methodology that
47
Table of Contents
we use in determining the allowance for loan credit losses. The allowance for credit losses on off-balance-sheet credit instruments was ¥60.3 billion at March 31, 2005, a decrease of ¥36.7 billion, or 37.9%, from ¥97.0 billion at March 31, 2004. This decrease shows the same trend as the quality improvement of loan assets.
Investment Portfolio
Our investment securities are primarily comprised of marketable equity securities and Japanese government and Japanese government agency bonds, which are mostly classified as available-for-sale securities. We also hold Japanese government bonds which are classified as securities being held to maturity.
Historically, we have held equity securities of some of our customers for strategic purposes, in particular to maintain long-term relationships with these customers. However, our current goal is to reduce the aggregate value of our equity securities to approximately 50% of our Tier I capital by March 31, 2007 because we believe from a risk management perspective that reducing the price fluctuation risk in our equity portfolio is imperative. As of March 31, 2005, we had reduced the aggregate value of marketable equity securities under Japanese GAAP to 59% of our Tier I capital, which satisfies the requirements of the legislation forbidding banks from holding equity securities in excess of their Tier I capital after September 30, 2006.
Investment securities increased ¥2.32 trillion, from ¥21.50 trillion at March 31, 2004 to ¥23.82 trillion at March 31, 2005.
The following table shows information as to the value of our investment securities available for sale and being held to maturity at March 31, 2004 and 2005. Subsequent to the filing of our Annual Report on Form 20-F for the fiscal year ended March 31, 2004, management determined that amortized costs and net unrealized gains on securities available for sale for the fiscal year ended March 31, 2004 were erroneously disclosed. As a result, such amounts have been restated from the amounts previously reported.
| At March 31, | ||||||||||||
| 2004 | 2005 | |||||||||||
Amortized (restated) | Estimated fair value | Net (restated) | Amortized cost | Estimated fair value | Net unrealized gains | |||||||
| (in billions) | ||||||||||||
Securities available for sale: | ||||||||||||
Debt securities, principally Japanese government bonds and corporate bonds | ¥17,135.0 | ¥17,146.1 | ¥11.1 | ¥18,335.6 | ¥18,392.9 | ¥57.3 | ||||||
Marketable equity securities | 1,819.2 | 3,140.7 | 1,321.5 | 1,803.3 | 3,099.3 | 1,296.0 | ||||||
Total securities available for sale | ¥18,954.2 | ¥20,286.8 | ¥1,332.6 | ¥20,138.9 | ¥21,492.2 | ¥1,353.3 | ||||||
Debt securities being held to maturity, principally Japanese government bonds | ¥1,052.2 | ¥1,052.7 | ¥0.5 | ¥2,047.9 | ¥2,064.6 | ¥16.7 | ||||||
Securities being held to maturity increased ¥1.00 trillion as our treasury operations increased holdings in Japanese government bonds for asset-liability management purposes, mainly due to the fact that our balance of deposits exceeded our loans, and Japanese government bonds were a viable investment option for us.
Available-for-sale securities increased ¥1.20 trillion from ¥20.29 trillion at March 31, 2004 to ¥21.49 trillion at March 31, 2005, primarily due to an increase in amount of mortgage-backed securities.
48
Table of Contents
Net unrealized gains on available-for-sale securities included in the investment portfolio at March 31, 2004 and 2005 were ¥1.33 trillion and ¥1.35 trillion, respectively. These net unrealized gains related principally to marketable equity securities.
Cash and Due from Banks
Cash and due from banks at March 31, 2005 was ¥4.03 trillion, an increase of ¥1.27 trillion from ¥2.76 trillion at March 31, 2004. The increase in cash and due from banks was primarily attributable to an increase in deposits with the Bank of Japan at the end of the fiscal year, which in turn was due to the Bank of Japan’s monetary policy of providing ample liquidity by increasing the balance of current accounts held at the Bank of Japan.
Interest-earning Deposits in Other Banks
Interest-earning deposits in other banks fluctuate significantly from day to day depending upon financial market conditions. Interest-earning deposits in other banks at March 31, 2005 were ¥3.92 trillion, an increase of ¥0.73 trillion, from ¥3.19 trillion at March 31, 2004. This increase primarily reflected an increase in foreign currency deposits.
Deferred Tax Assets
Deferred tax assets decreased ¥0.15 trillion, or 19.4%, from ¥0.75 trillion at March 31, 2004 to ¥0.60 trillion at March 31, 2005. This decrease was due primarily to a decrease in existing deductible temporary differences. The decrease in existing deductible temporary differences reflected a decrease in net operating loss carryforwards, which is attributable to the existence of taxable income for the fiscal year ended March 31, 2005. The decrease in allowance for credit losses and accrued severance indemnities and pension liabilities also contributed to the decrease in deferred tax assets.
Total Liabilities
At March 31, 2005, total liabilities were ¥88.88 trillion, an increase of ¥6.59 trillion from ¥82.29 trillion at March 31, 2004. This increase primarily reflected increases of ¥5.25 trillion in other short-term borrowings and ¥1.84 trillion in total deposits. These increases were partially offset by a decrease of ¥1.09 trillion in call money and funds purchased.
The depreciation of the yen against the US dollar and other foreign currencies during the fiscal year ended March 31, 2005 increased the yen values for liabilities denominated in foreign currencies by approximately ¥0.35 trillion.
Deposits
Deposits are our primary source of funds. Total average deposits increased ¥2.41 trillion from ¥56.79 trillion for the fiscal year ended March 31, 2004 to ¥59.20 trillion for the fiscal year ended March 31, 2005. This increase primarily reflected a ¥1.41 trillion increase in average domestic interest-bearing demand deposits.
Domestic deposits increased ¥1.05 trillion from ¥46.73 trillion at March 31, 2004 to ¥47.78 trillion at March 31, 2005, while foreign deposits increased ¥0.78 trillion from ¥11.81 trillion at March 31, 2004 to ¥12.59 trillion at March 31, 2005.
The reduction in the maximum amount covered by blanket deposit insurance to a ¥10 million maximum as of March 31, 2005 did not have a material affect on our average domestic deposits for the fiscal year ended March 31, 2005.
49
Table of Contents
Short-term Borrowings
We use short-term borrowings as a funding source and in our management of interest rate risk. For management of interest rate risk, short-term borrowings are used in asset liability management operations to match interest rate risk exposure resulting from loans and other interest-earning assets and for managing funding costs of various financial instruments at an appropriate level as a whole, based on our forecast of future interest rate levels. Short-term borrowings include call money and funds purchased, payables under repurchase agreements, payables under securities lending transactions and other short-term borrowings.
The total average balance of short-term borrowings increased ¥6.43 trillion from ¥10.30 trillion for the fiscal year ended March 31, 2004 to ¥16.73 trillion for the fiscal year ended March 31, 2005.
Short-term borrowings increased ¥4.67 trillion from ¥11.19 trillion at March 31, 2004 to ¥15.86 trillion at March 31, 2005. This increase was primarily attributable to an increase of 5.25 trillion in other short-term borrowings. The increase in other short-term borrowings was primarily due to measures we took to increase our liquidity near the end of the fiscal year ended March 31, 2005 in order to respond to any unexpected outflow of funds caused by the reduction of blanked deposit insurance at March 31, 2005. As discussed in “—Deposits” above, no such unexpected outflow of funds occurred.
Severance Indemnities and Pension Liabilities
As discussed in “Item 5.A. Operating Results—Recent Developments—Transfer to the Japanese Government of the Substitutional Portion of Employee Pension Fund Liabilities” and “Item 5.A. Operating Results—Accounting Changes—Transfer to the Japanese Government of the Substitutional Portion of Employee Pension Fund Liabilities,” in March 2005, the substitutional portion of our employee pension fund liabilities was transferred to a government agency and we were released from the obligation to pay the substitutional portion of the benefits to our employees. Although the completion of the transfer constituted a settlement of such plan, since there remains a defined benefit plan and the settlement occurred subsequent to December 31, 2004 (the measurement date of such plan), the impact of the transfer / settlement of a pre-tax income of ¥36.1 billion will be recognized in the fiscal year ending March 31, 2006. See note 15 to our consolidated financial statements for details of our defined benefit pension plans and the effect of the transfer / settlement.
Sources of Funding and Liquidity
Our primary source of liquidity is from a large balance of deposits, mainly ordinary deposits, certificates of deposit and time deposits. Time deposits have shown a historically high rollover rate among our corporate customers and individual depositors. Due to the economic and financial environment in Japan, as well as to our relatively high financial standing in Japan, our deposits have steadily increased during recent years, from ¥55.27 trillion at March 31, 2003 to ¥60.38 trillion at March 31, 2005. As of March 31, 2005, our deposits of ¥60.38 trillion exceeded our loans, net of allowance for credit losses of ¥42.85 trillion, by ¥17.53 trillion. These deposits provide us with a sizable source of stable and low-cost funds. While approximately 56% of certificates of deposit and time deposits mature within three months, we continuously monitor relevant interest rate characteristics of these funds and utilize asset and liability management techniques to manage the possible impact of the rollovers on our net interest margin and liquidity. Our average deposits, combined with average shareholder’s equity, funded 66.9% of our average total assets of ¥92.58 trillion during the fiscal year ended March 31, 2005.
Most of the remaining funding was provided by short-term borrowings and long-term senior and subordinated debt. Short-term borrowings consist of call money and funds purchased, payables under repurchase agreements, payables under securities lending transactions and other short-term borrowings. From time to time, we have issued long-term instruments such as straight bonds with mainly three to five years’ maturity. Liquidity may also be provided by the sale of financial assets, including securities available for sale, trading account securities and loans. Additional liquidity may be provided by the maturity of loans.
50
Table of Contents
Shareholder’s Equity
The following table presents a summary of our shareholder’s equity at March 31, 2004 and 2005:
| At March 31, | ||||||||
| 2004 | 2005 | |||||||
| (in billions, except percentages) | ||||||||
Preferred stock | ¥ | 122.1 | ¥ | 247.1 | ||||
Common stock | 749.9 | 749.9 | ||||||
Capital surplus | 814.5 | 983.3 | ||||||
Retained earnings | 887.0 | 978.9 | ||||||
Accumulated other changes in equity from nonowner sources | 199.3 | 209.7 | ||||||
Less parent company’s stock, at cost | (0.7 | ) | (2.3 | ) | ||||
Total shareholder’s equity | ¥ | 2,772.1 | ¥ | 3,166.6 | ||||
Ratio of total shareholder’s equity to total assets | 3.26 | % | 3.44 | % | ||||
Total shareholder’s equity increased ¥394.5 billion, or 14.2%, from ¥2,772.1 billion at March 31, 2004 to ¥3,166.6 billion at March 31, 2005. The ratio of total shareholder’s equity to total assets also showed an increase of 0.18 percentage points from 3.26% at March 31, 2004 to 3.44% at March 31, 2005. The increase in total shareholder’s equity at March 31, 2005, and the resulting increase in the ratio to total assets, were principally attributable to increases of ¥125.0 billion in preferred stock and ¥168.8 billion in capital surplus, primarily resulting from issuance of new shares of preferred stock in February 2005, and an increase of ¥91.9 billion in retained earnings, resulting from net income for the fiscal year ended March 31, 2005.
Due to our holdings of a large amount of marketable Japanese equity securities and the volatility of the equity markets in Japan, changes in the fair value of marketable equity securities have significantly affected our shareholder’s equity. The following table presents information relating to the accumulated net unrealized gains before tax effect in respect of marketable equity securities at March 31, 2004 and 2005:
| At March 31, | ||||||||
| 2004 | 2005 | |||||||
| (in billions, except percentages) | ||||||||
Accumulated net unrealized gains | ¥ | 1,321.5 | ¥ | 1,296.0 | ||||
Accumulated net unrealized gains to total assets | 1.55 | % | 1.41 | % | ||||
We are subject to various regulatory capital requirements promulgated by the regulatory authorities of the countries in which we operate. Failure to meet minimum capital requirements can initiate mandatory actions by regulators that, if undertaken, could have a direct material effect on our consolidated financial statements.
We continually monitor our risk-adjusted capital ratio closely and manage our operations in consideration of the capital ratio requirements. These ratios are affected not only by fluctuations in the value of our assets, including our marketable securities and deferred tax assets, but also by fluctuations in the value of the yen against the US dollar and other foreign currencies and by general price levels of Japanese equity securities.
Capital Requirements for Banking Institutions in Japan
A Japanese banking institution is subject to the minimum capital adequacy requirements both on a consolidated basis and a stand-alone basis, and is required to maintain the minimum capital irrespective of whether it operates independently or as a subsidiary under the control of another company. Under the Financial Services Agency’s guidelines, capital is classified into three tiers, referred to as Tier I, Tier II and Tier III. Our Tier I capital
51
Table of Contents
generally consists of shareholder’s equity items, including common stock, non-cumulative preferred stock, capital surplus, minority interests and retained earnings (which includes deferred tax assets), but recorded goodwill and other items, such as treasury stock, are deducted from Tier I capital. Our Tier II generally consists of general reserves for credit losses up to 1.25% of risk-weighted assets, 45% of the unrealized gains on investment securities available for sale, 45% of the land revaluation excess, the balance of perpetual subordinated debt and the balance of subordinated term debt with an original maturity of over five years subject to certain limitations, up to 50% of Tier I capital. Our Tier III capital consists of short-term subordinated debt with an original maturity of at least two years, subject to certain limitations. At least 50% of the minimum capital requirements must be maintained in the form of Tier I capital.
Under the Japanese regulatory capital requirements, our consolidated capital components, including Tier I, Tier II and Tier III and risk-weighted assets are calculated from our consolidated financial statements prepared under Japanese GAAP. Also, each of the consolidated and stand-alone capital components in Japan is calculated from consolidated and non-consolidated financial statements prepared under Japanese GAAP, respectively.
For a detailed discussion of the capital adequacy guidelines adopted by the Financial Service Agency and proposed amendments, see “Item 4.B. Information on the Company—Business Overview—Supervision and Regulation—Japan—Capital Adequacy.”
Capital Requirements for Banking Institutions in the United States of America
In the United States, UnionBanCal Corporation and its banking subsidiary, Union Bank of California, N.A., our largest subsidiaries operating outside Japan, are subject to various regulatory capital requirements administered by U.S. Federal banking agencies, including minimum capital requirements. Under capital adequacy guidelines and the regulatory framework for prompt corrective action, they must meet specific capital guidelines that involve quantitative measures of their assets, liabilities and certain off-balance-sheet items as calculated under U.S. regulatory accounting practices. Their capital amounts and prompt corrective action classification are also subject to qualitative judgments by the regulators about components, risk weightings and other factors.
For a detailed discussion of the capital adequacy guidelines applicable to our U.S. bank subsidiaries, see “Item 4.B. Information on the Company—Business Overview—Supervision and Regulation—United States—Bank Capital Requirements and Capital Distributions.”
Capital Requirements for Mitsubishi Securities
Mitsubishi Securities is required to maintain a minimum capital ratio of 120% calculated by as a percentage of capital accounts less certain illiquid assets, as determined in accordance with Japanese GAAP, against amounts equivalent to market, counterparty credit and operations risks. At March 31, 2005, Mitsubishi Securities’ capital accounts, less certain illiquid assets of ¥415.8 billion, were 406.7% of total amounts equivalent to market, counterparty credit and operations risks.
52
Table of Contents
Our Capital Ratios
The table below presents our consolidated risk-based capital, risk-adjusted assets and risk-based capital ratios at March 31, 2004 and 2005 (underlying figures are calculated in accordance with Japanese banking regulations based on information derived from our consolidated financial statements prepared in accordance with Japanese GAAP, as required by the Financial Services Agency):
| At March 31, | Minimum capital ratios required | ||||||||||
| 2004 | 2005 | ||||||||||
| (in billions, except percentages) | |||||||||||
Capital components: | |||||||||||
Tier I capital | ¥ | 2,876.0 | ¥ | 3,199.6 | |||||||
Tier II capital includable as qualifying capital | 2,415.3 | 2,564.8 | |||||||||
Tier III capital includable as qualifying capital | 30.0 | — | |||||||||
Deductions from total qualifying capital | 41.7 | 243.7 | |||||||||
Total risk-based capital | ¥ | 5,279.6 | ¥ | 5,520.7 | |||||||
Risk-weighted assets | ¥ | 44,093.8 | ¥ | 46,662.9 | |||||||
Capital ratios: | |||||||||||
Tier I capital | 6.52 | % | 6.86 | % | 4.00 | % | |||||
Total risk-based capital | 11.97 | 11.83 | 8.00 | ||||||||
Our Tier I ratio increased 0.34 percentage points from 6.52% at March 31, 2004 to 6.86% at March 31, 2005. This increase was a result of the increase in our retained earnings and our issuance of preferred shares during the fiscal year ended March 31, 2005. However, our total risk-based capital ratio decreased 0.14 percentage points from 11.97% at March 31, 2004 to 11.83% at March 31, 2005 mainly due to the loans made to Mitsubishi Tokyo Financial Group, Inc., which decreased our total risk-based capital as those loans were deducted from their qualifying capital under Japanese regulations. As of March 31, 2005, we had outstanding loans of ¥200.0 billion with regard to the investment by Mitsubishi Tokyo Financial Group, Inc. in UFJ Bank. The increase in loans, which increased our risk-weighted assets, also was a factor to the decrease in the consolidated total risk-based capital ratio.
Capital Ratios of Subsidiary Banks in the United States
The table below presents the risk-based capital ratios of UnionBanCal Corporation and Union Bank of California at December 31, 2003 and 2004:
| At December 31, | Minimum capital ratios required | Ratios OCC requires to be “well-capitalized” | ||||||||||
| 2003 | 2004 | |||||||||||
UnionBanCal Corporation: | ||||||||||||
Tier I capital (to risk-weighted assets) | 11.31 | % | 9.71 | % | 4.00 | % | — | |||||
Tier I capital (to quarterly average assets)* | 9.03 | 8.09 | 4.00 | — | ||||||||
Total capital (to risk-weighted assets) | 14.14 | 12.17 | 8.00 | — | ||||||||
Union Bank of California: | ||||||||||||
Tier I capital (to risk-weighted assets) | 10.44 | % | 9.29 | % | 4.00 | % | 6.00 | % | ||||
Tier I capital (to quarterly average assets)* | 8.30 | 7.72 | 4.00 | 5.00 | ||||||||
Total capital (to risk-weighted assets) | 11.88 | 10.57 | 8.00 | 10.00 | ||||||||
| * | Excludes certain intangible assets. |
Management believes that, as of December 31, 2004 and June 30, 2005, UnionBanCal Corporation and Union Bank of California met all capital adequacy requirements to which they are subject.
53
Table of Contents
As of December 31, 2004, Union Bank of California was categorized as “well-capitalized” under the regulatory framework for prompt corrective action in accordance with the notification from the OCC. To be categorized as “well capitalized,” Union Bank of California must maintain minimum total risk-based, Tier I risk-based and Tier I leverage ratios as set forth in the table. There are no conditions or events since that notification that management believes have changed Union Bank of California’s category.
Off-balance-sheet Arrangements
In the normal course of our business, we engage in several types of off-balance-sheet arrangements to meet the financing needs of our customers, including various types of guarantees, commitments to extend credit and commercial letters of credit. The following table summarizes these commitments at March 31, 2005:
| Amount of commitment expiration by period | ||||||||||||
Less than (Restated) | 1-5 (Restated) | Over 5 years (Restated) | Total (Restated) | |||||||||
| (in billions) | ||||||||||||
Guarantees: | ||||||||||||
Standby letters of credit and financial guarantees | ¥ | 1,247 | ¥ | 465 | ¥ | 770 | ¥ | 2,482 | ||||
Performance guarantees | 773 | 502 | 78 | 1,353 | ||||||||
Derivative instruments | 9,598 | 5,512 | 873 | 15,983 | ||||||||
Others | 512 | — | — | 512 | ||||||||
Total guarantees | 12,130 | 6,479 | 1,721 | 20,330 | ||||||||
Other off-balance-sheet instruments: | ||||||||||||
Commitments to extend credit | 18,265 | 5,662 | 674 | 24,601 | ||||||||
Commercial letters of credit | 457 | 1 | — | 458 | ||||||||
Others | 10 | 5 | — | 15 | ||||||||
Total other off-balance-sheet instruments | 18,732 | 5,668 | 674 | 25,074 | ||||||||
Total | ¥ | 30,862 | ¥ | 12,147 | ¥ | 2,395 | ¥ | 45,404 | ||||
See note 23 to our consolidated financial statements for a description of the nature of our guarantees and other off-balance-sheet instruments.
The contractual amounts of these guarantees and other off-balance-sheet instruments represent the amounts at risk should the contracts be fully drawn upon with a subsequent default by our customer and a decline in the value of the underlying collateral. Because many of these commitments expire without being drawn upon, the total contractual or notional amounts of these commitments do not necessarily represent our future cash requirements. At March 31, 2005, approximately 68% of these commitments will expire within one year, 27% from one year to five years and 5% after five years. Such risks are monitored and managed as a part of our risk management system as set forth in “Item 11. Quantitative and Qualitative Disclosures about Credit, Market and Other Risk.” In addition, in accordance with SFAS No. 5, “Accounting for Contingencies,” we evaluate off-balance-sheet arrangement in the manner described in note 1 to our consolidated financial statements.
In the aggregate, the income generated from fees and commissions is one of our most important sources of revenue. Such income amounted to ¥481.6 billion during the fiscal year ended March 31, 2005, accounting for approximately 60% of our non-interest income for the fiscal year. However, the fees generated specifically from off-balance-sheet arrangements are not a dominant source of our fees and commissions.
Some of our off-balance-sheet arrangements are related to activities of special purpose entities, most of which are VIEs. As set out in “Item 5.A. Operating Results—Accounting Changes—Variable Interest Entities,” we adopted FIN No. 46R at April 1, 2004. As a result, we have consolidated all VIEs in which we are deemed to be the primary beneficiary including those created before February 1, 2003.
Off-balance-sheet arrangements include the following types of special purpose entities.
54
Table of Contents
Asset-backed Commercial Paper Conduits
We administer several multi-seller finance entities (primarily commercial paper conduits) that purchase financial assets, primarily pools of receivables, from third-party customers. Assets purchased by these conduits are generally funded by issuing commercial paper to and/or by borrowings from us or third parties. While customers basically continue to service the transferred trade receivables, we underwrite, distribute, make a market in commercial paper issued by the conduits, and also provide liquidity and credit support facilities to the entities.
We, as a non-primary beneficiary, had variable interests in this type of entity, with total assets of ¥387.7 billion at March 31, 2005, and are exposed to a maximum loss of ¥55.5 billion.
Securitization Conduits of Client Properties
We administer several conduits that acquire client assets, primarily real estate, from third-party customers (“property sellers”) with the property sellers continuing to use the acquired real estate through lease-back agreements. The equity of the conduits is provided by the property sellers but such equity holders have no ability to make decisions about the activities of the conduits. Thus, we consider those conduits to be VIEs. The assets acquired by these conduits are generally funded by borrowings from us or third parties. We believe we are not the primary beneficiary of any of the conduits.
We, as a non-primary beneficiary, had variable interests in this type of entity, with total assets of ¥1,000.3 billion at March 31, 2005, and are exposed to a maximum loss of ¥358.1 billion, which would need to be recognized if, contrary to current expectations, we are unable to collect on our loans to these entities.
Investment Funds
We hold investments in various investment funds that collectively invest in equity and debt securities including listed Japanese securities and investment grade bonds, and, to a limited extent, securities and other interests issued by companies in a start-up or restructuring stage. Such investment funds are managed by investment advisory companies or fund management companies that make investment decisions and administer the funds.
We occasionally sell assets such as nonperforming loans to these funds, in particular the Corporate Recovery Fund, when we believe that such sale may improve our asset quality.
Corporate Recovery Fund. We have non-controlling equity interests in corporate recovery funds whose principal business purpose is to generate profits by investing in companies in the process of restructuring and then, typically, selling these investments after the companies complete their restructurings. Such funds purchase nonperforming loans from us or others and in some cases acquire majority ownership in the borrower companies by means of a debt-for-equity swap. Our non-voting interests in these funds amounted to ¥32.7 billion at March 31, 2004 and ¥24.7 billion at March 31, 2005, respectively. In addition, at March 31, 2005, we had commitments to make additional contributions of up to ¥3.8 billion to these funds.
The total assets of the corporate recovery funds in which we have interests were approximately ¥123.5 billion at March 31, 2004 and ¥95.0 billion at March 31, 2005. We sold to corporate recovery funds nonperforming loans with an aggregate net book value of ¥2.2 billion for ¥1.6 billion during the fiscal year ended March 31, 2004 and an aggregate net book value of ¥4.2 billion for ¥1.9 billion during the fiscal year ended March 31, 2005. For a detailed discussion on additional provisions for credit losses associated with the sale of such loans, see “—Financial Condition—Allowance for Credit Losses, Nonperforming and Past Due Loans.”
Venture Capital Fund. We own non-controlling equity interests in investment funds managed by fund management companies who have discretionary investment powers. These funds seek to invest in start-up companies or companies that are rapidly developing. The aggregate assets of these funds were approximately ¥2,165.5 billion at March 31, 2005. We made contributions to these funds amounting to ¥113.6 billion at March 31, 2005. At March 31, 2005, in accordance with the applicable limited partnership agreements, we had commitments to make additional contributions of up to ¥ 15.3 billion when required by the fund management companies.
55
Table of Contents
Investment Trust. We purchase the share units of investment trusts as mid- to long-term investments. These investment trusts are managed by investment advisory companies with the objective of investing in a diversified portfolio consisting of equity and debt securities, primarily shares of Japanese public companies. At March 31, 2005, our share units in investment trusts amounted to approximately ¥413.8 billion, which is equal to our maximum loss exposure. Generally, we are not obligated to invest in or extend funds by purchasing additional share units and our off-balance-sheet exposures or commitments relating to this type of special purpose entities were not material.
Special Purpose Entities Created for Structured Financing
We extend non-recourse asset-backed loans to special purpose entities, which hold beneficial interests in real properties, to provide financing for special purpose projects including real estate development and natural resource development managed by third parties.
We generally act as a member of a lending group and do not have any equity investment in the entities, which is typically provided by project owners. For most of these financings, the equity provided by the project owners is of sufficient level to absorb expected losses, while expected returns to the owners are arranged to be the most significant among all returns. Accordingly, we determined that we are not the primary beneficiary of most of these entities. However, we are ultimately required to consolidate entities whose investment at risk is exceptionally thin and to whom we provided most of the financing.
We, as a non-primary beneficiary, had variable interests in this type of entity, with total assets of ¥14,958.6 billion, at March 31, 2005, and are exposed to maximum loss of ¥910.0 billion, which will possibly realize if our loans to entities are not collected in accordance with the contractual terms.
Repackaged Instruments
We have two types of relationships with special purpose entities that repackage financial instruments to create new financial instruments.
We provide repackaged instruments with features that meet the customer’s needs and preferences through special purpose entities. We purchase financial instruments such as bonds and transfer them to special purpose entities which then issue new instruments. The special purpose entities may enter into derivative transactions including interest rate and currency swaps with us or other financial institutions to modify the cash flows of the underlying financial instruments. We underwrite and market to our customers the new instruments issued by the special purpose entities.
We also invest in repackaged instruments arranged and issued by third parties.
At March 31, 2005, the total assets of these entities were estimated as ¥11,470.6 billion and our maximum exposure to loss as a result of our involvement with such entities were estimated as ¥379.1 billion.
Other Type of VIEs
We are also a party to other types of VIEs including special purpose entities created to hold assets on behalf of us as an intermediary.
We identified borrowers that were determined to be VIEs due to an insufficient level of equity. We determined that we are not the primary beneficiary of most of these borrowers because of our limited exposure as a lender to such borrowers. Such borrowers engage in diverse business activities of various sizes in industries such as manufacturing, merchandise trading, distribution, construction and real estate development, independently from us.
56
Table of Contents
In the normal course of our business, we enter into contractual agreements whereby we commit to future purchases of products or services from unaffiliated parties. The following table shows a summary of our contractual cash obligations at March 31, 2005:
| Payments due by period | |||||||||||||||
| Less than 1 year | 1-3 years | 3-5 years | Over 5 years | Total | |||||||||||
| (in billions) | |||||||||||||||
Contractual cash obligations: | |||||||||||||||
Time deposits | ¥ | 20,107 | ¥ | 3,372 | ¥ | 589 | ¥ | 67 | ¥ | 24,135 | |||||
Long-term debt | 795 | 1,068 | 738 | 2,568 | 5,169 | ||||||||||
Capital lease obligations | 8 | 10 | 4 | 5 | 27 | ||||||||||
Operating leases | 17 | 26 | 16 | 23 | 82 | ||||||||||
Purchase obligations | 3 | 3 | 1 | 25 | 32 | ||||||||||
Total* | ¥ | 20,930 | ¥ | 4,479 | ¥ | 1,348 | ¥ | 2,688 | ¥ | 29,445 | |||||
| * | The total amount of expected future pension payments is not included in the above table or the total amount of commitments outstanding at March 31, 2005 as such amount is not currently determinable. We expect to contribute approximately ¥14.4 billion to the pension plans of domestic subsidiaries and approximately ¥14.8 billion to the pension plans of subsidiaries in the United States of America for the fiscal year ending March 31, 2006. |
Purchase obligations include any legally binding contractual obligations that require us to spend more than ¥100 million annually under the contract. Purchase obligations in the table primarily include commitments to make investments into corporate recovery or private equity investment funds.
Non-exchange Traded Contracts Accounted for at Fair Value
The use of non-exchange traded or over-the-counter contracts provide us with the ability to adapt to the varied requirements of a wide customer base while mitigating market risks. Non-exchange traded contracts are accounted for at fair value, which is generally based on pricing models or quoted market prices for instruments with similar characteristics. Gains or losses on non-exchange traded contracts are included in “Trading account profits—net” in our consolidated statements of income. These contracts consist primarily of crude oil commodity contracts. The following table summarizes the changes in fair value of non-exchange traded contracts for the fiscal years ended March 31, 2004 and 2005:
| Fiscal years ended March 31, | ||||||||
| 2004 | 2005 | |||||||
| (in millions) | ||||||||
Net fair value of contracts outstandings at beginning of fiscal year | ¥ | 10,275 | ¥ | 12,054 | ||||
Changes attributable to contracts realized or otherwise settled during the fiscal year | (8,467 | ) | (5,375 | ) | ||||
Fair value of new contracts when entered into during the fiscal year | (23 | ) | (29 | ) | ||||
Other changes in fair value, principally revaluation at end of fiscal year | 10,269 | 23,173 | ||||||
Net fair value of contracts outstandings at end of fiscal year | ¥ | 12,054 | ¥ | 29,823 | ||||
During the fiscal years ended March 31, 2004 and 2005, the fair value of non-exchange traded contracts increased primarily due to an increase in the fair value of oil commodity contracts indexed to the Brent crude oil and WTI crude oil prices, reflecting political factors in the Middle East and other factors.
57
Table of Contents
The following table summarizes the maturities of non-exchange traded contracts at March 31, 2005:
| Net fair value of contracts— unrealized gains | ||||||
| Prices actively quoted | Prices based on models and other valuation methods | |||||
| (in millions) | ||||||
Maturity less than 1 year | ¥ | 7,851 | ¥ | 305 | ||
Maturity less than 3 years | 8,779 | 197 | ||||
Maturity less than 5 years | 6,082 | — | ||||
Maturity 5 years or more | 6,609 | — | ||||
Total fair values | ¥ | 29,321 | ¥ | 502 | ||
| C. | Research and Development, Patents and Licenses, etc. |
Not applicable.
| D. | Trend Information |
See the discussions under Items 5.A. and 5.B. of this Annual Report.
| E. | Off-balance-sheet Arrangements |
See the discussion under “Item 5.B. Operating and Financial Review and Prospects—Liquidity and Capital Resources.”
| F. | Tabular Disclosure of Contractual Obligations |
See the discussion under “Item 5.B. Operating and Financial Review and Prospects—Liquidity and Capital Resources.”
| G. | Safe Harbor |
See the discussion under “Forward-Looking Statements.”
58
Table of Contents
| Item 18. | Financial Statements. |
The information required by this item is set forth in our consolidated financial statements starting on page F-1 of this Annual Report.
| Item 19. | Exhibits. |
| Exhibit | Description | |
| 12 | Certifications required by Rule 13a-14(a) (17 CFR 240.13a-14(a)) or Rule 15d-14(a) (17 CFR 240.15d-14(a)).(1) | |
| 13 | Certifications required by Rule 13a-14(b) (17 CFR 240.13a-14(b)) or Rule 15d-14(b) (17 CFR 240.15d-14(b)) and Section 1350 of Chapter 63 of Title 18 of the United States Code (18 U.S.C. 1350).(1) | |
59
Table of Contents
Due to close integration of our foreign and domestic activities, it is difficult to make a precise determination of the assets, liabilities, income and expenses of our foreign operations. The foreign operations as presented include the business conducted by overseas subsidiaries and branches, and the international business conducted by the several international banking related divisions headquartered in Japan. Our management believes that the results appropriately represent our domestic and foreign activities.
During the fiscal year ended March 31, 2003, the Bank of Japan changed its industry segment loan classification. Such change primarily includes the introduction of a new “Communication and information services” category. Due to the introduction of the new category, certain businesses previously included in “Manufacturing,” “Services” and “Other” industries were reclassified into “Communication and information services.” This change is expected to provide a more suitable and detailed description of the loan portfolio. In response to the change, we modified our loan reporting system. For comparative purposes, we provide the loan information by industry segment as of March 31, 2003, 2004 and 2005, including III. Loan Portfolio and IV. Summary of Loan Loss Experience, based on both the old and new industry segment classifications.
A-1
Table of Contents
I. Distribution of Assets, Liabilities and Shareholder’s Equity; Interest Rates and Interest Differential
Average Balance Sheets, Interest and Average Rates
The following table shows our average balances, interest and average interest rates for the fiscal years ended March 31, 2003, 2004 and 2005. Average balances are generally based on a daily average while a month-end average is used for certain average balances when it is not practicable to obtain applicable daily averages. The average balances determined by such methods are considered to be representative of our operations.
| Fiscal years ended March 31, | ||||||||||||||||||||||||||||||
| 2003 | 2004 | 2005 | ||||||||||||||||||||||||||||
Average balance | Interest | Average rate | Average balance | Interest | Average rate | Average balance | Interest | Average rate | ||||||||||||||||||||||
| (in millions, except percentages) | ||||||||||||||||||||||||||||||
Assets: | ||||||||||||||||||||||||||||||
Interest-earning assets: | ||||||||||||||||||||||||||||||
Interest-earning deposits in other banks: | ||||||||||||||||||||||||||||||
Domestic | ¥ | 354,260 | ¥ | 3,650 | 1.03 | % | ¥ | 299,310 | ¥ | 3,942 | 1.32 | % | ¥ | 310,569 | ¥ | 5,865 | 1.89 | % | ||||||||||||
Foreign | 2,960,108 | 63,329 | 2.14 | 2,378,858 | 39,528 | 1.66 | 2,567,745 | 53,837 | 2.10 | |||||||||||||||||||||
Total | 3,314,368 | 66,979 | 2.02 | 2,678,168 | 43,470 | 1.62 | 2,878,314 | 59,702 | 2.07 | |||||||||||||||||||||
Call loans, funds sold, and receivables under resale agreements and securities borrowing transactions: | ||||||||||||||||||||||||||||||
Domestic | 1,236,875 | 4,441 | 0.36 | 2,718,805 | 3,327 | 0.12 | 3,267,947 | 3,948 | 0.12 | |||||||||||||||||||||
Foreign | 1,547,905 | 38,335 | 2.48 | 1,516,144 | 25,760 | 1.70 | 1,560,507 | 32,126 | 2.06 | |||||||||||||||||||||
Total | 2,784,780 | 42,776 | 1.54 | 4,234,949 | 29,087 | 0.69 | 4,828,454 | 36,074 | 0.75 | |||||||||||||||||||||
Trading account assets: | ||||||||||||||||||||||||||||||
Domestic | 3,533,200 | 10,056 | 0.28 | 5,223,713 | 22,740 | 0.44 | 4,916,675 | 25,632 | 0.52 | |||||||||||||||||||||
Foreign | 522,781 | 1,159 | 0.22 | 541,584 | 5,275 | 0.97 | 666,692 | 5,043 | 0.76 | |||||||||||||||||||||
Total | 4,055,981 | 11,215 | 0.28 | 5,765,297 | 28,015 | 0.49 | 5,583,367 | 30,675 | 0.55 | |||||||||||||||||||||
Investment securities (see Note 1): | ||||||||||||||||||||||||||||||
Domestic | 13,762,282 | 80,138 | 0.58 | 15,295,168 | 77,352 | 0.51 | 21,585,300 | 95,534 | 0.44 | |||||||||||||||||||||
Foreign | 3,783,498 | 142,757 | 3.77 | 4,175,301 | 132,227 | 3.17 | 4,905,831 | 157,414 | 3.21 | |||||||||||||||||||||
Total | 17,545,780 | 222,895 | 1.27 | 19,470,469 | 209,579 | 1.08 | 26,491,131 | 252,948 | 0.95 | |||||||||||||||||||||
Loans (see Note 2): | ||||||||||||||||||||||||||||||
Domestic | 30,756,720 | 502,010 | 1.63 | 31,393,691 | 478,921 | 1.53 | 33,501,976 | 488,285 | 1.46 | |||||||||||||||||||||
Foreign | 9,872,489 | 414,792 | 4.20 | 9,048,810 | 331,080 | 3.66 | 9,140,376 | 330,745 | 3.62 | |||||||||||||||||||||
Total | 40,629,209 | 916,802 | 2.26 | 40,442,501 | 810,001 | 2.00 | 42,642,352 | 819,030 | 1.92 | |||||||||||||||||||||
Total interest-earning assets: | ||||||||||||||||||||||||||||||
Domestic | 49,643,337 | 600,295 | 1.21 | 54,930,687 | 586,282 | 1.07 | 63,582,467 | 619,264 | 0.97 | |||||||||||||||||||||
Foreign | 18,686,781 | 660,372 | 3.53 | 17,660,697 | 533,870 | 3.02 | 18,841,151 | 579,165 | 3.07 | |||||||||||||||||||||
Total | 68,330,118 | 1,260,667 | 1.84 | 72,591,384 | 1,120,152 | 1.54 | 82,423,618 | 1,198,429 | 1.45 | |||||||||||||||||||||
Non-interest-earning assets: | ||||||||||||||||||||||||||||||
Cash and due from banks | 1,826,588 | 4,063,489 | 4,437,910 | |||||||||||||||||||||||||||
Other non-interest-earning assets | 7,731,834 | 7,720,556 | 6,339,566 | |||||||||||||||||||||||||||
Allowance for credit losses | (1,326,654 | ) | (922,278 | ) | (616,227 | ) | ||||||||||||||||||||||||
Total non-interest-earning assets | 8,231,768 | 10,861,767 | 10,161,249 | |||||||||||||||||||||||||||
Total assets from discontinued operations | 80,280 | 21,183 | — | |||||||||||||||||||||||||||
Total average assets | ¥ | 76,642,166 | ¥ | 83,474,334 | ¥ | 92,584,867 | ||||||||||||||||||||||||
Notes:
| 1. | Tax-exempt income of tax-exempt investment securities has not been calculated on a tax equivalent basis because the effect of such calculation would not be material. |
| 2. | Average balances on loans outstanding include all nonaccrual and restructured loans. See “III. Loan Portfolio.” The amortized portion of net loan origination fees (costs) is included in interest income on loans, representing an adjustment to the yields with insignificant impact. |
A-2
Table of Contents
| Fiscal years ended March 31, | |||||||||||||||||||||||||||
| 2003 | 2004 | 2005 | |||||||||||||||||||||||||
Average balance | Interest | Average rate | Average balance | Interest | Average rate | Average balance | Interest | Average rate | |||||||||||||||||||
| (in millions, except percentages) | |||||||||||||||||||||||||||
Liabilities and shareholder’s equity: | |||||||||||||||||||||||||||
Interest-bearing liabilities: | |||||||||||||||||||||||||||
Deposits: | |||||||||||||||||||||||||||
Domestic | ¥ | 39,576,034 | ¥ | 54,991 | 0.14 | % | ¥ | 41,854,724 | ¥ | 40,212 | 0.10 | % | ¥ | 42,666,880 | ¥ | 50,353 | 0.12 | % | |||||||||
Foreign | 8,000,966 | 138,603 | 1.73 | 8,171,037 | 104,238 | 1.28 | 9,092,154 | 133,961 | 1.47 | ||||||||||||||||||
Total | 47,577,000 | 193,594 | 0.41 | 50,025,761 | 144,450 | 0.29 | 51,759,034 | 184,314 | 0.36 | ||||||||||||||||||
Debentures—Domestic | 1,346,268 | 8,508 | 0.63 | 498,518 | 4,035 | 0.81 | 68,296 | 351 | 0.51 | ||||||||||||||||||
Call money, funds purchased, and payables under repurchase agreements and securities lending transactions: | |||||||||||||||||||||||||||
Domestic | 4,094,246 | 3,478 | 0.08 | 5,433,533 | 10,852 | 0.20 | 6,911,932 | 26,424 | 0.38 | ||||||||||||||||||
Foreign | 2,251,946 | 66,852 | 2.97 | 2,125,712 | 37,320 | 1.76 | 1,714,918 | 27,703 | 1.62 | ||||||||||||||||||
Total | 6,346,192 | 70,330 | 1.11 | 7,559,245 | 48,172 | 0.64 | 8,626,850 | 54,127 | 0.63 | ||||||||||||||||||
Other short-term borrowings and trading account liabilities: | |||||||||||||||||||||||||||
Domestic | 1,609,391 | 12,960 | 0.81 | 3,575,821 | 26,097 | 0.73 | 9,116,401 | 29,158 | 0.32 | ||||||||||||||||||
Foreign | 598,545 | 16,493 | 2.76 | 537,476 | 6,868 | 1.28 | 1,304,679 | 24,006 | 1.84 | ||||||||||||||||||
Total | 2,207,936 | 29,453 | 1.33 | 4,113,297 | 32,965 | 0.80 | 10,421,080 | 53,164 | 0.51 | ||||||||||||||||||
Long-term debt: | |||||||||||||||||||||||||||
Domestic | 3,474,694 | 88,610 | 2.55 | 3,904,370 | 85,291 | 2.18 | 4,075,327 | 81,228 | 1.99 | ||||||||||||||||||
Foreign | 1,434,889 | 44,588 | 3.11 | 1,040,102 | 23,983 | 2.31 | 821,413 | 16,539 | 2.01 | ||||||||||||||||||
Total | 4,909,583 | 133,198 | 2.71 | 4,944,472 | 109,274 | 2.21 | 4,896,740 | 97,767 | 2.00 | ||||||||||||||||||
Total interest-bearing liabilities: | |||||||||||||||||||||||||||
Domestic | 50,100,633 | 168,547 | 0.34 | 55,266,966 | 166,487 | 0.30 | 62,838,836 | 187,514 | 0.30 | ||||||||||||||||||
Foreign | 12,286,346 | 266,536 | 2.17 | 11,874,327 | 172,409 | 1.45 | 12,933,164 | 202,209 | 1.56 | ||||||||||||||||||
Total | 62,386,979 | 435,083 | 0.70 | 67,141,293 | 338,896 | 0.50 | 75,772,000 | 389,723 | 0.51 | ||||||||||||||||||
Non-interest-bearing liabilities | 12,438,992 | 13,919,070 | 14,043,607 | ||||||||||||||||||||||||
Total liabilities from discontinued operations | 50,991 | 15,155 | — | ||||||||||||||||||||||||
Shareholder’s equity | 1,765,204 | 2,398,816 | 2,769,260 | ||||||||||||||||||||||||
Total average liabilities and shareholder’s equity | ¥ | 76,642,166 | ¥ | 83,474,334 | ¥ | 92,584,867 | |||||||||||||||||||||
Net interest income and average interest rate spread | ¥ | 825,584 | 1.14 | % | ¥ | 781,256 | 1.04 | % | ¥ | 808,706 | 0.94 | % | |||||||||||||||
Net interest income as a percentage of average total interest-earning assets | 1.21 | % | 1.08 | % | 0.98 | % | |||||||||||||||||||||
The percentage of average total assets attributable to foreign activities was 29.8%, 26.4% and 23.9%, respectively, for the fiscal years ended March 31, 2003, 2004 and 2005.
The percentage of average total liabilities attributable to foreign activities was 30.2%, 27.0% and 24.6%, respectively, for the fiscal years ended March 31, 2003, 2004 and 2005.
A-3
Table of Contents
Analysis of Net Interest Income
The following table shows changes in our net interest income between changes in volume and changes in rate for the fiscal year ended March 31, 2004 compared to the fiscal year ended March 31, 2003 and the fiscal year ended March 31, 2005 compared to the fiscal year ended March 31, 2004.
Fiscal year ended March 31, 2003 versus fiscal year ended March 31, 2004 | Fiscal year ended March 31, 2004 versus fiscal year ended March 31, 2005 | |||||||||||||||||||||||
| Increase (decrease) due to changes in | Increase (decrease) due to changes in | |||||||||||||||||||||||
| Volume | Rate | Net change | Volume | Rate | Net change | |||||||||||||||||||
| (in millions) | ||||||||||||||||||||||||
Interest income: | ||||||||||||||||||||||||
Interest-earning deposits in other banks: | ||||||||||||||||||||||||
Domestic | ¥ | (566 | ) | ¥ | 858 | ¥ | 292 | ¥ | 153 | ¥ | 1,770 | ¥ | 1,923 | |||||||||||
Foreign | (10,934 | ) | (12,867 | ) | (23,801 | ) | 3,330 | 10,979 | 14,309 | |||||||||||||||
Total | (11,500 | ) | (12,009 | ) | (23,509 | ) | 3,483 | 12,749 | 16,232 | |||||||||||||||
Call loans, funds sold, and receivables under resale agreements and securities borrowing transactions: | ||||||||||||||||||||||||
Domestic | 1,813 | (2,927 | ) | (1,114 | ) | 663 | (42 | ) | 621 | |||||||||||||||
Foreign | (550 | ) | (12,025 | ) | (12,575 | ) | 773 | 5,593 | 6,366 | |||||||||||||||
Total | 1,263 | (14,952 | ) | (13,689 | ) | 1,436 | 5,551 | 6,987 | ||||||||||||||||
Trading account assets: | ||||||||||||||||||||||||
Domestic | 6,021 | 6,663 | 12,684 | (1,337 | ) | 4,229 | 2,892 | |||||||||||||||||
Foreign | 43 | 4,073 | 4,116 | 946 | (1,178 | ) | (232 | ) | ||||||||||||||||
Total | 6,064 | 10,736 | 16,800 | (391 | ) | 3,051 | 2,660 | |||||||||||||||||
Investment securities (see Note 2): | ||||||||||||||||||||||||
Domestic | 7,752 | (10,538 | ) | (2,786 | ) | 27,839 | (9,657 | ) | 18,182 | |||||||||||||||
Foreign | 12,408 | (22,938 | ) | (10,530 | ) | 23,419 | 1,768 | 25,187 | ||||||||||||||||
Total | 20,160 | (33,476 | ) | (13,316 | ) | 51,258 | (7,889 | ) | 43,369 | |||||||||||||||
Loans: | ||||||||||||||||||||||||
Domestic | 9,717 | (32,806 | ) | (23,089 | ) | 30,728 | (21,364 | ) | 9,364 | |||||||||||||||
Foreign | (31,837 | ) | (51,875 | ) | (83,712 | ) | 3,313 | (3,648 | ) | (335 | ) | |||||||||||||
Total | (22,120 | ) | (84,681 | ) | (106,801 | ) | 34,041 | (25,012 | ) | 9,029 | ||||||||||||||
Total interest income: | ||||||||||||||||||||||||
Domestic | 24,737 | (38,750 | ) | (14,013 | ) | 58,046 | (25,064 | ) | 32,982 | |||||||||||||||
Foreign | (30,870 | ) | (95,632 | ) | (126,502 | ) | 31,781 | 13,514 | 45,295 | |||||||||||||||
Total | ¥ | (6,133 | ) | ¥ | (134,382 | ) | ¥ | (140,515 | ) | ¥ | 89,827 | ¥ | (11,550 | ) | ¥ | 78,277 | ||||||||
Notes:
| 1. | Rate/volume variance is allocated based on the percentage relationship of changes in volume and changes in rate to the total “net change.” |
| 2. | Tax-exempt income of tax-exempt investment securities has not been calculated on a tax equivalent basis because the effect of such calculation would not be material. |
A-4
Table of Contents
| Fiscal year ended March 31, 2003 versus fiscal year ended March 31, 2004 | Fiscal year ended March 31, 2004 versus fiscal year ended March 31, 2005 | |||||||||||||||||||||||
Increase (decrease) due to changes in | Net change | Increase (decrease) due to changes in | Net change | |||||||||||||||||||||
| Volume | Rate | Volume | Rate | |||||||||||||||||||||
| (in millions) | ||||||||||||||||||||||||
Interest expense: | ||||||||||||||||||||||||
Deposits: | ||||||||||||||||||||||||
Domestic | ¥ | 2,189 | ¥ | (16,968 | ) | ¥ | (14,779 | ) | ¥ | 794 | ¥ | 9,347 | ¥ | 10,141 | ||||||||||
Foreign | 2,170 | (36,535 | ) | (34,365 | ) | 12,517 | 17,206 | 29,723 | ||||||||||||||||
Total | 4,359 | (53,503 | ) | (49,144 | ) | 13,311 | 26,553 | 39,864 | ||||||||||||||||
Debentures—Domestic | (5,358 | ) | 885 | (4,473 | ) | (3,376 | ) | (308 | ) | (3,684 | ) | |||||||||||||
Call money, funds purchased, and payables under repurchase agreements and securities lending transactions: | ||||||||||||||||||||||||
Domestic | 1,437 | 5,937 | 7,374 | 3,572 | 12,000 | 15,572 | ||||||||||||||||||
Foreign | (2,337 | ) | (27,195 | ) | (29,532 | ) | (7,059 | ) | (2,558 | ) | (9,617 | ) | ||||||||||||
Total | (900 | ) | (21,258 | ) | (22,158 | ) | (3,487 | ) | 9,442 | 5,955 | ||||||||||||||
Other short-term borrowings and trading account liabilities: | ||||||||||||||||||||||||
Domestic | 14,351 | (1,214 | ) | 13,137 | 17,721 | (14,660 | ) | 3,061 | ||||||||||||||||
Foreign | (861 | ) | (8,764 | ) | (9,625 | ) | 13,100 | 4,038 | 17,138 | |||||||||||||||
Total | 13,490 | (9,978 | ) | 3,512 | 30,821 | (10,622 | ) | 20,199 | ||||||||||||||||
Long-term debt: | ||||||||||||||||||||||||
Domestic | 9,386 | (12,705 | ) | (3,319 | ) | 3,407 | (7,470 | ) | (4,063 | ) | ||||||||||||||
Foreign | (10,755 | ) | (9,850 | ) | (20,605 | ) | (4,817 | ) | (2,627 | ) | (7,444 | ) | ||||||||||||
Total | (1,369 | ) | (22,555 | ) | (23,924 | ) | (1,410 | ) | (10,097 | ) | (11,507 | ) | ||||||||||||
Total interest expense: | ||||||||||||||||||||||||
Domestic | 22,005 | (24,065 | ) | (2,060 | ) | 22,118 | (1,091 | ) | 21,027 | |||||||||||||||
Foreign | (11,783 | ) | (82,344 | ) | (94,127 | ) | 13,741 | 16,059 | 29,800 | |||||||||||||||
Total | ¥ | 10,222 | ¥ | (106,409 | ) | ¥ | (96,187 | ) | ¥ | 35,859 | ¥ | 14,968 | ¥ | 50,827 | ||||||||||
Net interest income: | ||||||||||||||||||||||||
Domestic | ¥ | 2,732 | ¥ | (14,685 | ) | ¥ | (11,953 | ) | ¥ | 35,928 | ¥ | (23,973 | ) | ¥ | 11,955 | |||||||||
Foreign | (19,087 | ) | (13,288 | ) | (32,375 | ) | 18,040 | (2,545 | ) | 15,495 | ||||||||||||||
Total | ¥ | (16,355 | ) | ¥ | (27,973 | ) | ¥ | (44,328 | ) | ¥ | 53,968 | ¥ | (26,518 | ) | ¥ | 27,450 | ||||||||
Note—Rate/volume variance is allocated based on the percentage relationship of changes in volume and changes in rate to the total “net change.”
A-5
Table of Contents
II. Investment Portfolio
The following table shows information as to the value of our investment securities available for sale and being held to maturity at March 31, 2003, 2004 and 2005.
| At March 31, | |||||||||||||||||||||||||||||
| 2003 | 2004 | 2005 | |||||||||||||||||||||||||||
| Amortized cost | Estimated value | Net unrealized gains | Amortized cost (Restated) | Estimated value | Net unrealized gains (losses) (Restated) | Amortized cost | Estimated value | Net unrealized gains (losses) | |||||||||||||||||||||
| (in millions) | |||||||||||||||||||||||||||||
Securities available for sale: | |||||||||||||||||||||||||||||
Domestic: | |||||||||||||||||||||||||||||
Japanese national government and Japanese government agency bonds | ¥ | 8,755,763 | ¥ | 8,810,317 | ¥ | 54,554 | ¥ | 12,599,395 | ¥ | 12,607,790 | ¥ | 8,395 | ¥ | 11,937,428 | ¥ | 11,970,903 | ¥ | 33,475 | |||||||||||
Corporate bonds | 839,507 | 842,296 | 2,789 | 1,027,342 | 1,028,679 | 1,337 | 1,362,737 | 1,368,002 | 5,265 | ||||||||||||||||||||
Marketable equity securities | 1,970,134 | 2,564,430 | 594,296 | 1,628,489 | 2,933,095 | 1,304,606 | 1,694,345 | 2,971,151 | 1,276,806 | ||||||||||||||||||||
Other securities | 491,667 | 498,619 | 6,952 | 253,683 | 256,205 | 2,522 | 196,257 | 198,183 | 1,926 | ||||||||||||||||||||
Total domestic | 12,057,071 | 12,715,662 | 658,591 | 15,508,909 | 16,825,769 | 1,316,860 | 15,190,767 | 16,508,239 | 1,317,472 | ||||||||||||||||||||
Foreign: | |||||||||||||||||||||||||||||
U.S. Treasury and other U.S. government agencies bonds | 870,486 | 874,569 | 4,083 | 896,136 | 900,256 | 4,120 | 767,042 | 755,285 | (11,757 | ) | |||||||||||||||||||
Other governments and official institutions bonds | 1,274,176 | 1,325,494 | 51,318 | 527,419 | 523,739 | (3,680 | ) | 736,919 | 742,612 | 5,693 | |||||||||||||||||||
Mortgage-backed securities | 1,139,648 | 1,151,042 | 11,394 | 1,148,711 | 1,145,084 | (3,627 | ) | 2,098,254 | 2,103,205 | 4,951 | |||||||||||||||||||
Other securities | 719,867 | 734,359 | 14,492 | 873,011 | 891,918 | 18,907 | 1,345,967 | 1,382,831 | 36,864 | ||||||||||||||||||||
Total foreign | 4,004,177 | 4,085,464 | 81,287 | 3,445,277 | 3,460,997 | 15,720 | 4,948,182 | 4,983,933 | 35,751 | ||||||||||||||||||||
Total | ¥ | 16,061,248 | ¥ | 16,801,126 | ¥ | 739,878 | ¥ | 18,954,186 | ¥ | 20,286,766 | ¥ | 1,332,580 | ¥ | 20,138,949 | ¥ | 21,492,172 | ¥ | 1,353,223 | |||||||||||
Securities being held to maturity: | |||||||||||||||||||||||||||||
Domestic: | |||||||||||||||||||||||||||||
Japanese national government and Japanese government agency bonds | ¥ | — | ¥ | — | ¥ | — | ¥ | 996,398 | ¥ | 996,785 | ¥ | 387 | ¥ | 1,997,336 | ¥ | 2,013,677 | ¥ | 16,341 | |||||||||||
Corporate bonds | — | — | — | 997 | 997 | — | 997 | 997 | — | ||||||||||||||||||||
Total domestic | — | — | — | 997,395 | 997,782 | 387 | 1,998,333 | 2,014,674 | 16,341 | ||||||||||||||||||||
Foreign: | |||||||||||||||||||||||||||||
U.S. Treasury and other U.S. government agencies bonds | — | — | — | 5,584 | 5,584 | — | 5,254 | 5,417 | 163 | ||||||||||||||||||||
Other governments and official institutions bonds | — | — | — | 12,528 | 12,608 | 80 | 9,846 | 9,957 | 111 | ||||||||||||||||||||
Other securities | — | — | — | 36,686 | 36,688 | 2 | 34,508 | 34,584 | 76 | ||||||||||||||||||||
Total foreign | — | — | — | 54,798 | 54,880 | 82 | 49,608 | 49,958 | 350 | ||||||||||||||||||||
Total | ¥ | — | ¥ | — | ¥ | — | ¥ | 1,052,193 | ¥ | 1,052,662 | ¥ | 469 | ¥ | 2,047,941 | ¥ | 2,064,632 | ¥ | 16,691 | |||||||||||
Subsequent to the filing of our Annual Report on Form 20-F for the fiscal year ended March 31, 2004, management determined that amortized costs and net unrealized gains (losses) on securities available for sale for the fiscal year ended March 31, 2004 were erroneously disclosed. As a result, such amounts have been restated from the amounts previously reported as follows:
| 2004 | |||||||||||||
| Amortized cost | Net unrealized gains (losses) | ||||||||||||
| As previously reported | As restated | As previously reported | As restated | ||||||||||
| (in millions) | |||||||||||||
Securities available for sale: | |||||||||||||
Foreign: | |||||||||||||
U.S. Treasury and other U.S. government agencies bonds | ¥ | 887,851 | ¥ | 896,136 | ¥ | 12,405 | ¥ | 4,120 | |||||
Other governments and official institutions bonds | 520,229 | 527,419 | 3,510 | (3,680 | ) | ||||||||
Mortgage-backed securities | 1,118,981 | 1,148,711 | 26,103 | (3,627 | ) | ||||||||
Other securities | 853,835 | 873,011 | 38,083 | 18,907 | |||||||||
Total foreign | ¥ | 3,380,896 | ¥ | 3,445,277 | ¥ | 80,101 | ¥ | 15,720 | |||||
Nonmarketable equity securities presented in Other investment securities in the consolidated financial statements were carried at costs of ¥113,054 million, ¥160,343 million and ¥275,316 million, at March 31, 2003, 2004 and 2005, respectively. The corresponding estimated fair values at those dates were not readily determinable.
A-6
Table of Contents
The following table presents the book values, maturities and weighted average yields of investment securities available for sale and being held to maturity, excluding equity securities, at March 31, 2005. Weighted average yields are calculated based on amortized cost. Yields on tax-exempt obligations have not been calculated on a tax equivalent basis because the effect of such calculation would not be material:
| Maturities within one year | Maturities after one year but within five years | Maturities after five years but within ten years | Maturities after ten years | Total | ||||||||||||||||||||||||||
| Amount | Yield | Amount | Yield | Amount | Yield | Amount | Yield | Amount | Yield | |||||||||||||||||||||
| (in millions, except percentages) | ||||||||||||||||||||||||||||||
Securities available for sale: | ||||||||||||||||||||||||||||||
Domestic: | ||||||||||||||||||||||||||||||
Japanese national government and Japanese government agency bonds | ¥ | 4,398,914 | 0.04 | % | ¥ | 5,824,497 | 0.35 | % | ¥ | 699,091 | 1.27 | % | ¥ | 1,048,401 | 0.82 | % | ¥ | 11,970,903 | 0.33 | % | ||||||||||
Corporate bonds | 200,812 | 1.25 | 1,123,542 | 0.71 | 43,466 | 1.03 | 182 | 0.00 | 1,368,002 | 0.80 | ||||||||||||||||||||
Other securities | 76,285 | 1.72 | 89,264 | 2.34 | 12,838 | 1.98 | 19,796 | 0.54 | 198,183 | 1.89 | ||||||||||||||||||||
Total domestic | 4,676,011 | 0.12 | 7,037,303 | 0.43 | 755,395 | 1.27 | 1,068,379 | 0.82 | 13,537,088 | 0.40 | ||||||||||||||||||||
Foreign: | ||||||||||||||||||||||||||||||
U.S. Treasury and other U.S. government agencies bonds | 129,454 | 2.82 | 494,953 | 2.99 | 129,185 | 4.17 | 1,693 | 8.86 | 755,285 | 3.17 | ||||||||||||||||||||
Other governments and official institutions bonds | 171,616 | 2.36 | 299,446 | 2.99 | 256,515 | 4.43 | 15,035 | 5.65 | 742,612 | 3.40 | ||||||||||||||||||||
Mortgage-backed securities | 219 | 4.57 | 7,891 | 3.68 | 173,563 | 3.60 | 1,921,532 | 4.36 | 2,103,205 | 4.30 | ||||||||||||||||||||
Other securities | 71,603 | 0.99 | 461,215 | 0.87 | 157,581 | 2.53 | 564,242 | 4.19 | 1,254,641 | 2.57 | ||||||||||||||||||||
Total foreign | 372,892 | 2.26 | 1,263,505 | 2.23 | 716,844 | 3.77 | 2,502,502 | 4.33 | 4,855,743 | 3.54 | ||||||||||||||||||||
Total | ¥5,048,903 | 0.28 | % | ¥ | 8,300,808 | 0.71 | % | ¥ | 1,472,239 | 2.50 | % | ¥ | 3,570,881 | 3.28 | % | ¥ | 18,392,831 | 1.23 | % | |||||||||||
Securities being held to maturity: | ||||||||||||||||||||||||||||||
Domestic: | ||||||||||||||||||||||||||||||
Japanese national government and Japanese government agency bonds | ¥ | — | — | % | ¥ | 1,997,336 | 0.51 | % | ¥ | — | — | % | ¥ | — | — | % | ¥ | 1,997,336 | 0.51 | % | ||||||||||
Corporate bonds | — | — | — | — | — | — | 997 | 1.50 | 997 | 1.50 | ||||||||||||||||||||
Total domestic | — | — | 1,997,336 | 0.51 | — | — | 997 | 1.50 | 1,998,333 | 0.51 | ||||||||||||||||||||
Foreign: | ||||||||||||||||||||||||||||||
U.S. Treasury and other U.S. government agencies bonds | 654 | 6.57 | 655 | 6.87 | — | — | 3,945 | 8.31 | 5,254 | 7.92 | ||||||||||||||||||||
Other governments and official institutions bonds | 9,153 | 4.46 | 693 | 8.80 | — | — | — | — | 9,846 | 4.76 | ||||||||||||||||||||
Other securities | 5,288 | 2.57 | 23,273 | 2.95 | 5,947 | 1.56 | — | — | 34,508 | 2.65 | ||||||||||||||||||||
Total foreign | 15,095 | 3.89 | 24,621 | 3.22 | 5,947 | 1.56 | 3,945 | 8.31 | 49,608 | 3.63 | ||||||||||||||||||||
Total | ¥ | 15,095 | 3.89 | % | ¥ | 2,021,957 | 0.54 | % | ¥ | 5,947 | 1.56 | % | ¥ | 4,942 | 6.94 | % | ¥ | 2,047,941 | 0.58 | % | ||||||||||
Excluding U.S. Treasury and other U.S. government agencies bonds and Japanese national government bonds, the following table sets forth the securities of individual issuers held in our investment securities portfolio which exceeded 10% of our consolidated shareholder’s equity at March 31, 2005.
| Amortized cost | Fair value | |||||
| (in millions) | ||||||
Mortgage-backed securities issued by U.S. Federal National Mortgage Association | ¥ | 1,581,381 | ¥ | 1,583,470 | ||
Mortgage-backed securities issued by U.S. Federal Home Loan Mortgage Corporation | 669,543 | 669,641 | ||||
Deposit Insurance Corporation of Japan | 509,823 | 510,685 | ||||
A-7
Table of Contents
III. Loan Portfolio
The following table shows our loans outstanding, before deduction of allowance for credit losses, by domicile and type of industry of borrower at March 31 of each of the five fiscal years ended March 31, 2005. Classification of loans by industry is based on the industry segment loan classification as defined by the Bank of Japan for regulatory reporting purposes and is not necessarily based on use of proceeds:
| At March 31, | |||||||||||||||||||||||||||||||
| 2001 | 2002 | 2003 | 2004 | 2005 | |||||||||||||||||||||||||||
Old classification | Old classification | Old classification | New classification | Old classification | New classification | Old classification | New classification | ||||||||||||||||||||||||
| (in millions) | |||||||||||||||||||||||||||||||
Domestic: | |||||||||||||||||||||||||||||||
Manufacturing | ¥ | 5,232,119 | ¥ | 5,081,824 | ¥ | 4,791,882 | ¥ | 4,714,708 | ¥ | 4,758,303 | ¥ | 4,692,433 | ¥ | 5,339,934 | ¥ | 5,280,555 | |||||||||||||||
Construction | 1,400,401 | 1,225,068 | 995,918 | 995,918 | 832,758 | 832,758 | 815,051 | 815,051 | |||||||||||||||||||||||
Real estate | 3,974,597 | 3,618,859 | 3,245,721 | 3,245,721 | 3,515,717 | 3,515,717 | 4,156,975 | 4,156,975 | |||||||||||||||||||||||
Services | 3,729,534 | 3,597,009 | 4,302,974 | 4,249,086 | 3,898,336 | 3,661,758 | 3,202,252 | 2,965,772 | |||||||||||||||||||||||
Wholesale and retail | 5,705,179 | 5,142,845 | 4,880,193 | 4,723,010 | 4,445,790 | 4,311,980 | 4,655,134 | 4,527,379 | |||||||||||||||||||||||
Banks and other financial institutions(1) | 1,906,526 | 2,098,870 | 1,705,185 | 1,705,185 | 1,676,785 | 1,676,785 | 2,364,504 | 2,364,504 | |||||||||||||||||||||||
Communication and information services | — | — | — | 1,264,713 | — | 650,983 | — | 605,910 | |||||||||||||||||||||||
Other industries | 1,589,648 | 2,781,122 | 3,621,445 | 2,644,977 | 4,965,300 | 4,750,575 | 5,526,883 | 5,344,587 | |||||||||||||||||||||||
Consumer | 6,767,046 | 6,790,123 | 7,089,429 | 7,089,429 | 7,562,590 | 7,562,590 | (3) | 7,662,809 | 7,662,809 | (3) | |||||||||||||||||||||
Total domestic | 30,305,050 | 30,335,720 | 30,632,747 | 30,632,747 | 31,655,579 | 31,655,579 | 33,723,542 | 33,723,542 | |||||||||||||||||||||||
Foreign: | |||||||||||||||||||||||||||||||
Governments and official institutions | 296,003 | 308,574 | 227,685 | 227,685 | 178,402 | 178,402 | 209,060 | 209,060 | |||||||||||||||||||||||
Banks and other financial institutions(1) | 581,433 | 493,800 | 777,697 | 777,697 | 904,841 | 904,841 | 780,666 | 780,666 | |||||||||||||||||||||||
Commercial and industrial | 8,218,468 | 9,271,565 | 8,127,334 | 8,127,334 | 7,063,034 | 7,063,034 | 8,553,679 | 8,553,679 | |||||||||||||||||||||||
Other | 804,434 | 644,003 | 267,301 | 267,301 | 156,369 | 156,369 | 171,514 | 171,514 | |||||||||||||||||||||||
Total foreign | 9,900,338 | 10,717,942 | 9,400,017 | 9,400,017 | 8,302,646 | 8,302,646 | 9,714,919 | 9,714,919 | |||||||||||||||||||||||
Total | 40,205,388 | 41,053,662 | 40,032,764 | 40,032,764 | 39,958,225 | 39,958,225 | 43,438,461 | 43,438,461 | |||||||||||||||||||||||
Less unearned income and deferred loan fees—net | 30,233 | 41,501 | 40,387 | 40,387 | 27,183 | 27,183 | 16,983 | 16,983 | |||||||||||||||||||||||
Total | ¥ | 40,175,155 | ¥ | 41,012,161 | (2) | ¥ | 39,992,377 | (2) | ¥ | 39,992,377 | (2) | ¥ | 39,931,042 | (2) | ¥ | 39,931,042 | (2) | ¥ | 43,421,478 | (2) | ¥ | 43,421,478 | (2) | ||||||||
Notes:
| (1) | Loans to the so-called non-bank finance companies are generally included in the “Banks and other financial institutions” category. Non-bank finance companies are primarily engaged in consumer lending, factoring and credit card businesses. |
| (2) | The above table includes loans held for sale of ¥3,178 million, ¥3,360 million, ¥9,960 million and 33,246 million at March 31, 2002, 2003, 2004 and 2005, respectively. |
| (3) | Domestic loans within the “consumer” category in the above table include loans to individuals who utilize loan proceeds to finance their proprietor activities and not for their personal financing needs. During the fiscal year ended March 31, 2004, our credit administration system was upgraded and became able to present a precise breakdown of the balance of such consumer loans by the type of proprietor business. This breakdown at March 31, 2004 and 2005 is presented below in accordance with our new classification: |
| Manufacturing | Construction | Real estate | Services | Wholesale and retail | Banks and other financial institutions | Communication and information services | Other industries | Total included in Consumer | |||||||||||||||||||
| (in millions) | |||||||||||||||||||||||||||
March 31,2004 | ¥ | 28,229 | ¥ | 19,283 | ¥ | 738,377 | ¥ | 230,730 | ¥ | 52,253 | ¥ | 1,200 | ¥ | 4,121 | ¥ | 10,620 | ¥ | 1,084,813 | |||||||||
March 31,2005 | ¥ | 23,023 | ¥ | 16,157 | ¥ | 542,969 | ¥ | 193,417 | ¥ | 39,806 | ¥ | 1,126 | ¥ | 3,681 | ¥ | 7,782 | ¥ | 827,961 | |||||||||
| Since the system upgrade was effective during the fiscal year ended March 31, 2004, no equivalent information is obtainable for prior fiscal year-end dates. |
A-8
Table of Contents
Subsequent to the filing of our Annual Report on Form 20-F for the fisical year eneded March 31, 2005, management determined that the details of loans by domicile and type of industry of borrower at March 31 of each of the five fisical years ended March 31, 2005 were erroneously disclosed. As a result, such amounts have been restated from the amounts previously reported as follows.
As previously reported
| At March 31, | ||||||||||||||||
| 2001 | 2002 | 2003 | 2004 | 2005 | ||||||||||||
| Old classification | Old classification | Old classification | New classification | Old classification | New classification | Old classification | New classification | |||||||||
| (in millions) | ||||||||||||||||
Domestic: | ||||||||||||||||
Banks and other financial institutions | 2,012,321 | 2,201,470 | 1,800,592 | 1,800,592 | 1,765,377 | 1,765,377 | 2,447,443 | 2,447,443 | ||||||||
Other industries | 1,589,648 | 2,781,122 | 3,621,243 | 2,644,775 | 4,965,300 | 4,750,575 | 5,443,944 | 5,261,648 | ||||||||
Consumer | 6,661,251 | 6,687,523 | 6,994,224 | 6,994,224 | 7,473,998 | 7,473,998 | 7,662,809 | 7,662,809 | ||||||||
Foreign: | ||||||||||||||||
Banks and other financial institutions | 581,433 | 493,800 | 777,697 | 777,697 | 904,841 | 904,841 | 1,075,339 | 1,075,339 | ||||||||
Commercial and industrial | 8,218,468 | 9,271,565 | 8,127,334 | 8,127,334 | 7,063,034 | 7,063,034 | 8,259,006 | 8,259,006 | ||||||||
As Restated
| At March 31, | ||||||||||||||||
| 2001 | 2002 | 2003 | 2004 | 2005 | ||||||||||||
| Old classification | Old classification | Old classification | New classification | Old classification | New classification | Old classification | New classification | |||||||||
| (in millions) | ||||||||||||||||
Domestic: | ||||||||||||||||
Banks and other financial institutions | 1,906,526 | 2,098,870 | 1,705,185 | 1,705,185 | 1,676,785 | 1,676,785 | 2,364,504 | 2,364,504 | ||||||||
Other industries | 1,589,648 | 2,781,122 | 3,621,445 | 2,644,977 | 4,965,300 | 4,750,575 | 5,526,883 | 5,344,587 | ||||||||
Consumer | 6,767,046 | 6,790,123 | 7,089,429 | 7,089,429 | 7,562,590 | 7,562,590 | 7,662,809 | 7,662,809 | ||||||||
Foreign: | ||||||||||||||||
Banks and other financial institutions | 581,433 | 493,800 | 777,697 | 777,697 | 904,841 | 904,841 | 780,666 | 780,666 | ||||||||
Commercial and industrial | 8,218,468 | 9,271,565 | 8,127,334 | 8,127,334 | 7,063,034 | 7,063,034 | 8,553,679 | 8,553,679 | ||||||||
A-9
Table of Contents
Maturities and Sensitivities of Loans to Changes in Interest Rates
The following table shows the maturities of our loan portfolio at March 31, 2005:
Old Classification
| Maturity | ||||||||||||
One year or less (Restated) | One to five years (Restated) | Over five years (Restated) | Total (Restated) | |||||||||
| (in millions) | ||||||||||||
Domestic: | ||||||||||||
Manufacturing | ¥ | 3,921,932 | ¥ | 1,259,328 | ¥ | 158,674 | ¥ | 5,339,934 | ||||
Construction | 588,798 | 180,105 | 46,148 | 815,051 | ||||||||
Real estate | 1,270,141 | 1,228,923 | 1,657,911 | 4,156,975 | ||||||||
Services | 1,697,539 | 1,039,287 | 465,426 | 3,202,252 | ||||||||
Wholesale and retail | 3,248,441 | 1,302,607 | 104,086 | 4,655,134 | ||||||||
Banks and other financial institutions | 1,281,613 | 794,358 | 288,533 | 2,364,504 | ||||||||
Other industries | 4,443,696 | 858,939 | 224,248 | 5,526,883 | ||||||||
Consumer: | ||||||||||||
Installment loans to individuals | 423,392 | 1,700,227 | 5,000,143 | 7,123,762 | ||||||||
Other | 442,707 | 42,265 | 54,075 | 539,047 | ||||||||
| 866,099 | 1,742,492 | 5,054,218 | 7,662,809 | |||||||||
Total domestic | 17,318,259 | 8,406,039 | 7,999,244 | 33,723,542 | ||||||||
Foreign | 4,764,486 | 2,839,715 | 2,110,718 | 9,714,919 | ||||||||
Total | ¥ | 22,082,745 | ¥ | 11,245,754 | ¥ | 10,109,962 | ¥ | 43,438,461 | ||||
New Classification
| Maturity | ||||||||||||
One year or less (Restated) | One to five years (Restated) | Over five years (Restated) | Total (Restated) | |||||||||
| (in millions) | ||||||||||||
Domestic: | ||||||||||||
Manufacturing | ¥ | 3,882,588 | ¥ | 1,245,743 | ¥ | 152,224 | ¥ | 5,280,555 | ||||
Construction | 588,798 | 180,105 | 46,148 | 815,051 | ||||||||
Real estate | 1,270,141 | 1,228,923 | 1,657,911 | 4,156,975 | ||||||||
Services | 1,512,003 | 988,110 | 465,659 | 2,965,772 | ||||||||
Wholesale and retail | 3,183,995 | 1,252,976 | 90,408 | 4,527,379 | ||||||||
Banks and other financial institutions | 1,281,613 | 794,358 | 288,533 | 2,364,504 | ||||||||
Communication and information services | 450,725 | 129,792 | 25,393 | 605,910 | ||||||||
Other industries | 4,282,297 | 843,540 | 218,750 | 5,344,587 | ||||||||
Consumer: | ||||||||||||
Installment loans to individuals | 423,392 | 1,700,227 | 5,000,143 | 7,123,762 | ||||||||
Other | 442,707 | 42,265 | 54,075 | 539,047 | ||||||||
| 866,099 | 1,742,492 | 5,054,218 | 7,662,809 | |||||||||
Total domestic | 17,318,259 | 8,406,039 | 7,999,244 | 33,723,542 | ||||||||
Foreign | 4,764,486 | 2,839,715 | 2,110,718 | 9,714,919 | ||||||||
Total | ¥ | 22,082,745 | ¥ | 11,245,754 | ¥ | 10,109,962 | ¥ | 43,438,461 | ||||
A-10
Table of Contents
Subsequent to the filing of our Annual Report on Form 20-F for the fiscal year ended March 31, 2005, management determined that the details of the maturities of our loan portfolio for the fiscal year ended March 31, 2005 were erroneously disclosed. As a result, such amounts have been restated from the amounts previously reported as follows.
Old Classification
| Maturity | ||||||||||||||||||
| One year or less | One to five years | Over five years | ||||||||||||||||
| As previously reported | As restated | As previously reported | As restated | As previously reported | As restated | |||||||||||||
| (in millions) | ||||||||||||||||||
Domestic: | ||||||||||||||||||
Banks and other financial institutions | ¥ | 1,364,552 | ¥ | 1,281,613 | ¥ | 794,358 | ¥ | 794,358 | ¥ | 288,533 | ¥ | 288,533 | ||||||
Other industries | 4,360,757 | 4,443,696 | 858,939 | 858,939 | 224,248 | 224,248 | ||||||||||||
Consumer: | ||||||||||||||||||
Installment loans to individuals | 418,739 | 423,392 | 1,682,370 | 1,700,227 | 5,022,653 | 5,000,143 | ||||||||||||
New Classification
| Maturity | ||||||||||||||||||
| One year or less | One to five years | Over five years | ||||||||||||||||
| As previously reported | As restated | As previously reported | As restated | As previously reported | As restated | |||||||||||||
| (in millions) | ||||||||||||||||||
Domestic: | ||||||||||||||||||
Banks and other financial institutions | ¥ | 1,364,552 | ¥ | 1,281,613 | ¥ | 794,358 | ¥ | 794,358 | ¥ | 288,533 | ¥ | 288,533 | ||||||
Other industries | 4,199,358 | 4,282,297 | 843,540 | 843,540 | 218,750 | 218,750 | ||||||||||||
Consumer: | ||||||||||||||||||
Installment loans to individuals | 418,739 | 423,392 | 1,682,370 | 1,700,227 | 5,022,653 | 5,000,143 | ||||||||||||
The above loans due after one year which had predetermined interest rates and floating or adjustable interest rates at March 31, 2005 are shown below.
| Domestic (Restated) | Foreign | Total (Restated) | |||||||
| (in millions) | |||||||||
Predetermined rate | ¥ | 7,123,727 | ¥ | 1,774,911 | ¥ | 8,898,638 | |||
Floating or adjustable rate | 9,281,556 | 3,175,522 | 12,457,078 | ||||||
Total | ¥ | 16,405,283 | ¥ | 4,950,433 | ¥ | 21,355,716 | |||
Subsequent to the filing of our Annual Report on Form 20-F for the fiscal year ended March 31, 2005, management determined that the details of the loans due after one year which had predetermined interest rates for the fiscal year ended March 31, 2005 were erroneously disclosed. As a result, such amounts have been restated from the amounts previously reported as follows.
| Domestic | ||||||
| As previously reported | As restated | |||||
| (in millions) | ||||||
Predetermined rate | ¥ | 7,128,380 | ¥ | 7,123,727 | ||
A-11
Table of Contents
Nonaccrual, Past Due and Restructured Loans
We generally discontinue the accrual of interest income on loans when substantial doubt exists as to the full and timely collection of either principal or interest, or when principal or interest is contractually past due one month or more with respect to loans of us and certain domestic subsidiaries, and 90 days or more with respect to loans of certain foreign subsidiaries.
The following table shows the distribution of our nonaccrual loans, restructured loans and accruing loans which are contractually past due 90 days or more as to principal or interest payments at March 31 of each of the five fiscal years ended March 31, 2005, based on the domicile and type of industry of the borrowers:
| At March 31, | ||||||||||||||||||||||||
| 2001 | 2002 | 2003 | 2004 | 2005 | ||||||||||||||||||||
Old classification | Old classification | Old classification | New classification | Old classification | New classification | Old classification | New classification | |||||||||||||||||
| (in millions) | ||||||||||||||||||||||||
Nonaccrual loans: | ||||||||||||||||||||||||
Domestic: | ||||||||||||||||||||||||
Manufacturing | ¥ | 109,726 | ¥ | 115,383 | ¥ | 74,609 | ¥ | 73,635 | ¥ | 99,069 | ¥ | 98,856 | ¥ | 77,999 | ¥ | 77,768 | ||||||||
Construction | 165,991 | 142,867 | 62,951 | 62,951 | 42,619 | 42,619 | 38,755 | 38,755 | ||||||||||||||||
Real estate | 618,146 | 511,435 | 198,792 | 198,792 | 125,405 | 125,405 | 92,623 | 92,623 | ||||||||||||||||
Services | 188,598 | 149,517 | 63,765 | 65,506 | 34,648 | 39,514 | 96,278 | 94,517 | ||||||||||||||||
Wholesale and retail | 214,691 | 223,786 | 209,645 | 195,423 | 93,637 | 84,095 | 83,564 | 74,435 | ||||||||||||||||
Banks and other financial institutions | 87,703 | 46,115 | 15,016 | 15,016 | 15,789 | 15,789 | 4,346 | 4,346 | ||||||||||||||||
Communication and information services | — | — | — | 13,863 | — | 5,128 | — | 11,379 | ||||||||||||||||
Other industries | 30,423 | 27,250 | 31,346 | 30,938 | 14,744 | 14,505 | 13,537 | 13,279 | ||||||||||||||||
Consumer | 161,665 | 157,241 | 147,110 | 147,110 | 137,690 | 137,690 | 115,811 | 115,811 | ||||||||||||||||
Total domestic | 1,576,943 | 1,373,594 | 803,234 | 803,234 | 563,601 | 563,601 | 522,913 | 522,913 | ||||||||||||||||
Foreign: | ||||||||||||||||||||||||
Governments and official institutions | 2,336 | 3,341 | 1,734 | 1,734 | 877 | 877 | 455 | 455 | ||||||||||||||||
Banks and other financial institutions | 7,829 | 8,393 | 7,694 | 7,694 | 84,623 | 84,623 | 45,091 | 45,091 | ||||||||||||||||
Commercial and industrial | 148,966 | 220,166 | 251,110 | 251,110 | 127,423 | 127,423 | 54,408 | 54,408 | ||||||||||||||||
Other | 23,321 | 1,871 | 5,350 | 5,350 | 13,942 | 13,942 | 8,252 | 8,252 | ||||||||||||||||
Total foreign | 182,452 | 233,771 | 265,888 | 265,888 | 226,865 | 226,865 | 108,206 | 108,206 | ||||||||||||||||
Total | 1,759,395 | 1,607,365 | 1,069,122 | 1,069,122 | 790,466 | 790,466 | 631,119 | 631,119 | ||||||||||||||||
Restructured loans: | ||||||||||||||||||||||||
Domestic | 1,574,503 | 1,522,078 | 945,261 | 945,261 | 381,063 | 381,063 | 343,557 | 343,557 | ||||||||||||||||
Foreign | 86,983 | 97,052 | 83,193 | 83,193 | 45,739 | 45,739 | 21,729 | 21,729 | ||||||||||||||||
Total | 1,661,486 | 1,619,130 | 1,028,454 | 1,028,454 | 426,802 | 426,802 | 365,286 | 365,286 | ||||||||||||||||
Accruing loans contractually past due 90 days or more: | ||||||||||||||||||||||||
Domestic | 23,254 | 15,023 | 15,212 | 15,212 | 11,092 | 11,092 | 9,232 | 9,232 | ||||||||||||||||
Foreign | 2,008 | 2,763 | 2,866 | 2,866 | 887 | 887 | 878 | 878 | ||||||||||||||||
Total | 25,262 | 17,786 | 18,078 | 18,078 | 11,979 | 11,979 | 10,110 | 10,110 | ||||||||||||||||
Total | ¥ | 3,446,143 | ¥ | 3,244,281 | ¥ | 2,115,654 | ¥ | 2,115,654 | ¥ | 1,229,247 | ¥ | 1,229,247 | ¥ | 1,006,515 | ¥ | 1,006,515 | ||||||||
Notes:
| (1) | The above table does not include real estate acquired in full or partial satisfaction of debt and certain assets under the management of the Cooperative Credit Purchasing Company which are recorded at estimated fair value less estimated cost to sell. |
| (2) | Domestic nonaccrual loans within the “consumer” category in the above table include loans to individuals who utilize loan proceeds to finance their proprietor activities and not for their personal financing needs. During the fiscal year ended March 31, 2004, our credit |
A-12
Table of Contents
administration system was upgraded and became able to present a precise breakdown of the balance of such consumer loans by the type of proprietor business. This breakdown at March 31, 2004 and 2005 is presented below in accordance with our new classification: |
| Manufacturing | Construction | Real estate | Services | Wholesale and retail | Banks and other financial institutions | Communication and information services | Other industries | Total included in Consumer | |||||||||||||||||||
| (in millions) | |||||||||||||||||||||||||||
March 31, 2004 | ¥ | 1,566 | ¥ | 877 | ¥ | 52,271 | ¥ | 14,203 | ¥ | 5,765 | ¥ | 21 | ¥ | 264 | ¥ | — | ¥ | 74,967 | |||||||||
March 31, 2005 | ¥ | 1,345 | ¥ | 986 | ¥ | 43,334 | ¥ | 13,692 | ¥ | 3,185 | ¥ | 18 | ¥ | 219 | ¥ | 378 | ¥ | 63,157 | |||||||||
| Since the system upgrade was effective during the fiscal year ended March 31, 2004, no equivalent information is obtainable for prior fiscal year-end dates. |
Gross interest income which would have been accrued at the original terms on domestic nonaccrual and restructured loans outstanding during the fiscal year ended March 31, 2005 was approximately ¥21.1 billion, of which ¥16.6 billion was included in the results of operations for the fiscal year. Gross interest income which would have been accrued at the original terms on foreign nonaccrual and restructured loans outstanding for the fiscal year ended March 31, 2005 was approximately ¥6.6 billion, of which ¥4.4 billion was included in the results of operations for the fiscal year.
Foreign Loans Outstanding
We had no cross-border outstandings to borrowers in any foreign country in which total exceeded 0.75% of consolidated total assets at March 31, 2003, 2004 and 2005. Cross-border outstandings are defined, for this purpose, as loans (including accrued interest), acceptances, interest-earning deposits with other banks, other interest-earning investments and any other monetary assets denominated in Japanese yen or other non-local currencies. Material local currency loans outstanding which are neither hedged nor funded by local currency borrowings are included in cross-border outstandings.
Guarantees of outstandings of borrowers of other countries are considered to be outstandings of the guarantor. Loans made to, or deposits placed with, a branch of a foreign bank located outside the foreign bank’s home country are considered to be loans to, or deposits with, the foreign bank. Outstandings of a country do not include principal or interest amounts of which are supported by written, legally enforceable guarantees by guarantors of other countries or the amounts of outstandings to the extent that they are secured by tangible, liquid collateral held and realizable by us and our subsidiaries outside the country in which they operate.
In addition to credit risk, cross-border outstandings are subject to country risk that as a result of political or economic conditions in a country, borrowers may be unable or unwilling to pay principal and interest according to contractual terms. Other risks related to cross-border outstandings include the possibility of insufficient foreign exchange and restrictions on its availability.
In order to manage country risk, we establish various risk management measures internally. Among other things, we first regularly monitor economic conditions and other factors globally and assess country risk in each country where we have cross-border exposure. For purposes of monitoring and controlling the amount of credit exposed to country risk, we set a country limit, the maximum amount of credit exposure for an individual country, in consideration of the level of country risk and our ability to bear such potential risk. We also determine our credit policy for each country in accordance with our country risk level and our business plan with regard to the country. Assessment of country risk, establishment of country limits, and determination of country credit policies are subject to review and approval by our senior management and are updated periodically.
Exposure to East Asia
We maintain a substantial network of branches and subsidiaries in East Asia and the region has been an important market for our financial services. Certain economies in this region are growing at a rapid pace and are
A-13
Table of Contents
not always stable. Accordingly, we are exposed to country risk in this region to a greater extent than in developed countries. In response to on-going and possible developments in the regional economy, we regularly reassess the country risk of each country in the region, to adjust exposure levels, and to review and revise country credit policies.
The following table represents our cross-border outstandings and unused commitments at March 31, 2004 and 2005, to certain East Asian countries:
| At March 31, | ||||||||||||
| 2004 | 2005 | |||||||||||
Cross-border outstanding | Unused commitments | Cross-border outstanding | Unused commitments | |||||||||
| (in billions) | ||||||||||||
Hong Kong | ¥ | 300.6 | ¥ | — | ¥ | 325.4 | ¥ | — | ||||
People’s Repubulic of China | 194.6 | 0.7 | 277.4 | — | ||||||||
Singapore | 211.4 | 1.6 | 271.9 | — | ||||||||
Thailand | 145.6 | 4.4 | 224.1 | 1.0 | ||||||||
South Korea | 191.1 | 0.5 | 221.3 | 4.8 | ||||||||
Malaysia | 84.7 | 1.0 | 88.1 | — | ||||||||
Philippines | 41.2 | — | 42.4 | — | ||||||||
Indonesia | 22.5 | — | 29.1 | — | ||||||||
Exposure to Latin America
Similar to the economies in East Asia, economic growth together with instability has been observed in the Latin America region. The following is a summary of cross-border outstandings to counterparties in major Latin American countries at March 31, 2004 and 2005:
| At March 31, | ||||||
| 2004 | 2005 | |||||
| (in billions) | ||||||
Brazil | ¥ | 82.0 | ¥ | 71.5 | ||
Mexico | 45.0 | 46.4 | ||||
Argentina | 18.2 | 0.9 | ||||
Loan Concentrations
At March 31, 2005, there were no concentrations of loans to a single industry group of borrowers, as defined by the Bank of Japan industry segment loan classifications, which exceeded 10% of our consolidated total loans, except for loans in a category disclosed in the table of loans outstanding above.
Credit Risk Management
We have a credit rating system, under which borrowers and transactions are graded on a worldwide basis. We calculate probability of default by statistical means and manage our credit portfolio based on this credit rating system. For a detailed description of this system and other elements of our risk management structure, see “Item 11. Quantitative and Qualitative Disclosures about Credit, Market and Other Risk—Credit Risk Management.”
A-14
Table of Contents
IV. Summary of Loan Loss Experience
The following table shows an analysis of our loan loss experience by type of borrowers’ business for each of the five fiscal years ended March 31, 2005:
| Fiscal years ended March 31, | ||||||||||||||||||||||||||||||||
| 2001 | 2002 | 2003 | 2004 | 2005 | ||||||||||||||||||||||||||||
Old classification | Old classification | Old classification | New classification | Old classification | New classification | Old classification | New classification | |||||||||||||||||||||||||
| (in millions, except percentages) | ||||||||||||||||||||||||||||||||
Allowance for credit losses at beginning of fiscal year | ¥ | 1,137,181 | ¥ | 1,385,010 | ¥ | 1,341,608 | ¥ | 1,341,608 | ¥ | 1,058,633 | ¥ | 1,058,633 | ¥ | 649,346 | ¥ | 649,346 | ||||||||||||||||
Provision (credit) for credit losses | 652,728 | 466,947 | 287,282 | 287,282 | (142,362 | ) | (142,362 | ) | 125,109 | 125,109 | ||||||||||||||||||||||
Charge-offs: | ||||||||||||||||||||||||||||||||
Domestic: | ||||||||||||||||||||||||||||||||
Manufacturing | 26,254 | 45,226 | 65,823 | 65,671 | 17,224 | 17,142 | 67,922 | 67,917 | ||||||||||||||||||||||||
Construction | 39,447 | 24,063 | 48,559 | 48,559 | 31,226 | 31,226 | 6,729 | 6,729 | ||||||||||||||||||||||||
Real estate | 96,371 | 112,757 | 181,203 | 181,203 | 46,975 | 46,975 | 33,322 | 33,322 | ||||||||||||||||||||||||
Services | 52,535 | 35,349 | 40,599 | 45,946 | 13,646 | 14,274 | 7,711 | 7,646 | ||||||||||||||||||||||||
Wholesale and retail | 134,381 | 80,622 | 105,952 | 98,106 | 42,115 | 39,387 | 26,249 | 25,185 | ||||||||||||||||||||||||
Banks and other financial institutions | 15,815 | 60,333 | 18,945 | 18,945 | 1,123 | 1,123 | 8,920 | 8,920 | ||||||||||||||||||||||||
Communication and information services | — | — | — | 4,865 | — | 2,256 | — | 1,265 | ||||||||||||||||||||||||
Other industries | 4,469 | 5,236 | 24,781 | 22,567 | 5,978 | 5,904 | 4,636 | 4,505 | ||||||||||||||||||||||||
Consumer | 33,725 | 43,059 | 38,042 | 38,042 | 48,620 | 48,620 | (2) | 26,044 | 26,044 | (2) | ||||||||||||||||||||||
Total domestic | 402,997 | 406,645 | 523,904 | 523,904 | 206,907 | 206,907 | 181,533 | 181,533 | ||||||||||||||||||||||||
Total foreign | 77,050 | 107,344 | 116,218 | 116,218 | 70,806 | 70,876 | 52,094 | 52,094 | ||||||||||||||||||||||||
Total | 480,047 | 513,989 | 640,122 | 640,122 | 277,713 | 277,713 | 233,627 | 233,627 | ||||||||||||||||||||||||
Recoveries: | ||||||||||||||||||||||||||||||||
Domestic | 16,341 | 30,865 | 49,074 | 49,074 | 11,337 | 11,337 | 14,284 | 14,284 | ||||||||||||||||||||||||
Foreign | 18,439 | 17,944 | 17,574 | 17,574 | 18,699 | 18,699 | 9,592 | 9,592 | ||||||||||||||||||||||||
Total | 34,780 | 48,809 | 66,648 | 66,648 | 30,036 | 30,036 | 23,876 | 23,876 | ||||||||||||||||||||||||
Net charge-offs | 445,267 | 465,180 | 573,474 | 573,474 | 247,677 | 247,677 | 209,751 | 209,751 | ||||||||||||||||||||||||
Others(1) | 40,368 | 12,333 | 3,217 | 3,217 | (19,248 | ) | (19,248 | ) | 3,781 | 3,781 | ||||||||||||||||||||||
The deconsolidation of Nippon Trust Bank | — | (57,502 | ) | — | — | — | — | — | — | |||||||||||||||||||||||
Allowance for credit losses at end of fiscal year | ¥ | 1,385,010 | ¥ | 1,341,608 | ¥ | 1,058,633 | ¥ | 1,058,633 | ¥ | 649,346 | ¥ | 649,346 | ¥568,485 | ¥568,485 | ||||||||||||||||||
Allowance for credit losses applicable to foreign activities: | ||||||||||||||||||||||||||||||||
Balance at beginning of fiscal year | ¥ | 156,576 | ¥ | 198,820 | ¥ | 224,830 | ¥ | 224,830 | ¥ | 226,612 | ¥ | 226,612 | ¥ | 194,714 | ¥ | 194,714 | ||||||||||||||||
Balance at end of fiscal year | ¥ | 198,820 | ¥ | 224,830 | ¥ | 226,612 | ¥ | 226,612 | ¥ | 194,714 | ¥ | 194,714 | ¥ | 87,315 | ¥ | 87,315 | ||||||||||||||||
Provision (credit) for credit losses | ¥ | 89,859 | ¥ | 110,898 | ¥ | 112,761 | ¥ | 112,761 | ¥ | 32,304 | ¥ | 32,304 | ¥ | (67,689 | ) | ¥ | (67,689 | ) | ||||||||||||||
Ratio of net charge-offs during the fiscal year to average loans outstanding during the fiscal year | 1.10 | % | 1.18 | % | 1.41 | % | 1.41 | % | 0.61 | % | 0.61 | % | 0.49 | % | 0.49 | % | ||||||||||||||||
Notes:
| (1) | Others primarily include foreign exchange translation and discontinued operations adjustments. |
| (2) | Charge-offs of domestic loans within the “consumer” category in the above table include charge-offs of loans to individuals who utilize loan proceeds to finance their proprietor activities and not for their personal financing needs. During the fiscal year ended March 31, |
A-15
Table of Contents
2004, our credit administration system was upgraded and became able to present a precise breakdown of charge-offs of such consumer loans by the type of proprietor business. This breakdown for the fiscal years ended March 31, 2004 and 2005 is presented below in accordance with our new classification: |
| Manufacturing | Construction | Real estate | Services | Wholesale and retail | Banks and other financial institutions | Communication and information services | Other industries | Total included in Consumer | |||||||||||||||||||
| (in millions) | |||||||||||||||||||||||||||
March 31, 2004 | ¥ | 39 | ¥ | — | ¥ | 9,481 | ¥ | 2,270 | ¥ | 486 | ¥ | — | ¥ | — | ¥ | 108 | ¥ | 12,384 | |||||||||
March 31, 2005 | ¥ | — | ¥ | — | ¥ | 450 | ¥ | 137 | ¥ | — | ¥ | — | ¥ | — | ¥ | 64 | ¥ | 651 | |||||||||
| Since the system upgrade was effective during the fiscal year ended March 31, 2004, no equivalent information is obtainable for prior fiscal years. |
The following table shows an allocation of our allowance for credit losses at March 31 of each of the five fiscal years ended March 31, 2005:
| At March 31, | ||||||||||||||||||||||||||||||||||||||||||||||||||||||||
| 2001 | 2002 | 2003 | 2004 | 2005 | ||||||||||||||||||||||||||||||||||||||||||||||||||||
Old Classification | Old Classification | Old Classification | New Classification | Old Classification | New Classification | Old Classification | New Classification | |||||||||||||||||||||||||||||||||||||||||||||||||
| Amount | % of loans in each category to total loans (Restated) | Amount | % of loans in each category to total loans (Restated) | Amount | % of loans in each category to total loans (Restated) | Amount | % of loans in each category to total loans (Restated) | Amount | % of loans in each category to total loans | Amount | % of loans in each category to total loans | Amount | % of loans in each category to total loans | Amount | % of loans in each category to total loans | |||||||||||||||||||||||||||||||||||||||||
| (in millions, except percentages) | ||||||||||||||||||||||||||||||||||||||||||||||||||||||||
Domestic: | ||||||||||||||||||||||||||||||||||||||||||||||||||||||||
Manufacturing | ¥ | 141,871 | 13.01 | % | ¥ | 138,706 | 12.38 | % | ¥ | 112,713 | 11.97 | % | ¥ | 111,089 | 11.78 | % | ¥ | 72,977 | 11.90 | % | ¥ | 72,552 | 11.75 | % | ¥ | 63,772 | 12.29 | % | ¥ | 63,417 | 12.16 | % | ||||||||||||||||||||||||
Construction | 93,767 | 3.48 | 106,573 | 2.98 | 54,497 | 2.49 | 54,497 | 2.49 | 15,174 | 2.08 | 15,174 | 2.08 | 35,179 | 1.88 | 35,179 | 1.88 | ||||||||||||||||||||||||||||||||||||||||
Real estate | 374,555 | 9.89 | 367,315 | 8.81 | 181,780 | 8.11 | 181,780 | 8.11 | 90,667 | 8.80 | 90,667 | 8.80 | 74,019 | 9.57 | 74,019 | 9.57 | ||||||||||||||||||||||||||||||||||||||||
Services | 132,256 | 9.28 | 124,118 | 8.76 | 96,428 | 10.75 | 100,968 | 10.61 | 41,518 | 9.76 | 44,737 | 9.16 | 91,153 | 7.37 | 85,939 | 6.83 | ||||||||||||||||||||||||||||||||||||||||
Wholesale and retail | 187,731 | 14.19 | 198,223 | 12.53 | 173,787 | 12.19 | 163,546 | 11.80 | 83,000 | 11.13 | 75,961 | 10.79 | 80,333 | 10.72 | 74,710 | 10.42 | ||||||||||||||||||||||||||||||||||||||||
Banks and other financial institutions | 55,350 | 4.74 | 36,940 | 5.11 | 37,648 | 4.26 | 37,648 | 4.26 | 19,301 | 4.20 | 19,301 | 4.20 | 16,473 | 5.44 | 16,473 | 5.44 | ||||||||||||||||||||||||||||||||||||||||
Communication and information services | — | — | — | — | — | — | 18,331 | 3.16 | — | — | 5,927 | 1.63 | — | — | 12,348 | 1.39 | ||||||||||||||||||||||||||||||||||||||||
Other industries | 37,725 | 3.95 | 37,132 | 6.78 | 57,299 | 9.04 | 46,293 | 6.60 | 31,900 | 12.43 | 30,218 | 11.89 | 35,361 | 12.72 | 34,205 | 12.30 | ||||||||||||||||||||||||||||||||||||||||
Consumer | 104,775 | 16.83 | 85,141 | 16.54 | 94,559 | 17.71 | 94,559 | 17.71 | 81,567 | 18.92 | 81,567 | * | 18.92 | 76,263 | 17.64 | 76,263 | 17.64 | |||||||||||||||||||||||||||||||||||||||
Foreign: | ||||||||||||||||||||||||||||||||||||||||||||||||||||||||
Governments and official institutions | 16,868 | 0.74 | 32,925 | 0.75 | 2,227 | 0.57 | 2,227 | 0.57 | 1,122 | 0.45 | 1,122 | 0.45 | 170 | 0.48 | 170 | 0.48 | ||||||||||||||||||||||||||||||||||||||||
Banks and other financial institutions | 8,156 | 1.45 | 6,668 | 1.20 | 5,275 | 1.94 | 5,275 | 1.94 | 58,198 | 2.26 | 58,198 | 2.26 | 8,502 | 1.80 | 8,502 | 1.80 | ||||||||||||||||||||||||||||||||||||||||
Commercial and industrial | 161,628 | 20.44 | 176,265 | 22.58 | 202,642 | 20.30 | 202,642 | 20.30 | 129,004 | 17.68 | 129,004 | 17.68 | 70,046 | 19.69 | 70,046 | 19.69 | ||||||||||||||||||||||||||||||||||||||||
Other | 12,168 | 2.00 | 8,972 | 1.58 | 16,468 | 0.67 | 16,468 | 0.67 | 6,390 | 0.39 | 6,390 | 0.39 | 8,597 | 0.40 | 8,597 | 0.40 | ||||||||||||||||||||||||||||||||||||||||
Unallocated | 58,160 | — | 22,630 | — | 23,310 | — | 23,310 | — | 18,528 | — | 18,528 | — | 8,617 | — | 8,617 | — | ||||||||||||||||||||||||||||||||||||||||
Total | ¥ | 1,385,010 | 100.00 | % | ¥ | 1,341,608 | 100.00 | % | ¥ | 1,058,633 | 100.00 | % | ¥ | 1,058,633 | 100.00 | % | ¥ | 649,346 | 100.00 | % | ¥ | 649,346 | 100.00 | % | ¥ | 568,485 | 100.00 | % | ¥ | 568,485 | 100.00 | % | ||||||||||||||||||||||||
Allowance as a percentage of loans | 3.45 | % | 3.27 | % | 2.65 | % | 2.65 | % | 1.63 | % | 1.63 | % | 1.31 | % | 1.31 | % | ||||||||||||||||||||||||||||||||||||||||
Allowance as a percentage of nonaccrual and restructured loans and accruing loans contractually past due 90 days or more | 40.19 | % | 41.35 | % | 50.04 | % | 50.04 | % | 52.82 | % | 52.82 | % | 56.48 | % | 56.48 | % | ||||||||||||||||||||||||||||||||||||||||
A-16
Table of Contents
| * | The credit loss allowance for domestic loans within the “consumer” category in the above table include the credit loss allowance for loans to individuals who utilize loan proceeds to finance their proprietor activities and not for their personal financing needs. During the fiscal year ended March 31, 2004, our credit administration system was upgraded and became able to present a precise breakdown of the balance of the credit loss allowance for such consumer loans by the type of proprietor business. This breakdown at March 31, 2004 and 2005 is presented below in accordance with our new classification: |
| Manufacturing | Construction | Real estate | Services | Wholesale and retail | Banks and other financial institutions | Communication and information services | Other industries | Total included in Consumer | |||||||||||||||||||
| (in millions) | |||||||||||||||||||||||||||
March 31, 2004 | ¥ | 292 | ¥ | 196 | ¥ | 7,671 | ¥ | 2,371 | ¥ | 554 | ¥ | 13 | ¥ | 42 | ¥ | 104 | ¥ | 11,243 | |||||||||
March 31, 2005 | ¥ | 211 | ¥ | 146 | ¥ | 4,962 | ¥ | 1,769 | ¥ | 363 | ¥ | 12 | ¥ | 35 | ¥ | 70 | ¥ | 7,568 | |||||||||
Since the system upgrade was effective during the fiscal year ended March 31, 2004, no equivalent information is obtainable for prior fiscal year-end dates.
Subsequent to the filing of our Annual Report on Form 20-F for the fiscal year ended March 31, 2005, management determined that % of loans in each category to total loans at March 31 of each of five fiscal years ended March 31, 2005 were erroneously disclosed. As a result, such amounts have been restated from the amounts previously reported as follows:
As previously reported
| 2001 | 2002 | 2003 | 2004 | 2005 | ||||||||||||
| Old classification | Old classification | Old classification | New classification | Old classification | New classification | Old classification | New classification | |||||||||
% of loans in to total | % of loans in to total | % of loans in to total | % of loans in to total | % of loans in to total | % of loans in to total | % of loans in to total | % of loans in to total | |||||||||
| (in millions, except percentages) | ||||||||||||||||
Domestic: | ||||||||||||||||
Banks and other financial institutions | 5.01 | 5.36 | 4.50 | 4.50 | 4.42 | 4.42 | 5.63 | 5.63 | ||||||||
Other industries | 3.95 | 6.78 | 9.04 | 6.60 | 12.43 | 11.89 | 12.53 | 12.11 | ||||||||
Consumer | 16.56 | 16.29 | 17.47 | 17.47 | 18.70 | 18.70 | 17.64 | 17.64 | ||||||||
Foreign: | ||||||||||||||||
Banks and other financial institutions | 1.45 | 1.20 | 1.94 | 1.94 | 2.26 | 2.26 | 2.48 | 2.48 | ||||||||
Commercial and industrial | 20.44 | 22.58 | 20.30 | 20.30 | 17.68 | 17.68 | 19.01 | 19.01 | ||||||||
A-17
Table of Contents
As Restated
| 2001 | 2002 | 2003 | 2004 | 2005 | ||||||||||||
| Old Classification | Old Classification | Old Classification | New Classification | Old Classification | New Classification | Old Classification | New Classification | |||||||||
% of loans in each to total loans | % of loans in each to total loans | % of loans in each to total loans | % of loans in each to total loans | % of loans in each to total loans | % of loans in each to total loans | % of loans in each to total loans | % of loans in each to total loans | |||||||||
| (in millions, except percentages) | ||||||||||||||||
Domestic: | ||||||||||||||||
Banks and other financial institutions | 4.74 | 5.11 | 4.26 | 4.26 | 4.20 | 4.20 | 5.44 | 5.44 | ||||||||
Other industries | 3.95 | 6.78 | 9.04 | 6.60 | 12.43 | 11.89 | 12.72 | 12.30 | ||||||||
Consumer | 16.83 | 16.54 | 17.71 | 17.71 | 18.92 | 18.92 | 17.64 | 17.64 | ||||||||
Foreign: | ||||||||||||||||
Banks and other financial institutions | 1.45 | 1.20 | 1.94 | 1.94 | 2.26 | 2.26 | 1.80 | 1.80 | ||||||||
Commercial and industrial | 20.44 | 22.58 | 20.30 | 20.30 | 17.68 | 17.68 | 19.69 | 19.69 | ||||||||
While the allowance for credit losses contains amounts allocated to components of specifically identified loans as well as a group on portfolio of loans, the allowance for credit losses is available for credit losses in the entire loan portfolio and the allocations shown above are not intended to be restricted to the specific loan category. Accordingly, as the evaluation of credit risks changes, allocations of the allowance will be changed to reflect current conditions and various other factors.
V. Deposits
The following table shows the average amount of, and the average rate paid on, the following deposit categories for the fiscal years ended March 31, 2003, 2004 and 2005:
| Fiscal years ended March 31, | ||||||||||||||||||
| 2003 | 2004 | 2005 | ||||||||||||||||
Average amount | Average rate | Average amount | Average rate | Average amount | Average rate | |||||||||||||
| (in millions, except percentages) | ||||||||||||||||||
Domestic offices: | ||||||||||||||||||
Non-interest-bearing demand deposits | ¥ | 3,318,708 | — | % | ¥ | 4,446,701 | — | % | ¥ | 4,764,551 | — | % | ||||||
Interest-bearing demand deposits | 20,005,618 | 0.02 | 22,332,657 | 0.02 | 23,745,558 | 0.02 | ||||||||||||
Deposits at notice | 1,377,800 | 0.82 | 1,579,007 | 0.64 | 1,251,744 | 0.78 | ||||||||||||
Time deposits | 16,525,519 | 0.24 | 16,104,461 | 0.16 | 16,127,396 | 0.22 | ||||||||||||
Certificates of deposit | 1,667,097 | 0.02 | 1,838,599 | 0.01 | 1,542,182 | 0.02 | ||||||||||||
Foreign offices, principally from banks located in foreign countries: | ||||||||||||||||||
Non-interest-bearing demand deposits | 2,050,597 | — | 2,317,658 | — | 2,673,494 | — | ||||||||||||
Interest-bearing deposits, principally time deposits and certificates of deposit | 8,000,966 | 1.73 | 8,171,037 | 1.28 | 9,092,154 | 1.47 | ||||||||||||
Total | ¥ | 52,946,305 | ¥ | 56,790,120 | ¥ | 59,197,079 | ||||||||||||
A-18
Table of Contents
Deposits at notice represent interest-bearing demand deposits which require the depositor to give two or more days notice in advance of withdrawal.
The average amounts of total deposits by foreign depositors included in domestic offices for the fiscal years ended March 31, 2003, 2004 and 2005 were ¥665,349 million, ¥944,520 million and ¥703,742 million, respectively.
At March 31, 2005, the balance and remaining maturities of time deposits and certificates of deposit issued by domestic offices in amounts of ¥10 million (approximately US$93 thousand at the Federal Reserve Bank of New York’s noon buying rate on March 31, 2005) or more and total foreign deposits issued in amounts of US$100,000 or more are shown in the following table.
| Time deposits | Certificates of deposit | Total | |||||||
| (in millions) | |||||||||
Domestic offices: | |||||||||
Three months or less | ¥ | 4,921,331 | ¥ | 771,891 | ¥ | 5,693,222 | |||
Over three months through six months | 1,727,483 | 97,745 | 1,825,228 | ||||||
Over six months through twelve months | 1,733,087 | 67,094 | 1,800,181 | ||||||
Over twelve months | 843,508 | 10,080 | 853,588 | ||||||
Total | ¥ | 9,225,409 | ¥ | 946,810 | ¥ | 10,172,219 | |||
Foreign offices | ¥ | 6,612,024 | |||||||
Subsequent to the filing of our Annual Report on Form 20-F for the fiscal year ended March 31, 2004, management determined that the balance and remaining maturities of time deposits issued by domestic offices in amounts of ¥10 million (approximately US$96 thousand at the Federal Reserve Bank of New York ‘s noon buying rate on March 31, 2004) or more for the fiscal year ended March 31, 2004 were erroneously disclosed. As a result, such amounts have been restated from the amounts previously reported as follows:
| Time deposits | ||||||
| As previously reported | As restated | |||||
| (in millions) | ||||||
Domestic offices: | ||||||
Three months or less | ¥ | 5,233,694 | ¥ | 5,233,694 | ||
Over three months through six months | 1,646,800 | 1,551,763 | ||||
Over six months through twelve months | 1,721,359 | 1,721,359 | ||||
Over twelve months | 796,910 | 796,910 | ||||
Total | ¥ | 9,398,763 | ¥ | 9,303,726 | ||
A-19
Table of Contents
VI. Short-Term Borrowings
The following table shows certain additional information with respect to our short-term borrowings for the fiscal years ended March 31, 2003, 2004 and 2005:
| Fiscal years ended March 31, | ||||||||||||
| 2003 | 2004 | 2005 | ||||||||||
| (in millions, except percentages) | ||||||||||||
Call money, funds purchased, and payables under repurchase agreements and securities lending transactions: | ||||||||||||
Average balance outstanding during the fiscal year | ¥ | 6,346,192 | ¥ | 7,559,245 | ¥ | 8,626,850 | ||||||
Maximum balance outstanding at any month-end during the fiscal year | 15,521,522 | 9,060,163 | 9,955,766 | |||||||||
Balance at end of fiscal year | 6,901,929 | 6,815,125 | 6,231,125 | |||||||||
Weighted average interest rate during the fiscal year | 1.11 | % | 0.64 | % | 0.63 | % | ||||||
Weighted average interest rate on balance at end of fiscal year | 0.93 | % | 0.52 | % | 0.97 | % | ||||||
Other short-term borrowings: | ||||||||||||
Average balance outstanding during the fiscal year | ¥ | 1,521,078 | ¥ | 2,745,530 | ¥ | 8,105,687 | ||||||
Maximum balance outstanding at any month-end during the fiscal year | 1,790,728 | 4,379,446 | 11,227,440 | |||||||||
Balance at end of fiscal year | 1,542,609 | 4,379,446 | 9,631,568 | |||||||||
Weighted average interest rate during the fiscal year | 1.74 | % | 0.49 | % | 0.27 | % | ||||||
Weighted average interest rate on balance at end of fiscal year | 0.76 | % | 0.13 | % | 0.30 | % | ||||||
A-20
Table of Contents
INDEX TO CONSOLIDATED FINANCIAL STATEMENTS
F-1
Table of Contents
REPORT OF INDEPENDENT REGISTERED PUBLIC ACCOUNTING FIRM
The Bank of Tokyo-Mitsubishi UFJ, Ltd.
(Formerly, The Bank of Tokyo-Mitsubishi, Ltd.)
(Kabushiki Kaisha Mitsubishi Tokyo UFJ Ginko
(Formerly, Kabushiki Kaisha Tokyo Mitsubishi Ginko)):
We have audited the accompanying consolidated balance sheets of The Bank of Tokyo-Mitsubishi UFJ Ltd. (Kabushiki Kaisha Mitsubishi Tokyo UFJ Ginko) (“the Bank”) (formerly, The Bank of Tokyo-Mitsubishi, Ltd. (Kabushiki Kaisha Tokyo Mitsubishi Ginko)) (a wholly owned subsidiary of Mitsubishi UFJ Financial Group, Inc. (Formerly, Mitsubishi Tokyo Financial Group, Inc.)) and subsidiaries (together, the “Group”) as of March 31, 2004 and 2005, and the related consolidated statements of income, changes in equity from nonowner sources, shareholders’ equity, and cash flows for each of the three years in the period ended March 31, 2005 (all expressed in Japanese Yen). These financial statements are the responsibility of the Bank’s management. Our responsibility is to express an opinion on these financial statements based on our audits.
We conducted our audits in accordance with the standards of the Public Company Accounting Oversight Board (United States). Those standards require that we plan and perform the audit to obtain reasonable assurance about whether the financial statements are free of material misstatement. The Bank is not required to have, nor were we engaged to perform, an audit of its internal control over financial reporting. Our audits included consideration of internal control over financial reporting as a basis for designing audit procedures that are appropriate in the circumstances, but not for the purpose of expressing an opinion on the effectiveness of the Group’s internal control over financial reporting. Accordingly, we express no such opinion. An audit also includes examining, on a test basis, evidence supporting the amounts and disclosures in the financial statements, assessing the accounting principles used and significant estimates made by management, as well as evaluating the overall financial statement presentation. We believe that our audits provide a reasonable basis for our opinion.
In our opinion, such consolidated financial statements present fairly, in all material respects, the financial position of the Group as of March 31, 2004 and 2005, and the results of their operations and their cash flows for each of the three years in the period ended March 31, 2005, in conformity with accounting principles generally accepted in the United States of America.
As discussed in Notes 4, 5, 9, 10, 11 and 23 to the consolidated financial statements, the accompanying consolidated balance sheet at March 31, 2005 and certain footnotes to the consolidated financial statements have been restated.
As discussed in Note 1 to the consolidated financial statements, the Bank changed its method of accounting for goodwill and other intangible assets in the fiscal year ended March 31, 2003, and its method of accounting for variable interest entities in the fiscal year ended March 31, 2005.
/s/ Deloitte Touche Tohmatsu
DELOITTE TOUCHE TOHMATSU
Tokyo, Japan
August 23, 2005 (February 20, 2006 as to the effects of the restatement discussed in Notes 5, 10 and 23 and reclassifications described in Notes 3 and 29)
F-2
Table of Contents
THE BANK OF TOKYO-MITSUBISHI, LTD. AND SUBSIDIARIES
CONSOLIDATED BALANCE SHEETS
MARCH 31, 2004 AND 2005
| 2004 | 2005 | |||||||
| (in millions) | ||||||||
| ASSETS | ||||||||
Cash and due from banks (Note 10) | ¥ | 2,764,182 | ¥ | 4,027,982 | ||||
Interest-earning deposits in other banks (Note 10) | 3,185,696 | 3,922,612 | ||||||
Call loans and funds sold (Note 13) | 972,613 | 920,136 | ||||||
Receivables under resale agreements | 1,478,497 | 559,194 | ||||||
Receivables under securities borrowing transactions | 4,615,515 | 5,102,273 | ||||||
Trading account assets (including assets pledged that secured parties are permitted to sell or repledge of ¥2,219,093 million in 2004 and ¥2,269,235 million in 2005 (restated)) (Notes 3 and 10) | 8,037,863 | 7,373,679 | ||||||
Investment securities (Notes 4 and 10): | ||||||||
Securities available for sale—carried at estimated fair value (including assets pledged that secured parties are permitted to sell or repledge of ¥922,894 million in 2004 and ¥1,571,463 million in 2005 (restated)) | 20,286,766 | 21,492,172 | ||||||
Securities being held to maturity—carried at amortized cost (estimated fair value of ¥1,052,662 million in 2004 and ¥2,064,632 million in 2005) | 1,052,193 | 2,047,941 | ||||||
Other investment securities | 160,343 | 275,316 | ||||||
Total investment securities | 21,499,302 | 23,815,429 | ||||||
Loans, net of unearned income and deferred loan fees (including assets pledged that secured parties are permitted to sell or repledge of ¥683,068 million in 2004 and ¥917,092 million in 2005) (Notes 5 and 10) | 39,931,042 | 43,421,478 | ||||||
Allowance for credit losses (Notes 5 and 6) | (649,346 | ) | (568,485 | ) | ||||
Net loans | 39,281,696 | 42,852,993 | ||||||
Premises and equipment—net (Note 7) | 434,523 | 427,385 | ||||||
Accrued interest | 93,596 | 111,484 | ||||||
Customers’ acceptance liability | 30,149 | 43,313 | ||||||
Intangible assets (Note 8) | 198,306 | 216,134 | ||||||
Goodwill (Note 8) | 26,910 | 56,124 | ||||||
Deferred tax assets (Note 9) | 747,822 | 602,807 | ||||||
Other assets (Notes 5 and 16) | 1,691,882 | 2,018,754 | ||||||
Total | ¥ | 85,058,552 | ¥ | 92,050,299 | ||||
| LIABILITIES AND SHAREHOLDER’S EQUITY | ||||||||
Deposits (Note 10 and 11): | ||||||||
Domestic offices: | ||||||||
Non-interest-bearing | ¥ | 4,933,248 | ¥ | 6,869,628 | ||||
Interest-bearing | 41,794,074 | 40,912,615 | ||||||
Overseas offices: | ||||||||
Non-interest-bearing | 2,408,796 | 2,824,896 | ||||||
Interest-bearing | 9,402,876 | 9,768,817 | ||||||
Total deposits | 58,538,994 | 60,375,956 | ||||||
Debentures (Note 12) | 265,957 | — | ||||||
Call money and funds purchased (Notes 10 and 13) | 2,638,298 | 1,552,687 | ||||||
Payables under repurchase agreements (Note 10) | 2,739,396 | 2,696,498 | ||||||
Payables under securities lending transactions (Note 10) | 1,437,431 | 1,981,940 | ||||||
Other short-term borrowings (Notes 10 and 14) | 4,379,446 | 9,631,568 | ||||||
Trading account liabilities (Note 3) | 2,374,629 | 1,871,774 | ||||||
Obligations to return securities received as collateral (Note 3) | 2,324,598 | 3,025,817 | ||||||
Bank acceptances outstanding | 30,149 | 43,313 | ||||||
Accrued interest | 70,560 | 79,797 | ||||||
Long-term debt (Notes 10 and 14) | 5,086,993 | 5,196,388 | ||||||
Other liabilities (Notes 9, 15 and 16) | 2,399,968 | 2,427,976 | ||||||
Total liabilities | 82,286,419 | 88,883,714 | ||||||
Commitments and contingent liabilities (Notes 23 and 25) | ||||||||
Shareholder’s equity (Note 20): | ||||||||
Capital stock (Notes 17 and 18): | ||||||||
Preferred stock (Note 32): | ||||||||
Class 1—authorized, 100,000,000 shares; issued and outstanding, 81,400,000 shares in 2004 and 2005, with no stated value (aggregate liquidation preference of ¥244,200 million) | 122,100 | 122,100 | ||||||
Class 2—authorized, 100,000,000 shares; issued and outstanding, 100,000,000 shares in 2005, with no stated value (aggregate liquidation preference of ¥250,000 million) | — | 125,000 | ||||||
Common stock—authorized, 8,000,000,000 shares; issued, 5,019,469,546 shares in 2004 and 2005, with no stated value | 749,873 | 749,873 | ||||||
Capital surplus (Note 18) | 814,583 | 983,264 | ||||||
Retained earnings (Notes 19 and 32): | ||||||||
Appropriated for legal reserve | 190,045 | 190,045 | ||||||
Unappropriated | 696,985 | 788,835 | ||||||
Accumulated other changes in equity from nonowner sources, net of taxes | 199,270 | 209,662 | ||||||
Total | 2,772,856 | 3,168,779 | ||||||
Less parent company’s stock, at cost—609 common shares in 2004 and 2,958 common shares in 2005 | 723 | 2,194 | ||||||
Shareholder’s equity—net | 2,772,133 | 3,166,585 | ||||||
Total | ¥ | 85,058,552 | ¥ | 92,050,299 | ||||
See the accompanying notes to Consolidated Financial Statements.
F-3
Table of Contents
THE BANK OF TOKYO-MITSUBISHI, LTD. AND SUBSIDIARIES
CONSOLIDATED STATEMENTS OF INCOME
FOR THE FISCAL YEARS ENDED MARCH 31, 2003, 2004 AND 2005
| 2003 | 2004 | 2005 | ||||||||||
| (in millions) | ||||||||||||
Interest income: | ||||||||||||
Loans, including fees (Note 5) | ¥ | 916,802 | ¥ | 810,001 | ¥ | 819,030 | ||||||
Deposits in other banks | 66,979 | 43,470 | 59,702 | |||||||||
Investment securities: | ||||||||||||
Interest | 190,818 | 178,937 | 222,539 | |||||||||
Dividends | 32,077 | 30,642 | 30,409 | |||||||||
Trading account assets | 11,215 | 28,015 | 30,675 | |||||||||
Call loans and funds sold | 9,593 | 6,297 | 6,958 | |||||||||
Receivables under resale agreements and securities borrowing transactions | 33,183 | 22,790 | 29,116 | |||||||||
Total | 1,260,667 | 1,120,152 | 1,198,429 | |||||||||
Interest expense: | ||||||||||||
Deposits | 193,594 | 144,450 | 184,314 | |||||||||
Debentures | 8,508 | 4,035 | 351 | |||||||||
Call money and funds purchased | 7,303 | 5,434 | 5,064 | |||||||||
Payables under repurchase agreements and securities lending transactions | 63,027 | 42,738 | 49,063 | |||||||||
Other short-term borrowings and trading account liabilities | 29,453 | 32,965 | 53,164 | |||||||||
Long-term debt | 133,198 | 109,274 | 97,767 | |||||||||
Total | 435,083 | 338,896 | 389,723 | |||||||||
Net interest income | 825,584 | 781,256 | 808,706 | |||||||||
Provision (credit) for credit losses (Notes 5 and 6) | 287,282 | (142,362 | ) | 125,109 | ||||||||
Net interest income after provision (credit) for credit losses | 538,302 | 923,618 | 683,597 | |||||||||
Non-interest income: | ||||||||||||
Fees and commissions (Note 26) | 384,377 | 440,887 | 481,564 | |||||||||
Foreign exchange gains (losses)—net (Note 3) | (578 | ) | 247,417 | 1,182 | ||||||||
Trading account profits—net (Note 3) | 273,723 | 117,272 | 31,312 | |||||||||
Investment securities gains—net (Note 4) | 33,847 | 97,763 | 190,454 | |||||||||
Refund of the local taxes by the Tokyo Metropolitan Government (Note 9) | — | 32,141 | — | |||||||||
Other non-interest income | 33,241 | 47,639 | 99,450 | |||||||||
Total | 724,610 | 983,119 | 803,962 | |||||||||
Non-interest expense: | ||||||||||||
Salaries and employee benefits (Note 15) | 397,814 | 412,516 | 399,288 | |||||||||
Occupancy expenses—net (Notes 7 and 25) | 88,881 | 86,566 | 88,116 | |||||||||
Fees and commission expenses | 70,302 | 68,931 | 77,327 | |||||||||
Amortization of intangible assets (Note 8) | 38,669 | 54,216 | 58,686 | |||||||||
Insurance premiums, including deposit insurance | 38,806 | 45,125 | 47,903 | |||||||||
Minority interest in income of consolidated subsidiaries | 6,025 | 45,824 | 39,046 | |||||||||
Communications | 19,638 | 25,462 | 25,899 | |||||||||
Other non-interest expenses | 313,202 | 296,299 | 224,411 | |||||||||
Total | 973,337 | 1,034,939 | 960,676 | |||||||||
Income from continuing operations before income tax expense and cumulative effect of a change in accounting principle | 289,575 | 871,798 | 526,883 | |||||||||
Income tax expense (Note 9) | 50,435 | 333,612 | 238,798 | |||||||||
Income from continuing operations before cumulative effect of a change in accounting principle | 239,140 | 538,186 | 288,085 | |||||||||
Income (loss) from discontinued operations—net (Note 2) | 10,370 | (585 | ) | — | ||||||||
Cumulative effect of a change in accounting principle, net of tax (Note 1) | (532 | ) | — | (977 | ) | |||||||
Net income | 248,978 | 537,601 | 287,108 | |||||||||
Income allocable to a preferred shareholder | ¥ | 3,358 | ¥ | 10,073 | 6,716 | |||||||
Net income available to a common shareholder | ¥ | 245,620 | ¥ | 527,528 | ¥ | 280,392 | ||||||
| (in Yen) | ||||||||||||
Amounts per share (Notes 19 and 21): | ||||||||||||
Basic earnings per common share—income from continuing operations available to a common shareholder before cumulative effect of a change in accounting principle | ¥ | 50.39 | ¥ | 105.22 | ¥ | 56.06 | ||||||
Basic earnings per common share—net income available to a common shareholder | 52.49 | 105.10 | 55.87 | |||||||||
Diluted earnings per common share—income from continuing operations available to a common shareholder before cumulative effect of a change in accounting principle | 47.05 | 104.93 | 55.80 | |||||||||
Diluted earnings per common share—net income available to a common shareholder | 49.11 | 104.81 | 55.61 | |||||||||
See the accompanying notes to Consolidated Financial Statements.
F-4
Table of Contents
THE BANK OF TOKYO-MITSUBISHI, LTD. AND SUBSIDIARIES
CONSOLIDATED STATEMENTS OF CHANGES IN EQUITY FROM NONOWNER SOURCES
FOR THE FISCAL YEARS ENDED MARCH 31, 2003, 2004 AND 2005
| Gains (Losses) before income tax expense (benefit) | Income tax (expense) benefit | Gains (Losses) net of income tax expense (benefit) | ||||||||||
| (in millions) | ||||||||||||
Fiscal year ended March 31, 2003: | ||||||||||||
Net income | ¥ | 248,978 | ||||||||||
Other changes in equity from nonowner sources: | ||||||||||||
Net unrealized holding losses on investment securities available for sale | ¥ | (635,074 | ) | ¥ | 238,071 | (397,003 | ) | |||||
Reclassification adjustment for gains included in net income | (46,805 | ) | 18,312 | (28,493 | ) | |||||||
Total | (681,879 | ) | 256,383 | (425,496 | ) | |||||||
Net unrealized gains on derivatives qualifying for cash flow hedges | 10,885 | (4,164 | ) | 6,721 | ||||||||
Reclassification adjustment for gains included in net income | (9,545 | ) | 3,651 | (5,894 | ) | |||||||
Total | 1,340 | (513 | ) | 827 | ||||||||
Minimum pension liability adjustments | (94,202 | ) | 34,295 | (59,907 | ) | |||||||
Foreign currency translation adjustments | (47,780 | ) | 3,299 | (44,481 | ) | |||||||
Reclassification adjustment for losses included in net income | 394 | — | 394 | |||||||||
Total | (47,386 | ) | 3,299 | (44,087 | ) | |||||||
Total changes in equity from nonowner sources | ¥ | (279,685 | ) | |||||||||
Fiscal year ended March 31, 2004: | ||||||||||||
Net income | ¥ | 537,601 | ||||||||||
Other changes in equity from nonowner sources: | ||||||||||||
Net unrealized holding gains on investment securities available for sale | ¥ | 728,156 | ¥ | (300,144 | ) | 428,012 | ||||||
Reclassification adjustment for gains included in net income | (115,013 | ) | 48,013 | (67,000 | ) | |||||||
Total | 613,143 | (252,131 | ) | 361,012 | ||||||||
Net unrealized gains on derivatives qualifying for cash flow hedges | 4,286 | (1,740 | ) | 2,546 | ||||||||
Reclassification adjustment for gains included in net income | (9,227 | ) | 3,529 | (5,698 | ) | |||||||
Total | (4,941 | ) | 1,789 | (3,152 | ) | |||||||
Minimum pension liability adjustments | 78,641 | (30,804 | ) | 47,837 | ||||||||
Foreign currency translation adjustments | (35,498 | ) | 4,324 | (31,174 | ) | |||||||
Reclassification adjustment for losses included in net income | 8,626 | — | 8,626 | |||||||||
Total | (26,872 | ) | 4,324 | (22,548 | ) | |||||||
Total changes in equity from nonowner sources | ¥ | 920,750 | ||||||||||
Fiscal year ended March 31, 2005: | ||||||||||||
Net income | ¥ | 287,108 | ||||||||||
Other changes in equity from nonowner sources: | ||||||||||||
Net unrealized holding gains on investment securities available for sale | ¥ | 250,417 | ¥ | (101,838 | ) | 148,579 | ||||||
Reclassification adjustment for gains included in net income | (241,953 | ) | 98,535 | (143,418 | ) | |||||||
Total | 8,464 | (3,303 | ) | 5,161 | ||||||||
Net unrealized gains on derivatives qualifying for cash flow hedges | 328 | (126 | ) | 202 | ||||||||
Reclassification adjustment for gains included in net income | (847 | ) | 324 | (523 | ) | |||||||
Total | (519 | ) | 198 | (321 | ) | |||||||
Minimum pension liability adjustments | 18,501 | (7,613 | ) | 10,888 | ||||||||
Foreign currency translation adjustments | (6,448 | ) | (7,760 | ) | (14,208 | ) | ||||||
Reclassification adjustment for losses included in net income | 8,872 | — | 8,872 | |||||||||
Total | 2,424 | (7,760 | ) | (5,336 | ) | |||||||
Total changes in equity from nonowner sources | ¥ | 297,500 | ||||||||||
See the accompanying notes to Consolidated Financial Statements.
F-5
Table of Contents
THE BANK OF TOKYO-MITSUBISHI, LTD. AND SUBSIDIARIES
CONSOLIDATED STATEMENTS OF SHAREHOLDER’S EQUITY
FOR THE FISCAL YEARS ENDED MARCH 31, 2003, 2004 AND 2005
| 2003 | 2004 | 2005 | ||||||||||
| (in millions) | ||||||||||||
Preferred stock (Class 1) (Note 17): | ||||||||||||
Balance at beginning of fiscal year | ¥ | 122,100 | ¥ | 122,100 | ¥ | 122,100 | ||||||
Balance at end of fiscal year | ¥ | 122,100 | ¥ | 122,100 | ¥ | 122,100 | ||||||
Preferred stock (Class 2) (Note 17): | ||||||||||||
Balance at beginning of fiscal year | ¥ | — | ¥ | — | ¥ | — | ||||||
Issuance of new shares of Class 2 preferred stock | — | — | 125,000 | |||||||||
Balance at end of fiscal year | ¥ | — | ¥ | — | ¥ | 125,000 | ||||||
Common stock (Note 18): | ||||||||||||
Balance at beginning of fiscal year | ¥ | 663,870 | ¥ | 749,873 | ¥ | 749,873 | ||||||
Issuance of new shares of common stock | 86,003 | — | — | |||||||||
Balance at end of fiscal year | ¥ | 749,873 | ¥ | 749,873 | ¥ | 749,873 | ||||||
Capital surplus (Note 18): | ||||||||||||
Balance at beginning of fiscal year | ¥ | 600,296 | ¥ | 815,192 | ¥ | 814,583 | ||||||
Issuance of new shares of common stock | 85,240 | — | — | |||||||||
Issuance of new shares of Class 2 preferred stock | — | — | 124,479 | |||||||||
Gains (losses) on sales of shares of parent company’s stock, net of taxes | 74,822 | (630 | ) | (256 | ) | |||||||
Recognition of tax benefit arising from parent company’s stock | 54,008 | — | — | |||||||||
Recognition of tax benefit arising from the suspension of the consolidated corporate-tax system (Note 9) | — | — | 44,641 | |||||||||
Loss on sale of shares of Mitsubishi Asset Management Co., Ltd. to parent company (Note 2) | — | — | (207 | ) | ||||||||
Other | 826 | 21 | 24 | |||||||||
Balance at end of fiscal year | ¥ | 815,192 | ¥ | 814,583 | ¥ | 983,264 | ||||||
Retained earnings appropriated for legal reserve (Note 19): | ||||||||||||
Balance at beginning of fiscal year | ¥ | 190,045 | ¥ | 190,045 | ¥ | 190,045 | ||||||
Balance at end of fiscal year | ¥ | 190,045 | ¥ | 190,045 | ¥ | 190,045 | ||||||
Unappropriated retained earnings (Note 19): | ||||||||||||
Balance at beginning of fiscal year | ¥ | 12,593 | ¥ | 244,187 | ¥ | 696,985 | ||||||
Net income | 248,978 | 537,601 | 287,108 | |||||||||
Total | 261,571 | 781,788 | 984,093 | |||||||||
Deduction: | ||||||||||||
Cash dividends | ||||||||||||
Common share—¥3.00 in 2003, ¥7.73 in 2004 and ¥34.71 in 2005 per share | (14,026 | ) | (38,800 | ) | (174,225 | ) | ||||||
Preferred share (Class 1)—¥41.25 in 2003, ¥123.75 in 2004 and ¥82.50 in 2005 per share | (3,358 | ) | (10,073 | ) | (6,716 | ) | ||||||
Hypothetical dividends under the separate return method (Note 9) | — | (35,930 | ) | (14,317 | ) | |||||||
Total | (17,384 | ) | (84,803 | ) | (195,258 | ) | ||||||
Balance at end of fiscal year (Note 32) | ¥ | 244,187 | ¥ | 696,985 | ¥ | 788,835 | ||||||
Accumulated other changes in equity from nonowner sources, net of taxes: | ||||||||||||
Net unrealized gains on investment securities available for sale (Note 4): | ||||||||||||
Balance at beginning of fiscal year | ¥ | 608,750 | ¥ | 183,254 | ¥ | 544,266 | ||||||
Net change during the fiscal year | (425,496 | ) | 361,012 | 5,161 | ||||||||
Balance at end of fiscal year | ¥ | 183,254 | ¥ | 544,266 | ¥ | 549,427 | ||||||
Net unrealized gains on derivatives qualifying for cash flow hedges (Note 22): | ||||||||||||
Balance at beginning of fiscal year | ¥ | 3,696 | ¥ | 4,523 | ¥ | 1,371 | ||||||
Net change during the fiscal year | 827 | (3,152 | ) | (321 | ) | |||||||
Balance at end of fiscal year | ¥ | 4,523 | ¥ | 1,371 | ¥ | 1,050 | ||||||
Minimum pension liability adjustments (Note 15): | ||||||||||||
Balance at beginning of fiscal year | ¥ | (141,559 | ) | ¥ | (201,466 | ) | ¥ | (153,629 | ) | |||
Net change during the fiscal year | (59,907 | ) | 47,837 | 10,888 | ||||||||
Balance at end of fiscal year | ¥ | (201,466 | ) | ¥ | (153,629 | ) | ¥ | (142,741 | ) | |||
Foreign currency translation adjustments: | ||||||||||||
Balance at beginning of fiscal year | ¥ | (126,103 | ) | ¥ | (170,190 | ) | ¥ | (192,738 | ) | |||
Net change during the fiscal year | (44,087 | ) | (22,548 | ) | (5,336 | ) | ||||||
Balance at end of fiscal year | ¥ | (170,190 | ) | ¥ | (192,738 | ) | ¥ | (198,074 | ) | |||
Balance at end of fiscal year | ¥ | (183,879 | ) | ¥ | 199,270 | ¥ | 209,662 | |||||
Parent company’s stock: | ||||||||||||
Balance at beginning of fiscal year | ¥ | (26,684 | ) | ¥ | (1,775 | ) | ¥ | (723 | ) | |||
Sales of shares of parent company’s stock | 26,017 | 907 | 708 | |||||||||
Net decrease (increase) resulting from changes in voting interests in its consolidated subsidiaries and affiliated companies | (1,108 | ) | 145 | (2,179 | ) | |||||||
Balance at end of fiscal year | ¥ | (1,775 | ) | ¥ | (723 | ) | ¥ | (2,194 | ) | |||
Total shareholder’s equity | ¥ | 1,935,743 | ¥ | 2,772,133 | ¥ | 3,166,585 | ||||||
See the accompanying notes to Consolidated Financial Statements.
F-6
Table of Contents
THE BANK OF TOKYO-MITSUBISHI, LTD. AND SUBSIDIARIES
CONSOLIDATED STATEMENTS OF CASH FLOWS
FOR THE FISCAL YEARS ENDED MARCH 31, 2003, 2004 AND 2005
| 2003 | 2004 | 2005 | ||||||||||
| (in millions) | ||||||||||||
Cash flows from operating activities: | ||||||||||||
Net income | ¥ | 248,978 | ¥ | 537,601 | ¥ | 287,108 | ||||||
Adjustments to reconcile net income to net cash provided by operating activities: | ||||||||||||
Loss (income) from discontinued operations—net | (10,370 | ) | 585 | — | ||||||||
Depreciation and amortization | 92,619 | 102,395 | 98,738 | |||||||||
Provision (credit) for credit losses | 287,282 | (142,362 | ) | 125,109 | ||||||||
Investment securities gains—net | (33,847 | ) | (97,763 | ) | (190,454 | ) | ||||||
Foreign exchange losses (gains)—net | (238,408 | ) | (299,265 | ) | 39,826 | |||||||
Provision for deferred income tax expense (benefit) | (10,339 | ) | 288,366 | 179,466 | ||||||||
Increase in trading account assets, excluding foreign exchange contracts | (1,282,820 | ) | (618,016 | ) | (592,927 | ) | ||||||
Increase in trading account liabilities, excluding foreign exchange contracts | 1,386,096 | 584,844 | 120,688 | |||||||||
Decrease (increase) in accrued interest receivable and other receivables | 46,103 | 13,691 | (20,115 | ) | ||||||||
Increase (decrease) in accrued interest payable and other payables | (76,129 | ) | (13,525 | ) | 14,782 | |||||||
Other—net | 76,508 | 78,600 | 23,323 | |||||||||
Net cash provided by operating activities | 485,673 | 435,151 | 85,544 | |||||||||
Cash flows from investing activities: | ||||||||||||
Proceeds from sales of investment securities available for sale | 22,403,930 | 21,657,326 | 28,333,369 | |||||||||
Proceeds from maturities of investment securities available for sale | 14,922,432 | 14,105,644 | 31,662,009 | |||||||||
Purchases of investment securities available for sale | (37,445,822 | ) | (38,417,403 | ) | (61,433,605 | ) | ||||||
Proceeds from maturities of investment securities being held to maturity | — | 23,101 | 7,006 | |||||||||
Purchases of investment securities being held to maturity | — | (1,029,334 | ) | (1,004,347 | ) | |||||||
Proceeds from sales of other investment securities | 16,996 | 31,665 | 18,039 | |||||||||
Purchases of other investment securities | (36,065 | ) | (93,936 | ) | (185,615 | ) | ||||||
Net increase in loans | (287,536 | ) | (927,293 | ) | (1,075,363 | ) | ||||||
Net decrease (increase) in interest-earning deposits in other banks | 414,498 | 243,785 | (582,361 | ) | ||||||||
Net decrease (increase) in call loans, funds sold, and receivables under resale agreements and securities borrowing transactions | 963,377 | (4,270,486 | ) | 548,177 | ||||||||
Proceeds from sales of premises and equipment | 12,582 | 34,709 | 15,524 | |||||||||
Capital expenditures for premises and equipment | (38,763 | ) | (42,630 | ) | (38,737 | ) | ||||||
Other—net | 73,446 | (252,983 | ) | (119,716 | ) | |||||||
Net cash provided by (used in) investing activities | 999,075 | (8,937,835 | ) | (3,855,620 | ) | |||||||
Cash flows from financing activities: | ||||||||||||
Net increase in deposits | 4,401,258 | 4,455,161 | 1,597,861 | |||||||||
Decrease in debentures | (1,639,508 | ) | (370,103 | ) | (265,957 | ) | ||||||
Net increase (decrease) in call money, funds purchased, and payables under repurchase agreements and securities lending transactions | (1,139,339 | ) | 79,048 | (658,412 | ) | |||||||
Net increase (decrease) in other short-term borrowings | (848,892 | ) | 2,859,880 | 4,005,183 | ||||||||
Proceeds from issuance of long-term debt | 1,015,300 | 1,219,410 | 1,130,420 | |||||||||
Repayment of long-term debt | (1,265,220 | ) | (658,685 | ) | (793,904 | ) | ||||||
Proceeds from issuance of new shares of common stock, net of stock issue expenses | 171,242 | — | — | |||||||||
Proceeds from issuance of new shares of preferred stock, net of stock issue expenses | — | — | 249,479 | |||||||||
Proceeds from sales of parent company’s stock | 65,056 | 805 | 1,074 | |||||||||
Dividends paid | (17,384 | ) | (48,873 | ) | (180,941 | ) | ||||||
Payments for the allocated amount under the consolidated corporate-tax system (Note 9) | (7,446 | ) | (4,338 | ) | (36,257 | ) | ||||||
Other—net | 70,722 | 42,418 | (7,860 | ) | ||||||||
Net cash provided by financing activities | 805,789 | 7,574,723 | 5,040,686 | |||||||||
Effect of exchange rate changes on cash and cash equivalents | (46,272 | ) | (72,636 | ) | (6,810 | ) | ||||||
Net increase (decrease) in cash and cash equivalents | 2,244,265 | (1,000,597 | ) | 1,263,800 | ||||||||
Cash and cash equivalents at beginning of fiscal year | 1,520,514 | 3,764,779 | 2,764,182 | |||||||||
Cash and cash equivalents at end of fiscal year | ¥ | 3,764,779 | ¥ | 2,764,182 | ¥ | 4,027,982 | ||||||
Supplemental disclosure of cash flow information: | ||||||||||||
Cash paid during the fiscal year for: | ||||||||||||
Interest | ¥ | 511,089 | ¥ | 352,661 | ¥ | 370,193 | ||||||
Income taxes, net of refunds | 54,028 | 52,968 | 51,718 | |||||||||
Non-cash investing activities: | ||||||||||||
Available-for-sale securities transferred to held-to-maturity category (Note 5) | — | 50,398 | — | |||||||||
Increase of parent company’s stock in exchange for the shares of Diamond Computer Service Co., Ltd. (Note 2) | — | — | 2,047 | |||||||||
Obtaining assets by entering into capital lease | 2,426 | 3,811 | 7,905 | |||||||||
See the accompanying notes to Consolidated Financial Statements.
F-7
Table of Contents
THE BANK OF TOKYO-MITSUBISHI, LTD. AND SUBSIDIARIES
NOTES TO CONSOLIDATED FINANCIAL STATEMENTS
1. BASIS OF FINANCIAL STATEMENTS AND SUMMARY OF SIGNIFICANT ACCOUNTING POLICIES
Basis of Financial Statements
The Bank of Tokyo-Mitsubishi, Ltd. (Kabushiki Kaisha Tokyo Mitsubishi Ginko) (the “Bank”) is a wholly owned subsidiary of Mitsubishi Tokyo Financial Group, Inc. (“MTFG”). On April 2, 2001, MTFG was established, as a bank holding company, through which the Bank, The Mitsubishi Trust and Banking Corporation (“Mitsubishi Trust”), and Nippon Trust Bank Limited (“NTB”), a former subsidiary of the Bank, have become wholly owned subsidiaries of MTFG pursuant to the stock-for-stock exchanges. Effective April 2, 2001, NTB has been deconsolidated.
The accompanying consolidated financial statements include the accounts of the Bank and its subsidiaries (together, the “Group”) and exclude accounts of MTFG and Mitsubishi Trust. The consolidated financial statements are stated in Japanese yen, the currency of the country in which the Bank is incorporated and principally operates. The accompanying consolidated financial statements have been prepared on the basis of accounting principles generally accepted in the United States of America (“US GAAP”). In certain respects, the accompanying consolidated financial statements reflect adjustments which are not included in the consolidated financial statements issued by the Bank and certain of its subsidiaries in accordance with applicable statutory requirements and accounting practices in the countries of incorporation. The major adjustments include those relating to (1) investment securities, (2) derivative financial instruments, (3) allowance for credit losses, (4) income taxes, (5) consolidation, (6) premises and equipment, (7) transfer of financial assets, (8) pension liability, (9) goodwill, and (10) lease transactions.
Fiscal periods of certain subsidiaries, which ended on or after December 31, and the Bank’s fiscal year, which ended on March 31, have been treated as coterminous. For the fiscal years ended March 31, 2003, 2004 and 2005, the effect of recording intervening events for the three-month periods ended March 31 on the Bank’s proportionate equity in net income of subsidiaries with fiscal periods ending on December 31, would have resulted in an increase of ¥3.48 billion, an increase of ¥2.93 billion and a decrease of ¥0.66 billion, respectively, to net income. No intervening events occurred during each of the three-month periods ended March 31, 2003, 2004 and 2005 which, if recorded, would have had effects of more than 1% of total assets, loans, total liabilities, deposits or shareholder’s equity as of March 31, 2003, 2004 and 2005.
Description of Business
The Group conducts domestic and international financial business through domestic and international networks of branches, offices and subsidiaries in Japan and around the world. The Bank is a major commercial banking institution, providing a broad range of financial services to consumers and corporations through commercial banking, investment banking and other activities. As one of the principal subsidiaries of MTFG, the Group’s activities also encompass transactions with other subsidiaries of MTFG. These transactions are, however, conducted on an arms-length base, requiring terms and conditions commonly adopted in the marketplace. NTB had been one of the major domestic subsidiaries of the Bank before the business combination and was acting as a trust vehicle for the Bank. On April 2, 2001, NTB became a wholly owned subsidiary of MTFG and has been deconsolidated from the Bank and was merged with and into Mitsubishi Trust, the other principal subsidiary of MTFG on October 1, 2001. The merger also involved The Tokyo Trust Bank, Ltd. (“TTB”), merging with and into Mitsubishi Trust. See Note 27 for more information by business segment.
F-8
Table of Contents
THE BANK OF TOKYO-MITSUBISHI, LTD. AND SUBSIDIARIES
NOTES TO CONSOLIDATED FINANCIAL STATEMENTS—(Continued)
Use of Estimates
The preparation of consolidated financial statements in conformity with US GAAP requires management to make estimates and assumptions that affect the reported amounts of assets and liabilities and disclosures of contingent assets and liabilities at the date of the consolidated financial statements and the reported amounts of revenues and expenses during the reporting period. Actual results could differ from those estimates. Material estimates that are particularly susceptible to significant change in the near term primarily relate to the allowance for credit losses on loans and off-balance-sheet credit instruments, deferred tax assets, financial instruments with no available market prices, goodwill, investment securities and accrued severance indemnities and pension liabilities.
Summary of Significant Accounting Policies
Significant accounting policies applied in the accompanying consolidated financial statements are summarized below:
Consolidation—The consolidated financial statements include the accounts of the Bank and its subsidiaries over which control is exercised through either majority ownership of voting stock and/or other means, including, but not limited to, the possession of the power to direct or cause the direction of the management and policies of entities. In situations in which the Group has less than 100% but greater than 50% of ownership in entities, such entities are consolidated and minority interests are also recorded in Other liabilities. Intercompany items have been eliminated. Investments in affiliated companies (companies over which the Group has the ability to exercise significant influence) are accounted for by the equity method of accounting and are reported in Other assets. The Group’s equity interests in the earnings of these equity investees and gains or losses realized on disposition of such investments are reported in Other non-interest income or expenses.
Variable interest entities for which the Group is deemed to be the primary beneficiary are consolidated when the Group has a variable interest that will absorb a majority of the entity’s expected loss, receive a majority of the entity’s expected returns, or both. SeeAccounting Changes—Variable Interest Entities and Note 24.
Assets that the Group holds in an agency, fiduciary or trust capacity are not assets of the Group and, accordingly, are not included in the accompanying consolidated balance sheets.
Cash Flows—For the purposes of reporting cash flows, cash and cash equivalents are defined as those amounts included in the consolidated balance sheets under the caption Cash and due from banks with original maturities of 90 days or less. Cash flows from qualified hedging activities are classified in the same category as the items being hedged.
Translation of Foreign Currency Financial Statements and Foreign Currency Transactions—Financial statements of overseas entities are translated into Japanese yen using the respective fiscal year-end exchange rates for assets and liabilities. Income and expense items are translated at average rates of exchange for the respective fiscal periods.
Except for overseas entities located in highly inflationary economies, foreign currency translation gains and losses related to the financial statements of overseas entities of the Group, net of related income tax effects, are credited or charged directly to Foreign currency translation adjustments, a component of accumulated other changes in equity from nonowner sources. Tax effects of gains and losses on foreign currency translation of financial statements of overseas entities are not recognized unless it is apparent that the temporary differences will reverse in the foreseeable future. If applicable, foreign exchange translation gains and losses pertaining to entities located in highly inflationary economies are recorded in Foreign exchange gains (losses)—net, as appropriate. For these entities, premises and equipment and the related depreciation and amortization thereof are translated at exchange rates prevailing at dates of acquisition.
F-9
Table of Contents
THE BANK OF TOKYO-MITSUBISHI, LTD. AND SUBSIDIARIES
NOTES TO CONSOLIDATED FINANCIAL STATEMENTS—(Continued)
Foreign currency denominated assets and liabilities are translated into Japanese yen at the respective fiscal year-end foreign exchange rates. Foreign currency denominated income and expenses are translated using average rates of exchange for the respective fiscal periods. Gains and losses from such translation are included in Foreign exchange gains (losses)—net, as appropriate.
Repurchase Agreements, Securities Lending and Other Secured Financing Transactions—Securities sold with agreements to repurchase (“repurchase agreements”), securities purchased with agreements to resell (“resale agreements”) and securities lending and borrowing transactions are accounted for as sales of securities with related off-balance-sheet forward repurchase commitments or purchases of securities with related off-balance-sheet forward resale commitments, if they meet the relevant conditions for the surrender of control as provided by Statement of Financial Accounting Standards (“SFAS”) No. 140, “Accounting for Transfers and Servicing of Financial Assets and Extinguishments of Liabilities, a replacement of FASB Statement No. 125.” If the conditions are not met, the transactions are treated as secured financing or lending.
Collateral—For secured lending transactions, including resale agreements, securities borrowing transactions, commercial lending and derivative transactions, the Group, as a secured party, generally has the right to require the counterparties to provide collateral, including letters of credit, cash, securities and other financial assets. For most securities lending transactions, the Group maintains strict levels of collateralization governed by daily mark-to-market analysis. Financial assets pledged as collateral are generally negotiable financial instruments and are permitted to be sold or repledged by secured parties. If the Group sells these financial assets received as collateral, it recognizes the proceeds from the sale and its obligation to return the collateral. For secured borrowing transactions, principally repurchase agreements and securities lending transactions and derivative transactions, where the secured party has the right to sell or repledge financial assets pledged as collateral, the Group separately discloses those financial assets pledged as collateral in the consolidated balance sheets.
Trading Account Securities—Securities and money market instruments held in anticipation of short-term market movements and for resale to customers are included in Trading account assets, and short trading positions of these instruments are included in Trading account liabilities. Trading positions are carried at fair value on the consolidated balance sheets and recorded on a trade date basis. Changes in the fair value of trading positions are recognized currently in Trading account profits—net, as appropriate.
Investment Securities—Debt securities for which the Group has both the positive intent and ability to hold to maturity are classified as Securities being held to maturity and carried at amortized cost. Debt securities that the Group may not hold to maturity and marketable equity securities, other than those classified as trading account securities, are classified as Securities available for sale, and are carried at their fair values, with unrealized gains and losses reported on a net-of-tax basis within accumulated other changes in equity from nonowner sources, which is a component of shareholder’s equity. Nonmarketable equity securities are stated at cost as Other investment securities.
Individual debt and equity securities are written down to fair value with the resulting losses charged to operations when, in the opinion of management, a decline in estimated fair value below the cost of such securities is other than temporary. Such impairment loss is included in Investment securities gains—net in the statement of income. In determining other than temporary declines in fair value to be recognized as an impairment loss on investment securities, the Group generally considers factors such as the financial condition of the issuer, the extent of decline in fair value, and the length of period that the decline in fair value below cost has existed. See Note 4 for a further discussion of other-than-temporary impairment. Interest and dividends on investment securities are reported in Interest Income. Dividends are recognized when the shareholders’ right to receive the dividend is established. Gains and losses on disposition of investment securities are computed using the average cost method and are recognized on the trade date.
F-10
Table of Contents
THE BANK OF TOKYO-MITSUBISHI, LTD. AND SUBSIDIARIES
NOTES TO CONSOLIDATED FINANCIAL STATEMENTS—(Continued)
Derivative Financial Instruments—The Group engages in derivative activities involving swaps, forwards and options, and other types of derivative contracts. Derivatives are used in trading activities to generate trading revenues and fee income for its own account and to respond to the customers’ financial needs. Derivatives are also used to manage its exposures to fluctuations in interest and foreign exchange rates, equity and commodity prices.
Derivatives entered into for trading purposes are carried at fair value and are reported as Trading account assets or Trading account liabilities. Fair values are based on market or broker-dealer quotes when available. Valuation models such as present value and pricing models are applied to current market information to estimate fair values when such quotes are not available. The Group defers trade date gains or losses on derivatives where the fair values of those derivatives are not obtained from a quoted market price, supported by comparison to other observable market transactions, or based upon a valuation technique incorporating observable market data. The fair values of derivative contracts executed with the same counterparty under legally enforceable master netting agreements are presented on a net basis. Changes in the fair value of such contracts are recognized currently in Foreign exchange gains (losses)—net with respect to foreign exchange contracts and in Trading account profits—net with respect to interest rate contracts and other types of contracts.
Embedded derivatives that are not clearly and closely related to the host contracts and meet the definition of derivatives are separated from the host contracts and measured at fair value unless the contracts embedding the derivatives are measured at fair value in their entirety.
Derivatives are also used for asset and liability management to manage exposures to fluctuations in interest and foreign exchange rates arising from mismatches of asset and liability positions. Such derivatives may include contracts that qualify for hedge accounting. At inception of hedge accounting, each derivative is designated as a hedging instrument and documented with related information such as the risk management objective and strategy for the hedge, which includes the hedged item, the risk being hedged and the method used to assess the hedge’s effectiveness. Derivatives are evaluated in order to determine if they qualify for hedge accounting. The hedging derivative instruments must be highly effective in achieving offsetting changes in fair values or variable cash flows from the hedged items attributable to the risk being hedged. Any ineffectiveness, which arises during the hedging relationship, is recognized in Non-interest income or expense in the period in which it arises. All qualifying hedging derivatives are valued at fair value and included in Other assets or Other liabilities. For fair value hedges of interest-bearing assets or liabilities, the change in the fair value of the hedged item and the hedging instruments is recognized in net interest income to the extent that it is effective. For all other fair value hedges, the change in the fair value of the hedged item and change in fair value of the derivative are recognized in non-interest income or expense. For cash flow hedges, the unrealized changes in fair value to the extent effective are recognized in accumulated other changes in equity from nonowner sources. Amounts realized on cash flow hedges related to variable rate loans are recognized in net interest income in the period when the cash flow from the hedged item is realized. The fair value of cash flow hedges related to forecasted transactions, if any, is recognized in non-interest income or expense in the period when the forecasted transaction occurs. Any difference that arises from gains or losses on hedging derivatives offsetting corresponding gains or losses on the hedged items, and gains and losses on derivatives attributable to the risks excluded from the assessment of hedge effectiveness are currently recognized in non-interest income or expense. Derivatives that do not qualify for hedge accounting are considered trading positions and are accounted for as such.
Loans—Loans are carried at the principal amount outstanding, adjusted for unearned income and deferred net nonrefundable loan fees and costs. Loans held and intended for dispositions or sales in secondary markets are transferred to the held-for-sale classification and carried at the lower of cost or estimated fair value generally on an individual loan basis. Loan origination fees, net of certain direct origination costs, are deferred and recognized over the contractual life of the loan as an adjustment of yield using the method that approximates the interest
F-11
Table of Contents
THE BANK OF TOKYO-MITSUBISHI, LTD. AND SUBSIDIARIES
NOTES TO CONSOLIDATED FINANCIAL STATEMENTS—(Continued)
method. Interest income on loans that are not impaired is accrued and credited to interest income as it is earned. Unearned income and discounts or premiums on purchased loans are deferred and recognized over the contractual lives of the loans using a method that approximates the interest method.
Loans are considered impaired when, based on current information and events, it is probable that the Group will be unable to collect the scheduled payments of principal or interest when due according to the contractual terms of the loan agreement. Factors considered by management in determining impairment include payment status, collateral value, and the probability of collecting scheduled principal and interest payments when due. Loans that experience insignificant payment delays and payment shortfalls generally are not classified as impaired. Management determines the significance of payment delays and payment shortfalls on a case-by-case basis, taking into consideration all of the circumstances surrounding the loan and the borrower, including the length of the delay, the reasons for the delay, the borrower’s prior payment record, and the amount of the shortfall in relation to the principal and interest owed. Impairment is measured on a loan by loan basis by either the present value of expected future cash flows discounted at the loan’s effective interest rate, the loan’s observable market price, or the fair value of the collateral if the loan is collateral dependent.
Loans are generally placed on nonaccrual status when substantial doubt exists as to the full and timely collection of either principal or interest, or when principal or interest is contractually past due one month or more with respect to loans of the Bank and certain domestic subsidiaries, and 90 days or more with respect to loans of certain foreign banking subsidiaries. A nonaccrual loan may be restored to an accrual status when interest and principal payments become current and management expects that the borrower will make future contractual payments as scheduled. When a loan is placed on nonaccrual status, interest accrued but not received is generally reversed against interest income. Cash receipts on nonaccrual loans, for which the ultimate collectibility of principal is uncertain, are applied as principal reductions; otherwise, such collections are credited to income. The Group does not capitalize any accrued interest in its principal balances of impaired loans at each balance sheet date.
Loan Securitization—The Group securitizes and services commercial and industrial loans in the normal course of business. The Group accounts for a transfer of loans in a securitization transaction as a sale if it meets relevant conditions for the surrender of control in accordance with SFAS No. 140. Otherwise, the transfer is accounted for as a collateralized borrowing transaction. Interests in loans sold through a securitization accounted for as a sale may be retained in the form of subordinated tranches or beneficial interests. These retained interests are primarily recorded in Securities available for sale. The previous carrying amount of the loans involved in the transfer is allocated between the loans sold and the retained interests based on their relative fair values at the date of the securitization. Since quoted market prices are generally not available, the Group usually estimates fair value of these retained interests based on the present value of future expected cash flows by using modeling techniques that involve management’s best estimates of key assumptions, which may include default rates, recovery rates, and discount rates. Retained interests that can contractually be prepaid or otherwise settled in such a way that the Group would not recover substantially all of its investment are accounted for as investment securities available for sale.
Allowance for Credit Losses—The Group maintains an allowance for credit losses to absorb probable losses inherent in the loan portfolio. Actual credit losses (amounts deemed uncollectible, in whole or in part), net of recoveries, are deducted from the allowance for credit losses, as net charge-offs, generally based on detailed loan reviews and a credit assessment by management at each balance sheet date. The Group generally applies its charge-off policy to all loans in its portfolio regardless of the type of borrower. A provision for credit losses, which is a charge against earnings, is added to bring the allowance to a level which, in management’s opinion, is adequate to absorb probable losses inherent in the credit portfolio.
A key element relating to the policies and discipline used in determining the allowance for credit losses is the credit classification and the related borrower categorization process. The categorization is based on conditions that may
F-12
Table of Contents
THE BANK OF TOKYO-MITSUBISHI, LTD. AND SUBSIDIARIES
NOTES TO CONSOLIDATED FINANCIAL STATEMENTS—(Continued)
affect the ability of borrowers to service their debt, taking into consideration current financial information, historical payment experience, credit documentation, public information, analyses of relevant industry segments and current trends. In determining the appropriate level of the allowance, the Group evaluates the probable loss by category of loan based on its type and characteristics.
The allowance for credit losses for non-homogeneous loans consists of an allocated allowance for specifically identified problem loans, an allocated allowance for country risk exposure, a formula allowance and an unallocated allowance. An allocated allowance is also established for large groups of smaller-balance homogeneous loans. Non-homogeneous loans such as commercial loans are evaluated individually and the allowance for such loans is comprised of specific, country risk, formula and unallocated allowances.
The credit loss allowance for individual customers represents the impairment allowance determined in accordance with SFAS No. 114, “Accounting by Creditors for Impairment of a Loan.” The Group measures the impairment of a loan, with the exception of large groups of smaller-balance homogeneous loans that are collectively evaluated for impairment, based on the present value of expected future cash flows discounted at the loan’s effective interest rate, or on the loan’s observable market price, or based on the fair value of the collateral if the loan is collateral dependent, when it is probable that the Group will be unable to collect all amounts due according to the contractual terms of the loan agreement. For certain subsidiaries, some impaired loans are aggregated for the purpose of measuring impairment using historical loss factors. Generally, the Group’s impaired loans include nonaccrual loans, restructured loans and other loans specifically identified as impaired.
The credit loss allowance for country risk exposure is a country-specific allowance for substandard, special mention and unclassified loans. The allowance is established to supplement the formula allowance for these loans, based on an estimate of probable losses relating to the exposure to countries that are identified by management to have a high degree of transfer risk. The measure is generally based on a function of default probability and the recovery ratio with reference to external credit ratings. For the allowance for specifically identified cross-border problem loans, the Group incorporates transfer risk in its determination of related allowance for credit losses.
The formula allowance is calculated for group of loans collectively evaluated for unidentified impairment by applying loss factors to outstanding substandard, special mention and unclassified loans. The evaluation of inherent loss for these loans involves a high degree of uncertainty, subjectivity and judgment because probable credit losses are not easily identifiable or measurable. In determining the formula allowance, the Group, therefore, relies on a statistical analysis that incorporates loss factor percentages of total loans outstanding based on historical experience. Corresponding to the periodical impairment identification and self-assessment process, the estimation of the formula allowance is back-tested by comparing the allowance with the actual results subsequent to the balance sheet date. The results of such back-testing are evaluated by management to determine whether the manner and level of formula allowance need to be changed in subsequent years.
The unallocated allowance represents an estimate of additional losses inherent in the loan portfolio and is composed of attribution factors, which are based upon management’s evaluation of various conditions that are not directly or indirectly measured in the determination of the allocated allowance. The conditions evaluated in connection with the unallocated allowance may include existing general economic and business conditions affecting the key lending areas of the Group, credit quality trends, collateral values, loan volumes and concentrations, seasoning of the loan portfolio, specific industry conditions within portfolio segments, recent loss experience in particular segments of the portfolio, duration of the current business cycle, bank regulatory examination results and findings of the Group’s internal credit examiners.
The credit loss allowance for large groups of smaller-balance homogeneous loans is focused on loss experience for the pool rather than on a detailed analysis of individual loans. The allowance is determined primarily based on probable net charge-offs and the probability of insolvency based on the number of delinquencies.
F-13
Table of Contents
THE BANK OF TOKYO-MITSUBISHI, LTD. AND SUBSIDIARIES
NOTES TO CONSOLIDATED FINANCIAL STATEMENTS—(Continued)
Allowance for Off-Balance-Sheet Credit Instruments—The Group maintains an allowance for credit losses on off-balance-sheet credit instruments, including commitments to extend credit, guarantees, standby letters of credit and other financial instruments. The allowance is recorded as a liability and includes the specific allowance for specifically identified credit exposure and the allocated formula allowance. With regard to the specific allowance for specifically identified credit exposure and the allocated formula allowance, the Group adopts the same methodology used in determining the allowance for loan credit losses. Potential credit losses related to derivatives are considered in the fair valuation of the derivatives.
Net changes in the allowance for off-balance-sheet credit instruments are accounted for as Other non-interest expenses.
Premises and Equipment—Premises and equipment are stated at cost less accumulated depreciation and amortization. Depreciation is charged to operations over the estimated useful lives of the related assets. Leasehold improvements are depreciated over the terms of the respective leases or the estimated useful lives of the improvements, whichever are shorter. Depreciation of premises and equipment is computed under the declining-balance method with respect to premises and equipment of the Bank and certain subsidiaries, and under the straight-line method with respect to premises and equipment of other subsidiaries, at rates principally based on the following estimated useful lives:
| Years | ||
Buildings | 15 to 50 | |
Equipment and furniture | 2 to 20 | |
Leasehold improvements | 8 to 17 |
Maintenance, repairs and minor improvements are charged to operations as incurred. Major improvements are capitalized. Net gains or losses on dispositions of premises and equipment are included in Other non-interest income or expense, as appropriate.
Long-lived assets are reviewed for impairment whenever events or changes in circumstances indicate that the carrying amount of an asset may not be recoverable. Recoverability of an asset to be held and used is measured by a comparison of the carrying amount to future undiscounted net cash flows expected to be generated by the asset. If an asset is considered to be impaired, the impairment to be recognized is measured by the amount by which the carrying amount of the asset exceeds the fair value. For purposes of recognition and measurement of an impairment loss, a long-lived asset or assets are grouped with other assets and liabilities at the lowest level with independent and identifiable cash flows. Assets to be disposed of by sale are reported at the lower of the carrying amount or fair value less estimated cost to sell.
Goodwill—The Group has classified as goodwill the excess of the cost of the Group’s investments in subsidiaries over the Group’s share of net assets at dates of acquisition in purchase transactions. Goodwill related to the investments in affiliated companies is included in the investments accounted for by the equity method. On April 1, 2002, the Group adopted SFAS No. 142, “Goodwill and Other Intangible Assets,” which provides goodwill acquired in a purchase business combination should not be amortized and is subject to an impairment test. Goodwill is recorded at a designated reporting unit level for the purpose of assessing impairment. An impairment loss, if any, is recognized to the extent that the carrying amount of goodwill exceeds its implied fair value.
Software—The Group capitalizes certain costs associated with the acquisition or development of internal-use software. Costs subject to capitalization are salaries and employee benefits for employees who are directly associated with and who devote time to the internal-use computer software project, to the extent of the time spent
F-14
Table of Contents
THE BANK OF TOKYO-MITSUBISHI, LTD. AND SUBSIDIARIES
NOTES TO CONSOLIDATED FINANCIAL STATEMENTS—(Continued)
directly on the project. Once the software is ready for its intended use, the Group begins to amortize capitalized costs on a straight-line basis over its estimated useful life.
Accrued Severance and Pension Liabilities—The Bank and certain subsidiaries have defined benefit retirement plans, including lump-sum severance indemnities plans. The costs of the plans, based on actuarial computations of current and future employee benefits, are charged to Salaries and employee benefits.
Debentures and Long-Term Debt—Premiums, discounts and issuance costs of debentures and long-term debt are amortized based on the method that approximates the interest method over the terms of the debentures and long-term debt.
Obligations under Guarantees—The Group provides customers with a variety of guarantees and similar arrangements, including standby letters of credit, financial and performance guarantees, credit protections, and liquidity facilities. The Group recognizes guarantee fee income over the guarantee period. It is the Bank’s dominant business practice to receive such guarantee fee at the inception of the guarantee, which approximates market value of the guarantee and is initially recorded as a liability, which is then recognized as guarantee fee income ratably over the guarantee period.
Fees and Commissions—Revenue recognition of major components of fees and commissions is as follows:
| • | Fees on funds transfer and collection services and fees from investment banking services are generally recognized as revenue when the related services are performed. |
| • | Fees from trade-related financing services are recognized over the period of the financing. |
| • | Trust fees are recognized on an accrual basis, generally based on the volume of trust assets under management and/or the operating performance for the accounting period of each trust account. |
| • | Annual fees and royalty and other service charges related to the credit card business are recorded on a straight-line basis as services are provided. |
| • | Interchange income from credit card business is recognized as billed. |
| • | Service charges on deposit accounts, and fees and commissions from other services are generally recognized over the period that the service is provided. |
| • | Fees on guarantees are generally recognized over the contractual periods of the respective guarantees. Amounts initially recorded as a liability corresponding to the obligations at fair value are generally recognized as revenue over the terms of the guarantees as the Group is deemed to be released from the risk under guarantees. |
Income Taxes—The provision for income taxes is determined using the asset and liability method of accounting for income taxes. Under this method, deferred income taxes reflect the net tax effects of (1) temporary differences between the carrying amounts of assets and liabilities for financial reporting purposes and the amounts used for income tax purposes, and (2) operating loss and tax credit carryforwards. A valuation allowance is recognized for any portion of the deferred tax assets where it is considered more likely than not that it will not be realized. The provision for deferred taxes is based on the change in the net deferred tax asset or liability from period to period.
Free Distributions of Common Shares—As permitted by the Commercial Code of Japan (the “Code”), Japanese companies, upon approval by the Board of Directors, may make a free distribution of shares, in the form of a “stock split” as defined, to shareholders. In accordance with generally accepted accounting practice in Japan, such distribution does not give rise to any change in capital stock or capital surplus accounts. Common shares distributed are recorded as shares issued on the distribution date. See Note 18.
F-15
Table of Contents
THE BANK OF TOKYO-MITSUBISHI, LTD. AND SUBSIDIARIES
NOTES TO CONSOLIDATED FINANCIAL STATEMENTS—(Continued)
Amounts per Common Share—Basic earnings per share (“EPS”) excludes dilutive effects of potential common shares and is computed by dividing income available to common stock shareholders by the weighted average number of common shares outstanding for the period, while diluted EPS gives effect to all dilutive potential common shares that were outstanding during the period. See Note 21 for the computation of basic and diluted EPS.
Comprehensive Income (Loss)—The Group’s comprehensive income (loss) includes net income and other changes in equity from nonowner sources. All changes in unrealized gains and losses on investment securities available for sale, unrealized gains and losses on derivatives qualifying for cash flow hedges, minimum pension liability adjustments and foreign currency translation adjustments constitute the Group’s changes in equity from nonowner sources and are presented, with related income tax effects, in the consolidated statements of changes in equity from nonowner sources.
Stock-Based Compensation—In December 2002, Financial Accounting Standards Board (the “FASB”) issued SFAS No. 148, “Accounting for Stock-Based Compensation—Transition and Disclosure, an amendment of FASB Statement No. 123,” which amends SFAS No. 123, “Accounting for Stock-Based Compensation,” to provide alternative methods of transition for a voluntary change to the fair value based method of accounting for stock-based employee compensation. It also amends the disclosure requirements to require prominent disclosure in both annual and interim financial statements about the method of accounting for stock-based employee compensation and the effect of the method used on reported results. The transition and annual disclosure requirements under this Statement are effective for financial statements for fiscal years ended after December 15, 2002.
Two subsidiaries of the Bank have several stock-based compensation plans, which are described more fully in Note 30. As permitted by the provisions of SFAS No. 123, they account for those employee stock-based compensation plans by the intrinsic value-based method prescribed in APB No. 25, “Accounting for Stock Issued to Employees” and related Interpretations. Under the intrinsic value-based method, compensation expense is measured as the amount by which quoted market price of these subsidiaries’ stock at the date of grant exceeds the stock option exercise price. Non-employee stock-based compensation plans are accounted for at fair value.
Had the employee stock-based compensation plans been accounted for under the fair value method of SFAS No. 123, the Group’s compensation expense, net income, and net income per share would have been the pro forma amounts indicated in the following table.
| Fiscal years ended March 31, | ||||||||||||
| 2003 | 2004 | 2005 | ||||||||||
| (in millions) | ||||||||||||
Reported net income | ¥ | 248,978 | ¥ | 537,601 | ¥ | 287,108 | ||||||
Stock-based employee compensation expense (determined under fair value based method for all awards, net of tax) | (2,015 | ) | (1,962 | ) | (1,661 | ) | ||||||
Pro forma net income, after stock-based employee compensation expense | ¥ | 246,963 | ¥ | 535,639 | ¥ | 285,447 | ||||||
| Basic earnings per common share—net income available to a common shareholder: | (in Yen) | |||||||||||
Reported | ¥ | 52.49 | ¥ | 105.10 | ¥ | 55.87 | ||||||
Pro forma | 52.06 | 104.71 | 55.53 | |||||||||
Diluted earnings per common share—net income available to a common shareholder: | ||||||||||||
Reported | 49.11 | 104.81 | 55.61 | |||||||||
Pro forma | 48.69 | 104.42 | 55.27 | |||||||||
Stock-based compensation expense included in net income for the fiscal years ended March 31, 2003, 2004 and 2005 was not significant.
F-16
Table of Contents
THE BANK OF TOKYO-MITSUBISHI, LTD. AND SUBSIDIARIES
NOTES TO CONSOLIDATED FINANCIAL STATEMENTS—(Continued)
Accounting Changes
Variable Interest Entities—In January 2003, the FASB issued FASB Interpretation (“FIN”) No. 46, “Consolidation of Variable Interest Entities, an interpretation of ARB No. 51.” FIN No. 46 addresses consolidation by business enterprises of variable interest entities (“VIEs”). The consolidation requirements of FIN No. 46 apply immediately to VIEs created after January 31, 2003. The Group has applied, as required, FIN No. 46 to all VIEs created after January 31, 2003. The consolidation requirements apply to older entities in the first fiscal year or interim period beginning after June 15, 2003, which has been amended by the FASB as described below.
In December 2003, the FASB issued FIN No. 46 (revised December 2003), “Consolidation of Variable Interest Entities, an interpretation of ARB No. 51” (“FIN No. 46R”). FIN No. 46R modifies FIN No. 46 in certain respects including the scope exception, the definition of VIEs, and other factors that would affect the determination of VIEs and primary beneficiaries that must consolidate VIEs. FIN No. 46R, as written, applies to VIEs created before February 1, 2003 no later than the end of the first reporting period that ends after March 15, 2004, and to all special purpose entities no later than the first reporting period that ends after December 15, 2003. Subsequent to the issuance of FIN No. 46R, the Chief Accountant of the U.S. Securities and Exchange Commission (“SEC”) stated the SEC staff’s position in a letter to the American Institute of Certified Public Accountants (“AICPA”) dated March 3, 2004, that the SEC staff does not object to the conclusion that FIN No. 46R should not be required to be applied at a date earlier than the original FIN No. 46 and that foreign private issuers would be required to apply FIN No. 46R at various dates depending on the entity’s year-end and the frequency of interim reporting. In accordance with the letter, the Group adopted FIN No. 46R on April 1, 2004, except for certain investment companies, for which the effective date of FIN No. 46R is deferred. Under FIN No. 46R, any difference between the net amount added to the balance sheet and the amount of any previously recognized interest in the VIE is to be recognized as a cumulative effect of a change in accounting principle. The cumulative effect of the change in accounting principle was to decrease net income by ¥977 million. See Note 24 for further discussion of VIEs in which the Group holds variable interests.
Certain Financial Instruments with Characteristics of both Liabilities and Equity—In May 2003, the FASB issued SFAS No. 150, “Accounting for Certain Financial Instruments with Characteristics of both Liabilities and Equity.” SFAS No. 150 establishes standards for how an issuer classifies and measures certain financial instruments with characteristics of both liabilities and equity. SFAS No. 150 is effective at the beginning of the first interim period beginning after June 15, 2003, which is the Group’s fiscal year ended March 31, 2005. On November 7, 2003, FASB Staff Position No. 150-3, “Effective Date, Disclosures, and Transition for Mandatorily Redeemable Financial Instruments of Certain Nonpublic Entities and Certain Mandatorily Redeemable Noncontrolling Interests under FASB Statement No. 150, Accounting for Certain Financial Instruments with Characteristics of Both Liabilities and Equity,” delayed the effective date of certain provisions of SFAS No. 150 for certain mandatorily redeemable noncontrolling interests. The adoption of SFAS No. 150 did not have a material impact on the Group’s financial position and results of operations.
Disclosure about Pension and Other Postretirement Benefit—In December 2003, the FASB issued SFAS No. 132 (revised 2003), “Employers’ Disclosures about Pensions and Other Postretirement Benefits, an amendment of FASB Statements No. 87, 88, and 106” (“SFAS No. 132R”), which replaces existing FASB disclosure requirements for pensions. SFAS No. 132R requires disclosure of more details about plan assets, benefit obligations, cash flows, benefit costs and other relevant information. SFAS No. 132R is generally effective for the fiscal years ended after December 15, 2003, and for interim periods beginning after December 15, 2003. See Note 15 for the required disclosure.
Impairment ofSecuritiesInvestments—In November 2003, the FASB Emerging Issues Task Force (the “EITF”) reached a consensus on Issue No. 03-1, “The Meaning of Other-Than-Temporary Impairment and Its
F-17
Table of Contents
THE BANK OF TOKYO-MITSUBISHI, LTD. AND SUBSIDIARIES
NOTES TO CONSOLIDATED FINANCIAL STATEMENTS—(Continued)
Application to Certain Investments” (“EITF 03-1”). EITF 03-1 requires certain additional quantitative and qualitative disclosures in addition to the disclosures already required by SFAS No. 115, “Accounting for Certain Investments in Debt and Equity Securities.” The new disclosure requirements are applied to financial statements for the fiscal years ended after December 15, 2003. See Note 4 for the required disclosures. In March 2004, the EITF also reached a consensus on additional accounting guidance for other-than-temporary impairments, which requires an evaluation and recognition of other-than-temporary impairment by a three-step impairment test. The guidance should be applied for reporting periods beginning after June 15, 2004. On September 30, 2004, FASB Staff Position EITF Issue 03-1-1, “The Meaning of Other-Than-Temporary Impairment and its Application to Certain Investments” delayed the effective date for the measurement and recognition guidance contained in paragraphs 10 through 20 of EITF 03-1. The FASB will be issuing implementation guidance related to this topic. Once issued, the Group will evaluate the effect of the measurement and recognition provision of EITF 03-1.
Goodwill and Other Intangible Assets—Effective April 1, 2002, the Group adopted SFAS No. 142, “Goodwill and Other Intangible Assets.” SFAS No. 142 requires that goodwill, formerly amortized over its useful life, no longer be amortized but rather tested for impairment at least annually. Further, SFAS No. 142 requires that intangible assets that have finite useful lives will continue to be amortized over their useful lives while intangible assets with indefinite lives will no longer be amortized and are subject to impairment testing at least annually.
The Group performed the required transitional impairment tests of goodwill and intangible assets with indefinite lives upon adoption of SFAS No. 142. The initial adoption resulted in a cumulative adjustment charge to earnings of ¥532 million.
Derivative Instruments and Hedging Activities—In April 2003, the FASB issued SFAS No. 149, “Amendment of Statement 133 on Derivative Instruments and Hedging Activities.” SFAS No. 149 amends and clarifies accounting for derivative instruments, including certain derivative instruments embedded in other contracts, and for hedging activities under SFAS No. 133. In particular, SFAS No. 149 (1) clarifies under what circumstances a contract with an initial net investment meets the characteristics of a derivative, (2) clarifies when a derivative contains a financing component that warrants special reporting in the statement of cash flows, (3) amends the definition of underlyings, one of three characteristics of derivatives, to include the occurrence or non-occurrence of a specified event such as scheduled payments under a contract, and (4) amends certain other existing pronouncements, in particular, those related to the scope of instruments that are subject to the requirements of SFAS No. 133. SFAS No. 149 is generally effective for contracts entered into or modified after June 30, 2003. The adoption of SFAS No. 149 did not have a material impact on the Group’s financial position and results of operations.
Transfer to the Japanese Government of the Substitutional Portion of Employee Pension Fund Liabilities—In January 2003, the EITF reached a consensus on Issue No. 03-2, “Accounting for the Transfer to the Japanese Government of the Substitutional Portion of Employee Pension Fund Liabilities” (“EITF 03-2”), which was ratified by the FASB in February 2003. EITF 03-2 addresses accounting for a transfer to the Japanese government of a substitutional portion of an employee pension fund and requires employers to account for the entire separation process of the substitutional portion from an entire plan upon completion of the transfer to the government of the substitutional portion of the benefit obligation and related plan assets as the culmination of a series of steps in a single settlement transaction. It also requires that the difference between the fair value of the obligation and the assets required to be transferred to the government, if any, should be accounted for as a subsidy from the government, separately from gain or loss on settlement of the substitutional portion of the obligation, upon completion of the transfer.
In June 2003, The Bank submitted to the government an application to transfer the obligation to pay benefits for future employee service related to the substitutional portion and the application was approved in August 2003. In
F-18
Table of Contents
THE BANK OF TOKYO-MITSUBISHI, LTD. AND SUBSIDIARIES
NOTES TO CONSOLIDATED FINANCIAL STATEMENTS—(Continued)
August 2004, the Bank made another application for transfer to the government of the remaining substitutional portion and the application was approved in November 2004. The substitutional obligation and related plan assets were transferred to a government agency in March 2005 and the Bank was released from paying the substitutional portion of the benefits to its employees. The completion of the transfer to the Japanese Government of the substitutional portion of the employee pension plan constituted a settlement of such plan. However, since there remains a defined benefit plan and the settlement occurred subsequent to December 31, 2004 (the measurement date of such plan), the impact of the transfer / settlement of a pre-tax income of ¥36.1 billion will be recognized in the fiscal year ending March 31, 2006.
Reclassifications
Certain reclassifications and format changes of the financial statements for the fiscal years ended March 31, 2003 and 2004 have been made to conform to the presentation for the fiscal year ended March 31, 2005.
Recently Issued Accounting Pronouncements
Accounting for Certain Loans and Debt Securities Acquired in a Transfer—In December 2003, the AICPA issued Statement of Position (“SOP”) 03-3, “Accounting for Certain Loans or Debt Securities Acquired in a Transfer,” which supersedes AICPA Practice Bulletin 6, “Amortization of Discounts on Certain Acquired Loans” and addresses accounting for differences between contractual cash flows and cash flows expected to be collected from an investor’s initial investment in loans or debt securities acquired in a transfer if those differences are attributable, at least, in part, to credit quality. SOP 03-3 requires acquired impaired loans for which it is probable that the investor will be unable to collect all contractually required payments receivable to be recorded at the present value of amounts expected to be received and prohibits carrying over or creation of valuation allowances in the initial accounting for these loans SOP 03-3 also limits accretable yield to the excess of the investor’s estimate of undiscounted cash flows over the investor’s initial investment in the loan and prohibits the recognition of the non-accretable difference. Subsequent increases in cash flows expected to be collected generally should be recognized prospectively through adjustment of the loan’s yield over its remaining life while any decreases in such cash flows should be recognized as impairments. SOP 03-3 also provides guidance with regard to presentation and disclosures. SOP 03-3 is effective for loans acquired in fiscal years beginning after December 15, 2004. The Group has not completed the study of what effect SOP 03-3 will have on its financial position and results of operations.
Share-Based Payment—In December 2004, the FASB issued SFAS No. 123 (revised 2004), “Share-Based Payment” (“SFAS No. 123R”). SFAS No. 123R replaces SFAS No. 123, “Accounting for Stock-Based Compensation,” and supersedes APB No. 25, “Accounting for Stock Issued to Employees.” SFAS No. 123 preferred a fair-value-based method of accounting for share-based payment transactions with employees, but it permitted the option of continuing to apply the guidance of using intrinsic-value-based measurement method in APB No. 25, as long as the footnotes to the financial statements disclosed what net income would have been had the preferable fair-value-based method been used. SFAS No. 123R establishes fair value as the measurement objective in accounting for share-based payment arrangements and requires a fair-value-based measurement method in accounting for share-based payment transactions with employees. As a result, the cost resulting from all share-based payment transactions shall be recognized in the financial statements. SFAS No. 123R is effective as of the beginning of the interim or annual reporting periods beginning after June 15, 2005. SeeSummary of Significant Accounting Policies—Stock Based Compensation—for the pro forma information as if the fair value based method had been applied to all awards in accordance with SFAS No.123.
Exchanges of Nonmonetary Assets—In December 2004, the FASB issued SFAS No. 153, “Exchanges of Nonmonetary Assets, an amendment of APB Opinion No. 29.” The guidance in APB No. 29, “Accounting for
F-19
Table of Contents
THE BANK OF TOKYO-MITSUBISHI, LTD. AND SUBSIDIARIES
NOTES TO CONSOLIDATED FINANCIAL STATEMENTS—(Continued)
Nonmonetary Transactions,” is based on the principle that exchanges of nonmonetary assets should be measured based on the fair value of the assets exchanged. The guidance in APB No. 29, however, included certain exceptions to that principle. SFAS No. 153 amends APB No. 29 to eliminate the exception for nonmonetary exchanges of similar productive assets and replaces it with a general exception for exchanges of nonmonetary assets that do not have commercial substance. A nonmonetary exchange has commercial substance if the future cash flows of the entity are expected to change significantly as a result of the exchange. SFAS No. 153 is effective for nonmonetary asset exchanges occurring in fiscal periods beginning after June 15, 2005, with earlier adoption permitted. The Group has not completed the study of what effect SFAS No. 153 will have on its financial position and results of operations.
Accounting Changes and Error Corrections—In May 2005, the FASB issued SFAS No. 154, “Accounting Changes and Error Corrections—a replacement of APB Opinion No. 20 and FASB Statement No. 3.” SFAS No. 154 replaces APB No. 20, “Accounting Changes,” and SFAS No. 3, “Reporting Accounting Changes in Interim Financial Statements,” and changes the requirements for the accounting for and reporting of a change in accounting principle. SFAS No. 154 applies to all voluntary changes in accounting principle. SFAS No. 154 also applies to changes required by an accounting pronouncement in the unusual instance that the pronouncement does not include specific transition provisions. SFAS No. 154 is effective for accounting changes and corrections of errors made in fiscal years beginning after December 15, 2005, with earlier adoption permitted. Accordingly, the Group can not reasonably estimate the ultimate impact of SFAS No. 154.
Accounting for Conditional Asset Retirement Obligations—In March 2005, the FASB issued FIN No. 47, “Accounting for Conditional Asset Retirement Obligations—an interpretation of FASB Statement No. 143.” FIN No. 47 clarifies that the term “conditional asset retirement obligation” as used in SFAS No. 143, “Accounting for Asset Retirement Obligations,” refers to a legal obligation to perform an asset retirement activity in which the timing and (or) method of settlement are conditional on a future event that may or may not be within the control of the entity. The obligation to perform the asset retirement activity is unconditional even though uncertainty exists about the timing and (or) method of settlement. SFAS No. 143 acknowledges that in some cases, sufficient information may not be available to reasonably estimate the fair value of an asset retirement obligation. FIN No. 47 also clarifies when an entity would have sufficient information to reasonably estimate the fair value of an asset retirement obligation. FIN No. 47 is effective no later than the end of fiscal years ending after December 15, 2005. The Group has not completed the study of what effect FIN No. 47 will have on its financial position and results of operations.
2. RESTRUCTURING OF THE GROUP COMPANIES
Discontinued Operations
During the fiscal year ended March 31, 2004, the Bank completed the liquidation process of its domestic mortgage securities subsidiary, The Diamond Mortgage Co., Ltd. The dissolution was due to the adverse business environment for the domestic mortgage securities business, whose results were reported as a part of the Commercial Banking business unit of the Group. In addition, during the fiscal year ended March 31, 2004, as a part of the Group’s efforts to streamline its securities business, Mitsubishi Securities, which itself constitutes a reportable operating segment of the Group, sold certain domestic subsidiaries to third parties. The Bank also sold its securities subsidiary in Europe to third parties.
In accordance with SFAS No. 144, “Accounting for Impairment of Disposal of Long-Lived Assets,” the Bank presents the results of discontinued operations as a separate line item in the consolidated statements of income.
F-20
Table of Contents
THE BANK OF TOKYO-MITSUBISHI, LTD. AND SUBSIDIARIES
NOTES TO CONSOLIDATED FINANCIAL STATEMENTS—(Continued)
The following table shows the results of discontinued operations for the fiscal years ended March 31, 2003 and 2004:
| 2003 | 2004 | |||||||
| (in millions) | ||||||||
Total revenue | ¥ | 3,077 | ¥ | 3,240 | ||||
Income (loss) from discontinued operations | ¥ | (16,227 | ) | ¥ | 2,185 | |||
Loss on disposal | — | (2,026 | ) | |||||
Income tax expense (benefit) | (26,597 | ) | 744 | |||||
Income (loss) from discontinued operations—net | ¥ | 10,370 | ¥ | (585 | ) | |||
Diamond Computer Service Co., Ltd.
In December 2004, MTFG acquired 100% of Diamond Computer Service Co., Ltd. (“DCS”), a former equity method investee, which provides data processing and IT development services, through a share exchange. 26,205 shares of MTFG’s common stock were issued in exchange for all of the outstanding shares of DCS’s common stock based on the exchange ratio of 0.00135 shares of MTFG’s common stock for each share of DCS’s common stock. Such MTFG’s common stock held by the Group and affiliated companies is presented as parent company’s stock in the consolidated balance sheets.
Mitsubishi Asset Management Co., Ltd.
In October 2004, Mitsubishi Asset Management Co., Ltd. (“MAM”) was formed by the merger of Tokyo-Mitsubishi Asset Management Ltd., the Bank’s subsidiary, and Mitsubishi Trust Asset Management Co., Ltd., a subsidiary of Mitsubishi Trust. Following the merger, in December 2004, the Bank sold certain shares of MAM to MTFG, resulting MAM to become an equity method investee. Loss on the sale is charged to capital surplus, with related income tax effects, in the consolidated statements of shareholder’s equity.
F-21
Table of Contents
THE BANK OF TOKYO-MITSUBISHI, LTD. AND SUBSIDIARIES
NOTES TO CONSOLIDATED FINANCIAL STATEMENTS—(Continued)
3. TRADING ACCOUNT ASSETS AND LIABILITIES
The following table shows trading account assets and liabilities, carried at estimated fair value, at March 31, 2004 and 2005. For trading derivative contracts executed under legally enforceable master netting agreements, related assets and liabilities are bilaterally offset and reported net by counterparty.
| 2004 | 2005 | |||||||
| (in millions) | ||||||||
Trading account assets: | ||||||||
Trading securities: | ||||||||
Japanese government, prefectural and municipal bonds | ¥ | 1,593,555 | ¥ | 2,686,769 | ||||
Commercial paper | 2,966,643 | 1,490,066 | ||||||
Foreign governments bonds and other securities | 1,182,408 | 1,319,239 | ||||||
Total | 5,742,606 | 5,496,074 | ||||||
Trading derivative assets: | ||||||||
Interest rate contracts: | ||||||||
Forwards and futures | 13,327 | 3,102 | ||||||
Swaps and swap-related products | 2,919,846 | 2,451,557 | ||||||
Options purchased | 93,994 | 98,068 | ||||||
Total | 3,027,167 | 2,552,727 | ||||||
Foreign exchange contracts: | ||||||||
Forwards and futures | 534,113 | 540,104 | ||||||
Swaps | 284,590 | 253,641 | ||||||
Options purchased | 86,992 | 103,161 | ||||||
Total | 905,695 | 896,906 | ||||||
Other contracts, mainly equity and credit-related contracts | 26,784 | 56,333 | ||||||
Bilateral netting of derivatives under master netting agreements | (1,664,389 | ) | (1,628,361 | ) | ||||
Total | ¥ | 8,037,863 | ¥ | 7,373,679 | ||||
Trading account liabilities: | ||||||||
Trading securities sold, not yet purchased | ¥ | 191,463 | ¥ | 40,246 | ||||
Trading derivative liabilities: | ||||||||
Interest rate contracts: | ||||||||
Forwards and futures | 11,236 | 4,433 | ||||||
Swaps and swap-related products | 2,791,918 | 2,378,973 | ||||||
Options written | 96,454 | 94,416 | ||||||
Total | 2,899,608 | 2,477,822 | ||||||
Foreign exchange contracts: | ||||||||
Forwards and futures | 484,005 | 542,166 | ||||||
Swaps | 319,970 | 277,116 | ||||||
Options written | 86,709 | 87,491 | ||||||
Total | 890,684 | 906,773 | ||||||
Other contracts, mainly equity and credit-related contracts | 57,263 | 75,294 | ||||||
Bilateral netting of derivatives under master netting agreements | (1,664,389 | ) | (1,628,361 | ) | ||||
Total | ¥ | 2,374,629 | ¥ | 1,871,774 | ||||
See Note 29 for the methodologies and assumptions used to estimate fair values.
Subsequent to the issuance of the Group’s consolidated financial statements for the fiscal year ended March 31, 2005, management determined that it would be more appropriate to present certain transactions to cover short sales, which were previously presented as Trading account liabilities—Trading securities sold, not yet purchased, as Obligation to return securities received as collateral to accomplish a more consistent presentation of similar
F-22
Table of Contents
THE BANK OF TOKYO-MITSUBISHI, LTD. AND SUBSIDIARIES
NOTES TO CONSOLIDATED FINANCIAL STATEMENTS—(Continued)
transactions within the Group. As a result, the corresponding amounts of such transactions at March 31, 2004 and 2005 have been reclassified accordingly.
The Group performs trading activities through market-making, sales and arbitrage, while maintaining risk levels within appropriate limits in accordance with its risk management policy. Net trading gains for the fiscal years ended March 31, 2003, 2004 and 2005 comprised the following:
| 2003 | 2004 | 2005 | |||||||||
| (in millions) | |||||||||||
Interest rate and other derivative contracts | ¥ | 262,676 | ¥ | 14,710 | ¥ | (20,275 | ) | ||||
Trading account securities, excluding derivatives | 11,047 | 102,562 | 51,587 | ||||||||
Trading account profits—net | 273,723 | 117,272 | 31,312 | ||||||||
Foreign exchange derivative contracts | (80,303 | ) | 22,836 | (2,438 | ) | ||||||
Net trading gains | ¥ | 193,420 | ¥ | 140,108 | ¥ | 28,874 | |||||
4. INVESTMENT SECURITIES
The amortized costs and estimated fair values of investment securities available for sale and being held to maturity at March 31, 2004 and 2005 were as follows:
| 2004 | 2005 | |||||||||||||||||||||||
Amortized (Restated) | Gross (Restated) | Gross (Restated) | Estimated fair value | Amortized cost | Gross unrealized gains | Gross unrealized losses | Estimated fair value | |||||||||||||||||
| (in millions) | ||||||||||||||||||||||||
Securities available for sale: | ||||||||||||||||||||||||
Debt securities: | ||||||||||||||||||||||||
Japanese national government and Japanese government agency bonds | ¥ | 12,599,395 | ¥ | 18,225 | ¥ | 9,830 | ¥ | 12,607,790 | ¥ | 11,937,428 | ¥ | 33,898 | ¥ | 423 | ¥ | 11,970,903 | ||||||||
Japanese prefectural and municipal bonds | 205,313 | 2,085 | — | 207,398 | 128,039 | 1,580 | 4 | 129,615 | ||||||||||||||||
Foreign governments and official institutions bonds | 1,423,555 | 11,153 | 10,713 | 1,423,995 | 1,503,961 | 10,852 | 16,916 | 1,497,897 | ||||||||||||||||
Corporate bonds | 1,490,532 | 9,299 | 3,999 | 1,495,832 | 1,926,997 | 23,448 | 1,789 | 1,948,656 | ||||||||||||||||
Mortgage-backed securities | 1,148,711 | 5,094 | 8,721 | 1,145,084 | 2,098,254 | 15,902 | 10,951 | 2,103,205 | ||||||||||||||||
Other debt securities | 267,437 | 1,119 | 2,602 | 265,954 | 740,950 | 5,847 | 4,242 | 742,555 | ||||||||||||||||
Marketable equity securities | 1,819,243 | 1,322,676 | 1,206 | 3,140,713 | 1,803,320 | 1,296,580 | 559 | 3,099,341 | ||||||||||||||||
Total | ¥ | 18,954,186 | ¥ | 1,369,651 | ¥ | 37,071 | ¥ | 20,286,766 | ¥20,138,949 | ¥1,388,107 | ¥34,884 | ¥21,492,172 | ||||||||||||
Securities being held to maturity: Debt securities: | ||||||||||||||||||||||||
Japanese national government and Japanese government agency bonds | ¥ | 996,398 | ¥ | 1,605 | ¥ | 1,218 | ¥ | 996,785 | ¥ | 1,997,336 | ¥ | 16,341 | ¥ | — | ¥ | 2,013,677 | ||||||||
Foreign governments and official institutions bonds | 18,112 | 80 | — | 18,192 | 15,100 | 274 | — | 15,374 | ||||||||||||||||
Corporate bonds | 35,569 | — | 3 | 35,566 | 28,009 | 66 | — | 28,075 | ||||||||||||||||
Other debt securities | 2,114 | 5 | — | 2,119 | 7,496 | 10 | — | 7,506 | ||||||||||||||||
Total | ¥ | 1,052,193 | ¥ | 1,690 | ¥ | 1,221 | ¥ | 1,052,662 | ¥ | 2,047,941 | ¥ | 16,691 | ¥ | — | ¥ | 2,064,632 | ||||||||
F-23
Table of Contents
THE BANK OF TOKYO-MITSUBISHI, LTD. AND SUBSIDIARIES
NOTES TO CONSOLIDATED FINANCIAL STATEMENTS—(Continued)
Subsequent to the issuance of the Group’s consolidated financial statements for the fiscal year ended March 31, 2004, management determined that amortized costs and gross unrealized gains and losses on securities available for sale for the fiscal year ended March 31, 2004 were erroneously disclosed. These errors had no impact on the consolidated financial position or results of operations. As a result, such amounts have been restated from the amounts previously reported as follows:
| 2004 | ||||||||||||||||||
| Amortized cost | Gross unrealized gains | Gross unrealized losses | ||||||||||||||||
| As previously reported | As restated | As previously reported | As restated | As previously reported | As restated | |||||||||||||
| (in millions) | ||||||||||||||||||
Securities available for sale: | ||||||||||||||||||
Debt securities: | ||||||||||||||||||
Foreign governments and official institutions bonds. | ¥ | 1,408,080 | ¥ | 1,423,555 | ¥ | 20,502 | ¥ | 11,153 | ¥ | 4,587 | ¥ | 10,713 | ||||||
Corporate bonds | 1,472,692 | 1,490,532 | 23,741 | 9,299 | 601 | 3,999 | ||||||||||||
Mortgage-backed securities | 1,118,981 | 1,148,711 | 30,656 | 5,094 | 4,553 | 8,721 | ||||||||||||
Other debt securities. | 266,101 | 267,437 | 2,330 | 1,119 | 2,477 | 2,602 | ||||||||||||
Investment securities other than securities available for sale or being held to maturity (i.e., nonmarketable equity securities presented in Other investment securities) were carried at cost of ¥160,343 million and ¥275,316 million, at March 31, 2004 and 2005, respectively. The corresponding estimated fair values at those dates were not readily determinable. The Group periodically monitors the status of each investee including the credit ratings and changes in the Group’s share of net assets in the investees as compared with its shares at the time of investment, to determine if impairment losses, if any, are to be recognized on these nonmarketable securities.
See Note 29 for the methodologies and assumptions used to estimate the fair values.
The amortized cost and estimated fair values of debt securities being held to maturity and the estimated fair values of debt securities available for sale at March 31, 2005 by contractual maturity are shown below. Expected maturities may differ from contractual maturities because borrowers may have the right to call or prepay obligations with or without penalties. Securities not due at a single maturity date and securities embedded with call or prepayment options, such as mortgage-backed securities, are included in the table below based on their original final maturities.
| Held-to-maturity | Available- for-sale | ||||||||
| Amortized cost | Estimated fair value | Estimated fair value | |||||||
| (in millions) | |||||||||
Due in one year or less | ¥ | 15,095 | ¥ | 15,029 | ¥ | 5,048,903 | |||
Due from one year to five years | 2,021,957 | 2,038,318 | 8,300,808 | ||||||
Due from five years to ten years | 5,947 | 5,948 | 1,472,239 | ||||||
Due after ten years | 4,942 | 5,337 | 3,570,881 | ||||||
Total | ¥ | 2,047,941 | ¥ | 2,064,632 | ¥ | 18,392,831 | |||
For the fiscal years ended March 31, 2003, 2004 and 2005, proceeds from sales of securities available for sale were ¥22,403,930 million, ¥21,657,326 million and ¥28,333,369 million, respectively. For the fiscal years ended March 31, 2003, 2004 and 2005, gross realized gains on those sales were ¥389,462 million, ¥408,732 million and ¥293,865 million, respectively, and gross realized losses on those sales were ¥118,513 million, ¥195,499 million and ¥29,151 million, respectively. In September 2000, the Bank changed its intent to hold securities originally
F-24
Table of Contents
THE BANK OF TOKYO-MITSUBISHI, LTD. AND SUBSIDIARIES
NOTES TO CONSOLIDATED FINANCIAL STATEMENTS—(Continued)
classified as held-to-maturity and transferred ¥369,039 million at carrying value of such securities to the available-for-sale category. As a result of the transfer, unrealized gains on securities available for sale were recorded against shareholder’s equity and were not significant. The Bank classified subsequent acquisitions of securities as either available for sale or trading until the fiscal year ended March 31, 2003. On April 1, 2003, the Bank reassessed the appropriateness of the classification of the securities which had been classified as available for sale and reclassified ¥50,398 million of such securities into the held-to-maturity category. The transfer did not have a material impact on its financial position or results of operations.
For the fiscal years ended March 31, 2003, 2004 and 2005, losses resulting from write-downs of investment securities to reflect the decline in value considered to be other than temporary were ¥241,635 million, ¥101, 938 million and ¥83,144 million, respectively, which were included in Investment securities gains—net in the consolidated statements of income.
The following table shows the unrealized gross losses and fair values of investment securities available for sale at March 31, 2005, by length of time that individual securities in each category have been in continuous loss position:
| Less than 12 months | 12 months or more | Total | ||||||||||||||||||
| Fair value | Unrealized losses | Fair value | Unrealized losses | Fair value | Unrealized losses | Number of securities | ||||||||||||||
| (in millions) | ||||||||||||||||||||
Securities available for sale: | ||||||||||||||||||||
Debt securities: | ||||||||||||||||||||
Japanese national government and Japanese government agency bonds | ¥ | 3,926,481 | ¥ | 423 | ¥ | — | ¥ | — | ¥ | 3,926,481 | ¥ | 423 | 22 | |||||||
Japanese prefectural and municipal bonds | 1,535 | 4 | — | — | 1,535 | 4 | 1 | |||||||||||||
Foreign governments and official institutions bonds | 779,302 | 13,925 | 110,091 | 2,991 | 889,393 | 16,916 | 201 | |||||||||||||
Corporate bonds | 82,959 | 1,789 | — | — | 82,959 | 1,789 | 43 | |||||||||||||
Mortgage-backed securities | 587,494 | 7,039 | 207,208 | 3,912 | 794,702 | 10,951 | 244 | |||||||||||||
Other debt securities | 274,184 | 3,477 | 11,049 | 765 | 285,233 | 4,242 | 71 | |||||||||||||
Marketable equity securities | 10,031 | 559 | — | — | 10,031 | 559 | 7 | |||||||||||||
Total | ¥ | 5,661,986 | ¥ | 27,216 | ¥ | 328,348 | ¥ | 7,668 | ¥ | 5,990,334 | ¥ | 34,884 | 589 | |||||||
The Group had no securities being hold to maturity with unrealized losses at March 31, 2005.
As a result of the restatement described above, the following table which sets forth the unrealized gross losses and fair values of investment securities available for sale at March 31, 2004, by length of time that individual securities in each category have been in continuous loss position, was also restated as follows:
| Less than 12 months | Number of securities | |||||||||||||||
| Fair value | Unrealized losses | |||||||||||||||
| As previously reported | As restated | As previously reported | As restated | As previously reported | As restated | |||||||||||
| (in millions) | ||||||||||||||||
Securities available for sale: | ||||||||||||||||
Debt securities: | ||||||||||||||||
Foreign governments and official institutions bonds | ¥ | 535,335 | ¥ | 605,464 | ¥ | 4,587 | ¥ | 10,713 | 94 | 96 | ||||||
Corporate bonds | 153,246 | 221,761 | 601 | 3,999 | 45 | 64 | ||||||||||
Mortgage-backed securities | 349,681 | 518,320 | 4,553 | 8,721 | 96 | 135 | ||||||||||
Other debt securities | 15,786 | 17,900 | 152 | 277 | 46 | 47 | ||||||||||
F-25
Table of Contents
THE BANK OF TOKYO-MITSUBISHI, LTD. AND SUBSIDIARIES
NOTES TO CONSOLIDATED FINANCIAL STATEMENTS—(Continued)
The Group holds various types of debt and equity securities as shown in the table of investment securities in the beginning part of this Note. Although, as shown in that table, substantial majority of such investments had unrealized gains at March 31, 2005, certain investments, primarily debt securities available for sale, had unrealized losses, most of which have been in continuous loss for a period less than 12 months.
The Group has determined that unrealized losses on investments at March 31, 2005 are temporary in nature based on its ability and intent to hold the investment for a period of time sufficient to allow for any anticipated recovery and the results of its review conducted to identify and evaluate investments that have indications of possible impairments. The Group’s review included consideration of the following criteria:
The length of time that fair value of the investment has been below cost—The Group generally deems a continued decline of fair value below cost for six months or more to be other than temporary. Certain securities held by UnionBanCal Corporation (“UNBC”), a U.S. subsidiary of the Bank, which primarily consists of securities backed by the full faith and credit of the U.S. government and corporate asset-backed and debt securities, were determined not to be impaired in some cases, on the basis of a cash flow analysis of securities and/or UNBC’s ability to hold such securities to maturity.
As shown in the table above, there were no material unrealized losses that have been in a continuous loss position for 12 months or more, except for unrealized losses on certain foreign governments and official institutions bonds, mortgage-backed securities, and other debt securities held by UNBC at March 31, 2005. Foreign governments and official institutions bonds in an unrealized loss position for 12 months or more were issued by one of the several Government-Sponsored Enterprises (“GSEs”). These securities were issued with a stated interest rate and mature in less than four years. All of the unrealized losses on these securities resulted from rising interest rates subsequent to purchase. Unrealized losses will decline as interest rates fall below the purchased yield and as the securities approach maturity. Since UNBC has the ability and intent to hold the securities until recovery of the carrying value, which could be maturity, the unrealized loss is considered temporary. Mortgage-backed securities in an unrealized loss position for 12 months or more are primarily securities guaranteed by a GSE. These securities are collateralized by residential mortgage loans and may be prepaid at par prior to maturity. All of the unrealized losses on the mortgage-backed securities resulted from rising interest rates subsequent to purchase. Because the likelihood of credit loss is remote, the securities are excluded from the periodic evaluation of other-than-temporary impairment. Other debt securities in an unrealized loss position for 12 months or more primarily consisted of collateralized loan obligations held by UNBC. Unrealized losses on such securities arise from rising interest rates, widening credit spreads, credit quality of the underlying collateral, and the market’s opinion of the performance of the fund managers. Based on the cash flow analysis set out above, such unrealized losses are determined to be temporary in nature.
The extent to which the fair value of investments has been below cost as of the end of the reporting period—The Group’s investment portfolio is exposed to volatile equity prices affected by many factors including investors’ perspectives as to future economic factors and the issuers’ performance, as well as cyclical market price fluctuation due to changes in market interest rates, foreign exchange rates, and changes in credit spreads etc. In view of the diversity and volume of equity investments as well as the fact that the majority of investments in debt securities are in high-grade fixed-rate bonds, including sovereign bonds, the Group generally deems the decline of fair value below cost of 20% or more is a critical indicator of an other-than-temporary decline in fair value.
The financial condition and near-term prospects of the issuer—The Group considers the financial condition and near-term prospects of the issuer primarily based on the credit standing of the issuers as determined by its credit rating system.
F-26
Table of Contents
THE BANK OF TOKYO-MITSUBISHI, LTD. AND SUBSIDIARIES
NOTES TO CONSOLIDATED FINANCIAL STATEMENTS—(Continued)
Exchange Traded Fund
For the fiscal years ended March 31, 2003 and 2004, the Bank transferred marketable equity securities to an exchange traded fund (“ETF”), sponsored by a securities firm. The Bank concurrently entered into sales agreements for marketable equity securities and purchase agreements for the fund units of the ETF with the securities firm. The Bank transferred its marketable equity securities to the securities firm with an aggregate cost of ¥163,861 million for ¥240,574 million, an aggregate cost of ¥54,366 million for ¥76,385 million and nil for the fiscal years ended March 31, 2003, 2004 and 2005, respectively. The securities firm contributed these marketable equity securities and additional securities purchased from the market to the ETF in order to link the ETF performance to the TOPIX (a composite index of all stocks listed on the First Section of the Tokyo Stock Exchange (“TSE”)). Certificates issued by the ETF (the “ETF certificates”) are linked to the TOPIX and have been listed on the TSE. The Bank purchased the ETF certificates at the fair value of ¥361,782 million, ¥113,930 million and nil for the fiscal years ended March 31, 2003, 2004 and 2005, respectively, with an intention to sell them in the market or to the securities firm in the near future.
The Bank accounted for the ETF certificates purchased from the securities firm as retained interests in the marketable equity securities transferred to the securities firm. The Bank accounted for the transfer of marketable equity securities as a sale when the Bank received cash or financial instruments other than the ETF certificates. For the fiscal years ended March 31, 2003, 2004 and 2005, the Bank recognized gains of ¥41,883 million, ¥89,581 million and nil, respectively, on the sales of the ETF certificates. The Bank held ETF certificates with fair values of ¥148,646 million at March 31, 2003 and nil at March 31, 2004 and 2005 in Securities available for sale. The ETF certificates are carried at fair value based on the market prices observed in the TSE and the fair value change is closely linked with the movement of the TOPIX.
Banks’ Shareholdings Purchase Corporation
Under a law forbidding banks from holding marketable equity securities in excess of their Tier I capital after September 30, 2006, the Banks’ Shareholdings Purchase Corporation (“BSPC”) was established in January 2002 in order to soften the impact on the stock market of sales of cross-shareholdings. BSPC began accepting share offers from financial institutions on February 15, 2002. It has been funded by financial institutions, including the Bank, which made initial contributions of ¥1,400 million (“preferred contributions”). BSPC will be disbanded when it sells all shares that it purchased from financial institutions, or by March 31, 2017, at the latest.
BSPC has two accounts to purchase stock from financial institutions; the General Account and the Special Account. In the General Account, each selling financial institution funds the amount of purchase by BSPC without guarantees by the Japanese government, and the financial institution will assume any gains or losses on sales by BSPC of the stocks. In the Special Account, each selling financial institution was required to make contributions of 8% of the selling prices to BSPC for purchases made prior to the effective date of the amendment to the above-mentioned law to fund any future losses (“subordinated contributions”). Effective in August 2003, the requirement of subordinated contributions was eliminated under the amendment to legislation. The purchase amount in the Special Account is funded by borrowings guaranteed by the Japanese government with a limit of ¥2.0 trillion. The cumulative net loss on sales of stocks in the Special Account, which will not be determined and finalized before the liquidation of BSPC, will be compensated first by the subordinated contributions, and then by the preferred contributions. If there is a remaining loss, the government, as a guarantor, will be liable for the loss. On the other hand, if there is a cumulative net asset at the time of the liquidation, the asset is first used to repay the preferred contributions and then to repay the subordinated contributions. After that, if any remaining net assets after repayment of subordinated contributions exist, such net assets will be paid out and the amounts will be determined based on the amounts of both contributions. Any remaining net assets in excess of double the amount of the contributions will belong to the Japanese government.
F-27
Table of Contents
THE BANK OF TOKYO-MITSUBISHI, LTD. AND SUBSIDIARIES
NOTES TO CONSOLIDATED FINANCIAL STATEMENTS—(Continued)
At the establishment of BSPC in January 2002, the Bank paid ¥1,400 million to BSPC as preferred contributions. The Bank sold marketable equity securities with aggregate market values of nil, ¥134,495 million and ¥59,120 million, respectively, for the fiscal years ended March 31, 2003, 2004 and 2005. At the time of the sales, the Bank made subordinated contribution to the Special Account of ¥1,164 million for the fiscal year ended March 31, 2002. Also, the Bank made loans to BSPC to fund its purchases of marketable equity securities. Such loans to BSPC, which are guaranteed by the Japanese government, amounted to ¥79,735 million, ¥7,398 million and ¥141,727 million, respectively, at March 31, 2003, 2004 and 2005. For the fiscal year ended March 31, 2003, the Bank evaluated its preferred contributions of ¥1,400 million and subordinated contributions of ¥1,164 million for impairment, and recognized an impairment loss of ¥2,564 million.
The Bank accounts for the transfers of marketable equity securities to the General Account, if any, as secured borrowings. With respect to the transfers of marketable equity securities to the Special Account with the requirement of subordinated contributions, if the fair value of the securities sold to the Special Account is greater than 10% of the fair value of all securities held by the Special Account, the Group accounts for the subordinated contributions as a partial retained interest in the sale. For all period presented, the Group made no sales of securities whose fair value was greater than 10% of the fair value of all securities held by the Special Account. For the fiscal years ended March 31, 2003, 2004 and 2005, the Bank recognized a gain of nil, ¥27,482 million and ¥35,434 million, respectively, on the sale of marketable equity securities to the Special Account.
The Bank of Japan
The Bank of Japan began purchasing marketable equity securities at fair value from banks, including the Bank, from November 2002, aiming to enhance the stability of the Japanese financial system by reducing the amount of marketable equity securities on the balance sheets of banks. Transfers of securities to the Bank of Japan are sales transactions without transferors’ continuing involvement. The Bank sold marketable equity securities to the Bank of Japan with aggregate market values of ¥51,453 million ¥38,553 million and nil for the fiscal years ended March 31, 2003, 2004 and 2005, respectively. In September 2004, the Bank of Japan ended purchasing marketable equity securities from banks.
F-28
Table of Contents
THE BANK OF TOKYO-MITSUBISHI, LTD. AND SUBSIDIARIES
NOTES TO CONSOLIDATED FINANCIAL STATEMENTS—(Continued)
5. LOANS
Loans at March 31, 2004 and 2005 by domicile and type of industry of borrower are summarized below:
Classification of loans by industry is based on the industry segment loan classification as defined by the Bank of Japan.
2004 (Restated) | 2005 (Restated) | |||||||
| (in millions) | ||||||||
Domestic: | ||||||||
Manufacturing | ¥ | 4,692,433 | ¥ | 5,280,555 | ||||
Construction | 832,758 | 815,051 | ||||||
Real estate | 3,515,717 | 4,156,975 | ||||||
Services | 3,661,758 | 2,965,772 | ||||||
Wholesale and retail | 4,311,980 | 4,527,379 | ||||||
Banks and other financial institutions | 1,676,785 | 2,364,504 | ||||||
Communication and information services | 650,983 | 605,910 | ||||||
Other industries | 4,750,575 | 5,344,587 | ||||||
Consumer | 7,562,590 | (2) | 7,662,809 | (2) | ||||
Total domestic | 31,655,579 | 33,723,542 | ||||||
Foreign: | ||||||||
Governments and official institutions | 178,402 | 209,060 | ||||||
Banks and other financial institutions | 904,841 | 780,666 | ||||||
Commercial and industrial | 7,063,034 | 8,553,679 | ||||||
Other | 156,369 | 171,514 | ||||||
Total foreign | 8,302,646 | 9,714,919 | ||||||
Less unearned income and deferred loan fees—net | 27,183 | 16,983 | ||||||
Total(1) | ¥ | 39,931,042 | ¥43,421,478 | |||||
Notes:
| (1) | The above table includes loans held for sale of ¥9,960 million and ¥33,246 million at March 31, 2004 and 2005, respectively. |
| (2) | Domestic loans within the “consumer” category in the above table include loans to individuals who utilize loan proceeds to finance their proprietor activities and not for their personal financing needs. During the fiscal year ended March 31, 2004, the Bank’s credit administration system was upgraded and became able to present a precise breakdown of the balance of such consumer loans by the type of proprietor business. This breakdown at March 31, 2004 and 2005 is presented below: |
| Manufacturing | Construction | Real estate | Services | Wholesale and retail | Banks and other financial institutions | Communication and information services | Other industries | Total included in Consumer | |||||||||||||||||||
March 31, 2004 | ¥ | 28,229 | ¥ | 19,283 | ¥ | 738,377 | ¥ | 230,730 | ¥ | 52,253 | ¥ | 1,200 | ¥ | 4,121 | ¥ | 10,620 | ¥ | 1,084,813 | |||||||||
March 31, 2005 | ¥ | 23,023 | ¥ | 16,157 | ¥ | 542,969 | ¥ | 193,417 | ¥ | 39,806 | ¥ | 1,126 | ¥ | 3,681 | ¥ | 7,782 | ¥ | 827,961 | |||||||||
Subsequent to the issuance of the Group’s consolidated financial statements for the fiscal year ended March 31, 2005, management determined that the details of loans by domicile and type of industry of borrower for the fiscal year ended March 31, 2004 and 2005 were erroneously disclosed. These errors had no impact on the consolidated
F-29
Table of Contents
THE BANK OF TOKYO-MITSUBISHI, LTD. AND SUBSIDIARIES
NOTES TO CONSOLIDATED FINANCIAL STATEMENTS—(Continued)
financial position or results of operations. As a result, such amounts have no impact on the consolidated financial position or results of operations. As a result, such amounts have been restated from the amounts previously reported as follows:
| 2004 | 2005 | |||||||||||
| As previously reported | As restated | As previously reported | As restated | |||||||||
| (in millions) | ||||||||||||
Domestic: | ||||||||||||
Banks and other financial institutions | ¥ | 1,765,377 | ¥ | 1,676,785 | ¥ | 2,447,443 | ¥ | 2,364,504 | ||||
Other industries | 4,750,575 | 4,750,575 | 5,261,648 | 5,344,587 | ||||||||
Consumer | 7,473,998 | 7,562,590 | 7,662,809 | 7,662,809 | ||||||||
Foreign: | ||||||||||||
Banks and other financial institutions | 904,841 | 904,841 | 1,075,339 | 780,666 | ||||||||
Commercial and industrial | 7,063,034 | 7,063,034 | 8,259,006 | 8,553,679 | ||||||||
Substantially all domestic loans are made under agreements which, as is customary in Japan, provide that a bank may, under certain conditions, require the borrower to provide collateral (or additional collateral) or guarantees with respect to the loans, and that the bank may treat any collateral, whether furnished as security for loans or otherwise, as collateral for all indebtedness to the bank. At March 31, 2004 and 2005, such collateralized loans originated by the Group, which were principally collateralized by real estate, marketable securities and accounts receivable, amounted to ¥5,587,347 million and ¥5,020,175 million, respectively, which represented 18% and 15%, respectively, of the total domestic loans at March 31, 2004 and 2005.
Nonaccrual and restructured loans were ¥1,217,268 million and ¥996,405 million at March 31, 2004 and 2005, respectively. Had interest on these loans been accrued at the original terms of agreement, gross interest income on such loans for the fiscal years ended March 31, 2004 and 2005 would have been approximately ¥33.6 billion and ¥27.7 billion, respectively, of which approximately ¥22.8 billion and ¥21.0 billion, respectively, were included in interest income on loans in the accompanying consolidated statements of income. Accruing loans contractually past due 90 days or more were ¥11,979 million and ¥10,110 million at March 31, 2004 and 2005, respectively.
The Group had provided commitments to extend credit with customers owing restructured loans. The amounts of such commitments were ¥30,777 million and ¥18,195 million at March 31, 2004 and 2005, respectively. See Note 23 for further discussion of commitments to extend credit.
Impaired Loans
The Group’s impaired loans primarily include nonaccrual loans and restructured loans. A summary of the recorded balances of impaired loans and related impairment allowance at March 31, 2004 and 2005 is shown below:
| 2004 | 2005 | |||||||||||
| Recorded loan balance | Impairment allowance | Recorded loan balance | Impairment allowance | |||||||||
| (in millions) | ||||||||||||
Requiring an impairment allowance | ¥ | 972,649 | ¥ | 380,934 | ¥ | 790,844 | ¥ | 343,197 | ||||
Not requiring an impairment allowance | 144,726 | — | 126,271 | — | ||||||||
Total | ¥ | 1,117,375 | ¥ | 380,934 | ¥ | 917,115 | ¥ | 343,197 | ||||
| Note: | In addition to impaired loans presented in the above table, there were loans held for sale that were impaired of ¥9,704 million and ¥12,149 million at March 31, 2004 and 2005, respectively. |
F-30
Table of Contents
THE BANK OF TOKYO-MITSUBISHI, LTD. AND SUBSIDIARIES
NOTES TO CONSOLIDATED FINANCIAL STATEMENTS—(Continued)
The average recorded investments in impaired loans were approximately ¥2,555 billion, ¥1,542 billion and ¥1,095 billion, respectively, for the fiscal years ended March 31, 2003, 2004 and 2005.
For the fiscal years ended March 31, 2003, 2004 and 2005, the Group recognized interest income of approximately ¥56.9 billion, ¥29.9 billion and ¥22.7 billion, respectively, on impaired loans. Interest income on nonaccrual loans was recognized on a cash basis when ultimate collectibility of principal is certain; otherwise, cash receipts are applied as principal reductions. Interest income on accruing impaired loans, including restructured loans, was recognized on an accrual basis to the extent that the collectibility of interest income was reasonably certain based on management’s assessment.
Lease Receivable
As part of its financing activities, the Group enters into leasing arrangements with customers. The Group’s leasing operations are performed through leasing subsidiaries and consist principally of direct financing leases involving various types of data processing equipment, office equipment and transportation equipment.
As of March 31, 2004 and 2005, the components of the investment in direct financing leases were as follows:
| 2004 | 2005 | |||||||
| (in millions) | ||||||||
Minimum lease payment receivable | ¥ | 594,974 | ¥ | 539,180 | ||||
Estimated residual values of leased property | 61,100 | 29,509 | ||||||
Less—unearned income | (49,920 | ) | (47,807 | ) | ||||
Net investment in direct financing leases | ¥ | 606,154 | ¥ | 520,882 | ||||
Future minimum lease payment receivables under noncancelable leasing agreements as of March 31, 2005 are as follows:
| Direct financing leases | |||
| (in millions) | |||
Fiscal year ending March 31: | |||
2006 | ¥ | 138,490 | |
2007 | 107,315 | ||
2008 | 73,209 | ||
2009 | 47,865 | ||
2010 | 26,360 | ||
2011 and thereafter | 145,941 | ||
Total minimum lease payment receivables | ¥ | 539,180 | |
Government-led Loan Restructuring Program
Under the legislation enacted by the Japanese Diet in June 1996, which incorporates the restructuring program for the loans of seven failed housing-loan companies (the “Jusen”), the Deposit Insurance Corporation (“DIC”) established a Housing Loan Administration Corporation ( “HLAC”) to collect and dispose of the loans of the liquidated Jusen. In 1999, HLAC merged with the Resolution and Collection Bank Limited to create the Resolution and Collection Corporation (“RCC”), which is wholly owned by the DIC.
F-31
Table of Contents
THE BANK OF TOKYO-MITSUBISHI, LTD. AND SUBSIDIARIES
NOTES TO CONSOLIDATED FINANCIAL STATEMENTS—(Continued)
Financial institutions, including the Group, waived the repayment of substantial amounts of the loans to the Jusen and transferred the remaining balances to HLAC. Financial institutions were requested to make loans to HLAC to finance its collection activities, and in the fiscal year ended March 31, 1997, the Group made loans of ¥184,197 million with an original maturity term of 15 years. The 15-year term loans to HLAC, which are guaranteed by the DIC under the legislation and the loan agreements, mature in 2011 and earn interest at TIBOR (Tokyo Interbank Offered Rate) plus 0.125%. At March 31, 2004 and 2005, outstanding loans to HLAC were ¥171,160 million and ¥116,638, respectively. During the fiscal year ended March 31, 2005, a part of the loan was repaid before the maturity.
Under this restructuring program, a Financial Stabilization Fund (the “Special Fund”) was established within the DIC, and the Bank of Japan and other financial institutions established another fund (the “New Fund”). These funds are principally invested in Japanese government bonds. The Group made non-interest-earning deposits of ¥111,124 million with the Special Fund and the New Fund in the fiscal year ended March 31, 1997. The deposit balances as of March 31, 2004 and 2005, which are included in Other Assets, were ¥82,104 million and ¥84,765 million, respectively, reflecting a present value discount and subsequent amortization of the discount during the period until the expected maturity date. The non-interest-earning deposits with these funds are expected to mature in 15 years from the deposit dates, which coincides with the planned operational lifespan of HLAC.
It is uncertain what losses (so-called “stage two loss”), if any, may ultimately be incurred by RCC through the collection of the Jusen loans during the 15-year term. If any such losses ultimately occur, the Japanese government will be liable for half of such losses, and the investment income to be earned by the Special Fund during the 15 years is to be used to cover the remaining half of the losses. The investment income to be earned by the New Fund during the 15 years is used to compensate for a portion of the public funds used for the Jusen restructuring.
At this time management believes all loans and deposits will be collectible according to their respective terms.
Sales of Loans
The Group originates various types of loans to corporate and individual customers in Japan and overseas in the normal course of its business. The Financial Services Agency of Japan (the “FSA”) announced in October 2002 that it will strive to reduce the aggregate ratio of nonperforming loans to total loans of major Japanese banks, including the Group, by approximately half by March 31, 2005. Pursuant to the FSA’s policy and in order to improve its loan quality, the Group actively disposed of nonperforming loans. Most of such nonperforming loans were disposed of by sales to third party purchasers including RCC without any continuing involvement. Management of the Group generally decides on approvals for disposals after significant sales terms, including prices, are negotiated. As such, loans are disposed of by sales shortly after the loans are transferred to held-for-sale classification. For the fiscal year ended March 31, 2003, the loss on sales of loans, which represents an additional provision for credit losses on such decision, was ¥37,173 million. The gains on sales of loans were ¥5,479 and ¥9,052 million for the fiscal years ended March 31, 2004 and 2005, respectively. Such gains and losses are included in the provision (credit) for credit losses in the accompanying consolidated statements of income.
Loan Securitization
The Group had no significant transfers of loans in securitization transactions accounted for as sales for the fiscal years ended March 31, 2003 and 2004, and did not retain any significant interests associated with loans transferred in securitizations at March 31, 2004. The Group securitized mortgage loans in the fiscal year ended March 31, 2005. After securitizations of mortgage loans, the Group provides servicing and advancing line for the loans transferred to the trust. As a result of the securitization, the Group received the proceeds of ¥8,620 million and recognized gain of ¥154 million for the fiscal year ended March 31, 2005. The Group did not possess any retained interests associated with the securitization at March 31, 2005.
F-32
Table of Contents
THE BANK OF TOKYO-MITSUBISHI, LTD. AND SUBSIDIARIES
NOTES TO CONSOLIDATED FINANCIAL STATEMENTS—(Continued)
Related party loans
In some cases, the Bank and its banking subsidiaries make loans to related parties, including their directors and executive officers, in the course of their normal commercial banking business. At March 31, 2004 and 2005, outstanding loans to such related parties were not significant.
In the opinion of management, these related party loans were made on substantially the same terms, including interest rates and collateral requirements, as those terms prevailing at the date these loans were made. For the fiscal years ended March 31, 2003, 2004 and 2005, there were no loans to related parties that were charged-off. Additionally, at March 31, 2004 and 2005, there were no loans to related parties that were impaired.
6. ALLOWANCE FOR CREDIT LOSSES
Changes in the allowance for credit losses for the fiscal years ended March 31, 2003, 2004 and 2005 are shown below:
| 2003 | 2004 | 2005 | ||||||||
| (in millions) | ||||||||||
Balance at beginning of fiscal year | ¥ | 1,341,608 | ¥ | 1,058,633 | ¥ | 649,346 | ||||
Provision (credit) for credit losses | 287,282 | (142,362 | ) | 125,109 | ||||||
Charge-offs | 640,122 | 277,713 | 233,627 | |||||||
Less—Recoveries | 66,648 | 30,036 | 23,876 | |||||||
Net charge-offs | 573,474 | 247,677 | 209,751 | |||||||
Others | 3,217 | (19,248 | ) | 3,781 | ||||||
Balance at end of fiscal year | ¥ | 1,058,633 | ¥ | 649,346 | ¥ | 568,485 | ||||
Note: Others principally include foreign exchange translation and discontinued operations adjustments.
As explained in Note 5, nonperforming loans were actively disposed of by sales during recent years. The allocated allowance for credit losses for such loans were removed from the allowance for credit losses and transferred to the valuation allowance for loan held for sale upon a decision to sell. Net charge-offs in the above table include the decrease in the allowance for credit losses due to loan disposal activity amounting to ¥310.7 billion, ¥120.1 billion and ¥25.3 billion for the fiscal years ended March 31, 2003, 2004 and 2005, respectively.
7. PREMISES AND EQUIPMENT
Premises and equipment at March 31, 2004 and 2005 consisted of the following:
| 2004 | 2005 | |||||
| (in millions) | ||||||
Land | ¥ | 96,802 | ¥ | 97,565 | ||
Buildings | 319,088 | 314,779 | ||||
Equipment and furniture | 394,419 | 393,214 | ||||
Leasehold improvements | 205,538 | 207,973 | ||||
Construction in progress | 4,136 | 2,923 | ||||
Total | 1,019,983 | 1,016,454 | ||||
Less accumulated depreciation | 585,460 | 589,069 | ||||
Premises and equipment—net | ¥ | 434,523 | ¥ | 427,385 | ||
F-33
Table of Contents
THE BANK OF TOKYO-MITSUBISHI, LTD. AND SUBSIDIARIES
NOTES TO CONSOLIDATED FINANCIAL STATEMENTS—(Continued)
Premises and equipment include capitalized leases, principally related to data processing equipment, which amounted to ¥39,813 million and ¥46,054 million at March 31, 2004 and 2005, respectively. Accumulated depreciation on such capitalized leases at March 31, 2004 and 2005 amounted to ¥26,239 million and ¥30,880 million, respectively.
Depreciation expense of premises and equipment for the fiscal years ended March 31, 2003, 2004 and 2005 was ¥53,950 million, ¥48,179 million and ¥40,052 million, respectively.
In March 1999, the Bank sold a 50% undivided interest in its head office land and building (including structure and equipment) for ¥91,500 million and in its main office land and building (including structure and equipment) for ¥9,100 million to an unrelated real estate company. At the same time, the Bank entered an agreement to lease back the 50% undivided interest in the buildings sold from the buyer over a period of 7 years. The Bank accounted for these transactions as financing arrangements, and recorded the total proceeds of ¥100,600 million as a financing obligation. Under the lease agreement, the Bank made non-interest-bearing deposits of ¥8,000 million with the buyer-lessor in March 1999. The lease payments are determined each year upon negotiations with the buyer-lessor, based on future market conditions and expenditures for significant improvements and the related expenses of the buildings to be born by the buyer-lessor. The lease agreement is noncancelable during the lease period of 7 years. At the end of the lease, the Bank has no obligations or options specified in the lease agreement.
At March 31, 2004 and 2005, the financing obligation was ¥102,795 million and ¥103,658 million, respectively, and total rental payments amounted to ¥6,190 million, ¥6,371 million and ¥6,594 million, respectively, for the fiscal years ended March 31, 2003, 2004 and 2005.
For the fiscal years ended March 31, 2003, 2004 and 2005, the Group recognized ¥11,112 million, ¥5,377 million and ¥1,183 million of impairment losses for long-lived assets, primarily domestic real estate which was either assets formerly used for its domestic banking operations that are no longer used or assets that are used without recoverability of carrying amount. In addition, ¥415 million, ¥1,832 million and ¥947 million of impairment losses were recognized for real estate held for sale for the fiscal years ended March 31, 2003, 2004 and 2005. These losses are included in Other non-interest expenses. In computing the amount of impairment losses, fair value was determined primarily based on market prices, if any, or the estimated price based on an appraisal.
8. GOODWILL AND OTHER INTANGIBLE ASSETS
As discussed in Note 1, on April 1, 2002, the Group adopted SFAS No. 142 which requires that goodwill, formerly subject to amortization, no longer be amortized and be tested for impairment at least annually. Further, SFAS No. 142 requires that intangible assets with finite useful lives continue to be amortized over their useful lives while intangible assets with indefinite lives no longer be amortized but rather are subject to impairment testing at least annually.
On April 1, 2002, the Group has performed the required transitional impairment tests of goodwill and intangible assets with indefinite lives upon adoption of SFAS No. 142. The initial adoption resulted in a cumulative adjustment charge to earnings of ¥532 million related to the impairment of goodwill. Such cumulative adjustment primarily resulted from an impairment of goodwill related to a U.S. leasing business and was measured using the discounted future cash flow method. Intangible assets with indefinite lives, which were amortized in the prior periods, were immaterial.
F-34
Table of Contents
THE BANK OF TOKYO-MITSUBISHI, LTD. AND SUBSIDIARIES
NOTES TO CONSOLIDATED FINANCIAL STATEMENTS—(Continued)
Goodwill
The changes in the carrying amount of goodwill by business segment during the fiscal years ended March 31, 2004 and 2005 were as follows:
| Mitsubishi Securities | UNBC | Total | ||||||||||
| (in millions) | ||||||||||||
For the fiscal year ended March 31, 2004 | ||||||||||||
Balance at March 31, 2003 | ¥ | 383 | ¥ | 18,050 | ¥ | 18,433 | ||||||
Goodwill acquired during the fiscal year | — | 10,876 | 10,876 | |||||||||
Goodwill written off related to sale of subsidiaries | (280 | ) | — | (280 | ) | |||||||
Foreign currency translation adjustments and other | — | (2,119 | ) | (2,119 | ) | |||||||
Balance at March 31, 2004 | ¥ | 103 | ¥ | 26,807 | ¥ | 26,910 | ||||||
For the fiscal year ended March 31, 2005 | ||||||||||||
Balance at March 31, 2004 | ¥ | 103 | ¥ | 26,807 | ¥ | 26,910 | ||||||
Goodwill acquired during the fiscal year | — | 31,105 | 31,105 | |||||||||
Foreign currency translation adjustments and other | — | (1,891 | ) | (1,891 | ) | |||||||
Balance at March 31, 2005 | ¥ | 103 | ¥ | 56,021 | ¥ | 56,124 | ||||||
See Note 27 for the business segment information of the Group.
Other Intangible Assets
The table below presents the gross carrying amount, accumulated amortization and net carrying amount, in total and by major class of intangible assets at March 31, 2004 and 2005:
| 2004 | 2005 | |||||||||||||||||
| Gross carrying amount | Accumulated amortization | Net carrying amount | Gross carrying amount | Accumulated amortization | Net carrying amount | |||||||||||||
| (in millions) | ||||||||||||||||||
Intangible assets subject to amortization: | ||||||||||||||||||
Software | ¥ | 331,741 | ¥ | 149,668 | ¥ | 182,073 | ¥ | 402,847 | ¥ | 200,934 | ¥ | 201,913 | ||||||
Core deposit intangible | 4,041 | 1,672 | 2,369 | 7,006 | 3,113 | 3,893 | ||||||||||||
Other | 9,106 | 5,206 | 3,900 | 10,363 | 6,340 | 4,023 | ||||||||||||
Total | ¥ | 344,888 | ¥ | 156,546 | 188,342 | ¥ | 420,216 | ¥ | 210,387 | 209,829 | ||||||||
Intangible assets recorded in connection with the additional minimum pension liabilities under SFAS No.87 (See Note 15) | 2,776 | 1,822 | ||||||||||||||||
Intangible assets not subject to amortization | 7,188 | 4,483 | ||||||||||||||||
Total | ¥ | 198,306 | ¥ | 216,134 | ||||||||||||||
Intangible assets subject to amortization acquired during the fiscal year ended March 31, 2005 amounted to ¥63,418 million, which primarily consist of capitalized cost of software. The weighted average amortization period for capitalized software is five years, and the amount of its residual value is immaterial.
F-35
Table of Contents
THE BANK OF TOKYO-MITSUBISHI, LTD. AND SUBSIDIARIES
NOTES TO CONSOLIDATED FINANCIAL STATEMENTS—(Continued)
For the fiscal years ended at March 31, 2004 and 2005, the Group recognized ¥215 million and ¥2,134 million of impairment losses for intangible assets not subject to amortization, which primarily consist of leasehold and telephone subscription rights, whose carrying amount exceeded its fair value. These losses are included in Other non-interest expenses. In computing the amount of impairment losses, fair value was determined primarily based on market prices, if any, or the estimated price based on an appraisal.
The estimated aggregate amortization expense for intangible assets for the next five fiscal years is as follows:
| (in millions) | |||
Fiscal year ending March 31, | |||
2006 | ¥ | 70,187 | |
2007 | 44,258 | ||
2008 | 35,439 | ||
2009 | 25,275 | ||
2010 | 15,396 | ||
9. INCOME TAXES
The detail of current and deferred income tax expense (benefit) for the fiscal years ended March 31, 2003, 2004 and 2005 was as follows:
| 2003 | 2004 (Restated) | 2005 | ||||||||||
| (in millions) | ||||||||||||
Current: | ||||||||||||
Domestic | ¥ | 18,929 | ¥ | 4,590 | ¥ | 8,484 | ||||||
Foreign | 41,845 | 40,656 | 50,848 | |||||||||
Total | 60,774 | 45,246 | 59,332 | |||||||||
Deferred: | ||||||||||||
Domestic | (25,755 | ) | 276,127 | 170,860 | ||||||||
Foreign | 15,416 | 12,239 | 8,606 | |||||||||
Total | (10,339 | ) | 288,366 | 179,466 | ||||||||
Income tax expense from continuing operations | 50,435 | 333,612 | 238,798 | |||||||||
Income tax expense (benefit) from discontinued operations | (26,597 | ) | 744 | — | ||||||||
Income tax expense (benefit) reported in shareholder’s equity relating to: | ||||||||||||
Investment securities available for sale | (256,383 | ) | 252,131 | 3,303 | ||||||||
Derivatives qualifying for cash flow hedges | 513 | (1,789 | ) | (198 | ) | |||||||
Minimum pension liability adjustments | (34,295 | ) | 30,804 | 7,613 | ||||||||
Foreign currency translation adjustments | (3,299 | ) | (4,324 | ) | 7,760 | |||||||
Total | (293,464 | ) | 276,822 | 18,478 | ||||||||
Total | ¥ | (269,626 | ) | ¥ | 611,178 | ¥ | 257,276 | |||||
F-36
Table of Contents
THE BANK OF TOKYO-MITSUBISHI, LTD. AND SUBSIDIARIES
NOTES TO CONSOLIDATED FINANCIAL STATEMENTS—(Continued)
Subsequent to the issuance of the Group’s consolidated financial statements for the fiscal year ended March 31, 2004, management determined that the details of current tax expense for the fiscal year ended March 31, 2004 were erroneously disclosed. These errors had no impact on the consolidated financial position or results of operations. As a result, such amounts have been restated from the amounts previously reported as follows:
| 2004 | |||||||
| As previously reported | As restated | ||||||
| (in millions) | |||||||
Current: | |||||||
Domestic | ¥ | (3,324 | ) | ¥ | 4,590 | ||
Foreign | 48,570 | 40,656 | |||||
Total | ¥ | 45,246 | ¥ | 45,246 | |||
Income taxes in Japan applicable to the Group are imposed by the national, prefectural and municipal governments, and in the aggregate resulted in a normal effective statutory rate of approximately 38.0%, 38.0% and 40.6%, respectively, for the fiscal years ended March 31, 2003, 2004 and 2005. Foreign subsidiaries are subject to income taxes of the countries in which they operate.
Consolidated Corporate Tax
In March 2003, MTFG’s application to file its tax returns under the consolidated corporate-tax system was approved by the Japanese tax authorities, and the consolidated corporate-tax system has become effective for the fiscal year ended March 31, 2003. At March 31, 2004 and 2005, the tax-related payable to MTFG, which was included in other liabilities were ¥31,212 million and ¥8,965 million, respectively. The Group, however, has used the separate return method of allocation. Under the separate return method of allocation, current and deferred taxes for the fiscal years ended March 31, 2003, 2004 and 2005 was determined by applying the requirements of SFAS No. 109 as if the Group was filing a separate tax return. Although the consolidated corporate-tax system requires to pay, for the fiscal years ended March 31, 2003 and 2004, a surcharge tax of 2.0% of taxable income in addition to the national corporate income tax rate. The Group reflected a tax provision calculated on the separate tax return basis and the combined normal effective statutory tax rate of the Group did not change. The difference between the cash flows that are to be paid or received under the Japanese tax law and the separate return method of tax allocation used for financial reporting purposes is reported in the financial statements as either a charge to retained earnings or a credit to paid-in capital.
In February 2005, MTFG’s application to suspend the consolidated corporate-tax system was approved by the Japanese tax authorities. The MTFG Group filed, for the fiscal year ended March 31, 2005, its tax returns under the consolidated corporate-tax system. Due to the suspension of the consolidated corporate-tax system, deferred income taxes have been calculated separately based on temporary differences as of March 31, 2005 and future taxable income at each company. In connection with the suspension, Japanese tax law requires MTFG to return the remaining net operating loss carryforwards (“NOLs”) to each subsidiary in which they originated. The balance of the Bank’s NOLs under Japanese tax law after the allocation, which occurred on April 1, 2005, is greater than that for financial accounting purposes at the same date. This is because more NOLs were reported as being utilized for financial reporting purposes, under the separate return basis, than were actually realized under the consolidated corporate-tax system. Based on the fact that the application to suspend the consolidated corporate-tax system was approved in February 2005, the Bank recognized an increase in deferred tax assets for this against the difference during the fiscal year ended March 31, 2005, which was credited to capital surplus.
F-37
Table of Contents
THE BANK OF TOKYO-MITSUBISHI, LTD. AND SUBSIDIARIES
NOTES TO CONSOLIDATED FINANCIAL STATEMENTS—(Continued)
Bank Tax
On March 30, 2000, the Tokyo Metropolitan Assembly passed a new tax rule that changed the basis on which it taxes large banks conducting business in Tokyo. The Bank is subject to the new rule. The new rule requires large banks to pay a 3.0% local tax on their gross operating income derived from their Tokyo operations for a period of five fiscal years commencing April 1, 2000.
On May 30, 2000, the Osaka Prefectural Assembly also passed a new tax rule that is substantially the same as the rule approved by the Tokyo Metropolitan Assembly. The new rule requires large banks to pay a 3.0% local tax on their gross operating income derived from Osaka operations for a period of five fiscal years commencing April 1, 2001.
The banks subject to the new tax rule, including the Bank, filed a complaint in October 2000 with the Tokyo District Court, calling for nullification of the new tax, which they claimed, unfairly targets banks. On March 26, 2002, the Tokyo District Court rejected the new tax enacted by the Tokyo Metropolitan Assembly. The court ordered the Tokyo Metropolitan Government to refund ¥72.4 billion in tax payments to 18 major banks and to pay an additional ¥1.8 billion in compensation.
On March 29, 2002, the Metropolitan Government lodged an appeal at the Tokyo High Court. Following the decision of the Tokyo District Court, 16 major banks filed a lawsuit on April 4, 2002 with the Osaka District Court against the Osaka Prefectural Government, seeking to nullify the new tax rule. In response to the lawsuit, on May 30, 2002, the Osaka Prefectural Government enacted a revised tax rule that changed the taxation for the fiscal year ended March 31, 2002 and the years subject to the new tax rule. Under the revised tax rule, for the fiscal years ended March 31, 2002 and 2003, large banks became subject to local taxes based on the lower of the 3.0% local tax on their gross operating income or the local tax computed based on net income. As a result of the revisions, the Bank did not pay any local taxes to the Osaka Prefectural Government for the fiscal years ended March 31, 2002 and 2003. The Bank incurred new local taxes to the Tokyo Metropolitan Government of ¥14.7 billion, ¥14.6 billion and ¥15.0 billion for the fiscal years ended March 31, 2001, 2002 and 2003, respectively. Had the Bank paid the local taxes based on net income under the former rule, tax expense would have been ¥6.6 billion for the year ended March 31, 2001, and zero for the fiscal years ended March 31, 2002 and 2003.
On January 30, 2003, the Tokyo High Court also rejected the new tax rule and ordered the Tokyo Metropolitan Government to refund tax payments that the banks had paid over the past two years, which represents the difference between the 3.0% tax on the gross operating profits paid by the banks and the amount computed based on net income under the former rule. The order includes the refund of ¥21.8 billion to the Bank. However, the Tokyo High Court reversed the lower court on the issue of additional compensation. The Tokyo Metropolitan Government appealed this decision to the Supreme Court of Japan.
On October 8, 2003, the Bank entered into a settlement-at-court with the Tokyo Metropolitan Government and the Tokyo Governor and withdrew their complaints regarding the Tokyo Metropolitan Government’s tax on large banks. The settlement included (a) a revision of the applicable tax rate to 0.9% from 3.0%, effective retroactive to the date of enactment of the local tax in the fiscal year ended March 31, 2001 and (b) a refund representing the difference between the amount already paid by the banks and the amount computed based on the newly enacted rate plus accrued interest. On October 7, 2003, the Bank received a tax refund plus accrued interest amounting to ¥32,141 million.
In March 2003, the Japanese government amended the local tax law. Under the amended local tax law, a corporation size-based enterprise tax was effective, which superseded the current enterprise tax, including the local taxes levied by the Tokyo Metropolitan Government and Osaka Prefectural Government, from the fiscal
F-38
Table of Contents
THE BANK OF TOKYO-MITSUBISHI, LTD. AND SUBSIDIARIES
NOTES TO CONSOLIDATED FINANCIAL STATEMENTS—(Continued)
year ended March 31, 2005. As a result, the normal effective statutory tax rate for the fiscal year ended March 31, 2005 was approximately 40.5%. The newly enacted rates were used in calculating the future expected tax effects of temporary differences as of March 31, 2003 that are expected to reverse during and subsequent to the fiscal year ended March 31, 2005. The change in tax rate resulted in a decrease of ¥63,938 million in income tax expense for the fiscal year ended March 31, 2003.
In October 2003, the Tokyo Metropolitan Government and the Osaka Prefectural Government enacted a surcharge tax of corporation sized based enterprise tax under the local tax law amended in March 2003. As a result, the normal effective statutory tax rate increased approximately 0.1% to approximately 40.6% effective for the fiscal year ended March 31, 2005. The change in tax rate, used in calculating the future expected tax effects of temporary differences, resulted in a decrease of ¥2,496 million in income tax expense for the fiscal year ended March 31, 2004.
A reconciliation of the effective income tax rate reflected in the accompanying consolidated statements of income to the combined normal effective statutory tax rate for the fiscal years ended March 31, 2003, 2004 and 2005 was as follows:
| 2003 | 2004 | 2005 | |||||||
Combined normal effective statutory tax rate | 38.0 | % | 38.0 | % | 40.6 | % | |||
Increase (decrease) in taxes resulting from: | |||||||||
Nondeductible expenses | 3.0 | 0.1 | 0.5 | ||||||
Dividends from foreign subsidiaries | 3.5 | 0.9 | 1.5 | ||||||
Foreign tax credit and payments | 7.9 | 0.7 | 1.1 | ||||||
Higher (lower) tax rates applicable to income of subsidiaries | (0.6 | ) | 0.3 | (1.1 | ) | ||||
Foreign tax refund | (1.1 | ) | — | — | |||||
Minority interest | 1.1 | 1.9 | 2.0 | ||||||
Change in valuation allowance | 2.1 | (4.9 | ) | 0.5 | |||||
Enacted change in tax rates | (22.1 | ) | (0.3 | ) | — | ||||
Liquidation of subsidiaries | (14.3 | ) | (1.7 | ) | 0.3 | ||||
Change in foreign exchange rate | (0.2 | ) | 1.5 | 0.9 | |||||
Other—net | 0.1 | 1.8 | (1.0 | ) | |||||
Effective income tax rate | 17.4 | % | 38.3 | % | 45.3 | % | |||
F-39
Table of Contents
THE BANK OF TOKYO-MITSUBISHI, LTD. AND SUBSIDIARIES
NOTES TO CONSOLIDATED FINANCIAL STATEMENTS—(Continued)
Deferred tax assets and liabilities are computed for each tax jurisdiction using current enacted tax rates applicable to periods when the temporary differences are expected to reverse. The tax effects of the items comprising the Group’s net deferred tax assets at March 31, 2004 and 2005 were as follows:
| 2004 | 2005 | |||||||
| (in millions) | ||||||||
Deferred tax assets: | ||||||||
Allowance for credit losses | ¥ | 347,116 | ¥ | 328,163 | ||||
Net operating loss carryforwards | 532,263 | 391,652 | ||||||
Accrued severance indemnities and pension liabilities | 108,231 | 96,910 | ||||||
Non-interest-earning deposits with the Special Fund and the New Fund (See | 9,006 | 7,926 | ||||||
Accrued liabilities and other | 78,574 | 74,596 | ||||||
Sale-and-leaseback transactions | 38,975 | 39,384 | ||||||
Derivative financial instruments | 3,830 | 32,938 | ||||||
Depreciation | 16,806 | 11,703 | ||||||
Valuation allowance | (108,256 | ) | (108,972 | ) | ||||
Total deferred tax assets | 1,026,545 | 874,300 | ||||||
Deferred tax liabilities: | ||||||||
Investment securities | 226,706 | 226,851 | ||||||
Deferred profit on property for income tax purposes | 8,344 | 11,788 | ||||||
Equipment and auto leasing | 81,722 | 89,623 | ||||||
Other | 20,382 | 9,829 | ||||||
Total deferred tax liabilities | 337,154 | 338,091 | ||||||
Net deferred tax assets | ¥ | 689,391 | ¥ | 536,209 | ||||
The valuation allowance was provided primarily against deferred tax assets recorded at the Group’s domestic subsidiaries with operating loss carryforwards. The net changes in the valuation allowance for deferred income tax assets were a decrease of ¥59,165 million and an increase of ¥716 million for the fiscal years ended March 31, 2004 and 2005, respectively, which primarily reflected an increase or a decrease in such operating loss carryforwards of these subsidiaries.
At March 31, 2005, the Group had operating loss carryforwards of ¥982,245 million and tax credit carryforwards of ¥528 million for tax purposes. Such carryforwards, if not utilized, are scheduled to expire as follows:
| Operating loss carryforwards | Tax credit carryforwards | |||||
| (in millions) | ||||||
Fiscal year ending March 31: | ||||||
2006 | ¥ | 44,857 | ¥ | — | ||
2007 | 123 | — | ||||
2008 | 40 | — | ||||
2009 | 29,220 | — | ||||
2010 | 836,282 | — | ||||
2011 | 15,369 | — | ||||
2012 and thereafter | 31,925 | 428 | ||||
No definite expiration date | 24,429 | 100 | ||||
Total | ¥ | 982,245 | ¥ | 528 | ||
F-40
Table of Contents
THE BANK OF TOKYO-MITSUBISHI, LTD. AND SUBSIDIARIES
NOTES TO CONSOLIDATED FINANCIAL STATEMENTS—(Continued)
In March 2004, the Japanese government extended the period for operating loss carryforwards from 5 years to 7 years under the corporate tax law. This applied retroactively to operating loss carryforwards since fiscal years beginning on or after April 1, 2001.
Income taxes are not provided on undistributed earnings of foreign subsidiaries, which are considered to be indefinitely reinvested in the operations of such subsidiaries. At March 31, 2005, such undistributed earnings of foreign subsidiaries amounted to approximately ¥262 billion. Determination of the amount of unrecognized deferred tax liabilities with respect to these undistributed earnings is not practicable because of the complexity associated with its hypothetical calculation including foreign withholding taxes and foreign tax credits. The Bank has neither plans nor the intention of disposing of investments in foreign subsidiaries and, accordingly, does not expect to record capital gains or losses, or otherwise monetize its foreign subsidiaries’ undistributed earnings. Rather, the Bank will receive a return on investments in foreign subsidiaries by way of dividends.
Income from continuing operations before income tax expense and cumulative effect of a change in accounting principle for the fiscal years ended March 31, 2003, 2004 and 2005 was as follows:
| 2003 | 2004 (Restated) | 2005 | |||||||
| (in millions) | |||||||||
Domestic income | ¥ | 206,956 | ¥ | 664,556 | ¥ | 375,116 | |||
Foreign income | 82,619 | 207,242 | 151,767 | ||||||
Total | ¥ | 289,575 | ¥ | 871,798 | ¥ | 526,883 | |||
Subsequent to the issuance of the Group’s consolidated financial statements for the fiscal year ended March 31, 2004, management determined that the details of income from continuing operations before income tax expense and cumulative effect of a change in accounting principle for the fiscal year ended March 31, 2004 were erroneously disclosed. These errors had no impact on the consolidated financial position or results of operations. As a result, such amounts have been restated from the amounts previously reported as follows:
| 2004 | ||||||
| As previously reported | As restated | |||||
| (in millions) | ||||||
Domestic income | ¥ | 791,531 | ¥ | 664,556 | ||
Foreign income | 80,267 | 207,242 | ||||
Total | ¥ | 871,798 | ¥ | 871,798 | ||
10. PLEDGED ASSETS AND COLLATERAL
Pledged Assets
At March 31, 2005, assets mortgaged, pledged, or otherwise subject to lien were as follows:
| (in millions) (Restated) | |||
Due from banks | ¥ | 4 | |
Trading account securities | 2,301,452 | ||
Investment securities | 4,991,587 | ||
Loans | 4,598,759 | ||
Other | 20,417 | ||
Total | ¥ | 11,912,219 | |
F-41
Table of Contents
THE BANK OF TOKYO-MITSUBISHI, LTD. AND SUBSIDIARIES
NOTES TO CONSOLIDATED FINANCIAL STATEMENTS—(Continued)
The above pledged assets are classified by type of liabilities to which they relate as follows:
(in millions) (Restated) | |||
Deposits | ¥ | 265,234 | |
Call money and funds purchased | 545,135 | ||
Payables under repurchase agreements and securities lending transactions | 3,549,694 | ||
Other short-term borrowings and long-term debt | 7,545,884 | ||
Other | 6,272 | ||
Total | ¥ | 11,912,219 | |
Subsequent to the issuance of the Group’s consolidated financial statements for the fiscal year ended March 31, 2005, management determined that the amounts of assets mortgaged, pledged, or otherwise subject to lien and type or liabilities to which they relate for the fiscal year ended March 31, 2005 were erroneously disclosed. These errors had no impact on the consolidated financial position or results of operations. As a result, such amounts have been restated from the amounts previously reported as follows:
Assets mortgaged, pledged, or otherwise subject to lien:
| 2005 | ||||
| As previously reported | As restated | |||
| (in millions) | ||||
Trading account securities | ¥2,658,751 | ¥2,301,452 | ||
Investment securities | 4,858,397 | 4,991,587 | ||
Loans | 4,731,949 | 4,598,759 | ||
Type of liabilities to which the above pledged assets relate:
| 2005 | ||||
| As previously reported | As restated | |||
| (in millions) | ||||
Payables under repurchase agreements and securities lending transactions | ¥3,906,993 | ¥3,549,694 | ||
In addition, the trading account assets and investment securities pledged that secured parties are permitted to sell or repledge for the fiscal years ended March 31, 2005 were erroneously disclosed. Such amounts have been restated from the amounts previously reported as follows in the parenthetic note to the Trading account assets and Securities available for sale in the consolidated balance sheet:
| 2005 | ||||
| As previously reported | As restated | |||
| (in millions) | ||||
Trading account assets pledged that secured parties are permitted to sell or repledge | ¥2,626,534 | ¥2,269,235 | ||
Securities available for sale pledged that secured parties are permitted to sell or repledge | 1,557,907 | 1,571,463 | ||
In addition, at March 31, 2005, certain investment securities, principally Japanese national government and Japanese government agency bonds, aggregating ¥5,682,482 million were pledged as collateral for acting as a collection agent of public funds, for settlement of exchange at the Bank of Japan and Tokyo Bankers Association, for derivative transactions and for certain other purposes.
F-42
Table of Contents
THE BANK OF TOKYO-MITSUBISHI, LTD. AND SUBSIDIARIES
NOTES TO CONSOLIDATED FINANCIAL STATEMENTS—(Continued)
Under Japanese law, Japanese banks are required to maintain certain minimum reserves on deposit with the Bank of Japan based on the amount of deposit balances and certain other factors. There are similar reserve deposit requirements for foreign offices engaged in banking businesses in foreign countries. At March 31, 2004 and 2005, the reserve funds maintained by the Group, which are included in Cash and due from banks and Interest-earning deposits in other banks, were ¥1,741,151 million and ¥2,980,755 million, respectively. Average reserves during the fiscal years ended March 31, 2004 and 2005 were ¥3,232,924 million and ¥3,643,134 million, respectively.
Collateral
The Group accepts and provides financial assets as collateral for transactions, principally commercial loans, repurchase agreements and securities lending transactions, call money, and derivatives. Financial assets eligible for such collateral include, among others, marketable equity securities, trade and note receivables and certificates of deposit.
Secured parties, including creditors and counterparties to certain transactions with the Group, may sell or repledge financial assets provided as collateral. Certain contracts, however, may not be specific about the secured party’s right to sell or repledge collateral under the applicable statutes and, therefore, whether or not the secured party is permitted to sell or repledge a collateral would differ depending on the interpretations of specific provisions of the existing statutes, contract or certain market practices. If the Group determines, based on available information, that a financial asset provided as collateral might not be sold or repledged by the secured parties, such collateral is not separately reported in the consolidated balance sheets. If a secured party is permitted to sell or repledge financial assets provided as collateral by contract or custom under the existing statutes, the Group reports such pledged financial assets separately on the face of the consolidated balance sheets. At March 31, 2005, the Group pledged ¥12,816 billion of assets that may not be sold or repledged by the secured parties.
Subsequent to the issuance of the Group’s consolidated financial statements for the fiscal year ended March 31, 2005, management determined that the amount of pledged assets that may not be sold or repledged by the secured parties for the fiscal year ended March 31, 2005 were erroneously disclosed. These errors had no impact on the consolidated financial position or results of operations. As a result, such amounts have been restated from the amounts previously reported as follows:
| 2005 | ||||
| As previously reported | As restated | |||
| (in billions) | ||||
Pledged assets that may not be sold or repledged by the secured parties | ¥12,835 | ¥12,816 | ||
The Group accepts collateral for commercial loans and certain banking transactions under a standardized agreement with customers, which provides that the Group may require the customers to provide collateral or guarantees with respect to the loans and other banking transactions. Financial assets pledged as collateral are generally negotiable and transferable instruments, and such negotiability and transferability is authorized by applicable legislation. In principle, Japanese legislation permits the Group to repledge financial assets accepted as collateral unless otherwise prohibited by contract or relevant statutes. Nevertheless, the Group did not sell or repledge nor does it plan to sell or repledge such collateral accepted in connection with commercial loans before a debtor’s default or other credit events specified in the agreements as it is not customary within the banking industry in Japan to dispose of collateral before a debtor’s default and other specified credit events. Derivative agreements commonly used in the marketplace do not prohibit a secured party’s disposition of financial assets received as collateral, and in resale agreements and securities borrowing transactions, securities accepted as
F-43
Table of Contents
THE BANK OF TOKYO-MITSUBISHI, LTD. AND SUBSIDIARIES
NOTES TO CONSOLIDATED FINANCIAL STATEMENTS—(Continued)
collateral may be sold or repledged by the secured parties. At March 31, 2005, the fair value of the collateral accepted by the Group that is permitted to be sold or repledged was approximately ¥10,327 billion, of which approximately ¥5,072 billion was sold or repledged. The amount includes the collateral that may be repledged under the current Japanese legislation but the Group does not dispose of before counterparties’ default in accordance with the customary practice within the Japanese banking industry.
Subsequent to the issuance of the Group’s consolidated financial statements for the fiscal year ended March 31, 2005, management determined that the fair value of the collateral accepted by the Group which was sold or repledged for the fiscal year ended March 31, 2005 were erroneously disclosed. These errors had no impact on the consolidated financial position or results of operations. As a result, such amounts have been restated from the amounts previously reported as follows:
| 2005 | ||||
| As previously reported | As restated | |||
| (in billions) | ||||
The fair value of the collateral accepted by the Group which was sold or repledged | ¥4,937 | ¥5,072 | ||
11. DEPOSITS
The balances of time deposits, including certificates of deposit (“CDs”), issued in amounts of ¥10 million (approximately US$93 thousand at the Federal Reserve Bank of New York’s noon buying rate on March 31, 2005) or more with respect to domestic deposits and issued in amounts of US$100,000 or more with respect to foreign deposits were ¥10,619,620 million and ¥6,363,946 million, respectively, at March 31, 2004, and ¥10,172,219 million and ¥6,612,024 million, respectively, at March 31, 2005.
The maturity information at March 31, 2005 for domestic and foreign time deposits, including CDs, is summarized as follows:
| Domestic | Foreign | |||||
| (in millions) | ||||||
Due in one year or less | ¥ | 13,500,664 | ¥ | 6,606,864 | ||
Due after one year through two years | 1,698,333 | 144,259 | ||||
Due after two years through three years | 1,465,320 | 63,738 | ||||
Due after three years through four years | 234,134 | 18,468 | ||||
Due after four years through five years | 300,244 | 35,762 | ||||
Due after five years | 40,405 | 27,025 | ||||
Total | ¥ | 17,239,100 | ¥ | 6,896,116 | ||
Subsequent to the issuance of the Group’s consolidated financial statements for the fiscal year ended March 31, 2004, management determined that the balances of time deposits, including CDs, issued in amounts of ¥10 million (approximately US$96 thousand at the Federal Reserve Bank of New York’s noon buying rate on March 31, 2004) or more with respect to domestic deposits for the fiscal year ended March 31, 2004 were erroneously disclosed. These errors had no impact on the consolidated financial position or results of operations. As a result, such amounts have been restated from the amounts previously reported as follows:
| 2004 | ||||||
| As previously reported | As restated | |||||
| (in millions) | ||||||
Domestic deposits, issued in amounts of ¥10 million or more | ¥ | 10,714,657 | ¥ | 10,619,620 | ||
F-44
Table of Contents
THE BANK OF TOKYO-MITSUBISHI, LTD. AND SUBSIDIARIES
NOTES TO CONSOLIDATED FINANCIAL STATEMENTS—(Continued)
12. DEBENTURES
In Japan, certain banks, including the Bank, were authorized to issue discount and coupon debentures in the domestic market under applicable banking laws. The Bank of Tokyo, Ltd., which merged with The Mitsubishi Bank, Limited to create the Bank, was authorized to issue such debentures and, after the merger in 1996, the Bank was also permitted to issue discount and coupon debentures in the domestic market through March 2002 under the Law concerning the Merger and Conversion of Financial Institutions of Japan.
Debentures at March 31, 2004 was comprised of the following:
| 2004 | |||
| (in millions) | |||
Three-year coupon debentures with interest of 0.02% to 0.06% | ¥ | 76,427 | |
Five-year coupon debentures with interest of 0.80% to 1.30% | 189,530 | ||
Total | ¥ | 265,957 | |
All debentures of ¥265,957 million at March 31, 2004 matured in the fiscal year ended March 31, 2005.
13. CALL LOANS AND FUNDS SOLD, AND CALL MONEY AND FUNDS PURCHASED
A summary of funds transactions for the fiscal years ended March 31, 2003, 2004 and 2005 was as follows:
| 2003 | 2004 | 2005 | ||||||||||
| (in millions) | ||||||||||||
Average balance during the fiscal year: | ||||||||||||
Call money and funds purchased | ¥ | 1,770,896 | ¥ | 2,029,233 | ¥ | 2,088,810 | ||||||
Call loans and funds sold | 637,078 | 557,638 | 753,685 | |||||||||
Net funds purchased position | ¥ | 1,133,818 | ¥ | 1,471,595 | ¥ | 1,335,125 | ||||||
Call money and funds purchased: | ||||||||||||
Outstanding at end of fiscal year: | ||||||||||||
Amount | ¥ | 2,436,308 | ¥ | 2,638,298 | ¥ | 1,552,687 | ||||||
Principal range of maturities | 1 day to 30 days | 1 day to 30 days | 1 day to 30 days | |||||||||
Weighted average interest rate | 0.23 | % | 0.17 | % | 0.29 | % | ||||||
Maximum balance at any month-end during the fiscal year | ¥ | 2,569,100 | ¥ | 3,833,308 | ¥ | 2,793,311 | ||||||
Weighted average interest rate paid during the fiscal year | 0.41 | % | 0.27 | % | 0.24 | % | ||||||
Average balances are generally based on a daily average while a month-end average is used for certain average balances when it is not practicable to obtain applicable daily averages.
14. SHORT-TERM BORROWINGS AND LONG-TERM DEBT
At March 31, 2004 and 2005, the Group had unused lines of credit amounting to ¥2,734,328 million and ¥4,551,342 million, respectively. The amounts principally consist of the lines of collateralized intraday overdrafts without interest charges and collateralized overnight loans on bills at the official discount rate granted by the Bank of Japan, which are used to cover shortages in the Bank of Japan account and to meet liquidity needs. The Group may borrow from the Bank of Japan on demand up to the total amount of collateral eligible for credit extension.
F-45
Table of Contents
THE BANK OF TOKYO-MITSUBISHI, LTD. AND SUBSIDIARIES
NOTES TO CONSOLIDATED FINANCIAL STATEMENTS—(Continued)
Other short-term borrowings at March 31, 2004 and 2005 were comprised of the following:
| 2004 | 2005 | |||||||
| (in millions) | ||||||||
Domestic offices: | ||||||||
Loans on notes and acceptances transferred with recourse (rediscount) | ¥ | 3,376,796 | ¥ | 7,135,600 | ||||
Commercial paper | 300,200 | 1,059,400 | ||||||
Borrowings from financial institutions | 327,673 | 354,457 | ||||||
Other | 150,609 | 24,187 | ||||||
Total domestic offices | 4,155,278 | 8,573,644 | ||||||
Foreign offices: | ||||||||
Commercial paper | 133,007 | 882,292 | ||||||
Other | 91,463 | 175,632 | ||||||
Total foreign offices | 224,470 | 1,057,924 | ||||||
Total | 4,379,748 | 9,631,568 | ||||||
Less unamortized discount | 302 | — | ||||||
Other short-term borrowings—net | ¥ | 4,379,446 | ¥ | 9,631,568 | ||||
Weighted average interest rate on outstanding balance at end of fiscal year | 0.13 | % | 0.30 | % | ||||
A summary of other short-term borrowing transactions for the fiscal years ended March 31, 2003, 2004 and 2005 was as follows:
| 2003 | 2004 | 2005 | ||||||||||
| (in millions) | ||||||||||||
Average balance outstanding during the fiscal year | ¥ | 1,521,078 | ¥ | 2,745,530 | ¥ | 8,105,687 | ||||||
Maximum balance at any month-end during the fiscal year | 1,790,728 | 4,379,446 | 11,227,440 | |||||||||
Weighted average interest rate during the fiscal year | 1.74 | % | 0.49 | % | 0.27 | % | ||||||
F-46
Table of Contents
THE BANK OF TOKYO-MITSUBISHI, LTD. AND SUBSIDIARIES
NOTES TO CONSOLIDATED FINANCIAL STATEMENTS—(Continued)
Long-term debt (with original maturities of more than one year) at March 31, 2004 and 2005 was comprised of the following:
| 2004 | 2005 | |||||
| (in millions) | ||||||
The Bank: | ||||||
Obligations under capital leases | ¥ | 21,194 | ¥ | 22,457 | ||
Obligation under sale-and-leaseback transactions | 102,795 | 103,658 | ||||
Unsubordinated debt: | ||||||
Insurance companies and other institutions, maturing serially through 2035, principally 0.25%-7.49% | 506,286 | 601,586 | ||||
Fixed rate bonds, payable in Japanese yen, due 2005-2022, principally 0.22%-2.69% | 2,002,760 | 1,882,745 | ||||
Subordinated debt: | ||||||
Insurance companies and other institutions, due 2005-2010, principally 0.06%-0.42% | — | 9,000 | ||||
Fixed rate notes, payable in United States dollars, due 2010, 8.40% | 211,267 | 214,684 | ||||
Fixed rate bonds, payable in Japanese yen, due 2010-2019, principally 1.13%-2.39% | 320,000 | 390,000 | ||||
Fixed rate borrowings, payable in Japanese yen, due 2005-2014, principally 1.63%-6.20% | 386,150 | 399,266 | ||||
Adjustable rate bonds, payable in Japanese yen, due 2011-2012, principally 0.56%-1.05% | 33,000 | 33,000 | ||||
Adjustable rate borrowings, payable in Japanese yen, due 2011-2019, principally 0.69%-2.21% | 176,500 | 184,500 | ||||
Adjustable rate borrowings, payable in Yuan, due 2006, 2.80% | 683 | 259 | ||||
Floating rate borrowings, payable in Japanese yen, due 2006-2035, principally 0.02%-1.74% | 9,000 | 509,308 | ||||
Floating rate borrowings, payable in United States dollars, due 2015, 3.55% | — | 32,217 | ||||
Floating rate borrowings, payable in Euro, due 2015, 2.63% | — | 41,661 | ||||
Total | 3,769,635 | 4,424,341 | ||||
Subsidiaries: | ||||||
Unsubordinated debt: | ||||||
Insurance companies and other institutions, due 2005-2011, principally 0.41%-11.62% | 208,366 | 40,694 | ||||
0.25% Convertible Bonds due 2014, payable in Japanese yen | 50,700 | 49,165 | ||||
Fixed rate bonds and notes, payable in United States dollars, due 2005-2023, principally 1.04%-8.44% | 36,380 | 44,438 | ||||
Fixed rate bonds and notes, payable in Japanese yen, due 2005-2012, principally 0.14%-4.60% | 107,045 | 203,116 | ||||
Adjustable rate bonds and notes, payable in United States dollars, due 2005-2011, principally | 8,135 | 7,441 | ||||
Adjustable rate bonds and notes, payable in Japanese yen, due 2005-2006, principally 1.58%-2.20% | 10,088 | 1,390 | ||||
Floating rate bonds and notes, payable in United States dollars, due 2005-2014, principally | 3,386 | 6,564 | ||||
Floating rate bonds and notes, payable in Japanese yen, due 2005-2034, principally 0.00%-20.00% | 67,386 | 270,630 | ||||
Floating rate notes, payable in Euro, due 2009, 2.59% | — | 708 | ||||
Obligations under capital leases and other miscellaneous debt | 31,002 | 5,782 | ||||
Total unsubordinated debt | 522,488 | 629,928 | ||||
Subordinated debt: | ||||||
Insurance companies and other institutions, due 2005-2010, principally 1.63%-3.39% | 4,605 | 13,745 | ||||
Undated notes, payable in Japanese yen, principally 0.40%-4.90% | 58,000 | — | ||||
Fixed rate undated notes, payable in Japanese yen, principally 1.40%-2.60% | 38,967 | — | ||||
Fixed rate bonds and notes, payable in United States dollars, due 2006-2030, principally 5.12%-10.88% | 49,222 | 50,875 | ||||
Fixed rate bonds and notes, payable in Japanese yen, due 2009-2010, principally 0.94%-1.63% | 79,251 | 16,052 | ||||
Adjustable rate undated notes, payable in Japanese yen, principally 0.77%-3.16% | 299,448 | — | ||||
Adjustable rate bonds and notes, payable in United States dollars, due 2009, 2.00% | 3,166 | — | ||||
Adjustable rate bonds and notes, payable in Japanese yen, due 2006-2010, principally 0.12%-5.93% | 79,442 | — | ||||
Floating rate undated notes, payable in Japanese yen, principally 1.27%-1.57% | 91,323 | — | ||||
Floating rate bonds and notes, payable in United States dollars, due 2009-2010, principally 0.00%-3.26% | 6,421 | 1,560 | ||||
Floating rate bonds and notes, payable in Japanese yen, due 2005-2010, principally 0.00%-1.53% | 40,556 | 59,887 | ||||
Other miscellaneous debt | 5,480 | — | ||||
Total subordinated debt | 755,881 | 142,119 | ||||
Junior subordinated debt payable to subsidiary grantor trust | 38,989 | — | ||||
Total | 1,317,358 | 772,047 | ||||
Total | ¥ | 5,086,993 | ¥ | 5,196,388 | ||
Notes:
| 1. | Adjustable rate debts are debts where interest rates are reset in accordance with the terms of the debt agreements, and floating rate debts are debts where interest rates are repriced in accordance with movements of market indices. |
| 2. | 0.25 % Convertible Bonds of ¥49,165 million, unsubordinated debt of subsidiaries, are convertible into common stock of Mitsubishi Securities. |
| 3. | Junior subordinated debt payable to subsidiary grantor trust were issued by a wholly owned subsidiary of UNBC (see Notes 22 and 24). On February 19, 2004, it was redeemed by UNBC. |
F-47
Table of Contents
THE BANK OF TOKYO-MITSUBISHI, LTD. AND SUBSIDIARIES
NOTES TO CONSOLIDATED FINANCIAL STATEMENTS—(Continued)
Certain unsubordinated bonds and notes (aggregating ¥43,680 million at March 31, 2004 and nil at March 31, 2005), and certain subordinated bonds and notes (aggregating ¥678,848 million at March 31, 2004 and nil at March 31, 2005) issued by subsidiaries were guaranteed, on a subordinated basis, by the Bank as to payment of principal and interest. These subsidiaries were deconsolidated in accordance with FIN No. 46R in the fiscal year ended March 31, 2005.
The Bank and certain subsidiaries entered into interest rate and currency swaps for certain debt in order to manage exposure to interest rate and currency exchange rate movements. As a result of these swap arrangements, the effective interest rates may differ from the coupon rates reflected in the above table. The interest rates for the adjustable and floating rate debt shown in the above table are those in effect at March 31, 2004 and 2005. Certain interest rates are determined by formulas and may be subject to certain minimum and maximum rates. Floating and adjustable rate debt agreements may provide for interest rate floors to prevent negative interest payments (i.e., receipts).
Certain debt agreements permit the Bank and some of its subsidiaries to redeem the related debt, in whole or in part, prior to maturity at the option of the issuer on terms specified in the respective agreements.
The following is a summary of maturities of long-term debt subsequent to March 31, 2005:
| The Bank | Other subsidiaries | Total | |||||||
| (in millions) | |||||||||
Fiscal year ending March 31: | |||||||||
2006 | ¥ | 631,388 | ¥ | 171,727 | �� | 803,115 | |||
2007 | 498,660 | 88,509 | 587,169 | ||||||
2008 | 371,192 | 119,708 | 490,900 | ||||||
2009 | 377,355 | 62,316 | 439,671 | ||||||
2010 | 213,768 | 88,008 | 301,776 | ||||||
2011 and thereafter | 2,331,978 | 241,779 | 2,573,757 | ||||||
Total | ¥ | 4,424,341 | ¥ | 772,047 | ¥ | 5,196,388 | |||
15. SEVERANCE INDEMNITIES AND PENSION PLANS
The Bank and Domestic Subsidiaries
The Bank and certain domestic subsidiaries have severance indemnities plans under which their employees in Japan, other than those who are directors, are entitled, under most circumstances, upon mandatory retirement at normal retirement age or earlier termination of employment, to lump-sum severance indemnities. Under the severance indemnities plans, benefit payments in the form of lump-sum cash payment without allowing a benefit payee an option to receive annuity payments, upon mandatory retirement at normal retirement age or earlier termination of employment, are provided. When a benefit is paid in a single payment to a benefit payee under the plans, the payment represents final relief of the obligation.
The Bank and certain domestic subsidiaries also have funded contributory defined benefit pension plans (private plans) which cover substantially all of their employees in Japan and provide for lifetime annuity payments commencing at age 65 based on eligible compensation at the time of severance, years of service and other factors. The Bank and certain domestic subsidiaries have Employees’ Pension Fund plans (“EPF”s), which are defined benefit pension plans established under the Japanese Welfare Pension Insurance Law (“JWPIL”). These plans are composed of (a) substitutional portion based on the pay-related part of the old-age pension benefits prescribed by JWPIL (similar to social security benefits in the United States) and (b) a corporate portion based on a contributory defined benefit pension arrangement established at the discretion of each subsidiary. The Bank and
F-48
Table of Contents
THE BANK OF TOKYO-MITSUBISHI, LTD. AND SUBSIDIARIES
NOTES TO CONSOLIDATED FINANCIAL STATEMENTS—(Continued)
certain domestic subsidiaries with an EPF and their employees are exempted from contributions to Japanese Pension Insurance (“JPI”) that would otherwise be required if they had not elected to fund the substitutional portion of the benefit through an EPF arrangement. The EPF, in turn, pays both the corporate and substitutional pension benefits to retired beneficiaries out of its plan assets. Benefits of the substitutional portion are based on a standard remuneration schedule as determined by the JWPIL, but the benefits of the corporate portion are based on a formula determined by each employer/EPF. Pension benefits and plan assets applicable to the substitutional portion are included with the corporate portion of the Bank and certain domestic subsidiaries in the determination of net periodic costs and funded status.
In June 2001, the JWPIL was amended to permit each employer/EPF to separate the substitutional portion from its EPF and transfer the obligation and related assets to the government. The separation process occurs in several phases.
In June 2003, The Bank submitted to the government an application to transfer the obligation to pay benefits for future employee service related to the substitutional portion and the application was approved in August 2003. In August 2004, the Bank made another application for transfer to the government of the remaining substitutional portion and the application was approved in November 2004. The substitutional obligation and related plan assets were transferred to a government agency in March 2005 and the Bank was released from paying the substitutional portion of the benefits to its employees.
The completion of the transfer to the Japanese Government of the substitutional portion of the employee pension plan constituted a settlement of such plan. However, since there remains a defined benefit plan and the settlement occurred subsequent to December 31, 2004 (the measurement date of such plan), the impact of the transfer/settlement of a pre-tax income of ¥36.1 billion will be recognized in the fiscal year ending March 31, 2006.
The effect of the settlement of the substitutional portion of the EPF calculated pursuant to the guidance in EITF 03-2 is as follows:
| (in billions) | ||||
Subsidy (representing the difference between the accumulated benefit obligation over the fair value of the related assets) | ¥ | 108.5 | ||
Settlement loss recognized for proportionate amount of net unrecognized loss related to the entire EPF | (73.6 | ) | ||
Effect of the reversal of future salary progression | 1.2 | |||
Net settlement gain | ¥ | 36.1 | ||
The Bank also has closed Tax-Qualified Pension Plans (“closed TQPPs”), funded non-contributory defined benefit pension plans, providing benefits to certain retired employees, excluding directors, in Japan, based on eligible compensation at the time of severance, years of service and other factors. The Bank’s plan covers retired employees whose service period with the Bank was 5 years or more, and provides for lifetime or certain limited period annuity payments commencing at age 60.
F-49
Table of Contents
THE BANK OF TOKYO-MITSUBISHI, LTD. AND SUBSIDIARIES
NOTES TO CONSOLIDATED FINANCIAL STATEMENTS—(Continued)
Net periodic cost of the severance indemnities and pension plans for the fiscal years ended March 31, 2003, 2004 and 2005 included the following components:
| 2003 | 2004 | 2005 | ||||||||||
| (in millions) | ||||||||||||
Service cost—benefits earned during the fiscal year | ¥ | 18,368 | ¥ | 17,962 | ¥ | 14,845 | ||||||
Interest costs on projected benefit obligation | 18,055 | 14,740 | 15,999 | |||||||||
Expected return on plan assets | (21,906 | ) | (13,273 | ) | (14,934 | ) | ||||||
Amortization of unrecognized net obligation at transition | 1,991 | 1,993 | 548 | |||||||||
Amortization of unrecognized prior service cost | 2,312 | (795 | ) | (795 | ) | |||||||
Amortization of net actuarial loss | 17,729 | 26,941 | 19,861 | |||||||||
Loss on settlements | 5,121 | 4,237 | 3,019 | |||||||||
Net periodic benefit cost | ¥ | 41,670 | ¥ | 51,805 | ¥ | 38,543 | ||||||
Weighted-average assumptions used: | ||||||||||||
Discount rates in determining expense | 2.50 | % | 1.87 | % | 2.07 | % | ||||||
Discount rates in determining benefit obligation | 1.87 | 2.07 | 2.18 | |||||||||
Rates of increase in future compensation level for determining expense | 2.42 | 2.33 | 2.56 | |||||||||
Rates of increase in future compensation level for determining benefit obligation | 2.33 | 2.56 | 2.68 | |||||||||
Expected rates of return on plan assets | 4.14 | 2.53 | 2.56 | |||||||||
F-50
Table of Contents
THE BANK OF TOKYO-MITSUBISHI, LTD. AND SUBSIDIARIES
NOTES TO CONSOLIDATED FINANCIAL STATEMENTS—(Continued)
The following table sets forth the combined funded status and amounts recognized in the accompanying consolidated balance sheets at March 31, 2004 and 2005 for the plans of the Bank and certain domestic subsidiaries. The Bank and some of its domestic subsidiaries have measured plan assets and benefit obligations at December 31 each fiscal year for the purpose of financial statements. Accordingly, funded status and amounts recognized in the table below shows the combined amounts of those presented in the consolidated financial statements of these subsidiaries.
| 2004 | 2005 | |||||||||||||||||||||||
Severance indemnities plans and non- | Contributory pension | Total | Severance indemnities plans and non- contributory pension plans | Contributory pension | Total | |||||||||||||||||||
| (in millions) | ||||||||||||||||||||||||
Change in benefit obligation: | ||||||||||||||||||||||||
Benefit obligation at beginning of fiscal year | ¥ | 140,531 | ¥ | 656,009 | ¥ | 796,540 | ¥ | 139,141 | ¥ | 646,291 | ¥ | 785,432 | ||||||||||||
Service cost | 7,310 | 10,652 | 17,962 | 6,879 | 7,966 | 14,845 | ||||||||||||||||||
Interest cost | 2,343 | 12,397 | 14,740 | 2,650 | 13,349 | 15,999 | ||||||||||||||||||
Plan participants’ contributions | — | 1,864 | 1,864 | — | 857 | 857 | ||||||||||||||||||
Divestitures | (37 | ) | — | (37 | ) | — | — | — | ||||||||||||||||
Actuarial loss (gain) | 3,606 | (17,453 | ) | (13,847 | ) | 1,114 | 17,076 | 18,190 | ||||||||||||||||
Benefits paid | (2,953 | ) | (17,178 | ) | (20,131 | ) | (2,594 | ) | (17,981 | ) | (20,575 | ) | ||||||||||||
Lump-sum payment | (11,659 | ) | — | (11,659 | ) | (10,391 | ) | — | (10,391 | ) | ||||||||||||||
Benefit obligation at end of fiscal year | 139,141 | 646,291 | 785,432 | 136,799 | 667,558 | 804,357 | ||||||||||||||||||
Change in plan assets: | ||||||||||||||||||||||||
Fair value of plan assets at beginning of fiscal year | 62,703 | 441,801 | 504,504 | 74,772 | 496,499 | 571,271 | ||||||||||||||||||
Actual return on plan assets | 11,124 | 41,246 | 52,370 | 5,706 | 23,549 | 29,255 | ||||||||||||||||||
Divestitures | (24 | ) | — | (24 | ) | — | — | — | ||||||||||||||||
Employer contributions | 3,922 | 28,766 | 32,688 | 3,938 | 19,654 | 23,592 | ||||||||||||||||||
Plan participants’ contributions | — | 1,864 | 1,864 | — | 857 | 857 | ||||||||||||||||||
Benefits paid | (2,953 | ) | (17,178 | ) | (20,131 | ) | (2,594 | ) | (17,981 | ) | (20,575 | ) | ||||||||||||
Fair value of plan assets at end of fiscal year | 74,772 | 496,499 | 571,271 | 81,822 | 522,578 | 604,400 | ||||||||||||||||||
Projected benefit obligation in excess of plan assets at end of fiscal year | (64,369 | ) | (149,792 | ) | (214,161 | ) | (54,977 | ) | (144,980 | ) | (199,957 | ) | ||||||||||||
Contributions to or benefits paid from plan assets during the three months ended March 31, 2004 and 2005 | 3,824 | 5,134 | 8,958 | 3,035 | 2,675 | 5,710 | ||||||||||||||||||
Unrecognized net actuarial loss | 44,501 | 256,272 | 300,773 | 35,083 | 246,681 | 281,764 | ||||||||||||||||||
Unrecognized prior service cost | (2,138 | ) | (22,533 | ) | (24,671 | ) | (2,032 | ) | (21,843 | ) | (23,875 | ) | ||||||||||||
Unrecognized net (asset) obligation at transition | (381 | ) | 1,772 | 1,391 | (67 | ) | 916 | 849 | ||||||||||||||||
Net amount recognized | ¥ | (18,563 | ) | ¥ | 90,853 | ¥ | 72,290 | ¥ | (18,958 | ) | ¥ | 83,449 | ¥ | 64,491 | ||||||||||
Amounts recognized in the balance sheets: | ||||||||||||||||||||||||
Prepaid pension cost | ¥ | 247 | ¥ | — | ¥ | 247 | ¥ | 307 | ¥ | — | ¥ | 307 | ||||||||||||
Accrued pension liability | (47,853 | ) | (124,404 | ) | (172,257 | ) | (38,730 | ) | (119,780 | ) | (158,510 | ) | ||||||||||||
Intangible assets | 998 | 1,772 | 2,770 | 816 | 916 | 1,732 | ||||||||||||||||||
Accumulated other changes in equity from nonowner sources | 28,045 | 213,485 | 241,530 | 18,649 | 202,313 | 220,962 | ||||||||||||||||||
Net amount recognized | ¥ | (18,563 | ) | ¥ | 90,853 | ¥ | 72,290 | ¥ | (18,958 | ) | ¥ | 83,449 | ¥ | 64,491 | ||||||||||
| Note: | The aggregated accumulated benefit obligations of these plans were ¥752,486 million and ¥768,620 million, respectively, at March 31, 2004 and 2005. The Bank and certain domestic subsidiaries have no plans with assets in excess of accumulated benefit obligations. The severance indemnities plans generally employ a multi-variable, non-linear formula based upon compensation at the time of severance, rank and years of service. Employees with service in excess of one year are qualified to receive lump-sum severance indemnities. |
F-51
Table of Contents
THE BANK OF TOKYO-MITSUBISHI, LTD. AND SUBSIDIARIES
NOTES TO CONSOLIDATED FINANCIAL STATEMENTS—(Continued)
Asset allocation
The Bank’s contributory pension plan asset allocations at December 31, 2003 and 2004, by asset category were as follows:
| Contributory pension plan assets at December 31, | ||||||
Asset Category | 2003 | 2004 | ||||
EPF assets | 88.90 | % | 88.52 | % | ||
Fund for corporate portion | 68.98 | 70.38 | ||||
Japanese equity securities | 18.51 | 18.86 | ||||
Japanese debt securities | 27.71 | 28.61 | ||||
General account of life insurance companies* | 11.12 | 11.06 | ||||
Non-Japanese equity securities | 5.92 | 6.66 | ||||
Non-Japanese debt securities | 5.48 | 4.96 | ||||
Short-term assets | 0.24 | 0.23 | ||||
Fund for substitutional portion | 19.92 | 18.14 | ||||
Japanese short-term monetary assets** | 6.06 | 18.14 | ||||
General account of life insurance companies* | 13.86 | — | ||||
Assets retained in employee retirement benefit trust | 11.10 | 11.48 | ||||
Japanese equity securities | 11.10 | 11.48 | ||||
| 100.00 | % | 100.00 | % | |||
Notes:
| * | “General account of life insurance companies” is a contract with life insurance companies that guarantees a return of approximately 0.96% (from April 2004 to March 2005), which is mainly invested in assets with low market risk such as Japanese debt securities. In terms of pension plan asset allocation, the Bank regards the general account in the same category as Japanese debt securities, because it is generally believed that there is a high degree of correlation between their performances. The Bank carefully monitors life insurance companies by credit rating and other assessments. |
| ** | Includes bank deposit for benefit payments at December 31, 2004. |
Japanese equity securities include MTFG and the Group’s common stock in the amounts of ¥1,330 million (0.27% of contributory pension plan assets) and ¥1,436 million (0.27% of contributory pension plan assets) at December 31, 2003 and 2004, respectively.
Japanese debt securities include the Group’s debt securities in the amounts of ¥617 million (0.12% of contributory pension plan assets) and ¥220 million (0.04% of contributory pension plan assets) at December 31, 2003 and 2004, respectively.
The assets of the contributory pension plan assets consisted of EPF and an employee retirement benefit trust. The process of transferring to the Japanese Government the substitutional portion of EPF liabilities, and the assets were planned to be delivered to the Employees’ Pension Insurance were still ongoing at December 31, 2004. Accordingly, the assets related to the substitutional portion (referred to above as “fund for substitutional portion”) were presented separately from the assets related to the corporate portion (referred to above as “fund for corporate portion”).
F-52
Table of Contents
THE BANK OF TOKYO-MITSUBISHI, LTD. AND SUBSIDIARIES
NOTES TO CONSOLIDATED FINANCIAL STATEMENTS—(Continued)
The asset allocations of the Bank and certain domestic subsidiaries in severance indemnities plans and non-contributory pension plans are as follows:
Asset category | Asset ratio at December 31, | |||||
| 2003 | 2004 | |||||
Equity securities | 74.23 | % | 74.60 | % | ||
Debt securities | 18.26 | 17.20 | ||||
Others | 7.51 | 8.20 | ||||
Total | 100.00 | % | 100.00 | % | ||
Note: The Bank’s severance indemnities plan assets are an employee retirement benefit trust invested in Japanese equity securities.
Investment policies
The Bank’s target asset allocation for funds for the corporate portion in contributory pension plans, which is the EPF funds not including the funds for the substitutional portion, is as follows:
Asset category | Target asset allocation | ||
Japanese equity securities | 21.0 | % | |
Japanese debt securities | 57.0 | ||
Non-Japanese equity securities | 15.0 | ||
Non-Japanese debt securities | 7.0 | ||
Total | 100.0 | % | |
The Bank regards that the purpose of contributory pension plan investments is to achieve assured benefits and stable contributions through proper risk control and return maximization. The Bank attaches a great deal of importance to the long-term performance of its contributory pension plan investments to achieve assured benefits. The Bank fixes the long-term asset allocation, which will be maintained for approximately five years, for efficient long-term investment return. The long-term asset allocation is based on optimal portfolios, which are estimated by expected return and risk according to each asset class, while considering the Bank’s risk tolerance.
As a general rule, the Bank reviews its investment policies approximately every five years. Additionally, a review is made in the following situations: large fluctuations in pension plan liabilities caused by modifications of pension plans, or changes in the market environment. The Bank carefully examines investment in alternative assets, such as derivatives or hedge funds, while considering the Bank’s investment administration structure. The Bank controls risk on its pension plan portfolio by standard deviation analysis. Additionally, the Bank requires and checks that investment companies tracks errors in each asset class within a designated range.
The bank regards that the purpose of employee retirement benefit trust investment is to achieve assured benefits by contribution of assets to the trust. Employee retirement benefit trust assets are invested in Japanese equity securities. This asset allocation will be held for the mid-term, but it is undecided whether it will be held in the long term.
The Bank’s severance indemnities plan consists of an employee retirement benefit trust. The trust’s purpose and basic policy is described above. The Bank’s TQPPs has closed and there are no more new beneficiaries. Therefore, to achieve assured benefit, the fund is invested in assets with low market risk.
F-53
Table of Contents
THE BANK OF TOKYO-MITSUBISHI, LTD. AND SUBSIDIARIES
NOTES TO CONSOLIDATED FINANCIAL STATEMENTS—(Continued)
Basis and procedure for estimating long-term return of each asset class
The expected long-term return on the fund for the corporate portion of the contributory pension plan is 3.7% for each asset class. The expected rate of return for each asset class is based on long-term prospects for the economy, historical performance, market environment, and some other factors. The expected rate of return on the fund for the substitutional portion of the contributory pension plan is estimated as 0.28% based on historical performance.
The expected rate of return on the employee retirement benefit trust is estimated as 0.95% based on the expected dividend yield on Japanese equity securities. Expected capital return is not taken into account, because the long-term asset allocation is undecided.
The Bank’s severance indemnities plan consists of an employee retirement benefit trust. The trust’s expected return is as described above.
Expected rate of return on closed TQPPs is estimated as 2.46% based on the performance over the last three fiscal years.
Cash flows
The Bank and certain domestic subsidiaries expect to contribute approximately ¥14.4 billion to pension plans in the fiscal year ending March 31, 2006 based upon their current funded status and expected asset return assumptions.
Estimated future benefit payments
The following table presents benefit payments expected to be paid, which include the effect of expected future service for the years indicated:
| Expected benefits | |||
| (in millions) | |||
Fiscal year ending March 31: | |||
2006 | ¥ | 25,054 | |
2007 | 25,572 | ||
2008 | 26,573 | ||
2009 | 27,335 | ||
2010 | 28,077 | ||
Thereafter (2011-2015) | 152,006 | ||
F-54
Table of Contents
THE BANK OF TOKYO-MITSUBISHI, LTD. AND SUBSIDIARIES
NOTES TO CONSOLIDATED FINANCIAL STATEMENTS—(Continued)
In accordance with the provisions of SFAS No. 87, the Group has recorded an additional minimum liability representing the excess of the accumulated benefit obligation over the fair value of plan assets and accrued pension liabilities previously recorded. A corresponding amount is recognized as an intangible asset to the extent of unrecognized net obligation at transition and prior service costs, with the remaining balance recorded as a separate reduction of shareholder’s equity, net of income taxes.
In accordance with the Bank’s and certain domestic subsidiaries’ employment practices, certain early-terminated employees are entitled to special lump-sum termination benefits. The amounts charged to operations for such early termination benefits for the fiscal years ended March 31, 2003, 2004 and 2005 were ¥11,035 million, ¥8,902 million and ¥6,433 million, respectively.
In accordance with amendments to the relevant welfare pension legislation, the Bank amended its contributory defined benefit pension plans to change the age of commencement of lifetime annuity payments from 60 to 65 in January 2002, which was reflected in the consolidated financial statements for the fiscal year ended March 31, 2003 because of the Bank’s measurement date of December 31, 2001. Furthermore, in November 2002, the Bank amended its pension plan to reduce employee pension benefits by amounts ranging from 7% to 20%, which will be payable to employees who retire on or after April 1, 2003. The effect of the negative amendments was a decrease of ¥44,027 million of the projected benefit obligation. Mitsubishi Securities, one of the Bank’s securities subsidiaries, amended its pension plan to change the lifetime annuity payments to limited period annuity payments. The amendment resulted in a decrease of ¥3,447 million in the projected benefit obligation.
Foreign Offices and Subsidiaries
Foreign offices and subsidiaries also have defined contribution plans and/or defined benefit plans. The cost of such plans charged to operations for the fiscal years ended March 31, 2003, 2004 and 2005 were ¥6,812 million, ¥7,728 million and ¥8,673 million, respectively, including ¥3,255 million, ¥3,404 million and ¥3,265 million, respectively, for defined contribution plans.
Foreign offices and subsidiaries have postemployment and/or postretirement plans for eligible employees and retirees. The costs charged to operations for the fiscal years ended March 31, 2003, 2004 and 2005 were ¥1,906 million, ¥3,115 million and ¥2,371 million, respectively.
Certain of the Bank’s subsidiaries in the United States of America maintain employees’ retirement plans, which are qualified retirement plans covering substantially all of the employees of such subsidiaries. The plans are non-contributory defined benefit plans, which provide benefit upon retirement based on years of service and average compensation. The plans are funded on a current basis in compliance with the requirement of the Employee Retirement Income Security Act of the United States of America. These subsidiaries also provide certain post employment benefits and postretirement benefits other than pensions for employees. Plan assets are generally invested in U.S. government securities, corporate bonds and mutual funds.
F-55
Table of Contents
THE BANK OF TOKYO-MITSUBISHI, LTD. AND SUBSIDIARIES
NOTES TO CONSOLIDATED FINANCIAL STATEMENTS—(Continued)
The net periodic cost of the employees’ retirement and other benefit plans of certain offices and subsidiaries in the United States of America for the fiscal years ended March 31, 2003, 2004 and 2005 include the following components:
| 2003 | 2004 | 2005 | ||||||||||
| (in millions) | ||||||||||||
Service cost—benefits earned during the fiscal year | ¥ | 4,492 | ¥ | 5,060 | ¥ | 5,321 | ||||||
Interest costs on projected benefit obligation | 7,550 | 7,567 | 7,465 | |||||||||
Expected return on plan assets | (9,167 | ) | (9,769 | ) | (10,626 | ) | ||||||
Amortization of unrecognized net obligation at transition | 455 | 307 | 292 | |||||||||
Amortization of unrecognized prior service cost | (31 | ) | (89 | ) | 1 | |||||||
Amortization of net actuarial loss | 722 | 1,866 | 2,468 | |||||||||
Net periodic benefit cost | ¥ | 4,021 | ¥ | 4,942 | ¥ | 4,921 | ||||||
Weighted-average assumptions used: | ||||||||||||
Discount rates in determining expense | 7.30 | % | 6.79 | % | 6.23 | % | ||||||
Discount rates in determining benefit obligation | 6.79 | 6.23 | 5.77 | |||||||||
Rates of increase in future compensation level for determining expense | 4.89 | 4.90 | 5.03 | |||||||||
Rates of increase in future compensation level for determining benefit obligation | 4.90 | 5.03 | 4.48 | |||||||||
Expected rates of return on plan assets | 8.35 | 8.24 | 8.27 | |||||||||
F-56
Table of Contents
THE BANK OF TOKYO-MITSUBISHI, LTD. AND SUBSIDIARIES
NOTES TO CONSOLIDATED FINANCIAL STATEMENTS—(Continued)
The following table sets forth the funded status and amounts recognized in the accompanying consolidated balance sheets at March 31, 2004 and 2005 for the employees’ retirement and other benefit plans of certain offices and subsidiaries in the United States of America:
| 2004 | 2005 | |||||||
| (in millions) | ||||||||
Change in benefit obligation: | ||||||||
Benefit obligation at beginning of fiscal year | ¥ | 119,451 | ¥ | 120,452 | ||||
Service cost | 5,060 | 5,321 | ||||||
Interest cost | 7,567 | 7,465 | ||||||
Plan participants’ contributions | 228 | 265 | ||||||
Amendments | (682 | ) | (339 | ) | ||||
Actuarial loss | 7,774 | 9,965 | ||||||
Benefits paid | (4,983 | ) | (4,909 | ) | ||||
Translation adjustments | (13,963 | ) | (3,560 | ) | ||||
Benefit obligation at end of fiscal year | 120,452 | 134,660 | ||||||
Change in plan assets: | ||||||||
Fair value of plan assets at beginning of fiscal year | 96,448 | 115,483 | ||||||
Actual return on plan assets | 21,741 | 13,737 | ||||||
Employer contributions | 14,755 | 13,029 | ||||||
Plan participants’ contributions | 228 | 265 | ||||||
Benefits paid | (4,925 | ) | (4,909 | ) | ||||
Translation adjustments | (12,764 | ) | (3,746 | ) | ||||
Fair value of plan assets at end of fiscal year | 115,483 | 133,859 | ||||||
Projected benefit obligation in excess of plan assets at end of fiscal year | (4,969 | ) | (801 | ) | ||||
Unrecognized net actuarial loss | 36,826 | 40,187 | ||||||
Unrecognized prior service cost | (412 | ) | (316 | ) | ||||
Unrecognized net obligation at transition | 2,599 | 1,771 | ||||||
Net amount recognized | ¥ | 34,044 | ¥ | 40,841 | ||||
Amounts recognized in the balance sheets: | ||||||||
Prepaid pension cost | ¥ | 37,147 | ¥ | 44,318 | ||||
Accrued pension liability | (3,559 | ) | (3,917 | ) | ||||
Intangible assets | 6 | 90 | ||||||
Accumulated other changes in equity from nonowner sources | 450 | 350 | ||||||
Net amount recognized | ¥ | 34,044 | ¥ | 40,841 | ||||
| Note: | The aggregated accumulated benefit obligations of these plans were ¥85,151 million and ¥104,405 million, respectively, at March 31, 2004 and 2005. |
The projected benefit obligations, accumulated benefit obligations and fair value of plan assets for the plans of certain offices and subsidiaries in the United States of America with accumulated benefit obligations in excess of plan assets were ¥2,627 million, ¥2,435 million and ¥1,124 million, respectively at March 31, 2004 and ¥9,179 million, ¥8,745 million and ¥6,286 million, respectively at March 31, 2005.
F-57
Table of Contents
THE BANK OF TOKYO-MITSUBISHI, LTD. AND SUBSIDIARIES
NOTES TO CONSOLIDATED FINANCIAL STATEMENTS—(Continued)
Asset allocation
The asset allocations of certain offices and subsidiaries in the United States of America in severance indemnities plans, contributory pension plans and non-contributory pension plans are as follows:
| Asset ratio at December 31, | ||||||
Asset category | 2003 | 2004 | ||||
Equity securities | 68.25 | % | 71.20 | % | ||
Debt securities | 29.19 | 28.43 | ||||
Others | 2.56 | 0.37 | ||||
Total | 100.00 | % | 100.00 | % | ||
Investment policies
Target asset allocation for funds of certain offices and subsidiaries in the United States of America is as follows:
Asset category | Target asset allocation | ||
Equity securities | 69.1 | % | |
Debt securities | 30.9 | ||
Total | 100.0 | % | |
The investment objective for pension plan of certain offices and subsidiaries in the United States of America is to optimize total return within reasonable and prudent levels of risk. The plan’s asset allocation strategy is the principal determinant in achieving expected investment returns on the plans’ assets. Actual asset allocations may fluctuate within acceptable ranges due to market value variability. If market fluctuations cause an asset class to fall outside of its strategic asset allocation range, the portfolio will be rebalanced as appropriate. Plan asset performance is compared against established indices and peer groups to evaluate whether the risk associated with the portfolio is appropriate for the level of return.
Basis and procedure for estimating long-term return of each asset class
Certain offices and subsidiaries in the United States of America periodically reconsider the expected long-term rate of return for plan assets. They evaluate the investment return volatility of different asset classes and compare the liability structure of their plan to those of other companies, while considering their funding policy to maintain a funded status sufficient to meet participants’ benefit obligations, and reducing long-term funding requirements and pension costs. Based on this information, certain offices and subsidiaries in the United States of America update adopting an expected long-term rate of return.
Cash flows
Certain offices and subsidiaries in the United States of America expect to contribute approximately ¥14.8 billion to pension plans in the fiscal year ending March 31, 2006 based upon their current funded status and expected asset return assumptions.
F-58
Table of Contents
THE BANK OF TOKYO-MITSUBISHI, LTD. AND SUBSIDIARIES
NOTES TO CONSOLIDATED FINANCIAL STATEMENTS—(Continued)
Estimated future benefit payments
The following table presents benefit payments expected to be paid, which include the effect of expected future service for the years indicated:
| Expected benefits | |||
| (in millions) | |||
Fiscal year ending March 31: | |||
2006 | ¥ | 6,066 | |
2007 | 7,595 | ||
2008 | 8,290 | ||
2009 | 9,055 | ||
2010 | 10,540 | ||
Thereafter (2011-2015) | 68,963 | ||
16. OTHER ASSETS AND LIABILITIES
Major components of other assets and liabilities at March 31, 2004 and 2005 were as follows:
| 2004 | 2005 | |||||
| (in millions) | ||||||
Other assets: | ||||||
Accounts receivable: | ||||||
Receivables from brokers, dealers and customers for securities transactions | ¥ | 260,701 | ¥ | 510,449 | ||
Other | 236,649 | 252,630 | ||||
Investments in equity method investees | 47,099 | 143,483 | ||||
Non-interest-earning deposits with the Special Fund and the New Fund (See Note 5) | 82,104 | 84,765 | ||||
Other | 1,065,329 | 1,027,427 | ||||
Total | ¥ | 1,691,882 | ¥ | 2,018,754 | ||
Other liabilities: | ||||||
Accounts payable: | ||||||
Payables to brokers, dealers and customers for securities transactions | ¥ | 665,900 | ¥ | 518,211 | ||
Other | 423,254 | 484,117 | ||||
Deferred tax liabilities | 58,431 | 66,598 | ||||
Allowance for off-balance-sheet credit instruments | 97,039 | 60,260 | ||||
Accrued pension liability | 186,331 | 180,661 | ||||
Minority interest | 372,346 | 447,305 | ||||
Guarantees and indemnifications | 20,005 | 26,753 | ||||
Accrued and other liabilities | 576,662 | 644,071 | ||||
Total | ¥ | 2,399,968 | ¥ | 2,427,976 | ||
F-59
Table of Contents
THE BANK OF TOKYO-MITSUBISHI, LTD. AND SUBSIDIARIES
NOTES TO CONSOLIDATED FINANCIAL STATEMENTS—(Continued)
Investments in equity method investees include marketable equity securities carried at ¥7,341 million and ¥7,217 million, respectively, at March 31, 2004 and 2005. Corresponding aggregated market values were ¥27,987 million and ¥22,463 million, respectively.
17. PREFERRED STOCK
By the Articles of Incorporation, the Bank is authorized to issue 100,000,000 shares of Class 1 Preferred Stock and 100,000,000 shares of Class 2 Preferred Stock without par value.
All classes of preferred stock are non-voting and have equal preference with Bank’s common stock for the payment of dividends and the distribution of assets in the event of a liquidation or dissolution of the Bank. They are all non-cumulative and non-participating with respect to dividend payments. Shareholder of Class 1 and Class 2 Preferred Stock receive a liquidation distribution at ¥3,000 and ¥2,500 per share, respectively, and do not have the right to participate in any further liquidation distributions.
Class 1 Preferred Stock
Class 1 Preferred Stock is redeemable at the option of the Bank. At the time of issuance, the Board of Directors determines an issue price, an annual dividend (not to exceed ¥360 per share) and redemption terms, including a redemption price. Class 1 Preferred Stock does not have voting rights at any general meetings of shareholders, unless otherwise provided by applicable laws and regulations. Preferred dividends are set to be ¥82.5 per share annually, except that the preferred dividends on the Class 1 Preferred Stock for the fiscal year ended March 31, 1999 were ¥15.87 per share.
Class 2 Preferred Stock
On February 21, 2005, the Bank issued 100,000,000 shares of Class 2 Preferred Stock at ¥2,500 per share, the aggregate amount of the issue price being ¥250 billion. Class 2 Preferred Stock does not have voting rights at any general meetings of shareholders, unless otherwise provided by applicable laws and regulations. Preferred dividends are set to be ¥60.0 per share annually, except that the preferred dividends on the Class 2 Preferred Stock for the fiscal year ended March 31, 2005 were ¥6.42 per share.
18. COMMON STOCK AND CAPITAL SURPLUS
The changes in the number of issued shares of common stock during the fiscal years ended March 31, 2003, 2004 and 2005 were as follows:
| 2003 | 2004 | 2005 | ||||
| (in thousands of shares) | ||||||
Balance at beginning of fiscal year | 4,675,456 | 5,019,470 | 5,019,470 | |||
Issuance of new shares of common stock | 344,014 | — | — | |||
Balance at end of fiscal year | 5,019,470 | 5,019,470 | 5,019,470 | |||
Under the Code, issuances of common stock, including conversions of bonds and notes, are required to be credited to the common stock account for at least 50% of the proceeds and to the legal capital surplus account (“legal capital surplus”) for the remaining amounts.
The Code permits Japanese companies, upon approval by the Board of Directors, to issue shares in the form of a “stock split,” as defined in the Code (see Note 1). Also, the Code prior to April 1, 1991 permitted Japanese
companies to issue free share distributions. The Bank from time to time made free share distributions. These free
F-60
Table of Contents
THE BANK OF TOKYO-MITSUBISHI, LTD. AND SUBSIDIARIES
NOTES TO CONSOLIDATED FINANCIAL STATEMENTS—(Continued)
distributions usually were from 5% to 10% of outstanding common stock and publicly-owned corporations in the United States issuing shares in similar transactions would be required to account for them as stock dividends as of the shareholders’ record date by reducing retained earnings and increasing the appropriate capital accounts by an amount equal to the fair value of the shares issued. The application of such United States accounting practice to the cumulative free distributions made by the Bank at March 31, 2005, would have increased capital accounts by ¥1,748,080 million with a corresponding decrease in unappropriated retained earnings.
The Code permits, upon approval of the Board of Directors, the transfer of amounts from the legal capital surplus to the capital stock account.
The Code, as amended effective on October 1, 2001 (the “Code Amendments”) permits Japanese companies to effect purchases of their own shares pursuant to a resolution by the shareholders at an annual general meeting until the conclusion of the following ordinary general meeting of shareholders, and to hold such shares as its treasury shares indefinitely regardless of purpose. However, the Code requires the amount of treasury stock purchased be within the amount of retained earnings available for dividends. Disposition of treasury stock is subject to the approval of the Board of Directors and is to follow the procedures similar to a public offering of shares for subscription. Prior to the amendment, in principle, reacquisition of treasury shares was prohibited with the exception of reacquisition for retirement and certain limited purposes, as specified by the Code. Any treasury shares were required to be disposed of in the near term.
Parent Company Shares Held by the Group and Affiliated Companies
At March 31, 2005, the Group and affiliated companies owned shares of common stock of MTFG. Such shares are included in parent company’s stock in the accompanying consolidated balance sheets and deducted from shareholder’s equity. For the fiscal year ended March 31, 2003, the MTFG shares held by the Bank were written down for tax purposes. The tax consequence of such write-down was treated as a capital transaction and credited to capital surplus.
19. RETAINED EARNINGS, LEGAL RESERVE AND DIVIDENDS
In addition to the Code, Japanese banks, including the Bank, are required to comply with the Banking Law of Japan (the “Banking Law”).
Legal Reserve Set Aside as Appropriation of Retained Earnings and Legal Capital Surplus
Under the Code
Effective October 1, 2001, the Code Amendments provide that an amount at least equal to 10% of the aggregate amount of cash dividends and certain appropriations of retained earnings associated with cash outlays applicable to each period shall be appropriated and set aside as a legal reserve until the aggregate amount of legal reserve set aside as appropriation of retained earnings and the legal capital surplus equals 25% of stated capital as defined in the Code.
Prior to the Code Amendments, the Code provided that an amount at least equal to 10% of the aggregate amount of cash dividends and certain appropriations of retained earnings associated with cash outlays applicable to each period shall be appropriated and set aside as a legal reserve until such reserve equals 25% of common stock. The retained earnings so appropriated may be used to eliminate or reduce a deficit by resolution of the shareholders or may be transferred to capital stock by resolution of the Board of Directors.
F-61
Table of Contents
THE BANK OF TOKYO-MITSUBISHI, LTD. AND SUBSIDIARIES
NOTES TO CONSOLIDATED FINANCIAL STATEMENTS—(Continued)
Under the Banking Law
In line with the Code Amendments, on June 29, 2001, amendments to the Banking Law (the “Banking Law Amendments”) were promulgated and became effective on October 1, 2001. The Banking Law Amendments provide that an amount at least equal to 20% of the aggregate amount of cash dividends and certain appropriations of retained earnings associated with cash outlays applicable to each fiscal period shall be appropriated and set aside as a legal reserve until the aggregate amount of legal reserve set aside as appropriation of retained earnings and the legal capital surplus equals 100% of stated capital as defined in the Code.
Prior to the Banking Law Amendments, the Banking Law provided that an amount at least equal to 20% of the aggregate amount of cash dividends and certain appropriations of retained earnings associated with cash outlays applicable to each fiscal period shall be appropriated and set aside as a legal reserve until such reserve equals 100% of stated capital as defined in the Code. The retained earnings so appropriated may be used to eliminate or reduce a deficit by resolution of the shareholders or may be transferred to capital stock by resolution of the Board of Directors.
Transfer of Legal Reserve
Under the Code Amendments
Effective October 1, 2001, under the Code Amendments, Japanese companies, including the Bank, are permitted, pursuant to a resolution by the shareholders at a general meeting, to make legal reserve set aside as appropriation of retained earnings and legal capital surplus available for dividends until the aggregate amount of the legal reserve and legal capital surplus equals 25% of stated capital as defined in the Code, which were formerly permitted only to reduce deficit and to transfer to stated capital as defined in the Code.
Under the Banking Law Amendments
Effective October 1, 2001, under the Banking Law Amendments, Japanese banks, including the Bank, are permitted, pursuant to a resolution by the shareholders at a general meeting, to make legal reserve set aside as appropriation of retained earnings and legal capital surplus available for dividends until the aggregate amount of the legal reserve and legal capital surplus equals 100% of stated capital as defined in the Code.
The Code permits the transfer, upon approval of the shareholders, of a portion of unappropriated retained earnings available for dividends to stated capital as defined in the Code.
Unappropriated Retained Earnings and Dividends
Under the Code, the amount available for dividends is based on the amount recorded in the Bank’s general books of account maintained in accordance with accounting principles generally accepted in Japan (“Japanese GAAP”). The adjustments included in the accompanying consolidated financial statements but not recorded in the Bank’s general books of account as explained in Note 1 have no effect on the determination of retained earnings available for dividends under the Code. In addition to the provision that requires an appropriation for legal reserve as described above, the Code and the Banking Law impose certain limitations on the amount available for dividends. Under the Banking Law, the Bank has to meet the minimum capital adequacy requirements and distributions of retained earnings of the Bank, which are otherwise distributable to shareholders, are restricted in order to maintain the minimum 4.0% Tier I capital for capital adequacy purpose.
None of the retained earnings recorded in the Bank’s general books of account, prepared in accordance with Japanese GAAP, as of March 31, 2005 (¥811,315 million, exclusive of the amounts to be appropriated for legal reserves and gross unrealized gains on fair valuation of assets, as defined, if any), is restricted by such limitations under the Code or by the Banking Law as described above.
F-62
Table of Contents
THE BANK OF TOKYO-MITSUBISHI, LTD. AND SUBSIDIARIES
NOTES TO CONSOLIDATED FINANCIAL STATEMENTS—(Continued)
Annual dividends, including those for preferred stock, are approved by the shareholders at an annual general meeting held subsequent to the fiscal year to which the dividends are applicable. In addition, a semi-annual interim dividend payment may be made by resolution of the Board of Directors, subject to limitations imposed by the Code and the Banking Law.
In the accompanying consolidated statements of shareholder’s equity, dividends and appropriations to legal reserve shown for each fiscal year represent dividends approved and paid during the fiscal year and the related appropriation to legal reserve.
20. REGULATORY CAPITAL REQUIREMENTS
Japan
The Bank is subject to various regulatory capital requirements promulgated by the regulatory authorities of the countries in which it operates. Failure to meet minimum capital requirements will initiate certain mandatory actions by regulators that, if undertaken, could have a direct material effect on the Bank’s consolidated financial statements.
In Japan, the Bank is subject to regulatory capital requirements administered by the FSA in accordance with the provisions of the Banking Law and related regulations. A banking institution is subject to the minimum capital adequacy requirements both on a consolidated basis and a stand-alone basis, and is required to maintain the minimum capital irrespective of whether it operates independently or as a subsidiary under the control of another company. When a bank holding company manages operations of its banking subsidiaries, it is required to maintain the minimum capital adequacy ratio on a consolidated basis in the same manner as its subsidiary banks. The FSA provides two sets of capital adequacy guidelines. One is a set of guidelines applicable to Japanese banks and bank holding companies with foreign offices conducting international operations, as defined, and the other is applicable to Japanese banks and bank holding companies that are not engaged in international operations.
Under the capital adequacy guidelines applicable to a Japanese banking institution with international operations conducted by foreign offices, the minimum target capital ratio of 8.0% is required. The capital adequacy guidelines adopt the approach of risk-weighted capital measure based on the framework developed and proposed by the Basel Committee on Banking Supervision of the Bank for International Settlements and involve quantitative credit measures of the assets and certain off-balance-sheet items as calculated under Japanese GAAP. Also, a banking institution engaged in certain qualified trading activities, as defined, is required to calculate an additional capital charge for market risk using either the institution’s own internal risk measurement model or a standardized process proposed and defined by the Bank for International Settlements. Capital is classified into three tiers, referred to as Tier I, Tier II and Tier III. Tier I generally consists of shareholders’ equity (including common stock, preferred stock, capital surplus, minority interests and retained earnings) less any recorded goodwill. Tier II generally consists of general reserves for credit losses up to 1.25% of risk-weighted assets, 45% of the unrealized gains on investment securities available for sale, 45% of the land revaluation excess, the balance of perpetual subordinated debt and the balance of subordinated term debt with an original maturity of over five years subject to some limitations, up to 50% of Tier I capital. Preferred stocks are includable in Tier I capital unless the preferred stocks have a fixed maturity, in which case, such preferred stocks will be components of Tier II capital. Tier III capital generally consists of short-term subordinated debt with an original maturity of at least two years, subject to certain limitations. At least 50% of the minimum capital requirements must be maintained in the form of Tier I capital.
If a banking institution is not engaged in international operations conducted by foreign offices, it is subject to the other set of capital adequacy requirements with a minimum target capital ratio of 4.0%. Such guidelines
F-63
Table of Contents
THE BANK OF TOKYO-MITSUBISHI, LTD. AND SUBSIDIARIES
NOTES TO CONSOLIDATED FINANCIAL STATEMENTS—(Continued)
incorporate measures of risk under the risk-weighted approach similar to the guidelines applicable to banking institutions with international operations. Qualifying capital is classified into Tier I and Tier II capital.
The Banking Law and related regulations require that one of three categories be assigned to banks and bank holding companies, based on its risk-adjusted capital adequacy ratio if the bank fails to meet the minimum target capital adequacy ratio. These categories indicate capital deterioration, which may be subject to certain prompt corrective action by the FSA.
The Bank has international operations conducted by foreign offices, as defined, and is subject to the 8.0% capital adequacy requirement. For the purpose of calculating the additional charge for market risk, the Bank has adopted the internal risk measurement model approach for general market risk calculations.
The risk-adjusted capital amounts and ratios of the Bank presented in the following table are based on amounts calculated in accordance with Japanese GAAP as required by the FSA.
| Actual | For capital adequacy purposes | |||||||||||
| Amount | Ratio | Amount | Ratio | |||||||||
| (in millions, except percentages) | ||||||||||||
Consolidated: | ||||||||||||
At March 31, 2004: | ||||||||||||
Total capital (to risk-weighted assets): | ¥ | 5,279,586 | 11.97 | % | ¥ | 3,527,511 | 8.00 | % | ||||
Tier I capital (to risk-weighted assets): | 2,876,007 | 6.52 | 1,763,756 | 4.00 | ||||||||
At March 31, 2005: | ||||||||||||
Total capital (to risk-weighted assets): | ¥ | 5,520,653 | 11.83 | % | ¥ | 3,733,030 | 8.00 | % | ||||
Tier I capital (to risk-weighted assets): | 3,199,568 | 6.86 | 1,866,515 | 4.00 | ||||||||
Stand-alone: | ||||||||||||
At March 31, 2004: | ||||||||||||
Total capital (to risk-weighted assets): | ¥ | 4,677,718 | 12.18 | % | ¥ | 3,070,027 | 8.00 | % | ||||
Tier I capital (to risk-weighted assets): | 2,437,541 | 6.35 | 1,535,014 | �� | 4.00 | |||||||
At March 31, 2005: | ||||||||||||
Total capital (to risk-weighted assets): | ¥ | 4,925,209 | 12.22 | % | ¥ | 3,224,668 | 8.00 | % | ||||
Tier I capital (to risk-weighted assets): | 2,733,885 | 6.78 | 1,612,334 | 4.00 | ||||||||
The Bank has securities subsidiaries in Japan and overseas, which are also subject to regulatory capital requirements. In Japan, the Securities and Exchange Law and related ordinance require securities firms to maintain a minimum capital ratio of 120% calculated as a percentage of capital accounts less certain fixed assets, as determined in accordance with Japanese GAAP, against amounts equivalent to market, counterparty credit and operations risks. Specific guidelines are issued as a ministerial ordinance which details the definition of essential components of the capital ratios, including capital, deductible fixed asset items and risks, and related measures. Failure to maintain a minimum capital ratio will trigger mandatory regulatory actions. A capital ratio of less than 140% will call for regulatory reporting and a capital ratio of 100% or less may lead to a suspension of all or part of the business for a period of time and cancellation of a license. Overseas securities subsidiaries are subject to the relevant regulatory capital requirements of the countries or jurisdictions in which they operate.
Management believes, as of March 31, 2005, that the Bank and other regulated securities subsidiaries meet all capital adequacy requirements to which they are subject.
F-64
Table of Contents
THE BANK OF TOKYO-MITSUBISHI, LTD. AND SUBSIDIARIES
NOTES TO CONSOLIDATED FINANCIAL STATEMENTS—(Continued)
United States of America
In the United States of America, UNBC and its banking subsidiary Union Bank of California, N.A. (“UBOC”), the Bank’s largest subsidiaries operating outside Japan, are subject to various regulatory capital requirements administered by U.S. Federal banking agencies, including minimum capital requirements. Under the capital adequacy guidelines and the regulatory framework for prompt corrective action, UNBC and UBOC must meet specific capital guidelines that involve quantitative measures of UNBC’s and UBOC’s assets, liabilities, and certain off-balance-sheet items as calculated under U.S. regulatory accounting practices. UNBC’s and UBOC’s capital amounts and UBOC’s prompt corrective action classification are also subject to qualitative judgments by the regulators about components, risk weightings and other factors.
Quantitative measures established by regulation to ensure capital adequacy require UNBC and UBOC to maintain minimum amounts and ratios (set forth in the table below) of total and Tier I capital (as defined in the regulations) to risk-weighted assets (as defined) and of Tier I capital (as defined) to quarterly average assets (as defined).
UNBC’s and the UBOC’s actual capital amounts and ratios are presented as follows:
| Actual | For capital adequacy purposes | |||||||||||
| Amount | Ratio | Amount | Ratio | |||||||||
| (in millions, except percentages) | ||||||||||||
UNBC: | ||||||||||||
At December 31, 2003: | ||||||||||||
Total capital (to risk-weighted assets) | $ | 4,684 | 14.14 | % | $ | 2,651 | 8.00 | % | ||||
Tier I capital (to risk-weighted assets) | 3,748 | 11.31 | 1,325 | 4.00 | ||||||||
Tier I capital (to quarterly average assets) | 3,748 | 9.03 | 1,660 | 4.00 | ||||||||
At December 31, 2004: | ||||||||||||
Total capital (to risk-weighted assets) | $ | 4,786 | 12.17 | % | $ | 3,146 | 8.00 | % | ||||
Tier I capital (to risk-weighted assets) | 3,818 | 9.71 | 1,573 | 4.00 | ||||||||
Tier I capital (to quarterly average assets) | 3,818 | 8.09 | 1,887 | 4.00 | ||||||||
| Actual | For capital adequacy purposes | Ratios OCC “well capitalized” | ||||||||||||||||
| Amount | Ratio | Amount | Ratio | Amount | Ratio | |||||||||||||
| (in millions, except percentages) | ||||||||||||||||||
UBOC: | ||||||||||||||||||
At December 31, 2003: | ||||||||||||||||||
Total capital (to risk-weighted assets) | $ | 3,863 | 11.88 | % | $ | 2,602 | 8.00 | % | $ | 3,253 | 10.00 | % | ||||||
Tier I capital (to risk-weighted assets) | 3,396 | 10.44 | 1,301 | 4.00 | 1,952 | 6.00 | ||||||||||||
Tier I capital (to quarterly average assets) | 3,396 | 8.30 | 1,637 | 4.00 | 2,046 | 5.00 | ||||||||||||
At December 31, 2004: | ||||||||||||||||||
Total capital (to risk-weighted assets) | $ | 4,091 | 10.57 | % | $ | 3,097 | 8.00 | % | $ | 3,871 | 10.00 | % | ||||||
Tier I capital (to risk-weighted assets) | 3,598 | 9.29 | 1,548 | 4.00 | 2,323 | 6.00 | ||||||||||||
Tier I capital (to quarterly average assets) | 3,598 | 7.72 | 1,864 | 4.00 | 2,329 | 5.00 | ||||||||||||
Management believes, as of December 31, 2004, that UNBC and UBOC met all capital adequacy requirements to which they are subject.
F-65
Table of Contents
THE BANK OF TOKYO-MITSUBISHI, LTD. AND SUBSIDIARIES
NOTES TO CONSOLIDATED FINANCIAL STATEMENTS—(Continued)
As of December 31, 2003 and 2004, the most recent notification from the U.S. Office of the Comptroller of the Currency (“OCC”) categorized UBOC as “well capitalized” under the regulatory framework for prompt corrective action. To be categorized as “well capitalized,” UBOC must maintain minimum total risk-based, Tier I risk-based, and Tier I leverage ratios as set forth in the table. There are no conditions or events since that notification that management believes have changed UBOC’s category.
21. EARNINGS PER COMMON SHARE
Reconciliations of net income and weighted average number of common shares outstanding used for the computation of basic earnings per common share to the adjusted amounts for the computation of diluted earnings per common share for the fiscal years ended March 31, 2003, 2004 and 2005 were as follows:
| 2003 | 2004 | 2005 | ||||||||||
| (in millions) | ||||||||||||
Income (Numerator): | ||||||||||||
Income from continuing operations before cumulative effect of a change in accounting principle | ¥ | 239,140 | ¥ | 538,186 | ¥ | 288,085 | ||||||
Income (loss) from discontinued operations | 10,370 | (585 | ) | — | ||||||||
Cumulative effect of a change in accounting principle | (532 | ) | — | (977 | ) | |||||||
Net income | 248,978 | 537,601 | 287,108 | |||||||||
Income allocable to a preferred shareholder | (3,358 | ) | (10,073 | ) | (6,716 | ) | ||||||
Income available to a common shareholder | 245,620 | 527,528 | 280,392 | |||||||||
Effect of dilutive securities: | ||||||||||||
3% Exchangeable Guaranteed Notes redeemed on November 30, 2002 | (10,997 | ) | — | — | ||||||||
Convertible debt—Mitsubishi Securities | — | (877 | ) | (391 | ) | |||||||
Stock options—Mitsubishi Securities | — | (7 | ) | (5 | ) | |||||||
Stock options—UNBC | — | (554 | ) | (894 | ) | |||||||
Income available to a common shareholder and assumed conversions | ¥ | 234,623 | ¥ | 526,090 | ¥ | 279,102 | ||||||
F-66
Table of Contents
THE BANK OF TOKYO-MITSUBISHI, LTD. AND SUBSIDIARIES
NOTES TO CONSOLIDATED FINANCIAL STATEMENTS—(Continued)
| 2003 | 2004 | 2005 | ||||||||||
| (thousands of shares) | ||||||||||||
Shares (Denominator): | ||||||||||||
Weighted average common shares outstanding | 4,679,226 | 5,019,470 | 5,019,470 | |||||||||
Effect of dilutive securities: | ||||||||||||
3% Exchangeable Guaranteed Notes redeemed on November 30, 2002 | 98,133 | — | — | |||||||||
Weighted average common shares for diluted computation | 4,777,359 | 5,019,470 | 5,019,470 | |||||||||
| 2003 | 2004 | 2005 | ||||||||||
| (in yen) | ||||||||||||
Amounts per share: | ||||||||||||
Basic earnings per common share: | ||||||||||||
Income from continuing operations available to a common shareholder before cumulative effect of a change in accounting principle | ¥ | 50.39 | ¥ | 105.22 | ¥ | 56.06 | ||||||
Income (loss) from discontinued operations | 2.22 | (0.12 | ) | — | ||||||||
Income available to a common shareholder before cumulative effect of a change in accounting principle | 52.61 | 105.10 | 56.06 | |||||||||
Cumulative effect of a change in accounting principle | (0.12 | ) | — | (0.19 | ) | |||||||
Net income available to a common shareholder | ¥ | 52.49 | ¥ | 105.10 | ¥ | 55.87 | ||||||
Diluted earnings per common share: | ||||||||||||
Income from continuing operations available to a common shareholder before cumulative effect of a change in accounting principle | ¥ | 47.05 | ¥ | 104.93 | ¥ | 55.80 | ||||||
Income (loss) from discontinued operations | 2.17 | (0.12 | ) | — | ||||||||
Income available to a common shareholder before cumulative effect of a change in accounting principle | 49.22 | 104.81 | 55.80 | |||||||||
Cumulative effect of a change in accounting principle | (0.11 | ) | — | (0.19 | ) | |||||||
Net income available to a common shareholder | ¥ | 49.11 | ¥ | 104.81 | ¥ | 55.61 | ||||||
For the fiscal year ended March 31, 2003, 3% Exchangeable Guaranteed Notes due 2002 that had been redeemed in November 2002 were included in the computation of diluted earnings per common share. For the fiscal year ended March 31, 2004, convertible securities and stock options issued by the subsidiaries that could potentially dilute earnings per common share in the future were included in the computation of diluted earnings per common share. The convertible securities are 1 1/4% Convertible Bonds due 2013 and 1/4% Convertible Bonds due 2014 issued by Mitsubishi Securities. The stock options are based on the stock-based compensation plans of Mitsubishi Securities and UNBC. For the fiscal year ended March 31, 2005, convertible securities and stock options issued by the subsidiaries that could potentially dilute earnings per common share in the future were included in the computation of diluted earnings per common share. The convertible securities are 1/4% Convertible Bonds due 2014 issued by Mitsubishi Securities. The stock options are based on the stock-based compensation plans of Mitsubishi Securities and UNBC.
F-67
Table of Contents
THE BANK OF TOKYO-MITSUBISHI, LTD. AND SUBSIDIARIES
NOTES TO CONSOLIDATED FINANCIAL STATEMENTS—(Continued)
22. DERIVATIVE FINANCIAL INSTRUMENTS
The Group uses various derivative financial instruments both for trading purposes and for purposes other than trading (primarily risk management purposes) in the normal course of business to meet the financial needs of its customers, as a source of revenue and to manage its exposures to a variety of risks. The Group is a party to derivatives, including swaps, forwards, options and other types of derivatives, dealing primarily with market risk associated with interest rate, foreign currency, equity and commodity prices, and credit risk associated with counterparty’s nonperformance of transactions.
Market risk is the possibility that future changes in market indices make the financial instruments less valuable. Credit risk is the possibility that a loss may result from a counterparty’s failure to perform according to the terms and conditions of the contract, which may exceed the value of underlying collateral. To reduce credit risk, the Group may require collateral or guaranties based on a case-by-case assessment of creditworthiness of each customer and evaluation of the instrument. The Group also uses master netting agreements in order to mitigate overall counterparty credit risk.
Trading Activities
The Group’s trading activities include dealing and other activities measured at fair value with gains and losses recognized currently in earnings. As part of its trading activities, the Group offers a variety of derivative financial instruments and debt instruments for managing interest rate and foreign exchange risk to its domestic and foreign corporate and financial institution customers. The Group also enters into other types of derivative transactions, including equity and credit-related contracts, for its own account.
Risk Management Activities
As part of risk management activities, the Group uses certain derivative financial instruments to manage its interest rate and currency exposures. The Group maintains an overall interest rate risk management strategy that incorporates the use of interest rate contracts to minimize significant unplanned fluctuations in earnings that are caused by interest rate volatility. The Group’s goal is to manage interest rate sensitivity so that movements in interest rates do not adversely affect net interest income. As a result of interest rate fluctuations, hedged fixed-rate assets and liabilities appreciate or depreciate in market value. Gains or losses on the derivative instruments that are linked to the hedged fixed-rate assets and liabilities are expected to substantially offset this unrealized appreciation or depreciation. Interest income and interest expense on hedged variable-rate assets and liabilities, respectively, increase or decrease as a result of interest rate fluctuations. Gains and losses on the derivative instruments that are linked to these hedged assets and liabilities are expected to substantially offset this variability in earnings.
The Group enters into interest rate swaps and other contracts as part of its interest rate risk management strategy primarily to alter the interest rate sensitivity of its loans, investment securities and deposit liabilities. The Group’s principal objectives in risk management include asset and liability management. Asset and liability management is viewed as one of the methods for the Group to manage its interest rate exposures on interest-bearing assets and liabilities. Interest rate contracts, which are generally non-leveraged generic interest rate and basis swaps, options and futures, allow the Group to effectively manage its interest rate risk position. Option contracts primarily consist of caps, floors, swaptions and options on index futures. Futures contracts used for asset and liability management activities are primarily index futures providing for cash payments based upon the movement of an underlying rate index. The Group enters into forward exchange contracts, currency swaps and other contracts in response to currency exposures resulting from on-balance-sheet assets and liabilities denominated in foreign currencies in order to limit the net foreign exchange position by currency to an appropriate level.
F-68
Table of Contents
THE BANK OF TOKYO-MITSUBISHI, LTD. AND SUBSIDIARIES
NOTES TO CONSOLIDATED FINANCIAL STATEMENTS—(Continued)
The risk management activities reduce the Group’s risk exposures economically, however, derivatives used for the risk management activities often fail to meet certain conditions to qualify for hedge accounting and the Group accounts for such derivatives as trading positions.
For the fiscal years ended March 31, 2004 and 2005, except for derivative transactions conducted by certain foreign subsidiaries, the Group accounted for derivatives held for risk management purposes as trading positions and measured them at fair value.
Embedded Derivatives
Derivative features embedded in other non-derivative host contracts are separated from the host contracts and measured at fair value when they are not clearly and closely related to the host contract and meet the definition of a derivative. The change in the fair value of such an embedded derivative is recognized currently in earnings, unless it is qualified as a hedge. The carrying amount is reported on the consolidated balance sheet with the host contract. The Group accounts for credit-linked notes as host contracts with embedded derivatives and measures the entire contracts at fair value.
UNBC
Derivative positions are integral components of the UNBC’s designated asset and liability management activities. UNBC uses interest rate derivatives to manage the sensitivity of the UNBC’s net interest income to changes in interest rates. These instruments are used to manage interest rate risk relating to specified groups of assets and liabilities, primarily LIBOR-based commercial loans, certificates of deposit, medium-term notes and subordinated debt.
Cash Flow Hedges—Hedging Strategies for Variable Rate Loans and Certificates of Deposit
UNBC engages in several types of cash flow hedging strategies for which the hedged transactions are forecasted future loan interest payments, and the hedged risk is the variability in those payments due to changes in the designated benchmark rate, e.g., U.S. dollar LIBOR. In these strategies, the hedging instruments are matched with groups of variable rate loans such that the tenor of the variable rate loans and that of the hedging instrument are identical. Cash flow hedging strategies include the utilization of purchased floor, cap, corridor options and interest rate swaps. At December 31, 2004, the weighted average remaining life of the currently active (excluding any forward positions) cash flow hedges was approximately 1.3 years.
UNBC uses purchased interest rate floors to hedge the variable cash flows associated with 1-month LIBOR or 3-month LIBOR indexed loans. Payments received under the floor contract offset the decline in loan interest income caused by the relevant LIBOR index falling below the floor’s strike rate.
UNBC uses interest rate floor corridors to hedge the variable cash flows associated with 1-month LIBOR or 3-month LIBOR indexed loans. Net payments to be received under the floor corridor contracts offset the decline in loan interest income caused by the relevant LIBOR index falling below the corridor’s upper strike rate, but only to the extent the index falls to the lower strike rate. The corridor will not provide protection from declines in the relevant LIBOR index to the extent it falls below the corridor’s lower strike rate.
UNBC uses interest rate collars to hedge the variable cash flows associated with 1-month LIBOR or 3-month LIBOR indexed loans. Net payments to be received under the collar contract offset the decline in loan interest income caused by the relevant LIBOR index falling below the collar’s floor strike rate while net payments to be paid will reduce the increase in loan interest income caused by the LIBOR index rising above the collar’s cap strike rate.
F-69
Table of Contents
THE BANK OF TOKYO-MITSUBISHI, LTD. AND SUBSIDIARIES
NOTES TO CONSOLIDATED FINANCIAL STATEMENTS—(Continued)
UNBC uses interest rate swaps to hedge the variable cash flows associated with 1-month LIBOR or 3-month LIBOR indexed loans. Payments to be received (or paid) under the swap contract will offset the fluctuations in loan interest income caused by changes in the relevant LIBOR index. As such, these instruments hedge all fluctuations in the loans’ interest income caused by changes in the relevant LIBOR index.
UNBC uses purchased interest rate caps to hedge the variable interest cash flows associated with the forecasted issuance and rollover of short-term, fixed rate, negotiable certificates of deposit (“CD”). In these hedging relationships, UNBC hedges the LIBOR component of the CD rates, which is either 3-month LIBOR or 6-month LIBOR, based on the CDs’ original term to maturity, which reflects their repricing frequency. Net payments to be received under the cap contract offset the increase in interest expense caused by the relevant LIBOR index rising above the cap’s strike rate.
UNBC uses interest rate cap corridors to hedge the variable cash flows associated with the forecasted issuance and rollover of short-term, fixed rate, negotiable CDs. In these hedging relationships, UNBC hedges the LIBOR component of the CD rates, either 1-month LIBOR, 3-month LIBOR, or 6-month LIBOR, based on the original term to maturity of the CDs, which reflects their repricing frequency. Net payments to be received under the cap corridor contract offset the increase in deposit interest expense caused by the relevant LIBOR index rising above the corridor’s lower strike rate, but only to the extent the index rises to the upper strike rate. The corridor will not provide protection from increases in the relevant LIBOR index to the extent it rises above the corridor’s upper strike rate.
Hedging transactions are structured at inception so that the notional amounts of the hedge are matched with an equal principal amount of loans or CDs, the index and repricing frequencies of the hedge matches those of the loans or CDs, and the period in which the designated hedged cash flows occurs is equal to the term of the hedge. As such, most of the ineffectiveness in the hedging relationship results from the mismatch between the timing of reset dates on the hedge versus those of the loans or CDs. In 2004, UNBC recognized a net loss of $1.8 million due to ineffectiveness, which is recognized in Non-interest expense, compared to a net gain of $0.9 million in 2003.
For cash flow hedges, based upon amounts included in accumulated other comprehensive income at March 31, 2005, the Group expects to realize approximately ¥1.4 billion in net interest income for the fiscal year ending March 31 2006. This amount could differ from amounts actually realized due to changes in interest rates and the addition of other hedges subsequent to March 31, 2005.
Fair Value Hedges—Hedging Strategy for “MarketPath” Certificates of Deposit
UNBC engages in a hedging strategy in which interest bearing CDs issued to customers, which are tied to the changes in the Standard and Poor’s 500 index, are exchanged for a fixed rate of interest. UNBC accounts for the embedded derivative in the CDs at fair value. A total return swap that encompasses the value of a series of options that had individually hedged each CD is valued at fair value and any ineffectiveness resulting from the hedge and the hedged item are recognized in Non-interest expense.
Hedging Strategy for UNBC—Junior Subordinated Debt Payable to Subsidiary Grantor Trust (Trust Notes)
On February 19, 2004, UNBC terminated its fair value hedge and called its Trust Notes. Prior to this date, UNBC engaged in an interest rate hedging strategy in which an interest rate swap was associated with a specific interest bearing liability, UNBC’s Trust Notes, in order to convert the liability from a fixed rate to a floating rate instrument. This strategy mitigated the changes in fair value of the hedged liability caused by changes in the designated benchmark interest rate, U.S. dollar LIBOR. The fair value hedging transaction was structured at
F-70
Table of Contents
THE BANK OF TOKYO-MITSUBISHI, LTD. AND SUBSIDIARIES
NOTES TO CONSOLIDATED FINANCIAL STATEMENTS—(Continued)
inception so that the notional amount of the swap matched an associated principal amount of the Trust Notes. The interest payment dates, the expiration date, and the embedded call option of the swap matched those of the Trust Notes. The ineffectiveness on the fair value hedges in 2004 was a net gain of $1.6 million, realized upon the termination of the swap on February 19, 2004, compared to a net gain of less than $0.1 million in 2003.
23. OBLIGATIONS UNDER GUARANTEES AND OTHER OFF-BALANCE-SHEET INSTRUMENTS
Obligations under Guarantees
The Group provides customers with a variety of guarantees and similar arrangements, including standby letters of credit, financial and performance guarantees, credit protections, liquidity facilities, other off-balance-sheet credit-related supports and similar instruments, in order to meet the customers’ financial and business needs. The table below summarizes the contractual or notional amounts with regard to obligations under guarantees and similar arrangements at March 31, 2004 and 2005. The contractual or notional amounts of these instruments represent the maximum potential amounts of future payments without consideration of possible recoveries under recourse provisions or from collateral held or pledged.
For certain types of derivatives, such as written interest rate options and written currency options, the maximum potential future payments are unlimited. Accordingly, it is impracticable to estimate such maximum potential amount of future payments. As such, the notional amounts of the related contracts, other than the maximum potential payments, are included in the table.
The Group mitigates credit risk exposure resulting from guarantees by utilizing various techniques, including collateralization in the form of cash, securities, and real properties based on management’s credit assessment of the guaranteed parties and the related credit profile. In order to manage the credit risk exposure, the Group also enters into sub-participation contracts with third parties who will fund a portion of the credit facility and bear its share of the loss to be incurred in the event that the borrower fails to fulfill its obligations. The following table includes unfunded commitments of ¥116.3 billion and ¥137.5 billion, respectively, at March 31, 2004 and 2005, which are participated out to third parties. The contractual or notional amounts summarized in the following table may not necessarily bear any direct relationship to the future actual credit exposure, primarily because of those risk management techniques.
At March 31, 2004 | Maximum or Notional | Amount by expiration period | ||||||||||||||||
Less than (Restated) | 1-2 years | 2-3 years | 3-5 years | Over 5 years | ||||||||||||||
| (in billions) | ||||||||||||||||||
Standby letters of credit and financial guarantees | ¥ | 2,561 | ¥ | 1,340 | ¥ | 120 | ¥ | 75 | ¥ | 127 | ¥ | 899 | ||||||
Performance guarantees | 1,192 | 669 | 191 | 125 | 122 | 85 | ||||||||||||
Liquidity facilities | 555 | 555 | — | — | — | — | ||||||||||||
Derivative instruments | 20,731 | 16,135 | 1,339 | 1,121 | 1,557 | 579 | ||||||||||||
Other | 309 | 309 | — | — | — | — | ||||||||||||
Total | ¥ | 25,348 | ¥ | 19,008 | ¥ | 1,650 | ¥ | 1,321 | ¥ | 1,806 | ¥ | 1,563 | ||||||
F-71
Table of Contents
THE BANK OF TOKYO-MITSUBISHI, LTD. AND SUBSIDIARIES
NOTES TO CONSOLIDATED FINANCIAL STATEMENTS—(Continued)
At March 31, 2005 | Maximum potential/ Contractual or Notional amount (Restated) | Amount by expiration period | ||||||||||||||||
| Less than 1 year (Restated) | 1-2 years | 2-3 years | 3-5 years | Over 5 years | ||||||||||||||
| (in billions) | ||||||||||||||||||
Standby letters of credit and financial guarantees | ¥ | 2,482 | ¥ | 1,247 | ¥ | 124 | ¥ | 97 | ¥ | 244 | ¥ | 770 | ||||||
Performance guarantees | 1,353 | 773 | 214 | 113 | 175 | 78 | ||||||||||||
Derivative instruments | 15,983 | 9,598 | 2,212 | 1,803 | 1,497 | 873 | ||||||||||||
Other | 512 | 512 | — | — | — | — | ||||||||||||
Total | ¥ | 20,330 | ¥ | 12,130 | ¥ | 2,550 | ¥ | 2,013 | ¥ | 1,916 | ¥ | 1,721 | ||||||
Subsequent to the issuance of the Group’s consolidated financial statements for the fiscal year ended March 31, 2005, management determined that the contractual amounts of obligations under guarantees for the fiscal year ended March 31, 2004 and March 31, 2005 were erroneously disclosed. These errors had no impact on the consolidated financial position or results of operations. As a result, such amounts have been restated from the amounts previously reported as follows:
| Maximum potential/ Contractual or Notional amount | Amount by expiration period | |||||||||||||||||||||||||||||||||||
| Less than 1 year | 1-2 years | 2-3 years | 3-5 years | Over 5 years | ||||||||||||||||||||||||||||||||
| As previously reported | As restated | As previously reported | As restated | As previously reported | As restated | As previously reported | As restated | As previously reported | As restated | As previously reported | As restated | |||||||||||||||||||||||||
| (in billions) | ||||||||||||||||||||||||||||||||||||
At March 31, 2004 | ||||||||||||||||||||||||||||||||||||
Standby letters of credit and financial guarantees | ¥ | 2,561 | ¥ | 2,561 | ¥ | 1,043 | ¥ | 1,340 | ¥ | 198 | ¥ | 120 | ¥ | 159 | ¥ | 75 | ¥ | 252 | ¥ | 127 | ¥ | 909 | ¥ | 899 | ||||||||||||
Performance guarantees | 1,192 | 1,192 | 654 | 669 | 199 | 191 | 128 | 125 | 126 | 122 | 85 | 85 | ||||||||||||||||||||||||
At March 31, 2005 | ||||||||||||||||||||||||||||||||||||
Standby letters of credit and financial guarantees | ¥ | 3,754 | ¥ | 2,482 | ¥ | 928 | ¥ | 1,247 | ¥ | 659 | ¥ | 124 | ¥ | 257 | ¥ | 97 | ¥ | 686 | ¥ | 244 | ¥ | 1,224 | ¥ | 770 | ||||||||||||
Performance guarantees | 1,353 | 1,353 | 264 | 773 | 564 | 214 | 191 | 113 | 203 | 175 | 131 | 78 | ||||||||||||||||||||||||
Nature of guarantee contracts
Standby letters of credit and financial guarantees generally include an obligation of an issuer or a designated third party to guarantee the performance of the customer to the beneficiary under the terms of contracts such as lending contracts and other similar financial transactions. The Group is required to make payments to the guaranteed parties in the events that the customers fail to fulfill the obligations under the contracts. The guarantees whose contractual maturities are over 5 years are mainly comprised of guarantees of housing loans.
Performance guarantees are the contracts that contingently require the Group to make payments to the guaranteed party based on another party’s failure to perform under an obligating agreement, except financial obligation. For example, performance guarantees include guarantees of completion of construction projects.
Liquidity facilities may include a provision of guarantees of collection of contractual cash flows under an asset securitization structure, involving variable interest entities. Such guarantee provisions protect the beneficiary of
F-72
Table of Contents
THE BANK OF TOKYO-MITSUBISHI, LTD. AND SUBSIDIARIES
NOTES TO CONSOLIDATED FINANCIAL STATEMENTS—(Continued)
an asset securitization from negative returns relating to shortfalls of cash collections on the underlying assets held by the securitization vehicle. See Note 24 for additional information on the Group’s operations regarding variable interest entities.
Derivative instruments that are deemed to be included within the definition of guarantees as prescribed in FIN No. 45 include certain written options and credit default swaps. In order for the Group to determine if those derivative instruments meet the definition of guarantees as prescribed in FIN No. 45, the Group has to track whether the counterparties are actually exposed to the losses that will result from the adverse change in the underlyings. Accordingly, the Group has disclosed information on all credit default swaps and certain written options for which there is a possibility of meeting the definition of guarantees as prescribed in FIN No. 45, regardless of whether the counterparties have assets or liabilities related to the underlyings of the derivatives.
Other includes contingent consideration agreements and security lending indemnifications. Contingent consideration agreements provide guarantees on additional payments to acquired insurance agencies’ shareholders based on the agencies’ future performance in excess of established revenue and/or earnings before interest, taxes, depreciation and amortization thresholds. Security lending indemnifications are the indemnifications for institutional customers of securities lending transactions against counterparty default. All lending transactions are collateralized, primarily by cash.
Carrying amount
At March 31, 2004 and 2005, the carrying amounts of the liabilities related to guarantees and similar instruments set forth above were ¥233,257 million and ¥213,100 million, respectively, which are included in Other liabilities and Trading account liabilities. In addition, Other liabilities also include an allowance for off-balance-sheet instruments of ¥73,092 million and ¥39,744 million, respectively, related to these transactions.
Other Off-Balance-Sheet Instruments
In addition to obligations under guarantees set forth above, the Group issues other off-balance-sheet instruments for purposes other than trading. Such off-balance-sheet instruments consist of lending-related commitments, including commitments to extend credit and commercial letters of credit that the Group provides to meet the financing needs of its customers. Once the Group issues these financial instruments, the Group is required to extend credit to or make certain payments to the customers or beneficiaries specified pursuant to the underlying contracts unless otherwise provided in the contracts. Since many of these commitments expire without being drawn upon, the total commitment amounts do not necessarily represent future cash requirements. At March 31, 2005, approximately 75% of these commitments will expire within one year, 23% from one year to five years and 2% after five years. The table below summarizes the contractual amounts with regard to these commitments at March 31, 2004 and 2005.
| 2004 (Restated) | 2005 (Restated) | |||||
| (in billions) | ||||||
Commitments to extend credit | ¥ | 22,857 | ¥ | 24,601 | ||
Commercial letters of credit | 377 | 458 | ||||
Resale and repurchase agreements | 186 | — | ||||
Commitments to make investments | 39 | 15 | ||||
Subsequent to the issuance of the Group’s consolidated financial statements for the fiscal year ended March 31, 2005, management determined that the commitment amounts of resale and repurchase agreements for the fiscal
F-73
Table of Contents
THE BANK OF TOKYO-MITSUBISHI, LTD. AND SUBSIDIARIES
NOTES TO CONSOLIDATED FINANCIAL STATEMENTS—(Continued)
year ended March 31, 2004 and March 31, 2005 were erroneously disclosed. These errors had no impact on the consolidated financial position or results of operations. As a result, such amounts have been restated from the amounts previously reported as follows:
| 2004 | 2005 | |||||||
| As previously reported | As restated | As previously reported | As restated | |||||
| (in billions) | ||||||||
Resale and repurchase agreements | ¥206 | ¥ 186 | ¥372 | ¥— | ||||
In addition, the approximate remaining terms of these commitments at March 31, 2005 were also erroneously disclosed and have been restated as follows:
| 2005 | ||||||||||||||||||
| Within one year | From one year to five years | After five years | ||||||||||||||||
| As previously reported | As restated | As previously reported | As restated | As previously reported | As restated | |||||||||||||
Approximate remaining terms of these commitments | 65 | % | 75 | % | 29 | % | 23 | % | 6 | % | 2 | % | ||||||
Commitments to extend credit, which generally have fixed expiration dates or other termination clauses, are legally binding agreements to lend to customers. Commitments are different from guarantees in that the commitments are generally revocable or have provisions that enable the Group to avoid payments in the event of violations of any conditions of the contracts and certain deterioration of the potential borrowers’ financial condition. Commitments to extend credit may expire without being drawn upon. Therefore, the total commitment amounts do not necessarily represent future cash requirements.
Commercial letters of credit, used for facilitating trade transactions, are generally secured by underlying goods. The Group continually monitors the type and amount of collateral and other security, and requires counterparties to provide additional collateral or guarantors as necessary.
Repurchase and resale transactions are collateralized financing agreements. In a sale of securities or other financial instruments with an agreement to repurchase them, the Group sells securities or other financial instruments at a stated price to a counterparty and agrees to repurchase identical financial instruments from the same counterparty at a later date at the predetermined price which reflect the principal amount and interest. In a purchase of securities or other financial instruments with an agreement to resell them, the Group receives securities or other financial instruments for a stated price from a counterparty and agrees to sell them to the same counterparty at a later date at the predetermined price reflecting the principal amount and interest. When certain conditions specified in SFAS No. 140 are met, the Group accounts for resale agreements as purchase of financial instruments with related off-balance-sheet forward resale commitments and repurchase agreements as sale of financial instruments with related off-balance-sheet forward repurchase agreements. The Group bears the off-balance-sheet risk related to the forward resale and repurchase commitments, including credit risk and market risk.
Commitments to make investments are legally binding contracts to make additional contributions to corporate recovery or private equity investment funds in accordance with limited partnership agreements. Some of these funds, in which the Group has significant variable interests, are described in Note 24.
Concentration of Credit Risk
Although the Group’s portfolio of financial instruments, including on-balance-sheet instruments, is widely diversified along industry and geographic lines, a significant portion of the transactions with off-balance-sheet risk are entered into with other financial institutions.
F-74
Table of Contents
THE BANK OF TOKYO-MITSUBISHI, LTD. AND SUBSIDIARIES
NOTES TO CONSOLIDATED FINANCIAL STATEMENTS—(Continued)
24. VARIABLE INTEREST ENTITIES
A variable interest entity (“VIE”) is defined as an entity with one or more of the following characteristics; (1) the equity investment at risk is not sufficient to permit the entity to finance its activities without additional subordinated financial support from other parties, (2) the equity investors lack significant decision making ability or do not absorb the expected losses or receive the expected residual returns or (3) the equity interests have voting rights that are not proportionate to their economic interests, and the activities of the entity involve or are conducted on behalf of an investor with a disproportionately small voting interest. Variable interests in a variable interest entity are contractual, ownership, or other pecuniary interests in an entity that change with changes in the fair value of the entity’s net assets exclusive of variable interests. An enterprise is required to consolidate a variable interest entity if that enterprise has a variable interest that will absorb a majority of the entity’s expected losses, receive a majority of the entity’s expected returns, or both. An enterprise that consolidates a VIE is referred to as the primary beneficiary.
In the normal course of its business, the Group is a party to various entities which may be deemed to be variable interest entities such as asset-backed commercial paper conduits, securitization conduits of client properties, various investment funds and special purpose entities created for structured financing.
The Group adopted FIN No. 46R on April 1, 2004, except for certain investment companies, for which the effective date of FIN No. 46R is deferred. As a result, the Group has consolidated all VIEs in which it is deemed to be the primary beneficiary including those created before February 1, 2003. The adoption of FIN No. 46R resulted in a cumulative-effect adjustment reducing net income by ¥ 977 million. See Note 1 “Accounting Changes” for more information.
The following table presents, by type of VIE, the total assets of consolidated and non-consolidated VIEs and the maximum exposure to non-consolidated VIEs at March 31, 2005:
| Consolidated VIEs | Non-consolidated VIEs | ||||||||
| Assets | Assets | Maximum exposure | |||||||
| (in millions) | |||||||||
Asset-backed commercial paper conduits | ¥ | 2,853,579 | ¥ | 387,659 | ¥ | 55,487 | |||
Securitization conduits of client properties | — | 1,000,277 | 358,107 | ||||||
Investment funds | 964,856 | 13,817,785 | 576,230 | ||||||
Special purpose entities created for structured financing | 18,758 | 14,958,609 | 909,961 | ||||||
Repackaged instruments | 152,575 | 11,470,551 | 379,132 | ||||||
Others | 164,091 | 4,344,106 | 586,064 | ||||||
Total | ¥ | 4,153,859 | ¥ | 45,978,987 | ¥ | 2,864,981 | |||
The following table presents the carrying amount of consolidated assets that correspond to VIE obligations at March 31, 2005:
| (in millions) | |||
Cash | ¥ | 125,046 | |
Trading account assets | 591,584 | ||
Investment securities | 103,400 | ||
Loans | 2,957,675 | ||
Others | 376,154 | ||
Total | ¥ | 4,153,859 | |
F-75
Table of Contents
THE BANK OF TOKYO-MITSUBISHI, LTD. AND SUBSIDIARIES
NOTES TO CONSOLIDATED FINANCIAL STATEMENTS—(Continued)
A portion of the assets presented in the table above were derived from the transactions between consolidated VIEs and the Group, the primary beneficiary, and were eliminated as intercompany transactions. The eliminated amounts were ¥64,625 million of cash and ¥1,031 million of other assets.
In general, the creditors or beneficial interest holders of consolidated VIEs have recourse only to the assets of those VIEs and do not have recourse to other assets of the Group, except where the Group provides credit support as in the case of certain asset-backed commercial paper conduits.
Asset-backed Commercial Paper Conduits
The Group administers several multi-seller finance entities (primarily commercial paper conduits) that purchase financial assets, primarily pools of receivables, from third-party customers. Assets purchased by these conduits are generally funded by issuing commercial paper to and/or by borrowings from the Group or third parties. While customers basically continue to service the transferred trade receivables, the Group underwrites, distributes, makes a market in commercial paper issued by the conduits, and also provides liquidity and credit support facilities to the entities.
In accordance with the consolidation requirements of FIN No. 46, the Group consolidated certain of these multi-seller finance entities for the fiscal year ended March 31, 2004. The Group has subsequently consolidated other multi-seller finance entities, where the Group is deemed to be the primary beneficiary, including those created before February 1, 2003.
As a result of the consolidation of these entities on March 31, 2005, the Group’s total assets, loans and commercial paper issued increased by ¥1,199,207 million, ¥2,519,457 million and ¥1,162,957 million, respectively, while the contractual or notional amounts of liquidity facilities and other off-balance-sheet credit related support were decreased by ¥1,162,957 million primarily as a result of elimination of the transactions within the Group.
The amount of total assets of the multi-seller finance entities that the Group consolidated on March 31, 2004 was ¥ 47,129 million.
Securitization Conduits of Client Properties
The Group administers several conduits that acquire client assets, primarily real estate, from third-party customers (“property sellers”) with the property sellers continuing to use the acquired real estate through lease-back agreements. The equity of the conduits is provided by the property sellers but such equity holders have no ability to make decisions about the activities of the conduits. Thus, the Group considers those conduits to be VIEs. The assets acquired by these conduits are generally funded by borrowings from the Group or third parties. The Group believes it is not the primary beneficiary of any of the conduits.
Investment Funds
The Group holds investments in various investment funds that collectively invest in equity and debt securities including listed Japanese securities and investment grade bonds, and, to a limited extent, securities and other interests issued by companies in a start-up or restructuring stage. Such investment funds are managed by investment advisory companies or fund management companies that make investment decisions and administer the funds.
In accordance with the requirement to apply FIN No. 46, the Group consolidated investment funds with total assets of ¥124,357 million on March 31, 2004.
F-76
Table of Contents
THE BANK OF TOKYO-MITSUBISHI, LTD. AND SUBSIDIARIES
NOTES TO CONSOLIDATED FINANCIAL STATEMENTS—(Continued)
Special Purpose Entities Created for Structured Financing
The Group extends non-recourse asset-backed loans to special purpose entities, which hold beneficial interests in real properties, to provide financing for special purpose projects including real estate development and natural resource development managed by third parties.
The Group generally acts as a member of a lending group and does not have any equity investment in the entities, which is typically provided by project owners. For most of these financings, the equity provided by the project owners is of sufficient level to absorb expected losses, while expected returns to the owners are arranged to be the most significant among all returns. Accordingly, the Group determined that the Group is not the primary beneficiary of most of these entities. However, in transactions with entities whose investment at risk is exceptionally thin and the Group provided most of the financing, the Group is ultimately required to consolidate this type of entities.
Repackaged Instruments
The Group has two types of relationships with special purpose entities that repackage financial instruments to create new financial instruments.
The Group provides repackaged instruments with features that meet the customer’s needs and preferences through special purpose entities. The Group purchases financial instruments such as bonds and transfers them to special purpose entities which then issue new instruments. The special purpose entities may enter into derivative transactions including interest rate and currency swaps with the Group or other financial institutions to modify the cash flows of the underlying financial instruments. The Group underwrites and markets to its customers the new instruments issued by the special purpose entities.
The Group also invests in repackaged instruments arranged and issued by third parties.
In accordance with the requirement to apply FIN No. 46, the Group consolidated repackaged instruments with total assets of ¥45,597 million on March 31, 2004.
Financing Vehicle
UNBC deconsolidated UNBC Finance Trust I upon adoption of FIN No. 46 in UNBC’s fiscal year ended December 31, 2003. Following the revisions introduced in FIN No. 46R, management considered whether the Group should deconsolidate other similar financing vehicles. As a result, the Group deconsolidated two financing vehicles, BTM (Curacao) Holdings N.V. and BTM Finance (Curacao) N.V., in accordance with FIN No. 46R. Since the two finance vehicles are conduits, deconsolidation did not have a material impact on the Group’s results of operations or financial condition.
Other Type of VIEs
The Group is also a party to other types of VIEs including special purpose entities created to hold assets on behalf of the Group as an intermediary.
The Group identified borrowers that were determined to be VIEs due to an insufficient level of equity. The Group determined that the Group is not the primary beneficiary of most of these borrowers because of its limited exposure as a lender to such borrowers. Such borrowers engage in diverse business activities of various sizes in industries such as manufacturing, merchandise trading, distribution, construction and real estate development, independently from the Group.
F-77
Table of Contents
THE BANK OF TOKYO-MITSUBISHI, LTD. AND SUBSIDIARIES
NOTES TO CONSOLIDATED FINANCIAL STATEMENTS—(Continued)
25. COMMITMENTS AND CONTINGENT LIABILITIES
The Group leases certain office space and equipment under noncancelable agreements expiring through the fiscal year 2014.
Future minimum rental commitments for noncancelable leases at March 31, 2005 were as follows:
Capitalized leases | Operating leases | ||||||
| (in millions) | |||||||
Fiscal year ending March 31: | |||||||
2006 | ¥ | 8,488 | ¥ | 16,560 | |||
2007 | 6,307 | 14,542 | |||||
2008 | 4,797 | 11,381 | |||||
2009 | 2,450 | 9,034 | |||||
2010 | 1,645 | 7,416 | |||||
2011 and thereafter | 6,412 | 23,061 | |||||
Total minimum lease payments | 30,099 | ¥ | 81,994 | ||||
Amount representing interest | (2,688 | ) | |||||
Present value of minimum lease payments | ¥ | 27,411 | |||||
Total rental expense for the fiscal years ended March 31, 2003, 2004 and 2005 was ¥40,616 million, ¥36,528 million and ¥36,293 million, respectively.
The Group is involved in various litigation matters. Management, based upon their current knowledge and the results of consultation with counsel, make appropriate level of litigation reserve. Management believes that the amounts of the Group’s liabilities, when ultimately determined, will not have a material adverse effect on the Group’s results of operations and financial position.
26. FEES AND COMMISSIONS INCOME
Details of fees and commissions income for the fiscal years ended March 31, 2003, 2004 and 2005 were as follows:
| 2003 | 2004 | 2005 | |||||||
| (in millions) | |||||||||
Trust fees | ¥ | 21,424 | ¥ | 19,503 | ¥ | 18,207 | |||
Fees on funds transfer and service charges for collections | 54,922 | 57,002 | 59,365 | ||||||
Fees and commissions on international business | 53,560 | 53,149 | 51,292 | ||||||
Fees and commissions on credit card business | 57,083 | 60,456 | 61,710 | ||||||
Service charges on deposits | 34,626 | 36,210 | 37,080 | ||||||
Fees and commissions on securities business | 49,217 | 79,014 | 104,337 | ||||||
Other fees and commissions | 113,545 | 135,553 | 149,573 | ||||||
Total | ¥ | 384,377 | ¥ | 440,887 | ¥ | 481,564 | |||
Trust fees consist of fees earned primarily by fiduciary asset management and administration services for corporate pension plans, investment funds, etc. Fees on funds transfer and service charges for collection are earned by providing settlement services such as domestic fund remittances and domestic collection services. Fees and commissions on international business primarily consist of fees from international fund transfer and
F-78
Table of Contents
THE BANK OF TOKYO-MITSUBISHI, LTD. AND SUBSIDIARIES
NOTES TO CONSOLIDATED FINANCIAL STATEMENTS—(Continued)
collection services, and trade-related financing services. Fees and commissions on credit card business are composed of interchange income, annual fees, royalty and other service charges from franchisees. Service charges on deposits are fees charged for deposits such as checking account deposits. Fees and commissions on securities business include underwriting, brokerage and advisory services and arrangement fees on securitizations. Other fees and commissions primarily include fees and commissions on guarantees and insurance products.
27. BUSINESS SEGMENTS
The business segment information of the Group, set forth below, is derived from the internal management reporting system used by management to measure the performance of the business segments. Unlike financial accounting, there is no authoritative body of guidance for management accounting. The business segment information, set forth below, is based on the financial information prepared in accordance with Japanese GAAP along with internal management accounting rules and practices. Accordingly, the format and information is presented primarily on the basis of Japanese GAAP and is not consistent with the consolidated financial statements prepared on the basis of US GAAP. A reconciliation is provided for the total amounts of segments’ total operating profit with income from continuing operations before income tax expense and cumulative effect of a change in accounting principle under US GAAP.
See Note 28 for financial information relating to the Group’s operations by geographic area. The geographic financial information is consistent with the basis of the accompanying consolidated financial statements.
The Group was organized based on a business unit system during the fiscal year ended March 31, 2005 as follows:
| • | The Retail Banking business unit provides banking products and services to individual customers in Japan. |
| • | The Commercial Banking business unit provides banking products and services to large corporations and some small and medium-sized companies. |
| • | The Global Corporate Banking business unit provides banking services to large Japanese corporations and their overseas operations as well as non-Japanese corporations who do business on a global basis, excluding UNBC’s customers. |
| • | The Investment Banking and Asset Management business unit provides advisory and other services related to mergers and acquisitions, securities services of the Bank, syndicated loans, project financing, derivatives and securitization and other investment banking activities, and asset management and trust products and services mainly to high net worth individuals, branch customers and corporate clients in Japan. |
| • | The UNBC business unit includes its subsidiaries in California, UnionBanCal Corporation and Union Bank of California, N.A. |
| • | The Operations Services unit provides operations and settlement services to the Group’s other business units, including settlement and foreign exchange. |
| • | The Treasury unit conducts the Group’s asset and liability management and liquidity management. |
The Mitsubishi Securities segment includes Mitsubishi Securities and its subsidiaries that provide a broad range of retail and corporate securities services and products including retail brokerage, securitization, M&A advisory and derivatives.
In July 2004, the Bank transferred its overseas securities subsidiary, Tokyo-Mitsubishi International plc, to Mitsubishi Securities. Tokyo-Mitsubishi International plc has since been renamed in line with the name of its new
F-79
Table of Contents
THE BANK OF TOKYO-MITSUBISHI, LTD. AND SUBSIDIARIES
NOTES TO CONSOLIDATED FINANCIAL STATEMENTS—(Continued)
parent company to Mitsubishi Securities International plc. Accordingly, this securities subsidiary has been included in Mitsubishi Securities for the fiscal year ended March 31, 2005. Presentation for the fiscal years ended March 31, 2003 and 2004 has been reclassified to conform to the presentation for the fiscal year ended March 31, 2005.
In addition, the Bank transferred its custody business, which had been included in the operations services business unit, to the investment banking and asset management business unit during the fiscal year ended March 31, 2005. Presentation for the fiscal years ended March 31, 2003 and 2004 has been reclassified to conform to the presentation for the fiscal year ended March 31, 2005.
The financial performances of the Group’s major business units and Mitsubishi Securities, derived from the internal management reporting system, are summarized below. Management does not use information on segments’ total assets to allocate resources and assess performance and has not prepared information on segment assets. Accordingly, business segments’ information on total assets is not available.
| Retail Banking | Commercial Banking | Global Corporate Banking | Investment and Asset Management | UNBC | Operations Services | Treasury | Mitsubishi Securities | Other* | Total | |||||||||||||||||||||||||
Fiscal year ended March 31, 2003: | ||||||||||||||||||||||||||||||||||
Net revenue: | ||||||||||||||||||||||||||||||||||
The Bank: | ||||||||||||||||||||||||||||||||||
Net interest income | ¥ | 165,407 | ¥ | 196,033 | ¥ | 125,811 | ¥ | 5,786 | ¥ | — | ¥ | 733 | ¥ | 180,127 | ¥ | — | ¥ | (49,935 | ) | ¥ | 623,962 | |||||||||||||
Net fees | 29,383 | 46,250 | 65,040 | 31,992 | — | 3,716 | (6,222 | ) | — | (37,185 | ) | 132,974 | ||||||||||||||||||||||
Other | 12,645 | 31,337 | 24,273 | 16,800 | — | 841 | 111,863 | — | (6,972 | ) | 190,787 | |||||||||||||||||||||||
The Bank’s subsidiaries | 72,534 | 12,964 | 47,787 | 24,074 | 269,755 | 14,569 | 2,068 | 68,223 | 6,022 | 517,996 | ||||||||||||||||||||||||
Total | 279,969 | 286,584 | 262,911 | 78,652 | 269,755 | 19,859 | 287,836 | 68,223 | (88,070 | ) | 1,465,719 | |||||||||||||||||||||||
Operating expenses | 211,695 | 126,995 | 129,945 | 45,717 | 155,506 | 16,937 | 26,712 | 82,911 | 80,008 | 876,426 | ||||||||||||||||||||||||
Operating profit (loss) | ¥ | 68,274 | ¥ | 159,589 | ¥ | 132,966 | ¥ | 32,935 | ¥ | 114,249 | ¥ | 2,922 | ¥ | 261,124 | ¥ | (14,688 | ) | ¥ | (168,078 | ) | ¥ | 589,293 | ||||||||||||
Fiscal year ended March 31, 2004: | ||||||||||||||||||||||||||||||||||
Net revenue: | ||||||||||||||||||||||||||||||||||
The Bank: | ||||||||||||||||||||||||||||||||||
Net interest income | ¥ | 169,252 | ¥ | 191,071 | ¥ | 119,182 | ¥ | 11,331 | ¥ | — | ¥ | 758 | ¥ | 116,822 | ¥ | — | ¥ | 5,830 | ¥ | 614,246 | ||||||||||||||
Net fees | 40,623 | 49,994 | 70,304 | 38,572 | — | 4,006 | (4,194 | ) | — | (45,908 | ) | 153,397 | ||||||||||||||||||||||
Other | 19,902 | 44,939 | 25,257 | 33,415 | — | 752 | 72,522 | — | (59,133 | ) | 137,654 | |||||||||||||||||||||||
The Bank’s subsidiaries | 73,113 | 11,661 | 31,609 | 21,475 | 253,456 | 12,536 | 1,174 | 157,239 | 4,247 | 566,510 | ||||||||||||||||||||||||
Total | 302,890 | 297,665 | 246,352 | 104,793 | 253,456 | 18,052 | 186,324 | 157,239 | (94,964 | ) | 1,471,807 | |||||||||||||||||||||||
Operating expenses | 204,065 | 119,574 | 120,199 | 37,030 | 150,877 | 18,358 | 26,253 | 124,312 | 40,848 | 841,516 | ||||||||||||||||||||||||
Operating profit (loss) | ¥ | 98,825 | ¥ | 178,091 | ¥ | 126,153 | ¥ | 67,763 | ¥ | 102,579 | ¥ | (306 | ) | ¥ | 160,071 | ¥ | 32,927 | ¥ | (135,812 | ) | ¥ | 630,291 | ||||||||||||
Fiscal year ended March 31, 2005: | ||||||||||||||||||||||||||||||||||
Net revenue: | ||||||||||||||||||||||||||||||||||
The Bank: | ||||||||||||||||||||||||||||||||||
Net interest income | ¥ | 181,403 | ¥ | 182,485 | ¥ | 116,827 | ¥ | 14,605 | ¥ | — | ¥ | 748 | ¥ | 162,304 | ¥ | — | ¥ | (28,907 | ) | ¥ | 629,465 | |||||||||||||
Net fees | 52,083 | 63,019 | 76,335 | 54,686 | — | 4,166 | (4,004 | ) | — | (56,646 | ) | 189,639 | ||||||||||||||||||||||
Other | 25,103 | 62,747 | 28,794 | 45,970 | — | 317 | 31,492 | — | (31,628 | ) | 162,795 | |||||||||||||||||||||||
The Bank’s subsidiaries | 78,244 | 12,904 | 25,954 | 20,528 | 274,934 | 11,433 | 1,106 | 151,773 | 2,831 | 579,707 | ||||||||||||||||||||||||
Total | 336,833 | 321,155 | 247,910 | 135,789 | 274,934 | 16,664 | 190,898 | 151,773 | (114,350 | ) | 1,561,606 | |||||||||||||||||||||||
Operating expenses | 215,760 | 121,829 | 121,333 | 41,053 | 158,835 | 14,429 | 25,319 | 127,222 | 46,629 | 872,409 | ||||||||||||||||||||||||
Operating profit (loss) | ¥ | 121,073 | ¥ | 199,326 | ¥ | 126,577 | ¥ | 94,736 | ¥ | 116,099 | ¥ | 2,235 | ¥ | 165,579 | ¥ | 24,551 | ¥ | (160,979 | ) | ¥ | 689,197 | |||||||||||||
| * | Other includes the Systems Services unit, the eBusiness & IT Initiatives unit, and the Corporate Center and eliminates overlapping allocation. |
F-80
Table of Contents
THE BANK OF TOKYO-MITSUBISHI, LTD. AND SUBSIDIARIES
NOTES TO CONSOLIDATED FINANCIAL STATEMENTS—(Continued)
Management measures performance of each business unit by “operating profit,” which includes profits or losses of the Bank’s subsidiaries. Financial information of each of the Bank’s subsidiaries is assigned to only one business unit, based on its major products or services provided and its major type of customers. “Operating profit” is a defined term in the Bank’s regulatory reporting to the FSA.
“Net revenue” above includes net interest income, net fees (that is, fees and commissions received, net of fees paid and other related expenses), and other gains, such as net trading gains, net foreign exchange gains, and net gains from sales of debt investment securities measured under Japanese GAAP. Interest income and expenses between business units are determined using an internal transfer pricing system, based on current market rates.
“Operating expenses” include salaries and employee benefits, occupancy and certain other non-interest expenses. In determining operating profit, the Group does not assign to each business unit certain income and expense items such as specific provisions for loan loss reserve, equity investment securities gains or losses, minority interest in earnings or losses of the Bank’s subsidiaries, equity in earnings or losses of the Bank’s affiliated companies, goodwill amortization and impairment, net gains or losses from disposition of premises and equipment, and other non-interest income and expense items.
Frequently, the business units work together in connection with providing services to customers. In accordance with the Group’s internal management accounting policies, the Group does not apportion the net revenue relating to a particular transaction among the participating business units. Instead, the Group assigns the total amount of net revenue relating to each of these transactions to each participating business unit. As a result, some items of net revenue are recorded as part of the operating results of more than one business unit. Any overlapping allocations are eliminated in the “Other” column. The following is a summary of the aggregate amounts of this overlapping allocation of net revenue for the business units for the fiscal years ended March 31, 2003, 2004 and 2005:
Retail Banking | Commercial Banking | Global Corporate Banking | Total amount eliminated | |||||||||
| (in millions) | ||||||||||||
Fiscal year ended March 31, 2003: | ||||||||||||
Investment Banking and Asset Management and Mitsubishi Securities | ¥ | — | ¥ | 9,722 | ¥ | 28,709 | ¥ | 38,431 | ||||
Fiscal year ended March 31, 2004: | ||||||||||||
Investment Banking and Asset Management and Mitsubishi Securities | 319 | 25,282 | 37,970 | 63,571 | ||||||||
Fiscal year ended March 31, 2005: | ||||||||||||
Investment Banking and Asset Management and Mitsubishi Securities | 719 | 53,440 | 39,223 | 93,382 | ||||||||
Reconciliation
As set forth above, the measurement bases and the income and expenses items covered are very different between the internal management reporting system and the accompanying consolidated statements of income. Therefore, it is impracticable to present reconciliations of the business segments’ total information, other than operating profit, to corresponding items in the accompanying consolidated statements of income.
F-81
Table of Contents
THE BANK OF TOKYO-MITSUBISHI, LTD. AND SUBSIDIARIES
NOTES TO CONSOLIDATED FINANCIAL STATEMENTS—(Continued)
A reconciliation of the operating profit under the internal management reporting system for the fiscal years ended March 31, 2003, 2004 and 2005 above to income from continuing operations before income tax expense and cumulative effect of a change in accounting principle shown on the consolidated statements of income is as follows:
| 2003 | 2004 | 2005 | ||||||||||
| (in billions) | ||||||||||||
Operating profit: | ¥ | 589 | ¥ | 630 | ¥ | 689 | ||||||
Credit (provision) for credit losses | (237 | ) | 142 | (125 | ) | |||||||
Trading account profits (losses)—net | 50 | (85 | ) | (81 | ) | |||||||
Equity investment securities gains (losses)—net | (171 | ) | 251 | 125 | ||||||||
Debt investment securities gains (losses)—net | 142 | (122 | ) | 39 | ||||||||
Foreign exchange gains (losses)—net | 28 | 172 | (89 | ) | ||||||||
Minority interest | (4 | ) | (46 | ) | (39 | ) | ||||||
Other—net | (107 | ) | (70 | ) | 8 | |||||||
Income from continuing operations before income tax expense and cumulative effect of a change in accounting principle | ¥ | 290 | ¥ | 872 | ¥ | 527 | ||||||
28. FOREIGN ACTIVITIES
Foreign operations include the business conducted by overseas offices, as well as international business conducted from domestic offices, principally several international banking-related divisions of the Bank’s Head Office in Tokyo, and involve various transactions with debtors and customers residing outside Japan. Close integration of the Group’s foreign and domestic activities makes precise estimates of the amounts of assets, liabilities, income and expenses attributable to foreign operations difficult and necessarily subjective. Assets, income and expenses attributable to foreign operations are allocated to geographical areas based on the domiciles of the debtors and customers.
Generally, interest rates with respect to funds borrowed and loaned between domestic and foreign operations are based on prevailing money market rates appropriate for the transactions. In general, the Group has allocated all direct expenses and a proportionate share of general and administrative expenses to income derived from foreign loans and other transactions by the Group’s foreign operations. The following table sets forth estimated total assets at March 31, 2003, 2004 and 2005, and estimated total revenue, total expenses, income from continuing operations before income tax expense (benefit) and cumulative effect of a change in accounting principle and net income for the respective fiscal years then ended.
F-82
Table of Contents
THE BANK OF TOKYO-MITSUBISHI, LTD. AND SUBSIDIARIES
NOTES TO CONSOLIDATED FINANCIAL STATEMENTS—(Continued)
| Domestic | Foreign | Total | ||||||||||||||||
| Japan | United States of America | Europe | Asia/ excluding Japan | Other areas(1) | ||||||||||||||
| (in millions) | ||||||||||||||||||
Fiscal year ended March 31, 2003: | ||||||||||||||||||
Total revenue(2) | ¥ | 1,025,459 | ¥ | 455,876 | ¥ | 292,240 | ¥ | 131,352 | ¥ | 80,350 | ¥ | 1,985,277 | ||||||
Total expenses(3) | 1,007,256 | 369,793 | 177,622 | 83,326 | 57,705 | 1,695,702 | ||||||||||||
Income from continuing operations before income tax expense (benefit) and cumulative effect of a change in accounting principle | 18,203 | 86,083 | 114,618 | 48,026 | 22,645 | 289,575 | ||||||||||||
Net income | 22,046 | 55,558 | 112,197 | 37,749 | 21,428 | 248,978 | ||||||||||||
Total assets at end of fiscal year | 56,675,468 | 10,294,825 | 5,895,574 | 2,986,840 | 1,827,680 | 77,680,387 | ||||||||||||
Fiscal year ended March 31, 2004: | ||||||||||||||||||
Total revenue(2) | ¥ | 1,309,068 | ¥ | 396,448 | ¥ | 217,023 | ¥ | 72,038 | ¥ | 108,694 | ¥ | 2,103,271 | ||||||
Total expenses(3) | 707,807 | 364,768 | 70,148 | 20,085 | 68,665 | 1,231,473 | ||||||||||||
Income from continuing operations before income tax expense and cumulative effect of a change in accounting principle | 601,261 | 31,680 | 146,875 | 51,953 | 40,029 | 871,798 | ||||||||||||
Net income | 370,042 | 25,718 | 90,268 | 30,938 | 20,635 | 537,601 | ||||||||||||
Total assets at end of fiscal year | 66,416,026 | 9,521,917 | 4,624,635 | 2,731,246 | 1,764,728 | 85,058,552 | ||||||||||||
Fiscal year ended March 31, 2005: | ||||||||||||||||||
Total revenue(2) | ¥ | 1,297,879 | ¥ | 413,153 | ¥ | 126,607 | ¥ | 100,565 | ¥ | 64,187 | ¥ | 2,002,391 | ||||||
Total expenses(3) | 1,092,015 | 266,684 | 71,268 | 28,658 | 16,883 | 1,475,508 | ||||||||||||
Income from continuing operations before income tax expense and cumulative effect of a change in accounting principle | 205,864 | 146,469 | 55,339 | 71,907 | 47,304 | 526,883 | ||||||||||||
Net income | 91,087 | 90,644 | 30,545 | 45,961 | 28,871 | 287,108 | ||||||||||||
Total assets at end of fiscal year | 70,973,900 | 11,750,252 | 4,348,065 | 3,229,463 | 1,748,619 | 92,050,299 | ||||||||||||
| Notes |
| (1) | Other areas primarily include Canada, Latin America and the Caribbean. |
| (2) | Total revenue is comprised of Interest income and Non-interest income. |
| (3) | Total expenses are comprised of Interest expense, Provision (credit) for credit losses and Non-interest expense. |
The following is an analysis of certain asset and liability accounts related to foreign activities at March 31, 2004 and 2005:
| 2004 | 2005 | |||||
| (in millions) | ||||||
Cash and due from banks | ¥ | 345,224 | ¥ | 303,742 | ||
Interest-earning deposits in other banks | 2,768,630 | 3,274,440 | ||||
Total | ¥ | 3,113,854 | ¥ | 3,578,182 | ||
Trading account assets | ¥ | 1,599,546 | ¥ | 1,668,021 | ||
Investment securities | ¥ | 3,522,218 | ¥ | 5,300,045 | ||
Loans—net of unearned income and deferred loan fees | ¥ | 8,274,090 | ¥ | 9,695,737 | ||
Deposits, principally time deposits and certificates of deposit by foreign banks | ¥ | 11,811,672 | ¥ | 12,593,713 | ||
Funds borrowed: | ||||||
Call money, funds purchased, and payables under repurchase agreements and securities lending transactions | ¥ | 1,201,061 | ¥ | 595,539 | ||
Other short-term borrowings | 224,470 | 1,057,924 | ||||
Long-term debt | 1,043,960 | 765,687 | ||||
Total | ¥ | 2,469,491 | ¥ | 2,419,150 | ||
Trading account liabilities | ¥ | 1,356,919 | ¥ | 1,586,734 | ||
F-83
Table of Contents
THE BANK OF TOKYO-MITSUBISHI, LTD. AND SUBSIDIARIES
NOTES TO CONSOLIDATED FINANCIAL STATEMENTS—(Continued)
At March 31, 2004 and 2005, the Group had no cross-border outstandings, as defined in the Securities Act Industry Guides 3 in any foreign country, which exceeded 0.75% of consolidated total assets.
29. ESTIMATED FAIR VALUE OF FINANCIAL INSTRUMENTS
Quoted market prices, when available, are used to estimate fair values of financial instruments. However, quoted market prices are not available for a substantial portion of financial instruments and, therefore, fair values for such financial instruments are estimated using discounted cash flow models or other valuation techniques. Although management uses its best judgment in estimating fair values of financial instruments, estimation methodologies and assumptions used to estimate fair values are inherently subjective. Accordingly, the estimates presented herein are not necessarily indicative of net realizable or liquidation values. The use of different estimation methodologies and/or market assumptions may have a significant effect on the estimated fair values.
The following is a summary of carrying amounts and estimated fair values of financial instruments at March 31, 2004 and 2005:
| 2004 | 2005 | |||||||||||
Carrying amount | Estimated fair value | Carrying amount | Estimated fair value | |||||||||
| (in billions) | ||||||||||||
Financial assets: | ||||||||||||
Cash, due from banks, call loans and funds sold, and receivables under resale agreements and securities borrowing transactions | ¥ | 13,017 | ¥ | 13,017 | ¥ | 14,532 | ¥ | 14,532 | ||||
Trading account assets, excluding derivatives | 5,743 | 5,743 | 5,496 | 5,496 | ||||||||
Investment securities | 21,339 | 21,339 | 23,540 | 23,557 | ||||||||
Loans, net of allowance for credit losses | 39,282 | 39,437 | 42,853 | 42,980 | ||||||||
Other financial assets | 1,759 | 1,759 | 2,017 | 2,017 | ||||||||
Derivative financial instruments: | ||||||||||||
Trading activities | 2,295 | 2,295 | 1,878 | 1,878 | ||||||||
Activities qualifying for hedges | 5 | 5 | 2 | 2 | ||||||||
Financial liabilities: | ||||||||||||
Non-interest-bearing deposits, call money and funds purchased, and payables under repurchase agreements and securities lending transactions | ¥ | 14,157 | ¥ | 14,157 | ¥ | 15,926 | ¥ | 15,926 | ||||
Interest-bearing deposits | 51,197 | 51,194 | 50,681 | 50,674 | ||||||||
Debentures | 266 | 266 | — | — | ||||||||
Trading account liabilities, excluding derivatives | 191 | 191 | 40 | 40 | ||||||||
Obligations to return securities received as collateral | 2,325 | 2,325 | 3,026 | 3,026 | ||||||||
Other short-term borrowings | 4,379 | 4,379 | 9,632 | 9,632 | ||||||||
Long-term debt | 5,087 | 5,173 | 5,196 | 5,287 | ||||||||
Other financial liabilities | 1,761 | 1,761 | 1,771 | 1,771 | ||||||||
Derivative financial instruments: | ||||||||||||
Trading activities | 2,183 | 2,183 | 1,832 | 1,832 | ||||||||
As a result of the reclassification described in Note 3, certain transactions to cover short sales, which were previously presented as Trading account liabilities, excluding derivatives, have been reclassified into Obligation to return securities received as collateral.
F-84
Table of Contents
THE BANK OF TOKYO-MITSUBISHI, LTD. AND SUBSIDIARIES
NOTES TO CONSOLIDATED FINANCIAL STATEMENTS—(Continued)
The methodologies and assumptions used to estimate the fair value of the financial instruments are summarized below.
Cash, due from banks, call loans and funds sold, and receivables under resale agreements and securities borrowing transactions—For cash, due from banks including interest-earning deposits, and call loans and funds sold, the carrying amounts are a reasonable estimate of the fair values because of their short-term nature and limited credit risk. For receivables under resale agreements and securities borrowing transactions, the fair values are based on quoted market prices, when available, or estimated with reference to quoted market prices for similar instruments when quoted market prices are not available.
Trading account securities—Trading account securities and short trading positions of securities are carried at fair value, which is principally based on quoted market prices, when available. If the quoted market prices are not available, fair values are based on quoted market prices of comparable instruments.
Investment securities—The fair values of investment securities, where quoted market prices or secondary market prices are available, are equal to such market prices. For investment securities, when quoted market prices or secondary market prices are not available, the fair values are estimated using quoted market prices for similar securities or based on appraised value as deemed appropriate by management. The fair value of investment securities other than those classified as available for sale or being held to maturity (i.e., nonmarketable equity securities) at March 31, 2004 and 2005 were not readily determinable. Therefore, the above summary does not include the carrying amounts of such investment securities amounting to ¥160 billion and ¥275 billion at March 31, 2004 and 2005, respectively.
Loans—The fair values of loans are estimated for groups of similar characteristics, including type of loan, credit quality and remaining maturity. In incorporating the credit risk factor, management concluded that the allowance for credit losses adequately adjusts the related book values for credit risk. For floating- or adjustable-rate loans, which mature or are repriced within a short period of time, the carrying values are considered to be a reasonable estimate of fair values. For fixed-rate loans, market prices are not generally available and the fair values are estimated by discounting the estimated future cash flows based on the contracted maturity of the loans. The discount rates are based on the current market rates corresponding to the applicable maturity. Where quoted market prices or estimated fair values are available, primarily for loans to refinancing countries, loans held for dispositions or sales and certain other foreign loans, the fair values are based on such market prices and estimated fair values, including secondary market prices. For nonperforming loans, the fair values are generally determined on an individual basis by discounting the estimated future cash flows and may be based on the appraisal value of underlying collateral as appropriate.
Other financial assets—The estimated fair values of other financial assets, which primarily include accrued interest receivable, customers’ acceptance liabilities and accounts receivable, approximate their carrying amounts. The above summary does not include the carrying amounts of investments in equity method investees amounting to ¥47 billion and ¥143 billion at March 31, 2004 and 2005, respectively.
Derivative financial instruments—The estimated fair values of derivative financial instruments are the amounts the Group would receive or pay to terminate the contracts at the balance-sheet date, taking into account the current unrealized gains or losses on open contracts. They are based on market or dealer quotes when available. Valuation models such as present value and option pricing models are applied to current market information to estimate fair values when such quotes are not available.
Non-interest-bearing deposits, call money and funds purchased, payables under repurchase agreements and securities lending transactions, and obligations to return securities received as collateral—The fair values of non-interest-bearing deposits are equal to the amounts payable on demand. For call money and funds purchased,
F-85
Table of Contents
THE BANK OF TOKYO-MITSUBISHI, LTD. AND SUBSIDIARIES
NOTES TO CONSOLIDATED FINANCIAL STATEMENTS—(Continued)
the carrying amounts are a reasonable estimate of the fair values because of their short-term nature. For payables under repurchase agreements and securities lending transactions and obligations to return securities received as collateral, the fair values are generally based on quoted market prices, when available, or estimated using quoted market prices for similar instruments when quoted market prices are not available.
Interest–bearing deposits—The fair values of demand deposits, deposits at notice, and certificates of deposit maturing within a short period of time are the amounts payable on demand. Fair values of time deposits and certificates of deposit maturing after a short period of time are estimated by discounting the estimated cash flows using the rates currently offered for deposits of similar remaining maturities or the applicable current market rates.
Debentures—The fair values of debentures are estimated using a discounted cash flow model based on quoted market rates or, if available, secondary market rates currently available for debentures with similar terms and remaining maturities.
Other short-term borrowings—For most other short-term borrowings, the carrying amounts are a reasonable estimate of the fair values because of their short-term nature. For certain borrowings, fair values are estimated by discounting the estimated future cash flows using applicable current market interest rates or comparable rates for similar instruments, which represent the Group’s cost to raise funds with a similar remaining maturity.
Long-term debt—For certain unsubordinated and subordinated debt, the fair values are estimated based on quoted market prices of the instruments. The fair values of other long-term debt are estimated using a discounted cash flow model based on rates applicable to the Group for debt with similar terms and remaining maturities.
Other financial liabilities—The estimated fair values of other financial liabilities, which primarily include accrued interest payable, bank acceptances, accounts payable and obligations under standby letters of credit and guarantees, approximate their carrying amounts. Effective January 1, 2003, the Group adopted the initial recognition and measurement provisions of FIN No. 45, which requires that, for guarantees within the scope of FIN No. 45 issued or amended after December 31, 2002, liabilities for the obligations undertaken in issuing the guarantees be initially measured at fair value. The fair values of obligations under standby letters of credit and guarantees are based on fees received or receivable by the Group.
The fair values of certain off-balance-sheet financial instruments held for purposes other than trading, including commitments to extend credit and commercial letters of credit, are estimated using the fees currently charged to enter into similar agreements, taking into account the remaining terms of the agreements and the credit quality. The aggregate fair value of such instruments at March 31, 2004 and 2005 was not material.
The fair value estimates presented herein are based on pertinent information available to management at March 31, 2004 and 2005. These amounts have not been comprehensively revalued since that date and, therefore, current estimates of fair values may have changed significantly from the amounts presented herein.
30. STOCK-BASED COMPENSATION
Two subsidiaries of the Bank, Mitsubishi Securities and UNBC, have several stock-based compensation plans.
Mitsubishi Securities
Under the Code, companies are permitted to purchase their own shares in the market in order to implement a stock option plan when approved by the shareholders.
F-86
Table of Contents
THE BANK OF TOKYO-MITSUBISHI, LTD. AND SUBSIDIARIES
NOTES TO CONSOLIDATED FINANCIAL STATEMENTS—(Continued)
Pursuant to resolutions approved at the general shareholders’ meetings, Mitsubishi Securities offers stock option plans which provide directors, executive officers, eligible employees and certain other persons with options to purchase shares (at the respective exercise prices stipulated in each plan) as follows:
Date of approval at the shareholders’ meeting | Exercise period | Shares | ||||
June 29, 2000 | July 1, 2002 to June 30, 2005 | 2,057,000 | ||||
June 28, 2001 | July 1, 2003 to June 30, 2006 | 2,272,000 | ||||
Total | 4,329,000 | |||||
The plans provide for the granting of stock options having an exercise price not less than the market value of Mitsubishi Securities’ common stock on the date of grant. Following is the option activity for the fiscal years ended March 31, 2004 and 2005:
| 2004 | 2005 | |||||||||||
| Number of shares | Weighted-average exercise price | Number of shares | Weighted-average exercise price | |||||||||
Options outstanding, beginning of fiscal year | 5,512,000 | ¥ | 1,278 | 3,153,000 | ¥ | 1,260 | ||||||
Granted | — | — | — | — | ||||||||
Exercised | (831,000 | ) | 812 | (326,000 | ) | 812 | ||||||
Forfeited | (1,528,000 | ) | 1,568 | — | — | |||||||
Options outstanding, end of fiscal year | 3,153,000 | ¥ | 1,260 | 2,827,000 | ¥ | 1,311 | ||||||
Options exercisable, end of fiscal year | 3,153,000 | ¥ | 1,260 | 2,827,000 | ¥ | 1,311 | ||||||
The following table details the distribution of stock options outstanding at March 31, 2005:
| Options outstanding at March 31, 2005 | Options exercisable at March 31, 2005 | |||||||
Exercise prices | Number outstanding | Remaining contractual life | Number exercisable | |||||
¥ 812 | 904,000 | 1.25 years | 904,000 | |||||
1,546 | 1,923,000 | 0.25 | 1,923,000 | |||||
| 2,827,000 | 2,827,000 | |||||||
UNBC
UNBC has two management stock plans. The Year 2000 UnionBanCal Corporation Stock Plan, effective January 1, 2000 (the “2000 Stock Plan”), and the UnionBanCal Corporation Management Stock Plan, restated effective June 1, 1997 (the “1997 Stock Plan”), have 16.0 million and 6.6 million shares, respectively, of the UNBC’s common stock authorized to be awarded to key employees and outside directors of UNBC at the discretion of the Executive Compensation and Benefits Committee of the Board of Directors (the “Committee”). Employees on rotational assignment from the Bank are not eligible for stock awards.
The Committee determines the term of each stock option grant, up to a maximum of ten years from the date of grant. The exercise price of the options issued under the Stock Plans shall not be less than the fair market value on the date the option is granted. Unvested restricted stock issued under the Stock Plans is accounted for as a reduction to retained earnings. The value of the restricted shares at the date of grant is amortized to compensation expense over its vesting period. All cancelled or forfeited options and restricted stock become available for future grants.
F-87
Table of Contents
THE BANK OF TOKYO-MITSUBISHI, LTD. AND SUBSIDIARIES
NOTES TO CONSOLIDATED FINANCIAL STATEMENTS—(Continued)
In 2002, 2003 and 2004, UNBC granted options to non-employee directors and various key employees, including policy-making officers under the 2000 Stock Plan. Under both Stock Plans, options granted to employees vest pro-rata on each anniversary of the grant date and become fully exercisable three years from the grant date, provided that the employee has completed the specified continuous service requirement. The options vest earlier if the employee dies, is permanently disabled, or retires under certain grant, age, and service conditions. Options granted to non-employee directors are fully vested on the grant date and exercisable 33 1/3 percent on each anniversary under the 1997 Stock Plan, and fully vested and exercisable on the grant date under the 2000 Stock Plan. The following is a summary of stock option transactions under the Stock Plans.
| Fiscal years ended December 31, | ||||||||||||||||||
| 2002 | 2003 | 2004 | ||||||||||||||||
Number of shares | Weighted- exercise price | Number of shares | Weighted- exercise price | Number of shares | Weighted- exercise price | |||||||||||||
Options outstanding, beginning of fiscal year | 7,939,271 | $ | 29.79 | 8,515,469 | $ | 34.71 | 9,008,011 | $ | 37.12 | |||||||||
Granted | 2,911,652 | 43.49 | 2,517,023 | 40.32 | 2,478,931 | 52.84 | ||||||||||||
Exercised | (2,187,170 | ) | 28.57 | (1,912,323 | ) | 30.52 | (1,917,818 | ) | 33.68 | |||||||||
Forfeited | (148,284 | ) | 34.05 | (112,158 | ) | 38.96 | (86,788 | ) | 42.87 | |||||||||
Options outstanding, end of fiscal year | 8,515,469 | $ | 34.71 | 9,008,011 | $ | 37.12 | 9,482,336 | $ | 41.87 | |||||||||
Options exercisable, end of fiscal year | 3,031,478 | $ | 31.08 | 3,845,520 | $ | 33.99 | 4,733,003 | $ | 36.49 | |||||||||
The weighted-average fair value of options granted was $16.67 during 2002, $12.92 during 2003, and $16.55 during 2004.
The fair value of each option grant is estimated on the date of grant using the Black-Scholes option pricing model with the following weighted-average assumptions used for grants made in 2002, 2003 and 2004:
| 2002 | 2003 | 2004 | |||||||
Risk-free interest rate | 4.9 | % | 2.9 | % | 2.8 | % | |||
Expected lives | 5 years | 5 years | 5 years | ||||||
Expected volatility | 46 | % | 43 | % | 40 | % | |||
Expected dividend yields | 2.3 | % | 2.8 | % | 2.4 | % |
The following table summarizes information about stock options outstanding.
| Options outstanding at December 31, 2004 | Options exercisable at December 31, 2004 | |||||||||||
Range of exercise prices | Number outstanding | Weighted-average remaining contractual life | Weighted-average exercise price | Number exercisable | Weighted-average exercise price | |||||||
$18.53-27.56 | 71,455 | 4.2 years | $ | 22.94 | 71,455 | $ | 22.94 | |||||
28.44-42.40 | 4,535,236 | 6.5 | 35.16 | 3,079,232 | 32.94 | |||||||
42.69-59.74 | 4,875,645 | 8.1 | 48.39 | 1,582,316 | 44.00 | |||||||
| 9,482,336 | 4,733,003 | |||||||||||
In 2002, 2003 and 2004, UNBC also granted 6,000, 6,000 and 16,000 shares of restricted stock with weighted average grant date fair values of $45.00, $46.95 and $61.50, respectively, to key officers, including policy-
F-88
Table of Contents
THE BANK OF TOKYO-MITSUBISHI, LTD. AND SUBSIDIARIES
NOTES TO CONSOLIDATED FINANCIAL STATEMENTS—(Continued)
making officers, under the 2000 Stock Plan. The awards of restricted stock vest pro-rata on each anniversary of the grant date and become fully vested four years from the grant date for awards in 2002 and 2003 and three years from the grant date for awards in 2004, provided that the employee has completed the specified continuous service requirement. They vest earlier if the employee dies, is permanently and totally disabled, or retires under certain grant, age, and service conditions. Restricted shareholders have the right to vote their restricted shares and receive dividends.
At December 31, 2002, 2003 and 2004, 1,764,414 shares, 5,347,715 shares and 2,937,629 shares respectively, were available for future grants as either stock options or restricted stock under the 2000 Stock Plan. The remaining shares under the 1997 Stock Plan are not available for future grants.
Effective January 1, 1997, UNBC established a Performance Share Plan. Eligible participants may earn performance share awards to be redeemed in cash three years after the date of grant. Performance shares are linked to shareholder value in two ways: (1) the market price of the UNBC’s common stock; and (2) return on equity, a performance measure closely linked to value creation. Eligible participants generally receive grants of performance shares annually. The plan was amended in 2004 increasing the total number of shares that can be granted under the plan to 2.6 million shares. There were 384,183, 340,683 and 2,252,183 performance shares remaining for future awards as of December 31, 2002, 2003 and 2004, respectively. UNBC granted 61,500 shares in 2002, 43,500 shares in 2003, and 88,500 shares in 2004. No performance shares were forfeited in 2002, 2003 or 2004. The value of a performance share is equal to the market price of the UNBC’s common stock. All cancelled or forfeited performance shares become available for future grants. Expenses related to these shares were $3.3 million in 2002, $6.6 million in 2003, and $4.8 million in 2004.
31. RELATED PARTY TRANSACTIONS
Transactions with MTFG, Mitsubishi Trust and their subsidiaries
Since the formation of MTFG, Mitsubishi Trust and its subsidiaries have been related parties which are under common control by MTFG. In addition, subsidiaries of MTFG other than wholly-owned banking subsidiaries (i.e. the Bank and Mitsubishi Trust) are related parties of the Bank.
The Bank lends and borrows funds from such related parties as a course of its normal banking activities. In addition, the Bank acts as an agency for Mitsubishi Trust and offers trust products to its customers on behalf of Mitsubishi Trust.
The following table shows the amount of transactions with its related parties under common control by MTFG for the fiscal years ended March 31, 2003, 2004 and 2005.
| 2003 | 2004 | 2005 | |||||||
| (in billions) | |||||||||
Interest income, primarily resulted from interest earning deposits in other banks: | ¥ | 14 | ¥ | 7 | ¥ | 10 | |||
Interest expense, primarily resulted from payables under securities lending transactions and long-term debts: | 17 | 10 | 6 | ||||||
Non-interest income: | 3 | 3 | 2 | ||||||
Non-interest expense: | 6 | 5 | 7 | ||||||
The following table shows the amounts due from or to its related parties under common control by MTFG at March 31, 2004 and 2005.
| 2004 | 2005 | |||||
| (in billions) | ||||||
Assets, primarily consisted of interest-earning deposits in other banks and call loans and funds sold: | ¥ | 517 | ¥ | 547 | ||
Liabilities, primarily consisted of call money and funds purchased and payables under securities lending transactions: | 710 | 520 | ||||
F-89
Table of Contents
THE BANK OF TOKYO-MITSUBISHI, LTD. AND SUBSIDIARIES
NOTES TO CONSOLIDATED FINANCIAL STATEMENTS—(Continued)
32. EVENTS SINCE MARCH 31, 2005
Approval of Dividends
On June 28, 2005, the shareholder approved payment of cash dividends to the shareholder of record on March 31, 2005 of ¥41.25 per share of Class 1 Preferred stock, totaling ¥3,358 million, of ¥6.42 per share of Class 2 Preferred stock, totaling ¥642 million, and of ¥32.32 per share of Common stock, totaling ¥162,229 million.
Merger Agreement of the MTFG Group and the UFJ Group was Approved by MTFG’s Shareholders
On June 29, 2005, the shareholders of MTFG approved the merger agreement between MTFG Group and UFJ Group. Furthermore, on the same day, the shareholders of UFJ Holdings, Inc. also approved the merger agreement. The merger agreement is subject to the approval of relevant authorities and includes the merger ratios, company names and other material terms. Through the merger, 0.62 shares of the Bank’s common stock will be issued for each share of the common stock of UFJ Bank Limited.
Postponement of Bank Merger
On August 12, 2005, MTFG announced that the merger between the Bank and UFJ Bank Limited has been postponed to January 1, 2006 in order to enable additional testing of the two banks’ systems intended to minimize risks arising from the merger. The mergers between the holding companies, trust banks and securities companies of the two groups are still expected to occur on October 1, 2005.
Conversion of Class 1 Preferred Stock
On June 28, 2005, at a meeting of shareholder, the articles of incorporation have been amended and all 81,400,000 shares of Class 1 Preferred stock were changed to 81,400,000 shares of Common stock. As a result, the number of issued shares of Common stock increased from 5,019,469,546 to 5,100,869,546 and no Class 1 Preferred stock is outstanding.
Completion of Share Transfer to Make Mitsubishi Securities a Directly-owned Subsidiary of MTFG
On July 1, 2005, the Bank sold all shares of Mitsubishi Securities to MTFG. As a result, Mitsubishi Securities became a directly-owned subsidiary of MTFG.
Purchase Agreement of the Bank’s Headquarters and Nihonbashi Annex
On July 21, 2005, the Bank reached an agreement to purchase from Mitsubishi Estate Co.,Ltd.(“Mitsubishi Estate”) the equivalent of 50% of the land and buildings of each of the Bank’s headquarters and Nihonbashi annex. These are jointly owned by the Bank and Mitsubishi Estate. The agreement will take place on August 31, 2005 and total purchase price is ¥111.3 billion.
Issuance of Non-dilutive Preferred Securities by MTFG’s Funding Vehicle
On July 28, 2005, MTFG established MTFG Capital Finance Limited, a wholly-owned funding vehicle in the Cayman Islands, for the issuance of preferred securities. MTFG Capital Finance Limited will issue ¥165 billion in non-cumulative perpetual preferred securities in a private placement to institutional investors in August 2005, and the proceeds will be provided to the Bank through BTM Preferred Capital Limited, the Bank’s wholly-owned vehicle, to strengthen the Group’s capital base under its capital adequacy requirements.
*****
F-90
Table of Contents
SIGNATURE
The registrant hereby certifies that it meets all of the requirements for filing on Form 20-F and that it has duly caused and authorized the undersigned to sign this Annual Report on its behalf.
THE BANK OF TOKYO-MITSUBISHI UFJ, LTD. | ||||
By: | /s/ NOBUO KUROYANAGI | |||
| Name: | Nobuo Kuroyanagi | |||
| Title: | President | |||
Date: February 28, 2006
Table of Contents
EXHIBIT INDEX
| Exhibit | Description | |
| 12 | Certifications required by Rule 13a-14(a) (17 CFR 240.13a-14(a)) or Rule 15d-14(a) (17 CFR 240.15d-14(a)).(1) | |
| 13 | Certifications required by Rule 13a-14(b) (17 CFR 240.13a-14(b)) or Rule 15d-14(b) (17 CFR 240.15d-14(b)) and Section 1350 of Chapter 63 of Title 18 of the United States Code (18 U.S.C. 1350).(1) | |