UNITED STATES
SECURITIES AND EXCHANGE COMMISSION
Washington, D.C. 20549
FORM N-CSR
CERTIFIED SHAREHOLDER REPORT OF REGISTERED MANAGEMENT
INVESTMENT COMPANIES
Investment Company Act file number 811-05848
The Gabelli Value 25 Fund Inc. (formerly, The Gabelli Value Fund Inc.)
(Exact name of registrant as specified in charter)
One Corporate Center
Rye, New York 10580-1422
(Address of principal executive offices) (Zip code)
Bruce N. Alpert
Gabelli Funds, LLC
One Corporate Center
Rye, New York 10580-1422
(Name and address of agent for service)
Registrant’s telephone number, including area code: 1-800-422-3554
Date of fiscal year end: December 31
Date of reporting period: December 31, 2013
Form N-CSR is to be used by management investment companies to file reports with the Commission not later than 10 days after the transmission to stockholders of any report that is required to be transmitted to stockholders under Rule 30e-1 under the Investment Company Act of 1940 (17 CFR 270.30e-1). The Commission may use the information provided on Form N-CSR in its regulatory, disclosure review, inspection, and policymaking roles.
A registrant is required to disclose the information specified by Form N-CSR, and the Commission will make this information public. A registrant is not required to respond to the collection of information contained in Form N-CSR unless the Form displays a currently valid Office of Management and Budget (“OMB”) control number. Please direct comments concerning the accuracy of the information collection burden estimate and any suggestions for reducing the burden to Secretary, Securities and Exchange Commission, 100 F Street, NE, Washington, DC 20549. The OMB has reviewed this collection of information under the clearance requirements of 44 U.S.C. § 3507.
Item 1. Reports to Stockholders.
The Report to Shareholders is attached herewith.
The Gabelli Value 25 Fund Inc.
(formerly known as The Gabelli Value Fund Inc.)
Annual Report — December 31, 2013 |
| |
| Christopher J. Marangi | ||
| Portfolio Manager |

To Our Shareholders,
For the year ended December 31, 2013, the net asset value (“NAV”) per Class A Share of The Gabelli Value 25 Fund Inc. increased 33.2% compared with increases of 32.4% and 29.6% for the Standard & Poor’s (“S&P”) 500 Index and the Dow Jones Industrial Average, respectively. See page 3 for additional performance information.
Enclosed are the schedule of investments and financial statements as of December 31, 2013.
Performance Discussion (Unaudited)
The Board of Directors approved a change to the name of the Fund, effective December 9, 2013, to The Gabelli Value 25 Fund Inc. The name change highlights the Fund’s overweighting of its core 25 equity positions and underscores the upcoming 25th anniversary of the Fund’s inception.
On the first business day of trading in January 2013, stocks began trading with a strong start to the year. Self-imposed U.S. governmental crisis (the debt ceiling and “sequestration” spending cuts) were either averted or shrugged off by the market. Global monetary policy also remained accommodative, with the Federal Reserve (“Fed”) and Mario Draghi’s European Central Bank continuing to keep rates low. Even Japan, following the election of Shinzo Abe, has said that it will use all options to beat deflation, leading to a substantial weakening of the yen.
Signs of modest improvement in the U.S. economy contrasted with renewed volatility in Europe, economic deceleration in China and Latin America, and political unrest in the Middle East. The Fed continued its program of quantitative easing throughout the year with the economy slowly improving. The Fed’s decision to keep its bond repurchasing at $85 billion per month rather than taper also helped to bolster market returns. At the end of the third quarter, the attention turned to the federal government shutdown that started on October 1 and the potential for the U.S bumping up against the Federal debt ceiling. Despite recurring drama in Washington, recession in Europe, and turmoil in emerging markets, the U.S. equity market ended the year 170% above its March 2009 low, representing a compounded annual return of over 22% during this period.
Selected holdings that contributed positively to performance in 2013 were Viacom Inc. Cl. A (7.9% of net assets as of December 31, 2013), an entertainment company that creates television programs, motion pictures, and other entertainment content; CBS Corp., Cl. A (4.5%), which operates as a mass media company; and American Express Co. (2.5%), a company providing charge and credit payment card products and services. Some of the larger detractors to performance were Cincinnati Bell Inc. (0.2%), a telecommunications and technology services company; Barrick Gold Corp. (0.3%), a company engaged in the production and sale of gold and
copper; and Newmont Mining Corp. (1.1%), a company involved in the acquisition, exploration, and production of gold and copper properties.
We appreciate your confidence and trust.
Sincerely yours, |
|
Bruce N. Alpert |
President |

February 11, 2014
2
Comparative Results
| Average Annual Returns through December 31, 2013 (a) (Unaudited) |
Since | |||||||||||||||||||||
1 Year | 5 Year | 10 Year | Inception | |||||||||||||||||||
Class A (GABVX) | 33.16 | % | 22.99 | % | 8.46 | % | 11.36 | % | ||||||||||||||
With sales charge (b) | 25.50 | 21.54 | 7.82 | 11.09 | ||||||||||||||||||
S&P 500 Index | 32.39 | 17.94 | 7.41 | 9.44 | ||||||||||||||||||
Dow Jones Industrial Average | 29.59 | 16.69 | 7.43 | 10.48 | ||||||||||||||||||
Nasdaq Composite Index | 40.12 | 22.92 | 8.81 | 9.39 | ||||||||||||||||||
Class AAA (GVCAX) | 33.08 | 22.98 | 8.45 | 11.36 | ||||||||||||||||||
Class C (GVCCX) | 32.18 | 22.05 | 7.64 | 10.89 | ||||||||||||||||||
With contingent deferred sales charge (c) | 31.18 | 22.05 | 7.64 | 10.89 | ||||||||||||||||||
Class I (GVCIX) | 33.51 | 23.28 | 8.62 | 11.43 | ||||||||||||||||||
In the current prospectuses dated April 30, 2013, the expense ratios for Class AAA, A, C, and I Shares are 1.42%, 1.42%, 2.17%, and 1.17%, respectively. See page 11 for the expense ratios for the year ended December 31, 2013. Class AAA and Class I Shares do not have a sales charge. The maximum sales charge for Class A and Class C Shares is 5.75% and 1.00%, respectively. | ||||
(a) | Returns represent past performance and do not guarantee future results. Total returns and average annual returns reflect changes in share price, reinvestment of distributions, and are net of expenses. Investment returns and the principal value of an investment will fluctuate. When shares are redeemed, they may be worth more or less than their original cost. Current performance may be lower or higher than the performance data presented. Visit www.gabelli.com for performance information as of the most recent month end. The Fund imposes a 2% redemption fee on shares sold or exchanged within seven days after the date of purchase. Investors should carefully consider the investment objectives, risks, charges, and expenses of the Fund before investing. The prospectuses contain information about these and other matters and should be read carefully before investing. To obtain a prospectus please visit our website at www.gabelli.com. The Class A Share NAVs are used to calculate performance for the periods prior to the issuance of Class AAA Shares on April 30, 2010, Class C Shares on March 15, 2000, and the Class I Shares on January 11, 2008. The actual performance of the Class C Shares would have been lower due to the additional fees and expenses associated with these classes of shares. The actual performance of the Class AAA Shares and Class I Shares would have been higher due to lower expenses related to this class of shares. The S&P 500 Index is a market capitalization weighted index of 500 large capitalization stocks commonly used to represent the U.S. equity market. The Dow Jones Industrial Average and the Nasdaq Composite Index are unmanaged indicators of stock market performance. Dividends are considered reinvested, except for the Nasdaq Composite Index. You cannot invest directly in an index. | |||
(b) | Performance results include the effect of the maximum 5.75% sales charge at the beginning of the period. | |||
(c)
| Assuming payment of the 1% maximum contingent deferred sales charge imposed on redemptions made within one year of purchase.
| |||
COMPARISON OF CHANGE IN VALUE OF A $10,000 INVESTMENT IN
THE GABELLI VALUE 25 FUND INC. (CLASS A SHARES) AND S&P 500 INDEX (Unaudited)
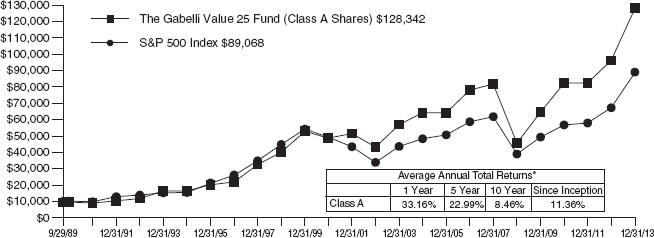
| * | Past performance is not predictive of future results. The performance tables and graph do not reflect the deduction of taxes that a shareholder would pay on Fund distributions or the redemption of Fund shares. |
3
| The Gabelli Value 25 Fund Inc. | ||
| Disclosure of Fund Expenses (Unaudited) | ||
| For the Six Month Period from July 1, 2013 through December 31, 2013 | Expense Table |
We believe it is important for you to understand the impact of fees and expenses regarding your investment. All mutual funds have operating expenses. As a shareholder of a fund, you incur ongoing costs, which include costs for portfolio management, administrative services, and shareholder reports (like this one), among others. Operating expenses, which are deducted from a fund’s gross income, directly reduce the investment return of a fund. When a fund’s expenses are expressed as a percentage of its average net assets, this figure is known as the expense ratio. The following examples are intended to help you understand the ongoing costs (in dollars) of investing in your Fund and to compare these costs with those of other mutual funds. The examples are based on an investment of $1,000 made at the beginning of the period shown and held for the entire period.
The Expense Table below illustrates your Fund’s costs in two ways:
Actual Fund Return: This section provides information about actual account values and actual expenses. You may use this section to help you to estimate the actual expenses that you paid over the period after any fee waivers and expense reimbursements. The “Ending Account Value” shown is derived from the Fund’s actual return during the past six months, and the “Expenses Paid During Period” shows the dollar amount that would have been paid by an investor who started with $1,000 in the Fund. You may use this information, together with the amount you invested, to estimate the expenses that you paid over the period.
To do so, simply divide your account value by $1,000 (for example, an $8,600 account value divided by $1,000 = 8.6), then multiply the result by the number given for your Fund under the heading “Expenses Paid During Period” to estimate the expenses you paid during this period.
Hypothetical 5% Return: This section provides information about hypothetical account values and
hypothetical expenses based on the Fund’s actual expense ratio. It assumes a hypothetical annualized return of 5% before expenses during the period shown. In this case – because the hypothetical return used is not the Fund’s actual return – the results do not apply to your investment and you cannot use the hypothetical account value and expense to estimate the actual ending account balance or expenses you paid for the period. This example is useful in making comparisons of the ongoing costs of investing in the Fund and other funds. To do so, compare this 5% hypothetical example with the 5% hypothetical examples that appear in shareholder reports of other funds.
Please note that the expenses shown in the table are meant to highlight your ongoing costs only and do not reflect any transactional costs such as sales charges (loads), redemption fees, or exchange fees, if any, which would be described in the Prospectus. If these costs were applied to your account, your costs would be higher. Therefore, the 5% hypothetical return is useful in comparing ongoing costs only, and will not help you determine the relative total costs of owning different funds. The “Annualized Expense Ratio” represents the actual expenses for the last six months and may be different from the expense ratio in the Financial Highlights which is for the year ended December 31, 2013.
| Beginning Account Value 07/01/13 | Ending Account Value 12/31/13 | Annualized Ratio | Expenses Paid During | |||||
| ||||||||
The Gabelli Value 25 Fund Inc. | ||||||||
| ||||||||
Actual Fund Return | ||||||||
Class AAA | $1,000.00 | $1,166.70 | 1.39% | $ 7.59 | ||||
Class A | $1,000.00 | $1,167.60 | 1.39% | $ 7.59 | ||||
Class C | $1,000.00 | $1,162.60 | 2.14% | $11.67 | ||||
Class I | $1,000.00 | $1,168.50 | 1.14% | $ 6.23 | ||||
Hypothetical 5% Return | ||||||||
Class AAA | $1,000.00 | $1,018.20 | 1.39% | $ 7.07 | ||||
Class A | $1,000.00 | $1,018.20 | 1.39% | $ 7.07 | ||||
Class C | $1,000.00 | $1,014.42 | 2.14% | $10.87 | ||||
Class I | $1,000.00 | $1,019.46 | 1.14% | $ 5.80 | ||||
| * | Expenses are equal to the Fund’s annualized expense ratio for the last six months multiplied by the average account value over the period, multiplied by the number of days in the most recent fiscal half year (184 days), then divided by 365. |
4
Summary of Portfolio Holdings (Unaudited)
The following table presents portfolio holdings as a percent of net assets as of December 31, 2013:
The Gabelli Value 25 Fund Inc.
Entertainment | 16.2% | |||
Cable and Satellite | 13.0% | |||
Food and Beverage | 6.5% | |||
Financial Services | 6.2% | |||
Broadcasting | 5.9% | |||
U.S. Government Obligations | 5.6% | |||
Diversified Industrial | 5.4% | |||
Equipment and Supplies | 4.2% | |||
Consumer Products | 3.5% | |||
Energy and Utilities | 3.4% | |||
Consumer Services | 3.0% | |||
Aerospace | 2.8% | |||
Business Services | 2.4% | |||
Machinery | 2.0% | |||
Automotive: Parts and Accessories | 2.0% | |||
Retail | 2.0% | |||
Metals and Mining | 1.9% |
Environmental Services | 1.8% | |||
Publishing | 1.5% | |||
Telecommunications | 1.5% | |||
Hotels and Gaming | 1.4% | |||
Automotive | 1.3% | |||
Health Care | 1.1% | |||
Computer Software and Services | 1.0% | |||
Aviation: Parts and Services | 1.0% | |||
Electronics | 1.0% | |||
Specialty Chemicals | 0.8% | |||
Wireless Communications | 0.8% | |||
Real Estate | 0.7% | |||
Communications Equipment | 0.5% | |||
Other Assets and Liabilities (Net) | (0.4)% | |||
|
| |||
| 100.0% | ||||
|
|
The Fund files a complete schedule of portfolio holdings with the Securities and Exchange Commission (the “SEC”) for the first and third quarters of each fiscal year on Form N-Q. Shareholders may obtain this information at www.gabelli.com or by calling the Fund at 800-GABELLI (800-422-3554). The Fund’s Form N-Q is available on the SEC’s website at www.sec.gov and may also be reviewed and copied at the SEC’s Public Reference Room in Washington, DC. Information on the operation of the Public Reference Room may be obtained by calling 800-SEC-0330.
Proxy Voting
The Fund files Form N-PX with its complete proxy voting record for the twelve months ended June 30, no later than August 31 of each year. A description of the Fund’s proxy voting policies, procedures, and how the Fund voted proxies relating to portfolio securities is available without charge, upon request, by (i) calling 800-GABELLI (800-422-3554); (ii) writing to The Gabelli Funds at One Corporate Center, Rye, NY 10580-1422; or (iii) visiting the SEC’s website at www.sec.gov.
5
The Gabelli Value 25 Fund Inc.
Schedule of Investments — December 31, 2013
| Shares | Cost | Market Value | ||||||||||
| COMMON STOCKS — 94.8% | ||||||||||||
| Aerospace — 2.8% | ||||||||||||
| 130,000 | Exelis Inc. | $ | 1,368,605 | $ | 2,477,800 | |||||||
| 920,000 | Rolls-Royce Holdings plc | 6,481,183 | 19,424,387 | |||||||||
| 79,120,000 | Rolls-Royce Holdings plc, Cl. C†(a) | 127,776 | 131,019 | |||||||||
|
|
|
| |||||||||
| 7,977,564 | 22,033,206 | |||||||||||
|
|
|
| |||||||||
| Automotive — 1.3% | ||||||||||||
| 160,000 | Ford Motor Co. | 2,040,913 | 2,468,800 | |||||||||
| 205,000 | Navistar International Corp.† | 6,273,551 | 7,828,950 | |||||||||
|
|
|
| |||||||||
| 8,314,464 | 10,297,750 | |||||||||||
|
|
|
| |||||||||
| Automotive: Parts and Accessories — 2.0% | ||||||||||||
| 38,000 | China Yuchai International Ltd. | 300,576 | 793,060 | |||||||||
| 140,000 | Genuine Parts Co. | 3,658,888 | 11,646,600 | |||||||||
| 14,000 | O’Reilly Automotive Inc.† | 1,739,997 | 1,801,940 | |||||||||
| 25,000 | Tenneco Inc.† | 828,780 | 1,414,250 | |||||||||
|
|
|
| |||||||||
| 6,528,241 | 15,655,850 | |||||||||||
|
|
|
| |||||||||
| Aviation: Parts and Services — 1.0% | ||||||||||||
| 1,500 | B/E Aerospace Inc.† | 116,738 | 130,545 | |||||||||
| 111,477 | BBA Aviation plc | 222,905 | 591,832 | |||||||||
| 27,000 | Curtiss-Wright Corp. | 574,682 | 1,680,210 | |||||||||
| 296,000 | GenCorp Inc.† | 2,236,460 | 5,333,920 | |||||||||
|
|
|
| |||||||||
| 3,150,785 | 7,736,507 | |||||||||||
|
|
|
| |||||||||
| Broadcasting — 5.9% | ||||||||||||
| 566,000 | CBS Corp., Cl. A, Voting | 11,235,702 | 36,020,240 | |||||||||
| 71,500 | Liberty Media Corp., Cl. A† | 1,149,485 | 10,471,175 | |||||||||
|
|
|
| |||||||||
| 12,385,187 | 46,491,415 | |||||||||||
|
|
|
| |||||||||
| Business Services — 2.4% | ||||||||||||
| 4,800 | ARAMARK Holdings Corp.† | 96,000 | 125,856 | |||||||||
| 45,000 | Ascent Capital Group Inc., Cl. A† | 1,175,027 | 3,850,200 | |||||||||
| 60,000 | Blucora Inc.† | 1,026,374 | 1,749,600 | |||||||||
| 65,000 | Clear Channel Outdoor Holdings Inc., Cl. A | 105,858 | 659,100 | |||||||||
| 52,000 | Fidelity National Information Services Inc. | 1,173,376 | 2,791,360 | |||||||||
| 130,000 | Internap Network Services Corp.† | 792,206 | 977,600 | |||||||||
| 59,800 | Macquarie Infrastructure Co. LLC | 2,394,211 | 3,254,914 | |||||||||
| 5,100 | MasterCard Inc., Cl. A | 1,107,728 | 4,260,846 | |||||||||
| 40,000 | The Brink’s Co. | 1,133,364 | 1,365,600 | |||||||||
|
|
|
| |||||||||
| 9,004,144 | 19,035,076 | |||||||||||
|
|
|
| |||||||||
| Cable and Satellite — 13.0% | ||||||||||||
| 212,000 | AMC Networks Inc., Cl. A† | 1,040,478 | 14,439,320 | |||||||||
| 780,000 | Cablevision Systems Corp., Cl. A | 1,847,002 | 13,985,400 | |||||||||
| 142,000 | Comcast Corp., Cl. A, Special | 3,069,906 | 7,082,960 | |||||||||
| 264,000 | DIRECTV† | 4,725,125 | 18,239,760 | |||||||||
| 153,000 | DISH Network Corp., Cl. A† | 2,921,499 | 8,861,760 | |||||||||
| 106,000 | EchoStar Corp., Cl. A† | 2,917,951 | 5,270,320 | |||||||||
| Shares | Cost | Market Value | ||||||||||
| 64,000 | Intelsat SA† | $ | 1,289,918 | $ | 1,442,560 | |||||||
| 154,000 | Liberty Global plc, Cl. A† | 3,887,861 | 13,704,460 | |||||||||
| 235,000 | Rogers Communications Inc., Cl. B | 3,167,627 | 10,633,750 | |||||||||
| 80,000 | Scripps Networks Interactive Inc., Cl. A | 2,642,710 | 6,912,800 | |||||||||
| 80,000 | Sky Deutschland AG† | 704,122 | 880,451 | |||||||||
| 11,000 | Time Warner Cable Inc. | 1,452,545 | 1,490,500 | |||||||||
|
|
|
| |||||||||
| 29,666,744 | 102,944,041 | |||||||||||
|
|
|
| |||||||||
| Communications Equipment — 0.5% | ||||||||||||
| 50,000 | Corning Inc. | 608,170 | 891,000 | |||||||||
| 40,500 | Loral Space & Communications Inc.† | 1,978,629 | 3,279,690 | |||||||||
|
|
|
| |||||||||
| 2,586,799 | 4,170,690 | |||||||||||
|
|
|
| |||||||||
| Computer Software and Services — 1.0% | ||||||||||||
| 20,000 | DST Systems Inc. | 1,425,667 | 1,814,800 | |||||||||
| 85,000 | EarthLink Inc. | 514,173 | 430,950 | |||||||||
| 35,000 | eBay Inc.† | 946,012 | 1,921,150 | |||||||||
| 30,000 | Microsoft Corp. | 976,765 | 1,122,900 | |||||||||
| 83,000 | RealD Inc.† | 700,673 | 708,820 | |||||||||
| 55,000 | Yahoo! Inc.† | 920,491 | 2,224,200 | |||||||||
|
|
|
| |||||||||
| 5,483,781 | 8,222,820 | |||||||||||
|
|
|
| |||||||||
| Consumer Products — 3.5% | ||||||||||||
| 20,000 | Avon Products Inc. | 355,616 | 344,400 | |||||||||
| 70,000 | Blyth Inc. | 1,212,161 | 761,600 | |||||||||
| 49,000 | Coty Inc., Cl. A | 831,488 | 747,250 | |||||||||
| 49,000 | Energizer Holdings Inc. | 1,149,617 | 5,303,760 | |||||||||
| 566 | Givaudan SA | 161,059 | 808,345 | |||||||||
| 614,000 | Swedish Match AB | 9,463,255 | 19,732,083 | |||||||||
| 1,000 | The Estee Lauder Companies Inc., Cl. A | 33,385 | 75,320 | |||||||||
|
|
|
| |||||||||
| 13,206,581 | 27,772,758 | |||||||||||
|
|
|
| |||||||||
| Consumer Services — 3.0% | ||||||||||||
| 296,500 | Liberty Interactive Corp., Cl. A† | 4,658,755 | 8,702,275 | |||||||||
| 27,135 | Liberty Ventures, Cl. A† | 1,347,976 | 3,326,480 | |||||||||
| 202,000 | Rollins Inc. | 662,012 | 6,118,580 | |||||||||
| 144,000 | The ADT Corp. | 5,124,578 | 5,827,680 | |||||||||
|
|
|
| |||||||||
| 11,793,321 | 23,975,015 | |||||||||||
|
|
|
| |||||||||
| Diversified Industrial — 5.4% | ||||||||||||
| 41,000 | Ampco-Pittsburgh Corp. | 205,014 | 797,450 | |||||||||
| 50,000 | Blount International Inc.† | 609,727 | 723,500 | |||||||||
| 118,000 | Crane Co. | 3,072,009 | 7,935,500 | |||||||||
| 50,000 | Fortune Brands Home & Security Inc. | 651,784 | 2,285,000 | |||||||||
| 68,000 | Griffon Corp. | 733,354 | 898,280 | |||||||||
| 228,000 | Honeywell International Inc. | 6,359,770 | 20,832,360 | |||||||||
| 62,000 | ITT Corp. | 1,088,182 | 2,692,040 | |||||||||
| 89,000 | Katy Industries Inc.† | 152,500 | 36,490 | |||||||||
| 6,000 | Precision Castparts Corp. | 738,419 | 1,615,800 | |||||||||
See accompanying notes to financial statements.
6
The Gabelli Value 25 Fund Inc.
Schedule of Investments (Continued) — December 31, 2013
| Shares | Cost | Market Value | ||||||||||
| COMMON STOCKS (Continued) | ||||||||||||
| Diversified Industrial (Continued) | ||||||||||||
| 130,000 | Tyco International Ltd. | $ | 2,916,624 | $ | 5,335,200 | |||||||
|
|
|
| |||||||||
| 16,527,383 | 43,151,620 | |||||||||||
|
|
|
| |||||||||
| Electronics — 1.0% | ||||||||||||
| 40,000 | Sony Corp., ADR | 686,560 | 691,600 | |||||||||
| 157,000 | Texas Instruments Inc. | 3,568,978 | 6,893,870 | |||||||||
|
|
|
| |||||||||
| 4,255,538 | 7,585,470 | |||||||||||
|
|
|
| |||||||||
| Energy and Utilities — 3.4% | ||||||||||||
| 2,000 | Chevron Corp. | 135,096 | 249,820 | |||||||||
| 70,000 | ConocoPhillips | 1,359,001 | 4,945,500 | |||||||||
| 35,000 | CONSOL Energy Inc. | 1,300,292 | 1,331,400 | |||||||||
| 200,000 | GenOn Energy Inc., Escrow† | 0 | 0 | |||||||||
| 239,000 | National Fuel Gas Co. | 10,655,531 | 17,064,600 | |||||||||
| 6,500 | Occidental Petroleum Corp. | 503,980 | 618,150 | |||||||||
| 13,000 | Southwest Gas Corp. | 325,889 | 726,830 | |||||||||
| 115,000 | Weatherford International Ltd.† | 1,772,300 | 1,781,350 | |||||||||
|
|
|
| |||||||||
| 16,052,089 | 26,717,650 | |||||||||||
|
|
|
| |||||||||
| Entertainment — 16.2% | ||||||||||||
| 37,000 | Discovery Communications Inc., Cl. A† | 537,456 | 3,345,540 | |||||||||
| 82,000 | Discovery Communications Inc., Cl. C† | 1,176,619 | 6,876,520 | |||||||||
| 50,000 | Dover Motorsports Inc. | 197,844 | 125,500 | |||||||||
| 231,000 | Grupo Televisa SAB, ADR | 2,234,491 | 6,990,060 | |||||||||
| 76,000 | Starz, Cl. A† | 143,781 | 2,222,240 | |||||||||
| 268,000 | The Madison Square Garden Co., Cl. A† | 1,143,500 | 15,431,440 | |||||||||
| 125,000 | Time Warner Inc. | 3,805,942 | 8,715,000 | |||||||||
| 270,000 | Twenty-First Century Fox Inc., Cl. A | 3,438,208 | 9,498,600 | |||||||||
| 110,000 | Twenty-First Century Fox Inc., Cl. B | 3,035,946 | 3,806,000 | |||||||||
| 716,000 | Viacom Inc., Cl. A | 22,217,940 | 62,843,320 | |||||||||
| 315,000 | Vivendi SA | 5,727,785 | 8,300,764 | |||||||||
| 54,000 | World Wrestling Entertainment Inc., Cl. A | 575,684 | 895,320 | |||||||||
|
|
|
| |||||||||
| 44,235,196 | 129,050,304 | |||||||||||
|
|
|
| |||||||||
| Environmental Services — 1.8% | ||||||||||||
| 64,000 | Progressive Waste Solutions Ltd. | 1,387,158 | 1,584,000 | |||||||||
| 318,000 | Republic Services Inc. | 5,071,828 | 10,557,600 | |||||||||
| 50,000 | Waste Management Inc. | 1,754,241 | 2,243,500 | |||||||||
|
|
|
| |||||||||
| 8,213,227 | 14,385,100 | |||||||||||
|
|
|
| |||||||||
| Equipment and Supplies — 4.2% | ||||||||||||
| 138,000 | CIRCOR International Inc. | 1,731,208 | 11,147,640 | |||||||||
| 3,000 | Federal Signal Corp.† | 29,730 | 43,950 | |||||||||
| 120,000 | Flowserve Corp. | 557,235 | 9,459,600 | |||||||||
| 10,000 | Graco Inc. | 570,432 | 781,200 | |||||||||
| 80,000 | GrafTech International Ltd.† | 841,379 | 898,400 | |||||||||
| Shares | Cost | Market Value | ||||||||||
| 25,000 | Sealed Air Corp. | $ | 372,835 | $ | 851,250 | |||||||
| 80,000 | Timken Co. | 4,422,692 | 4,405,600 | |||||||||
| 88,000 | Watts Water Technologies Inc., Cl. A | 1,237,166 | 5,444,560 | |||||||||
|
|
|
| |||||||||
| 9,762,677 | 33,032,200 | |||||||||||
|
|
|
| |||||||||
| Financial Services — 6.2% | ||||||||||||
| 222,000 | American Express Co. | 5,926,074 | 20,142,060 | |||||||||
| 72,000 | H&R Block Inc. | 1,208,334 | 2,090,880 | |||||||||
| 4,000 | Hartford Financial Services Group Inc. | 146,402 | 144,920 | |||||||||
| 7,000 | Interactive Brokers Group Inc., Cl. A | 103,603 | 170,380 | |||||||||
| 29,000 | JPMorgan Chase & Co. | 1,203,220 | 1,695,920 | |||||||||
| 3,100 | Kinnevik Investment AB, Cl. A | 93,856 | 144,256 | |||||||||
| 90,000 | Kinnevik Investment AB, Cl. B | 1,831,067 | 4,168,474 | |||||||||
| 100,000 | Legg Mason Inc. | 2,804,334 | 4,348,000 | |||||||||
| 37,000 | Loews Corp. | 1,585,859 | 1,784,880 | |||||||||
| 15,000 | Morgan Stanley | 392,619 | 470,400 | |||||||||
| 30,000 | SLM Corp. | 355,829 | 788,400 | |||||||||
| 19,000 | State Street Corp. | 867,339 | 1,394,410 | |||||||||
| 20,000 | Steel Excel Inc.† | 586,331 | 590,200 | |||||||||
| 114,000 | The Bank of New York Mellon Corp. | 3,232,991 | 3,983,160 | |||||||||
| 3,600 | The Goldman Sachs Group Inc. | 424,268 | 638,136 | |||||||||
| 17,000 | The PNC Financial Services Group Inc. | 1,090,926 | 1,318,860 | |||||||||
| 122,000 | Wells Fargo & Co. | 4,027,731 | 5,538,800 | |||||||||
|
|
|
| |||||||||
| 25,880,783 | 49,412,136 | |||||||||||
|
|
|
| |||||||||
| Food and Beverage — 6.5% | ||||||||||||
| 111,000 | Beam Inc. | 5,565,244 | 7,554,660 | |||||||||
| 200,000 | Davide Campari-Milano SpA | 1,481,732 | 1,672,857 | |||||||||
| 147,000 | Diageo plc, ADR | 5,692,415 | 19,465,740 | |||||||||
| 55,000 | Dr Pepper Snapple Group Inc. | 1,458,382 | 2,679,600 | |||||||||
| 70,000 | Fomento Economico Mexicano SAB de CV, ADR | 862,699 | 6,850,900 | |||||||||
| 140,000 | Hillshire Brands Co. | 4,367,520 | 4,681,600 | |||||||||
| 22,000 | Kerry Group plc, Cl. A | 256,795 | 1,528,106 | |||||||||
| 10,000 | Kikkoman Corp. | 106,788 | 188,586 | |||||||||
| 117,000 | Mondelēz International | 2,757,108 | 4,130,100 | |||||||||
| 9,000 | PepsiCo Inc. | 710,583 | 746,460 | |||||||||
| 12,000 | Pernod Ricard SA | 886,247 | 1,367,066 | |||||||||
| 14,000 | Remy Cointreau SA | 825,768 | 1,174,659 | |||||||||
|
|
|
| |||||||||
| 24,971,281 | 52,040,334 | |||||||||||
|
|
|
| |||||||||
| Health Care — 1.1% | ||||||||||||
| 1,000 | Becton, Dickinson and Co. | 103,970 | 110,490 | |||||||||
| 16,500 | Chemed Corp. | 964,105 | 1,264,230 | |||||||||
| 30,000 | Covidien plc | 1,127,121 | 2,043,000 | |||||||||
| 18,000 | Endo Health Solutions Inc.† | 556,000 | 1,214,280 | |||||||||
| 30,000 | Express Scripts Holding Co.† | 1,922,691 | 2,107,200 | |||||||||
| 25,000 | Hospira Inc.† | 1,027,829 | 1,032,000 | |||||||||
See accompanying notes to financial statements.
7
The Gabelli Value 25 Fund Inc.
Schedule of Investments (Continued) — December 31, 2013
| Shares | Cost | Market Value | ||||||||||
| COMMON STOCKS (Continued) | ||||||||||||
| Health Care (Continued) | ||||||||||||
| 12,235 | Life Technologies Corp.† | $ | 904,584 | $ | 927,413 | |||||||
| 11,000 | Zoetis Inc. | 286,000 | 359,590 | |||||||||
|
|
|
| |||||||||
| 6,892,300 | 9,058,203 | |||||||||||
|
|
|
| |||||||||
| Hotels and Gaming — 1.4% | ||||||||||||
| 16,000 | Accor SA | 560,185 | 754,987 | |||||||||
| 35,000 | International Game Technology | 537,925 | 635,600 | |||||||||
| 210,000 | Ladbrokes plc | 362,790 | 622,127 | |||||||||
| 40,000 | Las Vegas Sands Corp. | 1,062,527 | 3,154,800 | |||||||||
| 34,000 | MGM Resorts International† | 426,149 | 799,680 | |||||||||
| 120,000 | Ryman Hospitality Properties Inc. | 3,380,547 | 5,013,600 | |||||||||
|
|
|
| |||||||||
| 6,330,123 | 10,980,794 | |||||||||||
|
|
|
| |||||||||
| Machinery — 2.0% | ||||||||||||
| 54,000 | CNH Industrial NV, Brsaltaliana† | 525,492 | 615,477 | |||||||||
| 186,806 | CNH Industrial NV, New York† | 1,013,733 | 2,120,248 | |||||||||
| 52,000 | Deere & Co. | 1,125,349 | 4,749,160 | |||||||||
| 190,409 | Xylem Inc. | 4,805,879 | 6,588,151 | |||||||||
| 37,000 | Zebra Technologies Corp., Cl. A† | 1,052,154 | 2,000,960 | |||||||||
|
|
|
| |||||||||
| 8,522,607 | 16,073,996 | |||||||||||
|
|
|
| |||||||||
| Metals and Mining — 1.9% | ||||||||||||
| 145,000 | Barrick Gold Corp. | 3,627,880 | 2,556,350 | |||||||||
| 40,000 | Freeport-McMoRan Copper & Gold Inc. | 840,297 | 1,509,600 | |||||||||
| 25,000 | Global Brass & Copper Holdings Inc. | 372,567 | 413,750 | |||||||||
| 90,000 | Kinross Gold Corp. | 734,770 | 394,200 | |||||||||
| 35,000 | Materion Corp. | 830,808 | 1,079,750 | |||||||||
| 392,000 | Newmont Mining Corp. | 7,887,152 | 9,027,760 | |||||||||
|
|
|
| |||||||||
| 14,293,474 | 14,981,410 | |||||||||||
|
|
|
| |||||||||
| Publishing — 1.5% | ||||||||||||
| 235,000 | Media General Inc.† | 3,823,729 | 5,311,000 | |||||||||
| 31,000 | Meredith Corp. | 631,843 | 1,605,800 | |||||||||
| 67,500 | News Corp., Cl. A† | 468,847 | 1,216,350 | |||||||||
| 180,000 | News Corp., Cl. B† | 2,783,310 | 3,209,400 | |||||||||
| 20,000 | Nielsen Holdings NV† | 665,896 | 917,800 | |||||||||
|
|
|
| |||||||||
| 8,373,625 | 12,260,350 | |||||||||||
|
|
|
| |||||||||
| Real Estate — 0.7% | ||||||||||||
| 60,000 | Forest City Enterprises Inc., Cl. A† | 1,135,751 | 1,146,000 | |||||||||
| 132,000 | Griffin Land & Nurseries Inc. | 1,584,503 | 4,406,160 | |||||||||
|
|
|
| |||||||||
| 2,720,254 | 5,552,160 | |||||||||||
|
|
|
| |||||||||
| Retail — 2.0% | ||||||||||||
| 14,000 | Bed Bath & Beyond Inc.† | 947,722 | 1,124,200 | |||||||||
| 80,000 | CST Brands Inc. | 2,568,862 | 2,937,600 | |||||||||
| 40,000 | CVS Caremark Corp. | 1,366,949 | 2,862,800 | |||||||||
| 58,000 | Hertz Global Holdings Inc.† | 1,341,824 | 1,659,960 | |||||||||
| 15,000 | HSN Inc. | 395,417 | 934,500 | |||||||||
| Shares | Cost | Market Value | ||||||||||
| 55,000 | Ingles Markets Inc., Cl. A | $ | 695,382 | $ | 1,490,500 | |||||||
| 37,000 | Outerwall Inc.† | 1,839,770 | 2,488,990 | |||||||||
| 40,000 | Safeway Inc. | 853,300 | 1,302,800 | |||||||||
| 10,000 | The Home Depot Inc. | 308,325 | 823,400 | |||||||||
|
|
|
| |||||||||
| 10,317,551 | 15,624,750 | |||||||||||
|
|
|
| |||||||||
| Specialty Chemicals — 0.8% | ||||||||||||
| 13,500 | Airgas Inc. | 893,974 | 1,509,975 | |||||||||
| 12,500 | Ashland Inc. | 1,099,859 | 1,213,000 | |||||||||
| 10,000 | Chemtura Corp.† | 277,813 | 279,200 | |||||||||
| 125,000 | Ferro Corp.† | 858,702 | 1,603,750 | |||||||||
| 11,000 | FMC Corp. | 252,644 | 830,060 | |||||||||
| 14,000 | International Flavors & Fragrances Inc. | 611,175 | 1,203,720 | |||||||||
|
|
|
| |||||||||
| 3,994,167 | 6,639,705 | |||||||||||
|
|
|
| |||||||||
| Telecommunications — 1.5% | ||||||||||||
| 360,000 | Cincinnati Bell Inc.† | 1,212,939 | 1,281,600 | |||||||||
| 62,818 | Sprint Corp.† | 356,178 | 675,293 | |||||||||
| 385,000 | Telephone & Data Systems Inc. | 7,779,738 | 9,925,300 | |||||||||
|
|
|
| |||||||||
| 9,348,855 | 11,882,193 | |||||||||||
|
|
|
| |||||||||
| Wireless Communications — 0.8% | ||||||||||||
| 50,000 | NII Holdings Inc.† | 185,606 | 137,500 | |||||||||
| 60,000 | United States Cellular Corp. | 2,748,540 | 2,509,200 | |||||||||
| 85,000 | Vodafone Group plc, ADR | 2,318,032 | 3,341,350 | |||||||||
|
|
|
| |||||||||
| 5,252,178 | 5,988,050 | |||||||||||
|
|
|
| |||||||||
| TOTAL COMMON STOCKS | 336,040,919 | 752,751,553 | ||||||||||
|
|
|
| |||||||||
| Principal Amount | ||||||||||||
| U.S. GOVERNMENT OBLIGATIONS — 5.6% | ||||||||||||
| $ | 44,625,000 | U.S. Treasury Bills, 0.055% to 0.105%††, 03/06/14 to 06/26/14 | 44,610,768 | 44,617,278 | ||||||||
|
|
|
| |||||||||
| TOTAL INVESTMENTS — 100.4% | $ | 380,651,687 | 797,368,831 | |||||||||
|
| |||||||||||
Other Assets and Liabilities (Net) |
| (3,119,321 | ) | |||||||||
|
| |||||||||||
| NET ASSETS — 100.0% | $ | 794,249,510 | ||||||||||
|
| |||||||||||
| (a) | At December 31, 2013, the Fund held an investment in a restricted and illiquid security amounting to $131,019 or 0.02% of net assets, which was valued as follows: |
| Acquisition Shares | Issuer | Acquisition Date | Acquisition Cost | Carrying Value Per Share | ||||||||
| 79,120,000 | Rolls-Royce Holdings plc, Cl. C | 10/23/13 | $ | 127,776 | $ | 0.0017 | ||||||
| † | Non-income producing security. |
| †† | Represents annualized yield at date of purchase. |
| ADR | American Depositary Receipt |
See accompanying notes to financial statements.
8
The Gabelli Value 25 Fund Inc.
Statement of Assets and Liabilities
December 31, 2013
Assets: | ||||
Investments, at value (cost $380,651,687) | $ | 797,368,831 | ||
Receivable for Fund shares sold | 845,627 | |||
Receivable for investments sold | 43,557 | |||
Dividends receivable | 755,786 | |||
Prepaid expenses | 35,168 | |||
|
| |||
Total Assets | 799,048,969 | |||
|
| |||
Liabilities: | ||||
Payable to custodian | 93,325 | |||
Payable for Fund shares redeemed | 1,031,642 | |||
Payable for investments purchased | 2,686,595 | |||
Payable for investment advisory fees | 650,319 | |||
Payable for distribution fees | 152,570 | |||
Payable for accounting fees | 3,750 | |||
Other accrued expenses | 181,258 | |||
|
| |||
Total Liabilities | 4,799,459 | |||
|
| |||
Net Assets (applicable to 40,349,303 shares outstanding) | $ | 794,249,510 | ||
|
| |||
Net Assets Consist of: | ||||
Paid-in capital | $ | 382,215,152 | ||
Undistributed net investment income | 147,930 | |||
Accumulated net realized loss on investments and foreign currency transactions | (4,830,767 | ) | ||
Net unrealized appreciation on investments | 416,717,144 | |||
Net unrealized appreciation on foreign currency translations | 51 | |||
|
| |||
Net Assets | $ | 794,249,510 | ||
|
|
Shares of Capital Stock, each at $0.001 par value: | ||||
Class AAA: | ||||
Net Asset Value, offering, and redemption price per share ($7,174,109 ÷ 363,918 shares outstanding; 50,000,000 shares authorized) | $19.71 | |||
|
| |||
Class A: | ||||
Net Asset Value and redemption price per share ($635,816,931 ÷ 32,150,540 shares outstanding; 100,000,000 shares authorized) | $19.78 | |||
|
| |||
Maximum offering price per share (NAV ÷ 0.9425, based on maximum sales charge of 5.75% of the offering price) | $20.99 | |||
|
| |||
Class C: | ||||
Net Asset Value and offering price per share ($23,911,991 ÷ 1,391,764 shares outstanding; 50,000,000 shares authorized) | $17.18 | (a) | ||
|
| |||
Class I: | ||||
Net Asset Value, offering, and redemption price per share ($127,346,479 ÷ 6,443,081 shares outstanding; 50,000,000 shares authorized) | $19.76 | |||
|
|
| (a) | Redemption price varies based on the length of time held. |
Statement of Operations
For the Year Ended December 31, 2013
Investment Income: | ||||
Dividends (net of foreign withholding taxes of $277,574) | $ | 10,243,721 | ||
Interest | 15,578 | |||
|
| |||
Total Investment Income | 10,259,299 | |||
|
| |||
Expenses: | ||||
Investment advisory fees | 6,559,066 | |||
Distribution fees - Class AAA | 9,523 | |||
Distribution fees - Class A | 1,442,661 | |||
Distribution fees - Class B | 472 | |||
Distribution fees - Class C | 154,803 | |||
Shareholder services fees | 447,601 | |||
Shareholder communications expenses | 118,649 | |||
Custodian fees | 91,080 | |||
Directors’ fees | 80,000 | |||
Legal and audit fees | 73,612 | |||
Registration expenses | 67,322 | |||
Accounting fees | 45,000 | |||
Interest expense | 380 | |||
Miscellaneous expenses | 42,609 | |||
|
| |||
Total Expenses | 9,132,778 | |||
|
| |||
Less: | ||||
Advisory fee reduction on unsupervised assets (Note 3) | (33,873 | ) | ||
|
| |||
Net Expenses | 9,098,905 | |||
|
| |||
Net Investment Income | 1,160,394 | |||
|
| |||
Net Realized and Unrealized Gain/(Loss) on Investments and Foreign Currency: | ||||
Net realized gain on investments | 20,953,284 | |||
Net realized gain on foreign currency transactions | 15,466 | |||
|
| |||
Net realized gain on investments and foreign currency transactions | 20,968,750 | |||
|
| |||
Net change in unrealized appreciation/depreciation: | ||||
on investments | 164,671,328 | |||
on foreign currency translations | (651 | ) | ||
|
| |||
Net change in unrealized appreciation/depreciation on investments and foreign currency translations | 164,670,677 | |||
|
| |||
Net Realized and Unrealized Gain/(Loss) on Investments and Foreign Currency | 185,639,427 | |||
|
| |||
Net Increase in Net Assets Resulting from Operations | $ | 186,799,821 | ||
|
|
See accompanying notes to financial statements.
9
The Gabelli Value 25 Fund Inc.
Statement of Changes in Net Assets
| Year Ended December 31, 2013 | Year Ended December 31, 2012 | |||||||||
Operations: | ||||||||||
Net investment income | $ | 1,160,394 | $ | 4,366,321 | ||||||
Net realized gain on investments and foreign currency transactions | 20,968,750 | 28,796,367 | ||||||||
Net change in unrealized appreciation on investments and foreign currency translations | 164,670,677 | 47,343,087 | ||||||||
|
|
|
| |||||||
Net Increase in Net Assets Resulting from Operations | 186,799,821 | 80,505,775 | ||||||||
|
|
|
| |||||||
Distributions to Shareholders: | ||||||||||
Net investment income | ||||||||||
Class AAA | (12,586 | ) | (10,039 | ) | ||||||
Class A | (624,161 | ) | (4,086,739 | ) | ||||||
Class C | — | (23,827 | ) | |||||||
Class I | (406,656 | ) | (223,510 | ) | ||||||
|
|
|
| |||||||
| (1,043,403 | ) | (4,344,115 | ) | |||||||
|
|
|
| |||||||
Net realized gain | ||||||||||
Class AAA | (158,411 | ) | (61,140 | ) | ||||||
Class A | (14,841,956 | ) | (26,498,049 | ) | ||||||
Class B | — | (9,662 | ) | |||||||
Class C | (620,457 | ) | (534,094 | ) | ||||||
Class I | (2,920,186 | ) | (1,117,552 | ) | ||||||
|
|
|
| |||||||
| (18,541,010 | ) | (28,220,497 | ) | |||||||
|
|
|
| |||||||
Total Distributions to Shareholders | (19,584,413 | ) | (32,564,612 | ) | ||||||
|
|
|
| |||||||
Capital Share Transactions: | ||||||||||
Class AAA | 5,128,191 | 489,781 | ||||||||
Class A | (6,117,376 | ) | (32,559,337 | ) | ||||||
Class B* | (168,343 | ) | (531,574 | ) | ||||||
Class C | 11,437,759 | 444,913 | ||||||||
Class I | 91,518,282 | 11,425,616 | ||||||||
|
|
|
| |||||||
Net Increase/(Decrease) in Net Assets from Capital Share Transactions | 101,798,513 | (20,730,601 | ) | |||||||
|
|
|
| |||||||
Redemption Fees | 3,631 | 1,511 | ||||||||
|
|
|
| |||||||
Net Increase in Net Assets | 269,017,552 | 27,212,073 | ||||||||
Net Assets: | ||||||||||
Beginning of period | 525,231,958 | 498,019,885 | ||||||||
|
|
|
| |||||||
End of period (including undistributed net investment income of $147,930 and $15,410, respectively) | $ | 794,249,510 | $ | 525,231,958 | ||||||
|
|
|
| |||||||
| * | Class B Shares were fully redeemed and closed on April 25, 2013. |
See accompanying notes to financial statements.
10
The Gabelli Value 25 Fund Inc.
Financial Highlights
Selected data for a share of capital stock outstanding throughout each period:
| Income (Loss) from Investment Operations | Distributions | Ratios to Average Net Assets / Supplemental Data | ||||||||||||||||||||||||||||||||||||||||||||||||||||||||||||||||||||
Period Ended | Net Asset Value, Beginning of Period | Net Investment Income (Loss)(a) | Net Realized and Unrealized Gain (Loss) on Investments | Total from Investment Operations | Net Investment Income | Net Realized Gain on Investments | Total Distributions | Redemption Fees (a)(b) | Net Asset Value, End of Period | Total Return† | Net Assets, End of Period (in 000’s) | Net Investment Income (Loss) | Operating Expenses | Portfolio Turnover Rate | ||||||||||||||||||||||||||||||||||||||||||||||||||||||||
Class AAA | ||||||||||||||||||||||||||||||||||||||||||||||||||||||||||||||||||||||
2013 | $ | 15.21 | $ | 0.03 | $ | 4.98 | $ | 5.01 | $ | (0.04 | ) | $ | (0.47 | ) | $ | (0.51 | ) | $ | 0.00 | $ | 19.71 | 33.1 | % | $ | 7,174 | 0.16 | % | 1.39 | %(c) | 9 | % | |||||||||||||||||||||||||||||||||||||||
2012 | 13.87 | 0.14 | 2.20 | 2.34 | (0.14 | ) | (0.86 | ) | (1.00 | ) | 0.00 | 15.21 | 17.0 | 1,192 | 0.92 | 1.42 | 3 | |||||||||||||||||||||||||||||||||||||||||||||||||||||
2011 | 15.58 | 0.07 | (0.08 | ) | (0.01 | ) | (0.05 | ) | (1.65 | ) | (1.70 | ) | 0.00 | 13.87 | 0.1 | 634 | 0.45 | 1.43 | 6 | |||||||||||||||||||||||||||||||||||||||||||||||||||
2010(d) | 14.37 | 0.00 | (b) | 1.70 | 1.70 | (0.03 | ) | (0.46 | ) | (0.49 | ) | 0.00 | 15.58 | 11.8 | 275 | 0.00 | (e)(f) | 1.43 | (f) | 14 | ||||||||||||||||||||||||||||||||||||||||||||||||||
Class A | ||||||||||||||||||||||||||||||||||||||||||||||||||||||||||||||||||||||
2013 | $ | 15.24 | $ | 0.03 | $ | 5.00 | $ | 5.03 | $ | (0.02 | ) | $ | (0.47 | ) | $ | (0.49 | ) | $ | 0.00 | $ | 19.78 | 33.2 | % | $ | 635,817 | 0.18 | % | 1.39 | %(c) | 9 | % | |||||||||||||||||||||||||||||||||||||||
2012 | 13.89 | 0.13 | 2.21 | 2.34 | (0.13 | ) | (0.86 | ) | (0.99 | ) | 0.00 | 15.24 | 17.0 | 494,048 | 0.85 | 1.42 | 3 | |||||||||||||||||||||||||||||||||||||||||||||||||||||
2011 | 15.59 | 0.05 | (0.05 | ) | 0.00 | (b) | (0.05 | ) | (1.65 | ) | (1.70 | ) | 0.00 | 13.89 | 0.1 | 480,414 | 0.29 | 1.43 | 6 | |||||||||||||||||||||||||||||||||||||||||||||||||||
2010 | 12.58 | 0.01 | 3.46 | 3.47 | (0.00 | )(b) | (0.46 | ) | (0.46 | ) | 0.00 | 15.59 | 27.6 | 607,818 | 0.05 | 1.43 | 14 | |||||||||||||||||||||||||||||||||||||||||||||||||||||
2009 | 9.00 | 0.04 | 3.69 | 3.73 | (0.04 | ) | (0.11 | ) | (0.15 | ) | 0.00 | 12.58 | 41.4 | 449,865 | 0.36 | 1.52 | 5 | |||||||||||||||||||||||||||||||||||||||||||||||||||||
Class C | ||||||||||||||||||||||||||||||||||||||||||||||||||||||||||||||||||||||
2013 | $ | 13.37 | $ | (0.09 | ) | $ | 4.37 | $ | 4.28 | — | $ | (0.47 | ) | $ | (0.47 | ) | $ | 0.00 | $ | 17.18 | 32.2 | % | $ | 23,912 | (0.58 | )% | 2.14 | %(c) | 9 | % | ||||||||||||||||||||||||||||||||||||||||
2012 | 12.30 | 0.02 | 1.95 | 1.97 | $ | (0.04 | ) | (0.86 | ) | (0.90 | ) | 0.00 | 13.37 | 16.1 | 8,914 | 0.12 | 2.17 | 3 | ||||||||||||||||||||||||||||||||||||||||||||||||||||
2011 | 14.07 | (0.06 | ) | (0.06 | ) | (0.12 | ) | — | (1.65 | ) | (1.65 | ) | 0.00 | 12.30 | (0.7 | ) | 7,789 | (0.43 | ) | 2.18 | 6 | |||||||||||||||||||||||||||||||||||||||||||||||||
2010 | 11.47 | (0.09 | ) | 3.15 | 3.06 | — | (0.46 | ) | (0.46 | ) | �� | 0.00 | 14.07 | 26.7 | 7,378 | (0.70 | ) | 2.18 | 14 | |||||||||||||||||||||||||||||||||||||||||||||||||||
2009 | 8.25 | (0.04 | ) | 3.37 | 3.33 | — | (0.11 | ) | (0.11 | ) | 0.00 | 11.47 | 40.4 | 6,314 | (0.39 | ) | 2.27 | 5 | ||||||||||||||||||||||||||||||||||||||||||||||||||||
Class I | ||||||||||||||||||||||||||||||||||||||||||||||||||||||||||||||||||||||
2013 | $ | 15.22 | $ | 0.06 | $ | 5.02 | $ | 5.08 | $ | (0.07 | ) | $ | (0.47 | ) | $ | (0.54 | ) | $ | 0.00 | $ | 19.76 | 33.5 | % | $ | 127,347 | 0.32 | % | 1.14 | %(c) | 9 | % | |||||||||||||||||||||||||||||||||||||||
2012 | 13.88 | 0.19 | 2.18 | 2.37 | (0.17 | ) | (0.86 | ) | (1.03 | ) | 0.00 | 15.22 | 17.2 | 20,926 | 1.25 | 1.17 | 3 | |||||||||||||||||||||||||||||||||||||||||||||||||||||
2011 | 15.58 | 0.09 | (0.05 | ) | 0.04 | (0.09 | ) | (1.65 | ) | (1.74 | ) | 0.00 | 13.88 | 0.4 | 8,543 | 0.57 | 1.18 | 6 | ||||||||||||||||||||||||||||||||||||||||||||||||||||
2010 | 12.56 | 0.04 | 3.48 | 3.52 | (0.04 | ) | (0.46 | ) | (0.50 | ) | 0.00 | 15.58 | 28.0 | 8,035 | 0.31 | 1.18 | 14 | |||||||||||||||||||||||||||||||||||||||||||||||||||||
2009 | 8.99 | 0.06 | 3.69 | 3.75 | (0.07 | ) | (0.11 | ) | (0.18 | ) | 0.00 | 12.56 | 41.6 | 4,647 | 0.59 | 1.27 | 5 | |||||||||||||||||||||||||||||||||||||||||||||||||||||
| † | Total return represents aggregate total return of a hypothetical $1,000 investment at the beginning of the period and sold at the end of the period including reinvestment of distributions and does not reflect applicable sales charges. Total return for a period of less than one year is not annualized. |
| (a) | Per share amounts have been calculated using the average shares outstanding method. |
| (b) | Amount represents less than $0.005 per share. |
| (c) | The ratios do not include a reduction of advisory fee on unsupervised assets for the year ended December 31, 2013. Including such advisory fee reduction on unsupervised assets, the ratios of operating expenses to average net assets would have been 1.40% and 1.40% (Class AAA and Class A), 2.15% (Class C), and 1.15% (Class I), respectively. |
| (d) | From the commencement of offering Class AAA Shares on April 30, 2010 through December 31, 2010. |
| (e) | Amount represents less than 0.005%. |
| (f) | Annualized. |
See accompanying notes to financial statements.
11
The Gabelli Value 25 Fund Inc.
Notes to Financial Statements
1. Organization. Effective December 9, 2013, The Gabelli Value Fund Inc. changed its name to The Gabelli Value 25 Fund Inc. with a corresponding change in the name of each of its Classes of Shares. The Fund was incorporated on July 20, 1989 in Maryland. The Fund is a diversified open-end management investment company registered under the Investment Company Act of 1940, as amended (the “1940 Act”). The Fund’s primary objective is long term capital appreciation. The Fund commenced investment operations on September 29, 1989.
2. Significant Accounting Policies. The Fund’s financial statements are prepared in accordance with U.S. Generally Accepted Accounting Principles (“GAAP”), which may require the use of management estimates and assumptions. Actual results could differ from those estimates. The following is a summary of significant accounting policies followed by the Fund in the preparation of its financial statements.
Security Valuation. Portfolio securities listed or traded on a nationally recognized securities exchange or traded in the U.S. over-the-counter market for which market quotations are readily available are valued at the last quoted sale price or a market’s official closing price as of the close of business on the day the securities are being valued. If there were no sales that day, the security is valued at the average of the closing bid and asked prices or, if there were no asked prices quoted on that day, then the security is valued at the closing bid price on that day. If no bid or asked prices are quoted on such day, the security is valued at the most recently available price or, if the Board of Directors (the “Board”) so determines, by such other method as the Board shall determine in good faith to reflect its fair market value. Portfolio securities traded on more than one national securities exchange or market are valued according to the broadest and most representative market, as determined by Gabelli Funds, LLC (the “Adviser”).
Portfolio securities primarily traded on a foreign market are generally valued at the preceding closing values of such securities on the relevant market, but may be fair valued pursuant to procedures established by the Board if market conditions change significantly after the close of the foreign market, but prior to the close of business on the day the securities are being valued. Debt instruments with remaining maturities of sixty days or less that are not credit impaired are valued at amortized cost, unless the Board determines such amount does not reflect the securities’ fair value, in which case these securities will be fair valued as determined by the Board. Debt instruments having a maturity greater than sixty days for which market quotations are readily available are valued at the average of the latest bid and asked prices. If there were no asked prices quoted on such day, the security is valued using the closing bid price. U.S. government obligations with maturities greater than sixty days are normally valued using a model that incorporates market observable data such as reported sales of similar securities, broker quotes, yields, bids, offers, and reference data. Certain securities are valued principally using dealer quotations.
Securities and assets for which market quotations are not readily available are fair valued as determined by the Board. Fair valuation methodologies and procedures may include, but are not limited to: analysis and review of available financial and non-financial information about the company; comparisons with the valuation and changes in valuation of similar securities, including a comparison of foreign securities with the equivalent U.S. dollar value American Depositary Receipt securities at the close of the U.S. exchange; and evaluation of any other information that could be indicative of the value of the security.
Accounting Standards Update (“ASU”) No. 2011-11 (as clarified by ASU No. 2013-01) “Disclosures about Offsetting Assets and Liabilities” requires a fund to disclose both gross information and net information about both instruments
12
The Gabelli Value 25 Fund Inc.
Notes to Financial Statements (Continued)
and transactions eligible for offset in the statement of assets and liabilities and instruments and transactions subject to an agreement similar to a master netting arrangement. The scope of ASU 2011-11 includes derivatives and sale and repurchase agreements. The purpose of ASU 2011-11 is to facilitate comparison of financial statements prepared on the basis of GAAP and on the basis of International Financial Reporting Standards. Management is continually evaluating the implications of ASU 2011-11 and its impact on the financial statements and, at this time, has concluded that ASU 2011-11 is not applicable to the Fund because the Fund does not have investments covered under this guidance.
The inputs and valuation techniques used to measure fair value of the Fund’s investments are summarized into three levels as described in the hierarchy below:
| — | Level 1 — quoted prices in active markets for identical securities; |
| — | Level 2 — other significant observable inputs (including quoted prices for similar securities, interest rates, prepayment speeds, credit risk, etc.); and |
| — | Level 3 — significant unobservable inputs (including the Board’s determinations as to the fair value of investments). |
A financial instrument’s level within the fair value hierarchy is based on the lowest level of any input both individually and in the aggregate that is significant to the fair value measurement. The inputs or methodology used for valuing securities are not necessarily an indication of the risk associated with investing in those securities. The summary of the Fund’s investments in securities by inputs used to value the Fund’s investments as of December 31, 2013 is as follows:
| Valuation Inputs | ||||||||||||||||||||
| Level 1 Quoted Prices | Level 2 Other Significant Observable Inputs | Level 3 Significant Unobservable Inputs | Total Market Value at 12/31/13 | |||||||||||||||||
INVESTMENTS IN SECURITIES: | ||||||||||||||||||||
ASSETS (Market Value): | ||||||||||||||||||||
Common Stocks: | ||||||||||||||||||||
Aerospace | $ | 21,902,187 | — | $ | 131,019 | $ | 22,033,206 | |||||||||||||
Energy and Utilities | 26,717,650 | — | 0 | 26,717,650 | ||||||||||||||||
Other Industries (a) | 704,000,697 | — | — | 704,000,697 | ||||||||||||||||
Total Common Stocks | 752,620,534 | — | 131,019 | 752,751,553 | ||||||||||||||||
U.S. Government Obligations | — | $ | 44,617,278 | — | 44,617,278 | |||||||||||||||
TOTAL INVESTMENTS IN SECURITIES – ASSETS | $ | 752,620,534 | $ | 44,617,278 | $ | 131,019 | $ | 797,368,831 | ||||||||||||
| (a) | Please refer to the Schedule of Investments for the industry classifications of these portfolio holdings. |
The Fund did not have transfers among Level 1, Level 2, and Level 3 during the year ended December 31, 2013. The Fund’s policy is to recognize transfers among Levels as of the beginning of the reporting period.
Additional Information to Evaluate Qualitative Information.
General. The Fund uses recognized industry pricing services – approved by the Board and unaffiliated with the Adviser – to value most of its securities, and uses broker quotes provided by market makers of securities not valued by these and other recognized pricing sources. Several different pricing feeds are received to value domestic equity securities, international equity securities, preferred equity securities, and fixed income securities. The data within these feeds is ultimately sourced from major stock exchanges and trading systems where these
13
The Gabelli Value 25 Fund Inc.
Notes to Financial Statements (Continued)
securities trade. The prices supplied by external sources are checked by obtaining quotations or actual transaction prices from market participants. If a price obtained from the pricing source is deemed unreliable, prices will be sought from another pricing service or from a broker/dealer that trades that security or similar securities.
Fair Valuation. Fair valued securities may be common and preferred equities, warrants, options, rights, and fixed income obligations. Where appropriate, Level 3 securities are those for which market quotations are not available, such as securities not traded for several days, or for which current bids are not available, or which are restricted as to transfer. Among the factors to be considered to fair value a security are recent prices of comparable securities that are publicly traded, reliable prices of securities not publicly traded, the use of valuation models, current analyst reports, valuing the income or cash flow of the issuer, or cost if the preceding factors do not apply. A significant change in the unobservable inputs could result in a lower or higher value in Level 3 securities. The circumstances of Level 3 securities are frequently monitored to determine if fair valuation measures continue to apply.
The Adviser reports quarterly to the Board the results of the application of fair valuation policies and procedures. These include back testing the prices realized in subsequent trades of these fair valued securities to fair values previously recognized.
Foreign Currency Translations. The books and records of the Fund are maintained in U.S. dollars. Foreign currencies, investments, and other assets and liabilities are translated into U.S. dollars at current exchange rates. Purchases and sales of investment securities, income, and expenses are translated at the exchange rate prevailing on the respective dates of such transactions. Unrealized gains and losses that result from changes in foreign exchange rates and/or changes in market prices of securities have been included in unrealized appreciation/depreciation on investments and foreign currency translations. Net realized foreign currency gains and losses resulting from changes in exchange rates include foreign currency gains and losses between trade date and settlement date on investment securities transactions, foreign currency transactions, and the difference between the amounts of interest and dividends recorded on the books of the Fund and the amounts actually received. The portion of foreign currency gains and losses related to fluctuation in exchange rates between the initial purchase trade date and subsequent sale trade date is included in realized gain/(loss) on investments.
Foreign Securities. The Fund may directly purchase securities of foreign issuers. Investing in securities of foreign issuers involves special risks not typically associated with investing in securities of U.S. issuers. The risks include possible revaluation of currencies, the inability to repatriate funds, less complete financial information about companies, and possible future adverse political and economic developments. Moreover, securities of many foreign issuers and their markets may be less liquid and their prices more volatile than securities of comparable U.S. issuers.
Foreign Taxes. The Fund may be subject to foreign taxes on income, gains on investments, or currency repatriation, a portion of which may be recoverable. The Fund will accrue such taxes and recoveries as applicable, based upon its current interpretation of tax rules and regulations that exist in the markets in which it invests.
Restricted Securities. The Fund may invest up to 10% of its net assets in securities for which the markets are restricted. Restricted securities include securities whose disposition is subject to substantial legal or contractual restrictions. The sale of restricted securities often requires more time and results in higher brokerage charges or dealer discounts and other selling expenses than does the sale of securities eligible for trading on national
14
The Gabelli Value 25 Fund Inc.
Notes to Financial Statements (Continued)
securities exchanges or in the over-the-counter markets. Restricted securities may sell at a price lower than similar securities that are not subject to restrictions on resale. Securities freely saleable among qualified institutional investors under special rules adopted by the SEC may be treated as liquid if they satisfy liquidity standards established by the Board. The continued liquidity of such securities is not as well assured as that of publicly traded securities, and accordingly the Board will monitor their liquidity. For the restricted securities the Fund held as of December 31, 2013, refer to the Schedule of Investments.
Securities Transactions and Investment Income. Securities transactions are accounted for on the trade date with realized gain/(loss) on investments determined by using the identified cost method. Interest income (including amortization of premium and accretion of discount) is recorded on the accrual basis. Premiums and discounts on debt securities are amortized using the effective yield to maturity method. Dividend income is recorded on the ex-dividend date, except for certain dividends from foreign securities that are recorded as soon after the ex-dividend date as the Fund becomes aware of such dividends.
Determination of Net Asset Value and Calculation of Expenses. Certain administrative expenses are common to, and allocated among, various affiliated funds. Such allocations are made on the basis of each fund’s average net assets or other criteria directly affecting the expenses as determined by the Adviser pursuant to procedures established by the Board.
In calculating the NAV per share of each class, investment income, realized and unrealized gains and losses, redemption fees, and expenses other than class specific expenses are allocated daily to each class of shares based upon the proportion of net assets of each class at the beginning of each day. Distribution expenses are borne solely by the class incurring the expense.
Custodian Fee Credits and Interest Expense. When cash balances are maintained in the custody account, the Fund receives credits which are used to offset custodian fees. The gross expenses paid under the custody arrangement are included in custodian fees in the Statement of Operations with the corresponding expense offset, if any, shown as “Custodian fee credits.” When cash balances are overdrawn, the Fund is charged an overdraft fee equal to 2.00% above the federal funds rate on outstanding balances. This amount, if any, would be included in the Statement of Operations.
Distributions to Shareholders. Distributions to shareholders are recorded on the ex-dividend date. Distributions to shareholders are based on income and capital gains as determined in accordance with federal income tax regulations, which may differ from income and capital gains as determined under GAAP. These differences are primarily due to differing treatments of income and gains on various investment securities and foreign currency transactions held by the Fund, timing differences, and differing characterizations of distributions made by the Fund. Distributions from net investment income for federal income tax purposes include net realized gains on foreign currency transactions. These book/tax differences are either temporary or permanent in nature. To the extent these differences are permanent, adjustments are made to the appropriate capital accounts in the period when the differences arise. Permanent differences were primarily due to the tax treatment of currency gains and losses and reclassification of capital gain on a passive foreign investment company. These reclassifications have no impact on the NAV of the Fund. For the year ended December 31, 2013, reclassifications were made to increase undistributed net investment income by $15,529 and decrease accumulated net realized loss on investments and foreign currency transactions by $33,693, with an offsetting adjustment to paid-in capital.
15
The Gabelli Value 25 Fund Inc.
Notes to Financial Statements (Continued)
The tax character of distributions paid during the years ended December 31, 2013 and 2012 was as follows:
| Year Ended December 31, 2013 | Year Ended December 31, 2012 | |||||||
Distributions paid from: | ||||||||
Ordinary income (inclusive of short term capital gains) | $ | 1,507,028 | $ | 4,344,013 | ||||
Net long term capital gains | 18,077,385 | 28,220,599 | ||||||
|
|
|
| |||||
Total distributions paid | $ | 19,584,413 | $ | 32,564,612 | ||||
|
|
|
| |||||
Provision for Income Taxes. The Fund intends to continue to qualify as a regulated investment company under Subchapter M of the Internal Revenue Code of 1986, as amended (the “Code”). It is the policy of the Fund to comply with the requirements of the Code applicable to regulated investment companies and to distribute substantially all of its net investment company taxable income and net capital gains. Therefore, no provision for federal income taxes is required.
At December 31, 2013, the components of accumulated earnings/losses on a tax basis were as follows:
Undistributed ordinary income | $ | 226,189 | ||
Net unrealized appreciation on investments and foreign currency translations | 411,808,169 | |||
|
| |||
Total | $ | 412,034,358 | ||
|
|
Under the Regulated Investment Company Modernization Act of 2010, the Fund is permitted to carry forward for an unlimited period capital losses incurred. As a result of the rule, post-enactment capital losses that are carried forward will retain their character as either short term or long term capital losses rather than being considered all short term as under previous law.
At December 31, 2013, the temporary difference between book basis and tax basis net unrealized appreciation on investments was primarily due to deferral of losses from wash sales for tax purposes.
The following summarizes the tax cost of investments and the related net unrealized appreciation at December 31, 2013:
| Cost | Gross Unrealized Appreciation | Gross Unrealized Depreciation | Net Unrealized Appreciation | |||||||||||||
Investments | $ | 385,560,713 | $ | 419,252,874 | $ | (7,444,756 | ) | $ | 411,808,118 | |||||||
The Fund is required to evaluate tax positions taken or expected to be taken in the course of preparing the Fund’s tax returns to determine whether the tax positions are “more-likely-than-not” of being sustained by the applicable tax authority. Income tax and related interest and penalties would be recognized by the Fund as tax expense in the Statement of Operations if the tax positions were deemed not to meet the more-likely-than-not threshold. For the year ended December 31, 2013, the Fund did not incur any income tax, interest, or penalties. As of December 31, 2013, the Adviser has reviewed all open tax years and concluded that there was no impact to the Fund’s net assets or results of operations. Tax years ended December 31, 2010 through December 31, 2013 remain subject to examination by the Internal Revenue Service and state taxing authorities. On an ongoing basis, the Adviser will monitor the Fund’s tax positions to determine if adjustments to this conclusion are necessary.
16
The Gabelli Value 25 Fund Inc.
Notes to Financial Statements (Continued)
3. Investment Advisory Agreement and Other Transactions. The Fund has entered into an investment advisory agreement (the “Advisory Agreement”) with the Adviser which provides that the Fund will pay the Adviser a fee, computed daily and paid monthly, at the annual rate of 1.00% of the value of its average daily net assets. In accordance with the Advisory Agreement, the Adviser provides a continuous investment program for the Fund’s portfolio, oversees the administration of all aspects of the Fund’s business and affairs, and pays the compensation of all Officers and Directors of the Fund who are affiliated persons of the Adviser.
There was a reduction in the advisory fee paid to the Adviser relating to certain portfolio holdings, i.e., unsupervised assets, of the Fund with respect to which the Adviser transferred dispositive and voting control to the Fund’s Proxy Voting Committee. During the year ended December 31, 2013, the Fund’s Proxy Voting Committee exercised control and discretion over all rights to vote or consent with respect to such securities, and the Adviser reduced its fee with respect to such securities by $33,873.
The Fund pays each Director who is not considered an affiliated person an annual retainer of $9,000 plus $2,000 for each Board meeting attended, and they are reimbursed for any out of pocket expenses incurred in attending meetings. All Board committee members receive $500 per meeting attended. The Chairman of the Audit Committee and the Lead Director each receive an annual fee of $2,000 per year. The Chairman of the Nominating Committee and Proxy Voting Committee each receive an annual fee of $2,500. A Director may receive a single meeting fee, allocated among the participating funds, for attending certain meetings held on behalf of multiple funds. Directors who are directors or employees of the Adviser or an affiliated company receive no compensation or expense reimbursement from the Fund.
4. Distribution Plan. The Fund’s Board has adopted a distribution plan (the “Plan”) for each class of shares, except for Class I Shares, pursuant to Rule 12b-1 under the 1940 Act. Under the Class AAA, Class A, and Class C Share Plans, payments are authorized to G.distributors, LLC (the “Distributor”), an affiliate of the Fund, at annual rates of 0.25%, 0.25%, and 1.00%, respectively, of the average daily net assets of those classes, the annual limitations under each Plan. Such payments are accrued daily and paid monthly.
5. Portfolio Securities. Purchases and sales of securities during the year ended December 31, 2013, other than short term securities and U.S. Government obligations, aggregated $103,145,659 and $58,403,886, respectively.
6. Transactions with Affiliates. During the year ended December 31, 2013, the Fund paid brokerage commissions on security trades of $56,507 to G.research, Inc., an affiliate of the Adviser. Additionally, the Distributor retained a total of $50,250 from investors representing commissions (sales charges and underwriting fees) on sales and redemptions of Fund shares.
The cost of calculating the Fund’s NAV per share is a Fund expense pursuant to the Advisory Agreement. During the year ended December 31, 2013, the Fund paid or accrued $45,000 to the Adviser in connection with the cost of computing the Fund’s NAV.
7. Capital Stock. The Fund offers four classes of shares – Class AAA Shares, Class A Shares, Class C Shares, and Class I Shares. Class AAA Shares are offered without a sales charge only to investors who acquire them directly from the Distributor, through selected broker/dealers, or the transfer agent. Class I Shares are offered without a sales charge, solely to certain institutions, directly through the Distributor, or brokers that have entered into selling agreements specifically with respect to Class I Shares. Class A Shares are subject to a maximum
17
The Gabelli Value 25 Fund Inc.
Notes to Financial Statements (Continued)
front-end sales charge of 5.75%. Class C Shares are subject to a 1.00% contingent deferred sales charge for one year after purchase. Class B Shares were fully redeemed and closed on April 25, 2013.
The Fund imposes a redemption fee of 2.00% on all classes of shares that are redeemed or exchanged on or before the seventh day after the date of a purchase. The redemption fee is deducted from the proceeds otherwise payable to the redeeming shareholders and is retained by the Fund as an increase in paid-in capital. The redemption fees retained by the Fund during the years ended December 31, 2013 and 2012 amounted to $3,631 and $1,511, respectively.
Transactions in shares of capital stock were as follows:
| Year Ended December 31, 2013 | Year Ended December 31, 2012 | |||||||||||||||||||
| Shares | Amount | Shares | Amount | |||||||||||||||||
Class AAA | ||||||||||||||||||||
Shares sold | 354,087 | $ | 6,346,255 | 35,116 | $ | 526,378 | ||||||||||||||
Shares issued upon reinvestment of distributions | 8,830 | 165,485 | 4,720 | 71,179 | ||||||||||||||||
Shares redeemed | (77,369 | ) | (1,383,549 | ) | (7,173 | ) | (107,776 | ) | ||||||||||||
|
|
|
|
|
|
|
| |||||||||||||
Net increase | 285,548 | $ | 5,128,191 | 32,663 | $ | 489,781 | ||||||||||||||
|
|
|
|
|
|
|
| |||||||||||||
Class A | ||||||||||||||||||||
Shares sold | 2,686,336 | $ | 46,220,111 | 1,764,709 | $ | 26,711,110 | ||||||||||||||
Shares issued upon reinvestment of distributions | 772,780 | 14,528,234 | 1,896,070 | 28,649,609 | ||||||||||||||||
Shares redeemed | (3,734,054 | ) | (66,865,721 | ) | (5,822,119 | ) | (87,920,056 | ) | ||||||||||||
|
|
|
|
|
|
|
| |||||||||||||
Net decrease | (274,938 | ) | $ | (6,117,376 | ) | (2,161,340 | ) | $ | (32,559,337 | ) | ||||||||||
|
|
|
|
|
|
|
| |||||||||||||
Class B* | ||||||||||||||||||||
Shares sold | — | — | 2,675 | $ | 37,727 | |||||||||||||||
Shares issued upon reinvestment of distributions | — | — | 673 | 8,921 | ||||||||||||||||
Shares redeemed | (11,402 | ) | $ | (168,343 | ) | (44,078 | ) | (578,222 | ) | |||||||||||
|
|
|
|
|
|
|
| |||||||||||||
Net decrease | (11,402 | ) | $ | (168,343 | ) | (40,730 | ) | $ | (531,574 | ) | ||||||||||
|
|
|
|
|
|
|
| |||||||||||||
Class C | ||||||||||||||||||||
Shares sold | 761,048 | $ | 11,974,119 | 114,405 | $ | 1,530,380 | ||||||||||||||
Shares issued upon reinvestment of distributions | 28,650 | 468,147 | 34,866 | 462,331 | ||||||||||||||||
Shares redeemed | (64,589 | ) | (1,004,507 | ) | (115,625 | ) | (1,547,798 | ) | ||||||||||||
|
|
|
|
|
|
|
| |||||||||||||
Net increase | 725,109 | $ | 11,437,759 | 33,646 | $ | 444,913 | ||||||||||||||
|
|
|
|
|
|
|
| |||||||||||||
Class I | ||||||||||||||||||||
Shares sold | 5,277,469 | $ | 95,183,630 | 990,796 | $ | 14,936,898 | ||||||||||||||
Shares issued upon reinvestment of distributions | 166,158 | 3,122,100 | 79,120 | 1,194,715 | ||||||||||||||||
Shares redeemed | (375,046 | ) | (6,787,448 | ) | (311,123 | ) | (4,705,997 | ) | ||||||||||||
|
|
|
|
|
|
|
| |||||||||||||
Net increase | 5,068,581 | $ | 91,518,282 | 758,793 | $ | 11,425,616 | ||||||||||||||
|
|
|
|
|
|
|
| |||||||||||||
| * | Class B Shares were fully redeemed and closed on April 25, 2013. |
8. Indemnifications. The Fund enters into contracts that contain a variety of indemnifications. The Fund’s maximum exposure under these arrangements is unknown. However, the Fund has not had prior claims or losses pursuant to these contracts. Management has reviewed the Fund’s existing contracts and expects the risk of loss to be remote.
9. Other Matters. On April 24, 2008, the Adviser entered into a settlement with the SEC to resolve an inquiry regarding prior frequent trading in shares of the GAMCO Global Growth Fund (the “Global Growth Fund”) by one investor who was banned from the Global Growth Fund in August 2002. Under the terms of the settlement,
18
The Gabelli Value 25 Fund Inc.
Notes to Financial Statements (Continued)
the Adviser, without admitting or denying the SEC’s findings and allegations, paid $16 million (which included a $5 million civil monetary penalty). On the same day, the SEC filed a civil action in the U.S. District Court for the Southern District of New York against the Executive Vice President and Chief Operating Officer of the Adviser, alleging violations of certain federal securities laws arising from the same matter. The officer, who also is an officer of the Global Growth Fund and other funds in the Gabelli/GAMCO complex, including this Fund, denies the allegations and is continuing in his positions with the Adviser and the funds. The settlement by the Adviser did not have, and the resolution of the action against the officer is not expected to have, a material adverse impact on the Adviser or its ability to fulfill its obligations under the Advisory Agreement.
10. Subsequent Events. Management has evaluated the impact on the Fund of all subsequent events occurring through the date the financial statements were issued and has determined that there were no subsequent events requiring recognition or disclosure in the financial statements.
19
The Gabelli Value 25 Fund Inc.
Report of Independent Registered Public Accounting Firm
To the Board of Directors and Shareholders of
The Gabelli Value 25 Fund Inc.:
In our opinion, the accompanying statement of assets and liabilities, including the schedule of investments, and the related statements of operations and of changes in net assets and the financial highlights present fairly, in all material respects, the financial position of The Gabelli Value 25 Fund Inc. (formerly The Gabelli Value Fund Inc.) (hereafter referred to as the “Fund”) at December 31, 2013, the results of its operations for the year then ended, the changes in its net assets for each of the two years in the period then ended and the financial highlights for each of the five years in the period then ended, in conformity with accounting principles generally accepted in the United States of America. These financial statements and financial highlights (hereafter referred to as “financial statements”) are the responsibility of the Fund’s management. Our responsibility is to express an opinion on these financial statements based on our audits. We conducted our audits of these financial statements in accordance with the standards of the Public Company Accounting Oversight Board (United States). Those standards require that we plan and perform the audit to obtain reasonable assurance about whether the financial statements are free of material misstatement. An audit includes examining, on a test basis, evidence supporting the amounts and disclosures in the financial statements, assessing the accounting principles used and significant estimates made by management, and evaluating the overall financial statement presentation. We believe that our audits, which included confirmation of securities at December 31, 2013 by correspondence with the custodian and brokers, provide a reasonable basis for our opinion.
PricewaterhouseCoopers LLP
New York, New York
February 24, 2014
20
The Gabelli Value 25 Fund Inc.
Additional Fund Information (Unaudited)
The business and affairs of the Fund are managed under the direction of the Fund’s Board of Directors. Information pertaining to the Directors and officers of the Fund is set forth below. The Fund’s Statement of Additional Information includes additional information about the Fund’s Directors and is available without charge, upon request, by calling 800-GABELLI (800-422-3554) or by writing to The Gabelli Value 25 Fund Inc. at One Corporate Center, Rye, NY 10580-1422.
Name, Position(s) Address1 and Age | Term of Office | Number of Funds | Principal Occupation(s) | Other Directorships Held by Director4 | ||||
INTERESTED DIRECTORS3 : | ||||||||
Mario J. Gabelli, CFA Director and Chief Investment Officer Age: 71 | Since 1989 | 27 | Chairman, Chief Executive Officer, Chief Investment Officer–Value Portfolios of GAMCO Investors, Inc., and Chief Investment Officer– Value Portfolios of Gabelli Funds, LLC and GAMCO Asset Management Inc.; Director/ Trustee or Chief Investment Officer of other registered investment companies in the Gabelli/ GAMCO Funds Complex; Chief Executive Officer of GGCP, Inc. | Director of Morgan Group Holdings, Inc. (holding company); Chairman of the Board and Chief Executive Officer of LICT Corp. (multimedia and communication services); Director of CIBL, Inc. (broadcasting and wireless communications); Director of ICTC Group, Inc. (communications); Director of RLJ Acquisition Inc. (blank check company)(2011-2012) | ||||
INDEPENDENT DIRECTORS5 : | ||||||||
Anthony J. Colavita Director Age: 78 | Since 1989 | 36 | President of the law firm of Anthony J. Colavita, P.C. | — | ||||
Robert J. Morrissey Director Age: 74 | Since 1989 | 6 | Partner in the law firm of Morrissey, Hawkins & Lynch | — | ||||
Anthony R. Pustorino Director Age: 88 | Since 1989 | 13 | Certified Public Accountant; Professor Emeritus, Pace University | Director of The LGL Group, Inc. (diversified manufacturing) (2002-2010) | ||||
Werner J. Roeder, MD Director Age: 73 | Since 2001 | 23 | Medical Director of Lawrence Hospital and practicing private physician | — | ||||
21
The Gabelli Value 25 Fund Inc.
Additional Fund Information (Continued) (Unaudited)
Name, Position(s) Address1 and Age | Term of Office and Length of Time Served2 | Principal Occupation(s) During Past Five Years | ||
OFFICERS: | ||||
Bruce N. Alpert President Age: 62 | Since 2003 | Executive Vice President and Chief Operating Officer of Gabelli Funds, LLC since 1988; Officer of registered investment companies in the Gabelli/GAMCO Funds Complex; Director of Teton Advisors, Inc. 1998-2012; Chairman of Teton Advisors, Inc. 2008-2010; President of Teton Advisors, Inc. 1998-2008; Senior Vice President of GAMCO Investors, Inc. since 2008 | ||
Andrea R. Mango Secretary Age: 41 | Since November 2013 | Counsel of Gabelli Funds, LLC; Corporate Vice President within the Corporate Compliance Department of New York Life Insurance Company 2011-2013; Vice President and Counsel of Deutsche Bank 2006-2011 | ||
Agnes Mullady Treasurer Age: 55 | Since 2006 | President and Chief Operating Officer of the Open-End Fund Division of Gabelli Funds, LLC since September 2010; Senior Vice President of GAMCO Investors, Inc. since 2009; Vice President of Gabelli Funds, LLC since 2007; Officer of all of the registered investment companies in the Gabelli/GAMCO Funds Complex | ||
Richard J. Walz Chief Compliance Officer Age: 54 | Since November 2013 | Chief Compliance Officer of the Gabelli/GAMCO Funds Complex; Chief Compliance Officer of AEGON USA Investment Management LLC 2011-2013; Chief Compliance Officer of Cutwater Asset Management 2004-2011 | ||
| 1 | Address: One Corporate Center, Rye, NY 10580-1422, unless otherwise noted. |
| 2 | Each Director will hold office for an indefinite term until the earliest of (i) the next meeting of shareholders, if any, called for the purpose of considering the election or re-election of such Director and until the election and qualification of his or her successor, if any, elected at such meeting, or (ii) the date a Director resigns or retires, or a Director is removed by the Board of Directors or shareholders, in accordance with the Fund’s By-Laws and Articles of Incorporation. Each officer will hold office for an indefinite term until the date he or she resigns or retires or until his or her successor is elected and qualified. |
| 3 | “Interested person” of the Fund as defined in the 1940 Act. Mr. Gabelli is considered an “interested person” because of his affiliation with Gabelli Funds, LLC which acts as the Fund’s investment adviser. |
| 4 | This column includes only directorships of companies required to report to the SEC under the Securities Exchange Act of 1934, as amended, i.e., public companies, or other investment companies registered under the 1940 Act. |
| 5 | Directors who are not interested persons are considered “Independent” Directors. |
22
THE GABELLI VALUE 25 FUND INC.
One Corporate Center
Rye, NY 10580-1422
Portfolio Management Team Biographies
Mario J. Gabelli, CFA, is Chairman and Chief Executive Officer of GAMCO Investors, Inc. that he founded in 1977 and Chief Investment Officer – Value Portfolios of Gabelli Funds, LLC and GAMCO Asset Management Inc. Mr. Gabelli is a summa cum laude graduate of Fordham University and holds an MBA degree from Columbia Business School and Honorary Doctorates from Fordham University and Roger Williams University.
Christopher J. Marangi joined Gabelli in 2003 as a research analyst. He currently serves as a portfolio manager of Gabelli Funds, LLC and manages several funds within the Gabelli/GAMCO Funds Complex. Mr. Marangi graduated magna cum laude and Phi Beta Kappa with a BA in Political Economy from Williams College and holds an MBA with honors from Columbia Business School.
2013 TAX NOTICE TO SHAREHOLDERS (Unaudited)
For the year ended December 31, 2013, the Fund paid to shareholders ordinary income distributions (comprised of net investment income and short term capital gains) totaling $0.051, $0.033, $0.013, and $0.079 per share for Class AAA, Class A, Class C, and Class I Shares, respectively, and long term capital gains totaling $18,077,385, or the maximum allowable. The distribution of long term capital gains has been designated as a capital gain dividend by the Fund’s Board of Directors. For the year ended December 31, 2013, 100% of the ordinary income distribution qualifies for the dividends received deduction available to corporations. The Fund designates 100% of the ordinary income distribution as qualified dividend income pursuant to the Jobs and Growth Tax Relief Reconciliation Act of 2003. The Fund designates 0.21% of the ordinary income distribution as qualified interest income pursuant to the Tax Relief, Unemployment Reauthorization, and Job Creation Act of 2010.
U.S. Government Income
The percentage of the ordinary income distribution paid by the Fund during 2013 which was derived from U.S. Treasury securities was 0.10%. Such income is exempt from state and local tax in all states. However, many states, including New York and California, allow a tax exemption for a portion of the income earned only if a mutual fund has invested at least 50% of its assets at the end of each quarter of the Fund’s fiscal year in U.S. Government securities. The Fund did not meet this strict requirement in 2013. The percentage of U.S. Government securities held as of December 31, 2013 was 5.62%. Due to the diversity in state and local tax law, it is recommended that you consult your personal tax adviser as to the applicability of the information provided to your specific situation.
All designations are based on financial information available as of the date of this annual report and, accordingly, are subject to change. For each item, it is the intention of the Fund to designate the maximum amount permitted under the Internal Revenue Code and the regulations thereunder.
We have separated the portfolio managers’ commentary from the financial statements and investment portfolio due to corporate governance regulations stipulated by the Sarbanes-Oxley Act of 2002. We have done this to ensure that the content of the portfolio managers’ commentary is unrestricted. Both the commentary and the financial statements, including the portfolio of investments, will be available on our website at www.gabelli.com.
THE GABELLI VALUE 25 FUND INC.
One Corporate Center
Rye, New York 10580-1422
t 800-GABELLI (800-422-3554)
f 914-921-5118
e info@gabelli.com
GABELLI.COM
Net Asset Value per share available daily
by calling 800-GABELLI after 7:00 P.M.
BOARD OF DIRECTORS | OFFICERS | |
| Mario J. Gabelli, CFA | Bruce N. Alpert | |
| Chairman and | President | |
| Chief Executive Officer, | ||
| GAMCO Investors, Inc. | Andrea R. Mango | |
| Secretary | ||
| Anthony J. Colavita | ||
| President, | Agnes Mullady | |
| Anthony J. Colavita, P.C. | Treasurer | |
| Robert J. Morrissey | Richard J. Walz | |
| Partner, | Chief Compliance Officer | |
| Morrissey, Hawkins & Lynch | ||
DISTRIBUTOR | ||
| Anthony R. Pustorino | G.distributors, LLC | |
| Certified Public Accountant, | ||
| Professor Emeritus, | CUSTODIAN | |
| Pace University | The Bank of New York | |
| Mellon | ||
| Werner J. Roeder, MD | ||
| Medical Director, | TRANSFER AGENT AND | |
| Lawrence Hospital | DIVIDEND DISBURSING | |
AGENT | ||
| State Street Bank and Trust | ||
| Company | ||
LEGAL COUNSEL | ||
| Paul Hastings LLP | ||
This report is submitted for the general information of the shareholders of The Gabelli Value 25 Fund Inc. It is not authorized for distribution to prospective investors unless preceded or accompanied by an effective prospectus.
GAB409Q413AR

Item 2. Code of Ethics.
| (a) | The registrant, as of the end of the period covered by this report, has adopted a code of ethics that applies to the registrant’s principal executive officer, principal financial officer, principal accounting officer or controller, or persons performing similar functions, regardless of whether these individuals are employed by the registrant or a third party. |
| (c) | There have been no amendments, during the period covered by this report, to a provision of the code of ethics that applies to the registrant’s principal executive officer, principal financial officer, principal accounting officer or controller, or persons performing similar functions, regardless of whether these individuals are employed by the registrant or a third party, and that relates to any element of the code of ethics description. |
| (d) | The registrant has not granted any waivers, including an implicit waiver, from a provision of the code of ethics that applies to the registrant’s principal executive officer, principal financial officer, principal accounting officer or controller, or persons performing similar functions, regardless of whether these individuals are employed by the registrant or a third party, that relates to one or more of the items set forth in paragraph (b) of this item’s instructions. |
Item 3. Audit Committee Financial Expert.
As of the end of the period covered by the report, the registrant’s Board of Directors has determined that Anthony R. Pustorino is qualified to serve as an audit committee financial expert serving on its audit committee and that he is “independent,” as defined by Item 3 of Form N-CSR.
Item 4. Principal Accountant Fees and Services.
Audit Fees
| (a) | The aggregate fees billed for each of the last two fiscal years for professional services rendered by the principal accountant for the audit of the registrant’s annual financial statements or services that are normally provided by the accountant in connection with statutory and regulatory filings or engagements for those fiscal years are $38,867 for 2012 and $40,616 for 2013. |
Audit-Related Fees
| (b) | The aggregate fees billed in each of the last two fiscal years for assurance and related services by the principal accountant that are reasonably related to the performance of the audit of the registrant’s financial statements and are not reported under paragraph (a) of this Item are $0 for 2012 and $0 for 2013. |
Tax Fees
| (c) | The aggregate fees billed in each of the last two fiscal years for professional services rendered by the principal accountant for tax compliance, tax advice, and tax planning are $3,625 for 2012 and $3,770 for 2013. Tax fees represent tax compliance services provided in connection with the review of the Registrant’s tax returns. |
All Other Fees
| (d) | The aggregate fees billed in each of the last two fiscal years for products and services provided by the principal accountant, other than the services reported in paragraphs (a) through (c) of this Item are $0 for 2012 and $0 for 2013. |
| (e)(1) | Disclose the audit committee’s pre-approval policies and procedures described in paragraph (c)(7) of Rule 2-01 of Regulation S-X. |
Pre-Approval Policies and Procedures. The Audit Committee (“Committee”) of the registrant is responsible for pre-approving (i) all audit and permissible non-audit services to be provided by the independent registered public accounting firm to the registrant and (ii) all permissible non-audit services to be provided by the independent registered public accounting firm to the Adviser, Gabelli Funds, LLC, and any affiliate of Gabelli Funds, LLC (“Gabelli”) that provides services to the registrant (a “Covered Services Provider”) if the independent registered public accounting firm’s engagement related directly to the operations and financial reporting of the registrant. The Committee may delegate its responsibility to pre-approve any such audit and permissible non-audit services to the Chairperson of the Committee, and the Chairperson must report to the Committee, at its next regularly scheduled meeting after the Chairperson’s pre-approval of such services, his or her decision(s). The Committee may also establish detailed pre-approval policies and procedures for pre-approval of such services in accordance with applicable laws, including the delegation of some or all of the Committee’s pre-approval responsibilities to the other persons (other than Gabelli or the registrant’s officers). Pre-approval by the Committee of any permissible non-audit services is not required so long as: (i) the permissible non-audit services were not recognized by the registrant at the time of the engagement to be non-audit services; and (ii) such services are promptly brought to the attention of the Committee and approved by the Committee or Chairperson prior to the completion of the audit.
| (e)(2) | The percentage of services described in each of paragraphs (b) through (d) of this Item that were approved by the audit committee pursuant to paragraph (c)(7)(i)(C) of Rule 2-01 of Regulation S-X are as follows: |
(b) N/A
(c) 100%
(d) N/A
| (f) | The percentage of hours expended on the principal accountant’s engagement to audit the registrant’s financial statements for the most recent fiscal year that were attributed to work performed by persons other than the principal accountant’s full-time, permanent employees was 0%. |
| (g) | The aggregate non-audit fees billed by the registrant’s accountant for services rendered to the registrant, and rendered to the registrant’s investment adviser (not including any sub-adviser whose role is primarily portfolio management and is subcontracted with or overseen by another investment adviser), and any entity controlling, controlled by, or under common control with the adviser that provides ongoing services to the registrant for each of the last two fiscal years of the registrant was $0 for 2012 and $0 for 2013. |
| (h) | The registrant’s audit committee of the board of directors has considered whether the provision of non-audit services that were rendered to the registrant’s investment adviser (not including any sub-adviser whose role is primarily portfolio management and is subcontracted with or overseen by another investment adviser), and any entity controlling, controlled by, or under common control with the investment adviser that provides ongoing services to the registrant that were not pre-approved pursuant to paragraph (c)(7)(ii) of Rule 2-01 of Regulation S-X is compatible with maintaining the principal accountant’s independence. |
Item 5. Audit Committee of Listed registrants.
Not applicable.
Item 6. Investments.
| (a) | Schedule of Investments in securities of unaffiliated issuers as of the close of the reporting period is included as part of the report to shareholders filed under Item 1 of this form. |
| (b) | Not applicable. |
| Item 7. | Disclosure of Proxy Voting Policies and Procedures for Closed-End Management Investment Companies. |
Not applicable.
| Item 8. | Portfolio Managers of Closed-End Management Investment Companies. |
Not applicable.
| Item 9. | Purchases of Equity Securities by Closed-End Management Investment Company and Affiliated Purchasers. |
Not applicable.
Item 10. Submission of Matters to a Vote of Security Holders.
There have been no material changes to the procedures by which the shareholders may recommend nominees to the registrant’s Board of Directors, where those changes were implemented after the registrant last provided disclosure in response to the requirements of Item 407(c)(2)(iv) of Regulation S-K (17 CFR 229.407) (as required by Item 22(b)(15) of Schedule 14A (17 CFR 240.14a-101)), or this Item.
Item 11. Controls and Procedures.
| (a) | The registrant’s principal executive and principal financial officers, or persons performing similar functions, have concluded that the registrant’s disclosure controls and procedures (as defined in Rule 30a-3(c) under the Investment Company Act of 1940, as amended (the “1940 Act”) (17 CFR 270.30a-3(c))) are effective, as of a date within 90 days of the filing date of the report that includes the disclosure required by this paragraph, based on their evaluation of these controls and procedures required by Rule 30a-3(b) under the 1940 Act (17 CFR 270.30a-3(b)) and Rules 13a-15(b) or 15d-15(b) under the Securities Exchange Act of 1934, as amended (17 CFR 240.13a-15(b) or 240.15d-15(b)). |
| (b) | There were no changes in the registrant’s internal control over financial reporting (as defined in Rule 30a-3(d) under the 1940 Act (17 CFR 270.30a-3(d)) that occurred during the registrant’s second fiscal quarter of the period covered by this report that has materially affected, or is reasonably likely to materially affect, the registrant’s internal control over financial reporting. |
Item 12. Exhibits.
| (a)(1) | Code of ethics, or any amendment thereto, that is the subject of disclosure required by Item 2 is attached hereto. |
| (a)(2) | Certifications pursuant to Rule 30a-2(a) under the 1940 Act and Section 302 of the Sarbanes-Oxley Act of 2002 are attached hereto. |
| (a)(3) | Not applicable. |
| (b) | Certifications pursuant to Rule 30a-2(b) under the 1940 Act and Section 906 of the Sarbanes- Oxley Act of 2002 are attached hereto. |
(12.other) Not applicable.
SIGNATURES
Pursuant to the requirements of the Securities Exchange Act of 1934 and the Investment Company Act of 1940, the registrant has duly caused this report to be signed on its behalf by the undersigned, thereunto duly authorized.
| (Registrant) | The Gabelli Value 25 Fund Inc. (Formerly, The Gabelli Value Fund Inc.) |
| By (Signature and Title)* | /s/ Bruce N. Alpert | |
| Bruce N. Alpert, Principal Executive Officer | ||
| Date | 3/6/2014 |
Pursuant to the requirements of the Securities Exchange Act of 1934 and the Investment Company Act of 1940, this report has been signed below by the following persons on behalf of the registrant and in the capacities and on the dates indicated.
| By (Signature and Title)* | /s/ Bruce N. Alpert | |
| Bruce N. Alpert, Principal Executive Officer |
| Date | 3/6/2014 | |
| By (Signature and Title)* | /s/ Agnes Mullady | |
| Agnes Mullady, Principal Financial Officer and Treasurer | ||
| Date | 3/6/2014 | |
* Print the name and title of each signing officer under his or her signature.