UNITED STATES
SECURITIES AND EXCHANGE COMMISSION
Washington, D.C. 20549
FORMN-CSR
CERTIFIED SHAREHOLDER REPORT OF REGISTERED MANAGEMENT
INVESTMENT COMPANIES
Investment Company Act file number 811-05848
The Gabelli Value 25 Fund Inc.
(Exact name of registrant as specified in charter)
One Corporate Center
Rye, New York 10580-1422
(Address of principal executive offices) (Zip code)
Bruce N. Alpert
Gabelli Funds, LLC
One Corporate Center
Rye, New York 10580-1422
(Name and address of agent for service)
Registrant’s telephone number, including area code: 1-800-422-3554
Date of fiscal year end: December 31
Date of reporting period: December 31, 2018
FormN-CSR is to be used by management investment companies to file reports with the Commission not later than 10 days after the transmission to stockholders of any report that is required to be transmitted to stockholders under Rule30e-1 under the Investment Company Act of 1940 (17 CFR270.30e-1). The Commission may use the information provided on FormN-CSR in its regulatory, disclosure review, inspection, and policymaking roles.
A registrant is required to disclose the information specified by FormN-CSR, and the Commission will make this information public. A registrant is not required to respond to the collection of information contained in FormN-CSR unless the Form displays a currently valid Office of Management and Budget (“OMB”) control number. Please direct comments concerning the accuracy of the information collection burden estimate and any suggestions for reducing the burden to Secretary, Securities and Exchange Commission, 450 Fifth Street, NW, Washington, DC 20549-0609. The OMB has reviewed this collection of information under the clearance requirements of 44 U.S.C. § 3507.
Item 1. Reports to Stockholders.
The Report to Shareholders is attached herewith.
The Gabelli Value 25 Fund Inc.
Annual Report — December 31, 2018
(Y)our Portfolio Management Team
 |  | |||||
| Mario J. Gabelli, CFA | Christopher J. Marangi | |||||
| Chief Investment Officer | Co-Chief Investment Officer | |||||
BA, Williams College MBA, Columbia Business School | ||||||
To Our Shareholders,
For the year ended December 31, 2018, the net asset value (NAV) per Class A Share of The Gabelli Value 25 Fund Inc. decreased 8.2% compared with decreases of 4.4% and 3.5% for the Standard & Poor’s (S&P) 500 Index and the Dow Jones Industrial Average, respectively. Other classes of shares are available. See page 3 for performance information for all classes of shares.
Enclosed are the financial statements, including the schedule of investments, as of December 31, 2018.
Performance Discussion (Unaudited)
The investment objective of the Fund is to provide long term capital appreciation.
The Fund’s investment strategy is to invest primarily in equity securities of companies that Gabelli Funds, LLC (the Adviser) believes are undervalued and have the potential to achieve significant capital appreciation, overweighting its core 25 equity positions. The Adviser invests in companies whose securities are selling at a significant discount to their private market value (PMV). PMV is the value the Adviser believes informed investors would be willing to pay to acquire the entire company. If investor attention is focused on the underlying asset value of a company due to expected or actual developments or other catalysts, an investment opportunity to realize this PMV may exist. The Fund may invest in companies of any size and from time to time may invest a greater portion in companies with large, medium, or small market capitalizations.
Beginning on January 1, 2021, as permitted by regulations adopted by the Securities and Exchange Commission, paper copies of the Fund’s annual and semiannual shareholder reports will no longer be sent by mail, unless you specifically request paper copies of the reports. Instead, the reports will be made available on the Fund’s website (www.gabelli.com), and you will be notified by mail each time a report is posted and provided with a website link to access the report. If you already elected to receive shareholder reports electronically, you will not be affected by this change and you need not take any action. To elect to receive all future reports in paper free of charge, please contact your financial intermediary, or, if you invest directly with the Fund, you may call 800-422-3554 or send an email request to info@gabelli.com.
In selecting investments, the Adviser also considers the market price of the issuer’s securities, its balance sheet characteristics, and the perceived strength of its management. The Fund’s assets will be invested primarily in common stock. Many of the common stocks the Fund will buy will not pay dividends. These stocks will be bought for the potential that their prices will increase, providing capital appreciation for the Fund. The value of equity securities will fluctuate due to many factors, including the past and predicted earnings of the issuer, the quality of the issuer’s management, general market conditions, and the forecasts for the issuer’s industry and the value of the issuer’s assets.
January 2018 saw the stock market continue its nearly uninterrupted climb, but volatility finally returned with a sharp decline in February and continued choppiness in March, leading to major averages posting their first quarterly declines since 2015. Economic fundamentals continued to be largely positive – synchronous global growth, low unemployment, corporate profits boosted by tax reform and lower personal taxes for many Americans – but a new set of worries came to the fore for investors already uneasy about stretched valuations: trade wars, regulatory risks in the technology sector, and the U.S. Federal Reserve’s gradual liquidity reduction and interest rate policy.
During the second quarter of 2018, markets recouped first quarter losses to finish the first half of the year modestly higher. Economic indicators, including the lowest unemployment rate since 2000, remained favorable. The Federal Reserve’s program of interest rate normalization was back on track after two interest rate hikes earlier in the year. The market appeared to handle the strong trade rhetoric from the Trump administration.
Markets continued to charge ahead in the third quarter, with the S&P 500 again setting record highs in late September. Financial and economic data continued to support the rally: U.S. second quarter GDP growth registered 4.2%, the unemployment rate fell to a 49 year low at 3.7% in September, and corporate profits soared, with growth of over 16%.
During the fourth quarter of 2018, the stock market suffered a major pullback, with the S&P 500 Index down over 13% on a total return basis. That weak showing pushed the S&P 500 down for the full year after a very strong showing in 2017, leading to a negative impact on the Fund.
Among the better performing stocks for the year was Madison Square Garden Co. (5.3% of net assets as of December 31, 2018). The stock increased in the second quarter when it was announced that the company is exploring a spinoff to create a separate public company for its sports teams. Twenty-First Century Fox (3.5%), a diversified media company with operations in cable network television, television broadcasting, and filmed entertainment, also aided in the performance of the portfolio. The stock benefited from a bidding war between Disney and Comcast over its cable, international, and entertainment assets. Sony Corp. (6.1%) continues to operate in the video game segment, adding virtual reality to its lineup of products that it offers. Sony’s entertainment sector, Sony Pictures, benefited from a handful of films that performed well in the box office in 2018.
Our weakest performer was CBS Corp. (6.4%). Going into the second half of the year, CBS and its parent company, National Amusements, were in a legal battle with National Amusements trying to oust the CBS board members and CBS trying to cut National Amusement’s voting power to less than 20%. CBS was also unsuccessful in closing the re-merger deal with Viacom in 2018. Viacom Inc. (5.2%) saw declining profits as it struggled to stay abreast of bigger competitors like Disney and Comcast, and still has a substantial amount of debt on its balance sheet. Dish Network Corp. (1.1%) provides service to approximately 13.3 million pay TV subscribers and continues to be impacted by increased competition from over the top content video offerings.
Thank you for your investment in The Gabelli Value 25 Fund.
We appreciate your confidence and trust.
2
Comparative Results
Average Annual Returns through December 31, 2018 (a) (Unaudited) | ||||||||||||||||||||
| 1 Year | 5 Year | 10 Year | 15 Year | Since Inception (9/29/89) | ||||||||||||||||
Class A (GABVX) | (8.25 | )% | 1.21 | % | 11.57 | % | 5.98 | % | 9.55 | % | ||||||||||
With sales charge (b) | (13.52 | ) | 0.02 | 10.91 | 5.57 | 9.33 | ||||||||||||||
S&P 500 Index | (4.38 | ) | 8.49 | 13.12 | 7.77 | 9.28 | ||||||||||||||
Dow Jones Industrial Average | (3.50 | ) | 9.65 | 13.11 | 8.17 | 10.34 | ||||||||||||||
Nasdaq Composite Index | (2.80 | ) | 11.05 | 16.85 | 9.56 | 10.21 | ||||||||||||||
Class AAA (GVCAX) | (8.16 | ) | 1.23 | 11.58 | 5.99 | 9.56 | ||||||||||||||
Class C (GVCCX) | (8.91 | ) | 0.45 | 10.73 | 5.19 | 9.04 | ||||||||||||||
With contingent deferred sales charge (c) | (9.82 | ) | 0.45 | 10.73 | 5.19 | 9.04 | ||||||||||||||
Class I (GVCIX) | (7.79 | ) | 1.55 | 11.89 | 6.21 | 9.68 | ||||||||||||||
In the current prospectuses dated April 30, 2018, the gross expense ratios for Class AAA, A, C, and I Shares are 1.41%, 1.41%, 2.16%, and 1.16% respectively, and the net expense ratios for these share classes after contractual reimbursements by Gabelli Funds, LLC, (the Adviser) are 1.41%, 1.41%, 2.16%, and 1.00%, respectively. See page 10 for the expense ratios for the year ended December 31, 2018. Class AAA and Class I Shares do not have a sales charge. The maximum sales charge for Class A and Class C Shares is 5.75% and 1.00%, respectively.
| (a) | Returns represent past performance and do not guarantee future results. Total returns and average annual returns reflect changes in share price, reinvestment of distributions, and are net of expenses. Investment returns and the principal value of an investment will fluctuate. When shares are redeemed, they may be worth more or less than their original cost. Current performance may be lower or higher than the performance data presented. Visit www.gabelli.com for performance information as of the most recent month end. Returns would have been lower had the Adviser not reimbursed certain expenses of the Fund. The Fund imposes a 2% redemption fee on shares sold or exchanged within seven days of purchase. Investors should carefully consider the investment objectives, risks, charges, and expenses of the Fund before investing. The prospectuses contain information about these and other matters and should be read carefully before investing. To obtain a prospectus, please visit our website at www.gabelli.com.The Class A Share NAVs are used to calculate performance for the periods prior to the issuance of Class AAA Shares on April 30, 2010, Class C Shares on March 15, 2000, and Class I Shares on January 11, 2008. The actual performance of the Class C Shares would have been lower due to the additional fees and expenses associated with this class of shares. The actual performance of the Class AAA Shares and Class I Shares would have been higher due to lower expenses associated with these classes of shares. The S&P 500 Index is a market capitalization weighted index of 500 large capitalization stocks commonly used to represent the U.S. equity market. The Dow Jones Industrial Average and the Nasdaq Composite Index are unmanaged indicators of stock market performance. Dividends are considered reinvested, except for the Nasdaq Composite Index. You cannot invest directly in an index. |
| (b) | Performance results include the effect of the maximum 5.75% sales charge at the beginning of the period. |
| (c) | Assuming payment of the 1% maximum contingent deferred sales charge imposed on redemptions made within one year of purchase. |
COMPARISON OF CHANGE IN VALUE OF A $10,000 INVESTMENT IN
THE GABELLI VALUE 25 FUND INC. (CLASS A SHARES) AND S&P 500 INDEX (Unaudited)
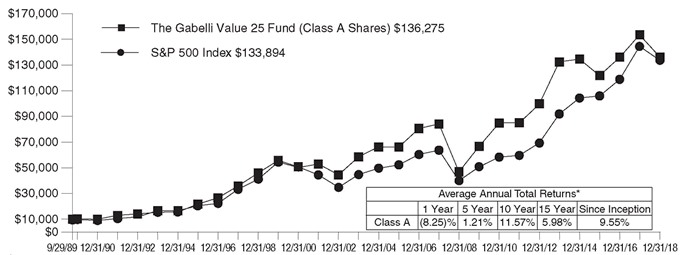
| * | Past performance is not predictive of future results. The performance tables and graph do not reflect the deduction of taxes that a shareholder would pay on Fund distributions or the redemption of Fund shares. |
3
| The Gabelli Value 25 Fund Inc. | ||||||||
| Disclosure of Fund Expenses (Unaudited) | ||||||||
| For the Six Month Period from July 1, 2018 through December 31, 2018 |
| Expense Table
|
| |||||
We believe it is important for you to understand the impact of fees and expenses regarding your investment. All mutual funds have operating expenses. As a shareholder of a fund, you incur ongoing costs, which include costs for portfolio management, administrative services, and shareholder reports (like this one), among others. Operating expenses, which are deducted from a fund’s gross income, directly reduce the investment return of a fund. When a fund’s expenses are expressed as a percentage of its average net assets, this figure is known as the expense ratio. The following examples are intended to help you understand the ongoing costs (in dollars) of investing in your Fund and to compare these costs with those of other mutual funds. The examples are based on an investment of $1,000 made at the beginning of the period shown and held for the entire period.
The Expense Table below illustrates your Fund’s costs in two ways:
Actual Fund Return:This section provides information about actual account values and actual expenses. You may use this section to help you to estimate the actual expenses that you paid over the period after any fee waivers and expense reimbursements. The “Ending Account Value” shown is derived from the Fund’sactualreturn during the past six months, and the “Expenses Paid During Period” shows the dollar amount that would have been paid by an investor who started with $1,000 in the Fund. You may use this information, together with the amount you invested, to estimate the expenses that you paid over the period.
To do so, simply divide your account value by $1,000 (for example, an $8,600 account value divided by $1,000 = 8.6), then multiply the result by the number given for your Fund under the heading “Expenses Paid During Period” to estimate the expenses you paid during this period.
Hypothetical 5% Return:This section provides information about hypothetical account values and hypothetical expenses based on the Fund’s actual expense
ratio. It assumes a hypothetical annualized return of 5% before expenses during the period shown. In this case – because the hypothetical return used isnotthe Fund’s actual return – the results do not apply to your investment and you cannot use the hypothetical account value and expense to estimate the actual ending account balance or expenses you paid for the period. This example is useful in making comparisons of the ongoing costs of investing in the Fund and other funds. To do so, compare this 5% hypothetical example with the 5% hypothetical examples that appear in shareholder reports of other funds.
Please note that the expenses shown in the table are meant to highlight your ongoing costs only and do not reflect any transactional costs such as sales charges (loads), redemption fees, or exchange fees, if any, which would be described in the Prospectus. If these costs were applied to your account, your costs would be higher. Therefore, the 5% hypothetical return is useful in comparing ongoing costs only, and will not help you determine the relative total costs of owning different funds. The “Annualized Expense Ratio” represents the actual expenses for the last six months and may be different from the expense ratio in the Financial Highlights which is for the fiscal year ended December 31, 2018.
| Beginning Account Value 07/01/18 | Ending Account Value 12/31/18 | Annualized Expense Ratio | Expenses Paid During Period* | |||||||||||||||
The Gabelli Value 25 Fund Inc. |
| |||||||||||||||||
Actual Fund Return |
| |||||||||||||||||
Class AAA | $1,000.00 | $ 903.70 | 1.45% | $ 6.96 | ||||||||||||||
Class A | $1,000.00 | $ 902.90 | 1.45% | $ 6.95 | ||||||||||||||
Class C | $1,000.00 | $ 899.70 | 2.20% | $10.53 | ||||||||||||||
Class I | $1,000.00 | $ 905.70 | 1.00% | $ 4.80 | ||||||||||||||
Hypothetical 5% Return |
| |||||||||||||||||
Class AAA | $1,000.00 | $1,017.90 | 1.45% | $ 7.37 | ||||||||||||||
Class A | $1,000.00 | $1,017.90 | 1.45% | $ 7.37 | ||||||||||||||
Class C | $1,000.00 | $1,014.12 | 2.20% | $11.17 | ||||||||||||||
Class I | $1,000.00 | $1,020.16 | 1.00% | $ 5.09 | ||||||||||||||
| * | Expenses are equal to the Fund’s annualized expense ratio for the last six months multiplied by the average account value over the period, multiplied by the number of days in the most recent fiscal half year (184 days), then divided by 365. |
4
Summary of Portfolio Holdings (Unaudited)
The following table presents portfolio holdings as a percent of net assets as of December 31, 2018:
The Gabelli Value 25 Fund Inc.
Entertainment | 17.1 | % | ||
Broadcasting | 10.0 | % | ||
Financial Services | 9.8 | % | ||
Cable and Satellite | 7.3 | % | ||
Electronics | 6.4 | % | ||
Food and Beverage | 5.9 | % | ||
Environmental Services | 5.8 | % | ||
Diversified Industrial | 5.1 | % | ||
Consumer Products | 4.8 | % | ||
Metals and Mining | 4.0 | % | ||
Automotive: Parts and Accessories | 3.6 | % | ||
Energy and Utilities | 3.2 | % | ||
Aerospace | 3.1 | % | ||
Machinery | 2.3 | % | ||
Business Services | 2.2 | % | ||
Hotels and Gaming | 2.1 | % |
Equipment and Supplies | 1.6 | % | ||
Specialty Chemicals | 1.2 | % | ||
Telecommunications | 1.1 | % | ||
Automotive | 1.0 | % | ||
Wireless Communications | 0.9 | % | ||
Communications Equipment | 0.8 | % | ||
Building and Construction | 0.7 | % | ||
Computer Software and Services | 0.6 | % | ||
Real Estate | 0.6 | % | ||
Consumer Services | 0.3 | % | ||
Other Assets and Liabilities (Net) | (1.5 | )% | ||
|
| |||
| 100.0 | % | |||
|
|
The Fund files a complete schedule of portfolio holdings with the Securities and Exchange Commission (the SEC) for the first and third quarters of each fiscal year on Form N-Q. Shareholders may obtain this information at www.gabelli.com or by calling the Fund at 800-GABELLI (800-422-3554). The Fund’s Form N-Q is available on the SEC’s website at www.sec.gov and may also be reviewed and copied at the SEC’s Public Reference Room in Washington, DC. Information on the operation of the Public Reference Room may be obtained by calling 800-SEC-0330.
Proxy Voting
The Fund files Form N-PX with its complete proxy voting record for the twelve months ended June 30, no later than August 31 of each year. A description of the Fund’s proxy voting policies, procedures, and how the Fund voted proxies relating to portfolio securities is available without charge, upon request, by (i) calling 800-GABELLI (800-422-3554); (ii) writing to The Gabelli Funds at One Corporate Center, Rye, NY 10580-1422; or (iii) visiting the SEC’s website at www.sec.gov.
5
The Gabelli Value 25 Fund Inc.
Schedule of Investments — December 31, 2018
Shares | Cost | Market | ||||||||||
| COMMON STOCKS — 101.5% |
| |||||||||||
| Aerospace — 3.1% |
| |||||||||||
| 259,000 | Aerojet Rocketdyne Holdings Inc.† | $ | 1,823,312 | $ | 9,124,570 | |||||||
| 140,000 | Rolls-Royce Holdings plc | 1,048,237 | 1,481,085 | |||||||||
| 9,890,000 | Rolls-Royce Holdings plc, Cl. C†(a) | 12,744 | 12,606 | |||||||||
|
|
|
| |||||||||
| 2,884,293 | 10,618,261 | |||||||||||
|
|
|
| |||||||||
| Automotive — 1.0% | ||||||||||||
| 135,000 | Navistar International Corp.† | 3,589,654 | 3,503,250 | |||||||||
|
|
|
| |||||||||
| Automotive: Parts and Accessories — 3.6% |
| |||||||||||
| 50,000 | Garrett Motion Inc.† | 651,142 | 617,000 | |||||||||
| 89,000 | Genuine Parts Co. | 2,039,498 | 8,545,780 | |||||||||
| 8,500 | O’Reilly Automotive Inc.† | 1,096,767 | 2,926,805 | |||||||||
|
|
|
| |||||||||
| 3,787,407 | 12,089,585 | |||||||||||
|
|
|
| |||||||||
| Broadcasting — 10.0% |
| |||||||||||
| 496,000 | CBS Corp., Cl. A, Voting | 9,118,223 | 21,749,600 | |||||||||
| 7,000 | Liberty Broadband Corp., Cl. A† | 314,951 | 502,670 | |||||||||
| 62,000 | Liberty Broadband Corp., Cl. C† | 1,513,032 | 4,465,860 | |||||||||
| 90,000 | Liberty Media Corp.- Liberty SiriusXM, Cl. C† | 125,724 | 3,328,200 | |||||||||
| 166,000 | MSG Networks Inc., Cl. A† | 76,944 | 3,910,960 | |||||||||
|
|
|
| |||||||||
| 11,148,874 | 33,957,290 | |||||||||||
|
|
|
| |||||||||
| Building and Construction — 0.7% |
| |||||||||||
| 76,000 | Johnson Controls International plc | 1,367,432 | 2,253,400 | |||||||||
|
|
|
| |||||||||
| Business Services — 2.2% |
| |||||||||||
| 80,000 | Macquarie Infrastructure Corp. | 2,408,086 | 2,924,800 | |||||||||
| 24,000 | Mastercard Inc., Cl. A | 493,639 | 4,527,600 | |||||||||
|
|
|
| |||||||||
| 2,901,725 | 7,452,400 | |||||||||||
|
|
|
| |||||||||
| Cable and Satellite — 7.3% |
| |||||||||||
| 79,000 | AMC Networks Inc., Cl. A† | 0 | 4,335,520 | |||||||||
| 127,000 | Comcast Corp., Cl. A | 1,778,941 | 4,324,350 | |||||||||
| 150,000 | DISH Network Corp., Cl. A† | 3,396,621 | 3,745,500 | |||||||||
| 84,000 | EchoStar Corp., Cl. A† | 2,087,613 | 3,084,480 | |||||||||
| 190,000 | Liberty Global plc, Cl. A† | 3,714,060 | 4,054,600 | |||||||||
| 45,000 | Liberty Global plc, Cl. C† | 448,934 | 928,800 | |||||||||
| 84,000 | Rogers Communications Inc., Cl. B | 296,707 | 4,305,840 | |||||||||
|
|
|
| |||||||||
| 11,722,876 | 24,779,090 | |||||||||||
|
|
|
| |||||||||
| Communications Equipment — 0.8% |
| |||||||||||
| 70,000 | Loral Space & Communications Inc.† | 3,534,456 | 2,607,500 | |||||||||
|
|
|
| |||||||||
| Computer Software and Services — 0.6% |
| |||||||||||
| 155,000 | Hewlett Packard Enterprise Co. | 2,123,644 | 2,047,550 | |||||||||
|
|
|
| |||||||||
| Consumer Products — 4.8% |
| |||||||||||
| 37,000 | Edgewell Personal Care Co.† | 642,285 | 1,381,950 | |||||||||
Shares | Cost | Market | ||||||||||
| 29,000 | Energizer Holdings Inc. | $ | 176,947 | $ | 1,309,350 | |||||||
| 345,000 | Swedish Match AB | 5,014,425 | 13,589,098 | |||||||||
|
|
|
| |||||||||
| 5,833,657 | 16,280,398 | |||||||||||
|
|
|
| |||||||||
| Consumer Services — 0.3% |
| |||||||||||
| 55,000 | Qurate Retail Inc.† | 450,644 | 1,073,600 | |||||||||
|
|
|
| |||||||||
| Diversified Industrial — 5.1% |
| |||||||||||
| 35,000 | Ampco-Pittsburgh Corp.† | 175,012 | 108,500 | |||||||||
| 95,000 | Crane Co. | 2,460,920 | 6,857,100 | |||||||||
| 79,000 | Honeywell International Inc. | 1,750,218 | 10,437,480 | |||||||||
|
|
|
| |||||||||
| 4,386,150 | 17,403,080 | |||||||||||
|
|
|
| |||||||||
| Electronics — 6.4% |
| |||||||||||
| 49,000 | Resideo Technologies Inc.† | 807,963 | 1,006,950 | |||||||||
| 430,000 | Sony Corp., ADR | 7,342,263 | 20,760,400 | |||||||||
|
|
|
| |||||||||
| 8,150,226 | 21,767,350 | |||||||||||
|
|
|
| |||||||||
| Energy and Utilities — 3.2% |
| |||||||||||
| 200,000 | GenOn Energy Inc., Escrow†(a) | 0 | 0 | |||||||||
| 213,000 | National Fuel Gas Co. | 9,406,084 | 10,901,340 | |||||||||
|
|
|
| |||||||||
| 9,406,084 | 10,901,340 | |||||||||||
|
|
|
| |||||||||
| Entertainment — 17.1% |
| |||||||||||
| 40,000 | Discovery Inc., Cl. A† | 369,758 | 989,600 | |||||||||
| 183,000 | Discovery Inc., Cl. C† | 2,715,303 | 4,223,640 | |||||||||
| 185,000 | Grupo Televisa SAB, ADR | 1,766,140 | 2,327,300 | |||||||||
| 16,000 | Liberty Media Corp.- Liberty Braves, Cl. A† | 266,393 | 399,040 | |||||||||
| 106,040 | Liberty Media Corp.- Liberty Braves, Cl. C† | 1,823,546 | 2,639,336 | |||||||||
| 67,600 | The Madison Square Garden Co., Cl. A† | 486,234 | 18,096,520 | |||||||||
| 162,000 | Twenty-First Century Fox Inc., Cl. A | 2,037,939 | 7,795,440 | |||||||||
| 87,000 | Twenty-First Century Fox Inc., Cl. B | 2,987,331 | 4,156,860 | |||||||||
| 634,000 | Viacom Inc., Cl. A | 18,976,593 | 17,631,540 | |||||||||
|
|
|
| |||||||||
| 31,429,237 | 58,259,276 | |||||||||||
|
|
|
| |||||||||
| Environmental Services — 5.8% |
| |||||||||||
| 198,400 | Republic Services Inc. | 2,547,185 | 14,302,656 | |||||||||
| 75,000 | Waste Connections Inc. | 2,413,526 | 5,568,750 | |||||||||
|
|
|
| |||||||||
| 4,960,711 | 19,871,406 | |||||||||||
|
|
|
| |||||||||
| Equipment and Supplies — 1.6% |
| |||||||||||
| 100,000 | CIRCOR International Inc.† | 1,229,799 | 2,130,000 | |||||||||
| 90,000 | Flowserve Corp. | 528,443 | 3,421,800 | |||||||||
|
|
|
| |||||||||
| 1,758,242 | 5,551,800 | |||||||||||
|
|
|
| |||||||||
| Financial Services — 9.8% |
| |||||||||||
| 135,000 | American Express Co. | 3,486,049 | 12,868,200 | |||||||||
| 100,000 | H&R Block Inc. | 1,886,510 | 2,537,000 | |||||||||
| 65,000 | Legg Mason Inc. | 1,527,353 | 1,658,150 | |||||||||
See accompanying notes to financial statements.
6
The Gabelli Value 25 Fund Inc.
Schedule of Investments (Continued) — December 31, 2018
Shares | Cost | Market Value | ||||||||||
| COMMON STOCKS (Continued) |
| |||||||||||
| Financial Services (Continued) |
| |||||||||||
| 260,000 | The Bank of New York Mellon Corp. | $ | 8,207,226 | $ | 12,238,200 | |||||||
| 90,000 | Wells Fargo & Co. | 2,798,711 | 4,147,200 | |||||||||
|
|
|
| |||||||||
| 17,905,849 | 33,448,750 | |||||||||||
|
|
|
| |||||||||
| Food and Beverage — 5.9% |
| |||||||||||
| 91,000 | Diageo plc, ADR | 3,414,903 | 12,903,800 | |||||||||
| 34,500 | Fomento Economico Mexicano SAB de CV, ADR | 398,586 | 2,968,725 | |||||||||
| 103,000 | Mondelēz International Inc., Cl. A | 2,781,568 | 4,123,090 | |||||||||
|
|
|
| |||||||||
| 6,595,057 | 19,995,615 | |||||||||||
|
|
|
| |||||||||
| Hotels and Gaming — 2.1% |
| |||||||||||
| 105,500 | Ryman Hospitality Properties Inc., REIT | 2,885,859 | 7,035,795 | |||||||||
|
|
|
| |||||||||
| Machinery — 2.3% |
| |||||||||||
| 183,744 | CNH Industrial NV | 1,331,785 | 1,692,282 | |||||||||
| 110,000 | CNH Industrial NV, Borsa Italiana | 990,523 | 989,104 | |||||||||
| 75,000 | Xylem Inc. | 1,698,078 | 5,004,000 | |||||||||
|
|
|
| |||||||||
| 4,020,386 | 7,685,386 | |||||||||||
|
|
|
| |||||||||
| Metals and Mining — 4.0% |
| |||||||||||
| 397,000 | Newmont Mining Corp. | 7,903,568 | 13,756,050 | |||||||||
|
|
|
| |||||||||
| Real Estate — 0.6% |
| |||||||||||
| 62,000 | Griffin Industrial Realty Inc. | 1,066,792 | 1,977,800 | |||||||||
|
|
|
| |||||||||
Shares | Cost | Market | ||||||||||
| Specialty Chemicals — 1.2% |
| |||||||||||
| 20,000 | Ashland Global Holdings Inc. | $ | 1,180,714 | $ | 1,419,200 | |||||||
| 19,000 | International Flavors & Fragrances Inc. | 1,501,989 | 2,551,130 | |||||||||
|
|
|
| |||||||||
| 2,682,703 | 3,970,330 | |||||||||||
|
|
|
| |||||||||
| Telecommunications — 1.1% |
| |||||||||||
| 115,700 | Telephone & Data Systems Inc. | 2,573,103 | 3,764,878 | |||||||||
|
|
|
| |||||||||
| Wireless Communications — 0.6% |
| |||||||||||
| 60,000 | United States Cellular Corp.† | 2,637,144 | 3,118,200 | |||||||||
|
|
|
| |||||||||
| TOTAL COMMON STOCKS | 157,705,773 | 345,169,380 | ||||||||||
|
|
|
| |||||||||
| TOTAL INVESTMENTS — 101.5% | $ | 157,705,773 | 345,169,380 | |||||||||
|
| |||||||||||
| Other Assets and Liabilities (Net) — (1.5)% |
| (5,192,748 | ) | |||||||||
|
| |||||||||||
| NET ASSETS — 100.0% |
| $ | 339,976,632 | |||||||||
|
| |||||||||||
| (a) | Security is valued using significant unobservable inputs and is classified as Level 3 in the fair value hierarchy. |
| † | Non-income producing security. |
| ADR | American Depositary Receipt |
| REIT | Real Estate Investment Trust |
See accompanying notes to financial statements.
7
The Gabelli Value 25 Fund Inc.
Statement of Assets and Liabilities
December 31, 2018
Assets: | ||||
Investments, at value (cost $157,705,773) | $ | 345,169,380 | ||
Receivable for investments sold | 833,667 | |||
Receivable for Fund shares sold | 17,665 | |||
Receivable from Adviser | 10,650 | |||
Dividends receivable | 842,809 | |||
Prepaid expenses | 25,842 | |||
|
| |||
Total Assets | 346,900,013 | |||
|
| |||
Liabilities: | ||||
Payable to custodian | 4,162,797 | |||
Payable for investments purchased | 40,260 | |||
Payable for Fund shares redeemed | 2,158,408 | |||
Payable for investment advisory fees | 308,770 | |||
Payable for distribution fees | 70,461 | |||
Payable for accounting fees | 7,500 | |||
Other accrued expenses | 175,185 | |||
|
| |||
Total Liabilities | 6,923,381 | |||
|
| |||
Net Assets | ||||
(applicable to 26,402,036 shares outstanding) | $ | 339,976,632 | ||
|
| |||
Net Assets Consist of: | ||||
Paid-in capital | $ | 154,142,392 | ||
Total distributable earnings(a) | 185,834,240 | |||
|
| |||
Net Assets | $ | 339,976,632 | ||
|
|
Shares of Capital Stock, each at $0.001 par value: |
| |||
Class AAA: | ||||
Net Asset Value, offering, and redemption price per share ($3,773,894 ÷ 292,421 shares outstanding; 50,000,000 shares authorized) | $12.91 | |||
|
| |||
Class A: | ||||
Net Asset Value and redemption price per share ($281,612,740 ÷ 21,725,520 shares outstanding; 100,000,000 shares authorized) | $12.96 | |||
|
| |||
Maximum offering price per share (NAV ÷ 0.9425, based on maximum sales charge of 5.75% of the offering price) | $13.75 | |||
|
| |||
Class C: | ||||
Net Asset Value and offering price per share ($6,528,043 ÷ 665,828 shares outstanding; 50,000,000 shares authorized) | $ 9.80 | (b) | ||
|
| |||
Class I: | ||||
Net Asset Value, offering, and redemption price per share ($48,061,955 ÷ 3,718,267 shares outstanding; 50,000,000 shares authorized) | $12.93 | |||
|
| |||
| (a) | Effective December 31, 2018, the Fund has adopted disclosure requirements conforming to SEC Rule 6-04.17 of Regulation S-X and discloses total distributable earnings. See Note 2 for further details. |
| (b) | Redemption price varies based on the length of time held. |
Statement of Operations
For the Year Ended December 31, 2018
Investment Income: | ||||
Dividends (net of foreign withholding taxes of $292,502) | $ | 5,987,621 | ||
Interest | 38,473 | |||
|
| |||
Total Investment Income | 6,026,094 | |||
|
| |||
Expenses: | ||||
Investment advisory fees | 4,107,722 | |||
Distribution fees - Class AAA | 10,515 | |||
Distribution fees - Class A | 854,816 | |||
Distribution fees - Class C | 74,074 | |||
Distribution fees - Class T | 1 | |||
Shareholder services fees | 264,002 | |||
Shareholder communications expenses | 106,672 | |||
Legal and audit fees | 101,997 | |||
Directors’ fees | 94,500 | |||
Registration expenses | 80,111 | |||
Custodian fees | 54,948 | |||
Accounting fees | 45,000 | |||
Interest expense | 424 | |||
Miscellaneous expenses | 30,179 | |||
|
| |||
Total Expenses | 5,824,961 | |||
|
| |||
Less: | ||||
Expense reimbursements (See Note 3) | (107,706 | ) | ||
Expenses paid indirectly by broker (See Note 6) | (4,186 | ) | ||
Custodian fee credits | (178 | ) | ||
|
| |||
Total Reimbursements and and Credits | (112,070 | ) | ||
|
| |||
Net Expenses | 5,712,891 | |||
|
| |||
Net Investment Income | 313,203 | |||
|
| |||
Net Realized and Unrealized Gain/(Loss) on Investments and Foreign Currency: | ||||
Net realized gain on investments | 33,220,526 | |||
Net realized loss on foreign currency transactions | (3,738 | ) | ||
|
| |||
Net realized gain on investments and foreign currency transactions | 33,216,788 | |||
|
| |||
Net change in unrealized appreciation/depreciation: | ||||
on investments | (63,975,003 | ) | ||
on foreign currency translations | (14,759 | ) | ||
|
| |||
Net change in unrealized appreciation/depreciation on investments and foreign currency translations | (63,989,762 | ) | ||
|
| |||
Net Realized and Unrealized Gain/(Loss) on Investments and Foreign Currency | (30,772,974 | ) | ||
|
| |||
Net Decrease in Net Assets Resulting from Operations | $ | (30,459,771 | ) | |
|
|
See accompanying notes to financial statements.
8
The Gabelli Value 25 Fund Inc.
Statement of Changes in Net Assets
| Year Ended December 31, 2018 | Year Ended December 31, 2017 | |||||||
Operations: | ||||||||
Net investment income | $ 313,203 | $ 560,928 | ||||||
Net realized gain on investments and foreign currency transactions | 33,216,788 | 30,334,810 | ||||||
Net change in unrealized appreciation/depreciation on investments and foreign currency translations | (63,989,762 | ) | 23,958,654 | |||||
|
|
|
| |||||
Net Increase/(Decrease) in Net Assets Resulting from Operations | (30,459,771 | ) | 54,854,392 | |||||
|
|
|
| |||||
Distributions to Shareholders: | ||||||||
Accumulated earnings | ||||||||
Class AAA | (300,525 | ) | (292,797 | ) | ||||
Class A | (25,249,673 | ) | (23,731,406 | ) | ||||
Class C | (745,412 | ) | (666,142 | ) | ||||
Class I | (4,463,121 | ) | (4,120,881 | ) | ||||
Class T* | — | (67 | ) | |||||
|
|
|
| |||||
Total Distributions to Shareholders(a) | (30,758,731 | ) | (28,811,293 | )(b) | ||||
|
|
|
| |||||
Capital Share Transactions: | ||||||||
Class AAA | (144,439 | ) | 211,262 | |||||
Class A | (30,365,984 | ) | (46,819,852 | ) | ||||
Class C | (526,197 | ) | (3,303,351 | ) | ||||
Class I | (3,944,470 | ) | 11,148,820 | |||||
Class T* | (1,118 | ) | 1,068 | |||||
|
|
|
| |||||
Net Decrease in Net Assets from Capital Share Transactions | (34,982,208 | ) | (38,762,053 | ) | ||||
|
|
|
| |||||
Redemption Fees | 7 | 110 | ||||||
|
|
|
| |||||
Net Decrease in Net Assets | (96,200,703 | ) | (12,718,844 | ) | ||||
Net Assets: | ||||||||
Beginning of year | 436,177,335 | 448,896,179 | ||||||
|
|
|
| |||||
End of year | $339,976,632 | $436,177,335 | ||||||
|
|
|
| |||||
| (a) | Effective December 31, 2018, the Fund has adopted disclosure requirements conforming to SEC Rule 6-04.17 of Regulation S-X. See Note 2 for further details. |
| (b) | For the year ended December 31, 2017, the distributions to shareholders from net investment income were $4,232 (Class AAA), $281,247 (Class A), $290,730 (Class I) and $2 (Class T*) and net realized gain were $288,565 (Class AAA), $23,450,159 (Class A), $666,142 (Class C), $3,830,151 (Class I) and $65 (Class T*). |
| * | Class T Shares were liquidated on September 21, 2018. |
See accompanying notes to financial statements.
9
The Gabelli Value 25 Fund Inc.
Financial Highlights
Selected data for a share of capital stock outstanding throughout each year:
| Income (Loss) from Investment Operations | Distributions | Ratios to Average Net Assets / Supplemental Data | ||||||||||||||||||||||||||||||||||||||||||||||||||||||
Year Ended | Net Asset Value, Beginning of Year | Net Investment Income (Loss)(a) | Net Realized and Unrealized Gain (Loss) on Investments | Total from Investment Operations | Net Investment Income | Net Realized Gain on Investments | Total Distributions | Redemption Fees (a)(b) | Net Asset Value, End of Year | Total Return† | Net Assets, End of Year (in 000’s) | Net Investment Income (Loss) | Operating Expenses Before Reimbursements | Operating Expenses Net of Reimbursements | Portfolio Turnover Rate | |||||||||||||||||||||||||||||||||||||||||
Class AAA |
| |||||||||||||||||||||||||||||||||||||||||||||||||||||||
2018 | $15.41 | $ 0.00 | (b) | $(1.27 | ) | $(1.27 | ) | $ 0.00 | (b) | $(1.23 | ) | $(1.23 | ) | $0.00 | $12.91 | (8.2 | )% | $ 3,774 | 0.03 | % | 1.44% | 1.44%(c) | 2 | % | ||||||||||||||||||||||||||||||||
2017 | 14.61 | 0.01 | 1.85 | 1.86 | (0.02 | ) | (1.04 | ) | (1.06 | ) | 0.00 | 15.41 | 12.7 | 4,542 | 0.09 | 1.41 | 1.41(c) | 2 | ||||||||||||||||||||||||||||||||||||||
2016 | 14.07 | 0.07 | 1.57 | 1.64 | (0.07 | ) | (1.03 | ) | (1.10 | ) | 0.00 | 14.61 | 11.6 | 4,103 | 0.48 | 1.40 | 1.40(c) | 2 | ||||||||||||||||||||||||||||||||||||||
2015 | 18.23 | 0.01 | (1.72 | ) | (1.71 | ) | (0.01 | ) | (2.44 | ) | (2.45 | ) | — | 14.07 | (9.5 | ) | 4,492 | 0.05 | 1.39 | 1.39(c) | 3 | |||||||||||||||||||||||||||||||||||
2014 | 19.71 | 0.02 | 0.34 | 0.36 | (0.03 | ) | (1.81 | ) | (1.84 | ) | 0.00 | 18.23 | 1.7 | 7,321 | 0.12 | 1.38 | 1.38 | 23 | ||||||||||||||||||||||||||||||||||||||
Class A |
| |||||||||||||||||||||||||||||||||||||||||||||||||||||||
2018 | $15.48 | $ 0.00 | (b) | $(1.29 | ) | $(1.29 | ) | $ 0.00 | (b) | $(1.23 | ) | $(1.23 | ) | $0.00 | $12.96 | (8.2 | )% | $281,613 | 0.03 | % | 1.44% | 1.44%(c) | 2 | % | ||||||||||||||||||||||||||||||||
2017 | 14.66 | 0.01 | 1.86 | 1.87 | (0.01 | ) | (1.04 | ) | (1.05 | ) | 0.00 | 15.48 | 12.8 | 362,729 | 0.09 | 1.41 | 1.41(c) | 2 | ||||||||||||||||||||||||||||||||||||||
2016 | 14.12 | 0.07 | 1.57 | 1.64 | (0.07 | ) | (1.03 | ) | (1.10 | ) | 0.00 | 14.66 | 11.6 | 386,700 | 0.48 | 1.40 | 1.40(c) | 2 | ||||||||||||||||||||||||||||||||||||||
2015 | 18.29 | 0.01 | (1.73 | ) | (1.72 | ) | (0.01 | ) | (2.44 | ) | (2.45 | ) | — | 14.12 | (9.5 | ) | 427,905 | 0.07 | 1.39 | 1.39(c) | 3 | |||||||||||||||||||||||||||||||||||
2014 | 19.78 | 0.02 | 0.33 | 0.35 | (0.03 | ) | (1.81 | ) | (1.84 | ) | 0.00 | 18.29 | 1.6 | 563,876 | 0.11 | 1.38 | 1.38 | 23 | ||||||||||||||||||||||||||||||||||||||
Class C |
| |||||||||||||||||||||||||||||||||||||||||||||||||||||||
2018 | $12.12 | $(0.09 | ) | $(1.00 | ) | $(1.09 | ) | — | $(1.23 | ) | $(1.23 | ) | $0.00 | $9.80 | (8.9 | )% | $ 6,528 | (0.72 | )% | 2.19% | 2.19%(c) | 2 | % | |||||||||||||||||||||||||||||||||
2017 | 11.77 | (0.08 | ) | 1.47 | 1.39 | — | (1.04 | ) | (1.04 | ) | 0.00 | 12.12 | 11.8 | 8,351 | (0.67 | ) | 2.16 | 2.16(c) | 2 | |||||||||||||||||||||||||||||||||||||
2016 | 11.55 | (0.03 | ) | 1.28 | 1.25 | — | (1.03 | ) | (1.03 | ) | 0.00 | 11.77 | 10.8 | 11,171 | (0.27 | ) | 2.15 | 2.15(c) | 2 | |||||||||||||||||||||||||||||||||||||
2015 | 15.55 | (0.10 | ) | (1.46 | ) | (1.56 | ) | — | (2.44 | ) | (2.44 | ) | — | 11.55 | (10.2 | ) | 13,317 | (0.69 | ) | 2.14 | 2.14(c) | 3 | ||||||||||||||||||||||||||||||||||
2014 | 17.18 | (0.11 | ) | 0.29 | 0.18 | — | (1.81 | ) | (1.81 | ) | 0.00 | 15.55 | 0.9 | 19,395 | (0.64 | ) | 2.13 | 2.13 | 23 | |||||||||||||||||||||||||||||||||||||
Class I |
| |||||||||||||||||||||||||||||||||||||||||||||||||||||||
2018 | $15.45 | $ 0.07 | $(1.28 | ) | $(1.21 | ) | $(0.08 | ) | $(1.23 | ) | $(1.31 | ) | $0.00 | $12.93 | (7.8 | )% | $ 48,062 | 0.47 | % | 1.19% | 1.00%(c)(d) | 2 | % | |||||||||||||||||||||||||||||||||
2017 | 14.64 | 0.08 | 1.85 | 1.93 | (0.08 | ) | (1.04 | ) | (1.12 | ) | 0.00 | 15.45 | 13.2 | 60,554 | 0.50 | 1.16 | 1.00(c)(d) | 2 | ||||||||||||||||||||||||||||||||||||||
2016 | 14.10 | 0.12 | 1.57 | 1.69 | (0.12 | ) | (1.03 | ) | (1.15 | ) | 0.00 | 14.64 | 11.9 | 46,922 | 0.79 | 1.15 | 1.13(c)(d) | 2 | ||||||||||||||||||||||||||||||||||||||
2015 | 18.28 | 0.05 | (1.73 | ) | (1.68 | ) | (0.06 | ) | (2.44 | ) | (2.50 | ) | — | 14.10 | (9.3 | ) | 64,336 | 0.28 | 1.14 | 1.14(c) | 3 | |||||||||||||||||||||||||||||||||||
2014 | 19.76 | 0.07 | 0.34 | 0.41 | (0.08 | ) | (1.81 | ) | (1.89 | ) | 0.00 | 18.28 | 2.0 | 138,916 | 0.33 | 1.13 | 1.13 | 23 | ||||||||||||||||||||||||||||||||||||||
| † | Total return represents aggregate total return of a hypothetical $1,000 investment at the beginning of the year and sold at the end of the year including reinvestment of distributions and does not reflect the applicable sales charges. |
| (a) | Per share amounts have been calculated using the average shares outstanding method. |
| (b) | Amount represents less than $0.005 per share. |
| (c) | The Fund received credits from a designated broker who agreed to pay certain Fund operating expenses. For the years ended December 31, 2018, 2017, 2016, and 2015, there was no impact on the expense ratios. |
| (d) | Under an expense reimbursement agreement with the Adviser, the Adviser reimbursed certain Class I expenses to the Fund. For the years ended December 31, 2018, 2017, and 2016, these reimbursements amounted to $107,706, $87,199, and $11,790, respectively. |
See accompanying notes to financial statements.
10
The Gabelli Value 25 Fund Inc.
Notes to Financial Statements
1. Organization.The Gabelli Value 25 Fund Inc. was incorporated on July 20, 1989 in Maryland and commenced investment operations on September 29, 1989. The Fund is a diversified open-end management investment company registered under the Investment Company Act of 1940, as amended (the 1940 Act). The Fund’s primary objective is long term capital appreciation.
2. Significant Accounting Policies.As an investment company, the Fund follows the investment company accounting and reporting guidance, which is part of U.S. generally accepted accounting principles (GAAP) that may require the use of management estimates and assumptions in the preparation of its financial statements. Actual results could differ from those estimates. The following is a summary of significant accounting policies followed by the Fund in the preparation of its financial statements.
New Accounting Pronouncements.The SEC recently adopted changes to Regulation S-X to simplify the reporting of information by registered investment companies in financial statements. The amendments require presentation of the total, rather than the components, of distributable earnings on the Statement of Assets and Liabilities and also require presentation of the total, rather than the components, of distributions to shareholders, except for tax return of capital distributions, if any, on the Statement of Changes in Net Assets. The amendments also removed the requirement for parenthetical disclosure of undistributed net investment income on the Statement of Changes in Net Assets. These Regulation S-X amendments are reflected in the Fund’s financial statements for the year ended December 31, 2018. As a result of adopting these amendments, the distributions to shareholders in the December 31, 2017 Statement of Changes in Net Assets presented herein have been reclassified to conform to the current year presentation.
To improve the effectiveness of fair value disclosure requirements, the Financial Accounting Standards Board recently issued Accounting Standard Update (ASU) 2018-13, Fair Value Measurement Disclosure Framework – Changes to the Disclosure Requirements for Fair Value Measurement (ASU 2018-13), which adds, removes, and modifies certain aspects relating to fair value disclosure. ASU 2018-13 is effective for interim and annual reporting periods beginning after December 15, 2019; early adoption of the additions relating to ASU 2018-13 is not required, even if early adoption is elected for the removals under ASU 2018-13. Management has early adopted the removals set forth in ASU 2018-13 in these financial statements and has not early adopted the additions set forth in ASU 2018-13.
Security Valuation.Portfolio securities listed or traded on a nationally recognized securities exchange or traded in the U.S. over-the-counter market for which market quotations are readily available are valued at the last quoted sale price or a market’s official closing price as of the close of business on the day the securities are being valued. If there were no sales that day, the security is valued at the average of the closing bid and asked prices or, if there were no asked prices quoted on that day, then the security is valued at the closing bid price on that day. If no bid or asked prices are quoted on such day, the security is valued at the most recently available price or, if the Board of Directors (the Board) so determines, by such other method as the Board shall determine in good faith to reflect its fair market value. Portfolio securities traded on more than one national securities exchange or market are valued according to the broadest and most representative market, as determined by Gabelli Funds, LLC (the Adviser).
Portfolio securities primarily traded on a foreign market are generally valued at the preceding closing values of such securities on the relevant market, but may be fair valued pursuant to procedures established by the Board if market conditions change significantly after the close of the foreign market, but prior to the close of
11
The Gabelli Value 25 Fund Inc.
Notes to Financial Statements (Continued)
business on the day the securities are being valued. Debt obligations for which market quotations are readily available are valued at the average of the latest bid and asked prices. If there were no asked prices quoted on such day, the security is valued using the closing bid price, unless the Board determines that such amount does not reflect the securities’ fair value, in which case these securities will be fair valued as determined by the Board. Certain securities are valued principally using dealer quotations. Futures contracts are valued at the closing settlement price of the exchange or board of trade on which the applicable contract is traded. OTC futures and options on futures for which market quotations are readily available will be valued by quotations received from a pricing service or, if no quotations are available from a pricing service, by quotations obtained from one or more dealers in the instrument in question by the Adviser.
Securities and assets for which market quotations are not readily available are fair valued as determined by the Board. Fair valuation methodologies and procedures may include, but are not limited to: analysis and review of available financial and non-financial information about the company; comparisons with the valuation and changes in valuation of similar securities, including a comparison of foreign securities with the equivalent U.S. dollar value American Depositary Receipt securities at the close of the U.S. exchange; and evaluation of any other information that could be indicative of the value of the security.
The inputs and valuation techniques used to measure fair value of the Fund’s investments are summarized into three levels as described in the hierarchy below:
| ● | Level 1 — quoted prices in active markets for identical securities; |
| ● | Level 2 — other significant observable inputs (including quoted prices for similar securities, interest rates, prepayment speeds, credit risk, etc.); and |
| ● | Level 3 — significant unobservable inputs (including the Board’s determinations as to the fair value of investments). |
A financial instrument’s level within the fair value hierarchy is based on the lowest level of any input both individually and in the aggregate that is significant to the fair value measurement. The inputs or methodology used for valuing securities are not necessarily an indication of the risk associated with investing in those securities. The summary of the Fund’s investments in securities by inputs used to value the Fund’s investments as of December 31, 2018 is as follows:
| Valuation Inputs | ||||||||||||
| Level 1 Quoted Prices | Level 3 Significant Unobservable Inputs | Total Market Value at 12/31/18 | ||||||||||
INVESTMENTS IN SECURITIES: | ||||||||||||
ASSETS (Market Value): | ||||||||||||
Common Stocks: | ||||||||||||
Aerospace | $ 10,605,655 | $12,606 | $ 10,618,261 | |||||||||
Energy and Utilities | 10,901,340 | 0 | 10,901,340 | |||||||||
Other Industries (a) | 323,649,779 | — | 323,649,779 | |||||||||
Total Common Stocks | 345,156,774 | 12,606 | 345,169,380 | |||||||||
TOTAL INVESTMENTS IN SECURITIES – ASSETS | $345,156,774 | $12,606 | $345,169,380 | |||||||||
| (a) | Please refer to the Schedule of Investments for the industry classifications of these portfolio holdings. |
12
The Gabelli Value 25 Fund Inc.
Notes to Financial Statements (Continued)
During the year ended December 31, 2018, the Fund did not have transfers into or out of Level 3.
Additional Information to Evaluate Qualitative Information.
General.The Fund uses recognized industry pricing services – approved by the Board and unaffiliated with the Adviser – to value most of its securities, and uses broker quotes provided by market makers of securities not valued by these and other recognized pricing sources. Several different pricing feeds are received to value domestic equity securities, international equity securities, preferred equity securities, and fixed income securities. The data within these feeds are ultimately sourced from major stock exchanges and trading systems where these securities trade. The prices supplied by external sources are checked by obtaining quotations or actual transaction prices from market participants. If a price obtained from the pricing source is deemed unreliable, prices will be sought from another pricing service or from a broker/dealer that trades that security or similar securities.
Fair Valuation.Fair valued securities may be common or preferred equities, warrants, options, rights, or fixed income obligations. Where appropriate, Level 3 securities are those for which market quotations are not available, such as securities not traded for several days, or for which current bids are not available, or which are restricted as to transfer. Among the factors to be considered to fair value a security are recent prices of comparable securities that are publicly traded, reliable prices of securities not publicly traded, the use of valuation models, current analyst reports, valuing the income or cash flow of the issuer, or cost if the preceding factors do not apply. A significant change in the unobservable inputs could result in a lower or higher value in Level 3 securities. The circumstances of Level 3 securities are frequently monitored to determine if fair valuation measures continue to apply.
The Adviser reports quarterly to the Board the results of the application of fair valuation policies and procedures. These may include backtesting the prices realized in subsequent trades of these fair valued securities to fair values previously recognized.
Foreign Currency Translations.The books and records of the Fund are maintained in U.S. dollars. Foreign currencies, investments, and other assets and liabilities are translated into U.S. dollars at current exchange rates. Purchases and sales of investment securities, income, and expenses are translated at the exchange rate prevailing on the respective dates of such transactions. Unrealized gains and losses that result from changes in foreign exchange rates and/or changes in market prices of securities have been included in unrealized appreciation/depreciation on investments and foreign currency translations. Net realized foreign currency gains and losses resulting from changes in exchange rates include foreign currency gains and losses between trade date and settlement date on investment securities transactions, foreign currency transactions, and the difference between the amounts of interest and dividends recorded on the books of the Fund and the amounts actually received. The portion of foreign currency gains and losses related to fluctuation in exchange rates between the initial purchase trade date and subsequent sale trade date is included in realized gain/(loss) on investments.
Foreign Securities.The Fund may directly purchase securities of foreign issuers. Investing in securities of foreign issuers involves special risks not typically associated with investing in securities of U.S. issuers. The risks include possible revaluation of currencies, the inability to repatriate funds, less complete financial information about companies, and possible future adverse political and economic developments. Moreover, securities of
13
The Gabelli Value 25 Fund Inc.
Notes to Financial Statements (Continued)
many foreign issuers and their markets may be less liquid and their prices more volatile than securities of comparable U.S. issuers.
Foreign Taxes.The Fund may be subject to foreign taxes on income, gains on investments, or currency repatriation, a portion of which may be recoverable. The Fund will accrue such taxes and recoveries as applicable, based upon its current interpretation of tax rules and regulations that exist in the markets in which it invests.
Restricted Securities.The Fund may invest up to 10% of its net assets in securities for which the markets are restricted. Restricted securities include securities whose disposition is subject to substantial legal or contractual restrictions. The sale of restricted securities often requires more time and results in higher brokerage charges or dealer discounts and other selling expenses than does the sale of securities eligible for trading on national securities exchanges or in the over-the-counter markets. Restricted securities may sell at a price lower than similar securities that are not subject to restrictions on resale. Securities freely saleable among qualified institutional investors under special rules adopted by the SEC may be treated as liquid if they satisfy liquidity standards established by the Board. The continued liquidity of such securities is not as well assured as that of publicly traded securities, and accordingly the Board will monitor their liquidity. At December 31, 2018, the Fund held no restricted securities.
Securities Transactions and Investment Income.Securities transactions are accounted for on the trade date with realized gain/(loss) on investments determined by using the identified cost method. Interest income (including amortization of premium and accretion of discount) is recorded on an accrual basis. Premiums and discounts on debt securities are amortized using the effective yield to maturity method. Dividend income is recorded on the ex-dividend date, except for certain dividends from foreign securities that are recorded as soon after the ex-dividend date as the Fund becomes aware of such dividends.
Determination of Net Asset Value and Calculation of Expenses.Certain administrative expenses are common to, and allocated among, various affiliated funds. Such allocations are made on the basis of each fund’s average net assets or other criteria directly affecting the expenses as determined by the Adviser pursuant to procedures established by the Board.
In calculating the NAV per share of each class, investment income, realized and unrealized gains and losses, redemption fees, and expenses other than class specific expenses are allocated daily to each class of shares based upon the proportion of net assets of each class at the beginning of each day. Distribution expenses are borne solely by the class incurring the expense.
Distributions to Shareholders.Distributions to shareholders are recorded on the ex-dividend date. Distributions to shareholders are based on income and capital gains as determined in accordance with federal income tax regulations, which may differ from income and capital gains as determined under GAAP. These differences are primarily due to differing treatments of income and gains on various investment securities and foreign currency transactions held by the Fund, timing differences, and differing characterizations of distributions made by the Fund. Distributions from net investment income for federal income tax purposes include net realized gains on foreign currency transactions. These book/tax differences are either temporary or permanent in nature. Permanent differences were primarily due to utilization of tax equalization, prior year long term capital gain reversal on real estate investment trusts, and tax treatment of currency gains and losses. To the extent these differences are permanent, adjustments are made to the appropriate capital accounts in the period when the
14
The Gabelli Value 25 Fund Inc.
Notes to Financial Statements (Continued)
differences arise. These reclassifications have no impact on the NAV of the Fund. For the fiscal year ended December 31, 2018, reclassifications were made to increase paid-in capital by $2,458,206, with an offsetting adjustment to total distributable earnings.
The tax character of distributions paid during the years ended December 31, 2018 and 2017 was as follows:
| Year Ended December 31, 2018 | Year Ended December 31, 2017 | |||||||||
Distributions paid from:* | ||||||||||
Ordinary income (inclusive of short term capital gains) | $ 334,638 | $ 1,141,947 | ||||||||
Net long term capital gains | 32,902,226 | 29,541,548 | ||||||||
|
|
|
| |||||||
Total distributions paid | $33,236,864 | $30,683,495 | ||||||||
|
|
|
| |||||||
| * | Total distributions paid differs from the Statement of Changes in Net Assets due to the utilization of equalization. |
Provision for Income Taxes.The Fund intends to continue to qualify as a regulated investment company under Subchapter M of the Internal Revenue Code of 1986, as amended (the Code). It is the policy of the Fund to comply with the requirements of the Code applicable to regulated investment companies and to distribute substantially all of its net investment company taxable income and net capital gains. Therefore, no provision for federal income taxes is required.
As of December 31, 2018, the components of accumulated earnings/losses on a tax basis were as follows:
Undistributed long term capital gains | $ | 159,343 | ||
Net unrealized appreciation on investments and foreign currency translations | 185,674,897 | |||
|
| |||
Total | $ | 185,834,240 | ||
|
|
At December 31, 2018, the temporary differences between book basis and tax basis net unrealized appreciation on investments were primarily due to deferral of losses from wash sales for tax purposes and tax basis adjustments on investments in real estate investment trusts.
The following summarizes the tax cost of investments and the related net unrealized appreciation at December 31, 2018:
| Cost | Gross Unrealized Appreciation | Gross Unrealized Depreciation | Net Unrealized Appreciation | |||||||||||||
Investments | $159,498,235 | $191,306,044 | $(5,634,899) | $185,671,145 | ||||||||||||
The Fund is required to evaluate tax positions taken or expected to be taken in the course of preparing the Fund’s tax returns to determine whether the tax positions are “more-likely-than-not” of being sustained by the applicable tax authority. Income tax and related interest and penalties would be recognized by the Fund as tax expense in the Statement of Operations if the tax positions were deemed not to meet the more-likely-than-not threshold. For the year ended December 31, 2018, the Fund did not incur any income tax, interest, or penalties. As of December 31, 2018, the Adviser has reviewed all open tax years and concluded that there was no impact to the Fund’s net assets or results of operations. The Fund’s federal and state tax returns for the prior three fiscal years remain open, subject to examination. On an ongoing basis, the Adviser will monitor the Fund’s tax positions to determine if adjustments to this conclusion are necessary.
3. Investment Advisory Agreement and Other Transactions.The Fund has entered into an investment advisory agreement (the Advisory Agreement) with the Adviser which provides that the Fund will pay the Adviser
15
The Gabelli Value 25 Fund Inc.
Notes to Financial Statements (Continued)
a fee, computed daily and paid monthly, at the annual rate of 1.00% of the value of its average daily net assets. In accordance with the Advisory Agreement, the Adviser provides a continuous investment program for the Fund’s portfolio, oversees the administration of all aspects of the Fund’s business and affairs, and pays the compensation of all Officers and Directors of the Fund who are affiliated persons of the Adviser.
Effective October 1, 2016, the Adviser contractually agreed to waive its investment advisory fee and/or reimburse expenses of Class I Shares to the extent necessary to maintain the total operating expenses (excluding brokerage, acquired fund fees and expenses, interest, taxes, and extraordinary expenses) until at least April 30, 2020 at no more than 1.00% of the value of its average daily net assets. In addition, the Fund has agreed, during the three year period following any waiver or reimbursement by the Adviser, to repay such amount to the extent, that after giving the effect to the repayment, such adjusted annualized total operating expenses of the Fund would not exceed 1.00% of the value of the Fund’s average daily net assets for Class I. The agreement is renewable annually. At December 31, 2018, the cumulative amount which the Fund may repay the Adviser is $206,695.
For the year ended December 31, 2016, expiring December 31, 2019 | $ | 11,790 | ||
For the year ended December 31, 2017, expiring December 31, 2020 | 87,199 | |||
For the year ended December 31, 2018, expiring December 31, 2021 | 107,706 | |||
|
| |||
| $ | 206,695 | |||
|
|
The Fund pays each Director who is not considered an affiliated person an annual retainer of $9,000 plus $2,000 for each Board meeting attended, and they are reimbursed for any out of pocket expenses incurred in attending meetings. All Board committee members receive $500 per meeting attended. The Chairman of the Audit Committee and the Lead Director each receives an annual fee of $2,000 per year. The Chairman of the Nominating Committee receives an annual fee of $2,500. A Director may receive a single meeting fee, allocated among the participating funds, for attending certain meetings held on behalf of multiple funds. Directors who are directors or employees of the Adviser or an affiliated company receive no compensation or expense reimbursement from the Fund.
4. Distribution Plan.The Fund’s Board has adopted a distribution plan (the Plan) for each class of shares, except for Class I Shares, pursuant to Rule 12b-1 under the 1940 Act. Under the Class AAA, Class A, and Class C Share Plans, payments are authorized to G.distributors, LLC (the Distributor), an affiliate of the Adviser, at annual rates of 0.25%, 0.25%, and 1.00%, respectively, of the average daily net assets of those classes, the annual limitations under each Plan. Such payments are accrued daily and paid monthly.
5. Portfolio Securities.Purchases and sales of securities during the year ended December 31, 2018, other than short term securities and U.S. Government obligations, aggregated $9,199,410 and $70,068,839, respectively.
6. Transactions with Affiliates and Other Arrangements.During the year ended December 31, 2018, the Fund paid $16,643 in brokerage commissions on security trades to G.research, LLC, an affiliate of the Adviser. Additionally, the Distributor retained a total of $4,353 from investors representing commissions (sales charges and underwriting fees) on sales and redemptions of Fund shares.
16
The Gabelli Value 25 Fund Inc.
Notes to Financial Statements (Continued)
During the year ended December 31, 2018, the Fund received credits from a designated broker who agreed to pay certain Fund operating expenses. The amount of such expenses paid through this directed brokerage arrangement during this period was $4,186.
The cost of calculating the Fund’s NAV per share is a Fund expense pursuant to the Advisory Agreement. During the year ended December 31, 2018, the Fund accrued $45,000 in accounting fees in the Statement of Operations.
7. Capital Stock.The Fund offers four classes of shares – Class AAA Shares, Class A Shares, Class C Shares, and Class I Shares. Class AAA Shares and Class I Shares are offered without a sales charge. Class A Shares are subject to a maximum front-end sales charge of 5.75%. Class C Shares are subject to a 1.00% contingent deferred sales charge for one year after purchase.
The Fund imposes a redemption fee of 2.00% on all classes of shares that are redeemed or exchanged on or before the seventh day after the date of a purchase. The redemption fee is deducted from the proceeds otherwise payable to the redeeming shareholders and is retained by the Fund as an increase in paid-in capital. The redemption fees retained by the Fund during the years ended December 31, 2018 and 2017, if any, can be found in the Statement of Changes in Net Assets under Redemption Fees.
17
The Gabelli Value 25 Fund Inc.
Notes to Financial Statements (Continued)
Transactions in shares of capital stock were as follows:
| Year Ended December 31, 2018 | Year Ended December 31, 2017 | |||||||||||||||
| Shares | Amount | Shares | Amount | |||||||||||||
Class AAA | ||||||||||||||||
Shares sold | 57,842 | $ | 834,317 | 56,037 | $ | 881,770 | ||||||||||
Shares issued upon reinvestment of distributions | 22,909 | 294,155 | 18,601 | 287,025 | ||||||||||||
Shares redeemed | (83,070 | ) | (1,272,911 | ) | (60,788 | ) | (957,533 | ) | ||||||||
|
|
|
|
|
|
|
| |||||||||
Net increase/(decrease) | (2,319 | ) | $ | (144,439 | ) | 13,850 | $ | 211,262 | ||||||||
|
|
|
|
|
|
|
| |||||||||
Class A | ||||||||||||||||
Shares sold | 141,733 | $ | 2,139,174 | 190,962 | $ | 2,981,864 | ||||||||||
Shares issued upon reinvestment of distributions | 1,868,662 | 24,086,847 | 1,438,964 | 22,303,924 | ||||||||||||
Shares redeemed | (3,719,152 | ) | (56,592,005 | ) | (4,566,779 | ) | (72,105,640 | ) | ||||||||
|
|
|
|
|
|
|
| |||||||||
Net decrease | (1,708,757 | ) | $ | (30,365,984 | ) | (2,936,853 | ) | $ | (46,819,852 | ) | ||||||
|
|
|
|
|
|
|
| |||||||||
Class C | ||||||||||||||||
Shares sold | 118,768 | $ | 1,287,635 | 22,582 | $ | 279,493 | ||||||||||
Shares issued upon reinvestment of distributions | 74,169 | 723,144 | 51,731 | 628,009 | ||||||||||||
Shares redeemed | (215,892 | ) | (2,536,976 | ) | (334,977 | ) | (4,210,853 | ) | ||||||||
|
|
|
|
|
|
|
| |||||||||
Net decrease | (22,955 | ) | $ | (526,197 | ) | (260,664 | ) | $ | (3,303,351 | ) | ||||||
|
|
|
|
|
|
|
| |||||||||
Class I | ||||||||||||||||
Shares sold | 415,344 | $ | 6,550,513 | 1,207,770 | $ | 19,052,127 | ||||||||||
Shares issued upon reinvestment of distributions | 340,330 | 4,376,640 | 246,145 | 3,807,872 | ||||||||||||
Shares redeemed | (956,604 | ) | (14,871,623 | ) | (740,070 | ) | (11,711,179 | ) | ||||||||
|
|
|
|
|
|
|
| |||||||||
Net increase/(decrease) | (200,930 | ) | $ | (3,944,470 | ) | 713,845 | $ | 11,148,820 | ||||||||
|
|
|
|
|
|
|
| |||||||||
Class T* | ||||||||||||||||
Shares sold | — | — | 63 | $ | 1,000 | |||||||||||
Shares issued upon reinvestment of distributions | — | — | 4 | 68 | ||||||||||||
Shares redeemed | (67 | ) | $ | (1,118 | ) | — | — | |||||||||
|
|
|
|
|
|
|
| |||||||||
Net increase/(decrease) | (67 | ) | $ | (1,118 | ) | 67 | $ | 1,068 | ||||||||
|
|
|
|
|
|
|
| |||||||||
| * | Class T Shares were liquidated on September 21, 2018. |
8. Indemnifications.The Fund enters into contracts that contain a variety of indemnifications. The Fund’s maximum exposure under these arrangements is unknown. However, the Fund has not had prior claims or losses pursuant to these contracts. Management has reviewed the Fund’s existing contracts and expects the risk of loss to be remote.
9. Subsequent Events.Management has evaluated the impact on the Fund of all subsequent events occurring through the date the financial statements were issued and has determined that there were no subsequent events requiring recognition or disclosure in the financial statements.
18
The Gabelli Value 25 Fund Inc.
Report of Independent Registered Public Accounting Firm
To the Board of Directors and
Shareholders of The Gabelli Value 25 Fund Inc.:
Opinion on the Financial Statements
We have audited the accompanying statement of assets and liabilities, including the schedule of investments, of The Gabelli Value 25 Fund Inc. (the “Fund”) as of December 31, 2018, the related statement of operations for the year ended December 31, 2018, the statement of changes in net assets for each of the two years in the period ended December 31, 2018, including the related notes, and the financial highlights for each of the five years in the period ended December 31, 2018 (collectively referred to as the “financial statements”). In our opinion, the financial statements present fairly, in all material respects, the financial position of the Fund as of December 31, 2018, the results of its operations for the year then ended, the changes in its net assets for each of the two years in the period ended December 31, 2018 and the financial highlights for each of the five years in the period ended December 31, 2018 in conformity with accounting principles generally accepted in the United States of America.
Basis for Opinion
These financial statements are the responsibility of the Fund’s management. Our responsibility is to express an opinion on the Fund’s financial statements based on our audits. We are a public accounting firm registered with the Public Company Accounting Oversight Board (United States) (PCAOB) and are required to be independent with respect to the Fund in accordance with the U.S. federal securities laws and the applicable rules and regulations of the Securities and Exchange Commission and the PCAOB.
We conducted our audits of these financial statements in accordance with the standards of the PCAOB. Those standards require that we plan and perform the audit to obtain reasonable assurance about whether the financial statements are free of material misstatement, whether due to error or fraud.
Our audits included performing procedures to assess the risks of material misstatement of the financial statements, whether due to error or fraud, and performing procedures that respond to those risks. Such procedures included examining, on a test basis, evidence regarding the amounts and disclosures in the financial statements. Our audits also included evaluating the accounting principles used and significant estimates made by management, as well as evaluating the overall presentation of the financial statements. Our procedures included confirmation of securities owned as of December 31, 2018 by correspondence with the custodian and broker; when replies were not received from the broker, we performed other auditing procedures. We believe that our audits provide a reasonable basis for our opinion.
/s/ PricewaterhouseCoopers LLP
New York, New York
February 28, 2019
We have served as the auditor of one or more investment companies in Gabelli/GAMCO Fund Complex since 1986.
19
The Gabelli Value 25 Fund Inc.
Additional Fund Information (Unaudited)
The business and affairs of the Fund are managed under the direction of the Fund’s Board of Directors. Information pertaining to the Directors and officers of the Fund is set forth below. The Fund’s Statement of Additional Information includes additional information about the Fund’s Directors and is available without charge, upon request, by calling 800-GABELLI (800-422-3554) or by writing to The Gabelli Value 25 Fund Inc. at One Corporate Center, Rye, NY 10580-1422.
Name, Position(s) Address1 and Age | Term of Office Time Served2 | Number of Funds in Fund Complex Overseen by Director | Principal Occupation(s) During Past Five Years | Other Directorships Held by Director3 | ||||
INTERESTED DIRECTORS4: | ||||||||
Mario J. Gabelli, CFA Director and Chief Investment Officer Age: 76 | Since 1989 | 35 | Chairman, Chief Executive Officer, and Chief Investment Officer– Value Portfolios of GAMCO Investors, Inc. and Chief Investment Officer–Value Portfolios of Gabelli Funds, LLC and GAMCO Asset Management Inc.; Director/ Trustee or Chief Investment Officer of other registered investment companies within the Gabelli/GAMCO Fund Complex; Chief Executive Officer of GGCP, Inc.; Executive Chairman of Associated Capital Group, Inc. | Director of Morgan Group Holdings, Inc. (holding company); Chairman of the Board and Chief Executive Officer of LICT Corp. (multimedia and communication services company); Director of CIBL, Inc. (broadcasting and wireless communications); Director of ICTC Group Inc. (communications) | ||||
INDEPENDENT DIRECTORS5: | ||||||||
Anthony J. Colavita Director Age: 83 | Since 1989 | 20 | President of the law firm of Anthony J. Colavita, P.C. | — | ||||
Robert J. Morrissey Director Age: 79 | Since 1989 | 7 | Partner in the law firm of Morrissey, Hawkins & Lynch | Chairman of the Board of Directors, Belmont Savings Bank | ||||
Kuni Nakamura6 Director Age: 50 | Since 2016 | 37 | President of Advanced Polymer, Inc. (chemical manufacturing company); President of KEN Enterprises, Inc. (real estate) | — | ||||
Anthony R. Pustorino Director Age: 93 | Since 1989 | 10 | Certified Public Accountant; Professor Emeritus, Pace University | Director of The LGL Group, Inc. (diversified manufacturing) (2004-2011) | ||||
Werner J. Roeder Director Age: 78 | Since 2001 | 23 | Retired physician; Former Vice President of Medical Affairs (Medical Director) of New York Presbyterian/Lawrence Hospital (1999-2014) | — | ||||
20
The Gabelli Value 25 Fund Inc.
Additional Fund Information (Continued) (Unaudited)
Name, Position(s) Address1 and Age | Term of Office Time Served2 | Principal Occupation(s) During Past Five Years | ||||
OFFICERS: | ||||||
Bruce N. Alpert President Age: 67 | Since 1989 | Executive Vice President and Chief Operating Officer of Gabelli Funds, LLC since 1988; Officer of registered investment companies within the Gabelli/GAMCO Fund Complex; Senior Vice President of GAMCO Investors, Inc. since 2008 | ||||
John C. Ball Treasurer Age: 42 | Since 2017 | Treasurer of funds within the Gabelli/GAMCO Fund Complex since 2017; Vice President and Assistant Treasurer of AMG Funds, 2014-2017; Vice President of State Street Corporation, 2007-2014 | ||||
Agnes Mullady Vice President Age: 60 | Since 2006 | Officer of registered investment companies within the Gabelli/GAMCO Fund Complex since 2006; President and Chief Operating Officer of the Fund Division of Gabelli Funds, LLC since 2015; Chief Executive Officer of G.distributors, LLC since 2010; Senior Vice President of GAMCO Investors, Inc. since 2009; Vice President of Gabelli Funds, LLC since 2007; Executive Vice President of Associated Capital Group, Inc. since 2016 | ||||
Andrea R. Mango Secretary Age: 46 | Since 2013 | Vice President of GAMCO Investors, Inc. since 2016; Counsel of Gabelli Funds, LLC since 2013; Secretary of registered investment companies within the Gabelli/GAMCO Fund Complex since 2013; Vice President of closed-end funds within the Gabelli/GAMCO Fund Complex since 2014; Corporate Vice President within the Corporate Compliance Department of New York Life Insurance Company, 2011-2013 | ||||
Richard J. Walz Chief Compliance Officer Age: 59 | Since 2013 | Chief Compliance Officer of registered investment companies within the Gabelli/GAMCO Fund Complex since 2013; Chief Compliance Officer of AEGON USA Investment Management, 2011-2013 | ||||
| 1 | Address: One Corporate Center, Rye, NY 10580-1422, unless otherwise noted. |
| 2 | Each Director will hold office for an indefinite term until the earliest of (i) the next meeting of shareholders, if any, called for the purpose of considering the election or re-election of such Director and until the election and qualification of his or her successor, if any, elected at such meeting, or (ii) the date a Director resigns or retires, or a Director is removed by the Board of Directors or shareholders, in accordance with the Fund’s By-Laws and Articles of Incorporation. Each officer will hold office for an indefinite term until the date he or she resigns or retires or until his or her successor is elected and qualified. For officers, includes time served in other officer positions with the Fund. |
| 3 | This column includes only directorships of companies required to report to the SEC under the Securities Exchange Act of 1934, as amended, i.e., public companies, or other investment companies registered under the 1940 Act. |
| 4 | “Interested person” of the Fund as defined in the 1940 Act. Mr. Gabelli is considered an “interested person” because of his affiliation with Gabelli Funds, LLC which acts as the Fund’s investment adviser. |
| 5 | Directors who are not interested persons are considered “Independent” Directors. |
| 6 | Mr. Nakamura is a director of Gabelli Merger Plus+ Trust Plc, which may be deemed to be controlled by Mario J. Gabelli and/or affiliates and, in that event, would be deemed to be under common control with the Fund’s Adviser. |
21
The Gabelli Value 25 Fund Inc.
Board Consideration and Re-Approval of Investment Advisory Agreement (Unaudited)
Section 15(c) of the Investment Company Act of 1940, as amended (the 1940 Act), contemplates that the Board of Directors (the Board) of The Gabelli Value 25 Fund Inc. (the Fund), including a majority of the Directors who have no direct or indirect interest in the investment advisory agreement and are not interested persons of the Fund, as defined in the 1940 Act (the Independent Board Members), are required annually to review and re-approve the terms of the Fund’s existing investment advisory agreement and approve any newly proposed terms therein. In this regard, the Board reviewed and re-approved, during the most recent six month period covered by this report, the Investment Advisory Agreement (the Advisory Agreement) with Gabelli Funds, LLC (the Adviser) for the Fund.
More specifically, at a meeting held on November 14, 2018, the Independent Board Members, meeting in executive session, reviewed the written and oral information that had been made available, and considered the factors and reached the conclusions described below relating to the selection of the Adviser and the re-approval of the Advisory Agreement.
1. The nature, extent, and quality of services provided by the Adviser
The Independent Board Members reviewed in detail the nature and extent of the services provided by the Adviser under the Advisory Agreement and the quality of those services over the past year. The Independent Board Members noted that these services included managing the investment program of the Fund, including the purchase and sale of portfolio securities, and overseeing all of the Fund’s third party service providers as well as providing general corporate services. The Independent Board Members considered that the Adviser also provided, at its expense, office facilities for use by the Fund and supervisory personnel responsible for supervising the performance of administrative, accounting, and related services for the Fund, including monitoring to assure compliance with stated investment policies and restrictions under the 1940 Act and related securities regulation. The Independent Board Members noted that, in addition to managing the investment program for the Fund, the Adviser provided certain non-advisory and compliance services, including services for the Fund’s Rule 38a-1 compliance program
The Independent Board Members also considered that the Adviser paid for all compensation of officers and Board Members of the Fund that are affiliated with the Adviser and that the Adviser further provided services to shareholders of the Fund who had invested through various programs offered by third party financial intermediaries. The Independent Board Members evaluated these factors based on its direct experience with the Adviser and in consultation with Fund Counsel. The Independent Board Members noted that the Adviser had engaged, at its expense, BNY Mellon Investment Servicing (US) Inc. (BNY) to assist it in performing certain of its administrative functions. The Independent Board Members concluded that the nature and extent of the services provided were reasonable and appropriate in relation to the advisory fee, that the level of services provided by the Adviser, either directly or through BNY, had not diminished over the past year, and that the quality of service continued to be high.
The Independent Board Members reviewed the personnel responsible for providing services to the Fund and concluded, based on their experience and interaction with the Adviser, that (i) the Adviser was able to retain quality personnel, (ii) the Adviser and its agents exhibited a high level of diligence and attention to detail in carrying out their advisory and administrative responsibilities under the Advisory Agreement, (iii) the Adviser was responsive to requests of the Board, (iv) the scope and depth of the Adviser’s resources were adequate, and (v) the Adviser had kept the Board apprised of developments relating to the Fund and the industry in
22
The Gabelli Value 25 Fund Inc.
Board Consideration and Re-Approval of Investment Advisory Agreement (Unaudited) (Continued)
general. The Independent Board Members also focused on the Adviser’s reputation and long standing relationship with the Fund. The Independent Board Members also believed that the Adviser had devoted substantial resources and made substantial commitments to address new regulatory compliance requirements applicable to the Fund.
2. The performance of the Fund and the Adviser.
The Independent Board Members reviewed the investment performance of the Fund, on an absolute basis, as compared with its Broadridge peer group of other SEC registered funds, and against the Fund’s broad based securities market benchmark as reflected in the Fund’s prospectus and annual report. The Independent Board Members considered the Fund’s one, three, five, and ten year average annual total return for the periods ended September 30, 2018, but placed greater emphasis on the Fund’s longer term performance. The peer group considered by the Independent Board Members was developed by Broadridge and was comprised of the Fund and a representative class/fund from each retail portfolio in the multi-cap core classifications, excluding outliers (the Performance Peer Group). The Independent Board Members considered these comparisons helpful in their assessment as to whether the Adviser was obtaining for the Fund’s shareholders the total return performance that was available in the marketplace, given the Fund’s objectives, strategies, limitations, and restrictions. In reviewing the performance of the Fund, the Independent Board Members noted that the Fund’s performance was below the median for the one year, three year, and five year periods. The Independent Board Members concluded that the Fund’s performance was reasonable in comparison to that of the Performance Peer Group.
In connection with its assessment of the performance of the Adviser, the Independent Board Members considered the Adviser’s financial condition and whether it had the resources necessary to continue to carry out its functions under the Advisory Agreement. The Independent Board Members concluded that the Adviser had the financial resources necessary to continue to perform its obligations under the Advisory Agreement and to continue to provide the high quality services that it has provided to the Fund to date.
3. The cost of the advisory services and the profits to the Adviser and its affiliates from the relationship with the Fund.
In connection with the Independent Board Members’ consideration of the cost of the advisory services and the profits to the Adviser and its affiliates from the relationship with the Fund, the Independent Board Members considered a number of factors. First, the Independent Board Members compared the level of the advisory fee for the Fund against comparative Broadridge expense peer group (Expense Peer Group). The Independent Board Members also considered comparative non-management fee expenses and comparative total fund expenses of the Fund and the Expense Peer Group. The Independent Board Members considered this information as useful in assessing whether the Adviser was providing services at a cost that was competitive with other similar funds. In assessing this information, the Independent Board Members considered both the comparative contract rates as well as the level of the total expense ratio, with respect to the Expense Peer Group. The Independent Board Members noted that the Fund’s advisory fee and expense ratio were above the median when compared with those of the Expense Peer Group.
The Independent Board Members also reviewed the fees charged by the Adviser to provide similar advisory services to other registered investment companies or accounts with similar investment objectives, noting that the fees charged by the Adviser were the same or lower, than the fees charged to the Fund.
23
The Gabelli Value 25 Fund Inc.
Board Consideration and Re-Approval of Investment Advisory Agreement (Unaudited) (Continued)
The Independent Board Members also considered an analysis prepared by the Adviser of the estimated profitability to the Adviser of its relationship with the Fund and reviewed with the Adviser its cost allocation methodology in connection with its profitability. In this regard, the Independent Board Members reviewed Pro-forma Income Statements of the Adviser for the year ended December 31, 2017. The Independent Board Members considered one analysis for the Adviser as a whole, and a second analysis for the Adviser with respect to the Fund. With respect to the Fund analysis, the Independent Board Members received an analysis based on the Fund’s average net assets during the period as well as a pro-forma analysis of profitability at higher and lower asset levels. The Independent Board Members concluded that the profitability of the Fund to the Adviser under either analysis was not excessive.
4. The extent to which economies of scale will be realized as the Fund grows and whether fee levels reflect those economies of scale.
With respect to the Independent Board Members’ consideration of economies of scale, the Independent Board Members discussed whether economies of scale would be realized by the Fund at higher asset levels. The Independent Board Members also reviewed data from the Expense Peer Group to assess whether the Expense Peer Group funds had advisory fee breakpoints and, if so, at what asset levels. The Independent Board Members also assessed whether certain of the Adviser’s costs would increase if asset levels rise. The Independent Board Members noted the Fund’s current size and concluded that under foreseeable conditions, they were unable to assess at this time whether economies of scale would be realized if the Fund were to experience significant asset growth. In the event there were to be significant asset growth in the Fund, the Independent Board Members determined to reassess whether the advisory fee appropriately took into account any economies of scale that had been realized as a result of that growth.
5. Other Factors
In addition to the above factors, the Independent Board Members also discussed other benefits received by the Adviser from its management of the Fund. The Independent Board Members considered that the Adviser does use soft dollars in connection with its management of the Fund.
Based on a consideration of all these factors in their totality, the Board Members, including all of the Independent Board Members, determined that the Fund’s advisory fee was fair and reasonable with respect to the quality of services provided and in light of the other factors described above that the Board deemed relevant. Accordingly, the Board Members determined to approve the continuation of the Fund’s Advisory Agreement. The Board based its decision on evaluations of all these factors as a whole and did not consider any one factor as all important or controlling.
24
Gabelli/GAMCO Funds and Your Personal Privacy
Who are we?
The Gabelli/GAMCO Funds are investment companies registered with the Securities and Exchange Commission under the Investment Company Act of 1940. We are managed by Gabelli Funds, LLC, which is affiliated with GAMCO Investors, Inc., a publicly held company with subsidiaries and affiliates that provide investment advisory services for a variety of clients.
What kind of non-public information do we collect about you if you become a fund shareholder?
If you apply to open an account directly with us, you will be giving us some non-public information about yourself. The non-public information we collect about you is:
| ● | Information you give us on your application form.This could include your name, address, telephone number, social security number, bank account number, and other information. |
| ● | Information about your transactions with us, any transactions with our affiliates, and transactions with the entities we hire to provide services to you.This would include information about the shares that you buy or redeem. If we hire someone else to provide services — like a transfer agent — we will also have information about the transactions that you conduct through them. |
What information do we disclose and to whom do we disclose it?
We do not disclose any non-public personal information about our customers or former customers to anyone other than our affiliates, our service providers who need to know such information, and as otherwise permitted by law. If you want to find out what the law permits, you can read the privacy rules adopted by the Securities and Exchange Commission. They are in volume 17 of the Code of Federal Regulations, Part 248. The Commission often posts information about its regulations on its website, www.sec.gov.
What do we do to protect your personal information?
We restrict access to non-public personal information about you to the people who need to know that information in order to provide services to you or the fund and to ensure that we are complying with the laws governing the securities business. We maintain physical, electronic, and procedural safeguards to keep your personal information confidential.
This page was intentionally left blank.
THE GABELLI VALUE 25 FUND INC.
One Corporate Center
Rye, NY 10580-1422
Portfolio Management Team Biographies
Mario J. Gabelli, CFA,is Chairman, Chief Executive Officer, and Chief Investment Officer - Value Portfolios of GAMCO Investors, Inc. that he founded in 1977, and Chief Investment Officer - Value Portfolios of Gabelli Funds, LLC and GAMCO Asset Management Inc. He is also Executive Chairman of Associated Capital Group, Inc. Mr. Gabelli is a summa cum laude graduate of Fordham University and holds an MBA degree from Columbia Business School and Honorary Doctorates from Fordham University and Roger Williams University.
Christopher J. Marangijoined Gabelli in 2003 as a research analyst. Currently he is a Managing Director and Co-Chief Investment Officer for GAMCO Investors, Inc.’s Value team. In addition, he serves as a portfolio manager of Gabelli Funds, LLC and manages several funds within the Gabelli/GAMCO Fund Complex. Mr. Marangi graduated magna cum laude and Phi Beta Kappa with a BA in Political Economy from Williams College and holds an MBA degree with honors from Columbia Business School.
2018 TAX NOTICE TO SHAREHOLDERS(Unaudited)
For the year ended December 31, 2018, the Fund paid to shareholders ordinary income distributions (comprised of net investment income) totaling $0.0018, $0.0032, and $0.0766 per share for Class AAA, Class A, and Class I Shares, respectively, and long term capital gains totaling $32,902,226, or the maximum allowable. The distribution of long term capital gains has been designated as a capital gain dividend by the Fund’s Board of Directors. For the year ended December 31, 2018, 100% of the ordinary income distribution qualifies for the dividends received deduction available to corporations. The Fund designates 100% of the ordinary income distribution as qualified dividend income pursuant to the Jobs and Growth Tax Relief Reconciliation Act of 2003. The Fund designates 0.63% of the ordinary income distribution as qualified interest income pursuant to the Tax Relief, Unemployment Reauthorization, and Job Creation Act of 2010.
U.S. Government Income
The percentage of the ordinary income distribution paid by the Fund during 2018 which was derived from U.S. Treasury securities was 0.57%.
All designations are based on financial information available as of the date of this annual report and, accordingly, are subject to change. For each item, it is the intention of the Fund to designate the maximum amount permitted under the Internal Revenue Code and the regulations thereunder.
We have separated the portfolio managers’ commentary from the financial statements and investment portfolio due to corporate governance regulations stipulated by the Sarbanes-Oxley Act of 2002. We have done this to ensure that the content of the portfolio managers’ commentary is unrestricted. Both the commentary and the financial statements, including the portfolio of investments, will be available on our website at www.gabelli.com.
THE GABELLI VALUE 25 FUND INC.
One Corporate Center
Rye, New York 10580-1422
t 800-GABELLI(800-422-3554)
f 914-921-5118
| e info@gabelli.com |
GABELLI.COM
Net Asset Value per share available daily
by calling800-GABELLI after 7:00 P.M.
BOARD OF DIRECTORS
| OFFICERS
| |
Mario J. Gabelli, CFA Chairman and Chief GAMCO Investors, Inc. Executive Chairman, Associated Capital Group, Inc.
Anthony J. Colavita President, Anthony J. Colavita, P.C.
Robert J. Morrissey Partner, Morrissey, Hawkins & Lynch
Kuni Nakamura President, Advanced Polymer, Inc.
Anthony R. Pustorino Certified Public Accountant, Professor Emeritus, Pace University
Werner J. Roeder Former Medical Director, Lawrence Hospital | Bruce N. Alpert President
John C. Ball Treasurer
Agnes Mullady Vice President
Andrea R. Mango Secretary
Richard J. Walz Chief Compliance Officer
DISTRIBUTOR
G.distributors, LLC
CUSTODIAN
The Bank of New York Mellon
TRANSFER AGENT AND DIVIDEND DISBURSING AGENT
DST Asset Manager
LEGAL COUNSEL
Paul Hastings LLP |
This report is submitted for the general information of the shareholders of The Gabelli Value 25 Fund Inc. It is not authorized for distribution to prospective investors unless preceded or accompanied by an effective prospectus.
GAB409Q418AR

Item 2. Code of Ethics.
| (a) | The registrant, as of the end of the period covered by this report, has adopted a code of ethics that applies to the registrant’s principal executive officer, principal financial officer, principal accounting officer or controller, or persons performing similar functions, regardless of whether these individuals are employed by the registrant or a third party. |
| (c) | There have been no amendments, during the period covered by this report, to a provision of the code of ethics that applies to the registrant’s principal executive officer, principal financial officer, principal accounting officer or controller, or persons performing similar functions, regardless of whether these individuals are employed by the registrant or a third party, and that relates to any element of the code of ethics description. |
| (d) | The registrant has not granted any waivers, including an implicit waiver, from a provision of the code of ethics that applies to the registrant’s principal executive officer, principal financial officer, principal accounting officer or controller, or persons performing similar functions, regardless of whether these individuals are employed by the registrant or a third party, that relates to one or more of the items set forth in paragraph (b) of this item’s instructions. |
Item 3. Audit Committee Financial Expert.
As of the end of the period covered by the report, the registrant’s Board of Directors has determined that Anthony R. Pustorino is qualified to serve as an audit committee financial expert serving on its audit committee and that he is “independent,” as defined by Item 3 of FormN-CSR.
Item 4. Principal Accountant Fees and Services.
Audit Fees
| (a) | The aggregate fees billed for each of the last two fiscal years for professional services rendered by the principal accountant for the audit of the registrant’s annual financial statements or services that are normally provided by the accountant in connection with statutory and regulatory filings or engagements for those fiscal years are $44,166 for 2017 and $44,166 for 2018. |
Audit-Related Fees
| (b) | The aggregate fees billed in each of the last two fiscal years for assurance and related services by the principal accountant that are reasonably related to the performance of the audit of the registrant’s financial statements and are not reported under paragraph (a) of this Item are $0 for 2017 and $0 for 2018. |
Tax Fees
| (c) | The aggregate fees billed in each of the last two fiscal years for professional services rendered by the principal accountant for tax compliance, tax advice, and tax planning are $4,100 for 2017 and $4,100 for 2018. Tax fees represent tax compliance services provided in connection with the review of the Registrant’s tax returns. |
All Other Fees
| (d) | The aggregate fees billed in each of the last two fiscal years for products and services provided by the principal accountant, other than the services reported in paragraphs (a) through (c) of this Item are $0 for 2017 and $0 for 2018. |
| (e)(1) | Disclose the audit committee’spre-approval policies and procedures described in paragraph (c)(7) of Rule2-01 of RegulationS-X. |
Pre-Approval Policies and Procedures. The Audit Committee (“Committee”) of the registrant is responsible forpre-approving (i) all audit and permissiblenon-audit services to be provided by the independent registered public accounting firm to the registrant and (ii) all permissiblenon-audit services to be provided by the independent registered public accounting firm to the Adviser, Gabelli Funds, LLC, and any affiliate of Gabelli Funds, LLC (“Gabelli”) that provides services to the registrant (a “Covered Services Provider”) if the independent registered public accounting firm’s engagement related directly to the operations and financial reporting of the registrant. The Committee may delegate its responsibility topre-approve any such audit and permissiblenon-audit services to the Chairperson of the Committee, and the Chairperson must report to the Committee, at its next regularly scheduled meeting after the Chairperson’spre-approval of such services, his or her decision(s). The Committee may also establish detailedpre-approval policies and procedures forpre-approval of such services in accordance with applicable laws, including the delegation of some or all of the Committee’spre-approval responsibilities to the other persons (other than Gabelli or the registrant’s officers).Pre-approval by the Committee of any permissiblenon-audit services is not required so long as: (i) the permissiblenon-audit services were not recognized by the registrant at the time of the engagement to benon-audit services; and (ii) such services are promptly brought to the attention of the Committee and approved by the Committee or Chairperson prior to the completion of the audit.
| (e)(2) | The percentage of services described in each of paragraphs (b) through (d) of this Item that were approved by the audit committee pursuant to paragraph (c)(7)(i)(C) of Rule2-01 of RegulationS-X are as follows: |
(b) N/A
(c) 0%
(d) N/A
| (f) | The percentage of hours expended on the principal accountant’s engagement to audit the registrant’s financial statements for the most recent fiscal year that were attributed to work performed by persons other than the principal accountant’s full-time, permanent employees was zero percent. |
| (g) | The aggregatenon-audit fees billed by the registrant’s accountant for services rendered to the registrant, and rendered to the registrant’s investment adviser (not including anysub-adviser whose role is primarily portfolio management and is subcontracted with or overseen by another investment adviser), and any entity controlling, controlled by, or under common control with the |
adviser that provides ongoing services to the registrant for each of the last two fiscal years of the registrant was $0 for 2017 and $0 for 2018. |
| (h) | The registrant’s audit committee of the board of directorshas considered whether the provision ofnon-audit services that were rendered to the registrant’s investment adviser (not including anysub-adviser whose role is primarily portfolio management and is subcontracted with or overseen by another investment adviser), and any entity controlling, controlled by, or under common control with the investment adviser that provides ongoing services to the registrant that were notpre-approved pursuant to paragraph (c)(7)(ii) of Rule2-01 of RegulationS-X is compatible with maintaining the principal accountant’s independence. |
Item 5. Audit Committee of Listed Registrants.
Not applicable.
Item 6. Investments.
| (a) | Schedule of Investments in securities of unaffiliated issuers as of the close of the reporting period is included as part of the report to shareholders filed under Item 1 of this form. |
| (b) | Not applicable. |
Item 7. | Disclosure of Proxy Voting Policies and Procedures for Closed-End Management Investment Companies. |
Not applicable.
Item 8. Portfolio Managers ofClosed-End Management Investment Companies.
Not applicable.
Item 9. | Purchases of Equity Securities byClosed-End Management Investment Company and Affiliated Purchasers. |
Not applicable.
Item 10. Submission of Matters to a Vote of Security Holders.
There have been no material changes to the procedures by which the shareholders may recommend nominees to the registrant’s Board of Directors, where those changes were implemented after the registrant last provided disclosure in response to the requirements of Item 407(c)(2)(iv) of
Regulation S-K (17 CFR 229.407) (as required by Item 22(b)(15) of Schedule 14A (17 CFR240.14a-101)), or this Item.
Item 11. Controls and Procedures.
| (a) | The registrant’s principal executive and principal financial officers, or persons performing similar functions, have concluded that the registrant’s disclosure controls and procedures (as defined in Rule30a-3(c) under the Investment Company Act of 1940, as amended (the “1940 Act”) (17 CFR270.30a-3(c))) are effective, as of a date within 90 days of the filing date of the report that includes the disclosure required by this paragraph, based on their evaluation of these controls and procedures required by Rule30a-3(b) under the 1940 Act (17 CFR270.30a-3(b)) and Rules13a-15(b) or15d-15(b) under the Securities Exchange Act of 1934, as amended (17 CFR240.13a-15(b) or240.15d-15(b)). |
| (b) | There were no changes in the registrant’s internal control over financial reporting (as defined in Rule30a-3(d) under the 1940 Act (17 CFR270.30a-3(d))) that occurred during the registrant’s last fiscal quarter that has materially affected, or is reasonably likely to materially affect, the registrant’s internal control over financial reporting. |
Item 12. Disclosure of Securities Lending Activities forClosed-End Management Investment Companies.
Not applicable.
Item 13. Exhibits.
| (a)(1) | Code of ethics, or any amendment thereto, that is the subject of disclosure required by Item 2 is attached hereto. |
| (a)(2) | Certifications pursuant to Rule30a-2(a) under the 1940 Act and Section 302 of the Sarbanes-Oxley Act of 2002 are attached hereto. |
| (a)(3) | Not applicable. |
| (a)(4) | Not applicable. |
| (b) | Certifications pursuant to Rule30a-2(b) under the 1940 Act and Section 906 of the Sarbanes- Oxley Act of 2002 are attached hereto. |
SIGNATURES
Pursuant to the requirements of the Securities Exchange Act of 1934 and the Investment Company Act of 1940, the registrant has duly caused this report to be signed on its behalf by the undersigned, thereunto duly authorized.
| (Registrant) | The Gabelli Value 25 Fund Inc. |
| By (Signature and Title)* | /s/ Bruce N. Alpert | |
| Bruce N. Alpert, Principal Executive Officer | ||
| Date | 3/7/19 | |
Pursuant to the requirements of the Securities Exchange Act of 1934 and the Investment Company Act of 1940, this report has been signed below by the following persons on behalf of the registrant and in the capacities and on the dates indicated. | ||||
| By (Signature and Title)* | /s/ Bruce N. Alpert | |
| Bruce N. Alpert, Principal Executive Officer | ||
| Date | 3/7/19 | |
| By (Signature and Title)* | /s/ John C. Ball | |
| John C. Ball, Principal Financial Officer and Treasurer | ||
| Date | 3/7/19 | |
* Print the name and title of each signing officer under his or her signature.