UNITED STATES
SECURITIES AND EXCHANGE COMMISSION
Washington, D.C. 20549
FORM N-CSR
CERTIFIED SHAREHOLDER REPORT OF
REGISTERED MANAGEMENT INVESTMENT COMPANIES
Investment Company Act file number 811-5851
MFS INTERMARKET INCOME TRUST I
(Exact name of registrant as specified in charter)
| | |
| 500 Boylston Street, Boston, Massachusetts | | 02116 |
| (Address of principal executive offices) | | (Zip code) |
Susan S. Newton
Massachusetts Financial Services Company
500 Boylston Street
Boston, Massachusetts 02116
(Name and address of agents for service)
Registrant’s telephone number, including area code: (617) 954-5000
Date of fiscal year end: November 30
Date of reporting period: May 31, 2008
| ITEM 1. | REPORTS TO STOCKHOLDERS. |


Semiannual report
MFS® InterMarket Income Trust I
5/31/08
CMK-SEM
MFS® InterMarket Income Trust I
New York Stock Exchange Symbol: CMK
NOT FDIC INSURED Ÿ MAY LOSE VALUE Ÿ
NO BANK OR CREDIT UNION GUARANTEE Ÿ NOT A DEPOSIT Ÿ
NOT INSURED BY ANY FEDERAL GOVERNMENT AGENCY OR
NCUA/NCUSIF

LETTER FROM THE CEO
Dear Shareholders:
Negative headlines tend to resonate during difficult markets, and we certainly have had more than our share of tough news recently. As a result consumer, and particularly investor, sentiment are at all-time lows. That said, I do think it is helpful to remember there are always silver linings in the storm clouds if you look hard enough.
Through all of the challenges we have faced, there are some positive underlying trends. In the United States, for example, institutional traders and credit market followers are just now showing increasing signs of confidence and are beginning to take on more risk. At the corporate level, earnings continue to be relatively strong as companies have reduced labor costs, controlled inventories, and relied less on debt to finance expansion. More broadly, low interest rates and strong demand for consumer goods and industrial equipment are good signs for the global economy.
While I do not mean to minimize the risks inherent in today’s markets, periods such as these allow the talented fund managers and research analysts we have at MFS® to test their convictions, reevaluate existing positions, and identify new investment ideas. Our investment process also includes a significant risk management component, with constant attention paid to monitoring market risk, so we can do our best to minimize any surprises to your portfolio.
For investors, this is a great time to check in with your advisor and make sure you have a sound investment plan in place — one that can keep your hard-earned money working over the long term through a strategy that involves asset allocation, diversification, and periodic portfolio rebalancing and reviews. A plan tailored to your distinct needs and goals continues to be the best approach to help you take advantage of the inevitable challenges — and opportunities — that present themselves over time.
Respectfully,

Robert J. Manning
Chief Executive Officer and Chief Investment Officer
MFS Investment Management®
July 15, 2008
The opinions expressed in this letter are subject to change, may not be relied upon for investment advice, and no forecasts can be guaranteed.
1
PORTFOLIO COMPOSITION
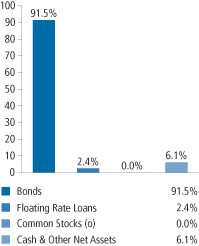
Portfolio structure
| | |
| Fixed income sectors (i) | | |
| High Yield Corporates | | 31.2% |
| Non-U.S. Government Bonds | | 23.7% |
| U.S. Treasury Securities | | 22.7% |
| High Grade Corporates | | 11.4% |
| Emerging Market Bonds | | 5.0% |
| Mortgage-Backed Securities | | 4.6% |
| Floating Rate Loans | | 2.4% |
| Asset-Backed Securities | | 0.6% |
| Municipal Bonds | | 0.4% |
| |
| Credit quality of bonds (r) | | |
| AAA | | 40.4% |
| AA | | 1.4% |
| A | | 9.7% |
| BBB | | 10.1% |
| BB | | 8.7% |
| B | | 20.9% |
| CCC | | 7.1% |
| CC (o) | | 0.0% |
| D | | 0.1% |
| Not Rated | | 1.6% |
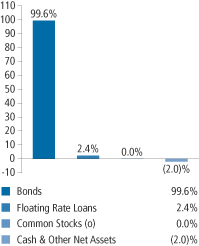
Portfolio structure reflecting equivalent exposure of derivative positions (i)
| | |
| Portfolio facts | | |
| Average Duration (d)(i) | | 5.0 |
| Average Life (i)(m) | | 7.4 yrs. |
| Average Maturity (i)(m) | | 9.6 yrs. |
Average Credit Quality of Rated
Securities (long-term) (a) | | A– |
Average Credit Quality of Rated
Securities (short-term) (a) | | A-1 |
| |
| Country weightings (i) | | |
| United States | | 65.3% |
| Japan | | 6.3% |
| Germany | | 3.5% |
| France | | 3.3% |
| Netherlands | | 3.2% |
| United Kingdom | | 3.1% |
| Canada | | 2.5% |
| Spain | | 1.9% |
| Ireland | | 1.6% |
| Other Countries | | 9.3% |
2
Portfolio Composition – continued
| (a) | The average credit quality of rated securities is based upon a market weighted average of portfolio holdings that are rated by public rating agencies. |
| (d) | Duration is a measure of how much a bond’s price is likely to fluctuate with general changes in interest rates, e.g., if rates rise 1.00%, a bond with a 5-year duration is likely to lose about 5.00% of its value. |
| (i) | For purposes of this presentation, the bond component includes accrued interest amounts and may be positively or negatively impacted by the equivalent exposure from any derivative holdings, if applicable, which may result in the investment in a sector less than 0.0%. |
| (m) | The average maturity shown is calculated using the final stated maturity on the portfolio’s holdings without taking into account any holdings which have been pre-refunded or pre-paid to an earlier date or which have a mandatory put date prior to the stated maturity. The average life shown takes into account these earlier dates. |
| (r) | Each security is assigned a rating from Moody’s Investors Service. If not rated by Moody’s, the rating will be that assigned by Standard & Poor’s. Likewise, if not assigned a rating by Standard & Poor’s, it will be based on the rating assigned by Fitch, Inc. For those portfolios that hold a security which is not rated by any of the three agencies, the security is considered Not Rated. Holdings in U.S. Treasuries and government agency mortgage-backed securities, if any, are included in the “AAA”-rating category. Percentages are based on the total market value of investments as of 5/31/08. |
Percentages are based on net assets as of 5/31/08, unless otherwise noted.
The portfolio is actively managed and current holdings may be different.
3
PORTFOLIO MANAGER’S PROFILE
| | | | |
| James Calmas | | — | | Investment Officer of MFS; employed in the investment area of MFS since 1988. Portfolio manager of the fund since June 2007. |
4
PERFORMANCE SUMMARY THROUGH 5/31/08
The following chart represents the fund’s historical performance in comparison to its benchmark(s). Investment return and principal value will fluctuate, and shares, when sold, may be worth more or less than their original cost; current performance may be lower or higher than quoted. The performance shown does not reflect the deduction of taxes, if any, that a shareholder would pay on fund distributions or the sale of fund shares.
| | | | | | | | | | | |
| Price Summary | | | | | | | |
| Six Months Ended 5/31/08 | | Date | | | Price | | |
| | | | Net Asset Value | | 5/31/08 | | | $8.86 | | |
| | | | | | 11/30/07 | | | $9.03 | | |
| | | | New York Stock Exchange Price | | 5/31/08 | | | $8.05 | | |
| | | | | | 2/12/08 | (high) (t) | | $8.34 | | |
| | | | | | 12/14/07 | (low) (t) | | $7.77 | | |
| | | | | | | 11/30/07 | | | $8.19 | | |
Total Returns vs Benchmarks
Six Months Ended 5/31/08
| | | | | | |
| | | | |
| | New York Stock Exchange Price (r) | | 1.52% | | |
| | | |
| | Net Asset Value (r) | | 1.34% | | |
| | | |
| | InterMarket Income Trust Blended Index (f)(x) | | 1.95% | | |
| | | |
| | Citigroup World Government Bond Non-Dollar Hedged Index ex-U.S. (f) | | 0.17% | | |
| | | |
| | Citigroup World Government Bond Non-Dollar Index ex-U.S. (f) | | 4.64% | | |
| | | |
| | JPMorgan Emerging Markets Bond Index Global (f) | | 2.41% | | |
| | | |
| | Lehman Brothers U.S. Credit Bond Index (f) | | 0.20% | | |
| | | |
| | Lehman Brothers U.S. Government/Mortgage Bond Index (f) | | 2.02% | | |
| | | |
| | | Lehman Brothers U.S. High-Yield Corporate Bond Index (f) | | 1.83% | | |
| (f) | Source: FactSet Research Systems Inc. |
| (r) | Includes reinvestment of dividends and capital gain distributions. |
| (t) | For the period December 1, 2007 through May 31, 2008. |
| (x) | InterMarket Income Trust Blended Index consists of 10% Lehman Brothers U.S. Credit Bond Index, 33% Lehman Brothers U.S. High-Yield Corporate Bond Index, 14% JPMorgan Emerging Markets Bond Index |
5
Performance Summary – continued
| | Global, 8.5% Citigroup World Government Bond Non-Dollar Hedged Index ex-U.S., 8.5% Citigroup World Government Bond Non-Dollar Index ex-U.S., and 26% Lehman Brothers U.S. Government/Mortgage Bond Index. |
Benchmark Definition
JPMorgan Emerging Markets Bond Index Global – measures the performance of U.S.-dollar-denominated debt instruments issued by emerging market sovereign and quasi-sovereign entities: Brady bonds, loans, Eurobonds.
Lehman Brothers U.S. Credit Bond Index – a market capitalization-weighted index that measures the performance of publicly issued, SEC-registered, U.S. corporate and specified foreign debentures and secured notes that meet specified maturity, liquidity, and quality requirements.
Lehman Brothers U.S. High-Yield Corporate Bond Index – a market capitalization-weighted index that measures the performance of non-investment grade, fixed rate debt. Eurobonds and debt issues from countries designated as emerging markets (e.g., Argentina, Brazil, Venezuela, etc.) are excluded.
Lehman Brothers U.S. Government/Mortgage Bond Index – a market capitalization-weighted index that measures the performance of debt issued by the U.S. Government, and its agencies, as well as mortgage-backed pass-through securities of Ginnie Mae (GNMA), Fannie Mae (FNMA), and Freddie Mac (FHLMC).
Citigroup World Government Bond Non-Dollar Hedged Index ex-U.S. – a market capitalization-weighted index that is designed to represent the currency-hedged performance of the international developed government bond markets, excluding the United States.
Citigroup World Government Bond Non-Dollar Index ex-U.S. – a market capitalization-weighted index that is designed to represent the performance of the international developed government bond markets, excluding the United States.
It is not possible to invest directly in an index.
Notes to Performance Summary
The fund’s shares may trade at a discount or premium to net asset value. Shareholders do not have the right to cause the fund to repurchase their shares at net asset value. When fund shares trade at a premium, buyers pay more than the net asset value underlying fund shares, and shares purchased at a premium would receive less than the amount paid for them in the event of the fund’s liquidation. As a result, the total return that is calculated based on the net asset value and New York Stock Exchange price can be different.
From time to time the fund may receive proceeds from litigation settlements, without which performance would be lower.
In accordance with Section 23(c) of the Investment Company Act of 1940, the fund hereby gives notice that it may from time to time repurchase shares of the fund in the open market at the option of the Board of Trustees and on such terms as the Trustees shall determine.
6
INVESTMENT OBJECTIVE, PRINCIPAL INVESTMENT STRATEGIES AND RISKS OF THE FUND
Investment Objective
The fund’s investment objective is to seek high current income, but may also consider capital appreciation. The fund’s objective may be changed without shareholder approval.
Principal Investment Strategies
MFS normally invests at least 80% of the fund’s net assets in U.S. and foreign government securities, and high income debt instruments. This policy may not be changed without shareholder approval.
MFS may invest the fund’s assets in other types of debt instruments. MFS may invest up to 100% of the fund’s assets in lower quality debt instruments.
MFS may invest the fund’s assets in U.S. and foreign securities, including emerging market securities. MFS may invest a relatively high percentage of the fund’s assets in a single country, a small number of countries, or a particular geographic region.
MFS may invest the fund’s assets in mortgage dollar rolls.
MFS may use derivatives for different purposes, including to earn income and enhance returns, to increase or decrease exposure to a particular market, to manage or adjust the risk profile of the fund, or as alternatives to direct investments.
MFS uses a bottom-up investment approach in buying and selling investments for the fund. Investments are selected primarily based on fundamental analysis of instruments and their issuers in light of current market, economic, political, and regulatory conditions. Factors considered may include the instrument’s credit quality, collateral characteristics, and indenture provisions, and the issuer’s management ability, capital structure, leverage, and ability to meet its current obligations. Quantitative analysis of the structure of the instrument and its features may also be considered.
The fund may use leverage by borrowing up to 33 1/3% of the fund’s assets, including borrowings for investment purposes, and investing the proceeds pursuant to its investment strategies.
In response to market, economic, political, or other conditions, MFS may depart from the fund’s principal investment strategies by temporarily investing for defensive purposes.
Principal Risks
The portfolio’s yield and share prices change daily based on the credit quality of its investments and changes in interest rates. In general, the value of debt
7
Investment Objective, Principal Investment Strategies and Risks of the Fund – continued
securities will decline when interest rates rise and will increase when interest rates fall. Debt securities with longer maturity dates will generally be subject to greater price fluctuations than those with shorter maturities. Mortgage securities are subject to prepayment risk which can offer less potential for gains in a declining interest rate environment and greater potential for loss in a rising interest rate environment. Derivatives can be highly volatile and involve risks in addition to those of the underlying indicator’s in whose value the derivative is based. Gains or losses from derivatives can be substantially greater than the derivatives’ original cost. Lower quality debt securities involve substantially greater risk of default and their value can decline significantly over time. Foreign investments can be more volatile than U.S. investments. Changes in currency exchange rates can affect the U.S. dollar rate of foreign currency investments and investments denominated in foreign currency. Investing in emerging markets can involve risks in addition to those generally associated with investing in more developed foreign markets. To the extent that investments are purchased with the proceeds from the borrowings from a bank, the fund’s net asset value will increase or decrease at a greater rate than a comparable unleveraged fund. When you sell your shares, they may be worth more or less than the amount you paid for them. Please see the fund’s registration statement for further information regarding these and other risk considerations. A copy of the fund’s registration statement on Form N-2 is available on the EDGAR database on the Securities and Exchange Commission’s Internet Web site at http://sec.gov.
8
DIVIDEND REINVESTMENT PLAN
Pursuant to the fund’s Dividend Reinvestment Plan (the “Plan”), all shareholders whose shares are registered in their own names will have all distributions reinvested automatically in additional shares of the fund by Computershare (the “Plan Agent”) unless a shareholder elects to receive cash. Shareholders whose shares are held in the name of a broker or nominee will have distributions reinvested automatically by the broker or nominee in additional shares under the Plan, unless the service is not provided by the broker or the nominee or the shareholder elects to receive distributions in cash. If the service is not available, such distributions will be paid in cash. Shareholders whose shares are held in the name of a broker or nominee should contact the broker or nominee for details. All distributions to shareholders who elect not to participate in the Plan will be paid by check mailed directly to the shareholder of record on the record date by the Plan Agent as the dividend disbursing agent.
Non-participants in the Plan will receive distributions in cash. Distributions payable to participants in the Plan will be applied by the Plan Agent, acting as agent for Plan participants, to the purchase of shares of the fund. Such shares will be purchased by the Plan Agent at the then current market price of such shares in the open market, on the New York Stock Exchange or elsewhere, for the participants’ accounts.
Participants in the Plan may withdraw from the Plan upon written notice to the Plan Agent. When a participant withdraws from the Plan or upon termination of the Plan as provided below, certificates for whole shares credited to his account under the Plan will be issued and a cash payment will be made for any fraction of a share credited to such account. A shareholder’s notice of election to withdraw from the Plan must be received by the Plan Agent before the record date for a dividend in order to be given effect with respect to that dividend.
In the case of shareholders such as banks, brokers or nominees holding shares for others who are the beneficial owners of those shares, the Plan Agent will administer the Plan on the basis of the number of shares certified from time to time by the shareholder of record as representing the total amount registered in such shareholder’s name and held for the account of beneficial owners who are to participate in the Plan.
There is no charge to Plan participants for reinvesting distributions. The Plan Agent’s fees for the handling of the reinvestment of distributions will be paid by the fund. Each participant in the Plan will pay a pro rata share of brokerage commissions incurred with respect to the Plan Agent’s open market purchases in connection with the reinvestment of distributions. Purchase orders from the participants in the Plan may be combined with those of other participants and
9
Dividend Reinvestment Plan – continued
the price paid by any particular participant may be the average of the price paid on various orders executed on behalf of groups of participants in the Plan. The automatic reinvestment of distributions will not relieve participants of any income tax that may be payable on such dividends or distributions.
The Plan may be amended or terminated on 30 days written notice to Plan participants. Contact the Plan Agent for additional information regarding the Plan. All communication concerning the Plan should be directed to Computershare Trust Company, N.A. by mail at P.O. Box 43078, Providence, RI 02940-3078, by phone at 1-800-637-2304 or by going to the Plan Agent’s website at www.computershare.com.
The following changes in the Plan will take effect on November 1, 2008:
| Ÿ | | Purchases for reinvested dividends are made at the market price unless that price exceeds the net asset value (the shares are trading at a premium). If the shares are trading at a premium, purchases will be made at a discounted price of either the net asset value or 95% of the market price, whichever is greater. |
| Ÿ | | You can buy shares of the fund through the Plan Agent on a quarterly basis. Investments may be made in any amount of $100 or more. Contact the Plan Agent for further information. |
| Ÿ | | If you withdraw from the Plan you will have three options with regard to shares held in the Plan: |
| | Ÿ | | Your full non-certificated shares will be held by the Plan Agent in your account in book-entry form and a check will be issued for the value of any fractional shares, less any applicable fees and brokerage charges. |
| | Ÿ | | The Plan Agent will sell all full and fractional shares and send the proceeds via check to your address of record. A service fee and a brokerage charge will be deducted from the proceeds. |
| | Ÿ | | If you opt to sell your shares through an investment professional, you may request your investment professional to transfer shares electronically from your Plan account to your brokerage firm account. |
10
PORTFOLIO OF INVESTMENTS
5/31/08 (unaudited)
The Portfolio of Investments is a complete list of all securities owned by your fund. It is categorized by broad-based asset classes.
| | | | | | |
| Bonds - 91.5% | | | | | | |
| Issuer | | Shares/Par | | Value ($) |
| | | | | | |
| Aerospace - 0.7% | | | | | | |
| Bombardier, Inc., 6.3%, 2014 (n) | | $ | 220,000 | | $ | 215,600 |
| DRS Technologies, Inc., 6.875%, 2013 | | | 130,000 | | | 132,925 |
| Hawker Beechcraft Acquisition Co. LLC, 9.75%, 2017 | | | 170,000 | | | 174,250 |
| Vought Aircraft Industries, Inc., 8%, 2011 | | | 200,000 | | | 193,500 |
| | | | | | |
| | | | | | $ | 716,275 |
| Apparel Manufacturers - 0.1% | | | | | | |
| Broder Brothers Co., 11.25%, 2010 | | $ | 85,000 | | $ | 55,888 |
| Hanesbrands, Inc., FRN, 8.203%, 2014 | | | 75,000 | | | 69,750 |
| | | | | | |
| | | | | | $ | 125,638 |
| Asset Backed & Securitized - 0.6% | | | | | | |
| Equity One ABS, Inc., FRN, 4.205%, 2034 | | $ | 425,000 | | $ | 376,327 |
| GMAC Mortgage Corp. Loan Trust, FRN, 4.865%, 2034 | | | 350,000 | | | 180,611 |
| | | | | | |
| | | | | | $ | 556,938 |
| Automotive - 1.2% | | | | | | |
| Allison Transmission, Inc., 11%, 2015 (n) | | $ | 220,000 | | $ | 207,350 |
| Ford Motor Credit Co. LLC, 9.75%, 2010 | | | 291,000 | | | 283,111 |
| Ford Motor Credit Co. LLC, 7.8%, 2012 | | | 220,000 | | | 194,642 |
| Ford Motor Credit Co. LLC, 12%, 2015 | | | 100,000 | | | 99,912 |
| Ford Motor Credit Co. LLC, FRN, 4.283%, 2010 | | | 110,000 | | | 101,090 |
| General Motors Acceptance Corp., 8.375%, 2033 | | | 156,000 | | | 106,860 |
| Goodyear Tire & Rubber Co., 8.625%, 2011 | | | 36,000 | | | 37,980 |
| Goodyear Tire & Rubber Co., 9%, 2015 | | | 88,000 | | | 94,380 |
| | | | | | |
| | | | | | $ | 1,125,325 |
| Broadcasting - 2.2% | | | | | | |
| Allbritton Communications Co., 7.75%, 2012 | | $ | 185,000 | | $ | 185,463 |
| CanWest MediaWorks LP, 9.25%, 2015 (n) | | | 105,000 | | | 91,875 |
| DIRECTV Holdings LLC, 7.625%, 2016 (z) | | | 175,000 | | | 174,344 |
| Grupo Televisa S.A., 6%, 2018 (z) | | | 102,000 | | | 99,708 |
| Grupo Televisa S.A., 8.5%, 2032 | | | 100,000 | | | 115,219 |
| Inmarsat Finance II PLC, 0% to 2008, 10.375% to 2012 | | | 190,000 | | | 190,000 |
| Lamar Media Corp., 6.625%, 2015 | | | 250,000 | | | 235,625 |
| Lamar Media Corp., “C”, 6.625%, 2015 | | | 95,000 | | | 89,538 |
| LBI Media, Inc., 8.5%, 2017 (n) | | | 100,000 | | | 81,000 |
| LIN TV Corp., 6.5%, 2013 | | | 220,000 | | | 208,725 |
11
Portfolio of Investments (unaudited) – continued
| | | | | | |
| Issuer | | Shares/Par | | Value ($) |
| | | | | | |
| Bonds - continued | | | | | | |
| Broadcasting - continued | | | | | | |
| Local TV Finance LLC, 9.25%, 2015 (n)(p) | | $ | 160,000 | | $ | 128,800 |
| Newport Television LLC, 13%, 2017 (p)(z) | | | 135,000 | | | 122,175 |
| Nexstar Broadcasting Group, Inc., 7%, 2014 | | | 180,000 | | | 159,300 |
| Univision Communications, Inc., 9.75%, 2015 (n)(p) | | | 350,000 | | | 264,250 |
| | | | | | |
| | | | | | $ | 2,146,022 |
| Brokerage & Asset Managers - 0.5% | | | | | | |
| Lehman Brothers Holdings, Inc., 6.5%, 2017 | | $ | 250,000 | | $ | 232,178 |
| Merrill Lynch & Co., Inc., 6.4%, 2017 | | | 40,000 | | | 38,128 |
| Nuveen Investments, Inc., 10.5%, 2015 (n) | | | 265,000 | | | 249,100 |
| | | | | | |
| | | | | | $ | 519,406 |
| Building - 0.7% | | | | | | |
| Associated Materials, Inc., 0% to 2009, 11.25% to 2014 | | $ | 130,000 | | $ | 88,725 |
| Building Materials Corp. of America, 7.75%, 2014 | | | 275,000 | | | 236,500 |
| Nortek Holdings, Inc., 10%, 2013 (z) | | | 90,000 | | | 89,438 |
| Nortek Holdings, Inc., 8.5%, 2014 | | | 140,000 | | | 98,000 |
| Ply Gem Industries, Inc., 9%, 2012 | | | 210,000 | | | 144,375 |
| | | | | | |
| | | | | | $ | 657,038 |
| Business Services - 0.8% | | | | | | |
| SunGard Data Systems, Inc., 9.125%, 2013 | | $ | 100,000 | | $ | 103,000 |
| SunGard Data Systems, Inc., 10.25%, 2015 | | | 210,000 | | | 218,400 |
| Xerox Corp., 5.5%, 2012 | | | 500,000 | | | 496,439 |
| | | | | | |
| | | | | | $ | 817,839 |
| Cable TV - 1.9% | | | | | | |
| Cablevision Systems Corp., 8%, 2012 | | $ | 110,000 | | $ | 106,975 |
| CCH I Holdings LLC, 11%, 2015 | | | 345,000 | | | 293,250 |
| CCH II Holdings LLC, 10.25%, 2010 | | | 280,000 | | | 278,600 |
| CCO Holdings LLC, 8.75%, 2013 | | | 395,000 | | | 375,250 |
| CSC Holdings, Inc., 7.625%, 2011 | | | 220,000 | | | 220,000 |
| Mediacom LLC, 9.5%, 2013 | | | 190,000 | | | 181,450 |
| NTL Cable PLC, 9.125%, 2016 | | | 130,000 | | | 127,400 |
| Virgin Media Finance PLC, 8.75%, 2014 | | EUR | 165,000 | | | 245,124 |
| | | | | | |
| | | | | | $ | 1,828,049 |
| Chemicals - 1.4% | | | | | | |
| Braskem S.A., 7.25%, 2018 (z) | | $ | 126,000 | | $ | 126,000 |
| Chemtura Corp., 6.875%, 2016 | | | 135,000 | | | 125,550 |
| Huntsman International LLC, 6.875%, 2013 (n) | | EUR | 75,000 | | | 117,107 |
| Huntsman International LLC, 7.875%, 2014 | | $ | 130,000 | | | 139,100 |
| Innophos, Inc., 8.875%, 2014 | | | 150,000 | | | 153,000 |
12
Portfolio of Investments (unaudited) – continued
| | | | | | |
| Issuer | | Shares/Par | | Value ($) |
| | | | | | |
| Bonds - continued | | | | | | |
| Chemicals - continued | | | | | | |
| Koppers Holdings, Inc., 0% to 2009, 9.875% to 2014 | | $ | 125,000 | | $ | 115,000 |
| Momentive Performance Materials, Inc., 11.5%, 2016 | | | 243,000 | | | 205,943 |
| Nalco Co., 7.75%, 2011 | | | 165,000 | | | 168,300 |
| Nalco Co., 8.875%, 2013 | | | 170,000 | | | 178,925 |
| | | | | | |
| | | | | | $ | 1,328,925 |
| Computer Software - 0.3% | | | | | | |
| First Data Corp., 9.875%, 2015 (n) | | $ | 300,000 | | $ | 271,500 |
| | |
| Consumer Goods & Services - 0.9% | | | | | | |
| Corrections Corp. of America, 6.25%, 2013 | | $ | 90,000 | | $ | 88,650 |
| GEO Group, Inc., 8.25%, 2013 | | | 165,000 | | | 169,125 |
| Jarden Corp., 7.5%, 2017 | | | 55,000 | | | 49,088 |
| KAR Holdings, Inc., 10%, 2015 | | | 135,000 | | | 122,850 |
| Service Corp. International, 7.375%, 2014 | | | 20,000 | | | 20,100 |
| Service Corp. International, 6.75%, 2016 | | | 65,000 | | | 61,913 |
| Service Corp. International, 7%, 2017 | | | 370,000 | | | 358,900 |
| | | | | | |
| | | | | | $ | 870,626 |
| Containers - 0.6% | | | | | | |
| Crown Americas LLC, 7.625%, 2013 | | $ | 100,000 | | $ | 103,000 |
| Crown Americas LLC, 7.75%, 2015 | | | 195,000 | | | 204,750 |
| Graham Packaging Co. LP, 9.875%, 2014 | | | 30,000 | | | 27,900 |
| Owens-Brockway Glass Container, Inc., 8.25%, 2013 | | | 170,000 | | | 175,950 |
| Owens-Illinois, Inc., 7.5%, 2010 | | | 100,000 | | | 102,000 |
| | | | | | |
| | | | | | $ | 613,600 |
| Defense Electronics - 0.2% | | | | | | |
| L-3 Communications Corp., 5.875%, 2015 | | $ | 120,000 | | $ | 113,700 |
| L-3 Communications Corp., 6.375%, 2015 | | | 130,000 | | | 125,288 |
| | | | | | |
| | | | | | $ | 238,988 |
| Electronics - 0.8% | | | | | | |
| Flextronics International Ltd., 6.25%, 2014 | | $ | 150,000 | | $ | 143,250 |
| Spansion LLC, 11.25%, 2016 (n) | | | 205,000 | | | 127,100 |
| Tyco Electronics Ltd., 6%, 2012 | | | 500,000 | | | 506,528 |
| | | | | | |
| | | | | | $ | 776,878 |
| Emerging Market Quasi-Sovereign - 1.2% | | | | | | |
| Gazprom International S.A., 7.201%, 2020 | | $ | 132,696 | | $ | 135,350 |
| National Development Co., 6.369%, 2018 (z) | | | 160,000 | | | 164,400 |
| National Power Corp., FRN, 6.888%, 2011 | | | 148,000 | | | 156,685 |
| Pemex Project Funding Master Trust, 5.75%, 2018 (n) | | | 426,000 | | | 423,870 |
13
Portfolio of Investments (unaudited) – continued
| | | | | | |
| Issuer | | Shares/Par | | Value ($) |
| | | | | | |
| Bonds - continued | | | | | | |
| Emerging Market Quasi-Sovereign - continued | | | | | | |
| Ras Laffan Liquefied Natural Gas Co. Ltd., 5.832%, 2016 (n) | | $ | 265,000 | | $ | 256,006 |
| | | | | | |
| | | | | | $ | 1,136,311 |
| Emerging Market Sovereign - 1.2% | | | | | | |
| Gabonese Republic, 8.2%, 2017 (n) | | $ | 234,000 | | $ | 246,870 |
| Republic of Argentina, FRN, 3.092%, 2012 | | | 298,125 | | | 256,441 |
| Republic of Colombia, 7.375%, 2017 | | | 246,000 | | | 278,226 |
| Republic of Panama, 8.875%, 2027 | | | 103,000 | | | 129,780 |
| Republic of Philippines, 9.375%, 2017 | | | 83,000 | | | 102,920 |
| Republic of Uruguay, 8%, 2022 | | | 134,000 | | | 146,730 |
| | | | | | |
| | | | | | $ | 1,160,967 |
| Energy - Independent - 1.7% | | | | | | |
| Chesapeake Energy Corp., 6.375%, 2015 | | $ | 85,000 | | $ | 81,388 |
| Hilcorp Energy I LP, 7.75%, 2015 (n) | | | 160,000 | | | 156,400 |
| Hilcorp Energy I LP, 9%, 2016 (n) | | | 115,000 | | | 119,313 |
| Mariner Energy, Inc., 8%, 2017 | | | 145,000 | | | 140,288 |
| Newfield Exploration Co., 6.625%, 2014 | | | 175,000 | | | 169,750 |
| OPTI Canada, Inc., 8.25%, 2014 | | | 235,000 | | | 242,050 |
| Plains Exploration & Production Co., 7%, 2017 | | | 280,000 | | | 269,500 |
| Plains Exploration & Production Co., 7.625%, 2018 | | | 30,000 | | | 30,150 |
| Quicksilver Resources, Inc., 7.125%, 2016 | | | 175,000 | | | 170,625 |
| Sandridge Energy, Inc., 8.625%, 2015 (p)(z) | | | 65,000 | | | 66,788 |
| Sandridge Energy, Inc., 8%, 2018 (z) | | | 105,000 | | | 106,313 |
| Southwestern Energy Co., 7.5%, 2018 (n) | | | 100,000 | | | 101,030 |
| | | | | | |
| | | | | | $ | 1,653,595 |
| Energy - Integrated - 0.6% | | | | | | |
| Petro-Canada, 6.05%, 2018 | | $ | 500,000 | | $ | 491,312 |
| Petroleum Co. of Trinidad & Tobago Ltd., 6%, 2022 | | | 100,000 | | | 97,120 |
| | | | | | |
| | | | | | $ | 588,432 |
| Entertainment - 0.1% | | | | | | |
| Marquee Holdings, Inc., 9.51%, 2014 | | $ | 85,000 | | $ | 68,425 |
| | |
| Financial Institutions - 1.2% | | | | | | |
| American Express Centurion Bank, 5.2%, 2010 | | $ | 300,000 | | $ | 302,354 |
| General Motors Acceptance Corp., 6.875%, 2011 | | | 545,000 | | | 459,485 |
| ILFC E-Capital Trust I, 5.9% to 2010, FRN to 2065 (n) | | | 500,000 | | | 424,348 |
| Residential Capital LLC, 8.5%, 2012 | | | 19,000 | | | 9,500 |
| | | | | | |
| | | | | | $ | 1,195,687 |
14
Portfolio of Investments (unaudited) – continued
| | | | | | |
| Issuer | | Shares/Par | | Value ($) |
| | | | | | |
| Bonds - continued | | | | | | |
| Food & Beverages - 1.4% | | | | | | |
| ARAMARK Corp., 8.5%, 2015 | | $ | 265,000 | | $ | 271,294 |
| B&G Foods, Inc., 8%, 2011 | | | 105,000 | | | 104,475 |
| Constellation Brands, Inc., 8.125%, 2012 | | | 95,000 | | | 96,188 |
| Cott Beverages USA, Inc., 8%, 2011 | | | 95,000 | | | 80,038 |
| Dean Foods Co., 7%, 2016 | | | 105,000 | | | 97,913 |
| Del Monte Corp., 6.75%, 2015 | | | 110,000 | | | 106,425 |
| Dr. Pepper Snapple Group, Inc., 6.82%, 2018 (z) | | | 500,000 | | | 504,250 |
| Kraft Foods, Inc., 6.125%, 2018 | | | 130,000 | | | 126,823 |
| | | | | | |
| | | | | | $ | 1,387,406 |
| Forest & Paper Products - 0.9% | | | | | | |
| Abitibi-Consolidated, Inc., 8.375%, 2015 | | $ | 135,000 | | $ | 59,063 |
| Catalyst Paper Corp., 8.625%, 2011 | | | 110,000 | | | 95,150 |
| Georgia-Pacific Corp., 7.125%, 2017 (z) | | | 95,000 | | | 93,813 |
| Georgia-Pacific Corp., 8%, 2024 | | | 145,000 | | | 139,925 |
| Graphic Packaging International Corp., 9.5%, 2013 | | | 85,000 | | | 85,638 |
| International Paper Co., 7.95%, 2018 | | | 80,000 | | | 80,277 |
| Millar Western Forest Products Ltd., 7.75%, 2013 | | | 125,000 | | | 83,750 |
| NewPage Holding Corp., 10%, 2012 | | | 70,000 | | | 74,550 |
| Norske Skog Canada Ltd., 7.375%, 2014 | | | 125,000 | | | 95,000 |
| Smurfit-Stone Container Corp., 8%, 2017 | | | 55,000 | | | 47,438 |
| | | | | | |
| | | | | | $ | 854,604 |
| Gaming & Lodging - 2.3% | | | | | | |
| Circus & Eldorado Joint Venture, 10.125%, 2012 | | $ | 115,000 | | $ | 115,144 |
| Firekeepers Development Authority, 13.875%, 2015 (z) | | | 205,000 | | | 205,513 |
| Fontainebleau Las Vegas Holdings LLC, 10.25%, 2015 (n) | | | 250,000 | | | 181,875 |
| Harrah’s Operating Co., Inc., 5.375%, 2013 | | | 10,000 | | | 6,500 |
| Harrah’s Operating Co., Inc., 5.625%, 2015 | | | 200,000 | | | 116,000 |
| Harrah’s Operating Co., Inc., 10.75%, 2016 (n) | | | 300,000 | | | 260,231 |
| Harrah’s Operating Co., Inc., 10.75%, 2018 (n)(p) | | | 190,000 | | | 150,100 |
| Jacobs Entertainment, Inc., 9.75%, 2014 | | | 125,000 | | | 98,125 |
| MGM Mirage, 5.875%, 2014 | | | 105,000 | | | 89,775 |
| Pinnacle Entertainment, Inc., 7.5%, 2015 (n) | | | 240,000 | | | 198,000 |
| Station Casinos, Inc., 6%, 2012 | | | 30,000 | | | 25,200 |
| Station Casinos, Inc., 6.875%, 2016 | | | 395,000 | | | 240,456 |
| Station Casinos, Inc., 6.625%, 2018 | | | 290,000 | | | 169,650 |
| Trump Entertainment Resorts Holdings, Inc., 8.5%, 2015 | | | 350,000 | | | 237,125 |
| Wynn Las Vegas LLC, 6.625%, 2014 | | | 180,000 | | | 173,700 |
| | | | | | |
| | | | | | $ | 2,267,394 |
| General Merchandise - 0.0% | | | | | | |
| Buhrmann U.S., Inc., 7.875%, 2015 | | $ | 40,000 | | $ | 37,850 |
15
Portfolio of Investments (unaudited) – continued
| | | | | | |
| Issuer | | Shares/Par | | Value ($) |
| | | | | | |
| Bonds - continued | | | | | | |
| Industrial - 0.5% | | | | | | |
| Blount, Inc., 8.875%, 2012 | | $ | 150,000 | | $ | 152,250 |
| JohnsonDiversey, Inc., 9.625%, 2012 | | EUR | 50,000 | | | 76,224 |
| JohnsonDiversey, Inc., “B”, 9.625%, 2012 | | $ | 265,000 | | | 270,300 |
| | | | | | |
| | | | | | $ | 498,774 |
| Insurance - 0.4% | | | | | | |
| ING Groep N.V., 5.775% to 2015, FRN to 2049 | | $ | 450,000 | | $ | 384,101 |
| | |
| Insurance - Property & Casualty - 0.2% | | | | | | |
| USI Holdings Corp., 9.75%, 2015 (n) | | $ | 215,000 | | $ | 174,150 |
| | |
| International Market Quasi-Sovereign - 0.2% | | | | | | |
| Canada Housing Trust, 4.6%, 2011 | | CAD | 210,000 | | $ | 217,472 |
| | |
| International Market Sovereign - 23.0% | | | | | | |
| Federal Republic of Germany, 5.25%, 2010 | | EUR | 1,054,000 | | $ | 1,670,574 |
| Federal Republic of Germany, 3.75%, 2015 | | EUR | 440,000 | | | 661,062 |
| Federal Republic of Germany, 6.25%, 2030 | | EUR | 531,000 | | | 976,194 |
| Government of Canada, 4.5%, 2015 | | CAD | 356,000 | | | 379,786 |
| Government of Canada, 5.75%, 2033 | | CAD | 92,000 | | | 115,503 |
| Government of Japan, 1.5%, 2012 | | JPY | 129,000,000 | | | 1,234,950 |
| Government of Japan, 1.3%, 2014 | | JPY | 217,000,000 | | | 2,034,265 |
| Government of Japan, 1.7%, 2017 | | JPY | 160,000,000 | | | 1,521,909 |
| Government of Japan, 2.2%, 2027 | | JPY | 94,000,000 | | | 880,389 |
| Government of Japan, 2.4%, 2037 | | JPY | 53,000,000 | | | 493,497 |
| Kingdom of Denmark, 4%, 2015 | | DKK | 1,878,000 | | | 375,971 |
| Kingdom of Netherlands, 3.75%, 2009 | | EUR | 1,338,000 | | | 2,066,298 |
| Kingdom of Netherlands, 3.75%, 2014 | | EUR | 124,000 | | | 186,211 |
| Kingdom of Spain, 5.35%, 2011 | | EUR | 1,140,000 | | | 1,821,531 |
| Kingdom of Sweden, 4.5%, 2015 | | SEK | 1,140,000 | | | 191,173 |
| Republic of Austria, 4.65%, 2018 | | EUR | 873,000 | | | 1,364,204 |
| Republic of France, 4.75%, 2012 | | EUR | 188,000 | | | 296,167 |
| Republic of France, 5%, 2016 | | EUR | 481,000 | | | 772,793 |
| Republic of France, 6%, 2025 | | EUR | 231,000 | | | 406,310 |
| Republic of France, 4.75%, 2035 | | EUR | 886,000 | | | 1,343,364 |
| Republic of Ireland, 4.6%, 2016 | | EUR | 985,000 | | | 1,537,153 |
| United Kingdom Treasury, 8%, 2015 | | GBP | 482,000 | | | 1,128,978 |
| United Kingdom Treasury, 8%, 2021 | | GBP | 155,000 | | | 390,145 |
| United Kingdom Treasury, 4.25%, 2036 | | GBP | 337,000 | | | 626,037 |
| | | | | | |
| | | | | | $ | 22,474,464 |
| Major Banks - 1.3% | | | | | | |
| BAC Capital Trust XIV, 5.63% to 2012, FRN to 2049 | | $ | 610,000 | | $ | 495,243 |
16
Portfolio of Investments (unaudited) – continued
| | | | | | |
| Issuer | | Shares/Par | | Value ($) |
| | | | | | |
| Bonds - continued | | | | | | |
| Major Banks - continued | | | | | | |
| Natixis S.A., 10% to 2018, FRN to 2049 (z) | | $ | 310,000 | | $ | 307,909 |
| UniCredito Italiano Capital Trust II, 9.2% to 2010, FRN to 2049 (n) | | | 500,000 | | | 490,566 |
| | | | | | |
| | | | | | $ | 1,293,718 |
| Medical & Health Technology & Services - 2.9% | | | | | | |
| Cardinal Health, Inc., 5.8%, 2016 | | $ | 279,000 | | $ | 272,665 |
| Community Health Systems, Inc., 8.875%, 2015 | | | 390,000 | | | 402,188 |
| Cooper Cos., Inc., 7.125%, 2015 | | | 160,000 | | | 153,200 |
| DaVita, Inc., 7.25%, 2015 | | | 425,000 | | | 415,438 |
| HCA, Inc., 6.375%, 2015 | | | 400,000 | | | 348,000 |
| HCA, Inc., 9.25%, 2016 | | | 250,000 | | | 264,063 |
| HCA, Inc., 9.625%, 2016 | | | 165,000 | | | 174,075 |
| LVB Acquisition Merger Sub, Inc., 10%, 2017 (n) | | | 110,000 | | | 117,975 |
| LVB Acquisition Merger Sub, Inc., 11.625%, 2017 (n) | | | 225,000 | | | 238,500 |
| Psychiatric Solutions, Inc., 7.75%, 2015 | | | 110,000 | | | 112,750 |
| U.S. Oncology, Inc., 7.949%, 2012 (p) | | | 100,000 | | | 81,500 |
| U.S. Oncology, Inc., 10.75%, 2014 | | | 100,000 | | | 100,750 |
| Universal Hospital Services, Inc., 8.5%, 2015 (p) | | | 125,000 | | | 126,250 |
| | | | | | |
| | | | | | $ | 2,807,354 |
| Metals & Mining - 1.5% | | | | | | |
| Arch Western Finance LLC, 6.75%, 2013 | | $ | 95,000 | | $ | 93,813 |
| FMG Finance Ltd., 10.625%, 2016 (n) | | | 250,000 | | | 290,000 |
| Foundation PA Coal Co., 7.25%, 2014 | | | 50,000 | | | 51,250 |
| Freeport-McMoRan Copper & Gold, Inc., 8.375%, 2017 | | | 485,000 | | | 521,375 |
| Freeport-McMoRan Copper & Gold, Inc., FRN, 5.882%, 2015 | | | 215,000 | | | 214,979 |
| Peabody Energy Corp., 7.375%, 2016 | | | 220,000 | | | 224,950 |
| PNA Group, Inc., 10.75%, 2016 | | | 120,000 | | | 114,000 |
| | | | | | |
| | | | | | $ | 1,510,367 |
| Mortgage Backed - 4.6% | | | | | | |
| Fannie Mae, 6.5%, 2036 | | $ | 1,382,010 | | $ | 1,426,623 |
| Fannie Mae, 6%, 2037 | | | 809,176 | | | 821,723 |
| Freddie Mac, 5.5%, 2026 | | | 1,500,000 | | | 1,529,277 |
| Ginnie Mae, 9%, 2016 | | | 72,407 | | | 78,821 |
| Ginnie Mae, 11%, 2018-2019 | | | 71,627 | | | 81,938 |
| Ginnie Mae, 10.5%, 2020 | | | 7,321 | | | 8,326 |
| Ginnie Mae, 5.612%, 2058 | | | 550,000 | | | 546,563 |
| | | | | | |
| | | | | | $ | 4,493,271 |
| Municipals - 0.4% | | | | | | |
| Cabazon Band Mission Indians, CA, Mortgage Notes, 13%, 2011 | | $ | 230,000 | | $ | 241,594 |
| Virginia Tobacco Settlement Financing Corp., “A-1”, 6.706%, 2046 | | | 135,000 | | | 116,613 |
| | | | | | |
| | | | | | $ | 358,207 |
17
Portfolio of Investments (unaudited) – continued
| | | | | | |
| Issuer | | Shares/Par | | Value ($) |
| | | | | | |
| Bonds - continued | | | | | | |
| Natural Gas - Distribution - 0.3% | | | | | | |
| AmeriGas Partners LP, 7.125%, 2016 | | $ | 170,000 | | $ | 164,900 |
| Inergy LP, 6.875%, 2014 | | | 150,000 | | | 144,750 |
| | | | | | |
| | | | | | $ | 309,650 |
| Natural Gas - Pipeline - 2.5% | | | | | | |
| Atlas Pipeline Partners LP, 8.125%, 2015 | | $ | 90,000 | | $ | 92,925 |
| CenterPoint Energy, Inc., 7.875%, 2013 | | | 500,000 | | | 538,645 |
| Colorado Interstate Gas Co., 6.8%, 2015 | | | 45,000 | | | 46,462 |
| Deutsche Bank (El Paso Performance-Linked Trust, CLN), 7.75%, 2011 (n) | | | 225,000 | | | 231,453 |
| El Paso Corp., 6.875%, 2014 | | | 130,000 | | | 130,452 |
| El Paso Corp., 7.25%, 2018 | | | 110,000 | | | 110,413 |
| Enterprise Products Operating LP, 5.65%, 2013 | | | 500,000 | | | 497,254 |
| OJSC AK Transneft, 5.67%, 2014 (n) | | | 319,000 | | | 309,063 |
| Williams Cos., Inc., 6.375%, 2010 (n) | | | 400,000 | | | 410,000 |
| Williams Cos., Inc., 7.75%, 2031 | | | 80,000 | | | 85,200 |
| | | | | | |
| | | | | | $ | 2,451,867 |
| Network & Telecom - 2.2% | | | | | | |
| British Telecommunications PLC, 5.15%, 2013 | | $ | 500,000 | | $ | 489,087 |
| Cincinnati Bell, Inc., 7%, 2015 | | | 135,000 | | | 130,275 |
| Citizens Communications Co., 7.875%, 2027 | | | 110,000 | | | 99,000 |
| Nordic Telephone Co. Holdings, 8.25%, 2016 (n) | | EUR | 85,000 | | | 126,276 |
| Qwest Capital Funding, Inc., 7.25%, 2011 | | $ | 265,000 | | | 259,038 |
| Qwest Communications International, Inc. “B”, 7.5%, 2014 | | | 100,000 | | | 98,000 |
| Qwest Corp., 8.875%, 2012 | | | 160,000 | | | 167,600 |
| Qwest Corp., 7.5%, 2014 | | | 95,000 | | | 94,525 |
| Telecom Italia Capital, 4.875%, 2010 | | | 500,000 | | | 495,803 |
| Windstream Corp., 8.625%, 2016 | | | 170,000 | | | 175,738 |
| | | | | | |
| | | | | | $ | 2,135,342 |
| Oil Services - 0.8% | | | | | | |
| Basic Energy Services, Inc., 7.125%, 2016 | | $ | 195,000 | | $ | 192,075 |
| Seitel, Inc., 9.75%, 2014 | | | 75,000 | | | 67,875 |
| Weatherford International Ltd., 5.95%, 2012 | | | 500,000 | | | 511,101 |
| | | | | | |
| | | | | | $ | 771,051 |
| Other Banks & Diversified Financials - 0.9% | | | | | | |
| Banco Mercantil del Norte S.A., 5.875% to 2009, FRN to 2014 (n) | | $ | 140,000 | | $ | 140,682 |
| Swedbank AB, FRN, 9%, 2049 (n) | | | 300,000 | | | 304,383 |
| UBS Preferred Funding Trust V, 6.243% to 2016, FRN to 2049 | | | 500,000 | | | 435,819 |
| | | | | | |
| | | | | | $ | 880,884 |
18
Portfolio of Investments (unaudited) – continued
| | | | | | |
| Issuer | | Shares/Par | | Value ($) |
| | | | | | |
| Bonds - continued | | | | | | |
| Pollution Control - 0.3% | | | | | | |
| Allied Waste North America, Inc., 7.875%, 2013 | | $ | 125,000 | | $ | 127,813 |
| Allied Waste North America, Inc., 7.125%, 2016 | | | 180,000 | | | 176,850 |
| | | | | | |
| | | | | | $ | 304,663 |
| Precious Metals & Minerals - 0.1% | | | | | | |
| Alrosa Finance S.A., 8.875%, 2014 | | $ | 110,000 | | $ | 119,471 |
| | |
| Printing & Publishing - 1.5% | | | | | | |
| American Media Operations, Inc., 10.25%, 2009 | | $ | 5,600 | | $ | 4,704 |
| American Media Operations, Inc., “B”, 10.25%, 2009 | | | 154,000 | | | 129,360 |
| Dex Media West LLC, 9.875%, 2013 | | | 436,000 | | | 420,195 |
| Dex Media, Inc., 0% to 2008, 9% to 2013 | | | 105,000 | | | 81,375 |
| Idearc, Inc., 8%, 2016 | | | 431,000 | | | 308,165 |
| Nielsen Co. B.V., 0% to 2011, 11.125% to 2016 | | EUR | 80,000 | | | 80,891 |
| Nielsen Finance LLC, 10%, 2014 | | $ | 165,000 | | | 170,156 |
| Nielsen Finance LLC, 0% to 2011, 12.5% to 2016 | | | 130,000 | | | 94,250 |
| Quebecor World, Inc., 6.125%, 2013 (d) | | | 75,000 | | | 37,125 |
| R.H. Donnelley Corp., 8.875%, 2016 | | | 170,000 | | | 116,450 |
| | | | | | |
| | | | | | $ | 1,442,671 |
| Railroad & Shipping - 0.5% | | | | | | |
| American Railcar Industries, Inc., 7.5%, 2014 | | $ | 90,000 | | $ | 84,150 |
| Canadian Pacific Railway Co., 6.5%, 2018 | | | 320,000 | | | 318,206 |
| Panama Canal Railway Co., 7%, 2026 (n) | | | 122,000 | | | 110,410 |
| | | | | | |
| | | | | | $ | 512,766 |
| Real Estate - 0.3% | | | | | | |
| Kimco Realty Corp., 6.875%, 2009 | | $ | 320,000 | | $ | 322,128 |
| | |
| Restaurants - 0.6% | | | | | | |
| YUM! Brands, Inc., 8.875%, 2011 | | $ | 500,000 | | $ | 545,826 |
| | |
| Retailers - 0.4% | | | | | | |
| Couche-Tard, Inc., 7.5%, 2013 | | $ | 80,000 | | $ | 81,000 |
| Federated Retail Holdings, Inc., 5.35%, 2012 | | | 300,000 | | | 282,789 |
| | | | | | |
| | | | | | $ | 363,789 |
| Specialty Chemicals - 0.1% | | | | | | |
| INVISTA, 9.25%, 2012 (n) | | $ | 100,000 | | $ | 103,500 |
| | |
| Specialty Stores - 0.1% | | | | | | |
| Payless ShoeSource, Inc., 8.25%, 2013 | | $ | 110,000 | | $ | 98,450 |
19
Portfolio of Investments (unaudited) – continued
| | | | | | |
| Issuer | | Shares/Par | | Value ($) |
| | | | | | |
| Bonds - continued | | | | | | |
| Telecommunications - Wireless - 1.2% | | | | | | |
| Alltel Corp., 7%, 2012 | | $ | 268,000 | | $ | 234,500 |
| MetroPCS Wireless, Inc., 9.25%, 2014 | | | 230,000 | | | 221,088 |
| Rural Cellular Corp., 6.075%, 2013 | | | 110,000 | | | 111,100 |
| Rural Cellular Corp., FRN, 8.622%, 2012 | | | 115,000 | | | 117,013 |
| U.S. Unwired, Inc., 10%, 2012 | | | 165,000 | | | 160,463 |
| Vimpel-Communications, 8.375%, 2013 (z) | | | 113,000 | | | 115,121 |
| Wind Acquisition Finance S.A., 10.75%, 2015 (n) | | | 164,000 | | | 175,480 |
| | | | | | |
| | | | | | $ | 1,134,765 |
| Telephone Services - 0.1% | | | | | | |
| Embarq Corp., 7.995%, 2036 | | $ | 55,000 | | $ | 53,203 |
| | |
| Tobacco - 0.2% | | | | | | |
| Alliance One International, Inc., 8.5%, 2012 | | $ | 95,000 | | $ | 90,250 |
| Reynolds American, Inc., 7.625%, 2016 | | | 130,000 | | | 135,739 |
| | | | | | |
| | | | | | $ | 225,989 |
| Transportation - 0.3% | | | | | | |
| IIRSA Norte Finance Ltd., 8.75%, 2024 | | $ | 245,113 | | $ | 280,409 |
| | |
| Transportation - Services - 0.2% | | | | | | |
| Hertz Corp., 8.875%, 2014 | | $ | 110,000 | | $ | 109,450 |
| Quality Distribution, Inc., 9%, 2010 | | | 95,000 | | | 66,500 |
| | | | | | |
| | | | | | $ | 175,950 |
| U.S. Treasury Obligations - 15.9% | | | | | | |
| U.S. Treasury Bonds, 12.5%, 2014 (f) | | $ | 5,309,000 | | $ | 5,919,950 |
| U.S. Treasury Bonds, 10.625%, 2015 | | | 2,780,000 | | | 3,966,929 |
| U.S. Treasury Bonds, 8.875%, 2019 | | | 1,817,000 | | | 2,525,205 |
| U.S. Treasury Bonds, 7.5%, 2024 | | | 865,000 | | | 1,146,936 |
| U.S. Treasury Notes, 5%, 2011 | | | 1,845,000 | | | 1,949,790 |
| | | | | | |
| | | | | | $ | 15,508,810 |
| Utilities - Electric Power - 4.5% | | | | | | |
| AES Corp., 9.375%, 2010 | | $ | 340,000 | | $ | 360,400 |
| AES Corp., 7.75%, 2014 | | | 165,000 | | | 165,000 |
| Dynegy Holdings, Inc., 7.5%, 2015 | | | 90,000 | | | 85,050 |
| Dynegy Holdings, Inc., 7.125%, 2018 | | | 195,000 | | | 179,888 |
| Edison Mission Energy, 7%, 2017 | | | 525,000 | | | 513,188 |
| Enersis S.A., 7.375%, 2014 | | | 260,000 | | | 275,194 |
| FirstEnergy Corp., 6.45%, 2011 | | | 500,000 | | | 515,455 |
| ISA Capital do Brasil S.A., 7.875%, 2012 | | | 280,000 | | | 291,200 |
| ISA Capital do Brasil S.A., 7.875%, 2012 (n) | | | 147,000 | | | 152,880 |
20
Portfolio of Investments (unaudited) – continued
| | | | | | |
| Issuer | | Shares/Par | | Value ($) |
| | | | | | |
| Bonds - continued | | | | | | |
| Utilities - Electric Power - continued | | | | | | |
| Israel Electric Corp. Ltd., 7.25%, 2019 (z) | | $ | 200,000 | | $ | 201,492 |
| Mirant North America LLC, 7.375%, 2013 | | | 180,000 | | | 181,350 |
| NRG Energy, Inc., 7.25%, 2014 | | | 95,000 | | | 93,100 |
| NRG Energy, Inc., 7.375%, 2016 | | | 590,000 | | | 575,250 |
| NRG Energy, Inc., 7.375%, 2017 | | | 70,000 | | | 68,425 |
| Reliant Energy, Inc., 7.875%, 2017 | | | 165,000 | | | 165,825 |
| Sierra Pacific Resources, 8.625%, 2014 | | | 80,000 | | | 83,688 |
| Texas Competitive Electric Holdings LLC, 10.25%, 2015 (n) | | | 445,000 | | | 454,456 |
| | | | | | |
| | | | | | $ | 4,361,841 |
| Total Bonds (Identified Cost, $90,523,468) | | | | | $ | 89,258,621 |
| | |
| Floating Rate Loans - 2.4% (g)(r) | | | | | | |
| Aerospace - 0.2% | | | | | | |
| Hawker Beechcraft Acquisition Co., Letter of Credit, 4.7%, 2014 | | $ | 10,913 | | $ | 10,216 |
| Hawker Beechcraft Acquisition Co., Term Loan, 4.7%, 2014 | | | 187,269 | | | 175,301 |
| | | | | | |
| | | | | | $ | 185,517 |
| Automotive - 0.4% | | | | | | |
| Allison Transmission, Inc., Term Loan B, 5.53%, 2014 | | $ | 94,200 | | $ | 86,266 |
| Federal-Mogul Corp., Term Loan B, 4.49%, 2015 | | | 135,720 | | | 116,041 |
| Ford Motor Co., Term Loan B, 5.8%, 2013 | | | 66,462 | | | 57,254 |
| Goodyear Tire & Rubber Co., Second Lien Term Loan, 4.54%, 2014 | | | 93,286 | | | 87,152 |
| Mark IV Industries, Inc., Second Lien Term Loan, 11.3%, 2011 | | | 107,322 | | | 43,465 |
| | | | | | |
| | | | | | $ | 390,178 |
| Broadcasting - 0.1% | | | | | | |
| Young Broadcasting, Inc., Term Loan, 5.23%, 2012 | | $ | 92,924 | | $ | 83,167 |
| Young Broadcasting, Inc., Term Loan B-1, 5.25%, 2012 | | | 49,542 | | | 44,340 |
| | | | | | |
| | | | | | $ | 127,507 |
| Cable TV - 0.1% | | | | | | |
| CSC Holdings, Inc., Incremental Term Loan, 4.34%, 2013 | | $ | 126,623 | | $ | 120,119 |
| | |
| Computer Software - 0.2% | | | | | | |
| First Data Corp., Term Loan B-1, 5.17%, 2014 | | $ | 169,890 | | $ | 157,476 |
| | |
| Forest & Paper Products - 0.0% | | | | | | |
| Abitibi-Consolidated, Inc., Term Loan, 11.5%, 2009 | | $ | 46,366 | | $ | 46,018 |
| | |
| Gaming & Lodging - 0.2% | | | | | | |
| Green Valley Ranch Gaming LLC, Second Lien Term Loan, 5.89%, 2014 (o) | | $ | 117,595 | | $ | 77,172 |
21
Portfolio of Investments (unaudited) – continued
| | | | | | |
| Issuer | | Shares/Par | | Value ($) |
| | | | | | |
| Floating Rate Loans - continued | | | | | | |
| Gaming & Lodging - continued | | | | | | |
| Harrah’s Entertainment, Inc., Term Loan B-2, 5.92%, 2015 | | $ | 83,051 | | $ | 77,536 |
| | | | | | |
| | | | | | $ | 154,708 |
| Medical & Health Technology & Services - 0.2% | | | | | | |
| Community Health Systems, Inc., Delayed Draw Term Loan, 2014 (q) | | $ | 3,210 | | $ | 3,026 |
| Community Health Systems, Inc., Term Loan B, 4.83%, 2014 | | | 62,717 | | | 59,122 |
| HCA, Inc., Term Loan B, 4.95%, 2013 | | | 149,621 | | | 140,702 |
| | | | | | |
| | | | | | $ | 202,850 |
| Printing & Publishing - 0.2% | | | | | | |
| Idearc, Inc., Term Loan B, 2014 (o) | | $ | 16,693 | | $ | 13,868 |
| Tribune Co., Term Loan B, 2014 (o) | | | 205,981 | | | 152,254 |
| | | | | | |
| | | | | | $ | 166,122 |
| Specialty Stores - 0.2% | | | | | | |
| Michaels Stores, Inc., Term Loan B, 5.04%, 2013 | | $ | 189,779 | | $ | 164,918 |
| | |
| Telecommunications - Wireless - 0.3% | | | | | | |
| ALLTEL Communications, Inc., Term Loan B-2, 2015 (o) | | $ | 91,271 | | $ | 84,603 |
| Wind Acquisition Holdings Syndicated Loan, 9.98%, 2011 | | | 227,328 | | | 221,076 |
| | | | | | |
| | | | | | $ | 305,679 |
| Utilities - Electric Power - 0.3% | | | | | | |
| Calpine Corp., DIP Term Loan, 5.57%, 2009 | | $ | 145,703 | | $ | 140,922 |
Texas Competitive Electric Holdings LLC, Term Loan B-3,
6.26%, 2014 | | | 189,745 | | | 178,313 |
| | | | | | |
| | | | | | $ | 319,235 |
| Total Floating Rate Loans (Identified Cost, $2,365,149) | | | | | $ | 2,340,327 |
| | |
| Common Stock - 0.0% | | | | | | |
| Trucking - 0.0% | | | | | | |
| Quality Distribution, Inc. (Identified Cost, $0) (a)(z) | | | 671 | | $ | 2,348 |
22
Portfolio of Investments (unaudited) – continued
| | | | | | | | | | | |
| Warrants - 0.0% | | | | | | | | | | | |
| Issuer | | Strike Price | | First Exercise | | Shares/Par | | Value ($) |
| | | | | | | | | | | |
| Telephone Services - 0.0% | | | | | | | | | | | |
| Jazztel PLC (6 shares for 1 warrant) (Identified Cost, $79) (a)(z) | | EUR | 34.10 | | 6/28/00 | | | 40 | | $ | 0 |
| | | |
| Short-Term Obligations - 4.5% (y) | | | | | | | | |
| Cargill, Inc., 2.25%, due 6/02/08 (t) | | | | | | | $ | 3,899,000 | | $ | 3,898,756 |
| General Electric Capital Corp., 2.35%, due 6/02/08 | | | | | | | | 509,000 | | | 508,967 |
| Total Short-Term Obligations, at Amortized Cost and Value | | | | | $ | 4,407,723 |
| Total Investments (Identified Cost, $97,296,419) | | | | | | | $ | 96,009,019 |
| | | |
| Other Assets, Less Liabilities - 1.6% | | | | | | | | 1,579,606 |
| Net Assets - 100.0% | | | | | | | | | | $ | 97,588,625 |
| (a) | Non-income producing security. |
| (d) | Non-income producing security – in default. |
| (f) | All or a portion of the security has been segregated as collateral for open futures contracts. |
| (g) | The rate shown represents a weighted average coupon rate on settled positions at period end. |
| (n) | Securities exempt from registration under Rule 144A of the Securities Act of 1933. These securities may be sold in the ordinary course of business in transactions exempt from registration, normally to qualified institutional buyers. At period end, the aggregate value of these securities was $8,380,638, representing 8.59% of net assets. |
| (o) | All or a portion of this position has not settled. Upon settlement date, interest rates will be determined. |
| (p) | Payment-in-kind security. |
| (q) | All or a portion of this position represents an unfunded loan commitment. The rate shown represents a weighted average coupon rate on the full position, including the unfunded loan commitment which has no current coupon rate. |
| (r) | Remaining maturities of floating rate loans may be less than stated maturities shown as a result of contractual or optional prepayments by the borrower. Such prepayments cannot be predicted with certainty. These loans may be subject to restrictions on resale. Floating rate loans generally have rates of interest which are determined periodically by reference to a base lending rate plus a premium. |
| (t) | Security exempt from registration with the U.S. Securities and Exchange Commission under Section 4(2) of the Securities Act of 1933. |
| (y) | The rate shown represents an annualized yield at time of purchase. |
23
Portfolio of Investments (unaudited) – continued
| (z) | Restricted securities are not registered under the Securities Act of 1933 and are subject to legal restrictions on resale. These securities generally may be resold in transactions exempt from registration or to the public if the securities are subsequently registered. Disposal of these securities may involve time-consuming negotiations and prompt sale at an acceptable price may be difficult. The fund holds the following restricted securities: |
| | | | | | |
| Restricted Securities | | Acquisition
Date | | Cost | | Current
Market
Value |
| Braskem S.A., 7.25%, 2018 | | 5/29/08 | | $124,900 | | $126,000 |
| DIRECTV Holdings LLC, 7.625%, 2016 | | 5/07/08 | | 175,000 | | 174,344 |
| Dr. Pepper Snapple Group, Inc., 6.82%, 2018 | | 5/14/08 | | 513,775 | | 504,250 |
| Firekeepers Development Authority, 13.875%, 2015 | | 4/22/08 | | 198,000 | | 205,513 |
| Georgia-Pacific Corp., 7.125%, 2017 | | 4/22/08-4/23/08 | | 95,125 | | 93,813 |
| Grupo Televisa S.A., 6%, 2018 | | 5/06/08 | | 101,266 | | 99,708 |
| Israel Electric Corp. Ltd., 7.25%, 2019 | | 5/01/08 | | 199,662 | | 201,492 |
| Jazztel PLC (Warrant) | | 10/09/02 | | 79 | | 0 |
| National Development Co., 6.369%, 2018 | | 5/28/08 | | 160,960 | | 164,400 |
| Natixis S.A., 10% to 2018, FRN to 2049 | | 4/24/08 | | 310,000 | | 307,909 |
| Newport Television LLC, 13%, 2017 | | 5/05/08 | | 118,200 | | 122,175 |
| Nortek Holdings, Inc., 10%, 2013 | | 5/13/08 | | 89,061 | | 89,438 |
| Quality Distribution, Inc. | | 12/28/06 | | 0 | | 2,348 |
| Sandridge Energy, Inc., 8%, 2018 | | 5/15/08 | | 105,000 | | 106,313 |
| Sandridge Energy, Inc., 8.625%, 2015 | | 5/07/08 | | 67,600 | | 66,788 |
| Vimpel-Communications, 8.375%, 2013 | | 4/24/08 | | 113,000 | | 115,121 |
| Total Restricted Securities | | | | | | $2,379,612 |
| % of Net Assets | | | | | | 2.4% |
The following abbreviations are used in this report and are defined:
| FRN | | Floating Rate Note. Interest rate resets periodically and may not be the rate reported at period end. |
Abbreviations indicate amounts shown in currencies other than the U.S. dollar. All amounts are stated in U.S. dollars unless otherwise indicated. A list of abbreviations is shown below:
| CNY | | Chinese Yuan Renminbi |
24
Portfolio of Investments (unaudited) – continued
Derivative Contracts at 5/31/08
Forward Foreign Currency Exchange Contracts at 5/31/08
| | | | | | | | | | | | | | | | |
| Type | | Currency | | Contracts to
Deliver/Receive | | Settlement
Date Range | | In Exchange
for | | Contracts
at Value | | Net
Unrealized
Appreciation
(Depreciation) | |
| Appreciation | | | | | | | | | | | |
| BUY | | CAD | | 7,506 | | 6/24/08 | | $ | 7,401 | | $ | 7,542 | | $ | 141 | |
| BUY | | CNY | | 2,039,188 | | 8/21/08 | | | 295,000 | | | 296,562 | | | 1,562 | |
| SELL | | DKK | | 1,860,932 | | 6/16/08 | | | 393,540 | | | 387,779 | | | 5,761 | |
| SELL | | JPY | | 217,215,567 | | 6/30/08 | | | 2,109,442 | | | 2,063,182 | | | 46,260 | |
| BUY | | MXN | | 1,059,220 | | 6/09/08 | | | 99,563 | | | 102,487 | | | 2,924 | |
| SELL | | SEK | | 958,307 | | 6/30/08 | | | 160,406 | | | 159,485 | | | 921 | |
| | | | | | | | | | | | | | | | |
| | | | | | | | | | | | | | $ | 57,569 | |
| | | | | | | | | | | | | | | | |
| | | | | | |
| Depreciation | | | | | | | | | | | | | |
| SELL | | CAD | | 724,522 | | 6/24/08 | | $ | 710,229 | | $ | 728,025 | | $ | (17,796 | ) |
| BUY | | EUR | | 3,395,115 | | 6/30/08 | | | 5,282,485 | | | 5,274,071 | | | (8,414 | ) |
| SELL | | EUR | | 8,245,358 | | 6/30/08 | | | 12,682,849 | | | 12,808,582 | | | (125,733 | ) |
| BUY | | GBP | | 52,469 | | 6/30/08 | | | 103,684 | | | 103,684 | | | 0 | |
| SELL | | GBP | | 1,200,119 | | 6/30/08 | | | 2,353,914 | | | 2,371,545 | | | (17,631 | ) |
| BUY | | JPY | | 999,731 | | 6/30/08 | | | 9,535 | | | 9,496 | | | (39 | ) |
| BUY | | NOK | | 221,199 | | 6/18/08 | | | 44,401 | | | 43,289 | | | (1,112 | ) |
| | | | | | | | | | | | | | | | |
| | | | | | | | | | | | | | $ | (170,725 | ) |
| | | | | | | | | | | | | | | | |
Futures contracts outstanding at 5/31/08
| | | | | | | | | |
| Description | | Contracts | | Value | | Expiration
Date | | Unrealized
Appreciation/
(Depreciation) | |
| U.S. Treasury Note 5 yr (Long) | | 30 | | $3,298,125 | | Sep-08 | | $(5,730 | ) |
| U.S. Treasury Note 10 yr (Long) | | 27 | | 3,034,969 | | Sep-08 | | (4,313 | ) |
| | | | | | | | $(10,043 | ) |
| | | | | | | | | |
At May 31, 2008, the fund had sufficient cash and/or other liquid securities to cover any commitments under these derivative contracts.
See Notes to Financial Statements
25
Financial Statements
STATEMENT OF ASSETS AND LIABILITIES
At 5/31/08 (unaudited)
This statement represents your fund’s balance sheet, which details the assets and liabilities comprising the total value of the fund.
| | | | | |
| Assets | | | | | |
| Investments, at value (identified cost, $97,296,419) | | $96,009,019 | | | |
| Cash | | 1,393 | | | |
| Receivable for forward foreign currency exchange contracts | | 57,569 | | | |
| Receivable for daily variation margin on open futures contracts | | 9,563 | | | |
| Receivable for investments sold | | 1,147,072 | | | |
| Interest receivable | | 1,706,851 | | | |
| Other assets | | 36,621 | | | |
| Total assets | | | | | $98,968,088 |
| Liabilities | | | | | |
| Distributions payable | | $48,120 | | | |
| Payable for forward foreign currency exchange contracts | | 170,725 | | | |
| Payable for investments purchased | | 1,124,716 | | | |
| Payable to affiliates | | | | | |
Management fee | | 5,997 | | | |
Transfer agent and dividend disbursing costs | | 1,327 | | | |
Administrative services fee | | 191 | | | |
| Payable for independent trustees’ compensation | | 15,531 | | | |
| Accrued expenses and other liabilities | | 12,856 | | | |
| Total liabilities | | | | | $1,379,463 |
| Net assets | | | | | $97,588,625 |
| Net assets consist of | | | | | |
| Paid-in capital | | $120,444,508 | | | |
Unrealized appreciation (depreciation) on investments and
translation of assets and liabilities in foreign currencies | | (1,395,845 | ) | | |
Accumulated net realized gain (loss) on investments and foreign
currency transactions | | (21,186,080 | ) | | |
| Accumulated distributions in excess of net investment income | | (273,958 | ) | | |
| Net assets | | | | | $97,588,625 |
| Shares of beneficial interest outstanding | | | | | 11,009,000 |
Net asset value per share (net assets of
$97,588,625/11,009,000 shares of beneficial interest
outstanding) | | | | | $8.86 |
See Notes to Financial Statements
26
Financial Statements
STATEMENT OF OPERATIONS
Six months ended 5/31/08 (unaudited)
This statement describes how much your fund earned in investment income and accrued in expenses. It also describes any gains and/or losses generated by fund operations.
| | | | | | |
| Net investment income | | | | | | |
| Interest income | | | | | $3,113,048 | |
| Expenses | | | | | | |
Management fee | | $369,490 | | | | |
Transfer agent and dividend disbursing costs | | 8,858 | | | | |
Administrative services fee | | 11,749 | | | | |
Independent trustees’ compensation | | 6,746 | | | | |
Stock exchange fee | | 4,387 | | | | |
Custodian fee | | 22,818 | | | | |
Shareholder communications | | 9,950 | | | | |
Auditing fees | | 29,756 | | | | |
Legal fees | | 15,586 | | | | |
Miscellaneous | | 12,617 | | | | |
| Total expenses | | | | | $491,957 | |
Fees paid indirectly | | (2,533 | ) | | | |
Reduction of expenses by investment adviser | | (243 | ) | | | |
| Net expenses | | | | | $489,181 | |
| Net investment income | | | | | $2,623,867 | |
| Realized and unrealized gain (loss) on investments | | | | | | |
| Realized gain (loss) (identified cost basis) | | | | | | |
Investment transactions | | $826,758 | | | | |
Futures contracts | | (17,158 | ) | | | |
Swap transactions | | 5,676 | | | | |
Foreign currency transactions | | (699,912 | ) | | | |
Net realized gain (loss) on investments
and foreign currency transactions | | | | | $115,364 | |
| Change in unrealized appreciation (depreciation) | | | | | | |
Investments | | $(1,513,745 | ) | | | |
Futures contracts | | (18,500 | ) | | | |
Translation of assets and liabilities in foreign currencies | | (116,495 | ) | | | |
Net unrealized gain (loss) on investments and foreign
currency translation | | | | | $(1,648,740 | ) |
Net realized and unrealized gain (loss) on investments and
foreign currency | | | | | $(1,533,376 | ) |
| Change in net assets from operations | | | | | $1,090,491 | |
See Notes to Financial Statements
27
Financial Statements
STATEMENTS OF CHANGES IN NET ASSETS
These statements describe the increases and/or decreases in net assets resulting from operations, any distributions, and any shareholder transactions.
| | | | | | |
| | | Six months ended
5/31/08
(unaudited) | | | Year ended
11/30/07 | |
| Change in net assets | | | | | | |
| From operations | | | | | | |
| Net investment income | | $2,623,867 | | | $5,176,732 | |
Net realized gain (loss) on investments
and foreign currency transactions | | 115,364 | | | 2,752,008 | |
| Net unrealized gain (loss) on investments and foreign currency translation | | (1,648,740 | ) | | (2,839,451 | ) |
| Change in net assets from operations | | $1,090,491 | | | $5,089,289 | |
| Distributions declared to shareholders | | | | | | |
| From net investment income | | $(2,906,376 | ) | | $(7,106,314 | ) |
| Total change in net assets | | $(1,815,885 | ) | | $(2,017,025 | ) |
| Net assets | | | | | | |
| At beginning of period | | 99,404,510 | | | 101,421,535 | |
| At end of period (including accumulated distributions in excess of net investment income of $273,958 and undistributed net investment income of $8,551) | | $97,588,625 | | | $99,404,510 | |
See Notes to Financial Statements
28
Financial Statements
FINANCIAL HIGHLIGHTS
The financial highlights table is intended to help you understand the fund’s financial performance for the semiannual period and the past 5 fiscal years. Certain information reflects financial results for a single fund share. The total returns in the table represent the rate by which an investor would have earned (or lost) on an investment in the fund share class (assuming reinvestment of all distributions) held for the entire period.
| | | | | | | | | | | | | | | | | | |
| | | Six months
ended
5/31/08
(unaudited) | | | Years ended 11/30 | |
| | | | 2007 | | | 2006 | | | 2005 | | | 2004 | | | 2003 | |
| | | | | | | | | | | | | | | | | |
| Net asset value, beginning of period | | $9.03 | | | $9.21 | | | $9.25 | | | $9.79 | | | $9.47 | | | $8.60 | |
| Income (loss) from investment operations | | | | | | | | | | | | | | | | |
Net investment income (d) | | $0.24 | | | $0.47 | | | $0.50 | | | $0.55 | | | $0.56 | | | $0.59 | |
Net realized and unrealized gain
(loss) on investments and
foreign currency | | (0.15 | ) | | (0.00 | )(w) | | 0.14 | | | (0.35 | ) | | 0.46 | | | 0.93 | |
| Total from investment operations | | $0.09 | | | $0.47 | | | $0.64 | | | $0.20 | | | $1.02 | | | $1.52 | |
| Less distributions declared to shareholders | | | | | | | | | | | | | | | | |
From net investment income | | $(0.26 | ) | | $(0.65 | ) | | $(0.68 | ) | | $(0.63 | ) | | $(0.60 | ) | | $(0.65 | ) |
From net realized gain on
investments | | — | | | — | | | — | | | (0.11 | ) | | (0.10 | ) | | — | |
Total distributions declared to
shareholders | | $(0.26 | ) | | $(0.65 | ) | | $(0.68 | ) | | $(0.74 | ) | | $(0.70 | ) | | $(0.65 | ) |
| Net asset value, end of period | | $8.86 | | | $9.03 | | | $9.21 | | | $9.25 | | | $9.79 | | | $9.47 | |
| Per share market value, end of period | | $8.05 | | | $8.19 | | | $8.44 | | | $8.09 | | | $8.68 | | | $8.96 | |
| Total return at market value (%) | | 1.52 | (n) | | 4.84 | | | 13.27 | | | 1.30 | | | 4.91 | | | 20.93 | |
| Total return at net asset value (%) (t) | | 1.34 | (n) | | 5.93 | | | 8.10 | | | 2.69 | | | 11.96 | | | 18.60 | |
Ratios (%) (to average net assets) and
Supplemental data: | | | | | | | | | | | | | | | | |
| Expenses before expense reductions (f) | | 1.00 | (a) | | 1.02 | | | 1.11 | | | 1.04 | | | 1.01 | | | 1.04 | |
| Expenses after expense reductions (f) | | 1.00 | (a) | | 1.02 | | | N/A | | | N/A | | | N/A | | | N/A | |
| Net investment income | | 5.33 | (a) | | 5.15 | | | 5.49 | | | 5.76 | | | 5.91 | | | 6.44 | |
| Portfolio turnover | | 43 | | | 88 | | | 45 | | | 47 | | | 73 | | | 64 | |
Net assets at end of period
(000 Omitted) | | $97,589 | | | $99,405 | | | $101,422 | | | $101,874 | | | $107,797 | | | $104,238 | |
| (d) | Per share data is based on average shares outstanding. |
| (f) | Ratios do not reflect reductions from fees paid indirectly, if applicable. |
| (t) | Prior to November 30, 2007, total return at net asset value is unaudited. |
| (w) | Per share amount was less than $0.01. |
See Notes to Financial Statements
29
NOTES TO FINANCIAL STATEMENTS
(unaudited)
| (1) | | Business and Organization |
MFS InterMarket Income Trust I (the fund) is organized as a Massachusetts business trust and is registered under the Investment Company Act of 1940, as amended, as a closed-end management investment company.
| (2) | | Significant Accounting Policies |
General – The preparation of financial statements in conformity with U.S. generally accepted accounting principles requires management to make estimates and assumptions that affect the reported amounts of assets and liabilities, and disclosure of contingent assets and liabilities at the date of the financial statements and the reported amounts of revenues and expenses during the reporting period. Actual results could differ from those estimates. The fund can invest in foreign securities, including securities of emerging market issuers. Investments in foreign securities are vulnerable to the effects of changes in the relative values of the local currency and the U.S. dollar and to the effects of changes in each country’s legal, political, and economic environment. The markets of emerging markets countries are generally more volatile than the markets of developed countries with more mature economies. All of the risks of investing in foreign securities previously described are heightened when investing in emerging markets countries.
Investment Valuations – Equity securities, including restricted equity securities, are generally valued at the last sale or official closing price as reported by an independent pricing service on the market or exchange on which they are primarily traded. For securities for which there were no sales reported that day, equity securities are generally valued at the last quoted daily bid quotation as reported by an independent pricing service on the market or exchange on which they are primarily traded. For securities held short for which there were no sales reported for the day, the position is generally valued at the last quoted daily ask quotation as reported by an independent pricing service on the market or exchange on which such securities are primarily traded. Debt instruments and floating rate loans (other than short-term instruments), including restricted debt instruments, are generally valued at an evaluated or composite bid as reported by an independent pricing service. Short-term instruments with a maturity at issuance of 60 days or less may be valued at amortized cost, which approximates market value. Futures contracts are generally valued at last posted settlement price as reported by an independent pricing service on the market on which they are primarily traded. Futures contracts for which there were no trades that day for a particular position are generally valued at the closing bid quotation as reported by an independent pricing service on the market on which such futures contracts are
30
Notes to Financial Statements (unaudited) – continued
primarily traded. Forward foreign currency contracts are generally valued at the mean of bid and asked prices for the time period interpolated from rates reported by an independent pricing service for proximate time periods. Securities and other assets generally valued on the basis of information from an independent pricing service may also be valued at a broker-dealer bid quotation. Values obtained from pricing services can utilize both dealer-supplied valuations and electronic data processing techniques, which take into account factors such as institutional-size trading in similar groups of securities, yield, quality, coupon rate, maturity, type of issue, trading characteristics, and other market data. The values of foreign securities and other assets and liabilities expressed in foreign currencies are converted to U.S. dollars using the mean of bid and asked prices for rates reported by an independent pricing service.
The Board of Trustees has delegated primary responsibility for determining or causing to be determined the value of the fund’s investments (including any fair valuation) to the adviser pursuant to valuation policies and procedures approved by the Board. If the adviser determines that reliable market quotations are not readily available, investments are valued at fair value as determined in good faith by the adviser in accordance with such procedures under the oversight of the Board of Trustees. Under the fund’s valuation policies and procedures, market quotations are not considered to be readily available for most types of debt instruments and floating rate loans and many types of derivatives. These investments are generally valued at fair value based on information from independent pricing services. In addition, investments may be valued at fair value if the adviser determines that an investment’s value has been materially affected by events occurring after the close of the exchange or market on which the investment is principally traded (such as foreign exchange or market) and prior to the determination of the fund’s net asset value, or after the halting of trading of a specific security where trading does not resume prior to the close of the exchange or market on which the security is principally traded. The adviser may rely on independent pricing services or other information (such as the correlation with price movements of similar securities in the same or other markets; the type, cost and investment characteristics of the security; the business and financial condition of the issuer; and trading and other market data) to assist in determining whether to fair value and at what value to fair value an investment. The value of an investment for purposes of calculating the fund’s net asset value can differ depending on the source and method used to determine value. When fair valuation is used, the value of investments used to determine the fund’s net asset value may differ from quoted or published prices for the same investments.
The fund adopted FASB Statement No. 157, Fair Value Measurements (the “Statement”) in this reporting period. This Statement provides a single
31
Notes to Financial Statements (unaudited) – continued
definition of fair value, a hierarchy for measuring fair value and expanded disclosures about fair value measurements.
Various inputs are used in determining the value of the fund’s assets or liabilities carried at market value. These inputs are categorized into three broad levels. Level 1 includes quoted prices in active markets for identical assets or liabilities. Level 2 includes other significant observable market-based inputs (including quoted prices for similar securities, interest rates, prepayment speed, and credit risk). Level 3 includes unobservable inputs, which may include the adviser’s own assumptions in determining the fair value of investments. Other financial instruments are derivative instruments not reflected in total investments, such as futures, forwards, swap contracts and written options, which are valued at the unrealized appreciation/depreciation on the instrument. The following is a summary of the levels used as of May 31, 2008 in valuing the fund’s assets or liabilities carried at market value:
| | | | | | | | | | | |
| | | Level 1 | | | Level 2 | | | Level 3 | | Total | |
| Investments in Securities | | $2,348 | | | $96,006,671 | | | $— | | $96,009,019 | |
| Other Financial Instruments | | $(10,043 | ) | | $(113,156 | ) | | $— | | $(123,199 | ) |
Repurchase Agreements – The fund may enter into repurchase agreements with institutions that the fund’s investment adviser has determined are creditworthy. Each repurchase agreement is recorded at cost. The fund requires that the securities collateral in a repurchase transaction be transferred to a custodian in a manner sufficient to enable the fund to obtain those securities in the event of a default under the repurchase agreement. The fund monitors, on a daily basis, the value of the collateral to ensure that its value, including accrued interest, is greater than amounts owed to the fund under each such repurchase agreement. The fund and other funds managed by Massachusetts Financial Services Company (MFS), may utilize a joint trading account for the purpose of entering into one or more repurchase agreements.
Foreign Currency Translation – Purchases and sales of foreign investments, income, and expenses are converted into U.S. dollars based upon currency exchange rates prevailing on the respective dates of such transactions. Gains and losses attributable to foreign currency exchange rates on sales of securities are recorded for financial statement purposes as net realized gains and losses on investments. Gains and losses attributable to foreign exchange rate movements on income and expenses are recorded for financial statement purposes as foreign currency transaction gains and losses. That portion of both realized and unrealized gains and losses on investments that results from fluctuations in foreign currency exchange rates is not separately disclosed.
Derivative Risk – The fund may invest in derivatives for hedging or non-hedging purposes. While hedging can reduce or eliminate losses, it can also reduce or eliminate gains. When the fund uses derivatives as an
32
Notes to Financial Statements (unaudited) – continued
investment to gain market exposure, or for hedging purposes, gains and losses from derivative instruments may be substantially greater than the derivative’s original cost. Cash that has been segregated on behalf of certain derivative contracts will be reported separately on the Statement of Assets and Liabilities as restricted cash. Derivative instruments include futures contracts and forward foreign currency exchange contracts.
Futures Contracts – The fund may enter into futures contracts for the delayed delivery of securities or currency, or contracts based on financial indices at a fixed price on a future date. In entering such contracts, the fund is required to deposit with the broker either in cash or securities an amount equal to a certain percentage of the contract amount. Subsequent payments are made or received by the fund each day, depending on the daily fluctuations in the value of the contract, and are recorded for financial statement purposes as unrealized gains or losses by the fund. Upon entering into such contracts, the fund bears the risk of interest or exchange rates or securities prices moving unexpectedly, in which case, the fund may not achieve the anticipated benefits of the futures contracts and may realize a loss.
Forward Foreign Currency Exchange Contracts – The fund may enter into forward foreign currency exchange contracts for the purchase or sale of a specific foreign currency at a fixed price on a future date. Risks may arise upon entering into these contracts from the potential inability of counterparties to meet the terms of their contracts and from unanticipated movements in the value of the contract. The fund may enter into forward foreign currency exchange contracts for hedging purposes as well as for non-hedging purposes. For hedging purposes, the fund may enter into contracts to deliver or receive foreign currency it will receive from or require for its normal investment activities. The fund may also use contracts in a manner intended to protect foreign currency denominated securities from declines in value due to unfavorable exchange rate movements. For non-hedging purposes, the fund may enter into contracts with the intent of changing the relative exposure of the fund’s portfolio of securities to different currencies to take advantage of anticipated changes. The forward foreign currency exchange contracts are adjusted by the daily exchange rate of the underlying currency and any gains or losses are recorded as unrealized until the contract settlement date. On contract settlement date, the gains or losses are recorded as realized gains or losses on foreign currency transactions.
In March 2008, FASB Statement No. 161, Disclosures about Derivative Instruments and Hedging Activities (the “Standard”) was issued, and is effective for financial statements issued for fiscal years and interim periods beginning after November 15, 2008. This Standard provides enhanced disclosures about the fund’s use of and accounting for derivative instruments
33
Notes to Financial Statements (unaudited) – continued
and the effect of derivative instruments on the fund’s results of operations and financial position. Management is evaluating the application of the Standard to the fund, and has not at this time determined the impact, if any, resulting from the adoption of this Standard on the fund’s financial statements.
Hybrid Instruments – The fund may invest in indexed or hybrid securities on which any combination of interest payments, the principal or stated amount payable at maturity is determined by reference to prices of other securities, currencies, indexes, economic factors or other measures, including interest rates, currency exchange rates, or securities indices. The risks of investing in hybrid instruments reflect a combination of the risks of investing in securities, swaps, options, futures and currencies. Hybrid instruments are potentially more volatile and carry greater market risks than traditional debt instruments. Depending on the structure of the particular hybrid instrument, changes in a benchmark, underlying assets or economic indicator may be magnified by the terms of the hybrid instrument and have an even more dramatic and substantial effect upon the value of the hybrid instrument. Also, the prices of the hybrid instrument and the benchmark, underlying asset or economic indicator may not move in the same direction or at the same time.
Loans and Other Direct Debt Instruments – The fund may invest in loans and loan participations or other receivables. These investments may include standby financing commitments, including revolving credit facilities, which obligate the fund to supply additional cash to the borrower on demand. Loan participations involve a risk of insolvency of the lending bank or other financial intermediary. At May 31, 2008, the portfolio had unfunded loan commitments of $3,210, which could be extended at the option of the borrower and which are covered by sufficient cash and/or liquid securities held by the fund. The market value and obligation of the fund on these unfunded loan commitments is included in Investments, at value and Payable for investments purchased, respectively, on the Statement of Assets and Liabilities.
Indemnifications – Under the fund’s organizational documents, its officers and trustees may be indemnified against certain liabilities and expenses arising out of the performance of their duties to the fund. Additionally, in the normal course of business, the fund enters into agreements with service providers that may contain indemnification clauses. The fund’s maximum exposure under these agreements is unknown as this would involve future claims that may be made against the fund that have not yet occurred.
Investment Transactions and Income – Investment transactions are recorded on the trade date. Interest income is recorded on the accrual basis. All premium and discount is amortized or accreted for financial statement purposes in accordance with U.S. generally accepted accounting principles. The fund earns certain fees in connection with its floating rate loan purchasing
34
Notes to Financial Statements (unaudited) – continued
activities. These fees are in addition to interest payments earned and may include amendment fees, commitment fees, facility fees, consent fees, and prepayment fees. Commitment fees are recorded on an accrual basis as income in the accompanying financial statements. Dividends received in cash are recorded on the ex-dividend date. Certain dividends from foreign securities will be recorded when the fund is informed of the dividend if such information is obtained subsequent to the ex-dividend date. Dividend and interest payments received in additional securities are recorded on the ex-dividend or ex-interest date in an amount equal to the value of the security on such date.
The fund may receive proceeds from litigation settlements. Any proceeds received from litigation involving portfolio holdings are reflected in the Statement of Operations in realized gain/loss if the security has been disposed of by the fund or in unrealized gain/loss if the security is still held by the fund. Any other proceeds from litigation not related to portfolio holdings are reflected as other income in the Statement of Operations.
Fees Paid Indirectly – The fund’s custody fee may be reduced according to an arrangement that measures the value of cash deposited with the custodian by the fund. This amount, for the six months ended May 31 ,2008, is shown as a reduction of total expenses on the Statement of Operations.
Tax Matters and Distributions – The fund intends to qualify as a regulated investment company, as defined under Subchapter M of the Internal Revenue Code, and to distribute all of its taxable income, including realized capital gains. As a result, no provision for federal income tax is required. The fund adopted the provisions of FASB Interpretation No. 48, Accounting for Uncertainty in Income Taxes (“the Interpretation”) on the first day of the fund’s fiscal year. The Interpretation prescribes a minimum threshold for financial statement recognition of the benefit of a tax position taken or expected to be taken in a tax return. There was no impact resulting from the adoption of this Interpretation on the fund’s financial statements. Each of the fund’s federal tax returns for the prior three fiscal years remains subject to examination by the Internal Revenue Service. It is the fund’s policy to record interest and penalty charges on underpaid taxes associated with its tax positions as interest expense and miscellaneous expense, respectively. No such charges were recorded in the current financial statements. Foreign taxes, if any, have been accrued by the fund in the accompanying financial statements.
Distributions to shareholders are recorded on the ex-dividend date. Income and capital gain distributions are determined in accordance with income tax regulations, which may differ from U.S. generally accepted accounting principles. Certain capital accounts in the financial statements are periodically adjusted for permanent differences in order to reflect their tax character. These adjustments have no impact on net assets or net asset value per share.
35
Notes to Financial Statements (unaudited) – continued
Temporary differences which arise from recognizing certain items of income, expense, gain or loss in different periods for financial statement and tax purposes will reverse at some time in the future. Distributions in excess of net investment income or net realized gains are temporary overdistributions for financial statement purposes resulting from differences in the recognition or classification of income or distributions for financial statement and tax purposes.
Book/tax differences primarily relate to amortization and accretion of debt securities, foreign currency transactions, and derivative transactions.
The tax character of distributions made during the current period will be determined at fiscal year end. The tax character of distributions declared to shareholders is as follows:
| | |
| | | 11/30/07 |
| Ordinary income (including any short-term capital gains) | | $7,106,314 |
The federal tax cost and the tax basis components of distributable earnings were as follows:
| | | |
| As of 5/31/08 | | | |
| Cost of investments | | $98,915,497 | |
| Gross appreciation | | 1,635,376 | |
| Gross depreciation | | (4,541,854 | ) |
| Net unrealized appreciation (depreciation) | | $(2,906,478 | ) |
| |
| As of 11/30/07 | | | |
| Undistributed ordinary income | | $127,429 | |
| Capital loss carryforwards | | (19,331,788 | ) |
| Post-October capital loss deferral | | (500,807 | ) |
| Other temporary differences | | (100,786 | ) |
| Net unrealized appreciation (depreciation) | | $(1,234,046 | ) |
The aggregate cost above includes prior fiscal year end tax adjustments.
As of November 30, 2007, the fund had capital loss carryforwards available to offset future realized gains. Such losses expire as follows:
| | | |
| 11/30/08 | | $(4,849,355 | ) |
| 11/30/09 | | (5,692,253 | ) |
| 11/30/10 | | (7,020,484 | ) |
| 11/30/13 | | (333,261 | ) |
| 11/30/14 | | (1,436,435 | ) |
| | $(19,331,788 | ) |
| (3) | | Transactions with Affiliates |
Investment Adviser – The fund has an investment advisory agreement with MFS to provide overall investment management and related administrative
36
Notes to Financial Statements (unaudited) – continued
services and facilities to the fund. The management fee is computed daily and paid monthly at an annual rate of 0.75% of the fund’s average daily net assets.
Transfer Agent – The fund engages Computershare Trust Company, N.A. (“Computershare”) as the sole transfer agent for the fund. MFS Service Center, Inc. (MFSC) monitors and supervises the activities of Computershare for an agreed upon fee approved by the Board of Trustees. For the six months ended May 31, 2008, these fees paid to MFSC amounted to $4,168. MFSC also receives payment from the fund for out-of-pocket expenses paid by MFSC on behalf of the fund. For the six months ended May 31, 2008, no out-of-pocket costs were incurred by the fund.
Administrator – MFS provides certain financial, legal, shareholder communications, compliance, and other administrative services to the fund. Under an administrative services agreement, the fund partially reimburses MFS the costs incurred to provide these services. The fund is charged a fixed amount plus a fee based on average daily net assets. The fund’s annual fixed amount is $17,500.
The administrative services fee incurred for the six months ended May 31, 2008 was equivalent to an annual effective rate of 0.0238% of the fund’s average daily net assets.
Trustees’ and Officers’ Compensation – The fund pays compensation to independent trustees in the form of a retainer, attendance fees, and additional compensation to Board and Committee chairpersons. The fund does not pay compensation directly to trustees or to officers of the fund who are also officers of the investment adviser, all of whom receive remuneration for their services to the fund from MFS. Certain officers and trustees of the fund are officers or directors of MFS and MFSC.
Deferred Trustee Compensation – The fund’s former independent trustees participated in a Deferred Compensation Plan (the Plan). The fund’s current independent trustees are not allowed to defer compensation under the Plan. Deferred amounts represent an unsecured obligation of the fund until distributed in accordance with the Plan. Included in other assets and payable for independent trustees’ compensation is $15,531 of deferred trustees’ compensation.
Other – This fund and certain other MFS funds (the funds) have entered into a services agreement (the Agreement) which provides for payment of fees by the funds to Tarantino LLC in return for the provision of services of an Independent Chief Compliance Officer (ICCO) for the funds. The ICCO is an officer of the funds and the sole member of Tarantino LLC. The funds can terminate the Agreement with Tarantino LLC at any time under the terms of the Agreement. For the six months ended May 31, 2008, the fee paid by the fund to Tarantino LLC was $422 and is included in miscellaneous expense on
37
Notes to Financial Statements (unaudited) – continued
the Statement of Operations. MFS has agreed to reimburse the fund for a portion of the payments made by the fund to Tarantino LLC in the amount of $243, which is shown as a reduction of total expenses in the Statement of Operations. Additionally, MFS has agreed to bear all expenses associated with office space, other administrative support, and supplies provided to the ICCO.
Purchases and sales of investments, other than purchased option transactions and short-term obligations, were as follows:
| | | | |
| | | Purchases | | Sales |
| U.S. Government securities | | $2,244,497 | | $5,472,976 |
| Investments (non-U.S. Government securities) | | $38,410,806 | | $34,886,557 |
On February 15, 2008, the fund entered into a credit agreement with State Street for a revolving line of credit that can be drawn upon up to $45,000,000. The credit agreement matures on February 13, 2009. Borrowing under the agreement can be made for liquidity or leverage purposes. Interest is charged at a rate per annum equal to either the Federal Funds Rate plus 0.45% or LIBOR plus 0.45%, at the option of the borrower. The fund did not incur any borrowings under this agreement at May 31, 2008. The fund did incur a commitment fee of $5,494 during the period, which is based on the average daily unused portion of the line of credit. The fund is subject to certain covenants including, but not limited to, requirements with respect to asset coverage, portfolio diversification and liquidity.
| (6) | | Shares of Beneficial Interest |
The fund’s Declaration of Trust permits the Trustees to issue an unlimited number of full and fractional shares of beneficial interest. The Trustees have authorized the repurchase by the fund of up to 10% annually of its own shares of beneficial interest. During the six months ended May 31, 2008 and the year ended November 30, 2007, the fund did not repurchase any shares.
The fund is permitted to have bank borrowings for temporary or emergency purposes to fund shareholder redemptions. The fund has established borrowing arrangements with certain banks. The interest rate on the borrowings is equal to the Federal Reserve funds rate plus 0.30%. The fund had no significant borrowings during the six months ended May 31, 2008.
38
REPORT OF INDEPENDENT REGISTERED PUBLIC ACCOUNTING FIRM
To the Trustees and Shareholders of the MFS InterMarket Income Trust I:
We have reviewed the accompanying statement of assets and liabilities of the MFS InterMarket Income Trust I (the Fund), including the portfolio of investments, as of May 31, 2008, and the related statements of operations, changes in net assets, and financial highlights for the six-month period ended May 31, 2008. These interim financial statements are the responsibility of the Fund’s management.
We conducted our review in accordance with the standards of the Public Company Accounting Oversight Board (United States). A review of interim financial information consists principally of applying analytical procedures and making inquiries of persons responsible for financial and accounting matters. It is substantially less in scope than an audit conducted in accordance with the standards of the Public Company Accounting Oversight Board (United States), the objective of which is the expression of an opinion regarding the financial statements taken as a whole. Accordingly, we do not express such an opinion.
Based on our review, we are not aware of any material modifications that should be made to the accompanying interim financial statements for them to be in conformity with U.S. generally accepted accounting principles.
We have previously audited, in accordance with the standards of the Public Company Accounting Oversight Board (United States), the statement of changes in net assets for the year ended November 30, 2007, and financial highlights for the year then ended, and in our report dated January 16, 2008, we expressed an unqualified opinion on such statement of changes in net assets and financial highlights. The financial highlights for each of the four years in the period then ended November 20, 2006 were audited by another independent registered public accounting firm whose report, dated January 25, 2007, expressed an unqualified opinion on those financial highlights.

Boston, Massachusetts
July 17, 2008
39
BOARD REVIEW OF INVESTMENT ADVISORY AGREEMENT
A discussion regarding the Board’s most recent review and renewal of the fund’s investment advisory agreement is available by clicking on the fund’s name under “Products and Performance” and then “Closed-End Funds” on the MFS Web site (mfs.com).
PROXY VOTING POLICIES AND INFORMATION
A general description of the MFS funds’ proxy voting policies and procedures is available without charge, upon request, by calling 1-800-225-2606, by visiting the Proxy Voting section of mfs.com or by visiting the SEC’s Web site at http://www.sec.gov.
Information regarding how the fund voted proxies relating to portfolio securities during the twelve-month period ended June 30, 2007 is available without charge by visiting the Proxy Voting section of mfs.com or by visiting the SEC’s Web site at http://www.sec.gov.
QUARTERLY PORTFOLIO DISCLOSURE
The fund will file a complete schedule of portfolio holdings with the Securities and Exchange Commission (the Commission) for the first and third quarters of each fiscal year on Form N-Q. The fund’s Form N-Q may be reviewed and copied at the:
Public Reference Room
Securities and Exchange Commission
100 F Street, NE, Room 1580
Washington, D.C. 20549
Information on the operation of the Public Reference Room may be obtained by calling the Commission at 1-800-SEC-0330. The fund’s Form N-Q is available on the EDGAR database on the Commission’s Internet Web site at http://www.sec.gov, and copies of this information may be obtained, upon payment of a duplicating fee, by electronic request at the following e-mail address: publicinfo@sec.gov or by writing the Public Reference Section at the above address.
A shareholder can also obtain the quarterly portfolio holdings report at mfs.com.
40
CONTACT INFORMATION AND NUMBER OF SHAREHOLDERS
Investor Information
Transfer Agent, Registrar and Dividend Disbursing Agent
| | |
| Call | | 1-800-637-2304 any business day from 9 a.m. to 5 p.m. Eastern time |
| |
| Write to: | | Computershare Trust Company, N.A. P.O. Box 43078 Providence, RI 02940-3078 |
Number of Shareholders
As of May 31, 2008, our records indicate that there are 693 registered shareholders and approximately 6,213 shareholders owning trust shares in “street” name, such as through brokers, banks, and other financial intermediaries.
If you are a “street” name shareholder and wish to directly receive our reports, which contain important information about the trust, please write or call:
Computershare Trust Company, N.A.
P.O. Box 43078
Providence, RI 02940-3078
1-800-637-2304

500 Boylston Street, Boston, MA 02116
The Registrant has not amended any provision in its Code of Ethics (the “Code”) that relates to any element of the Code’s definition enumerated in paragraph (b) of Item 2 of this Form N-CSR.
| ITEM 3. | AUDIT COMMITTEE FINANCIAL EXPERT. |
Not applicable for semi-annual reports.
| ITEM 4. | PRINCIPAL ACCOUNTANT FEES AND SERVICES. |
Not applicable for semi-annual reports.
| ITEM 5. | AUDIT COMMITTEE OF LISTED REGISTRANTS. |
Not applicable for semi-annual reports.
| ITEM 6. | SCHEDULE OF INVESTMENTS |
A schedule of investments for each series of the Registrant is included as part of the report to shareholders of such series under Item 1 of this Form N-CSR.
| ITEM 7. | DISCLOSURE OF PROXY VOTING POLICIES AND PROCEDURES FOR CLOSED-END MANAGEMENT INVESTMENT COMPANIES. |
Not applicable for semi-annual reports.
| ITEM 8. | PORTFOLIO MANAGERS OF CLOSED-END MANAGEMENT INVESTMENT COMPANIES. |
There were no changes during this period.
| ITEM 9. | PURCHASES OF EQUITY SECURITIES BY CLOSED-END MANAGEMENT INVESTMENT COMPANY AND AFFILIATED PURCHASERS. |
MFS InterMarket Income Trust I
| | | | | | | | |
Period | | (a) Total number
of Shares
Purchased | | (b)
Average
Price
Paid per
Share | | (c) Total
Number of
Shares
Purchased as
Part of Publicly
Announced
Plans or
Programs | | (d) Maximum
Number (or
Approximate
Dollar Value) of
Shares that May
Yet Be Purchased
under the Plans
or Programs |
12/1/07 – 12/31/07 | | 0 | | N/A | | 0 | | 0 |
1/1/08 – 1/31/08 | | 0 | | N/A | | 0 | | 0 |
2/1/08 – 2/29/08 | | 0 | | N/A | | 0 | | 0 |
3/1/08 – 3/31/08 | | 0 | | N/A | | 0 | | 1,100,900 |
4/1/08 – 4/30/08 | | 0 | | N/A | | 0 | | 1,100,900 |
5/1/08 – 5/31/08 | | 0 | | N/A | | 0 | | 1,100,900 |
| | | | | | | | |
Total | | 0 | | N/A | | 0 | | |
| | | | | | | | |
Note: The Board of Trustees approves procedures to repurchase Fund shares annually. The notification to shareholders of the program is included in the semi-annual and annual reports sent to shareholders. These annual programs begin on March 1st of each year. The programs conform to the conditions of Rule 10b-18 of the Securities Exchange Act of 1934 and limit the aggregate number of Fund shares that may be repurchased in each annual period (March 1 through the following February 28) to 10% of the Registrant’s outstanding shares as of the first day of the plan year (March 1). The aggregate number of Fund shares available for repurchase for the March 1, 2008 plan year is 1,100,900.
| ITEM 10. | SUBMISSION OF MATTERS TO A VOTE OF SECURITY HOLDERS. |
There were no material changes to the procedures by which shareholders may send recommendations to the Board for nominees to the Registrant’s Board since the Registrant last provided disclosure as to such procedures in response to the requirements of Item 407 (c)(2)(iv) of Regulation S-K or this Item.
| ITEM 11. | CONTROLS AND PROCEDURES. |
| (a) | Based upon their evaluation of the effectiveness of the registrant’s disclosure controls and procedures (as defined in Rule 30a-3(c) under the Investment Company Act of 1940 (the “Act”)) as conducted within 90 days of the filing date of this report on Form N-CSR, the registrant’s principal financial officer and principal executive officer have concluded that those disclosure controls and procedures provide reasonable assurance that the material information required to be disclosed by the registrant on this report is recorded, processed, summarized and reported within the time periods specified in the Securities and Exchange Commission’s rules and forms. |
| (b) | There were no changes in the registrant’s internal controls over financial reporting (as defined in Rule 30a-3(d) under the Act) that occurred during the second fiscal quarter of the period covered by the report that have materially affected, or are reasonably likely to materially affect, the registrant’s internal control over financial reporting. |
| (a) | File the exhibits listed below as part of this form. Letter or number the exhibits in the sequence indicated. |
| | (1) | Any code of ethics, or amendment thereto, that is the subject of the disclosure required by Item 2, to the extent that the registrant intends to satisfy the Item 2 requirements through filing of an exhibit. |
| | (2) | A separate certification for each principal executive officer and principal financial officer of the registrant as required by Rule 30a-2 under the Act (17 CFR 270.30a-2): Attached hereto. |
| (b) | If the report is filed under Section 13(a) or 15(d) of the Exchange Act, provide the certifications required by Rule 30a-2(b) under the Act (17 CFR 270.30a-2(b)), Rule 13a-14(b) or Rule 15d-14(b) under the Exchange Act (17 CFR 240.13a-14(b) or 240.15d-14(b)) and Section 1350 of Chapter 63 of Title 18 of the United States Code (18 U.S.C. 1350) as an exhibit. A certification furnished pursuant to this paragraph will not be deemed “filed” for the purposes of Section 18 of the Exchange Act (15 U.S.C. 78r), or otherwise subject to the liability of that section. Such certification will not be deemed to be incorporated by reference into any filing under the Securities Act of 1933 or the Exchange Act, except to the extent that the registrant specifically incorporates it by reference: Attached hereto. |
Notice
A copy of the Agreement and Declaration of Trust, as amended, of the Registrant is on file with the Secretary of State of The Commonwealth of Massachusetts and notice is hereby given that this instrument is executed on behalf of the Registrant by an officer of the Registrant as an officer and not individually and the obligations of or arising out of this instrument are not binding upon any of the Trustees or shareholders individually, but are binding only upon the assets and property of the respective constituent series of the Registrant.
SIGNATURES
Pursuant to the requirements of the Securities Exchange Act of 1934 and the Investment Company Act of 1940, the registrant has duly caused this report to be signed on its behalf by the undersigned, thereunto duly authorized.
| | | | |
| (Registrant) MFS INTERMARKET INCOME TRUST I | | |
| | |
| By (Signature and Title)* | | /s/ ROBERT J. MANNING | | |
| | Robert J. Manning, President | | |
| |
| Date: July 18, 2008 | | |
|
| Pursuant to the requirements of the Securities Exchange Act of 1934 and the Investment Company Act of 1940, this report has been signed below by the following persons on behalf of the registrant and in the capacities and on the dates indicated. |
| | |
| By (Signature and Title)* | | /s/ ROBERT J. MANNING | | |
| | Robert J. Manning, President (Principal Executive Officer) | | |
| |
| Date: July 18, 2008 | | |
| | |
| By (Signature and Title)* | | /s/ MARIA F. DWYER | | |
| | Maria F. Dwyer, Treasurer (Principal Financial Officer and Accounting Officer) | | |
| |
| Date: July 18, 2008 | | |
| * | Print name and title of each signing officer under his or her signature. |