QuickLinks -- Click here to rapidly navigate through this documentEXHIBIT 99.1
[PHOTO]
outfront
DECOMA INTERNATIONAL INC.
Annual Report 2003
DECOMA INTERNATIONAL INC. is a full service supplier of exterior vehicle appearance systems for the world's automotive industry. Decoma designs, engineers and manufactures automotive exterior components and systems which include fascias (bumpers), front and rear end modules, plastic body panels, roof modules, exterior trim components, sealing and greenhouse systems and lighting components for cars and light trucks (including sport utility vehicles and mini vans).
All amounts in this Annual Report are expressed in U.S. dollars unless otherwise noted.
CONTENTS
| Up Front — Financial Highlights | | 1 |
| Front-page News — 2003 Achievements | | 2 |
| Front and Centre — To Our Shareholders | | 4 |
| Frontline — Employee Shareholders and Employee's Charter | | 6 |
| New Frontiers | | 8 |
| Front Runners | | 10 |
| Front-to-Back | | 12 |
| Financial Review | | 14 |
This Annual Report contains forward looking statements within the meaning of applicable securities legislation. As such, readers are specifically referred to the "Forward Looking Statements" section of the Management's Discussion and Analysis of Results of Operations and Financial Position set out on page 34 of this report.
up front
FINANCIAL HIGHLIGHTS
|
|
|---|
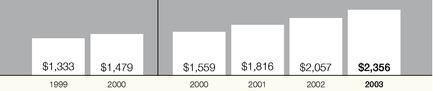
Sales
(millions) | Consolidated Sales By Customer |
Years ended July 31 Years ended December 31
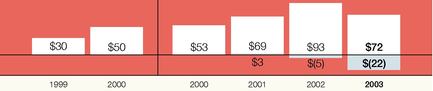
Net Income
(millions)
Years ended July 31 Years ended December 31
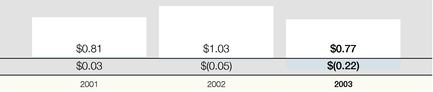
Diluted Earning Per Share
Years ended December 31
Capital Expenditures and Investments, Net
(Excluding business acquisitions and dispositions) (millions)
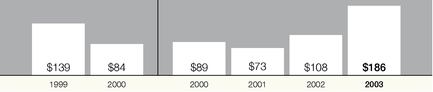
Years ended July 31 Years ended December 31 | 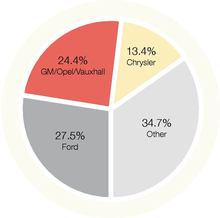
2003
2002 |
Impact of "Other charges" and "Other income" as disclosed in the Company's consolidated financial
statements, included elsewhere herein.
Annual Report 2003 1
front-page news
2003 FINANCIAL ACHIEVEMENTS
- •
- Total sales reach a record $2,356 million, increasing 15% over the previous year, despite unprecedented pricing pressure from OEMs and lower vehicle production volumes in North America and Europe.
- •
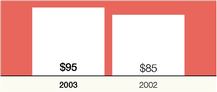
- Average content per vehicle increases from $85 to $95 in North America, and from $30 to $39 in Europe. North American production sales increase 8% to $1,507 million and in Europe production sales increase 31% to $647 million.
- •
- Decoma's North American business with new domestic Asian and European OEMs continues to grow.
2003 OPERATING ACHIEVEMENTS
- •
- Performance remains extremely strong in North America. In Europe, Decoma completes a comprehensive review and undertakes decisive action to improve operating performance.
- •
- The forward lighting assets of Federal Mogul are successfully integrated into Autosystems, adding new facilities in Mexico and Ohio and an engineering centre in Virginia.
- •
- Decoma secures its first contract incorporating a TPV application for sealing systems.
- •
- Decoma expands its global presence, launching four new facilities in Europe and continues to construct a new mould and paint facility in the southern United States. Investments in major capital projects are on time and on budget.
DECOMA'S GLOBAL FACILITIES
Manufacturing Facilities
| | Product Development and Engineering Facilities
|
|---|
| Austria | | 1 | | Mexico | | 2 | | Canada | | 1 | | Japan | | 1 |
| Belgium | | 3 | | Poland | | 1 | | Czech Republic | | 1 | | United Kingdom | | 1 |
| Canada | | 19 | | United Kingdom | | 2 | | France | | 1 | | United States | | 2 |
| Germany | | 7 | | United States | | 6 | | Germany | | 1 | | | | |
DECOMA'S PRODUCT RANGE
| |
| |
| |
|
|---|
| • Front End Modules | | • Claddings | | • Hard Tonneaus | | • Window Surround |
| • Lighting | | • Running Boards | | • Light Bars | | Modules |
| • Front Fenders | | • Rear Fenders | | • "C" Pillars | | • Sealing Systems |
| • Wheel Opening | | • Rear End Modules | | • "B" Pillars | | • Grilles |
| Mouldings | | • Rear Tail Lamps | | • Roof Modules | | • Specialty Vehicle Packages |
DECOMA'S TOP FIVE PLATFORMS
North America
| | Europe
|
|---|
• Ford Explorer
• Chrysler Sebring/Stratus
• Ford Crown Victoria/
Grand Marquis | | • Chrysler Ram Pick-Up
• Chrysler Intrepid/
300M/Concorde | | • Mercedes Benz C Class
• VW Group T5 Transit Van
• Opel Epsilon | | • Audi B6 (A4)
• BMW Mini |
2
[PHOTOS]
Roof Module |
|
VWT5 Front End Module |
|
Composite Tailgate |
| Exterior Appearance Package | | Aston Martin Headlamp | | Porsche 911 Rear Fascia |
| Composite Running Board | | Automated Roof Rack | | Lexus Grille |
FRONT AND CENTRE
TO OUR SHAREHOLDERS
2003 was another tremendous year for Decoma. Total sales and content per vehicle increased to record levels in both North America and Europe, despite lower vehicle production volumes. The last 12 months were marked by unprecedented pricing pressure from our OEM customers, however, we were able to offset these pressures in North America thanks to the positive impact of recent acquisitions, new facility and program start-ups, take-over business and productivity improvements.
We continued to expand our global reach with the construction of a new mould and paint facility in the southern United States and a new paint facility in Belgium. We also enhanced our front end module presence in Europe with new facilities in Austria, Belgium and Poland. These investments will further our market leadership and position Decoma for sales and earnings growth in the coming years.
We also made excellent progress in our content per vehicle growth through the second quarter acquisition of the forward lighting original equipment assets of Federal Mogul, which resulted in the addition of new facilities in Mexico and Ohio and an engineering centre in Virginia. This acquisition, when combined with the earlier acquisition of Autosystems and organic growth in this segment, has positioned Decoma as a leading player in North America's automotive forward lighting market. This growth is integral to our strategy to meet our customers' increasing demand for more fully integrated front end module systems.
FINANCIAL OVERVIEW
Total sales for 2003 grew to a record $2,356 million compared with $2,057 million in 2002. Currency translation had a positive impact on Decoma's sales: excluding this impact, total sales still increased by a healthy 5%.
Reported operating income, net income and diluted earnings per share declined in 2003 to $151.2 million, $71.9 million and $0.77, respectively, primarily as a result of the United Kingdom impairment and continental Europe paint consolidation charges.
Excluding other charges, other income and the future net tax liability revaluation as a result of changes to Ontario future tax rates, operating income and net income declined $7.0 million and $2.5 million respectively. This decline is the result of new facility investments, combined with customer pricing pressures, the changeover of a number of large production programs in North America, operating losses from certain European operations and lower production volumes on certain high content programs. These declines, in combination with the issuance of Convertible Debentures in 2003, resulted in a decline in diluted earnings per share of $0.08.
NORTH AMERICA: MOMENTUM REMAINS STRONG
The momentum we've built in recent years in Decoma's North American operations remains strong. Despite a decline in vehicle production volumes to 15.9 million units from 16.3 million units in 2002, North American production sales grew 8% to $1,507 million, while content per vehicle grew from $85 to a record $95. This growth was driven by the positive effects of currency translation, the previously noted acquisition of Federal Mogul's forward lighting operations, take-over business, sales on previously launched programs and strong volumes on certain high content platforms. As the demand for more fully integrated systems increases, Decoma is positioned to capitalize on this opportunity, which will in turn result in expanded content per vehicle.
EUROPE: DECISIVE ACTION
European sales and content per vehicle grew in 2003, despite virtually level European vehicle production volumes of 16.4 million units in 2003 compared to 16.3 million units in 2002. Production sales grew to $647 million, while content per vehicle grew from $30 to $39. This growth was driven by the addition of new facilities in late 2002 and in 2003, including new facility start-ups in Austria, Germany, Poland and in Belgium, with the Company's new paint line and the take-over of an existing assembly and sequencing facility. European sales and content growth also benefited from currency translation and continued growth in our front end module business.
While we're encouraged by these gains, profitability in certain European operations did not meet our expectations. In response, we took decisive action in the fourth quarter by implementing management changes, conducting a review of our continental European operating facilities and intensifying our efforts to apply proven operating best practices throughout our European operations.
In connection with this review, we have now undertaken rationalizing certain of our German and Belgium painting operations with a view to optimizing our manufacturing and paint capacity utilization in these regions. Certain of these actions resulted in the previously announced charges taken in the fourth quarter, which total approximately $11.4 million.
4 Decoma International Inc.
We are confident that this is the most appropriate strategy to reduce operating overheads and improve long-term earnings at these German and Belgium facilities in 2005 and beyond.
In conjunction with our continental Europe review, we also completed our review of the United Kingdom marketplace and determined that we needed to write-down the carrying value of certain of our long-lived assets in this market. This write-down, which totalled $12.4 million, will have no impact on our United Kingdom operations going forward.
FROM CHALLENGES TO OPPORTUNITIES
Our North American domestic OEM customers remain locked in a competitive battle for market share that shows no sign of abating. As a result, Decoma continues to be under intense pricing pressure from our customers. In response to these challenges, Decoma has continued to develop innovative strategies, products and technologies, which we believe will provide the Company with a distinct advantage over our competitors.
Decoma has also been able to leverage the growth of new domestic OEMs in North America into new opportunities for our North American and European businesses. In 2003 we secured a number of new domestic OEM contracts, primarily for our trim products. These inroads provide an excellent foundation for developing relationships with our new domestic customers, as well as the opportunity to showcase highly engineered products such as lighting and lift gate modules.
We're meeting the pressure of pricing demands head-on, by applying the most innovative thinking in the industry to our products and processes in order to drive out costs and improve productivity. This push for continuous improvement has long been an integral part of the Decoma culture. Actively rewarding employees at every level of the organization for proposing ideas to reduce costs and improve profits makes Decoma a highly rewarding place to work, while at the same time positioning the Company to offset competitive pressures more effectively than our competitors.
In 2003, for example, more than 2,500 individual employees were involved in our Winning Teams program, which rewards employees for submitting proposals that result in measurable cost reductions or productivity gains. This enthusiastic involvement resulted in more than 600 submissions for improvements.
In 2001, Decoma incorporated Six Sigma into our culture as a problem-solving methodology for driving productivity, quality and business improvements. To date, 31 Decoma divisions are participating in Six Sigma activities, with 58 employees specially trained to apply Six Sigma problem-solving tools and methodologies. Eighty-six projects have been completed so far, allowing us to achieve significant annual savings, and we plan to expand Six Sigma in 2004.
Ideas in Motion is a program that rewards Decoma employees for proposing commercially viable ideas for products, processes and strategies. In 2003, we received 178 proposals, some of which have led to new patent applications.
In addition, the considerable investment — a minimum of 7 percent of pretax profit — the Company makes each year in research and development helps us introduce innovative, effective products and technologies to meet pricing demands while creating high-value, functional solutions that appeal to OEMs and their customers.
OUT IN FRONT
It's an achievement to be out in front. It's an even greater challenge to remain there. The coming year will be another year of significant investment to solidify our position as one of the world's leading suppliers of exterior components and systems. We have a record number of program launches in 2004, which will lay critical groundwork for success well into the future. The investments made in new programs and facilities in 2003 and continuing into 2004 will strengthen our market leadership and position Decoma for even greater growth.
Our commitment to improving operating performance in Europe will remain a top priority. We'll continue to expand into new market segments, particularly lighting and composites, which offer excellent growth opportunities.
In closing, I wish to thank our Board of Directors, our shareholders and the entire Decoma team. It is their dedication, creativity, skill and collaboration that keep Decoma out in front.
[SIGNATURE]
Alan J. Power
President and Chief Executive Officer
Annual Report 2003 5
| Autosystems America — Ohio, U.S.A. | | Decoform — Saarland, Germany | | Decoma Graz — Steiermark, Austria |
| Merplas — Merseyside, UK | | Belplas — Limburg, Belgium | | Formatex — Wielkopolska, Poland |
| Polybrite — Ontario, Canada | | Decostar — Georgia, U.S.A. | | Litetek — Matamoros, Mexico |
|
|
|
|
|
[PHOTO] |
|
[PHOTO] |
|
[PHOTO] |
|
|
|
|
|
[PHOTO] |
|
[PHOTO] |
|
[PHOTO] |
|
|
|
|
|
[PHOTO] |
|
[PHOTO] |
|
[PHOTO]
|
EMPLOYEE SHAREHOLDERS
Corporate Constitution
EMPLOYEE EQUITY AND PROFIT PARTICIPATION
Ten percent of Decoma's profit before tax will be allocated to employees. These funds will be used for the purchase of Decoma shares in trust for employees and for cash distributions to employees, recognizing length of service.
SHAREHOLDER PROFIT PARTICIPATION
Decoma will distribute, on average, twenty percent of its annual net profit after-tax to shareholders.
MANAGEMENT PROFIT PARTICIPATION
To obtain long-term contractual commitment from senior management, the Company provides a compensation arrangement which, in addition to a base salary below industry standards, allows for the distribution of up to six percent of Decoma's profit before tax.
RESEARCH AND DEVELOPMENT
Decoma will allocate a minimum of seven percent of its profit before tax for research and development to ensure the long-term viability of the Company.
SOCIAL RESPONSIBILITY
The Company will allocate a maximum of two percent of its profit before tax for charitable, cultural, educational, and political purposes to support the basic fabric of society.
MINIMUM PROFIT PERFORMANCE
Management has an obligation to produce a profit. If Decoma does not generate a minimum after-tax return of four percent on share capital for two consecutive years, the Class A shareholders, voting as a class, will have the right to elect additional directors.
BOARD OF DIRECTORS
Decoma believes that outside directors provide independent counsel and discipline. A majority of the members of Decoma's Board of Directors will be outsiders.
UNRELATED INVESTMENTS
Class A and Class B shareholders, with each class voting separately, will have the right to approve any investment in an unrelated business in the event such investment together with all other investments in unrelated businesses exceeds twenty percent of Decoma's equity.
CONSTITUTIONAL AMENDMENTS
Any change to Decoma's Corporate Constitution will require the approval of the Class A and Class B shareholders, with each class voting separately.
EMPLOYEE'S CHARTER
Decoma is committed to an operating philosophy which is based on fairness and concern for people. This philosophy is part of Decoma's Fair Enterprise culture in which employees and management share in the responsibility to ensure the success of the company. It includes these principles:
Job Security
Being competitive by making a better product for a better price is the best way to enhance job security. Decoma is committed to working together with its employees to help protect their job security. To assist its employees, Decoma will provide:
- •
- Job Counselling
- •
- Training
- •
- Employee Assistance Programs
A Safe and Healthful Workplace
Decoma strives to provide its employees with a working environment which is safe and healthful.
Fair Treatment
Decoma offers equal opportunities based on an individual's qualifications and performance, free from discrimination or favouritism.
Competitive Wages and Benefits
Decoma will provide its employees with information which will enable them to compare their total compensation, including total wages and total benefits with those earned by employees of their competitors, as well as with other plants in their community. If an employee's total compensation is found not to be competitive, then their wages will be adjusted.
Employee Equity and Profit Participation
Decoma believes that every employee should share in the financial success of the company.
Communication and Information
Through regular monthly meetings between management and employees and through publications, Decoma will provide its employees with information so that they will know what is going on in the Company and within the industry.
The Hotline
Should an employee have a problem, or feel the above principles are not being met, we encourage them to call the Hotline or use the self-addressed Hotline Envelopes to register their complaints. Employees do not have to give their name, but if they do, it will be held in strict confidence. Hotline Investigators will answer the employee's call. The Hotline is committed to investigate and resolve all concerns or complaints and must report the outcome to the Global Human Resources Department. Hotline Number 1-800-263-1691.
Employee Relations Advisory Board
The Employee Relations Advisory Board is a group of people who have proven recognition and credibility relating to humanitarian and social issues. This Board will monitor, advise and ensure that Decoma operates within the spirit of the Decoma Employee's Charter and the principles of Decoma's Corporate Constitution.
7
MAKING OUR MARK IN EMERGING MARKETS.
Adding new features and integrating additional Decoma components into our window surround modules delivers benefits to our OEM customers, their customers and to Decoma. Our window surrounds can now incorporate multiple trim elements, glass division posts and fixed glass in a single assembly. For the front door window surround, Decoma recently co-developed a system to integrate the rearview mirror base into the surround, reducing labour and improving the ability to run vehicles with very different trim requirements on the same lines. For drivers, the end result is improved fit and finish and wind noise. From a manufacturing and assembly standpoint, modular systems decrease the number of parts, thereby lowering assembly time for both Decoma and OEMs, and reducing the overall cost of the systems.
THE FUTURE IS LIGHTER AND STRONGER.
Research and development is a core Decoma commitment and one that's showcased superbly in our lightweight composites expertise. We're taking a leading role in developing stronger, yet lighter components that will help our OEM customers achieve cost savings and weight savings, which in turn can translate into greater fuel efficiency. Fabricating body panels in carbon fibre composites — long used in racing and niche vehicles — can yield significantly stiffer, stronger parts weighing up to 35% less than the same parts made with conventional steel, aluminum and sheet moulding composites. As carbon fibre prices decrease, this promise grows. This prototype carbon fibre composite Jeep TJ hood, developed by Decoma, is validating that potential, helping our researchers determine the ideal combination of resins and reinforcement materials for future commercial-scale applications.
front runners
front-to-back
[PHOTO]
LEADING THE DRIVE TO MODULARIZE.
The trend toward modular assembly is revolutionizing the way vehicles are built, and it's a trend that Decoma is ideally poised to exploit. Decoma's modular capabilities, showcased here in the 2005 Volkswagon Golf, are unmatched in our industry. By 2007, Decoma will be the global leader in front end modules, in a market that only promises to grow as the drive to modularize becomes as prevalent in North America as it currently is in Europe. Decoma is working with European OEMs as they transform assembly techniques to allow for the integration of increasingly complex modules, and structuring to respond with sequencing centres that deliver components in sequence to our customers' assembly plants.
FINANCIAL REVIEW
| Management's Discussion and Analysis of Results of Operations and Financial Position | | 15 |
| Management's Responsibility for Financial Reporting | | 35 |
| Auditors' Report | | 35 |
| Significant Accounting Policies | | 36 |
| Consolidated Balance Sheets | | 40 |
| Consolidated Statements of Income and Retained Earnings | | 41 |
| Consolidated Statements of Cash Flows | | 42 |
| Notes to Consolidated Financial Statements | | 43 |
| Historical Financial Summary | | 70 |
| Decoma's Board of Directors, Officers and Operations Management | | 72 |
| Investor Information | | 73 |
14 Decoma International Inc.
MANAGEMENT'S DISCUSSION AND ANALYSIS OF
RESULTS OF OPERATIONS AND FINANCIAL POSITION
All amounts in this Management's Discussion and Analysis of Results of Operations and Financial Position ("MD&A") are in U.S. dollars unless otherwise noted. This MD&A is current as of February 25, 2004 and should be read in conjunction with the Company's consolidated financial statements for the year ended December 31, 2003, included elsewhere herein.
Impact of Translation of Foreign Currency Results of Operations into the Company's U.S. Dollar Reporting Currency
| | Years Ended December 31,
|
|---|
| | 2003
| | 2002
| | % Change
|
|---|
| 1 Cdn. dollar equals U.S. dollars | | 0.716 | | 0.637 | | 12.4% |
| 1 Euro equals U.S. dollars | | 1.132 | | 0.946 | | 19.7% |
| 1 British Pound equals U.S. dollars | | 1.635 | | 1.503 | | 8.8% |
| | |
| |
| |
|
The preceding table reflects the average foreign exchange rates between the primary currencies in which the Company conducts business and its U.S. dollar reporting currency. Significant changes in the exchange rates of these currencies against the U.S. dollar impact the reported U.S. dollar amounts of the Company's results of operations.
The results of foreign operations are translated into U.S. dollars using the average exchange rates in the table above for the relevant period. Throughout this MD&A reference is made to the impact of translation of foreign operations on reported U.S. dollar amounts where significant.
In addition to the impact of movements in exchange rates on translation of foreign operations into U.S. dollars, the Company's results can also be influenced by the impact of movements in exchange rates on foreign currency transactions (such as raw material purchases denominated in foreign currencies). However, as a result of historical hedging programs employed by the Company, foreign currency transactions in the current period have not been fully impacted by the recent movements in exchange rates. Readers are asked to refer to the "Financial Condition, Liquidity and Capital Resources — Forward Foreign Currency Contracts" section of this MD&A for further discussion. The Company records foreign currency transactions at the hedged rate.
Finally, holding gains and losses on foreign currency denominated monetary items, which are recorded in selling, general and administrative expenses, impact reported results. This MD&A makes reference to the impact of these amounts where significant.
OVERVIEW
The following table isolates the year over year impact of certain unusual income and expense items on the Company's key earnings measures.
(U.S. dollars, in millions except per share figures)
| | Operating Income
| |
| | Net Income
| |
| | Diluted EPS
| |
|
|---|
| 2002 as reported | | $ | 173.7 | | | | $ | 93.0 | | | | $ | 1.03 | | |
| Addback Merplas deferred preproduction expenditures write-off | | | 8.3 | | | | | 8.3 | | | | | 0.08 | | |
| Deduct other income in 2002 | | | — | | | | | (3.4 | ) | | | | (0.03 | ) | |
| | |
| | | |
| | | |
| | |
| Adjusted 2002 base | | | 182.0 | | | | | 97.9 | | | | | 1.08 | | |
| United Kingdom impairment charge | | | (12.4 | ) | | | | (12.4 | ) | | | | (0.12 | ) | |
| Continental Europe paint capacity consolidation charges | | | (11.4 | ) | | | | (11.4 | ) | | | | (0.11 | ) | |
| Future net tax liability revaluation | | | — | | | | | (1.1 | ) | | | | (0.01 | ) | |
| Other income in 2003 | | | — | | | | | 1.4 | | | | | 0.01 | | |
| Decrease over adjusted 2002 base | | | (7.0 | ) | (4%) | | | (2.5 | ) | (3%) | | | (0.08 | ) | (7%) |
| | |
| | | |
| | | |
| | |
| 2003 as reported | | $ | 151.2 | | | | $ | 71.9 | | | | $ | 0.77 | | |
| | |
| | | |
| | | |
| | |
Total sales grew to $2,355.8 million in 2003. Total sales benefited $204.1 million from translation. Excluding the impact of translation, total sales increased $95.0 million or 5% over 2002 due primarily to the acquisition of certain of Federal Mogul's original equipment automotive lighting operations (the "FM Lighting Acquisition") in the second quarter of 2003, sales at recent new facility startups and higher tooling sales.
As shown in the table above, diluted earnings per share in 2003 was impacted by:
- •
- the United Kingdom impairment and continental Europe paint capacity consolidation charges (see the "Other Charges" section of this MD&A for further discussion);
- •
- the revaluation of future net tax liabilities due to an increase in the future Ontario, Canada income tax rate (see the "Results of Operations — Years Ended December 31, 2003 and 2002 — Income Taxes" section of this MD&A for further discussion); and
Annual Report 2003 15
- •
- other income from the permanent repatriation of funds from foreign operations (see the "Results of Operations — Years Ended December 31, 2003 and 2002 — Other Income" section of this MD&A for further discussion).
Similarly, 2002 diluted earnings per share was impacted by:
- •
- the Merplas deferred preproduction expenditures write-off (see the "Other Charges" section of this MD&A for further discussion); and
- •
- other income from the disposition of a non-core North American operating division and from the permanent repatriation of funds from foreign operations (see the "Results of Operations — Years Ended December 31, 2003 and 2002 — Other Income" section of this MD&A for further discussion).
Excluding the above items, diluted earnings per share declined $0.08 in 2003 compared to 2002. This decline is primarily attributable to an increase in the average number of diluted Class A Subordinate Voting and Class B Shares outstanding due to the issuance in March 2003 of Cdn. $100 million of 6.5% convertible unsecured subordinated debentures (the "Convertible Debentures") and to the issuance of 451,400 and 548,600 Class A Subordinate Voting Shares to the Decoma employee deferred profit sharing program during the third quarter of 2002 and second quarter of 2003, respectively, and due to a $2.5 million decline in net income. The decline in net income was due to a $7.0 million reduction in operating income primarily as a result of an $8.0 million increase in European operating losses and an $8.4 million increase in corporate segment losses primarily the result of foreign exchange losses on U.S. dollar denominated monetary items held in Canada. These reductions were partially offset by a $9.4 million increase in North American operating income.
OTHER CHARGES
Year Ended December 31, 2003
UNITED KINGDOM IMPAIRMENT CHARGE
The Company operates two facilities in the United Kingdom, Merplas and Sybex. Given the magnitude of Merplas' historic losses, the Merplas results have been separately disclosed in the Company's MD&A in order to better explain the performance of the European operating segment.
The Merplas facility was initially built to service the X400 program assembled at Jaguar's Halewood plant, and other Jaguar programs, including the X100 program, with additional capacity to service other future business opportunities. Production volumes on the Jaguar X400 and X100 programs continue at levels that are well below original planning volume estimates of 115,000 and 11,000, respectively. In 2003, production volumes were approximately 52,700 and 6,500 for the X400 and X100, respectively. Despite low volumes, Merplas has steadily reduced its operating losses from $23.4 million in 2001 to $11.5 million in 2003 through its continuous improvement efforts.
The Sybex facility's major programs include the BMW Mini and various Rover and Ford PAG Landrover programs. Sybex's operating income in 2003 and 2002 was $1.2 million and $0.5 million, respectively. While BMW Mini program volumes are strong, long-term Rover volumes are subject to uncertainty. In addition, declines in Sybex's current Landrover business were expected to be offset by the award of Landrover's Freelander fascia program which will launch in 2006 (Freelander volumes are expected to approximate 75,000 vehicles annually after ramp up). However, as a result of Ford PAG's decision to produce its 2006 Freelander program at its Halewood, England plant, the Company has decided to relocate its related 2006 Freelander fascia production from Sybex to the closer Merplas facility.
Upon completion of the 2004 business planning process, the Company identified a number of indicators of United Kingdom long-lived asset impairment including the continuation of budgeted United Kingdom operating losses, uncertain long-term production volumes for the United Kingdom market in general which affect certain of the Company's existing programs, and excess paint capacity in the United Kingdom market.
These impairment indicators required the Company to assess its United Kingdom asset base for recoverability. Estimated discounted future cash flows were used to determine the amount of the write-down. The result of this assessment was a write-down of $12.4 million of certain of the long-lived assets at the Company's Sybex facility. Although Merplas has experienced significant historic operating losses, the decision to relocate the 2006 Freelander fascia program from Sybex to Merplas significantly improves Merplas' long-term outlook. However, without additional new business, Sybex's long-term outlook deteriorates. Although the possibility of obtaining incremental new business remains, the Company has been unable to advance incremental business opportunities for Sybex to the point of concluding they are reasonably probable.
This write-down will have no near term impact on operations at either Merplas or Sybex, which will continue their operations in the normal course.
As a result of cumulative losses in the United Kingdom, this impairment charge has not been tax effected.
This impairment charge had no impact on depreciation expense in 2003. However, as a result of the impairment charge, depreciation expense in 2004 is expected to be reduced by approximately $2.5 million.
CONTINENTAL EUROPE PAINT CAPACITY CONSOLIDATION CHARGES
During 2003, the Company completed, and committed to, a plan to consolidate its continental Europe paint capacity. This plan entails mothballing the Company's Decoform paint line in Germany and transferring Decoform's painted trim and fascia business to the Company's newer paint lines at its Decorate and Belplas facilities in Germany and Belgium, respectively. Decoform will continue to mold and assemble products for Decorate.
The consolidation required the write-down of the carrying value of the Decoform paint line by $4.8 million. The consolidation will also result in severance costs associated with a reduction of the Decoform workforce of 284 employees. Severance costs of $6.7 million were accrued in 2003.
16 Decoma International Inc.
Decoform employees have a contractual notice period of up to two quarters following the quarter in which individual notice is given. The consolidation plan envisions substantially all employees working through their contractual notice periods with paint line production transfers and employee terminations completed by the end of 2004.
A continuity of the severance accrual related to this consolidation plan is as follows:
(U.S. dollars in millions)
| |
|
|---|
| Expensed | | $ | 6,658 |
| Payments | | | — |
| Currency translation | | | 141 |
| | |
|
| Balance, December 31, 2003 | | $ | 6,799 |
| | |
|
There will be no reduction in sales as a result of the consolidation of these operations. The consolidation will avoid the need for significant future capital expenditures at the Decoform facility and Decoma believes that the consolidation will also improve long-term EBIT at the affected facilities in 2005 and beyond by reducing operating overheads and paint line depreciation and by improving the utilization rates within the Company's Decorate and Belplas paint operations.
These continental Europe paint capacity consolidation charges have resulted in large accounting losses in Germany and create both taxable temporary difference and loss carryforward future tax assets. A full valuation allowance has been provided against these future tax assets resulting in no net tax recovery against these charges in the consolidated income statement.
Year Ended December 31, 2002
GOODWILL AND DEFERRED PREPRODUCTION EXPENDITURES
In 2002, the Company adopted the new accounting recommendations of The Canadian Institute of Chartered Accountants for goodwill and other intangible assets. Upon initial adoption of these recommendations, the Company recorded a goodwill write-down of $12.3 million related to its United Kingdom reporting unit. This write-down was charged against January 1, 2002 opening retained earnings. As part of its assessment of goodwill impairment, the Company also reviewed the recoverability of deferred preproduction expenditures at its Merplas facility. As a result of this review, $8.3 million of deferred preproduction expenditures were written off as a charge against income in the second quarter of 2002. As a result of cumulative losses in the United Kingdom, this write-down has not been tax effected.
RESULTS OF OPERATIONS
Years Ended December 31, 2003 and 2002
SALES
| | Years Ended December 31,
| |
|---|
| | 2003
| | 2002
| | % Change
| |
|---|
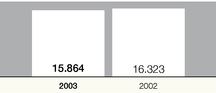
| Light Vehicle Production Volumes [in millions] | | | | | | | | | |
| | North America | | | 15.864 | | | 16.323 | | (3% | ) |
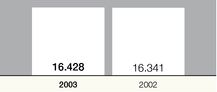
| | Western Europe | | | 16.428 | | | 16.341 | | 1% | |
| | |
| |
| |
| |
| Average Content Per Vehicle [U.S. dollars] | | | | | | | | | |
| | North America | | $ | 95 | | $ | 85 | | 12% | |
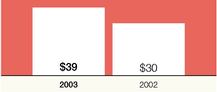
| | Europe | | | 39 | | | 30 | | 30% | |
| | |
| |
| |
| |
| Production Sales [U.S. dollars in millions] | | | | | | | | | |
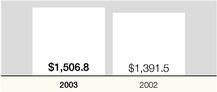
| | North America | | $ | 1,506.8 | | $ | 1,391.5 | | 8% | |
| | Europe | | | | | | | | | |
| | | Excluding Merplas | | | 616.1 | | | 457.1 | | 35% | |
| | | Merplas | | | 30.4 | | | 34.7 | | (12% | ) |
| | |
| |
| | | |
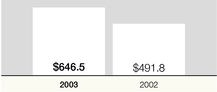
| | | Total Europe | | | 646.5 | | | 491.8 | | 31% | |
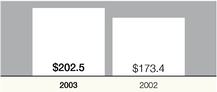
| Global Tooling and Other Sales | | | 202.5 | | | 173.4 | | 17% | |
| | |
| |
| |
| |
| Total Sales | | $ | 2,355.8 | | $ | 2,056.7 | | 15% | |
| | |
| |
| |
| |
Annual Report 2003 17
Average content per vehicle in North America and in Europe has been calculated by dividing the Company's North American and European production sales by the industry's North American and European light vehicle production volumes, respectively. Excluding the effects of translation, continued growth in average content per vehicle provides a measure of the Company's ability to sell its products onto new vehicle platforms and/or expand its sales onto existing vehicle platforms. Increases in average content per vehicle may result from any one or more of: the award of takeover business; the acquisition of competitors; the expansion of the Company's existing product markets (i.e. the conversion of bumpers from steel to plastic); and the introduction of new products.
North America
North American production sales grew by 8% to $1,506.8 million in 2003.
A 3% decline in North American vehicle production volumes negatively impacted sales by $42.0 million. However, this decline was offset by significant growth in North American content per vehicle. North American content per vehicle grew $10 or 12% to approximately $95.
Translation of Canadian dollar sales into the Company's U.S. dollar reporting currency added approximately $102.1 million to production sales and $6 to North American content per vehicle. In addition, the FM Lighting Acquisition added approximately $51.9 million to production sales and $3 to North American content per vehicle.
The remaining net $3.3 million increase in production sales and $1 increase in North American content per vehicle was due to:
- •
- new takeover business including certain General Motors lighting and Ford running board programs;
- •
- sales on programs that launched during or subsequent to 2002 including the General Motors GMX 367 (Grand Prix) and the GMX 380 (Malibu) programs, the DaimlerChrysler AN (Dakota) program serviced by a new Michigan based specialty vehicle assembly facility launched by the Company in the fourth quarter of 2002, the Ford U231 (Aviator) program and the BMW E85 (Z4) program amongst others; and
- •
- strong volumes on other high content production programs including the General Motors GMX 210 (Impala), GMX 320 (Cadillac CTS) and GMT 820 C and D (Cadillac Escalade and Denali SUV) programs, the DaimlerChrysler DR (Ram pickup) program and the Ford U222 (Expedition) program.
These increases were partially offset by:
- •
- end of production on the DaimlerChrysler LH (Concorde, Intrepid and 300M) program during 2003 (the new Daimler Chrysler LX program did not launch until the first quarter of 2004);
- •
- lower production volumes as a result of the changeover of the Ford WIN 126 (Windstar) program to the V229 (Freestar) program during the year (V229 (Freestar) fascia production was transferred by Ford to a competitor at the end of 2003);
- •
- end of production on the General Motors MS2000 (Grand Prix) program;
- •
- lower production volumes on certain other long running high content programs including the Ford U152 (Explorer) and EN114 (Crown Victoria, Grand Marquis) programs and the DaimlerChrysler JR (Stratus, Sebring and Sebring Convertible), RS (Minivan) and PT Cruiser programs;
- •
- reduced painting content on the GMT 805 (Avalanche) and GMT 806 (Escalade EXT) programs and end of production during 2002 on the Ford CT120 (Escort) 4 door program all in Mexico;
- •
- reduced content on the DaimlerChrysler RS (Minivan) program;
- •
- the closure of the Company's specialty vehicle operation in Montreal due to the end of production of the F Car (Camaro, Firebird) at General Motors' St. Therese assembly plant in the third quarter of 2002; and
- •
- the impact of OEM price concessions.
North American Vehicle Production Volumes
(in millions) | | North American Average Content Per Vehicle | | North American Production Sales
(in millions) |
 | |  | |  |
Europe
European production sales increased 31% to $646.5 million in 2003 on substantially level production volumes. European content per vehicle grew $9 or 30% to approximately $39 for 2003. Content growth was driven by the translation of Euro and British Pound sales into the Company's U.S. dollar reporting currency. This added approximately $83.1 million to European production sales and $5 to European content per vehicle.
Content growth was also driven by sales at recent new facility startups in the latter part of 2002 and in 2003 including the launch of the VW Group T5 (Transit Van) fascia and front end module assembly and sequencing program at the Company's new Modultec and Formatex facilities in Germany and Poland; the launch of the DaimlerChrysler Mercedes E Class 4 Matic front end module assembly and sequencing program at the Company's new Graz, Austria facility; the launch of the VW Group A5 (Golf) program in the fourth quarter of 2003 including fascia production at the Company's new Belplas paint line and front end module assembly and sequencing at the Company's new Brussels Sequencing Centre. These new facilities collectively added approximately $102.9 million to production sales and $6 to European content per vehicle.
18 Decoma International Inc.
The remaining net $31.3 million reduction in production sales and $2 reduction in content per vehicle is due to a number of factors including a decline in production volumes on the Jaguar X400 program produced at Merplas. Merplas' sales declined from $34.7 million in 2002 to $30.4 million in 2003. Adjusting to eliminate the impact of translation of British Pound sales into U.S. dollars, Merplas' sales declined $7.3 million. In addition, European production sales and content were negatively impacted by lower volumes on certain long running high content programs such as the DaimlerChrysler Mercedes C Class and various Rover programs and end of production of DaimlerChrysler Mercedes E Class trim production, Landrover Discovery fascia production and the Audi TT hard top program. These factors were partially offset by the launch of various new Audi production programs at the Company's facilities in Germany and strong BMW Mini volumes.
European Vehicle Production Volumes
(in millions) | | European Average Content Per Vehicle | | European Production Sales
(in millions) |
 | |  | |  |
Global Tooling and Other
Tooling and other sales on a global basis increased 17% to $202.5 million for 2003. The increase came in both North America and Europe and is primarily related to translation of Canadian dollar, Euro and British pound sales into the Company's U.S. dollar reporting currency which added $18.8 million to tooling sales. The remaining $10.3 million or 6% increase relates to new program launches including the Ford U204 (Escape) refresh program in North America and the VW Group A5 (Golf) program in Europe.
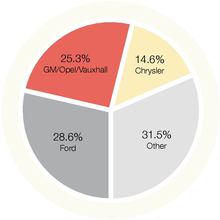
Sales by Customer
The Company' s sales by customer breakdown for 2003 and 2002 was as follows:
| | Year Ended December 31, 2003
| | Year Ended December 31, 2002
|
|---|
| | North America
| | Europe
| | Global
| | North America
| | Europe
| | Global
|
|---|
| Traditional "Big 3" Brands | | | | | | | | | | | | |
| | Ford | | 25.4% | | 2.1% | | 27.5% | | 26.5% | | 2.1% | | 28.6% |
| | GM / Opel / Vauxhall | | 22.6% | | 1.8% | | 24.4% | | 23.9% | | 1.4% | | 25.3% |
| | Chrysler | | 12.6% | | 0.8% | | 13.4% | | 13.9% | | 0.7% | | 14.6% |
| | |
| |
| |
| |
| |
| |
|
| | | 60.6% | | 4.7% | | 65.3% | | 64.3% | | 4.2% | | 68.5% |
| |
VW Group |
|
0.1% |
|
8.8% |
|
8.9% |
|
0.1% |
|
4.7% |
|
4.8% |
| | Mercedes | | — | | 8.7% | | 8.7% | | — | | 9.4% | | 9.4% |
| | BMW | | 0.6% | | 1.7% | | 2.3% | | 0.5% | | 1.6% | | 2.1% |
| | Ford Premier Automotive Group ("Ford PAG") | | 0.1% | | 2.1% | | 2.2% | | 0.1% | | 2.3% | | 2.4% |
| | Renault Nissan | | 1.5% | | 0.5% | | 2.0% | | 1.6% | | 0.6% | | 2.2% |
| | Other | | 5.5% | | 5.1% | | 10.6% | | 5.6% | | 5.0% | | 10.6% |
| | |
| |
| |
| |
| |
| |
|
| | | 68.4% | | 31.6% | | 100.0% | | 72.2% | | 27.8% | | 100.0% |
| | |
| |
| |
| |
| |
| |
|
| (i) Included above are sales to Asian new domestics | | 4.1% | | 0.1% | | 4.2% | | 3.8% | | 0.3% | | 4.1% |
| | |
| |
| |
| |
| |
| |
|
The Company continues to grow it sales with original equipment manufacturer ("OEM") customers outside the traditional "Big 3" automotive brands.
The growth in sales to the VW Group is the result of the launch of the VW Group T5 (Transit Van) and A5 (Golf) fascia and front end module programs and the recent launch of a number of new Audi programs. The Company's sales to the VW Group are expected to continue to grow as the VW A5 (Golf) program ramps up and the VW SLW (City Car) program launches at Formatex. Sales to Mercedes are also expected to grow with the launch of both the A Class program in the second half of 2004 and the Decostar facility in 2005.
Annual Report 2003 19
The Company's largest production sales programs for 2003 in each of North America and Europe included:
North America
- •
- Ford U152 (Explorer)
- •
- DaimlerChrysler JR (Stratus, Sebring and Sebring Convertible)
- •
- Ford EN114 (Crown Victoria and Grand Marquis)
- •
- DaimlerChrysler DR (Ram pick up)
- •
- DaimlerChrysler LH (Concorde, Intrepid and 300M)
Europe
- •
- DaimlerChrysler Mercedes C Class
- •
- VW Group T5 (Transit Van)
- •
- BMW Mini
- •
- Audi B6 (A4)
- •
- Opel Epsilon
The DaimlerChrysler LH (Concorde, Intrepid and 300M) program remained one of the Company's largest North American production sales programs despite the fact that this program ended in the third quarter of 2003 and the new LX program does not start up until the first quarter of 2004.
Although the Company has significant North American business with General Motors, including a number of individually significant programs such as the GMX 210 (Impala), individual General Motors' programs are outside the Company's top 5 sales dollar programs.
Global Tooling and Other Sales
(in millions) | | Sales by Customer |
 | |  |
GROSS MARGIN
Gross margin increased to $464.7 million in 2003 compared to $423.4 million in 2002. As a percentage of total sales, gross margin declined to 19.7% compared to 20.6% for 2003 and 2002, respectively.
The gross margin percentage in North America was substantially unchanged at 25.0% in 2003 compared to 24.7% in 2002. The Company's ongoing continuous improvement programs, favourable purchase price variances on net U.S. dollar purchases within the Company's Canadian operations and increased claims for eligible research and development investment tax credits enabled the North American segment to successfully offset the impact of the changeover of a number of large North American production programs; lower North American production volumes including lower volumes on certain long running high content programs; OEM price concessions; spending at the Company's Decostar facility; increased costs within the Company's systems integration operations with the launch of two new facilities in 2003 and costs in preparation for the launch of additional facilities in 2004; growth in the Company's lighting business which currently operates at lower margins; and FM Lighting Acquisition integration costs.
European gross margin declined to 8.2% in 2003 compared to 9.8% in 2002. The decline in the European gross margin percentage is due primarily to new facility startups and the growth in front end module assembly and sequencing sales and the lower margins associated with purchased components. In addition, continued operating inefficiencies and other performance issues at the Company's Prometall and Decoform facilities negatively impacted gross margin. These negative impacts were partially offset by improvements at Merplas and within the Company's paint operations at its Decorate trim facility.
The competitive environment within the automotive industry continues to cause the Company's customers to increase pressure for price concessions and to finance or absorb more engineering costs related to product design, tooling costs and certain capital and other items. The Company has been largely successful in the past in responding to these pressures through improved operating efficiencies and cost reductions. However, customer pressure for price concessions has intensified in recent quarters. Although the Company remains highly focused on continuous improvement activities, continued significant incremental price concessions could have an adverse impact on the Company's gross margin percentage.
DEPRECIATION AND AMORTIZATION
Depreciation and amortization costs increased to $89.9 million for 2003 compared to $78.3 million for 2002. Of this increase, $7.1 million is attributable to the translation of Canadian dollar, Euro and British Pound depreciation expense into the Company's U.S. dollar reporting currency. The Company's ongoing capital spending program also contributed to increased depreciation expense including commencement of depreciation at the Company's new Belplas paint line in the fourth quarter of 2003. These increases were partially offset by a reduction in Merplas deferred preproduction amortization as a result of the 2002 write-down of Merplas' deferred preproduction expenditures. Depreciation expense in 2002 includes $0.7 million of Merplas deferred preproduction amortization prior to the write-down.
20 Decoma International Inc.
Depreciation as a percentage of total sales was substantially unchanged at 3.8% in 2003 and 2002.
Depreciation on capital invested at Decostar will not commence until commercial production begins which is now scheduled for the first quarter of 2005.
SELLING, GENERAL AND ADMINISTRATIVE ("S, G&A")
S,G&A costs were $175.3 million for 2003, up from $137.9 million for 2002. This increase reflects the translation of Canadian dollar, Euro and British Pound S,G&A costs into the Company's U.S. dollar reporting currency which increased reported S,G&A dollars by $15.0 million. In addition, foreign exchange losses increased by $7.8 million in 2003 compared to 2002 largely on U.S. dollar denominated monetary items held in Canada. The impact of the Company's change in accounting policy to expense stock options granted on or after January 1, 2003 increased S,G&A expense by $0.3 million (readers are asked to refer to note 4 to the Company's consolidated financial statements for the year ended December 31, 2003, included elsewhere herein).
The remaining $14.3 million increase in S,G&A expense is related to the Company's Decostar and Belplas projects; the FM Lighting Acquisition; and additional S,G&A expense at recently launched facilities including Modultec, Formatex, Graz and the Brussels Sequencing Centre in Europe and increased costs within the Company's systems integration operations with the launch of two new facilities in 2003 and costs in preparation for the launch of additional facilities in 2004.
As a percentage of total sales, S,G&A increased to 7.4% for 2003 compared to 6.7% for 2002.
In addition to the benefits provided by Magna International Inc. and it's subsidiaries ("Magna") to Decoma under the affiliation agreement noted below, Magna provides certain management and administrative services to the Company, including specialized legal, environmental, immigration, tax, treasury, information systems (including wide area network infrastructure and support services) and employee relations services (including administration of Decoma's Employee Equity Participation and Profit Sharing Program), in return for a specific amount negotiated between the Company and Magna which includes an allocated share of the facility and overhead costs dedicated to providing these services. The Company is currently in discussions with Magna with respect to a formal long-term agreement detailing these arrangements. The cost of management and administrative services provided by Magna and included in S,G&A was $4.2 million for 2003 compared to $3.6 million for 2002. The increase is due to translation of Canadian dollar fees into the Company's U.S. dollar reporting currency and to an increase in the cost of the services provided.
AFFILIATION AND SOCIAL FEES
The Company is party to an affiliation agreement with Magna that provides for the payment by Decoma of an affiliation fee. The affiliation agreement provides the Company with, amongst other things, certain trademark rights, access to Magna's management and to its operating principles and policies, internal audit services, Tier 1 development assistance, global expansion assistance, vehicle system integration and modular product strategy assistance and sharing of best practices in areas such as new management techniques, employee benefits and programs, marketing and technology development initiatives.
As previously disclosed, the Company entered into an amended agreement with Magna effective August 1, 2002. Affiliation fees payable under the amended agreement were reduced to 1% of Decoma's consolidated net sales (as defined in the agreement) from the 1.5% rate that previously applied. In addition, the amended agreement provides for a fee holiday on 100% of consolidated net sales derived from future business acquisitions in the calendar year of the acquisition and 50% of consolidated net sales derived from future business acquisitions in the first calendar year following the year of acquisition. The amended agreement also entitled Decoma to a credit equal to 0.25% of Decoma's consolidated net sales for the period from January 1, 2002 to July 31, 2002. In addition, Decoma was entitled to a credit equal to 1.5% of 2001 consolidated net sales derived from the acquisition of Autosystems and 50% of 1.25% of January 1, 2002 to July 31, 2002 consolidated net sales derived from Autosystems.
Decoma's corporate constitution specifies that the Company will allocate a maximum of 2% of its profit before tax to support social and charitable activities. The Company pays 1.5% of its consolidated pretax profits to Magna which in turn allocates such amount to social and other charitable programs on behalf of Magna and its affiliated companies, including Decoma.
Affiliation and social fees expense for 2003 decreased to $24.5 million from $25.3 million for 2002. Affiliation fee expense in 2002 was 1.25% through July 31 and 1.0% thereafter on consolidated net sales, less the Autosystems related fee holiday. Affiliation fees for 2003 were 1.0% of consolidated net sales, less the acquisition related fee holidays primarily related to the FM Lighting Acquisition. The decrease in the 2003 affiliation and social fees expense is the result of a lower effective affiliation fee rate in 2003 compared to 2002 and reduced social fee expenses due to a reduction in the pretax profits on which the social fees are calculated, partially offset by an increase in consolidated net sales on which the affiliation fees are calculated.
Affiliation and social fee expense as a percentage of total sales declined to 1.0% in 2003 compared to 1.2% in 2002.
Annual Report 2003 21
OPERATING INCOME
| | Years Ended December 31,
| |
|---|
[U.S. dollars in millions]
| | 2003
| | 2002
| | % Change
| |
|---|
| Operating Income | | | | | | | | | |
| | North America | | $ | 213.8 | | $ | 204.4 | | 5% | |
| | Europe | | | | | | | | | |
| | | Excluding Merplas and other charges | | | (10.8 | ) | | 1.8 | | | |
| | | Merplas excluding deferred preproduction expenditures write-off | | | (11.5 | ) | | (16.1 | ) | 29% | |
| | | Merplas deferred preproduction expenditures write-off | | | — | | | (8.3 | ) | | |
| | | United Kingdom impairment charge | | | (12.4 | ) | | — | | | |
| | | Continental Europe paint capacity consolidation charges | | | (11.4 | ) | | — | | | |
| | |
| |
| | | |
| | | Total Europe | | | (46.1 | ) | | (22.6 | ) | (104% | ) |
| | Corporate | | | (16.5 | ) | | (8.1 | ) | | |
| | |
| |
| |
| |
| | Total Operating Income | | $ | 151.2 | | $ | 173.7 | | (13% | ) |
| | |
| |
| |
| |
As a percentage of total sales, operating income before other charges was 7.4% for 2003 compared to 8.8% for 2002.
The increase in the corporate segment operating loss is attributable to an increase in foreign exchange losses of $7.6 million on U.S. dollar denominated monetary items held in Canada, one time severance costs and the impact of the Company's change in accounting policy to expense stock options granted on or after January 1, 2003 which added $0.3 million to the corporate segment operating loss.
North America
North American operating income increased $9.4 million to $213.8 million for 2003. As a percentage of total North American sales, North American operating income was 13.2% in 2003 compared to 13.7% in 2002.
The 0.5% decline in North American operating income as a percentage of total sales is the result of:
- •
- a 0.8% increase in S,G&A expenses as a percentage of total sales from 5.8% in 2002 to 6.6% in 2003 as a result of increased costs related to the Company's lighting business including integration costs related to the FM Lighting Acquisition, increased costs related to Decostar and the Company's systems integration operations and the impact of a temporary reduction in sales as a result of the changeover of a number of large production programs including end of production on the DaimlerChrysler LH (Concorde, Intrepid and 300M) program (the new DaimlerChrysler LX program does not launch until the first quarter of 2004) without a similar temporary reduction in S,G&A costs; and
- •
- a 0.1% increase in depreciation expense as a percent of total sales from 3.7% in 2002 to 3.8% in 2003; partially offset by
- •
- a 0.1% reduction in affiliation and social fees as a percentage of total sales as a result of the reduction in the affiliation fee rate and as a result of the acquisition fee holiday related to the FM Lighting Acquisition, partially offset by the elimination of the acquisition affiliation fee holiday related to the 2001 acquisition of Autosystems; and
- •
- a 0.3% improvement in the North American gross margin percentage.
Europe
European operating losses were negatively impacted by the United Kingdom impairment and continental Europe paint capacity consolidated charges, partially offset by the Merplas deferred preproduction expenditures write-off in 2002. Excluding other charges, European operating income declined $8.0 million. European operating income continues to be negatively impacted by efficiency and other performance issues at the Company's Prometall and Decoform facilities. Operating income at these facilities declined by $10.0 million in 2003 compared to 2002. In addition to the impact of operating inefficiencies, this decline is also the result of:
- •
- costs associated with various Audi production programs recently launched at these facilities;
- •
- costs associated with various Porsche programs that will launch in 2004 at a new assembly and sequencing facility in Zuffenhausen, Germany with fascia and related trim production originally scheduled to come from the Company's existing Decoform facility and from third parties (Decoform Porsche production has now been shifted to Belplas as a result of the Company's continental Europe paint capacity consolidation plan); and
- •
- costs associated with the transfer, to a new facility located in Germany, and start-up of the Prometall operations.
In addition, the Company's Decotrim exterior trim facility in Belgium continues to be impacted by competitive pricing pressures and open capacity. Decotrim's operating losses grew $0.6 million in 2003 compared to 2002.
Operating results were also negatively impacted by costs incurred to support European sales growth including:
- •
- costs associated with establishing the Company's Formatex moulding, assembly and sequencing facility located in Poland to service the VW Group T5 (Transit Van) and the SLW (City Car) Polish production programs; and
22 Decoma International Inc.
- •
- costs associated with the construction and launch of the Company's new Belplas paint line and the takeover of the Brussels Sequencing Centre both to service a portion of the production volume on the VW Group A5 (Golf) program commencing in the fourth quarter of 2003.
The aggregate net change in operating income in 2003 compared to 2002 at Formatex, Belplas and the Brussels Sequencing Centre was a reduction of $9.4 million.
Finally, during the fourth quarter of 2003, the Company completed the acquisition of HDO Galvano-und Oberflächentechnik GmbH ("HDO") which operated a chroming line adjacent to the Company's Idoplas facility. The line is being converted to allow for grille chroming and will be integrated into Idoplas' operations. The Company expects to launch the chroming line in early 2004 and commence the insourcing of grille chroming business currently outsourced by Decoma's European operations at that time. As a result, the fourth quarter of 2003 was negatively impacted by chroming line start-up and launch costs.
The above costs were partially offset by:
- •
- income now being generated at the Company's Modultec mould in colour, assembly and sequencing facility which was launched in Germany in the fourth quarter of 2002 to supply the VW Group T5 (Transit Van) program and the Company's Graz, Austria assembly and sequencing facility which was launched in the first quarter of 2003 to supply Magna Steyr's DaimlerChrysler Mercedes E Class 4 Matic program (the aggregate net change in operating income in 2003 compared to 2002 at Modultec and Graz, was an improvement of $1.4 million); and
- •
- improvements at the Company's other European facilities, most notably within the paint operations at its Decorate trim facility in Germany and continued strong operating profits generated at the Company's Innoplas fascia facility in Germany despite lower production volumes on its highest content program, the DaimlerChrysler Mercedes C Class, and costs associated with the DaimlerChrysler Mercedes A Class program that will launch in the second half of 2004 (operating income at these two facilities combined improved $5.3 million in 2003 compared to 2002).
Finally, Merplas' operating loss before other charges improved to $11.5 million for 2003 compared to a loss of $16.1 million in 2002. Adjusting to eliminate the impact of translation of British Pound operating losses into U.S. dollars, Merplas' operating loss declined $6.0 million in 2003 compared to 2002. This improvement was realized despite the reduced fixed cost coverage effects of a significant drop in production sales as a result of lower Jaguar X400 production volumes. The improvement relates, in part, to the recovery of tooling and engineering costs that were expensed in prior periods. However, the balance of the improvement reflects the impact of significant operating improvements implemented at Merplas over the last two years.
EQUITY INCOME
Income from equity accounted investments, which includes the Company's 40% share of Bestop, Inc. ("Bestop") and Modular Automotive Systems, LLC, increased to $1.8 million for 2003 compared to $0.5 million for 2002 due to closure costs in 2002 with respect to one of Bestop's facilities and the resulting improvement in operating performance as a result of the closure.
INTEREST EXPENSE
Interest expense for 2003 declined to $10.7 million compared to $12.0 million for 2002 as a result of a reduction in average interest bearing net debt (including bank indebtedness, long-term debt including current portion and debt due to Magna including current portion, less cash and cash equivalents) levels and interest capitalized on the Company's Decostar and Belplas paint line projects of $1.3 million in 2003 (nil in 2002) partially offset by translation of Canadian dollar and Euro interest into the Company's U.S. dollar reporting currency. In addition, lower interest rates on debt due to Magna contributed to the reduction. The original interest rate on the first and second tranches of Euro denominated debt due to Magna was 7.0%. The first and second tranches were due October 1, 2002 and October 1, 2003, respectively. However, since the original maturity dates of this debt, the Company, with Magna's consent, was extending the repayment of this debt at 90 day intervals at market interest rates ranging from 3.14% to 4.29%. Substantially all of this debt was repaid in December 2003.
Interest on debt due to Magna and its affiliates and included in reported interest expense amounted to $11.3 million in 2003 compared to $10.1 million in 2002. This increase is the result of translation of Canadian dollar and Euro interest into the Company's U.S. dollar reporting currency partially offset by the interest rate reductions described above.
AMORTIZATION OF DISCOUNT ON CONVERTIBLE SERIES PREFERRED SHARES
The Company's amortization of the discount on the portion of the Convertible Series Preferred Shares held by Magna classified as debt increased to $8.6 million for 2003 compared to $8.4 million for 2002. The increase reflects the translation of Canadian dollar amortization into the Company's U.S. dollar reporting currency and increased amortization on the Series 4 and 5 Convertible Series Preferred Shares as the liability amount approaches face value, partially offset by lower amortization as a result of the discount on the Series 3 Convertible Series Preferred Shares being fully amortized as of July 31, 2002. As of December 31, 2003, the Series 4 Convertible Series Preferred Shares are fully amortized. Therefore, amortization in 2004 will be reduced as it will be limited to amortization on the Series 5 Convertible Series Preferred Shares only.
OTHER INCOME
Other income in 2003 of $1.4 million represents the recognition in income of a pro rata amount of the Company's cumulative translation adjustment account on the permanent repatriation of $75 million of the Company's net investment in its United States operations. This amount was not subject to tax.
Annual Report 2003 23
Other income in 2002 includes a $3.9 million gain on the sale of a non-core North American operating division. Income tax expense for 2002 includes $1.0 million related to this gain. In addition, other income in 2002 includes $0.5 million as a result of the recognition in income of a pro rata amount of the Company's cumulative translation adjustment account on the permanent repatriation of Euro 10 million of the Company's net investment in its continental Europe operations. This amount was not subject to tax.
INCOME TAXES
The Company's effective income tax rate for 2003 increased to 46.8% from 41.2% for 2002. As explained in the "Other Charges" section of this MD&A, the other charges in 2003 and 2002 were not tax effected which negatively impacted the Company's effective tax rate. Similarly, the Company's other income in 2003 and 2002 was either fully or partially not subject to tax. In addition, as a result of an increase in future Ontario, Canada income tax rates and the resulting required revaluation of the Company's future net tax liabilities, the Company's 2003 tax expense increased by $1.1 million. Excluding other charges, other income and the future net tax liability revaluation as a result of Ontario, Canada future tax rate changes, the Company's effective tax rate for 2003 was substantially unchanged at 39.4% compared to 39.6% for 2002.
The Company's effective tax rate continues to be high due to Convertible Series Preferred Share amortization which is not deductible for tax purposes and losses which are not being tax benefited primarily in the United Kingdom, Germany, Belgium and Poland. Cumulative unbenefited tax loss carryforwards total approximately $143 million. Substantially all of these losses have no expiry date and will be available to shelter future taxable income in these jurisdictions.
NET INCOME
Net income for 2003 declined to $71.9 million from $93.0 million for 2002.
Excluding the impact of other charges, other income and the future net tax liability revaluation, the Company's net income declined $2.5 million (readers are asked to refer to the "Overview" section of this MD&A for further discussion). The decline in net income was due to reduced operating income partially offset by lower interest expense.
FINANCING CHARGES
The deduction from net income of financing charges on the Convertible Series Preferred Shares held by Magna (comprised of dividends declared on the Convertible Series Preferred Shares less the reduction of the Convertible Series Preferred Shares dividend equity component) decreased to $4.5 million for 2003 compared to $4.8 million for 2002. The decrease reflects the conversion of the Series 1, 2 and 3 Convertible Series Preferred Shares into the Company's Class A Subordinate Voting Shares in August 2003 partially offset by the translation of Canadian dollar dividends into the Company's U.S. dollar reporting currency.
In March of 2003, the Company issued the Convertible Debentures. Financing charges, net of income tax recoveries, related to the Convertible Debentures were $3.0 million in 2003. The Company has the option to settle Convertible Debenture interest, and principal on redemption or maturity, with Class A Subordinate Voting Shares. In addition, the holders of the Convertible Debentures have the right to convert into Class A Subordinate Voting Shares at a fixed price at any time. As a result, under current Canadian generally accepted accounting principles ("GAAP"), the Convertible Debentures are presented as equity and the carrying costs associated with the Debentures are charged to retained earnings. Therefore, Convertible Debenture carrying charges do not impact net income. However, because interest on the Convertible Debentures is paid in preference to common shareholders, the Convertible Debenture carrying charges reduce net income attributable to Class A Subordinate Voting and Class B Shares.
The Canadian Institute of Chartered Accountants recently amended Handbook Section 3860, "Financial Instruments — Disclosure and Presentation", to require certain obligations that may be settled with an entity's own equity instruments to be reflected as a liability. The amendments must be adopted in the Company's 2005 consolidated financial statements with retroactive application. Upon adoption, the Convertible Debentures currently presented entirely within equity on the consolidated balance sheet will have to be presented in part as a liability and in part as equity and the related liability carrying costs will be presented as a charge to net income.
DILUTED EARNINGS PER SHARE
| | Years Ended December 31,
| |
|---|
| | 2003
| | 2002
| | % Change
| |
|---|
| Earnings per Class A Subordinate Voting or Class B Share [U.S. dollars] | | | | | | | | | |
| | Basic | | $ | 0.88 | | $ | 1.30 | | (32% | ) |
| | Diluted
| | 0.77
| | 1.03
| | (25%
| )
|
| Average number of Class A Subordinate Voting and Class B Shares outstanding [in millions] | | | | | | | | | |
| | Basic | | | 73.4 | | | 67.8 | | 8% | |
| | Diluted
| | 104.3
| | 98.3
| | 6%
| |
24 Decoma International Inc.
The increase in the weighted average number of basic Class A Subordinate Voting and Class B Shares outstanding is due to the issuance of 14,895,729 Class A Subordinate Voting Shares on conversion of the Series 1, 2 and 3 Convertible Series Preferred Shares during the third quarter of 2003. This transaction negatively impacted basic earnings per share but had no impact on diluted shares outstanding or diluted earnings per share. Readers are asked to refer to the "Consolidated Capitalization" section of this MD&A for further discussion regarding the conversion.
Diluted earnings per share for 2003 declined to $0.77. Excluding the impact of other charges, other income and the future net tax liability revaluation, the Company's diluted earnings per share declined $0.08 (readers are asked to refer to the "Overview" section of this MD&A for further discussion). This decline is primarily attributable to an increase in the average number of diluted Class A Subordinate Voting and Class B Shares outstanding due to the issuance in March 2003 of the Convertible Debentures and to the issuance of 451,400 and 548,600 Class A Subordinate Voting Shares to the Decoma employee deferred profit sharing program during the third quarter of 2002 and second quarter of 2003, respectively, and due to the $2.5 million decline in net income.
The maximum number of shares that would be outstanding if all of the Company's stock options, Convertible Series Preferred Shares and Convertible Debentures issued and outstanding as at December 31, 2003 were exercised or converted would be 108.8 million. (Refer to note 14 of the Company's consolidated financial statements, included elsewhere herein, for further discussion.)
FINANCIAL CONDITION, LIQUIDITY AND CAPITAL RESOURCES
Cash Flows for the Years Ended December 31, 2003 and 2002
| | Years Ended December 31,
| |
|---|
[U.S. dollars in millions]
| | 2003
| | 2002
| |
|---|
| EBITDA before non-cash impairment charges | | | | | | | |
| | North America | | $ | 276.2 | | $ | 259.9 | |
| | Europe | | | | | | | |
| | | Excluding Merplas | | | 14.2 | | | 21.7 | |
| | | Merplas | | | (9.0 | ) | | (13.2 | ) |
| | | Continental Europe paint capacity consolidation charges | | | (6.7 | ) | | — | |
| | |
| |
| |
| | | Total Europe | | | (1.5 | ) | | 8.5 | |
| | Corporate | | | (16.5 | ) | | (8.1 | ) |
| | |
| |
| |
| | | | 258.2 | | | 260.3 | |
| Interest, cash taxes and other operating cash flows | | | (74.7 | ) | | (71.7 | ) |
| | |
| |
| |
| Cash flow from operations before changes in non-cash working capital | | | 183.5 | | | 188.6 | |
| Cash (invested in) generated from non-cash working capital | | | (51.6 | ) | | 50.0 | |
| Fixed and other asset spending, net | | | | | | | |
| | North America | | | (114.2 | ) | | (57.5 | ) |
| | Europe | | | (71.3 | ) | | (50.6 | ) |
| Acquisition spending | | | | | | | |
| | North America | | | (13.3 | ) | | (2.6 | ) |
| | Europe | | | (5.8 | ) | | — | |
| Proceeds from disposition of operating division | | | — | | | 5.7 | |
| Convertible Debenture interest payments | | | (3.8 | ) | | — | |
| Dividends | | | | | | | |
| | Convertible Series Preferred Shares | | | (12.2 | ) | | (12.1 | ) |
| | Class A Subordinate Voting and Class B Shares | | | (18.8 | ) | | (14.2 | ) |
| | |
| |
| |
| Cash generated and available for debt reduction (shortfall to be financed) | | | (107.5 | ) | | 107.3 | |
| Repayments of debt due to Magna | | | (72.4 | ) | | (7.8 | ) |
| Net decrease in long-term debt | | | (0.1 | ) | | (10.9 | ) |
| Net increase (decrease) in bank indebtedness | | | 109.7 | | | (110.3 | ) |
| Issuance of Convertible Debentures | | | 66.1 | | | — | |
| Issuances of Class A Subordinate Voting Shares | | | 4.7 | | | 4.7 | |
| Foreign exchange on cash and cash equivalents | | | 11.0 | | | 4.8 | |
| | |
| |
| |
| Net increase (decrease) in cash and cash equivalents | | $ | 11.5 | | $ | (12.2 | ) |
| | |
| |
| |
The Company has presented EBITDA before non-cash impairment charges as supplementary information concerning the cash flows of the Company and its operating segments. The breakdown of both EBITDA before non-cash impairment charges and fixed and other asset and acquisition spending by segment provides readers with an indication of where cash is being generated and used. The Company defines EBITDA before non-cash impairment charges (totalling $258.2 million and $260.3 million in 2003 and 2002, respectively) as operating income ($151.2 million and $173.7 million in 2003 and 2002, respectively) plus depreciation and amortization ($89.9 million and $78.3 million in 2003 and 2002, respectively) plus the United Kingdom impairment charge ($12.4 million in 2003) plus the non-cash portion of the continental Europe paint capacity consolidation charges ($4.8 million in 2003) and plus the Merplas deferred preproduction expenditures write-off ($8.3 million in 2002) based on the respective amounts presented in the Company's consolidated statements of income included elsewhere herein. However, EBITDA before non-cash impairment charges does not have any standardized meaning under Canadian GAAP and is, therefore, unlikely to be comparable to similar measures presented by other issuers.
Annual Report 2003 25
CASH GENERATED AND AVAILABLE FOR DEBT REDUCTION (SHORTFALL TO BE FINANCED)
Investments in non-cash working capital, capital and acquisition spending, Convertible Debenture interest and dividends exceeded cash generated from operations by $107.5 million for 2003 compared to an excess of cash generated from operations, non-cash working capital and proceeds from disposition over capital and acquisition spending and dividends of $107.3 million in 2002. This change was due primarily to $51.6 million being invested in non-cash working capital in 2003 compared to $50.0 million being generated from non-cash working capital in 2002. The increase in working capital is primarily the result of increased European working capital with higher sales from new facilities, increases in tooling related amounts and an increase in taxes receivable partially offset by accruals related to the continental Europe paint capacity consolidation plan.
In addition, increased capital and acquisition spending and dividends and Convertible Debenture interest also contributed to the usage of cash.
Investing Activities
Capital spending, excluding acquisition spending, on a global basis totalled $185.5 million in 2003.
Given economic uncertainties throughout 2001 and 2002, the Company eliminated or delayed planned capital spending wherever possible. However, capital spending for 2003 has increased. The increase reflects spending to complete the Belgium paint line during 2003, continued Decostar spending, European spending related to new program launches including spending for the DaimlerChrysler A Class program which will launch in 2004 and spending due to prior deferrals of previously planned facility upgrade and other process related and improvement projects. Spending on Decostar will continue in 2004. Spending for 2004 is expected to approximate $151 million. Readers are asked to refer to the "Financial Condition, Liquidity and Capital Resources — Unused and Available Financing Resources" section of this MD&A for further discussion.
Acquisition spending in 2003 includes $10.4 million for the FM Lighting Acquisition, $2.9 million for the repayment of promissory notes that arose on the May 2001 acquisition of the remaining minority interest in the Company's Mexican operations and $5.8 million for the acquisition of HDO in Europe.
Dividends
Dividends paid on the Company's Convertible Series Preferred Shares were $12.2 million for 2003 up from $12.1 million in 2002 due to translation of Canadian dollar dividends into the Company's U.S. dollar reporting currency partially offset by reduced dividends as a result of the conversion of the Series 1, 2 and 3 Convertible Series Preferred Shares into Class A Subordinate Voting Shares during the year.
Dividends paid in 2003 on Class A Subordinate Voting and Class B Shares totalled $18.8 million. This represents dividends paid of US$0.07 per share in respect of the three month periods ended September 30 and June 30, 2003 and US$0.06 per share in respect of the three month periods ended March 31, 2003 and December 31, 2002.
Dividends paid during 2002 on Class A Subordinate Voting and Class B Shares totalled $14.2 million representing dividends declared of US$0.06 in respect of the three month period ended September 30, 2002 and US$0.05 per share in respect of the three month periods ended June 30 and March 31, 2002 and December 31, 2001.
Subsequent to December 31, 2003, the board of directors of the Company declared a dividend of US$0.07 per Class A Subordinate Voting and Class B Share in respect of the three month period ended December 31, 2003.
FINANCING ACTIVITIES
The $107.5 million shortfall in cash generated from operations over cash invested in non-cash working capital, capital and acquisition spending, Convertible Debenture interest and dividends, was covered with $66.1 million raised through the issuance of Convertible Debentures, the issuance of $4.7 million Class A Subordinate Voting Shares to the Decoma employee deferred profit sharing plan and with additional draws on the Company's $300 million operating credit facility. The Company's $300 million operating credit facility was also drawn upon to fund the repayment of $72.4 million of debt due to Magna. As a result, bank indebtedness grew to $177.3 million at December 31, 2003 compared to $55.0 million at December 31, 2002. Cash and cash equivalents at December 31, 2003 were $93.5 million compared to $82.1 million at December 31, 2002.
The Company's bank indebtedness is currently drawn substantially in Canada. However, the Company held cash primarily in the United States, Europe and Mexico at the year end. Although there are no long-term restrictions on the flow of funds from one jurisdiction to the other, there may be costs, such as withholding taxes, to move funds between jurisdictions. As a result, the Company is not always able to immediately apply the cash held in certain jurisdictions against bank borrowings in other jurisdictions.
26 Decoma International Inc.
CONSOLIDATED CAPITALIZATION
[U.S. dollars in millions]
| | December 31, 2003
| |
| | December 31, 2002
| |
|
|---|
| Cash and cash equivalents | | $ | (93.5 | ) | | | $ | (82.1 | ) | |
| Bank indebtedness | | | 177.3 | | | | | 55.0 | | |
| | |
| | | |
| | |
| | | | 83.8 | | | | | (27.1 | ) | |
| Debt due within twelve months | | | | | | | | | | |
| | Due to Magna, repaid subsequent to year end (previously due December 31, 2003) | | | 3.5 | | | | | 38.3 | | |
| | Due to Magna March 31, 2004 (previously due December 31, 2003) | | | 46.5 | | | | | 64.2 | | |
| | Due to Magna December 31, 2004 | | | 90.6 | | | | | — | | |
| | Other | | | 6.0 | | | | | 8.0 | | |
| | |
| | | |
| | |
| | | | 146.6 | | | | | 110.5 | | |
| Long-term debt | | | | | | | | | | |
| | Due to Magna December 31, 2004 | | | — | | | | | 75.1 | | |
| | Other | | | 11.2 | | | | | 9.7 | | |
| | |
| |
| |
| |
|
| Net Conventional Debt | | $ | 241.6 | | 24.0% | | $ | 168.2 | | 22.6% |
| | |
| |
| |
| |
|
| Liability portion of Convertible Series | | | | | | | | | | |
| Preferred Shares, held by Magna | | | | | | | | | | |
| | Current | | $ | 150.6 | | | | $ | 95.6 | | |
| | Long-term | | | — | | | | | 116.2 | | |
| | |
| |
| |
| |
|
| | | $ | 150.6 | | 15.0% | | $ | 211.8 | | 28.5% |
| | |
| |
| |
| |
|
| Shareholders' equity | | | | | | | | | | |
| | Convertible Debentures | | $ | 66.1 | | 6.6% | | $ | — | | |
| | Other | | | 547.5 | | 54.4% | | | 362.7 | | 48.9% |
| | |
| |
| |
| |
|
| | | $ | 613.6 | | 61.0% | | $ | 362.7 | | 48.9% |
| | |
| |
| |
| |
|
| Total Capitalization | | $ | 1,005.8 | | 100.0% | | $ | 742.7 | | 100.0% |
| | |
| |
| |
| |
|
During the year, Magna converted the Series 1, 2 and 3 Convertible Series Preferred Shares into Decoma Class A Subordinate Voting Shares at a fixed conversion price of Cdn. $10.07 per Class A Subordinate Voting Share. Decoma issued 14,895,729 Class A Subordinate Voting Shares on conversion.
The Convertible Debentures and the remaining Series 4 and 5 Convertible Series Preferred Shares are also convertible into Class A Subordinate Voting Shares at the holders' option at fixed prices (Cdn. $13.25 per share in the case of the Debentures and Cdn. $13.20 per share in the case of the Series 4 and 5 Convertible Series Preferred Shares). The Company's Class A Subordinate Voting Shares closed at Cdn. $12.42 on February 12, 2004, and have traded between Cdn. $8.81 and Cdn. $14.95 over the 52 week period ended February 12, 2004. As a result, it is possible that all, or a portion, of the Convertible Debentures and the Series 4 and 5 Convertible Series Preferred Shares will be settled with Class A Subordinate Voting Shares if the holders' exercise their fixed price conversion options. The possible conversions of the Company's Convertible Debentures and Series 4 and 5 Convertible Series Preferred Shares into Class A Subordinate Voting Shares is reflected in the Company's reported full year diluted earnings per share.
In addition to the fixed price conversion options noted above, Magna may retract the Convertible Series Preferred Shares for cash at their face value after December 31, 2003 in the case of the Series 4 Convertible Series Preferred Shares and commencing December 31, 2004 in the case of the Series 5 Convertible Series Preferred Shares. Accordingly, the liability portion of the Series 4 and 5 Convertible Series Preferred Shares is shown as current in the Company's consolidated balance sheet.
Should the holders' of the Convertible Debentures not exercise their fixed price conversion option, they are entitled to receive cash on redemption or maturity (subject to the Company's option of retiring the Convertible Debentures with Class A Subordinate Voting Shares in which case the number of Class A Subordinate Voting Shares issuable is based on 95% of the trading price of the Company's Class A Subordinate Voting Shares for the 20 consecutive trading days ending five trading days prior to the date fixed for redemption or maturity).
The Convertible Debentures mature on March 10, 2010 but are redeemable at the Company's option between March 31, 2007 and March 31, 2008 if the weighted average trading price of the Company's Class A Subordinate Voting Shares is not less than Cdn. $16.5625 for the 20 consecutive trading days ending five trading days preceding the date on which notice of redemption is given. Subsequent to March 31, 2008, all or part of the Convertible Debentures are redeemable at the Company's option at any time.
The Company can call the Series 4 and 5 Convertible Series Preferred Shares for redemption commencing December 31, 2005.
The Company's Net Conventional Debt to Total Capitalization at December 31, 2003 was 24.0% compared to 22.6% at December 31, 2002. This measure treats the Company's hybrid Convertible Debenture and Convertible Series Preferred Share instruments like equity rather than debt given their possible conversion into Class A Subordinate Voting Shares.
Annual Report 2003 27
The Company's Net Conventional Debt plus the liability portions of the Convertible Series Preferred Shares to Total Capitalization, has improved to 39.0% at December 31, 2003 compared to 51.1% at December 31, 2002. This measure treats the liability portions of the Convertible Series Preferred Shares like debt rather than equity given their possible retraction for cash.
The Company's Net Conventional Debt plus the liability portions of the Convertible Series Preferred Shares plus the Convertible Debentures to Total Capitalization was 45.6% at December 31, 2003 compared to 51.1% at December 31, 2002. In addition to the liability portions of the Convertible Series Preferred Shares, this measure treats the Convertible Debentures like debt rather than equity given the possibility of settling them for cash on maturity or redemption rather than for Class A Subordinate Voting Shares.
Readers are asked to refer to the "Results of Operations — Years Ended December 31, 2003 and 2002 — Financing Charges" section of this MD&A for a discussion regarding the impact of a pending accounting change in 2005 that will impact the accounting for, and presentation of, the Company's Convertible Debentures.
UNUSED AND AVAILABLE FINANCING RESOURCES
At December 31, 2003 the Company had cash on hand of $93.5 million and $122.7 million of unused and available credit representing the unused and available portion of the Company's $300 million extendible, revolving credit facility that expires on May 27, 2004 at which time Decoma may request, subject to lender approval, further revolving 364 day extensions.
Debt, excluding bank indebtedness, that comes due in the next twelve months totals $146.6 million including debt due to Magna consisting of $3.5 million repaid subsequent to year end, $46.5 million due March 31, 2004 and $90.6 million due December 31, 2004.
Since the original maturity of the amounts due March 31, 2004, the Company, with Magna's consent, has been extending the repayment of this debt at 90 day intervals at market interest rates. Although the Company expects Magna to continue to extend the repayment date for this debt, there can be no assurance that Magna will do so.
The Company anticipates that working capital investments, capital expenditures and currently scheduled repayments of debt will exceed cash generated from operations in 2004. As a result, the Company is dependent on its lenders to continue to revolve its existing $300 million credit facility. Although the Company expects the credit facility will continue to revolve, there can be no assurance that it will continue to revolve under terms and conditions as favourable as those currently in place. In addition, the Company may seek additional debt or equity financing and/or pursue further extensions of the maturity dates of debt due to Magna or work with Magna to establish a new fixed long-term amortization schedule related to this debt.
In addition to the above unused and available financing resources, the Company sponsors a finance program for tooling suppliers to finance tooling under construction for the Company. Under this program, the facility provider orders tooling from suppliers and subsequently sells such tooling to the Company. The facility provider makes advances to tooling suppliers based on tool build milestones approved by the Company. On completion of the tooling the facility provider sells the tooling to the Company for an amount equal to cumulative advances. In the event of tooling supplier default, the Company will purchase in progress tooling for an amount approximating cumulative advances.
A number of Magna affiliated companies are sponsors under this facility. The maximum facility amount is $100 million and is available to individual sponsors on an uncommitted demand basis subject to individual sponsor sub limits and, therefore, the facility provider may, at any time, refuse to purchase additional tooling under this facility. The Company's sub limit is $35 million. As at December 31, 2003, $0.3 million had been advanced to tooling suppliers under the Company's portion of this facility. This amount is included in accounts payable.
OFF BALANCE SHEET FINANCING
The Company's off balance sheet financing arrangements are limited to operating lease contracts.
A number of the Company's facilities are subject to operating leases with Magna and with third parties. Operating lease expense for facilities in 2003 amounted to $24.8 million including $11.8 million under lease arrangements with affiliates of Magna. As of December 31, 2003, operating lease commitments for facilities totalled $25.6 million for 2004 including $13.1 million under lease arrangements with affiliates of Magna. For 2008, total operating lease commitments for facilities totalled $19.2 million including $11.9 million under lease arrangements with affiliates of Magna. In certain situations, the Company has posted letters of credit to collateralize lease obligations.
The Company also has third party operating lease commitments for equipment. These leases are generally of shorter duration. Operating lease expense for equipment in 2003 amounted to $5.8 million. As of December 31, 2003, operating lease commitments for equipment totalled $8.2 million for 2004. For 2008, operating lease commitments for equipment totalled $3.3 million.
Although the Company's consolidated contractual annual lease commitments decline year by year, existing leases will either be renewed or replaced resulting in lease commitments being sustained at current levels or the Company will incur capital expenditures to acquire equivalent capacity.
28 Decoma International Inc.
FORWARD FOREIGN CURRENCY CONTRACTS
The Company operates in North America and Europe, which gives rise to a risk that its earnings, cash flows and shareholders' equity may be adversely impacted by fluctuations in foreign exchange rates amongst the four principal currencies in which the Company currently conducts business; namely, the U.S. and Canadian dollars, the British Pound and the Euro.
Operating as a global company, Decoma transacts business through operating divisions whose functional currency is generally the currency of the division's country of residence, except for the Company's operations in Mexico where the functional currency is the U.S. dollar. To protect against the reduction in value of foreign currency cash flows resulting from foreign currency customer and supplier contracts, the Company has instituted a foreign currency cash flow hedging program. The Company hedges portions of its cash flows denominated in currencies other than the applicable division's functional currency with forward contracts.
The Company formally documents all relationships between hedging instruments and hedged items, as well as its risk management objective and strategy for undertaking various hedge transactions. This process includes linking all derivatives to specific assets and liabilities on the balance sheet or to specific firm commitments or forecasted transactions. The Company also formally assesses, both at the hedge's inception and on an ongoing basis, whether the derivatives that are used in hedging transactions are highly effective in offsetting changes in fair values or cash flows of hedged items.
Any gains and losses on these hedging instruments, including the forward premium or discount on a forward foreign currency contract relating to the period prior to consummation of the foreign currency cash flow, are recognized in the same period as, and as part of, the hedged transaction. The Company does not enter into forward foreign currency contracts for speculative purposes.
At December 31, 2003, the Company's outstanding forward foreign currency contracts included contracts to sell Canadian dollars in return for U.S. dollars totalling Cdn. $37.0 million and Cdn. $10.3 million in 2004 and 2005, respectively, at weighted average rates of 0.7334 U.S. dollars per Canadian dollar.
Similarly, at December 31, 2003, the Company's United Kingdom operations had outstanding forward foreign currency contracts to sell British pounds in return for Euros totalling GBP 5.8 million and GBP 2.6 million in 2004 and 2005, respectively, at weighted average rates of 1.4950 Euros per British Pound.
These contracts are designated and effective as hedges of the Canadian operations' net U.S. dollar purchase requirements and the United Kingdom operations' net Euro purchase requirements, respectively, primarily for raw materials.
In addition, the Company's outstanding forward foreign currency contracts included contracts to sell Euros in return for U.S. dollars totalling $11.4 million in 2004 at weighted average rates of 1.1725 U.S. dollars per Euro which are designated and effective as hedges of the European operations' U.S. dollar affiliation fee payment requirements.
RETURN ON INVESTMENT
Decoma defines after tax return on common equity as net income attributable to Class A Subordinate Voting and Class B Shares over shareholders' equity excluding Convertible Debentures and the equity portion of Convertible Series Preferred Shares. After tax return on common equity was 15% and 29% for the years ended December 31, 2003 and 2002, respectively. The decline reflects the United Kingdom impairment and continental Europe paint capacity consolidation charges, the conversion of the Series 1, 2 and 3 Convertible Series Preferred Shares into Class A Subordinate Voting Shares and translation, particularly of European net assets into the Company's U.S. dollar reporting currency.
Each operating segment's return on investment is measured using return on funds employed. Return on funds employed is defined as operating income plus equity income divided by long-term assets, excluding future tax assets, plus non-cash working capital. Return on funds employed represents a return on investment measure before the impacts of capital structure. The Company views capital structure as a corporate, rather than operating segment, decision.
| | Return on
Funds Employed
| |
| |
| |
|---|
| | Funds Employed
| |
|---|
| | Years Ended December 31,
| |
|---|
| | As at December 31,
| |
|---|
[U.S. dollars in millions]
| | 2003
| | 2002
| | 2003
| | 2002
| |
|---|
| North America | | 34% | | 35% | | $ | 720.1 | | $ | 569.3 | |
| Europe | | | | | | | | | | | |
| | Excluding Merplas | | (14% | ) | 1% | | | 283.1 | | | 193.6 | |
| | Merplas | | (42% | ) | (66% | ) | | 28.7 | | | 26.9 | |
| Corporate | | n/a | | n/a | | | 21.0 | | | (0.1 | ) |
| | |
| |
| |
| |
| |
| Global | | 17% | | 22% | | $ | 1,052.9 | | $ | 789.7 | |
| | |
| |
| |
| |
| |
Annual Report 2003 29
Return on funds employed was 17% in 2003. Return on funds employed for 2003 compared to 2002 was negatively impacted by the United Kingdom impairment and continental Europe paint capacity consolidation charges; increased non-cash working capital investments; and increased investments in Europe, particularly with the new Belplas paint line, and in North America at Decostar. Translation, particularly of European funds employed into the Company's U.S. dollar reporting currency, also negatively impacted return on funds employed. These negative impacts were partially offset by the 2002 write-down of Merplas deferred preproduction expenditures.
OTHER SELECTED FINANCIAL INFORMATION
The Company is required to disclose its contractual obligations as of December 31, 2003 as follows:
| | As at December 31, 2003
|
|---|
[U.S. dollars in millions]
| | Less than 1 year
| | 2-3 years
| | 4-5 years
| | More than 5 years
|
|---|
| Long-term debt and capital lease obligations | | $ | 146.6 | | $ | 7.3 | | $ | 3.3 | | $ | 0.6 |
| Liability portion of Convertible Series Preferred Shares | | | 150.6 | | | — | | | — | | | — |
| Operating lease commitments | | | 33.8 | | | 62.1 | | | 47.4 | | | 100.3 |
| Purchase obligations(i) | | | — | | | — | | | — | | | — |
| | |
| |
| |
| |
|
| Total contractual obligations and commitments | | $ | 331.0 | | $ | 69.4 | | $ | 50.7 | | $ | 100.9 |
| | |
| |
| |
| |
|
- [i]
- The Company had no unconditional purchase obligations other than those related to inventory, services, tooling and fixed assets in the ordinary course of business.
In addition to the above, the Company's obligations with respect to employee future benefit plans, which have been actuarially determined, were $7.5 million at December 31, 2003 broken down as follows:
[U.S. dollars in millions]
| | Canada & U.S. Pension
| | German Pension
| | Canada & U.S. Post Retirement Medical
| | Total
| |
|---|
| Projected benefit obligation | | $ | 6.8 | | $ | 3.3 | | $ | 9.0 | | $ | 19.1 | |
| Less plan assets | | | (5.2 | ) | | — | | | — | | | (5.2 | ) |
| | |
| |
| |
| |
| |
| Unfunded amount | | | 1.6 | | | 3.3 | | | 9.0 | | | 13.9 | |
| Unrecognized past service costs and actuarial losses | | | (1.3 | ) | | — | | | (5.1 | ) | | (6.4 | ) |
| | |
| |
| |
| |
| |
| Amount recognized in other long-term liabilities | | $ | 0.3 | | $ | 3.3 | | $ | 3.9 | | $ | 7.5 | |
| | |
| |
| |
| |
| |
The Company is also required to disclose the following selected annual information for the most recent three fiscal years:
| | Years Ended December 31,
|
|---|
[U.S. dollars, in millions except per share figures]
| | 2003
| | 2002
| | 2001
|
|---|
| Total sales | | $ | 2,355.8 | | $ | 2,056.7 | | $ | 1,815.9 |
| Net income | | | 71.9 | | | 93.0 | | | 68.7 |
| Earnings per Class A Subordinate Voting or Class B Share | | | | | | | | | |
| | Basic | | | 0.88 | | | 1.30 | | | 1.00 |
| | Diluted | | | 0.77 | | | 1.03 | | | 0.81 |
| Cash dividends declared per Class A Subordinate Voting and Class B Share in respect of each period | | | 0.27 | | | 0.22 | | | 0.20 |
| Total assets | | | 1,525.5 | | | 1,192.5 | | | 1,169.2 |
| Total long-term liabilities, excluding future taxes | | | 18.7 | | | 205.7 | | | 310.7 |
| | |
| |
| |
|
Changes in total sales, net income and earnings and cash dividends per Class A Subordinate Voting or Class B Share between 2003 and 2002 are explained in this MD&A. The growth in total assets is a result of translation of Canadian dollar, Euro and British Pound operations into the Company's U.S. dollar reporting currency, capital spending and investments in non-cash working capital. Long-term liabilities at December 31, 2002 includes debt due to Magna of $75.1 million and the liability portions of the Series 4 and 5 Convertible Series Preferred Shares of $116.1 million. These amounts are current at December 31, 2003.
30 Decoma International Inc.
The growth in 2002 sales and earnings compared to 2001 is the result of strong performance by the Company's North American segment. The ramp up of programs that launched in 2001, the Autosystems lighting acquisition, takeover programs that launched at the beginning of 2002, favourable production volume program mix and a year with relatively few major new program launches and associated launch costs all contributed to strong sales and earnings in North America. In the Company's Europe segment, production sales increased as a result of the ramp up of the BMW Mini and Jaguar X400 programs and as a result of translation of Euro and British Pound sales into the Company's U.S. dollar reporting currency. However, combined production sales in Germany and Belgium, measured in Euros, declined as a result of lower vehicle production volumes including lower volumes on certain high content programs. This sales decline, in conjunction with costs to support significant future European sales growth, contributed to a decline in European, excluding Merplas, operating income. Merplas, on the other hand, reduced its operating losses before the write-off of deferred preproduction expenditures.
The Company is also required to disclose the following selected quarterly information for the most recent eight quarters:
| | Three Month Periods Ended
|
|---|
[U.S. dollars, in millions except per share figures]
| | December 31, 2003
| | September 30, 2003
| | June 30, 2003
| | March 31, 2003
|
|---|
| Total sales | | $ | 646.2 | | $ | 556.4 | | $ | 592.1 | | $ | 561.1 |
| Net income | | | (3.8 | ) | | 14.7 | | | 33.8 | | | 27.2 |
| Earnings per Class A Subordinate Voting or Class B Share | | | | | | | | | | | | |
| | Basic | | | (0.06 | ) | | 0.17 | | | 0.46 | | | 0.38 |
| | Diluted | | | (0.06 | ) | | 0.16 | | | 0.34 | | | 0.30 |
| | |
| |
| |
| |
|
|
|
Three Month Periods Ended
|
|---|
[U.S. dollars, in millions except per share figures]
| | December 31, 2002
| | September 30, 2002
| | June 30, 2002
| | March 31, 2002
|
|---|
| Total sales | | $ | 528.2 | | $ | 465.5 | | $ | 565.8 | | $ | 497.1 |
| Net income | | | 23.1 | | | 18.6 | | | 27.4 | | | 23.9 |
| Earnings per Class A Subordinate Voting or Class B Share | | | | | | | | | | | | |
| | Basic | | | 0.32 | | | 0.26 | | | 0.39 | | | 0.34 |
| | Diluted | | | 0.25 | | | 0.21 | | | 0.30 | | | 0.27 |
| | |
| |
| |
| |
|
Sales in 2003 compared to 2002 benefited from translation of Canadian, Euro and British Pound sales into the Company's U.S. dollar reporting currency, sales at new European start up facilities and the FM Lighting acquisition commencing in the second quarter of 2002. Net income and earnings per Class A Subordinate Voting or Class B Share in the fourth quarter of 2003 was negatively impacted by the United Kingdom impairment and continental Europe paint capacity consolidation charges. Earnings in the second half of 2003 compared to 2002 were impacted by North American program changeovers, lower vehicle production volumes on certain high content programs, Decostar costs, customer pricing pressures, foreign exchange losses on U.S. dollar denominated monetary items held in Canada and increased losses in Europe particularly in the third quarter of 2003. The third quarter is affected by the normal seasonal effects of lower vehicle production volumes as a result of OEM summer shutdowns.
CRITICAL ACCOUNTING POLICIES
General
The Company's discussion and analysis of its results of operations and financial position is based upon the consolidated financial statements, which have been prepared in accordance with Canadian GAAP. Note 26 to the Company's consolidated financial statements sets out the material differences between Canadian and United States GAAP. The preparation of the consolidated financial statements requires management to make estimates and judgments that affect the reported amounts of assets, liabilities, revenues and expenses, and the related disclosure of contingent assets and liabilities. The Company bases its estimates on historical experience and various other assumptions that are believed to be reasonable in the circumstances, the results of which form the basis for making judgments about the carrying value of assets and liabilities. On an on-going basis, the Company evaluates its estimates. However, actual results may differ from these estimates under different assumptions or conditions.
The Company believes the following critical accounting policies affect its more significant judgments and estimates used in the preparation of its consolidated financial statements. Management has discussed the development and selection of the following critical accounting policies with the audit committee of the board of directors and the audit committee has reviewed the Company's disclosure relating to critical accounting policies in this MD&A.
Annual Report 2003 31
Revenue Recognition
SEPARATELY PRICED TOOLING CONTRACTS
With respect to its contracts with OEMs for particular vehicle programs, the Company performs multiple revenue-generating activities. The most common arrangement is where, in addition to contracting for the production and sale of parts, the Company also has a separately priced contract with the OEM for related tooling costs. Under these arrangements, the Company either constructs the tools at its in-house tool shop or contracts with third party tooling vendors to construct and supply tooling to be used by the Company in the production of parts for the OEM. On completion of the tooling build, and upon acceptance of the tooling by the OEM, the Company sells the separately priced tooling to the OEM pursuant to a separate tooling purchase order.
Revenues and cost of sales from separately priced tooling contracts are presented on a gross basis in the consolidated statements of income when the Company is acting as principal and is subject to significant risks and rewards in connection with the process of bringing the tool to its final state and in the post-sale dealings with its customers. Otherwise, components of revenue and related costs are presented on a net basis. To date, revenues and cost of sales on separately priced tooling contracts have been reported on a gross basis.
Revenues from separately priced tooling contracts are recognized substantially on a completed contract basis. The completed contract method recognizes revenue and cost of sales only when the contract is completed and the tool is accepted by the customer. All costs, net of customer advances, are reported in tooling inventory in the Company's consolidated balance sheet until that time.
Tooling contract prices are generally fixed, however, price changes, change orders and program cancellations may affect the ultimate amount of revenue recorded with respect to a contract. Contract costs are estimated at the time of signing the contract and are reviewed at each reporting date. Adjustments to the original estimates of total contract costs are often required as work progresses under the contract and as experience is gained, even though the scope of the work under the contract may not change. When the current estimates of total contract revenue and total contract costs indicate a loss, a provision for the entire loss on the contract is made. Factors that are considered in arriving at the forecasted loss on a contract include, amongst others, cost over-runs, non-reimbursable costs, change orders and potential price changes.
For United States GAAP purposes, the Company reports a United States GAAP difference with respect to separately priced tooling contracts manufactured at the Company's in-house tooling division when such tools will be used by the Company to service a subsequent parts production program. Given the potential for profit on tooling manufactured in-house and based on the detailed requirements of the United States Securities and Exchange Commission's Staff Accounting Bulletin No. 101, the Company concluded that revenues and cost of sales on such tooling should be deferred and amortized on a gross basis over the subsequent parts production program for United States GAAP purposes.
The Emerging Issues Task Force recently issue Abstract 00-21, "Accounting for Revenue Arrangements With Multiple Deliverables" (EITF 00-21"). In addition, the CICA recently issued Emerging Issues Committee Abstract No. 142, "Revenue Arrangements with Multiple Deliverables" (EIC-142'). These Abstracts provide guidance on an accounting by a vendor for arrangements involving multiple deliverables. They specifically address how a vendor determines whether an arrangement involving multiple deliverables contains more than one unit of accounting and they also address how consideration should be measured and allocated to the separate units of accounting in the arrangement. These Abstracts are effective for revenue arrangements entered into by the Company on or after January 1, 2004. The impact of these pronouncements on the Company's consolidated financial statements has not been determined.
FRONT END MODULE CONTRACTS
Modularization, where the Company is required to coordinate the design, manufacture, integration and assembly of a large number of individual parts and components into a modular system for delivery to the customer's vehicle assembly plant, is a growing trend in the Automotive industry. The principle modular system in the Company's product area is a front end module ("FEM") which combines fascias and bumper systems with a number of related components such as grilles, lighting, electrical and cooling systems. The Company has received a number of recent FEM contracts in Europe. Under these contracts, the Company manufactures a portion of the products included in the FEM but also purchases components from various sub-suppliers and assembles such components into the completed module. The Company recognizes FEM revenues and cost of sales on a gross basis when the Company has a combination of: primary responsibility for providing the FEM to the customer; responsibility for styling and/or product design specifications; latitude in establishing sub-supplier pricing; responsibility for validation of sub-supplier part quality; inventory risk on sub-supplier parts; exposure to warranty; exposure to credit risk on the sale of the FEM to the customer; and other factors. Otherwise, the Company recognizes revenue on a net basis.
To date, revenues and cost of sales on the Company's FEM contracts have been reported on a gross basis except in those rare circumstances where the fascia component of the FEM is not manufactured by Decoma.
Amortized Engineering and Customer Owned Tooling Arrangements
The Company incurs pre-production engineering research and development ("ER&D") costs related to the products it produces for its customers under long-term supply agreements. The Company expenses ER&D costs, which are paid for as part of subsequent related parts production piece price amounts, as incurred unless a contractual guarantee for reimbursement exists.
Unlike revenues and expenses related to separately priced tooling contracts, the Company expenses all costs as incurred related to the design and development of moulds, dies and other tools that the Company will not own and that will be used in, and reimbursed as part of the piece-price amount for, subsequent related parts production. Such costs are capitalized only when the supply agreement provides the Company with a contractual guarantee for reimbursement of costs or the non-cancelable right to use the moulds, dies and other tools during the supply agreement.
32 Decoma International Inc.
ER&D and customer owned tooling costs capitalized in "Other assets" are amortized on a units of production basis over the related parts production long-term supply agreement. As at December 31, 2003, total ER&D and customer owned tooling costs capitalized in other assets amounted to $9.4 million and $5.1 million, respectively.
Asset Impairments
GOODWILL
Effective January 1, 2002, goodwill is subject to an annual impairment test or more frequently when an event or circumstance occurs that more likely than not reduces the fair value of a reporting unit below its carrying value.
FIXED ASSETS
The Company evaluates fixed assets for impairment whenever indicators of impairment exist. Indicators of impairment include prolonged operating losses or a decision to dispose of, or otherwise change the use of, an existing fixed asset. If the sum of the future undiscounted cash flows expected to result from the asset is less than the reported value of the asset, an asset impairment must be recognized in the financial statements for the difference. The amount of impairment to recognize is calculated by subtracting the fair value of the asset from the reported value of the asset.
The Company believes that accounting estimates related to both goodwill and fixed asset impairment assessments are "critical accounting estimates" because: (i) they are subject to significant measurement uncertainty and are susceptible to change as management is required to make forward looking assumptions regarding the impact of improvement plans on current operations, insourcing and other new business opportunities, program price and cost assumptions on current and future business, the timing of new program launches and future forecasted production volumes; and (ii) any resulting impairment loss could have a material impact on the Company's consolidated net income and on the amount of fixed assets reported on the Company's consolidated balance sheet.
Asset Retirement Obligations
For United States GAAP purposes, Statement of Financial Accounting Standard No. 133, "Accounting for Asset Retirement Obligations" ("Statement 133"), was adopted by the Company on January 1, 2003. This standard requires the Company to estimate and accrue for the present value of its obligations to restore leased premises at the end of the lease. At lease inception, the present value of this obligation is recognized as other long-term liabilities with a corresponding amount recognized in fixed assets. The fixed asset amount is amortized, and the liability amount is accreted, over the period from lease inception to the time the Company expects to vacate the premises resulting in both depreciation and interest charges in the consolidated statements of income.
For Canadian GAAP purposes, similar accounting requirements become effective on January 1, 2004. The adoption of these requirements on January 1, 2004 for Canadian GAAP is expected to result in the cumulative effect of an accounting change of $1.0 million being recognized as a charge to opening retained earnings, the recognition of a long-term liability of $3.2 million, the recognition of a fixed asset of $1.8 million, the recognition of a future tax asset of $0.3 million and currency translation adjustment debits of $0.1 million.
Future Income Tax Assets
At December 31, 2003, the Company had recorded future tax assets (net of related valuation allowances) in respect of loss carryforwards and share issue costs of $10.6 million. Of this amount, $1.2 million is matched by reversing future tax liabilities. The remaining future tax assets of $9.4 million relate primarily to the Company's German operations and its Canadian holding company.
The Company evaluates quarterly the realizability of its future tax assets by assessing its valuation allowance and by adjusting the amount of such allowance, if necessary. The factors used to assess the likelihood of realization are the Company's forecast of future taxable income and available tax planning strategies that could be implemented to realize the future tax assets. The Company has and continues to use tax planning strategies to realize future tax assets in order to avoid the potential loss of benefits.
At December 31, 2003, the Company had gross income tax loss carryforwards of approximately $143 million, which relate to operations in the United Kingdom, Germany, Belgium and Poland, the tax benefits of which have not been recognized in the consolidated financial statements. Substantially all of these tax loss carryforwards have no expiry date. If operations improve to profitable levels in these jurisdictions, and such improvements are sustained for a prolonged period of time, the Company's earnings will benefit from these loss carryforward pools.
Employee Defined Benefit Plans
The determination of the obligation and expense for defined benefit pension and other post-retirement benefits, such as retiree healthcare and medical benefits, is dependent on the selection of certain assumptions used by actuaries in calculating such amounts. Those assumptions are included in note 12 to the Company's consolidated financial statements and include, among others, the discount rate, expected long-term rate of return on plan assets and rates of increase in compensation costs. Actual results that differ from the assumptions used are accumulated and, if outside of a 10% corridor, are amortized over future periods and, therefore, impact the recognized expense and recorded obligation in future periods.
While the Company's current obligation and annual expense under existing employee benefit plans are not significant, significant differences in actual experience, significant changes in assumptions or significant new plan enhancements could materially affect the Company's future employee benefit obligations and future expense.
Annual Report 2003 33
FORWARD LOOKING STATEMENTS
The contents of this MD&A contain statements which, to the extent that they are not recitations of historical fact, constitute "forward looking statements" within the meaning of the Private Securities Litigation Reform Act of 1995. The words "estimate", "anticipate", "believe", "expect" and similar expressions are intended to identify forward looking statements. Persons reading this MD&A are cautioned that such statements are only predictions and that the Company's actual future results or performance may be materially different. In evaluating such forward looking statements readers should specifically consider the various risk factors which could cause actual events or results to differ materially from those indicated by such forward looking statements. These risks and uncertainties include, but are not limited to, specific risks relating to the Company's relationship with its customers, the automotive industry in general and the economy as a whole. Such risks include, without limitation; the Company's reliance on its major OEM customers; increased pricing concession and cost absorption pressures from the Company's customers; the impact of production volumes and product mix on the Company's financial performance, including changes in the actual customer production volumes compared to original planning volumes; program delays and/or cancellations; the extent, nature and duration of purchasing or leasing incentive programs offered by automotive manufacturers and the impact of such programs on future consumer demand; warranty, recall and product liability costs and risks; the continuation and extent of automotive outsourcing by automotive manufacturers; changes in vehicle pricing and the resulting impact on consumer demand; the Company's operating and/or financial performance, including the affect of new accounting standards that are promulgated from time to time (such as the ongoing requirement for impairment testing of long-lived assets) on the Company's financial results; the Company's ability to finance its business requirements and access capital markets; the Company's continued compliance with credit facility covenant requirements; trade and labour issues or disruptions impacting the Company's operations and those of its customers; the Company's ability to identify, complete and integrate acquisitions and to realize projected synergies relating thereto; the impact of environmental related matters including emission regulations; risks associated with the launch of new facilities, including cost overruns and construction delays; technological developments by the Company's competitors; fluctuations in fuel prices and availability; electricity and natural gas cost volatility; government and regulatory policies and the Company's ability to anticipate or respond to changes therein; the Company's relationship with Magna; currency exposure risk; fluctuations in interest rates; changes in consumer and business confidence levels; consumer personal debt levels; disruptions to the economy relating to acts of terrorism or war; and other changes in the competitive environment in which the Company operates. In addition, and without limiting the above, readers are cautioned that the specific forward looking statements contained herein relating to the Company's ability to successfully implement European improvement plans; the possible conversion of the Company's Convertible Debentures and Convertible Series Preferred Shares to Class A Subordinate Voting Shares; the Company's ability to raise necessary future financing; capital spending estimates; and the recoverability of the Company's remaining goodwill and other long lived assets, are all subject to significant risk and uncertainty. Readers are also referred to the discussion of "Other Factors" set out in the Company's Annual Information Form dated May 20th, 2003, wherein certain of the above risk factors are discussed in further detail. The Company expressly disclaims any intention and undertakes no obligation to update or revise any forward looking statements contained in this MD&A to reflect subsequent information, events or circumstances or otherwise.
34 Decoma International Inc.
MANAGEMENT'S RESPONSIBILITY FOR FINANCIAL REPORTING AND
AUDITORS' REPORT
MANAGEMENT'S RESPONSIBILITY FOR FINANCIAL REPORTING
Decoma's management is responsible for the preparation and presentation of the consolidated financial statements and all other information in this Annual Report. The consolidated financial statements were prepared by management in accordance with Canadian generally accepted accounting principles. Where alternative accounting methods exist, management has selected those that it considered to be the most appropriate in the circumstances. The preparation of the consolidated financial statements in conformity with Canadian generally accepted accounting principles requires management to make estimates and assumptions that affect the amounts reported therein. Management has determined such amounts on a reasonable and prudent basis to present fairly, in all material respects, the consolidated financial statements; however, actual results may differ from these estimates. Financial information presented elsewhere in this Annual Report has been prepared by management on a basis consistent with the consolidated financial statements. The consolidated financial statements have been reviewed by the Audit Committee and approved by the Board of Directors of Decoma.
Management is responsible for the development and maintenance of systems of internal accounting and administrative controls of high quality consistent with reasonable cost. Such systems are designed to provide reasonable assurance that the financial information is accurate, relevant and reliable, and that Decoma's assets are appropriately accounted for and adequately safeguarded.
Decoma's Audit Committee is appointed by the Board of Directors and is comprised of outside directors. The Audit Committee meets periodically with management, as well as with the internal auditors and the independent auditors, to satisfy itself that each is properly discharging its responsibilities, to review the consolidated financial statements and the independent Auditors' Report and to discuss significant financial reporting issues and auditing matters. The Audit Committee reports its findings to the Board of Directors for consideration when approving the consolidated financial statements for issuance to the shareholders. The Audit Committee also considers, for review by the Board of Directors and approval by the shareholders, the engagement or reappointment of the independent auditors.
The consolidated financial statements have been audited by Ernst & Young LLP, the independent auditors, in accordance with Canadian and United States generally accepted auditing standards on behalf of the shareholders of Decoma. The Auditors' Report outlines the nature of their examination and their opinion on Decoma's consolidated financial statements. The independent auditors have full and unrestricted access to the Audit Committee.
| /s/ S. RANDALL SMALLBONE | | /s/ GUY R. JONES |
| S. RANDALL SMALLBONE | | GUY R. JONES |
| Executive Vice-President, Finance and Chief Financial Officer | | Vice-President, Finance |
AUDITORS' REPORT
To the Shareholders of Decoma International Inc.
We have audited the consolidated balance sheets ofDecoma International Inc. as at December 31, 2003 and 2002 and the consolidated statements of income and retained earnings and cash flows for each of the years in the three year period ended December 31, 2003. These financial statements are the responsibility of the Company's management. Our responsibility is to express an opinion on these financial statements based on our audits.
We conducted our audits in accordance with Canadian generally accepted auditing standards and United States generally accepted auditing standards. Those standards require that we plan and perform an audit to obtain reasonable assurance whether the financial statements are free of material misstatement. An audit includes examining, on a test basis, evidence supporting the amounts and disclosures in the financial statements. An audit also includes assessing the accounting principles used and significant estimates made by management, as well as evaluating the overall financial statement presentation.
In our opinion, these consolidated financial statements present fairly, in all material respects, the financial position of the Company as at December 31, 2003 and 2002 and the results of its operations and its cash flows for each of the years in the three year period ended December 31, 2003 in accordance with Canadian generally accepted accounting principles.
As described in note 4 to these consolidated financial statements, the Company changed its accounting policies for stock-based compensation and goodwill.
| | | /s/ ERNST & YOUNG LLP |
| TORONTO, CANADA | | ERNST & YOUNG LLP |
| February 12, 2004 | | Chartered Accountants |
Annual Report 2003 35
SIGNIFICANT ACCOUNTING POLICIES
December 31, 2003
BASIS OF PRESENTATION
Decoma International Inc. ["Decoma"] is a full service supplier of exterior vehicle appearance systems for the world's automotive industry. Decoma designs, engineers and manufactures automotive exterior components and systems which include fascias [bumpers], front and rear end modules, plastic body panels, roof modules, exterior trim components, sealing and greenhouse systems and lighting components for cars and light trucks [including sport utility vehicles and mini vans].
The consolidated financial statements of Decoma have been prepared following Canadian generally accepted accounting principles ["Canadian GAAP"]. These principles are also in conformity, in all material respects, with United States generally accepted accounting principles ["United States GAAP"], except as described in note 26 to the consolidated financial statements.
The consolidated financial statements include the accounts of Decoma and its subsidiaries [collectively, the "Company"]. All significant intercompany balances and transactions have been eliminated.
FOREIGN CURRENCY TRANSLATION
The assets and liabilities of the Company's operations having a functional currency other than the U.S. dollar are translated into the Company's U.S. dollar reporting currency using the exchange rate in effect at the year end and revenues and expenses are translated at the average rate during the year. Exchange gains or losses on translation of the Company's net equity investment in these operations are deferred as a separate component of shareholders' equity.
The appropriate amounts of exchange gains or losses accumulated in the separate component of shareholders' equity are reflected in income when there is a reduction, as a result of capital transactions, in the Company's net investment in the operations that gave rise to such exchange gains and losses.
Foreign exchange gains and losses on transactions occurring in a currency different than an operation's functional currency are reflected in income except for gains and losses on foreign exchange contracts used to hedge specific future commitments in foreign currencies. Gains or losses on these contracts are accounted for as a component of the related hedged transaction.
CYCLICALITY OF OPERATIONS
Substantially all revenue is derived from sales to the North American and European facilities of the major automobile manufacturers. The Company's operations are exposed to the cyclicality inherent in the automotive industry and to changes in the economic and competitive environments in which the Company operates. The Company is dependent on continued relationships with the major automobile manufacturers.
USE OF ESTIMATES
The preparation of the consolidated financial statements in conformity with generally accepted accounting principles requires management to make estimates and assumptions that affect: the reported amounts of assets and liabilities; the disclosure of contingent assets and liabilities at the date of the consolidated financial statements; and the reported amounts of revenue and expenses during the reporting period. Management believes that the estimates utilized in preparing its consolidated financial statements are reasonable and prudent; however, actual results could differ from these estimates.
CASH AND CASH EQUIVALENTS
Cash and cash equivalents includes cash on account, demand deposits and short-term investments with remaining maturities of less than three months at acquisition.
INVENTORIES
Production inventories and tooling inventories manufactured in-house are valued at the lower of cost and net realizable value, with cost being determined substantially on a first-in, first-out basis. Cost includes the cost of materials plus direct labour applied to the product and the applicable share of manufacturing overhead.
Outsourced tooling inventories are valued at the lower of subcontracted costs and net realizable value.
INVESTMENTS
The Company accounts for investments in which it has significant influence on the equity basis.
36 Decoma International Inc.
FIXED ASSETS
Fixed assets are recorded at historical cost which includes acquisition and development costs. Development costs include direct construction costs, interest capitalized on construction in progress and land under development and indirect costs wholly attributable to development.
Depreciation is provided on a straight-line basis over the estimated useful lives of fixed assets at annual rates of 21/2% to 5% for buildings, 7% to 10% for general purpose equipment and 10% to 33% for special purpose equipment.
Historically, certain costs incurred in establishing new facilities which required substantial time to reach commercial production capability were capitalized as deferred preproduction costs. Amortization of these costs is provided over periods of up to five years from the date commercial production is achieved. As of December 31, 2003, capitalized deferred preproduction costs are minimal [see note 8].
IMPAIRMENT OF LONG-LIVED ASSETS
The Company assesses long-lived assets for recoverability whenever indicators of impairment exist. If the carrying value of the asset exceeds the estimated undiscounted cash flows from the use of the asset, an impairment loss is recognized. Impairment losses are measured as the amount by which the asset's carrying value exceeds its fair value. Fair valued is based on discounted cash flows.
GOODWILL
Prior to January 1, 2002, goodwill was amortized over a period of 20 years.
Effective January 1, 2002, goodwill is no longer amortized and is subject to an annual impairment test. Goodwill impairment is assessed based on a comparison of the fair value of an individual reporting unit to the underlying carrying value of the reporting unit's net assets including goodwill. When the carrying amount of the reporting unit exceeds its fair value, the fair value of the reporting unit's goodwill is compared with its carrying amount to measure the amount of the impairment loss, if any. The fair value of goodwill is determined in the same manner as in a business combination.
REVENUE RECOGNITION
Revenue from the sale of manufactured products is recognized upon shipment to [or receipt by customers depending on contractual terms], and acceptance by, customers when the price is fixed or determinable and collectibility is reasonably assured.
Revenues from separately priced tooling contracts are recognized substantially on a completed contract basis.
Revenues and cost of sales, including amounts from separately priced tooling contracts, are presented on a gross basis in the consolidated statements of income when the Company is acting as principal and is subject to significant risks and rewards in connection with the process of bringing the product to its final state and in the post-sale dealings with its customers. Otherwise, components of revenue and related costs are presented on a net basis.
PREPRODUCTION COSTS RELATED TO LONG-TERM SUPPLY AGREEMENTS
Costs incurred [net of customer subsidies] related to design and engineering, which are paid for as part of subsequent related parts production piece price amounts, are expensed as incurred unless a contractual guarantee for reimbursement exists.
Costs incurred [net of customer subsidies] related to the design and development of moulds, dies and other tools that the Company does not own [and that will be used in, and paid for as part of the piece price amount for, subsequent related parts production] are expensed as incurred unless the supply agreement provides a contractual guarantee for reimbursement or the non-cancelable right to use the moulds, dies and other tools during the supply agreement.
Costs deferred in the above circumstances are amortized on a units of production basis to cost of goods sold over the anticipated term of the supply agreement.
RESEARCH AND DEVELOPMENT
Research costs are expensed as incurred and development costs which meet certain criteria where future benefit is reasonably certain are deferred to the extent of their estimated recovery.
EMPLOYEE FUTURE BENEFIT PLANS
The cost of providing benefits through defined benefit pensions and post-retirement benefits other than pensions is actuarially determined and recognized in earnings using the projected benefit method prorated on service and management's best estimate of expected plan investment performance, compensation increases, retirement ages of employees, future termination levels and long-term interest rates. Plan assets are measured at fair value. Prior service costs related to plan amendments are amortized on a straight line basis over the expected average remaining service life of employees. Changes in assumptions and experience gains and losses outside a 10% corridor are recognized in income over the expected average remaining service life of employees.
Annual Report 2003 37
The cost of providing benefits through defined contribution pension plans is charged to earnings in the period in respect of which contributions become payable.
STOCK-BASED COMPENSATION
Prior to 2003, no compensation expense was recognized for stock options granted under the Company's fixed price Incentive Stock Option Plan [the "Option Plan"].
Commencing in 2003, the fair value of stock options granted, modified or settled on or after January 1, 2003 is recognized on a straight-line basis over the applicable stock option vesting period as compensation expense in selling, general and administrative expenses in the consolidated statements of income and contributed surplus in the consolidated balance sheets. On the exercise of stock options, consideration received and the accumulated contributed surplus amount is credited to capital stock.
For stock options granted prior to January 1, 2003 which are not accounted for at fair value, pro forma earnings disclosure showing the impact of fair value accounting is included in note 15.
The fair value of stock options is estimated at the grant date using the Black-Scholes option pricing model. This model requires the input of a number of assumptions including dividend yields, expected stock price volatility, expected time until exercise and risk-free interest rates. Although the assumptions used reflect management's best estimates, they involve inherent uncertainties based on market conditions generally outside of the control of the Company.
GOVERNMENT ASSISTANCE
The Company makes periodic applications for financial assistance under available government assistance programs in the various jurisdictions in which the Company operates. Grants relating to capital expenditures are reflected as a reduction of the cost of the related assets. Grants and tax credits relating to current operating expenditures are recorded as a reduction of expense at the time the grant or tax credit is earned and receipt thereof is reasonably assured. The Company may also receive loans which are recorded as liabilities in amounts equal to the cash received.
INCOME TAXES
The Company follows the liability method of tax allocation for accounting for income taxes. Under the liability method of tax allocation, future tax assets and liabilities are determined based on differences between the financial reporting and tax bases of assets and liabilities and are measured using the substantively enacted tax rates and laws that will be in effect when the differences are expected to reverse.
Income taxes related to unremitted earnings of foreign subsidiaries are not provided for by the Company as such earnings are considered to be reinvested for the foreseeable future.
CONVERTIBLE SERIES PREFERRED SHARES HELD BY MAGNA
Three key attributes of the Company's Convertible Series Preferred Shares held by Magna International Inc. ["Magna"] have been valued as of their date of issuance and are presented separately in the Company's consolidated financial statements. These attributes are:
- •
- the holder's right to retract the Convertible Series Preferred Shares at their face amount after certain specified dates;
- •
- the holder's right to receive non-cumulative cash dividends; and
- •
- the holder's ability to convert the Convertible Series Preferred Shares into Class A Subordinate Voting Shares of the Company at a fixed price.
The retraction attribute is a liability of the Company and is presented as debt at the present value of the face amount which becomes payable, at the option of the holder, after certain specified dates. The resulting discount is amortized to income systematically from the date of issuance until the date each series of the Convertible Series Preferred Shares becomes retractable.
The non-cumulative dividend is not considered debt-related as the Company is not contractually obligated to make dividend payments. However, a value has been assigned to the possible stream of future dividends and this amount is presented as equity. As dividends are declared, the amount of the dividend is included in financing charges on Convertible Series Preferred Shares in the consolidated statements of income. In addition, as dividends are declared, a systematically calculated portion of this equity component is reversed and included in financing charges on Convertible Series Preferred Shares in the consolidated statements of income.
The conversion feature is similar to a stock warrant as it provides the holder with the option to exchange their Convertible Series Preferred Shares for Class A Subordinate Voting Shares of the Company at a fixed price. This attribute is also classified as equity.
38 Decoma International Inc.
CONVERTIBLE DEBENTURES
The key attributes of the Company's Convertible Debentures are separately valued and accounted for as follows:
- •
- the present value of principal and interest [each of which can, at the option of the Company, be settled with the issuance of Class A Subordinate Voting Shares] has been presented as equity. The present value was determined using a discount rate of 7.75% reflecting an estimate of the coupon rate that the Convertible Debentures would have borne absent the holders' conversion feature. The resulting discount is accreted to the Convertible Debentures' face value over the period from issuance to unrestricted redemption [March 31, 2008] through periodic charges, net of income taxes, presented as financing charges on Convertible Debentures in the consolidated statements of income; and
- •
- the holders' conversion feature is similar to a stock warrant as it provides the holder with the option to exchange their Convertible Debentures for Class A Subordinate Voting Shares at a fixed price. The residual approach was used to value this attribute and this amount is also presented as equity.
SUBORDINATED DEBENTURES
The Company's Subordinated Debentures, which were repaid during 2001, were recorded in part as debt and in part as equity.
The debt component consisted of the present value of the future interest payments on the Subordinated Debentures to maturity and was presented as debenture interest obligation. Interest on the debt component was accrued over time and recognized as a charge against income.
The equity component included the present value of the principal amount of the Subordinated Debentures which could, at the option of the Company, be satisfied by delivering such number of Class A Subordinate Voting Shares of the Company to a registered trustee for the sale to open bidders as required to satisfy the payment obligations. This equity component was accreted to the face value of the Subordinated Debentures over the term to maturity through periodic charges, net of income taxes, presented as financing charges on Subordinated Debentures in the consolidated statements of income.
EARNINGS PER CLASS A SUBORDINATE VOTING OR CLASS B SHARE
Basic earnings per Class A Subordinate Voting or Class B Share are calculated on net income attributable to Class A Subordinate Voting and Class B Shares using the weighted average number of Class A Subordinate Voting and Class B Shares outstanding during the year.
Diluted earnings per Class A Subordinate Voting or Class B Share are calculated on the weighted average number of Class A Subordinate Voting and Class B Shares that would have been outstanding during the year had all Convertible Series Preferred Shares and Convertible Debentures been converted at the beginning of the year [or date of issuance, if later] into Class A Subordinate Voting Shares based on each instrument's holders' fixed price conversion option, if such conversions are dilutive. In addition, the weighted average number of Class A Subordinate Voting and Class B Shares used to determine diluted earnings per share includes an adjustment for stock options outstanding using the treasury stock method. Under the treasury stock method:
- •
- the exercise of options is assumed to be at the beginning of the period [or date of issuance, if later];
- •
- the proceeds from the exercise of options, plus future period compensation expense on options granted on or after January 1, 2003, are assumed to be used to purchase Class A Subordinate Voting Shares at the average market price during the period; and
- •
- the incremental number of Class A Subordinate Voting Shares [the difference between the number of shares assumed issued and the number of shares assumed purchased] is included in the denominator of the diluted earnings per share computation.
Annual Report 2003 39
CONSOLIDATED BALANCE SHEETS
| | As at December 31,
|
|---|
[U.S. dollars in thousands]
| | Note
| | 2003
| | 2002
|
|---|
| ASSETS | | | | | | | | |
| Current assets: | | | | | | | | |
| | Cash and cash equivalents | | | | $ | 93,545 | | $ | 82,059 |
| | Accounts receivable | | 24 | | | 395,040 | | | 306,870 |
| | Inventories | | 6 | | | 216,502 | | | 160,091 |
| | Income taxes receivable | | | | | 4,015 | | | — |
| | Prepaid expenses and other | | | | | 18,267 | | | 15,902 |
| | | | |
| |
|
| | | | | | 727,369 | | | 564,922 |
| | | | |
| |
|
| Investments | | 7 | | | 20,781 | | | 17,382 |
| | | | |
| |
|
| Fixed assets, net | | 8 | | | 680,497 | | | 525,463 |
| | | | |
| |
|
| Goodwill, net | | 4, 5 | | | 71,106 | | | 62,008 |
| | | | |
| |
|
| Future tax assets | | 9 | | | 10,556 | | | 6,015 |
| | | | |
| |
|
| Other assets | | | | | 18,390 | | | 16,745 |
| | | | |
| |
|
| | | | | $ | 1,528,699 | | $ | 1,192,535 |
| | | | |
| |
|
LIABILITIES AND SHAREHOLDERS' EQUITY |
|
|
|
|
|
|
|
|
Current liabilities: |
|
|
|
|
|
|
|
|
| | Bank indebtedness | | 10 | | $ | 177,288 | | $ | 55,021 |
| | Accounts payable | | 24 | | | 226,114 | | | 187,656 |
| | Accrued salaries and wages | | | | | 68,298 | | | 59,715 |
| | Other accrued liabilities | | | | | 77,260 | | | 54,104 |
| | Income taxes payable | | 9 | | | — | | | 13,336 |
| | Long-term debt due within one year | | 10 | | | 4,856 | | | 6,918 |
| | Debt due to Magna and its affiliates within one year | | 10 | | | 141,804 | | | 103,536 |
| | Convertible Series Preferred Shares, held by Magna | | 11 | | | 150,572 | | | 95,639 |
| | | | |
| |
|
| | | | | | 846,192 | | | 575,925 |
| | | | |
| |
|
| Long-term debt | | 10 | | | 11,194 | | | 9,677 |
| | | | |
| |
|
| Long-term debt due to Magna and its affiliates | | 10 | | | — | | | 75,094 |
| | | | |
| |
|
| Convertible Series Preferred Shares, held by Magna | | 11 | | | — | | | 116,140 |
| | | | |
| |
|
| Other long-term liabilities | | 12 | | | 7,462 | | | 4,837 |
| | | | |
| |
|
| Future tax liabilities | | 9 | | | 50,214 | | | 48,114 |
| | | | |
| |
|
| Commitments and contingencies | | 10, 17 | | | | | | |
Shareholders' equity: |
|
|
|
|
|
|
|
|
| | Convertible Debentures | | 13 | | | 66,127 | | | — |
| | Convertible Series Preferred Shares | | 11 | | | 8,826 | | | 18,765 |
| | Class A Subordinate Voting Shares | | 14 | | | 287,137 | | | 172,488 |
| | Class B Shares | | 14 | | | 30,594 | | | 30,594 |
| | Contributed surplus | | 4 | | | 267 | | | — |
| | Retained earnings | | | | | 156,984 | | | 111,450 |
| | Currency translation adjustment | | 16 | | | 63,702 | | | 29,451 |
| | | | |
| |
|
| | | | | | 613,637 | | | 362,748 |
| | | | |
| |
|
| | | | | $ | 1,528,699 | | $ | 1,192,535 |
| | | | |
| |
|
On behalf of the Board:
| /s/ JOHN T. MAYBERRY | | /s/ JENNIFER J. JACKSON |
| JOHN T. MAYBERRY | | JENNIFER J. JACKSON |
| Director and Chairman of the Audit Committee | | Director and Member of the Audit Committee |
See accompanying notes
40 Decoma International Inc.
CONSOLIDATED STATEMENTS OF INCOME AND RETAINED EARNINGS
| |
| | Years ended December 31,
| |
|---|
[U.S. dollars in thousands]
| | Note
| | 2003
| | 2002
| | 2001
| |
|---|
| Sales | | 24 | | $ | 2,355,830 | | $ | 2,056,673 | | $ | 1,815,869 | |
| Cost of goods sold | | 23, 24 | | | 1,891,153 | | | 1,633,225 | | | 1,450,360 | |
| Depreciation and amortization | | 4 | | | 89,894 | | | 78,284 | | | 81,360 | |
| Selling, general and administrative | | 4, 19, 24 | | | 175,267 | | | 137,859 | | | 115,722 | |
| Affiliation and social fees | | 24 | | | 24,541 | | | 25,311 | | | 27,110 | |
| Other charges | | 2, 3, 4 | | | 23,785 | | | 8,301 | | | — | |
| | | | |
| |
| |
| |
| Operating income | | | | | 151,190 | | | 173,693 | | | 141,317 | |
| Equity income | | 7 | | | (1,844 | ) | | (521 | ) | | (15 | ) |
| Interest expense, net | | 10, 24 | | | 10,693 | | | 11,984 | | | 19,095 | |
| Amortization of discount on Convertible Series Preferred Shares, held by Magna | | 11, 24 | | | 8,631 | | | 8,351 | | | 9,276 | |
| Other income | | 20 | | | (1,387 | ) | | (4,369 | ) | | (2,780 | ) |
| | | | |
| |
| |
| |
| Income before income taxes and minority interest | | | | | 135,097 | | | 158,248 | | | 115,741 | |
| Income taxes | | 9 | | | 63,195 | | | 65,223 | | | 46,222 | |
| Minority interest | | 5 | | | — | | | — | | | 843 | |
| | | | |
| |
| |
| |
| Net income | | | | $ | 71,902 | | $ | 93,025 | | $ | 68,676 | |
| | | | |
| |
| |
| |
| Financing charges on Convertible Series Preferred Shares held by Magna, Convertible Debentures and Subordinated Debentures, net of taxes | | 11, 13, 21, 24 | | $ | (7,552 | ) | $ | (4,792 | ) | $ | (6,474 | ) |
| Loss on retirement of Subordinated Debentures, net of taxes | | 20 | | | — | | | — | | | (1,717 | ) |
| | | | |
| |
| |
| |
| Net income attributable to Class A Subordinate Voting and Class B Shares | | | | | 64,350 | | | 88,233 | | | 60,485 | |
| Retained earnings, beginning of year | | | | | 111,450 | | | 49,768 | | | 156 | |
| Dividends on Class A Subordinate Voting and Class B Shares | | 14 | | | (18,816 | ) | | (14,247 | ) | | (10,873 | ) |
| Adjustment for change in accounting policy for goodwill | | 4 | | | — | | | (12,304 | ) | | — | |
| | | | |
| |
| |
| |
| Retained earnings, end of year | | | | $ | 156,984 | | $ | 111,450 | | $ | 49,768 | |
| | | | |
| |
| |
| |
| Earnings per Class A Subordinate Voting or Class B Share | | | | | | | | | | | | |
| | Basic | | 22 | | $ | 0.88 | | $ | 1.30 | | $ | 1.00 | |
| | Diluted | | 22 | | $ | 0.77 | | $ | 1.03 | | $ | 0.81 | |
| | | | |
| |
| |
| |
| Average number of Class A Subordinate Voting and Class B Shares outstanding | | | | | | | | | | | | |
| | (in thousands) | | | | | | | | | | | | |
| | Basic | | 22 | | | 73,420 | | | 67,800 | | | 60,456 | |
| | Diluted | | 22 | | | 104,283 | | | 98,307 | | | 90,584 | |
| | | | |
| |
| |
| |
See accompanying notes
Annual Report 2003 41
CONSOLIDATED STATEMENTS OF CASH FLOWS
| |
| | Years ended December 31,
| |
|---|
[U.S. dollars in thousands]
| | Note
| | 2003
| | 2002
| | 2001
| |
|---|
| Cash provided from (used for): | | | | | | | | | | | | |
OPERATING ACTIVITIES |
|
|
|
|
|
|
|
|
|
|
|
|
| Net income | | | | $ | 71,902 | | $ | 93,025 | | $ | 68,676 | |
| Items not involving current cash flows | | 23 | | | 111,595 | | | 95,557 | | | 92,034 | |
| | | | |
| |
| |
| |
| | | | | | 183,497 | | | 188,582 | | | 160,710 | |
| Changes in non-cash working capital | | 23 | | | (51,621 | ) | | 50,011 | | | (920 | ) |
| | | | |
| |
| |
| |
| | | | | | 131,876 | | | 238,593 | | | 159,790 | |
| | | | |
| |
| |
| |
INVESTING ACTIVITIES |
|
|
|
|
|
|
|
|
|
|
|
|
| Fixed asset additions | | | | | (177,906 | ) | | (99,940 | ) | | (68,472 | ) |
| Acquisitions of subsidiaries, net of cash acquired | | 5 | | | (16,169 | ) | | — | | | (20,051 | ) |
| Less remaining purchase price payable | | 5 | | | (2,899 | ) | | (2,584 | ) | | 5,187 | |
| Increase in investments and other assets | | | | | (8,057 | ) | | (9,708 | ) | | (6,251 | ) |
| Proceeds from dispositions of fixed and other assets | | | | | 455 | | | 1,578 | | | 1,492 | |
| Proceeds from disposition of operating division, net | | 20 | | | — | | | 5,736 | | | — | |
| | | | |
| |
| |
| |
| | | | | | (204,576 | ) | | (104,918 | ) | | (88,095 | ) |
| | | | |
| |
| |
| |
FINANCING ACTIVITIES |
|
|
|
|
|
|
|
|
|
|
|
|
| Increase (decrease) in bank indebtedness | | 10 | | | 109,689 | | | (110,339 | ) | | 80,774 | |
| Repayments of debt due to Magna and its affiliates | | 10 | | | (72,417 | ) | | (7,836 | ) | | (85,435 | ) |
| Decrease in long-term debt | | 10 | | | (179 | ) | | (10,844 | ) | | (14,770 | ) |
| Issuance of Convertible Debentures | | 13 | | | 66,128 | | | — | | | — | |
| Issuances of Class A Subordinate Voting Shares, net | | 14 | | | 4,715 | | | 4,663 | | | 111,346 | |
| Repayment of Subordinated Debentures | | 20 | | | — | | | — | | | (74,252 | ) |
| Convertible Debentures interest payments | | 13 | | | (3,751 | ) | | — | | | — | |
| Repayment of Subordinated Debenture interest obligation | | 20 | | | — | | | — | | | (20,762 | ) |
| Dividends on Convertible Series Preferred Shares | | 11 | | | (12,177 | ) | | (12,098 | ) | | (11,085 | ) |
| Dividends on Class A Subordinate Voting and Class B Shares | | 14 | | | (18,816 | ) | | (14,247 | ) | | (12,599 | ) |
| | | | |
| |
| |
| |
| | | | | | 73,192 | | | (150,701 | ) | | (26,783 | ) |
| | | | |
| |
| |
| |
| Effect of exchange rate changes on cash and cash equivalents | | | | | 10,994 | | | 4,814 | | | (682 | ) |
| | | | |
| |
| |
| |
| Net increase (decrease) in cash and cash equivalents during the year | | | | | 11,486 | | | (12,212 | ) | | 44,230 | |
| Cash and cash equivalents, beginning of year | | | | | 82,059 | | | 94,271 | | | 50,041 | |
| | | | |
| |
| |
| |
| Cash and cash equivalents, end of year | | | | $ | 93,545 | | $ | 82,059 | | $ | 94,271 | |
| | | | |
| |
| |
| |
See accompanying notes
42 Decoma International Inc.
NOTES TO CONSOLIDATED FINANCIAL STATEMENTS
December 31, 2003
1. SIGNIFICANT ACCOUNTING POLICIES
The significant accounting policies followed by the Company are set out under "Significant Accounting Policies" preceding these consolidated financial statements.
2. UNITED KINGDOM IMPAIRMENT CHARGE
Upon completion of the 2004 business planning process, the Company identified a number of indicators of United Kingdom long-lived asset impairment including the continuation of United Kingdom budgeted operating losses, uncertain long-term production volumes for the United Kingdom market in general which affect certain of the Company's existing programs, and excess paint capacity in the United Kingdom market. In addition, Ford of Europe's decision to produce its 2006 Freelander program at Ford facilities in Halewood, England, has caused the Company to relocate its related 2006 Freelander fascia production from Sybex to the closer Merplas facility.
Under Canadian GAAP, these impairment indicators required the Company to assess its United Kingdom asset base for recoverability. Estimated discounted future cash flows were used to determine the amount of the write-down. The result was a write-down of $12.4 million of certain of the assets of the Company's Sybex facility. This write-down will have no near term impact on operations at the Company's United Kingdom facilities which will continue their operations in the normal course.
As a result of cumulative losses in the United Kingdom, this impairment charge has not been tax benefited.
3. CONTINENTAL EUROPE PAINT CAPACITY CONSOLIDATION CHARGES
During 2003, the Company completed, and committed to, a plan to consolidate its continental Europe paint capacity. This plan entails mothballing the Company's Decoform paint line in Germany and transferring Decoform's painted trim and fascia business to the Company's newer paint lines at its Decorate and Belplas facilities in Germany and Belgium, respectively. Decoform will continue to mold and assemble products for the Company's Decorate facility.
The consolidation required the write-down of the carrying value of the Decoform paint line by $4.8 million. The consolidation will also result in severance costs associated with a reduction of the Decoform workforce of 284 employees. Severance costs of $6.7 million were accrued in 2003.
Decoform employees have a contractual notice period of up to two quarters following the quarter in which individual notice is given. The consolidation plan envisions substantially all employees working through their contractual notice periods with paint line production transfers completed by the end of 2004.
A continuity of the severance accrual related to this consolidation plan is as follows:
[U.S. dollars in thousands]
| |
|
|---|
| Expensed in the three month period ended December 31, 2003 | | $ | 6,658 |
| Payments | | | — |
| Currency translation | | | 141 |
| | |
|
| Balance, December 31, 2003 | | $ | 6,799 |
| | |
|
The continental Europe paint capacity consolidation charges have resulted in large accounting losses in Germany and create both taxable temporary difference and loss carry forward future tax assets. A full valuation allowance has been provided against these future tax assets resulting in no net tax recovery in the consolidated statement of income against these charges.
4. ACCOUNTING POLICY CHANGES
Stock-based Compensation
As provided for by new accounting recommendations of The Canadian Institute of Chartered Accountants [the "CICA"] and as explained under "Significant Accounting Policies — Stock-based Compensation", the fair value of stock options granted, modified or settled on or after January 1, 2003 is recognized on a straight-line basis over the applicable stock option vesting period as compensation expense in selling, general and administrative expenses in the consolidated statements of income. For stock options granted prior to January 1, 2003 which are not accounted for at fair value, pro forma earnings disclosure showing the impact of fair value accounting is included in note 15. The impact of this accounting policy change on reported net income and earnings per share is as follows:
Annual Report 2003 43
[U.S. dollars, in thousands except per share figures]
| | Year ended
December 31, 2003
|
|---|
| Increase in selling, general and administrative expenses | | $ | 267 |
| | |
|
| Reduction of net income | | $ | 267 |
| | |
|
| Reduction of earnings per Class A Subordinate Voting or Class B Share | | | |
| | Basic | | $ | — |
| | Diluted | | $ | — |
| | |
|
Goodwill and Deferred Preproduction Expenditures
In 2002, the Company adopted the new accounting recommendations of the CICA for goodwill and other intangible assets. These accounting recommendations require that all business combinations initiated after June 30, 2001 be accounted for using the purchase method of accounting, provide new criteria to determine when acquired intangible assets should be recognized separately from goodwill and employ new non-amortization and impairment rules for existing goodwill and indefinite life intangible assets.
Upon initial adoption of these recommendations, the Company recorded a goodwill write-down of $12.3 million related to its United Kingdom reporting unit. This write-down was charged against January 1, 2002 opening retained earnings. As part of its initial assessment of goodwill impairment, the Company also reviewed the recoverability of deferred preproduction expenditures at its Merplas United Kingdom facility. As a result of this review, $8.3 million of deferred preproduction expenditures were written off as a charge against income in 2002. As a result of cumulative losses in the United Kingdom, this write-down was not tax effected.
In addition, commencing in 2002, the Company ceased recording amortization of existing goodwill. The Company does not have any indefinite life intangible assets meeting the non-amortization criteria under the new accounting recommendations. The Company's results for 2001 include goodwill amortization. Had the Company's 2001 results been restated to eliminate goodwill amortization, adjusted net income and earnings per share would have been as follows:
[U.S. dollars, in thousands except per share figures]
| | Year ended
December 31, 2001
|
|---|
| Net income, as reported | | $ | 68,676 |
| Restatement to eliminate goodwill amortization | | | 4,192 |
| | |
|
| Adjusted net income | | $ | 72,868 |
| | |
|
| Adjusted earnings per Class A Subordinate Voting or Class B Share | | | |
| | Basic | | $ | 1.07 |
| | Diluted | | $ | 0.85 |
| | |
|
5. BUSINESS ACQUISITIONS
Acquisitions in the year ended December 31, 2003
Federal Mogul Lighting
During the second quarter of 2003, the Company entered into an agreement to acquire Federal Mogul's original equipment automotive lighting operations in Matamoros, Mexico, a distribution centre in Brownsville, Texas, an assembly operation in Toledo, Ohio and certain of the engineering operations, contracts and equipment at Federal Mogul's original equipment automotive lighting operations in Hampton, Virginia. The total purchase price was $10.4 million. The transaction closed on April 14, 2003 with a transition of the Hampton, Virginia contracts and assets over the balance of 2003.
The net effect of the transaction on the Company's consolidated balance sheet was as follows:
[U.S. dollars in thousands]
| |
|
|---|
| Non-cash working capital | | $ | 8,023 |
| Fixed assets | | | 2,338 |
| | |
|
| Net assets acquired | | $ | 10,361 |
| | |
|
HDO
On October 1, 2003, the Company acquired the shares of HDO Galvano-und Oberflächentechnik GmbH ["HDO"]. HDO operated a chroming line adjacent to the Company's Idoplas facility in Germany. The line is being converted to allow for grille chroming and will be integrated into Idoplas' operations. The Company expects to launch the chroming line in early 2004 and commence the insourcing of grille chroming business previously outsourced by Decoma's European operations. Total consideration paid in connection with the acquisition amounted to $5.8 million. The acquisition has been accounted for by the purchase method in these consolidated financial statements from the date of acquisition.
44 Decoma International Inc.
The net effect of the transaction on the Company's consolidated balance sheet was as follows:
[U.S. dollars in thousands]
| |
| |
|---|
| Non-cash working capital | | $ | (430 | ) |
| Fixed assets | | | 6,238 | |
| | |
| |
| Net assets acquired | | $ | 5,808 | |
| | |
| |
Acquisitions in the year ended December 31, 2001
Autosystems
On September 28, 2001, the Company acquired the lighting components manufacturing business and related fixed and working capital assets of Autosystems Manufacturing Inc. ["Autosystems"] from the court appointed receiver and monitor of Autosystems.
Autosystems is located in Ontario and its principal customers include General Motors Corporation and Visteon Corporation. Total consideration paid in connection with the acquisition amounted to $12.3 million. The acquisition has been accounted for by the purchase method in these consolidated financial statements from the date of acquisition.
The net effect of the transaction on the Company's consolidated balance sheet was as follows:
[U.S. dollars in thousands]
| |
|
|---|
| Non-cash working capital | | $ | 2,200 |
| Fixed assets | | | 10,070 |
| | |
|
| Net assets acquired | | $ | 12,270 |
| | |
|
Decomex
In May 2001, the Company acquired the remaining 30% minority interest in Decomex Inc. ["Decomex"] from Corporación Activa, S.A. de C.V. Decomex operates fascia moulding and finishing operations in Mexico.
Total consideration paid in connection with the acquisition amounted to $7.8 million which gave rise to goodwill of $0.1 million. The purchase price was satisfied with cash of $2.6 million and by the issuance of $5.2 million of prime rate promissory notes which were repaid during 2002 and 2003.
The acquisition has been accounted for by the purchase method in these consolidated financial statements from the date of acquisition.
Pro Forma Impact
If the Federal Mogul Lighting and HDO acquisitions occurred on January 1, 2002, there would have been no material impact to the Company's sales or net income.
6. INVENTORIES
Inventories consist of:
| | As at December 31,
|
|---|
[U.S. dollars in thousands]
| | 2003
| | 2002
|
|---|
| Raw materials and supplies | | $ | 72,529 | | $ | 48,281 |
| Work-in-process | | | 21,070 | | | 19,029 |
| Finished goods | | | 29,077 | | | 28,383 |
| Tooling, net of customer advances of $41,494 [2002 — $41,968] | | | 93,826 | | | 64,398 |
| | |
| |
|
| | | $ | 216,502 | | $ | 160,091 |
| | |
| |
|
7. INVESTMENTS
Investments consist of the Company's 40% interests in Bestop Inc. ["Bestop"] and Modular Automotive Systems LLC ["MAS"]. The Company's investment in Bestop includes goodwill of $8.9 million as at December 31, 2003 [2002 — $7.3 million].
Annual Report 2003 45
8. FIXED ASSETS
Fixed assets consist of:
| | As at December 31,
| |
|---|
| | 2003
| | 2002
| |
|---|
[U.S. dollars in thousands]
| |
| |
|---|
| Cost | | | | | | | |
| | Land | | $ | 18,335 | | $ | 16,100 | |
| | Buildings and leasehold improvements | | | 186,382 | | | 139,004 | |
| | Machinery and equipment | | | 1,034,150 | | | 797,413 | |
| | Construction in progress | | | 83,615 | | | 56,204 | |
| | |
| |
| |
| | | | 1,322,482 | | | 1,008,721 | |
| Accumulated depreciation | | | | | | | |
| | Buildings and leasehold improvements | | | (57,709 | ) | | (43,835 | ) |
| | Machinery and equipment | | | (584,530 | ) | | (440,075 | ) |
| | |
| |
| |
| | | | 680,243 | | | 524,811 | |
| Deferred preproduction costs, net | | | 254 | | | 652 | |
| | |
| |
| |
| | | $ | 680,497 | | $ | 525,463 | |
| | |
| |
| |
Notes:
- [i]
- Interest capitalized on construction in progress during the year ended December 31, 2003 was $1.3 million [2002 and 2001 — nil].
9. INCOME TAXES
- [a]
- The provision for income taxes differs from the expense that would be obtained by applying Canadian statutory rates as a result of the following:
| | Years ended December 31,
| |
|---|
| | 2003
| | 2002
| | 2001
| |
|---|
| Canadian statutory income tax rate | | 36.6 | % | 38.6 | % | 41.7 | % |
| Manufacturing and processing profits deduction | | (2.1 | ) | (2.4 | ) | (3.8 | ) |
| Foreign rate differentials | | (2.3 | ) | (2.2 | ) | (4.6 | ) |
| | |
| |
| |
| |
| | | 32.2 | % | 34.0 | % | 33.3 | % |
| Losses not benefited | | 12.0 | | 6.0 | | 6.5 | |
| Amortization of discount on Convertible Series Preferred Shares held by Magna | | 2.3 | | 2.0 | | 3.3 | |
| Utilization of losses not previously benefited | | — | | (0.3 | ) | (2.5 | ) |
| Non-deductible goodwill amortization | | — | | — | | 1.2 | |
| Other income [see note 20] | | (0.4 | ) | (0.4 | ) | (1.0 | ) |
| Future net tax liability revaluation due to Ontario income tax rate changes | | 0.9 | | — | | (1.4 | ) |
| Earnings of equity investees | | (0.5 | ) | (0.1 | ) | — | |
| Other | | 0.3 | | — | | 0.5 | |
| | |
| |
| |
| |
| Effective income tax rate on income before income taxes and minority interest | | 46.8 | % | 41.2 | % | 39.9 | % |
| | |
| |
| |
| |
- [b]
- The details of income before income taxes and minority interest by jurisdiction are as follows:
| | Years ended December 31,
|
|---|
| | 2003
| | 2002
| | 2001
|
|---|
[U.S. dollars in thousands]
| |
|
|---|
| Canadian | | $ | 88,696 | | $ | 79,412 | | $ | 52,746 |
| Foreign | | | 46,401 | | | 78,836 | | | 62,995 |
| | |
| |
| |
|
| | | $ | 135,097 | | $ | 158,248 | | $ | 115,741 |
| | |
| |
| |
|
46 Decoma International Inc. 2003
- [c]
- The details of the income tax provision are as follows:
| | Years ended December 31,
| |
|---|
| | 2003
| | 2002
| | 2001
| |
|---|
[U.S. dollars in thousands]
| |
| |
|---|
| Current provision | | | | | | | | | | |
| | Canadian federal taxes | | $ | 22,993 | | $ | 15,673 | | $ | 14,275 | |
| | Canadian provincial taxes | | | 9,475 | | | 7,794 | | | 6,914 | |
| | Foreign taxes | | | 37,992 | | | 40,581 | | | 22,455 | |
| | |
| |
| |
| |
| | | | 70,460 | | | 64,048 | | | 43,644 | |
| | |
| |
| |
| |
| Future provision | | | | | | | | | | |
| | Canadian federal taxes | | | (1,435 | ) | | 3,160 | | | (1,588 | ) |
| | Canadian provincial taxes | | | (741 | ) | | 1,571 | | | (766 | ) |
| | Foreign taxes | | | (5,089 | ) | | (3,556 | ) | | 4,932 | |
| | |
| |
| |
| |
| | | | (7,265 | ) | | 1,175 | | | 2,578 | |
| | |
| |
| |
| |
| | | $ | 63,195 | | $ | 65,223 | | $ | 46,222 | |
| | |
| |
| |
| |
- [d]
- Future income taxes have been provided on temporary and timing differences which consist of the following:
| | Years ended December 31,
| |
|---|
| | 2003
| | 2002
| | 2001
| |
|---|
[U.S. dollars in thousands]
| |
| |
|---|
| Tax depreciation in excess of (less than) book depreciation | | $ | (2,501 | ) | $ | 1,851 | | $ | 3,953 | |
| Preproduction and contract costs, capitalized for accounting [net of amortization] deducted for tax | | | (836 | ) | | (2,650 | ) | | (713 | ) |
| Tax losses benefited | | | (6,513 | ) | | (3,200 | ) | | (914 | ) |
| Utilization of loss carryforwards | | | — | | | 6,524 | | | 662 | |
| Reversal of tax losses previously benefited | | | 1,851 | | | — | | | — | |
| Future income tax revaluation due to Ontario income tax rate changes | | | 1,119 | | | — | | | (1,605 | ) |
| Amortization of share issue costs and other temporary differences | | | (385 | ) | | (1,350 | ) | | 1,195 | |
| | |
| |
| |
| |
| | | $ | (7,265 | ) | $ | 1,175 | | $ | 2,578 | |
| | |
| |
| |
| |
- [e]
- Future tax assets and liabilities consist of the following temporary differences:
| | As at December 31,
| |
|---|
| | 2003
| | 2002
| |
|---|
[U.S. dollars in thousands]
| |
| |
|---|
| Assets: | | | | | | | |
| Tax benefit of loss carryforwards | | | | | | | |
| | Post-acquisition | | $ | 55,259 | | $ | 26,403 | |
| Share issue costs | | | 777 | | | 964 | |
| | |
| |
| |
| | | | 56,036 | | | 27,367 | |
| Valuation allowance against tax benefit of loss carryforwards | | | | | | | |
| | Post-acquisition | | | (45,480 | ) | | (21,352 | ) |
| | |
| |
| |
| | | | 10,556 | | | 6,015 | |
| | |
| |
| |
Liabilities: |
|
|
|
|
|
|
|
| Tax depreciation in excess of book depreciation | | | (49,032 | ) | | (45,153 | ) |
| Deferred costs | | | (238 | ) | | (1,074 | ) |
| Other | | | (944 | ) | | (1,887 | ) |
| | |
| |
| |
| | | | (50,214 | ) | | (48,114 | ) |
| | |
| |
| |
| Net future income taxes | | $ | (39,658 | ) | $ | (42,099 | ) |
| | |
| |
| |
Annual Report 2003 47
- [f]
- At December 31, 2003, the Company has gross income tax loss carryforwards of approximately $143.2 million, which relate to certain entities in the United Kingdom, Belgium, Germany and Poland, the tax benefits of which have not been recognized in the consolidated financial statements. Of the total losses, $141.6 million have no expiry date and $1.6 million expire within 5 years.
- [g]
- Consolidated retained earnings includes approximately $104.9 million at December 31, 2003 of undistributed earnings of foreign subsidiaries that may be subject to tax if remitted to the Canadian parent company. No provision has been made for such taxes as these earnings are considered to be reinvested for the foreseeable future.
10. DEBT AND COMMITMENTS
- [a]
- At December 31, 2003, the Company had total lines of credit of $316.0 million. Of this amount, $300 million is represented by an extendible revolving credit facility that expires on May 27, 2004, at which time the Company may request, subject to lender approval, further revolving 364 day extensions. The unused and available lines of credit at December 31, 2003 were approximately $122.7 million.
Draws under the Company's $300 million credit facility bear interest at prime plus 0% to 0.375% depending on the Company's consolidated debt to capitalization position. In addition, the Company pays a commitment fee of 0.175% to 0.3% of the undrawn portion of the facility depending on the Company's consolidated debt to capitalization position.
The facility contains a number of covenants including maximum indebtedness, maximum consolidated debt to capitalization and minimum interest and fixed charge coverage, all as defined in the credit agreement. Each of these covenants is measured quarterly. The Company has been in compliance with these covenants through December 31, 2003.
Bank indebtedness at December 31, 2003 is denominated in Canadian dollars.
- [b]
- The Company's long-term debt consists of the following:
| | As at December 31,
|
|---|
| | 2003
| | 2002
|
|---|
[U.S. dollars in thousands]
| |
|
|---|
| Bank debt denominated in Euros [i] | | $ | 10,877 | | $ | 13,665 |
| Notes payable denominated in Canadian dollars | | | — | | | 2,550 |
| Capital lease obligations denominated in Euros | | | 4,978 | | | 337 |
| Other | | | 195 | | | 43 |
| | |
| |
|
| | | | 16,050 | | | 16,595 |
| Less due within one year | | | 4,856 | | | 6,918 |
| | |
| |
|
| | | $ | 11,194 | | $ | 9,677 |
| | |
| |
|
Note:
- [i]
- Substantially all of this debt is unsecured and bears interest at EURIBOR plus 0.1%.
- [c]
- The Company's debt due to Magna and its affiliates consists of the following:
| | As at December 31,
|
|---|
| | 2003
| | 2002
|
|---|
[U.S. dollars in thousands]
| |
|
|---|
| Debt denominated in Canadian dollars [i] | | $ | 46,512 | | $ | 38,256 |
| Debt denominated in Euros [ii] | | | 94,128 | | | 139,324 |
| Capital lease obligation denominated in Euros | | | 1,164 | | | 1,050 |
| | |
| |
|
| | | | 141,804 | | | 178,630 |
| Less due within one year | | | 141,804 | | | 103,536 |
| | |
| |
|
| | | $ | — | | $ | 75,094 |
| | |
| |
|
Notes:
- [i]
- This debt initially bore interest at 7.5% and was repayable in 2001. In addition to the maturity date, the interest rate on this debt was subsequently renegotiated to 4.85% effective September 2001, 3.10% effective January 1, 2002, 3.60% effective April 1, 2002, 3.83% effective July 1, 2002, 3.90% effective October 1, 2002, 3.85% effective January 1, 2003, 4.25% effective April 1, 2003, 4.19% effective July 1, 2003, 3.86% effective October 1, 2003 and 3.65% effective January 1, 2004. The maturity date of the Cdn. $60 million debt has been extended to March 31, 2004.
48 Decoma International Inc. 2003
- [ii]
- This debt, comprised of three tranches, initially bore interest at 7.0%, 7.0% and 7.5%, respectively, and was repayable October 1, 2002, October 1, 2003 and December 31, 2004, respectively. The maturity date and the interest rate on the first tranche was renegotiated to 4.29% effective October 2, 2002, 3.86% effective January 2, 2003, 3.51% effective April 2, 2003, 3.14% effective July 2, 2003 and 3.32% effective October 2, 2003. The maturity date and the interest rate on the second tranche was renegotiated to 3.32% effective October 2, 2003. Substantially all of the first and second tranches were repaid in December 2003. The remaining portions of the first and second tranches outstanding at December 31, 2003 have subsequently been repaid. The third and final tranche of this debt, totalling Euro 72.0 million, continues to be due December 31, 2004 and bears interest at its original rate of 7.5%.
- [d]
- Future principal repayments on long-term debt are estimated to be as follows:
[U.S. dollars in thousands]
| | Third
parties
| | Magna and
its affiliates
| | Total
|
|---|
| 2004 | | $ | 4,856 | | $ | 141,804 | | $ | 146,660 |
| 2005 | | | 5,430 | | | — | | | 5,430 |
| 2006 | | | 1,903 | | | — | | | 1,903 |
| 2007 | | | 1,504 | | | — | | | 1,504 |
| 2008 | | | 1,815 | | | — | | | 1,815 |
| Thereafter | | | 542 | | | — | | | 542 |
| | |
| |
| |
|
| | | $ | 16,050 | | $ | 141,804 | | $ | 157,854 |
| | |
| |
| |
|
- [e]
- Net interest expense includes:
| | Years ended December 31,
| |
|---|
[U.S. dollars in thousands]
| | 2003
| | 2002
| | 2001
| |
|---|
| Interest expense | | | | | | | | | | |
| | Current | | $ | 2,779 | | $ | 4,592 | | $ | 4,506 | |
| | Long-term | | | 705 | | | 211 | | | 3,169 | |
| | Intercompany to Magna and its affiliates | | | 11,325 | | | 10,109 | | | 13,900 | |
| | |
| |
| |
| |
| | | | 14,809 | | | 14,912 | | | 21,575 | |
| Less: Interest capitalized | | | (1,263 | ) | | — | | | — | |
| | |
| |
| |
| |
| | | | 13,546 | | | 14,912 | | | 21,575 | |
| Interest income | | | (2,853 | ) | | (2,928 | ) | | (2,480 | ) |
| | |
| |
| |
| |
| Net interest expense | | $ | 10,693 | | $ | 11,984 | | $ | 19,095 | |
| | |
| |
| |
| |
Interest paid in cash for the year ended December 31, 2003 was $14.2 million [2002 — $14.9 million; 2001 — $19.2 million].
- [f]
- At December 31, 2003, the Company had commitments under operating leases requiring future annual rental payments as follows:
| | Facilities
| | Equipment
and other
| |
|
|---|
[U.S. dollars in thousands]
| | Third
parties
| | Magna and
its affiliates
| | Third
parties
| | Total
|
|---|
| 2004 | | $ | 12,470 | | $ | 13,129 | | $ | 8,247 | | $ | 33,846 |
| 2005 | | | 12,702 | | | 13,119 | | | 6,601 | | | 32,422 |
| 2006 | | | 11,029 | | | 12,931 | | | 5,679 | | | 29,639 |
| 2007 | | | 8,448 | | | 12,783 | | | 3,614 | | | 24,845 |
| 2008 | | | 7,273 | | | 11,889 | | | 3,347 | | | 22,509 |
| Thereafter | | | 48,220 | | | 49,970 | | | 2,148 | | | 100,338 |
| | |
| |
| |
| |
|
| | | $ | 100,142 | | $ | 113,821 | | $ | 29,636 | | $ | 243,599 |
| | |
| |
| |
| |
|
In the year ended December 31, 2003, operating lease expense amounted to approximately $30.6 million [2002 — $24.6 million; 2001 — $22.1 million].
Annual Report 2003 49
11. CONVERTIBLE SERIES PREFERRED SHARES HELD BY MAGNA
During 2003, the Series 1, 2 and 3 Convertible Series Preferred Shares held by Magna were converted into Class A Subordinate Voting Shares at a fixed conversion price of Cdn. $10.07 per Class A Subordinate Voting Share. Decoma issued 14,895,729 Class A Subordinate Voting Shares on conversion.
The Company's Convertible Series Preferred Shares which remain outstanding at December 31, 2003 are as follows:
| |
| | Face Value
| |
| |
|
|---|
| | Number of
Shares
| | Non-Cumulative
Dividend Rate
| | Conversion
Price
|
|---|
| | Per Share
| | Total
|
|---|
| Series 4 | | 1,000,000 | | Cdn. $100 | | Cdn. $100,000,000 | | 5.75% | | Cdn. $13.20 |
| Series 5 | | 1,000,000 | | Cdn. $100 | | Cdn. $100,000,000 | | 5.75% | | Cdn. $13.20 |
The Convertible Series Preferred Shares are:
- •
- retractable at their carrying value by the holders thereof after December 31, 2003 in the case of Series 4 and commencing December 31, 2004 in the case of Series 5;
- •
- redeemable at their carrying value and subject to purchase for cancellation by the Company commencing December 31, 2005; and
- •
- convertible into Class A Subordinate Voting Shares of the Company at the option of the holder at a conversion price of Cdn. $13.20.
Dividends are non-cumulative and payable on a quarterly basis.
The portion of the Convertible Series Preferred Shares classified as debt is as follows:
[U.S. dollars in thousands]
| | Series 1
| | Series 2
| | Series 3
| | Series 4
| | Series 5
| | Total
| |
|---|
| Balance, December 31, 2000 | | $ | 33,328 | | $ | 32,526 | | $ | 31,120 | | $ | 54,796 | | $ | 51,331 | | $ | 203,101 | |
| Amortization of discount | | | — | | | 786 | | | 1,334 | | | 3,695 | | | 3,461 | | | 9,276 | |
| Currency translation | | | (1,992 | ) | | (1,976 | ) | | (1,900 | ) | | (3,383 | ) | | (3,170 | ) | | (12,421 | ) |
| | |
| |
| |
| |
| |
| |
| |
| Balance, December 31, 2001 | | | 31,336 | | | 31,336 | | | 30,554 | | | 55,108 | | | 51,622 | | | 199,956 | |
| Amortization of discount | | | — | | | — | | | 795 | | | 3,901 | | | 3,655 | | | 8,351 | |
| Currency translation | | | 544 | | | 544 | | | 530 | | | 957 | | | 897 | | | 3,472 | |
| | |
| |
| |
| |
| |
| |
| |
| Balance, December 31, 2002 | | | 31,880 | | | 31,880 | | | 31,879 | | | 59,966 | | | 56,174 | | | 211,779 | |
| Amortization of discount | | | — | | | — | | | — | | | 4,235 | | | 4,396 | | | 8,631 | |
| Currency translation | | | 3,946 | | | 3,946 | | | 3,947 | | | 13,319 | | | 12,482 | | | 37,640 | |
| Conversion | | | (35,826 | ) | | (35,826 | ) | | (35,826 | ) | | — | | | — | | | (107,478 | ) |
| | |
| |
| |
| |
| |
| |
| |
| Balance, December 31, 2003 | | $ | — | | $ | — | | $ | — | | $ | 77,520 | | $ | 73,052 | | $ | 150,572 | |
| | |
| |
| |
| |
| |
| |
| |
The portion of the Convertible Series Preferred Shares included in shareholders' equity is as follows:
| | As at December 31,
|
|---|
[U.S. dollars in thousands]
| | 2003
| | 2002
|
|---|
| Warrant portion [relating to conversion feature] | | $ | 4,028 | | $ | 6,370 |
| Dividend portion [relating to possible future non-cumulative dividends] | | | 4,798 | | | 12,395 |
| | |
| |
|
| | | $ | 8,826 | | $ | 18,765 |
| | |
| |
|
50 Decoma International Inc.
12. EMPLOYEE FUTURE BENEFIT PLANS
Prior to 2001, Decoma's Corporate Constitution required that 10% of employee pre-tax profits before profit sharing [as defined in the Corporate Constitution] for any fiscal period be allocated to an employee equity and profit participation program [the "Decoma EEPPP"] consisting of the Decoma deferred profit sharing plan and a cash distribution to eligible employees of Decoma. Eligible Canadian and United States employees participate in the Decoma EEPPP. During 2001, Decoma amended its Corporate Constitution to allow for the introduction of a defined benefit pension plan as part of the Decoma EEPPP. All employees that participate in the Decoma EEPPP were, and all new employees are, given the option of continuing in the original Decoma EEPPP or receiving a reduced entitlement under the original Decoma EEPPP plus a defined benefit pension. The defined benefit pension is payable to retirees based on years of service and compensation levels.
The Company also sponsors a post-retirement medical benefits plan covering eligible employees and retirees in Canada and the United States. Retirees age 60 or older with ten or more years of service will be eligible for benefits. Benefits are subject to a fixed cap based on years of service.
Certain of the Company's European subsidiaries sponsor defined benefit pension arrangements for their employees.
The significant actuarial assumptions adopted in measuring the Company's projected benefit obligations at December 31, 2003 are as follows:
| Discount rate | | 5% to 6.75% |
| Rate of compensation increase | | 4% |
| Expected return on plan assets | | 8% |
| | |
|
Information about the Company's defined benefit pension and post-retirement medical benefits plans is as follows:
| | As at December 31,
| |
|---|
[U.S. dollars in thousands]
| | 2003
| | 2002
| |
|---|
| Projected benefit obligation: | | | | | | | |
| Beginning of year | | $ | 11,200 | | $ | 6,940 | |
| Current service and interest costs | | | 3,637 | | | 2,807 | |
| Actuarial losses and changes in assumptions | | | 2,176 | | | 1,112 | |
| Benefits paid | | | (95 | ) | | (55 | ) |
| Currency translation | | | 2,297 | | | 396 | |
| | |
| |
| |
| End of year | | $ | 19,215 | | $ | 11,200 | |
| | |
| |
| |
Plan assets at fair value: |
|
|
|
|
|
|
|
| Beginning of year | | $ | 2,556 | | $ | — | |
| Employer contributions | | | 2,039 | | | 2,697 | |
| Return on plan assets | | | 244 | | | (122 | ) |
| Benefits paid | | | (48 | ) | | (19 | ) |
| Currency translation | | | 422 | | | — | |
| | |
| |
| |
| End of year | | $ | 5,213 | | $ | 2,556 | |
| | |
| |
| |
Amount recognized in the consolidated balance sheets: |
|
|
|
|
|
|
|
| Unfunded amount | | $ | 14,002 | | $ | 8,644 | |
| Unrecognized past service costs | | | (3,996 | ) | | (3,629 | ) |
| Unrecognized actuarial losses | | | (2,544 | ) | | (178 | ) |
| | |
| |
| |
| Net amount recognized in the consolidated balance sheets | | $ | 7,462 | | $ | 4,837 | |
| | |
| |
| |
|
|
Years ended December 31,
|
|
|---|
[U.S. dollars in thousands]
| | 2003
| | 2002
| | 2001
| |
|---|
| Net periodic cost: | | �� | | | | | | | | |
| Current service and interest costs | | $ | 3,637 | | $ | 2,807 | | $ | 2,041 | |
| Amortization of past service costs | | | 233 | | | 212 | | | 209 | |
| Return on plan assets | | | (245 | ) | | (64 | ) | | — | |
| Amortization of actuarial (losses) gains | | | 1 | | | (30 | ) | | (3 | ) |
| | |
| |
| |
| |
| Total cost of benefits | | $ | 3,626 | | $ | 2,925 | | $ | 2,247 | |
| | |
| |
| |
| |
Annual Report 2003 51
13. CONVERTIBLE DEBENTURES
On March 27, 2003, the Company issued Cdn. $100 million of unsecured, subordinated Convertible Debentures bearing interest at 6.5% and maturing March 31, 2010. The Convertible Debentures are convertible at the option of the holder at any time into the Company's Class A Subordinate Voting Shares at a fixed conversion price of Cdn. $13.25 per share. All or part of the Convertible Debentures are redeemable at the Company's option between March 31, 2007 and March 31, 2008 if the weighted average trading price of the Company's Class A Subordinate Voting Shares is not less than Cdn. $16.5625 for the 20 consecutive trading days ending five trading days preceding the date on which notice of redemption is given. Subsequent to March 31, 2008, all or part of the Convertible Debentures are redeemable at the Company's option at any time. On redemption or maturity, the Company will have the option of retiring the Convertible Debentures with Class A Subordinate Voting Shares in which case the number of Class A Subordinate Voting Shares issuable is based on 95% of the trading price of the Company's Class A Subordinate Voting Shares for the 20 consecutive trading days ending five trading days prior to the date fixed for redemption or maturity. In addition, the Company may elect from time to time to issue and deliver freely tradeable Class A Subordinate Voting Shares to a trustee in order to raise funds to satisfy the obligation to pay interest on the Convertible Debentures.
As a result of these terms and as explained under "Significant Accounting Policies — Convertible Debentures", the Convertible Debentures are presented as equity.
14. CAPITAL STOCK
- [a]
- Class A Subordinate Voting Shares and Class B Shares
Class A Subordinate Voting Shares without par value [unlimited amount authorized] are entitled to one vote per share at all meetings of shareholders and participate equally as to cash dividends with each Class B Share.
Class B Shares without par value [unlimited amount authorized] are entitled to 20 votes per share at all meetings of shareholders, participate equally as to cash dividends with each Class A Subordinate Voting Share and may be converted at any time into fully-paid Class A Subordinate Voting Shares on a one-for-one basis.
In the event that either the Class A Subordinate Voting Shares or the Class B Shares are subdivided or consolidated, the other class shall be similarly changed to preserve the relative position of each class.
Outstanding Class A Subordinate Voting Shares and Class B Shares included in shareholders' equity as at December 31, 2003, 2002, 2001 and 2000 are as follows:
| | Class A Subordinate Voting Shares
| | Class B Shares
|
|---|
[U.S. dollars in thousands]
| | Number of shares
| | Stated Value
| | Number of shares
| | Stated Value
|
|---|
| Balance, December 31, 2000 | | 19,551,649 | | $ | 56,479 | | 31,909,091 | | $ | 30,594 |
| Issuance of Class A Subordinate Voting Shares through public offering [i] | | 16,100,000 | | | 111,131 | | — | | | — |
| Issuance of Class A Subordinate Voting Shares on exercise of stock options | | 35,250 | | | 215 | | — | | | — |
| | |
| |
| |
| |
|
| Balance, December 31, 2001 | | 35,686,899 | | | 167,825 | | 31,909,091 | | | 30,594 |
| Issuance of Class A Subordinate Voting Shares to the Decoma deferred profit sharing plan | | 451,400 | | | 4,554 | | — | | | — |
| Issuance of Class A Subordinate Voting Shares on exercise of stock options | | 16,000 | | | 109 | | — | | | — |
| | |
| |
| |
| |
|
| Balance, December 31, 2002 | | 36,154,299 | | | 172,488 | | 31,909,091 | | | 30,594 |
| Issuance of Class A Subordinate Voting Shares to Decoma deferred profit sharing plan | | 548,600 | | | 4,715 | | — | | | — |
| Issuance of Class A Subordinate Voting Shares on conversion of Series 1, 2 and 3 Convertible Series Preferred Shares [see note 11] | | 14,895,729 | | | 109,934 | | — | | | — |
| | |
| |
| |
| |
|
| Balance, December 31, 2003 | | 51,598,628 | | $ | 287,137 | | 31,909,091 | | $ | 30,594 |
| | |
| |
| |
| |
|
- [i]
- The Company completed a public offering of Class A Subordinate Voting Shares in June 2001. The details of the proceeds from the offering are as follows:
52 Decoma International Inc.
[U.S. dollars in thousands]
| |
| |
|---|
| Total proceeds on 16,100,000 shares at Cdn. $10.85 per share | | $ | 114,621 | |
| Expenses of the issue, net of taxes | | | (3,490 | ) |
| | |
| |
| | | $ | 111,131 | |
| | |
| |
- [b]
- Maximum Number of Shares
The following table presents the maximum number of Class A Subordinate Voting and Class B Shares that would be outstanding if all the outstanding options, Convertible Debentures and Convertible Series Preferred Shares issued and outstanding at December 31, 2003 were exercised or converted:
| | Number of Shares
|
|---|
| Class A Subordinate Voting Shares outstanding at December 31, 2003 | | 51,598,628 |
| Class B Shares outstanding at December 31, 2003 | | 31,909,091 |
| Options to purchase Class A Subordinate Voting Shares | | 2,640,000 |
| Convertible Debentures, convertible by the holders at Cdn. $13.25 per share | | 7,547,170 |
| Convertible Series Preferred Shares | | |
| | Series 4, convertible at Cdn. $13.20 per share | | 7,575,758 |
| | Series 5, convertible at Cdn. $13.20 per share | | 7,575,758 |
| | |
|
| | | 108,846,405 |
| | |
|
The above amounts include shares issuable if the holders of the Convertible Debentures exercise their fixed price conversion option but exclude Class A Subordinate Voting Shares issuable, only at the Company's option, to settle interest and principal related to the Convertible Debentures. The number of Class A Subordinate Voting Shares issuable at the Company's option is dependent on the trading price of Class A Subordinate Voting Shares at the time the Company elects to settle Convertible Debenture interest and principal with shares.
- [c]
- Dividends
Dividends were declared and paid in respect of the following periods on outstanding Class A Subordinate Voting and Class B Shares:
[U.S. dollars, in thousands except per share figures]
| | Per Class A Subordinate Voting and Class B Share
| | Total
|
|---|
| Two month period ended December 31, 2000 | | $ | 0.03 | | $ | 1,544 |
| Three month period ended March 31, 2001 | | $ | 0.05 | | | 2,573 |
| Three month period ended June 30, 2001 | | $ | 0.05 | | | 3,378 |
| Three month period ended September 30, 2001 | | $ | 0.05 | | | 3,378 |
| | |
| |
|
| Charged to retained earnings during the year ended December 31, 2001 | | | | | $ | 10,873 |
| | |
| |
|
| Three month period ended December 31, 2001 | | $ | 0.05 | | $ | 3,380 |
| Three month period ended March 31, 2002 | | $ | 0.05 | | | 3,380 |
| Three month period ended June 30, 2002 | | $ | 0.05 | | | 3,403 |
| Three month period ended September 30, 2002 | | $ | 0.06 | | | 4,084 |
| | |
| |
|
| Charged to retained earnings during the year ended December 31, 2002 | | | | | $ | 14,247 |
| | |
| |
|
| Three month period ended December 31, 2002 | | $ | 0.06 | | $ | 4,084 |
| Three month period ended March 31, 2003 | | $ | 0.06 | | | 4,084 |
| Three month period ended June 30, 2003 | | $ | 0.07 | | | 4,802 |
| Three month period ended September 30, 2003 | | $ | 0.07 | | | 5,846 |
| | |
| |
|
| Charged to retained earnings during the year ended December 31, 2003 | | | | | $ | 18,816 |
| | |
| |
|
Annual Report 2003 53
15. INCENTIVE STOCK OPTIONS
Under the Option Plan adopted by the Company on March 2, 1998, the Company may grant options to purchase Class A Subordinate Voting Shares to present and future officers, directors, other full-time employees or consultants of the Company. The maximum number of shares reserved to be issued for options is 4,100,000. The number of reserved but unoptioned shares at December 31, 2003 is 1,408,750. The total number of shares issued from exercised stock options from the inception date of the plan is 51,250.
All options granted are for a term of no more than ten years from the date of the grant. The options granted under Tranche 1 vest 121/2% on the grant date, 121/2% on July 31, 1998 and 121/2% on each of the following six years. The options granted under Tranche 2 vest 331/3% on the grant date and 162/3% on each of the following four anniversaries of the grant. The options granted under Tranche 3 vest 371/2% on July 31, 1999 and 121/2% on July 31 of each of the following five years. The options granted under Tranche 4, 6, 7, 8, 9, 10, 11 and 12 vest 20% on the grant date and 20% on each of the following four anniversaries of the grant. The options granted under Tranche 5 vest 60% on the grant date and 20% on each of December 31, 2000 and December 31, 2001.
The following is a continuity schedule of options outstanding:
| | Number
| | Weighted Average Exercise Price
| | Number of Options Exercisable
| |
|---|
| Outstanding at December 31, 2000 | | 1,426,250 | | Cdn. $11.99 | | 803,250 | |
| Granted | | 405,000 | | Cdn. $11.92 | | | |
| Exercised | | (35,250 | ) | Cdn. $9.50 | | (35,250 | ) |
| Vested | | | | | | 321,000 | |
| | |
| |
| |
| |
| Outstanding at December 31, 2001 | | 1,796,000 | | Cdn. $12.02 | | 1,089,000 | |
| Granted | | 435,000 | | Cdn. $17.53 | | | |
| Exercised | | (16,000 | ) | Cdn. $10.59 | | (16,000 | ) |
| Cancelled | | (20,000 | ) | Cdn. $11.24 | | (4,000 | ) |
| Vested | | | | | | 375,000 | |
| | |
| |
| |
| |
| Outstanding at December 31, 2002 | | 2,195,000 | | Cdn. $13.13 | | 1,444,000 | |
| Granted | | 455,000 | | Cdn. $12.43 | | | |
| Cancelled | | (10,000 | ) | Cdn. $10.30 | | (4,000 | ) |
| Vested | | | | | | 339,000 | |
| | |
| |
| |
| |
| Outstanding at December 31, 2003 | | 2,640,000 | | Cdn. $13.02 | | 1,779,000 | |
| | |
| |
| |
| |
At December 31, 2003, the outstanding options consist of the following:
| |
| | Options Outstanding
| |
|
|---|
| | Exercise Price
| | Number
| | Remaining Contractual Life
| | Number of Options Exercisable
|
|---|
| Tranche 1 | | Cdn. $9.50 | | 320,000 | | 4.1 years | | 280,000 |
| Tranche 2 | | Cdn. $13.55 | | 750,000 | | 3.6 years | | 750,000 |
| Tranche 3 | | Cdn. $11.55 | | 40,000 | | 4.1 years | | 35,000 |
| Tranche 4 | | Cdn. $11.00 | | 205,000 | | 6.4 years | | 164,000 |
| Tranche 5 | | Cdn. $11.25 | | 60,000 | | 6.0 years | | 60,000 |
| Tranche 6 | | Cdn. $10.08 | | 55,000 | | 7.2 years | | 33,000 |
| Tranche 7 | | Cdn. $10.30 | | 10,000 | | 7.3 years | | 6,000 |
| Tranche 8 | | Cdn. $12.40 | | 310,000 | | 7.8 years | | 186,000 |
| Tranche 9 | | Cdn. $16.85 | | 10,000 | | 8.3 years | | 4,000 |
| Tranche 10 | | Cdn. $17.55 | | 425,000 | | 8.5 years | | 170,000 |
| Tranche 11 | | Cdn. $12.50 | | 425,000 | | 9.1 years | | 85,000 |
| Tranche 12 | | Cdn. $11.47 | | 30,000 | | 9.2 years | | 6,000 |
| | | | |
| | | |
|
| | | | | 2,640,000 | | | | 1,779,000 |
| | | | |
| | | |
|
| Weighted average exercise price | | | | Cdn. $13.02 | | | | Cdn. $12.70 |
| | | | |
| | | |
|
| Weighted average remaining contractual life | | | | | | 6.3 years | | |
| | | | | | |
| | |
54 Decoma International Inc.
The fair value of stock options is estimated at the grant date using the Black-Scholes option pricing model using the following weighted average assumptions for stock options issued in each period indicated:
| | Years ended December 31,
|
|---|
| | 2003
| | 2002
| | 2001
|
|---|
| Risk free interest rate | | 3.0% | | 2.7% | | 3.1% |
| Expected dividend yield | | 3.2% | | 1.9% | | 1.8% |
| Expected volatility | | 39% | | 37% | | 28% |
| Expected life of options | | 5 years | | 5 years | | 6 years |
| | |
| |
| |
|
Stock options granted prior to January 1, 2003 are not accounted for at fair value. Had these stock options been accounted for at fair value, the Company's net income attributable to Class A Subordinate Voting and Class B Shares would have been:
| | Years ended December 31,
| |
|---|
[U.S. dollars, in thousands except per share figures]
| | 2003
| | 2002
| | 2001
| |
|---|
| Net income attributable to Class A Subordinate Voting and Class B Shares | | $ | 64,350 | | $ | 88,233 | | $ | 60,485 | |
Pro forma adjustments for the fair value of stock options granted prior to
January 1, 2003 | | | (947 | ) | | (1,019 | ) | | (1,199 | ) |
| | |
| |
| |
| |
| Pro forma net income attributable to Class A Subordinate Voting and Class B Shares | | $ | 63,403 | | $ | 87,214 | | $ | 59,286 | |
| | |
| |
| |
| |
| Pro forma earnings per Class A Subordinate Voting or Class B Share | | | | | | | | | | |
| | Basic | | $ | 0.86 | | $ | 1.29 | | $ | 0.98 | |
| | Diluted | | $ | 0.76 | | $ | 1.02 | | $ | 0.80 | |
| | |
| |
| |
| |
16. CURRENCY TRANSLATION ADJUSTMENT
The following is a continuity schedule of the currency translation adjustment account included in shareholders' equity:
| | Years ended December 31,
| |
|---|
[U.S. dollars in thousands]
| | 2003
| | 2002
| | 2001
| |
|---|
| Balance, beginning of year | | $ | 29,451 | | $ | 22,848 | | $ | 22,346 | |
| Translation adjustments | | | 35,638 | | | 7,098 | | | 3,282 | |
| Amount recognized in income [see note 20] | | | (1,387 | ) | | (495 | ) | | (2,780 | ) |
| | |
| |
| |
| |
| Balance, end of year | | $ | 63,702 | | $ | 29,451 | | $ | 22,848 | |
| | |
| |
| |
| |
17. CONTINGENCIES
In the ordinary course of business activities, the Company may be contingently liable for litigation and claims with customers, suppliers and former employees. In addition, the Company may be, or could become, liable to incur environmental remediation costs to bring environmental contamination levels back within acceptable legal limits. On an on-going basis, the Company assesses the likelihood of any adverse judgments or outcomes to these matters as well as potential ranges of probable costs and losses. A determination of the provision required, if any, for these contingencies is made after analysis of each individual issue. The required provision may change in the future due to new developments in each matter or changes in approach such as a change in settlement strategy in dealing with these matters.
In certain circumstances, the Company is at risk for warranty costs including product liability and recall costs. Product liability provisions are established based on the Company's best estimate of the amounts necessary to settle existing claims on product default issues. Recall costs are costs incurred when the Company and/or the customer decide, either voluntarily or involuntarily, to recall a product due to a known or suspected performance issue. Costs typically include the cost of the product being replaced, the customer's cost of the recall and labour to remove and replace the defective part. When a decision to recall a product has been made or is probable, the Company's estimated cost of the recall is recorded as a charge to net income in that period. In making this estimate, judgment is required as to the number of units that may be returned as a result of the recall, the total cost of the recall campaign, the ultimate negotiated sharing of the cost between the Company and the customer and, in some cases, the extent to which a supplier to the Company will share in the recall cost. Due to the nature of the costs, the Company makes its best estimate of the expected future costs, however, the ultimate amount of such costs could be materially different. Given the nature of the Company's products, to date, the Company has not experienced significant warranty, including product liability and recall, costs. However, the Company continues to experience increased customer pressure to assume greater warranty responsibility. Currently the Company only accounts for existing or probable claims, however, a significant increase in warranty responsibility could require the Company to consider accounting for possible future claims.
Annual Report 2003 55
18. FINANCIAL INSTRUMENTS
- [a]
- Fair Value
The methods and assumptions used to estimate the fair value of financial instruments are described below.
Cash and cash equivalents, accounts receivable, bank indebtedness, accounts payable and accrued liabilities
Due to the short period to maturity of these instruments, the carrying values as presented in the consolidated balance sheets are reasonable estimates of their fair value.
Investments
Fair value information is not readily available. However, management believes the market value to be in excess of the carrying value of investments.
Long-term debt
The fair value of the Company's long-term debt (including the liability portion of the Convertible Series Preferred Shares and long-term debt due to Magna and its affiliates) is estimated using discounted cash flow analyses based on the Company's current incremental borrowing rates for similar types of arrangements. The fair values are not necessarily indicative of the amounts that the Company may incur in actual market transactions.
The fair value of the Company's long-term debt approximates its carrying value with the following exceptions:
| | As at December 31, 2003
| | As at December 31, 2002
|
|---|
[U.S. dollars in thousands]
| | Carrying Amount
| | Fair Value
| | Carrying Amount
| | Fair Value
|
|---|
| Long-term debt due to Magna and its affiliates [including current portion] | | $ | 141,804 | | $ | 145,469 | | $ | 178,630 | | $ | 183,496 |
| Convertible Series Preferred Shares, held by Magna [liability portion] | | | | | | | | | | | | |
| | Current | | $ | 150,572 | | $ | 152,317 | | $ | 95,639 | | $ | 94,151 |
| | Long-term | | $ | — | | $ | — | | $ | 116,140 | | $ | 121,190 |
| | |
| |
| |
| |
|
- [b]
- Credit Risk
The Company's financial assets that are exposed to credit risk consist primarily of cash and cash equivalents and accounts receivable.
Cash and cash equivalents which consists of short-term investments, including commercial paper, is only invested in governments and corporations with an investment grade credit rating. Credit risk is further reduced by limiting the amount which is invested in any one government or corporation.
The Company, in the normal course of business, is exposed to credit risk from its customers, substantially all of which are in the automotive industry.
The Company is also exposed to credit risk from the potential default by any of its counterparties on its foreign exchange forward contracts. The Company mitigates this credit risk by dealing with counterparties who are major financial institutions and which the Company anticipates will satisfy their obligations under the contracts.
56 Decoma International Inc.
- [c]
- Interest Rate Risk
The following table summarizes the Company' s exposure to interest rate risk as at December 31, 2003:
[U.S. dollars in thousands]
| | Floating rate
| | Fixed interest rate maturing within 5 years
| | Non-interest bearing
| | Total
| |
|---|
| Financial assets: | | | | | | | | | | | | | |
| | Cash and cash equivalents | | $ | 93,545 | | $ | — | | $ | — | | $ | 93,545 | |
| | Accounts receivable | | | — | | | — | | | 395,040 | | | 395,040 | |
| Financial liabilities: | | | | | | | | | | | | | |
| | Bank indebtedness | | | (177,288 | ) | | — | | | — | | | (177,288 | ) |
| | Accounts payable | | | — | | | — | | | (226,114 | ) | | (226,114 | ) |
| | Long-term debt including current portion | | | (10,877 | ) | | (5,173 | ) | | — | | | (16,050 | ) |
| | Long-term debt due to Magna and its affiliates including current portion | | | — | | | (141,804 | ) | | — | | | (141,804 | ) |
| | Convertible Series Preferred Shares held by Magna including current portion | | | — | | | (150,572 | ) | | — | | | (150,572 | ) |
| | |
| |
| |
| |
| |
| | | $ | (94,620 | ) | $ | (297,549 | ) | $ | 168,926 | | $ | (223,243 | ) |
| | |
| |
| |
| |
| |
| Average fixed rate | | | | | | 5.93% | | | | | | | |
| | | | | |
| | | | | | | |
- [d]
- Foreign Exchange Risk
The Company operates in North America and Europe, which gives rise to a risk that its earnings, cash flows and shareholders' equity may be adversely impacted by fluctuations in foreign exchange rates amongst four principal currencies; namely, the U.S. and Canadian dollars, the British Pound and the Euro.
Operating as a global company, Decoma transacts business through operating divisions whose functional currency is the currency of the division's country of residency, except for the Company's operations in Mexico where the functional currency is the U.S. dollar. To protect against the reduction in value of foreign currency cash flows resulting from foreign currency customer and supplier contracts, the Company has instituted a foreign currency cash flow hedging program. The Company hedges portions of its cash flows denominated in foreign currencies with forward contracts.
The Company formally documents all relationships between hedging instruments and hedged items, as well as its risk management objective and strategy for undertaking various hedge transactions. This process includes linking all derivatives to specific assets and liabilities on the consolidated balance sheets or to specific firm commitments or forecasted transactions. The Company also formally assesses, both at the hedge's inception and on an ongoing basis, whether the derivatives that are used in hedging transactions are highly effective in offsetting changes in fair values or cash flows of hedged items.
Any gains and losses on these hedging instruments, including the forward premium or discount on a forward foreign currency contract relating to the period prior to consummation of the foreign currency cash flow, are recognized in the same period as, and as part of, the hedged transaction. The Company does not enter into forward foreign currency contracts for speculative purposes.
At December 31, 2003, the Company had outstanding forward foreign currency contracts to buy (sell) as follows [in thousands, except rates]:
For Euro
| | British Pounds
| | Weighted Average Rate
|
|---|
| 2004 | | (5,833 | ) | 1.4997 |
| 2005 | | (2,644 | ) | 1.4845 |
| | |
| |
|
| | | (8,477 | ) | 1.4950 |
| | |
| |
|
Annual Report 2003 57
For U.S. Dollars
| | Cdn. Dollars
| | Weighted Average Rate
| | Euro
| | Weighted Average Rate
|
|---|
| 2004 | | (36,995 | ) | 0.7345 | | (11,421 | ) | 1.1725 |
| 2005 | | (10,280 | ) | 0.7296 | | — | | — |
| | |
| |
| |
| |
|
| | | (47,275 | ) | 0.7334 | | (11,421 | ) | 1.1725 |
| | |
| |
| |
| |
|
Based on forward foreign exchange rates as at December 31, 2003 for contracts with similar remaining terms to maturity, the unrecognized net losses relating to the Company's forward foreign currency contracts are approximately $1.6 million.
If the Company's forward foreign currency contracts cease to be effective as hedges, for example, if projected net foreign cash outflows decline significantly, previously unrecognized gains or losses pertaining to the portion of the hedging transaction in excess of projected foreign currency denominated cash outflows would be recognized in income at the time this condition was identified.
- [e]
- Electricity Swap Contracts
The Company uses electricity swap contracts to manage the cash flow risk for a portion of its forecasted Ontario electricity purchases over the period to April 2005. Swaps outstanding at December 31, 2003 have an annual notional energy volume of approximately 176,000 megawatt hours ("MWh") under which the Company pays a fixed average price of Cdn. $52.21 per MWh and receives a floating average price per MWh based on the hourly Ontario energy price. The net settlements under the electricity swap contracts are recognized in the same period as, and as part of, the hedged transactions. The Company does not enter into electricity swap contracts for speculative purposes.
The Company's estimate of the fair value of these electricity contracts as at December 31, 2003 is $0.6 million, representing a financial benefit to the Company. In 2002, the Ontario government passed legislation which fixes the electricity price for low volume and designated customers. Although the Company is not directly affected by the legislation, this has disrupted the forward market for Ontario electricity contracts and significantly reduced liquidity. The Company has estimated fair value based on available broker quotes but given the current illiquidity of the market, the fair value is subject to significant measurement uncertainty.
19. FOREIGN EXCHANGE
Selling, general and administrative expenses are net of foreign exchange (losses) income of:
| | Years ended December 31,
|
|---|
[U.S. dollars in thousands]
| | 2003
| | 2002
| | 2001
|
|---|
| Foreign exchange (losses) income | | $ | (7,259 | ) | $ | 494 | | $ | 526 |
| | |
| |
| |
|
20. OTHER INCOME
- [a]
- During 2003, the Company permanently repatriated $75 million from its United States operations. This repatriation gave rise to the recognition of a pro rata amount of the Company's cumulative translation adjustment account. This amount, totalling $1.4 million, has been included in other income and is not subject to tax.
- [b]
- During 2002, the Company completed the divestiture of one of its non-core North American divisions. The division was engaged in the coating of automotive parts. The Company recorded other income of $3.9 million related to this transaction, representing the excess of sale proceeds over the carrying value of the fixed and working capital assets of this division and direct costs related to the transaction. Income taxes includes an expense of $1.0 million related to this transaction.
- [c]
- During 2002, the Company permanently repatriated Euro 10 million from its European operations. This repatriation gave rise to the recognition of a pro rata amount of the Company's cumulative translation adjustment account. This amount, totalling $0.5 million, has been included in other income and is not subject to tax.
- [d]
- On October 16, 2000, Decoma issued $32 million and $58 million of 9.5% unsecured Subordinated Debentures at par, as partial consideration for the October 2000 acquisition of the remaining interest in the Conix group of companies [the "Conix Group"]. The Subordinated Debentures were repaid with cash in June and November of 2001, respectively.
The November 2001 repayment of the $58 million Subordinated Debenture gave rise to a foreign exchange loss. There were no substantial foreign exchange losses on the June 2001 repayment of the $32 million Subordinated Debenture. Decoma funded the repayment of the $58 million Subordinated Debenture in part by $25 million that was permanently repatriated from the Company's United States operations. The $25 million repatriation and $58 million repayment transactions gave rise to the following income statement amounts during 2001:
58 Decoma International Inc.
[U.S. dollars in thousands]
| |
| |
|---|
| Recognition of pro rata amount of cumulative translation adjustment on repatriation presented as other income | | $ | 2,780 | |
| | |
| |
| Income before income taxes and minority interest | | | 2,780 | |
| Income tax recovery | | | — | |
| | |
| |
| Net income | | | 2,780 | |
| Foreign exchange loss on retirement of Subordinated Debenture, net of taxes | | | (1,717 | ) |
| | |
| |
| Net income attributable to Class A Subordinate Voting and Class B Shares | | $ | 1,063 | |
| | |
| |
21. FINANCING CHARGES ON CONVERTIBLE SERIES PREFERRED SHARES HELD BY MAGNA,
CONVERTIBLE DEBENTURES AND SUBORDINATED DEBENTURES
Financing charges on Convertible Series Preferred Shares, Convertible Debentures and Subordinated Debentures, net of taxes, as presented in the consolidated statements of income include the following:
| | Years ended December 31,
| |
|---|
[U.S. dollars in thousands]
| | 2003
| | 2002
| | 2001
| |
|---|
| Dividends declared on Convertible Series Preferred Shares | | $ | (12,177 | ) | $ | (12,098 | ) | $ | (9,836 | ) |
| Reduction of Convertible Series Preferred Shares dividend equity component | | | 7,663 | | | 7,306 | | | 6,353 | |
| Financing charges on Convertible Debentures, net of taxes | | | (3,038 | ) | | — | | | — | |
| Financing charges on Subordinated Debentures, net of taxes | | | — | | | — | | | (2,991 | ) |
| | |
| |
| |
| |
| | | $ | (7,552 | ) | $ | (4,792 | ) | $ | (6,474 | ) |
| | |
| |
| |
| |
22. EARNINGS PER SHARE
| | Years ended December 31,
|
|---|
[U.S. dollars in thousands except per share figures]
| | 2003
| | 2002
| | 2001
|
|---|
| BASIC EARNINGS PER CLASS A SUBORDINATE VOTING AND CLASS B SHARE | | | | | | | | | |
| Net income attributable to Class A Subordinate Voting and Class B Shares | | $ | 64,350 | | $ | 88,233 | | $ | 60,485 |
| | |
| |
| |
|
| Average number of Class A Subordinate Voting and Class B shares outstanding during the year | | | 73,420 | | | 67,800 | | | 60,456 |
| | |
| |
| |
|
| Basic earnings per Class A Subordinate Voting and Class B Share | | $ | 0.88 | | $ | 1.30 | | $ | 1.00 |
| | |
| |
| |
|
DILUTED EARNINGS PER CLASS A SUBORDINATE VOTING AND CLASS B SHARE |
|
|
|
|
|
|
|
|
|
| Net income attributable to Class A Subordinate Voting and Class B Shares | | $ | 64,350 | | $ | 88,233 | | $ | 60,485 |
| Adjustments [net of related tax effects] for: | | | | | | | | | |
| | Amortization of discount on Convertible Series Preferred Shares | | | 8,631 | | | 8,351 | | | 9,276 |
| | Financing charges on Convertible Series Preferred Shares, held by Magna | | | 4,514 | | | 4,792 | | | 3,483 |
| | Financing charges on Convertible Debentures | | | 3,038 | | | — | | | — |
| | |
| |
| |
|
| | | $ | 80,533 | | $ | 101,376 | | $ | 73,244 |
| | |
| |
| |
|
Average number of Class A Subordinate Voting and Class B Shares outstanding during the year |
|
|
73,420 |
|
|
67,800 |
|
|
60,456 |
| Adjustments for: | | | | | | | | | |
| | Class A Subordinate Voting Shares issuable on conversion of Convertible Series Preferred Shares | | | 24,988 | | | 30,047 | | | 30,047 |
| | Class A Subordinate Voting Shares issuable on conversion of Convertible Debentures | | | 5,757 | | | — | | | — |
| | Stock options determined using the treasury stock method | | | 118 | | | 460 | | | 81 |
| | |
| |
| |
|
| | | | 104,283 | | | 98,307 | | | 90,584 |
| | |
| |
| |
|
| Diluted earnings per Class A Subordinate Voting and Class B Share | | $ | 0.77 | | $ | 1.03 | | $ | 0.81 |
| | |
| |
| |
|
Diluted earnings per Class A Subordinate Voting and Class B Share for the year ended December 31, 2003 exclude 1.9 million [2002 — 0.4 million; 2001 — 1.1 million] Class A Subordinate Voting Shares issuable under the Company's Option Plan as such options were not in the money during the year.
Annual Report 2003 59
23. DETAILS OF CASH FROM OPERATING ACTIVITIES
- [a]
- Items not involving current cash flows are as follows:
| | Years ended December 31,
| |
|---|
[U.S. dollars in thousands]
| | 2003
| | 2002
| | 2001
| |
|---|
| Depreciation and amortization | | $ | 89,894 | | $ | 78,284 | | $ | 81,360 | |
| Other asset amortization included in cost of goods sold | | | 3,904 | | | 1,509 | | | 461 | |
| Future income taxes | | | (7,265 | ) | | 1,175 | | | 2,578 | |
| Equity income | | | (1,844 | ) | | (521 | ) | | (15 | ) |
| Minority interest | | | — | | | — | | | 843 | |
| Amortization of discount on Convertible Series Preferred Shares | | | 8,631 | | | 8,351 | | | 9,276 | |
| United Kingdom impairment charge | | | 12,355 | | | — | | | — | |
| Continental Europe paint capacity consolidation charges | | | 4,772 | | | — | | | — | |
| Deferred preproduction expenditures write-off [see note 4] | | | — | | | 8,301 | | | — | |
| Gain on sale of operating division [see note 20] | | | — | | | (3,874 | ) | | — | |
| Currency translation adjustment [see note 20] | | | (1,387 | ) | | (495 | ) | | (2,780 | ) |
| Other | | | 2,535 | | | 2,827 | | | 311 | |
| | |
| |
| |
| |
| | | $ | 111,595 | | $ | 95,557 | | $ | 92,034 | |
| | |
| |
| |
| |
- [b]
- Changes in non-cash working capital are as follows:
| | Years ended December 31,
| |
|---|
[U.S. dollars in thousands]
| | 2003
| | 2002
| | 2001
| |
|---|
| Accounts receivable | | $ | (37,147 | ) | $ | (21,626 | ) | $ | (12,284 | ) |
| Inventories | | | (18,370 | ) | | 36,580 | | | (52,286 | ) |
| Prepaid expenses and other | | | 122 | | | 1,547 | | | 7,885 | |
| Accounts payable and accrued liabilities | | | 20,324 | | | 26,829 | | | 39,461 | |
| Income taxes payable or receivable | | | (16,550 | ) | | 6,681 | | | 16,304 | |
| | |
| |
| |
| |
| | | $ | (51,621 | ) | $ | 50,011 | | $ | (920 | ) |
| | |
| |
| |
| |
24. TRANSACTIONS WITH RELATED PARTIES
Amounts included in the consolidated statements of income with respect to transactions with Magna and its affiliates include:
| | Years ended December 31,
|
|---|
[U.S. dollars in thousands]
| | 2003
| | 2002
| | 2001
|
|---|
| Affiliation and social fees | | $ | 24,541 | | $ | 25,311 | | $ | 27,110 |
| Management and administrative services included in selling, general and administrative expenses | | | 4,236 | | | 3,568 | | | 3,481 |
| Rent | | | 11,811 | | | 8,929 | | | 6,695 |
| Interest | | | 11,325 | | | 10,109 | | | 13,900 |
| Amortization of discount on Convertible Series Preferred Shares | | | 8,631 | | | 8,351 | | | 9,276 |
| Financing charges on Convertible Series Preferred Shares | | | 4,514 | | | 4,792 | | | 3,483 |
| | |
| |
| |
|
| | | $ | 65,058 | | $ | 61,060 | | $ | 63,945 |
| | |
| |
| |
|
| Sales of materials to Magna and Magna subsidiaries | | $ | 32,894 | | $ | 13,086 | | $ | 19,892 |
| | |
| |
| |
|
The Company is party to an affiliation agreement with Magna that provides for the payment by the Company of an affiliation fee.
On June 25, 2002, the Company entered into an agreement with Magna to amend the terms of its existing affiliation agreement. The amended agreement, which became effective August 1, 2002, provides for a term of nine years and five months, expiring on December 31, 2011, and thereafter is renewable on a year to year basis at the parties' option.
The affiliation agreement provides the Company with, amongst other things, certain trademark rights, access to Magna's management and to its operating principles and policies, internal audit services, Tier 1 development assistance, global expansion assistance, vehicle system integration and modular product strategy assistance and sharing of best practices in areas such as new management techniques, employee benefits and programs, marketing and technology development initiatives.
60 Decoma International Inc.
Affiliation fees payable under the amended agreement were reduced to 1% of Decoma's consolidated net sales [as defined in the agreement] from the 1.5% that previously applied. In addition, the amended agreement provides for a fee holiday on 100% of consolidated net sales derived from future business acquisitions in the calendar year of the acquisition and 50% of consolidated net sales derived from future business acquisitions in the first calendar year following the year of acquisition. The amended agreement also provided Decoma with a credit of 0.25% of Decoma's consolidated net sales for the period from January 1, 2002 to July 31, 2002 and a credit equal to 1.5% of 2001 consolidated net sales derived from the 2001 acquisition of Autosystems and 50% of 1.25% of January 1, 2002 to July 31, 2002 consolidated net sales derived from Autosystems.
Decoma's corporate constitution specifies that the Company will allocate a maximum of 2% of its profit before tax to support social and charitable activities. The Company pays 1.5% of its consolidated pretax profits to Magna which in turn allocates such amount to social and other charitable programs on behalf of Magna and its affiliated companies, including Decoma.
In addition to affiliation and social fees payable to Magna, the Company pays Magna a negotiated amount for certain management and administrative services including specialized legal, environmental, immigration, tax, treasury, information systems [including wide area network infrastructure and support services] and employee relations services [including administration of the Decoma EEPPP] and an allocated share of the facility and overhead costs dedicated to providing these services.
Prior to January 1, 2002 certain of the Company's European employees participated in the Magna employee equity and profit participation program [the "Magna EEPPP"]. Costs associated with the Magna EEPPP that have been expensed in these consolidated financial statements were nil for the years ended December 31, 2003 and 2002 [2001 — $1.1 million].
Various land and buildings used in operations are leased from Magna affiliates under operating lease agreements. The operating lease agreements with Magna affiliates are effected on normal commercial terms [see note 10]. Prior to August 29, 2003, these Magna affiliates [collectively "MID"] were subsidiaries of Magna. On August 29, 2003, pursuant to a planned reorganization of Magna, the shares of MID were distributed to the shareholders of Magna. As a result of the distribution, MID became directly controlled by the controlling shareholder of Magna which shareholder indirectly controls Decoma. As a result, MID continues to be a related party of Decoma. Related party rent expense was $7.4 million for the period from January 1, 2003 to August 29, 2003 and $ 4.4 million for the period from August 30, 2003 to December 31, 2003.
Sales to MAS during the year ended December 31, 2003 were $40.3 million [2002 — $48.5 million; 2001 — $54.2 million] and accounts receivable from MAS as at December 31, 2003 were $6.3 million [2002 — $5.0 million].
Included in accounts receivable are trade amounts due from Magna and its affiliates in the amount of $4.5 million at 2003 [2002 — $1.4 million].
Included in accounts payable are trade amounts due to Magna and its affiliates in the amount of $21.1 million at December 31, 2003 [2002 — $24.9 million].
25. SEGMENTED INFORMATION
The Company operates in one industry segment, the automotive exteriors business. As at December 31, 2003, the Company had 27 manufacturing facilities in North America and 14 in Europe. In addition, the Company had 8 product development and engineering centers.
The Company's European divisions operate separately from the Company's North American divisions as a result of differences in customer mix and business environment. The Company's internal financial reports, which are reviewed by executive management including the Company's President and Chief Executive Officer, segment divisional results between North America and Europe. This segmentation recognizes the different geographic business risks faced by the Company's North American and European divisions, including vehicle production volumes in North America and Europe, foreign currency exposure, differences in OEM customer mix, the level of customer outsourcing and the nature of products and systems outsourced.
The accounting policies of each segment are the same as those set out under "Significant Accounting Policies" preceding these consolidated financial statements and intersegment sales and transfers are accounted for at fair market value.
Annual Report 2003 61
- [a]
- The following tables show certain information with respect to segment disclosures:
| | Year ended December 31, 2003
| |
|---|
[U.S. dollars in thousands]
| | North America
| | Europe
| | Corporate
| | Total
| |
|---|
| | Total sales | | $ | 1,616,812 | | $ | 744,497 | | $ | — | | $ | 2,361,309 | |
| | Intersegment sales | | | (2,885 | ) | | (2,594 | ) | | — | | | (5,479 | ) |
| | |
| |
| |
| |
| |
| | Sales to external customers | | $ | 1,613,927 | | $ | 741,903 | | $ | — | | $ | 2,355,830 | |
| | |
| |
| |
| |
| |
| | Depreciation and amortization | | $ | 62,407 | | $ | 27,487 | | $ | — | | $ | 89,894 | |
| | |
| |
| |
| |
| |
| | Other charges [notes 2 and 3] | | $ | — | | $ | 23,785 | | $ | — | | $ | 23,785 | |
| | |
| |
| |
| |
| |
| | Operating income (loss) | | $ | 213,804 | | $ | (46,109 | ) | $ | (16,505 | ) | $ | 151,190 | |
| | |
| |
| |
| |
| |
| | Equity income | | $ | (1,844 | ) | $ | — | | $ | — | | $ | (1,844 | ) |
| | |
| |
| |
| |
| |
| | Interest expense (income), net | | $ | 32,825 | | $ | 17,184 | | $ | (39,316 | ) | $ | 10,693 | |
| | |
| |
| |
| |
| |
| | Amortization of discount on Convertible Series Preferred Shares, held by Magna | | $ | — | | $ | — | | $ | 8,631 | | $ | 8,631 | |
| | |
| |
| |
| |
| |
| | Other income [note 20] | | $ | — | | $ | — | | $ | (1,387 | ) | $ | (1,387 | ) |
| | |
| |
| |
| |
| |
| | Fixed assets, net | | $ | 449,571 | | $ | 230,926 | | $ | — | | $ | 680,497 | |
| | |
| |
| |
| |
| |
| | Fixed asset additions | | $ | 108,884 | | $ | 69,022 | | $ | — | | $ | 177,906 | |
| | |
| |
| |
| |
| |
| | Goodwill, net | | $ | 50,174 | | $ | 20,932 | | $ | — | | $ | 71,106 | |
| | |
| |
| |
| |
| |
|
|
Year ended December 31, 2002
|
|
|---|
[U.S. dollars in thousands]
| | North America
| | Europe
| | Corporate
| | Total
| |
|---|
| | Total sales | | $ | 1,486,975 | | $ | 572,613 | | $ | — | | $ | 2,059,588 | |
| | Intersegment sales | | | (1,588 | ) | | (1,327 | ) | | — | | | (2,915 | ) |
| | |
| |
| |
| |
| |
| | Sales to external customers | | $ | 1,485,387 | | $ | 571,286 | | $ | — | | $ | 2,056,673 | |
| | |
| |
| |
| |
| |
| | Depreciation and amortization | | $ | 55,454 | | $ | 22,830 | | $ | — | | $ | 78,284 | |
| | |
| |
| |
| |
| |
| | Other charges [note 4] | | $ | — | | $ | 8,301 | | $ | — | | $ | 8,301 | |
| | |
| |
| |
| |
| |
| | Operating income (loss) | | $ | 204,431 | | $ | (22,595 | ) | $ | (8,143 | ) | $ | 173,693 | |
| | |
| |
| |
| |
| |
| | Equity income | | $ | (521 | ) | $ | — | | $ | — | | $ | (521 | ) |
| | |
| |
| |
| |
| |
| | Interest expense (income), net | | $ | 27,196 | | $ | 19,826 | | $ | (35,038 | ) | $ | 11,984 | |
| | |
| |
| |
| |
| |
| | Amortization of discount on Convertible Series Preferred Shares, held by Magna | | $ | — | | $ | — | | $ | 8,351 | | $ | 8,351 | |
| | |
| |
| |
| |
| |
| | Other income [note 20] | | $ | (3,874 | ) | $ | — | | $ | (495 | ) | $ | (4,369 | ) |
| | |
| |
| |
| |
| |
| | Fixed assets, net | | $ | 358,675 | | $ | 166,788 | | $ | — | | $ | 525,463 | |
| | |
| |
| |
| |
| |
| | Fixed asset additions | | $ | 54,505 | | $ | 45,435 | | $ | — | | $ | 99,940 | |
| | |
| |
| |
| |
| |
| | Goodwill, net | | $ | 44,728 | | $ | 17,280 | | $ | — | | $ | 62,008 | |
| | |
| |
| |
| |
| |
62 Decoma International Inc. 2003
| | Year ended December 31, 2001
| |
|---|
[U.S. dollars in thousands]
| | North America
| | Europe
| | Corporate
| | Total
| |
|---|
| Total sales | | $ | 1,286,108 | | $ | 534,578 | | $ | — | | $ | 1,820,686 | |
| Intersegment sales | | | (4,501 | ) | | (316 | ) | | — | | | (4,817 | ) |
| | |
| |
| |
| |
| |
| Sales to external customers | | $ | 1,281,607 | | $ | 534,262 | | $ | — | | $ | 1,815,869 | |
| | |
| |
| |
| |
| |
| Depreciation and amortization | | $ | 57,278 | | $ | 24,082 | | $ | — | | $ | 81,360 | |
| | |
| |
| |
| |
| |
| Operating income (loss) | | $ | 146,556 | | $ | 2,404 | | $ | (7,643 | ) | $ | 141,317 | |
| | |
| |
| |
| |
| |
| Equity income | | $ | (15 | ) | $ | — | | $ | — | | $ | (15 | ) |
| | |
| |
| |
| |
| |
| Interest expense (income), net | | $ | 23,652 | | $ | 18,825 | | $ | (23,382 | ) | $ | 19,095 | |
| | |
| |
| |
| |
| |
| Amortization of discount on Convertible | | | | | | | | | | | | | |
| | Series Preferred Shares, held by Magna | | $ | — | | $ | — | | $ | 9,276 | | $ | 9,276 | |
| | |
| |
| |
| |
| |
| Other income [note 20] | | $ | — | | $ | — | | $ | (2,780 | ) | $ | (2,780 | ) |
| | |
| |
| |
| |
| |
| Fixed assets, net | | $ | 356,989 | | $ | 134,785 | | $ | — | | $ | 491,774 | |
| | |
| |
| |
| |
| |
| Fixed asset additions | | $ | 44,670 | | $ | 23,802 | | $ | — | | $ | 68,472 | |
| | |
| |
| |
| |
| |
| Goodwill, net | | $ | 44,298 | | $ | 27,218 | | $ | — | | $ | 71,516 | |
| | |
| |
| |
| |
| |
- [b]
- For the year ended December 31, 2003, sales to the Company's three largest customers amounted to 30%, 25% and 22% [2002 — 31%, 26% and 24%; 2001 — 32%, 22% and 26%] of total sales, respectively.
- [c]
- The following tables show certain information with respect to geographic segmentation:
| | Year ended December 31, 2003
|
|---|
[U.S. dollars in thousands]
| | Canada
| | Europe
| | United States, Mexico, Other
| | Total
|
|---|
| Sales | | $ | 1,020,866 | | $ | 744,497 | | $ | 590,467 | | $ | 2,355,830 |
| | |
| |
| |
| |
|
| Fixed assets, net | | $ | 216,934 | | $ | 230,926 | | $ | 232,637 | | $ | 680,497 |
| | |
| |
| |
| |
|
| Goodwill, net | | $ | 30,552 | | $ | 20,932 | | $ | 19,622 | | $ | 71,106 |
| | |
| |
| |
| |
|
|
|
Year ended December 31, 2002
|
|---|
[U.S. dollars in thousands]
| | Canada
| | Europe
| | United States, Mexico, Other
| | Total
|
|---|
| Sales | | $ | 903,646 | | $ | 572,613 | | $ | 580,414 | | $ | 2,056,673 |
| | |
| |
| |
| |
|
| Fixed assets, net | | $ | 174,103 | | $ | 166,788 | | $ | 184,572 | | $ | 525,463 |
| | |
| |
| |
| |
|
| Goodwill, net | | $ | 25,129 | | $ | 17,280 | | $ | 19,599 | | $ | 62,008 |
| | |
| |
| |
| |
|
|
|
Year ended December 31, 2001
|
|---|
[U.S. dollars in thousands]
| | Canada
| | Europe
| | United States, Mexico, Other
| | Total
|
|---|
| Sales | | $ | 801,872 | | $ | 534,578 | | $ | 479,419 | | $ | 1,815,869 |
| | |
| |
| |
| |
|
| Fixed assets, net | | $ | 171,114 | | $ | 134,785 | | $ | 185,875 | | $ | 491,774 |
| | |
| |
| |
| |
|
| Goodwill, net | | $ | 24,701 | | $ | 27,218 | | $ | 19,597 | | $ | 71,516 |
| | |
| |
| |
| |
|
26. UNITED STATES GAAP
The Company's consolidated financial statements are prepared using Canadian GAAP which conforms with United States GAAP except for the following:
- [a]
- Convertible Debentures
Under United States GAAP, the Convertible Debentures would not have been accounted for as equity as required under Canadian GAAP. Under United States GAAP, the Convertible Debentures would be presented as a liability and the required interest payments would be presented as interest expense in the consolidated statements of income and translation adjustments on the Canadian dollar denominated liability would impact other comprehensive income.
Annual Report 2003 63
- [b]
- Convertible Series Preferred Shares
Under United States GAAP, the Company would not have accounted for the Convertible Series Preferred Shares as part equity and part debt as required under Canadian GAAP. Under United States GAAP, the Convertible Series Preferred Shares would be shown at their face value outside of shareholders' equity and the non-cumulative dividend would be deducted from net income attributable to Class A Subordinate Voting and Class B Shares.
- [c]
- Subordinated Debentures
Under United States GAAP, the Company would not have accounted for the Subordinated Debentures as part equity and part debt as required under Canadian GAAP. Under United States GAAP, the entire face amount of the Subordinated Debentures would be treated as a liability, the required interest payments would be recorded as interest expense and foreign exchange gains and losses on the liability would impact net income.
- [d]
- Goodwill and Deferred Preproduction Expenditures
Under United States GAAP, the Company would have expensed all preproduction costs as incurred. Accordingly, in addition to the deduction of Canadian GAAP deferred preproduction additions and the addback of Canadian GAAP deferred preproduction amortization, the Merplas deferred preproduction expenditures write-off [see note 4] is also added back to arrive at United States GAAP earnings as these expenditures were expensed for United States GAAP in prior years.
The elimination of deferred preproduction costs also results in higher goodwill for United States GAAP purposes related to the Company's October 2000 acquisition of the remaining interest in the Conix Group. The portion of this higher goodwill amount that is related to Merplas, which was part of the Conix Group, has been written off for United States GAAP as part of the Company's initial adoption of the goodwill impairment rules in 2002 [see note 4]. Under United States GAAP, the 2002 goodwill write-off as a result of the Company's initial adoption of the goodwill impairment rules is reported as a cumulative catch-up adjustment for a change in accounting policy.
- [e]
- Derivative Instruments
The Company uses foreign exchange forward contracts to manage foreign exchange risk from its underlying customer contracts. In particular, the Company uses foreign exchange forward contracts for the sole purpose of hedging certain of its future committed U.S. dollar and Euro outflows. Under Canadian GAAP, gains and losses on these contracts are accounted for as a component of the related hedged transaction.
Under United States GAAP, the Company follows Statement of Financial Accounting Standards No. 133 ["Statement 133"], "Accounting for Derivative Instruments and Hedging Activities", as amended, which establishes accounting and reporting standards for derivative instruments, including certain derivative instruments embedded in other contracts, and for hedging activities. Statement 133 requires a company to recognize all of its derivative instruments, whether designated in hedging relationships or not, on the balance sheet at fair value. The accounting for changes in the fair value [i.e., gains or losses] of a derivative instrument depends on whether it has been designated and qualifies as part of a hedging relationship. Statement 133 establishes certain criteria to be met in order to designate a derivative instrument as a hedge and to deem a hedge as effective.
Effective January 1, 2002, the Company implemented a new treasury management system that complies with the documentation requirements for hedge accounting under Statement 133. As a result, for the year ended December 31, 2001 the Company's derivative portfolio was not eligible for hedge accounting despite the fact that management considered its portfolio to be an effective foreign currency risk management tool and an economic hedge of its future committed U.S. dollar and Euro outflows.
The Company has recorded a loss of $0.1 million in the year ended December 31, 2003 related to the Company's derivative portfolio for purposes of reconciling to United States GAAP [2002 — $0.2 million loss; 2001 — $0.4 million loss].
The Company has reviewed its other commercial contracts outstanding as at December 31, 2003, 2002 and 2001 in relation to Statement 133 and has concluded that there are no embedded derivatives as defined in the Statement.
- [f]
- Minimum Pension Liability
Under United States GAAP, in certain periods the Company would have reported an additional minimum liability for employee future benefits since the accumulated benefit obligation for certain pension plans exceeds the projected benefit obligation. The offsetting effect of the additional minimum liability is reported as an adjustment to other comprehensive income.
64 Decoma International Inc. 2003
- [g]
- Reduction in Stated Capital
During 2001, the Company's shareholders approved a special resolution authorizing a reduction in the stated capital of Decoma's Class A Subordinate Voting and Class B Shares which reduction eliminated a deficit. Under United States GAAP, the reduction in stated capital of the Class A Subordinate Voting and Class B Shares to absorb the Company's deficit would not impact the accounting value of Class A Subordinate Voting and Class B Shares and retained earnings.
- [h]
- Revenue Recognition
In December 1999, the United States Securities and Exchange Commission issued Staff Accounting Bulletin No. 101, "Revenue Recognition in Financial Statements" ["SAB 101"].
In the normal course of business, the Company enters into arrangements with its customers to design, engineer, build or subcontract the building of tools, dies, moulds and production equipment and processes [collectively "tooling"]. Under separately priced tooling contracts, such tooling is sold to the customer upon completion but is retained by the Company and used in subsequent related parts production. With the introduction of SAB 101, under United States GAAP, the in-house manufacture of tooling and the subsequent related parts production are regarded as a single arrangement. Previously, the Company recognized revenue from such tooling arrangements separately on completion of the tooling build. Effective August 1, 2000, for purposes of United States GAAP, the Company recognizes sales and related cost of sales for these tooling activities over the estimated life of the subsequent parts production arrangement. There was no impact to retained earnings as a result of the cumulative effect of adopting this new United States GAAP policy effective August 1, 2000.
For the year ended December 31, 2003, revenues and expenses under United States GAAP are lower by $6.5 million [2002 — $6.5 million; 2001 — $5.0 million] and $4.2 million [2002 — $5.1 million; 2001 — $4.2 million], respectively, and net income attributable to Class A Subordinate Voting and Class B Shares was lower by $1.5 million [2002 — $0.9 million; 2001 — $0.5 million].
During the year ended December 31, 2003, the Company recognized $1.8 million in sales [2002 — $4.0 million; 2001 — $5.6 million] and $1.7 million of cost of goods sold [2002 — $3.7 million; 2001 — $5.1 million] that was included in the cumulative effect adjustment as of August 1, 2000.
- [i]
- Reporting Currency
Effective January 1, 2001, the Company adopted the U.S. dollar as its reporting currency. Prior to this change the Canadian dollar had been used as the Company's reporting currency. Under Canadian GAAP, the Company's financial statements for all periods presented through December 31, 2000 were translated from Canadian dollars to U.S. dollars using the exchange rate in effect on January 1, 2001. Under United States GAAP, the financial statements for the periods prior to the change in reporting currency must be translated to U.S. dollars using the current rate method, which method uses specific year end or specific annual average exchange rates as appropriate. As a result, although total shareholders' equity is not impacted, the reported amounts for Class A Subordinate Voting and Class B Shares, retained earnings and accumulated other comprehensive income differ under United States GAAP.
- [j]
- Cumulative Translation Adjustment
As described in note 20, under Canadian GAAP, during 2003, 2002 and 2001 the Company recognized portions of its cumulative translation adjustment in income on the repatriation of certain amounts from its foreign operations. Under United States GAAP, the partial repatriation of a foreign investment does not result in the recognition in income of a portion of the cumulative translation adjustment. Under United States GAAP, the recognition in income of the cumulative translation adjustment occurs only upon the complete, or substantially complete, liquidation of a foreign investment.
- [k]
- Electricity Swap Contracts
As described in note 18 [e], the Company uses electricity swap contracts to manage the cash flow risk from its electricity purchase requirements in Ontario, Canada. Under both Canadian and United States GAAP, these swap contracts are accounted for using hedge accounting and the net swap settlements are recognized in the same period as, and as part of, the hedge transaction. For United States GAAP purposes, the Company also reflects the estimated fair value of the swap contracts on the balance sheet with an offsetting adjustment to other comprehensive income.
- [l]
- Asset Retirement Obligation
Under United States GAAP, Statement of Financial Accounting Standards No. 143, "Accounting for Asset Retirement Obligations" ["Statement 143"], was adopted by the Company January 1, 2003. The standard requires the Company to estimate and accrue for the present value of its obligations to restore leased premises at the end of the lease. At lease inception, the present value of this obligation is recognized as other long-term liabilities with a corresponding amount recognized in fixed assets. The fixed asset amount is amortized, and the liability amount is accreted, over the period from lease inception to the time the Company expects to vacate the premises resulting in both depreciation and interest charges in the consolidated statements of income. The adoption of Statement 143 resulted in the cumulative effect of an accounting change of $0.7 million being charged against income, the recognition of a liability of $2.6 million, the recognition of a fixed asset of $1.7 million and the recognition of a future tax asset of $0.2 million all at January 1, 2003.
Annual Report 2003 65
- [m]
- Consolidated Statements of Income
The following table presents net income under United States GAAP:
| | Years ended December 31,
| |
|---|
[U.S. dollars, in thousands, except per share figures]
| | 2003
| | 2002
| | 2001
| |
|---|
| Net income under Canadian GAAP | | $ | 71,902 | | $ | 93,025 | | $ | 68,676 | |
| Adjustments [net of related tax effects] for: | | | | | | | | | | |
| | Amortization of discount on Convertible Series Preferred Shares | | | 8,631 | | | 8,351 | | | 9,276 | |
| | Interest on Convertible Debentures | | | (2,555 | ) | | — | | | — | |
| | Deferred preproduction expenditures | | | 1,361 | | | 10,221 | | | 1,868 | |
| | Derivative instruments | | | (91 | ) | | (232 | ) | | (392 | ) |
| | Amortization of tooling income | | | (1,550 | ) | | (933 | ) | | (526 | ) |
| | Impact of asset retirement obligations | | | (304 | ) | | — | | | — | |
| | Cumulative translation adjustment | | | (1,387 | ) | | (495 | ) | | (2,780 | ) |
| | Amortization of goodwill | | | — | | | — | | | (181 | ) |
| | Additional interest on Subordinated Debentures | | | — | | | — | | | (2,991 | ) |
| | Foreign exchange loss on Subordinated Debentures | | | — | | | — | | | (2,181 | ) |
| | |
| |
| |
| |
| Net income under United States GAAP before cumulative catch-up adjustments | | | 76,007 | | | 109,937 | | | 70,769 | |
| Cumulative catch-up adjustment for change in accounting policy for asset retirement obligations | | | (720 | ) | | — | | | — | |
| Cumulative catch-up adjustment for change in accounting policy for goodwill | | | — | | | (15,664 | ) | | — | |
| | |
| |
| |
| |
| Net income under United States GAAP | | | 75,287 | | | 94,273 | | | 70,769 | |
| Dividends on Convertible Series Preferred Shares | | | (12,177 | ) | | (12,098 | ) | | (9,836 | ) |
| | |
| |
| |
| |
| Net income attributable to Class A Subordinate Voting and Class B Shares under United States GAAP | | $ | 63,110 | | $ | 82,175 | | $ | 60,933 | |
| | |
| |
| |
| |
| Earnings per Class A Subordinate Voting or Class B Share under United States GAAP | | | | | | | | | | |
| | Basic | | | | | | | | | | |
| | | Before cumulative catch-up adjustment | | $ | 0.87 | | $ | 1.44 | | $ | 1.01 | |
| | | After cumulative catch-up adjustment | | $ | 0.86 | | $ | 1.21 | | $ | 1.01 | |
| | Diluted | | | | | | | | | | |
| | | Before cumulative catch-up adjustment | | $ | 0.75 | | $ | 1.12 | | $ | 0.78 | |
| | | After cumulative catch-up adjustment | | $ | 0.75 | | $ | 0.96 | | $ | 0.78 | |
| | |
| |
| |
| |
- [n]
- Comprehensive Income
The following table presents comprehensive income under United States GAAP:
| | Years ended December 31,
| |
|---|
[U.S. dollars in thousands]
| | 2003
| | 2002
| | 2001
| |
|---|
| Net income attributable to Class A Subordinate Voting and Class B Shares under United States GAAP | | $ | 63,110 | | $ | 82,175 | | $ | 60,933 | |
| Adjustments for: | | | | | | | | | | |
| | Unrealized foreign exchange gains on translation of self-sustaining foreign operations | | | 24,424 | | | 6,568 | | | 5,148 | |
| | Minimum pension liability | | | — | | | 214 | | | (214 | ) |
| | Electricity swap contracts | | | (357 | ) | | 734 | | | — | |
| | Derivative instruments | | | (369 | ) | | 689 | | | (19 | ) |
| | |
| |
| |
| |
| Comprehensive income attributable to Class A Subordinate Voting and Class B Shares under United States GAAP | | $ | 86,808 | | $ | 90,380 | | $ | 65,848 | |
| | |
| |
| |
| |
66 Decoma International Inc.
- [o]
- Consolidated Balance Sheets
The following tables present significant items in the consolidated balance sheets that would have been affected had the consolidated financial statements been prepared under United States GAAP:
| | As at December 31, 2003
| |
|---|
| |
| | Note 26 reference
| |
| |
|---|
[U.S. dollars in thousands]
| | Canadian GAAP
| | (a) (b)
| | (d)
| | (e), (h), (j), (k)
| | (g), (i)
| | (l)
| | United States GAAP
| |
|---|
| Investments | | $ | 20,781 | | — | | — | | — | | — | | (8 | ) | $ | 20,773 | |
| | |
| |
| |
| |
| |
| |
| |
| |
| Fixed assets, net | | $ | 680,497 | | — | | (254 | ) | — | | — | | 1,796 | | $ | 682,039 | |
| | |
| |
| |
| |
| |
| |
| |
| |
| Goodwill, net | | $ | 71,106 | | — | | (1,085 | ) | — | | — | | — | | $ | 70,021 | |
| | |
| |
| |
| |
| |
| |
| |
| |
| Other assets | | $ | 18,390 | | 2,328 | | (372 | ) | — | | — | | — | | $ | 20,346 | |
| | |
| |
| |
| |
| |
| |
| |
| |
| Accounts payable | | $ | (226,114 | ) | — | | — | | (5,543 | ) | — | | — | | $ | (231,657 | ) |
| | |
| |
| |
| |
| |
| |
| |
| |
| Future tax liabilities, net | | $ | (39,658 | ) | — | | 238 | | 2,273 | | — | | 307 | | $ | (36,840 | ) |
| | |
| |
| |
| |
| |
| |
| |
| |
| Convertible Debentures | | $ | — | | (77,519 | ) | — | | — | | — | | — | | $ | (77,519 | ) |
| | |
| |
| |
| |
| |
| |
| |
| |
| Convertible Series Preferred Shares Current | | $ | (150,572 | ) | (4,467 | ) | — | | — | | — | | — | | $ | (155,039 | ) |
| | |
| |
| |
| |
| |
| |
| |
| |
| Other long-term liabilities | | $ | (7,462 | ) | — | | — | | — | | — | | (3,247 | ) | $ | (10,709 | ) |
| | |
| |
| |
| |
| |
| |
| |
| |
| Shareholders' equity | | | | | | | | | | | | | | | | | |
| | Convertible Debentures | | $ | (66,127 | ) | 66,127 | | — | | — | | — | | — | | $ | — | |
| | Convertible Series Preferred Shares | | | (8,826 | ) | 8,826 | | — | | — | | — | | — | | | — | |
| | Class A Subordinate Voting Shares | | | (287,137 | ) | 2,457 | | — | | — | | (16,577 | ) | — | | | (301,257 | ) |
| | Class B Shares | | | (30,594 | ) | — | | — | | — | | (36,145 | ) | | | | (66,739 | ) |
| | Contributed surplus | | | (267 | ) | — | | — | | — | | — | | — | | | (267 | ) |
| | Retained earnings | | | (156,984 | ) | (7,641 | ) | 1,612 | | 8,031 | | 27,607 | | 1,024 | | | (126,351 | ) |
| | Accumulated other comprehensive income | | | (63,702 | ) | 9,890 | | (140 | ) | (4,761 | ) | 25,115 | | 128 | | | (33,470 | ) |
| | |
| |
| |
| |
| |
| |
| |
| |
| | | $ | (613,637 | ) | 79,659 | | 1,472 | | 3,270 | | — | | 1,152 | | $ | (528,084 | ) |
| | |
| |
| |
| |
| |
| |
| |
| |
Annual Report 2003 67
| | As at December 31, 2002
| |
|---|
| |
| | Note 26 reference
| |
| |
|---|
[U.S. dollars in thousands]
| | Canadian GAAP
| | (b)
| | (d)
| | (e), (h), (j), (k)
| | (g), (i)
| | United States GAAP
| |
|---|
| Fixed assets, net | | $ | 525,463 | | — | | (651 | ) | — | | — | | $ | 524,812 | |
| | |
| |
| |
| |
| |
| |
| |
| Goodwill, net | | $ | 62,008 | | — | | (1,085 | ) | — | | — | | $ | 60,923 | |
| | |
| |
| |
| |
| |
| |
| |
| Other assets | | $ | 16,745 | | — | | (2,171 | ) | — | | — | | $ | 14,574 | |
| | |
| |
| |
| |
| |
| |
| |
| Accounts payable | | $ | (187,656 | ) | — | | — | | (1,379 | ) | — | | $ | (189,035 | ) |
| | |
| |
| |
| |
| |
| |
| |
| Future tax liabilities, net | | $ | (42,099 | ) | — | | 1,074 | | 476 | | — | | $ | (40,549 | ) |
| | |
| |
| |
| |
| |
| |
| |
| Convertible Series Preferred Shares | | | | | | | | | | | | | | | |
| | Current | | $ | (95,639 | ) | — | | — | | — | | — | | $ | (95,639 | ) |
| | Long-term | | $ | (116,140 | ) | (11,378 | ) | — | | — | | — | | $ | (127,518 | ) |
| | |
| |
| |
| |
| |
| |
| |
| Other long-term liabilities | | $ | (4,837 | ) | — | | — | | — | | — | | $ | (4,837 | ) |
| | |
| |
| |
| |
| |
| |
| |
| Shareholders' equity | | | | | | | | | | | | | | | |
| | Convertible Series Preferred Shares | | $ | (18,765 | ) | 18,765 | | — | | — | | — | | $ | — | |
| | Class A Subordinate Voting Shares | | | (172,488 | ) | — | | — | | — | | (16,577 | ) | | (189,065 | ) |
| | Class B Shares | | | (30,594 | ) | — | | — | | — | | (36,145 | ) | | (66,739 | ) |
| | Retained earnings | | | (111,450 | ) | (6,191 | ) | 2,973 | | 5,003 | | 27,607 | | | (82,058 | ) |
| | Accumulated other comprehensive income | | | (29,451 | ) | (1,196 | ) | (140 | ) | (4,100 | ) | 25,115 | | | (9,772 | ) |
| | |
| |
| |
| |
| |
| |
| |
| | | $ | (362,748 | ) | 11,378 | | 2,833 | | 903 | | — | | $ | (347,634 | ) |
| | |
| |
| |
| |
| |
| |
| |
- [p]
- Stock-based Compensation
The Company's Canadian GAAP approach to stock-based compensation is consistent with United States GAAP. However, given that net income attributable to Class A Subordinate Voting and Class B Shares before pro forma adjustments for the fair value of stock options granted prior to January 1, 2003 differs between United States and Canadian GAAP, pro forma net income attributable to Class A Subordinate Voting and Class B Shares differs between United States and Canadian GAAP.
For purposes of pro forma disclosures, the Company's net income attributable to Class A Subordinate Voting and Class B Shares, based on the fair value of all stock options at the grant date, would have been:
| | Years ended December 31,
| |
|---|
[U.S. dollars, in thousands except per share figures]
| | 2003
| | 2002
| | 2001
| |
|---|
| Net income attributable to Class A Subordinate Voting and Class B Shares under United States GAAP | | $ | 63,110 | | $ | 82,175 | | $ | 60,933 | |
| Pro forma adjustments for the fair value of stock options granted prior to January 1, 2003 [see note 15] | | | (947 | ) | | (1,019 | ) | | (1,199 | ) |
| | |
| |
| |
| |
| Pro forma net income attributable to Class A Subordinate Voting and Class B Shares under United States GAAP | | $ | 62,163 | | $ | 81,156 | | $ | 59,734 | |
| | |
| |
| |
| |
| Pro forma earnings per Class A Subordinate Voting or Class B Share under United States GAAP | | | | | | | | | | |
| | Basic | | $ | 0.85 | | $ | 1.20 | | $ | 0.99 | |
| | Diluted | | $ | 0.74 | | $ | 0.95 | | $ | 0.77 | |
| | |
| |
| |
| |
68 Decoma International Inc.
- [q]
- Variable Interest Entities
One of the Company's German subsidiaries has entered into an operating lease for a facility constructed at a cost of approximately $12 million. Such facility is owned by a partnership that has been substantially debt financed to fund the construction. The partnership is owned directly and indirectly by a leasing company. The partnership has entered into a lease agreement with the leasing company which in turn has entered into a sublease with the Company's German subsidiary. Such sublease is for an initial term of 19 years with a 5 year renewal option. Although the Company's German subsidiary has options to acquire either the facility under lease or the partnership, the Company's obligations under this arrangement are limited to those in its operating lease agreement.
- [r]
- New Accounting Pronouncements
Under Staff Accounting Bulletin No. 74, the Company is required to disclose certain information relating to new accounting standards which have not yet been adopted due to delayed effective dates.
Canadian GAAP standards:
In 2003, the CICA amended Handbook section 3860, "Financial Instruments — Disclosure and Presentation", to require certain obligations that may be settled with an entity's own equity instruments to be reflected as a liability. The amendments must be adopted in the Company's 2005 consolidated financial statements with retroactive application. Upon adoption, the Convertible Debentures currently presented entirely within equity on the consolidated balance sheet will have to be presented in part as a liability and in part as equity and the related liability carrying costs will be presented as a charge against net income.
In 2003, the CICA issued Emerging Issues Committee Abstract No. 142, "Revenue Arrangements with Multiple Deliverables" ["EIC-142"], which provides guidance on accounting by a vendor for arrangements involving multiple deliverables. It specifically addresses how a vendor determines whether an arrangement involving multiple deliverables contains more than one unit of accounting and also addresses how consideration should be measured and allocated to the separate units of accounting in the arrangement. The guidance in EIC-142 is applicable for revenue arrangements with multiple deliverables entered into by the Company on or after January 1, 2004. Although the Company is currently reviewing EIC-142, the impact of this Abstract, if any, on the Company's consolidated financial statements has not been determined.
In 2003, the CICA issued Handbook section 3110, "Asset Retirement Obligations", which establishes standards for the recognition, measurement and disclosure of asset retirement obligations and the related asset retirement costs. This new section is effective for the Company's 2004 fiscal year and harmonizes Canadian requirements with existing United States GAAP. The adoption of this section on January 1, 2004 is expected to result in the cumulative effect of an accounting change of $1.0 million being recognized as a charge to opening retained earnings, the recognition of a long-term liability of $3.2 million, the recognition of a fixed asset of $1.8 million, the recognition of a future tax asset of $0.3 million and currency translation adjustment debits of $0.1 million.
In 2003, the CICA issued Accounting Guideline AcG-15, "Consolidation of Variable Interest Entities", to provide guidance for applying the principles in Handbook section 1590, "Subsidiaries", to certain entities. Although the CICA is contemplating amendments to the Guideline, it is expected to be effective for the Company's 2005 fiscal year. Although the Company is currently reviewing AcG-15, the impact of the Guideline, if any, on the Company's consolidated financial statements has not been determined.
In 2003, the CICA finalized amendments to Accounting Guideline AcG-13, "Hedging Relationships", that clarified certain of the requirements in AcG-13 and provided additional application guidance. AcG-13 is applicable for the Company's 2004 fiscal year. The Company does not expect the adoption of this Guideline to have a material impact on its consolidated financial statements.
United States GAAP Standards:
In 2003, the Financial Accounting Standards Board ["FASB"] finalized Emerging Issues Task Force Abstract No. 00-21, "Revenue Arrangements with Multiple Deliverables" ["EITF 00-21"]. The guidance in this Abstract is consistent with the guidance in EIC-142, which was recently issued by the CICA. The guidance in EITF 00-21 is applicable for revenue arrangements with multiple deliverables that the Company enters into on or after January 1, 2004.
In 2003, the FASB amended Interpretation No. 46, "Consolidation of Variable Interest Entities" ["FIN 46R"]. FIN 46R requires that a variable interest entity ["VIE"] be consolidated by a company if that company is subject to a majority of the risk of loss from the VIE's activities and/or is entitled to receive a majority of the VIE's residual returns. For the Company, the requirements of FIN 46R apply in 2003 for all VIEs created after January 31, 2003. For VIEs created before January 31, 2003, the requirements of FIN 46R apply as of December 31, 2004 for a VIE that does not meet the definition of a special-purpose entity ["SPE"] and as of January 1, 2004 for a VIE that is an SPE.
Although the Company is currently reviewing EITF 00-21 and FIN 46R (with respect to VIEs created before January 31, 2003), the impact, if any, of these pronouncements on the Company's consolidated financial statements has not been determined.
Annual Report 2003 69
Historical Financial Summary
| | Years ended December 31,
| | Five month period ended December 31, 2000
| | Years ended July 31,
| |
|---|
[U.S. dollars in thousands, except per share figures]
| | ]2003
| | 2002
| | 2001
| | 2000
| | 2000
| | 1999
| | 1998
| |
|---|
| EARNINGS | | | | | | | | | | | | | | | | | | | | | | | | | |
| Sales | | $ | 2,355,830 | | $ | 2,056,673 | | $ | 1,815,869 | | $ | 1,558,536 | | $ | 663,340 | | $ | 1,479,255 | | $ | 1,332,584 | | $ | 1,064,754 | |
| | |
| |
| |
| |
| |
| |
| |
| |
| |
| Other charges | | | 23,785 | | | 8,301 | | | — | | | — | | | — | | | — | | | — | | | — | |
| | |
| |
| |
| |
| |
| |
| |
| |
| |
| Operating income | | | 151,190 | | | 173,693 | | | 141,317 | | | 112,326 | | | 42,315 | | | 109,353 | | | 73,482 | | | 78,460 | |
| | |
| |
| |
| |
| |
| |
| |
| |
| |
| Financing expense (1) | | | 19,324 | | | 20,335 | | | 28,371 | | | 22,275 | | | 9,341 | | | 21,471 | | | 20,201 | | | 15,696 | |
| | |
| |
| |
| |
| |
| |
| |
| |
| |
| Other income | | | (1,387 | ) | | (4,369 | ) | | (2,780 | ) | | — | | | — | | | — | | | — | | | — | |
| | |
| |
| |
| |
| |
| |
| |
| |
| |
| Income before income taxes and minority interest | | | 135,097 | | | 158,248 | | | 115,741 | | | 90,567 | | | 33,174 | | | 88,330 | | | 53,226 | | | 60,154 | |
| | |
| |
| |
| |
| |
| |
| |
| |
| |
| Net income | | | 71,902 | | | 93,025 | | | 68,676 | | | 53,090 | | | 20,073 | | | 49,593 | | | 30,350 | | | 34,354 | |
| | |
| |
| |
| |
| |
| |
| |
| |
| |
| Net income attributable to Class A Subordinate Voting and Class B Shares | | | 64,350 | | | 88,233 | | | 60,485 | | | 50,332 | | | 18,178 | | | 47,834 | | | 28,458 | | | 33,611 | |
| | |
| |
| |
| |
| |
| |
| |
| |
| |
| Earnings per Class A Subordinate Voting and Class B Share | | | | | | | | | | | | | | | | | | | | | | | | | |
| | Basic | | $ | 0.88 | | $ | 1.30 | | $ | 1.00 | | | — | | | — | | | — | | | — | | | — | |
| | Diluted | | $ | 0.77 | | $ | 1.03 | | $ | 0.81 | | | — | | | — | | | — | | | — | | | — | |
| | |
| |
| |
| |
| |
| |
| |
| |
| |
| CASH FLOWS | | | | | | | | | | | | | | | | | | | | | | | | | |
| Cash generated from operating activities before changes in non-cash working capital | | $ | 183,497 | | $ | 188,582 | | $ | 160,710 | | $ | 130,444 | | $ | 49,840 | | $ | 127,651 | | $ | 91,666 | | $ | 90,632 | |
| | |
| |
| |
| |
| |
| |
| |
| |
| |
| Changes in non-cash working capital | | | (51,621 | ) | | 50,011 | | | (920 | ) | | (12,580 | ) | | (48,282 | ) | | (23,553 | ) | | 7,668 | | | (26,646 | ) |
| | |
| |
| |
| |
| |
| |
| |
| |
| |
| Fixed and other asset and investment spending, net | | | (185,508 | ) | | (108,070 | ) | | (73,231 | ) | | (88,566 | ) | | (30,780 | ) | | (83,743 | ) | | (138,594 | ) | | (137,189 | ) |
| | |
| |
| |
| |
| |
| |
| |
| |
| |
| Acquisition spending | | | (19,068 | ) | | (2,584 | ) | | (14,864 | ) | | (43,424 | ) | | (43,424 | ) | | — | | | — | | | (81,491 | ) |
| | |
| |
| |
| |
| |
| |
| |
| |
| |
| Proceeds from disposition of operating division, net | | | — | | | 5,736 | | | — | | | — | | | — | | | — | | | — | | | — | |
| | |
| |
| |
| |
| |
| |
| |
| |
| |
| Convertible Debentures interest payments | | | (3,751 | ) | | — | | | — | | | — | | | — | | | — | | | — | | | — | |
| | |
| |
| |
| |
| |
| |
| |
| |
| |
| Dividends on Convertible Series Preferred Shares | | | (12,177 | ) | | (12,098 | ) | | (11,085 | ) | | (5,000 | ) | | (1,250 | ) | | (4,999 | ) | | (4,999 | ) | | (2,000 | ) |
| | |
| |
| |
| |
| |
| |
| |
| |
| |
| Dividends on Class A Subordinate Voting and Class B Shares | | | (18,816 | ) | | (14,247 | ) | | (12,599 | ) | | (6,610 | ) | | (1,725 | ) | | (6,037 | ) | | (4,599 | ) | | (862 | ) |
| | |
| |
| |
| |
| |
| |
| |
| |
| |
| Cash generated from (used in) financing activities excluding dividends and Convertible Debentures interest payments | | | 107,936 | | | (124,356 | ) | | (3,099 | ) | | 47,602 | | | 83,735 | | | (15,934 | ) | | 30,107 | | | 218,269 | |
| | |
| |
| |
| |
| |
| |
| |
| |
| |
| Increase (decrease) in cash and cash equivalents | | $ | 11,486 | | $ | (12,212 | ) | $ | 44,230 | | $ | 21,088 | | $ | 7,809 | | $ | (7,458 | ) | $ | (19,022 | ) | $ | 62,466 | |
| | |
| |
| |
| |
| |
| |
| |
| |
| |
70 Decoma International Inc.
| | December 31,
| | July 31,
|
|---|
| | 2003
| | 2002
| | 2001
| | 2000
| | 2000
| | 1999
|
|---|
| FINANCIAL POSITION | | | | | | | | | | | | | | | | | | |
| Non-cash working capital (2) | | $ | 262,152 | | $ | 168,052 | | $ | 204,768 | | $ | 194,748 | | $ | 121,291 | | $ | 101,270 |
| | |
| |
| |
| |
| |
| |
|
| Total assets | | | 1,528,699 | | | 1,192,535 | | | 1,169,159 | | | 1,089,850 | | | 834,883 | | | 830,032 |
| | |
| |
| |
| |
| |
| |
|
| Cash and cash equivalents | | | 93,545 | | | 82,059 | | | 94,271 | | | 50,041 | | | 42,232 | | | 49,690 |
| | |
| |
| |
| |
| |
| |
|
| Bank indebtedness | | | 177,288 | | | 55,021 | | | 159,959 | | | 83,695 | | | 13,879 | | | 19,655 |
| | |
| |
| |
| |
| |
| |
|
| Long-term debt (including current portion) (3) | | | 16,050 | | | 16,595 | | | 27,508 | | | 61,103 | | | 28,252 | | | 31,182 |
| | |
| |
| |
| |
| |
| |
|
| Debt due to Magna and its affiliates (including current portion) | | | 141,804 | | | 178,630 | | | 164,532 | | | 254,968 | | | 26,850 | | | 35,595 |
| | |
| |
| |
| |
| |
| |
|
| Convertible Series Preferred Shares, held by Magna (including current portion) | | | 150,572 | | | 211,779 | | | 199,956 | | | 203,101 | | | 95,855 | | | 91,936 |
| | |
| |
| |
| |
| |
| |
|
| Minority interest | | | — | | | — | | | — | | | 6,872 | | | 6,909 | | | 9,423 |
| | |
| |
| |
| |
| |
| |
|
| Shareholders' equity (4) | | $ | 613,637 | | $ | 362,748 | | $ | 297,106 | | $ | 212,152 | | $ | 419,430 | | $ | 404,140 |
| | |
| |
| |
| |
| |
| |
|
- 1.
- Financing expense includes interest expense and amortization of discount on Convertible Series Preferred Shares.
- 2.
- Non-cash working capital excludes cash and cash equivalents, bank indebtedness, current portion of long-term debt, current portion of debt due to Magna and its affiliates and current portion of the liability component of the Convertible Series Preferred Shares.
- 3.
- Long-term debt includes debenture interest obligation.
- 4.
- Shareholders' equity includes the Convertible Debentures and the equity portions of the Subordinated Debentures and Convertible Series Preferred Shares and Magna's net investment in MES and DET prior to the completion of the Global Exteriors Transaction.
Annual Report 2003 71
Decoma's Board of Directors, Officers and Operations Management
BOARD OF DIRECTORS
NEIL G. DAVIS B.A., LL.B.
Partner, Davis Webb Schulze & Moon LLP
Neil G. Davis is a partner with the law firm of Davis Webb Schulze & Moon LLP where he practices in general law with emphasis on municipal, planning and environmental work and expertise in commercial real estate and corporate law. He also serves as Chairman of the Georgian Bay Trust Foundation, a past director of Community Care Access Centre of Peel, past Governor of Sheridan College, past Chair of leadership gifts for YMCA Capital Campaign, past Director of a number of local community charities and social organizations. Mr. Davis is a director of Intier Automotive Inc. and has been a director of Decoma since April 16, 2001.
ROBERT J. FULLER B. Com., LL.B., Q.C.
Senior Partner, Miller Thomson LLP
Robert J. Fuller is a senior partner in the law firm Miller Thomson LLP, a full service law firm with offices in Toronto, Markham, Edmonton, Calgary, Vancouver, Whitehorse and Washington, D.C., and affiliations throughout the world. His practice involves individual and corporate planning from a broad perspective, both domestic and international. He serves on the boards of directors of numerous companies. Mr. Fuller has been a director of Decoma since March 2, 1998.
JENNIFER J. JACKSON
President, Berger Jackson Capital Services, Inc.
Jennifer J. Jackson, is President of Berger Jackson Capital Services, Inc. and a Principal of Berger Jackson Capital Management, LLC and Berger Jackson Capital L.P., general partners for the Berger Jackson group of private investment partnerships, providing investment and financial advice to individual, corporate and institutional clients. She has provided strategic direction and developed strategic relationships for a number of companies. Ms. Jackson has been a director of Decoma since March 2, 1998.
VINCENT J. GALIFI B. Com., C.A.
Executive Vice-President and Chief Financial Officer, Magna International Inc.
Vincent J. Galifi is Executive Vice-President and Chief Financial Officer of Magna International Inc., a leading global supplier of technologically advanced automotive systems, components and complete modules. Mr. Galifi is a director of Intier Automotive Inc. and Tesma International Inc. and was appointed a director of Decoma on February 25, 2004.
FRANK E. MACHER B.S., Mech Eng, M.B.A.
Retired Chairman and Chief Executive Officer, Federal-Mogul Corporation
Frank E. Macher retired as Chairman and Chief Executive Officer of Federal-Mogul Corporation, one of the largest independent suppliers to the world's automakers, in January 2004 and remains a director. He is also a director of Tenneco Automotive Inc. and a member of the Board of Trustees of Kettering University. He has served on the Industry Manufacturing Advisory Council for Stanford University, the MIT Leaders for Manufacturing Council and the Detroit Historical Society. Mr. Macher has been a director of Decoma since January 6, 1999.
JOHN T. MAYBERRY B.A. Psych, LL.D.
Retired Chair of the Board and Chief Executive Officer, Dofasco Inc.
John T. Mayberry retired as Chair of the Board and Chief Executive Officer and a director of Dofasco Inc., in May 2003. He is a director of the Bank of Nova Scotia, MDS Inc., CFM Corporation, Inco Limited and Hatch Consulting. He participates in a number of industry-related associations and is the Chairman and a director of the International Iron and Steel Institute. Mr. Mayberry has been a director of Decoma since March 2, 1998.
ALAN J. POWER B. Eng Mech
President and Chief Executive Officer, Decoma International Inc.
Alan J. Power is President and Chief Executive Officer of Decoma International Inc. He has directed Decoma's global growth since becoming President in 1993, having commenced his career with the Magna group in 1987. In 1999, Mr. Power became a member of Top 40 Under 40 and in 2001 received the "Leader of the Year" award from the Canadian Plastics Industries Association. In September 2002, he was appointed co-chair of the CAPC (Canadian Automotive Partnership Council) Innovation Working Committee. Mr. Power is a member of the Magna Technical Training Centre Advisory Committee and has been a director of Decoma since December 3, 1997.
SIEGFRIED WOLF, Ing.
Executive Vice-Chairman, Magna International Inc.
Siegfried Wolf is Executive Vice-Chairman and a director of Magna International Inc., a leading global supplier of technologically advanced automotive systems, components and complete modules. Mr. Wolf is a director of Tesma International Inc. and Intier Automotive Inc. and has been a director of Decoma since April 2, 2002.
OFFICERS
SIEGFRIED WOLF
Chairman of the Board
ALAN J. POWER
President and Chief Executive Officer
R. DAVID BENSON
Executive Vice-President, Secretary and General Counsel
DOUGLAS M. HARRISON
Executive Vice-President, Planning and Corporate Development
S. RANDALL SMALLBONE
Executive Vice-President, Finance and Chief Financial Officer
GREGORY J. WALTON
Executive Vice-President, Sales and Marketing
GUY R. JONES
Vice-President, Finance
DAVID M. ONGARO
Treasurer
OPERATIONS MANAGEMENT
TERRY L. BALL
President, Exterior Trim
ROBERT A. BROWNLEE
President, Fascia Operations and Managing Director, Decoma Europe
JAMES R. DROUILLARD
Executive Vice-President, Product Development
GREGORY J. WALTON
Executive Vice-President, Systems Integration
W. STEPHEN SLOAN
Vice-President, Information Technology
72 Decoma International Inc.
Investor Information
CANADA
| | TSX — Class A Subordinate Voting Shares
|
|---|
2003 Quarter
|
|---|
| | Volume
| | High
| | Low
| | Close
|
|---|
(Canadian dollars except volume)
| |
|
|---|
| 1st | | 9,384,011 | | 13.85 | | 8.81 | | 10.09 |
| 2nd | | 7,209,897 | | 11.90 | | 9.70 | | 11.59 |
| 3rd | | 4,383,207 | | 14.65 | | 11.55 | | 13.51 |
| 4th | | 4,192,101 | | 14.95 | | 11.98 | | 13.28 |
| | |
| |
| |
| |
|
|
|
TSX — 6.5% Convertible Unsecured Subordinated Debentures (trading commenced March 27, 2003)
|
|---|
2003 Quarter
|
|---|
| | Volume
| | High
| | Low
| | Close
|
|---|
(Canadian dollars except volume)
| |
|
|---|
| 1st | | 117,350 | | 101.00 | | 99.60 | | 100.50 |
| 2nd | | 183,520 | | 109.20 | | 100.50 | | 108.50 |
| 3rd | | 279,060 | | 122.50 | | 108.00 | | 117.00 |
| 4th | | 88,790 | | 125.00 | | 114.00 | | 117.00 |
| | |
| |
| |
| |
|
|
|
TSX — Class A Subordinate Voting Shares
|
|---|
2002 Quarter
|
|---|
| | Volume
| | High
| | Low
| | Close
|
|---|
(Canadian dollars except volume)
| |
|
|---|
| 1st | | 2,022,686 | | 19.10 | | 15.00 | | 16.90 |
| 2nd | | 3,134,823 | | 21.10 | | 15.50 | | 17.00 |
| 3rd | | 2,013,611 | | 17.99 | | 12.55 | | 13.05 |
| 4th | | 5,845,602 | | 15.25 | | 10.56 | | 12.32 |
| | |
| |
| |
| |
|
UNITED STATES
|
|
NASDAQ — Class A Subordinate Voting Shares
|
|---|
2003 Quarter
|
|---|
| | Volume
| | High
| | Low
| | Close
|
|---|
(U.S. dollars except volume)
| |
|
|---|
| 1st | | 474,498 | | 9.00 | | 5.85 | | 6.64 |
| 2nd | | 133,581 | | 8.90 | | 6.71 | | 8.58 |
| 3rd | | 697,928 | | 10.72 | | 8.25 | | 10.11 |
| 4th | | 245,840 | | 11.36 | | 8.80 | | 10.30 |
| | |
| |
| |
| |
|
|
|
NASDAQ — Class A Subordinate Voting Shares
|
|---|
2002 Quarter
|
|---|
| | Volume
| | High
| | Low
| | Close
|
|---|
(U.S. dollars except volume)
| |
|
|---|
| 1st | | 129,303 | | 12.23 | | 9.37 | | 10.58 |
| 2nd | | 391,817 | | 13.85 | | 9.80 | | 11.22 |
| 3rd | | 261,805 | | 11.74 | | 7.86 | | 8.26 |
| 4th | | 544,014 | | 9.80 | | 6.63 | | 7.86 |
| | |
| |
| |
| |
|
Transfer Agents & Registrars
CANADA
Class A Subordinate Voting Shares
Computershare Trust Company of Canada, Toronto, Canada
6.5% Convertible Unsecured Subordinated Debentures
Computershare Trust Company of Canada, Toronto, Canada
UNITED STATES
Class A Subordinate Voting Shares
Computershare Trust Company, Inc., Golden, Colorado, U.S.A.
Stock Listings
Class A Subordinate Voting Shares
Toronto Stock Exchange — DEC. A
NASDAQ National Market — DECA
6.5% Convertible Unsecured Subordinated Debentures
Toronto Stock Exchange — DEC. DB
Auditors
Ernst & Young LLP
Toronto, Canada
Principal Bankers
Royal Bank of Canada
Citibank Canada
Toronto, Canada
Investor Information
Shareholders seeking assistance or information about the Company are requested to contact:
S. Randall Smallbone
Executive Vice-President,
Finance and Chief Financial Officer
50 Casmir Court,
Concord Ontario,
Canada L4K 4J5
Telephone: (905) 669-2888
Fax: (905) 669-5075
Annual Meeting
Monday, May 3, 2004
at 3:00 p.m.
The Design Exchange
Toronto Dominion Centre
Ernst & Young Tower
234 Bay Street, 2nd Floor
Toronto, Ontario, Canada

|
|
|
|
|
|
|
|
|
|
|
|
|
|
|
www.decoma.com |
|
|
| | | DECOMA INTERNATIONAL INC.
Casmir Court, Concord, Ontario
Canada L4K 4J5
Tel: 905-669-2888 Fax: 905-669-5075
|
QuickLinks
FINANCIAL HIGHLIGHTSDECOMA'S GLOBAL FACILITIESDECOMA'S PRODUCT RANGEDECOMA'S TOP FIVE PLATFORMSMANAGEMENT'S DISCUSSION AND ANALYSIS OF RESULTS OF OPERATIONS AND FINANCIAL POSITIONMANAGEMENT'S RESPONSIBILITY FOR FINANCIAL REPORTING AND AUDITORS' REPORTCONSOLIDATED BALANCE SHEETSCONSOLIDATED STATEMENTS OF INCOME AND RETAINED EARNINGSCONSOLIDATED STATEMENTS OF CASH FLOWSNOTES TO CONSOLIDATED FINANCIAL STATEMENTS December 31, 2003