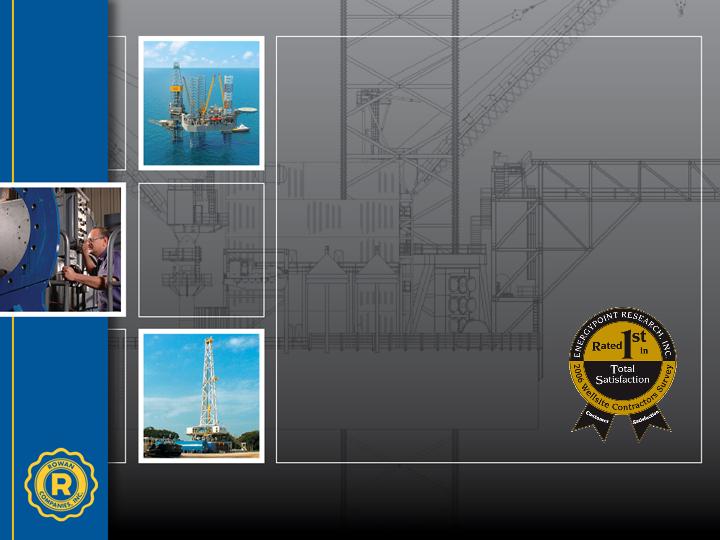
Rowan Companies, Inc.
D.F. McNease
Chairman & CEO
September 2006
Lehman Brothers Energy / Power Conference

This report contains forward looking statements within the meaning of the Private Securities Litigation Reform Act of 1995, including, without limitation, statements as to the expectations, beliefs and future expected financial performance of the Company that are based on current expectations and are subject to certain risks, trends and uncertainties that could cause actual results to differ materially from those projected by the Company. Among the factors that could cause actual results to differ materially are the following: oil, natural gas and other commodity prices; the level of offshore expenditures by energy companies; energy demand; the general economy, including inflation; weather conditions in the Company’s principal operating areas; and environmental and other laws and regulations. Other relevant factors have been disclosed in the Company’s filings with the U. S. Securities and Exchange Commission.
Forward Looking Statements

Rowan Companies, Inc. Revenues
Drilling
73%
Manufacturing
27%
Drilling
70%
Manufacturing
30%
2005
2006 Estimate

LeTourneau, Inc. Revenues and Backlog
YTD YTD
6/30/06 6/30/05
($ in millions)
External revenues $185.5 $124.0
Margin* (% of revenues) $39.0 (21%) $15.6 (13%)
Operating income** (% of revenues) 24.3 (13%) 0.9 (1%)
External backlog $566.5 $251.9
Internal volume to Rowan 117.7 45.6
* Equals external revenues less direct cost of sales
** Equals margin less SG&A, Engineering and R&D, which are allocated among groups after the margin line but before operating income, plus gain (loss) on sale of fixed assets

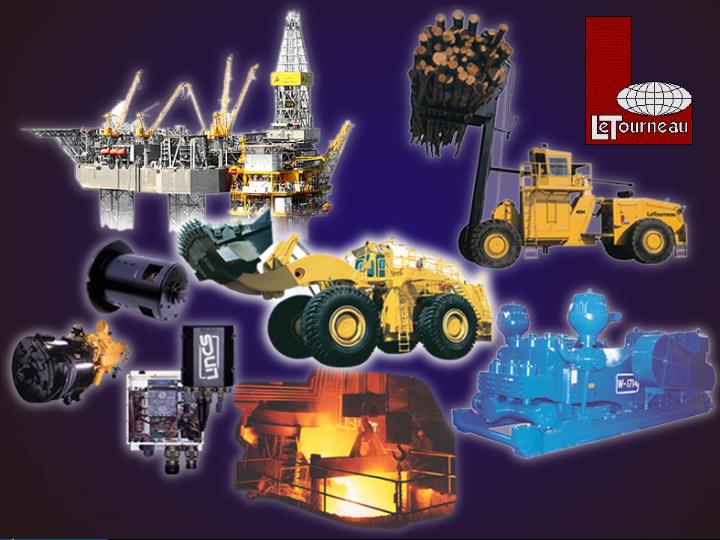
LeTourneau, Inc. - Longview
OEM - Houston
LeTourneau, Inc. - Vicksburg
Manufacturing Facilities
LEWCO - Houston
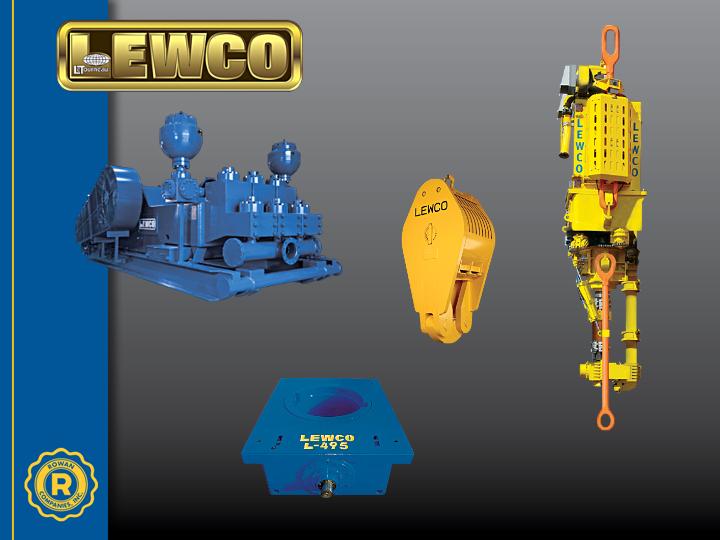
AC DirectDrive Top Drive
3,000 HP Mud Pump
Rotary Table
Traveling Block
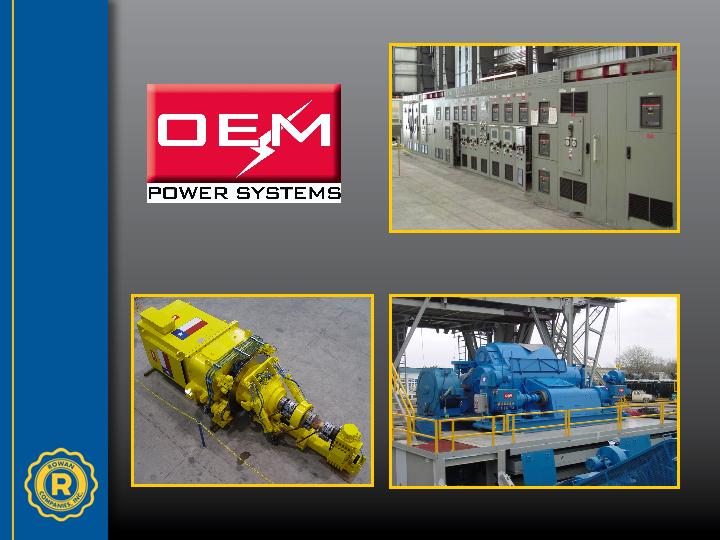
AC Traction Motors
Motor Drives and Controls

Rowan’s Offshore Fleet – 20 Total Jack-ups
Gorilla Class
3 Rigs 15%
300-350’
116-C
7 Rigs
35%
35%
350’
Slot
2 Rigs
10%
10%
Slot
2 Rigs
10%
10%
TARZAN
CLASS
2 Rigs
10%
Super Gorilla
Class
4 Rigs
20%
4 Rigs
20%
The Hank Boswell, Rowan’s 3rd TARZAN Class jack-up, will be christened into service on September 23, 2006. Three additional rigs are under construction / on order
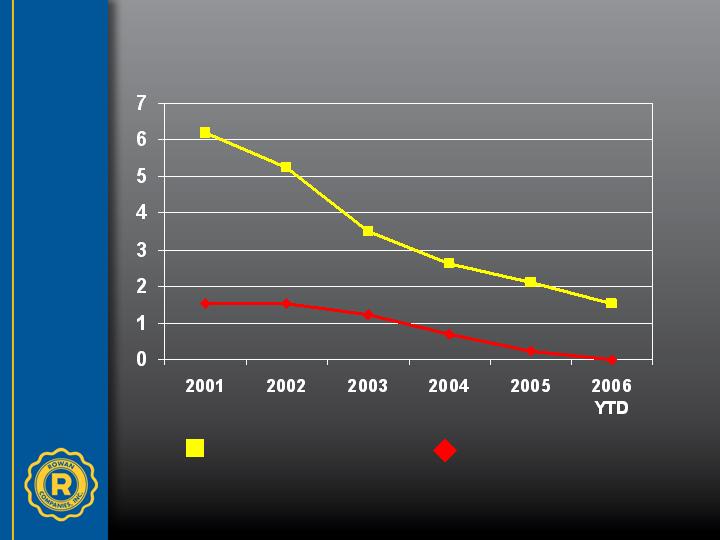
Rowan’s Safety Statistics: Offshore and Land Drilling
TRIR Rate
LTI Rate
Rowan accident rate based on 200,000 man-hours

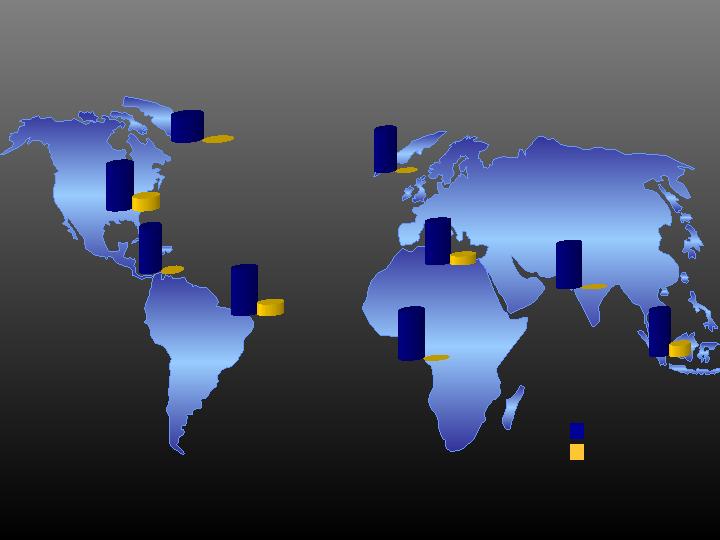
Rowan’s Worldwide Offshore Fleet
Eastern
Canada
1 Rig
5%
Middle East
4 Rigs
20%
20%
North Sea
2 Rigs
10%
Current average day rate worldwide: $150,000
Current average day rate U.S. Gulf of Mexico: $155,000
U.S. Gulf
Mexico
9 Rigs
43%
of9 Rigs
43%
8 Rigs
38%
Middle East38%
U.S. Gulf of
Mexico
13 Rigs
65%
65%
North Sea
Trinidad
3 Rigs
14%
14%
1 Rig
5%
August 2006
1st Quarter 2007
(Number of rigs per area)

Eastern
Canada
15%
15%
Middle East
5%
North Sea
31%
U.S. Gulf of
Mexico
32%
32%
Middle East
24%
U.S. Gulf of
Mexico
49%
49%
North Sea
42%
Trinidad
2%August 2006
1st Quarter 2007
Rowan’s Worldwide Offshore Fleet
(Net Book Value per area)

Rowan’s Offshore Drilling NBV by Class
Gorilla /
Super Gorilla
63%
63%
TARZAN
Class
26%
300’-350’
Cantilever
7%
7%
250’, 30
Slot 4%
0’-350’21 Total Jack-up Rigs
(includes Hank Boswell)

Rowan Companies, Inc. - ROI Analysis
4 year income – after taxes (35%) $203 million
Estimated ROI – after taxes 20%
4 year cash flow – after taxes $241 million
Saudi Aramco Contract: 2 TARZAN Rigs - 4 year period

Rowan’s CAPEX vs. Cash Flow
For the 18 months ended 6/30/2006
(In millions)
Cash Flow $480
Capital Expenditures:
Drilling ($445)
Manufacturing ($46)
Total CAPEX ($491)
CAPEX exceeds Cash Flow by ($11)
*Cash Flow is Rowan's actual increase in cash, excluding additions to PP&E
Rig 54
20 Land rigs currently
operating in
Texas, Louisiana & Oklahoma
17 out of the 20 rigs are
on term contracts
Current average day rate:
$23,400
9 Newbuilds are under construction
8 of the 9 rigs are contracted for
terms of 2-3 years with day rates
ranging from $21,000 - $27,500
ranging from $21,000 - $27,500
Rowan’s Land Fleet
E. Canada: 100%
C & S
America: 82%
US GOM: 80%
Mexico: 100%
West Africa: 100%
North Sea: 100%
Middle East: 98%
SE Asia: 97%
Contracted
Not Contracted
80
2
0
26
3
32
25
0
79
2
33
1
20
14
0
Current Worldwide Jack-up Supply / Demand
Worldwide Utilization: 92%
Includes data supplied by ODS-Petrodata, Inc; Copyright 2006
0
Indian Ocean: 100%
28
0

Worldwide: Jack-up Supply Deficits
Southeast Asia 4 - 5 rigs
India 2 - 3 rigs
West Africa 2 - 3 rigs
Mexico 3 rigs
U.S. GOM We believe the U.S. GOM jack-up deficit
will return after hurricane season
Middle East 4 - 5 rigs
North Sea 2 - 3 rigs
Trinidad 1 rig
Total Rig Deficit 18 - 23 Jack-ups

Worldwide Jack-up Tenders
Middle East
Maersk 1 rig Currently Tendering
3 rigs September
Saudi Aramco 1 - 2 116C Currently Tendering
2 Deep Gas rigs Awarded (Rowan)
4 rigs November 2006
RasGas 1 rig Currently Tendering
2 rigs October 2006
National Drilling 2 rigs Currently Tendering
3 rigs 2008
Oxy 1-2 rigs Currently Tendering
Mexico
PEMEX 2 300’IC Currently Tendering
1 250’IC Currently Tendering
India
ONGC 5 rigs Currently Tendering
GSPC 1 rig Currently Tendering
West Africa
ExxonMobil 3 - 4 rig deficit
Chevron Texaco 1 - 2 rigs Currently Tendering
Cabinda Gulf 1 rig Currently Tendering
Trinidad
Petro-Canada 1 rig Awarded (Rowan)
British Gas 1 rig 1st Quarter 2007
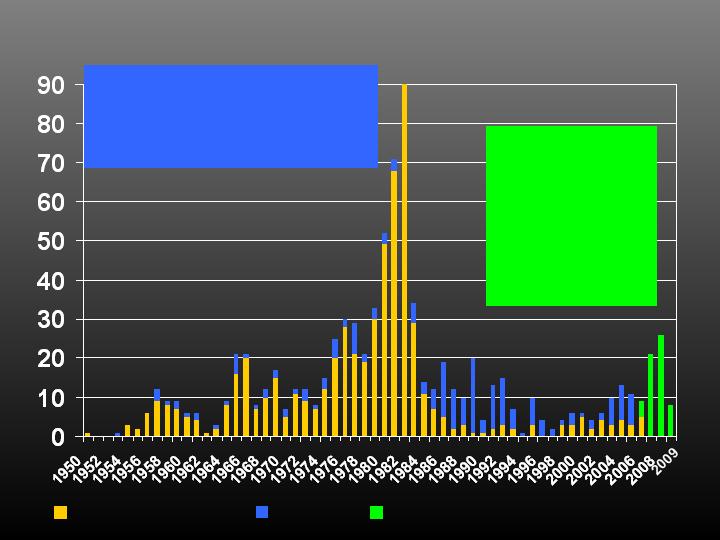
Worldwide Jack-up Newbuilds and Attrition 1950-2009
Additions to the Fleet
Attrition
Average Age of Retired Rigs: 20 yrs.
87% of the fleet is 20 years & older
Average Number of Retired Rigs
per year: 6 Rigs
Scheduled Construction / On Order
59 rigs under construction
2006 - 4
2007 – 21
2008 - 26
2009 - 8
Includes data supplied by ODS-Petrodata, Inc; Copyright 2006

350’ IC
14 Rigs
10%
300’ IC
24 Rigs
17%
250’ IC
22 Rigs
15%
<250’ IC
7 Rigs
5%
200’-250’ MS
19 Rigs
13%
200’-250’ MC
23 Rigs
16%
<200’ MC
14 Rigs
10%
IS
8 Rigs
6%
>350’ IC
12 Rigs
8%
2001
2006
143 Jack-ups
100 Jack-ups
350’ IC
10 Rigs
10%
300’ IC
11 Rigs
11%
250’ IC
13 Rigs
13%
<250’ IC
5 Rigs
5%
200’-250’ MS
18 Rigs
18%
200’-250’ MC
15 Rigs
15%
<200’ MC
15 Rigs
15%
IS
5 Rigs
5%
>350’ IC
8 Rigs
8%
U.S. Gulf of Mexico Jack-up Market
Loss of:
33 Independent Cantilevers
(21 of those are 300'+)
3 Independent Slots
7 Mat Cantilevers
September 2006 100
Contracted Migration - 15
1Q 2007 85
(assuming no other rigs migrate)
Cold Stacked Rigs - 8
77
Gulf of Mexico Jack-ups
Rig Count Timeline
1st Quarter 2007 Active Jack-up Fleet – 77 Rigs
Pre-Storm Jack-up Demand (Summer 2005) – 92 Rigs
15 Jack-up Rig Deficit
Includes data supplied by ODS-Petrodata, Inc; Copyright 2006

Gulf of Mexico Jack-ups
Migration Factors
We believe migration will continue due to:
•
Global rig demand
•
International supply deficits
•
Longer-term contracts abroad
•
Higher day rates internationally
Unless U.S. E&P companies begin to offer the same incentives domestically, the U.S. Gulf of Mexico could see an additional departure of 11-15 rigs by December 2007

•
Mexico – 2-3 rigs (250’IC/300’IC)
•
West Africa – 2 rigs (350’IC)
•
North Sea – 2 rigs (350’+IC)
•
Middle East – 3-5 rigs (300’IC/350’IC)
•
India –
2-3 rigs (300’IC)
| • | Considering a pre-storm demand of 92 rigs, there could be a 26 rig deficit in the US GOM |
•
Total Projected Migration – 11-15 rigs
•
There are still 8 cold stacked jack-up rigs further decreasing the active fleet to 66
December 2007
U.S Gulf of Mexico
Projected Rig Make-up
74 Total Jack-ups
Projected Rig Make-up
74 Total Jack-ups
(66 Total Active Jack-ups)
December 2007
U.S Gulf of Mexico
Projected Rig Make-up
74 Total Jack-ups
Projected Rig Make-up
74 Total Jack-ups
(66 Total Active Jack-ups)
Gulf of Mexico Jack-ups
Projected Rig Make-up
December 2007
December 2007
350’ IC
5 Rigs
7%
300’ IC
0 Rigs
250’ IC
9 Rigs
12%
<250’ IC
5 Rigs
7%
200’-250’ MS
16 Rigs
22%
200’-250’ MC
15 Rigs
20%
<200’ MC
15 Rigs
20%
IS
5 Rigs
7%
>350’ IC
4 Rigs
5%
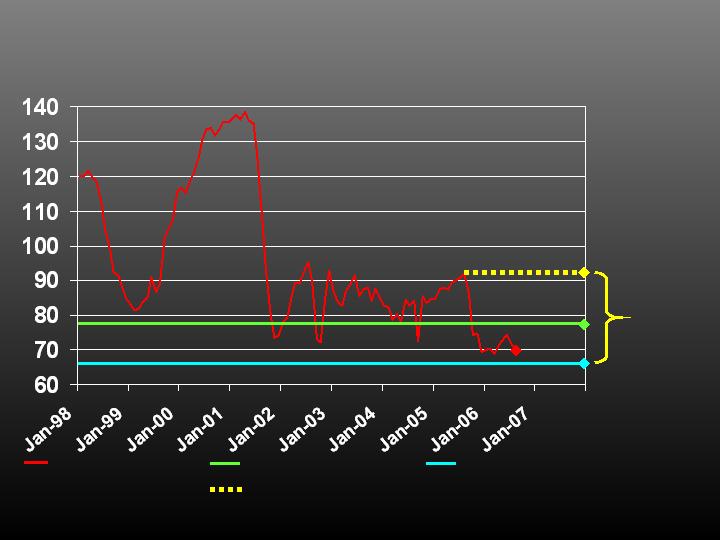
Gulf of Mexico Jack-up Market
Historical Demand
Current Active Supply
Projected Post-Migration Supply
Pre-Storm Demand
26 Rig
Deficit
Includes data supplied by ODS-Petrodata, Inc; Copyright 2006
The projected post-migration supply could
descend below historical trough cycle demand
Current Active Supply
Projected Post-Migration Supply
Rowan Companies, Inc.