UNITED STATES
SECURITIES AND EXCHANGE COMMISSION
Washington, D.C. 20549
FORM 8-K
CURRENT REPORT
Pursuant to Section 13 or 15(d) of the Securities Exchange Act of 1934
Date of Report (Date of earliest event reported): January 21, 2025
GREAT SOUTHERN BANCORP, INC.
(Exact name of registrant as specified in its charter)
| Maryland | | 0-18082 | | 43-1524856 |
| (State or other jurisdiction of incorporation) | | (Commission File Number) | | (IRS Employer Identification No.) |
| 1451 East Battlefield, Springfield, Missouri | | | | 65804 |
| (Address of principal executive offices) | | | | (Zip Code) |
Registrant's telephone number, including area code: (417) 887-4400
Not Applicable
(Former name or former address, if changed since last report)
Check the appropriate box below if the Form 8-K filing is intended to simultaneously satisfy the filing obligation of the registrant under any of the following provisions:
| ☐ | Written communications pursuant to Rule 425 under the Securities Act (17 CFR 230.425) |
| | |
| ☐ | Soliciting material pursuant to Rule 14a-12 under the Exchange Act (17 CFR 240.14a-12) |
| | |
| ☐ | Pre-commencement communications pursuant to Rule 14d-2(b) under the Exchange Act (17 CFR 240.14d-2(b)) |
| | |
| ☐ | Pre-commencement communications pursuant to Rule 13e-4(c) under the Exchange Act (17 CFR 240.13e-4(c)) |
Securities registered pursuant to Section 12(b) of the Act:
| Title of each class | Trading Symbol(s) | Name of each exchange on which registered |
| Common Stock, par value $0.01 per share | GSBC | The NASDAQ Stock Market LLC |
Indicate by check mark whether the registrant is an emerging growth company as defined in Rule 405 of the Securities Act of 1933 (§230.405 of this chapter) or Rule 12b-2 of the Securities Exchange Act of 1934 (§240.12b-2 of this chapter).
Emerging growth company ☐
If an emerging growth company, indicate by check mark if the registrant has elected not to use the extended transition period for complying with any new or revised financial accounting standards provided pursuant to Section 13(a) of the Exchange Act. ☐
Item 7.01 Regulation FD Disclosure.
Set forth below is presentation material of Great Southern Bancorp, Inc., the holding company for Great Southern Bank.
December 31, 2024 1
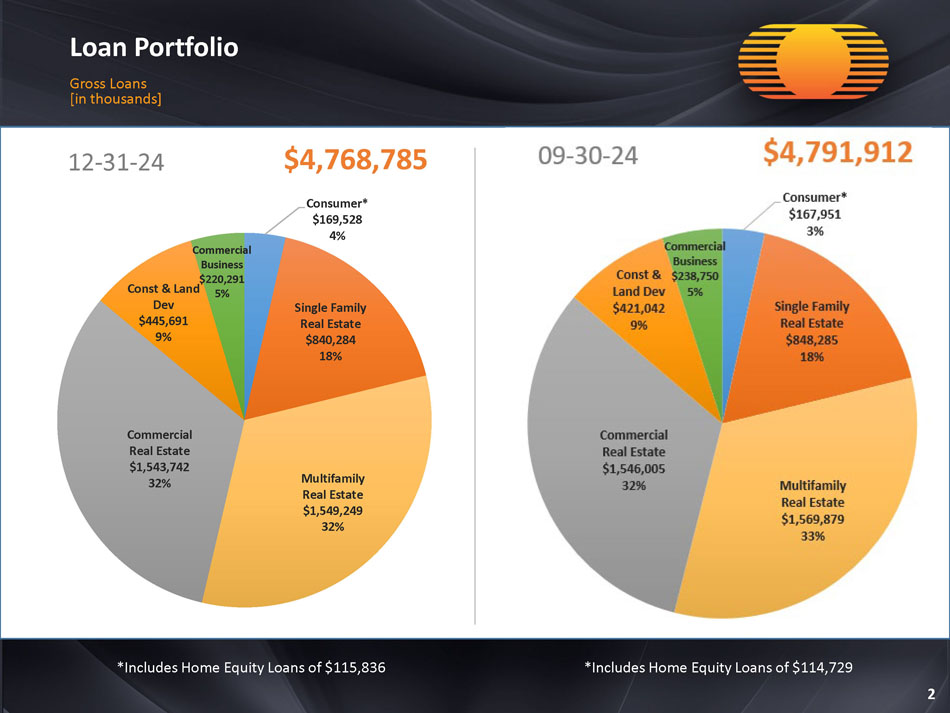
Loan Portfolio Gross Loans [in thousands] *Includes Home Equity Loans of $115,836 2 *Includes Home Equity Loans of $114,729 12 - 31 - 24 $4,768,785 Consumer* $169,528 4% Single Family Real Estate $840,284 18% Multifamily Real Estate $1,549,249 32% Commercial Real Estate $1,543,742 32% Const & Land Dev $445,691 9% Commercial Business $220,291 5%

Loan Portfolio by Region Gross Loans [in thousands] 3 Kansas City $224,649 5% St. Louis $781,370 17% Springfield $372,009 8% Missouri - Other $248,953 5% Iowa/Nebraska /South Dakota $355,252 8% Minnesota $354,705 8% Oklahoma $155,759 3% Denver $160,264 3% Colorado - Other $174,314 3% Georgia $142,065 3% Chicago $158,596 3% Dallas $240,752 5% Texas - Other $345,691 7% Phoenix $137,933 3% Florida $156,337 3% Midwest Region $247,175 5% Southern Region $400,529 9% Other Region $112,432 2% 12 - 31 - 24 $4,768,785
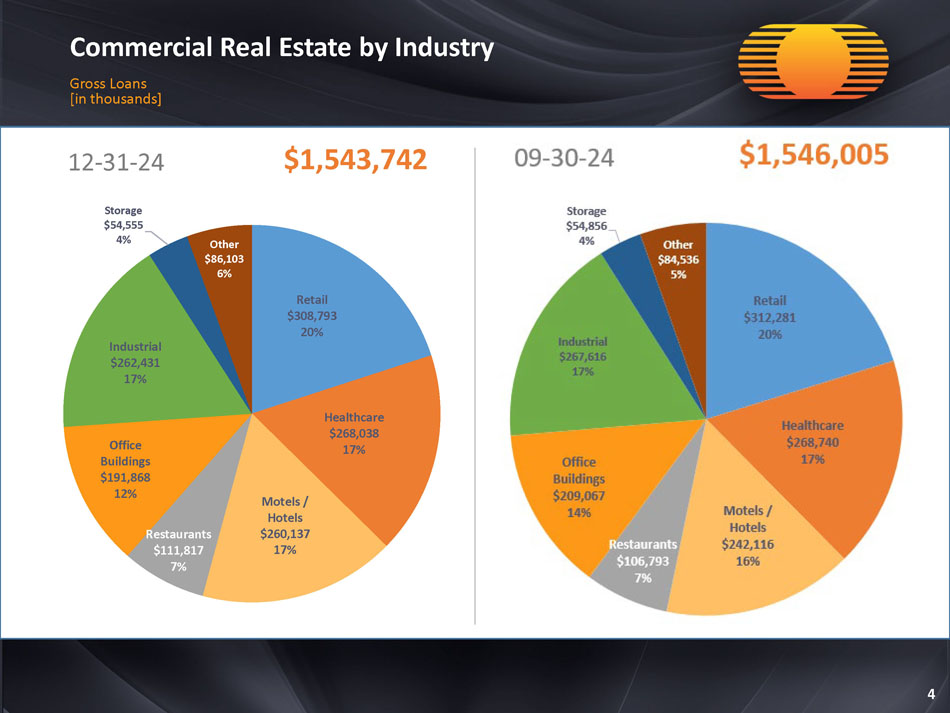
Commercial Real Estate by Industry Gross Loans [in thousands] 4 Retail $308,793 20% Healthcare $268,038 17% Motels / Hotels $260,137 17% Restaurants $111,817 7% Office Buildings $191,868 12% Industrial $262,431 17% Storage $54,555 4% Other $86,103 6% 12 - 31 - 24 $1,543,742

Commercial Real Estate by Region Gross Loans [in thousands] 5 Kansas City $114,521 8% St. Louis $266,314 17% Springfield $97,678 6% Missouri - Other $111,506 7% Iowa/Nebraska/ South Dakota $103,239 7% Minnesota $97,393 6% Chicago $144,353 9% Texas $110,810 7% Midwest Region $148,659 10% Southern Region $227,955 15% Other Region $121,314 8% 12 - 31 - 24 $1,543,742
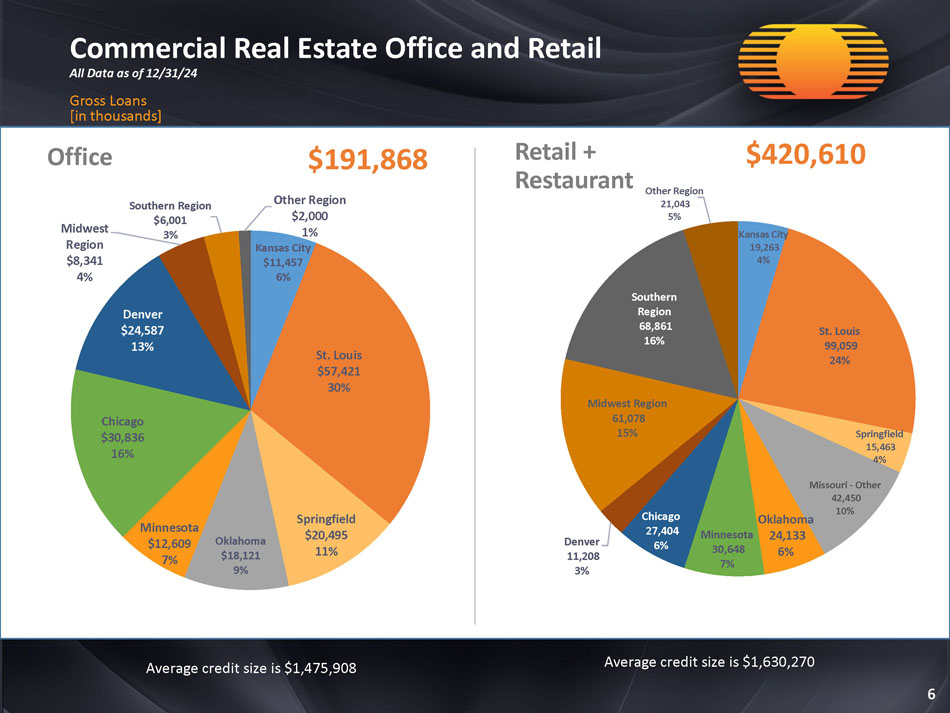
Commercial Real Estate Office and Retail All Data as of 12/31/24 Gross Loans [in thousands] 6 Kansas City $11,457 6% St. Louis $57,421 30% Springfield $20,495 11% Oklahoma $18,121 9% Minnesota $12,609 7% Chicago $30,836 16% Denver $24,587 13% Midwest Region $8,341 4% Southern Region $6,001 3% Other Region $2,000 1% Kansas City 19,263 4% St. Louis 99,059 24% Springfield 15,463 4% Missouri - Other 42,450 10% Oklahoma 24,133 6% Minnesota 30,648 7% Chicago 27,404 6% Denver 11,208 3% Midwest Region 61,078 15% Southern Region 68,861 16% Other Region 21,043 5% Office $191,868 Retail + Restaurant $420,610 Average credit size is $1,475,908 Average credit size is $1,630,270

Commercial Real Estate Office and Retail All Data as of 12/31/24 Gross Loans [in thousands] 7 Office - $191,868 Retail + Restaurant - $420,610 Traditional Medical $157,006 $34,862 Outstanding Balance 109 20 # of Loans $1,440 $1,660 Avg. Loan Size 64% Weighted Avg. LTV 99% of Office Portfolio – Pass Rated Restaurants Neighborhood & Shopping Center Mixed - Use Single Tenant Strip Center $111,817 $70,531 $20,527 $93,803 $117,595 Outstanding Balance 90 14 12 80 55 # of Loans $1,215 $5,038 $1,711 $1,173 $1,993 Avg. Loan Size 58% 52% 60% 54% 57% Weighted Avg. LTV 100% of Retail Portfolio – Pass Rated $19,381 Owner Occupied 51 # of Loans $380 Avg. Loan Size 47% Weighted Avg. LTV Other Office Sq. Ft. $85,740 >100,000 $24,135 20,000 - 100,000 $27,749 <20,000 58 # of Loans $2,373 Avg. Loan Size 44% Weighted Avg. LTV
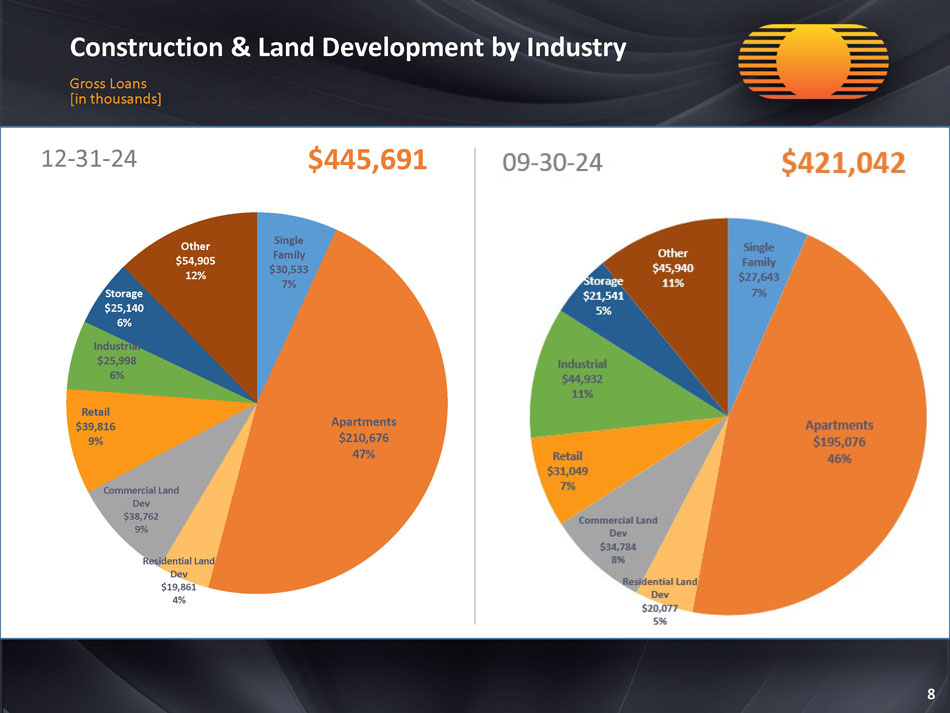
Construction & Land Development by Industry Gross Loans [in thousands] 8 Single Family $30,533 7% Apartments $210,676 47% Residential Land Dev $19,861 4% Commercial Land Dev $38,762 9% Retail $39,816 9% Industrial $25,998 6% Storage $25,140 6% Other $54,905 12% 12 - 31 - 24 $445,691
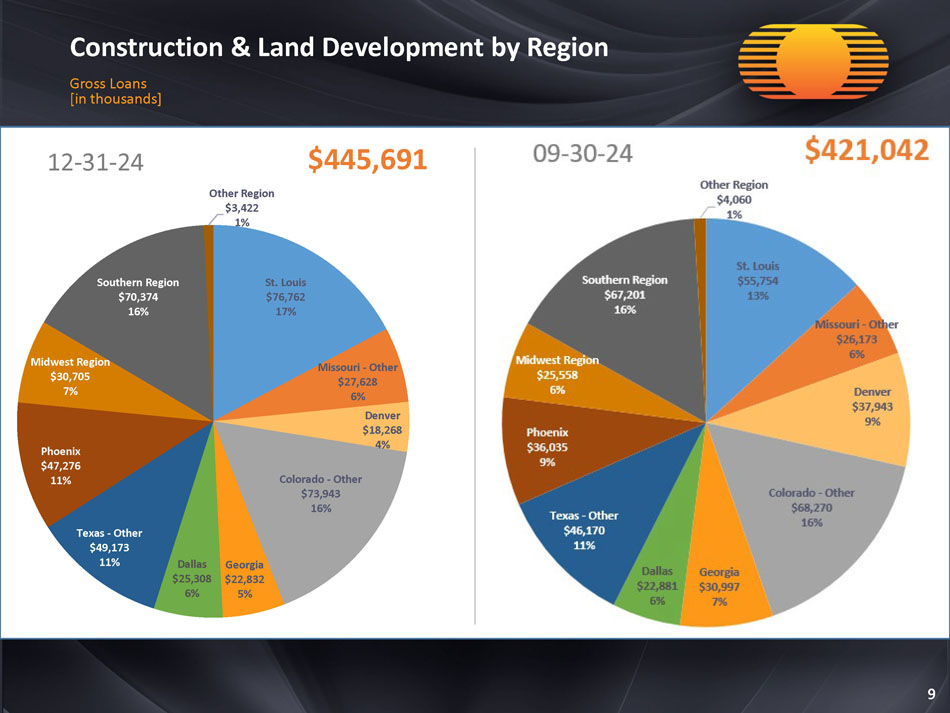
Construction & Land Development by Region Gross Loans [in thousands] 9 St. Louis $76,762 17% Missouri - Other $27,628 6% Denver $18,268 4% Colorado - Other $73,943 16% Georgia $22,832 5% Dallas $25,308 6% Texas - Other $49,173 11% Phoenix $47,276 11% Midwest Region $30,705 7% Southern Region $70,374 16% Other Region $3,422 1% 12 - 31 - 24 $445,691
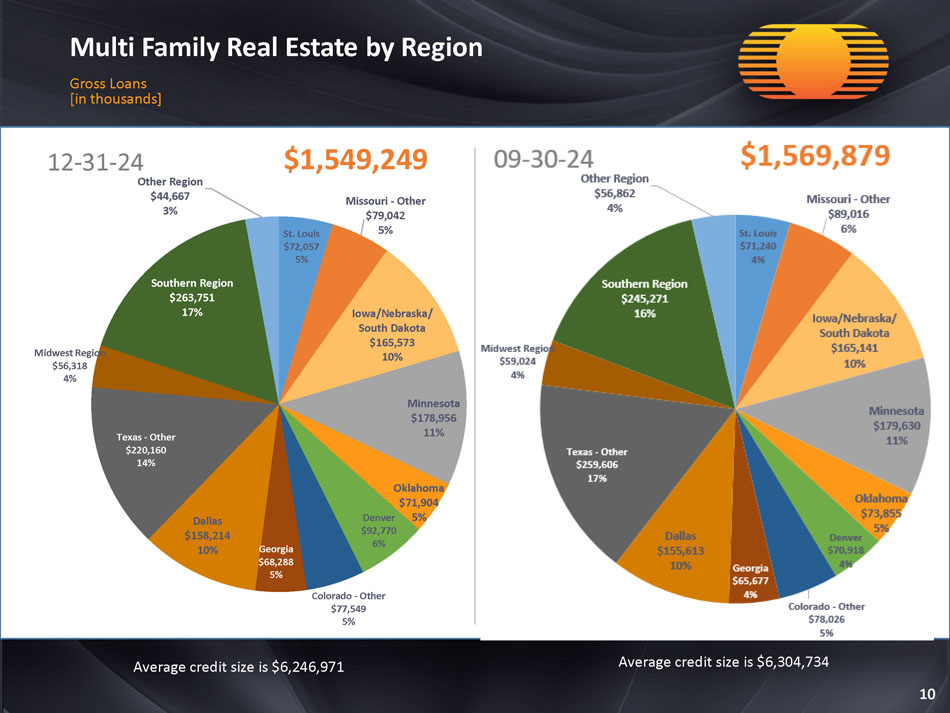
Multi Family Real Estate by Region Gross Loans [in thousands] 10 St. Louis $72,057 5% Missouri - Other $79,042 5% Iowa/Nebraska/ South Dakota $165,573 10% Minnesota $178,956 11% Oklahoma $71,904 5% Denver $92,770 6% Colorado - Other $77,549 5% Georgia $68,288 5% Dallas $158,214 10% Texas - Other $220,160 14% Midwest Region $56,318 4% Southern Region $263,751 17% Other Region $44,667 3% 12 - 31 - 24 $1,549,249 Average credit size is $6,246 ,971 Average credit size is $6,304,734

Multi Family Real Estate by LTV Gross Loans [in thousands] 11 25% or less $14,780 1% 26% - 50% $384,373 25% 51% - 75% $1,097,435 71% 76% - 85% $49,951 3% 86% and higher $2,710 0% 12 - 31 - 24 $1,549,249

Non - performing by Type Gross Loans [in thousands] 12 12 - 31 - 24 $3,573 *Includes Home Equity Loans of $0 *Includes Home Equity Loans of $0 Consumer* $17 0% Single Family Real Estate $2,631 74% Commercial Real Estate $77 2% Commercial Business $464 13% Const & Land Dev $384 11%

Non - performing by Region Gross Loans [in thousands] 13 Missouri $228 6% Iowa/Nebraska/ South Dakota $464 13% Midwest Region $26 1% Southern Region $1,159 32% Other Region $1,696 48% 12 - 31 - 24 $3,573
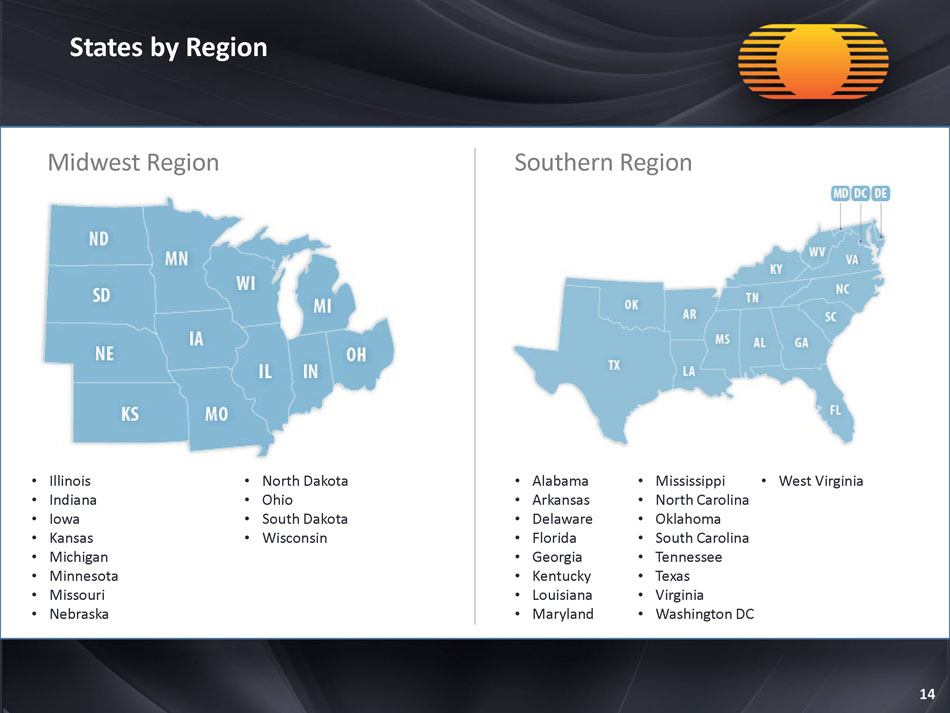
States by Region 14 Midwest Region Southern Region • Illinois • Indiana • Iowa • Kansas • Michigan • Minnesota • Missouri • Nebraska • North Dakota • Ohio • South Dakota • Wisconsin • Alabama • Arkansas • Delaware • Florida • Georgia • Kentucky • Louisiana • Maryland • Mississippi • North Carolina • Oklahoma • South Carolina • Tennessee • Texas • Virginia • Washington DC • West Virginia
SIGNATURES
Pursuant to the requirements of the Securities Exchange Act of 1934, the registrant has duly caused this report to be signed on its behalf by the undersigned hereunto duly authorized.
| | | GREAT SOUTHERN BANCORP, INC. |
| | | |
| Date: January 21, 2025 | By: | /s/ Joseph W. Turner |
| | | Joseph W. Turner, President and Chief Executive Officer |