UNITED STATES
SECURITIES AND EXCHANGE COMMISSION
Washington, D.C. 20549
FORM 10-K/A
Annual Report Persuant to Section 13 or 15(d)of
the Securities Exchange Act of 1934
For the fiscal year ended December 31, 2006
Commission file number 0-18121
___________________________
MAF BANCORP, INC.
(Exact name of registrant as specified in its charter)
| Delaware (State of Incorporation) | 36-3664868 (I.R.S. Employer Identification No.) |
55th Street & Holmes Avenue, Clarendon Hills, Illinois 60514-1500
Telephone Number (630) 325-7300
Securities registered pursuant to Section 12(b) of the Act: None
Securities registered pursuant to Section 12(g) of the Act:
Common Stock, par value $.01 per share
(Title of Class)
Indicate by check mark if the registrant is a well-known seasoned issuer, as defined in Rule 405 of the Securities Act.
Yes [X] No[ ]Indicate by check mark if the registrant is not required to file reports pursuant to Section 13 or Section 15(d) of the Exchange Act.
Yes [X] No[ ]Indicate by check mark whether the registrant (1) has filed all reports required to be filed by Section 13 or 15(d) of the Securities Exchange Act of 1934 during the preceding 12 months, and (2) has been subject to such filing requirements for the past 90 days.
Yes [X] No[ ]Indicate by check mark if disclosure of delinquent filers pursuant to Item 405 of Regulation S-K is not contained herein, and will not be contained, to the best of registrant's knowledge, in definitive proxy or information statements incorporated by reference in Part III of this Form 10-K/A or any amendments to this Form 10-K/A.
[ ]Indicate by check mark whether the registrant is a large accelerated filer, an accelerated filer, or a non-accelerated filer. See definition of “accelerated filer” and “large accelerated filer” in Rule 12b-2 of the Exchange Act.
Large accelerated filer [X] Accelerated filer [ ] Non-accelerated filer [ ]Indicate by check mark whether the registrant is a shell company (as defined in Rule 12b-2 of the Exchange Act).
Yes [ ] No[X]Based opon closing price of the registrant's common stock as of June 30, 2006, the aggregate market value of the voting stock held by non affiliates of the reistrant was $1.3 billion. *
The number of shares of Common Stock outstanding as of February 23, 2007: 32,926,938
Document Incorporated by Reference
PART III - Portions of the Proxy Statement for the Annual Meeting of Shareholders to be held on May 16, 2007 are incorporated by reference into Part III hereof.
*Solely for purposes of this calculation, all executive officers and directors of the registrant are considered to be affiliates. Except to the extent shares have been allocated to the plan accounts of directors and executive officers, the affiliate holdings do not include shares held in certain employee benefit plans administered by plan committees the include executive officers.
MAF BANCORP, INC. AND SUBSIDIARIES
FORM 10-K
Page
PART I.
| Item 1. | Business | 2 |
| Item 1A. | Risk Factors | 28 |
| Item 1B. | Unresolved Staff Comments | 31 |
| Item 2. | Properties | 31 |
| Item 3. | Legal Proceedings | 31 |
| Item 4. | Submission of Matters to a Vote of Security Holders | 31 |
| PART II | ||
| Item 5. | Market for the Registrant's Common Equity, Related Stockholder Matters and Issuer Purchases of Equity Securities | 31 |
| Item 6. | Selected Financial Data | 33 |
| Item 7. | Management's Discussion and Analysis of Financial Condition and Results of Operations | 37 |
| Item 7A. | Quantitative and Qualitative Disclosures about Market Risk | 55 |
| Item 8. | Financial Statements and Supplementary Data | 59 |
| Item 9. | Changes in and Disagreements with Accountants on Accounting and Financial Disclosure | 99 |
| Item 9A. | Controls and Procedures | 99 |
| Item 9B. | Other Informtion | 99 |
| PART III | ||
| Item 10. | Directors, Executive Officers and Corporate Governance | 99 |
| Item 11. | Executive Compensation | 100 |
| Item 12. | Security Ownership of Certain Beneficial Owners and Management and Related Stockholder Matters | 100 |
| Item 13. | Certain Relationships and Related Transactions, and Director Independence | 100 |
| Item 14. | Principle Accountant Fees and Services | 101 |
| PART IV | ||
| Item 15. | Exhibits and Financial Statements Schedules | 101 |
| SIGNATURES | 105 |
i
PART I
Item 1. Business
General
MAF Bancorp, Inc. was incorporated under the laws of the state of Delaware in 1989, as the holding company for Mid America Bank, fsb (“Bank”), our banking subsidiary. The Bank, which was organized as a mutual savings and loan association and has been operating in the Chicago area since 1922, formed the holding company in connection with its conversion from a mutual to stock savings institution. Over the last five years, the Bank has grown from 32 branches and $5.60 billion in total assets at December 31, 2001 to 82 branches and $11.12 billion in assets at December 31, 2006. Today, the Bank is one of the largest community-oriented financial institutions in the Chicago and Milwaukee metropolitan areas, serving both retail and business banking customers. We also engage in residential real estate land development through our subsidiary, MAF Developments, Inc., or MAFD, a business we have been active in for over 30 years.
The Company’s executive offices are located at 55th Street and Holmes Avenue, Clarendon Hills, Illinois 60514-1500. The Company’s telephone number is (630) 325-7300.
We have grown our franchise through de novo branching, as well as acquisitions of other financial institutions and branch acquisitions. We have opened 13 denovo branches in the past five years. The table below summarizes information regarding the acquisitions we have completed during the past five years.
| Acquired Company | Number of Branches | Market Area | Acquisition Date | Total Assets at Closing | Total Deposits at Closing | |||||||||||||||
|---|---|---|---|---|---|---|---|---|---|---|---|---|---|---|---|---|---|---|---|---|
| (In thousands) | ||||||||||||||||||||
| EFC Bancorp, Inc. | 7 | Elgin, IL | February 2006 | $ | 1,052,943 | 703,435 | ||||||||||||||
| Chesterfield Financial Corp | 3 | Chicago, IL | November 2004 | 354,221 | 270,711 | |||||||||||||||
| St. Francis Capital Corporation | 23 | Milwaukee, WI | December 2003 | 2,190,627 | 1,294,517 | |||||||||||||||
| Fidelity Bancorp, Inc. | 4 | Chicago, IL | July 2003 | 612,869 | 434,573 | |||||||||||||||
We may continue to consider selective acquisition opportunities to strengthen our market share in the greater Chicago and Milwaukee metropolitan areas or to pursue strategic growth opportunities in other attractive markets.
As we have grown, we have successfully transitioned our business from a traditional savings and loan engaged primarily in one- to four-family residential mortgage lending to a more diversified community bank, servicing both consumer and business customers, while retaining our emphasis on relationship-driven, responsive customer service. We offer a wide variety of checking, savings and other deposit accounts as well as investment services and securities brokerage, general insurance services and other financial services targeted to individuals, families and small- to medium-sized businesses in our primary market areas. All of our locations are full-service branches, many of which offer customers the convenience of drive-up facilities.
We launched our Business Banking unit in 2001 and have steadily grown commercial deposits and business banking loans over the past six years. We have also emphasized home equity lending in recent years as part of our strategy to diversify our loan portfolio with higher-yielding loan categories. We continue to originate, and to a lesser extent purchase, residential one- to four-family mortgage loans primarily in our market areas through our residential loan origination platform. While we expect to keep more of our adjustable rate mortgage originations in our portfolio, we have migrated to more of an originate-and-sell model in our mortgage business. The acquisitions of Fidelity, St. Francis and EFC Bancorp contributed significantly to the change in our asset mix, increasing our multi-family mortgages, home equity loans, commercial real estate and business loans and reducing the concentration of one- to four-family mortgage loans in our total loan portfolio. At December 31, 2006, 54% of total loans were comprised of one- to four-family mortgages compared to 79% at December 31, 2002.
For segment information regarding the Company’s two lines of business (banking and land development), see “Note 18. Segment Information” to the audited consolidated financial statements of the Company included in “Item 8. Financial Statements and Supplementary Data.”
2
Lending Activities
Loan Portfolio Composition. The following table sets forth the composition of the Bank’s loan portfolio by loan type at the dates indicated. The table reflects the change in the loan portfolio mix over the last four years resulting from increased emphasis on equity lines of credit, the successful growth of our Business Banking unit and the impact from acquisitions.
| At December 31, | |||||||||||||||||||||||||||||||||||||||||||||||||||||||||||||||||
|---|---|---|---|---|---|---|---|---|---|---|---|---|---|---|---|---|---|---|---|---|---|---|---|---|---|---|---|---|---|---|---|---|---|---|---|---|---|---|---|---|---|---|---|---|---|---|---|---|---|---|---|---|---|---|---|---|---|---|---|---|---|---|---|---|---|
| 2006 | 2005 | 2004 | 2003 | 2002 | |||||||||||||||||||||||||||||||||||||||||||||||||||||||||||||
| Amount | Percent of Total | Amount | Percent of Total | Amount | Percent of Total | Amount | Percent of Total | Amount | Percent of Total | ||||||||||||||||||||||||||||||||||||||||||||||||||||||||
| (Dollars in thousands) | |||||||||||||||||||||||||||||||||||||||||||||||||||||||||||||||||
| One- to four-family | $ | 4,012,468 | 53 | .87% | $ | 4,256,913 | 59.03 | % | $ | 4,036,826 | 58 | .69% | $ | 3,899,222 | 61.33 | % | $ | 3,463,298 | 79 | .02% | |||||||||||||||||||||||||||||||||||||||||||||
| Equity lines of credit | |||||||||||||||||||||||||||||||||||||||||||||||||||||||||||||||||
| and home equity loans | 1,301,665 | 17 | .47 | 1,346,750 | 18.67 | 1,336,090 | 19 | .42 | 965,571 | 15.18 | 419,145 | 9 | .56 | ||||||||||||||||||||||||||||||||||||||||||||||||||||
| Multi-family | 801,866 | 10 | .77 | 698,659 | 9.69 | 646,269 | 9 | .40 | 622,207 | 9.78 | 258,464 | 5 | .90 | ||||||||||||||||||||||||||||||||||||||||||||||||||||
| Commercial real | |||||||||||||||||||||||||||||||||||||||||||||||||||||||||||||||||
| estate | 628,957 | 8 | .44 | 492,307 | 6.83 | 476,796 | 6 | .93 | 521,438 | 8.20 | 142,493 | 3 | .25 | ||||||||||||||||||||||||||||||||||||||||||||||||||||
| Construction | 194,254 | 2 | .61 | 109,691 | 1.52 | 134,759 | 1 | .96 | 110,860 | 1.74 | 33,418 | 0 | .76 | ||||||||||||||||||||||||||||||||||||||||||||||||||||
| Land | 304,685 | 4 | .09 | 171,580 | 2.38 | 92,779 | 1 | .35 | 73,365 | 1.15 | 40,011 | 0 | .92 | ||||||||||||||||||||||||||||||||||||||||||||||||||||
| Commercial | |||||||||||||||||||||||||||||||||||||||||||||||||||||||||||||||||
| business loans | 198,853 | 2 | .67 | 129,771 | 1.80 | 147,345 | 2 | .14 | 128,251 | 2.02 | 20,705 | 0 | .47 | ||||||||||||||||||||||||||||||||||||||||||||||||||||
| Consumer | 5,843 | 0 | .08 | 5,566 | 0.08 | 7,650 | 0 | .11 | 38,237 | 0.60 | 5,101 | 0 | .12 | ||||||||||||||||||||||||||||||||||||||||||||||||||||
| $ | 7,448,591 | 100 | .00% | $ | 7,211,237 | 100.00 | % | $ | 6,878,514 | 100 | .00% | $ | 6,359,151 | 100.00 | % | $ | 4,382,635 | 100 | .00% | ||||||||||||||||||||||||||||||||||||||||||||||
The following table shows the breakdown of fixed-rate and adjustable-rate loans in our portfolio for loan categories other than our residential lending categories as of the dates indicated:
| At December 31, | |||||||||||||||||||||||||||||||||||
|---|---|---|---|---|---|---|---|---|---|---|---|---|---|---|---|---|---|---|---|---|---|---|---|---|---|---|---|---|---|---|---|---|---|---|---|
| 2006 | 2005 | 2004 | |||||||||||||||||||||||||||||||||
| Amount | Percent | Amount | Percent | Amount | Percent | ||||||||||||||||||||||||||||||
| (Dollars in thousands) | |||||||||||||||||||||||||||||||||||
| Multi-family: | |||||||||||||||||||||||||||||||||||
| Adjustable-rate | $ | 656,385 | 81 | .9% | $ | 604,235 | 86 | .5% | $ | 571,524 | 88 | .4% | |||||||||||||||||||||||
| Fixed-rate | 145,481 | 18 | .1 | 94,424 | 13 | .5 | 74,745 | 11 | .6 | ||||||||||||||||||||||||||
| Total multi-family | $ | 801,866 | 100 | .0% | $ | 698,659 | 100 | .0% | $ | 646,269 | 100 | .0% | |||||||||||||||||||||||
| Commercial real estate: | |||||||||||||||||||||||||||||||||||
| Adjustable-rate | 300,021 | 47 | .7% | $ | 305,761 | 62 | .1% | $ | 353,612 | 74 | .2% | ||||||||||||||||||||||||
| Fixed-rate | 328,936 | 52 | .3 | 186,546 | 37 | .9 | 123,184 | 25 | .8 | ||||||||||||||||||||||||||
| Total commercial | |||||||||||||||||||||||||||||||||||
| real estate | $ | 628,957 | 100 | .0% | $ | 492,307 | 100 | .0% | $ | 476,796 | 100 | .0% | |||||||||||||||||||||||
| Construction and Land: | |||||||||||||||||||||||||||||||||||
| Adjustable-rate | $ | 397,928 | 79 | .8% | $ | 190,522 | 67 | .7% | $ | 165,365 | 72 | .7% | |||||||||||||||||||||||
| Fixed-rate | 101,011 | 20 | .2 | 90,749 | 32 | .3 | 62,173 | 27 | .3 | ||||||||||||||||||||||||||
| Total construction | |||||||||||||||||||||||||||||||||||
| and land | $ | 498,939 | 100 | .0% | $ | 281,271 | 100 | .0% | $ | 227,538 | 100 | .0% | |||||||||||||||||||||||
| Commercial business loans: | |||||||||||||||||||||||||||||||||||
| Adjustable-rate | $ | 100,905 | 50 | .7% | $ | 69,246 | 53 | .4% | $ | 74,664 | 50 | .7% | |||||||||||||||||||||||
| Fixed-rate | 97,948 | 49 | .3 | 60,525 | 46 | .6 | 72,681 | 49 | .3 | ||||||||||||||||||||||||||
| Total commercial | |||||||||||||||||||||||||||||||||||
| business | $ | 198,853 | 100 | .0% | $ | 129,771 | 100 | .0% | $ | 147,345 | 100 | .0% | |||||||||||||||||||||||
Loan Maturity. The following table shows the principal amount of loans for loan categories other than one- to four-family mortgages, home equity lines of credit, home equity loans, and consumer loans by contractual final maturity at December 31, 2006. This table is not indicative of the timing of expected repayments on these loans.
| At December 31, 2006 | |||||||||||||||||||||||||||||
|---|---|---|---|---|---|---|---|---|---|---|---|---|---|---|---|---|---|---|---|---|---|---|---|---|---|---|---|---|---|
| Due in 1 year or less | Due after 1 year through 5 years | Due after 5 years | Total due after 1 year | Total Amount Due | |||||||||||||||||||||||||
| (Dollars in thousands) | |||||||||||||||||||||||||||||
| Multi-family | $ | 12,720 | 81,721 | 707,425 | 789,146 | 801,866 | |||||||||||||||||||||||
| Commercial real estate | 52,797 | 284,597 | 291,563 | 576,160 | 628,957 | ||||||||||||||||||||||||
| Construction | 101,959 | 49,644 | 42,651 | 92,295 | 194,254 | ||||||||||||||||||||||||
| Land | 115,513 | 145,788 | 43,384 | 189,172 | 304,685 | ||||||||||||||||||||||||
| Commercial business loans | 111,647 | 81,892 | 5,314 | 87,206 | 198,853 | ||||||||||||||||||||||||
| Total | $ | 394,636 | 643,642 | 1,090,337 | 1,733,979 | 2,128,615 | |||||||||||||||||||||||
Of the $1.73 billion of loans shown in the table above with contractual final maturities after one year, $1.17 billion, or 67%, are adjustable rate loans and $568.8 million or 33%, are fixed rate loans.
Residential Lending. At December 31, 2006, we had approximately $4.01 billion of one- to four-family mortgage loans in our loan portfolio. We sell the majority of our one- to four-family fixed rate
3
mortgage production into the secondary market, as well as a significant portion of our conforming and Alt-A adjustable-rate loan originations. For this reason, we generally underwrite our residential loans to investor criteria and typically price our loans to secondary market rates. We have developed a broad base of investors to include not only Fannie Mae, Freddie Mac and the Federal Home Loan Bank Mortgage Finance Partnership program (“MPF”), but also commercial and investment banks and other private investors, to provide outlets for most of our products. This allows us to limit liquidity risk and interest rate risk.
We currently attract most of our residential mortgage loan customers through commissioned loan officers and cross-selling to banking customers. We are working to expand our telemarketing and web-based offerings in an effort to attract more business through alternative channels. We also offer subprime loans for prospective borrowers with substandard credit through a small group of specialized officers, and we have broker and correspondent lending relationships with other mortgage companies who purchase the subprime loans that we originate through these programs. Our policy is not to retain these loans in portfolio.
We offer ARM loans with 30- and 40-year amortization terms with initial rates that are fixed for a period of one to ten years, with annual adjustments (and periodic and lifetime caps) thereafter, to the extent they do not refinance. At December 31, 2006, $3.13 billion, or 78% of our one- to four-family portfolio were adjustable rate loans, including $1.14 billion of 3/1 ARMs, $1.62 billion of 5/1 ARMs, and $377.0 million of 7/1 and 10/1 ARMs. At December 31, 2006 the ARM loan portfolio included $625.9 million of loans with 40-year amortization terms. Despite the benefits of ARM loans for asset/liability management purposes, particularly those with shorter initial fixed-rate periods, adjustable rate loans do pose potentially greater credit risks than fixed rate loans, since as interest rates rise, the underlying payment requirements of the borrower rise, increasing the potential risk of default.
For traditional mortgage loans with loan-to-value ratios (LTVs) in excess of 80%, to better manage our credit risk we generally require that a customer maintain private mortgage insurance (PMI), and/or we obtain lender paid private mortgage insurance. In situations where we believe the credit risks associated with higher LTV loans are mitigated by the borrower’s FICO score, we may self insure. If the customer does not obtain PMI, we charge the customer a higher interest rate on the loan to compensate us for the cost of insurance we pay or the greater risk of the loan. For loans with PMI, the Bank has a mortgage reinsurance subsidiary that shares in a portion of insurance premiums earned by various private mortgage insurance companies on loans originated by the Bank, in return for assuming a second-tier layer of risk on insured portions of these loans. To date, the Bank has experienced no losses through our assumed risk layers. For the years ended December 31, 2006, 2005 and 2004 this activity generated pre-tax income of $2.5 million, $2.3 million and $1.9 million, respectively. We have also invested in various debt instruments issued by one of the PMI companies where the interest rate earned on the note is based on the performance and loss experience of the underlying pool of insured loans. During the years ended December 31, 2006, 2005 and 2004, we received interest income of $630,000, $985,000 and $1.4 million, respectively, on these instruments.
Over the past few years, we have expanded our offerings of non-traditional mortgage products to include a variety of interest-only products for primary residences, investment properties and vacation homes. We also offer products for up to 100% combined LTVs that use alternative underwriting standards without relying on standard income verifications. We have developed a particular niche originating no-income-verification loans for homeowners in ethnic communities. We have not offered payment- option-ARMs or other loans involving negative amortization. Interest-only loans accounted for approximately 24% of our 2006 originations and comprised approximately 12% of our residential mortgage portfolio at year end. While non-traditional mortgages, particularly high LTV interest-only loans, may pose a higher risk of loss than conventional one- to four-family loans, we generally earn a higher interest rate on these loans to compensate us for the risk.
An important part of our business strategy is our commitment to community lending initiatives. We offer various innovative and flexible home mortgage products and participate in or actively support many special lending programs designed to promote affordable homeownership and address the needs of underserved communities in the markets we serve. These programs include single and multi-family home mortgage loans in low-to-moderate income census tracts, loans in predominantly minority communities, and loans to borrowers whose income is below 80% of median income. Many loans we make in our community lending programs tend to have higher LTVs.
4
Home Equity Lending. Home equity lending totaled $1.30 billion, or 17.5% of our loan portfolio. Several years ago, we made a strategic decision to expand our level of equity line activity in an effort to capitalize on our penetration of residential lending production in our primary market areas, diversify our asset mix and reduce our interest rate risk exposure, as home equity lines are variable rate products generally tied to the Prime rate. At December 31, 2006, the average utilization rate on our equity line portfolio was 51.5% compared to 53.8% at December 31, 2005 and 55.7% at December 31, 2004. The rising interest rates over the past year made growth in this portfolio more challenging as consumers repaid balances or refinanced into fixed rate mortgage products. We underwrite our home equity loans similarly to our one- to four-family production, by evaluating a customer’s ability to repay the loan, including FICO score, and by reviewing the combined loan-to-value ratio (CLTVs) of the loan taking into account any first mortgage loan. Our underwriting procedures limit the combined loan-to-value ratio to 100% or less. We generally determine the rate on an equity line of credit using a tiered pricing schedule based on a combination of a customer’s FICO score and CLTV ratios. Under applicable regulatory guidelines, we maintain higher capital levels to support second lien home equity lines of credit than are required for first lien residential mortgages, taking into account the entire approved amount of the equity line, not just the amount drawn at any given time. We do not normally obtain PMI insurance on home equity products. As part of our originate- and-sell strategy in residential lending, in 2005 and 2006 we sold some of our home equity-line production to generate gain on sale income. We have considered home equity line sales from time to time when market pricing has been attractive relative to our prepayment speed projections, and to reduce credit risk exposure on higher CLTV products. In these transactions, we have endeavored to select for sale loans we have made to “single-service” customers whose business relationships with the Bank are limited to their home equity lines.
Multi-family Lending. Our multi-family real estate loans totaled $801.9 million at December 31, 2006, or 10.8% of our loan portfolio. We originate multi-family residential mortgage loans in our market areas. These residential mortgage loans are generally ARM loans having interest rates with initial fixed rate terms of three to ten years, amortization periods of up to 25 years and balloon maturity dates of five to ten years. Our underwriting standards for these loans generally require a loan-to-value ratio not greater than 80% and net operating income to debt service coverage ratio that is not less than 1.0 for loans secured by less than 24 units and 1.15 for loans secured by more than 24 units. In cases where the debt service ratios are lower, we may charge a higher yield, require additional collateral, require a lower LTV or verify the overall cash flow of the borrower or guarantor to cover any debt service shortfall. The multi-family loans typically carry more risk than single family loans as the loan balances are larger and the repayment of loans is dependent in part on the cash flow of the property securing the loan.
To a lesser extent, we also offer equity lines secured by multi-family properties, which permit equity borrowing up to 80% LTV.
Commercial Real Estate Lending. Our commercial real estate loans totaled $629.0 million at December 31, 2006, or 8.4% of our loan portfolio. We lend on various commercial properties, including small office buildings, warehouses, industrial/manufacturing buildings, land acquisition and development, and other improved residential and non-residential properties. Commercial real estate loans that are adjustable-rate in nature have floating interest rates that are generally tied to Prime or LIBOR. Payments on loans secured by commercial real estate properties are often dependent on the successful operation or management of the properties or their primary tenants, and as such, repayment of such loans may be subject to adverse conditions in the real estate market or the economy. We seek to minimize these risks by lending primarily to experienced developers, or existing income-producing properties and generally restrict such loans to properties in our market areas.
Commercial real estate loans tend to be much larger than our average residential loan, and involve a greater degree of risk than residential mortgage loans with respect to the determination of the market value of the collateral and underlying cash flow assumptions. This increased risk is a result of several factors, including the concentration of principal in a limited number of loans and borrowers, the effects of general economic conditions, and the increased difficulty of evaluating and monitoring these loans. Furthermore, the repayment of loans secured by non-residential property is typically dependent upon the successful operation of the related real estate project. If the cash flow from the project is reduced, the borrower’s ability to repay the loan may be impaired. See “Business — Delinquent, Non-performing and Classified Assets.”
Our underwriting of commercial real estate loans is a robust process and is less homogeneous than generally found in our residential loan underwriting. We use a combination of inside and outside
5
appraisers with pertinent expertise to appraise our commercial real estate properties. Our credit analysis includes a review of the property’s ability to service debt, the capacity of the borrower to generate income elsewhere and where applicable, the strength of any personal guarantor(s). We generally seek a net operating income to debt coverage ratio that is not less than 1.20, exclusive of other outside income. In instances where the coverage ratio is lower, we seek a higher rate of interest or collect additional fees to compensate us for the increased level of risk or require other compensating factors such as additional collateral, personal guarantees or strong overall cash flow from borrowers and guarantors.
Construction and Land Lending. Our commercial real estate construction, single-family construction and land loans totaled $498.9 million at December 31, 2006, or 6.7% of our loan portfolio. Our construction and land lending are both focused primarily on one- to four-family residences and residential land developments in our market areas. This lending focuses on construction of properties where qualified contractors are involved, and loans are structured to be repaid or converted to permanent loans at the end of the construction phase. Our construction loans tend to be adjustable-rate, with interest-only payments during the construction phase.
The maximum loan-to-value during construction is generally limited to 80% LTV. Loan proceeds are disbursed in increments as construction progresses, inspections are completed and lien waivers obtained. Our land lending includes loans to developers for the initial purchase and land development for residential subdivisions in our market area, as well as loans to builders and individuals. Under our policy, the loan-to-value ratio for development loans may not exceed 80%. The majority of these loans are floating rate based on the Prime rate or LIBOR. We require an appraisal of the property, and feasibility studies may also be required to determine the profit potential of the development project.
Construction and land development loans involve higher risks than residential mortgages because the uncertainties inherent in estimating construction costs, as well as variations in the market value of the completed project and the effects of local governmental regulation of real property, make it relatively difficult to precisely estimate the total funds required to complete a project and the related loan-to-value ratio. Construction and land development lending often involves the disbursement of substantial funds with repayment dependent, in part, on the success of the ultimate project rather than the ability of the borrower or guarantor to repay principal and interest. If we have to foreclose on a project, especially if prior to completion, we may have difficulty recovering all of the unpaid balance of and accrued interest on the loan, as well as related foreclosure and holding costs. In addition, we may be required to fund additional amounts to complete the project and may have to hold the property for an unspecified period of time. We have attempted to address these risks through our underwriting procedures and monitoring of construction lending on multi-family and commercial real estate properties.
Commercial Business Lending. Our commercial business loans totaled $198.9 million at December 31, 2006, or 2.7% of our loan portfolio. We originate a variety of commercial business loans, including working capital financing, equipment loans, and selected personal loans for executives, professionals and entrepreneurs with floating interest rates typically tied to Prime or LIBOR and fixed rates indexed to Treasury rates or LIBOR. Supporting collateral can take many forms, such as accounts receivable, inventory equipment and other business or personal assets, or in some cases loans may be unsecured. Typically, we target small-to medium-sized, privately held businesses in our primary market areas and seek to establish full service commercial loan and deposit relationships. Growing our commercial lending portfolio is key to the success of our asset diversification strategy, since this type of lending typically provides higher yield opportunities than residential loans and is an important component in achieving a more balanced loan portfolio.
Loans to commercial business entities involve risk factors unique to the business of each borrower. In order to mitigate these risks, we seek to gain an understanding of the business of each borrower; understand the cash flow generated by the business, place appropriate value on collateral taken and structure the loan properly to make sure that collateral values and financial conditions are maintained while loans are outstanding. Appropriate documentation of commercial business loans is also important to protect our interests. Our credit approval process for commercial loans is comprehensive and our underwriting process includes an evaluation of the borrower’s historical and projected balance sheet, income statement, liquidity and cash flow as well as the strength of the collateral to determine the level of creditworthiness of the borrower. We typically review the current and future cash needs of the borrower, its business strategy, management’s ability to execute the strategies, and the strength of any guarantors. While our loan policy has guidelines for advances on different types of collateral, we establish eligible asset values on a case-by-case basis for each borrower. Generally, the commercial business loans are
6
secured by a first priority security interest in all the assets of the borrower and also include the personal guarantees of business owners. The repayment of a commercial business loan depends primarily on the ability of the borrower to generate cash and the creditworthiness of the borrower, since liquidation of collateral is often a secondary and potentially insufficient source of repayment due to inventory or assets being obsolete, or accounts receivable becoming uncollectible.
We may also provide letter of credit services to certain borrowers on a case-by-case basis. Underwriting, structuring and collateralization of letters of credit are similar to that used in other commercial loans.
Lending Concentrations. Our largest lending relationship at December 31, 2006, involved $68.4 million of credit exposure, the majority of which is comprised of construction and land loans relating to residential developments. Aggregate credit exposure to our ten largest lending relationships at December 31, 2006, was approximately $373 million. The majority of our loans are made in our Chicago and Milwaukee market areas. Of our total loan portfolio at December 31, 2006, 76.3% are loans secured by property located in Illinois and 20.2% by property located in Wisconsin.
Environmental Issues. We encounter certain environmental risks in our lending activities. Under federal and state environmental laws, and in certain circumstances, lenders may become liable for the costs of cleaning up hazardous materials found on security property. To mitigate environmental related risks to us, our loan policies call for management to consider all relevant factors in order to determine whether an environmental review is needed and, if so, the scope and detail, prior to our origination of commercial and multi-family loans. Although environmental risks are usually associated with industrial and commercial loans, there are also risks for residential lenders like us if environmental contamination makes the collateral property unsuitable or has an adverse effect on nearby property values.
No assurance can be given that the values of properties securing loans in our portfolio will not be adversely affected by unforeseen environmental risks, although we are unaware of any such environmental issues which subject us to potential material liability at this time.
Secondary Market and Loan Servicing Activities
Originations, Purchases and Sales of Mortgage Loans. Our mortgage origination volumes, and the mix of fixed-rate and ARM products in our originations, are significantly dependent on the interest rate environment, consumer preferences and the expected level of future interest rates. We originate the majority of our production, through our internal sales force of commissioned loan originators. In addition, in the past several years we have worked to establish relationships with a number of selected mortgage brokers operating in our market areas from whom we purchase loans, primarily home equity products, based on our published rate sheets and in conformity with our underwriting guidelines and usually in whole loan transactions where we assume the servicing.
Our strategy regarding loan sales is dependent on a number of factors and varies from time to time depending on the impact of these factors on our operations. We consider the profit margin on sale compared to the spread income expected to be earned on a loan in determining whether we sell certain production. We also sell loans as a means of managing our overall level of interest-rate risk as well as the credit risk profile of our residential loan portfolio. We may also sell loans as a means of providing liquidity to our operations. In managing our interest-rate and liquidity risks, we generally sell most of our fixed-rate residential mortgage originations, and tend to sell more ARM originations when the yield curve is flatter. During 2006, we sold a larger percentage of our ARM loan production as part of our strategy to limit portfolio growth in the inverted yield curve environment, intended to mitigate net interest margin pressure. Based on our current interest rate outlook, we may retain more of our ARM loan production in portfolio in 2007 as we work to grow interest earning assets at acceptable spreads.
We began selling home equity loans on a servicing-released basis two years ago, selling $139.3 million in 2005 and $114.5 million in 2006. We sold home equity loans to realize the attractive gain on sale margins available in the secondary market for this product. In addition, the sales were used to help manage our credit risk by selling more of the higher loan-to-value production, particularly in 2006 as we started to see negative asset quality trends and higher loss experience on these loans due to the weakening housing market conditions. We expect to continue this strategy in 2007.
7
The following table shows the Bank’s one- to four-family mortgage and home equity originations and purchases and loan sale activity for the periods indicated:
| At or For the Year Ended December 31, | |||||||||||||||||||||||||||||||||||
|---|---|---|---|---|---|---|---|---|---|---|---|---|---|---|---|---|---|---|---|---|---|---|---|---|---|---|---|---|---|---|---|---|---|---|---|
| 2006 | 2005 | 2004 | |||||||||||||||||||||||||||||||||
| Amount | Percent | Amount | Percent | Amount | Percent | ||||||||||||||||||||||||||||||
| (Dollars in thousands) | |||||||||||||||||||||||||||||||||||
| One- to Four-Family Originations and Purchases: | |||||||||||||||||||||||||||||||||||
| Fixed-rate | $ | 632,762 | 40 | % | $ | 674,882 | 33 | % | $ | 905,182 | 38 | % | |||||||||||||||||||||||
| Adjustable-rate | 932,336 | 60 | 1,363,816 | 67 | 1,481,547 | 62 | |||||||||||||||||||||||||||||
| Total | $ | 1,565,098 | 100 | % | $ | 2,038,698 | 100 | % | $ | 2,386,729 | 100 | % | |||||||||||||||||||||||
| Equity lines of credit(1) | $ | 793,550 | $ | 1,201,936 | $ | 1,151,971 | |||||||||||||||||||||||||||||
| Home equity loans | 133,490 | 48,389 | 17,381 | ||||||||||||||||||||||||||||||||
| Loans Sales: | |||||||||||||||||||||||||||||||||||
| One- to four-family loans: | |||||||||||||||||||||||||||||||||||
| Fixed-rate(2) | 638,903 | 55 | % | 661,641 | 96 | % | 649,789 | 71 | % | ||||||||||||||||||||||||||
| Adjustable-rate(2) | 525,186 | 45 | 24,839 | 4 | 264,292 | 29 | |||||||||||||||||||||||||||||
| Total | $ | 1,164,089 | 100 | % | $ | 686,480 | 100 | % | $ | 914,081 | 100 | % | |||||||||||||||||||||||
| Equity loans | $ | 114,538 | $ | 139,270 | $ | — | |||||||||||||||||||||||||||||
| Gain (loss) on sale or writedown of: | |||||||||||||||||||||||||||||||||||
| One- to four-family loans | $ | 11,204 | $ | 7,100 | $ | 9,294 | |||||||||||||||||||||||||||||
| Lower of cost or market | |||||||||||||||||||||||||||||||||||
| adjustment on | |||||||||||||||||||||||||||||||||||
| loans transferred to held for | |||||||||||||||||||||||||||||||||||
| sale | (4,156 | ) | — | — | |||||||||||||||||||||||||||||||
| Home equity loans | 1,745 | 3,575 | — | ||||||||||||||||||||||||||||||||
| Total loan sale gains | $ | 8,793 | $ | 10,675 | $ | 9,294 | |||||||||||||||||||||||||||||
| Margin on loan sales: | |||||||||||||||||||||||||||||||||||
| One- to four-family loans | |||||||||||||||||||||||||||||||||||
| (exclusive of lower of | |||||||||||||||||||||||||||||||||||
| cost or market adjustment) | .96 | % | 1.03 | % | 1.02 | % | |||||||||||||||||||||||||||||
| Equity loans | 1.52 | 2.57 | — | ||||||||||||||||||||||||||||||||
| (1) | Represents total disbursements during the year on all home equity lines, including amounts related to lines newly originated during the year and lines previously outstanding. This does not reflect any unused amounts that remain available at year end. |
| (2) | Loans sold includes one- to four-family originations that are swapped into mortgage-backed securities and sold simultaneously and does not include $37.2 million in 2005 of Bank-originated loans swapped into mortgage-backed securities and held in portfolio. |
Of our fixed-rate originations in 2006, $613.3 million, or 97%, conformed to the requirements for sale to Fannie Mae and Freddie Mac and $19.5 million, or 3%, were non-conforming. Our “non-conforming” loans are generally designated as such because the principal loan balance exceeds $417,000, which is the Freddie Mac, Fannie Mae, and MPF purchase limit, and not because the loans present increased risk of default. Non-conforming loans, or jumbo loans with such higher balances, generally carry interest rates from one-eighth to one quarter of one percent higher than similar, conforming fixed-rate loans. Jumbo loans are priced higher to compensate for their higher risks of prepayment.
We generally sell our conforming long-term fixed-rate production to Freddie Mac, Fannie Mae, or the MPF program of the Federal Home Loan Bank of Chicago, commonly referred to as “GSEs,” or government sponsored entities. Since 2002, we have been selling most of our non-conforming long-term fixed-rate production to private investors. During 2006 we sold $525.2 million of adjustable rate loans, or 56% of our ARM originations as spreads to funding costs narrowed as a means to hold down growth in lower-yielding assets and mitigate pressure on the net interest margin.
We often enter into forward commitments for loan sales with various investors based on our mortgage production pipeline as our primary hedge of price risk. The majority of our loans are sold without recourse, except those loans sold through the MPF program, where we retain a limited level of risk in exchange for better pricing on the loans sold and a credit enhancement fee. At December 31, 2006, we had approximately $16.8 million in net credit risk exposure on loans we have sold through the MPF program.
Loan servicing. We have generally retained servicing rights on single family mortgage loans that we sell into the secondary market, but to date, not on equity lines that we sell. When we retain the servicing, we generate loan servicing fee income from fees the investors pay us to collect and remit mortgage payments, insurance premiums and real estate taxes. The monthly servicing fees we receive are equal to at least .25% of the outstanding principal balance of the sold loans being serviced. Costs of servicing loans for others are charged to expense as incurred, while we capitalize mortgage servicing rights upon the sale of loans based on assumptions as to fee income earned, estimated prepayment
8
speeds of the underlying mortgage loans, and the cost of servicing. Mortgage servicing rights are intangible assets and are amortized based on the estimated life of the loan servicing income stream, which is recorded as a decrease to loan servicing fee income. Our mortgage servicing rights are assessed quarterly for impairment, with any impairment or recovery recognized through a valuation allowance and a related charge to earnings.
The following table shows the components of loan servicing fee income in dollars and as a percentage of loans serviced for others, as well as other information regarding loans serviced for others for the years indicated:
| Year Ended December 31, | ||||||||||||||||||||
|---|---|---|---|---|---|---|---|---|---|---|---|---|---|---|---|---|---|---|---|---|
| 2006 | 2005 | 2004 | ||||||||||||||||||
| (Dollars in thousands) | ||||||||||||||||||||
| Gross servicing revenue | $ | 8,728 | 9,302 | 9,312 | ||||||||||||||||
| Amortization of mortgage servicing rights | (5,319 | ) | (7,041 | ) | (8,081 | ) | ||||||||||||||
| Loan servicing fee income | $ | 3,409 | 2,261 | 1,231 | ||||||||||||||||
| As a percentage of average loans serviced for | ||||||||||||||||||||
| others: | ||||||||||||||||||||
| Gross servicing revenue | .275 | % | .260 | .277 | ||||||||||||||||
| Amortization of mortgage servicing rights | (.168 | ) | (.197 | ) | (.241 | ) | ||||||||||||||
| Loan servicing fee income | .107 | % | .063 | .036 | ||||||||||||||||
| Average balance of loans serviced for others | $ | 3,168,668 | 3,582,886 | 3,357,002 | ||||||||||||||||
| Loans serviced for others at end of year(1) | 2,680,242 | 2,919,075 | 3,641,445 | |||||||||||||||||
| Mortgage servicing rights at end of year, net | 17,549 | 20,007 | 25,697 | |||||||||||||||||
| Average service fee at year end | .28 | % | .26 | .28 | ||||||||||||||||
| Mortgage servicing rights as a percentage of | ||||||||||||||||||||
| mortgage loans serviced for others | .65 | .69 | .71 | |||||||||||||||||
| Multiple of average servicing fee at year end | 2.3 | x | 2.6 | x | 2.5 | x | ||||||||||||||
| Weighted-average interest rate on loans | ||||||||||||||||||||
| serviced for others | 5.98 | % | 5.69 | 5.70 | ||||||||||||||||
| Loan Servicing: | ||||||||||||||||||||
| Gain on sale of mortgage servicing rights | $ | 3,600 | 2,400 | — | ||||||||||||||||
| Valuation recovery on mortgage servicing rights | — | 171 | 2,072 | |||||||||||||||||
| (1) | One- to four-family loans serviced for other investors which are primarily GSE and to a lesser extent private investors. |
The loans we service for others are loans we have sold, typically without recourse, and are not included in our loan portfolio composition totals or in our consolidated statements of financial condition. The following table shows delinquency information about mortgage loans we serviced for others at the dates shown:
| Loan Serviced for Others(1) | |||||||||||||||||||||||||||||||||||
|---|---|---|---|---|---|---|---|---|---|---|---|---|---|---|---|---|---|---|---|---|---|---|---|---|---|---|---|---|---|---|---|---|---|---|---|
| 61-90 Days Delinquencies | > 90 Days Delinquencies | ||||||||||||||||||||||||||||||||||
| Number of Loans | Principal Balance of Delinquent Loans | As a Percent of Total Loans(2) | Number of Loans | Principal Balance of Delinquent Loans | As a Percent of Total Loans(2) | ||||||||||||||||||||||||||||||
| (Dollars in thousands) | |||||||||||||||||||||||||||||||||||
| December 31, 2006 | 29 | $ | 4,124 | .15% | 79 | $ | 12,366 | .46% | |||||||||||||||||||||||||||
| December 31, 2005 | 26 | 3,207 | .11 | 60 | 8,413 | .29 | |||||||||||||||||||||||||||||
| December 31, 2004 | 17 | 2,363 | .07 | 53 | 6,484 | .18 | |||||||||||||||||||||||||||||
| (1) | Sold loans are serviced for other investors which are primarily GSE’s and to a lesser extent, private investors. |
| (2) | Principal balance of delinquent loans serviced for others as a percentage of total loans serviced for others. |
From time to time, we may sell all or a portion of our servicing portfolio if we believe market valuations of servicing rights offer us a better return than our outlook for servicing fee income streams on the loans serviced for others. Servicing rights valuations are significantly dependent on loan prepayment speed assumptions. We completed a sale of servicing rights on $963.1 million of loans, approximately 27% of our one- to four-family mortgage loans serviced for others portfolio, during the fourth quarter of 2006 at a pre-tax gain of $3.6 million. The loan servicing rights were sold to take advantage of an increase in servicing valuations early in the fourth quarter and represented primarily single service customers we had determined were unlikely prospects for additional business based on the outcome of our cross-selling efforts. We sold servicing rights on $751 million of loans in 2005 at a pre-tax gain of $2.4 million for similar reasons.
9
Asset Quality and Allowance for Loan Losses
We work with consumers and business clients to provide a wide range of lending products designed to meet their individual needs, while adhering to our internal underwriting standards that have allowed us to maintain strong credit quality and minimize credit losses historically.
Delinquent Loans. When a borrower fails to make a required payment by the end of the month in which the payment is due, we commence collection efforts through borrower notifications and other collection procedures. When a loan payment is delinquent for three or more monthly installments, we will generally initiate foreclosure proceedings and cease accruing interest. At the dates shown delinquencies in our portfolio were as follows:
| 61-90 Days | > 90 Days(2) | ||||||||||||||||||||||||||||||||||||||||||||||||||||
|---|---|---|---|---|---|---|---|---|---|---|---|---|---|---|---|---|---|---|---|---|---|---|---|---|---|---|---|---|---|---|---|---|---|---|---|---|---|---|---|---|---|---|---|---|---|---|---|---|---|---|---|---|---|
| Number of Loans | Principal Balance of Delinquent Loans | As a Percent of Total Loans(1) | Number of Loans | Principal Balance of Delinquent Loans | As a Percent of Total Loans(1) | ||||||||||||||||||||||||||||||||||||||||||||||||
| (Dollars in thousands) | |||||||||||||||||||||||||||||||||||||||||||||||||||||
| December 31, 2006 | 199 | $ | 18,073 | .23% | 620 | $ | 66,486 | .85% | |||||||||||||||||||||||||||||||||||||||||||||
| December 31, 2005 | 79 | 9,039 | .12 | 356 | 31,160 | .43 | |||||||||||||||||||||||||||||||||||||||||||||||
| December 31, 2004 | 93 | 8,557 | .12 | 283 | 31,473 | .46 | |||||||||||||||||||||||||||||||||||||||||||||||
| (1) | Reflects principal balance of delinquent loans as a percentage of total loans outstanding. |
| (2) | The more than 90 days category includes all loans on non-accrual regardless of days past due. |
Non-Performing Assets. The table below sets forth information regarding non-performing assets in our portfolio at the dates shown:
| At December 31, | |||||||||||||||||||||||||||||
|---|---|---|---|---|---|---|---|---|---|---|---|---|---|---|---|---|---|---|---|---|---|---|---|---|---|---|---|---|---|
| 2006 | 2005 | 2004 | 2003 | 2002 | |||||||||||||||||||||||||
| (Dollars in thousands) | |||||||||||||||||||||||||||||
| Non-accrual loans:(1) | |||||||||||||||||||||||||||||
| One- to four-family | $ | 41,756 | 21,535 | 23,629 | 27,106 | 22,448 | |||||||||||||||||||||||
| Equity lines of credit and home equity loans | 13,761 | 7,484 | 4,324 | 2,651 | 1,121 | ||||||||||||||||||||||||
| Multi-family | 2,505 | 341 | 1,826 | 478 | 32 | ||||||||||||||||||||||||
| Commercial real estate | 6,784 | 1,639 | 1,294 | 1,503 | 742 | ||||||||||||||||||||||||
| Construction | — | — | — | — | 153 | ||||||||||||||||||||||||
| Land | — | — | — | — | — | ||||||||||||||||||||||||
| Commercial business loans | 1,649 | 134 | 321 | 578 | 860 | ||||||||||||||||||||||||
| Consumer loans | 31 | 27 | 79 | 471 | 38 | ||||||||||||||||||||||||
| Total | $ | 66,486 | 31,160 | 31,473 | 32,787 | 25,394 | |||||||||||||||||||||||
| Non-performing loans to total loans | .89 | % | .43 | .46 | .51 | .58 | |||||||||||||||||||||||
| Non-accrual investment securities | — | — | — | 7,697 | — | ||||||||||||||||||||||||
| Foreclosed real estate: | |||||||||||||||||||||||||||||
| One- to four-family | $ | 3,245 | 789 | 1,487 | 3,200 | 2,366 | |||||||||||||||||||||||
| Commercial real estate | 697 | — | — | — | — | ||||||||||||||||||||||||
| Total foreclosed real estate | $ | 3,942 | 789 | 1,487 | 3,200 | 2,366 | |||||||||||||||||||||||
| Total non-performing assets | $ | 70,428 | 31,949 | 32,960 | 43,684 | 27,760 | |||||||||||||||||||||||
| Total non-performing assets to total assets | .63 | % | .30 | .34 | .49 | .47 | |||||||||||||||||||||||
| (1) | Consists of loans in the process of foreclosure or for which interest is otherwise deemed uncollectible. |
Non-accrual loans. Generally, when a loan is more than 90 days or more past due, in the process of foreclosure, or in bankruptcy, or when collectibility is otherwise in doubt, the full amount of previously accrued but unpaid interest on such non-accrual loan is deducted from interest income. Income is subsequently recorded to the extent cash payments are received, or at the time when the loan is brought current in accordance with its original terms. This policy is applied consistently for all types of loans in the Bank’s loan portfolio. There were no loans over 90 days delinquent and still accruing at any year end shown in the table above.
For the year ended December 31, 2006, the amount of interest income that would have been recorded on non-accrual loans if these loans were performing in accordance with their terms amounted to $2.6 million for 2006 and $1.4 million for each of the years ended December 31, 2005 and 2004. For the years ended December 31, 2006, 2005 and 2004, interest income on non-accrual loans that was actually collected and recorded amounted to $2.0 million, $563,000 and $630,000.
The majority of our non-performing loans are secured by one- to four-family residential real estate in our market area with current loan-to-value ratios less than 90% or with private mortgage insurance.
10
We generally regard these loans as presenting lower risk of credit loss due to the nature of the collateral. Approximately 17% of our non-accrual loans at December 31, 2006, are covered by private mortgage insurance. Ratios for loans secured by one- to four-family residential properties were as follows:
| At December 31, | |||||||||||
|---|---|---|---|---|---|---|---|---|---|---|---|
| 2006 | 2005 | ||||||||||
| One- to four-family, equity lines of credit and home equity loans as a percentage of total loans | 71 | .3% | 77 | .7% | |||||||
| Non-performing one- to four-family, equity lines of credit and home equity loans as percentage of total non-performing loans | 83 | .5 | 93 | .1 | |||||||
| Percentage of non-performing one - to four-family, equity lines of credit and home equity loans | |||||||||||
| with private mortgage insurance or other guarantees | 16 | .6 | 26 | .4 | |||||||
| Percentage of one- to four-family, equity lines of credit and home equity loans without | |||||||||||
| private mortgage insurance and with combined loan- to-value greater than 90% | 8 | .1 | 7 | .7 | |||||||
Impaired Loans. We consider a loan impaired when, based on current information and events, it is probable that we will be unable to collect all amounts due according to the contractual terms of the loan. Impairment for loans considered individually significant and that exhibit probable or observed credit weaknesses are measured based on the present value of expected future cash flows discounted at the loan’s effective interest rate, or the fair value of the collateral if the loan is collateral dependent. If the determined fair value of an impaired loan is less than the carrying value of the loan and a loss has deemed to have occurred, we charge off the principal amount of the loan in excess of fair value or net realizable value. For loans that are not individually significant, loans $1.0 million or less, and represent a homogeneous population, we evaluate impairment collectively based on management reports on the level and extent of delinquencies, as well as historical loss experience for these types of loans. These homogeneous loans are excluded from the impaired loan disclosures. We use these criteria on one- to four-family residential loans, consumer loans, smaller multi-family residential loans, and land loans. At December 31, 2006 and 2005, the Company had $8.7 million and $2.1 million of impaired loans. Impaired loans at December 31, 2006 includes $5.6 million related to a loan on a commercial office building that resulted from the Bank advancing funds under a standby letter of credit in December 2006. Earlier in the year we had recorded a $1.0 million writedown on the letter of credit obligation and we charged off an additional $200,000 on the loan in the fourth quarter. This loan was paid off in January 2007. The average balance of impaired loans for 2006 and 2005 was $3.6 million and $2.4 million, respectively.
Classified Assets. The federal regulators have adopted a classification system for problem assets of insured institutions, which covers all problem assets and requires certain reserves. Under this classification system, problem assets of insured institutions are classified as “substandard,” “doubtful,” or “loss.” An asset is considered “substandard” if it is inadequately protected by the current net worth and paying capacity of the obligor or the value of the collateral pledged, if any. “Substandard” assets include those characterized by the “distinct possibility” that the insured institution will sustain “some loss” if the deficiencies are not corrected. Assets classified as “doubtful” have all of the weaknesses inherent in those classified “substandard,” with the added characteristic that the weaknesses present make “collection or liquidation in full,” on the basis of currently existing facts, conditions, and values, “highly questionable and improbable.” Assets classified as “loss” are those considered “uncollectible” and of such little value that their continuance as assets without the establishment of a specific loss reserve is not warranted. In addition, a “special mention” category consists of assets, which currently do not expose the Company to a sufficient degree of risk to warrant adverse classification, but do possess credit deficiencies deserving management’s close attention.
In connection with our filing of periodic reports with the OTS, we regularly review the problem assets in our portfolio to determine whether any loans or investments require classification in accordance with applicable regulations. At December 31, 2006 all our non-performing loans were classified as substandard, except $676,000 classified as doubtful. In addition, at December 31, 2006, we had classified $9.8 million of multi-family loans, $3.8 million of commercial loans, $74,000 of land loans, $2.5 million of construction loans and $1.5 million of commercial business loans as that were still accruing interest as substandard for regulatory purposes. At December 31, 2005 all of our non-performing loans were classified as substandard except $12,000 classified as doubtful. At December 31, 2005, we had classified $3.5 million of multi-family loans, $8.2 million of commercial real estate loans and $2.5 million of commercial business loans that were accruing interest as substandard for regulatory purposes. Special mention loans at December 31, 2006 and 2005 totaled $49.6 million and $23.9 million, respectively.
Allowance for Loan Losses. In evaluating the adequacy of the allowance for loan losses and determining the related provision for loan losses, if any, management considers: (1) historical loss
11
experience and change in the size and mix of the overall portfolio composition, (2) specific allocations based upon probable losses identified during the review of the portfolio, (3) delinquency trends in the portfolio and the composition of non-performing loans, including the percent of non-performing loans with supplemental mortgage insurance, and (4) subjective factors, including local and general economic business factors and trends, industry and interest rate trends, new lending products and changes in underwriting criteria and portfolio concentrations. Larger loans, typically secured by commercial real estate, that exhibit probable or observed credit weaknesses are subject to individual review. In addition, various regulatory agencies, as an integral part of their examination process, periodically review our allowance for loan losses. Such agencies may require us to recognize additions to the allowance based on their judgments about information available to them at the time of their examination. While we use available information to recognize inherent losses on loans, future adjustments to the allowance for loan losses may be necessary based on changes in economic conditions and other factors and the impact of such changes on the Bank’s borrowers. The allowance for loan losses totaled $39.9 million at December 31, 2006, or .54% of total loans receivable, exclusive of loans held for sale, and $36.5 million, or .51% of total loans receivable at December 31, 2005. An analysis of the changes in the allowance for loan losses for the years indicated is presented in the table below.
| Year Ended December 31, | ||||||||||||||||||||||||||||||||
|---|---|---|---|---|---|---|---|---|---|---|---|---|---|---|---|---|---|---|---|---|---|---|---|---|---|---|---|---|---|---|---|---|
| 2006 | 2005 | 2004 | 2003 | 2002 | ||||||||||||||||||||||||||||
| (Dollars in thousands) | ||||||||||||||||||||||||||||||||
| Balance at beginning of year | $ | 36,495 | 36,255 | 34,555 | 19,483 | 19,607 | ||||||||||||||||||||||||||
| Charge-offs: | ||||||||||||||||||||||||||||||||
| One- to four-family | (397 | ) | (113 | ) | (241 | ) | (67 | ) | (78 | ) | ||||||||||||||||||||||
| Equity lines of credit and | ||||||||||||||||||||||||||||||||
| home equity loans | (4,153 | ) | (1,030 | ) | (244 | ) | (44 | ) | (93 | ) | ||||||||||||||||||||||
| Multi-family | — | — | (174 | ) | — | — | ||||||||||||||||||||||||||
| Commercial real estate | (344 | ) | (667 | ) | (41 | ) | — | — | ||||||||||||||||||||||||
| Constuction | — | — | — | — | — | |||||||||||||||||||||||||||
| Land | — | — | — | — | — | |||||||||||||||||||||||||||
| Commercial business loans | (398 | ) | (117 | ) | (311 | ) | (148 | ) | (424 | ) | ||||||||||||||||||||||
| Consumer | (44 | ) | (121 | ) | (80 | ) | (110 | ) | (22 | ) | ||||||||||||||||||||||
| (5,336 | ) | (2,048 | ) | (1,091 | ) | (369 | ) | (617 | ) | |||||||||||||||||||||||
| Recoveries: | ||||||||||||||||||||||||||||||||
| One- to four-family | 39 | 96 | 54 | 29 | 60 | |||||||||||||||||||||||||||
| Equity lines of credit and | ||||||||||||||||||||||||||||||||
| home equity loans | 431 | 132 | 19 | 26 | 10 | |||||||||||||||||||||||||||
| Multi-family | — | — | 93 | — | — | |||||||||||||||||||||||||||
| Commercial real estate | 21 | 7 | 8 | — | 15 | |||||||||||||||||||||||||||
| Construction | — | �� | — | — | — | |||||||||||||||||||||||||||
| Land | — | — | — | — | — | |||||||||||||||||||||||||||
| Commercial business loans | 81 | 51 | 76 | 11 | 106 | |||||||||||||||||||||||||||
| Consumer | 6 | 22 | 29 | 4 | 2 | |||||||||||||||||||||||||||
| 578 | 308 | 279 | 70 | 193 | ||||||||||||||||||||||||||||
| Charge-offs, net of recoveries | (4,758 | ) | (1,740 | ) | (812 | ) | (299 | ) | (424 | ) | ||||||||||||||||||||||
| Provision for loan losses | 3,900 | 1,980 | 1,215 | — | 300 | |||||||||||||||||||||||||||
| Additions related to acquisitions | 4,294 | — | 1,297 | 15,371 | — | |||||||||||||||||||||||||||
| Balance at end of year | $ | 39,931 | 36,495 | 36,255 | 34,555 | 19,483 | ||||||||||||||||||||||||||
| Net charge-offs to average loans | ||||||||||||||||||||||||||||||||
| outstanding | .06 | % | .02 | .01 | .01 | .01 | ||||||||||||||||||||||||||
| Allowance for loan losses to | ||||||||||||||||||||||||||||||||
| total loans receivable, | ||||||||||||||||||||||||||||||||
| exclusive of one- to | ||||||||||||||||||||||||||||||||
| four-family loans held for sale | .54 | .51 | .53 | .54 | .44 | |||||||||||||||||||||||||||
| Allowance for loan losses to | ||||||||||||||||||||||||||||||||
| total non-performing loans | 60.06 | 117.12 | 115.18 | 105.39 | 76.72 | |||||||||||||||||||||||||||
The following table sets forth our allocation of allowance for loan losses. This allocation is based on management’s subjective estimates. The amount of reserves allocated to a particular category may not be indicative of actual future losses, and amounts allocated to particular categories may change from year to year based on changes in management’s assessment of the risk characteristics of the loan portfolio. During 2006, we refined the methodology we use to evaluate the impact of the various factors described above in establishing allowance allocations for each loan category. The portion of the reserve that is unallocated reflects management’s recognition of the imprecision in measuring and estimating loss when evaluating reserves for individual loans or categories of loans. The allowance allocation as a percentage of one- to four-family loans was relatively unchanged from December 31, 2005 and the decrease in the allocation amount is primarily related to portfolio shrinkage. At December 31, 2006, the
12
allowance allocation amount and as a percentage of equity lines of credit and home equity loans was up significantly compared to December 31, 2005 due to the higher level of non-performing loans and delinquencies and a much higher level of charge-offs in 2006, the increased risk characteristics in the portfolio related to new products, the increase in high LTV loans in the loan mix, and changes in underwriting criteria. The allowance allocations as a percentage of the commercial real estate, and commercial business portfolios were lower, reflecting a healthy corporate sector environment, very low levels of non-performing loans, excellent delinquency trends and extremely low levels of net charge-offs, particularly in the commercial real estate portfolio. The allowance allocations as a percentage of the multi-family, construction and land portfolios were also lower, reflecting very low levels of non-performing loans and delinquencies and another year of no charge-offs in these portfolios. We have not experienced any charge-offs in the construction and land portfolios in the last five years. The increase in the allowance allocation amounts for the land, construction and commercial business loans is due to portfolio growth. The decrease in the allowance amounts for the multi-family and commercial real estate portfolios was primarily due to the lower percentage allocations for the reasons described above offsetting the impact of growth in these portfolios.
| At December 31, | |||||||||||||||||||||||||||||||||||||||||||||||||||||||||||||||||
|---|---|---|---|---|---|---|---|---|---|---|---|---|---|---|---|---|---|---|---|---|---|---|---|---|---|---|---|---|---|---|---|---|---|---|---|---|---|---|---|---|---|---|---|---|---|---|---|---|---|---|---|---|---|---|---|---|---|---|---|---|---|---|---|---|---|
| 2006 | 2005 | 2004 | 2003 | 2002 | |||||||||||||||||||||||||||||||||||||||||||||||||||||||||||||
| Allowance | Loan category as % of Total Loans | Allowance | Loan category as % of Total Loans | Allowance | Loan category as % of Total Loans | Allowance | Loan category as % of Total Loans | Allowance | Loan category as % of Total Loans | ||||||||||||||||||||||||||||||||||||||||||||||||||||||||
| (Dollars in thousands) | |||||||||||||||||||||||||||||||||||||||||||||||||||||||||||||||||
| One- to four-family | $ | 8,505 | 53.87 | % | $ | 9,009 | 59.03 | % | $ | 8,627 | 58.69 | % | $ | 8,594 | 61.33 | % | $ | 9,062 | 79.02 | % | |||||||||||||||||||||||||||||||||||||||||||||
| Equity lines of credit | |||||||||||||||||||||||||||||||||||||||||||||||||||||||||||||||||
| and home equity | |||||||||||||||||||||||||||||||||||||||||||||||||||||||||||||||||
| loans | 13,248 | 17.47 | 7,338 | 18.67 | 7,087 | 19.42 | 5,740 | 15.18 | 2,296 | 9.56 | |||||||||||||||||||||||||||||||||||||||||||||||||||||||
| Multi-family | 3,790 | 10.77 | 4,198 | 9.69 | 3,912 | 9.40 | 3,721 | 9.78 | 2,030 | 5.90 | |||||||||||||||||||||||||||||||||||||||||||||||||||||||
| Commercial real | |||||||||||||||||||||||||||||||||||||||||||||||||||||||||||||||||
| estate | 7,348 | 8.44 | 9,970 | 6.83 | 10,610 | 6.93 | 11,304 | 8.20 | 2,846 | 3.25 | |||||||||||||||||||||||||||||||||||||||||||||||||||||||
| Construction | 1,573 | 2.61 | 1,371 | 1.52 | 1,691 | 1.96 | 759 | 1.74 | 426 | .76 | |||||||||||||||||||||||||||||||||||||||||||||||||||||||
| Land | 2,466 | 4.09 | 2,145 | 2.38 | 1,157 | 1.35 | 870 | 1.15 | 531 | .92 | |||||||||||||||||||||||||||||||||||||||||||||||||||||||
| Commercial | |||||||||||||||||||||||||||||||||||||||||||||||||||||||||||||||||
| business | 2,432 | 2.67 | 1,971 | 1.80 | 2,180 | 2.14 | 2,087 | 2.02 | 397 | .47 | |||||||||||||||||||||||||||||||||||||||||||||||||||||||
| Consumer | 87 | .08 | 46 | .08 | 47 | .11 | 191 | .60 | 80 | .12 | |||||||||||||||||||||||||||||||||||||||||||||||||||||||
| Unallocated | |||||||||||||||||||||||||||||||||||||||||||||||||||||||||||||||||
| reserve | 482 | N/A | 447 | N/A | 944 | N/A | 1,289 | N/A | 1,815 | N/A | |||||||||||||||||||||||||||||||||||||||||||||||||||||||
| Total | $ | 39,931 | 100.00 | % | $ | 36,495 | 100.00 | % | $ | 36,255 | 100.00 | % | $ | 34,555 | 100.00 | % | $ | 19,483 | 100.00 | % | |||||||||||||||||||||||||||||||||||||||||||||
At December 31, 2006, 17% of our non-performing residential loans carried private mortgage insurance or government guarantees and the average loan-to-value ratio on the one- to four-family, equity lines of credit and home equity non-performing loans without supplemental mortgage insurance was 86%. Our net income could be affected if our estimate of the amount of loan loss that may be incurred is materially different than actual results, which could require an additional provision for loan losses and a respective charge to earnings. We believe the allowance for loan losses is adequate at December 31, 2006. However, future adjustments to the allowance may be necessary based on changes in economic conditions and the impact of such changes may have on our borrowers.
Investment Activities
Our strategy is to use our investment and mortgage-backed securities portfolios as stable sources of interest income and to provide flexibility in managing our interest rate risk and liquidity needs. For this reason, we keep our investment portfolios relatively short-term in nature and seek to limit exposure to credit risk. These portfolios represented a combined 17.4% of our total assets at December 31, 2006 compared to 21.0% at December 31, 2005. We maintain a majority of our investment and mortgage-backed securities in an available-for-sale portfolio, and we may sell these securities for liquidity needs, to alter asset/liability management strategies or to manage risk-based capital levels. The classification of investments and mortgage-backed securities as held to maturity, available for sale or trading is made at the time of purchase based upon management’s intent at that time.
At December 31, 2006, our investment securities classified as available for sale had a fair market value of $530.0 million and a cost basis of $529.3 million. Mortgage-backed securities available for sale had a fair value of $1.20 billion with a cost basis of $1.21 billion. At December 31, 2006, we had $212.3 million of mortgage-backed securities in a held to maturity portfolio in which the loans underlying these securities are loans we originated and swapped into mortgage-backed securities. See “Note 4, Mortgage-Backed Securities Available for Sale and Held to Maturity” in “Item 8. Financial Statements and Supplementary Data,” for further information regarding our balance sheet restructuring.
13
We owned $146.4 million of stock in the Federal Home Loan Bank of Chicago, or FHLBC, at December 31, 2006, which is carried at cost, representing 1.3% of total assets and 13.7% of stockholders’ equity. At December 31, 2006, we were required to hold $107.7 million of stock, based on our outstanding credit obligations to the FHLBC. We may, subject to the regulatory and capital constraints of the FHLBC, redeem at par any capital stock greater than our required investment. While our voluntary investment in FHLBC stock yielded us a higher than market return in past years, the current yield on this investment no longer represents an attractive rate compared to alternative investments. In mid-2004, we began reducing our voluntary FHLBC stock position at the recommendation of our asset liability committee (“ALCO”) in order to lower the investment concentration that resulted from our 2003 acquisitions. We redeemed $31.9 million of FHLBC stock in 2006, $125.6 million in 2005 and $125.7 million in 2004. We expect to redeem any remaining excess investment if and when the FHLBC allows further redemptions. See “Regulation and Supervision-Federal Home Loan Bank System.”
The following table sets forth certain information regarding the carrying value of our investment and mortgage-backed securities portfolios at the dates indicated.
| At December 31, | |||||||||||||||||
|---|---|---|---|---|---|---|---|---|---|---|---|---|---|---|---|---|---|
| 2006 | 2005 | 2004 | |||||||||||||||
| (Dollars in thousands) | |||||||||||||||||
| Investment securities available | |||||||||||||||||
| for sale: | |||||||||||||||||
| U.S. Government and Agency securities | $ | 337,634 | 354,203 | 273,088 | |||||||||||||
| Municipal securities | 50,316 | 23,587 | 9,565 | ||||||||||||||
| Asset-backed securities | 14,468 | 15,942 | 19,988 | ||||||||||||||
| Corporate debt securities | 7,000 | 6,551 | 7,320 | ||||||||||||||
| Bank trust preferred securities | 91,694 | 61,922 | 61,928 | ||||||||||||||
| GSE preferred stock and other | 28,886 | 12,947 | 17,070 | ||||||||||||||
| Total investment securities | $ | 529,998 | 475,152 | 388,959 | |||||||||||||
| Stock in FHLB of Chicago | $ | 146,407 | 165,663 | 278,916 | |||||||||||||
| Mortgage-backed securities | |||||||||||||||||
| Available for sale | $ | 1,195,494 | 1,313,409 | 948,168 | |||||||||||||
| Held to maturity | 212,302 | 243,161 | 245,021 | ||||||||||||||
| Total mortgage-backed | |||||||||||||||||
| securities | $ | 1,407,796 | 1,556,570 | 1,193,189 | |||||||||||||
The table below sets forth information regarding the carrying value and weighted average yields based on amortized cost and expected maturities for our investment and mortgage-backed securities.
| At December 31, 2006 | |||||||||||||||||||||||||||||||||||||||||||||||||||||
|---|---|---|---|---|---|---|---|---|---|---|---|---|---|---|---|---|---|---|---|---|---|---|---|---|---|---|---|---|---|---|---|---|---|---|---|---|---|---|---|---|---|---|---|---|---|---|---|---|---|---|---|---|---|
| One Year or Less | 1 to 5 Years | 5 to 10 Years | More than 10 Years | Total Investment Securities | |||||||||||||||||||||||||||||||||||||||||||||||||
| Carrying Value | Weighted Average Yield | Carrying Value | Weighted Average Yield | Carrying Value | Weighted Average Yield | Carrying Value | Weighted Average Yield | Average Life in Years | Carrying Value | Fair Value | Weighted Average Yield | ||||||||||||||||||||||||||||||||||||||||||
| (Dollars in thousands) | |||||||||||||||||||||||||||||||||||||||||||||||||||||
| U.S. Government | |||||||||||||||||||||||||||||||||||||||||||||||||||||
| and Agency securities | $ | 103,936 | 3 | .73% | $ | 233,698 | 4 | .10% | $ | — | — | $ | — | —% | 1.02 | $ | 337,634 | 337,634 | 3 | .99% | |||||||||||||||||||||||||||||||||
| Municipal securities(5) | 1,816 | 4 | .11 | 11,915 | 3 | .88 | 29,567 | 3 | .88 | 7,018 | 4 | .26 | 7.42 | 50,316 | 50,316 | 3 | .94 | ||||||||||||||||||||||||||||||||||||
| Asset-backed | |||||||||||||||||||||||||||||||||||||||||||||||||||||
| securities | 12,500 | 5 | .75 | 1,968 | 7 | .08 | — | — | — | — | .62 | 14,468 | 14,468 | 5 | .93 | ||||||||||||||||||||||||||||||||||||||
| Corporate debt | |||||||||||||||||||||||||||||||||||||||||||||||||||||
| securities | 6,233 | 6 | .23 | 767 | 34 | .09 | — | — | — | — | .70 | 7,000 | 7,000 | 9 | .28 | ||||||||||||||||||||||||||||||||||||||
| Bank trust preferred | |||||||||||||||||||||||||||||||||||||||||||||||||||||
| securities | — | — | — | — | 20,917 | 7 | .15 | 70,777 | 6 | .98 | 22.87 | 91,694 | 91,694 | 7 | .02 | ||||||||||||||||||||||||||||||||||||||
| Marketable equity securities: | |||||||||||||||||||||||||||||||||||||||||||||||||||||
| GSE preferred | |||||||||||||||||||||||||||||||||||||||||||||||||||||
| stock | — | — | — | — | — | — | 27,935 | 6 | .07 | — | 27,935 | 27,935 | 6 | .07 | |||||||||||||||||||||||||||||||||||||||
| Other | — | — | — | — | — | — | 951 | 1 | .47 | — | 951 | 951 | 1 | .47 | |||||||||||||||||||||||||||||||||||||||
| Stock in FHLB of | |||||||||||||||||||||||||||||||||||||||||||||||||||||
| Chicago(1)(2) | — | — | — | — | — | — | 146,407 | 3 | .10 | — | 146,407 | 146,407 | 3 | .10 | |||||||||||||||||||||||||||||||||||||||
| Mortgage-backed | |||||||||||||||||||||||||||||||||||||||||||||||||||||
| securities(3): | |||||||||||||||||||||||||||||||||||||||||||||||||||||
| Available for sale(4) | 73,485 | 4 | .43 | 1,045,831 | 4 | .73 | 76,178 | 4 | .91 | — | — | 2.95 | 1,195,494 | 1,195,494 | 4 | .72 | |||||||||||||||||||||||||||||||||||||
| Held to maturity(4) | — | — | 212,302 | 4 | .66 | — | — | — | — | 4.09 | 212,302 | 205,620 | 4 | .66 | |||||||||||||||||||||||||||||||||||||||
| Total | $ | 197,970 | 4 | .20% | $ | 1,506,481 | 4 | .63% | $ | 126,662 | 5 | .04% | $ | 253,088 | 4 | .54% | 3.13 | $ | 2,084,201 | 2,077,519 | 4 | .60% | |||||||||||||||||||||||||||||||
| (1) | Marketable equity securities and stock in the FHLBC with no stated maturity are included in the “More than 10 Years” category. These securities are excluded in the calculation of average life. Actual repricings and yields of the securities may differ from that reflected in the table depending upon actual interest rates and callable features of those investments. |
| (2) | The yield reflects the dividend declared for the fourth quarter of 2006. |
| (3) | Mortgage-backed securities available for sale and held to maturity are categorized for maturity purposes by their individual weighted average lives. |
| (4) | The yields to maturity of mortgage-backed securities are based upon estimated future cash flow and prepayments. The yields on these securities may differ from that reflected in the table depending upon actual interest rates and prepayment experience. |
| (5) | The yields exclude any tax equivalent adjustments. |
14
The bank trust preferred securities shown in the tables above represent investments in several different pools of collateralized debt securities consisting of primarily 30-year capital securities issued by various banks, thrifts and insurance companies. The underlying pool of issuers of the collateralized debt securities are well diversified as to asset size and geography. These securities are primarily LIBOR-indexed floating-rate securities and contain an issuer call provision at par anytime after five years from the issuance date. The individual issuers of trust preferred securities have the ability to defer interest payments for up to 20 consecutive quarters in certain circumstances. At December 31, 2006, the $91.7 million of bank trust preferred securities classified as available for sale had a cost basis of $91.2 million.
During 2004, we recorded a $2.0 million other-than-temporary impairment on two Freddie Mac floating-rate preferred stock securities with an aggregate carrying value of $8.8 million. We recorded the write-down because the current yield on these securities was below market interest rates, the fair value was below cost for an extended period, and a recovery in fair value was not assumed within a reasonably short period of time. We determined that an impairment charge on these securities was not necessary during 2006 and 2005.
Investment Subsidiary. The Bank has a wholly-owned subsidiary organized as a Nevada corporation that was acquired in the St. Francis acquisition. This subsidiary holds and manages a portfolio of our investment securities that are included in the tables above. At December 31, 2006, the Bank’s total investment in the Nevada subsidiary was approximately $448.5 million, and the subsidiary had assets of $448.9 million consisting primarily of mortgage-backed securities.
Wisconsin does not require consolidated tax returns and because the investment subsidiary is out of state, its income has not been subject to state income tax in Wisconsin. Representatives of the Wisconsin Department of Revenue have indicated that the Department may revoke its previously issued favorable tax rulings relating to such Nevada subsidiaries, even though there has not been any intervening change in law. The Department also has implemented a program for the audit of financial institutions operating in Wisconsin that have subsidiaries incorporated and located in Nevada and is asserting a basis for imposition of Wisconsin income taxes on income from those operations. Although the Bank is not currently under audit by the Department, we are in discussions with the Department concerning an agreement to finalize prior years’ tax liabilities relating to the Nevada subsidiary that remain subject to audit, which, if agreement is reached, may among other things place certain limitations on the operations of the Nevada subsidiary in future periods.
Other Investments. In addition to our investment securities and mortgage-backed securities portfolios, we maintain a portion of our assets in more liquid investments for daily liquidity management. Our liquid investments include interest-bearing deposits, primarily at the Federal Home Loan Bank of Chicago, federal funds sold and U.S. Government and federal agency obligations. We invest overnight federal funds with two large commercial banks in Chicago, based upon periodic review of these institutions’ financial condition. We generally limit overnight federal funds sold investments to $100.0 million at any one institution.
Deposits
We offer a variety of deposit accounts having a wide range of interest rates and terms. Our deposits consist of passbook accounts, interest-bearing and non-interest bearing checking accounts, money market and certificate accounts. We rely primarily on competitive pricing policies, advertising, and customer service to attract and retain deposits. The flow of deposits is influenced significantly by general economic conditions, changes in money market and prevailing interest rates, and competition. At December 31, 2006, core deposits, defined as commercial and non-interest bearing checking accounts, interest-bearing checking accounts, money market accounts and passbooks, accounted for approximately 49.4% of our total deposits. While this core deposit ratio is lower than our core deposit ratio of 53.4% at December 31, 2005, reflecting our pricing strategies in the face of rising interest rates during the year, we continue to benefit from a favorable core deposit ratio.
15
The following table sets forth the composition of deposits by type at the dates indicated and the change in the dollar amount of our deposits for the periods shown:
| At or For the Year Ended December 31, 2006 | At or For the Year Ended December 31, 2005 | At or For the Year Ended December 31, 2004 | |||||||||||||||||||||||||||||||||||||||||||||||||||||||||
|---|---|---|---|---|---|---|---|---|---|---|---|---|---|---|---|---|---|---|---|---|---|---|---|---|---|---|---|---|---|---|---|---|---|---|---|---|---|---|---|---|---|---|---|---|---|---|---|---|---|---|---|---|---|---|---|---|---|---|---|
| Amount | % of Deposits | Increase (Decrease) | Amount | % of Deposits | Increase (Decrease) | Amount | % of Deposits | ||||||||||||||||||||||||||||||||||||||||||||||||||||
| (Dollars in thousands) | |||||||||||||||||||||||||||||||||||||||||||||||||||||||||||
| Commercial checking | $ | 300,624 | 4 | .4% | $ | 41,992 | $ | 258,632 | 4 | .2% | $ | 19,383 | $ | 239,249 | 4 | .0% | |||||||||||||||||||||||||||||||||||||||||||
| Non-interest bearing checking | 303,480 | 4 | .3 | 12,018 | 291,462 | 4 | .7 | 40,893 | 250,569 | 4 | .2 | ||||||||||||||||||||||||||||||||||||||||||||||||
| Interest-bearing checking | 739,149 | 10 | .5 | (77,238 | ) | 816,387 | 13 | .2 | (155,622 | ) | 972,009 | 16 | .4 | ||||||||||||||||||||||||||||||||||||||||||||||
| Commercial money markets | 105,783 | 1 | .5 | 45,719 | 60,064 | 1 | .0 | (4,746 | ) | 64,810 | 1 | .1 | |||||||||||||||||||||||||||||||||||||||||||||||
| Money markets | 900,959 | 12 | .8 | 285,679 | 615,280 | 9 | .9 | 3,773 | 611,507 | 10 | .3 | ||||||||||||||||||||||||||||||||||||||||||||||||
| Passbooks | 1,113,980 | 15 | .9 | (154,700 | ) | 1,268,680 | 20 | .4 | (130,419 | ) | 1,399,099 | 23 | .6 | ||||||||||||||||||||||||||||||||||||||||||||||
| Total core deposits | 3,463,975 | 49 | .4 | 153,470 | 3,310,505 | 53 | .4 | (226,738 | ) | 3,537,243 | 59 | .6 | |||||||||||||||||||||||||||||||||||||||||||||||
| Certificates of deposit | 3,554,317 | 50 | .6 | 668,319 | 2,885,998 | 46 | .6 | 490,393 | 2,395,605 | 40 | .4 | ||||||||||||||||||||||||||||||||||||||||||||||||
| Unamortized premium | (282 | ) | — | (1,282 | ) | 1,000 | — | (1,860 | ) | 2,860 | — | ||||||||||||||||||||||||||||||||||||||||||||||||
| Total deposits | $ | 7,018,010 | 100 | .0% | $ | 820,507 | $ | 6,197,503 | 100 | .0% | $ | 261,795 | $ | 5,935,708 | 100 | .0% | |||||||||||||||||||||||||||||||||||||||||||
The following table sets forth the distribution and the weighted-average interest rates of our average deposits for the years indicated:
| Year Ended | ||||||||||||||||||||||||||||||||||||||||||||||||||||||||||||||
|---|---|---|---|---|---|---|---|---|---|---|---|---|---|---|---|---|---|---|---|---|---|---|---|---|---|---|---|---|---|---|---|---|---|---|---|---|---|---|---|---|---|---|---|---|---|---|---|---|---|---|---|---|---|---|---|---|---|---|---|---|---|---|
| December 31, 2006 | December 31, 2005 | December 31, 2004 | ||||||||||||||||||||||||||||||||||||||||||||||||||||||||||||
| Average Balance | Percent of Total Deposits | Weighted Average Rate | Average Balance | Percent of Total Deposits | Weighted Average Rate | Average Balance | Percent of Total Deposits | Weighted Average Rate | ||||||||||||||||||||||||||||||||||||||||||||||||||||||
| (Dollars in thousands) | ||||||||||||||||||||||||||||||||||||||||||||||||||||||||||||||
| Commercial checking | $ | 295,021 | 4.33 | % | — | $ | 266,948 | 4 | .40% | — | $ | 236,300 | 4 | .15% | — | |||||||||||||||||||||||||||||||||||||||||||||||
| Non-interest bearing checking | 285,961 | 4.20 | — | 257,524 | 4 | .24 | — | 226,661 | 3 | .98 | — | |||||||||||||||||||||||||||||||||||||||||||||||||||
| Interest-bearing checking | 763,530 | 11.22 | 1.06 | 860,332 | 14 | .17 | 0 | .93 | 824,603 | 14 | .49 | 0 | .84 | |||||||||||||||||||||||||||||||||||||||||||||||||
| Commercial money markets | 84,846 | 1.25 | 3.88 | 75,911 | 1 | .25 | 2 | .39 | 72,062 | 1 | .27 | 1 | .13 | |||||||||||||||||||||||||||||||||||||||||||||||||
| Money markets | 719,439 | 10.57 | 2.98 | 656,092 | 10 | .81 | 1 | .77 | 690,950 | 12 | .14 | 0 | .76 | |||||||||||||||||||||||||||||||||||||||||||||||||
| Passbooks | 1,237,691 | 18.18 | 0.69 | 1,347,958 | 22 | .21 | 0 | .58 | 1,364,904 | 24 | .00 | 0 | .58 | |||||||||||||||||||||||||||||||||||||||||||||||||
| Total checking, money market | ||||||||||||||||||||||||||||||||||||||||||||||||||||||||||||||
| and passbook accounts | 3,386,488 | 49.75 | 1.22 | 3,464,765 | 57 | .08 | 0 | .85 | 3,415,480 | 60 | .03 | 0 | .62 | |||||||||||||||||||||||||||||||||||||||||||||||||
| Certificates with original | ||||||||||||||||||||||||||||||||||||||||||||||||||||||||||||||
| maturities of: | ||||||||||||||||||||||||||||||||||||||||||||||||||||||||||||||
| 6 months or less | 388,929 | 5.71 | 3.93 | 419,368 | 6 | .91 | 2 | .49 | 406,613 | 7 | .15 | 1 | .25 | |||||||||||||||||||||||||||||||||||||||||||||||||
| 7 to 12 months | 1,514,043 | 22.25 | 4.40 | 830,933 | 13 | .69 | 3 | .13 | 730,816 | 12 | .85 | 2 | .26 | |||||||||||||||||||||||||||||||||||||||||||||||||
| Greater than 1 to 3 years | 1,327,713 | 19.50 | 4.10 | 1,159,786 | 19 | .11 | 2 | .98 | 956,551 | 16 | .81 | 2 | .41 | |||||||||||||||||||||||||||||||||||||||||||||||||
| Greater than 3 years | 190,115 | 2.79 | 4.19 | 195,083 | 3 | .21 | 4 | .19 | 179,802 | 3 | .16 | 4 | .36 | |||||||||||||||||||||||||||||||||||||||||||||||||
| Total certificates of | ||||||||||||||||||||||||||||||||||||||||||||||||||||||||||||||
| deposits | 3,420,800 | 50.25 | 4.22 | 2,605,170 | 42 | .92 | 3 | .04 | 2,273,782 | 39 | .97 | 2 | .31 | |||||||||||||||||||||||||||||||||||||||||||||||||
| Total average deposits | ||||||||||||||||||||||||||||||||||||||||||||||||||||||||||||||
| $ | 6,807,288 | 100.00 | % | 2.73 | $ | 6,069,935 | 100 | .00% | 1 | .79 | $ | 5,689,262 | 100 | .00% | 1 | .29 | ||||||||||||||||||||||||||||||||||||||||||||||
The following table presents, by various interest rate categories, the amount of our certificates of deposit outstanding at December 31, 2006, 2005, and 2004, and the periods to maturity of the certificates of deposit outstanding at December 31, 2006. Certificates of deposit in our portfolio represent predominately retail deposits attracted from households in our market areas as we have not sought to attract internet certificates of deposit nor have we pursued brokered certificates of deposit as a funding source. For this reason we believe our certificate of deposit portfolio reflects a stable part of our deposit base.
| At December 31, | Time to Maturity at December 31, 2006 | |||||||||||||||||||||||||||||||||||||||||||||||
|---|---|---|---|---|---|---|---|---|---|---|---|---|---|---|---|---|---|---|---|---|---|---|---|---|---|---|---|---|---|---|---|---|---|---|---|---|---|---|---|---|---|---|---|---|---|---|---|---|
| 2006 | 2005 | 2004 | Within One Year | 1 to 3 Years | Over 3 Years | Total | ||||||||||||||||||||||||||||||||||||||||||
| (Dollars in thousands) | ||||||||||||||||||||||||||||||||||||||||||||||||
| Certificates of deposit: | ||||||||||||||||||||||||||||||||||||||||||||||||
| Up to 2.99% | $ | 52,119 | 491,212 | 1,753,439 | $ | 41,665 | 10,350 | 104 | 52,119 | |||||||||||||||||||||||||||||||||||||||
| 3.00% to 3.99% | 406,470 | 1,505,743 | 394,822 | 280,659 | 116,743 | 9,068 | 406,470 | |||||||||||||||||||||||||||||||||||||||||
| 4.00% to 4.99% | 1,377,666 | 852,544 | 180,784 | 1,166,747 | 169,745 | 41,174 | 1,377,666 | |||||||||||||||||||||||||||||||||||||||||
| 5.00% and greater | 1,718,062 | 36,499 | 66,560 | 1,295,565 | 416,336 | 6,161 | 1,718,062 | |||||||||||||||||||||||||||||||||||||||||
| Total | $ | 3,554,317 | 2,885,998 | 2,395,605 | $ | 2,784,636 | 713,174 | 56,507 | 3,554,317 | |||||||||||||||||||||||||||||||||||||||
At December 31, 2006, we had outstanding $1.04 billion in certificate of deposit accounts in amounts of $100,000 or more maturing as follows:
| Period to Maturity | Amount | ||||
|---|---|---|---|---|---|
| (Dollars in thousands) | |||||
| Three months or less | $ | 343,910 | |||
| Over three through six months | 249,082 | ||||
| Over six through 12 months | 231,730 | ||||
| Over 12 months | 219,707 | ||||
| Total | $ | 1,044,429 | |||
16
Borrowed Funds and Junior Subordinated Debentures
The following table is a summary of the Company's borrowed funds and junior subordinated debentures at December 31, 2006 and 2005. The unamortized premium (discount) was recorded as a result of purchase accounting adjustments for the acquisitions of St. Francis in 2003 and EFC in 2006.
| At December 31, 2006 | At December 31, 2005 | ||||||||||||||||||||||||||||
|---|---|---|---|---|---|---|---|---|---|---|---|---|---|---|---|---|---|---|---|---|---|---|---|---|---|---|---|---|---|
| Interest Rate Range | Weighted Average Rate | Amount | Weighted Average Rate | Amount | |||||||||||||||||||||||||
| (Dollars in thousands) | |||||||||||||||||||||||||||||
| Fixed-rate advances from FHLBC | |||||||||||||||||||||||||||||
| due: | |||||||||||||||||||||||||||||
| Within 1 year | 2.76 - 5.14% | 4 | .21% | $ | 945,000 | 3 | .48% | $ | 510,000 | ||||||||||||||||||||
| 1 to 2 years | 2.78 - 5.24 | 4 | .44 | 564,000 | 4 | .19 | 767,000 | ||||||||||||||||||||||
| 2 to 3 years | 3.53 - 4.85 | 4 | .52 | 36,000 | 4 | .70 | 713,000 | ||||||||||||||||||||||
| 3 to 4 years | 4.28 - 4.28 | 4 | .28 | 50,000 | 5 | .43 | 76,000 | ||||||||||||||||||||||
| 4 to 5 years | 4.36 - 4.36 | 4 | .36 | 10,000 | 3 | .85 | 155,000 | ||||||||||||||||||||||
| Total fixed-rate advances | 2.76 - 5.24 | 4 | .30 | 1,605,000 | 4 | .21 | 2,221,000 | ||||||||||||||||||||||
| Adjustable-rate advances from FHLBC due: | |||||||||||||||||||||||||||||
| Within 1 year | 5.29 - 5.52 | 5 | .33 | 550,000 | 4 | .44 | 150,000 | ||||||||||||||||||||||
| 1 to 2 years | — | — | — | 4 | .39 | 100,000 | |||||||||||||||||||||||
| Total adjustable-rate | |||||||||||||||||||||||||||||
| advances | 5.29 - 5.52 | 5 | .33 | 550,000 | 4 | .42 | 250,000 | ||||||||||||||||||||||
| Total advances from FHLBC | 2.76 - 5.52 | 4 | .56 | 2,155,000 | 4 | .23 | 2,471,000 | ||||||||||||||||||||||
| Unsecured term bank loan | 6 | .32 | 147,500 | 5 | .14 | 63,000 | |||||||||||||||||||||||
| Other borrowings | 4 | .91 | 470,750 | 4 | .20 | 523,379 | |||||||||||||||||||||||
| Junior subordinated debentures | 6 | .92 | 67,011 | 6 | .05 | 67,011 | |||||||||||||||||||||||
| Unamortized premium | — | (58 | ) | — | 290 | ||||||||||||||||||||||||
| Total borrowed funds and | |||||||||||||||||||||||||||||
| junior subordinated | |||||||||||||||||||||||||||||
| debentures | 4 | .77% | $ | 2,840,203 | 4 | .28% | $ | 3,124,680 | |||||||||||||||||||||
Federal Home Loan Bank of Chicago Advances. Although deposits are our primary source of funds, our membership in the FHLBC has provided us another attractive funding source. We obtain advances from the FHLBC secured by our capital stock investment in the FHLBC and a blanket pledge of certain of our residential mortgage loans. See “Regulation and Supervision — Federal Home Loan Bank System.” We borrow under several different credit programs, each of which has its own interest rate and range of maturities. The maximum amount that the FHLBC will advance to member institutions, including the Bank, for purposes other than meeting withdrawals, fluctuates from time to time in accordance with the policies of the FHLBC. The maximum amount of FHLBC advances to a member institution generally is reduced by secured borrowings from any other source. At December 31, 2006, the Bank’s FHLBC advances totaled $2.16 billion, or 19.4% of our total assets, compared to $2.47 billion, or 23.6% of total assets at December 31, 2005.
Included in FHLBC advances at December 31, 2006 are $40.0 million of fixed-rate advances with original scheduled maturities of 10 years at interest rates ranging from 5.12% to 5.24%, which are callable quarterly at the discretion of the FHLBC until maturity and are currently expected to be put which may require us to refinance these borrowings. At inception, we receive a lower cost of borrowing on such advances than on similar-termed non-callable advances, in return for granting the FHLBC the option to call the advances prior to their final maturity. If called, the FHLBC will provide replacement funding, should we want or need to refinance the borrowing, at the then prevailing market rate of interest for the remaining term to maturity of the advances, subject to standard terms and conditions.
The interest rate on $100.0 million of adjustable-rate advances is tied to the Prime rate and ranges from Prime minus 280 basis points to prime minus 287 basis points. At December 31, 2006, we had a $50.0 million adjustable-rate advance that is indexed at three-month London interbank offering rate (“LIBOR”) minus 6 basis points. The remaining $400.0 million of adjustable-rate advances is indexed at the FHLBC effective federal funds rate minus 3 basis points, which was 5.29% at December 31, 2006. This borrowing was funded in late December as part of the balance sheet restructuring transaction and was repaid in January 2007 with the proceeds from the sale of investments and mortgage-backed securities.
Reverse Repurchase Agreements. We enter into sales of securities under agreements to repurchase the identical securities (“reverse repurchase agreements”) with nationally recognized primary securities dealers. These reverse repurchase agreements are treated as financings and are reflected on our balance sheet as other borrowings. The securities underlying the agreements are delivered to the
17
dealers who arrange the transaction and continue to be reflected as assets on our balance sheet. The following table presents certain information regarding reverse repurchase agreements as of the end of and for the periods indicated:
| Year Ended December 31, | |||||||||||||||||
|---|---|---|---|---|---|---|---|---|---|---|---|---|---|---|---|---|---|
| 2006 | 2005 | 2004 | |||||||||||||||
| (Dollars in thousands) | |||||||||||||||||
| Balance at end of period | $ | 400,000 | 500,000 | 300,000 | |||||||||||||
| Maximum month-end balance | 550,000 | 500,000 | 300,000 | ||||||||||||||
| Average balance | 442,260 | 394,931 | 195,492 | ||||||||||||||
| Weighted average rate at end of | |||||||||||||||||
| period | 4.94 | % | 4.24 | 2.42 | |||||||||||||
| Weighted average rate on average | |||||||||||||||||
| balance | 4.67 | 3.41 | 1.69 | ||||||||||||||
At December 31, 2006, $300 million of the reverse repurchase agreements were floating-rate and have maturities ranging from three months to four years. The interest rate on $75 million of these agreements is tied to Prime and ranges from Prime minus 280 basis points to Prime minus 284 basis points. The remaining $225 million have interest rates ranging from three-month LIBOR minus 26 basis points to three-month LIBOR minus 58.5 basis points. The LIBOR-indexed repurchase agreements are putable at the discretion of the lender quarterly in 2007 and are currently expected to be put which may require us to refinance these borrowings. At December 31, 2006, reverse repurchase agreements were collateralized by investment and collateralized mortgage obligation (“CMO”) securities with a carrying value of $429.7 million and a market value of $425.8 million. We intend to continue to use reverse repurchase agreements as an additional funding source.
Retail Repurchase Agreements. For certain customers with significant funds available for deposit at the Bank, we offer “retail” repurchase agreements under which we collateralize our obligation to repay the customer funds with U.S. government or agency securities. The retail repurchases, which totaled $69.8 million at December 31, 2006, are collateralized by three U.S. government agency and ten CMO securities with a carrying and fair value of $74.7 million.
Unsecured Term Bank Loan and Line of Credit. During 2006, we twice refinanced the unsecured term bank loan and revolving line of credit that we maintain from an unaffiliated lender to increase our holding company borrowings. The first refinancing was to fund a portion of our acquisition of EFC Bancorp, Inc. and the second quarter refinancing was to fund a portion of our stock buyback program.
We increased our unsecured term bank loan from $63.0 million outstanding at December 31, 2005, to $155.0 million during 2006 and increased our revolving line of credit from $55.0 million to $60.0 million. We made a scheduled principal payment on the term loan of $7.5 million on December 31, 2006 reducing the balance to $147.5 million. At December 31, 2006 and 2005, there were no amounts outstanding under the line. The loan agreement provides for an interest rate on the term loan at our option of one, two, three, six or twelve-month LIBOR plus 95 basis points. The term loan is unsecured and matures on December 31, 2015, with the next scheduled payment of principal due on December 31, 2007, and annually thereafter. Prepayments of principal are allowed without penalty at the end of any repricing period.
The revolving line of credit is also unsecured, bears an interest rate at our option at Prime minus .50% or one, two, three, six or twelve-month LIBOR plus 80 basis points and matures on June 30, 2007.
The credit agreement for both the unsecured term loan and the secured revolving line of credit contains covenants that, among other things, require the Company to maintain a minimum stockholders’ equity balance and to obtain certain minimum operating results, as well as requiring the Bank to maintain “well capitalized” regulatory capital levels and certain non-performing asset ratios. In addition, the Company has agreed to certain restrictions on additional indebtedness and agreed not to pledge any stock of the Bank or MAF Developments for any purpose.
18
Junior Subordinated Debentures. In 2005, we issued $67.0 million of junior subordinated debentures through two privately-offered trust preferred financings. This debt, which matures in 30 years and is callable at par in 2010, provides an attractive alternative to equity capital. Interest on the junior subordinated debentures is payable quarterly at a floating rate tied to three-month LIBOR and is tax deductible. At December 31, 2006, the interest rate for $30.9 million of the debentures was 7.11% and for $36.1 million was 6.76%.
Real Estate Development
We engage in the business of purchasing unimproved land for development into residential subdivisions of single-family lots through MAFD, a wholly-owned subsidiary of the Company. We started this business in 1974 and since that time have developed and sold over 6,600 lots in 24 different subdivisions primarily in the western suburbs of Chicago. MAFD typically acts as sole principal or as a joint venture partner in our development projects. Historically, we have provided essentially all of the capital for a joint venture and receive in exchange an ownership interest in the joint venture which entitles us to a market rate of return on invested capital plus a percentage of the profit or loss generated by the project, generally 50-60%, with the exact percentage based upon a number of factors, including characteristics of the venture, the perceived risks involved, and the time to completion. In addition, MAFD from time to time invests in residential real estate projects, either individually or structured as limited partnership investments, managed by unaffiliated parties.
Springbank of Plainfield. Currently, our only active development is our Springbank project. This joint venture project consists of 950 acres in Plainfield, Illinois, located in Will County, southwest of Chicago along the fast-developing I-55 corridor. Delayed receipt of local zoning and plan approvals in 2005 and 2006 has prolonged the original timeline expected for lot sale closings in the project. Based on the current plans for this project, future development costs are currently estimated to be $78.0 million. The investment balance shown in the table above includes land purchases, engineering, survey and other development costs incurred to date. With the recent weakness in new and existing home sales, development of this project is currently expected to continue over the next four to six years.
| At December 31, 2006 | |||||||||||||||||||||||
|---|---|---|---|---|---|---|---|---|---|---|---|---|---|---|---|---|---|---|---|---|---|---|---|
| Description of Project | Number of Lots Closed to Date | Number of Lot Sales Pending | Lots Remaining For Sale(1) | Investment Balance | |||||||||||||||||||
| (Dollars in thousands) | |||||||||||||||||||||||
| Springbank of Plainfield | |||||||||||||||||||||||
| 1,599 residential lots; 281 multi-family units and | |||||||||||||||||||||||
| 45.8 acres for commercial development | 206 | 33 | 1,360 | $ | 74,201 | ||||||||||||||||||
| Other(2) | — | — | — | 8,848 | |||||||||||||||||||
| $ | 83,049 | ||||||||||||||||||||||
| (1) | Lots remaining for sale reflects planned single-family lots in the current project that have not yet been sold and does not include commercial or multi-family units. The units are being developed in phases, and lots are generally not offered for sale until unit development is near completion. |
| (2) | Reflects investment in 160 acres of unimproved land for potential future development. Development plan has not yet been established. |
Regulation and Supervision
General. The Company, as a savings and loan holding company, is required to file certain reports with, and otherwise comply with the rules and regulations of, the OTS under the Home Owners’ Loan Act, or the HOLA. In addition, the activities of savings institutions, like us, are governed by the HOLA and the Federal Deposit Insurance Act, or the FDI Act.
We are subject to extensive regulation, examination and supervision by the OTS, as our primary federal regulator, and the FDIC, as the deposit insurer. We are a member of the Federal Home Loan Bank System, or FHLBC System and our deposit accounts are insured up to applicable limits by the Deposit Insurance Fund, or SAIF, managed by the FDIC. We must file reports with the OTS and the FDIC concerning our activities and financial condition in addition to obtaining regulatory approvals prior to entering into certain transactions such as mergers with, or acquisitions of, other savings institutions. The OTS and/or the FDIC conduct periodic examinations to test our compliance with various regulatory requirements. This regulation and supervision establishes a comprehensive framework of activities in
19
which an institution can engage and is intended primarily for the protection of the insurance fund and depositors. The regulatory structure also gives the regulatory authorities extensive discretion in connection with their supervisory and enforcement activities and examination policies, including policies with respect to the classification of assets and the establishment of adequate loan loss reserves for regulatory purposes. Any change in such regulatory requirements and policies, whether by the OTS, the FDIC or the Congress, could have a material adverse impact on our operations. Certain regulatory requirements applicable to us are referred to below or elsewhere herein. The description of statutory provisions and regulations applicable to savings institutions and their holding companies set forth in this Form 10-K does not purport to be a complete description of such statutes and regulations and their effects on our business.
Holding Company Regulation. The Company is a non-diversified unitary savings and loan holding company within the meaning of the HOLA. As a unitary savings and loan holding company, the Company generally will not be restricted under existing laws as to the types of business activities in which it may engage, provided that we continue to be a qualified thrift lender, or QTL. See “Federal Savings Institution Regulation — QTL Test.” Upon any non-supervisory acquisition by the Company of another savings institution or savings bank that meets the QTL test and is deemed to be a savings institution by the OTS, the Company would become a multiple savings and loan holding company (if the acquired institution is held as a separate subsidiary) and would be subject to limitations on the types of business activities in which it could engage. The HOLA limits the activities of a multiple savings and loan holding company and its uninsured institution subsidiaries primarily to activities permissible for bank holding companies under Section 4(c)(8) of the Bank Holding Company Act of 1956, as amended, or the BHC Act, subject to the prior approval of the OTS, and activities authorized by OTS regulation. No multiple savings and loan holding company may acquire more than 5% of the voting stock of a company engaged in impermissible activities.
The HOLA prohibits a savings and loan holding company, directly or indirectly, or through one or more subsidiaries, from acquiring more than 5% of the voting stock of another savings institution or holding company thereof, without prior written approval of the OTS; or acquiring or retaining control of a depository institution that is not insured by the FDIC. In evaluating applications by holding companies to acquire savings institutions, the OTS must consider the financial and managerial resources and future prospects of the company and institution involved the effect of the acquisition on the institution, the risk to the insurance funds, the convenience and needs of the community and competitive factors.
Although savings and loan holding companies are not subject to specific capital requirements or specific restrictions on the payment of dividends or other capital distributions, HOLA does prescribe such restrictions on subsidiary savings institutions, as described below. We must notify the OTS 30 days before declaring any dividend to the Company. In addition, the financial impact of a holding company on its subsidiary institution is a matter that is evaluated by the OTS and the agency has authority to order cessation of activities or divestiture of uninsured subsidiaries deemed to pose a threat to the safety and soundness of the institution.
Federal Savings Institution Regulation
Capital Requirements. The OTS capital regulations require savings institutions to meet three minimum capital standards: a 1.5% tangible capital ratio, a 3% leverage (core capital) ratio for institutions receiving the highest rating on the CAMEL financial institution rating system, and a 4% leverage (core capital) ratio for all other institutions, like the Bank, and an 8% risk-based capital ratio. In addition, the prompt corrective action standards discussed below also establish, in effect, a minimum 2% tangible capital standard, a 4% leverage (core capital) ratio (3% for institutions receiving the highest rating on the CAMEL financial institution rating system), and, together with the risk-based capital standard itself, a 4% Tier I risk-based capital standard. The OTS regulations also require that, in meeting the leverage ratio, tangible and risk-based capital standards, institutions must generally deduct investments in and loans to subsidiaries engaged in activities as principal that are not permissible for a national bank. The risk-based capital standard for savings institutions requires the maintenance of Tier I (core) and total capital (which is defined as core capital and supplementary capital) to risk-weighted assets of at least 4% and 8%, respectively.
20
At December 31, 2006 and 2005, the Bank was in compliance with the current capital requirements as follows:
| At December 31, 2006 | At December 31, 2005 | ||||||||||||||||||||||
|---|---|---|---|---|---|---|---|---|---|---|---|---|---|---|---|---|---|---|---|---|---|---|---|
| Amount | Percent of Assets | Amount | Percent of Assets | ||||||||||||||||||||
| (Dollars in thousands) | |||||||||||||||||||||||
| Stockholder's equity of the Bank | $ | 1,191,066 | 10 | .81% | $ | 1,012,304 | 9 | .72% | |||||||||||||||
| Tangible capital of the Bank | $ | 789,888 | 7 | .44% | $ | 715,105 | 7 | .07% | |||||||||||||||
| Tangible capital requirement | 159,286 | 1 | .50 | 151,807 | 1 | .50 | |||||||||||||||||
| Excess | $ | 630,602 | 5 | .94% | $ | 563,298 | 5 | .57% | |||||||||||||||
| Core capital of the Bank | $ | 789,888 | 7 | .44% | $ | 715,105 | 7 | .07% | |||||||||||||||
| Core capital requirement | 424,763 | 4 | .00 | 404,818 | 4 | .00 | |||||||||||||||||
| Excess | $ | 365,125 | 3 | .44% | $ | 310,287 | 3 | .07% | |||||||||||||||
| Core and supplementary capital of the | |||||||||||||||||||||||
| Bank | $ | 804,554 | 11 | .01% | $ | 735,996 | 11 | .15% | |||||||||||||||
| Risk based capital requirement | 584,478 | 8 | .00 | 528,112 | 8 | .00 | |||||||||||||||||
| Excess | $ | 220,076 | 3 | .01% | $ | 207,884 | 3 | .15% | |||||||||||||||
| Total Bank assets | $ | 11,020,484 | $ | 10,417,886 | |||||||||||||||||||
| Adjusted total Bank assets | 10,619,074 | 10,120,457 | |||||||||||||||||||||
| Total risk weighted Bank assets | 7,707,379 | 6,898,826 | |||||||||||||||||||||
| Adjusted total risk weighted Bank | |||||||||||||||||||||||
| assets | 7,305,969 | 6,601,398 | |||||||||||||||||||||
The following table reflects the adjustments required to reconcile the Bank’s stockholder’s equity to the Bank’s regulatory capital at December 31, 2006:
| Tangible | Core | Risk-Based | |||||||||||||||
|---|---|---|---|---|---|---|---|---|---|---|---|---|---|---|---|---|---|
| (Dollars in thousands) | |||||||||||||||||
| Stockholder's equity of the Bank | $ | 1,191,066 | $ | 1,191,066 | $ | 1,191,066 | |||||||||||
| Goodwill and core deposit intangibles | (407,312 | ) | (407,312 | ) | (407,312 | ) | |||||||||||
| Non-permissible subsidiary deduction | (400 | ) | (400 | ) | (400 | ) | |||||||||||
| Non-includible purchased mortgage | |||||||||||||||||
| servicing rights | (1,755 | ) | (1,755 | ) | (1,755 | ) | |||||||||||
| Adjustment for available for | |||||||||||||||||
| sale securities | 8,289 | 8,289 | 8,289 | ||||||||||||||
| Recourse on loan sales | — | — | (25,265 | ) | |||||||||||||
| General allowance for loan losses | — | — | 39,931 | ||||||||||||||
| Regulatory capital of the Bank | $ | 789,888 | $ | 789,888 | $ | 804,554 | |||||||||||
Prompt Corrective Regulatory Action. Under the OTS prompt corrective action regulations, the OTS is required to take certain supervisory actions against undercapitalized institutions, the severity of which depends upon the institution’s degree of undercapitalization. For this purpose, a savings association is placed in one of the following five categories based on its capital:
| o “well capitalized” if its ratio of total capital to risk-weighted assets is at least 10%, its ratio of Tier I (core) capital to risk-weighted assets is at least 6%, its ratio of core capital to total assets is at least 5%, and it is not subject to any order or directive by the OTS to meet a specific capital level; |
| o “adequately capitalized” if its ratio of total capital to risk-weighted assets is at least 8%, its ratio of Tier I (core) capital to risk-weighted assets is at least 4%, its ratio of core capital to total assets is at least 4% (3% if the institution receives highest rating on the CAMELS financial institution rating system) and it does not meet the definition of “well capitalized”; |
| o “undercapitalized” if its ratio of total capital to risk-weighted assets is less than 8%, its ratio of Tier I (core) capital to risk-weighted assets is less than 4% or its ratio of core capital to total assets is less than 4% (3% or less for institutions with highest rating on the CAMELS financial institution rating system); |
| o “significantly undercapitalized” if its ratio of total capital to risk-weighted assets is less than 6%, its ratio of Tier I (core) capital to risk-weighted assets is less than 3% or its ratio of core capital to total assets is less than 3%; or |
| o “critically undercapitalized” if its tangible capital to assets ratio is equal to or less than 2%. |
Subject to a narrow exception, the OTS is required to appoint a receiver or conservator within specified time frames for an institution that is “critically undercapitalized.” The regulation also provides
21
that a capital restoration plan must be filed with the OTS within 45 days of the date a savings institution receives notice that it is “undercapitalized,” “significantly undercapitalized” or “critically undercapitalized.” Compliance with the plan must be guaranteed by any parent holding company. In addition, numerous mandatory supervisory actions become immediately applicable to an undercapitalized institution, including, but not limited to, increased monitoring by regulators and restrictions on growth, investment activities, capital distributions and expansion. The OTS could also take any one of a number of discretionary supervisory actions against undercapitalized institutions, including the issuance of a capital directive and the replacement of senior executive officers and directors.
At December 31, 2006, the Bank met the criteria for being considered “well capitalized.”
Insurance of Deposit Accounts. The Bank’s deposits are insured up to applicable limits by the Deposit Insurance Fund, or DIF, of the FDIC. The DIF is the successor to the Bank Insurance Fund and the Savings Association Insurance Fund, which were merged in 2006. The Bank’s deposits, therefore, are subject to FDIC deposit insurance assessment.
The FDIC recently amended its risk-based deposit assessment system for 2007 to implement authority granted by the Federal Deposit Insurance Reform Act of 2005, or the Reform Act. Under the revised system, insured institutions are assigned to one of four risk categories based on supervisory evaluations, regulatory capital levels and certain other factors. An institution’s assessment rate depends upon the category to which it is assigned. Risk Category I, which contains the least risky depository institutions, is expected to include more than 90% of all institutions. Unlike the other categories, Risk Category I contains further risk differentiation based on the FDIC’s analysis of financial ratios, examination component ratings and other information. Assessment rates are determined by the FDIC and currently range from five to seven basis points for the healthiest institutions (Risk Category I) to 43 basis points of assessable deposits for the riskiest (Risk Category IV). The FDIC may adjust rates uniformly from one quarter to the next, except that no single adjustment can exceed three basis points.
The FDIC is authorized to set the reserve ratio for the DIF annually at between 1.15% and 1.5% of estimated insured deposits, in contrast to the statutorily fixed ratio of 1.25% under the old system. The ratio, which is viewed by the FDIC as the level that the funds should achieve, was established by the agency at 1.25% for 2007. The Reform Act also provided for the possibility that the FDIC may pay dividends to insured institutions once the DIF reserve ratio equals or exceeds 1.35% of estimated insured deposits. The Reform Act also provided for a one-time credit for eligible institutions based on their assessment base as of December 1996. Subject to certain limitations with respect to institutions that are exhibiting weaknesses, credits can be used to offset future assessments until exhausted. The Bank’s one-time credit is estimated by the FDIC to be approximately $6.5 million.
In addition to the assessment for deposit insurance, institutions are required to make payments on bonds issued in the late 1980‘s by the Financing Corporation, or FICO, to recapitalize the predecessor to the Savings Association Insurance Fund. The payment is established quarterly and during the calendar year ending December 31, 2006 averaged 1.28 basis points of assessable deposits.
The Bank’s total assessment paid for this period (including the FICO payments) was $907,000. The FDIC has the authority and is expected to increase insurance assessments as described above. A significant increase in insurance premiums would likely have an adverse effect on the operating expenses and results of operations of the Bank. Management can not predict what insurance assessment rates will be in the future.
Under the FDI Act, insurance of deposits may be terminated by the FDIC upon a finding that the institution has engaged in unsafe or unsound practices, is in an unsafe or unsound condition to continue operations or has violated any applicable law, regulation, rule, order or condition imposed by the FDIC or the OTS. Our management does not know of any practice, condition or violation that might lead to termination of deposit insurance.
Community Reinvestment. Under the Community Reinvestment Act, or the CRA, every insured depository institution, including the Bank, has a continuing and affirmative obligation, consistent with its safe and sound operation, to help meet the credit needs of its entire community, including low- and moderate-income neighborhoods. The CRA does not establish specific lending requirements or programs for financial institutions, or limit an institution’s discretion to develop the types of products and services that it believes are best suited to its particular community that are consistent with the CRA. Institutions are rated on their performance in meeting the needs of their communities. Performance is tested in three
22
areas: (a) lending, which evaluates the institution’s record of making loans in its assessment areas; (b) investment, which evaluates the institution’s record of investing in community development projects, affordable housing and programs benefiting low- or moderate-income individuals and businesses; and (c) service, which evaluates the institution’s delivery of services to residents of its communities through its branches, ATMs and other offices. The CRA requires each federal banking agency, in connection with its examination of a financial institution, to assess and assign one of four ratings to the institution’s record of meeting the credit needs of its community and to take this record into account in evaluating certain applications by the institution, including applications for charters, branches and other deposit facilities, relocations, mergers, consolidations, acquisitions of assets or assumptions of liabilities, and savings and loan holding company acquisitions. The CRA also requires that all institutions publicly disclose their CRA ratings. The Bank received an “outstanding” rating on its CRA performance evaluation prepared by the OTS dated July 18, 2005, the most recent report we have received.
Gramm-Leach-Bliley Act. The Gramm-Leach-Bliley Act, or the GLB Act, significantly reformed various aspects of the financial services business, including, but not limited to: (i) the establishment of a new framework under which bank holding companies and, subject to numerous restrictions, banks can own securities firms, insurance companies and other financial companies; (ii) subjecting banks to the same securities regulation as other providers of securities products; and (iii) prohibiting new unitary savings and loan holding companies from engaging in nonfinancial activities or affiliating with non-financial entities.
The provisions in the GLB Act permitting full affiliations between bank holding companies or banks and other financial companies do not increase the Company’s authority to affiliate with securities firms, insurance companies or other financial companies. As a unitary savings and loan holding company, the Company was generally permitted to have such affiliations prior to the enactment of the GLB Act. It is expected, however, that these provisions will benefit the Company’s competitors.
The prohibition on the ability of new unitary savings and loan holding companies to engage in nonfinancial activities or affiliating with nonfinancial entities generally applies only to savings and loan holding companies that were not, or had not submitted an application to become, savings and loan holding companies as of May 4, 1999. Since the Company was treated as a unitary savings and loan holding company prior to that date, the GLB Act will not prohibit the Company from engaging in nonfinancial activities or acquiring nonfinancial subsidiaries. However, the GLB Act generally restricts any nonfinancial entity from acquiring the Company unless such nonfinancial entity was, or had submitted an application to become a savings and loan holding company as of May 4, 1999.
The GLB Act imposed new requirements on financial institutions with respect to customer privacy by generally prohibiting disclosure of customer information to non-affiliated third parties unless the customer has been given the opportunity to object and has not objected to such disclosure. Financial institutions are further required to disclose their privacy policies to customers annually. The Company has developed policies and procedures to comply with the implementing regulations promulgated by the OTS and the other federal regulators with regard to customer privacy.
To the extent the GLB Act permits banks, securities firms and insurance companies to affiliate, the financial services industry may experience further consolidation. This could result in a growing number of larger financial institutions that offer a wider variety of financial services than the Company currently offers and that can aggressively compete in the markets the Company currently serves.
USA Patriot Act of 2001/Bank Secrecy Act. The USA Patriot Act of 2001, or the Patriot Act, was enacted in response to the terrorist attacks that occurred on September 11, 2001. The Patriot Act is intended to strengthen U.S. law enforcement’s and the intelligence communities’ abilities to work cohesively to combat terrorism on a variety of fronts. The potential impact of the Patriot Act on financial institutions of all kinds is significant and wide ranging. By way of amendments to the Bank Secrecy Act, the Patriot Act contains sweeping anti-money laundering and financial transparency laws and requires various regulations, including standards for verifying customer identification at account opening, and rules to promote cooperation among financial institutions, regulators, and law enforcement entities in identifying parties that may be involved in terrorism or money laundering. Under the Bank Secrecy Act, a financial institution is required to have systems in place to detect certain transactions, based on the size and nature of the transaction. The OTS is required to consider a financial institution’s compliance with the Bank Secrecy Act when reviewing applications from financial institutions.
23
Loans to One Borrower. Under the HOLA, savings institutions are generally subject to the limits on loans to one borrower applicable to national banks. Generally, savings institutions may not make a loan or extend credit to a single or related group of borrowers in excess of 15% of its unimpaired capital and surplus. An additional amount may be lent, equal to 10% of unimpaired capital and surplus, if such loan is secured by readily marketable collateral, which is defined to include certain financial instruments and bullion. At December 31, 2006, our legal lending limit on loans to any one borrower was $122.0 million. At December 31, 2006, the Bank’s largest amount of loans to any one related borrower group was $68.4 million.
QTL Test. The HOLA requires savings institutions to meet a QTL test. Under the QTL test, a savings and loan association is required to either qualify as a “domestic building and loan association” under the Internal Revenue Code or maintain at least 65% of its “portfolio assets” (total assets less (i) specified liquid assets up to 20% of total assets; (ii) intangibles, including goodwill; and (iii) the value of property used to conduct business) in certain “qualified thrift investments” (primarily residential mortgages and related investments, including certain mortgage-backed securities) in at least 9 months out of each 12 month period. A savings institution that fails the QTL test is subject to certain operating restrictions and may be required to convert to a bank charter. As of December 31, 2006, the Bank maintained 83.3% of its portfolio assets in qualified thrift investments and, therefore, met the QTL test.
Limitation on Capital Distributions. OTS regulations impose limitations upon all capital distributions by a savings institution, such as cash dividends, payments to repurchase or otherwise acquire its shares, payments to shareholders of another institution in a cash out merger and other distributions charged against capital, if the institution would not be well-capitalized after the distribution. The regulations provide that an institution (i) which is not eligible for expedited treatment under the application processing rules of the OTS; or (ii) for which its total amount of capital distributions for the applicable calendar year exceeds its net income for that year to date plus its retained income for the preceding two years; or (iii) which would not be at least adequately capitalized following the distribution; or (iv) which would violate a prohibition contained in a statute, regulation or agreement between the institution and the OTS by performing the capital distribution, must submit an application to the OTS to receive approval of the capital distribution. Under any other circumstances, the Bank would be required to provide a written notice to the OTS 30 days prior to the capital distribution. As of December 31, 2006, the Bank’s capital distributions have met the foregoing conditions and no prior applications to the OTS have been required.
Assessments. Savings institutions are required to pay assessments to the OTS to fund the agency’s operations. The general assessments, paid on a semi-annual basis, are computed upon the savings institution’s total assets, including consolidated subsidiaries, as reported in the Bank’s latest quarterly thrift financial report. The assessments paid by the Bank were $1.6 million, $1.5 million and $1.3 million in 2006, 2005 and 2004, respectively.
Branching. OTS regulations permit nationwide branching by federally chartered savings institutions to the extent allowed by federal statute. Generally, a federal savings institution which meets the QTL test, may establish or acquire branches in states other than its home state. This permits federal savings institutions to establish interstate networks and to geographically diversify their loan portfolios and lines of business. The OTS authority preempts any state law purporting to regulate branching by federal savings institutions.
Transactions with Related Parties. The Bank’s authority to engage in transactions with related parties or “affiliates” (e.g., any company that controls or is under common control with an institution, including the Company and its non-savings institution subsidiaries) is limited by Sections 23A and 23B of the Federal Reserve Act, or FRA, and Regulation W thereunder. Section 23A limits the aggregate amount of covered transactions with any individual affiliate to 10% of the capital and surplus of the savings institution. The aggregate amount of covered transactions with all affiliates is limited to 20% of the savings institution’s capital and surplus. Certain transactions with affiliates are required to be secured by collateral in an amount and of a type described in Section 23A, and the purchase of low quality assets from affiliates is generally prohibited. Section 23B generally provides that certain transactions with affiliates, including loans and asset purchases, must be on terms and under circumstances, including credit standards, that are substantially the same or at least as favorable to the institution as those prevailing at the time for comparable transactions with non-affiliated companies. In addition, savings institutions are prohibited from lending to any affiliate that is engaged in activities that are not permissible
24
for bank holding companies and no savings institution may purchase the securities of any affiliate other than a subsidiary.
The Bank’s authority to extend credit to executive officers, directors and 10% shareholders, as well as entities such persons control, is governed by Sections 22(g) and 22(h) of the FRA and Regulation O thereunder. Among other things, such loans are generally required to be made on terms substantially the same as those offered to unaffiliated individuals and to not involve more than the normal risk of repayment. Regulation O also places individual and aggregate limits on the amount of loans the Bank may make to such persons based, in part, on the Bank’s capital position and requires certain board approval procedures to be followed.
Enforcement. Under the FDI Act, the OTS has primary enforcement responsibility over savings institutions and has the authority to bring actions against the institution and all “institution affiliated parties,” including certain shareholders, and any attorneys, appraisers and accountants who knowingly or recklessly participate in wrongful action likely to have an adverse effect on an insured institution. Formal enforcement action may range from the issuance of a capital directive or cease and desist order for removal of officers and/or directors to institution of proceedings for receivership, conservatorship or termination of deposit insurance. Civil penalties cover a wide range of violations and may amount to as much as $1 million per day in certain circumstances. Under the FDI Act, the FDIC has the authority to recommend to the Director of the OTS enforcement action to be taken with respect to a particular savings institution. If action is not taken by the Director, the FDIC has authority to take such action under certain circumstances. Federal law also establishes criminal penalties for certain violations.
Standards for Safety and Soundness. The federal banking agencies have adopted Interagency Guidelines Prescribing Standards for Safety and Soundness, or the Guidelines, and a final rule to implement safety and soundness standards required under the FDI Act. The Guidelines set forth the safety and soundness standards that the federal banking agencies use to identify and address problems at insured depository institutions before capital becomes impaired. The standards set forth in the Guidelines address internal controls and information systems; internal audit system; credit underwriting; loan documentation; interest rate risk exposure; asset growth; asset quality; earnings and compensation; fees and benefits. If the appropriate federal banking agency determines that an institution fails to meet any standard prescribed by the Guidelines, the agency may require the institution to submit to the agency an acceptable plan to achieve compliance with the standard, as required by the FDI Act. The OTS requires that a savings association file a written safety and soundness compliance plan within 30 days of receiving a request for a compliance plan from the OTS.
Consumer Lending Laws. We also are subject to many federal and state consumer protection statutes and regulations including the Equal Credit Opportunity Act, the Fair Housing Act, the Truth in Lending Act, the Truth in Savings Act, the Real Estate Settlement Procedures Act and the Home Mortgage Disclosure Act. Among other things, these acts:
| o require lenders to disclose credit terms in meaningful and consistent ways; |
| o prohibit discrimination against an applicant in any consumer or business credit transaction; |
| o prohibit discrimination in housing-related lending activities; |
| o require certain lenders to collect and report applicant and borrower data regarding loans for home purchases or improvement projects; |
| o require lenders to provide borrowers with information regarding the nature and cost of real estate settlements; |
| o prohibit certain lending practices and limit escrow account amounts with respect to real estate transactions; and |
| o prescribe possible penalties for violations of the requirements of consumer protection statutes and regulations. |
In addition to private actions by aggrieved borrowers or applicants for actual and punitive damages, the U.S. Department of Justice and other regulatory agencies can take enforcement action seeking injunctive and other equitable relief for alleged violations. The Bank is subject to an Agreed
25
Consent Order that it entered into on December 30, 2002, to resolve allegations by the Department of Justice that the Bank had violated the fair lending laws based on the level of the Bank’s lending in minority areas during the period 1996-2000. The Bank denied all alleged violations. The Agreed Consent Order requires the Bank to undertake a number of actions over the five year period of 2003-2008 to promote its home mortgage lending in communities with significant minority populations, including:
| o Open or acquire two branch offices in minority areas by June 30, 2005. |
| o Implement a targeted advertising campaign to increase home mortgage lending. |
| o Provide $10 million in benefits to borrowers under special lending programs to help residents of minority areas achieve home ownership (which may include subsidized interest rates, down payment and closing cost assistance, and Prime rate loans to borrowers with below Prime credit). |
| o Contribute $500,000 over the five year period 2003-2008 to homebuyer education and counseling programs, and conduct an assessment of the home mortgage credit needs of residents in minority areas. |
The Bank is in compliance with all terms of the Order. Since the Order was entered by the court, the Bank has opened two branch offices within minority areas, conducted an assessment of home mortgage credit needs of residents in minority areas, and implemented a targeted marketing campaign to increase mortgage lending. The Bank fully satisfied the $10 million financial benefits requirement in 2003 through special lending programs designed to help minority residents achieve homeownership and is continuing to offer special community lending programs targeted to minority and low-income borrowers in its market areas.
Federal Home Loan Bank System
The Bank is a member of the FHLBC System, which consists of 12 regional Federal Home Loan Banks. The FHLBC System provides a central credit facility primarily for member institutions. As a member of the FHLBC, the Bank is required to acquire and hold shares of capital stock in the FHLBC in an amount at least equal to 1% of the aggregate principal amount of its unpaid residential mortgage loans and similar obligations at the beginning of each year, or 1/20 of its advances (borrowings) from the FHLBC, whichever is greater. Regulatory directives, capital requirements and net income of the FHLBC affect its ability to pay dividends to us. In addition, the FHLBs are required to provide funds to cover certain obligations on bonds issued by the Resolution Funding Corporation to fund the resolution of insolvent thrifts and to contribute funds for affordable housing programs. These requirements could reduce the amount of dividends that the FHLBs pay to their members and could also result in the FHLBs imposing a higher rate of interest on advances to their members. From an average of 6.125% paid in 2004, the FHLBC has reduced its dividend to 3.10% in 2006.
We currently have an investment in FHLBC stock in excess of our required investment by approximately $38.7 million at December 31, 2006. Excess investments are redeemable at par upon notice to the FHLBC, subject to regulatory or capital constraints of the FHLBC. During 2006, we redeemed $31.9 million of FHLB stock. FHLBC has indicated that it is not currently redeeming additional stock, but we intend to redeem our excess investment if and when redemption opportunities resume.
At December 31, 2006, the Bank had advances from the FHLBC with aggregate outstanding principal balances of $2.16 billion, and the Bank’s investment in FHLBC stock totaled $146.4 million. FHLBC advances must be secured by specified types of collateral and are available to member institutions primarily for the purpose of providing funds for residential housing finance. We also sell mortgages to the FHLBC through the FHLBC’s MPF program. See the discussion under “Secondary Market and Loan Servicing Activities” for more information.
Federal Reserve System
The Federal Reserve Board regulations require savings institutions to maintain non-interest earning reserves against their transaction accounts (primarily checking accounts). The Federal Reserve Board regulations generally require that reserves be maintained against aggregate transaction accounts as follows: for accounts aggregating $45.8 million or less (subject to adjustment by the Federal Reserve Board) the reserve requirement is 3%; and for accounts greater than $45.8 million, the reserve
26
requirement is currently $1,119,000 plus 10% (subject to adjustment by the Federal Reserve Board) against that portion of total transaction accounts in excess of $45.8 million. The first $8.5 million of otherwise reserveable balances (subject to adjustments by the Federal Reserve Board) are exempted from the reserve requirements. The Bank is in compliance with the foregoing requirements. The balances maintained to meet the reserve requirements imposed by the Federal Reserve Board may be used to satisfy liquidity requirements imposed by the OTS.
Executive Officers of the Registrant
Information regarding the executive officers of the Company and the Bank are listed below.
| Name | Age | Year of Employment | Position and Background | |||||||||||
|---|---|---|---|---|---|---|---|---|---|---|---|---|---|---|
| Allen H. Koranda | 60 | 1972 | Chairman of the Board and Chief Executive Officer. | |||||||||||
| Kenneth Koranda | 57 | 1972 | Vice Chairman of the Board and President of the Company; President and Director of the Bank. Mr. Koranda is the brother of Allen Koranda. | |||||||||||
| Jerry A. Weberling | 55 | 1984 | Senior Executive Vice President, Chief Financial Officer and Treasurer. Prior to joining the Bank, Mr. Weberling, a CPA, conducted audits of financial institutions, mortgage banking and real estate companies for a large public accounting firm for ten years. | |||||||||||
| James E. Allen | 48 | 2001 | Executive Vice President-Business Banking. Mr. Allen was previously Senior Vice President - Corporate Banking at Old Kent Bank where he worked in northern Illinois commercial markets from 1997 to 2001. | |||||||||||
| Gerard J. Buccino | 45 | 1990 | Executive Vice President-Risk Management. Prior to joining the Bank, Mr. Buccino, a CPA, conducted audits of financial institutions, brokerage and mutual funds for a large public accounting firm where he worked for six years. | |||||||||||
| Jennifer R. Evans | 48 | 2004 | Executive Vice President and General Counsel. Prior to joining the Company, Ms. Evans was a partner/shareholder in the law firm of Vedder, Price, Kaufman & Kammholz, P.C., Chicago, Illinois, where she practiced from 1984 to 2004. | |||||||||||
| James S. Eckel | 51 | 2003 | Executive Vice President-Marketing. Mr. Eckel joined the Bank in conjuction with the acquisition of St. Francis Capital Corp. Prior to that, he held various management positions with St. Francis Bank, most recently as Executive Vice President - Mortgage Banking. | |||||||||||
| William G. Haider | 56 | 1984 | Executive Vice President; President of MAFD. | |||||||||||
| Michael J. Janssen | 47 | 1989 | Executive Vice President-Investor Relations and Taxation. | |||||||||||
| Edward A. Karasek | 53 | 2003 | Executive Vice President-Operations. He was Senior Vice President - Audit and Compliance from December 2003 until January 2006. Prior to joining the Company, Mr. Karasek was involved in internal audit consulting with INARMA. Previously, he was Senior Vice President - Corporate Audit Director for Bank One Corporation from 1998 to 2001. | |||||||||||
| David W. Kohlsaat | 52 | 1976 | Executive Vice President-Administration. | |||||||||||
| Thomas C. Miers | 55 | 1979 | Executive Vice President-Retail Banking. | |||||||||||
| Sharon M. Wheeler | 54 | 1971 | Executive Vice President-Residential Lending. | |||||||||||
Employees
We employed a total of 2,152 full-time equivalent employees as of December 31, 2006. Management considers its relationship with its employees to be excellent.
Safe Harbor Statement under the Private Securities Litigation Reform Act of 1995
This report, including the discussion in “Item 7. Management’s Discussion and Analysis of Financial Condition and Results of Operations” and elsewhere, contains, and other periodic reports and press releases of the Company may contain, certain forward-looking statements (within the meaning of Section 21E of the Securities Exchange Act of 1934, as amended), which involve certain risks and uncertainties. The Company intends such forward-looking statements to be covered by the safe harbor provisions for forward-looking statements contained in the Private Securities Litigation Reform Act of
27
1995, and is including this statement for purposes of invoking these safe harbor provisions. These forward-looking statements, which are based on certain assumptions and describe future plans, strategies and expectations of the Company, are generally identifiable by use of the words “believe,” “expect,” “intend,” “anticipate,” “estimate,” “project,” “plan,” or similar expressions. The Company’s ability to predict results or the actual effect of future plans or strategies is inherently uncertain and actual results may differ from those predicted. The Company undertakes no obligation to update these forward-looking statements in the future. Please see “Risk Factors” below for a discussion of the risks and uncertainties that could affect management’s outlook or future prospects of the Company
Item 1A. Risk Factors
The Company is subject to certain risks. In addition to the factors discussed below, please see the discussion under “Item 7A. Quantitative and Qualitative Disclosure about Market Risk” beginning on page 55. These risks and uncertainties, along with the other information in our Form 10-K, should be considered in evaluating forward-looking statements, and undue reliance should not be placed on such statements.
Unanticipated changes in interest rates and/or continuation of the inverted yield curve environment could reduceour profitability and affect the value of our assets.
Our net interest income, which is our primary source of revenue, depends on the spread between the interest we earn on loans and investments and the interest we pay on deposits and borrowings. For this reason, the level of our earnings is highly susceptible to changes in interest rates which generally impact our interest-earning assets and our interest-bearing liabilities differently. While we actively manage this sensitivity to interest rate risk as a key part of our business strategy, unanticipated changes in interest rates and changes in the yield curve may have a material adverse effect on our results of operations. Changes in the level of interest rates also may negatively affect the level of our mortgage loan originations, the value of our assets and our ability to realize gains from the sale of loans.
In addition, further prolonging of the current inverted treasury yield curve environment may continue to pressure our net interest margin and could have a material adverse effect on our results of operations.
Weakening of the real estate markets in the Chicago and Milwaukee metropolitan areas could have a material adverse effect on us.
With most of our real estate loans concentrated in suburban Chicago and suburban Milwaukee areas, a decline in local economic conditions or declining demand for real estate in these markets could adversely affect the value of the collateral securing our loans and may cause us to suffer loan losses, particularly if loans we originated at higher loan-to value ratios default. For example, recent weakness in housing prices and the slowdown in home purchase activity in our markets have made it more difficult to fully recover on some of our defaulted residential mortgage and home equity loans through the sale of the residential real estate collateral and have increased our cost associated with the sale of foreclosed real estate. A decline in local economic and market conditions may have a greater effect on our earnings and capital than on the earnings and capital of institutions whose real estate loan portfolios are more geographically diverse.
In addition, the residential mortgage business, historically a strong part of our operations, is largely dependent on home sales activity. With the considerable slowdown of home purchases nationwide, the mortgage industry has slowed dramatically. Our mortgage loan origination volumes dropped 23% in 2006 to $1.6 billion, generally in line with the overall decline industry-wide. Until the housing market improves, we expect continued pressure on our one- to four-family loan origination volume and mortgage banking revenues.
High loan-to-value ratios on a portion of our residential mortgage and home equity portfolios expose us togreater risk of loss.
Some of our residential mortgage loans are secured by liens on mortgage properties in which the borrowers have little or no equity, which may lead to a higher incidence of default on these loans. Our product offerings include certain mortgage and home equity loans or lines of credit that allow qualifying
28
borrowers to obtain loans with combined loan-to-value ratios at origination of up to 100% of the value of the home securing the loan. At December 31, 2006, approximately $428.1 million, or 8%, of our $5.31 billion single-family residential mortgage loan portfolio, including equity lines of credit and home equity loans, had combined loan-to-value ratios in excess of 90% (based on total line available) and no private mortgage insurance. There was an additional approximately $40 million of undrawn amounts remaining available under high CLTV equity lines in our portfolio at December 31, 2006. During 2006, we experienced a higher loss rate on high CLTV loans than our residential portfolio as a whole, and we are likely to continue to experience a higher risk of loss on these loans that we elect to keep in portfolio, since our ability to recover against the collateral is more sensitive to declining property values than for loans with lower combined loan-to-value ratios.
Competition from financial institutions and other financial service providers may adversely affect our growth and profitability.
The financial services business is highly competitive and we experience competition in each of our markets from many other financial institutions. The Chicago metropolitan market, in particular, is regarded as one of the most competitive banking markets in the country due to fragmented market share among many competing institutions which also tends to attract new entrants to the market. We compete with community banks, savings and loan associations, credit unions, mortgage banking firms, mortgage brokers, consumer finance companies, securities brokerage firms, insurance companies, money market funds and other mutual funds, as well as other regional, super-regional, national and international financial institutions that operate offices in our primary market areas and elsewhere. While we believe we can and do successfully compete with these other financial institutions in our primary markets, we may face a competitive disadvantage as a result of lesser geographic diversification and inability to spread our marketing costs across a broader market.
We compete with these institutions both in attracting deposits and in originating loans. A key part of our strategy is to compete through concentrated marketing in our primary markets with local advertisements, broad product offerings, community support, personal contacts, and flexibility and responsiveness in working with local customers, but competition has made it more difficult for us to grow our customer base without adjusting our pricing. We have experienced increased competition from larger commercial banks which have refocused their marketing efforts on the retail banking customers. In addition, in recent years we have encountered many de novo banks in our market areas that tend to price their loans and deposits aggressively in order to attract customers. Price competition for loans and deposits causes us to earn less on our loans and pay more on our deposits, which reduces net interest income.
Income from our real estate development business may continue to be adversely affected by housing market conditions and other uncertainties.
Historically, a significant source of our non-interest income for us has been income from our real estate development projects involving the acquisition and development of raw land into residential lots for sale to home builders. We often develop these projects in multiple phases over a period of years and our initial projections regarding the time to completion and development costs involved may prove to be inaccurate. For example, in our Springbank project in Plainfield, Illinois, delays in the approval process, weak housing market conditions and other factors outside our control, have extended the project timeline, increased our development costs and reduced our expected returns on investment over the life of the project. The weakness in new and existing home sales activity that we experienced in 2006, along with softening real estate prices, contributed to significantly lower income from real estate operations in 2006. Without improved housing market conditions, we are likely to continue to experience weaker income from real estate in 2007 and beyond.
Our allowance for loan losses is based on our estimates of future losses inherent in our portfolio, and actual losses we incur could exceed these estimates.
We maintain an allowance for loan losses we deem adequate to cover losses inherent in our portfolio from loans that may not be repaid in their entirety. In evaluating the adequacy of our allowance for loan losses on a quarterly basis, in addition to numerous quantitative factors we take into account, we also consider many qualitative factors, such as general business and economic conditions, general real
29
estate market trends and other matters which are by their nature more subjective and susceptible to change. In addition, our estimates of the risk of loss and amount of loss on some of our commercial loans require us to assess our borrowers’ abilities to successfully execute their business models through changing economic environments, competitive challenges and other factors outside our control. Because of the degree of uncertainty in the assumptions we make and the factors we consider, the losses we actually incur may exceed our estimates and our allowance for loan losses may prove insufficient to absorb these losses.
Breaches of our computer and network security may result in compromises of information which could have a material adverse effect on our business.
We depend heavily in our daily operations on our automated information systems, networks and telecommunications systems which support the evaluation, acquisition, monitoring, collection and administration of our loan and deposit servicing portfolios, general accounting and other management controls. We also outsource some data and payment processing to third parties. While we have implemented extensive policies and procedures designed to limit the impact of system failures or disruptions as well as information security measures to safeguard these systems, technological difficulties or security breaches involving our systems or those of any of our vendors could compromise our ability to protect customer personal information and could interfere with our ability to accurately process and account for customer transactions, and this could potentially expose us to significant loss. In addition, a failure or interruption of these systems or a failure of data integrity could subject us to customer complaints, potential lawsuits or increased regulatory scrutiny and could damage our reputation, making it more difficult for us to compete successfully.
Our ability to service our holding company debt and pay dividends to our shareholders is substantially dependent on dividends from the Bank, and these dividends are subject to regulatory limits.
Since January 1, 2005, we increased debt at our holding company $135 million as a result of acquisitions and as part of our capital management strategy designed to increase shareholder returns. The Company is largely dependent on the receipt of dividends from the Bank in order to service this debt and the availability of dividends from the Bank is limited by various statutes and regulations. In the event that the Bank is unable to pay dividends to us, we may not be able to service our debt, fund additional real estate development activities, complete stock buybacks, if any, or pay dividends on our common stock.
We operate in a highly regulated environment and we may be adversely affected by changes in laws and regulations.
The Bank is subject to extensive regulation, supervision and examination by the Office of Thrift Supervision, its chartering authority, and by the Federal Deposit Insurance Corporation, as insurer of its deposits. Such regulation and supervision govern the activities in which an institution and its holding company may engage, and are not intended to protect the interests of investors in our common stock. Regulatory authorities have broad discretion in their supervisory and enforcement activities, including the authority to impose restrictions on our operations, to classify our assets which may affect the level of our allowance for loan losses, to limit our dividends or impose higher capital requirements on us, to limit acquisition activities we may propose and to impose penalties for noncompliance. In addition, we are likely to continue to incur significant operational costs related to compliance as the risks and burden of regulatory compliance have increased significantly in recent years. Regulatory changes, whether in the form of regulatory policy, regulations, legislation or supervisory action, may have a material impact on our operations.
Our acquisition strategy exposes us to certain risks.
We have acquired a number of other banking companies in recent years and we may pursue selective acquisitions of other financial institutions in the future. Acquisitions can present certain managerial and operational challenges. While we evaluate acquisition opportunities across a variety of parameters, including our assessment of the potential impact on our financial condition as well as our prospective financial performance, our results may suffer as a result of an acquisition if we are not
30
effective in integrating the acquired operations into our business and converting data processing systems to our platform as planned, or if we fail to achieve anticipated cost savings or revenue enhancements. In addition, we anticipate that future acquisitions, if any, will likely be valued at a premium to book value and at a premium to current market value, which may result in book value per share or tangible book value per share dilution and possible short-term earnings per share dilution for our shareholders depending on the transaction structure and pricing.
Item 1B. Unresolved Staff Comments
None.
Available Information
Our internet address is www.mafbancorp.com. We make available through this address, free of charge, our annual report on Form 10-K, proxy statement, quarterly reports on Form 10-Q, current reports on Form 8-K and amendments to those reports filed or furnished pursuant to Section 13(a) or 15(d) of the Exchange Act as soon as reasonably practicable after such material is electronically filed with, or furnished to, the SEC. Our Code of Ethics and other corporate governance information is also available on our website.
Item 2. Properties
All of our facilities are located in the greater Chicago and Milwaukee metropolitan areas. At December 31, 2006, we own the majority of our 82 banking offices and lease others under individual lease arrangements. We also own our executive office building in Clarendon Hills, Illinois, and lease additional corporate offices in Downers Grove, Illinois, both located in the western suburbs of Chicago. We believe that all of our facilities are suitable and adequate for our operational needs.
See Note 8 in “Item 8. Financial Statement and Supplementary Data” for additional information about the Company’s properties.
Item 3. Legal Proceedings
There are various actions pending against the Company or its subsidiaries in the normal course of business, but in the opinion of management, none of these actions is likely to have a material adverse effect on our consolidated financial statements.
Item 4. Submission of Matters to a Vote of Security Holders
None.
PART II
Item 5. Market for the Registrant’s Common Equity, Related Stockholder Matters and Issuer Purchases of Equity Securities
Our common stock trades on the NASDAQ Stock Market under the symbol “MAFB.” As of February 23, 2007, we had 3,800 shareholders of record. The table below shows the reported high and low sales prices of the common stock during the periods indicated as well as the period end closing sales prices.
| Year ended December 31, 2006 | Year ended December 31, 2005 | ||||||||||||||||||||||||||||
|---|---|---|---|---|---|---|---|---|---|---|---|---|---|---|---|---|---|---|---|---|---|---|---|---|---|---|---|---|---|
| High | Low | Close | Dividend | High | Low | Close | Dividend | ||||||||||||||||||||||
| First Quarter | $ | 44 | .21 | 40 | .74 | 43 | .77 | .25 | $ | 44 | .98 | 40 | .63 | 41 | .54 | .23 | |||||||||||||
| Second Quarter | 45 | .00 | 41 | .72 | 42 | .84 | .25 | 43 | .99 | 38 | .38 | 42 | .63 | .23 | |||||||||||||||
| Third Quarter | 42 | .99 | 40 | .15 | 41 | .29 | .25 | 44 | .81 | 40 | .08 | 40 | .98 | .23 | |||||||||||||||
| Fourth Quarter | 46 | .75 | 40 | .95 | 44 | .69 | .25 | 43 | .52 | 39 | .14 | 41 | .38 | .23 | |||||||||||||||
We declared $1.00 per share in dividends during the year ended December 31, 2006 and $0.92 per share in dividends for the year ended December 31, 2005. During the first quarter of 2007, we announced an increase in our quarterly dividend to $0.27 per share, or $1.08 per share on an annualized basis. Our ability to pay cash dividends depends largely on cash dividends received from the Bank. Dividend payments from the Bank are subject to various regulatory restrictions. See “Item 1. Business -Regulation and Supervision — Federal Savings Institution Regulation — Limitation on Capital Distributions.”
31
Stock Performance Graph
The following graph shows a comparison of cumulative total shareholder return (including reinvested dividends) on the Company’s common stock, with the cumulative total returns of both a broad-market index and a peer group index for the period December 31, 2001 through December 29, 2006. The broad-market index chosen was the Nasdaq Market Index, and the peer group index chosen was the Hemscott Industry Group, comprised of savings and loan institutions, which is the same peer group index used in past years. The data was provided by Hemscott, Inc. (formerly known as Core Data, Inc.). The shareholder returns are measured based on an assumed investment of $100 on December 31, 2001.
Comparison of Cumulative Total Return Among MAF Bancorp,
Peer Group Index and Nasdaq Market Index
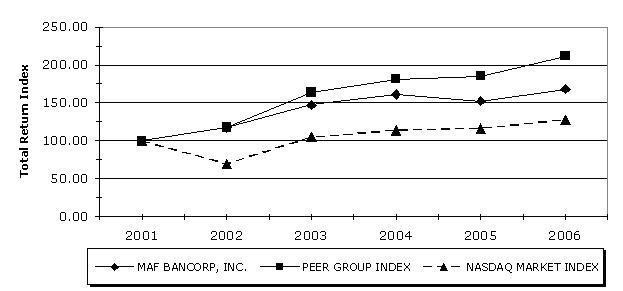
| 12/31/01 | 12/31/02 | 12/31/03 | 12/31/04 | 12/30/05 | 12/29/06 | |||||||||||||||
|---|---|---|---|---|---|---|---|---|---|---|---|---|---|---|---|---|---|---|---|---|
| MAF Bancorp | 100 | .00 | 117 | .26 | 147 | .29 | 161 | .29 | 152 | .16 | 168 | .17 | ||||||||
| Peer Group Index | 100 | .00 | 117 | .85 | 163 | .92 | 181 | .54 | 185 | .46 | 211 | .94 | ||||||||
| Nasdaq Market Index | 100 | .00 | 69 | .75 | 104 | .88 | 113 | .70 | 116 | .19 | 128 | .12 | ||||||||
| A. | The lines represent yearly index levels derived from compounded returns that include all dividends. |
| B. | If the fiscal year end is not a trading day, the preceding day is used. |
| C. | The index level for all series was set to $100.00 on 12/31/01. |
The following table sets forth information in connection with purchases of common stock made by or on behalf of us during the fourth quarter of the year ended December 31, 2006.
| Period | Total Number of Shares Purchased(1) | Average Price Paid per Share | Total Number of Shares Purchased as Part of Publicly Announced Plans or Programs | Maximum Number of Shares that May Yet be Purchased under the Plans or Programs | ||||||||||
|---|---|---|---|---|---|---|---|---|---|---|---|---|---|---|
| October 1, 2006 through October 31, | ||||||||||||||
| 2006 | — | — | — | — | ||||||||||
| November 1, 2006 through November 30, | ||||||||||||||
| 2006 | 2,747 | $ | 43 | .67 | — | — | ||||||||
| December 1, 2006 through December 31, | ||||||||||||||
| 2006 | 2,705 | 44 | .30 | — | — | |||||||||
| Total | 5,452 | $ | 43 | .98 | — | |||||||||
| (1) | Reflects 5,452 shares that were surrendered to us in payment of option exercise prices. The table does not include 1,706 shares that were surrendered in payment of withholding tax in connection with the exercise of related options during the quarter. |
32
Item 6. Selected Financial Data
The following tables set forth certain summary consolidated financial data, performance ratios and other data at or for the periods indicated. This information should be read in conjunction with the Consolidated Financial Statements and notes thereto included herein. See “Item 8. Financial Statements and Supplementary Data.” We also have presented certain Non-GAAP financial information that management believes is helpful to an understanding of our financial results. See “Non-GAAP Financial Information” following these tables for a reconciliation of these items to GAAP measures.
| At December 31, | ||||||||||||||||||||||||||||||||||||||
|---|---|---|---|---|---|---|---|---|---|---|---|---|---|---|---|---|---|---|---|---|---|---|---|---|---|---|---|---|---|---|---|---|---|---|---|---|---|---|
| 2006 | 2005 | 2004 | 2003 | 2002 | ||||||||||||||||||||||||||||||||||
| (Dollars in thousands, except per share data) | ||||||||||||||||||||||||||||||||||||||
| Selected Balance Sheet Data: | ||||||||||||||||||||||||||||||||||||||
| Total assets | $ | 11,120,499 | 10,487,504 | 9,681,384 | 8,933,585 | 5,937,181 | ||||||||||||||||||||||||||||||||
| Loans receivable, net | 7,408,660 | 7,174,742 | 6,842,259 | 6,324,596 | 4,363,152 | |||||||||||||||||||||||||||||||||
| Mortgage-backed securities available | ||||||||||||||||||||||||||||||||||||||
| for sale | 1,195,494 | 1,313,409 | 948,168 | 971,969 | 365,638 | |||||||||||||||||||||||||||||||||
| Mortgage-backed securities held to | ||||||||||||||||||||||||||||||||||||||
| maturity | 212,302 | 243,161 | 245,021 | — | — | |||||||||||||||||||||||||||||||||
| Interest bearing deposits | 67,883 | 38,491 | 56,089 | 57,988 | 28,210 | |||||||||||||||||||||||||||||||||
| Federal funds sold | 64,944 | 23,739 | 42,854 | 19,684 | 100,205 | |||||||||||||||||||||||||||||||||
| Investment securities available for sale | 529,998 | 475,152 | 388,959 | 365,334 | 308,235 | |||||||||||||||||||||||||||||||||
| Stock in Federal Home Loan Bank of | ||||||||||||||||||||||||||||||||||||||
| Chicago | 146,407 | 165,663 | 278,916 | 384,643 | 169,708 | |||||||||||||||||||||||||||||||||
| Real estate held for development or sale | 83,049 | 50,066 | 35,091 | 32,093 | 14,938 | |||||||||||||||||||||||||||||||||
| Goodwill and core deposit intangibles | 407,312 | 314,414 | 318,231 | 276,549 | 101,967 | |||||||||||||||||||||||||||||||||
| Deposits | 7,018,010 | 6,197,503 | 5,935,708 | 5,580,455 | 3,751,237 | |||||||||||||||||||||||||||||||||
| Borrowed funds | 2,773,192 | 3,057,669 | 2,600,667 | 2,299,427 | 1,556,500 | |||||||||||||||||||||||||||||||||
| Junior subordinated debentures | 67,011 | 67,011 | — | — | — | |||||||||||||||||||||||||||||||||
| Stockholders' equity | 1,072,145 | 978,179 | 974,386 | 901,604 | 501,458 | |||||||||||||||||||||||||||||||||
| Book value per share | 32.59 | 30.50 | 29.28 | 27.27 | 21.57 | |||||||||||||||||||||||||||||||||
| Tangible book value per share(1) | 20.21 | 20.70 | 19.72 | 18.90 | 17.18 | |||||||||||||||||||||||||||||||||
| Common shares outstanding | 32,895,846 | 32,066,721 | 33,273,235 | 33,063,853 | 23,252,815 | |||||||||||||||||||||||||||||||||
| For the Year Ended December 31, | ||||||||||||||||||||||||||||||||||||||
|---|---|---|---|---|---|---|---|---|---|---|---|---|---|---|---|---|---|---|---|---|---|---|---|---|---|---|---|---|---|---|---|---|---|---|---|---|---|---|
| 2006 | 2005 | 2004 | 2003 | 2002 | ||||||||||||||||||||||||||||||||||
| (Dollars and shares in thousands, except per share data) | ||||||||||||||||||||||||||||||||||||||
| Selected Income Statement Data: | ||||||||||||||||||||||||||||||||||||||
| Interest income | $ | 595,200 | 478,656 | 421,173 | 316,430 | 329,490 | ||||||||||||||||||||||||||||||||
| Interest expense | 335,571 | 213,897 | 159,885 | 136,952 | 171,465 | |||||||||||||||||||||||||||||||||
| Net interest income | 259,629 | 264,759 | 261,288 | 179,478 | 158,025 | |||||||||||||||||||||||||||||||||
| Provision for loan losses | 3,900 | 1,980 | 1,215 | — | 300 | |||||||||||||||||||||||||||||||||
| Net interest income after provision | ||||||||||||||||||||||||||||||||||||||
| for loan losses | 255,729 | 262,779 | 260,073 | 179,478 | 157,725 | |||||||||||||||||||||||||||||||||
| Total non-interest income | 75,918 | 81,176 | 78,054 | 73,519 | 58,737 | |||||||||||||||||||||||||||||||||
| Total non-interest expense | 198,070 | 186,074 | 185,816 | 122,083 | 101,716 | |||||||||||||||||||||||||||||||||
| Income before income taxes | 133,577 | 157,881 | 152,311 | 130,914 | 114,746 | |||||||||||||||||||||||||||||||||
| Income taxes | 48,994 | 54,528 | 50,789 | 47,481 | 40,775 | |||||||||||||||||||||||||||||||||
| Net income | $ | 84,583 | 103,353 | 101,522 | 83,433 | 73,971 | ||||||||||||||||||||||||||||||||
| Net income as adjusted for balance sheet | ||||||||||||||||||||||||||||||||||||||
| restructuring and certain tax charges | $ | 100,651 | 103,353 | 101,522 | 83,433 | 73,971 | ||||||||||||||||||||||||||||||||
| Net income per common share: | ||||||||||||||||||||||||||||||||||||||
| Basic earnings per share | $ | 2.55 | 3.20 | 3.09 | 3.35 | 3.19 | ||||||||||||||||||||||||||||||||
| Diluted earnings per share | 2.51 | 3.13 | 3.01 | 3.26 | 3.11 | |||||||||||||||||||||||||||||||||
| Diluted earnings per share as adjusted for balance | ||||||||||||||||||||||||||||||||||||||
| sheet restructuring and certain tax charges | 2.99 | 3.13 | 3.01 | 3.26 | 3.11 | |||||||||||||||||||||||||||||||||
| Average common and common equivalent | ||||||||||||||||||||||||||||||||||||||
| shares outstanding: | ||||||||||||||||||||||||||||||||||||||
| Basic | 33,177,226 | 32,307,390 | 32,897,164 | 24,920,150 | 23,162,422 | |||||||||||||||||||||||||||||||||
| Diluted | 33,765,012 | 32,983,962 | 33,706,569 | 25,592,745 | 23,748,411 | |||||||||||||||||||||||||||||||||
| (see footnote on following page) |
33
| At or For the Years Ended December 31, | ||||||||||||||||||||||||||||||||||||||||||||||||||
|---|---|---|---|---|---|---|---|---|---|---|---|---|---|---|---|---|---|---|---|---|---|---|---|---|---|---|---|---|---|---|---|---|---|---|---|---|---|---|---|---|---|---|---|---|---|---|---|---|---|---|
| 2006 | 2005 | 2004 | 2003 | 2002 | ||||||||||||||||||||||||||||||||||||||||||||||
| (Dollars and shares in thousands, except per share data) | ||||||||||||||||||||||||||||||||||||||||||||||||||
| Average Balance Data: | ||||||||||||||||||||||||||||||||||||||||||||||||||
| Average interest-earning assets | $ | 10,317,994 | 9,193,692 | 8,551,351 | 6,065,772 | 5,409,877 | ||||||||||||||||||||||||||||||||||||||||||||
| Average interest-bearing liabilities | 9,487,371 | 8,360,019 | 7,714,028 | 5,420,900 | 4,895,818 | |||||||||||||||||||||||||||||||||||||||||||||
| Average loans to average deposits | 1.28 | x | 1.26 | 1.29 | 1.30 | 1.30 | ||||||||||||||||||||||||||||||||||||||||||||
| Average stockholders' equity | $ | 1,051,984 | 961,538 | 924,462 | 588,263 | 467,182 | ||||||||||||||||||||||||||||||||||||||||||||
| Average stockholders' equity to average | ||||||||||||||||||||||||||||||||||||||||||||||||||
| assets | 9.31 | % | 9.62 | 9.98 | 9.09 | 8.14 | ||||||||||||||||||||||||||||||||||||||||||||
| Average interest-earning assets to average | ||||||||||||||||||||||||||||||||||||||||||||||||||
| interest-bearing liabilities | 108.76 | 109.97 | 110.85 | 110.90 | 110.50 | |||||||||||||||||||||||||||||||||||||||||||||
| Interest rate spread | 2.23 | 2.65 | 2.85 | 2.69 | 2.59 | |||||||||||||||||||||||||||||||||||||||||||||
| Net interest margin | 2.52 | 2.88 | 3.06 | 2.96 | 2.92 | |||||||||||||||||||||||||||||||||||||||||||||
| Performance Ratios: | ||||||||||||||||||||||||||||||||||||||||||||||||||
| Return on average assets | .75 | 1.03 | 1.10 | 1.29 | 1.29 | |||||||||||||||||||||||||||||||||||||||||||||
| Return on average assets, exclusive of balance sheet | ||||||||||||||||||||||||||||||||||||||||||||||||||
| restructuring and certain tax charges(1) | .89 | 1.03 | 1.10 | 1.29 | 1.29 | |||||||||||||||||||||||||||||||||||||||||||||
| Return on average equity | 8.04 | 10.75 | 10.98 | 14.18 | 15.83 | |||||||||||||||||||||||||||||||||||||||||||||
| Return on average equity, exclusive of balance sheet | ||||||||||||||||||||||||||||||||||||||||||||||||||
| restructuring and certain tax charges(1) | 9.57 | 10.75 | 10.98 | 14.18 | 15.83 | |||||||||||||||||||||||||||||||||||||||||||||
| Return on average tangible equity(2) | 12.99 | 16.03 | 15.81 | 18.37 | 20.33 | |||||||||||||||||||||||||||||||||||||||||||||
| Return on average tangible equity, exclusive of balance | ||||||||||||||||||||||||||||||||||||||||||||||||||
| sheet restructuring and certain tax charges(1)(2) | 15.46 | 16.03 | 15.81 | 18.37 | 20.33 | |||||||||||||||||||||||||||||||||||||||||||||
| Stockholders' equity to total assets | 9.64 | 9.33 | 10.06 | 10.09 | 8.45 | |||||||||||||||||||||||||||||||||||||||||||||
| Tangible stockholders' equity to tangible | ||||||||||||||||||||||||||||||||||||||||||||||||||
| assets(3) | 6.21 | 6.52 | 7.01 | 7.22 | 6.85 | |||||||||||||||||||||||||||||||||||||||||||||
| Tangible and core capital to total assets | ||||||||||||||||||||||||||||||||||||||||||||||||||
| (Bank only) | 7.44 | 7.07 | 7.14 | 7.16 | 6.78 | |||||||||||||||||||||||||||||||||||||||||||||
| Risk based capital ratio (Bank only) | 11.01 | 11.15 | 11.30 | 11.45 | 11.85 | |||||||||||||||||||||||||||||||||||||||||||||
| Non-interest expense to average assets | 1.75 | 1.86 | 2.01 | 1.89 | 1.77 | |||||||||||||||||||||||||||||||||||||||||||||
| Non-interest expense exclusive of balance sheet | ||||||||||||||||||||||||||||||||||||||||||||||||||
| restructuring to average assets(1) | 1.73 | 1.86 | 2.01 | 1.89 | 1.77 | |||||||||||||||||||||||||||||||||||||||||||||
| Efficiency ratio, exclusive of balance sheet restructuring (1)(4) | 56.07 | 54.31 | 54.97 | 48.08 | 47.02 | |||||||||||||||||||||||||||||||||||||||||||||
| Ratio of earnings to fixed charges: | ||||||||||||||||||||||||||||||||||||||||||||||||||
| Including interest on deposits | 1.39 | x | 1.71 | x | 1.91 | x | 1.93 | x | 1.66 | x | ||||||||||||||||||||||||||||||||||||||||
| Excluding interest on deposits | 1.84 | x | 2.40 | x | 2.61 | x | 2.65 | x | 2.38 | x | ||||||||||||||||||||||||||||||||||||||||
| Asset Quality Data (at year-end): | ||||||||||||||||||||||||||||||||||||||||||||||||||
| Non-performing loans to total loans | .89 | % | .43 | .46 | .51 | .58 | ||||||||||||||||||||||||||||||||||||||||||||
| Non-performing assets to total assets | .63 | .30 | .34 | .49 | .47 | |||||||||||||||||||||||||||||||||||||||||||||
| Allowance for loan loss to total loans | .54 | .51 | .53 | .54 | .44 | |||||||||||||||||||||||||||||||||||||||||||||
| Allowance for loan loss to non-performing | ||||||||||||||||||||||||||||||||||||||||||||||||||
| loans | 60.06 | 117.12 | 115.18 | 105.39 | 76.72 | |||||||||||||||||||||||||||||||||||||||||||||
| Other Data (at year-end): | ||||||||||||||||||||||||||||||||||||||||||||||||||
| Number of deposit accounts | 639,812 | 600,851 | 586,590 | 564,696 | 393,801 | |||||||||||||||||||||||||||||||||||||||||||||
| Mortgage loans serviced for others | $ | 2,680,242 | 2,919,075 | 3,641,445 | 3,330,039 | 2,021,512 | ||||||||||||||||||||||||||||||||||||||||||||
| Number of retail banking offices | 82 | 75 | 72 | 66 | 34 | |||||||||||||||||||||||||||||||||||||||||||||
| Number of FTEs | 2,152 | 2,044 | 2,160 | 1,969 | 1,376 | |||||||||||||||||||||||||||||||||||||||||||||
| Cumulative one-year gap | (7.38 | ) | (1.31 | ) | (3.98 | ) | (1.59 | ) | 10.23 | |||||||||||||||||||||||||||||||||||||||||
| Stock Price and Dividend Information: | ||||||||||||||||||||||||||||||||||||||||||||||||||
| High | $ | 46.75 | 44.98 | 47.25 | 44.80 | 40.11 | ||||||||||||||||||||||||||||||||||||||||||||
| Low | 40.15 | 38.38 | 39.27 | 32.61 | 28.60 | |||||||||||||||||||||||||||||||||||||||||||||
| Close | 44.69 | 41.38 | 44.82 | 41.90 | 34.00 | |||||||||||||||||||||||||||||||||||||||||||||
| Cash dividends declared per share | 1.00 | .92 | .84 | .72 | .60 | |||||||||||||||||||||||||||||||||||||||||||||
| Dividend payout ratio | 39.84 | % | 29.39 | 27.91 | 22.09 | 19.29 | ||||||||||||||||||||||||||||||||||||||||||||
| (1) | Exclusive of balance sheet restructuring and certain tax charges. See “Non-GAAP Financial Information” below for related reconciliations. |
| (2) | Return on average tangible equity is calculated by dividing net income by the difference of average shareholder equity less average goodwill and core deposit intangibles. See “Non-GAAP Financial Information” below for related reconciliations. |
| (3) | See “Non-GAAP Financial Information.” |
| (4) | The efficiency ratio is calculated by dividing non-interest expense exclusive of restructuring charges by the sum of net interest income and non-interest income, exclusive of restructuring charges and net gain/(loss) on sale and write-down of mortgage-backed and investment securities, gain on sale of mortgage servicing rights and fixed assets. |
34
Non-GAAP Financial Information
This report contains certain financial information determined by methods other than in accordance with U.S. generally accepted accounting principles, or GAAP. The Company’s management uses tangible book value per share, tangible stockholders’ equity to tangible assets ratio and return on average tangible equity in its analysis of the Company’s performance and financial condition and believes this presentation provides useful supplemental information that is helpful in understanding our financial condition and results, as it provides a method to assess management’s success in managing alternatives for the utilization of tangible capital.
The Company believes net income, non-interest income and non-interest expense adjusted for the 2006 balance sheet restructuring and certain 2006 tax charges recorded in the fourth quarter of 2006 is useful supplemental information to better understand the core operating performance of the Company. See “Management's Discussion and Analysis of Financial Condition and Results of Operations” for a discussion of the restructuring plan we announced in the fourth quarter of 2006. The excluded tax charges relate to adjustments to tax reserves for prior year periods that were recorded in the fourth quarter of 2006 because of uncertainties that recently arose relating to an unresolved tax authority audit and other developments. See “Management’s Discussion & Analysis of Financial Condition — Results of Operations — Income Taxes.”
These disclosures should not be considered an alternative to GAAP, nor are they necessarily comparable to Non-GAAP performance measures that might be presented by other companies.
Tangible Book Value Per Share. Tangible book value per share is calculated by dividing (a) stockholders’ equity less the sum of goodwill and core deposit intangibles, by (b) common shares outstanding. The following table presents a reconciliation of stockholders’ equity to tangible stockholders’ equity (in thousands):
| 12/31/06 | 12/31/05 | ||||||||||||||||||||||
|---|---|---|---|---|---|---|---|---|---|---|---|---|---|---|---|---|---|---|---|---|---|---|---|
| Amount | Per share | Amount | Per share | ||||||||||||||||||||
| Stockholders' equity - as reported | $ | 1,072,145 | 32.59 | $ | 978,179 | 30.50 | |||||||||||||||||
| Goodwill | (387,980 | ) | (11.79 | ) | (304,251 | ) | (9.48 | ) | |||||||||||||||
| Core deposit intangibles | (19,333 | ) | (0.59 | ) | (10,164 | ) | (0.32 | ) | |||||||||||||||
| Tangible stockholders' equity | $ | 664,832 | 20.21 | $ | 663,764 | 20.70 | |||||||||||||||||
Tangible Stockholders’ Equity to Tangible Assets. Tangible stockholders’ equity to tangible assets is calculated by dividing (a) stockholders’ equity less the sum of goodwill and core deposit intangibles, by (b) total assets less the sum of goodwill and core deposit intangibles. The following table presents a reconciliation of total assets to tangible assets (in thousands):
| 12/31/06 | 12/31/05 | ||||||||||
|---|---|---|---|---|---|---|---|---|---|---|---|
| Total assets - as reported | $ | 11,120,499 | $ | 10,487,504 | |||||||
| Goodwill | (387,980 | ) | (304,251 | ) | |||||||
| Core deposit intangibles | (19,333 | ) | (10,164 | ) | |||||||
| Tangible total assets | $ | 10,713,186 | $ | 10,173,089 | |||||||
35
Return on Average Stockholders’ Equity and Return on Average Tangible Stockholders’ Equity. Return on average stockholders’ equity is calculated by dividing (a) net income adjusted for balance sheet restructuring charges and certain tax charges (see below) by (b) average stockholders’ equity. Return on average tangible stockholders’ equity is calculated by dividing (a) net income adjusted for balance sheet restructuring charges and certain tax charges by (b) average stockholders’ equity less average goodwill and core deposit intangibles. The following table presents a reconciliation of average stockholders’ equity to average tangible stockholders’ equity (in thousands):
| Year Ended December 31, | ||||||||||||||||||||
|---|---|---|---|---|---|---|---|---|---|---|---|---|---|---|---|---|---|---|---|---|
| 2006 | 2005 | |||||||||||||||||||
| Average stockholders' equity | $ | 1,051,984 | 961,538 | |||||||||||||||||
| Average goodwill | (380,489 | ) | (304,950 | ) | ||||||||||||||||
| Average core deposit intangibles | (20,503 | ) | (11,712 | ) | ||||||||||||||||
| Average tangible stockholders' equity | $ | 650,992 | 644,876 | |||||||||||||||||
The following three tables reconcile net income, non-interest income and non-interest expense to net income, non-interest income and non-interest expense as adjusted for the balance sheet restructuring and certain tax charges (in thousands):
Net income adjusted for balance sheet restructuring and certain tax charges. Diluted earnings per share as adjusted for balance sheet restructuring and certain tax charges is calculated by dividing net income as adjusted for balance sheet restructuring and certain tax charges by the weighted average number of diluted shares outstanding.
| Year Ended December 31, 2006 | ||||||||
|---|---|---|---|---|---|---|---|---|
| Net income - as reported | $ | 84,583 | ||||||
| Lower of cost of market adjustment on loans | ||||||||
| transferred to held for sale | 4,156 | |||||||
| Loss on mortgage-backed securities | 9,316 | |||||||
| Loss on investment securities | 3,618 | |||||||
| Prepayment charge related to repayment | ||||||||
| of borrowings | 2,813 | |||||||
| Tax benefits related to balance sheet | ||||||||
| restructuring charges | (7,798 | ) | ||||||
| Certain tax charges | 3,963 | |||||||
| Net income adjusted for balance sheet restructuring | ||||||||
| and certain tax charges | $ | 100,651 | ||||||
Return on average assets is calculated by dividing (a) net income adjusted for balance sheet restructuring and certain tax charges by (b) average total assets.
Non-interest income adjusted for balance sheet restructuring charges
| Year Ended December 31, 2006 | ||||||||
|---|---|---|---|---|---|---|---|---|
| Non-interest income - as reported | $ | 75,918 | ||||||
| Lower of cost of market adjustment on loans | ||||||||
| transferred to held for sale | 4,156 | |||||||
| Loss on mortgage-backed securities | 9,316 | |||||||
| Loss on investment securities | 3,618 | |||||||
| Non-interest income adjusted for balance sheet | ||||||||
| restructuring charges | $ | 93,008 | ||||||
Non-interest expense adjusted for balance sheet restructuring charges
| Year Ended December 31, 2006 | ||||||||
|---|---|---|---|---|---|---|---|---|
| Non-interest expense - as reported | $ | 198,070 | ||||||
| Prepayment charge related to repayment | ||||||||
| of borrowings | (2,813 | ) | ||||||
| Non-interest expense adjusted for balance sheet | ||||||||
| restructuring charges | $ | 195,257 | ||||||
The ratio of non-interest expense to average assets is calculated by dividing (a) non-interest expense adjusted for balance sheet restructuring charges by (b) average total assets.
36
Item 7. Management's Discussion and Analysis of Financial Condition and Results of Operations
We encourage you to read the following discussion in conjunction with the selected financial information as of and for the three years ended December 31, 2006, included in Item 6. “Selected Financial Data” and the financial information as of and for the three years ended December 31, 2006, included in Item 8. “Financial Statements and Supplementary Data.”
Overview
Our net income was $84.6 million in 2006 compared to $103.4 million in 2005 and $101.5 million in 2004. Net income for 2006 was reduced by $12.1 million, or $.36 per diluted share due to the balance sheet restructuring plan we implemented in the fourth quarter. In addition, 2006 results were reduced by certain tax charges of $4.0 million, or $.12 per diluted share, primarily relating to reserves established in connection with uncertainties arising from a recent tax authority audit. Exclusive of these charges, 2006 net income was $100.7 million, or $2.99 per diluted share compared to $3.13 per diluted share in 2005 and $3.01 in 2004. The decline in earnings during 2006 primarily reflects the difficult operating environment that our industry faces in the inverted yield curve environment in weak mortgage and housing market conditions.
Our primary source of revenue is net interest income which is driven by the volume of our interest-earning assets and our net interest margin. During 2006, the increasing and flat to inverted interest rate yield curve had a negative impact on our net interest income as the increase in the average cost of our interest-bearing liabilities out-paced increases in our average interest-earning asset yields. In light of the unfavorable interest rate environment, a key part of the interest rate risk management strategies we pursued in 2006 was to limit balance sheet growth of our one-to-four family mortgages, which mitigated some of the margin pressures. Gravitating to more of an originate-and-sell model in our residential lending business, we sold a significant portion of our ARM loans as well as the majority of our fixed-rate mortgage production which generate income from gains on sales. However, significantly lower mortgage origination volumes resulting from rising interest rates and slowing housing sales during the year limited growth in this source of income.
Due to the extended duration of the inverted yield curve environment, we undertook a balance sheet restructuring plan in the fourth quarter to reposition our balance sheet for improved earnings in the future. As described more fully below, we sold certain lower-yielding loans and investment securities, repaid certain higher-cost wholesale borrowings, and reinvested remaining proceeds in short-term investment securities to eliminate negative interest rate spread that had been reducing our net interest income. While this deleveraging caused us to recognize restructuring charges in the fourth quarter of 2006 and will shrink our balance sheet for the near term, management believes the restructuring will benefit the Company by allowing us to reinvest certain funds into higher yielding short-term securities and over time to redeploy capital in more favorable investment opportunities as we continue our strategy of increasing the concentration of business and home equity loans in our portfolio.
Exclusive of restructuring charges, we grew non-interest income approximately 14% in 2006 largely due to stronger deposit account service fees and higher gains on sale of loans in our mortgage banking operation which more than offset a $2.1 million decline in income from real estate operations. Lot sales activity has been adversely impacted by the slow down in the housing market. We anticipate that 2007 will also be a difficult year for our land development operations.
37
As expected, non-interest expense in 2006 increased with the additional costs of operating two de novo branches that we opened in December 2005 and the seven branches we added in our acquisition of EFC Bancorp, Inc. in February 2006. However, we were able to limit the increase in our total non-interest expense through cost containment efforts that we pursued in the face of the challenging operating environment. Exclusive of expense related to the balance sheet restructuring, our ratio of non-interest expense to average assets improved in 2006 to 1.73% from 1.86% in 2005 and 2.01% in 2004. We are continuing to address our cost structure and are pursuing additional cost control initiatives in 2007.
Recent Acquisitions
We have acquired a number of other financial institutions in recent years, including EFC Bancorp in early 2006. The following table summarizes financial information relating to our recent acquisitions:
| Selling Entity | Acquisition Date | Data Processing Conversion Completion | Acquired Deposits | Acquired Loans | Goodwill and Intangibles Recorded | |||||||||||||||||||||||||||||||||
|---|---|---|---|---|---|---|---|---|---|---|---|---|---|---|---|---|---|---|---|---|---|---|---|---|---|---|---|---|---|---|---|---|---|---|---|---|---|---|
| (In thousands) | ||||||||||||||||||||||||||||||||||||||
| EFC Bancorp, Inc.(1) | February 1, 2006 | February 2006 | $ | 703,435 | 860,680 | 97,368 | ||||||||||||||||||||||||||||||||
| Chesterfield Financial Corp. | ||||||||||||||||||||||||||||||||||||||
| (2) | November 1, 2004 | November 2004 | 270,711 | 140,699 | 45,918 | |||||||||||||||||||||||||||||||||
| St. Francis Capital | ||||||||||||||||||||||||||||||||||||||
| Corporation(3) | December 1, 2003 | May 2004 | 1,294,517 | 1,243,549 | 130,819 | |||||||||||||||||||||||||||||||||
| Fidelity Bancorp, Inc.(4) | July 21, 2003 | August 2003 | 434,573 | 338,123 | 44,057 | |||||||||||||||||||||||||||||||||
| (1) | We acquired EFC Bancorp for $176.6 million. We issued 2.3 million shares of stock and paid $67.3 million in cash, $52 million of which was funded with increased borrowings under our unsecured term loan. |
| (2) | We acquired Chesterfield Financial Corp. for $128.4 million. We issued 981,467 shares of stock and paid $85.7 million in cash for the purchase, $25 million of which was funded by an increase in borrowings under our unsecured term loan. |
| (3) | We acquired St. Francis Capital Corporation by issuing 7.5 million shares in an all-stock transaction valued at $358 million. |
| (4) | We acquired Fidelity Bancorp by issuing 2.8 million shares in an all-stock transaction valued at $115 million. |
Critical Accounting Policies and Estimates
Our discussion and analysis of financial condition and results of operations are based upon consolidated financial statements, which have been prepared in conformity with U.S. generally accepted accounting principles, and are more fully described in Note 1 of the consolidated financial statements found in “Item 8. Financial Statements and Supplementary Data.” The preparation of these consolidated financial statements requires that management make estimates and assumptions that affect the reported amounts of assets, liabilities, income and expense, as well as related disclosures of contingencies. Management’s judgment is based on historical experience, terms of existing contracts, market trends and other information available. We believe that of our significant accounting policies, the following may involve a higher degree of judgment and complexity:
Allowance for loan losses. In evaluating the adequacy of the allowance for loan losses and determining the related provision for loan losses on a quarterly basis, management considers: (1) historical loss experience and change in the size and mix of the overall portfolio composition, (2) specific allocations based upon probable losses identified during the review of the portfolio, (3) delinquency trends in the portfolio and the composition of non-performing loans, including the percent of non-performing loans with supplemental mortgage insurance, and (4) subjective factors, including local and general economic business factors and trends, industry and interest rate trends, new lending products and changes in underwriting criteria, and portfolio concentrations. A provision for loan losses is recorded as a charge to current earnings. The allowance for loan losses is management’s estimate of probable losses inherent in the Bank’s loan portfolio at the assessment date. If actual losses ultimately exceed management’s estimate, the allowance may not be sufficient to absorb probable losses in the loan portfolio and may result in an additional provision for loan losses. The allowance is also subject to examination and adequacy testing by regulatory agencies, which may consider such factors as the methodology used to determine the adequacy and size of the allowance relative to that of peer institutions, and other adequacy tests. Such regulatory agencies could require an adjustment to our allowance based on information available to them at the time of their examination.
Valuation of mortgage servicing rights. We capitalize the fair value of mortgage servicing rights upon the sale of loans. We determine the fair value by allocating the previous carrying amount of the sold loans based on the relative fair values of the servicing rights retained and the loans that are sold to a third party. The estimated value takes into consideration contractually known amounts, such as loan balance, term, contract rate and whether the customer escrows funds with the Bank for the payment of
38
taxes and insurance. The estimated value is also affected by additional assumptions relating to loan prepayment speeds, earnings on escrow funds, as well as the discount rate used to present value the estimated future cash flow stream. Subsequent to the establishment of this asset, management reviews the fair value of mortgage servicing rights on a quarterly basis using current estimates of prepayment speeds, cash flow and discount rate assumptions. Changes in these estimates impact fair value, and could require us to record a valuation allowance or recovery. There was no valuation reserve at December 31, 2006 or 2005. Net recoveries of $171,000 were recorded in 2005 due to lower prepayment estimates reflective of a rising rate environment. Should estimates assumed by management regarding future prepayment speeds on the underlying loans supporting the mortgage servicing rights prove to be incorrect, additional valuation allowances could occur, or conversely, valuation allowances could be recovered if changing estimates increase the fair value of mortgage servicing rights.
Valuation of goodwill and intangible assets. In accounting for acquisitions of other companies, we generally record as assets on our financial statements both goodwill and identifiable intangible assets, such as core deposit intangibles. The amounts we record are based on our estimates of the fair value of assets and liabilities acquired. The valuation techniques we use to determine the carrying value of tangible and intangible assets and liabilities acquired in acquisitions and the estimated lives of the identifiable intangible assets involve a number of subjective judgments such as estimates for discount rates, projected future cash flows and time period of useful lives, all of which are susceptible to change based on changes in economic conditions and other factors. Core deposit and other identifiable intangible assets are amortized to expense over their estimated useful lives and are reviewed for impairment whenever events or changes in circumstances indicate that the carrying amount of the asset exceeds the remaining value we are reasonably likely to realize. Similarly, on an annual basis we evaluate whether the carrying value of our goodwill has become impaired, in which case we reduce its carrying value through a charge to our earnings. Goodwill is evaluated for impairment at the segment reporting level, and all of our goodwill is recorded in our banking segment. Based on our evaluations, we recorded no goodwill impairment in the years ended December 31, 2006, 2005 and 2004.
While we believe the valuation assumptions and estimates we used are reasonable, using different assumptions or estimates would have resulted in our recording different amounts of goodwill and core deposit intangibles and could have impacted our amortization expense. For example, if we had assumed faster prepayment speeds of mortgage loans we acquired in our acquisitions, the value of the mortgage loans we acquired would have been less and the goodwill we recorded would have been greater. Similarly, if we had assumed greater deposit run-off rates, we may have recorded lower core deposit intangibles, but might have shortened our estimate of the average life of this intangible asset, and the combination of these changes may have increased or decreased our amortization expense in 2006. Any changes in the assumptions and estimates which we use in future periods to determine the carrying value of our goodwill and identifiable intangible assets which adversely affect their value or shortens estimated lives would adversely affect our results of operations.
Real estate held for development. Income from real estate operations in the Company’s real estate developments are based on cash received less the cost of sales per lot, including capitalized interest and an estimate of future costs to be incurred. This is especially true at the outset of a project, where few actual costs have been incurred in the project as a whole. The estimate of total project costs is reviewed on a quarterly basis by management. Estimates are subject to change for various reasons, including the duration of the project, changes in rules or requirements of the communities where the projects reside, soil and weather conditions, increased project budgets, as well as the general level of inflation. If these estimates are incorrect and either the expenses are greater than anticipated or the sales do not close as expected, we may have to expend additional funds or obtain borrowings to cover current improvement costs.
Any change in income from real estate operations from past sales that results from changes in future estimated costs are recognized in the period of change as either a charge or an addition to income from real estate operations. Additionally, we periodically evaluate the net realizable value from each project by considering other factors, such as pace of lot absorption, sources of funding and timing of disbursements. A charge to current earnings would occur if this evaluation indicated a project’s net realizable value did not exceed its recorded cost. Currently, the estimated net realizable value of Springbank, our only project currently under development, exceeds the recorded cost of the project.
Income Taxes. The determination of income tax expense and the amounts of current and deferred income tax assets and liabilities is based on complex analyses of many factors, including
39
interpretation of Federal and state income tax laws, current financial accounting standards, the difference between tax and financial reporting bases of assets and liabilities (temporary differences), assessments of the likelihood that the reversals of deferred deductible temporary differences will yield tax benefits and estimates of reserves required for tax uncertainties.
We periodically undergo examination by various governmental taxing authorities. Such agencies may require that changes in the amount of tax expense be recognized when their interpretations of tax law differ from those of management, based on their judgments about information available to them at the time of their examinations. There can be no assurance that future events, such as court decisions, new interpretations of existing law or positions by federal or state taxing authorities, will not result in tax liability amounts that differ from management’s current assessment of such amounts, the impact of which could be significant to future results.
Temporary differences may give rise to deffered tax assets, which are recorded on our balance sheet. We assess the likelihood that deferred tax assets will be realized in future periods and establish a valuation allowance for those assets for which recovery is unlikely. In making this assessment, we must make judgments and estimates regarding the ability to realize these assets through carryback to taxable income in prior years, the future reversal of existing taxable temporary differences, future taxable income, and the possible application of future tax planning strategies. Although the Company has established valuation allowances relating to certain deferred tax assets, there is no guarantee that the tax benefits associated with other deferred tax assets for which no valuation allowance has been established, will be fully realized.
In the preparation of income tax returns, tax positions are taken based on interpretation of federal and state income tax laws for which the outcome of such positions may not be certain. Management periodically reviews and evaluates the status of uncertain tax positions and may establish tax reserves for estimates of amounts that may ultimately be due or owed (including interest). These estimates may change from time to time based on management’s evaluation of developments subsequent to the filing of the income tax return, such as tax authority audits, court decisions or other tax law interpretations. There can be no assurance that any tax reserves will be sufficient to cover tax liabilities that may ultimately be determined to be owed. FASB Interpretation No. 48 provides new accounting for uncertain income tax positions and is effective for 2007. See “Recent Accounting Standards.”
For additional discussion of income taxes, see “Management's Discussion and Anaylsis of Financial Condition and Results of Operations - Results of Operations- Income Tax Expense” and Notes 1 and 14 of “Notes to Consolidated Financial Statements” in Item 8 of this Form 10-K.
Results of Operations
| Year Ended December 31, | |||||||||||||||||
|---|---|---|---|---|---|---|---|---|---|---|---|---|---|---|---|---|---|
| 2006 | 2005 | 2004 | |||||||||||||||
| (Dollars in thousands, except per share data) | |||||||||||||||||
| Net income | $ | 84,583 | 103,353 | 101,522 | |||||||||||||
| Net income as adjusted for balance sheet | |||||||||||||||||
| restructuring and certain tax charges | 100,651 | 103,353 | 101,522 | ||||||||||||||
| Diluted earnings per share | 2.51 | 3.13 | 3.01 | ||||||||||||||
| Diluted earnings per share as adjusted for | |||||||||||||||||
| balance sheet restructuring and | |||||||||||||||||
| certain tax charges | 2.99 | 3.13 | 3.01 | ||||||||||||||
| Return on average assets | .75 | % | 1.03 | 1.10 | |||||||||||||
| Return on average assets, exclusive of | |||||||||||||||||
| balance sheet restructuring and certain tax | |||||||||||||||||
| charges (1) | .89 | 1.03 | 1.10 | ||||||||||||||
| Return on average equity | 8.04 | 10.75 | 10.98 | ||||||||||||||
| Return on average equity, exclusive of | |||||||||||||||||
| balance sheet restructuring and certain tax | |||||||||||||||||
| charges (1) | 9.57 | 10.75 | 10.98 | ||||||||||||||
| Return on average tangible equity(2) | 12.99 | 16.03 | 15.81 | ||||||||||||||
| Return on average tangible equity, exclusive of | |||||||||||||||||
| balance sheet restructuring and certain tax | |||||||||||||||||
| charges(1)(2) | 15.46 | 16.03 | 15.81 | ||||||||||||||
| Average diluted shares outstanding | 33,765,012 | 32,983,962 | 33,706,569 | ||||||||||||||
| (1) | These ratios are calculated exclusive of balance sheet restructuring and certain tax charges. See “Item 6. Non-GAAP Financial Information” |
| (2) | Return on average tangible equity is calculated by dividing net income by the difference of average shareholder equity less average goodwill and core deposit intangibles. |
40
Balance Sheet Restructuring
During the fourth quarter of 2006, we undertook a balance sheet restructuring plan seeking to better position the Bank for current difficult and uncertain interest rate environment. The restructuring has allowed us to reduce pressure on our net interest margin as we reduced the size of our investment portfolio and repaid certain wholesale borrowings, and has enabled us to improve future operating results without increasing interest rate risk. The restructuring plan had a negative impact on 2006 pre-tax earnings of $19.9 million, or $.36 per diluted share on an after-tax basis. We estimate that the restructuring will benefit 2007 pre-tax earnings by approximately $9.8 million, or approximately $.18 per diluted share on an after-tax basis, and that we will have recouped the 2006 restructuring costs through increased net interest income in approximately 2.1 years without considering any potential redeployment of capital in longer-term opportunities.
The table below summarizes the results of the various components of the restructuring:
| Balance | Yield/ Cost | Pre-tax Impact on 2006 Results | ||||||||||||
|---|---|---|---|---|---|---|---|---|---|---|---|---|---|---|
| Interest-earning assets sold: | ||||||||||||||
| Loans receivable | $ | 219,579 | 4 | .21% | $ | (4,156 | ) | |||||||
| Investment Securities | 229,650 | 3 | .71 | (3,618 | ) | |||||||||
| Mortgage-backed securities | 301,722 | 4 | .10 | (9,316 | ) | |||||||||
| $ | 750,951 | 4 | .01% | (17,090 | ) | |||||||||
| FHLBC advances prepaid | $ | 501,513 | 5 | .28% | (2,813 | ) | ||||||||
| Total restructuring charges | $ | (19,903 | ) | |||||||||||
We identified for sale $219.6 million of one- to four-family loans held in our portfolio, primarily seasoned 5/1 hybrid ARMs with approximately two years remaining to their first repricing, which carried a weighted average yield of 4.21%. A lower-of-cost-or-market adjustment was recorded in December 2006, when we reclassified the loans into the loans held for sale category. We also identified for sale investments and mortgage-backed securities with; a cost basis of $531.4 million, an average duration of approximately 2.17 years, and an average yield of 3.93%. We recorded an other-than-temporary impairment on these securities as of December 31, 2006. Much of this write-down was previously recognized as a reduction to stockholders’ equity through other comprehensive income adjustments in accordance with SFAS No. 115. We repaid $501.5 million of FHLBC advances with a duration of approximately 2.07 years and included advances with unexercised put options. We repaid the borrowings in late December 2006, and recorded $2.8 million of expense associated with prepayment of these borrowings. We initially funded the repayment with cash on hand and a $400 million short-term borrowing until the asset sales were consummated and settled in early 2007. Consequently, at December 31, 2006, our balance sheet has yet to reflect the deleverage aspect of the transaction. The short-term borrowing was repaid on January 9, 2007. The approximately $230.0 million of liquidity available for immediate reinvestment has been used to purchase securities which meet the Bank’s duration target contemplated in the transaction, at a current yield of approximately 5.69%, well above the yields on assets sold.
Net interest income
Net interest income is our principal source of earnings, and consists primarily of interest income on loans receivable and mortgage-backed and investment securities, offset by interest expense on deposits, borrowed funds, and junior subordinated debentures. Net interest income fluctuates due to a variety of reasons, most notably due to the size of our balance sheet, changes in interest rates, the shape of the U.S. Treasury yield curve, competitive market pressures on the pricing of our products, the extent of our investment in non-interest earning assets and the level of interest-rate and credit risk we are willing to accept. Our net interest margin has contracted over the last several years largely due to the concentration of one- to four-family mortgages in our portfolio.
Traditionally, we have been able to increase net interest income at a faster pace when intermediate to long-term U.S. Treasury rates are greater than short-term interest rates, as our funding costs tend to be tied to shorter-term rates, while pricing on our fixed-rate and ARM loan products tend to
41
be tied to intermediate to longer-term interest rates. In periods of greater slope in the yield curve, we have leveraged our capital to increase loans and other earning assets and this strategy has successfully increased past profits. As the market differential between short- and long-term interest rates has shrunk since late 2004, marginal incremental business added to our balance sheet carries smaller net interest margin income, and ultimately decreases our net interest margin percentage. We have attempted to limit the adverse impact of the flatter and inverted yield curve environment by limiting asset growth in lower yielding asset categories, by selling a higher percentage of our one- to four-family ARM mortgage loan production.
Over the past five years, we have successfully transitioned a greater percentage of our balance sheet into higher-yielding, adjustable-rate loans related to our business banking and home equity line of credit loan portfolios as another way of combating a flatter, or inverted yield curve environment. These products tend to be tied to the Prime rate (or to a lesser extent three-month LIBOR) and adjust to increased short-term interest rates more rapidly than other assets in our portfolio. Because of this, we can more effectively match fund these assets with similar duration liabilities, exclusive of the shape of the yield curve.
Core deposits, which tend to provide lower-cost funding, also help us mitigate the impact of a flatter yield curve. Impacting our net interest income recently has been the shifting of our low-cost core deposits into higher-yielding certificate accounts and money market accounts due to rapid increases in short-term interest rates since 2005. As rates rose in the first half of 2006, our pricing strategy was designed to migrate interest-sensitive depositors to more rate-sensitive certificates of deposit. In the fourth quarter of 2006, when rates appeared to have peaked, we changed our pricing strategy with a goal of moving these funds back into shorter term products such as money market accounts. Our mix of core deposits to total deposits has declined slightly from 53.4% at December 31, 2005, to 49.4% at December 31, 2006, and the cost of core deposits has also risen, both due to higher short-term market rates and competitive pricing for deposits. These factors have added pressure to our net interest margin.
42
Average Balance Sheets.The following table reflects the average yield on assets and average cost of liabilities for the periods indicated. Such yields or costs are derived by dividing income or expense by the average balance of assets or liabilities, excluding any tax equivalent adjustments for municipal security income, the impact of which is not significant. Average balances are derived from average daily balances, and include non-accrual loans and investments. The yield/cost at December 31, 2006 includes fees that are considered adjustments to yield.
| Year Ended December 31, | |||||||||||||||||||||||||||||||||||||||||||||||||||||||||||||||||||||||||
|---|---|---|---|---|---|---|---|---|---|---|---|---|---|---|---|---|---|---|---|---|---|---|---|---|---|---|---|---|---|---|---|---|---|---|---|---|---|---|---|---|---|---|---|---|---|---|---|---|---|---|---|---|---|---|---|---|---|---|---|---|---|---|---|---|---|---|---|---|---|---|---|---|---|
| 2006 | 2005 | 2004 | At December 31, 2006 | ||||||||||||||||||||||||||||||||||||||||||||||||||||||||||||||||||||||
| Average Balance | Interest | Average Yield/ Cost | Average Balance | Interest | Average Yield/ Cost | Average Balance | Interest | Average Yield/ Cost | Balance | Yield/ Cost | |||||||||||||||||||||||||||||||||||||||||||||||||||||||||||||||
| (Dollars in thousands) | |||||||||||||||||||||||||||||||||||||||||||||||||||||||||||||||||||||||||
| Assets: | |||||||||||||||||||||||||||||||||||||||||||||||||||||||||||||||||||||||||
| Loans receivable | $ | 8,007,644 | 488,639 | 6.10 | % | $ | 7,051,371 | $ | 383,879 | 5 | .44% | $ | 6,721,514 | $ | 343,011 | 5 | .10% | $ | 7,780,552 | 6 | .36% | ||||||||||||||||||||||||||||||||||||||||||||||||||||
| Mortgage-backed | |||||||||||||||||||||||||||||||||||||||||||||||||||||||||||||||||||||||||
| securities | 1,475,936 | 67,649 | 4.58 | 1,411,558 | 59,664 | 4 | .23 | 1,008,800 | 38,802 | 3 | .85 | 1,407,796 | 4 | .71 | |||||||||||||||||||||||||||||||||||||||||||||||||||||||||||
| Stock in FHLB of | |||||||||||||||||||||||||||||||||||||||||||||||||||||||||||||||||||||||||
| Chicago | 166,343 | 5,276 | 3.17 | 208,734 | 12,346 | 5 | .91 | 356,435 | 23,092 | 6 | .46 | 146,407 | 3 | .10 | |||||||||||||||||||||||||||||||||||||||||||||||||||||||||||
| Investment securities | 521,807 | 24,060 | 4.61 | 438,074 | 18,077 | 4 | .13 | 358,022 | 13,233 | 3 | .70 | 529,998 | 4 | .73 | |||||||||||||||||||||||||||||||||||||||||||||||||||||||||||
| Interest-bearing deposits | |||||||||||||||||||||||||||||||||||||||||||||||||||||||||||||||||||||||||
| and federal funds sold(1) | 146,264 | 9,576 | 6.55 | 83,955 | 4,690 | 5 | .59 | 106,580 | 3,035 | 2 | .85 | 132,827 | 5 | .88 | |||||||||||||||||||||||||||||||||||||||||||||||||||||||||||
| Total interest-earning | |||||||||||||||||||||||||||||||||||||||||||||||||||||||||||||||||||||||||
| assets | 10,317,994 | 595,200 | 5.77 | 9,193,692 | 478,656 | 5 | .21 | 8,551,351 | 421,173 | 4 | .92 | 9,997,580 | 5 | .99 | |||||||||||||||||||||||||||||||||||||||||||||||||||||||||||
| Non-interest earning | |||||||||||||||||||||||||||||||||||||||||||||||||||||||||||||||||||||||||
| assets | 982,407 | 800,980 | 707,928 | 1,122,919 | |||||||||||||||||||||||||||||||||||||||||||||||||||||||||||||||||||||
| Total assets | $ | 11,300,401 | $ | 9,994,672 | $ | 9,259,279 | $ | 11,120,499 | |||||||||||||||||||||||||||||||||||||||||||||||||||||||||||||||||
| Liabilities and | |||||||||||||||||||||||||||||||||||||||||||||||||||||||||||||||||||||||||
| stockholders' equity: | |||||||||||||||||||||||||||||||||||||||||||||||||||||||||||||||||||||||||
| Deposits | $ | 6,226,306 | 185,705 | 2.98 | $ | 5,575,696 | 108,374 | 1 | .94 | $ | 5,226,301 | 73,872 | 1 | .41 | 6,413,906 | 3 | .47 | ||||||||||||||||||||||||||||||||||||||||||||||||||||||||
| Borrowed funds | 3,194,054 | 145,359 | 4.55 | 2,747,379 | 103,531 | 3 | .77 | 2,487,727 | 86,013 | 3 | .46 | 2,773,192 | 4 | .71 | |||||||||||||||||||||||||||||||||||||||||||||||||||||||||||
| Junior subordinated | |||||||||||||||||||||||||||||||||||||||||||||||||||||||||||||||||||||||||
| debentures | 67,011 | 4,507 | 6.73 | 36,944 | 1,992 | 5 | .39 | — | — | — | 67,011 | 6 | .95 | ||||||||||||||||||||||||||||||||||||||||||||||||||||||||||||
| Total interest-bearing | |||||||||||||||||||||||||||||||||||||||||||||||||||||||||||||||||||||||||
| liabilities | 9,487,371 | 335,571 | 3.54 | 8,360,019 | 213,897 | 2 | .56 | 7,714,028 | 159,885 | 2 | .07 | 9,254,109 | 3 | .87 | |||||||||||||||||||||||||||||||||||||||||||||||||||||||||||
| Non-interest | |||||||||||||||||||||||||||||||||||||||||||||||||||||||||||||||||||||||||
| bearing deposits | 580,982 | 494,239 | 462,961 | 604,104 | |||||||||||||||||||||||||||||||||||||||||||||||||||||||||||||||||||||
| Other liabilities | 180,064 | 178,876 | 157,828 | 190,141 | |||||||||||||||||||||||||||||||||||||||||||||||||||||||||||||||||||||
| Total liabilities | 10,248,417 | 9,033,134 | 8,334,817 | 10,048,354 | |||||||||||||||||||||||||||||||||||||||||||||||||||||||||||||||||||||
| Stockholders' equity | 1,051,984 | 961,538 | 924,462 | 1,072,145 | |||||||||||||||||||||||||||||||||||||||||||||||||||||||||||||||||||||
| Liabilities and | |||||||||||||||||||||||||||||||||||||||||||||||||||||||||||||||||||||||||
| stockholders' equity | $ | 11,300,401 | $ | 9,994,672 | $ | 9,259,279 | $ | 11,120,499 | |||||||||||||||||||||||||||||||||||||||||||||||||||||||||||||||||
| Net interest income/ | |||||||||||||||||||||||||||||||||||||||||||||||||||||||||||||||||||||||||
| interest rate spread | 259,629 | 2.23 | % | 264,759 | 2 | .65% | 261,288 | 2 | .85% | 2 | .12% | ||||||||||||||||||||||||||||||||||||||||||||||||||||||||||||||
| Net earning assets/net | |||||||||||||||||||||||||||||||||||||||||||||||||||||||||||||||||||||||||
| yield on average | |||||||||||||||||||||||||||||||||||||||||||||||||||||||||||||||||||||||||
| interest-earning assets | $ | 830,623 | 2.52 | % | $ | 833,673 | 2 | .88% | $ | 837,323 | 3 | .06% | $ | 743,471 | |||||||||||||||||||||||||||||||||||||||||||||||||||||||||||
| Ratio of interest-earning | |||||||||||||||||||||||||||||||||||||||||||||||||||||||||||||||||||||||||
| assets to interest- | |||||||||||||||||||||||||||||||||||||||||||||||||||||||||||||||||||||||||
| bearing liabilities | 108.76 | % | 109.97 | % | 110.85 | % | 108.03 | % | |||||||||||||||||||||||||||||||||||||||||||||||||||||||||||||||||
| (1) | Includes pro-rata share of interest income received on outstanding drafts payable. |
43
Rate/Volume Analysis. The table below shows the impact of changes in interest-earning assets and interest-bearing liabilities and changes in interest rates on our interest income and interest expense during the periods indicated. Changes attributable to the combined impact of volume and rate have been allocated proportionately to the changes due to volume and the changes due to rate.
| Year Ended December 31, 2006 vs. 2005 | Year Ended December 31, 2005 vs. 2004 | ||||||||||||||||||||||||||||||||||
|---|---|---|---|---|---|---|---|---|---|---|---|---|---|---|---|---|---|---|---|---|---|---|---|---|---|---|---|---|---|---|---|---|---|---|---|
| Total Change | Change Due to Volume | Change Due to Rate | Total Change | Change Due to Volume | Change Due to Rate | ||||||||||||||||||||||||||||||
| (Dollars in thousands) | |||||||||||||||||||||||||||||||||||
| Change in: | |||||||||||||||||||||||||||||||||||
| Interest-income: | |||||||||||||||||||||||||||||||||||
| Loans receivable | $ | 104,760 | 55,387 | 49,373 | $ | 40,868 | 17,309 | 23,559 | |||||||||||||||||||||||||||
| Mortagage-backed securities | 7,985 | 2,802 | 5,183 | 20,862 | 16,719 | 4,143 | |||||||||||||||||||||||||||||
| Investment securities | 5,983 | 3,706 | 2,277 | 4,844 | 3,185 | 1,659 | |||||||||||||||||||||||||||||
| Stock in FHLB of Chicago | (7,070 | ) | (2,153 | ) | (4,917 | ) | (10,746 | ) | (8,925 | ) | (1,821 | ) | |||||||||||||||||||||||
| Interest-bearing deposits and | |||||||||||||||||||||||||||||||||||
| federal funds sold | 4,886 | 3,967 | 919 | 1,655 | (756 | ) | 2,411 | ||||||||||||||||||||||||||||
| Total interest income | 116,544 | 63,709 | 52,835 | 57,483 | 27,532 | 29,951 | |||||||||||||||||||||||||||||
| Interest-expense: | |||||||||||||||||||||||||||||||||||
| Deposits | 77,331 | 13,857 | 63,474 | 34,502 | 5,175 | 29,327 | |||||||||||||||||||||||||||||
| Borrowed funds | 41,828 | 18,368 | 23,460 | 17,518 | 9,411 | 8,107 | |||||||||||||||||||||||||||||
| Junior subordinated | |||||||||||||||||||||||||||||||||||
| debentures | 2,515 | 1,621 | 894 | 1,992 | 1,992 | — | |||||||||||||||||||||||||||||
| Total interest expense | 121,674 | 33,846 | 87,828 | 54,012 | 16,578 | 37,434 | |||||||||||||||||||||||||||||
| Net change in interest | |||||||||||||||||||||||||||||||||||
| income | $ | (5,130 | ) | 29,863 | (34,993 | ) | $ | 3,471 | 10,954 | (7,483 | ) | ||||||||||||||||||||||||
2006 versus 2005. Net interest income decreased to $259.6 million in 2006, compared to $264.8 million in 2005. While we grew average earning assets by $1.12 billion, primarily due to the acquisition of EFC, our net interest margin declined 36 basis points, to 2.52% from 2.88%. With higher funding costs, our one- to four-family mortgage portfolio, made up primarily of hybrid ARMs originated within the last one to three years, is negatively impacting our margin. More than $1.5 billion of these loans are scheduled to reprice over the next eight quarters, which should help our net interest margin beginning in late 2007.
The overall yield on interest-earning assets improved 56 basis points to 5.77% in 2006, reflecting higher market rates of interest as well as the strategic shift in our mix of loans. Organic growth in interest-earning assets was minimal in 2006 due to our strategy to limit balance sheet growth in lower-yielding asset categories.
We experienced 35 and 48 basis point improvements in the average yields on our mortgage-backed and investment securities portfolio, respectively, during 2006 due to maturities and amortization of lower-yielding securities redeployed at higher current yields. Due to our balance sheet restructuring, the yields on these portfolios should improve further in 2007, while average balances are expected to decrease.
We reduced our investment in FHLBC stock in 2006 to the extent of permitted redemptions, but continued to hold excess investment in what is now an underperforming investment. The dividend yield declined to 3.17% in 2006 from 5.91% in 2005 due to continued regulatory restrictions and weaker earnings at the FHLBC. We anticipate further reducing our excess investment in 2007, subject to FHLBC constraints.
The cost of our interest-bearing liabilities increased 98 basis points to 3.54% in 2006, as deposit costs increased by 104 basis points due to upward repricing of maturing certificates of deposit, slow checking account growth and a decline in the balance of passbook accounts. Money market deposit costs increased due to our strategy of offering a higher rate money market product as an alternative to higher cost CDs. The increase in the prime rate due to Federal Reserve Board tightened monetary policy (as well as 3-month LIBOR) led to an increase in the cost of variable rate borrowings and our junior subordinated debentures.
In addition, during 2006 we repurchased 1.9 million shares of stock using borrowed funds, which improved earnings per share results but had the effect of reducing the net interest margin. We also increased our investments in bank-owned life insurance (earnings from which are classified as non-
44
interest income) by another $35 million during 2006 after having added $35 million in the second quarter of 2005, and our investment in real estate held for development. Investments in non-interest earning assets negatively impact the net interest margin.
2005 versus 2004. Net interest income increased to $264.8 million in 2005, compared to $261.3 million in 2004, due to an increase in average interest-earning assets of $642.3 million, or 7.5%, to $9.19 billion. Our net interest margin contracted 18 basis points from the previous year to 2.88% in 2005, due to the faster upward repricing of our deposits and borrowed funds compared to our interest->earning assets, in response to the rise in short-term market interest rates and our issuance during 2005 of junior subordinated debentures, which are higher cost than the average rate on our other borrowings. We used the majority of this amount to fund stock repurchases during the year.
Our overall yield on interest-earning assets increased 29 basis points to 5.21% in 2005. We achieved a 34 basis point increase in the yield on our loan portfolio, to 5.44%, as our portfolios of equity lines of credit and commercial business loans adjusted upward in response to the rise in the Prime rate of interest. Similarly, a 38 basis point increase in the average yield on our mortgage-backed and investment securities portfolio due to new assets purchased at higher rates helped improve our asset yields. Due to limited growth in our loan portfolio, attributable to slower mortgage production and increased prepayments on mortgage loans and equity lines, we grew our average mortgage-backed securities portfolio by $402.8 million, while maintaining our interest rate risk objectives. Our overall average asset yield in 2005 was negatively impacted by the yield reduction on our FHLBC stock investment, as well as the $147.7 million reduction in the average balance of this investment. We redeemed FHLBC stock periodically throughout the year during 2005 to address the concentration in our investment portfolio resulting from prior acquisitions.
Our overall cost of interest-bearing liabilities increased 49 basis points to 2.56% in 2006, driven by a 53 basis point increase in our cost of deposits, to 1.94%. Deposits accounted for 66.5% of our funding in 2005. Our deposit costs were impacted by a variety of factors, including the sharp upward repricing of maturing certificate of deposit accounts and money market deposits, slower growth of checking deposits, and a decline in the balance of passbook accounts, which led to a reduction in the percentage of our core deposits to total deposits to 53.4% in 2005, compared to 59.6% in 2004. Similarly, our costs of borrowed funds increased 31 basis points to 3.77% in 2005. In response to our increase in shorter-term interest-earning assets, we have increased our exposure to Prime and LIBOR-indexed borrowed funds, which have repriced upward in response to rising short-term interest rates.
Provision for Loan Losses
We recorded a provision for loan losses and experienced net charge-offs as follows for the three years ended December 31, 2006 as shown below:
| Year Ended December 31, | |||||||||||||||||
|---|---|---|---|---|---|---|---|---|---|---|---|---|---|---|---|---|---|
| 2006 | 2005 | 2004 | |||||||||||||||
| (Dollars in thousands) | |||||||||||||||||
| Provision for loan losses | $ | 3,900 | 1,980 | 1,215 | |||||||||||||
| Net charge-offs | 4,758 | 1,740 | 812 | ||||||||||||||
| Net charge-offs to average loans | .06 | % | .02 | .01 | |||||||||||||
The provision for loan losses increased in 2006 due to higher incurred and expected losses on the residential loan portfolio, particularly in the high loan-to-value equity lines of credit category, where we earn a higher rate of interest to compensate for the greater credit risk associated with these loans. Higher interest rates and weakness in residential real estate prices have contributed to higher levels of delinquencies, non-accrual loans and chargeoffs on these loans although our overall credit quality experience as measured by net-charge-offs to average loans has remained strong.
45
In evaluating the adequacy of the allowance for loan losses and determining, if any, the related provision for loan losses shown in the table above, management considers: (1) historical loss experience and change in the size and mix of the overall portfolio composition, (2) specific allocations based upon probable losses identified during the review of the portfolio, (3) delinquency trends in the portfolio and the composition of non-performing loans, including the percent of non-performing loans with supplemental mortgage insurance, and (4) subjective factors, including local and general economic business factors and trends, industry and interest rate trends, new lending products and changes in underwriting criteria and portfolio concentrations. The table below shows the total allowance for loan losses and selected percentages for the periods indicated:
| Year Ended December 31, | |||||||||||||||||
|---|---|---|---|---|---|---|---|---|---|---|---|---|---|---|---|---|---|
| 2006 | 2005 | 2004 | |||||||||||||||
| (Dollars in thousands) | |||||||||||||||||
| Allowance for loan losses | $ | 39,931 | 36,495 | 36,255 | |||||||||||||
| Allowance for loan losses as a percentage of non-performing | |||||||||||||||||
| loans | 60.06 | % | 117.12 | 115.18 | |||||||||||||
| Allowance for loan losses as a percentage of loans receivable, | |||||||||||||||||
| exclusive of loans held for sale | .54 | .51 | .53 | ||||||||||||||
Non-interest income
2006 versus 2005. Non-interest income is another significant source of revenue for us. It consists primarily of fees earned on deposit and loan products and services and gains and losses from asset sale activity. Non-interest income decreased $5.3 million or 6.5% for the year ended December 31, 2006 compared to the year ended December 31, 2005. Exclusive of balance sheet restructuring charges, however, non-interest income grew by $11.8 million, or 15% in 2006.
The table below shows the composition of non-interest income for the periods indicated.
| Year Ended December 31, | Percentage Increase (Decrease) | |||||||||||||||||||||||||||||||||||||
|---|---|---|---|---|---|---|---|---|---|---|---|---|---|---|---|---|---|---|---|---|---|---|---|---|---|---|---|---|---|---|---|---|---|---|---|---|---|---|
| 2006 | 2005 | 2004 | 2006 | 2005 | ||||||||||||||||||||||||||||||||||
| (Dollars in thousands) | ||||||||||||||||||||||||||||||||||||||
| Net gain (loss) on sale and write-down | ||||||||||||||||||||||||||||||||||||||
| of assets: | ||||||||||||||||||||||||||||||||||||||
| Loans receivable | $ | 8,793 | 10,675 | 9,294 | (17 | .6)% | 14 | .9 | ||||||||||||||||||||||||||||||
| Mortgage-backed securities | (9,316 | ) | — | 500 | N | M | N | M | ||||||||||||||||||||||||||||||
| Investment securities | (3,614 | ) | 727 | 822 | (597 | .1) | (11 | .6) | ||||||||||||||||||||||||||||||
| Premises and equipment | 795 | 164 | (9 | ) | 384 | .8 | (1,922 | .2) | ||||||||||||||||||||||||||||||
| Foreclosed real estate | (322 | ) | 221 | 506 | (245 | .7) | (56 | .3) | ||||||||||||||||||||||||||||||
| Mortgage loan servicing rights | 3,600 | 2,400 | — | 50 | .0 | N | M | |||||||||||||||||||||||||||||||
| Deposit account service charges | 41,837 | 35,193 | 34,112 | 18 | .9 | 3 | .2 | |||||||||||||||||||||||||||||||
| Other loan fees | 6,821 | 6,303 | 5,775 | 8 | .2 | 9 | .1 | |||||||||||||||||||||||||||||||
| Bank-owned life insurance | 7,303 | 5,576 | 3,410 | 31 | .0 | 63 | .5 | |||||||||||||||||||||||||||||||
| Brokerage and insurance commissions | 6,281 | 4,891 | 4,608 | 28 | .4 | 6 | .1 | |||||||||||||||||||||||||||||||
| Loan servicing fee income | 3,409 | 2,261 | 1,231 | 50 | .8 | 83 | .7 | |||||||||||||||||||||||||||||||
| Valuation recovery (allowance) on | ||||||||||||||||||||||||||||||||||||||
| mortgage servicing rights | — | 171 | 2,072 | N | M | (91 | .7) | |||||||||||||||||||||||||||||||
| Income from real estate operations | 785 | 2,928 | 6,657 | (73 | .2) | (56 | .0) | |||||||||||||||||||||||||||||||
| Other income: | ||||||||||||||||||||||||||||||||||||||
| Safe deposit box fees | 972 | 899 | 820 | 8 | .1 | 9 | .6 | |||||||||||||||||||||||||||||||
| Title agency fees | 286 | 386 | 524 | (25 | .9) | (26 | .3) | |||||||||||||||||||||||||||||||
| Assumed premium income | 2,491 | 2,346 | 1,938 | 6 | .2 | 21 | .1 | |||||||||||||||||||||||||||||||
| Real estate held for investment | ||||||||||||||||||||||||||||||||||||||
| income(1) | 3,842 | 4,150 | 3,951 | (7 | .4) | 5 | .0 | |||||||||||||||||||||||||||||||
| Other | 1,955 | 1,885 | 1,843 | 3 | .7 | 2 | .3 | |||||||||||||||||||||||||||||||
| Total other income | 9,546 | 9,666 | 9,076 | (1 | .2) | 6 | .5 | |||||||||||||||||||||||||||||||
| Total non-interest income | $ | 75,918 | 81,176 | 78,054 | (6 | .5)% | 4 | .0 | ||||||||||||||||||||||||||||||
| (1) | Income from investments in affordable housing properties in Wisconsin. |
Exclusive of the $4.2 million lower-of-cost or market adjustment related to our balance sheet restructuring, our gain on sale of loans in 2006 increased to $13.0 million on $1.28 billion of loan sales compared to $10.7 million on $825.8 million of loan sales in 2005. Also contributing to 2006 non-interest income was a $3.6 million gain on sale of $963 million of loan servicing rights compared to a $2.4 million gain on $751 million of loan servicing rights sold in 2005, continuing our strategy of selling primarily single-service loan servicing rights to take advantage of attractive market opportunity when we believe market pricing offers us a better return than our projected servicing cash flows.
Losses on investment and mortgage-backed securities in 2006 resulted from $12.9 million of other-than-temporary impairment writedowns on $531 million of securities identified for sale as part of the balance sheet restructuring. Subsequent to year end, these securities have all been sold. Investment
46
gains in 2005 related primarily to consideration received in the dissolution of a regional ATM network in which we held shares.
Losses of $322,000 in 2006 from the sale of foreclosed real estate is indicative of the slowdown in home sales in the U.S. and local economy.
Assumed premium income, which represents the portion we share of insurance premiums under reinsurance agreements with various private mortgage insurance (PMI) companies in return for our assuming part of the risk of loss on credits we originate, increased over 6% due to a higher volume of loans included in these programs.
Deposit account service charge income increased primarily due to higher fee rates for deposit service charges, as well as the addition of the EFC deposit base acquired in February 2006. The growth also reflects increases in debit card activity and higher consumer overdraft activity.
Income earned from bank-owned life insurance increased $1.7 million, or 31%, in 2006, as the result of $15 million of new investments during the year and additional BOLI investments acquired in the EFC acquisition.
Other loan fee income, which primarily includes late charges, commercial processing fees, equity lines of credit fees, income from our origination and sale of subprime product offerings and letter of credit fees, was $6.8 million in 2006, an increase of $518,000 over 2005. The increase is due primarily to higher fee income from subprime lending activities where we originate loans as a broker or correspondent for third party subprime lenders.
Brokerage and insurance commissions improved 28.4% to $6.3 million due to the improved equity markets, additional sales personnel, as well as the acquisition of EFC. We currently employ 28 licensed investment professionals throughout our network selling investment products to our customers.
Loan servicing fee income improved in 2006 as a result of slower prepayment speeds experienced in the current year that resulted from higher interest rates and slower home sales. The improvement supports the higher value of servicing rights in the market, and why we have sold mortgage servicing rights in the past two years.
Income from real estate operations for the last three years is detailed below by project:
| Year Ended December 31, | |||||||||||||||||||||||||||||||||||||||||
|---|---|---|---|---|---|---|---|---|---|---|---|---|---|---|---|---|---|---|---|---|---|---|---|---|---|---|---|---|---|---|---|---|---|---|---|---|---|---|---|---|---|
| 2006 | 2005 | 2004 | |||||||||||||||||||||||||||||||||||||||
| Lots Closed | Income (Loss) | Lots Closed | Income (Loss) | Lots Closed | Income (Loss) | ||||||||||||||||||||||||||||||||||||
| (Dollars in thousands) | |||||||||||||||||||||||||||||||||||||||||
| Springbank of Plainfield | 83 | $ | 726 | 123 | $ | 2,335 | — | $ | — | ||||||||||||||||||||||||||||||||
| Shenandoah | — | (5 | ) | 4 | 561 | 126 | 5,022 | ||||||||||||||||||||||||||||||||||
| Tallgrass of Naperville: | |||||||||||||||||||||||||||||||||||||||||
| Single-family | 3 | 360 | — | 32 | 13 | 1,175 | |||||||||||||||||||||||||||||||||||
| Multi-family and commercial | — | — | — | — | 1 | 460 | |||||||||||||||||||||||||||||||||||
| Other | — | $ | (296 | ) | — | — | — | — | |||||||||||||||||||||||||||||||||
| 86 | $ | 785 | 127 | $ | 2,928 | 140 | $ | 6,657 | |||||||||||||||||||||||||||||||||
During 2006, we sold the final lots in Tallgrass of Naperville. Lot sales in the Springbank development in 2006 decreased due to the weaker housing market that has significantly reduced new and existing home sales nationwide and in our markets. Higher estimated costs to completion in the project, largely due to earlier project delays, have contributed to lower lot sale profit margins. While we now have product to sell to our builder group, most of the builders have been reluctant to add to their existing lot inventories due to the slow home sales market. The $296,000 other loss in 2006 resulted from the Company’s decision not to exercise an expiring option to purchase a parcel of real estate in Plainfield, IL , which resulted in a write-off of an earnest money deposit and other costs. The slow real estate sales market and the considerable investment the Company has in the Springbank development in Plainfield led to this decision. To accelerate revenue in the Springbank project, we are considering potential bulk lot sales, and the sale of unimproved land and the commercial and townhome sites in the subdivision.
2005 versus 2004. Loan sale volume dropped to $825.8 million in 2005 compared to $914.1 million in 2004, but our gain on sale of loans increased nearly 15% due to higher loan sale margins, primarily on our equity line of credit sales. During the year we also completed a sale of mortgage servicing rights, representing 21% of our serviced for others portfolio, at a pre-tax gain of $2.4 million.
47
Gain on investment securities in 2005 resulted primarily from the dissolution of a regional ATM network and the sale of two investments in other equity securities. The gain in 2004 resulted from the sale of certain corporate debt securities that had incurred other-than-temporary impairment write-downs in previous periods at a net gain of $2.7 million that was offset by a $2.0 million other-than-temporary impairment write-down on $8.8 million of Freddie Mac floating-rate preferred stock securities.
Assumed premium income increased over 20% due to an increase in the volume of loans originated with PMI that we included in these programs.
Deposit account service charge income increased primarily due to higher fee rates for deposit service charges, as well as the addition of the EFC deposit base acquired in February 2006.
Income earned from bank-owned life insurance increased $2.2 million, or 64%, in 2005, as the result of $35 million of new investments during the year and the receipt of $664,000 of death benefit proceeds.
Other loan fee income was $6.3 million in 2005, an increase of $528,000 over 2004. The increase was due primarily to a higher volume of late charges and commercial processing fees.
We closed on the first lots in the Springbank development in the fourth quarter of 2005. The 2005 income from Shenandoah included a $428,000 gain resulting from the closing out of the project.
Non-interest expense
The table below shows the composition of non-interest expense for the periods indicated.
| Year Ended December 31, | Percentage Increase (Decrease) | |||||||||||||||||||||||||||||||||||||
|---|---|---|---|---|---|---|---|---|---|---|---|---|---|---|---|---|---|---|---|---|---|---|---|---|---|---|---|---|---|---|---|---|---|---|---|---|---|---|
| 2006 | 2005 | 2004 | 2006 | 2005 | ||||||||||||||||||||||||||||||||||
| (Dollars in thousands) | ||||||||||||||||||||||||||||||||||||||
| Compensation | $ | 80,031 | 74,613 | 74,295 | 7 | .3% | .4 | |||||||||||||||||||||||||||||||
| Employee benefits | 25,764 | 25,375 | 23,975 | 1 | .5 | 5 | .8 | |||||||||||||||||||||||||||||||
| Total compensation and benefits | 105,795 | 99,988 | 98,270 | 5 | .8 | 1 | .7 | |||||||||||||||||||||||||||||||
| Occupancy expense | 23,468 | 21,145 | 19,717 | 11 | .0 | 7 | .2 | |||||||||||||||||||||||||||||||
| Furniture, fixture and equipment expense | 8,345 | 8,248 | 8,267 | 1 | .2 | ( | .2) | |||||||||||||||||||||||||||||||
| Advertising and promotion | 7,656 | 8,313 | 9,079 | (7 | .9) | (8 | .4) | |||||||||||||||||||||||||||||||
| Data processing | 9,695 | 8,144 | 8,012 | 19 | .0 | 1 | .6 | |||||||||||||||||||||||||||||||
| Amortization of core deposit intangibles | 4,309 | 2,902 | 3,002 | 48 | .5 | (3 | .3) | |||||||||||||||||||||||||||||||
| Prepayment charges related to repayment of borrowings | 2,813 | — | — | N | M | N | M | |||||||||||||||||||||||||||||||
| Other expenses: | ||||||||||||||||||||||||||||||||||||||
| Professional fees | 2,843 | 4,873 | 4,756 | (41 | .7) | 2 | .5 | |||||||||||||||||||||||||||||||
| Stationery, brochures and supplies | 3,036 | 2,811 | 3,210 | 8 | .0 | (12 | .4) | |||||||||||||||||||||||||||||||
| Postage | 2,556 | 2,649 | 2,810 | (3 | .5) | (5 | .7) | |||||||||||||||||||||||||||||||
| Telephone | 1,987 | 1,938 | 3,200 | 2 | .5 | (39 | .4) | |||||||||||||||||||||||||||||||
| Transaction fraud losses, net | 3,149 | 1,941 | 3,084 | 62 | .2 | (37 | .1) | |||||||||||||||||||||||||||||||
| Correspondent banking services | 1,607 | 1,586 | 1,596 | 1 | .3 | ( | .6) | |||||||||||||||||||||||||||||||
| Title fees, recording fees and credit | 2,092 | 2,317 | 1,937 | (9 | .7) | 19 | .6 | |||||||||||||||||||||||||||||||
| report expense | ||||||||||||||||||||||||||||||||||||||
| Security expense | 1,692 | 1,625 | 1,464 | 4 | .1 | 11 | .0 | |||||||||||||||||||||||||||||||
| Insurance costs | 1,963 | 1,829 | 1,635 | 7 | .3 | 11 | .9 | |||||||||||||||||||||||||||||||
| FDIC premiums and OTS assessment | 2,545 | 2,332 | 2,224 | 9 | .1 | 4 | .9 | |||||||||||||||||||||||||||||||
| Real estate held for investment(1) | 3,886 | 3,966 | 4,215 | (2 | .0) | (5 | .9) | |||||||||||||||||||||||||||||||
| Other | 8,633 | 9,467 | 9,338 | (8 | .8) | 1 | .4 | |||||||||||||||||||||||||||||||
| Total other expenses | 35,989 | 37,334 | 39,469 | (3 | .6) | (5 | .4) | |||||||||||||||||||||||||||||||
| Total non-interest expense | $ | 198,070 | 186,074 | 185,816 | 6 | .5% | 0 | .1 | ||||||||||||||||||||||||||||||
| Non-interest expense to average assets, exclusive of balance sheet restructuring charges | 1.73 | % | 1.86 | 2.01 | ||||||||||||||||||||||||||||||||||
| FTEs | 2,152 | 2,075 | 2,088 | |||||||||||||||||||||||||||||||||||
| (1) | Expenses related to investments in affordable housing properties in Wisconsin. |
48
2006 versus 2005. Non-interest expense increased 6.5%, or $12.0 million, in 2006 compared to 2005, including $2.8 million of prepayment charges related to the balance sheet restructuring and $1.0 million loss related to a standby letter of credit obligation. While we added seven branches from the acquisition of EFC and operated two de novo branches opened in December 2005 for the full year, we partially offset these costs through a number of cost curtailment strategies implemented during the year. The ratio of non-interest expense to average assets improved to 1.73% in 2006 from 1.86% in 2005. Efforts to carefully monitor and control non-interest expense levels will continue to be a focus in 2007.
Compensation and benefits increased by 5.8% during 2006, while occupancy and equipment costs increased by 8.2% over this same period. The increase in these categories is primarily due to the impact of the EFC transaction.
We experienced a 19.0% increase in data processing expense to $9.7 million in 2006 as the expansion of our retail network in the EFC acquisition necessitated additional resources allocated to network hardware support. Also contributing to the increase was the cost of additional security safeguards.
Amortization of core deposit intangibles increased as a result of the EFC acquisition.
Other expenses of $36.0 million were 3.6% lower than 2005 despite the $1.0 million write down. Professional expenses were substantially lower in 2006 compared to 2005 as certain expenses incurred in 2005 relating to anti-money laundering and Sarbanes-Oxley functions were not recurring in 2006.
2005 versus 2004. Our successful cost control efforts during the year held non-interest expenses flat to the prior year. The ratio of non-interest expense to average assets improved to 1.86% in 2005 compared to 2.01% in 2004. This was achieved while operations continued to expand through acquisition (Chesterfield Financial Corp. in October 2004) and three new branch openings in 2005.
Compensation and benefit costs increased only 1.7% in 2005, as our average full-time equivalent number of employees remained flat, and we reduced annual incentive compensation despite adding three new branches during the year.
Our advertising costs were reduced by 8.4% as we changed our marketing initiatives, spending less on new account premiums and channeling those savings into more targeted, rate-driven promotions.
Professional fees increased during 2005 compared to the prior year, reflecting higher costs related to consulting fees for various process improvement initiatives, including an automated work flow system for the mortgage loan division, and for enhancement of our ongoing Bank Secrecy Act/anti-money laundering compliance activities.
Telephone expense decreased year over year due to renegotiation and consolidation of our contract. Reductions in stationery and supplies expenses for 2005 reflect various efficiency and cost-reduction efforts.
Income Tax Expense
2006 versus 2005. Income tax expense decreased to $49.0 million for 2006, compared to $54.5 million for 2005 due to a decrease in pre-tax income, the effect of which was partially offset by an increase in the effective income tax rate. Our effective tax rate increased to 36.7% in 2006 compared to 34.5% for 2005. The increase in the effective tax rate compared to the prior year period was primarily attributable to adjustments to tax reserves for uncertainties.
During 2006, we recorded additional tax reserves of approximately $4.5 million relating to tax uncertainties (including interest) associated with income earned through the Bank’s REIT subsidiary that invests in real estate loans. Included in this total is $4.0 million of REIT-related reserves recorded in the fourth quarter as a result of state audit activity. As part of its audit of state income tax returns for 1999 to 2001, the Illinois Department of Revenue (“IDR”) issued a proposed adjustment in January 2007 that reflected the disallowance of the REIT dividends paid deduction for the years under examination, and a proposed increase in state income tax of approximately $11.4 million is claimed to be due. We disagree with the IDR proposed adjustment and intend to defend our tax filing positions.
49
Although we believe we have established adequate reserves for the state tax uncertainties associated with the REIT, if we are unsuccessful in defending our tax filing positions in these and subsequent years, we may incur increased tax expense in future periods.
2005 versus 2004. Income tax expense increased to $54.5 million for 2005, compared to $50.8 million for 2004, due to an increase in pre-tax income and to an increase in our effective tax rate to 34.5% in 2005 compared to 33.3% for 2004. The increase in the effective tax rate in 2005 was primarily due to the reversal of tax reserves for uncertainties in 2004 that related to certain prior years’ income tax matters.
A reconciliation of the statutory federal income tax rate to the effective tax rate is included in Note 14 to the consolidated financial statements in Item 8. “Financial Statements and Supplementary Data.”
Liquidity and Capital Resources
Our holding company manages liquidity and capital resources to provide funds necessary for holding company debt service on borrowings, cash dividends to stockholders, funding our real estate operations, and planned repurchases of common stock. Our major sources of liquidity at our holding company are dividends from the Bank, which are subject to regulatory limitations. Additionally, we maintain a $60.0 million unsecured line of credit with a Chicago-based commercial bank. See “Business– Borrowed Funds and Junior Subordinated Debentures” on page 19 for more information relating to this bank line of credit.
At December 31, 2006 our capital structure at the holding company includes equity capital of $1.07 billion, coupled with $67.0 million of junior subordinated debentures and $147.5 million of unsecured term debt. The weighted-average cost of our junior subordinated debentures is equal to 3-month LIBOR plus 156 basis points, while our term debt floats at 3-month LIBOR plus 95 basis points. We have used a combination of these sources of funds over the past few years to fund acquisitions and to repurchase our common stock in the open market. In connection with our purchase of EFC, we issued $105.1 million worth of our common stock, and increased our unsecured term loan to $115 million from $63 million to help finance the cash portion of the transaction. We also increased our revolving line of credit during 2006 from $55.0 million to $60.0 million. In July, 2006, we increased the term loan by $40 million to $155 million in part to provide funding for our stock buyback program. A scheduled principal payment on the term loan of $7.5 million was paid on December 31, 2006 reducing the balance to $147.5 million. At December 31, 2006, there were no amounts outstanding under the $60 million line of credit.
During 2006, the Company received $95.0 million in dividends from the Bank. At December 31, 2006 under current OTS regulations, the Bank has $13.3 million of retained earnings available for dividend declarations. On January 1, 2007 the amount available for dividend declarations increased to $40.5 million.
We manage liquidity at the Bank to ensure that adequate funds are available to meet normal operating requirements, as well as unexpected loan demand or deposit withdrawals by our customers, and other contractual obligations or commitments, on a timely and cost-effective manner. Our primary sources of funds are deposits, wholesale borrowings, principal repayments on loans and mortgage-backed securities, as well as proceeds from the sale of loans and investment securities. We manage our liquidity through regular review of loan originations and payoffs, deposit flows, and anticipated movements in interest rates, efforts that are aimed at forecasting when liquidity needs may occur and satisfying these liquidity needs while attempting to minimize funding risk.
While our scheduled loan and mortgage-backed securities amortization and maturing certificates of deposit are a relatively predictable source of funds, core deposit flows, loan and mortgage-backed securities prepayments are greatly influenced by economic conditions, the general level of interest rates and competition. We utilize particular sources of funds based on comparative costs and availability. We expect to continue diversifying our funding sources in 2007 through increased use of other wholesale borrowing sources, including reverse repurchase agreements. We may pursue wholesale borrowings with optionality structures to provide lower effective borrowing costs.
At December 31, 2006, we have approximately $1.21 billion of potential additional borrowing capacity from the FHLBC and approximately $1.05 billion of available collateral capacity under our one- to four-family blanket pledge agreement. We also have the ability to pledge other mortgage-backed and investment securities, as well as certain multi-family mortgage loans. Additional borrowings from the
50
FHLBC are subject to the Bank’s compliance underwriting, collateral, capital stock and other policies set forth in the FHLBC credit guide at the time of the borrowing request. In addition, we have $80 million of various short-term lines of credit with two other commercial banks. We also have additional capacity to obtain other borrowings through the pledge of investment or mortgage-backed securities.
Contractual Obligations and Commitments and Contingencies
Through the normal course of business we enter into certain contractual obligations and other commitments. These obligations generally relate to the funding of operations through deposits or borrowings. We generally renew a large percentage of our certificates of deposit, upon maturity, as certificates of deposit are primarily retail-oriented accounts rather than more rate-sensitive brokered certificates. As such, the scheduled $2.78 billion of maturing certificates of deposit in 2007 are not expected to put a burden on our cash needs. We have the ability to refinance any advance coming due with the FHLBC, which we will normally do in the normal course of business if our loan portfolio is growing and out-pacing deposit growth. If loan portfolio growth is slower, due to higher prepayments in the loan portfolio or increased loan sale activity, we may repay our maturing advances out of loan repayment proceeds.
Contractual Obligations. The following table shows our contractual obligations coming due in the periods indicated at December 31, 2006:
| Total | Less than 1 Year | 1 to 3 Years | 3 to 5 Years | After 5 Years | ||||||||||||||||||||||||||||||||||
|---|---|---|---|---|---|---|---|---|---|---|---|---|---|---|---|---|---|---|---|---|---|---|---|---|---|---|---|---|---|---|---|---|---|---|---|---|---|---|
| (Dollars in thousands) | ||||||||||||||||||||||||||||||||||||||
| Certificates of deposit | $ | 3,554,035 | 2,783,973 | 713,036 | 47,125 | 9,901 | ||||||||||||||||||||||||||||||||
| FHLB of Chicago advances | 2,155,000 | 1,495,000 | 600,000 | 60,000 | — | |||||||||||||||||||||||||||||||||
| Other borrowings | 470,751 | 95,751 | 100,000 | 225,000 | 50,000 | |||||||||||||||||||||||||||||||||
| Unsecured term bank loan | 147,500 | 12,500 | 28,000 | 33,000 | 74,000 | |||||||||||||||||||||||||||||||||
| Junior subordinated debentures | 67,011 | — | — | — | 67,011 | |||||||||||||||||||||||||||||||||
| Purchase obligations | 5,623 | 4,120 | 1,503 | — | — | |||||||||||||||||||||||||||||||||
| Real estate development contracts(1) | 11,898 | 7,294 | 4,604 | — | — | |||||||||||||||||||||||||||||||||
| Post retirement benefit plans | 5,895 | 95 | 504 | 903 | 4,393 | |||||||||||||||||||||||||||||||||
| Operating leases | 54,310 | 5,611 | 10,602 | 9,250 | 28,847 | |||||||||||||||||||||||||||||||||
| Total | $ | 6,472,023 | 4,404,344 | 1,458,249 | 375,278 | 234,152 | ||||||||||||||||||||||||||||||||
| (1) | Reflects pending contractual commitments for improvements. These figures do not include estimated development costs not under contract, currently estimated at $67 million for existing real estate development projects, all of which relates to our Springbank of Plainfield development. |
Purchase obligations reflect payment obligations under agreements to purchase goods or services in determinable amounts at fixed prices that are enforceable and legally binding on the Company.
Real estate development costs have been funded primarily out of proceeds from sales of previously developed lots, and when sales have not generated sufficient cash flow, funding is supported by additional capital investments from the holding company. It is currently anticipated that in 2007 we will be required to supplement the cash flow from lot sales with capital investments from the holding company.
Post retirement benefits include benefits for certain employees and/or directors under the Company’s Supplemental Executive Retirement Plan and Long-Term Medical Plan.
51
Commitments and Contingencies. The following table shows certain off-balance sheet commitments and contingencies of the Company and the Bank as of December 31, 2006:
| Total | Less than 1 Year | 1 to 3 Years | 3 to 5 Years | After 5 Years | ||||||||||||||||||||||||||||||||||
|---|---|---|---|---|---|---|---|---|---|---|---|---|---|---|---|---|---|---|---|---|---|---|---|---|---|---|---|---|---|---|---|---|---|---|---|---|---|---|
| (Dollars in thousands) | ||||||||||||||||||||||||||||||||||||||
| One- to four-family mortgage | ||||||||||||||||||||||||||||||||||||||
| commitments | $ | 377,617 | 377,617 | — | — | — | ||||||||||||||||||||||||||||||||
| Equity line and equity loan | ||||||||||||||||||||||||||||||||||||||
| commitments | 55,856 | 55,856 | — | — | — | |||||||||||||||||||||||||||||||||
| Unused portion of equity lines of | ||||||||||||||||||||||||||||||||||||||
| credit | 1,166,102 | 1,166,102 | — | — | — | |||||||||||||||||||||||||||||||||
| Commitments to sell one- to | ||||||||||||||||||||||||||||||||||||||
| four-family mortgage and equity | ||||||||||||||||||||||||||||||||||||||
| loans | 109,266 | 109,266 | — | — | — | |||||||||||||||||||||||||||||||||
| SBIC commitments | 3,625 | 3,625 | — | — | — | |||||||||||||||||||||||||||||||||
| Other mortgage loan commitments | 50,404 | 50,404 | — | — | — | |||||||||||||||||||||||||||||||||
| Commercial business lines | 643,059 | 548,880 | 75,259 | 13,726 | 5,194 | |||||||||||||||||||||||||||||||||
| Letters of credit(1) | 111,091 | 66,811 | 20,448 | 17,357 | 6,475 | |||||||||||||||||||||||||||||||||
| Commercial business loan | ||||||||||||||||||||||||||||||||||||||
| commitments | 3,985 | 3,985 | — | — | — | |||||||||||||||||||||||||||||||||
| Loans in Process | 32,258 | 32,258 | — | — | — | |||||||||||||||||||||||||||||||||
| Contingent liability under | ||||||||||||||||||||||||||||||||||||||
| recourse provisions(2) | 63,128 | 63,128 | — | — | — | |||||||||||||||||||||||||||||||||
| Total | $ | 2,616,391 | 2,477,932 | 95,707 | 31,083 | 11,669 | ||||||||||||||||||||||||||||||||
| (1) | Letters of credit include $14.0 million related to land development projects. |
| (2) | Amounts are shown based on time to maturity for amounts if used. Reflects the maximum amount of potential liability for credit losses at December 31, 2006 that we have retained relating to an aggregate $719.2 million of one- to four-family loans. We have either sold the loans to investors with recourse or have assumed a layer of credit risk through private mortgage insurance in force in the Bank’s captive reinsurance subsidiary and have a contingent liability under these provisions of $63.1 million. Our loss experience to date under such recourse provisions has been immaterial. |
At December 31, 2006, we have $331.2 million of cash and liquidity, $109.3 million of commitments to sell loans and significant additional borrowing capacity from the FHLBC and other wholesale borrowing sources. These sources are also available for the funding of unused equity lines of credit. However, we do not expect all of these lines to be used based on historical levels of total line usage by our customers. Recourse provisions include credit risk related to $28.6 million of loans sold with recourse to investors, $16.8 million of credit risk relating to loans sold to the MPF program and $17.7 million of credit risk related to loans with private mortgage insurance in force in our captive reinsurance subsidiary.
Impact of Inflation and Changing Prices
The consolidated financial statements and related consolidated information are prepared in accordance with generally accepted accounting principles, which require the measurement of financial position and operating results in terms of historical dollars without considering changes in the relative purchasing power of money over time due to inflation. Unlike most industrial companies, virtually all of the assets and liabilities of a financial institution are monetary in nature. As a result, interest rates have a more significant effect on a financial institution’s performance than the effects of general levels of inflation. Interest rates do not necessarily move in the same direction or in the same magnitude as the price of goods and services.
Recent Accounting Standards
Statements of Financial Accounting Standards
Stock Based Compensation. In December 2004, the FASB issued Statement No. 123 (revised 2004), “Share-Based Payment” (“SFAS No. 123R”). SFAS No. 123R is a revision of SFAS No. 123, “Accounting for Stock Based Compensation”, supersedes APB 25 and amends FASB Statement No. 95, “Statement of Cash Flows.” SFAS No. 123R requires that stock option awards, as well as other equity-based compensation, be recognized as compensation expense in the income statement based on their fair values determined at the date of the grant. Under SEC guidance, the applicable effective date of SFAS No. 123R is the beginning of the next fiscal year after June 15, 2005. SFAS No. 123R permits companies to adopt the recognition requirements using either a “modified prospective” method or a “modified retrospective” method. Under the “modified prospective” method, compensation cost is recognized in the financial statements based on the time of vesting beginning with the effective date, under the requirements of SFAS No. 123R for all share-based payments granted after that date and under the requirements of SFAS No. 123 for all awards granted prior to the effective date of SFAS No. 123R that vest after the effective date.
52
The Company adopted SFAS No. 123R effective January 1, 2006 using the “modified prospective” method and plans to use the Black-Scholes option valuation model. Adopting SFAS No. 123R will result in the Company recording compensation cost for employee stock options that vest on or after January 1, 2006 or are granted on or after January 1, 2006. Nearly all stock options outstanding on December 31, 2005 were fully-vested and there were no new stock options granted in 2006 so SFAS No. 123R had minimal impact in 2006. We will incur compensation expense to the extent that additional stock option awards are made in future periods. Had the Company adopted stock option expensing in prior periods, the impact would have approximated that as presented in the SFAS No. 123 disclosure of pro-forma net income and earnings per share in Note 1, “Summary of Accounting Policies,” of this Form 10-K. See Note 1 for the pro forma impact in 2005 and 2004.
For additional information regarding the Company’s stock-based compensation plans, refer to Note 16, “Officer, Director and Employee Benefit Plans,” of this Form 10-K.
Accounting Changes and Error Corrections. In May 2005, the FASB issued Statement No. 154, “Accounting Changes and Error Corrections,” which provides guidance on the accounting for and reporting of accounting changes and error corrections. It establishes, unless impracticable, retrospective application as the required method for reporting a change in accounting principle in the absence of explicit transition requirements specific to the newly adopted accounting principle. The reporting of a correction of an error by restating previously issued financial statements is also addressed by this statement. This statement became effective, on a prospective basis, for fiscal years beginning after December 15, 2005. Our implementation of this statement has not had a material affect on our consolidated financial statements.
Accounting for Certain Hybrid Financial Instruments – an amendment of FASB Statements No. 133 and 140. In February 2006, FASB issued SFAS No. 155, “Accounting for Certain Hybrid Financial Instruments – an amendment of FASB No. 133 and 140,” which is effective for fiscal years beginning after September 15, 2006. The statement was issued to clarify the application of SFAS No. 133 to beneficial interests in securitized financial assets and to improve the consistency of accounting for similar financial instruments, regardless of the form of the instruments. This statement is effective for the first fiscal year beginning after September 30, 2006. We do not expect implementation of the Statement in 2007 to have a material effect on our consolidated financial statements.
Accounting for Servicing of Financial Assets. In March 2006, FASB issued SFAS No. 156, “Accounting for Servicing of Financial Assets – an amendment to FASB Statement No. 140.” The new standard requires recognition of servicing assets in connection with any obligation to service a financial asset arising from 1) a servicing contract entered into as part of a transfer of assets meeting the requirements for sale accounting, 2) the transfer of assets to a special purpose entity in a guaranteed mortgage securitization where the transferor retains a controlling interest in the securitized asset, or 3) an acquisition or assumption of obligations to service financial assets not related to the servicer or its consolidated affiliates. The servicing assets and liabilities must be measured at fair value initially, if practicable, and the assets or liabilities must either be amortized or recorded at fair value at each reporting date. The statement allows a one-time reclassification for entities with servicing rights and subsequently requires separate presentation of servicing assets and liabilities at fair value in the statement of financial position. This statement is effective for the first fiscal year beginning after September 15, 2006, with earlier adoption permitted. We adopted this pronouncement January 1, 2007 and will utilize the amortization method. We do not expect this implementation to have a material effect on our consolidated financial statements.
Fair Value Measurements. In September 2006, FASB issued SFAS No. 157, “Fair Value Measurements,” which establishes a framework for measuring fair value, and expands disclosures about fair value measurements required under the accounting pronouncements, but does not change existing guidance as to whether or not an instrument is carried at fair value. Additionally, it establishes a fair value hierarchy that prioritizes the information used to develop those assumptions. SFAS No. 157 is effective for financial statements issued for fiscal years beginning after November 15, 2007, and interim periods within those fiscal years. Earlier application is encouraged, provided that the reporting entity has not yet issued financial statements for fiscal year, including financial statements for an interim period within the fiscal year. We are currently evaluating the impact, if any, that SFAS No. 157 will have on our consolidated financial statements.
53
Employers’ Accounting for Defined Benefit Pension and Other Postretirement Plans, an Amendment of FASB Statements No. 87, 88, 106, and 132R. In September 2006, the FASB, issued SFAS, No. 158, “Employers’ Accounting for Defined Benefit Pension and Other Postretirement Plans, an Amendment of FASB Statements No. 87, 88, 106, and 132R,” which requires employers to recognize the underfunded or overfunded status of a defined benefit postretirement plan as an asset or liability in its statement of financial position and to recognize changes in the funded status in the year in which the changes occur through accumulated other comprehensive income. Additionally, SFAS No. 158 requires employers to measure the funded status of a plan as of the date of its year-end statement of financial position. The new reporting requirements and related new footnote disclosure rules of SFAS No. 158 are effective for fiscal years ending after December 15, 2006. We adopted the provisions of SFAS No. 158 for the year end 2006, and the effect of recognizing the funded status in accumulated other comprehensive income was not significant. The new measurement date requirement applies for fiscal years ending after December 15, 2008. See Note 16, “Officer, Director and Employee Benefit Plans,” of this Form 10-K for additional information.
Financial Accounting Standards Board Staff Positions, Interpretations and Issues
Other-Than-Temporary Impairment. FASB Staff Position on FAS No. 115-1 and FAS No. 124-1 (“the FSP”), “The Meaning of Other-Than-Temporary Impairment and Its Application to Certain Investments,” was issued in November 2005 and addresses the determination of when an investment is considered impaired, whether the impairment on an investment is other-than-temporary and how to measure an impairment loss. The FSP also addresses accounting considerations subsequent to the recognition of other-than-temporary impairments on a debt security, and requires certain disclosures about unrealized losses that have not been recognized as other-than-temporary impairments. The FSP replaces the impairment guidance on Emerging Issues Task Force (EITF) Issue No. 03-1 with references to existing authoritative literature concerning other-than-temporary determinations. Under the FSP, losses arising from impairment deemed to be other-than-temporary, must be recognized in earnings at an amount equal to the entire difference between the securities cost and its fair value at the financial statement date, without considering partial recoveries subsequent to that date. The FSP also required that an investor recognize other-than-temporary impairment losses when a decision to sell a security has been made and the investor does not expect the fair value of the security to fully recover prior to the expected time of sale. The FSP is effective for reporting periods beginning after December 15, 2005. Our initial adoption of this statement has not had a material impact on our consolidated financial statements.
FASB Interpretation No. 48, “Accounting for Uncertainty in Income Taxes, an interpretation of FASB Statement No.109.” Interpretation 48 prescribes a recognition threshold and a measurement attribute for the financial statement recognition and measurement of a tax position taken or expected to be taken in a tax return. Benefits from tax positions should be recognized in the financial statements only when it is more likely than not that the tax position will be sustained upon examination by the appropriate taxing authority that would have full knowledge of all relevant information. The amount of tax benefits to be recognized for a tax position that meets the more-likely-than-not recognition threshold is measured as the largest amount of benefit that is greater than fifty percent likely of being realized upon ultimate settlement. Tax benefits relating to tax positions that previously failed to meet the more-likely-than-not recognition threshold should be recognized in the first subsequent financial reporting period in which that threshold is met or certain other events have occurred. Previously recognized tax benefits relating to tax positions that no longer meet the more-likely-than-not recognition threshold should be derecognized in the first subsequent financial reporting period in which that threshold is no longer met. Interpretation 48 also provides guidance on the accounting for and disclosure of tax reserves for unrecognized tax benefits, interest and penalties and accounting in interim periods. Interpretation 48 is effective for fiscal years beginning after December 15, 2006. The change in net assets as a result of applying this pronouncement will be a change in accounting principle with the cumulative effect of the change required to be treated as an adjustment to the opening balance of retained earnings on January 1, 2007, except in certain cases involving uncertainties relating to income taxes in purchase business combinations. In such instances, the impact of the adoption of Interpretation 48 will result in an adjustment to goodwill. While our analysis of the impact of adopting Interpretation 48 is not yet complete, we do not currently anticipate it will have a material impact on the Company’s consolidated financial statements.
Accounting for Deferred Compensation and Postretirement Benefit Aspects of Endorsement Split-Dollar Life Insurance Arrangements. In September 2006, FASB ratified the consensus reached by the Emerging Issues Task Force, or EITF, in Issue No. 06-4, “Accounting for Deferred Compensation and Postretirement Benefit Aspects of Endorsement Split-Dollar Life Insurance Arrangements.” EITF 06-4 requires companies with split-dollar life insurance policies that provide a benefit to an employee that extends
54
to post-retirement periods to recognize a liability for future benefits based on the substantive agreement with the employee. Recognition should be in accordance with FASB Statement No. 106, “Employers’ Accounting for Retirement Benefits Other Than Pensions” or APB Opinion No. 12, “Omnibus Opinion – 1967,” depending on whether a substantive plan is deemed to exist. Companies are permitted to recognize the effects of applying the consensus through either (1) a change in accounting principle the cumulative-effect adjustment to retained earnings or to other components of equity or net assets as of the beginning of the year of adoption or (2) a change in accounting principle through retrospective application to all prior periods. EITF 06-4 will be effective for fiscal years beginning after December 15, 2007, with early adoption permitted. We anticipate adopting EITF 06-4 in 2008 and are in the process of assessing the impact on our consolidated financial statements.
Accounting for Purchases of Life Insurance-Determining the Amount That Could Be Realized in Accordance with FASB Technical Bulletin No. 85-4, Accounting for Purchases of Life Insurance. In September 2006, FASB ratified the consensus reached by the EITF, in Issue No. 06-5. “Accounting for Purchases of Life Insurance-Determining the Amount That Could Be Realized in Accordance with FASB Technical Bulletin No. 85-4, Accounting for Purchases of Life Insurance.” EITF 06-5 concluded that companies purchasing a life insurance policy including COLI or BOLI should record the amount that could be realized, considering any additional amounts beyond cash surrender value included in the contractual terms of the policy. The amount that could be realized should be based on assumed surrender at the individual policy or certificate level, unless all policies or certificates are required to be surrendered as a group. When it is probable that contractual restrictions would limit the amount that could be realized, such contractual limitations should be considered and any amounts recoverable at the insurance company’s discretion should be excluded from the amount that could be realized. Companies are permitted to recognize the effects of applying the consensus through either (1) a change in accounting principle through a cumulative-effect adjustment to retained earnings or to other components of equity or net assets as of the beginning of the year of adoption or (2) a change in accounting principle through retrospective application to all prior periods. EITF 06-5 will be effective for fiscal years beginning after December 15, 2006. We will adopt EITF 06-5 in 2007 and are in the process of assessing the impact on our consolidated financial statements.
SEC Staff Accounting Bulletins
Considering the Effects of Prior Year Misstatements in Current Year Financial Statements. In September 2006, the Securities and Exchange Commission issued Staff Accounting Bulletin No. 108, “Considering the Effects of Prior Year Misstatements when Quantifying Misstatements in Current Year Financial Statements,” (“SAB 108”),which provides interpretive guidance on the consideration of the effects of prior year misstatements in quantifying current year misstatements for the purpose of a materiality assessment. We adopted SAB 108 in the fourth quarter of 2006 with no impact on our consolidated financial statements.
Item 7A. Quantitative and Qualitative Disclosures about Market Risk
Our primary market risk is considered to be interest rate risk. Interest rate risk on our balance sheet arises from the maturity mismatch of interest-earning assets versus interest-bearing liabilities, as well as the potential for maturities to shorten or lengthen on our interest-earning assets, and to a lesser extent on our interest-bearing liabilities due to the exercise of options. The most common of these are prepayment options on mortgage loans, and mortgage-backed securities, and to a lesser extent put options on wholesale borrowings or jump-rate features in our certificates of deposits. Management’s goal, through policies established by the Asset/Liability Management Committee of the Board of Directors (ALCO), is to maximize net interest income while achieving adequate returns on equity capital and managing our balance sheet within the established interest rate risk policy limits prescribed by the ALCO.
We use a variety of measurement and modeling techniques that estimate the impact of future movements in interest rates on the net interest income of our Company. Generally, we measure the impact via parallel movements in interest rates in 100 basis point increments over a one-year time horizon, although we also model other scenarios, such as ramps and rotations of the Treasury yield curve.
One of the techniques used in measuring the sensitivity of net interest income to changes in interest rates is interest rate sensitivity (static) gap analysis. The static gap is the difference between the amount of interest-earning assets maturing or repricing within a specific period of time and the amount of interest-bearing liabilities maturing or repricing within that same period of time. We utilize our static gap analysis as means of managing our interest rate risk at the cumulative one-year time horizon. In this
55
analysis, maturities of assets and liabilities are adjusted for the estimated impact of embedded options that are contained in certain financial instruments on the Company’s balance sheet. These include prepayment assumptions on real estate loans, and mortgage-backed securities, call options embedded in investment securities, and put options embedded in certain borrowings. Because of the level of financial instruments with embedded options on our balance sheet, certain shortcomings are inherent in using gap analysis to quantify exposure to interest rate risk. For instance, while we model expected loan prepayments in our static gap analysis, actual customer behavior may prove to be much different. Changes in interest rates may impact cash flow on a lag basis, or lead future interest rate movements, and our expected lives of our non-maturity core deposit accounts may not prove to be as long-term as we assume them to be in our gap analysis. However, we still believe static gap analysis remains a useful tool for us to help manage our interest rate risk.
Generally, a positive one-year gap, where more interest-earning assets are repricing or maturing during one-year period than interest-bearing liabilities, would tend to result in a reduction in net interest income in a period of falling interest rates. Conversely, during a period of rising interest rates, a positive one-year gap would likely result in an improvement in net interest income. Our goal is to maintain our cumulative one-year gap within the range of (15)% to 15%, although we will begin to adjust our ALCO strategies in our interest-sensitive portfolios, if the gap exceeds (10)% to 10%, recognizing that changes in ALCO strategies take some time to impact our overall static gap position. Our loan portfolio tends to have the most impact on the movement in our static gap over a range of changing interest rates, due to the predominance of one- to four-family mortgage loans that allow the customer to prepay without penalty. We have mitigated the impact one- to four-family loans can have on our gap by 1) reducing their concentration as a percentage of our overall loan portfolio, 2) limiting our exposure to long-term fixed-rate mortgage loans, and 3) expanding our equity line of credit and business loan portfolios, that generally carry more frequent interest rate adjustments, adjustable rates and/or shorter maturities.
Currently we do not use derivative financial instruments such as interest rate swaps, caps, floors, options or similar financial instruments, to manage our interest rate risk, or periodic net interest income. We do use forward commitments with the GSEs and other investors when selling our loan production originated for sale.
The following tables set forth the scheduled repricing or maturity of the Bank’s assets and liabilities at December 31, 2006 and 2005. The table uses a series of assumptions to disclose the expected cash flows in our various interest sensitive portfolios. Loans held for sale are shown in the less than six months category due to management’s intent, ability and often use of firm forward commitments to sell mortgage loans. In 2006, loans held for sale includes $215.9 million of loans transferred to held for sale as part of our balance sheet restructuring transactions which were subsequently sold in January 2007. Investments and mortgage-backed securities are shown at their average maturity, adjusted for estimated prepayments, and/or expected calls. In 2006, the less than six month category includes $226.0 million and $292.4 million for investments and mortgage-backed securities identified for sale as part of our balance sheet restructuring which were subsequently sold in January 2007. Decay rates for non-maturity deposits are based in internally generated historical information, while FHLBC advances are shown at maturity, adjusted for any put options deemed in the money. Prepayment assumptions on loans receivable are based on internal models developed from our actual prepayment experience, while prepayment assumptions on mortgage-backed securities and the impact of embedded put options on borrowings and call options on investments are based on current market expectations.
56
| At December 31, 2006 | |||||||||||||||||||||||||||||||||||
|---|---|---|---|---|---|---|---|---|---|---|---|---|---|---|---|---|---|---|---|---|---|---|---|---|---|---|---|---|---|---|---|---|---|---|---|
| ‹ 1/2 Yr. | 1/2 - 1 Yr. | 1 - 3 Yrs. | 3 - 5 Yrs. | 5+ Yrs. | Total | ||||||||||||||||||||||||||||||
| (Dollars in thousands) | |||||||||||||||||||||||||||||||||||
| Interest-earning assets: | |||||||||||||||||||||||||||||||||||
| Loans receivable held for sale | $ | 331,961 | — | — | — | — | 331,961 | ||||||||||||||||||||||||||||
| Loans receivable | 2,489,717 | 871,275 | 2,407,697 | 1,313,784 | 366,118 | 7,448,591 | |||||||||||||||||||||||||||||
| Mortgage-backed securities | 396,490 | 90,513 | 274,703 | 221,932 | 424,158 | 1,407,796 | |||||||||||||||||||||||||||||
| Investment securities | 347,734 | 4,576 | 78,773 | 12,682 | 86,233 | 529,998 | |||||||||||||||||||||||||||||
| Stock in FHLB of Chicago | 146,407 | — | — | — | — | 146,407 | |||||||||||||||||||||||||||||
| Interest-bearing deposits | 67,883 | — | — | — | — | 67,883 | |||||||||||||||||||||||||||||
| Federal funds sold | 64,944 | — | — | — | — | 64,944 | |||||||||||||||||||||||||||||
| Total interest-earning | |||||||||||||||||||||||||||||||||||
| assets | 3,845,136 | 966,364 | 2,761,173 | 1,548,398 | 876,509 | 9,997,580 | |||||||||||||||||||||||||||||
| Interest-bearing liabilities: | |||||||||||||||||||||||||||||||||||
| Interest-bearing checking | |||||||||||||||||||||||||||||||||||
| accounts | 22,174 | 25,205 | 90,694 | 75,985 | 525,091 | 739,149 | |||||||||||||||||||||||||||||
| Money market accounts | 498,385 | 20,841 | 55,789 | 69,095 | 362,632 | 1,006,742 | |||||||||||||||||||||||||||||
| Passbook accounts | 60,094 | 52,088 | 163,052 | 140,681 | 698,065 | 1,113,980 | |||||||||||||||||||||||||||||
| Certificate accounts | 1,979,901 | 804,072 | 713,036 | 47,125 | 9,901 | 3,554,035 | |||||||||||||||||||||||||||||
| FHLBC advances | 1,191,834 | 342,938 | 460,062 | 60,108 | — | 2,154,942 | |||||||||||||||||||||||||||||
| Other borrowings | 517,604 | 50,283 | 50,000 | — | 363 | 618,250 | |||||||||||||||||||||||||||||
| Junior subordinated debentures | 67,011 | — | — | — | — | 67,011 | |||||||||||||||||||||||||||||
| Total interest-bearing | |||||||||||||||||||||||||||||||||||
| liabilities | 4,337,003 | 1,295,427 | 1,632,633 | 392,994 | 1,596,052 | 9,254,109 | |||||||||||||||||||||||||||||
| Interest sensitivity gap | $ | (491,867 | ) | (329,063 | ) | 1,128,540 | 1,155,404 | (719,543 | ) | 743,471 | |||||||||||||||||||||||||
| Cumulative gap | $ | (491,867 | ) | (820,930 | ) | 307,610 | 1,463,014 | 743,471 | |||||||||||||||||||||||||||
| Cumulative gap as a percentage | |||||||||||||||||||||||||||||||||||
| of total assets | (4.42 | )% | (7.38 | ) | 2.77 | 13.16 | 6.69 | ||||||||||||||||||||||||||||
| Cumulative net interest-earning | |||||||||||||||||||||||||||||||||||
| assets as a percentage of | |||||||||||||||||||||||||||||||||||
| interest-bearing liabilities | 88.66 | 85.42 | 104.23 | 119.10 | 108.03 | ||||||||||||||||||||||||||||||
| (1) | Represents forward commitments to sell mortgage loans. |
| At December 31, 2005 | |||||||||||||||||||||||||||||||||||
|---|---|---|---|---|---|---|---|---|---|---|---|---|---|---|---|---|---|---|---|---|---|---|---|---|---|---|---|---|---|---|---|---|---|---|---|
| ‹ 1/2 Yr. | 1/2 - 1 Yr. | 1 - 3 Yrs. | 3 - 5 Yrs. | 5+ Yrs. | Total | ||||||||||||||||||||||||||||||
| (Dollars in thousands) | |||||||||||||||||||||||||||||||||||
| Interest-earning assets: | |||||||||||||||||||||||||||||||||||
| Loans receivable held for | |||||||||||||||||||||||||||||||||||
| sale | $ | 114,482 | — | — | — | — | 114,482 | ||||||||||||||||||||||||||||
| Loans receivable | 2,298,641 | 683,483 | 2,580,697 | 1,311,617 | 336,799 | 7,211,237 | |||||||||||||||||||||||||||||
| Mortgage-backed securities . | 153,300 | 135,421 | 387,877 | 311,622 | 568,350 | 1,556,570 | |||||||||||||||||||||||||||||
| Investment securities | 134,534 | 36,530 | 189,593 | 98,164 | 16,331 | 475,152 | |||||||||||||||||||||||||||||
| Stock in FHLB of Chicago | 165,663 | — | — | — | — | 165,663 | |||||||||||||||||||||||||||||
| Interest-bearing deposits | 38,491 | — | — | — | — | 38,491 | |||||||||||||||||||||||||||||
| Federal funds sold | 23,739 | — | — | — | — | 23,739 | |||||||||||||||||||||||||||||
| Total interest-earning | |||||||||||||||||||||||||||||||||||
| assets | 2,928,850 | 855,434 | 3,158,167 | 1,721,403 | 921,480 | 9,585,334 | |||||||||||||||||||||||||||||
| Interest-bearing liabilities: | |||||||||||||||||||||||||||||||||||
| Interest-bearing checking | |||||||||||||||||||||||||||||||||||
| accounts | 24,492 | 27,838 | 100,170 | 83,925 | 579,962 | 816,387 | |||||||||||||||||||||||||||||
| Money market accounts | 32,990 | 26,334 | 70,495 | 87,308 | 458,217 | 675,344 | |||||||||||||||||||||||||||||
| Passbook accounts | 67,367 | 59,374 | 185,862 | 160,361 | 795,716 | 1,268,680 | |||||||||||||||||||||||||||||
| Certificate accounts | 1,258,589 | 936,043 | 602,663 | 78,269 | 11,434 | 2,886,998 | |||||||||||||||||||||||||||||
| FHLBC advances | 585,290 | 250,000 | 1,480,000 | 156,000 | — | 2,471,290 | |||||||||||||||||||||||||||||
| Other borrowings | 585,863 | 82 | 66 | — | 368 | 586,379 | |||||||||||||||||||||||||||||
| Junior subordinated debentures | 67,011 | — | — | — | — | 67,011 | |||||||||||||||||||||||||||||
| Total interest-bearing | |||||||||||||||||||||||||||||||||||
| liabilities | 2,621,602 | 1,299,671 | 2,439,256 | 565,863 | 1,845,697 | 8,772,089 | |||||||||||||||||||||||||||||
| Interest sensitivity gap | $ | 307,248 | (444,237 | ) | 718,911 | 1,155,540 | (924,217 | ) | 813,245 | ||||||||||||||||||||||||||
| Cumulative gap | $ | 307,248 | (136,989 | ) | 581,922 | 1,737,462 | 813,245 | ||||||||||||||||||||||||||||
| Cumulative gap as a percentage | |||||||||||||||||||||||||||||||||||
| of total assets | 2.93 | % | (1.31 | ) | 5.55 | 16.57 | 7.75 | ||||||||||||||||||||||||||||
| Cumulative net | |||||||||||||||||||||||||||||||||||
| interest-earning assets as | |||||||||||||||||||||||||||||||||||
| a percentage of | |||||||||||||||||||||||||||||||||||
| interest-bearing liabilities | 111.72 | 96.51 | 109.15 | 125.08 | 109.27 | ||||||||||||||||||||||||||||||
| (1) | Represents forward commitments to sell mortgage loans. |
Our cumulative one-year gap at December 31, 2006 is (7.38)%, compared to (1.31)% one-year gap at December 31, 2005. Our negative gap which indicates that if interest rates rose, without us making any additional managerial decisions regarding our ALCO strategy, our net interest income would decline modestly over the next 12 months. Conversely, if rates declined, our net interest income would increase modestly over the next twelve months. To maintain our gap within policy limits, we intend to continue to control our extension risk by limiting our investment in long-term mortgage loans and expanding our short-term interest sensitive equity lines of credit and business loan portfolios. Our negative gap is higher at December 31, 2006 due to our strategy of attracting additional money market accounts as opposed to short-term certificates of deposit, which are carrying higher rates than the money market product. Unlike our core money market accounts, we are showing approximately $472.4 million in high-rate money markets related to this new product entirely in the less than six month bucket as the product pays a market rate of interest that can change at any time and we have limited experience related to the duration of these accounts. Because of the short-term nature of our certificates of deposit our one-year gap is not materially impacted.
57
In addition to static gap analysis, we model the impact of instantaneous parallel shifts in yield curve changes in interest rates (assuming interest rates rise and fall in increments of 100 basis points), on anticipated net interest income over a 12-month horizon. These models are more robust than our static gap analysis, in that we are modeling underlying cash flows in each of our interest-sensitive portfolios under these changing rate environments. This includes adjusting anticipated prepayments, analyzing put and call exercises, changing expected business volumes and mix (such as the mix in loan originations between ARMs and fixed-rate), as well as modeling anticipated changes in interest rates paid on core deposit accounts, whose rates do not necessarily move in any relationship to movements in Treasury rates. We compare these results to our results assuming flat interest rates. Our modeling as of December 31, 2006 indicates that net interest income would decrease by approximately 3.6% if interest rates rose 100 basis points instantaneously, while if rates instantaneously fell by 100 basis points, net interest income would increase by approximately 6.1%.
A third measurement of our interest rate risk we use is Net Portfolio Value Analysis. Under OTS Thrift Bulletin 13a, we are required to measure our interest rate risk assuming various increases and decreases in general interest rates, and their effect on our market value of portfolio equity. The Board of Directors has established limits to changes in Net Portfolio Value (“NPV”), (including limits regarding the change in net interest income discussed above), across a range of hypothetical interest rate changes. If estimated changes to NPV and net interest income are not within these limits, the Board may direct management to adjust its asset/liability mix to bring its interest rate risk within Board limits. At December 31, 2006 and 2005, the Bank was well within the Board-approved limits. NPV is computed as the difference between the market value of assets and the market value of liabilities, adjusted for the value of off-balance sheet items, including a core deposit intangible on the Bank’s core deposit balances.
Net Portfolio Value Analysis measures our interest rate risk by calculating the estimated change in the NPV of our cash flows from interest-sensitive assets and liabilities, as well as certain off-balance sheet items, in the event of a shock in interest rates ranging from 100 to 200 basis points. We use a 200 basis point movement up or down as our means of measuring overall NPV interest-rate risk. The table below shows the change in NPV applying various instantaneous rate shocks to the Bank’s interest-earning assets and interest-bearing liabilities as of December 31, 2006 and 2005.
| Change in Interest Rate | Estimated NPV | Estimated Increase (Decrease) in NPV | Percentage Increase (Decrease) in NPV | ||||||||||||||||||||||||||||||||
|---|---|---|---|---|---|---|---|---|---|---|---|---|---|---|---|---|---|---|---|---|---|---|---|---|---|---|---|---|---|---|---|---|---|---|---|
| 2006 | 2005 | 2006 | 2005 | 2006 | 2005 | ||||||||||||||||||||||||||||||
| (Dollars in thousands) | |||||||||||||||||||||||||||||||||||
| 200 basis point rise | $ | 943,641 | 844,802 | $ | (193,429 | ) | (187,364 | ) | (17 | )% | (18 | ) | |||||||||||||||||||||||
| 100 basis point rise | 1,044,011 | 944,507 | (93,060 | ) | (87,660 | ) | (8 | ) | (8 | ) | |||||||||||||||||||||||||
| Base scenario | 1,137,070 | 1,032,166 | — | — | — | — | |||||||||||||||||||||||||||||
| 100 basis point decline | 1,189,940 | 1,060,522 | 52,870 | 28,356 | 5 | 3 | |||||||||||||||||||||||||||||
| 200 basis point decline | 1,215,507 | 1,016,912 | 78,437 | (15,254 | ) | 7 | (1 | ) | |||||||||||||||||||||||||||
| (1) | The base scenario includes the impact of the balance sheet restructuring. |
The 2006 decline in NPV assuming an up 200 basis point shock in interest rates is similar when compared to 2005 on a percentage basis. Although short-term interest rates rose during 2006, the remainder of the term structure of interest rates remained relatively steady and similarly sloped at the end of 2006 compared to 2005. As such, we are estimating similar mortgage loan prepayments in each analysis, which is the main driver of our change in NPV. The actual increase in interest rates that did occur, and which negatively impacted interest-earning asset values at the end of 2006 compared to 2005 were offset by higher core deposit values due to the larger increase in short-term interest rates.
58
| Item 8. Financial Statements and Supplementary Data | ||
| Page | ||
| Report of Management Regarding Internal Control Over Financial Reporting | 60 | |
| Report of Independent Registered Public Accounting Firm | 61 | |
| Report of Independent Registered Public Accounting Firm | 62 | |
| Consolidated Statements of Financial Condition | 63 | |
| Consolidated Statements of Operations | 64 | |
| Consolidated Statements of Changes in Stockholders' Equity | 65 | |
| Consolidated Statements of Cash Flows | 66 | |
| Notes to Consolidated Financial Statements | 68 |
59
Report of Management Regarding Internal Control Over Financial Reporting
The management of MAF Bancorp, Inc. is responsible for the preparation, integrity, and fair presentation of the consolidated financial statements included in this annual report. The consolidated financial statements and notes included in this annual report have been prepared in conformity with U.S. generally accepted accounting principles and necessarily include some amounts that are based on management’s best estimates and judgments.
In order to produce reliable financial statements, management is responsible for establishing and maintaining effective internal control over financial reporting. Management evaluates the effectiveness of internal control over financial reporting and tests for reliability of recorded financial information through a program of ongoing internal audits. Any system of internal control, no matter how well designed, has inherent limitations, including the possibility that a control can be circumvented or overridden and misstatements due to error or fraud may occur and not be detected. Also, because of changes in conditions, internal control effectiveness may vary over time. Accordingly, even an effective system of internal control will provide only reasonable assurance with respect to financial statement preparation.
Management assessed the Company’s internal control over financial reporting as of December 31, 2006, as required by Section 404 of the Sarbanes-Oxley Act of 2002, based on the criteria for effective internal control over financial reporting described in the “Internal Control-Integrated Framework,” adopted by the Committee of Sponsoring Organizations of the Treadway Commission (COSO). Based on this assessment, management concludes that, as of December 31, 2006, the Company’s internal control over financial reporting is effective at the reasonable assurance level.
KPMG LLP, the independent registered public accounting firm that audited the Company’s consolidated financial statements included in this Annual Report on Form 10-K/A, has issued an attestation report on management’s assessment of the Company’s internal control over financial reporting as of December 31, 2006. The report, which expresses unqualified opinions on management’s assessment and on the effectiveness of the Company’s internal control over financial reporting as of December 31, 2006, is included in this Item. See “Report of Independent Registered Public Accounting Firm” on page 61.
60
Report of Independent Registered Public Accounting Firm
The Stockholders and Board of Directors
MAF Bancorp, Inc.
We have audited management’s assessment, included in the accompanying Report of Management Regarding Internal Control Over Financial Reporting, that MAF Bancorp, Inc. maintained effective internal control over financial reporting as of December 31, 2006, based on criteria established in Internal Control—Integrated Framework issued by the Committee of Sponsoring Organizations of the Treadway Commission (COSO). MAF Bancorp, Inc.‘s management is responsible for maintaining effective internal control over financial reporting and for its assessment of the effectiveness of internal control over financial reporting. Our responsibility is to express an opinion on management’s assessment and an opinion on the effectiveness of MAF Bancorp, Inc.‘s internal control over financial reporting based on our audit.
We conducted our audit in accordance with the standards of the Public Company Accounting Oversight Board (United States). Those standards require that we plan and perform the audit to obtain reasonable assurance about whether effective internal control over financial reporting was maintained in all material respects. Our audit included obtaining an understanding of internal control over financial reporting, evaluating management’s assessment, testing and evaluating the design and operating effectiveness of internal control, and performing such other procedures as we considered necessary in the circumstances. We believe that our audit provides a reasonable basis for our opinion.
A company’s internal control over financial reporting is a process designed to provide reasonable assurance regarding the reliability of financial reporting and the preparation of financial statements for external purposes in accordance with generally accepted accounting principles. A company’s internal control over financial reporting includes those policies and procedures that (1) pertain to the maintenance of records that, in reasonable detail, accurately and fairly reflect the transactions and dispositions of the assets of the company; (2) provide reasonable assurance that transactions are recorded as necessary to permit preparation of financial statements in accordance with generally accepted accounting principles, and that receipts and expenditures of the company are being made only in accordance with authorizations of management and directors of the company; and (3) provide reasonable assurance regarding prevention or timely detection of unauthorized acquisition, use, or disposition of the company’s assets that could have a material effect on the financial statements.
Because of its inherent limitations, internal control over financial reporting may not prevent or detect misstatements. Also, projections of any evaluation of effectiveness to future periods are subject to the risk that controls may become inadequate because of changes in conditions, or that the degree of compliance with the policies or procedures may deteriorate.
In our opinion, management’s assessment that MAF Bancorp, Inc. maintained effective internal control over financial reporting as of December 31, 2006, is fairly stated, in all material respects, based on criteria established in Internal Control—Integrated Framework issued by the Committee of Sponsoring Organizations of the Treadway Commission (COSO). Also, in our opinion, the Company maintained, in all material respects, effective internal control over financial reporting as of December 31, 2006, based on criteria established in Internal Control—Integrated Framework issued by the Committee of Sponsoring Organizations of the Treadway Commission (COSO).
We also have audited, in accordance with the standards of the Public Company Accounting Oversight Board (United States), the consolidated statements of financial condition of MAF Bancorp, Inc. and subsidiaries as of December 31, 2006 and 2005, and the related consolidated statements of operations, changes in stockholders’ equity, and cash flows for each of the years in the three-year period ended December 31, 2006, and our report dated March 1, 2007 expressed an unqualified opinion on those consolidated financial statements.
KPMG LLP
Chicago, Illinois
March 1, 2007
61
Report of Independent Registered Public Accounting Firm
The Stockholders and Board of Directors
MAF Bancorp, Inc.
We have audited the accompanying consolidated statements of financial condition of MAF Bancorp, Inc. and subsidiaries as of December 31, 2006 and 2005, and the related consolidated statements of operations, changes in stockholders’ equity, and cash flows for each of the years in the three-year period ended December 31, 2006. These consolidated financial statements are the responsibility of the Company’s management. Our responsibility is to express an opinion on these consolidated financial statements based on our audits.
We conducted our audits in accordance with standards of the Public Company Accounting Oversight Board (United States). Those standards require that we plan and perform the audit to obtain reasonable assurance about whether the financial statements are free of material misstatement. An audit includes examining, on a test basis, evidence supporting the amounts and disclosures in the financial statements. An audit also includes assessing the accounting principles used and significant estimates made by management, as well as evaluating the overall financial statement presentation. We believe that our audits provide a reasonable basis for our opinion.
In our opinion, the consolidated financial statements referred to above present fairly, in all material respects, the financial position of MAF Bancorp, Inc. and subsidiaries as of December 31, 2006 and 2005, and the results of their operations and their cash flows for each of the years in the three-year period ended December 31, 2006 in conformity with U.S. generally accepted accounting principles.
We also have audited, in accordance with the standards of the Public Company Accounting Oversight Board (United States), the effectiveness of MAF Bancorp, Inc.‘s internal control over financial reporting as of December 31, 2006, based on criteria established in Internal Control—Integrated Framework issued by the Committee of Sponsoring Organizations of the Treadway Commission, and our report dated March 1, 2007 expressed an unqualified opinion on management’s assessment of, and the effective operation of, internal control over financial reporting.
KPMG LLP
Chicago, Illinois
March 1, 2007
62
MAF Bancorp, Inc. and Subsidiaries
Consolidated Statements of Financial Condition
| December 31, | ||||||||||||||
|---|---|---|---|---|---|---|---|---|---|---|---|---|---|---|
| 2006 | 2005 | |||||||||||||
| (Dollars in thousands) | ||||||||||||||
| Assets | ||||||||||||||
| Cash and due from banks | $ | 198,391 | 183,799 | |||||||||||
| Interest-bearing deposits | 67,883 | 38,491 | ||||||||||||
| Federal funds sold | 64,944 | 23,739 | ||||||||||||
| Total cash and cash equivalents | 331,218 | 246,029 | ||||||||||||
| Investment securities available for sale, at fair value | 529,998 | 475,152 | ||||||||||||
| Stock in Federal Home Loan Bank of Chicago, at cost | 146,407 | 165,663 | ||||||||||||
| Mortgage-backed securities available for sale, at fair value | 1,195,494 | 1,313,409 | ||||||||||||
| Mortgage-backed securities held to maturity (fair value $205,620 and $237,489) | 212,302 | 243,161 | ||||||||||||
| Loans receivable held for sale | 331,961 | 114,482 | ||||||||||||
| Loans receivable, net | 7,448,591 | 7,211,237 | ||||||||||||
| Allowance for loan losses | (39,931 | ) | (36,495 | ) | ||||||||||
| Loans receivable, net of allowance for loan losses | 7,408,660 | 7,174,742 | ||||||||||||
| Accrued interest receivable | 50,372 | 44,339 | ||||||||||||
| Foreclosed real estate | 3,942 | 789 | ||||||||||||
| Real estate held for development or sale | 83,049 | 50,066 | ||||||||||||
| Premises and equipment, net | 174,474 | 149,312 | ||||||||||||
| Bank-owned life insurance | 149,497 | 107,253 | ||||||||||||
| Goodwill | 387,980 | 304,251 | ||||||||||||
| Intangibles, net | 36,882 | 30,171 | ||||||||||||
| Other assets | 78,263 | 68,685 | ||||||||||||
| Total assets | $ | 11,120,499 | 10,487,504 | |||||||||||
| Liabilities and Stockholders' Equity | ||||||||||||||
| Liabilities | ||||||||||||||
| Deposits | $ | 7,018,010 | 6,197,503 | |||||||||||
| Borrowed funds | 2,773,192 | 3,057,669 | ||||||||||||
| Junior subordinated debentures | 67,011 | 67,011 | ||||||||||||
| Advances by borrowers for taxes and insurance | 44,115 | 45,115 | ||||||||||||
| Accrued expenses and other liabilities | 146,026 | 142,027 | ||||||||||||
| Total liabilities | 10,048,354 | 9,509,325 | ||||||||||||
| Stockholders' equity | ||||||||||||||
| Preferred stock, $.01 par value; authorized 5,000,000 shares; none issued or | ||||||||||||||
| outstanding | — | — | ||||||||||||
| Common stock, $.01 par value; 80,000,000 shares authorized; 34,499,494 and | ||||||||||||||
| 33,634,642 shares issued; 32,895,846 and 32,066,721 shares outstanding | 345 | 336 | ||||||||||||
| Additional paid-in capital | 569,142 | 527,131 | ||||||||||||
| Retained earnings, substantially restricted | 579,651 | 537,140 | ||||||||||||
| Accumulated other comprehensive loss, net of tax | (8,476 | ) | (19,391 | ) | ||||||||||
| Treasury stock, at cost; 1,603,648 and 1,567,921 shares | (68,517 | ) | (67,037 | ) | ||||||||||
| Total stockholders' equity | 1,072,145 | 978,179 | ||||||||||||
| Total liabilities and stockholders' equity | $ | 11,120,499 | 10,487,504 | |||||||||||
See accompanying Notes to Consolidated Financial Statements.
63
MAF Bancorp, Inc. and Subsidiaries
Consolidated Statements of Operations
| Year Ended December 31, | |||||||||||||||||
|---|---|---|---|---|---|---|---|---|---|---|---|---|---|---|---|---|---|
| 2006 | 2005 | 2004 | |||||||||||||||
| (Dollars in thousands, except share data) | |||||||||||||||||
| Interest income: | |||||||||||||||||
| Loans receivable | $ | 488,639 | 383,879 | 343,011 | |||||||||||||
| Mortgage-backed securities held to maturity | 57,436 | 11,703 | 3,337 | ||||||||||||||
| Mortgage-backed securities available for sale | 10,213 | 47,961 | 35,465 | ||||||||||||||
| Federal Home Loan Bank of Chicago stock | 5,276 | 12,346 | 23,092 | ||||||||||||||
| Investment securities available for sale | 24,060 | 18,077 | 13,233 | ||||||||||||||
| Interest-bearing deposits and federal funds sold | 9,576 | 4,690 | 3,035 | ||||||||||||||
| Total interest income | 595,200 | 478,656 | 421,173 | ||||||||||||||
| Interest expense: | |||||||||||||||||
| Deposits | 185,705 | 108,374 | 73,872 | ||||||||||||||
| Borrowed funds | 145,359 | 103,531 | 86,013 | ||||||||||||||
| Junior subordinated debentures | 4,507 | 1,992 | — | ||||||||||||||
| Total interest expense | 335,571 | 213,897 | 159,885 | ||||||||||||||
| Net interest income | 259,629 | 264,759 | 261,288 | ||||||||||||||
| Provision for loan losses | 3,900 | 1,980 | 1,215 | ||||||||||||||
| Net interest income after provision for loan losses | 255,729 | 262,779 | 260,073 | ||||||||||||||
| Non-interest income: | |||||||||||||||||
| Net gain (loss) on sale and write-down of: | |||||||||||||||||
| Loans receivable | 8,793 | 10,675 | 9,294 | ||||||||||||||
| Mortgage-backed securities | (9,316 | ) | — | 500 | |||||||||||||
| Investment securities | (3,614 | ) | 727 | 822 | |||||||||||||
| Premises and equipment | 795 | 164 | (9 | ) | |||||||||||||
| Foreclosed real estate | (322 | ) | 221 | 506 | |||||||||||||
| Mortgage loan servicing rights | 3,600 | 2,400 | — | ||||||||||||||
| Deposit account service charges | 41,837 | 35,193 | 34,112 | ||||||||||||||
| Other loan fees | 6,821 | 6,303 | 5,775 | ||||||||||||||
| Bank-owned life insurance | 7,303 | 5,576 | 3,410 | ||||||||||||||
| Brokerage and insurance commissions | 6,281 | 4,891 | 4,608 | ||||||||||||||
| Loan servicing fee income | 3,409 | 2,261 | 1,231 | ||||||||||||||
| Valuation recovery on mortgage servicing rights | — | 171 | 2,072 | ||||||||||||||
| Income from real estate operations | 785 | 2,928 | 6,657 | ||||||||||||||
| Other | 9,546 | 9,666 | 9,076 | ||||||||||||||
| Total non-interest income | 75,918 | 81,176 | 78,054 | ||||||||||||||
| Non-interest expense: | |||||||||||||||||
| Compensation and benefits | 105,795 | 99,988 | 98,270 | ||||||||||||||
| Office occupancy and equipment | 31,813 | 29,393 | 27,984 | ||||||||||||||
| Advertising and promotion | 7,656 | 8,313 | 9,079 | ||||||||||||||
| Data processing | 9,695 | 8,144 | 8,012 | ||||||||||||||
| Amortization of core deposit intangibles | 4,309 | 2,902 | 3,002 | ||||||||||||||
| Prepayment charge related to repayment of borrowings | 2,813 | — | — | ||||||||||||||
| Other | 35,989 | 37,334 | 39,469 | ||||||||||||||
| Total non-interest expense | 198,070 | 186,074 | 185,816 | ||||||||||||||
| Income before income taxes | 133,577 | 157,881 | 152,311 | ||||||||||||||
| Income taxes | 48,994 | 54,528 | 50,789 | ||||||||||||||
| Net income | $ | 84,583 | 103,353 | 101,522 | |||||||||||||
| Basic earnings per share | $ | 2.55 | 3.20 | 3.09 | |||||||||||||
| Diluted earnings per share | 2.51 | 3.13 | 3.01 | ||||||||||||||
| Dividends declared per common share | 1.00 | .92 | .84 | ||||||||||||||
| Average common and common equivalent shares outstanding: | |||||||||||||||||
| Basic | 33,177,226 | 32,307,390 | 32,897,164 | ||||||||||||||
| Diluted | 33,765,012 | 32,983,962 | 33,706,569 | ||||||||||||||
See accompanying Notes to Consolidated Financial Statements.
64
MAF Bancorp, Inc. and Subsidiaries
Consolidated Statements of Changes in Stockholders’ Equity
| Common stock | Additional paid-in capital | Retained earnings | Gain Deferral Plan | Accumu- lated other compre- hensive income (loss) | Treasury stock | Total | ||||||||||||||||||||||||||||||||||||||||||
|---|---|---|---|---|---|---|---|---|---|---|---|---|---|---|---|---|---|---|---|---|---|---|---|---|---|---|---|---|---|---|---|---|---|---|---|---|---|---|---|---|---|---|---|---|---|---|---|---|
| (Dollars in thousands) | ||||||||||||||||||||||||||||||||||||||||||||||||
| Balance at December 31, 2003 | $ | 331 | 495,747 | 402,402 | 1,015 | 2,109 | — | 901,604 | ||||||||||||||||||||||||||||||||||||||||
| Comprehensive income: | ||||||||||||||||||||||||||||||||||||||||||||||||
| Net income | — | — | 101,522 | — | — | — | 101,522 | |||||||||||||||||||||||||||||||||||||||||
| Other comprehensive income, net of | ||||||||||||||||||||||||||||||||||||||||||||||||
| tax: | ||||||||||||||||||||||||||||||||||||||||||||||||
| Unrealized holding loss during | ||||||||||||||||||||||||||||||||||||||||||||||||
| the year | — | — | — | — | (2,904 | ) | — | (2,904 | ) | |||||||||||||||||||||||||||||||||||||||
| Reclassification adjustment of | ||||||||||||||||||||||||||||||||||||||||||||||||
| gains included in net income | — | — | — | — | (881 | ) | — | (881 | ) | |||||||||||||||||||||||||||||||||||||||
| Total comprehensive income | — | — | 101,522 | — | (3,785 | ) | — | 97,737 | ||||||||||||||||||||||||||||||||||||||||
| Exercise of 425,282 stock options and | ||||||||||||||||||||||||||||||||||||||||||||||||
| reissuance of treasury stock | — | 1,162 | (7,849 | ) | — | — | 13,711 | 7,024 | ||||||||||||||||||||||||||||||||||||||||
| Issuance of 981,467 shares for | ||||||||||||||||||||||||||||||||||||||||||||||||
| acquisition of Chesterfield | ||||||||||||||||||||||||||||||||||||||||||||||||
| Financial Corp. | 5 | 23,114 | — | — | — | 19,523 | 42,642 | |||||||||||||||||||||||||||||||||||||||||
| Purchase of 1,151,000 shares of | ||||||||||||||||||||||||||||||||||||||||||||||||
| treasury stock | — | — | — | — | — | (49,174 | ) | (49,174 | ) | |||||||||||||||||||||||||||||||||||||||
| Tax benefits from stock-related | ||||||||||||||||||||||||||||||||||||||||||||||||
| compensation | — | 2,024 | — | — | — | — | 2,024 | |||||||||||||||||||||||||||||||||||||||||
| Cash dividends declared, $0.84 per | ||||||||||||||||||||||||||||||||||||||||||||||||
| share | — | — | (27,668 | ) | — | — | — | (27,668 | ) | |||||||||||||||||||||||||||||||||||||||
| Dividends paid to Gain Deferral Plan | — | — | 1 | 196 | — | — | 197 | |||||||||||||||||||||||||||||||||||||||||
| Balance at December 31, 2004 | 336 | 522,047 | 468,408 | 1,211 | (1,676 | ) | (15,940 | ) | 974,386 | |||||||||||||||||||||||||||||||||||||||
| Comprehensive income: | ||||||||||||||||||||||||||||||||||||||||||||||||
| Net income | — | — | 103,353 | — | — | — | 103,353 | |||||||||||||||||||||||||||||||||||||||||
| Other comprehensive income, net of | ||||||||||||||||||||||||||||||||||||||||||||||||
| tax: | ||||||||||||||||||||||||||||||||||||||||||||||||
| Unrealized holding loss during | ||||||||||||||||||||||||||||||||||||||||||||||||
| the year | — | — | — | — | (17,239 | ) | — | (17,239 | ) | |||||||||||||||||||||||||||||||||||||||
| Reclassification adjustment of | ||||||||||||||||||||||||||||||||||||||||||||||||
| gains included in net income | — | — | — | — | (476 | ) | — | (476 | ) | |||||||||||||||||||||||||||||||||||||||
| Total comprehensive income | — | — | 103,353 | — | (17,715 | ) | — | 85,638 | ||||||||||||||||||||||||||||||||||||||||
| Exercise of 267,423 stock options and | ||||||||||||||||||||||||||||||||||||||||||||||||
| reissuance of treasury stock from | ||||||||||||||||||||||||||||||||||||||||||||||||
| option exercise and 4,930 shares | ||||||||||||||||||||||||||||||||||||||||||||||||
| from restricted stock unit awards | — | — | (6,209 | ) | — | — | 9,684 | 3,475 | ||||||||||||||||||||||||||||||||||||||||
| Purchase of 1,342,500 shares of | ||||||||||||||||||||||||||||||||||||||||||||||||
| treasury stock | — | — | — | — | — | (56,826 | ) | (56,826 | ) | |||||||||||||||||||||||||||||||||||||||
| Tax benefits from stock-related | ||||||||||||||||||||||||||||||||||||||||||||||||
| compensation | — | 1,137 | — | — | — | — | 1,137 | |||||||||||||||||||||||||||||||||||||||||
| Cash dividends declared, $0.92 per | ||||||||||||||||||||||||||||||||||||||||||||||||
| share | — | — | (29,623 | ) | — | — | — | (29,623 | ) | |||||||||||||||||||||||||||||||||||||||
| Distribution of Gain Deferral Plan | ||||||||||||||||||||||||||||||||||||||||||||||||
| shares | — | 3,947 | 1,262 | (1,262 | ) | — | (3,955 | ) | (8 | ) | ||||||||||||||||||||||||||||||||||||||
| Dividends paid to Gain Deferral Plan | — | — | (51 | ) | 51 | — | — | — | ||||||||||||||||||||||||||||||||||||||||
| Balance at December 31, 2005 | 336 | 527,131 | 537,140 | — | (19,391 | ) | (67,037 | ) | 978,179 | |||||||||||||||||||||||||||||||||||||||
| Comprehensive income: | ||||||||||||||||||||||||||||||||||||||||||||||||
| Net income | — | — | 84,583 | — | — | — | 84,583 | |||||||||||||||||||||||||||||||||||||||||
| Other comprehensive income, net of | ||||||||||||||||||||||||||||||||||||||||||||||||
| tax: | ||||||||||||||||||||||||||||||||||||||||||||||||
| Adjustment to initially apply SFAS No. 158, | ||||||||||||||||||||||||||||||||||||||||||||||||
| net of tax | — | — | — | — | (304 | ) | — | (304 | ) | |||||||||||||||||||||||||||||||||||||||
| Unrealized holding gain during | ||||||||||||||||||||||||||||||||||||||||||||||||
| the year | — | — | — | — | 19,406 | — | 19,406 | |||||||||||||||||||||||||||||||||||||||||
| Reclassification adjustment of | ||||||||||||||||||||||||||||||||||||||||||||||||
| losses included in net income | — | — | — | — | (8,187 | ) | — | (8,187 | ) | |||||||||||||||||||||||||||||||||||||||
| Total comprehensive income | — | — | 84,583 | — | 10,915 | — | 95,498 | |||||||||||||||||||||||||||||||||||||||||
| Exercise of 460,196 stock options and | ||||||||||||||||||||||||||||||||||||||||||||||||
| reissuance of treasury stock from | ||||||||||||||||||||||||||||||||||||||||||||||||
| option exercise and 7,842 shares | ||||||||||||||||||||||||||||||||||||||||||||||||
| from restricted stock unit awards | 1 | 1,386 | (8,787 | ) | — | — | 14,372 | 6,972 | ||||||||||||||||||||||||||||||||||||||||
| Issuance of 2,343,186 shares for the | ||||||||||||||||||||||||||||||||||||||||||||||||
| acquisition of EFC Bancorp and the | ||||||||||||||||||||||||||||||||||||||||||||||||
| conversion of 168,690 EFC Bancorp | ||||||||||||||||||||||||||||||||||||||||||||||||
| stock options | 8 | 38,905 | — | — | — | 66,138 | 105,051 | |||||||||||||||||||||||||||||||||||||||||
| Purchase of 1,917,379 shares of | ||||||||||||||||||||||||||||||||||||||||||||||||
| treasury stock | — | — | — | — | — | (81,990 | ) | (81,990 | ) | |||||||||||||||||||||||||||||||||||||||
| Tax benefits from stock-related | ||||||||||||||||||||||||||||||||||||||||||||||||
| compensation | — | 1,720 | — | — | — | — | 1,720 | |||||||||||||||||||||||||||||||||||||||||
| Cash dividends declared, $1.00 per | ||||||||||||||||||||||||||||||||||||||||||||||||
| share | — | — | (33,285 | ) | — | — | — | (33,285 | ) | |||||||||||||||||||||||||||||||||||||||
| Balance at December 31, 2006 | $ | 345 | 569,142 | 579,651 | — | (8,476 | ) | (68,517 | ) | 1,072,145 | ||||||||||||||||||||||||||||||||||||||
See accompanying Notes to Consolidated Financial Statements.
65
MAF Bancorp, Inc. and Subsidiaries
Consolidated Statements of Cash Flows
| Year Ended December 31, | |||||||||||||||||
|---|---|---|---|---|---|---|---|---|---|---|---|---|---|---|---|---|---|
| 2006 | 2005 | 2004 | |||||||||||||||
| (Dollars in thousands) | |||||||||||||||||
| Operating activities: | |||||||||||||||||
| Net income | $ | 84,583 | 103,353 | 101,522 | |||||||||||||
| Adjustments to reconcile net income to net cash provided by | |||||||||||||||||
| operating activities: | |||||||||||||||||
| Amortization (accretion) of premiums, discounts and | |||||||||||||||||
| deferred loan fees | 1,078 | (4,323 | ) | (15,940 | ) | ||||||||||||
| Provision for loan losses | 3,900 | 1,980 | 1,215 | ||||||||||||||
| FHLB of Chicago stock dividends | — | (12,300 | ) | (23,141 | ) | ||||||||||||
| Net gain on sale of loans receivable | (8,793 | ) | (10,675 | ) | (9,294 | ) | |||||||||||
| Net gain on sale of mortgage servicing rights | (3,600 | ) | (2,400 | ) | — | ||||||||||||
| Net gain on sale of investment and mortgage-backed | |||||||||||||||||
| securities | (4 | ) | (727 | ) | (3,308 | ) | |||||||||||
| Other than temporary impairment write-down on investment | |||||||||||||||||
| securities | 12,934 | — | 1,988 | ||||||||||||||
| Net gain on real estate held for development or sale | (785 | ) | (2,928 | ) | (6,657 | ) | |||||||||||
| Net gain on sale of premises and equipment | (795 | ) | (164 | ) | 9 | ||||||||||||
| Amortization of mortgage servicing rights, net | 5,319 | 6,870 | 6,010 | ||||||||||||||
| Depreciation and amortization | 17,060 | 15,058 | 13,666 | ||||||||||||||
| Amortization of core deposit intangibles | 4,309 | 2,902 | 3,002 | ||||||||||||||
| Deferred income tax expense (benefit) | (13,436 | ) | (136 | ) | 7,468 | ||||||||||||
| Increase (decrease) in accrued interest receivable | (1,368 | ) | (9,451 | ) | (3,720 | ) | |||||||||||
| Net increase (decrease) in bank-owned life insurance income | (7,304 | ) | (4,633 | ) | (3,410 | ) | |||||||||||
| Net change in other assets and liabilities, net of effects | |||||||||||||||||
| from acquisitions | (5,330 | ) | 17,328 | 6,785 | |||||||||||||
| Tax benefit for stock options exercised | 1,720 | 5,084 | 2,024 | ||||||||||||||
| Excess tax benefits realized on exercise of stock compensation | (1,415 | ) | — | — | |||||||||||||
| Loans originated and purchased for sale | (1,276,528 | ) | (792,991 | ) | (909,291 | ) | |||||||||||
| Sale of loans originated and purchased for sale | 1,283,624 | 834,429 | 919,743 | ||||||||||||||
| Net cash provided by operating activities | 95,169 | 146,276 | 88,671 | ||||||||||||||
| Investing activities: | |||||||||||||||||
| Loans originated and purchased for investment | (2,174,190 | ) | (3,190,244 | ) | (3,313,955 | ) | |||||||||||
| Principal repayments on loans receivable | 2,560,336 | 2,710,823 | 2,685,375 | ||||||||||||||
| Principal repayments on mortgage-backed securities | 280,675 | 322,387 | 278,184 | ||||||||||||||
| Proceeds from maturities of investment securities available | |||||||||||||||||
| for sale | 163,140 | 39,587 | 90,741 | ||||||||||||||
| Proceeds from sale or redemption of: | |||||||||||||||||
| Investment securities available for sale | 34,484 | 16,174 | 48,551 | ||||||||||||||
| Mortgage-backed securities available for sale | — | — | 34,470 | ||||||||||||||
| Real estate held for development or sale | 12,309 | 16,692 | 21,737 | ||||||||||||||
| Stock in Federal Home Loan Bank of Chicago | 31,879 | 125,553 | 130,954 | ||||||||||||||
| Premises and equipment | 884 | 336 | 107 | ||||||||||||||
| Purchases of: | |||||||||||||||||
| Investment securities available for sale | (154,410 | ) | (145,806 | ) | (153,650 | ) | |||||||||||
| Mortgage-backed securities available for sale | (121,874 | ) | (675,323 | ) | (252,983 | ) | |||||||||||
| Bank-owned life insurance | (15,000 | ) | (35,000 | ) | (15,000 | ) | |||||||||||
| Real estate held for development or sale | (40,146 | ) | (25,611 | ) | (10,257 | ) | |||||||||||
| Premises and equipment | (11,223 | ) | (18,868 | ) | (23,361 | ) | |||||||||||
| Net cash received (paid) in acquisition | (42,809 | ) | — | 80,373 | |||||||||||||
| Net cash provided by (used in) investing activities | 524,055 | (859,300 | ) | (398,714 | ) | ||||||||||||
| Financing Activities: | |||||||||||||||||
| Proceeds from: | |||||||||||||||||
| FHLB of Chicago advances | 1,298,400 | 1,576,000 | 1,207,500 | ||||||||||||||
| Issuance of junior subordinated debentures | — | 67,011 | — | ||||||||||||||
| Unsecured bank term loan | 92,000 | — | 25,000 | ||||||||||||||
| Unsecured line of credit | 65,000 | 30,000 | 17,000 | ||||||||||||||
| Reverse repurchase agreements | 200,000 | 200,000 | 250,000 | ||||||||||||||
| Repayments of: | |||||||||||||||||
| FHLB of Chicago advances | (1,828,400 | ) | (1,293,125 | ) | (1,123,750 | ) | |||||||||||
| Unsecured bank term loan | (7,500 | ) | (7,000 | ) | — | ||||||||||||
| Unsecured line of credit | (65,000 | ) | (40,000 | ) | (17,000 | ) | |||||||||||
| Reverse repurchase agreements | (300,000 | ) | — | (55,000 | ) | ||||||||||||
| Net increase (decrease) in: | |||||||||||||||||
| Deposits | 118,316 | 261,795 | 88,640 | ||||||||||||||
| Other short-term borrowings | 2,472 | (2,283 | ) | 9,685 | |||||||||||||
| Advances by borrowers for taxes and insurance | (3,563 | ) | 1,830 | 1,030 | |||||||||||||
66
MAF Bancorp, Inc. and Subsidiaries
Consolidated Statements of Cash Flows - (Continued)
| Year Ended December 31, | ||||||||||||||||||||
|---|---|---|---|---|---|---|---|---|---|---|---|---|---|---|---|---|---|---|---|---|
| 2006 | 2005 | 2004 | ||||||||||||||||||
| (Dollars in thousands) | ||||||||||||||||||||
| Proceeds from exercise of stock options | $ | 7,262 | 3,910 | 7,559 | ||||||||||||||||
| Excess tax benefits realized on exercise of stock compensation | 1,415 | — | — | |||||||||||||||||
| Purchase of treasury stock | (81,990 | ) | (56,826 | ) | (49,174 | ) | ||||||||||||||
| Cash dividends paid | (32,447 | ) | (29,257 | ) | (26,411 | ) | ||||||||||||||
| Net cash provided by (used in) financing activities | (534,035 | ) | 712,055 | 335,079 | ||||||||||||||||
| Increase (decrease) in cash and cash equivalents | 85,189 | (969 | ) | 25,036 | ||||||||||||||||
| Cash and cash equivalents at beginning of year | 246,029 | 246,998 | 221,962 | |||||||||||||||||
| Cash and cash equivalents at end of year | $ | 331,218 | 246,029 | 246,998 | ||||||||||||||||
| Supplemental disclosure of cash flow information: | ||||||||||||||||||||
| Cash paid during the year for: | ||||||||||||||||||||
| Interest on deposits and borrowed funds | $ | 333,831 | 201,758 | 140,769 | ||||||||||||||||
| Income taxes | 55,810 | 46,579 | 16,419 | |||||||||||||||||
| Summary of non-cash transactions: | ||||||||||||||||||||
| Transfer of loans receivable to foreclosed real estate | 7,796 | 2,206 | 3,801 | |||||||||||||||||
| Loans receivable transferred to held for sale | 219,579 | 107,905 | — | |||||||||||||||||
| Loans receivable swapped into mortgage-backed securities | — | 42,623 | 301,750 | |||||||||||||||||
| Treasury stock received for withholding tax liability | ||||||||||||||||||||
| related to stock option exercises (14,591, 10,411 and | ||||||||||||||||||||
| 12,224 shares) | 631 | 444 | 536 | |||||||||||||||||
| Treasury stock received for stock option exercises (50,156, | ||||||||||||||||||||
| 36,149 and 34,143 shares) | $ | 2,145 | 1,547 | 1,508 | ||||||||||||||||
| Acquisitions: | ||||||||||||||||||||
| Assets acquired | $ | 1,052,403 | — | 352,126 | ||||||||||||||||
| Common stock issued | 105,051 | — | 42,642 | |||||||||||||||||
| Cash paid | (64,276 | ) | — | (80,034 | ) | |||||||||||||||
| Cash acquired | 21,467 | — | 160,407 | |||||||||||||||||
| Net cash (paid) received from acquisitions | $ | (42,809 | ) | — | 80,373 | |||||||||||||||
See accompanying Notes to Consolidated Financial Statements.
67
MAF Bancorp, Inc. and Subsidiaries
Notes to Consolidated Financial Statements
1. Summary of Significant Accounting Policies
Principles of Consolidation. The consolidated financial statements include the accounts of MAF Bancorp, Inc. (“Company”) and its wholly-owned subsidiaries. All significant intercompany balances and transactions have been eliminated in consolidation. Certain reclassifications of prior year amounts have been made to conform to the current year presentation.
Use of Estimates. The accounting and reporting policies of the Company conform with U.S. generally accepted accounting principles (GAAP). The preparation of consolidated financial statements in conformity with GAAP requires management to make estimates, assumptions and judgments that affect the amounts reported in the consolidated financial statements and accompanying notes. Actual results could differ materially from those estimates.
Statement of Cash Flows. Cash and cash equivalents include cash and due from banks, interest-bearing deposits and federal funds sold. Generally, federal funds are sold for one-day periods and interest-bearing deposits mature within one day to three months.
Restrictions on Cash. Based on the types and amounts of deposits received, the Bank maintains vault cash and non-interest bearing cash balances in accordance with Federal Reserve Bank reserve requirements. The Bank’s reserve requirements of $20.6 million at December 31, 2006 and $21.7 million at December 31, 2005 were met with funds on deposit in a pass-through account at the Federal Home Loan Bank of Chicago as well as vault cash on hand and in the branches.
The Bank is also required to keep a compensating balance based on the average daily remittance of checks issued for daily operating activities with a third party. This balance was $7.7 million at December 31, 2006 and $10.9 million at December 31, 2005.
Investment and Mortgage-Backed Securities. All investment and mortgage-backed securities are classified as available for sale or held to maturity. Investments and mortgage-backed securities that are categorized as available for sale are carried at fair value, with unrealized gains and losses reflected in stockholders’ equity, net of tax. Held to maturity securities include mortgage-backed securities which the Company has the positive intent and ability to hold to maturity. These investments are carried at amortized cost, with no recognition of unrealized gains or losses in the consolidated financial statements. Losses on securities that are deemed other-than-temporary are recognized in the consolidated statement of operations, with a new cost basis established in the consolidated statement of financial condition.
Interest and dividends on investments and mortgage-backed securities, including amortization of premiums, discounts, and purchase accounting adjustments to the earlier of call or maturity, or in the case of mortgage-related securities, over the estimated life of the security using the level-yield method are included in interest income. Gains and losses on sales of investment securities, mortgage-backed securities, and equity securities are determined using the specific identification method.
The Bank executes “swap” transactions with the Federal National Mortgage Association (“Fannie Mae”) and the Federal Home Loan Mortgage Corporation (“Freddie Mac”) to exchange whole mortgage loans originated by the Bank for mortgage-backed securities guaranteed by the agencies, for which the Bank pays a guarantee fee.
Bank-Owned Life Insurance (“BOLI”). BOLI represents life insurance policies on the lives of certain Company officers and employees for former officers or employees or which we are the beneficiary. These policies are recorded as an asset on the consolidated statements of financial condition at their cash surrender value, the amount that could be realized currently. The change in cash surrender value and insurance proceeds received are recorded as BOLI income in the consolidated statements of operations in non-interest income and is not subject to income taxes.
Loans receivable held for sale. The Bank sells, generally without recourse, whole loans and participation interests in mortgage loans and home equity lines of credit that it originates primarily to GSEs such as Fannie Mae and Freddie Mac and to a lesser extent, private investors. The Bank sells various loans, with recourse, to the Federal Home Loan Bank Mortgage Partnership Program (“MPF”) and
68
MAF Bancorp, Inc. and Subsidiaries
Notes to Consolidated Financial Statements - (Continued)
to a lesser extent, other investors in which it retains a limited and specified level of credit risk. Loans originated are identified as either held for investment or sale upon origination. Loans which the Bank intends to sell before maturity are classified as held for sale, and are carried at the lower of cost, adjusted for applicable deferred loan fees or costs, or estimated market value, in the aggregate.
The Bank enters into forward commitments, primarily with Fannie Mae, to sell mortgage loans originated by the Bank at a specific time and specific price in the future. Loans subject to forward sales are classified as held for sale. Unrealized losses and gains, if any, on forward commitments are included in gain on sale of mortgage loans in the period the loans are committed.
Loans Receivable. Loans receivable are stated at unpaid principal balances less unearned discounts, deferred loan origination fees and costs, loans in process and the allowance for loan losses.
Interest is recognized on an accrual basis. Loan fees and certain direct loan origination costs are deferred at origination, and the net deferred fee or cost is amortized into interest income using the level-yield method over the contractual life of the loans. Discounts on loans receivable are amortized to interest income using the level-yield method over the remaining period to contractual maturity, adjusted for anticipated prepayments. Purchase accounting premiums or discounts are amortized into interest income over the contractual term of loans receivable acquired, adjusted for anticipated prepayments, using the level-yield method.
The accrual of interest income for all loans is discontinued when there is clear indication that the borrower’s cash flow may not be sufficient to meet payments as they become due or management becomes aware of facts or circumstances that may adversely impact the collectibility of principal or interest on loans. A loan (whether considered impaired or not) is classified as non-accrual when the borrower becomes 91 days past due. When a loan is placed on non-accrual status, or is in the process of bankruptcy or foreclosure, previously accrued but unpaid interest is reversed against interest income. Income is subsequently recorded to the extent cash payments are received, if the entire principal balance is considered collectible, or at a time when the loan is brought current in accordance with its original terms.
The Bank considers a loan impaired when, based on current information and events, it is probable that the Bank will be unable to collect all amounts due according to the contractual terms of the loan. For loans which are not individually significant (i.e. loans under $1.0 million) and represent a homogeneous population, the Bank evaluates impairment collectively based on management reports on the volume and extent of delinquencies, as well as historical loss experience for these types of loans. The Bank uses this criteria on one- to four-family residential loans, consumer loans, smaller multi-family residential loans and land loans. Impairment for loans considered individually significant, as well as commercial real estate and commercial business loans, are measured based on the present value of expected future cash flows discounted at the loan’s effective interest rate, or the fair value of the collateral if the loan is collateral dependent. Charge-offs of principal occur when a loss has deemed to have occurred as a result of the book value exceeding the fair value or net realizable value.
Allowance for Loan Losses. We maintain an allowance for loan losses to cover management’s estimate of probable losses inherent in the Bank’s loan portfolio. In evaluating the allowance for loan losses and determining the amount of any provision for loan losses, management considers: (1) historical loss experience and the change in size and the mix of the overall portfolio composition, (2) specific allocations based upon probable losses identified during the review of the portfolio, (3) delinquency trends in the portfolio and the composition of non-performing loans, including the percent of non-performing loans with supplemental mortgage insurance, and (4) subjective factors, including local and general economic business factors and trends, industry and interest rate trends, new lending products and changes in underwriting criteria and portfolio concentrations.
The allowance for loan losses is established through a provision for loan losses that is recorded in the consolidated statement of operations.
Foreclosed Real Estate. Real estate properties acquired through, or in lieu of, foreclosure are initially recorded at the lower of carrying value or fair value less the estimated cost to dispose at the date of foreclosure, establishing a new cost basis. Management periodically performs valuations and an allowance for loss is established if the carrying value of a property exceeds its estimated fair value less
69
MAF Bancorp, Inc. and Subsidiaries
Notes to Consolidated Financial Statements - (Continued)
cost to dispose. At December 31, 2006, foreclosed real estate included 17 one- to four-family residences and one commercial real estate property.
Real Estate Held for Development or Sale. The direct cost of material, labor, overhead, real estate taxes, interest, design, engineering and project management during construction and development are capitalized as real estate held for development or sale. Real estate properties held for development or sale, are carried at the lower of cost, including capitalized holding costs, or net realizable value. Gains and losses on individual lot sales in a particular development are based on cash received less the estimated cost of sales per lot. Cost of sales per lot is calculated as the current investment in the particular development unit plus anticipated costs to complete the development unit, which includes capitalized interest and real estate taxes, divided by the total number of lots to be sold in the unit. Periodic reviews are made as to a development’s estimated costs to complete.
Premises and Equipment. Land is carried at cost. Buildings, leasehold improvements, furniture, fixtures, and equipment are carried at cost, less accumulated depreciation and amortization. Purchase of premises and equipment are recorded at market value for business acquisitions. Buildings, furniture, fixtures, and equipment are depreciated using the straight-line method over the estimated useful lives of the assets. The cost of leasehold improvements is amortized using the straight-line method over the lesser of the life of the leasehold improvement or the term of the related lease. Maintenance and repairs are charged to expense as incurred.
Affordable Housing Investments. Affordable housing investments included in other assets represent multi-family rental properties (affordable housing projects) in which a subsidiary of the Bank has limited partner interests, generally 98-99%. The financial condition, results of operations and cash flows of each LLP or LLC is consolidated in the Company’s financial statements. The properties are recorded at cost less accumulated depreciation. The Company evaluates the recoverability of the carrying value on a regular basis. If the recoverability was determined to be in doubt, a valuation allowance would be established. Depreciation expense is provided on a straight-line basis over the estimated useful life of the assets. The operations of the properties tend to generate an aggregate net loss before income taxes, but contribute income tax credits, which lowers the Company’s effective tax rate. Once established, the credits on each property last for ten years and reduce the consolidated federal income tax liability and expense of the Company. The Company is obligated to keep the projects’ low-rent structure in place for a period of time after the ten-year tax credit period.
Goodwill and Intangibles. Goodwill represents the excess of the purchase price over the fair value of the net identifiable assets acquired in business combinations or branch acquisitions. Core deposit intangibles represent the value assigned to the core deposit base acquired. The valuation techniques we use to determine the carrying value of tangible and intangible assets and liabilities acquired in acquisitions and the estimated lives of the identifiable intangible assets involve a number of subjective judgments such as estimates for discount rates, projected future cash flows and time period of useful lives, all of which are susceptible to change based on changes in economic conditions and other factors.
Both goodwill and core deposit intangibles are recognized as a result of the purchase method of accounting for business combinations. Core deposit intangibles have finite lives and are amortized on an accelerated basis to expense over the estimated life of the core deposit which approximates ten years.
The Company reviews long-lived assets and certain identifiable intangibles for impairment whenever events or changes in circumstances indicate that the carrying amount may not be recoverable. The impairment is measured based on the expected future cash flows from the use of the asset and its eventual disposition. If expected future cash flows are less than the carrying amount of the asset, an impairment loss is recognized based on current fair values.
Goodwill and indefinite life intangibles are no longer amortized but are subject to impairment tests on at least an annual basis. Any impairment of goodwill or intangibles will be recognized as an expense in the period of impairment. No impairment was identified as a result of the Company’s annual analysis in May 2006 or 2005.
70
MAF Bancorp, Inc. and Subsidiaries
Notes to Consolidated Financial Statements - (Continued)
Mortgage Servicing Rights. Mortgage servicing rights are initially capitalized upon acquisition, at fair value of allocated cost, and are subsequently amortized over the estimated life of the loan servicing income stream, using the level-yield method. Mortgage servicing rights that are retained when mortgage loans are sold are recorded by allocating the previous carrying amount of the sold loan between the servicing rights retained and the loans that are sold to a third party. This allocation is based upon the relative fair values of the mortgage servicing rights and the loans sold. The estimated value takes into consideration contractually known amounts, such as loan balance, term, contract rate, and escrow funds with the Bank for the payment of taxes and insurance. The balance of mortgage servicing rights is included in the consolidated statement of financial condition in intangible assets. The Bank conducts periodic impairment analyses by evaluating the present value of the future economic benefit to be derived from the servicing rights using current information regarding interest rates, prepayment assumptions, ancillary income, and the cost to service such loans. For purposes of measuring impairment, the mortgage servicing rights are stratified based on the predominant risk characteristics of the underlying loans. The Bank stratifies loans by interest rate, maturity, and whether the loans are fixed or adjustable rate. A valuation allowance is recognized in the amount by which the capitalized servicing rights for a specific stratum exceeds its estimated fair value.
Income Taxes. The Company and its subsidiaries file a consolidated federal income tax return, except for MAF Realty Co., L.L.C. — IV, a REIT, which is required to file a separate federal income tax return. The provision for income taxes is based upon net income in the consolidated financial statements, rather than amounts reported on the Company’s tax return. Deferred income taxes are provided for all significant items of income and expense that are recognized in different periods for financial reporting purposes and income tax reporting purposes. The asset and liability approach is used for the financial accounting and reporting of income taxes. This approach requires companies to take into account changes in the tax rates when valuing the deferred income tax accounts recorded on the consolidated statement of financial condition. In addition, it provides that a deferred tax liability or asset shall be recognized for the estimated future tax effects attributable to “temporary differences.” Temporary differences include differences between financial statement income and tax return income which are expected to reverse in future periods as well as differences between tax bases of assets and liabilities and their amounts for financial reporting purposes which are also expected to be settled in future periods. To the extent a deferred tax asset is established which is not more likely than not to be realized, a valuation allowance shall be established against such asset.
Derivative Financial Instruments. The Company utilizes forward commitments to sell mortgage loans as part of its mortgage loan origination hedging strategy. Loan commitments and forward sales are accounted for as derivative instruments with adjustments included in earnings as a component of gain on sale of loans at each period end. All derivatives are recognized on the consolidated statement of financial condition at their fair value.
Comprehensive Income. Comprehensive income includes net income plus other comprehensive income. Other comprehensive income includes revenues, expenses, gains and losses that under GAAP are included in comprehensive income but excluded from net income. The Company reports comprehensive income in its consolidated statement of changes in stockholders’ equity.
Segments. The Company uses the management approach for determining segment reporting. Based on the management approach, the Company operates two separate lines of business, banking and real estate operations.
Stock Option and Equity-based Plans. The Company has various stock-based compensation plans pursuant to which stock options and other equity-based awards have been granted.
Prior to 2006, the Company applied APB Opinion 25, “Accounting for Stock Issued to Employees,” and related interpretations in accounting for its stock option plans. On January 1, 2006, the Company adopted Statement of Financial Accounting Standards, or SFAS, No. 123R, “Share-Based Payments.” SFAS No. 123R requires the recognition of compensation expense in an amount equal to the fair value of all share-based payments. The Company elected to apply SFAS 123R on a modified prospective method, which requires the Company to record compensation expense for options granted on or after January 1, 2006 and over the remaining vesting period for previous awards that were partially unvested as of the
71
MAF Bancorp, Inc. and Subsidiaries
Notes to Consolidated Financial Statements - (Continued)
date of adoption of SFAS No. 123R. See Note No. 16 “Officer, Director and Employee Benefit Plans” for additional information regarding the impact on prior years results.
Compensation expense for restricted stock unit awards is recognized ratably over the period of service, usually the vesting period, based on the fair value of the stock on the date of grant.
Earnings Per Share. Earnings per share is determined by dividing net income for the period by the weighted average number of shares outstanding. Stock options are considered in the earnings per share calculations only if dilutive, and are the only adjustments made to average shares outstanding in computing diluted earnings per share. Anti-dilutive stock options not included in the computation of diluted earnings per share were 442,250, 1,109,150, and 393,750 at December 31, 2006, 2005 and 2004, respectively.
| Year Ended December 31, 2006 | Year Ended December 31, 2005 | Year Ended December 31, 2004 | ||||||||||||||||||||||||||||||||||||||||||||||||||||||||||||
|---|---|---|---|---|---|---|---|---|---|---|---|---|---|---|---|---|---|---|---|---|---|---|---|---|---|---|---|---|---|---|---|---|---|---|---|---|---|---|---|---|---|---|---|---|---|---|---|---|---|---|---|---|---|---|---|---|---|---|---|---|---|---|
| Income (Numerator) | Shares (Denominator) | Per Share Amount | Income (Numerator) | Shares (Denominator) | Per Share Amount | Income (Numerator) | Shares (Denominator) | Per Share Amount | ||||||||||||||||||||||||||||||||||||||||||||||||||||||
| (Dollars in thousands, except share data) | ||||||||||||||||||||||||||||||||||||||||||||||||||||||||||||||
| Basic earnings per share: | ||||||||||||||||||||||||||||||||||||||||||||||||||||||||||||||
| Income available to | ||||||||||||||||||||||||||||||||||||||||||||||||||||||||||||||
| common shareholders | $84,583 | 33,177,226 | $ | 2.55 | $ | 103,353 | 32,307,390 | $ | 3.20 | $ | 101,522 | 32,897,164 | $ | 3 | .09 | |||||||||||||||||||||||||||||||||||||||||||||||
| Effect of dilutive securities- | ||||||||||||||||||||||||||||||||||||||||||||||||||||||||||||||
| stock options | 587,786 | 676,572 | 809,405 | |||||||||||||||||||||||||||||||||||||||||||||||||||||||||||
| Diluted earnings per share: | ||||||||||||||||||||||||||||||||||||||||||||||||||||||||||||||
| Income available to | ||||||||||||||||||||||||||||||||||||||||||||||||||||||||||||||
| common shareholders | ||||||||||||||||||||||||||||||||||||||||||||||||||||||||||||||
| plus assumed | ||||||||||||||||||||||||||||||||||||||||||||||||||||||||||||||
| conversions | $ 84,583 | 33,765,012 | $ | 2.51 | $ | 103,353 | 32,983,962 | $ | 3.13 | $ | 101,522 | 33,706,569 | $ | 3 | .01 | |||||||||||||||||||||||||||||||||||||||||||||||
2. Business Combinations
On February 1, 2006, the Company acquired EFC Bancorp, Inc. (“EFC”), in a cash and stock transaction valued at $176.6 million including stock options. The Company paid $67.3 million in cash and issued 2.34 million common shares, and remaining options to purchase EFC common stock were converted into options to purchase a total of 168,690 shares of the Company’s common stock. The acquisition was accounted for under the purchase method as of the closing date. Goodwill and core deposit intangibles recorded was $97.4 million. At January 31, 2006, EFC had $1.1 billion in total assets, $703.4 million in deposits and $82.5 million in stockholders’ equity. The acquisition added seven offices to the Bank’s branch network, with offices in Kane and Cook Counties, Illinois. The Company funded the cash portion of the merger consideration primarily through an increase in its unsecured term bank loan in the amount of $52 million.
72
MAF Bancorp, Inc. and Subsidiaries
Notes to Consolidated Financial Statements - (Continued)
The following table summarizes the estimated fair value of the assets acquired and liabilities assumed at the date of acquisition of EFC (dollars in thousands):
| Cash | $ | 17,639 | |||
| Investment securities | 95,529 | ||||
| FHLB of Chicago stock | 12,623 | ||||
| Mortgage-backed securities | 7,988 | ||||
| Loans | 859,434 | ||||
| Allowance for loan losses | (4,294 | ) | |||
| Premises | 31,054 | ||||
| Other assets | 54,437 | ||||
| Goodwill | 83,890 | ||||
| Core deposit intangibles | 13,478 | ||||
| Total assets acquired | $ | 1,171,778 | |||
| Deposits | $ | 686,659 | |||
| Borrowings | 262,023 | ||||
| Other liabilities | 8,973 | ||||
| Total liabilities assumed | 957,655 | ||||
| Net assets acquired | $ | 214,123 | |||
The $83.9 million of goodwill and $13.5 million of core deposit intangible recorded in the acquisition were assigned to the banking segment. The core deposit intangible has an estimated life of ten years. The Company relied on a valuation report by an independent third party in valuing the core deposit intangible.
On November 1, 2004, the Company acquired Chesterfield Financial Corp. in a transaction valued at $128.4 million including stock options. The Company paid $85.7 million in cash and issued approximately 982,000 shares of MAF Bancorp common stock. Goodwill and core deposit intangibles of $45.9 million were generated in the transaction. The merger provided three additional branch locations in the Chicago area. At acquisition date, Chesterfield had assets of $354.2 million, deposits of $270.7 million and stockholders’ equity of $73.3 million.
3. Investment Securities Available for Sale
Investment securities available for sale are summarized below:
| December 31, 2006 | December 31, 2005 | ||||||||||||||||||||||||||||||||||||||||||||||||||||||||||
|---|---|---|---|---|---|---|---|---|---|---|---|---|---|---|---|---|---|---|---|---|---|---|---|---|---|---|---|---|---|---|---|---|---|---|---|---|---|---|---|---|---|---|---|---|---|---|---|---|---|---|---|---|---|---|---|---|---|---|---|
| Gross Unrealized | Gross Unrealized | ||||||||||||||||||||||||||||||||||||||||||||||||||||||||||
| Amortized Cost | Gains | Losses | Fair Value | Amortized Cost | Gains | Losses | Fair Value | ||||||||||||||||||||||||||||||||||||||||||||||||||||
| (Dollars in thousands) | |||||||||||||||||||||||||||||||||||||||||||||||||||||||||||
| U.S. Government and Agency securities | $ | 338,640 | 36 | (1,042 | ) | 337,634 | $ | 371,985 | 75 | (6,615 | ) | 365,445 | |||||||||||||||||||||||||||||||||||||||||||||||
| Municipal securities | 50,195 | 321 | (200 | ) | 50,316 | 23,587 | 57 | (40 | ) | 23,604 | |||||||||||||||||||||||||||||||||||||||||||||||||
| Asset-backed securities | 14,462 | 13 | (7 | ) | 14,468 | 4,680 | 10 | (7 | ) | 4,683 | |||||||||||||||||||||||||||||||||||||||||||||||||
| Corporate debt securities | 6,964 | 36 | — | 7,000 | 6,480 | 71 | — | 6,551 | |||||||||||||||||||||||||||||||||||||||||||||||||||
| Bank trust preferred | |||||||||||||||||||||||||||||||||||||||||||||||||||||||||||
| securities | 91,242 | 452 | — | 91,694 | 61,353 | 641 | (72 | ) | 61,922 | ||||||||||||||||||||||||||||||||||||||||||||||||||
| GSE preferred stock and | |||||||||||||||||||||||||||||||||||||||||||||||||||||||||||
| other | 27,757 | 1,419 | (290 | ) | 28,886 | 12,159 | 813 | (25 | ) | 12,947 | |||||||||||||||||||||||||||||||||||||||||||||||||
| $ | 529,260 | 2,277 | (1,539 | ) | 529,998 | $ | 480,244 | 1,667 | (6,759 | ) | 475,152 | ||||||||||||||||||||||||||||||||||||||||||||||||
The Company did not have any investment securities classified as held to maturity or trading at December 31, 2006 or 2005.
73
MAF Bancorp, Inc. and Subsidiaries
Notes to Consolidated Financial Statements - (Continued)
The amortized cost and fair value of securities at December 31, 2006, by contractual maturity, are shown in the table below. Expected maturities may differ from contractual maturities because certain issuers have the right to call obligations prior to maturity without penalty. At December 31, 2006, the Company had $177.5 million of investment securities with call options, of which $132.7 million were callable within one year.
| Amortized Cost | Fair Value | ||||||||||
|---|---|---|---|---|---|---|---|---|---|---|---|
| (Dollars in thousands) | |||||||||||
| Debt securities: | |||||||||||
| Under one year | $ | 176,540 | 176,615 | ||||||||
| Over 1 to 5 years | 178,164 | 177,944 | |||||||||
| Over 5 to 10 years | 64,829 | 64,415 | |||||||||
| Over 10 years | 67,508 | 67,670 | |||||||||
| Total debt securities | 487,041 | 486,644 | |||||||||
| Asset-backed securities | 14,462 | 14,468 | |||||||||
| GSE preferred stock and | |||||||||||
| other | 27,757 | 28,886 | |||||||||
| Total investment | |||||||||||
| securities | $ | 529,260 | 529,998 | ||||||||
Activity in the sales of investment securities available for sale is as follows:
| Year Ended December 31, | |||||||||||||||||
|---|---|---|---|---|---|---|---|---|---|---|---|---|---|---|---|---|---|
| 2006 | 2005 | 2004 | |||||||||||||||
| (Dollars in thousands) | |||||||||||||||||
| Total proceeds on sale | $ | 34,484 | 16,174 | 48,551 | |||||||||||||
| Gross realized gains | $ | 4 | 775 | 3,475 | |||||||||||||
| Gross realized losses | — | (48 | ) | (665 | ) | ||||||||||||
| Net gain on sale | 4 | 727 | 2,810 | ||||||||||||||
| Impairment writedown deemed | |||||||||||||||||
| other-than-temporary | (3,618 | ) | — | (1,988 | ) | ||||||||||||
| Net gain (loss) on sale or | |||||||||||||||||
| writedown | $ | (3,614 | ) | 727 | 822 | ||||||||||||
During 2006, other-than-temporary impairment writedown of $3.6 million were recorded on approximately $229.7 million of investments upon the decision to sell these securities as part of a balance sheet restructuring program in December 2006. In 2005, the gain represents a dissolution of stock in a regional ATM network and the sale of two marketable equity securities. During 2004, the Company recorded a $2.0 million other-than-temporary impairment write-down on two Freddie Mac floating-rate preferred stock securities with an aggregate carrying value of $8.8 million. The Company recorded the write-down because the current yields on these securities were below market interest rates, the fair value had been below cost for an extended period, and a recovery in fair value was not assumed within a reasonably short period of time.
The following table discloses the securities in the Company’s investment portfolio that have unrealized losses aggregated by each category of investment as of December 31, 2006. The $229.7 million of securities identified as being part of the balance sheet restructuring are not included in the table below as the unrealized losses were recorded in the 2006 consolidated statement of operations.
| Aggregate Unrealized Losses on Investment Securities | |||||||||||||||||||||||||||||||||||||||||||||||||||||
|---|---|---|---|---|---|---|---|---|---|---|---|---|---|---|---|---|---|---|---|---|---|---|---|---|---|---|---|---|---|---|---|---|---|---|---|---|---|---|---|---|---|---|---|---|---|---|---|---|---|---|---|---|---|
| Less than 12 months | 12 months or longer | Total | |||||||||||||||||||||||||||||||||||||||||||||||||||
| Description of Securities | Fair Value | Unrealized Losses | Fair Value | Unrealized Losses | Fair Value | Unrealized Losses | |||||||||||||||||||||||||||||||||||||||||||||||
| (Dollars in thousands) | |||||||||||||||||||||||||||||||||||||||||||||||||||||
| U.S. Government and Agency securities | $ | 25,742 | (87 | ) | 70,803 | (955 | ) | 96,545 | (1,042 | ) | |||||||||||||||||||||||||||||||||||||||||||
| Municipal securities | 14,456 | (192 | ) | 1,979 | (8 | ) | 16,435 | (200 | ) | ||||||||||||||||||||||||||||||||||||||||||||
| Asset-backed securities | — | — | 1,968 | (7 | ) | 1,968 | (7 | ) | |||||||||||||||||||||||||||||||||||||||||||||
| GSE preferred stock | 13,588 | (244 | ) | 1,960 | (46 | ) | 15,548 | (290 | ) | ||||||||||||||||||||||||||||||||||||||||||||
| $ | 53,786 | (523 | ) | 76,710 | (1,016 | ) | 130,496 | (1,539 | ) | ||||||||||||||||||||||||||||||||||||||||||||
74
MAF Bancorp, Inc. and Subsidiaries
Notes to Consolidated Financial Statements - (Continued)
The following table discloses the securities in the Company’s investment portfolio that have unrealized losses aggregated by each category of investment as of December 31, 2005:
| Aggregate Unrealized Losses on Investment Securities | |||||||||||||||||||||||||||||||||||||||||||||||||||||
|---|---|---|---|---|---|---|---|---|---|---|---|---|---|---|---|---|---|---|---|---|---|---|---|---|---|---|---|---|---|---|---|---|---|---|---|---|---|---|---|---|---|---|---|---|---|---|---|---|---|---|---|---|---|
| Less than 12 months | 12 months or longer | Total | |||||||||||||||||||||||||||||||||||||||||||||||||||
| Description of Securities | Fair Value | Unrealized Losses | Fair Value | Unrealized Losses | Fair Value | Unrealized Losses | |||||||||||||||||||||||||||||||||||||||||||||||
| (Dollars in thousands) | |||||||||||||||||||||||||||||||||||||||||||||||||||||
| U.S. Government and Agency securities | $ | 125,135 | (1,270 | ) | 235,236 | (5,345 | ) | 360,371 | (6,615 | ) | |||||||||||||||||||||||||||||||||||||||||||
| Municipals | 2,932 | (10 | ) | 3,017 | (30 | ) | 5,949 | (40 | ) | ||||||||||||||||||||||||||||||||||||||||||||
| Asset-backed securities | — | — | 2,592 | (7 | ) | 2,592 | (7 | ) | |||||||||||||||||||||||||||||||||||||||||||||
| Bank trust preferred | |||||||||||||||||||||||||||||||||||||||||||||||||||||
| securities | 7,095 | (72 | ) | — | — | 7,095 | (72 | ) | |||||||||||||||||||||||||||||||||||||||||||||
| GSE preferred stock | — | — | 4,975 | (25 | ) | 4,975 | (25 | ) | |||||||||||||||||||||||||||||||||||||||||||||
| $ | 135,162 | (1,352 | ) | 245,820 | (5,407 | ) | 380,982 | (6,759 | ) | ||||||||||||||||||||||||||||||||||||||||||||
Because the securities in the investment portfolio are classified as available for sale, and carried at fair value with unrealized losses, net of related tax effects, recorded in stockholders’ equity, any charge to earnings in the future if the securities were to be sold or were deemed by management to be other-than-temporarily impaired would not be expected to have a significant impact on stockholders’ equity at December 31, 2006. None of the unrealized losses are related to credit deterioration, but rather market value deterioration due to higher interest rates. See Note No. 4 “Mortgage-Backed Securities Available for Sale and Held to Maturity” for further information regarding the sale of mortgage-backed securities as part or our balance sheet restructuring.
4. Mortgage-Backed Securities Available for Sale and Held to Maturity
Mortgage-backed securities available for sale and held to maturity are summarized below:
| December 31, 2006 | December 31, 2005 | ||||||||||||||||||||||||||||||||||||||||||||||||||||||||||
|---|---|---|---|---|---|---|---|---|---|---|---|---|---|---|---|---|---|---|---|---|---|---|---|---|---|---|---|---|---|---|---|---|---|---|---|---|---|---|---|---|---|---|---|---|---|---|---|---|---|---|---|---|---|---|---|---|---|---|---|
| Gross Unrealized | Gross Unrealized | ||||||||||||||||||||||||||||||||||||||||||||||||||||||||||
| Amortized Cost | Gains | Losses | Fair Value | Amortized Cost | Gains | Losses | Fair Value | ||||||||||||||||||||||||||||||||||||||||||||||||||||
| (Dollars in thousands) | |||||||||||||||||||||||||||||||||||||||||||||||||||||||||||
| Available for sale: | |||||||||||||||||||||||||||||||||||||||||||||||||||||||||||
| Pass-through | |||||||||||||||||||||||||||||||||||||||||||||||||||||||||||
| certificates: | |||||||||||||||||||||||||||||||||||||||||||||||||||||||||||
| Fannie Mae | $ | 175,905 | 92 | (1,539 | ) | 174,458 | $ | 200,518 | 97 | (3,746 | ) | 196,869 | |||||||||||||||||||||||||||||||||||||||||||||||
| Freddie Mac | 37,676 | 160 | (465 | ) | 37,371 | 33,633 | 36 | (734 | ) | 32,935 | |||||||||||||||||||||||||||||||||||||||||||||||||
| Other | 15,206 | 9 | (42 | ) | 15,173 | 15,087 | — | (335 | ) | 14,752 | |||||||||||||||||||||||||||||||||||||||||||||||||
| Collateralized mortgage | |||||||||||||||||||||||||||||||||||||||||||||||||||||||||||
| obligations: | |||||||||||||||||||||||||||||||||||||||||||||||||||||||||||
| Agency CMOs | 746,037 | 293 | (8,786 | ) | 737,544 | 821,543 | 20 | (17,279 | ) | 804,284 | |||||||||||||||||||||||||||||||||||||||||||||||||
| Private issue CMOs | 234,734 | 1 | (3,787 | ) | 230,948 | 269,182 | — | (4,613 | ) | 264,569 | |||||||||||||||||||||||||||||||||||||||||||||||||
| $ | 1,209,558 | 555 | (14,619 | ) | 1,195,494 | $ | 1,339,963 | 153 | (26,707 | ) | 1,313,409 | ||||||||||||||||||||||||||||||||||||||||||||||||
| Held to maturity - | |||||||||||||||||||||||||||||||||||||||||||||||||||||||||||
| Fannie Mae | |||||||||||||||||||||||||||||||||||||||||||||||||||||||||||
| pass-through | |||||||||||||||||||||||||||||||||||||||||||||||||||||||||||
| certificates | $ | 212,302 | 90 | (6,772 | ) | 205,620 | $ | 243,161 | 205 | (5,877 | ) | 237,489 | |||||||||||||||||||||||||||||||||||||||||||||||
In 2006, the Bank did not swap any originated loans into mortgage-backed securities. During 2005, the Bank swapped $45.4 million of primarily fixed-rate loans it originated into mortgage-backed securities which were sold in the same period. Additionally in 2005, the Bank swapped $37.2 million of 15-year fixed-rate loans into mortgage-backed securities that were added to the held to maturity portfolio. Included in mortgage-backed securities held to maturity at December 31, 2006 and 2005 are $212.3 million and $243.2 million, respectively, of loans originated by the Bank.
Activity in the sales of mortgage-backed securities available for sale is as follows:
| Year Ended December 31, | |||||||||||||||||
|---|---|---|---|---|---|---|---|---|---|---|---|---|---|---|---|---|---|
| 2006 | 2005 | 2004 | |||||||||||||||
| (Dollars in thousands) | |||||||||||||||||
| Total proceeds on sale | $ | — | — | 34,470 | |||||||||||||
| Gross realized gains | $ | — | — | 500 | |||||||||||||
| Gross realized losses | — | — | — | ||||||||||||||
| Net gain on sale | — | — | 500 | ||||||||||||||
| Impairment writedown deemed | |||||||||||||||||
| other-than-temporary | (9,316 | ) | — | — | |||||||||||||
| Net gain (loss) on sale or | |||||||||||||||||
| writedown | $ | (9,316 | ) | — | 500 | ||||||||||||
75
MAF Bancorp, Inc. and Subsidiaries
Notes to Consolidated Financial Statements - (Continued)
During 2006, other-than-temporary impairment writedowns of $9.3 million were recorded on approximately $301.7 million of mortgage-backed securities upon the decision to sell these securities as part of a balance sheet restructuring program in December 2006.
The following table discloses the securities in the Company’s available for sale and held to maturity portfolios that have unrealized losses aggregated by each category of investment as of December 31, 2006. The $301.7 million of mortgage-backed securities identified for sale as part of the balance sheet restructuring are not included in the table below as the unrealized losses were recorded in the 2006 consolidated statement of operations.
| Aggregate Unrealized Losses on Mortgage-Backed Securities | ||||||||||||||||||||||||||||||||||||||
|---|---|---|---|---|---|---|---|---|---|---|---|---|---|---|---|---|---|---|---|---|---|---|---|---|---|---|---|---|---|---|---|---|---|---|---|---|---|---|
| Less than 12 months | 12 months or longer | Total | ||||||||||||||||||||||||||||||||||||
| Description of Securities | Fair Value | Unrealized Losses | Fair Value | Unrealized Losses | Fair Value | Unrealized Losses | ||||||||||||||||||||||||||||||||
| (Dollars in thousands) | ||||||||||||||||||||||||||||||||||||||
| Available for sale: | ||||||||||||||||||||||||||||||||||||||
| Pass-through certificates: | ||||||||||||||||||||||||||||||||||||||
| Fannie Mae | $ | — | — | 99,231 | (1,539 | ) | 99,231 | (1,539 | ) | |||||||||||||||||||||||||||||
| Freddie Mac | — | — | 22,321 | (465 | ) | 22,321 | (465 | ) | ||||||||||||||||||||||||||||||
| Other | 2,249 | (7 | ) | 2,793 | (35 | ) | 5,042 | (42 | ) | |||||||||||||||||||||||||||||
| Total pass-through certificates | 2,249 | (7 | ) | 124,345 | (2,039 | ) | 126,594 | (2,046 | ) | |||||||||||||||||||||||||||||
| Collateralized mortgage obligations: | ||||||||||||||||||||||||||||||||||||||
| Agency CMOs | 7,558 | (9 | ) | 437,651 | (8,777 | ) | 445,209 | (8,786 | ) | |||||||||||||||||||||||||||||
| Private issue CMOs | — | — | 216,399 | (3,787 | ) | 216,399 | (3,787 | ) | ||||||||||||||||||||||||||||||
| Total CMOs | 7,558 | (9 | ) | 654,050 | (12,654 | ) | 661,608 | (12,573 | ) | |||||||||||||||||||||||||||||
| Total available for | ||||||||||||||||||||||||||||||||||||||
| sale | $ | 9,807 | (16 | ) | 778,395 | (14,603 | ) | 788,202 | (14,619 | ) | ||||||||||||||||||||||||||||
| Held to maturity - | ||||||||||||||||||||||||||||||||||||||
| Fannie Mae pass-through | ||||||||||||||||||||||||||||||||||||||
| certificates | $ | — | — | 199,317 | (6,772 | ) | 199,317 | (6,772 | ) | |||||||||||||||||||||||||||||
The following table discloses the securities in the Company’s available for sale and held to maturity portfolios that have unrealized losses aggregated by each category of investment as of December 31, 2005:
| Aggregate Unrealized Losses on Mortgage-Backed Securities | ||||||||||||||||||||||||||||||||||||||
|---|---|---|---|---|---|---|---|---|---|---|---|---|---|---|---|---|---|---|---|---|---|---|---|---|---|---|---|---|---|---|---|---|---|---|---|---|---|---|
| Less than 12 months | 12 months or longer | Total | ||||||||||||||||||||||||||||||||||||
| Description of Securities | Fair Value | Unrealized Losses | Fair Value | Unrealized Losses | Fair Value | Unrealized Losses | ||||||||||||||||||||||||||||||||
| (Dollars in thousands) | ||||||||||||||||||||||||||||||||||||||
| Available for sale: | ||||||||||||||||||||||||||||||||||||||
| Pass-through certificates: | ||||||||||||||||||||||||||||||||||||||
| Fannie Mae | $ | 69,968 | (1,031 | ) | 109,010 | (2,715 | ) | 178,978 | (3,746 | ) | ||||||||||||||||||||||||||||
| Freddie Mac | 17,687 | (256 | ) | 9,897 | (478 | ) | 27,584 | (734 | ) | |||||||||||||||||||||||||||||
| Other | 8,562 | (56 | ) | 6,189 | (279 | ) | 14,751 | (335 | ) | |||||||||||||||||||||||||||||
| Total pass-through certificates | 96,217 | (1,343 | ) | 125,096 | (3,472 | ) | 221,313 | (4,815 | ) | |||||||||||||||||||||||||||||
| Collateralized mortgage obligations: | ||||||||||||||||||||||||||||||||||||||
| Agency CMOs | 569,260 | (10,818 | ) | 214,718 | (6,461 | ) | 783,978 | (17,279 | ) | |||||||||||||||||||||||||||||
| Private issue CMOs | 222,605 | (3,362 | ) | 41,579 | (1,251 | ) | 264,184 | (4,613 | ) | |||||||||||||||||||||||||||||
| Total CMOs | 791,865 | (14,180 | ) | 256,297 | (7,712 | ) | 1,048,162 | (21,892 | ) | |||||||||||||||||||||||||||||
| Total available for sale | $ | 888,082 | (15,523 | ) | 381,393 | (11,184 | ) | 1,269,475 | (26,707 | ) | ||||||||||||||||||||||||||||
| Held to maturity - | ||||||||||||||||||||||||||||||||||||||
| Fannie Mae pass-through | ||||||||||||||||||||||||||||||||||||||
| certificates | $ | 138,920 | (3,610 | ) | 81,558 | (2,267 | ) | 220,478 | (5,877 | ) | ||||||||||||||||||||||||||||
Because the securities identified in the table above are classified as available for sale, and carried at fair value with unrealized losses, net of related tax effects, recorded in stockholders’ equity, any charge to earnings in the future if the securities were to be sold or were deemed by management to be other-than-temporarily impaired would not be expected to have a significant impact on stockholders’ equity. None of the unrealized losses are related to credit deterioration, but rather market value deterioration due to higher interest rates.
76
MAF Bancorp, Inc. and Subsidiaries
Notes to Consolidated Financial Statements - (Continued)
During the fourth quarter of 2006, the Bank evaluated its overall asset/liability position and identified $531.4 of investment and mortgage-backed securities for sale as part of a balance sheet restructuring plan approved by the Company’s Board of Directors on December 19, 2006. The plan objectives were aimed at reducing the size of its investment portfolio, repaying wholesale borrowings, managing liquidity and better positioning the Bank for the current difficult and uncertain interest rate environment. When determining the securities to sell, the Bank considered reducing its portfolio with the lowest coupon rates, which have negatively impacted cash flows most dramatically due to rising short-term interest rates. The Bank also sought to maintain its net duration position after repaying borrowings. All of the securities identified for sale were rated AAA. To a lesser extent, the Bank considered its collateral needs in selecting securities for sale.
The Bank assessed the remainder of the investment and mortgage-backed portfolio relative to its asset/liability and liquidity management objectives and its ability to more effectively manage the current interest rate environment. Given this assessment, the Bank maintains its intent and ability to hold the remaining available-for-sale investment and mortgage-backed securities to the earlier of the recovery of the unrealized losses or maturity.
5. Loans Receivable Held For Sale
Loans receivable held for sale are summarized as follows:
| At December 31, | |||||||||||||||||||||||
|---|---|---|---|---|---|---|---|---|---|---|---|---|---|---|---|---|---|---|---|---|---|---|---|
| 2006 | 2005 | ||||||||||||||||||||||
| Amount | Weighted average rate | Amount | Weighted average rate | ||||||||||||||||||||
| (Dollars in thousands) | |||||||||||||||||||||||
| One- to four-family | |||||||||||||||||||||||
| Fixed-rate | $ | 42,561 | 6 | .39% | $ | 34,272 | 6 | .38% | |||||||||||||||
| Adjustable-rate | 251,884 | 4 | .66 | 45,066 | 6 | .38 | |||||||||||||||||
| Total one- to four-family | 294,445 | 4 | .91 | 79,338 | 6 | .38 | |||||||||||||||||
| Equity lines of credit and home | |||||||||||||||||||||||
| equity loans: | |||||||||||||||||||||||
| Equity lines of credit | 26,607 | 9 | .31 | 32,098 | 7 | .76 | |||||||||||||||||
| Home equity loans | 10,909 | 8 | .88 | 3,046 | 9 | .48 | |||||||||||||||||
| Total equity loans | 37,516 | 9 | .18 | 35,144 | 7 | .90 | |||||||||||||||||
| Total loans receivable held for | |||||||||||||||||||||||
| sale | $ | 331,961 | 5 | .39% | $ | 114,482 | 6 | .85% | |||||||||||||||
6. Loans Receivable
Loans receivable are summarized as follows:
| At December 31, | |||||||||||
|---|---|---|---|---|---|---|---|---|---|---|---|
| 2006 | 2005 | ||||||||||
| (Dollars in thousands) | |||||||||||
| One- to four-family | $ | 4,012,468 | 4,256,913 | ||||||||
| Equity lines of credit and home equity loans | 1,301,665 | 1,346,750 | |||||||||
| Multi-family | 801,866 | 698,659 | |||||||||
| Commercial real estate | 628,957 | 492,307 | |||||||||
| Construction | 194,254 | 109,691 | |||||||||
| Land | 304,685 | 171,580 | |||||||||
| Commercial business loans | 198,853 | 129,771 | |||||||||
| Consumer loans | 5,843 | 5,566 | |||||||||
| Loans receivable, net | $ | 7,448,591 | 7,211,237 | ||||||||
Loans that have adjustable-rate features included in loans receivable totaled $5.80 billion at December 31, 2006 and $5.88 billion at December 31, 2005. Netted in loans receivable at December 31, 2006 and December 31, 2005 are net deferred loan origination costs of $16.0 million and $23.3 million, respectively.
77
MAF Bancorp, Inc. and Subsidiaries
Notes to Consolidated Financial Statements - (Continued)
Allowance for loan losses. Activity in the allowance for loan losses is summarized as follows for the years indicated:
| Year Ended December 31, | |||||||||||||||||
|---|---|---|---|---|---|---|---|---|---|---|---|---|---|---|---|---|---|
| 2006 | 2005 | 2004 | |||||||||||||||
| (Dollars in thousands) | |||||||||||||||||
| Balance at beginning of year | $ | 36,495 | 36,255 | 34,555 | |||||||||||||
| Provision for loan losses | 3,900 | 1,980 | 1,215 | ||||||||||||||
| Balance acquired in | |||||||||||||||||
| acquisitions | 4,294 | — | 1,297 | ||||||||||||||
| Charge-offs | (5,336 | ) | (2,048 | ) | (1,091 | ) | |||||||||||
| Recoveries | 578 | 308 | 279 | ||||||||||||||
| Balance at end of year | $ | 39,931 | 36,495 | 36,255 | |||||||||||||
At December 31, 2006, 2005 and 2004, the Bank had $66.5 million, $31.2 million and $31.5 million, respectively, in loans that were on non-accrual status. Interest income that would have been recorded on non-accrual loans amounted to $2.6 million for the year ended December 31, 2006, and $1.4 million for each years ended December 31, 2005 and 2004. Interest income recognized on non-accrual loans and included in interest income was $2.0 million, $563,000 and $630,000, for the years ended December 31, 2006, 2005 and 2004, respectively.
At December 31, 2006 there were $4.1 million of commitments to lend additional funds to borrowers whose loans were non-performing.
At December 31, 2006, 2005 and 2004, the Company had $8.7 million, $2.1 million and $3.4 million of impaired loans, respectively. There were no specific reserves established for these loans. The average balance of impaired loans for 2006, 2005 and 2004 was $3.6 million, $2.4 million and $2.7 million, respectively.
7. Real Estate Held for Development or Sale
The carrying value of the Company’s investment in real estate held for development or sale by project is as follows:
| At December 31, | |||||||||||
|---|---|---|---|---|---|---|---|---|---|---|---|
| 2006 | 2005 | ||||||||||
| (Dollars in thousands) | |||||||||||
| Springbank of | |||||||||||
| Plainfield | $ | 74,201 | 49,850 | ||||||||
| Future development | 8,848 | 216 | |||||||||
| $ | 83,049 | 50,066 | |||||||||
Income from real estate operations by project for the years indicated is as follows:
| Year Ended December 31, | |||||||||||||||||
|---|---|---|---|---|---|---|---|---|---|---|---|---|---|---|---|---|---|
| 2006 | 2005 | 2004 | |||||||||||||||
| (Dollars in thousands) | |||||||||||||||||
| Springbank of | |||||||||||||||||
| Plainfield | $ | 430 | 2,335 | — | |||||||||||||
| Shenandoah | (5 | ) | 561 | 5,022 | |||||||||||||
| Tallgrass of | |||||||||||||||||
| Naperville | 360 | 32 | 1,635 | ||||||||||||||
| $ | 785 | 2,928 | 6,657 | ||||||||||||||
Interest expense capitalized to real estate held for development or sale amounted to $729,000, $173,000 and $8,000 for the years ended December 31, 2006, 2005 and 2004, respectively.
78
MAF Bancorp, Inc. and Subsidiaries
Notes to Consolidated Financial Statements - (Continued)
8. Premises and Equipment
Premises and equipment are summarized as follows:
| At December 31, | ||||||||||||||
|---|---|---|---|---|---|---|---|---|---|---|---|---|---|---|
| Estimated Useful Life | 2006 | 2005 | ||||||||||||
| (Dollars in thousands) | ||||||||||||||
| Land | $ | 44,991 | 31,498 | |||||||||||
| Office buildings | 10-50 years | 94,430 | 72,586 | |||||||||||
| Furniture, fixtures and equipment | 1-20 years | 47,056 | 50,140 | |||||||||||
| Computer equipment | 2-10 years | 34,419 | 30,091 | |||||||||||
| Leasehold improvements | 1-25 years | 23,097 | 21,271 | |||||||||||
| Total premises and equipment, at cost | 243,993 | 205,586 | ||||||||||||
| Less: accumulated depreciation and amortization | (69,519 | ) | (56,274 | ) | ||||||||||
| $ | 174,474 | 149,312 | ||||||||||||
Depreciation and amortization of premises and equipment, included in data processing expense and office occupancy and equipment expense, totaled $17.1 million, $15.1 million and $13.7 million for the years ended December 31, 2006, 2005 and 2004, respectively. Rent expense is recorded on a straight line basis. As a result, actual rental payments during a period may differ from rent expense recorded, due to lease escalation clauses or rent abatements. Occupancy expense is reduced by rental income from leased premises totaling $832,000, $930,000, and $982,000 for the years ended December 31, 2006, 2005 and 2004, respectively.
The Bank is obligated under non-cancelable operating leases primarily for office space. Rent expense under these leases for the years ended December 31, 2006, 2005 and 2004, was $8.0 million, $8.0 million, and $8.2 million, respectively. The projected minimum rental expense over the remaining terms of original existing leases as of December 31, 2006 is as follows (in thousands):
| Year Ended December 31, | |||||
|---|---|---|---|---|---|
| 2007 | $ | 5,600 | |||
| 2008 | 5,500 | ||||
| 2009 | 5,100 | ||||
| 2010 | 4,800 | ||||
| 2011 | 4,500 | ||||
| 2012 and thereafter | 28,800 | ||||
9. Goodwill and Intangibles
The changes in the carrying amount of goodwill, all recorded in the Banking segment, for the years ended December 31, 2006 and 2005 are shown below. The adjustments to goodwill relating to prior acquisitions primarily reflect tax adjustments that resulted from provision to tax return changes and changes in the estimated amounts of tax reserves relating to such acquisitions, as well as adjustments for 2005 relating to improved information received on contingent liability reserves from prior acquisitions.
The changes in the carrying amount of goodwill, all recorded in the Banking segment, for the years ended December 31, 2006 and 2005 are as follows (in thousands):
| Balance at December 31, 2004 | $ | 305,166 | |||
| Adjustments related to prior | |||||
| acquisitions | (915 | ) | |||
| Balance at December 31, 2005 | 304,251 | ||||
| Addition related to EFC acquisition | 83,890 | ||||
| Adjustments related to prior | |||||
| acquisitions | (161 | ) | |||
| Balance at December 31, 2006 | $ | 387,980 | |||
79
MAF Bancorp, Inc. and Subsidiaries
Notes to Consolidated Financial Statements - (Continued)
The changes in the carrying amount of intangibles for the years ended December 31, 2006 and 2005 are as follows:
| Core Deposit Intangibles | Mortgage Servicing Rights | Total | |||||||||||||||
|---|---|---|---|---|---|---|---|---|---|---|---|---|---|---|---|---|---|
| (Dollars in thousands) | |||||||||||||||||
| Balance at December 31, 2004 | $ | 13,066 | 25,697 | 38,763 | |||||||||||||
| Additions | — | 6,263 | 6,263 | ||||||||||||||
| Amortization expense | (2,902 | ) | (7,041 | ) | (9,943 | ) | |||||||||||
| Carrying value of servicing rights sold | — | (5,083 | ) | (5,083 | ) | ||||||||||||
| Valuation recovery | — | 171 | 171 | ||||||||||||||
| Balance at December 31, 2005 | 10,164 | 20,007 | 30,171 | ||||||||||||||
| Additions | 13,478 | 9,535 | 23,013 | ||||||||||||||
| Amortization expense | (4,309 | ) | (5,319 | ) | (9,628 | ) | |||||||||||
| Carrying value of servicing rights sold | — | (6,674 | ) | (6,674 | ) | ||||||||||||
| Balance at December 31, 2006 | $ | 19,333 | 17,549 | 36,882 | |||||||||||||
The following is a summary of intangible assets subject to amortization:
| As of December 31, 2006 | As of December 31, 2005 | ||||||||||||||||||||||
|---|---|---|---|---|---|---|---|---|---|---|---|---|---|---|---|---|---|---|---|---|---|---|---|
| Gross Carrying Amount | Accumulated Amortization | Gross Carrying Amount | Accumulated Amortization | ||||||||||||||||||||
| (Dollars in thousands) | |||||||||||||||||||||||
| Core deposit intangibles | $ | 40,055 | (20,722 | ) | $ | 26,577 | (16,413 | ) | |||||||||||||||
| Mortgage servicing rights(1) | 26,632 | (9,083 | ) | 26,685 | (6,678 | ) | |||||||||||||||||
| Total | $ | 66,687 | (29,805 | ) | $ | 53,262 | (23,091 | ) | |||||||||||||||
| (1) | The estimated fair values of mortgage servicing rights at December 31, 2006 and 2005 were $25.3 million and $29.0 million, respectively. |
Amortization expense for core deposit intangibles and mortgage servicing rights for the year ended December 31, 2006 and estimates for the five years thereafter are as follows. These estimates relate to the carrying value of the Bank’s core deposit intangibles and mortgage servicing rights as of December 31, 2006.
| Core Deposit Intangibles | Mortgage Servicing Rights | ||||||||||
|---|---|---|---|---|---|---|---|---|---|---|---|
| (Dollars in thousands) | |||||||||||
| Aggregate amortization expense for | |||||||||||
| the year ended December 31, 2006 | $ | 4,309 | 5,319 | ||||||||
| Estimated amortization expense for | |||||||||||
| the year ending December 31,: | |||||||||||
| 2007 | 3,500 | 3,700 | |||||||||
| 2008 | 2,900 | 3,200 | |||||||||
| 2009 | 2,500 | 2,700 | |||||||||
| 2010 | 2,200 | 2,400 | |||||||||
| 2011 | 2,200 | 2,000 | |||||||||
Loan servicing and mortgage servicing rights. The Bank services loans for the benefit of others pursuant to loan servicing agreements. Under these agreements, the Bank typically collects from the borrower monthly payments of principal and interest, as well as funds for the payment of real estate taxes and insurance. The Bank retains its loan servicing fee from these payments and remits the balance of the principal and interest payments to the various investors. Mortgage loans serviced for others are not included in the accompanying consolidated statement of financial condition. The unpaid principal balances of these loans were $2.7 billion, $2.9 billion and $3.6 billion, at December 31, 2006, 2005 and 2004, respectively. Loan servicing fee income was $3.4 million, $2.3 million and $1.2 million for the years ended December 31, 2006, 2005 and 2004, respectively. Non-interest bearing custodial balances maintained in connection with mortgage loans serviced for others (included in deposits) were $46.8 million and $41.2 million at December 31, 2006 and 2005, respectively.
80
MAF Bancorp, Inc. and Subsidiaries
Notes to Consolidated Financial Statements - (Continued)
10. Deposits
The following table is a summary of the Company’s deposits at December 31, 2006 and 2005. The weighted average rates are contractual rates and are not adjusted for the effect of purchase accounting adjustments. The unamortized premium represents part of the purchase accounting adjustments remaining from the acquisitions of Chesterfield, St. Francis and Elgin to mark the deposits to fair value.
| At December 31, 2006 | At December 31, 2005 | ||||||||||||||||||||||||||||||||||||||||||||||||||||
|---|---|---|---|---|---|---|---|---|---|---|---|---|---|---|---|---|---|---|---|---|---|---|---|---|---|---|---|---|---|---|---|---|---|---|---|---|---|---|---|---|---|---|---|---|---|---|---|---|---|---|---|---|---|
| Amount | % of Total | Weighted Average Rate | Amount | % of Total | Weighted Average Rate | ||||||||||||||||||||||||||||||||||||||||||||||||
| (Dollars in thousands) | |||||||||||||||||||||||||||||||||||||||||||||||||||||
| Commercial checking | $ | 300,624 | 4 | .4% | — | $ | 258,632 | 4 | .2% | — | |||||||||||||||||||||||||||||||||||||||||||
| Non-interest bearing | |||||||||||||||||||||||||||||||||||||||||||||||||||||
| checking | 303,480 | 4 | .3 | — | 291,462 | 4 | .7 | — | |||||||||||||||||||||||||||||||||||||||||||||
| Interest bearing | |||||||||||||||||||||||||||||||||||||||||||||||||||||
| checking | 739,149 | 10 | .5 | 1 | .03 | 816,387 | 13 | .2 | .98 | ||||||||||||||||||||||||||||||||||||||||||||
| Commercial money markets | 105,783 | 1 | .5 | 4 | .03 | 60,064 | 1 | .0 | 3 | .07 | |||||||||||||||||||||||||||||||||||||||||||
| Money markets | 900,959 | 12 | .8 | 3 | .84 | 615,280 | 9 | .9 | 2 | .34 | |||||||||||||||||||||||||||||||||||||||||||
| Passbooks | 1,113,980 | 15 | .9 | 0 | .71 | 1,268,680 | 20 | .4 | .60 | ||||||||||||||||||||||||||||||||||||||||||||
| 3,463,975 | 49 | .4 | 1 | .57 | 3,310,505 | 53 | .4 | .96 | |||||||||||||||||||||||||||||||||||||||||||||
| Certificate accounts: | |||||||||||||||||||||||||||||||||||||||||||||||||||||
| Up to 2.99% | 52,119 | 0 | .7 | 2 | .69 | 491,212 | 7 | .9 | 2 | .74 | |||||||||||||||||||||||||||||||||||||||||||
| 3.00% to 3.99% | 406,470 | 5 | .8 | 3 | .60 | 1,505,743 | 24 | .3 | 3 | .54 | |||||||||||||||||||||||||||||||||||||||||||
| 4.00% to 4.99% | 1,377,666 | 19 | .6 | 4 | .51 | 852,544 | 13 | .8 | 4 | .31 | |||||||||||||||||||||||||||||||||||||||||||
| 5.00% and greater | 1,718,062 | 24 | .5 | 5 | .22 | 36,499 | 0 | .6 | 5 | .46 | |||||||||||||||||||||||||||||||||||||||||||
| 3,554,317 | 50 | .6 | 4 | .72 | 2,885,998 | 46 | .6 | 3 | .65 | ||||||||||||||||||||||||||||||||||||||||||||
| Unamortized | |||||||||||||||||||||||||||||||||||||||||||||||||||||
| premium(discount) | (282 | ) | — | — | 1,000 | — | — | ||||||||||||||||||||||||||||||||||||||||||||||
| Total deposits | $ | 7,018,010 | 100 | .0% | 3 | .17 | $ | 6,197,503 | 100 | .0% | 2 | .22 | |||||||||||||||||||||||||||||||||||||||||
The aggregate amount of certificates of deposit with denominations of $100,000 or greater was $1.04 billion and $751.1 million at December 31, 2006 and 2005, respectively.
Scheduled maturities of certificate accounts at December 31, 2006 are as follows (in thousands):
| 12 months or less | $ | 2,784,636 | |||
| 13 to 24 months | 627,211 | ||||
| 25 to 36 months | 85,963 | ||||
| Over 36 months | 56,507 | ||||
| $ | 3,554,317 | ||||
Interest expense on deposit accounts is summarized as follows for the periods indicated:
| Year Ended December 31, | |||||||||||||||||
|---|---|---|---|---|---|---|---|---|---|---|---|---|---|---|---|---|---|
| 2006 | 2005 | 2004 | |||||||||||||||
| (Dollars in thousands) | |||||||||||||||||
| Interest-bearing checking | $ | 8,071 | 8,041 | 6,960 | |||||||||||||
| Money markets | 24,733 | 13,438 | 6,099 | ||||||||||||||
| Passbooks | 8,518 | 7,800 | 7,970 | ||||||||||||||
| Certificates | 144,383 | 79,095 | 52,843 | ||||||||||||||
| $ | 185,705 | 108,374 | 73,872 | ||||||||||||||
At December 31, 2006, U.S. Treasury Notes, Freddie Mac and Fannie Mae mortgage-backed securities, as well as mortgage loans with an aggregate carrying value of $136.8 million and fair value of $136.4 million, were pledged as collateral for certain certificate accounts.
81
MAF Bancorp, Inc. and Subsidiaries
Notes to Consolidated Financial Statements - (Continued)
11. Borrowed Funds
The following table is a summary of the Company’s borrowed funds at December 31, 2006 and 2005. The weighted average rates are contractual rates and are not adjusted for the effect of purchase accounting adjustments.
| At December 31, 2006 | At December 31, 2005 | ||||||||||||||||||||||||||||||||||
|---|---|---|---|---|---|---|---|---|---|---|---|---|---|---|---|---|---|---|---|---|---|---|---|---|---|---|---|---|---|---|---|---|---|---|---|
| Interest Rate Range | Weighted Average Rate | Amount | Weighted Average Rate | Amount | |||||||||||||||||||||||||||||||
| (Dollars in thousands) | |||||||||||||||||||||||||||||||||||
| Fixed-rate advances from FHLBC | |||||||||||||||||||||||||||||||||||
| due: | |||||||||||||||||||||||||||||||||||
| Within 1 year | 2.76 - 5.14% | 4 | .21$ | 945,000 | 3 | .48% | $ | 510,000 | |||||||||||||||||||||||||||
| 1 to 2 years | 2.78 - 5.24 | 4 | .44 | 564,000 | 4 | .19 | 767,000 | ||||||||||||||||||||||||||||
| 2 to 3 years | 3.53 - 4.85 | 4 | .52 | 36,000 | 4 | .70 | 713,000 | ||||||||||||||||||||||||||||
| 3 to 4 years | 4.28 - 4.28 | 4 | .28 | 50,000 | 5 | .43 | 76,000 | ||||||||||||||||||||||||||||
| 4 to 5 years | 4.36 - 4.36 | 4 | .36 | 10,000 | 3 | .85 | 155,000 | ||||||||||||||||||||||||||||
| Total fixed-rate advances | 2.76 - 5.24 | 4 | .30 | 1,605,000 | 4 | .21 | 2,221,000 | ||||||||||||||||||||||||||||
| Adjustable-rate advances from | |||||||||||||||||||||||||||||||||||
| FHLBC due: | |||||||||||||||||||||||||||||||||||
| Within 1 year | 5.29 - 5.52 | 5 | .33 | 550,000 | 4 | .44 | 150,000 | ||||||||||||||||||||||||||||
| 1 to 2 years | — | — | — | 4 | .39 | 100,000 | |||||||||||||||||||||||||||||
| Total adjustable-rate | |||||||||||||||||||||||||||||||||||
| advances | 5.29 - 5.52 | 5 | .33 | 550,000 | 4 | .42 | 250,000 | ||||||||||||||||||||||||||||
| Total advances from FHLBC | 2.76 - 5.52% | 4 | .56 | 2,155,000 | 4 | .23 | 2,471,000 | ||||||||||||||||||||||||||||
| Unsecured term bank loan | 6 | .32 | 147,500 | 5 | .14 | 63,000 | |||||||||||||||||||||||||||||
| Other borrowings | 4 | .91 | 470,750 | 4 | .20 | 523,379 | |||||||||||||||||||||||||||||
| Unamortized premium(discount) | — | (58 | ) | — | 290 | ||||||||||||||||||||||||||||||
| Total borrowed funds | 4 | .71% | $ | 2,773,192 | 4 | .24% | $ | 3,057,669 | |||||||||||||||||||||||||||
Federal Home Loan Bank of Chicago Advances. The Bank has adopted a collateral pledge agreement whereby the Bank has agreed to at all times keep on hand, free of all other pledges, liens, and encumbrances, first mortgages with unpaid principal balances aggregating no less than 150% of the outstanding secured advances from the Federal Home Loan Bank of Chicago (“FHLBC”). All stock in the FHLBC is pledged as additional collateral for these advances. At December 31, 2006, no other securities were pledged for these borrowings.
Included in FHLBC advances at December 31, 2006 are $40.0 million of fixed-rate advances with original scheduled maturities of 10 years, with interest rates ranging from 5.12% to 5.24% which are putable at the discretion of the FHLBC within the next twelve months. At inception, the Bank receives a lower cost of borrowing on such advances than on similar termed non-putable advances, in return for granting the FHLBC the option to put the advances back to the Bank prior to their final maturity. At
December 31, 2006, the Bank had $100 million of adjustable rate advances indexed at the Prime rate ranging from Prime minus 280 basis points to 287 basis points, a $50.0 million adjustable-rate advance that is indexed at three-month London interbank offering rate (“LIBOR”) minus 6 basis points and $400.0 million of a short term advance at a FHLBC effective federal funds rate minus 3 basis points, which was 5.29% at December 31, 2006. This last borrowing was funded in late December as part of the balance sheet restructuring transaction and was repaid in January 2007 with the proceeds from the sale of investments and mortgage-backed securities. The table above shows all advances at their final contractual maturity.
Unsecured Term Bank Loan. At December 31, 2006, the Company has an unsecured term loan with a final maturity of December 31, 2015. The loan agreement provides for an interest rate of one, two, three, six or twelve-month LIBOR plus 95 basis points at the option of the Company at each reprice date. At December 31, 2006, the weighted average interest rate was 6.32%. The next scheduled principal payment of $12.5 million is due on December 31, 2007. Prepayments of principal are allowed without penalty at the end of any repricing period. At December 31, 2006 and 2005, the balance of the unsecured term loan was $147.5 million and $63.0 million, respectively.
Unsecured Line of Credit. In conjunction with the term bank loan, the Company also maintains a $60.0 million one-year unsecured revolving line of credit, which was renewed until June 30, 2007. There was no balance drawn at December 31, 2006 and December 31, 2005.
82
MAF Bancorp, Inc. and Subsidiaries
Notes to Consolidated Financial Statements - (Continued)
The term bank loan and line of credit agreements contain covenants that, among other things, require the Company to maintain a minimum stockholders’ equity balance and to obtain certain minimum operating results, as well as requiring the Bank to maintain “well capitalized” regulatory capital levels and certain non-performing asset ratios. In addition, the Company has agreed to certain restrictions on additional indebtedness and agreed not to pledge any stock of the Bank or MAF Developments for any purpose. At December 31, 2006, the Company was in compliance with these covenants after giving effect to the waiver obtained from the lenders with respect to the net income impact of the balance sheet restructuring.
Reverse Repurchase Agreements. The Bank enters into sales of securities under agreements to repurchase the identical securities (“reverse repurchase agreements”) with nationally recognized primary securities dealers and are treated as financings. The securities underlying the agreements are delivered to the dealers who arrange the transaction and are reflected as assets. The usual terms of agreements require the seller, generally after a short period of time, to repurchase the same securities at a predetermined price or yield. The following table presents certain information regarding reverse repurchase agreements as of and for the periods indicated:
| Year Ended December 31, | |||||||||||||||||
|---|---|---|---|---|---|---|---|---|---|---|---|---|---|---|---|---|---|
| 2006 | 2005 | 2004 | |||||||||||||||
| (Dollars in thousands) | |||||||||||||||||
| Balance at end of period | $ | 400,000 | 500,000 | 300,000 | |||||||||||||
| Maximum month-end balance | 550,000 | 500,000 | 300,000 | ||||||||||||||
| Average balance | 442,260 | 394,931 | 195,492 | ||||||||||||||
| Weighted average rate at end of | |||||||||||||||||
| period | 4.94 | % | 4.24 | 2.42 | |||||||||||||
| Weighted average rate on average | |||||||||||||||||
| balance | 4.67 | 3.41 | 1.69 | ||||||||||||||
At December 31, 2006, reverse repurchase agreements totaled $400 million of which $300 million are adjustable-rate and $100 million are fixed-rate. The adjustable rate agreements have remaining terms to maturity ranging from 3 months to 4 years. The interest rate on $75.0 million of adjustable rate agreements is tied to the Prime rate and ranges from Prime minus 280 basis points to Prime minus 284 basis points. The remaining $225.0 million have interest rates ranging from three-month LIBOR minus 26 basis points to three-month LIBOR minus 58.5 basis points. The LIBOR-based repurchase agreements are putable at the discretion of the lender quarterly starting in 2007. The rates on the putable fixed rate repurchase agreements range from 4.31% to 4.65%, and these agreements are putable at discretion of the lender quarterly at various dates in 2007 and 2008. The remaining terms on the fixed-rate agreements range from 4 years to 8 years. At December 31, 2006, reverse repurchase agreements were collateralized by investment and CMO securities with a carrying value of $429.7 million and fair value of $425.8 million. Securities sold under agreements to repurchase were delivered for escrow to the broker-dealer who arranged the transactions.
Scheduled principal repayments on our long-term debt obligations including FHLBC advances, reverse repurchase agreements and the unsecured term bank loan are as follows as of December 31, 2006 (in thousands):
| FHLBC Advances | Reverse Repurchase Agreements | Unsecured Term Bank Loan | Total | |||||||||||
|---|---|---|---|---|---|---|---|---|---|---|---|---|---|---|
| 2007 | $ | 1,495,000 | 25,000 | 12,500 | 1,532,500 | |||||||||
| 2008 | 564,000 | 50,000 | 13,000 | 627,000 | ||||||||||
| 2009 | 36,000 | 50,000 | 15,000 | 101,000 | ||||||||||
| 2010 | 50,000 | 175,000 | 16,000 | 241,000 | ||||||||||
| 2011 | �� | 10,000 | 50,000 | 17,000 | 77,000 | |||||||||
| 2012 and | ||||||||||||||
| thereafter | — | 50,000 | 74,000 | 124,000 | ||||||||||
| $ | 2,155,000 | 400,000 | 147,500 | 2,702,500 | ||||||||||
Retail repurchase agreements. For certain customers with significant funds available for deposit at the Bank, the Bank offers “retail” repurchase agreements under which the Bank collateralizes its obligation to repay the customer funds with U.S. government or agency securities. The retail
83
MAF Bancorp, Inc. and Subsidiaries
Notes to Consolidated Financial Statements - (Continued)
repurchases, which totaled $69.8 million at December 31, 2006, are collateralized by U.S. government agency and CMO securities with a carrying value and fair value of $74.7 million.
Interest expense on borrowed funds is summarized as follows for the periods indicated:
| Year Ended December 31, | |||||||||||||||||
|---|---|---|---|---|---|---|---|---|---|---|---|---|---|---|---|---|---|
| 2006 | 2005 | 2004 | |||||||||||||||
| (Dollars in thousands) | |||||||||||||||||
| FHLB of Chicago advances | $ | 113,355 | 85,870 | 80,587 | |||||||||||||
| Reverse repurchase agreements | 21,457 | 13,540 | 3,709 | ||||||||||||||
| Unsecured term bank loan | 7,954 | 3,167 | 1,312 | ||||||||||||||
| Unsecured line of credit | 994 | 602 | 144 | ||||||||||||||
| Other borrowings | 1,599 | 352 | 261 | ||||||||||||||
| $ | 145,359 | 103,531 | 86,013 | ||||||||||||||
12. Junior Subordinated Debentures
The following table summarizes the amount of junior subordinated debentures issued by the Company to MAF Bancorp Capital Trust I and MAF Bancorp Capital Trust II as of December 31, 2006:
| At December 31, 2006 | ||||||||||||||||||||
|---|---|---|---|---|---|---|---|---|---|---|---|---|---|---|---|---|---|---|---|---|
| Trust Name | Issuance Date | Balance | Rate | Pricing | Maturity Date | Call Date | ||||||||||||||
| MAF Bancorp Capital Trust I | April 15, 2005 | $ | 30,928 | 7 | .11% | 3-month LIBOR plus 1.75% | June 2035 | June 2010 | ||||||||||||
| MAF Bancorp Capital Trust II | August 4, 2005 | 36,083 | 6 | .76 | 3-month LIBOR plus 1.40% | September 2035 | August 2010 | |||||||||||||
| $ | 67,011 | |||||||||||||||||||
During 2005, the Company formed MAF Bancorp Capital Trust I and MAF Bancorp Capital Trust II (the “Trusts”) as special purpose finance subsidiaries. The Trusts have issued $65.0 million in trust preferred securities. The proceeds from the sale of the preferred securities, along with $2.0 million received from the Company’s purchase of the common equity securities of the Trusts, were invested in junior subordinated debentures of the Company. The sole assets of the Trusts are the junior subordinated debentures. The Trusts are unconsolidated subsidiaries in accordance with the guidance from the Financial Accounting Standards Board (“FASB”) Interpretation No. 46 Revised, “Consolidation of Variable Interest Entities: (“FIN 46R”). The total balance of the junior subordinated debentures issued to the Trusts is recorded as a liability. Interest expense on the junior subordinated debentures is recorded in interest expense in the consolidated statement of operations.
13. Derivative Financial Instruments
The Bank enters into forward commitments to sell mortgage loans for future delivery as a means of limiting exposure to changing interest rates between the date a loan customer commits to a given rate, or closes the loan, whichever is sooner, and the sale date, which is generally 10 to 60 days after the closing date. These commitments to sell require the Bank to deliver mortgage loans at stated coupon rates within the specified forward sale period, and subject the Bank to risk to the extent the loans do not close. The Bank attempts to mitigate this risk by collecting a non-refundable commitment fee, when possible, and by estimating a percentage of fallout when determining the amount of forward commitments to sell. The following is a summary of the Bank’s forward sales commitment activity for the periods indicated:
| Year Ended December 31, | |||||||||||||||||
|---|---|---|---|---|---|---|---|---|---|---|---|---|---|---|---|---|---|
| 2006 | 2005 | 2004 | |||||||||||||||
| (Dollars in thousands) | |||||||||||||||||
| Balance at beginning of year | $ | 74,180 | 73,761 | 66,433 | |||||||||||||
| New forward commitments to deliver | |||||||||||||||||
| loans | 1,313,713 | 863,417 | 1,174,197 | ||||||||||||||
| Loans delivered to satisfy forward | |||||||||||||||||
| commitments | (1,278,627 | ) | (862,998 | ) | (1,166,869 | ) | |||||||||||
| Balance at end of year | $ | 109,266 | 74,180 | 73,761 | |||||||||||||
84
MAF Bancorp, Inc. and Subsidiaries
Notes to Consolidated Financial Statements - (Continued)
Loan commitments and forward sales are accounted for as derivative instruments with adjustments included in gain on sale of mortgage loans. At December 31, 2006 and 2005, the net fair value adjustment of locked commitments and forward sales was ($171,000) and ($382,000), respectively.
14. Income Taxes
Income tax expenses is summarized below:
| Year Ended December 31, | |||||||||||||||||
|---|---|---|---|---|---|---|---|---|---|---|---|---|---|---|---|---|---|
| 2006 | 2005 | 2004 | |||||||||||||||
| (Dollars in thousands) | |||||||||||||||||
| Current: | |||||||||||||||||
| Federal | $ | 50,254 | 48,600 | 42,022 | |||||||||||||
| State | 12,176 | 6,064 | 1,299 | ||||||||||||||
| 62,430 | 54,664 | 43,321 | |||||||||||||||
| Deferred: | |||||||||||||||||
| Federal | (12,269 | ) | (797 | ) | 5,609 | ||||||||||||
| State | (1,167 | ) | 661 | 1,859 | |||||||||||||
| (13,436 | ) | (136 | ) | 7,468 | |||||||||||||
| Total income tax | |||||||||||||||||
| expense | $ | 48,994 | 54,528 | 50,789 | |||||||||||||
Retained earnings at December 31, 2006 include $95.0 million of tax bad debt reserves for which no provision for income taxes has been made. This amount represents earnings legally appropriated to bad debt reserves and deducted for federal income tax purposes and is generally not available for payment of cash dividends by the Bank or other distributions to shareholders of the Bank. If in the future this amount or a portion thereof, is used for certain purposes other than to absorb losses on bad debts, an income tax liability will be imposed on the amount so used at the then current corporate income tax rate. If deferred taxes were required to be provided on this item, the amount of this deferred tax liability would be approximately $37.3 million.
The reasons for the differences between the effective income tax rate and the corporate federal income tax rate are summarized in the following table:
| Percentage of Income Before Income Taxes | ||||||||||||||
|---|---|---|---|---|---|---|---|---|---|---|---|---|---|---|
| Year Ended December 31, | ||||||||||||||
| 2006 | 2005 | 2004 | ||||||||||||
| Federal income tax rate | 35 | .0% | 35 | .0 | 35 | .0 | ||||||||
| Items affecting effective income | ||||||||||||||
| tax rate: | ||||||||||||||
| State income taxes, net of | ||||||||||||||
| federal benefit | 5 | .6 | 2 | .8 | 1 | .4 | ||||||||
| Bank-owned life insurance | (1 | .8) | (1 | .1) | (0 | .7) | ||||||||
| Affordable housing tax credits | (1 | .9) | (1 | .9) | (2 | .0) | ||||||||
| Other items, net | (0 | .2) | (0 | .3) | (0 | .4) | ||||||||
| Effective income tax rate | 36 | .7% | 34 | .5 | 33 | .3 | ||||||||
The higher effective income tax rate for 2006 primarily results from adjustments to tax reserves for uncertainties associated with the Company’s real estate investment trust (REIT) subsidiary, which the Company has had in place since 1999. As part of its audit of state income tax returns for 1999 to 2001, the Illinois Department of Revenue (“IDR”) issued a proposed adjustment in January 2007 that reflected the disallowance of the REIT dividends paid deduction for the years under examination.The Company believes it has established adequate reserves to cover its tax liabilities, including these state income tax uncertainties. The Company disagrees with the proposed IDR adjustment and intends to defend its tax filing positions.
85
MAF Bancorp, Inc. and Subsidiaries
Notes to Consolidated Financial Statements - (Continued)
The tax effects of temporary differences that give rise to significant portions of the deferred tax assets and deferred tax liabilities at December 31, 2006 and 2005 are presented below:
| December 31, | ||||||||||||||
|---|---|---|---|---|---|---|---|---|---|---|---|---|---|---|
| 2006 | 2005 | |||||||||||||
| (Dollars in thousands) | ||||||||||||||
| Deferred tax assets: | ||||||||||||||
| Deferred compensation | $ | 11,629 | 10,954 | |||||||||||
| Allowance for loan losses | 15,725 | 14,263 | ||||||||||||
| Unrealized loss on securities available | ||||||||||||||
| for sale | 5,154 | 12,259 | ||||||||||||
| Book versus tax basis of securities | 3,165 | — | ||||||||||||
| Book versus tax basis of loans receivable | 2,713 | — | ||||||||||||
| Book versus tax basis of deposits | — | 389 | ||||||||||||
| State net operating losses | 2,997 | 2,272 | ||||||||||||
| Other | 3,895 | 2,060 | ||||||||||||
| Total deferred tax assets | 45,278 | 42,197 | ||||||||||||
| Valuation allowance | (3,244 | ) | (1,872 | ) | ||||||||||
| Total deferred tax assets net of | ||||||||||||||
| valuation allowance | 42,034 | 40,325 | ||||||||||||
| Deferred tax liabilities: | ||||||||||||||
| REIT dividends | (704 | ) | (163 | ) | ||||||||||
| Loan origination fees and expenses | (5,993 | ) | (6,898 | ) | ||||||||||
| Book versus tax basis of land and fixed | ||||||||||||||
| assets | (17,313 | ) | (16,817 | ) | ||||||||||
| Book versus tax basis of capitalized | ||||||||||||||
| servicing | (6,505 | ) | (7,070 | ) | ||||||||||
| Book versus tax basis of intangible assets | (9,274 | ) | (5,234 | ) | ||||||||||
| Book versus tax basis of FHLBC stock | (14,566 | ) | (15,220 | ) | ||||||||||
| Book versus tax basis of loans receivable . | — | (1,046 | ) | |||||||||||
| Book versus tax basis of deposits | (110 | ) | (2,687 | ) | ||||||||||
| Other | (2,008 | ) | (2,179 | ) | ||||||||||
| Total deferred tax liabilities | (56,473 | ) | (57,314 | ) | ||||||||||
| Net deferred tax liability | $ | (14,439 | ) | (16,989 | ) | |||||||||
At December 31, 2006, there are deferred tax assets relating to approximately $60.1 million of various state net operating loss carryforwards, of which $35.6 million relate to pre-acquisition losses of acquired companies. The net operating losses expire during a period that begins in 2007 and ends in 2021. The deferred tax assets associated with the net operating loss carryforwards and certain other deferred deductible items are reduced by a 100% valuation allowance because realization of these tax benefits is in doubt. The increase in the valuation allowance in 2006 primarily relates to net operating losses incurred in 2006 and 2005. If the net operating losses with a related valuation allowance are subsequently utilized, the related recognized tax benefits will be allocated to reduce goodwill to the extent they relate to pre-acquisition net operating losses of acquired companies.
15. Regulatory Capital
The Bank is subject to regulatory capital requirements by the Office of Thrift Supervision (“OTS”). Failure to meet minimum capital requirements can initiate certain mandatory, and possibly additional discretionary actions by regulators, which could have a material impact on the Bank’s financial statements. Under capital adequacy guidelines and the regulatory framework for prompt corrective action, the Bank must meet specific capital guidelines that involve quantitative measures of the Bank’s assets, liabilities, and certain off-balance sheet items as calculated under regulatory accounting practices.
Quantitative measures established by the OTS to ensure capital adequacy require the Bank to maintain minimum amounts and ratios (as set forth in the table below) of three capital requirements: a tangible capital (as defined in the regulations) to adjusted total assets ratio, a core capital (as defined) to adjusted total assets ratio, and a risk-based capital (as defined) to total risk-weighted assets ratio. The Bank met all capital adequacy requirements to which it is subject as of December 31, 2006 and 2005.
86
MAF Bancorp, Inc. and Subsidiaries
Notes to Consolidated Financial Statements - (Continued)
The Bank’s actual capital amounts and ratios, as well as minimum amounts and ratios required for capital adequacy and prompt corrective action provisions are presented below:
| Actual | For Capital Adequacy Purposes | To Be Well Capitalized Under Prompt Corrective Action Provisions | |||||||||||||||||||||||||||||||||||||||
|---|---|---|---|---|---|---|---|---|---|---|---|---|---|---|---|---|---|---|---|---|---|---|---|---|---|---|---|---|---|---|---|---|---|---|---|---|---|---|---|---|---|
| Amount | Ratio | Amount | Ratio | Amount | Ratio | ||||||||||||||||||||||||||||||||||||
| (Dollars in thousands) | |||||||||||||||||||||||||||||||||||||||||
| As of December 31, 2006: | |||||||||||||||||||||||||||||||||||||||||
| Tangible capital (to total assets) | $ | 789,888 | 7 | .44% | >$ 159,286 | >1.50% | N/A | N/A | |||||||||||||||||||||||||||||||||
| Core capital (to total assets) | 789,888 | 7 | .44 | > 424,763 | >4.00 | >$530,954 | >5.00% | ||||||||||||||||||||||||||||||||||
| Total capital (to risk-weighted assets) | 804,554 | 11 | .01 | > 584,478 | >8.00 | >730,597 | >10.00 | ||||||||||||||||||||||||||||||||||
| Core capital (to risk-weighted assets) | 789,888 | 10 | .81 | N/A | N/A | >438,358 | >6.00 | ||||||||||||||||||||||||||||||||||
| As of December 31, 2005: | |||||||||||||||||||||||||||||||||||||||||
| Tangible capital (to total assets) | 715,105 | 7 | .07 | > 151,807 | >1.50 | N/A | N/A | ||||||||||||||||||||||||||||||||||
| Core capital (to total assets) | 715,105 | 7 | .07 | > 404,818 | >4.00 | >506,023 | >5.00 | ||||||||||||||||||||||||||||||||||
| Total capital (to risk-weighted assets) | 735,996 | 11 | .15 | > 528,112 | >8.00 | >660,140 | >10.00 | ||||||||||||||||||||||||||||||||||
| Core capital (to risk-weighted assets) | 715,105 | 10 | .83 | N/A | N/A | >396,084 | >6.00 | ||||||||||||||||||||||||||||||||||
OTS regulations provide various standards under which the Bank may declare and pay dividends to the Company. During 2007, the amount of dividends the Bank can pay to the Company without prior approval of the OTS is limited to 2007 eligible net profits, as defined, and adjusted retained 2006 and 2005 net income from the Bank and its subsidiaries. At December 31, 2006 under current OTS regulations, the Bank has $13.3 million of retained earnings available for dividend declarations.
As of December 31, 2006 and 2005, the Bank was categorized as well capitalized under the regulatory framework for prompt corrective action. To be categorized as well capitalized, the Bank must maintain a minimum core capital to adjusted total assets, risk-based capital to adjusted risk-weighted assets, and core capital to adjusted risk-weighted assets ratios as set forth in the table above.
16. Officer, Director and Employee Benefit Plans
Employee Stock Ownership Plan (ESOP). The Mid America Bank, fsb ESOP covers substantially all employees who met minimum service requirements and who have attained the age of 21. Contributions to the ESOP by the Bank are currently made to purchase additional common shares of the Company’s stock. For the years ended December 31, 2006, 2005 and 2004, total contributions to the ESOP were $670,000, $720,000, and $680,000, respectively, which were expensed. The ESOP purchased 14,647, 16,650 and 16,237 of the Company’s shares for the years ended December 31, 2006, 2005 and 2004 respectively.
Profit Sharing Plan/401(k) Plan. The Mid America Bank, fsb Profit Sharing/401(k) Plan allows employees to make pre-tax or after-tax contributions to the plan, subject to certain limitations. The Bank matches the pre-tax contributions of employees at a rate equal to 35%, up to a $1,200 maximum matching contribution per employee. The Bank, at its discretion, may make additional contributions to the plan. Employees’ contributions vest immediately while the Bank’s contributions vest gradually over a six-year period based on an employee’s years of service. The Bank made discretionary and matching contributions to the plan of $2.7 million, $2.9 million and $2.7 million for the years ended December 31, 2006, 2005, and 2004, respectively.
Qualified Retirement Plans of Acquired Companies. As a result of the merger with EFC Bancorp Inc. in 2006, the Company, through Mid America Bank, became the plan sponsor of the Elgin Financial Center, S.B. ESOP and the Elgin Financial Center, S.B. 401(k) Plan. The Elgin ESOP and 401(k) plans were merged into the Mid America Profit Sharing Plan, in 2006.
As a result of the merger with Fidelity Bancorp in 2003, the Company, through Mid America Bank, became the plan sponsor of the Fidelity Retirement Plan. The plan has been terminated and distributions totaling $976,000 were made to plan participants during 2005. The Company did not record any contribution expense for this plan during 2005 or 2004.
87
MAF Bancorp, Inc. and Subsidiaries
Notes to Consolidated Financial Statements - (Continued)
As a result of the merger with Chesterfield Financial Corp. in 2004, the Company, through Mid America Bank, became the plan sponsor of the Chesterfield ESOP and the Chesterfield Profit Sharing Plan. The Chesterfield ESOP has been terminated and distributions totaling $5.5 million were made to plan participants during 2005. The Chesterfield Profit Sharing Plan has been terminated and distributions were made to plan participants during 2006. The Company did not record any contribution expense for these plans during 2006, 2005 or 2004.
As a result of the merger with St. Francis Capital Corporation during 2003, the Company, through Mid America Bank, became the plan sponsor of the St. Francis ESOP and the St. Francis Savings and Retirement Plan. The St. Francis ESOP and St. Francis Savings and Retirement Plan were merged into the Mid America ESOP and Mid America Profit Sharing Plan, respectively, during 2004.
Incentive Plan/Stock Option Plans. Prior to January 1, 2006, the Company elected to apply Accounting Principles Board, or APB, No. 25 and related interpretations under SFAS No. 123 “Accounting for Stock-Based Compensation” and SFAS No. 148 “Accounting for Stock-Based Compensation – Transition and Disclosure.” Pursuant to the guidance in these pronouncements, we did not record compensation expense under our plans related to stock options.
On January 1, 2006, the Company adopted Statement of Financial Accounting Standards, or SFAS, No. 123R, “Share-Based Payments.” SFAS No. 123R requires the recognition of compensation expense in an amount equal to the fair value of all share-based payments. The Company elected to apply SFAS 123R on a modified prospective method, which requires the Company to record compensation expense for options granted on or after January 1, 2006 and over the remaining vesting period for previous awards that were partially unvested as of the date of adoption of SFAS No. 123R. Also, under the modified prospective method, the financial statements for prior periods do not reflect any adjusted amounts. The Company utilized the Black-Scholes option-pricing model to determine the grant date value of stock options.
Had the Company elected to record compensation expense for stock option grants based on the fair value at the grant dates for stock option awards under those plans consistent with the method of SFAS No. 148, the Company’s net income and earnings per share would have been reduced to the pro-forma amounts indicated in the table below:
>| Year Ended December 31, | |||||||||||
|---|---|---|---|---|---|---|---|---|---|---|---|
| 2005 | 2004 | ||||||||||
| Net income | |||||||||||
| As reported | $ | 103,353 | 101,522 | ||||||||
| Add: Stock based employee compensation expense included in reported net | |||||||||||
| income, net of tax effects | 210 | 123 | |||||||||
| Deduct: total stock option employee compensation expense determined using | |||||||||||
| Black-Scholes method for all awards, net of related tax effects | (4,636 | ) | (6,928 | ) | |||||||
| Pro-forma | $ | 98,927 | 94,717 | ||||||||
| Basic earnings per share | |||||||||||
| As reported | $ | 3.20 | 3.09 | ||||||||
| Pro-forma | 3.06 | 2.88 | |||||||||
| Diluted earnings per share | |||||||||||
| As reported | 3.13 | 3.01 | |||||||||
| Pro-forma | $ | 3.06 | 2.88 | ||||||||
The fair value of each option grant was estimated using the Black-Scholes option-pricing model with the following weighted-average assumptions used for grants during the years ended December 31, 2005 and 2004: dividend yield of 2.05% and 1.88%; expected volatility of 24.67% and 25.91%; risk-free interest rates of 4.42% and 4.20%; expected life of 7.5 years for each period.
The MAF Bancorp Incentive Compensation Plan, or the Incentive Plan, was adopted in July 2003. Under the Incentive Plan, a variety of different types of awards may be granted to directors and employees, including stock options, stock appreciation rights, restricted shares, performance shares, restricted and performance share units, cash awards, awards under deferred compensation or similar plans, and other incentive awards. Stock options have also been granted to employees and directors under prior stock option plans. Our shareholders have approved all stock incentive plans. We generally issue treasury shares to satisfy stock option exercises and upon vesting of RSUs, as available.
88
MAF Bancorp, Inc. and Subsidiaries
Notes to Consolidated Financial Statements — (Continued)
The plan provides that the total number of shares of common stock which may be issued pursuant to awards under the plan may not exceed 800,000 shares, plus such number of shares of common stock that have already been authorized and previously approved by the Company’s shareholders and are available for issuance under the Company’s 2000 Stock Option Plan.
Of the shares authorized for issuance under the Incentive Plan, up to 25% may be issued with respect to awards of restricted stock and restricted stock units. In the case of stock option awards, the option exercise price must be at least 100% of the fair market value of the common stock on the date of grant, and the option term cannot exceed 10 years. Vesting periods are determined at the discretion of the Company’s Compensation Committee. For the initial stock options awards granted under the Incentive Plan in 2003, the vesting period was established as two years. The stock options awarded during 2005 and 2004 were immediately vested on the date of grant.
All current outstanding stock options have been granted at an exercise price equal to or greater than the fair market value of the underlying common stock at the date of grant, and may be exercisable for up to 10 years. We recorded expense for the year ended December 31, 2006 of $6,312 related to 500 options that became fully vested in December 2006. We did not grant any stock options in 2006. In 2005 and 2004, stock options granted were immediately vested and no associated compensation expense has been recorded for such options in 2006, 2005 or 2004.
In conjunction with the Company’s acquisitions, certain outstanding stock options of the acquired institutions were converted into stock options of the Company based on the transactions’ exchange ratios and other terms of the merger agreements. The value of these stock options was included in the purchase price of the transactions, and therefore no compensation expense was recorded for such options in 2006, 2005 or 2004.
| Year Ended December 31, | |||||||||||||||||||||||||||||||||||||||||
|---|---|---|---|---|---|---|---|---|---|---|---|---|---|---|---|---|---|---|---|---|---|---|---|---|---|---|---|---|---|---|---|---|---|---|---|---|---|---|---|---|---|
| 2006 | 2005 | 2004 | |||||||||||||||||||||||||||||||||||||||
| Shares | Average Exercise Price | Shares | Average Exercise Price | Shares | Average Exercise Price | ||||||||||||||||||||||||||||||||||||
| Beginning of year | 3,376,104 | $ | 32 | .75 | 3,307,326 | $ | 30 | .67 | 3,273,345 | $ | 27 | .44 | |||||||||||||||||||||||||||||
| Options granted | — | — | 341,700 | 42 | .50 | 474,500 | 44 | .61 | |||||||||||||||||||||||||||||||||
| Acquiree options converted | 168,690 | 18 | .97 | — | — | — | — | ||||||||||||||||||||||||||||||||||
| Options exercised | (277,297 | ) | 21 | .32 | (255,443 | ) | 19 | .56 | (216,872 | ) | 21 | .21 | |||||||||||||||||||||||||||||
| Converted options exercised | (182,899 | ) | 19 | .11 | (11,979 | ) | 21 | .76 | (208,405 | ) | 21 | .44 | |||||||||||||||||||||||||||||
| Options cancelled | (7,583 | ) | 38 | .96 | (5,500 | ) | 25 | .21 | (15,242 | ) | 32 | .72 | |||||||||||||||||||||||||||||
| End of year | 3,077,015 | $ | 33 | .82 | 3,376,104 | $ | 32 | .75 | 3,307,326 | $ | 30 | .67 | |||||||||||||||||||||||||||||
| Options exercisable | 3,077,015 | $ | 33 | .82 | 3,375,604 | $ | 32 | .75 | 2,992,325 | $ | 30 | .14 | |||||||||||||||||||||||||||||
| Fair value of options granted | |||||||||||||||||||||||||||||||||||||||||
| during year | $ | — | $ | 12 | .07 | $ | 13 | .21 | |||||||||||||||||||||||||||||||||
At December 31, 2006 the following stock options are outstanding:
| Options Outstanding | Options Exercisable | ||||||||||||||||||||||
|---|---|---|---|---|---|---|---|---|---|---|---|---|---|---|---|---|---|---|---|---|---|---|---|
| Range of Exercise Prices | Options Outstanding | Weighted-Average Remaining Life (yrs) | Weighted-Average Exercise Price | Options Exercisable | Weighted-Average Exercise Price | ||||||||||||||||||
| $13.77 to 24.24 | 374,713 | 2.42 | $ | 21 | .87 | 374,713 | $ | 21 | .87 | ||||||||||||||
| 25.22 to 34.11 | 1,486,355 | 4.46 | 29 | .44 | 1,486,355 | 29 | .44 | ||||||||||||||||
| 34.94 to 44.87 | 1,215,947 | 7.65 | 42 | .85 | 1,215,947 | 42 | .85 | ||||||||||||||||
| 3,077,015 | 5.47 | $ | 33 | .82 | 3,077,015 | $ | 33 | .82 | |||||||||||||||
The Company also granted restricted stock units (“RSUs”) to employees pursuant to the Incentive Plan. An RSU award entitles a recipient to receive a like number of shares of MAF Bancorp stock on certain designated vesting dates, assuming the recipient is still employed with the Company on such dates. RSUs granted to employees in 2006 vest ratably over a three-year or five-year period while RSUs granted to directors in 2006 vest over one-year period. RSUs granted in 2005 vest ratably over a three-year period while RSUs granted in 2004 vest on various dates during a period that ends five years from the date of grant. The following is a summary of outstanding RSUs:
89
MAF Bancorp, Inc. and Subsidiaries
Notes to Consolidated Financial Statements - (Continued)
| Year Ended December 31, | ||||||||||||||
|---|---|---|---|---|---|---|---|---|---|---|---|---|---|---|
| 2006 | 2005 | 2004 | ||||||||||||
| Beginning of Year | 43,398 | 42,602 | 26,258 | |||||||||||
| RSUs granted | 97,663 | 10,900 | 26,040 | |||||||||||
| RSUs vested | (7,309 | ) | (3,809 | ) | (4,750 | ) | ||||||||
| RSUs cancelled | (4,765 | ) | (6,295 | ) | (4,946 | ) | ||||||||
| End of year | 128,987 | 43,398 | 42,602 | |||||||||||
The Company incurred compensation expense totaling $671,000, $343,000, and $201,000 in 2006, 2005 and 2004, respectively, relating to restricted stock awards. In addition to the outstanding stock options and RSUs shown in the tables above, there were 75,553 shares available for grant under the Incentive Plan as of December 31, 2006. Cancelled stock options and RSUs increase the number of shares available for grant under the Incentive Plan.
Stock Option Gain Deferral Plan. The MAF Bancorp, Inc. Stock Option Gain Deferral Plan (“Gain Deferral Plan”) was adopted during 1999 and terminated in 2005. The Gain Deferral Plan combined traditional deferred compensation arrangements with stock option exercise transactions by allowing designated executive officer participants to defer to a future date, the receipt of shares representing the value of underlying MAF Bancorp stock options. Dividends paid on MAF Bancorp shares deferred through the Gain Deferral Plan were recorded as compensation expense and reinvested in MAF Bancorp shares. The Company’s obligation to issue the deferred MAF Bancorp shares in the future was recorded in stockholders’ equity as the sum of (a) the number of shares purchased with reinvested dividends multiplied by the purchase price of such shares, and (b) the number of shares deferred in option exercise transactions multiplied by the exercise price of the related stock options. On February 1, 2005, the Gain Deferral Plan was terminated. The assets of the Plan, which were invested in shares of the Company’s common stock, were distributed in kind to the two Plan participants upon termination.
Deferred Compensation Plans. The Bank maintains deferred compensation plans for directors, executive officers and certain other corporate officers. The deferred compensation plans allow directors to defer all of their director compensation and other participants to defer up to 25% of their salary and certain bonuses. Plan participants have the option to have their deferred amounts earn interest at 110% (130% prior to January 1, 2005) of the Moody’s corporate bond rate or to earn a total return based on an investment in MAF Bancorp common stock. The Bank also offers a deferred compensation plan to other selected employees that has similar terms but provides for a lower interest crediting rate and no stock investment option. In addition, the Bank is the successor to various deferred compensation plans of acquired companies. The Company records compensation expense relating to the interest credited on deferred compensation balances. Amounts deferred remain the property of the Bank.
The Company invests in bank-owned life insurance that may be used to satisfy obligations of the deferred compensation plans, including certain death benefits. At December 31, 2006, and 2005 the Company had an aggregate liability to the participants of the deferred compensation plans totaling $18.7 million and $17.7 million, respectively, including the value of common stock attributable to participants’ accounts based on the fair market value of the common stock at the time of deferral. For the years ended December 31, 2006, 2005 and 2004, benefit expenses related to these plans were $1.1 million, $1.2 million and $1.1 million, respectively.
Post Retirement Benefits. The Bank sponsors a supplemental executive retirement plan (“SERP”) for the purpose of providing certain retirement benefits to executive officers and other corporate officers approved by the board of directors. The annual retirement plan benefit under the SERP is calculated equal to 2% of final average salary times the years of service after 1994, or such later date that a participant enters the plan. Up to ten additional years of service are credited to participants in the event of a change in control transaction although in no event may total years of service exceed 20 years. The maximum annual retirement benefit payable is equal to 40% of final average salary. Benefits are payable in various forms in the event of retirement, death, disability and separation from service, subject to certain conditions defined in the plan. The SERP also provides for certain death benefits to the extent
90
MAF Bancorp, Inc. and Subsidiaries
Notes to Consolidated Financial Statements - (Continued)
such amounts exceed a participant’s accrued benefit at the time of death. The plan is unfunded, however, the Company funds life insurance policies that may be used to satisfy obligations of the SERP.
The Bank also provides a long-term medical plan for the purpose of providing employees post- retirement medical benefits. If retirement occurs prior to age 65, but at least age 55 with 10 years of service, the retiree pays 100% of the premium cost of the plan for lifetime. If retirement occurs at 65 or later, the retiree pays the following percentage of premium costs based on service at retirement:
| Years of service | Contribution percentage | ||||
|---|---|---|---|---|---|
| 10-19 | 100 | % | |||
| 20-24 | 90 | ||||
| 25-29 | 75 | ||||
| 30+ | 60 | ||||
The benefits under the retiree benefit plan are not pre-funded and there are no plan assets. Benefits are funded on a pay-as-you-go basis. The Bank’s long-term Medical Plan was amended January 1, 2005, to eliminate the retiree subsidy for all non-retired participants effective January 1, 2006. Employees who retired prior to 2006 are grandfathered under the subsidy provisions.
The prescription contribution paid by Bank employees and directors is not actuarially equivalent to Medicare Part D, as defined by the Medicare Prescription Drug Improvement and Modernization Act of 2003. Therefore, the Bank does not qualify for the government subsidy of 28%.
Members of the board of directors pay a portion of the cost for both pre-65 and post-65 coverage, which the case of pre-65 coverage is comparable to the cost paid by current employees.
The following table sets forth the change in benefit obligations and the related assumptions for the SERP and long-term medical plan for the periods indicated:
| Year Ended December 31, | |||||||||||||||||||||||
|---|---|---|---|---|---|---|---|---|---|---|---|---|---|---|---|---|---|---|---|---|---|---|---|
| SERP | Long-Term Medical | ||||||||||||||||||||||
| 2006 | 2005 | 2006 | 2005 | ||||||||||||||||||||
| (Dollars in thousands) | |||||||||||||||||||||||
| Projected benefit obligation - beginning of year | $ | 7,907 | 6,429 | 474 | 535 | ||||||||||||||||||
| Service cost | 934 | 814 | — | — | |||||||||||||||||||
| Interest cost | 454 | 385 | 25 | 30 | |||||||||||||||||||
| Plan amendments | — | — | — | — | |||||||||||||||||||
| Actuarial losses | (336 | ) | 294 | 15 | (57 | ) | |||||||||||||||||
| Benefits paid | (32 | ) | (15 | ) | (36 | ) | (34 | ) | |||||||||||||||
| Projected benefit obligation - end | |||||||||||||||||||||||
| of year | $ | 8,927 | 7,907 | 478 | 474 | ||||||||||||||||||
| Funded status | $ | (8,927 | ) | (7,907 | ) | (478 | ) | (474 | ) | ||||||||||||||
| Unrecognized transition obligation | — | — | — | — | |||||||||||||||||||
| Unrecognized prior-service cost | — | — | (1,154 | ) | (1,269 | ) | |||||||||||||||||
| Unrecognized loss | 953 | 1,360 | 700 | 743 | |||||||||||||||||||
| Accrued benefit cost | $ | (7,974 | ) | (6,547 | ) | (932 | ) | (1,000 | ) | ||||||||||||||
| Weighted average assumptions: | |||||||||||||||||||||||
| Discount rate | 5.75 | % | 6.00 | 5.50 | 5.75 | ||||||||||||||||||
| Discount rate at the end of the year | 6.00 | 5.75 | 5.75 | 5.50 | |||||||||||||||||||
| Rate of compensation increase | 4.50 | 4.50 | N/A | N/A | |||||||||||||||||||
91
MAF Bancorp, Inc. and Subsidiaries
Notes to Consolidated Financial Statements - (Continued)
SFAS 158, “Employers’ Accounting for Defined Benefit Pension and other Post-retirement Plans,” requires employers to recognize the underfunded or overfunded status of a defined benefit post-retirement plan as an asset or liability in its statement of financial position and to recognize changes in the funded status in the year in which the changes occur through accumulated other comprehensive loss. Additionally, SFAS No. 158 requires employers to measure the funded status of a plan as of the date of its year-end statement of financial position. The incremental effect of applying SFAS No. 158 on our consolidated balance sheet in relationship to the SERP and long-term medical plans were as follows:
| Adjustments | |||||||||||||||||||||||
|---|---|---|---|---|---|---|---|---|---|---|---|---|---|---|---|---|---|---|---|---|---|---|---|
| Before application of SFAS 158 | SERP | Long-Term Medical | After application of SFAS 158 | ||||||||||||||||||||
| (Dollars in thousands) | |||||||||||||||||||||||
| Accrued expenses and other liabilities | $ | 145,526 | 953 | (453 | ) | 146,026 | |||||||||||||||||
| Accumulated other comprehensive loss, net of tax | (8,172 | ) | (579 | ) | 275 | (8,476 | ) | ||||||||||||||||
| Total stockholders' equity | |||||||||||||||||||||||
| 1,072,449 | (579 | ) | 275 | 1,072,145 | |||||||||||||||||||
The components of the net periodic benefit cost of post retirement plans are as follows:
| Year Ended December 31, | |||||||||||||||||||||||
|---|---|---|---|---|---|---|---|---|---|---|---|---|---|---|---|---|---|---|---|---|---|---|---|
| SERP | Long-Term Medical | ||||||||||||||||||||||
| 2006 | 2005 | 2006 | 2005 | ||||||||||||||||||||
| (Dollars in thousands) | |||||||||||||||||||||||
| Service cost | $ | 934 | 814 | — | — | ||||||||||||||||||
| Interest cost | 454 | 385 | 25 | 30 | |||||||||||||||||||
| Amortization of prior-service cost | — | — | (115 | ) | (115 | ) | |||||||||||||||||
| Unrecognized net loss | 71 | 53 | 58 | 46 | |||||||||||||||||||
| Net periodic benefit cost | $ | 1,459 | 1,252 | (32 | ) | (39 | ) | ||||||||||||||||
The projected future benefit payments related to the SERP and long-term medical plan for the next five years and the total payments thereafter are as follows (in thousands):
| For the year ended December 31, | SERP | Long-Term Medical | ||||||
|---|---|---|---|---|---|---|---|---|
| 2007 | $ | 55 | 40 | |||||
| 2008 | 180 | 41 | ||||||
| 2009 | 240 | 43 | ||||||
| 2010 | 410 | 42 | ||||||
| 2011 | 410 | 41 | ||||||
| 2012 - 2016 | 4,200 | 193 | ||||||
17. Commitments and Contingencies
The Bank is a party to various financial instruments with off-balance sheet risk in the normal course of its business. These instruments include commitments to extend credit, standby letters of credit, and forward commitments to sell loans. These financial instruments carry varying degrees of credit and interest-rate risk in excess of amounts recorded in the financial statements. The contractual amounts of credit-related financial instruments, such as commitments to extend credit and letters of credit, represent the amounts of potential loss should the contract be fully drawn upon, the customer default, or the value of any existing collateral become worthless.
Commitments to originate and purchase loans of $487.9 million at December 31, 2006, represent amounts which the Bank plans to fund within the normal commitment period of 30 to 90 days of which $205.1 million were fixed-rate, with rates averaging 6.78%, and $282.8 million were adjustable-rate loans with rates averaging 7.12%. At December 31, 2006, prospective borrowers had locked the interest rate on $36.8 million of fixed-rate loans, with rates averaging 6.72%, and $53.6 million of adjustable-rate loans, with rates averaging 7.05%. At December 31, 2006 the bank also had outstanding commitments to originate $55.9 million of floating-rate equity lines of credit, with rates averaging 8.36%. Because the credit worthiness of each customer is reviewed prior to extension of the commitment, the Bank adequately controls its credit risk on these commitments, as it does for loans recorded on the balance sheet. As part of its effort to control interest-rate risk on these commitments, the Bank generally sells fixed-rate mortgage loan commitments, for future delivery, at a specified price and at a specified future date. Such commitments for future delivery present a risk to the Bank, in the event it cannot deliver the
92
MAF Bancorp, Inc. and Subsidiaries
Notes to Consolidated Financial Statements - (Continued)
loans during the delivery period. This could lead to the Bank being charged a fee for non-performance, or being forced to reprice the mortgage loans at a lower rate, causing a loss to the Bank. The Bank seeks to mitigate this potential loss by charging potential borrowers, when possible, a fee to fix the interest rate. The Bank also estimates a percentage of fallout when determining the amount of forward commitments to enter into. At December 31, 2006, forward commitments to sell mortgage and equity loans for future delivery were $109.3 million, of which $69.2 million are related to loans held for sale, and $40.1 million are unfunded as of December 31, 2006.
The Bank has approved, but unused home equity lines of credit of $1.17 billion at December 31, 2006. Approval of equity lines is based on underwriting standards that generally do not allow total borrowings, including the equity line of credit, to exceed 100% of the current appraised value of the customer’s home, which is similar to guidelines used when the Bank originates first mortgage loans, and are a means of controlling its credit risk on the loan. However, the Bank offers home equity lines of credit up to 100% of the home’s current appraised value, less existing liens, at a commensurately higher interest rate. In addition, the Bank has $643.1 million in approved, but unused commercial business lines.
At December 31, 2006, the Bank had standby letters of credit, excluding land development, totaling $97.1 million, one of which totals $6.5 million to enhance an industrial revenue bond financing of commercial real estate in the Bank’s market. At December 31, 2006, the Bank had pledged investment and mortgage-backed securities with an aggregate carrying value and fair value of $13.1 million and $12.8 million respectively, as collateral for this letter of credit. Standby letters of credit are conditional commitments issued by the Bank to guarantee the performance of a customer to a third party. The credit risk involved in these transactions is essentially the same as that involved in extending a loan to a customer in the normal course of business, as performance under the letters of credit creates a first position lien in favor of the Bank. Additionally, at December 31, 2006, the Company had standby letters of credit totaling $14.0 million, which ensure the completion of land development improvements on behalf of MAF Developments, Inc.
At December 31, 2006, the Bank had $16.8 million of credit risk related to loans sold to the MPF program and $28.6 million of loans sold with recourse to investors. There were no losses incurred in 2006, 2005 or 2004. There are no expected losses and no reported liability at December 31, 2006 and 2005 for such exposure. Additionally the Bank had $17.7 million of credit risk related to loans with private mortgage insurance in force in the Bank’s captive reinsurance subsidiary.
In addition to financial instruments with off-balance sheet risk, the Bank is exposed to varying risks with concentrations of credit. Concentrations of credit include significant lending activities in specific geographical areas and large extensions of credit to single borrowers. The Bank’s loan portfolio primarily consists of loans secured by real estate within its market area. At December 31, 2006 and 2005, loans representing 76.3% and 76.8%, respectively, of the Bank’s total loans receivable were secured by real estate located in the State of Illinois and 20.2% and 19.6% respectively, were secured by real estate located in the State of Wisconsin.
The Company is also subject to various contingent tax liabilities relating to tax positions it takes in the filing of its tax returns that may be disallowed by taxing authorities based on their differing interpretation of applicable tax law. The Company believes it has established adequate reserves for such tax uncertainties.
There are various matters of litigation pending against the Bank that have arisen during the normal course of business. Management believes that the liability, if any, resulting from these matters will not be material to the consolidated financial position or results of operation of the Bank.
18. Segment Information
The Company utilizes the “management approach” for segment reporting. This approach is based on the way that management of the Company organizes lines of business for making operating decisions and assessing performance.
93
MAF Bancorp, Inc. and Subsidiaries
Notes to Consolidated Financial Statements - (Continued)
Currently, the Company has two segments. The Banking segment includes lending and deposit gathering operations, as well as other financial services offered to individuals and business customers. The Real Estate Operations segment consists primarily of acquiring, obtaining necessary zoning and regulatory approvals, and improving raw land into developed residential lots for sale to builders. All goodwill is assigned to the Banking segment. Selected segment information is included in the table below:
| Year Ended December 31, 2006 | ||||||||||||||||||||
|---|---|---|---|---|---|---|---|---|---|---|---|---|---|---|---|---|---|---|---|---|
| Banking | Real Estate Operations | Consolidated Total | ||||||||||||||||||
| (Dollars in thousands) | ||||||||||||||||||||
| Interest income | $ | 595,200 | — | 595,200 | ||||||||||||||||
| Interest expense | 336,300 | (729 | ) | 335,571 | ||||||||||||||||
| Net interest income | 258,900 | 729 | 259,629 | |||||||||||||||||
| Provision for loan losses | 3,900 | — | 3,900 | |||||||||||||||||
| Net interest income after | ||||||||||||||||||||
| provision | 255,000 | 729 | 255,729 | |||||||||||||||||
| Non-interest income | 75,133 | 785 | 75,918 | |||||||||||||||||
| Non-interest expense before | ||||||||||||||||||||
| depreciation | 180,060 | 1,429 | 181,489 | |||||||||||||||||
| Depreciation expense | 16,502 | 79 | 16,581 | |||||||||||||||||
| Income before income taxes | 133,571 | 6 | 133,577 | |||||||||||||||||
| Income tax expense | 48,992 | 2 | 48,994 | |||||||||||||||||
| Net income | $ | 84,579 | 4 | 84,583 | ||||||||||||||||
| Average assets | $ | 11,237,872 | 62,529 | 11,300,401 | ||||||||||||||||
| Total revenues | $ | 334,033 | 1,514 | 335,547 | ||||||||||||||||
| Year Ended December 31, 2005 | ||||||||||||||||||||
|---|---|---|---|---|---|---|---|---|---|---|---|---|---|---|---|---|---|---|---|---|
| Banking | Real Estate Operations | Consolidated Total | ||||||||||||||||||
| (Dollars in thousands) | ||||||||||||||||||||
| Interest income | $ | 478,656 | — | 478,656 | ||||||||||||||||
| Interest expense | 214,070 | (173 | ) | 213,897 | ||||||||||||||||
| Net interest income | 264,586 | 173 | 264,759 | |||||||||||||||||
| Provision for loan losses | 1,980 | — | 1,980 | |||||||||||||||||
| Net interest income | ||||||||||||||||||||
| after provision | 262,606 | 173 | 262,779 | |||||||||||||||||
| Non-interest income | 78,248 | 2,928 | 81,176 | |||||||||||||||||
| Non-interest expense before | ||||||||||||||||||||
| depreciation | 169,465 | 1,551 | 171,016 | |||||||||||||||||
| Depreciation expense | 14,969 | 89 | 15,058 | |||||||||||||||||
| Income before income taxes | 156,420 | 1,461 | 157,881 | |||||||||||||||||
| Income tax expense | 53,947 | 581 | 54,528 | |||||||||||||||||
| Net income | $ | 102,473 | 880 | 103,353 | ||||||||||||||||
| Average assets | $ | 9,949,156 | 45,516 | 9,994,672 | ||||||||||||||||
| Total revenues | $ | 342,834 | 3,101 | 345,935 | ||||||||||||||||
| Year Ended December 31, 2004 | ||||||||||||||||||||
|---|---|---|---|---|---|---|---|---|---|---|---|---|---|---|---|---|---|---|---|---|
| Banking | Real Estate Operations | Consolidated Total | ||||||||||||||||||
| (Dollars in thousands) | ||||||||||||||||||||
| Interest income | $ | 421,173 | — | 421,173 | ||||||||||||||||
| Interest expense | 159,893 | (8 | ) | 159,885 | ||||||||||||||||
| Net interest income | 261,280 | 8 | 261,288 | |||||||||||||||||
| Provision for loan losses | 1,215 | — | 1,215 | |||||||||||||||||
| Net interest income after | ||||||||||||||||||||
| provision | 260,065 | 8 | 260,073 | |||||||||||||||||
| Non-interest income | 71,397 | 6,657 | 78,054 | |||||||||||||||||
| Non-interest expense before | ||||||||||||||||||||
| depreciation | 170,922 | 1,228 | 172,150 | |||||||||||||||||
| Depreciation expense | 13,576 | 90 | 13,666 | |||||||||||||||||
| Income before income taxes | 146,964 | 5,347 | 152,311 | |||||||||||||||||
| Income tax expense | 48,664 | 2,125 | 50,789 | |||||||||||||||||
| Net income | $ | 98,300 | 3,222 | 101,522 | ||||||||||||||||
| Average assets | $ | 9,223,273 | 36,006 | 9,259,279 | ||||||||||||||||
| Total revenues | $ | 332,677 | 6,665 | 339,342 | ||||||||||||||||
19. Fair Values of Financial Instruments
SFAS No. 107, “Disclosures about Fair Value of Financial Instruments” requires the disclosure of estimated fair values of all asset, liability and off-balance sheet financial instruments. The estimated fair value amounts under SFAS No. 107 have been determined as of a specific point in time utilizing available market information, assumptions and appropriate valuation methodologies. Accordingly, the estimated fair values presented herein are not necessarily representative of the underlying value of the Company. Rather the disclosures are limited to reasonable estimates of the fair value of only the Company’s financial instruments. The use of assumptions and various valuation techniques, as well as the absence of
94
MAF Bancorp, Inc. and Subsidiaries
Notes to Consolidated Financial Statements - (Continued)
secondary markets for certain financial instruments, will likely reduce the comparability of fair value disclosures between financial institutions. The Company does not plan to sell most of its assets or settle most of its liabilities at these values.
The estimated fair values of the Company’s financial instruments as of December 31, 2006 and 2005 are set forth in the following table below.
| December 31, 2006 | December 31, 2005 | ||||||||||||||||||||||
|---|---|---|---|---|---|---|---|---|---|---|---|---|---|---|---|---|---|---|---|---|---|---|---|
| Carrying Amount | Fair Value | Carrying Amount | Fair Value | ||||||||||||||||||||
| (Dollars in thousands) | |||||||||||||||||||||||
| Financial assets: | |||||||||||||||||||||||
| Cash and cash equivalents | $ | 331,218 | 331,218 | $ | 246,029 | 246,029 | |||||||||||||||||
| Investment securities | |||||||||||||||||||||||
| available for sale | 529,998 | 529,998 | 475,152 | 475,152 | |||||||||||||||||||
| Stock in FHLB of Chicago | 146,407 | 146,407 | 165,663 | 165,663 | |||||||||||||||||||
| Mortgage-backed | |||||||||||||||||||||||
| securities available | |||||||||||||||||||||||
| for sale | 1,195,494 | 1,195,494 | 1,313,409 | 1,313,409 | |||||||||||||||||||
| Mortgage-backed | |||||||||||||||||||||||
| securities | |||||||||||||||||||||||
| held to maturity | 212,302 | 205,620 | 243,161 | 237,489 | |||||||||||||||||||
| Loans receivable held | |||||||||||||||||||||||
| for sale | 331,961 | 331,961 | 114,482 | 114,482 | |||||||||||||||||||
| Loans receivable | 7,448,591 | 7,382,663 | 7,211,237 | 7,161,715 | |||||||||||||||||||
| Interest receivable | 50,372 | 50,372 | 44,339 | 44,339 | |||||||||||||||||||
| Bank-owned life insurance | 149,497 | 149,497 | 107,253 | 107,253 | |||||||||||||||||||
| Mortgage loan servicing | |||||||||||||||||||||||
| rights | 17,549 | 25,272 | 20,007 | 29,029 | |||||||||||||||||||
| Total financial assets | $ | 10,413,389 | 10,348,502 | $ | 9,940,732 | 9,894,560 | |||||||||||||||||
| Financial liabilities: | |||||||||||||||||||||||
| Non-maturity deposits | $ | 3,463,975 | 3,463,975 | $ | 3,310,505 | 3,310,505 | |||||||||||||||||
| Deposits with stated | |||||||||||||||||||||||
| maturities | 3,554,035 | 3,559,363 | 2,886,998 | 2,880,254 | |||||||||||||||||||
| Borrowed funds | 2,773,192 | 2,760,001 | 3,057,669 | 2,977,573 | |||||||||||||||||||
| Junior subordinated | |||||||||||||||||||||||
| debentures | �� | 67,011 | 67,038 | 67,011 | 67,518 | ||||||||||||||||||
| Interest payable | 12,735 | 12,735 | 11,944 | 11,944 | |||||||||||||||||||
| Total financial | |||||||||||||||||||||||
| liabilities | $ | 9,870,948 | 9,863,112 | $ | 9,334,127 | 9,247,794 | |||||||||||||||||
The following methods and assumptions are used by the Company in estimating the fair value amounts for its financial instruments.
Cash and cash equivalents. The carrying value of cash and cash equivalents approximates fair value due to the relatively short period of time between the origination of the instruments and their expected realization.
Investment securities and mortgage-backed securities. The fair values of these financial instruments were estimated using quoted market prices, when available. The fair value of FHLBC stock is based on its redemption value.
Loans receivable. The fair value of loans receivable held for investment is estimated based on contractual cash flows adjusted for prepayment assumptions, discounted using the current rate at which similar loans would be made to borrowers with similar credit ratings and remaining terms to maturity. The fair value of mortgage loans held for sale is based on estimated values that could be obtained in the secondary market.
Interest receivable and payable. The carrying value of interest receivable, net of the reserve for uncollected interest, and interest payable, approximates fair value due to the relatively short period of time between accrual and expected realization.
Deposits. The fair value of deposits with no stated maturity, such as demand deposit, passbook savings, checking and money market accounts, are disclosed as the amount payable on demand. The fair value of fixed-maturity deposits is the present value of the contractual cash flows discounted using interest rates currently being offered for deposits with similar remaining terms to maturity.
Borrowed funds. The fair value of FHLBC advances and reverse repurchase agreements is the present value of the contractual cash flows, discounted by the current rate offered for similar remaining maturities. The carrying value of the unsecured term bank loan approximates fair value due to the short term to repricing and adjustable rate nature of the loan.
95
MAF Bancorp, Inc. and Subsidiaries
Notes to Consolidated Financial Statements - (Continued)
Commitments to extend credit and standby letters of credit. The fair value of commitments to extend credit is estimated based on current levels of interest rates versus the committed rates. As of December 31, 2006 and 2005, the fair value of the Bank’s mortgage loan commitments of $487.9 million and $756.4 million, respectively, was $1.1 million and ($817,000), respectively, which represents the differential between the committed value and value at current rates. The fair value of the standby letters of credit approximate the recorded amounts of related fees and are not material at December 31, 2006 and 2005.
20. Related Party Transactions
The Company, through its subsidiary bank, has made loans and had transactions with certain of its directors and officers. All such loans and transactions were made in the ordinary course of business on substantially the same terms, including interest rates and collateral, as those prevailing at the time for comparable transactions with other persons and did not involve more than the normal risk of collectibility or present other unfavorable features. We had loans and commitments to extend credit to directors and executive officers of $3.3 million and $3.1 million at December 31, 2006 and 2005, respectively. During 2006, we originated new loans and commitments totaling $246,000 to such persons.
A director of the Company is a partner in a law firm that provides legal services to the Company and the Bank. Total fees paid to this law firm were $315,360, $316,720 and $387,660 for the years ended December 31, 2006, 2005 and 2004, respectively. The same law firm leases office space from the Company and paid rents in the amount of $115,992 for each of the years ended December 31, 2006, 2005 and 2004.
The Company and the Bank also employ various relatives of certain executive officers and directors and pay them compensation commensurate with their positions at the Bank and the Company.
21. Parent Company Only Financial Information
The information as of December 31, 2006, and 2005, and for the years ended December 31, 2006, 2005, and 2004, presented below should be read in conjunction with the other Notes to Consolidated Financial Statements.
| At December 31, | ||||||||||||||
|---|---|---|---|---|---|---|---|---|---|---|---|---|---|---|
| Condensed Statements of Financial Condition | 2006 | 2005 | ||||||||||||
| (Dollars in thousands) | ||||||||||||||
| Assets: | ||||||||||||||
| Cash and cash equivalents | $ | 18,164 | 38,117 | |||||||||||
| Investment securities | 5,065 | 5,458 | ||||||||||||
| Equity in net assets of subsidiaries | 1,267,827 | 1,064,941 | ||||||||||||
| Other assets | 6,563 | 8,086 | ||||||||||||
| Total assets | $ | 1,297,619 | 1,116,602 | |||||||||||
| Liabilities and Stockholders' Equity: | ||||||||||||||
| Liabilities: | ||||||||||||||
| Borrowed funds | $ | 147,500 | 63,000 | |||||||||||
| Junior subordinated debentures | 67,011 | 67,011 | ||||||||||||
| Accrued expenses | 10,963 | 8,412 | ||||||||||||
| Total liabilities | 225,474 | 138,423 | ||||||||||||
| Stockholders' equity: | ||||||||||||||
| Common stock | 345 | 336 | ||||||||||||
| Additional paid-in capital | 569,142 | 527,131 | ||||||||||||
| Retained earnings, substantially restricted | 579,651 | 537,140 | ||||||||||||
| Accumulated other comprehensive loss, net of tax | (8,476 | ) | (19,391 | ) | ||||||||||
| Treasury stock | (68,517 | ) | (67,037 | ) | ||||||||||
| Total stockholders' equity | 1,072,145 | 978,179 | ||||||||||||
| Total liabilities and stockholders' equity | $ | 1,297,619 | 1,116,602 | |||||||||||
96
MAF Bancorp, Inc. and Subsidiaries
Notes to Consolidated Financial Statements - (Continued)
| Year Ended December 31, | ||||||||||||||
|---|---|---|---|---|---|---|---|---|---|---|---|---|---|---|
| Condensed Statements of Operations | 2006 | 2005 | 2004 | |||||||||||
| (Dollars in thousands) | ||||||||||||||
| Dividend income from subsidiaries | $ | 95,000 | 65,000 | 128,000 | ||||||||||
| Interest income | 531 | 656 | 517 | |||||||||||
| Interest expense | 13,454 | 5,761 | 1,456 | |||||||||||
| Net interest and dividend income | 82,077 | 59,895 | 127,061 | |||||||||||
| Gain on sale of investments, net | — | 166 | 67 | |||||||||||
| Non-interest expense | 2,901 | 2,682 | 3,063 | |||||||||||
| Net income before income tax benefit and equity | ||||||||||||||
| in undistributed earnings of subsidiaries | 79,176 | 57,379 | 124,065 | |||||||||||
| Income tax benefit | 5,784 | 3,572 | 2,066 | |||||||||||
| Net income before equity in undistributed | ||||||||||||||
| earnings of subsidiaries | 84,960 | 60,951 | 126,131 | |||||||||||
| Equity (deficit) in undistributed earnings of | ||||||||||||||
| subsidiaries | (377 | ) | 42,402 | (24,609 | ) | |||||||||
| Net income | $ | 84,583 | 103,353 | 101,522 | ||||||||||
| December 31, | ||||||||||||||
|---|---|---|---|---|---|---|---|---|---|---|---|---|---|---|
| Condensed Statements of Cash Flows | 2006 | 2005 | 2004 | |||||||||||
| (Dollars in thousands) | ||||||||||||||
| Operating activities: | ||||||||||||||
| Net income | $ | 84,583 | 103,353 | 101,522 | ||||||||||
| Deficit (equity) in undistributed earnings of | ||||||||||||||
| subsidiaries | 377 | (42,402 | ) | 24,609 | ||||||||||
| Gain on sale of investment securities | — | (166 | ) | (67 | ) | |||||||||
| Net decrease (increase) in other assets and | ||||||||||||||
| liabilities, net of effects from | ||||||||||||||
| acquisitions | (8,182 | ) | (3,839 | ) | 1,371 | |||||||||
| Net cash provided by operating activities | 76,778 | 56,946 | 127,435 | |||||||||||
| Investing activities: | ||||||||||||||
| Proceeds from sale and maturities of investment | ||||||||||||||
| securities | 767 | 1,438 | 625 | |||||||||||
| Loans to subsidiaries less repayments, net | (12,800 | ) | (8,700 | ) | (1,200 | ) | ||||||||
| Investments in unconsolidated subsidiaries | — | (2,011 | ) | — | ||||||||||
| Purchases of investment securities | — | (500 | ) | — | ||||||||||
| Payment for acquisitions, net of cash acquired | (62,023 | ) | — | (73,846 | ) | |||||||||
| Net cash used in investing activities | (74,056 | ) | (9,773 | ) | (74,421 | ) | ||||||||
| Financing activities: | ||||||||||||||
| Proceeds from: | ||||||||||||||
| Exercise of stock options | 7,262 | 3,910 | 7,559 | |||||||||||
| Borrowings | 157,000 | 20,000 | 35,000 | |||||||||||
| Issuance of junior subordinated debentures | — | 67,011 | — | |||||||||||
| Repayment of borrowings | (72,500 | ) | (37,000 | ) | (10,000 | ) | ||||||||
| Purchase of treasury stock | (81,990 | ) | (56,826 | ) | (49,174 | ) | ||||||||
| Cash dividends paid | (32,447 | ) | (29,257 | ) | (26,411 | ) | ||||||||
| Net cash used in financing activities | (22,675 | ) | (32,162 | ) | (43,026 | ) | ||||||||
| Increase (decrease) in cash and cash equivalents | (19,953 | ) | 15,011 | 9,988 | ||||||||||
| Cash and cash equivalents at beginning of year | 38,117 | 23,106 | 13,118 | |||||||||||
| Cash and cash equivalents at end of year | $ | 18,164 | 38,117 | 23,106 | ||||||||||
97
MAF Bancorp, Inc. and Subsidiaries
Notes to Consolidated Financial Statements - (Continued)
22. Selected Quarterly Financial Data (Unaudited)
The following are the consolidated results of operations on a quarterly basis:
| Year Ended December 31, 2006 | Year Ended December 31, 2005 | ||||||||||||||||||||||||||||||||||||||||||||||||||||||||||
|---|---|---|---|---|---|---|---|---|---|---|---|---|---|---|---|---|---|---|---|---|---|---|---|---|---|---|---|---|---|---|---|---|---|---|---|---|---|---|---|---|---|---|---|---|---|---|---|---|---|---|---|---|---|---|---|---|---|---|---|
| First Quarter | Second Quarter | Third Quarter | Fourth Quarter | First Quarter | Second Quarter | Third Quarter | Fourth Quarter | ||||||||||||||||||||||||||||||||||||||||||||||||||||
| (Dollars in thousands, except per share amounts) | |||||||||||||||||||||||||||||||||||||||||||||||||||||||||||
| Interest income | $ | 141,515 | 150,137 | 152,506 | 151,042 | $ | 111,524 | 116,764 | 122,044 | 128,324 | |||||||||||||||||||||||||||||||||||||||||||||||||
| Interest expense | 74,073 | 83,210 | 87,382 | 90,906 | 43,985 | 49,686 | 55,920 | 64,306 | |||||||||||||||||||||||||||||||||||||||||||||||||||
| Net interest income | 67,442 | 66,927 | 65,124 | 60,136 | 67,539 | 67,078 | 66,124 | 64,018 | |||||||||||||||||||||||||||||||||||||||||||||||||||
| Provision for loan losses | 400 | 1,250 | 900 | 1,350 | — | — | 480 | 1,500 | |||||||||||||||||||||||||||||||||||||||||||||||||||
| Net interest income | |||||||||||||||||||||||||||||||||||||||||||||||||||||||||||
| after provision for | |||||||||||||||||||||||||||||||||||||||||||||||||||||||||||
| loan losses | 67,042 | 65,677 | 64,224 | 58,786 | 67,539 | 67,078 | 65,644 | 62,518 | |||||||||||||||||||||||||||||||||||||||||||||||||||
| Net gain (loss) on sale or | |||||||||||||||||||||||||||||||||||||||||||||||||||||||||||
| writedown of assets | 2,938 | 3,160 | 3,565 | (9,727 | ) | 4,520 | 2,627 | 2,752 | 4,288 | ||||||||||||||||||||||||||||||||||||||||||||||||||
| Income (loss) from real | |||||||||||||||||||||||||||||||||||||||||||||||||||||||||||
| estate operations | 852 | 350 | (111 | ) | (306 | ) | — | 166 | — | 2,762 | |||||||||||||||||||||||||||||||||||||||||||||||||
| Deposit account service | |||||||||||||||||||||||||||||||||||||||||||||||||||||||||||
| charges | 8,862 | 10,824 | 11,559 | 10,592 | 7,646 | 8,769 | 9,342 | 9,436 | |||||||||||||||||||||||||||||||||||||||||||||||||||
| Other income | 8,195 | 7,813 | 8,228 | 9,124 | 6,113 | 6,834 | 8,266 | 7,655 | |||||||||||||||||||||||||||||||||||||||||||||||||||
| Total non-interest | |||||||||||||||||||||||||||||||||||||||||||||||||||||||||||
| income | 20,847 | 22,147 | 23,241 | 9,683 | 18,279 | 18,396 | 20,360 | 24,141 | |||||||||||||||||||||||||||||||||||||||||||||||||||
| Non-interest expense | 49,808 | 48,942 | 49,727 | 49,593 | 48,599 | 47,040 | 45,499 | 44,936 | |||||||||||||||||||||||||||||||||||||||||||||||||||
| Income before income | |||||||||||||||||||||||||||||||||||||||||||||||||||||||||||
| taxes | 38,081 | 38,882 | 37,738 | 18,876 | 37,219 | 38,434 | 40,505 | 41,723 | |||||||||||||||||||||||||||||||||||||||||||||||||||
| Income tax expense | 13,001 | 13,195 | 13,041 | 9,757 | 13,042 | 13,375 | 13,520 | 14,591 | |||||||||||||||||||||||||||||||||||||||||||||||||||
| Net income | $ | 25,080 | 25,687 | 24,697 | 9,119 | $ | 24,177 | 25,059 | 26,985 | 27,132 | |||||||||||||||||||||||||||||||||||||||||||||||||
| Basic earnings per share | $ | .75 | .77 | .75 | .28 | $ | .73 | .78 | .84 | .85 | |||||||||||||||||||||||||||||||||||||||||||||||||
| Diluted earnings per share | .74 | .75 | .74 | .27 | .72 | .76 | .83 | .83 | |||||||||||||||||||||||||||||||||||||||||||||||||||
| Dividends declared per | |||||||||||||||||||||||||||||||||||||||||||||||||||||||||||
| common share | .25 | .25 | .25 | .25 | .23 | .23 | .23 | .23 | |||||||||||||||||||||||||||||||||||||||||||||||||||
98
Item 9. Changes in and Disagreements with Accountants on Accounting and Financial Disclosure
None.
Item 9A. Controls and Procedures
As of December 31, 2006, our Chief Executive Officer and Chief Financial Officer carried out an evaluation under their supervision, with the participation of other members of management as they deemed appropriate, of the effectiveness of the design and operation of the Company’s disclosure controls and procedures as contemplated by Rule 13a-15(e) under the Securities Exchange Act of 1934. Based upon, and as of the date of that evaluation, the Chief Executive Officer and Chief Financial Officer concluded that the Company’s disclosure controls and procedures are effective, in all material respects, in timely alerting them to material information relating to the Company (and its consolidated subsidiaries) and in ensuring that information required to be included in the periodic reports the Company files or submits to the SEC under the Securities Exchange Act is recorded, processed, summarized and reported as required.
As of December 31, 2006, we also evaluated the effectiveness of our internal controls over financial reporting as required by Section 404 of the Sarbanes-Oxley Act and Rule 13a-15(f) under the Securities Exchange Act of 1934. The report of our Chief Executive Officer and Chief Financial Officer regarding management’s internal control assessment is included in Item 8 and incorporated herein by reference.
In order to produce reliable financial statements, management is responsible for establishing and maintaining effective internal controls over financial reporting. Management evaluates the effectiveness of its system of internal control over financial reporting and tests for reliability of recorded financial information through a program of ongoing internal audits. Actions are taken to address potential control deficiencies that are identified. Any system of internal control, no matter how well designed, has inherent limitations, including the possibility that a control can be circumvented or overridden and misstatements due to error or fraud may occur and not be detected. Also, because of changes in conditions, internal control effectiveness may vary over time. Accordingly, even an effective system of internal control will provide only reasonable assurance with respect to financial statement preparation. Our Chief Executive Officer and Chief Financial Officer concluded that our system of internal control over financial reporting at December 31, 2006 is designed and operating effectively at this reasonable assurance level.
The audit committee, consisting entirely of independent directors, meets regularly with management, internal auditors and the independent registered public accounting firm, and reviews audit plans and results, as well as management’s actions taken in discharging responsibilities for accounting, financial reporting, and internal control. KPMG LLP, independent registered public accounting firm, and the Company’s internal auditors have direct and confidential access to the audit committee.
Item 9B. Other Information
None.
PART III
Item 10. Directors, Executive Officers and Corporate Governance
Information regarding our directors is included in our proxy statement under the headings “Information About Directors and Others,” “Transactions with Certain Related Persons and Other Information,” “Corporate Governance Matters – Audit Committee” and the information included therein is incorporated herein by reference. Information regarding the executive officers of the Company included in this Form 10-K is included in “Item 1. Business.” Information regarding beneficial ownership reporting compliance is included in the Company’s proxy statement under the heading “Section 16(a) Beneficial Ownership Reporting Compliance” and the information included therein is incorporated by reference.
There have been no material changes to the procedures by which security holders may recommend nominees to our board of directors.
99
The Company has adopted a code of ethics as required by the listing standards of the NASDAQ National Market and the SEC. This code applies to all of its directors, officers and employees. The Company has also adopted a charter for each of its audit committee, administrative/compensation committee and nominating and corporate governance committee and has posted the code of ethics, the committee charters and other governance information on the Company’s website at www.mafbancorp.com. The Company will post on its website any amendments to the code of ethics and waivers, if any, applicable to any of its directors or executive officers. The foregoing information will also be available in print and free of charge to any shareholder who requests such information.
Item 11. Executive Compensation
Information regarding compensation of executive officers and directors is included in the Company’s proxy statement under the headings “Directors’ Compensation,” and “Executive Compensation” and the information included therein is incorporated herein by reference.
The information regarding compensation committee interlocks and insider participation is included in the registrant’s proxy statement under the headings “Compensation Committee Interlocks and Insider Participation” and the information included therein under the heading “Compensation Committee Report” is incorporated herein by reference (except that the Compensation Committee Report shall not be deemed to be “filed” with the Securities and Exchange Commission).
Item 12. Security Ownership of Certain Beneficial Owners and Management and Related Stockholder Matters
Information regarding security ownership of certain beneficial owners and management is included in the Company’s proxy statement under the headings “Security Ownership of Certain Beneficial Owners,” and “Information About Directors and Others,” and the information included therein is incorporated herein by reference.
Equity Compensation Plans
The following table summarizes certain information about the equity compensation plans of the Company as of December 31, 2006:
| Plan Category | Number Of Securities To Be Issued Upon Exercise Of Outstanding Options, Warrants And Rights | Weighted-Average Exercise Price Of Outstanding Options, Warrants And Rights | Number Of Securities Remaining Available For Future Issuance Under Equity Compensation Plans (Excluding Securities Reflected In Column (A) | ||||||||
|---|---|---|---|---|---|---|---|---|---|---|---|
| (A) | (B) | (C) | |||||||||
| Equity compensation plans approved by | |||||||||||
| security holders | 3,206,002 | (1)(2) | $ | 32.46 | 75,553 | ||||||
| Equity compensation plans not approved by | |||||||||||
| security holders | — | — | 3,431 | (3) | |||||||
| Total | 3,206,002 | $ | 32.46 | 78,984 | |||||||
| (1) | Includes 46,344 stock options exercisable at a weighted average price of $21.31 per share relating to options granted under plans of acquired entities that were converted into MAF Bancorp stock options. No further grants will be made under such plans. |
| (2) | Includes 128,987 restricted stock units granted to certain employees and non-employee directors. |
| (3) | Represents shares reserved for issuance under deferred compensation plans, which shares may be issued to executive officers and directors, if any, electing to defer cash compensation otherwise payable to them. The number of shares allocated to plan participants is determined based on the fair market value of shares at the time of compensation deferral. |
Item 13. Certain Relationships and Related Transactions, and Director Independence
Information regarding certain relationships and related party transactions is included in the Company’s proxy statement under the heading “Transactions with Certain Related Persons and Other Information,” and the information included therein is incorporated herein by reference.
The information regarding the independence of the Company’s directors is included in the Company’s proxy statement under the heading “Corporate Governance Matters - Director Independence,” and the information included therein is incorporated herein by reference.
100
Item 14. Principal Accountant Fees and Services
Information regarding fees paid to the independent auditors and the pre-approval policies and procedures of the Company’s audit committee is included in the Company’s proxy statement under the heading “Proposal 2 – Ratification of Independent Auditors,” and the information included therein is incorporated herein by reference.
PART IV
Item 15. Exhibits and Financial Statements Schedules
(a)(1) Financial Statements
The following consolidated financial statements of the registrant and its subsidiaries are filed as a part of this document under “Item 8. Financial Statements and Supplementary Data.”
Consolidated Statements of Financial Condition at December 31, 2006 and 2005.
Consolidated Statements of Operations for the years ended December 31, 2006, 2005 and 2004.
Consolidated Statements of Changes in Stockholders’ Equity for the years ended December 31, 2006, 2005 and 2004.
Consolidated Statements of Cash Flows for the years ended December 31, 2006, 2005 and 2004.
Notes to Consolidated Financial Statements.
Report of Management Regarding Internal Control Over Financial Reporting.
Report of Independent Registered Public Accounting Firm.
Report of Independent Registered Public Accounting Firm.
(a)(2) Financial Statement Schedules
All schedules are omitted because they are not required or are not applicable or the required information is shown in the consolidated financial statements or notes thereto.
(a)(3) Exhibits
The following exhibits are either filed as part of this report or are incorporated herein by reference:
| 3.1 | Restated Certificate of Incorporation. (Incorporated herein by reference to Exhibit 3.1 to Registrant's Form 8-K (File No. 0-18121) dated December 19, 2000). |
| 3.2 | Amended and Restated By-laws of Registrant. (Incorporated herein by reference to Exhibit No. 3 to Registrant's September 30, 2003 Form 10-Q (File No. 0-18121)). |
| 4.1 | Certain instruments defining the rights of the holders of long-term debt of the Company and of a subsidiary, involving a total amount of indebtedness not in excess of 10% of the total assets of the Company and its subsidiaries on a consolidated basis, have not been filed as Exhibits. The Company hereby agrees to furnish a copy of any of these agreements to the Commission upon request. |
101
Exhibit No. 10. Material Contracts
| 10.1 | Credit Agreement dated as of July 17, 2006, between MAF Bancorp, Inc. and Harris, N.A. (Incorporated herein by reference to Exhibit 10.1 to Registrant's September 30, 2006 Form 10-Q (File No. 0-18121)). |
| 10.2 | Mid America Bank, fsb Management Recognition and Retention Plan and Trust Agreement. (Incorporated herein by reference to Exhibit No. 10.4 to Registrant's June 30, 1992 Form 10-K (File No. 0-18121)).* |
| 10.3 | MAF Bancorp, Inc. 1990 Incentive Stock Option Plan, as amended. (Incorporated herein by reference to Exhibit No. 10.2 to Registrant's June 30, 1999 Form 10-Q and to Exhibit A to Registrant's Proxy Statement, dated March 23, 1998 (File No. 0-18121), relating to the 1998 Annual Meeting of Shareholders).* |
| 10.4 | Amendment dated May 23, 2000 to the MAF Bancorp, Inc. 1990 Incentive Stock Option Plan, as amended. (Incorporated herein by reference to Exhibit No. 10.3 to Registrant's December 31, 2000 Form 10-K (File No. 0-18121)).* |
| 10.5 | MAF Bancorp, Inc. 1993 Amended and Restated Premium Price Stock Option Plan, as amended. (Incorporated herein by reference to Exhibit 10.4 to Registrant's December 31, 2005 Form 10-K (File No. 0-18121)).* |
| 10.6 | Amendment dated June 22, 1999 to the MAF Bancorp, Inc. 1993 Amended and Restated Premium Price Stock Option Plan, as amended. (Incorporated herein by reference to Exhibit No. 10.3 to Registrant's June 30, 1999 Form 10-Q (File No. 0-18121)).* |
| 10.7 | Amendment dated May 23, 2000 to the MAF Bancorp, Inc. 1993 Amended and Restated Premium Price Stock Option Plan, as amended. (Incorporated herein by reference to Exhibit No. 10.5 to Registrant's December 31, 2000 Form 10-K (File No. 0-18121)).* |
| 10.8 | MAF Bancorp, Inc. 2000 Stock Option Plan. (Incorporated herein by reference to Exhibit B filed as part of Registrant's Proxy Statement dated March 23, 2001 (File No. 0-18121), relating to the 2001 Annual Meeting of Shareholders).* |
| 10.9 | MAF Bancorp, Inc. Incentive Compensation Plan (Incorporated herein by reference to Exhibit 10.1 to Registrant's Form S-4/A dated October 14, 2003, Registration No. 333-108742).* |
| 10.10 | Form of Non-Qualified Stock Option Agreement. (Incorporated herein by reference to Exhibit 10.9 to Registrant's December 31, 2004 Form 10-K (File No. 0-18121)).* |
| 10.11 | Form of Incentive Stock Option Agreement. (Incorporated herein by reference to Exhibit 10.10 to Registrant's December 31, 2004 Form 10-K (File No. 0-18121)).* |
| 10.12 | Form of Long-Term Incentive Compensation Award Agreement. (Incorporated herein by reference to Exhibit 10.12 to Registrant's December 31, 2005 Form 10-K (File No. 0-18121)).* |
| 10.13 | Form of Restricted Stock Unit Award Agreement.*+ |
| 10.14 | Amended and Restated EFC Bancorp, Inc. 1998 Stock-Based Incentive Plan (Incorporated herein by reference to Appendix A to the EFC Bancorp, Inc. Proxy Statement, dated March 26, 1999, relating to the 1999 Annual Meeting of Shareholders (File No. 1-13605)). * |
| 10.15 | Amendment dated November 15, 2005 to the amended and restated EFC Bancorp, Inc. 1998 Stock- Based Incentive Plan. *+ |
| * | Indicates management contracts or compensatory plans or arrangements required to be filed as an exhibit. |
| + | Filed herewith. |
102
| 10.16 | Mid America Federal Savings and Loan Association Deferred Compensation Trust Agreement. (Incorporated herein by reference to Exhibit No. 10.8 to Registrant's June 30, 1990 Form 10-K (File No. 0-18121)).* |
| 10.17 | Amendment dated May 16, 2001 to the Mid America Bank, fsb Deferred Compensation Trust Agreement. (Incorporated herein by reference to Exhibit No. 10.2 to Registrant's June 30, 2001 Form 10-Q (File No. 0-18121)).* |
| 10.18 | Mid America Bank, fsb Directors' Deferred Compensation Plan. (Incorporated herein by reference to Exhibit No. 10.10 to Registrant's December 31, 1997 Form 10-K (File No. 0-18121)).* |
| 10.19 | Mid America Bank, fsb Executive Deferred Compensation Plan. (Incorporated herein by reference to Exhibit No. 10.11 to Registrant's December 31, 1997 Form 10-K (File No. 0-18121)).* |
| 10.20 | Deferred Compensation Agreement dated January 1, 1999 between St. Francis Bank, F.S.B. and Thomas R. Perz. (Incorporated herein by reference to Exhibit No. 10.25 to Registrant's Form 10-K for the year ended December 31, 2003 (File No. 0-18121)).* |
| 10.21 | Deferred Compensation Agreements dated January 1, 1998, January 1, 1996, January 19, 1994 and November 18, 1987 between St. Francis Capital Corporation, St. Francis Bank, F.S.B., Bank Wisconsin and Thomas R. Perz. (Incorporated herein by reference to Exhibit No. 10.26 to Registrant's Form 10-K for the year ended December 31, 2003 (File No. 0-18121)).* |
| 10.22 | Mid America Bank, fsb Supplemental Executive Retirement Plan, as amended. (Incorporated herein by reference to Exhibit No. 10.13 to Registrant's December 31, 1998 Form 10-K (File No. 0-18121)).* |
| 10.23 | Amendment dated March 27, 2001 to the Mid America Bank, fsb Supplemental Executive Retirement Plan, as amended. (Incorporated herein by reference to Exhibit No. 10.1 to Registrant's March 31, 2001 Form 10-Q (File No. 0-18121)).* |
| 10.24 | Amendment dated January 24, 2006 to the Mid America Bank, fsb Supplemental Executive Retirement Plan, as amended. *+ |
| 10.25 | Fidelity Federal Savings Bank Supplemental Retirement Plan, as amended. (Incorporated herein by reference to Exhibit No. 10.33 to Registrant’s Form 10-K for the year ended December 31, 2003 (File No. 0-18121)).* |
| 10.26 | Form of Employment Agreement, as amended, between MAF Bancorp, Inc. and Allen Koranda, Kenneth Koranda and Jerry Weberling. (Incorporated herein by reference to Exhibit No. 10.29 to Registrant's December 31, 2005 Form 10-K (File No. 0-18121)).* |
| 10.27 | Form of Employment Agreement, as amended, between Mid America Bank, fsb and Allen Koranda, Kenneth Koranda and Jerry Weberling. (Incorporated herein by reference to Exhibit No. 10.30 to Registrant's December 31, 2005 Form 10-K (File No. 0-18121)).* |
| 10.28 | Form of Special Termination Agreement, as amended, between MAF Bancorp, Inc., and various officers. (Incorporated herein by reference to Exhibit No. 10.31 to Registrant's December 31, 2005 Form 10-K (File No. 0-18121)).* |
| 10.29 | Form of Special Termination Agreement, as amended, between Mid America Bank, fsb, and various officers. (Incorporated herein by reference to Exhibit No. 10.32 to Registrant's December 31, 2005 Form 10-K (File No. 0-18121)).* |
| * | Indicates management contracts or compensatory plans or arrangements required to be filed as an exhibit. |
| + | Filed herewith. |
103
| 10.30 | Special Termination Agreement between MAF Bancorp, Inc. and Edward A. Karasek (Incorporated herein by reference to Exhibit No. 10.2 to Registrant's September 30, 2006 Form 10-Q (File No. 0-18121)).* |
| 10.31 | Special Termination Agreement between Mid America Bank, fsb, and Edward A. Karasek (Incorporated herein by reference to Exhibit No. 10.3 to Registrant's September 30, 2006 Form 10-Q (File No. 0-18121)).* |
| 10.32 | Special Termination Agreement between MAF Bancorp, Inc. and James S. Eckel (Incorporated herein by reference to Exhibit No. 10.4 to Registrant's September 30, 2006 Form 10-Q (File No. 0-18121)).* |
| 10.33 | Special Termination Agreement between Mid America Bank, fsb, and James S. Eckel (Incorporated herein by reference to Exhibit No. 10.5 to Registrant's September 30, 2006 Form 10-Q (File No. 0-18121)).* |
| 10.34 | Employment Agreement between MAF Bancorp, Inc. and Thomas R. Perz. (Incorporated herein by reference to Exhibit No. 10.38 to Registrant's Form 10-K for the year ended December 31, 2003 (File No. 0-18121)).* |
| 10.35 | Employment Agreement between Mid America Bank, fsb and Thomas R. Perz. (Incorporated herein by reference to Exhibit No. 10.39 to Registrant's Form 10-K for the year ended December 31, 2003 (File No. 0-18121)).* |
| 10.36 | Agreement Regarding Post-Employment Restrictive Covenants between MAF Bancorp, Inc. and Thomas R. Perz. (Incorporated herein by reference to Exhibit No. 10.40 to Registrant's Form 10-K for the year ended December 31, 2003 (File No. 0-18121)).* |
| 12.1 | Statements re: Computation of ratio of earnings to fixed charges. + |
| 21.1 | Subsidiaries of the Registrant.+ |
| 23.1 | Consent of KPMG LLP.+ |
| 24.1 | Power of Attorney (Included on Signature Page to Registrant's Form 10-K for the year ended December 31, 2006 and incorporated herein by reference (File No. 0-18121)). |
| 31.1 | Certification of Chief Executive Officer.+ |
| 31.2 | Certification of Chief Financial Officer.+ |
| 32.1 | Certification of Chief Executive Officer and Chief Financial Officer pursuant to 18 U.S.C. Section 1350, as adopted pursuant to Section 906 of the Sarbanes-Oxley Act of 2002.+ |
| * | Indicates management contracts or compensatory plans or arrangements required to be filed as an exhibit. |
| + | Filed herewith. |
104
SIGNATURES
Pursuant to the requirements of Section 13 or 15(d) of the Securities Exchange Act of 1934, the registrant has duly caused this report to be signed on its behalf by the undersigned, thereunto duly authorized.
| MAF Bancorp, Inc. | ||||||||
| (Registrant) | ||||||||
| By: | /s/ Allen H. Koranda | |||||||
| Allen H. Koranda | ||||||||
| Chairman of the Board and Chief Executive Officer | ||||||||
| March 2, 2007 | ||||||||
| (Date) | ||||||||
Pursuant to the requirements of the Securities Exchange Act of 1934, this report has been signed below by the following persons on behalf of the registrant and in the capacities and on the dates indicated.
| /s/ Allen H. Koranda | March 2, 2007 | |||||||
| Allen H. Koranda | (Date) | |||||||
| Chairman of the Board and | ||||||||
| Chief Executive Officer (Principal Executive Officer) | ||||||||
| /s/ Jerry A. Weberling | March 2, 2007 | |||||||
| Jerry A. Weberling | (Date) | |||||||
| Executive Vice President and | ||||||||
| Chief Financial Officer and Director (Principal Financial Officer) | ||||||||
| /s/ Christine Roberg | March 2, 2007 | |||||||
| Christine Roberg | (Date) | |||||||
| First Vice President and Controller | ||||||||
| (Principal Accounting Officer) | ||||||||
| * | March 2, 2007 | |||||||
| Kenneth R. Koranda | (Date) | |||||||
| Vice Chairman of the Board | ||||||||
| * | March 2, 2007 | |||||||
| Robert J. Bowles, M.D. | (Date) | |||||||
| Director | ||||||||
| * | March 2, 2007 | |||||||
| David C. Burba | (Date) | |||||||
| Director | ||||||||
105
| * | March 2, 2007 | |||||||
| Terry A. Ekl | (Date) | |||||||
| Director | ||||||||
| * | March 2, 2007 | |||||||
| Leo M. Flanagan | (Date) | |||||||
| Director | ||||||||
| * | March 2, 2007 | |||||||
| Joe F Hanauer | (Date) | |||||||
| Director | ||||||||
| * | March 2, 2007 | |||||||
| Babara L. Lamb | (Date) | |||||||
| Director | ||||||||
| * | March 2, 2007 | |||||||
| Edward W. Mentzer | (Date) | |||||||
| Director | ||||||||
| * | March 2, 2007 | |||||||
| Thomas R. Perz | (Date) | |||||||
| Director | ||||||||
| * | March 2, 2007 | |||||||
| Raymond S. Stolarczyk | (Date) | |||||||
| Director | ||||||||
| * | March 2, 2007 | |||||||
| Lois B. Vasto | (Date) | |||||||
| Director | ||||||||
| * | March 2, 2007 | |||||||
| Andrew . Zych | (Date) | |||||||
| Director | ||||||||
* Signed pursuant to power of attorney (included as Exhibit 24.1 hereto) on March 2, 2007 by:
/s/ Allen H. Koranda
______________________________
Allen H. Koranda, as attorney-in-fact
106
EXHIBIT INDEX
| Exhibit No. 10.13 | Form of Restricted Stock Unit Award Agreement.*+ |
| Exhibit No. 10.15 | Amendment dated November 15, 2005 to the amended and restated EFC Bancorp, Inc. 1998 Stock- Based Incentive Plan.*+ |
| Exhibit No. 10.24 | Amendment dated January 24, 2006 to the Mid America Bank, fsb Supplemental Executive Retirement Plan, as amended.*+ |
| Exhibit No. 12.1 | Statements re: Computation of ratio of earnings to fixed charges.+ |
| Exhibit No. 21.1 | Subsidiaries of the Registrant.+ |
| Exhibit No. 23.1 | Consent of KPMG LLP.+ |
| Exhibit No. 31.1 | Certification of Chief Executive Officer.+ |
| Exhibit No. 31.2 | Certification of Chief Financial Officer.+ |
| Exhibit No. 32.1 | Certification of Chief Executive Officer and Chief Financial Officer pursuant to 18 U.S.C. Section 1350, as adopted pursuant to Section 906 of the Sarbanes-Oxley Act of 2002.+ |
| * | Indicates management contracts or compensatory plans or arrangements required to be filed as an exhibit. |
| + | Filed herewith. |