UNITED STATES
SECURITIES AND EXCHANGE COMMISSION
WASHINGTON, D. C. 20549
FORM N-CSRS
Investment Company Act file number | 811-5896 |
DWS Target Fund (formerly Scudder Target Fund)
(Exact Name of Registrant as Specified in Charter)
222 South Riverside Plaza
Chicago, IL 60606
(Address of principal executive offices) (Zip code)
Registrant’s Telephone Number, including Area Code: (212) 454-7190
Paul Schubert
345 Park Avenue
New York, NY 10154
(Name and Address of Agent for Service)
Date of fiscal year end: | 07/31 |
Date of reporting period: | 01/31/06 |
ITEM 1. REPORT TO STOCKHOLDERS
JANUARY 31, 2006
Semiannual Report
to Shareholders
DWS Target 2013 Fund
(formerly Scudder Target 2013 Fund)
Contents
Click Here Performance Summary
Click Here Information About Your Fund's Expenses
Click Here Portfolio Management Review
Click Here Portfolio Summary
Click Here Investment Portfolio
Click Here Financial Statements
Click Here Financial Highlights
Click Here Notes to Financial Statements
Click Here Investment Management Agreement Approval
Click Here Account Management Resources
Click Here Privacy Statement
This report must be preceded by a prospectus. The prospectus contains the fund's objectives, risks, charges and expenses, and other important information about the fund.
Investments in mutual funds involve risk. Some funds have more risk than others. Because the fund provides investment protection only on the maturity date to investors who reinvest all dividends and do not redeem their shares before the maturity date, the principal value of the fund is subject to market fluctuation prior to and after the maturity date. This fund is subject to stock market risk, meaning stocks in the fund may decline in value for extended periods of time due to the activities and financial prospects of individual companies, or due to general market and economic conditions. Additionally, the fund invests in individual bonds whose yields and market values fluctuate so that your investment may be worth more or less than its original cost. Bond investments are subject to interest-rate risk such that when interest rates rise, the prices of the bonds, and thus the value of the fund, can decline and the investor can lose principal value. Please read this fund's prospectus for specific details regarding its investments and risk profile. This fund is closed to new investors. Please refer to the prospectus for more details.
DWS Scudder is part of Deutsche Asset Management, which is the marketing name in the US for the asset management activities of Deutsche Bank AG, Deutsche Bank Trust Company Americas, Deutsche Asset Management, Inc., Deutsche Investment Management Americas Inc. and DWS Trust Company.
NOT FDIC/NCUA INSURED NO BANK GUARANTEE MAY LOSE VALUE NOT A DEPOSIT NOT INSURED BY ANY FEDERAL GOVERNMENT AGENCY
Performance Summary January 31, 2006
All performance shown is historical, assumes reinvestment of all dividend and capital gain distributions, and does not guarantee future results. Investment return and principal value fluctuate with changing market conditions so that, when redeemed, shares may be worth more or less than their original cost. Current performance may be lower or higher than the performance quoted. Please visit www.dws-scudder.com for the Fund's most recent month-end performance.
The maximum sales charge for the Fund is 5.0%. Unadjusted returns do not reflect sales charges and would have been lower if they had.
Performance figures do not reflect the deduction of taxes that a shareholder would pay on fund distributions or the redemption of fund shares.
Average Annual Total Returns (Unadjusted for Sales Charge) as of 1/31/06 |
| 6-Month* | 1-Year | 3-Year | 5-Year | 10-Year |
DWS Target 2013 Fund | .75% | 2.85% | 6.39% | .96% | 5.15% |
S&P 500 Index+ | 4.68% | 10.38% | 16.42% | .37% | 8.99% |
Lehman Brothers US Government Bond Index++ | .77% | 1.84% | 2.85% | 5.14% | 5.86% |
Sources: Lipper Inc. and Deutsche Investment Management Americas Inc.
* Total returns shown for periods less than one year are not annualized.
Net Asset Value and Distribution Information |
Net Asset Value: 1/31/06 | $ 9.14 |
7/31/05 | $ 9.31 |
Distribution Information: Six Months: Income Dividends as of 1/31/06 | $ .24 |
Lipper Rankings — Balanced Target Maturity Funds Category as of 1/31/06 |
Period | Rank | | Number of Funds Tracked | Percentile Ranking (%) |
1-Year | 29 | of | 83 | 35 |
3-Year | 7 | of | 46 | 15 |
5-Year | 8 | of | 8 | 89 |
10-Year | 6 | of | 6 | 86 |
Source: Lipper Inc. Rankings are historical and do not guarantee future results. Rankings are based on total returns unadjusted for sales charges with distributions reinvested. If sales charges had been included, rankings might have been less favorable.
Growth of an Assumed $10,000 Investment (Adjusted for Maximum Sales Charge) |
[] DWS Target 2013 Fund [] S&P 500 Index+ [] Lehman Brothers US Government Bond Index++ |
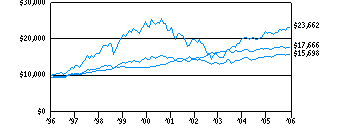 |
Yearly periods ended January 31 |
The Fund's growth of an assumed $10,000 investment is adjusted for the maximum sales charge of 5.0%. This results in a net initial investment of $9,500.
Comparative Results (Adjusted for Maximum Sales Charge) as of 1/31/06 |
| 1-Year | 3-Year | 5-Year | 10-Year |
DWS Target 2013 Fund | Growth of $10,000 | $9,771 | $11,441 | $9,967 | $15,698 |
Average annual total return | -2.29% | 4.59% | -.07% | 4.61% |
S&P 500 Index+ | Growth of $10,000 | $11,038 | $15,779 | $10,186 | $23,662 |
Average annual total return | 10.38% | 16.42% | .37% | 8.99% |
Lehman Brothers US Government Bond Index++ | Growth of $10,000 | $10,184 | $10,881 | $12,847 | $17,666 |
Average annual total return | 1.84% | 2.85% | 5.14% | 5.86% |
The growth of $10,000 is cumulative.
+ The Standard & Poor's 500 (S&P 500) Index is an unmanaged capitalization-weighted index of 500 stocks. The index is designed to measure performance of the broad domestic economy through changes in the aggregate market value of 500 stocks representing all major industries.
++ The Lehman Brothers US Government Bond Index is an unmanaged market-value-weighted index of US Treasury and government agency securities (other than mortgage securities) with maturities of one year or more.
Index returns assume reinvestment of dividends and, unlike Fund returns, do not reflect any fees or expenses. It is not possible to invest directly into an index.
Information About Your Fund's Expenses
As an investor of the Fund, you incur two types of costs: ongoing expenses and transaction costs. Ongoing expenses include management fees, distribution and service (12b-1) fees and other Fund expenses. Examples of transaction costs include sales charges (loads), redemption fees and account maintenance fees, which are not shown in this section. The following tables are intended to help you understand your ongoing expenses (in dollars) of investing in the Fund and to help you compare these expenses with the ongoing expenses of investing in other mutual funds. The tables are based on an investment of $1,000 made at the beginning of the six-month period ended January 31, 2006.
The tables illustrate your Fund's expenses in two ways:
Actual Fund Return. This helps you estimate the actual dollar amount of ongoing expenses (but not transaction costs) paid on a $1,000 investment in the Fund using the Fund's actual return during the period. To estimate the expenses you paid over the period, simply divide your account value by $1,000 (for example, an $8,600 account value divided by $1,000 = 8.6), then multiply the result by the number in the "Expenses Paid per $1,000" line under the share class you hold.
Hypothetical 5% Fund Return. This helps you to compare your Fund's ongoing expenses (but not transaction costs) with those of other mutual funds using the Fund's actual expense ratio and a hypothetical rate of return of 5% per year before expenses. Examples using a 5% hypothetical fund return may be found in the shareholder reports of other mutual funds. The hypothetical account values and expenses may not be used to estimate the actual ending account balance or expenses you paid for the period.
Please note that the expenses shown in these tables are meant to highlight your ongoing expenses only and do not reflect any transaction costs. The "Expenses Paid per $1,000" line of the tables is useful in comparing ongoing expenses only and will not help you determine the relative total expense of owning different funds. If these transaction costs had been included, your costs would have been higher.
Expenses and Value of a $1,000 Investment for the six months ended January 31, 2006 |
Actual Fund Return | |
Beginning Account Value 8/1/05 | $ 1,000.00 |
Ending Account Value 1/31/06 | $ 1,007.50 |
Expenses Paid per $1,000* | $ 5.82 |
Hypothetical 5% Fund Return | |
Beginning Account Value 8/1/05 | $ 1,000.00 |
Ending Account Value 1/31/06 | $ 1,019.41 |
Expenses Paid per $1,000* | $ 5.85 |
* Expenses are equal to the Fund's annualized expense ratio multiplied by the average account value over the period, multiplied by the number of days in the most recent six-month period, then divided by 365.
Annualized Expense Ratio | |
DWS Target 2013 Fund | 1.15% |
For more information, please refer to the Fund's prospectus.
Portfolio Management Review
In the following interview, Portfolio Managers Sal Bruno and Gregory Sivin discuss the market environment, fund performance and their strategy in managing DWS Target 2013 Fund during the semiannual period ended January 31, 2006.
Q: How did the US financial markets perform during the reporting period?
A: The US stock market performed well during the past six months, as some of the key issues that had been weighing on investors in mid-2005 began to dissipate. Economic growth came in stronger than expected, underscoring the resilience of the US economy in the face of the Gulf Coast hurricanes and rising energy prices. Corporate profit growth remained strong, helping US companies take positive actions, such as shoring up their balance sheets, buying back stock and boosting their dividends. In addition, investors began to look ahead to the end of the long series of interest rate increases being enacted by the US Federal Reserve Board (the Fed). The result was that the US stock market — as measured by the Standard & Poor's 500 (S&P 500) Index1 — reached its highest level in four years in mid-December, then continued to rally through January. The bond market, meanwhile, provided marginally positive returns but trailed the return of stocks. Longer-term issues generally held up well, reflecting strong demand from overseas, while shorter-term bonds — which are more sensitive to the Fed's interest rate policy — lost ground.
1 The Standard & Poor's 500 (S&P 500) Index is an unmanaged capitalization-weighted index of 500 stocks. The index is designed to measure performance of the broad domestic economy through changes in the aggregate market value of 500 stocks representing all major industries.
Index returns reflect the reinvestment of dividends and, unlike fund returns, do not reflect fees or expenses. It is not possible to invest directly into an index.
How is the equity portion of the fund managed? "We believe fundamental equity research is our competitive advantage, so we strive to generate long-term outperformance through individual stock selection. We combine the insights of our proprietary individual company research with the objectivity of quantitative portfolio construction — in other words, the use of statistical measures to evaluate individual stocks and weed out those that do not meet our criteria. After our research analysts determine the expected return for each stock in our investment universe, our quantitative process uses those inputs to determine the weighting for each stock in order to maximize the portfolio's return and help manage its risk. To ensure that stock selection drives returns, the fund's sector weightings are kept closely in line with those of the benchmark. We believe this focus on individual stock selection is the way we can add the greatest amount of value for shareholders over time." Portfolio Manager Sal Bruno |
Q: How did the fund perform in this environment?
A: DWS Target 2013 Fund returned 0.75% during the six-month period ended January 31, 2006.
Returns are unadjusted for sales charges. If sales charges had been included, returns would have been lower. Past performance is no guarantee of future results. Please see pages 4 through 5 for more complete performance information.
The fund invests in both stocks and bonds. DWS Target 2013 Fund held weightings of 32% in stocks and 68% in bonds as of January 31, 2006. The fund's stock benchmark is the S&P 500, which returned 4.68% during the semiannual period. The fund's bond benchmark is the Lehman Brothers US Government Bond Index, which returned 0.77% for the same period.2
2 The Lehman Brothers US Government Bond Index is an unmanaged market-value weighted index of US Treasury and government agency securities (other than mortgage securities) with maturities of one year or more.
Index returns reflect the reinvestment of dividends and, unlike fund returns, do not reflect fees or expenses. It is not possible to invest directly into an index.
Q: What factors helped and hurt the performance of the equity portion of the portfolio?
A: Within the fund's equity portfolio, we added significant value through individual stock selection. Our stock picks in the financial sector delivered the best relative performance. Here, the fund held an overweight3 in the capital markets subsector, which includes companies with exposure to areas such as investment banking and mergers and acquisitions. The Goldman Sachs Group, Inc. and Lehman Brothers Holdings, Inc. were our top-performing picks in this group, and the fund also generated a gain through its position in Bank of New York Co., Inc., which as a processor for capital markets companies is a peripheral play on the sector's growth. A more recent addition in the capital markets area is Merrill Lynch & Co. Inc., which the fund purchased during the fourth quarter of 2005. A notable detractor among the fund's holdings in financials was Allstate Corp., a property and casualty insurer whose stock fell about 14% due to the increased claims that resulted from the Gulf Coast hurricanes.
Energy stocks were also a source of strong performance. While an underweight position in services stocks relative to the largest integrated companies detracted from performance, we more than made up for the shortfall via strong stock selection. Our top contributor was Amerada Hess Corp., which we identified as a turnaround story in April 2005, meaning that the fund has been able to ride the stock for a significant gain. Believing the company's exploration initiatives in Libya will lead to further growth in its bottom line, we continue to hold stock in the fund despite its sharp run-up over the past six months. Also boosting returns were positions in Burlington Resources (no longer held in the fund), Occidental Petroleum Corp. and Talisman Energy, Inc.
We added further value through our stock selection in the health care sector. An underweight position in pharmaceutical stocks, which underperformed, proved beneficial. We have begun to look for opportunities to add to this area, however, believing the main worries surrounding the pharmaceutical sector — such as rising competition from generics companies and weak pipelines of new products — are largely reflected in stock prices. Elsewhere in health care, the fund's holdings in the services stocks Caremark Rx, Inc., Cardinal Health, Inc., Aetna, Inc. and United Health Group, Inc. performed very well. Our picks in the equipment area, Medtronic, Inc. and C.R. Bard, Inc., were not as successful, but we remain confident in their longer-term prospects.
Marginal positive contributions came from the consumer and utilities sectors. In the former, our avoidance of Wal-Mart added substantial value as concerns about how rising energy prices would affect the lower-end consumer weighed heavily on the stock during the period. (Wal-Mart is a large component of the benchmark, 1.18%, and given that the stock underperformed the broader market, our non-holding was helpful to fund performance.) With this trend in mind, the fund held a larger position in higher-end brand names such as Coach, Inc. and Polo Ralph Lauren Corp., which held up better on a relative basis. Also helping performance was an underweight in media stocks — which were hurt by the migration of more advertising to the Internet — as well as a position in the retailer Costco Wholesale Corp. On the negative side, the fund's large position in Coca-Cola Co. detracted from performance. In utilities, positions in Allegheny Energy, Inc. and Edison International both made meaningful contributions to relative returns. Edison is no longer held in the fund.
Our stock selection was not as effective in technology, where holdings in the semiconductor (computer chip) companies Texas Instruments, Inc. and Intel Corp. both detracted from performance. Oracle Corp. also delivered weak relative performance. On the plus side, we added value through positions in Affiliated Computer Services, Inc. (sold in January), Accenture Ltd. "A", Motorola, Inc. and Google, Inc. (sold in October).
The fund's performance was also hurt by its ownership of Tyco International, Ltd., which in January released fourth quarter earnings that came in below the market's expectations. We believe the stock, which closed the period at $26.05, is more appropriately valued in the mid-30s.
Q: How did the fund's investment in fixed-income securities affect performance?
A: The fixed-income portion of the portfolio is invested almost entirely in Treasury Separate Trading of Registered Interest and Principal Securities (STRIPS), which are securities representing the principal payment of a Treasury security that has been "stripped" of its semiannual income component. In other words, the final payment of the bond — the return of principal — is the only payment investors receive. Such securities initially sell at a discount to their final value, and their prices gradually rise until they become fully valued at par ($1,000 per bond) on their maturity date. Since we intend to hold these securities in the fund until they mature, we expect the fund to receive their full value at this time. STRIPS tend to exhibit lower volatility the closer they are to their maturity date. The value of the fixed-income portion of the fund therefore should not pose any notable risk, since these bonds are guaranteed to be a certain price at a certain point in time. Given the relatively short amount of time until these securities mature, they exhibited a relatively low level of volatility during the semiannual period. As a result, their short-term fluctuations were not a factor in terms of performance or the way we manage the portfolio. However, we make adjustments to the level of cash and STRIPS in the portfolio every day to ensure that the fund does not violate its mandate of providing a guaranteed return upon maturity.
As the fund moves closer to its maturity date, we will continue to manage the portfolio in a conservative fashion by investing in zero-coupon bonds and high-quality, large-capitalization US equities.
The views expressed in this report reflect those of the portfolio managers only through the end of the period of the report as stated on the cover. The management team's views are subject to change at any time based on market and other conditions and should not be construed as a recommendation.
Portfolio Summary
Asset Allocation (Excludes Securities Lending Collateral) | 1/31/06 | 7/31/05 |
| | |
US Treasury Obligations | 68% | 69% |
Common Stocks | 32% | 31% |
| 100% | 100% |
Sector Diversification (As a % of Common Stocks) | 1/31/06 | 7/31/05 |
| | |
Financials | 22% | 20% |
Information Technology | 15% | 16% |
Health Care | 13% | 13% |
Industrials | 11% | 11% |
Energy | 11% | 9% |
Consumer Discretionary | 10% | 12% |
Consumer Staples | 9% | 9% |
Utilities | 3% | 4% |
Telecommunication Services | 3% | 3% |
Materials | 3% | 3% |
| 100% | 100% |
Asset allocation and sector diversification are subject to change.
Ten Largest Equity Holdings at January 31, 2006 (8.5% of Net Assets) |
1. ExxonMobil Corp. Explorer and producer of oil and gas | 1.2% |
2. Bank of America Corp. Provider of commercial banking services | 1.0% |
3. Procter & Gamble Co. Manufacturer of diversified consumer products | 0.9% |
4. Coca-Cola Co. Bottler and distributor of soft drinks | 0.8% |
5. The Goldman Sachs Group, Inc. Provider of global investment banking services | 0.8% |
6. United Technologies Corp. Manufacturer of aerospace equipment, climate control systems and elevators | 0.8% |
7. UnitedHealth Group, Inc. Operator of organized health systems | 0.8% |
8. Lehman Brothers Holdings, Inc. Provider of investment management and stock brokerage services | 0.8% |
9. Sprint Nextel Corp. Provider of telecommunication services | 0.7% |
10. Tyco International Ltd. Manufacturer of medical products, packaging, electrical and electronic components | 0.7% |
Portfolio holdings are subject to change.
For more complete details about the Fund's investment portfolio, see page 16. A quarterly Fact Sheet is available upon request. Information concerning portfolio holdings of the Fund as of month end will be posted to www.dws-scudder.com on the 15th day of the following month. Please see the Account Management Resources section for contact information.
Following the Fund's fiscal first and third quarter-end, a complete portfolio holdings listing is filed with the SEC on Form N-Q. This form will be available on the SEC's Web site at www.sec.gov, and it also may be reviewed and copied at the SEC's Public Reference Room in Washington, D.C. Information on the operation of the SEC's Public Reference Room may be obtained by calling (800) SEC-0330.
Investment Portfolio as of January 31, 2006 (Unaudited)
|
Shares
| Value ($) |
| |
Common Stocks 31.4% |
Consumer Discretionary 2.9% |
Auto Components 0.2% |
Johnson Controls, Inc. | 1,330 | 92,089 |
Household Durables 0.5% |
Black & Decker Corp. | 1,850 | 159,655 |
Pulte Homes, Inc. | 2,020 | 80,598 |
| 240,253 |
Media 0.5% |
CBS Corp. "B" | 3,115 | 81,395 |
Clear Channel Communications, Inc. | 2,610 | 76,395 |
Viacom, Inc. "B"* | 3,115 | 129,210 |
| 287,000 |
Multiline Retail 0.9% |
Federated Department Stores, Inc. | 1,960 | 130,595 |
J.C. Penney Co., Inc. | 3,550 | 198,090 |
Target Corp. | 2,170 | 118,807 |
| 447,492 |
Specialty Retail 0.4% |
Home Depot, Inc. | 2,470 | 100,159 |
Staples, Inc. | 4,200 | 99,582 |
| 199,741 |
Textiles, Apparel & Luxury Goods 0.4% |
Coach, Inc.* | 3,160 | 113,602 |
Polo Ralph Lauren Corp. | 1,690 | 95,722 |
| 209,324 |
Consumer Staples 3.0% |
Beverages 1.3% |
Coca-Cola Co. | 10,070 | 416,697 |
PepsiCo, Inc. | 3,480 | 198,986 |
| 615,683 |
Food & Staples Retailing 0.2% |
Costco Wholesale Corp. | 2,240 | 111,754 |
Food Products 0.6% |
General Mills, Inc. | 3,120 | 151,663 |
Kellogg Co. | 3,660 | 157,014 |
| 308,677 |
Household Products 0.9% |
Procter & Gamble Co. | 7,810 | 462,586 |
Energy 3.3% |
Energy Equipment & Services 0.5% |
Cooper Cameron Corp.* | 740 | 35,809 |
Halliburton Co. | 1,260 | 100,233 |
Schlumberger Ltd. | 830 | 105,783 |
| 241,825 |
Oil, Gas & Consumable Fuels 2.8% |
Amerada Hess Corp. | 2,120 | 328,176 |
Chevron Corp. | 5,090 | 302,244 |
ExxonMobil Corp. | 9,586 | 601,522 |
Occidental Petroleum Corp. | 920 | 89,893 |
Talisman Energy, Inc. | 1,400 | 85,302 |
| 1,407,137 |
Financials 6.8% |
Banks 2.3% |
Bank of America Corp. | 11,470 | 507,318 |
US Bancorp. | 3,620 | 108,274 |
Wachovia Corp. | 4,630 | 253,863 |
Wells Fargo & Co. | 3,000 | 187,080 |
Zions Bancorp. | 1,580 | 124,931 |
| 1,181,466 |
Capital Markets 2.2% |
Bank of New York Co., Inc. | 2,470 | 78,571 |
Lehman Brothers Holdings, Inc. | 2,690 | 377,811 |
Merrill Lynch & Co., Inc. | 3,290 | 246,980 |
The Goldman Sachs Group, Inc. | 2,830 | 399,737 |
| 1,103,099 |
Diversified Financial Services 0.7% |
Citigroup, Inc. | 2,383 | 111,000 |
Countrywide Financial Corp. | 3,130 | 104,667 |
JPMorgan Chase & Co. | 3,000 | 119,250 |
| 334,917 |
Insurance 1.6% |
AFLAC, Inc. | 4,030 | 189,209 |
Allstate Corp. | 3,480 | 181,134 |
Hartford Financial Services Group, Inc. | 1,010 | 83,052 |
MetLife, Inc. | 6,600 | 331,056 |
| 784,451 |
Health Care 4.1% |
Biotechnology 0.7% |
Amgen, Inc.* | 1,940 | 141,407 |
Genzyme Corp.* | 1,730 | 122,726 |
Invitrogen Corp.* | 1,400 | 96,432 |
| 360,565 |
Health Care Equipment & Supplies 0.8% |
C.R. Bard, Inc. | 2,250 | 142,695 |
Medtronic, Inc. | 4,290 | 242,256 |
| 384,951 |
Health Care Providers & Services 1.8% |
Aetna, Inc. | 1,380 | 133,584 |
Cardinal Health, Inc. | 1,870 | 134,715 |
Caremark Rx, Inc.* | 1,950 | 96,135 |
UnitedHealth Group, Inc. | 6,590 | 391,578 |
WellPoint, Inc.* | 1,750 | 134,400 |
| 890,412 |
Pharmaceuticals 0.8% |
Johnson & Johnson | 4,870 | 280,220 |
Pfizer, Inc. | 5,420 | 139,185 |
| 419,405 |
Industrials 3.5% |
Aerospace & Defense 1.8% |
Boeing Co. | 4,240 | 289,634 |
Goodrich Corp. | 3,490 | 137,401 |
Lockheed Martin Corp. | 1,290 | 87,269 |
United Technologies Corp. | 6,810 | 397,500 |
| 911,804 |
Electrical Equipment 0.5% |
Emerson Electric Co. | 3,020 | 233,899 |
Industrial Conglomerates 1.2% |
General Electric Co. | 7,830 | 256,433 |
Tyco International Ltd. | 13,390 | 348,809 |
| 605,242 |
Information Technology 4.9% |
Communications Equipment 0.7% |
Cisco Systems, Inc.* | 9,560 | 177,529 |
Motorola, Inc. | 8,220 | 186,676 |
| 364,205 |
Computers & Peripherals 1.2% |
Apple Computer, Inc.* | 1,430 | 107,979 |
EMC Corp.* | 16,540 | 221,636 |
International Business Machines Corp. | 3,340 | 271,542 |
| 601,157 |
Internet Software & Services 0.2% |
eBay, Inc.* | 2,720 | 117,232 |
IT Consulting & Services 0.6% |
Accenture Ltd. "A" | 6,890 | 217,242 |
Automatic Data Processing, Inc. | 1,370 | 60,198 |
| 277,440 |
Semiconductors & Semiconductor Equipment 1.3% |
Applied Materials, Inc. | 5,500 | 104,775 |
Intel Corp. | 10,740 | 228,440 |
Texas Instruments, Inc. | 10,350 | 302,530 |
| 635,745 |
Software 0.9% |
Business Objects SA (ADR)* | 1,960 | 81,340 |
Microsoft Corp. | 10,210 | 287,412 |
Oracle Corp.* | 7,920 | 99,554 |
| 468,306 |
Materials 0.9% |
Chemicals |
Dow Chemical Co. | 5,130 | 216,999 |
Monsanto Co. | 910 | 76,995 |
PPG Industries, Inc. | 2,660 | 158,270 |
| 452,264 |
Telecommunication Services 1.0% |
Diversified Telecommunication Services 0.2% |
AT&T, Inc. | 4,250 | 110,288 |
Wireless Telecommunication Services 0.8% |
Sprint Nextel Corp. | 16,170 | 370,131 |
Utilities 1.0% |
Electric Utilities 0.5% |
Allegheny Energy, Inc.* | 3,550 | 123,504 |
Exelon Corp. | 2,500 | 143,550 |
| 267,054 |
Independent Power Producers & Energy Traders 0.5% |
Constellation Energy Group | 2,250 | 131,108 |
TXU Corp. | 2,560 | 129,638 |
| 260,746 |
Total Common Stocks (Cost $13,176,118) | 15,758,340 |
| Principal Amount ($) | Value ($) |
| |
US Treasury Obligations 68.4% |
US Treasury STRIPS 4.569%**, 2/15/2013 (a) (Cost $34,693,501) | 47,122,000 | 34,284,129 |
|
Contracts
| Value ($) |
| |
Put Options Purchased 0.0% |
Amerada Hess Corp.(Cost $10,790) | 14 | 7,000 |
|
Shares
| Value ($) |
| |
Securities Lending Collateral 30.6% |
Daily Assets Fund Institutional, 4.35% (b) (c) (Cost $15,314,805) | 15,314,805 | 15,314,805 |
|
Cash Equivalents 0.3% |
Cash Management QP Trust, 4.33% (d) (Cost $130,664) | 130,664 | 130,664 |
| % of Net Assets | Value ($) |
| |
Total Investment Portfolio (Cost $63,325,878)+ | 130.7 | 65,494,938 |
Other Assets and Liabilities, Net | (30.7) | (15,378,849) |
Net Assets | 100.0 | 50,116,089 |
* Non-income producing security.
** Bond equivalent yield to maturity; not a coupon rate.
+ The cost for federal income tax purposes was $63,430,547. At January 31, 2006, net unrealized appreciation for all securities based on tax cost was $2,064,391. This consisted of aggregate gross unrealized appreciation for all securities in which there was an excess of value over tax cost of $2,762,004 and aggregate gross unrealized depreciation for all securities in which there was an excess of tax cost over value of $697,613.
(a) All or a portion of these securities were on loan (See Notes to Financial Statements). The value of all securities loaned at January 31, 2006 amounted to $15,006,436 which is 29.9% of net assets.
(b) Daily Assets Fund Institutional, an affiliated fund, is managed by Deutsche Asset Management, Inc. The rate shown is the annualized seven-day yield at period end.
(c) Represents collateral held in connection with securities lending.
(d) Cash Management QP Trust, an affiliated fund, is managed by Deutsche Investment Management Americas Inc. The rate shown is the annualized seven-day yield at period end.
ADR: American Depositary Receipt
STRIPS: Separate Trading of Registered Interest and Principal Securities.
At January 31, 2006, open written options were as follows:
Written Options | Number of Contracts | Expiration Date | Strike Price ($) | Value ($) |
Call Options Amerada Hess Corp. | 14 | 5/20/2006 | 160.0 | (13,020) |
Total outstanding written options (premiums received $8,921) | (13,020) |
The accompanying notes are an integral part of the financial statements.
Financial Statements
Statement of Assets and Liabilities as of January 31, 2006 (Unaudited) |
Assets |
Investments: Investments in securities, at value (cost $47,880,409) — including $15,006,436 of securities loaned | $ 50,049,469 |
Investment in Cash Management QP Trust (cost $130,664) | 130,664 |
Investment in Daily Assets Fund Institutional (cost $15,314,805)* | 15,314,805 |
Total investments in securities, at value (cost $63,325,878) | 65,494,938 |
Cash | 10,000 |
Receivable for investments sold | 31,365 |
Dividends receivable | 7,538 |
Interest receivable | 4,919 |
Other assets | 14,787 |
Total assets | 65,563,547 |
Liabilities |
Payable for Fund shares redeemed | 36,604 |
Payable upon return of securities loaned | 15,314,805 |
Written options, at value (premiums received $8,921) | 13,020 |
Accrued management fee | 24,058 |
Other accrued expenses and payables | 58,971 |
Total liabilities | 15,447,458 |
Net assets, at value | $ 50,116,089 |
Net Assets |
Net assets consist of: Undistributed net investment income | 526,285 |
Net unrealized appreciation (depreciation) on: Investments | 2,169,060 |
Written options | (4,099) |
Accumulated net realized gain (loss) | (370,368) |
Paid-in capital | 47,795,211 |
Net assets, at value | $ 50,116,089 |
Net Asset Value |
Net Asset Value and redemption price(a) per share ($50,116,089 ÷ 5,481,613 outstanding shares of beneficial interest, $.01 par value, unlimited number of shares authorized) | $ 9.14 |
* Represents collateral on securities loaned.
(a) Redemption price per share for shares held less than 15 days is equal to net asset value less a 2% redemption fee.
The accompanying notes are an integral part of the financial statements.
Statement of Operations for the six months ended January 31, 2006 (Unaudited) |
Investment Income |
Income: Dividends | $ 123,814 |
Interest | 776,596 |
Interest — Cash Management QP Trust | 3,922 |
Securities lending income, including income from Daily Assets Fund Institutional, net of borrower rebates | 3,749 |
Total Income | 908,081 |
Expenses: Management fee | 130,311 |
Distribution service fees | 64,581 |
Services to shareholders | 48,440 |
Custodian fees | 5,453 |
Auditing | 17,158 |
Legal | 4,898 |
Trustees' fees and expenses | 9,772 |
Reports to shareholders | 8,804 |
Registration fees | 8,122 |
Other | 2,974 |
Total expenses before expense reductions | 300,513 |
Expense reductions | (1,866) |
Total expenses after expense reductions | 298,647 |
Net investment income (loss) | 609,434 |
Realized and Unrealized Gain (Loss) on Investment Transactions |
Net realized gain (loss) from: Investments | 1,007,126 |
Written options | 522 |
| 1,007,648 |
Net unrealized appreciation (depreciation) during the period on: Investments | (1,207,300) |
Written options | (3,541) |
| (1,210,841) |
Net gain (loss) on investment transactions | (203,193) |
Net increase (decrease) in net assets resulting from operations | $ 406,241 |
The accompanying notes are an integral part of the financial statements.
Statement of Changes in Net Assets |
Increase (Decrease) in Net Assets | Six Months Ended January 31, 2006 (Unaudited) | Year Ended July 31, 2005 |
Operations: Net investment income (loss) | $ 609,434 | $ 1,375,570 |
Net realized gain (loss) on investment transactions | 1,007,648 | 2,809,576 |
Net unrealized appreciation (depreciation) during the period on investment transactions | (1,210,841) | 368,570 |
Net increase (decrease) in net assets resulting from operations | 406,241 | 4,553,716 |
Distributions to shareholders from: Net investment income | (1,308,193) | (1,474,123) |
Fund share transactions: | | |
Reinvestment of distributions | 1,273,782 | 1,428,655 |
Cost of shares redeemed | (3,689,927) | (8,374,188) |
Net increase (decrease) in net assets from Fund share transactions | (2,416,145) | (6,945,533) |
Increase (decrease) in net assets | (3,318,097) | (3,865,940) |
Net assets at beginning of period | 53,434,186 | 57,300,126 |
Net assets at end of period (including undistributed net investment income of $526,285 and $1,225,044, respectively) | $ 50,116,089 | $ 53,434,186 |
Other Information |
Shares outstanding at beginning of period | 5,740,684 | 6,498,995 |
Shares issued to shareholders in reinvestment of distributions | 139,211 | 156,308 |
Shares redeemed | (398,282) | (914,619) |
Net increase (decrease) in Fund shares | (259,071) | (758,311) |
Shares outstanding at end of period | 5,481,613 | 5,740,684 |
The accompanying notes are an integral part of the financial statements.
Financial Highlights
Years Ended July 31, | 2006a | 2005 | 2004 | 2003 | 2002 | 2001 |
Selected Per Share Data |
Net asset value, beginning of period | $ 9.31 | $ 8.82 | $ 8.35 | $ 8.53 | $ 9.54 | $ 11.08 |
Income (loss) from investment operations: Net investment income (loss)b | .11 | .22 | .21 | .16 | .15 | .29 |
Net realized and unrealized gain (loss) on investment transactions | (.04) | .51 | .43 | (.18) | (.82) | (.74) |
Total from investment operations | .07 | .73 | .64 | (.02) | (.67) | (.45) |
Less distributions from: Net investment income | (.24) | (.24) | (.17) | (.16) | (.20) | (.31) |
Net realized gain on investment transactions | — | — | — | — | (.14) | (.78) |
Total distributions | (.24) | (.24) | (.17) | (.16) | (.34) | (1.09) |
Net asset value, end of period | $ 9.14 | $ 9.31 | $ 8.82 | $ 8.35 | $ 8.53 | $ 9.54 |
Total Return (%)c | .75** | 8.33 | 7.70 | (.21) | (7.18) | (4.12) |
Ratios to Average Net Assets and Supplemental Data |
Net assets, end of period ($ millions) | 50 | 53 | 57 | 61 | 75 | 93 |
Ratio of expenses before expense reductions (%) | 1.15* | 1.18 | 1.07 | .97 | .95 | 1.00d |
Ratio of expenses after expense reductions (%) | 1.15* | 1.18 | 1.07 | .97 | .95 | .98d |
Ratio of net investment income (loss) (%) | 2.33* | 2.45 | 2.36 | 1.83 | 1.64 | 2.84 |
Portfolio turnover rate (%) | 32* | 26 | 10 | 87 | 102 | 47 |
a For the six months ended January 31, 2006 (Unaudited). b Based on average shares outstanding during the period. c Total return does not reflect the effect of any sales charges. d The ratios of operating expenses excluding costs incurred in connection with a fund complex reorganization before and after expenses reductions were .97% and .97%, respectively. * Annualized ** Not annualized |
Notes to Financial Statements (Unaudited)
A. Significant Accounting Policies
DWS Target 2013 Fund (formerly Scudder Target 2013 Fund) is a diversified series of DWS Target Fund (formerly Scudder Target Fund) (the "Trust") which is registered under the Investment Company Act of 1940, as amended (the "1940 Act"), as an open-end management investment company organized as a Massachusetts business trust. The objective of the Fund is to provide a guaranteed return of investment on the Maturity Date (February 15, 2013) to investors who reinvest all dividends and hold their shares to the Maturity Date, and to provide long-term growth of capital.
The assurance that investors who reinvest all dividends and hold their shares until the Maturity Date will receive at least their original investment on the Maturity Date is provided by the principal amount of the zero coupon US Treasury obligations in the Fund's portfolio. This assurance is further backed by an agreement entered into by Deutsche Investment Management Americas Inc. ("DeIM" or the "Advisor"), an indirect, wholly owned subsidiary of Deutsche Bank AG, the Fund's investment manager. Fund shares were sold during limited offering periods, and are redeemable on a continuous basis.
The Fund's financial statements are prepared in accordance with accounting principles generally accepted in the United States of America which require the use of management estimates. Actual results could differ from those estimates. The policies described below are followed consistently by the Fund in the preparation of its financial statements.
Security Valuation. Investments are stated at value determined as of the close of regular trading on the New York Stock Exchange on each day the exchange is open for trading. Equity securities are valued at the most recent sale price or official closing price reported on the exchange (US or foreign) or over-the-counter market on which the security is traded most extensively. Securities for which no sales are reported are valued at the calculated mean between the most recent bid and asked quotations on the relevant market or, if a mean cannot be determined, at the most recent bid quotation.
Debt securities are valued by independent pricing services approved by the Trustees of the Fund. If the pricing services are unable to provide valuations, the securities are valued at the most recent bid quotation or evaluated price, as applicable, obtained from a broker-dealer. Such services may use various pricing techniques which take into account appropriate factors such as yield, quality, coupon rate, maturity, type of issue, trading characteristics and other data, as well as broker quotes.
Money market instruments purchased with an original or remaining maturity of sixty days or less, maturing at par, are valued at amortized cost. Investments in open-end investment companies and Cash Management QP Trust are valued at their net asset value each business day.
Securities and other assets for which market quotations are not readily available or for which the above valuation procedures are deemed not to reflect fair value are valued in a manner that is intended to reflect their fair value as determined in accordance with procedures approved by the Trustees.
Securities Lending. The Fund may lend securities to financial institutions. The Fund retains beneficial ownership of the securities it has loaned and continues to receive interest and dividends paid by the securities and to participate in any changes in their market value. The Fund requires the borrowers of the securities to maintain collateral with the Fund consisting of liquid, unencumbered assets having a value at least equal to the value of the securities loaned. The Fund may invest the cash collateral into a joint trading account in an affiliated money market fund pursuant to Exemptive Orders issued by the SEC. The Fund receives compensation for lending its securities either in the form of fees or by earning interest on invested cash collateral net of fees paid to the lending agent. Either the Fund or the borrower may terminate the loan. The Fund is subject to all investment risks associated with the value of any cash collateral received, including, but not limited to, interest rate, credit and liquidity risk associated with such investments.
Options. An option contract is a contract in which the writer of the option grants the buyer of the option the right to purchase from (call option), or sell to (put option), the writer a designated instrument at a specified price within a specified period of time. Certain options, including options on indices, will require cash settlement by the Fund if the option is exercised. The Fund may enter into option contracts in order to hedge against potential adverse price movements in the value of portfolio assets; as a temporary substitute for selling selected investments; to lock in the purchase price of a security or currency which it expects to purchase in the near future; as a temporary substitute for purchasing selected investments; and to enhance potential gain.
The liability representing the Fund's obligation under an exchange traded written option or investment in a purchased option is valued at the last sale price or, in the absence of a sale, the mean between the closing bid and asked prices or at the most recent asked price (bid for purchased options) if no bid and asked price are available. Over-the-counter written or purchased options are valued using dealer supplied quotations. Gain or loss is recognized when the option contract expires or is closed.
If the Fund writes a covered call option, the Fund foregoes, in exchange for the premium, the opportunity to profit during the option period from an increase in the value of the underlying security above the exercise price. If the Fund writes a put option it accepts the risk of a decline in the value of the underlying security below the exercise price. Over-the-counter options have the risk of the potential inability of counterparties to meet the terms of their contracts. The Fund's maximum exposure to purchased options is limited to the premium initially paid. In addition, certain risks may arise upon entering into option contracts including the risk that an illiquid secondary market will limit the Fund's ability to close out an option contract prior to the expiration date and that a change in the value of the option contract may not correlate exactly with changes in the value of the securities or currencies hedged.
Federal Income Taxes. The Fund's policy is to comply with the requirements of the Internal Revenue Code, as amended, which are applicable to regulated investment companies, and to distribute all of its taxable income to its shareholders. Accordingly, the Fund paid no federal income taxes and no federal income tax provision was required.
Distribution of Income and Gains. Net investment income of the Fund, if any, is declared and distributed to shareholders annually. Net realized gains from investment transactions, in excess of available capital loss carryforwards, would be taxable to the Fund if not distributed, and, therefore, will be distributed to shareholders at least annually.
The timing and characterization of certain income and capital gains distributions are determined annually in accordance with federal tax regulations which may differ from accounting principles generally accepted in the United States of America. As a result, net investment income (loss) and net realized gain (loss) on investment transactions for a reporting period may differ significantly from distributions during such period. Accordingly, the Fund may periodically make reclassifications among certain of its capital accounts without impacting the net asset value of the Fund.
The tax character of current year distributions will be determined at the end of the current fiscal year.
Expenses. Expenses of the Trust arising in connection with a specific Fund are allocated to that Fund. Other Trust expenses which cannot be directly attributed to a Fund are apportioned among the Funds in the Trust.
Contingencies. In the normal course of business, the Fund may enter into contracts that contain a variety of representations which provide general indemnifications. The Fund's maximum exposure under these arrangements is unknown as this would involve future claims that may be made against the Fund that have not yet been made. However, based on experience, the Fund expects the risk of loss to be remote.
Other. Investment transactions are accounted for on a trade date plus one basis for daily net asset value calculations. However, for financial reporting purposes, investment security transactions are reported on trade date. Interest income is recorded on the accrual basis. Dividend income is recorded on the ex-dividend date. Realized gains and losses from investment transactions are recorded on an identified cost basis. All premiums and discounts are amortized/accreted for both tax and financial reporting purposes.
B. Purchases and Sales of Securities
During the six months ended January 31, 2006, purchases and sales of investment securities (excluding short-term instruments and US Treasury obligations) aggregated $8,410,337 and $10,045,845, respectively. Purchases and sales of US Treasury obligations aggregated $0 and $2,343,903, respectively.
For the six months ended January 31, 2006, transactions for written call options on securities were as follows:
| Number of Contracts | Premium |
Outstanding, beginning of period | 12 | $ 522 |
Options written | 14 | 8,921 |
Options closed | — | — |
Options exercised | — | — |
Options expired | (12) | (522) |
Outstanding, end of period | 14 | $ 8,921 |
C. Related Parties
Management Agreement. Under the Management Agreement, the Advisor directs the investments of the Fund in accordance with its investment objectives, policies and restrictions. The Advisor determines the securities, instruments and other contracts relating to investments to be purchased, sold or entered into by the Fund. In addition to portfolio management services, the Advisor provides certain administrative services in accordance with the Management Agreement. The management fee payable under the Management Agreement is equal to an annual rate of 0.50% of average daily net assets, computed and accrued daily and payable monthly.
Service Provider Fees. DWS Scudder Investments Service Company ("DWS-SISC"), an affiliate of the Advisor, is the Fund's transfer agent, dividend-paying agent and shareholder service agent. Pursuant to a sub-transfer agency agreement between DWS-SISC and DST Systems, Inc. ("DST"), DWS-SISC has delegated certain transfer agent and dividend paying agent functions to DST. DWS-SISC compensates DST out of the shareholder servicing fee it receives from the Fund. For the six months ended January 31, 2006, the amount charged to the Fund by DWS-SISC aggregated $38,082, of which $16,914 is unpaid.
Distribution Service Agreement. Under the Distribution Service Agreement, in accordance with Rule 12b-1 under the 1940 Act, DWS Scudder Distributors, Inc. ("DWS-SDI"), a subsidiary of the Advisor, provides information and administrative services ("Service Fee") to shareholders at an annual rate of up to 0.25% of average daily net assets. DWS-SDI in turn has various agreements with financial services firms that provide these services and pays these fees based upon the assets of shareholder accounts the firms service. For the six months ended January 31, 2006, the Service Fee was $64,581, of which $10,038 is unpaid. Accordingly, for the six months ended January 31, 2006, the Service Fee was equivalent to an annualized effective rate of 0.25% of the Fund's average daily net assets.
Typesetting and Filing Service Fees. Under an agreement with DeIM, the Advisor is compensated for providing typesetting and regulatory filing services to the Fund. For the six months ended January 31, 2006, the amount charged to the Fund by DeIM included in the reports to shareholders aggregated $5,400, all of which is unpaid at January 31, 2006.
Trustees' Fees and Expenses. The Fund pays each Trustee not affiliated with the Advisor retainer fees plus specified amounts for attended board and committee meetings.
Cash Management QP Trust. Pursuant to an Exemptive Order issued by the SEC, the Fund may invest in the Cash Management QP Trust (the "QP Trust") and other affiliated funds managed by the Advisor. The QP Trust seeks to provide as high a level of current income as is consistent with the preservation of capital and the maintenance of liquidity. The QP Trust does not pay the Advisor a management fee for the affiliated funds' investments in the QP Trust.
D. Expense Reductions
For the six months ended January 31, 2006, the Advisor agreed to reimburse the Fund $1,818, which represents a portion of the fee savings expected to be realized by the Advisor related to the outsourcing by the Advisor of certain administrative services to an unaffiliated service provider.
In addition, the Fund has entered into an arrangement with its custodian whereby credits realized as a result of uninvested cash balances are used to reduce a portion of the Fund's custodian expenses. During the six months ended January 31, 2006, the Fund's custodian fees were reduced by $48 for custody credits earned.
E. Line of Credit
The Fund and several other affiliated funds (the "Participants") share in a $1.1 billion revolving credit facility administered by J.P. Morgan Chase Bank for temporary or emergency purposes, including the meeting of redemption requests that otherwise might require the untimely disposition of securities. The Participants are charged an annual commitment fee which is allocated, based upon net assets, among each of the Participants. Interest is calculated at the Federal Funds Rate plus 0.5 percent. The Fund may borrow up to a maximum of 33 percent of its net assets under the agreement.
F. Regulatory Matters and Litigation
Market Timing Related Regulatory and Litigation Matters. Since at least July 2003, federal, state and industry regulators have been conducting ongoing inquiries and investigations ("inquiries") into the mutual fund industry, and have requested information from numerous mutual fund companies, including DWS Scudder. The DWS funds' advisors have been cooperating in connection with these inquiries and are in discussions with the regulators concerning proposed settlements. Publicity about mutual fund practices arising from these industry-wide inquiries serves as the general basis of a number of private lawsuits against the DWS funds. These lawsuits, which previously have been reported in the press, involve purported class action and derivative lawsuits, making various allegations and naming as defendants various persons, including certain DWS funds, the funds' investment advisors and their affiliates, and certain individuals, including in some cases fund Trustees/Directors, officers, and other parties. Each DWS fund's investment advisor has agreed to indemnify the applicable DWS funds in connection with these lawsuits, or other lawsuits or regulatory actions that may be filed making allegations similar to these lawsuits regarding market timing, revenue sharing, fund valuation or other subjects arising from or related to the pending inquiries. It is not possible to determine with certainty what the outcome of these inquiries will be or what the effect, if any, would be on the funds or their advisors.
With respect to the lawsuits, based on currently available information, the funds' investment advisors believe the likelihood that the pending lawsuits will have a material adverse financial impact on a DWS fund is remote and such actions are not likely to materially affect their ability to perform under their investment management agreements with the DWS funds.
With respect to the regulatory matters, Deutsche Asset Management ("DeAM") has advised the funds as follows:
DeAM expects to reach final agreements with regulators early in 2006 regarding allegations of improper trading in the DWS funds. DeAM expects that it will reach settlement agreements with the Securities and Exchange Commission, the New York Attorney General and the Illinois Secretary of State providing for payment of disgorgement, penalties, and investor education contributions totaling approximately $134 million. Approximately $127 million of this amount would be distributed to shareholders of the affected DWS funds in accordance with a distribution plan to be developed by an independent distribution consultant. DeAM does not believe that any of the DWS funds will be named as respondents or defendants in any proceedings. The funds' investment advisors do not believe these amounts will have a material adverse financial impact on them or materially affect their ability to perform under their investment management agreements with the DWS funds. The above-described amounts are not material to Deutsche Bank, and they have already been reserved.
Based on the settlement discussions thus far, DeAM believes that it will be able to reach a settlement with the regulators on a basis that is generally consistent with settlements reached by other advisors, taking into account the particular facts and circumstances of market timing at DeAM and at the legacy Scudder and Kemper organizations prior to their acquisition by DeAM in April 2002. Among the terms of the expected settled orders, DeAM would be subject to certain undertakings regarding the conduct of its business in the future, including maintaining existing management fee reductions for certain funds for a period of five years. DeAM expects that these settlements would resolve regulatory allegations that it violated certain provisions of federal and state securities laws (i) by entering into trading arrangements that permitted certain investors to engage in market timing in certain DWS funds and (ii) by failing more generally to take adequate measures to prevent market timing in the DWS funds, primarily during the 1999-2001 period. With respect to the trading arrangements, DeAM expects that the settlement documents will include allegations related to one legacy DeAM arrangement, as well as three legacy Scudder and six legacy Kemper arrangements. All of these trading arrangements originated in businesses that existed prior to the current DeAM organization, which came together in April 2002 as a result of the various mergers of the legacy Scudder, Kemper and Deutsche fund groups, and all of the arrangements were terminated prior to the start of the regulatory investigations that began in the summer of 2003. No current DeAM employee approved the trading arrangements.
There is no certainty that the final settlement documents will contain the foregoing terms and conditions. The independent Trustees/Directors of the DWS funds have carefully monitored these regulatory investigations with the assistance of independent legal counsel and independent economic consultants. Additional information announced by DeAM regarding the terms of the expected settlements will be made available at www.dws-scudder.com/regulatory_settlements, which will also disclose the terms of any final settlement agreements once they are announced.
Other Regulatory Matters. DeAM is also engaged in settlement discussions with the Enforcement Staffs of the SEC and the NASD regarding DeAM's practices during 2001-2003 with respect to directing brokerage commissions for portfolio transactions by certain DWS funds to broker-dealers that sold shares in the DWS funds and provided enhanced marketing and distribution for shares in the DWS funds. In addition, on January 13, 2006, DWS Scudder Distributors, Inc. received a Wells notice from the Enforcement Staff of the NASD regarding DWS Scudder Distributors' payment of non-cash compensation to associated persons of NASD member firms, as well as DWS Scudder Distributors' procedures regarding non-cash compensation regarding entertainment provided to such associated persons. Additional information announced by DeAM regarding the terms of the expected settlements will be made available at www.dws-scudder.com/regulatory_settlements, which will also disclose the terms of any final settlement agreements once they are announced.
G. Payments made by Affiliates and Investment Restriction Violations
During the six months ended January 31, 2006, the Advisor fully reimbursed the Fund $25,656 for losses incurred on a trade executed incorrectly.
H. Subsequent Event
Effective February 6, 2006, Scudder Investments changed its name to DWS Scudder and Scudder funds were renamed DWS funds.
Investment Management Agreement Approval
The Board of Trustees, including the Independent Trustees, approved the renewal of your Fund's investment management agreement (the "Agreement") with Deutsche Investment Management Americas Inc. ("DeIM" or the "Advisor") in September 2005. As part of its review process, the Board requested and evaluated all information it deemed reasonably necessary to evaluate the Agreement. Over the course of several months, the Contract Review Committee, in coordination with the Equity Oversight Committee and the Operations Committee of the Board, reviewed comprehensive materials received from the Advisor, independent third parties and independent counsel. The Board also received extensive information throughout the year regarding performance and operating results of the Fund. After their review of the information received, the Committees presented their findings and recommendations to the Independent Trustees as a group. The Independent Trustees then reviewed the Committees' findings and recommendations and presented their recommendations to the full Board.
In connection with the contract review process, the various Committees and the Board considered the factors discussed below, among others. The Board also considered that the Advisor and its predecessors have managed the Fund since its inception, and the Board believes that a long-term relationship with a capable, conscientious advisor is in the best interests of the Fund. The Board considered, generally, that shareholders invested in the Fund, or approved the investment management agreement for the Fund, knowing that the Advisor managed the Fund and knowing the investment management fee schedule. In connection with recent and ongoing efforts by Deutsche Bank to restructure its US mutual fund business, which resulted in turnover of senior management and other personnel of the Advisor, the Board considered Deutsche Bank's commitment that it will devote to the Advisor and its affiliates all attention and resources that are necessary to provide the Fund with top-quality investment management and shareholder, administrative and product distribution services.
Nature, Quality and Extent of Services. The Board considered the nature, extent and quality of services provided under the Agreement, including portfolio management services and administrative services. The Board considered the experience and skills of senior management and investment personnel, the resources made available to such personnel, the ability of the Advisor to attract and retain high-quality personnel, the impact of recent changes in investment personnel and the organizational depth and stability of the Advisor. The Board reviewed the Fund's performance over short-term and long-term periods, and compared those returns to various agreed-upon performance measures, including market indices and peer groups. The Board considered whether investment results were consistent with the Fund's investment objectives and policies. The Board also noted that it has put a process into place of identifying "Focus Funds" (e.g., funds performing poorly relative to their peer group), and receives more frequent reporting and information from the Advisor regarding such funds, along with the Advisor's remedial plans to address underperformance. The Board believes this process is an effective manner of addressing poorly performing funds at this time.
On the basis of this evaluation and the ongoing review of investment results by the Equity Oversight Committee, the Board concluded that the nature, quality and extent of services provided by the Advisor historically have been and continue to be satisfactory, and that the Fund's performance over time was satisfactory.
Fees and Expenses. The Board considered the Fund's management fee rate, operating expenses and total expense ratio, and compared management fees to a peer group and total expenses to a broader peer universe based on information and data supplied by Lipper Inc. ("Lipper"). For purposes of this comparison, the Board relied on historical data compiled by Lipper for the peer funds and the Advisor's estimate of current expenses for the Fund. The information provided to the Board showed that the Fund's management fee rate was below the median of the peer group, and that the Fund's total expense ratio was below the median of the peer universe. The Board also considered the Fund's management fee rates as compared to fees charged by the Advisor and certain of its affiliates for comparable mutual funds.
On the basis of the information provided, the Board concluded that management fees were reasonable and appropriate in light of the nature, quality and extent of services provided by the Advisor.
Profitability. The Board reviewed detailed information regarding revenues received by the Advisor under the Agreement. The Board considered the estimated costs and pre-tax profits realized by the Advisor from advising the DWS Funds, as well as estimates of the pre-tax profits attributable to managing the Fund in particular. The Board also received information regarding the estimated enterprisewide profitability of the DWS organization with respect to all fund services in totality and by fund. The Board reviewed DeIM's methodology in allocating its costs to the management of the Fund. Although the Board noted the inherently subjective nature of any allocation methodology, the Board received an attestation report from an accounting firm affirming that the allocation methods were consistently applied and were based upon practices commonly used in the investment management industry. The Board noted that, based on the information provided, the Advisor operated the Fund at a loss.
Economies of Scale. The Board considered whether there are economies of scale with respect to the management of the Fund and whether the Fund benefits from any economies of scale. The Board considered whether the management fee rate under the Agreement is reasonable in relation to the asset size of the Fund. The Board concluded that the management fee schedule reflects an appropriate level of sharing of any economies of scale.
Other Benefits to DeIM and Its Affiliates. The Board also considered the character and amount of other incidental benefits received by DeIM and its affiliates, including fees received by the Advisor for administrative services provided to the Fund and fees received by an affiliate of the Advisor for shareholder-related services. The Board also considered benefits to DeIM related to brokerage and soft-dollar allocations, which pertain primarily to funds investing in equity securities. The Board considered that, during the past year, the Advisor agreed to cease allocating brokerage to acquire research services from third-party service providers. The Board concluded that management fees were reasonable in light of these fallout benefits.
Regulatory Matters. The Board also considered information regarding ongoing inquiries of the Advisor regarding market timing, late trading and other matters by federal and state regulators and private lawsuits on related topics. Among other matters, the Board considered the Advisor's commitment to indemnify the DWS Funds against regulatory actions or lawsuits arising from such inquiries. The Board also considered management's representation that such actions will not materially impact the Advisor's ability to perform under the Agreement or materially impact the Fund.
Based on all of the information considered and the conclusions reached, the Board (including a majority of the Independent Trustees) determined that the terms of the Agreement continue to be fair and reasonable and that the continuation of the Agreement is in the best interests of the Fund. No single factor was determinative in the Board's analysis.
Account Management Resources
|
Automated Information Lines | InvestorACCESS (800) 972-3060 Personalized account information, information on other DWS funds and services via touchtone telephone, and the ability to exchange or redeem shares. |
Web Site | www.dws-scudder.com View your account transactions and balances, trade shares, monitor your asset allocation, and change your address, 24 hours a day. Obtain prospectuses and applications, blank forms, interactive worksheets, news about DWS funds, subscription to fund updates by e-mail, retirement planning information, and more. |
For More Information | (800) 621-1048 To speak with a DWS Scudder service representative. |
Written Correspondence | DWS Scudder PO Box 219356
Kansas City, MO 64121-9356 |
Proxy Voting | A description of the fund's policies and procedures for voting proxies for portfolio securities and information about how the fund voted proxies related to its portfolio securities during the 12-month period ended June 30 is available on our Web site — www.dws-scudder.com (click on "proxy voting"at the bottom of the page) — or on the SEC's Web site — www.sec.gov. To obtain a written copy of the fund's policies and procedures without charge, upon request, call us toll free at 1-800-621-1048. |
Principal Underwriter | If you have questions, comments or complaints, contact: DWS Scudder Distributors, Inc. 222 South Riverside Plaza
Chicago, IL 60606-5808 (800) 621-1148 |
Nasdaq Symbol | KRFDX |
CUSIP Number | 23337N 600 |
Fund Number | 54 |
Privacy Statement
This privacy statement is issued by DWS Scudder Distributors, Inc., Deutsche Investment Management Americas Inc., Deutsche Asset Management, Inc., Investment Company Capital Corporation, DeAM Investor Services, Inc., DWS Trust Company and the DWS Funds.
We never sell customer lists or individual client information. We consider privacy fundamental to our client relationships and adhere to the policies and practices described below to protect current and former clients' information. Internal policies are in place to protect confidentiality, while allowing client needs to be served. Only individuals who need to do so in carrying out their job responsibilities may access client information. We maintain physical, electronic and procedural safeguards that comply with federal and state standards to protect confidentiality. These safeguards extend to all forms of interaction with us, including the Internet.
In the normal course of business, clients give us nonpublic personal information on applications and other forms, on our websites, and through transactions with us or our affiliates. Examples of the nonpublic personal information collected are name, address, Social Security number and transaction and balance information. To be able to serve our clients, certain of this client information is shared with affiliated and nonaffiliated third party service providers such as transfer agents, custodians, and broker-dealers to assist us in processing transactions and servicing your account with us. In addition, we may disclose all of the information we collect to companies that perform marketing services on our behalf or to other financial institutions with which we have joint marketing agreements. The organizations described above that receive client information may only use it for the purpose designated by the companies listed above.
We may also disclose nonpublic personal information about you to other parties as required or permitted by law. For example, we are required or we may provide information to government entities or regulatory bodies in response to requests for information or subpoenas, to private litigants in certain circumstances, to law enforcement authorities, or any time we believe it necessary to protect the firm.
Questions on this policy may be sent to:
DWS Scudder
Attention: Correspondence — Chicago
P.O. Box 219415
Kansas City, MO 64121-9415
February 2006
Notes
Notes
Notes
Notes
Notes
Notes

| ITEM 3. | AUDIT COMMITTEE FINANCIAL EXPERT. |
| ITEM 4. | PRINCIPAL ACCOUNTANT FEES AND SERVICES. |
| ITEM 5. | AUDIT COMMITTEE OF LISTED REGISTRANTS |
| ITEM 6. | SCHEDULE OF INVESTMENTS |
ITEM 7. | DISCLOSURE OF PROXY VOTING POLICIES AND PROCEDURES FOR CLOSED-END MANAGEMENT INVESTMENT COMPANIES. |
ITEM 8. | PORTFOLIO MANAGERS OF CLOSED-END MANAGEMENT INVESTMENT COMPANIES. |
ITEM 9. | PURCHASES OF EQUITY SECURITIES BY CLOSED-END MANAGEMENT INVESTMENT COMPANY AND AFFILIATED PURCHASERS |
| ITEM 10. | SUBMISSION OF MATTERS TO A VOTE OF SECURITY HOLDERS. |
The primary function of the Nominating and Governance Committee is to identify and recommend individuals for membership on the Board and oversee the administration of the Board Governance Procedures and Guidelines. Shareholders may recommend candidates for Board positions by forwarding their correspondence by U.S. mail or courier service to the Fund's Secretary for the attention of the Chairman of the Nominating and Governance Committee, Two International Place, Boston, MA 02110. Suggestions for candidates must include a resume of the candidate.
| ITEM 11. | CONTROLS AND PROCEDURES. |
(a) | The Chief Executive and Financial Officers concluded that the Registrant's Disclosure Controls and Procedures are effective based on the evaluation of the Disclosure Controls and Procedures as of a date within 90 days of the filing date of this report. |
(b) | There have been no changes in the registrant's internal control over financial reporting that occurred during the registrant's last half-year (the registrant's second fiscal half-year in the case of the annual report) that has materially affected, or is reasonably likely to materially affect, the registrant's internal controls over financial reporting. |
(a)(1) | Certification pursuant to Rule 30a-2(a) under the Investment Company Act of 1940 (17 CFR 270.30a-2(a)) is filed and attached hereto as Exhibit 99.CERT. |
(b) | Certification pursuant to Rule 30a-2(b) under the Investment Company Act of 1940 (17 CFR 270.30a-2(b)) is furnished and attached hereto as Exhibit 99.906CERT. |
Form N-CSRS Item F
SIGNATURES
Pursuant to the requirements of the Securities Exchange Act of 1934 and the Investment Company Act of 1940, the registrant has duly caused this report to be signed on its behalf by the undersigned, thereunto duly authorized.
Registrant: | DWS Target 2013 Fund, a series of DWS Target Fund |
By: | /s/Vincent J. Esposito |
| Vincent J. Esposito | |
President
Pursuant to the requirements of the Securities Exchange Act of 1934 and the Investment Company Act of 1940, this report has been signed below by the following persons on behalf of the registrant and in the capacities and on the dates indicated.
Registrant: | DWS Target 2013 Fund, a series of DWS Target Fund |
By: | /s/Vincent J. Esposito |
| Vincent J. Esposito | |
President
By: | /s/Paul Schubert |
| Paul Schubert | |
Chief Financial Officer and Treasurer
