WASHINGTON, D. C. 20549
JULY 31, 2013 Annual Report to Shareholders |
| |
| DWS Target 2014 Fund |
|
Contents
4 Portfolio Management Review 12 Statement of Assets and Liabilities 13 Statement of Operations 14 Statement of Changes in Net Assets 16 Notes to Financial Statements 23 Report of Independent Registered Public Accounting Firm 24 Information About Your Fund's Expenses 26 Summary of Management Fee Evaluation by Independent Fee Consultant 30 Board Members and Officers 35 Account Management Resources |
This report must be preceded by a prospectus. The prospectus contains the fund's objectives, risks, charges and expenses, and other important information about the fund.
Although allocation among different asset categories generally limits risk, portfolio management may favor an asset category that underperforms other assets or markets as a whole. Bond investments are subject to interest-rate and credit risks. When interest rates rise, bond prices generally fall. Credit risk refers to the ability of an issuer to make timely payments of principal and interest. Investing in derivatives entails special risks relating to liquidity, leverage and credit that may reduce returns and/or increase volatility. Because Exchange Traded Funds ("ETFs") trade on a securities exchange, their shares may trade at a premium or discount to their net asset value. ETFs also incur fees and expenses so they may not fully match the performance of the indexes they are designed to track. Stocks may decline in value. See the prospectus for details.
DWS Investments is part of the Deutsche Asset & Wealth Management division of Deutsche Bank AG.
NOT FDIC/NCUA INSURED NO BANK GUARANTEE MAY LOSE VALUE NOT A DEPOSIT NOT INSURED BY ANY FEDERAL GOVERNMENT AGENCY
Portfolio Management Review (Unaudited)
Market Overview and Fund Performance
All performance information below is historical and does not guarantee future results. Investment return and principal fluctuate, so your shares may be worth more or less when redeemed. Current performance may differ from performance data shown. Please visit www.dws-investments.com for the most recent month-end performance of all share classes. Fund performance includes reinvestment of all distributions. Unadjusted returns do not reflect sales charges and would have been lower if they had. Please refer to pages 8 through 9 for more complete performance information.
Investment Strategy The fund seeks to provide a guaranteed return of investment on November 15, 2014 (the "Maturity Date") to investors who reinvest all dividends and hold their shares to the Maturity Date. The fund seeks to achieve its investment objectives by investing a portion of its assets in "zero coupon" U.S. Treasury obligations and the balance of its assets in common stocks or investment vehicles that provide exposure to common stocks. |
DWS Target 2014 Fund produced a total return of 3.00% during the annual period ending July 31, 2013.
U.S. government bonds experienced poor performance during the past 12 months ended July 31, 2013, but the fund — by virtue of the relatively short time left until its maturity — was able to sidestep the full impact of the downturn. U.S. Treasuries generally performed well for much of the annual period thanks to the combination of slow economic growth, low inflation and the continued support provided by the U.S. Federal Reserve Board's (the Fed's) bond-buying program known as "quantitative easing" (QE). Aside from a brief spike in March 2013, the 10-year Treasury note largely traded in a range between 1.6% and 1.9% from the beginning of the period through the end of April 2013. This benign environment abruptly changed in May 2013, however, when Fed Chairman Ben Bernanke suggested that the Fed may "taper" QE before year-end. Bonds sold off sharply on the news, causing yields to spike from 1.63% on May 2, 2013 to 2.59% by the end of the period. (Bond prices and yields move in opposite directions.) Longer-term bonds were hit much harder than their short-term counterparts, a plus for the fund given that its fixed income holdings are now entirely short-term in nature. The fund's bond benchmark — the Barclays U.S. Treasury Index — closed the annual period with a loss of -2.72%.
| "As the fund moves closer to its maturity date, we continue to manage the portfolio by investing in zero-coupon bonds and ETFs representative of the broader U.S. stock market." |
In contrast to the turbulence in the bond market, U.S. equities delivered outstanding returns during the past 12 months ending July 31, 2013. The Standard & Poor's 500® (S&P 500) Index, the fund's equity benchmark, gained 25.00%. Stocks were supported by an environment highlighted by the improving housing market, rising stock buybacks and the generally robust health of large domestic corporations. The S&P 500 closed the period just short of its all-time high.
Performance Attribution
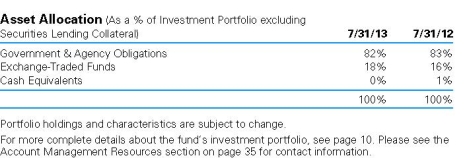
As of July 31, 2013, the fund held a weighting of 18.1% in stocks and 81.6% in bonds. The remainder of the portfolio was in cash.
The fixed income portion of the portfolio is invested entirely in Treasury STRIPS, which stands for Separate Trading of Registered Interest and Principal of Securities. STRIPS are created by dividing all of the individual interest and principal payments of underlying coupon-bearing Treasury notes into separate zero-coupon securities. Such securities initially sell at a discount to their final value, and their prices gradually rise until they become fully valued at par ($100 per bond) on their maturity date. Because STRIPS are more responsive to interest rate changes than coupon-bearing bonds of similar maturity, they tend to be more sensitive to volatility in the broader bond market. This is particularly true for longer-maturity STRIPS. On the other hand, the dominant contribution to price performance for STRIPS with closer maturity dates comes from the gradual accretion of the bonds towards their $100 par value.
Since the fund's November 15, 2014 maturity date is so close, the performance of the fixed income portion of the portfolio is due almost entirely to the accretion of the STRIPS' price toward its par value rather than movements in prevailing interest rates. For the year, the fund's STRIPS position produced a return of approximately 0.7%. This return is greater than that of the Barclays U.S. Treasury Index because the maturity of the fund's STRIPS investment is less than the average maturity of the securities in the benchmark — a positive factor at a time in which long-term bonds underperformed.
The equity portion of the fund is invested in two exchange-traded funds, or ETFs, that track the performance of the S&P 500 Index: the SPDR S&P 500 ETF and the iShares S&P 500 Index ETF. We believe this low-cost approach will enable the equity portion of the fund to produce returns in line with the broader U.S. equity market. This portion of the portfolio performed very well during the 12-month reporting period, reflecting the robust gain in the U.S. market during this time. While stocks are only a modest part of the portfolio, their strong return helped augment the performance of its holdings in zero-coupon bonds.
Outlook and Positioning
As the fund moves closer to its maturity date, we continue to manage the portfolio by investing in zero-coupon bonds and ETFs representative of the broader U.S. stock market.
Portfolio Management Team
William Chepolis, CFA, Managing Director
Portfolio Manager of the fund. Joined the fund in 2005.
• Joined Deutsche Asset & Wealth Management in 1998 after 13 years of experience as vice president and portfolio manager for Norwest Bank where he managed the bank's fixed income and foreign exchange portfolios.
• Portfolio Manager for Retail Fixed Income: New York.
• BIS, University of Minnesota.
Rahmila Nadi, Associate
Portfolio Manager of the fund. Joined the fund in 2013.
• Joined Deutsche Asset & Wealth Management in 2012 after six years of experience at J.P. Morgan Chase in credit portfolio trading.
• BA, Columbia University, Columbia College; MBA, S.C. Johnson Graduate School of Management at Cornell University.
The views expressed reflect those of the portfolio management team only through the end of the period of the report as stated on the cover. The management team's views are subject to change at any time based on market and other conditions and should not be construed as a recommendation. Past performance is no guarantee of future results. Current and future portfolio holdings are subject to risk.
Terms to Know
Quantitative easing is a government monetary policy often used when interest rates are at or near zero. With this policy, government securities are purchased from the market, causing the price of the securities purchased to rise and the yield or interest rates on the securities purchased to fall. Lower interest rates are paid on new bonds issued to replace existing bonds that have matured. With lower borrowing costs, the central banks hope consumers will be encouraged to spend more, thus helping the overall economy and improving the balance sheets for the companies providing the goods and services on which consumers are spending their money.
The Barclays U.S. Treasury Index is an unmanaged index of prices of U.S. Treasury bonds with maturities of one to 30 years.
The Standard & Poor's 500 (S&P 500) Index is an unmanaged, capitalization- weighted index of 500 stocks. The index is designed to measure performance of the broad domestic economy through changes in the aggregate market value of 500 stocks representing all major industries.
Index returns do not reflect fees or expenses and it is not possible to invest directly into an index.
An exchange-traded fund (ETF) is a security that tracks an index or asset like an index fund, but trades like a stock on an exchange.
Performance Summary July 31, 2013 (Unaudited) Average Annual Total Returns as of 7/31/13 | |
| | | 1-Year | | | 5-Year | | | 10-Year | |
| Unadjusted for Sales Charge | | | 3.00 | % | | | 3.47 | % | | | 4.13 | % |
Adjusted for the Maximum Sales Charge (max 5.00% load) | | | -2.15 | % | | | 2.41 | % | | | 3.60 | % |
S&P 500® Index† | | | 25.00 | % | | | 8.26 | % | | | 7.64 | % |
Barclays U.S. Treasury Index†† | | | -2.72 | % | | | 4.38 | % | | | 4.60 | % |
Performance in the Average Annual Total Returns table above and the Growth of an Assumed $10,000 Investment line graph that follows is historical and does not guarantee future results. Investment return and principal fluctuate, so your shares may be worth more or less when redeemed. Current performance may differ from performance data shown. Please visit www.dws-investments.com for the Fund's most recent month-end performance. Fund performance includes reinvestment of all distributions. Unadjusted returns do not reflect sales charges and would have been lower if they had.
The gross expense ratio of the Fund, as stated in the fee table of the prospectus dated December 1, 2012, is 1.21% and may differ from the expense ratio disclosed in the Financial Highlights table in this report.
The Fund may charge a 2% fee for redemptions of shares held less than 15 days.
Index returns do not reflect any fees or expenses and it is not possible to invest directly into an index.
Performance figures do not reflect the deduction of taxes that a shareholder would pay on fund distributions or the redemption of fund shares.
| Net Asset Value and Distribution Information | |
Net Asset Value: 7/31/13 | | $ | 7.78 | |
| 7/31/12 | | $ | 7.77 | |
Distribution Information: Twelve Months as of 7/31/13: Income Dividends | | $ | .22 | |
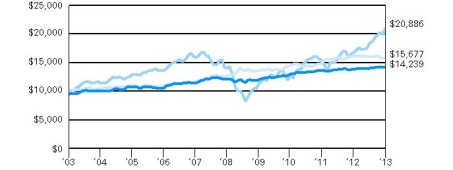
Growth of an Assumed $10,000 Investment (Adjusted for Maximum Sales Charge) |
|
|
| Yearly periods ended July 31 |
The Fund's growth of an assumed $10,000 investment is adjusted for the maximum sales charge of 5.0%. This results in a net initial investment of $9,500.
The growth of $10,000 is cumulative.
† The Standard & Poor's 500 (S&P 500) Index is an unmanaged, capitalization-weighted index of 500 stocks. The index is designed to measure performance of the broad domestic economy through changes in the aggregate market value of 500 stocks representing all major industries.
†† The Barclays U.S. Treasury Index tracks the performance of U.S. Treasury obligations with a remaining maturity of one year or more.
Investment Portfolio as of July 31, 2013 | | | Principal Amount ($) | | | Value ($) | |
| | | | |
| Government & Agency Obligation 82.0% | |
| U.S. Treasury Obligation | |
| U.S. Treasury STRIPS, 4.465%*, 11/15/2014 (a) (Cost $17,839,561) | | | 18,886,000 | | | | 18,841,524 | |
| | | Shares | | | Value ($) | |
| | | | |
| Exchange-Traded Funds 18.2% | |
| iShares S&P 500 Index Fund | | | 10,220 | | | | 1,732,495 | |
| SPDR S&P 500 ETF Trust | | | 14,549 | | | | 2,453,834 | |
Total Exchange-Traded Funds (Cost $2,790,147) | | | | 4,186,329 | |
| | |
| Securities Lending Collateral 39.9% | |
| Daily Assets Fund Institutional, 0.10% (b) (c) (Cost $9,168,750) | | | 9,168,750 | | | | 9,168,750 | |
| | |
| Cash Equivalents 0.2% | |
| Central Cash Management Fund, 0.05% (b) (Cost $50,979) | | | 50,979 | | | | 50,979 | |
| | | % of Net Assets | | | Value ($) | |
| | | | |
Total Investment Portfolio (Cost $29,849,437)† | | | 140.3 | | | | 32,247,582 | |
| Other Assets and Liabilities, Net | | | (40.3 | ) | | | (9,257,668 | ) |
| Net Assets | | | 100.0 | | | | 22,989,914 | |
* Annualized yield at time of purchase; not a coupon rate.
† The cost for federal income tax purposes was $29,849,437. At July 31, 2013, net unrealized appreciation for all securities based on tax cost was $2,398,145. This consisted of aggregate gross unrealized appreciation for all securities in which there was an excess of value over tax cost of $2,398,145 and aggregate gross unrealized depreciation for all securities in which there was an excess of tax cost over value of $0.
(a) All or a portion of these securities were on loan (see Notes to Financial Statements). The value of securities loaned at July 31, 2013 amounted to $8,978,805, which is 39.1% of net assets.
(b) Affiliated fund managed by Deutsche Investment Management Americas Inc. The rate shown is the annualized seven-day yield at period end.
(c) Represents collateral held in connection with securities lending. Income earned by the Fund is net of borrower rebates.
S&P: Standard & Poor's
SPDR: Standard & Poor's Depositary Receipt
STRIPS: Separate Trading of Registered Interest and Principal Securities
Fair Value Measurements
Various inputs are used in determining the value of the Fund's investments. These inputs are summarized in three broad levels. Level 1 includes quoted prices in active markets for identical securities. Level 2 includes other significant observable inputs (including quoted prices for similar securities, interest rates, prepayment speeds and credit risk). Level 3 includes significant unobservable inputs (including the Fund's own assumptions in determining the fair value of investments). The inputs or methodology used for valuing securities are not necessarily an indication of the risk associated with investing in those securities.
The following is a summary of the inputs used as of July 31, 2013 in valuing the Fund's investments. For information on the Fund's policy regarding the valuation of investments, please refer to the Security Valuation section of Note A in the accompanying Notes to Financial Statements.
| Assets | | Level 1 | | | Level 2 | | | Level 3 | | | Total | |
| | |
| Government & Agency Obligation | | $ | — | | | $ | 18,841,524 | | | $ | — | | | $ | 18,841,524 | |
| Exchange-Traded Funds | | | 4,186,329 | | | | — | | | | — | | | | 4,186,329 | |
| Short-Term Investments (d) | | | 9,219,729 | | | | — | | | | — | | | | 9,219,729 | |
| Total | | $ | 13,406,058 | | | $ | 18,841,524 | | | $ | — | | | $ | 32,247,582 | |
There have been no transfers between fair value measurement levels during the year ended July 31, 2013.
(d) See Investment Portfolio for additional detailed categorizations.
The accompanying notes are an integral part of the financial statements.
Statement of Assets and Liabilities | as of July 31, 2013 | |
| Assets | |
Investments: Investments in non-affiliated securities, at value (cost $20,629,708) — including $8,978,805 of securities loaned | | $ | 23,027,853 | |
| Investment in Daily Assets Fund Institutional (cost $9,168,750)* | | | 9,168,750 | |
| Investment in Central Cash Management Fund (cost $50,979) | | | 50,979 | |
| Total investments, at value (cost $29,849,437) | | | 32,247,582 | |
| Cash | | | 12,129 | |
| Interest receivable | | | 374 | |
| Other assets | | | 2,855 | |
| Total assets | | | 32,262,940 | |
| Liabilities | |
| Payable upon return of securities loaned | | | 9,168,750 | |
| Payable for Fund shares redeemed | | | 28,637 | |
| Accrued management fee | | | 7,846 | |
| Accrued Trustees' fees | | | 571 | |
| Other accrued expenses and payables | | | 67,222 | |
| Total liabilities | | | 9,273,026 | |
| Net assets, at value | | $ | 22,989,914 | |
| Net Assets Consist of | |
| Undistributed net investment income | | | 318,783 | |
| Net unrealized appreciation (depreciation) on investments | | | 2,398,145 | |
| Accumulated net realized gain (loss) | | | (589,757 | ) |
| Paid-in capital | | | 20,862,743 | |
| Net assets, at value | | $ | 22,989,914 | |
| Net Asset Value | |
Net Asset Value and redemption price(a) per share ($22,989,914 ÷ 2,954,356 outstanding shares of beneficial interest, no par value, unlimited number of shares authorized) | | $ | 7.78 | |
* Represents collateral on securities loaned.
(a) Redemption price per share for shares held less than 15 days is equal to net asset value less a 2% redemption fee.
The accompanying notes are an integral part of the financial statements.
| for the year ended July 31, 2013 | |
| Investment Income | |
Income: Dividends | | $ | 87,408 | |
| Interest | | | 823,546 | |
| Income distributions — Central Cash Management Fund | | | 118 | |
| Securities lending income, including income from Daily Assets Fund Institutional, net of borrower rebates | | | 876 | |
| Total income | | | 911,948 | |
Expenses: Management fee | | | 96,424 | |
| Administration fee | | | 24,106 | |
| Services to shareholders | | | 30,769 | |
| Distribution and service fees | | | 58,002 | |
| Custodian fee | | | 6,169 | |
| Audit and tax fees | | | 39,421 | |
| Legal fees | | | 11,112 | |
| Reports to shareholders | | | 23,558 | |
| Registration fees | | | 7,018 | |
| Trustees' fees and expenses | | | 2,508 | |
| Other | | | 4,225 | |
| Total expenses before expense reductions | | | 303,312 | |
| Expense reductions | | | (23,009 | ) |
| Total expenses after expense reductions | | | 280,303 | |
| Net investment income | | | 631,645 | |
| Realized and Unrealized Gain (Loss) | |
| Net realized gain (loss) from investments | | | 322,665 | |
| Change in net unrealized appreciation (depreciation) on investments | | | (258,429 | ) |
| Net gain (loss) | | | 64,236 | |
| Net increase (decrease) in net assets resulting from operations | | $ | 695,881 | |
The accompanying notes are an integral part of the financial statements.
Statement of Changes in Net Assets | | | Years Ended July 31, | |
| Increase (Decrease) in Net Assets | | 2013 | | | 2012 | |
Operations: Net investment income | | $ | 631,645 | | | $ | 700,727 | |
| Net realized gain (loss) | | | 322,665 | | | | 438,650 | |
| Change in net unrealized appreciation (depreciation) | | | (258,429 | ) | | | (657,056 | ) |
| Net increase (decrease) in net assets resulting from operations | | | 695,881 | | | | 482,321 | |
Distributions to shareholders from: Net investment income | | | (683,640 | ) | | | (699,055 | ) |
Fund share transactions: Reinvestment of distributions | | | 683,640 | | | | 692,718 | |
| Payments for shares redeemed | | | (2,954,659 | ) | | | (3,709,669 | ) |
| Payments for shares redeemed | | | (2,954,659 | ) | | | (3,709,669 | ) |
| Net increase (decrease) in net assets from Fund share transactions | | | (2,271,019 | ) | | | (3,016,951 | ) |
| Increase (decrease) in net assets | | | (2,258,778 | ) | | | (3,233,685 | ) |
| Net assets at beginning of period | | | 25,248,692 | | | | 28,482,377 | |
| Net assets at end of period (including undistributed net investment income of $318,783 and $370,778, respectively) | | $ | 22,989,914 | | | $ | 25,248,692 | |
| Other Information | |
| Shares outstanding at beginning of period | | | 3,247,422 | | | | 3,634,926 | |
| Shares issued to shareholders in reinvestment of distributions | | | 90,534 | | | | 90,787 | |
| Shares redeemed | | | (383,600 | ) | | | (478,291 | ) |
| Net increase (decrease) in Fund shares | | | (293,066 | ) | | | (387,504 | ) |
| Shares outstanding at end of period | | | 2,954,356 | | | | 3,247,422 | |
The accompanying notes are an integral part of the financial statements.
| | | Years Ended July 31, | |
| | | | 2013 | | | 2012 | | | 2011 | | | 2010 | | | 2009 | |
| Selected Per Share Data | |
| Net asset value, beginning of period | | $ | 7.77 | | | $ | 7.84 | | | $ | 7.68 | | | $ | 7.27 | | | $ | 7.51 | |
Income (loss) from investment operations: Net investment incomea | | | .20 | | | | .20 | | | | .19 | | | | .19 | | | | .19 | |
| Net realized and unrealized gain (loss) | | | .03 | | | | (.07 | ) | | | .18 | | | | .42 | | | | (.23 | ) |
| Total from investment operations | | | .23 | | | | .13 | | | | .37 | | | | .61 | | | | (.04 | ) |
Less distributions from: Net investment income | | | (.22 | ) | | | (.20 | ) | | | (.21 | ) | | | (.20 | ) | | | (.20 | ) |
| Net asset value, end of period | | $ | 7.78 | | | $ | 7.77 | | | $ | 7.84 | | | $ | 7.68 | | | $ | 7.27 | |
Total Return (%)b | | | 3.00 | c | | | 1.77 | | | | 4.84 | | | | 8.54 | | | | (.57 | ) |
| Ratios to Average Net Assets and Supplemental Data | |
| Net assets, end of period ($ millions) | | | 23 | | | | 25 | | | | 28 | | | | 31 | | | | 31 | |
| Ratio of expenses before expense reductions (%) | | | 1.26 | | | | 1.20 | | | | 1.18 | | | | 1.17 | | | | 1.20 | |
| Ratio of expenses after expense reductions (%) | | | 1.16 | | | | 1.20 | | | | 1.18 | | | | 1.17 | | | | 1.20 | |
| Ratio of net investment income (%) | | | 2.62 | | | | 2.64 | | | | 2.43 | | | | 2.56 | | | | 2.62 | |
| Portfolio turnover rate (%) | | | 0 | | | | 0 | | | | 0 | | | | 35 | | | | 39 | |
a Based on average shares outstanding during the period. b Total return does not reflect the effect of any sales charge. c Total return would have been lower had certain expenses not been reduced. | |
Notes to Financial Statements
A. Organization and Significant Accounting Policies
DWS Target 2014 Fund (the "Fund") is a diversified series of DWS Target Fund (the "Trust"), which is registered under the Investment Company Act of 1940, as amended (the "1940 Act"), as an open-end management investment company organized as a Massachusetts business trust.
By investing in Zero Coupon Treasuries, the Fund seeks to assure that investors who reinvest all dividends and hold their shares until the Maturity Date (November 15, 2014) will receive at least their original investment on the Maturity Date. This assurance is further backed by an agreement entered into between Deutsche Investment Management Americas Inc. ("DIMA" or the "Advisor"), an indirect, wholly owned subsidiary of Deutsche Bank AG, the Fund's investment manager, and the Fund. Under this agreement, the Advisor has agreed to make, if necessary, sufficient payments on the Fund's Maturity Date to the investors who have reinvested all dividends and held their investments in the Fund to the Maturity Date to enable them to receive on that date, an aggregate amount of redemption proceeds and payments equal to the amount of their original investment, including any applicable sales charge. The Fund accounts for this agreement as a derivative pursuant to ASC Topic 815, Accounting for Derivatives and Hedging Activities. Management values the derivative through comparison of the expected maturity date value of the Zero Coupon Treasuries to DIMA's obligation under the agreement. As the expected maturity date value of the Zero Coupon Treasuries exceeds the obligation under the agreement, the value of the agreement is considered to be immaterial to the Fund at July 31, 2013. Fund shares were sold during a limited offering period and are redeemable on a continuous basis. The Fund is no longer offering shares to new or existing shareholders except through dividend reinvestment. The Fund's returns will fluctuate and there is no assurance that the Fund will achieve its objective of long-term capital growth.
The Fund's financial statements are prepared in accordance with accounting principles generally accepted in the United States of America which require the use of management estimates. Actual results could differ from those estimates. The policies described below are followed consistently by the Fund in the preparation of its financial statements.
Security Valuation. Investments are stated at value determined as of the close of regular trading on the New York Stock Exchange on each day the exchange is open for trading.
Various inputs are used in determining the value of the Fund's investments. These inputs are summarized in three broad levels. Level 1 includes quoted prices in active markets for identical securities. Level 2 includes other significant observable inputs (including quoted prices for similar securities, interest rates, prepayment speeds, and credit risk). Level 3 includes significant unobservable inputs (including the Fund's own assumptions in determining the fair value of investments). The inputs or methodology used for valuing securities are not necessarily an indication of the risk associated with investing in those securities.
Exchange-traded funds ("ETFs") are valued at the most recent sale price or official closing price reported on the exchange (U.S. or foreign) or over-the-counter market on which they trade. ETFs for which no sales are reported are valued at the calculated mean between the most recent bid and asked quotations on the relevant market or, if a mean cannot be determined, at the most recent bid quotation. Equity securities are categorized as Level 1 securities.
Debt securities are valued at prices supplied by independent pricing services approved by the Fund's Board. If the pricing services are unable to provide valuations, securities are valued at the most recent bid quotation or evaluated price, as applicable, obtained from one or more broker-dealers. Such services may use various pricing techniques which take into account appropriate factors such as yield, quality, coupon rate, maturity, type of issue, trading characteristics and other data, as well as broker quotes. These securities are generally categorized as Level 2.
Investments in open-end investment companies are valued at their net asset value each business day and are categorized as Level 1.
Securities and other assets for which market quotations are not readily available or for which the above valuation procedures are deemed not to reflect fair value are valued in a manner that is intended to reflect their fair value as determined in accordance with procedures approved by the Board and are generally categorized as Level 3. In accordance with the Fund's valuation procedures, factors used in determining value may include, but are not limited to, the type of the security; the size of the holding; the initial cost of the security; the existence of any contractual restrictions on the security's disposition; the price and extent of public trading in similar securities of the issuer or of comparable companies; quotations or evaluated prices from broker-dealers and/or pricing services; information obtained from the issuer, analysts, and/or the appropriate stock exchange (for exchange-traded securities); an analysis of the company's or issuer's financial statements; an evaluation of the forces that influence the issuer and the market(s) in which the security is purchased and sold; and with respect to debt securities, the maturity, coupon, creditworthiness, currency denomination and the movement of the market in which the security is normally traded. The value determined under these procedures may differ from published values for the same securities.
Disclosure about the classification of fair value measurements is included in a table following the Fund's Investment Portfolio.
Securities Lending. Deutsche Bank AG, as lending agent, lends securities of the Fund to certain financial institutions under the terms of the Security Lending Agreement. The Fund retains the benefits of owning the securities it has loaned and continues to receive interest and dividends generated by the securities and to participate in any changes in their market value. The Fund requires the borrowers of the securities to maintain collateral with the Fund consisting of either cash or liquid, unencumbered assets having a value at least equal to the value of the securities loaned. When the collateral falls below specified amounts, the lending agent will use its best effort to obtain additional collateral on the next business day to meet required amounts under the security lending agreement. The Fund may invest the cash collateral into a joint trading account in an affiliated money market fund pursuant to Exemptive Orders issued by the SEC. The Fund receives compensation for lending its securities either in the form of fees or by earning interest on invested cash collateral net of borrower rebates and fees paid to a lending agent. Either the Fund or the borrower may terminate the loan. There may be risks of delay and costs in recovery of securities or even loss of rights in the collateral should the borrower of the securities fail financially. If the Fund is not able to recover securities lent, the Fund may sell the collateral and purchase a replacement investment in the market, incurring the risk that the value of the replacement security is greater than the value of the collateral. The Fund is also subject to all investment risks associated with the reinvestment of any cash collateral received, including, but not limited to, interest rate, credit and liquidity risk associated with such investments.
As of July 31, 2013, the Fund had securities on loan with a gross value of $8,978,805. The value of the related collateral, $9,168,750, exceeded the value of the securities loaned at period end.
Federal Income Taxes. The Fund's policy is to comply with the requirements of the Internal Revenue Code, as amended, which are applicable to regulated investment companies, and to distribute all of its taxable income to its shareholders.
Under the Regulated Investment Company Modernization Act of 2010, net capital losses incurred post-enactment may be carried forward indefinitely, and their character is retained as short-term and/or long-term. Previously, net capital losses were carried forward for eight years and treated as short-term losses. As a transition rule, the Act requires that post-enactment net capital losses be used before pre-enactment net capital losses.
At July 31, 2013, the Fund had a net tax basis capital loss carryforward of approximately $590,000 of pre-enactment losses, which may be applied against any realized net taxable capital gains of each succeeding year until fully utilized or until the Fund matures.
The Fund has reviewed the tax positions for the open tax years as of July 31, 2013 and has determined that no provision for income tax is required in the Fund's financial statements. The Fund's federal tax returns for the prior three fiscal years remain open subject to examination by the Internal Revenue Service.
Distribution of Income and Gains. Distributions from net investment income of the Fund, if any, are declared and distributed to shareholders annually. Net realized gains from investment transactions, in excess of available capital loss carryforwards, would be taxable to the Fund if not distributed, and, therefore, will be distributed to shareholders at least annually. The Fund may also make additional distributions for tax purposes if necessary.
The timing and characterization of certain income and capital gain distributions are determined annually in accordance with federal tax regulations which may differ from accounting principles generally accepted in the United States of America. These differences primarily relate to certain securities sold at a loss. As a result, net investment income (loss) and net realized gain (loss) on investment transactions for a reporting period may differ significantly from distributions during such period. Accordingly, the Fund may periodically make reclassifications among certain of its capital accounts without impacting the net asset value of the Fund.
At July 31, 2013, the Fund's components of distributable earnings (accumulated losses) on a tax basis were as follows:
| Undistributed ordinary income* | | $ | 318,783 | |
| Capital loss carryforwards | | $ | (590,000 | ) |
| Unrealized appreciation (depreciation) on investments | | $ | 2,398,145 | |
In addition, the tax character of distributions paid to shareholders by the Fund is summarized as follows:
| | | Years Ended July 31, | |
| | | 2013 | | | 2012 | |
| Distributions from ordinary income* | | $ | 683,640 | | | $ | 699,055 | |
* For tax purposes, short-term capital gain distributions are considered ordinary income distributions.
Redemption Fees. The Fund imposes a redemption fee of 2% of the total redemption amount on the Fund shares redeemed or exchanged within 15 days of buying them, either by purchase or exchange. This fee is assessed and retained by the Fund for the benefit of the remaining shareholders. The redemption fee is accounted for as an addition to paid-in capital. For the year ended July 31, 2013, there were no redemption fees imposed by the Fund.
Expenses. Expenses of the Trust arising in connection with a specific fund are allocated to that fund. Other Trust expenses which cannot be directly attributed to a fund are apportioned among the funds in the Trust based upon the relative net assets or other appropriate measures.
Contingencies. In the normal course of business, the Fund may enter into contracts with service providers that contain general indemnification clauses. The Fund's maximum exposure under these arrangements is unknown as this would involve future claims that may be made against the Fund that have not yet been made. However, based on experience, the Fund expects the risk of loss to be remote.
Other. Investment transactions are accounted for on a trade date plus one basis for daily net asset value calculations. However, for financial reporting purposes, investment transactions are reported on trade date. Interest income is recorded on the accrual basis. Dividend income is recorded on the ex-dividend date. Realized gains and losses from investment transactions are recorded on an identified cost basis and may include proceeds from litigation. All premiums and discounts are amortized/accreted for both tax and financial reporting purposes.
B. Purchases and Sales of Securities
During the year ended July 31, 2013, purchases and sales of investment securities (excluding short-term investments and U.S. Treasury obligations) aggregated $0 and $608,226, respectively. Purchases and sales of U.S. Treasury obligations aggregated $0 and $2,379,953, respectively.
C. Related Parties
Management Agreement. Under the Investment Management Agreement, the Advisor directs the investments of the Fund in accordance with its investment objectives, policies and restrictions. The Advisor determines the securities, instruments and other contracts relating to investments to be purchased, sold or entered into by the Fund. The management fee payable under the Investment Management Agreement is equal to an annual rate of 0.40% of average daily net assets, computed and accrued daily and payable monthly.
For the period from October 1, 2012 through September 30, 2013, the Advisor has contractually agreed to waive its fees and/or reimburse certain operating expenses of the Fund to the extent necessary to maintain the operating expenses (excluding certain expenses such as extraordinary expenses, taxes, brokerage and interest) at 1.15% of the Fund's average daily net assets.
Administration Fee. Pursuant to the Administrative Services Agreement, DIMA provides most administrative services to the Fund. For all services provided under the Administrative Services Agreement, the Fund pays the Advisor an annual fee ("Administration Fee") of 0.10% of the Fund's average daily net assets, computed and accrued daily and payable monthly. For the year ended July 31, 2013, the Administration Fee was $24,106, of which $1,961 is unpaid.
Service Provider Fees. DWS Investments Service Company ("DISC"), an affiliate of the Advisor, is the transfer agent, dividend-paying agent and shareholder service agent for the Fund. Pursuant to a sub-transfer agency agreement between DISC and DST Systems, Inc. ("DST"), DISC has delegated certain transfer agent, dividend-paying agent and shareholder service agent functions to DST. DISC compensates DST out of the shareholder servicing fee it receives from the Fund. For the year ended July 31, 2013, the amount charged to the Fund by DISC aggregated $19,447, all of which was waived.
Distribution Service Fee. Under the Fund's 12b-1 Plan, DWS Investments Distributors, Inc. ("DIDI"), an affiliate of the Advisor, provides information and administrative services for a fee ("Service Fee") to shareholders at an annual rate of up to 0.25% of average daily net assets. DIDI in turn has various agreements with financial services firms that provide these services and pays these fees based upon the assets of shareholder accounts the firms service. For the year ended July 31, 2013, the Service Fee was $58,002, of which $3,562 was waived, and $8,120 is unpaid. Accordingly, for the year ended July 31, 2013, the Service Fee was equivalent to an annual effective rate of 0.23% of the Fund's average daily net assets.
Typesetting and Filing Service Fees. Under an agreement with DIMA, DIMA is compensated for providing typesetting and certain regulatory filing services to the Fund. For the year ended July 31, 2013, the amount charged to the Fund by DIMA included in the Statement of Operations under "reports to shareholders" aggregated $11,968, of which $4,361 is unpaid.
Trustees' Fees and Expenses. The Fund paid retainer fees to each Trustee not affiliated with the Advisor, plus specified amounts to the Board Chairperson and Vice Chairperson and to each committee Chairperson.
Affiliated Cash Management Vehicles. The Fund may invest uninvested cash balances in Central Cash Management Fund and DWS Variable NAV Money Fund, affiliated money market funds which are managed by the Advisor. Each affiliated money market fund seeks to provide a high level of current income consistent with liquidity and the preservation of capital. Each affiliated money market fund is managed in accordance with Rule 2a-7 under the Investment Company Act of 1940, which governs the quality, maturity, diversity and liquidity of instruments in which a money market fund may invest. Central Cash Management Fund seeks to maintain a stable net asset value, and DWS Variable NAV Money Fund maintains a floating net asset value. The Fund indirectly bears its proportionate share of the expenses of each affiliated money market fund in which it invests. Central Cash Management Fund does not pay the Advisor an investment management fee. To the extent that DWS Variable NAV Money Fund pays an investment management fee to the Advisor, the Advisor will waive an amount of the investment management fee payable to the Advisor by the Fund equal to the amount of the investment management fee payable on the Fund's assets invested in DWS Variable NAV Money Fund.
Security Lending Fees. Effective November 29, 2012, Deutsche Bank AG serves as securities lending agent for the Fund. For the period from November 29, 2012 through July 31, 2013, the Fund incurred securities lending agent fees to Deutsche Bank AG in the amount of $97.
D. Line of Credit
The Fund and other affiliated funds (the "Participants") share in a $375 million revolving credit facility provided by a syndication of banks. The Fund may borrow for temporary or emergency purposes, including the meeting of redemption requests that otherwise might require the untimely disposition of securities. The Participants are charged an annual commitment fee which is allocated based on net assets, among each of the Participants. Interest is calculated at a rate per annum equal to the sum of the Federal Funds Rate plus 1.25 percent plus if LIBOR exceeds the Federal Funds Rate the amount of such excess. The Fund may borrow up to a maximum of 33 percent of its net assets under the agreement. The Fund had no outstanding loans at July 31, 2013.
Report of Independent Registered Public Accounting Firm
To the Board of Trustees of DWS Target Fund and Shareholders of DWS Target 2014 Fund:
We have audited the accompanying statement of assets and liabilities, including the investment portfolio, of DWS Target 2014 Fund (a series of DWS Target Fund) (the "Fund") as of July 31, 2013, and the related statement of operations for the year then ended, the statement of changes in net assets for each of the two years in the period then ended, and the financial highlights for each of the five years in the period then ended. These financial statements and financial highlights are the responsibility of the Fund's management. Our responsibility is to express an opinion on these financial statements and financial highlights based on our audits.
We conducted our audits in accordance with the standards of the Public Company Accounting Oversight Board (United States). Those standards require that we plan and perform the audit to obtain reasonable assurance about whether the financial statements and financial highlights are free of material misstatement. We were not engaged to perform an audit of the Fund's internal control over financial reporting. Our audits included consideration of internal control over financial reporting as a basis for designing audit procedures that are appropriate in the circumstances, but not for the purpose of expressing an opinion on the effectiveness of the Fund's internal control over financial reporting. Accordingly, we express no such opinion. An audit also includes examining, on a test basis, evidence supporting the amounts and disclosures in the financial statements and financial highlights, assessing the accounting principles used and significant estimates made by management, and evaluating the overall financial statement presentation. Our procedures included confirmation of securities owned as of July 31, 2013, by correspondence with the custodian and broker. We believe that our audits provide a reasonable basis for our opinion.
In our opinion, the financial statements and financial highlights referred to above present fairly, in all material respects, the financial position of DWS Target 2014 Fund at July 31, 2013, the results of its operations for the year then ended, the changes in its net assets for each of the two years in the period then ended, and the financial highlights for each of the five years in the period then ended, in conformity with U.S. generally accepted accounting principles.
| | | |
Boston, Massachusetts September 19, 2013 | | |
Information About Your Fund's Expenses
As an investor of the Fund, you incur two types of costs: ongoing expenses and transaction costs. Ongoing expenses include management fees, distribution and service (12b-1) fees and other Fund expenses. Examples of transaction costs include sales charges (loads) and account maintenance fees, which are not shown in this section. The following tables are intended to help you understand your ongoing expenses (in dollars) of investing in the Fund and to help you compare these expenses with the ongoing expenses of investing in other mutual funds. In the most recent six-month period, the Fund limited these expenses; had it not done so, expenses would have been higher. The example in the table is based on an investment of $1,000 invested at the beginning of the six-month period and held for the entire period (February 1, 2013 to July 31, 2013).
The tables illustrate your Fund's expenses in two ways:
•Actual Fund Return. This helps you estimate the actual dollar amount of ongoing expenses (but not transaction costs) paid on a $1,000 investment in the Fund using the Fund's actual return during the period. To estimate the expenses you paid over the period, simply divide your account value by $1,000 (for example, an $8,600 account value divided by $1,000 = 8.6), then multiply the result by the number in the "Expenses Paid per $1,000" line under the share class you hold.
•Hypothetical 5% Fund Return. This helps you to compare your Fund's ongoing expenses (but not transaction costs) with those of other mutual funds using the Fund's actual expense ratio and a hypothetical rate of return of 5% per year before expenses. Examples using a 5% hypothetical fund return may be found in the shareholder reports of other mutual funds. The hypothetical account values and expenses may not be used to estimate the actual ending account balance or expenses you paid for the period.
Please note that the expenses shown in these tables are meant to highlight your ongoing expenses only and do not reflect any transaction costs. The "Expenses Paid per $1,000" line of the tables is useful in comparing ongoing expenses only and will not help you determine the relative total expense of owning different funds. If these transaction costs had been included, your costs would have been higher.
Expenses and Value of a $1,000 Investment for the six months ended July 31, 2013 (Unaudited) | |
| Actual Fund Return | | | |
| Beginning Account Value 2/1/13 | | $ | 1,000.00 | |
| Ending Account Value 7/31/13 | | $ | 1,018.30 | |
| Expenses Paid per $1,000* | | $ | 5.75 | |
| Hypothetical 5% Fund Return | | | | |
| Beginning Account Value 2/1/13 | | $ | 1,000.00 | |
| Ending Account Value 7/31/13 | | $ | 1,019.09 | |
| Expenses Paid per $1,000* | | $ | 5.76 | |
* Expenses are equal to the Fund's annualized expense ratio, multiplied by the average account value over the period, multiplied by 181 (the number of days in the most recent six-month period), then divided by 365.
| Annualized Expense Ratio | |
| DWS Target 2014 Fund | 1.15% |
For more information, please refer to the Fund's prospectus.
For an analysis of the fees associated with an investment in the Fund or similar funds, please refer to http://apps.finra.org/fundanalyzer/1/fa.aspx.
Tax Information (Unaudited)
For corporate shareholders, 13% of the income dividends paid during the Fund's fiscal year ended July 31, 2013, qualified for the dividends received deduction.
A total of 90% of the dividends distributed during the fiscal year was derived from interest on U.S. government securities, which is generally exempt from state income tax.
For federal income tax purposes, the Fund designates $96,000, or the maximum amount allowable under tax law, as qualified dividend income.
Please consult a tax advisor if you have questions about federal or state income tax laws, or on how to prepare your tax returns. If you have specific questions about your account, please call (800) 728-3337.
Summary of Management Fee Evaluation by Independent Fee Consultant
September 17, 2012
Pursuant to an Order entered into by Deutsche Investment Management Americas and affiliates (collectively, "DeAM") with the Attorney General of New York, I, Thomas H. Mack, have been appointed the Independent Fee Consultant for the DWS Funds (formerly the DWS Scudder Funds). My duties include preparing an annual written evaluation of the management fees DeAM charges the Funds, considering among other factors the management fees charged by other mutual fund companies for like services, management fees DeAM charges other clients for like services, DeAM's costs of supplying services under the management agreements and related profit margins, possible economies of scale if a Fund grows larger, and the nature and quality of DeAM's services, including fund performance. This report summarizes my evaluation for 2012, including my qualifications, the evaluation process for each of the DWS Funds, consideration of certain complex-level factors, and my conclusions. I served in substantially the same capacity in 2007, 2008, 2009, 2010 and 2011.
Qualifications
For more than 35 years I have served in various professional capacities within the investment management business. I have held investment analysis and advisory positions, including securities analyst, portfolio strategist and director of investment policy with a large investment firm. I have also performed business management functions, including business development, financial management and marketing research and analysis.
Since 1991, I have been an independent consultant within the asset management industry. I have provided services to over 125 client organizations, including investment managers, mutual fund boards, product distributors and related organizations. Over the past ten years I have completed a number of assignments for mutual fund boards, specifically including assisting boards with management contract renewal.
I hold a Master of Business Administration degree, with highest honors, from Harvard University and Master of Science and Bachelor of Science (highest honors) degrees from the University of California at Berkeley. I am an independent director and audit committee financial expert for two closed-end mutual funds and have served in various leadership and financial oversight capacities with non-profit organizations.
Evaluation of Fees for each DWS Fund
My work focused primarily on evaluating, fund-by-fund, the fees charged to each of the 103 mutual fund portfolios in the DWS Fund family. For each Fund, I considered each of the key factors mentioned above, as well as any other relevant information. In doing so I worked closely with the Funds' Independent Directors in their annual contract renewal process, as well as in their approval of contracts for several new funds (documented separately).
In evaluating each Fund's fees, I reviewed comprehensive materials provided by or on behalf of DeAM, including expense information prepared by Lipper Analytical, comparative performance information, profitability data, manager histories, and other materials. I also accessed certain additional information from the Lipper and Morningstar databases and drew on my industry knowledge and experience.
To facilitate evaluating this considerable body of information, I prepared for each Fund a document summarizing the key data elements in each area as well as additional analytics discussed below. This made it possible to consider each key data element in the context of the others.
In the course of contract renewal, DeAM agreed to implement a number of fee and expense adjustments requested by the Independent Directors which will favorably impact future fees and expenses, and my evaluation includes the effects of these changes.
Fees and Expenses Compared with Other Funds
The competitive fee and expense evaluation for each fund focused on two primary comparisons:
The Fund's contractual management fee (the advisory fee plus the administration fee where applicable) compared with those of a group of typically 12-15 funds in the same Lipper investment category (e.g. Large Capitalization Growth) having similar distribution arrangements and being of similar size.
The Fund's total expenses compared with a broader universe of funds from the same Lipper investment category and having similar distribution arrangements.
These two comparisons provide a view of not only the level of the fee compared with funds of similar scale but also the total expense the Fund bears for all the services it receives, in comparison with the investment choices available in the Fund's investment category and distribution channel. The principal figure-of-merit used in these comparisons was the subject Fund's percentile ranking against peers.
DeAM's Fees for Similar Services to Others
DeAM provided management fee schedules for all of its US domiciled fund and non-fund investment management accounts in any of the investment categories where there is a DWS Fund. These similar products included the other DWS Funds, non-fund pooled accounts, institutional accounts and sub-advisory accounts. Using this information, I calculated for each Fund the fee that would be charged to each similar product, at the subject Fund's asset level.
Evaluating information regarding non-fund products is difficult because there are varying levels of services required for different types of accounts, with mutual funds generally requiring considerably more regulatory and administrative types of service as well as having more frequent cash flows than other types of accounts. Also, while mutual fund fees for similar fund products can be expected to be similar, there will be some differences due to different pricing conditions in different distribution channels (e.g. retail funds versus those used in variable insurance products), differences in underlying investment processes and other factors.
Costs and Profit Margins
DeAM provided a detailed profitability analysis for each Fund. After making some adjustments so that the presentation would be more comparable to the available industry figures, I reviewed profit margins from investment management alone, from investment management plus other fund services (excluding distribution) provided to the Funds by DeAM (principally shareholder services), and DeAM profits from all sources, including distribution. A later section comments on overall profitability.
Economies of Scale
Economies of scale — an expected decline in management cost per dollar of fund assets as fund assets grow — are very rarely quantified and documented because of inherent difficulties in collecting and analyzing relevant data. However, in virtually every investment category that I reviewed, larger funds tend to have lower fees and lower total expenses than smaller funds. To see how each DWS Fund compares with this industry observation, I reviewed:
The trend in Fund assets over the last five years and the accompanying trend in total expenses. This shows if the Fund has grown and, if so, whether total expense (management fees as well as other expenses) have declined as a percent of assets.
Whether the Fund has break-points in its management fee schedule, the extent of the fee reduction built into the schedule and the asset levels where the breaks take effect, and in the case of a sub-advised Fund how the Fund's break-points compare with those of the sub-advisory fee schedule.
How the Fund's contractual fee schedule compares with trends in the industry data. To accomplish this, I constructed a chart showing how actual latest-fiscal-year contractual fees of the Fund and of other similar funds relate to average fund assets, with the subject Fund's contractual fee schedule superimposed.
Quality of Service — Performance
The quality-of-service evaluation focused on investment performance, which is the principal result of the investment management service. Each Fund's performance was reviewed over the past 1, 3, 5 and 10 years, as applicable, and compared with that of other funds in the same investment category and with a suitable market index.
In addition, I calculated and reviewed risk-adjusted returns relative to an index of similar mutual funds' returns and a suitable market index. The risk-adjusted returns analysis provides a way of determining the extent to which the Fund's return comparisons are mainly the product of investment value-added (or lack thereof) or alternatively taking considerably more or less risk than is typical in its investment category.
I also received and considered the history of portfolio manager changes for each Fund, as this provided an important context for evaluating the performance results.
Complex-Level Considerations
While this evaluation was conducted mainly at the individual fund level, there are some issues relating to the reasonableness of fees that can alternatively be considered across the whole fund complex:
I reviewed DeAM's profitability analysis for all DWS Funds, with a view toward determining if the allocation procedures used were reasonable and how profit levels compared with public data for other investment managers.
I considered whether DeAM and affiliates receive any significant ancillary or "fallout" benefits that should be considered in interpreting the direct profitability results. These would be situations where serving as the investment manager of the Funds is beneficial to another part of the Deutsche Bank organization.
I considered how aggregated DWS Fund expenses had varied over the years, by asset class and in the context of trends in asset levels.
I considered how aggregated DWS Fund performance measures relative to appropriate peers had varied by asset class and over time.
I reviewed the structure of the DeAM organization, trends in staffing levels, and information on compensation of investment management and other professionals compared with industry data.
Findings
Based on the process and analysis discussed above, which included reviewing a wide range of information from management and external data sources and considering among other factors the fees DeAM charges other clients, the fees charged by other fund managers, DeAM's costs and profits associated with managing the Funds, economies of scale, possible fall-out benefits, and the nature and quality of services provided, in my opinion the management fees charged the DWS Funds are reasonable.
Thomas H. Mack
President, Thomas H. Mack & Co., Inc.
Board Members and Officers
The following table presents certain information regarding the Board Members and Officers of the fund. Each Board Member's year of birth is set forth in parentheses after his or her name. Unless otherwise noted, (i) each Board Member has engaged in the principal occupation(s) noted in the table for at least the most recent five years, although not necessarily in the same capacity; and (ii) the address of each Independent Board Member is c/o Kenneth C. Froewiss, Chairman, DWS Mutual Funds, P.O. Box 78, Short Hills, NJ 07078. Except as otherwise noted below, the term of office for each Board Member is until the election and qualification of a successor, or until such Board Member sooner dies, resigns, is removed or as otherwise provided in the governing documents of the fund. Because the fund does not hold an annual meeting of shareholders, each Board Member will hold office for an indeterminate period. The Board Members may also serve in similar capacities with other funds in the fund complex.
| Independent Board Members |
Name, Year of Birth, Position with the Fund and Length of Time Served1 | | Business Experience and Directorships During the Past Five Years | Number of Funds in DWS Fund Complex Overseen |
Other Directorships Held by Board Member |
Kenneth C. Froewiss (1945) Chairperson since 2013,9 and Board Member since 2001 | | Adjunct Professor of Finance, NYU Stern School of Business (September 2009-present; Clinical Professor from 1997-September 2009); Member, Finance Committee, Association for Asian Studies (2002-present); Director, Mitsui Sumitomo Insurance Group (US) (2004-present); prior thereto, Managing Director, J.P. Morgan (investment banking firm) (until 1996) | 102 | — |
William McClayton (1944) Vice Chairperson since 2013,9 and Board Member since 2004 | | Private equity investor (since October 2009); previously, Managing Director, Diamond Management & Technology Consultants, Inc. (global consulting firm) (2001-2009); Directorship: Board of Managers, YMCA of Metropolitan Chicago; formerly: Senior Partner, Arthur Andersen LLP (accounting) (1966-2001); Trustee, Ravinia Festival | 102 | — |
John W. Ballantine (1946) Board Member since 1999 | | Retired; formerly, Executive Vice President and Chief Risk Management Officer, First Chicago NBD Corporation/The First National Bank of Chicago (1996-1998); Executive Vice President and Head of International Banking (1995-1996); former Directorships: Stockwell Capital Investments PLC (private equity); First Oak Brook Bancshares, Inc. and Oak Brook Bank; Prisma Energy International | 102 | Chairman of the Board, Healthways, Inc.2 (provider of disease and care management services) (2003- present); Portland General Electric2 (utility company) (2003- present) |
Henry P. Becton, Jr. (1943) Board Member since 1990 | | Vice Chair and former President, WGBH Educational Foundation. Directorships: Public Radio International; Public Radio Exchange (PRX); The PBS Foundation; North Bennett Street School (Boston); former Directorships: Association of Public Television Stations; Boston Museum of Science; American Public Television; Concord Academy; New England Aquarium; Mass. Corporation for Educational Telecommunications; Committee for Economic Development; Public Broadcasting Service; Connecticut College | 102 | Lead Director, Becton Dickinson and Company2 (medical technology company); Lead Director, Belo Corporation2 (media company) |
Dawn-Marie Driscoll (1946) Board Member since 1987 | | President, Driscoll Associates (consulting firm); Emeritus Executive Fellow, Center for Business Ethics, Bentley University; formerly, Partner, Palmer & Dodge (1988-1990); Vice President of Corporate Affairs and General Counsel, Filene's (1978-1988). Directorships: Director of ICI Mutual Insurance Company (since 2007); Advisory Board, Center for Business Ethics, Bentley University; Chairman of the Board of Trustees, Southwest Florida Community Foundation (charitable organization); former Directorships: Sun Capital Advisers Trust (mutual funds) (2007-2012), Investment Company Institute (audit, executive, nominating committees) and Independent Directors Council (governance, executive committees) | 102 | — |
Keith R. Fox, CFA (1954) Board Member since 1996 | | Managing General Partner, Exeter Capital Partners (a series of private investment funds) (since 1986). Directorships: Progressive International Corporation (kitchen goods importer and distributor); The Kennel Shop (retailer); former Chairman, National Association of Small Business Investment Companies; former Directorships: BoxTop Media Inc. (advertising); Sun Capital Advisers Trust (mutual funds) (2011-2012) | 102 | — |
Paul K. Freeman (1950) Board Member since 1993, and Chairperson (2009-Jan. 8, 2013) | | Consultant, World Bank/Inter-American Development Bank; Executive and Governing Council of the Independent Directors Council (Chairman of Education Committee); formerly: Project Leader, International Institute for Applied Systems Analysis (1998-2001); Chief Executive Officer, The Eric Group, Inc. (environmental insurance) (1986-1998); Directorships: Denver Zoo Foundation (December 2012-present); former Directorships: Prisma Energy International | 102 | — |
Richard J. Herring (1946) Board Member since 1990 | | Jacob Safra Professor of International Banking and Professor, Finance Department, The Wharton School, University of Pennsylvania (since July 1972); Co-Director, Wharton Financial Institutions Center (since July 2000); Co-Chair, U.S. Shadow Financial Regulatory Committee; Executive Director, Financial Economists Roundtable; formerly: Vice Dean and Director, Wharton Undergraduate Division (July 1995-June 2000); Director, Lauder Institute of International Management Studies (July 2000-June 2006) | 102 | Director, Japan Equity Fund, Inc. (since September 2007), Thai Capital Fund, Inc. (since 2007), Singapore Fund, Inc. (since September 2007), Independent Director of Barclays Bank Delaware (since September 2010) |
Rebecca W. Rimel (1951) Board Member since 1995 | | President and Chief Executive Officer, The Pew Charitable Trusts (charitable organization) (1994 to present); formerly: Executive Vice President, The Glenmede Trust Company (investment trust and wealth management) (1983-2004); Board Member, Investor Education (charitable organization) (2004-2005); Trustee, Executive Committee, Philadelphia Chamber of Commerce (2001-2007); Director, Viasys Health Care2 (January 2007-June 2007); Trustee, Thomas Jefferson Foundation (charitable organization) (1994-2012) | 102 | Director, Becton Dickinson and Company2 (medical technology company) (2012- present); Director, CardioNet, Inc.2 (health care) (2009- present) |
William N. Searcy, Jr. (1946) Board Member since 1993 | | Private investor since October 2003; formerly: Pension & Savings Trust Officer, Sprint Corporation2 (telecommunications) (November 1989-September 2003); Trustee, Sun Capital Advisers Trust (mutual funds) (1998-2012) | 102 | — |
Jean Gleason Stromberg (1943) Board Member since 1997 | | Retired. Formerly, Consultant (1997-2001); Director, Financial Markets U.S. Government Accountability Office (1996-1997); Partner, Fulbright & Jaworski, L.L.P. (law firm) (1978-1996). Directorships: The William and Flora Hewlett Foundation; former Directorships: Service Source, Inc., Mutual Fund Directors Forum (2002-2004), American Bar Retirement Association (funding vehicle for retirement plans) (1987-1990 and 1994-1996) | 102 | — |
Robert H. Wadsworth (1940) Board Member since 1999 | | President, Robert H. Wadsworth & Associates, Inc. (consulting firm) (1983 to present); Director, National Horizon, Inc. (non-profit organization); Director and Treasurer, The Phoenix Boys Choir Association | 105 | — |
Interested Board Member and Officer4 |
Name, Year of Birth, Position with the Fund and Length of Time Served1,6 | | Business Experience and Directorships During the Past Five Years | Number of Funds in DWS Fund Complex Overseen |
Other Directorships Held by Board Member |
Michael J. Woods5 (1967) Board Member since 2013,9 and Executive Vice President since 20139 | | Managing Director,3 Deutsche Asset & Wealth Management (2009-present); Head of the Americas Asset Management Business for Deutsche Bank, Member of the Asset and Wealth Management ("AWM") Extended Executive Committee, AWM Global Client Group Executive Committee and the AWM Active Asset Management Executive Committee; CEO and US Regional Head of DWS Investments; formerly: Sr. VP, Head of the Financial Intermediaries and Investments Group of Evergreen Investments (2007-2009), CEO and Vice Chairman of Board of Directors of XTF Global Asset Management (2006-2007), Managing Director — US Head of Sub-Advisory and Investment Only Business at Citigroup Asset Management (2000-2006). Mr. Woods is currently a board member of The Children's Village, The Big Brothers Big Sisters Organization, and The Mutual Fund Education Alliance. | 38 | — |
Officers4 |
Name, Year of Birth, Position with the Fund and Length of Time Served6 | | Business Experience and Directorships During the Past Five Years |
W. Douglas Beck, CFA7 (1967) President, 2011-present | | Managing Director,3 Deutsche Asset & Wealth Management (2006-present); President of DWS family of funds and Head of Product Management, U.S. for DWS Investments; formerly: Executive Director, Head of Product Management (2002-2006) and President (2005-2006) of the UBS Funds at UBS Global Asset Management; Co-Head of Manager Research/Managed Solutions Group, Merrill Lynch (1998-2002) |
John Millette8 (1962) Vice President and Secretary, 1999-present | | Director,3 Deutsche Asset & Wealth Management |
Paul H. Schubert7 (1963) Chief Financial Officer, 2004-present Treasurer, 2005-present | | Managing Director,3 Deutsche Asset & Wealth Management (since July 2004); formerly: Executive Director, Head of Mutual Fund Services and Treasurer for UBS Family of Funds (1998-2004); Vice President and Director of Mutual Fund Finance at UBS Global Asset Management (1994-1998) |
Caroline Pearson8 (1962) Chief Legal Officer, 2010-present | | Managing Director,3 Deutsche Asset & Wealth Management; formerly: Assistant Secretary for DWS family of funds (1997-2010) |
Melinda Morrow7 (1970) Vice President, 2012-present | | Director,3 Deutsche Asset & Wealth Management |
Hepsen Uzcan8 (1974) Assistant Secretary, since 20139 | | Vice President, Deutsche Asset & Wealth Management |
Paul Antosca8 (1957) Assistant Treasurer, 2007-present | | Director,3 Deutsche Asset & Wealth Management |
Jack Clark8 (1967) Assistant Treasurer, 2007-present | | Director,3 Deutsche Asset & Wealth Management |
Diane Kenneally8 (1966) Assistant Treasurer, 2007-present | | Director,3 Deutsche Asset & Wealth Management |
John Caruso7 (1965) Anti-Money Laundering Compliance Officer, 2010-present | | Managing Director,3 Deutsche Asset & Wealth Management |
Robert Kloby7 (1962) Chief Compliance Officer, 2006-present | | Managing Director,3 Deutsche Asset & Wealth Management |
1 The length of time served represents the year in which the Board Member joined the board of one or more DWS funds currently overseen by the Board.
2 A publicly held company with securities registered pursuant to Section 12 of the Securities Exchange Act of 1934.
3 Executive title, not a board directorship.
4 As a result of their respective positions held with the Advisor, these individuals are considered "interested persons" of the Advisor within the meaning of the 1940 Act. Interested persons receive no compensation from the fund.
5 The mailing address of Mr. Woods is 60 Wall Street, New York, New York 10005. Mr. Woods is an interested Board Member by virtue of his positions with Deutsche Asset & Wealth Management. As an interested person, Mr. Woods receives no compensation from the fund. Mr. Woods is a board member of the following trusts and corporations: Cash Account Trust, DWS Market Trust, DWS Money Funds, DWS State Tax-Free Income Series, DWS Target Fund, DWS Value Series, Inc., DWS Variable Series II, Investors Cash Trust, Tax-Exempt California Money Market Fund, DWS Global High Income Fund, Inc., DWS High Income Opportunities Fund, Inc., DWS High Income Trust, DWS Multi-Market Income Trust, DWS Municipal Income Trust, DWS Strategic Income Trust and DWS Strategic Municipal Income Trust.
6 The length of time served represents the year in which the officer was first elected in such capacity for one or more DWS funds.
7 Address: 60 Wall Street, New York, NY 10005.
8 Address: One Beacon Street, Boston, MA 02108.
9 Effective as of January 9, 2013.
The fund's Statement of Additional Information ("SAI") includes additional information about the Board Members. The SAI is available, without charge, upon request. If you would like to request a copy of the SAI, you may do so by calling the following toll-free number: (800) 728-3337.
Account Management Resources | |
| For More Information | | The automated telephone system allows you to access personalized account information and obtain information on other DWS funds using either your voice or your telephone keypad. For more information, contact your financial advisor. You may also access our automated telephone system or speak with a DWS Investments representative by calling the number below: (800) 728-3337 |
| Web Site | | www.dws-investments.com View your account transactions and balances, trade shares, monitor your asset allocation, and change your address, 24 hours a day. Obtain prospectuses and applications, blank forms, interactive worksheets, news about DWS funds, subscription to fund updates by e-mail, retirement planning information, and more. |
| Written Correspondence | | DWS Investments PO Box 219151 Kansas City, MO 64121-9151 |
| Proxy Voting | | The fund's policies and procedures for voting proxies for portfolio securities and information about how the fund voted proxies related to its portfolio securities during the 12-month period ended June 30 are available on our Web site — www.dws-investments.com (click on "proxy voting"at the bottom of the page) — or on the SEC's Web site — www.sec.gov. To obtain a written copy of the fund's policies and procedures without charge, upon request, call us toll free at (800) 728-3337. |
| Portfolio Holdings | | Following the fund's fiscal first and third quarter-end, a complete portfolio holdings listing is filed with the SEC on Form N-Q. This form will be available on the SEC's Web site at www.sec.gov, and it also may be reviewed and copied at the SEC's Public Reference Room in Washington, D.C. Information on the operation of the SEC's Public Reference Room may be obtained by calling (800) SEC-0330. The fund's portfolio holdings are also posted on www.dws-investments.com from time to time. Please see the fund's current prospectus for more information. |
| Principal Underwriter | | If you have questions, comments or complaints, contact: DWS Investments Distributors, Inc. 222 South Riverside Plaza Chicago, IL 60606-5808 (800) 621-1148 |
| Investment Management | | Deutsche Investment Management Americas Inc. ("DIMA" or the "Advisor"), which is part of Deutsche Asset & Wealth Management, is the investment advisor for the fund. DIMA and its predecessors have more than 80 years of experience managing mutual funds and DIMA provides a full range of investment advisory services to both institutional and retail clients. DIMA is an indirect, wholly owned subsidiary of Deutsche Bank AG. Deutsche Bank AG is a major global banking institution engaged in a wide variety of financial services, including investment management, retail, private and commercial banking, investment banking and insurance. DWS Investments is the retail brand name in the U.S. for the asset management activities of Deutsche Bank AG and DIMA. As such, DWS is committed to delivering the investing expertise, insight and resources of this global investment platform to American investors. |
| Nasdaq Symbol | | KRFEX | |
| CUSIP Number | | | 23337N 709 | |
| Fund Number | | | 55 | |
Notes
Notes
Notes
Pursuant to the requirements of the Securities Exchange Act of 1934 and the Investment Company Act of 1940, the registrant has duly caused this report to be signed on its behalf by the undersigned, thereunto duly authorized.
Pursuant to the requirements of the Securities Exchange Act of 1934 and the Investment Company Act of 1940, this report has been signed below by the following persons on behalf of the registrant and in the capacities and on the dates indicated.