Third Quarter 2024 Results November 7, 2024 EXHIBIT 99.2
2ROYAL GOLD, INC. | THIRD QUARTER 2024 RESULTS | NOVEMBER 7, 2024 Cautionary Statements Forward-Looking Statements: This presentation and the accompanying webcast include “forward-looking statements” within the meaning of U.S. federal securities laws. Forward-looking statements are any statements other than statements of historical fact. Forward-looking statements are not guarantees of future performance, and actual results may differ materially from these statements. Forward-looking statements are often identified by words like “will,” “may,” “could,” “should,” “would,” “believe,” “estimate,” “expect,” “anticipate,” “plan,” “forecast,” “potential,” “intend,” “continue,” “project,” or negatives of these words or similar expressions. Forward-looking statements include, among others, statements about the following: our expected financial performance and outlook, including our 2024 guidance; operators’ expected operating and financial performance and other anticipated developments relating to their properties and operations,, including production, deliveries, estimates of mineral resources and mineral reserves, environmental and feasibility studies, technical reports, mine plans, capital requirements, liquidity, and capital expenditures; opportunities for acquisitions and other transactions; anticipated benefits from acquisitions and other transactions; the receipt and timing of future metal deliveries, including deferred amounts at Pueblo Viejo; and repayment of outstanding balances on our revolving line of credit. Factors that could cause actual results to differ materially from these forward-looking statements include, among others, the following: changes in the price of gold, silver, copper, or other metals; operating activities or financial performance of properties on which we hold stream or royalty interests, including variations between actual and forecasted performance, operators’ ability to complete projects on schedule and as planned, operators’ changes to mine plans and mineral reserves and mineral resources (including updated mineral reserve and mineral resource information), liquidity needs, mining and environmental hazards, labor disputes, distribution and supply chain disruptions, permitting and licensing issues, other adverse government or court actions, or operational disruptions; changes of control of properties or operators; contractual issues involving our stream or royalty agreements; the timing of deliveries of metals from operators and our subsequent sales of metal; risks associated with doing business in foreign countries; increased competition for stream and royalty interests; environmental risks, including those caused by climate change; potential cyber-attacks, including ransomware; our ability to identify, finance, value and complete acquisitions or other transactions; adverse economic and market conditions; impact of health epidemics and pandemics; changes in laws or regulations governing us, operators or operating properties; changes in management and key employees; and other factors described in our reports filed with the Securities and Exchange Commission, including Item 1A. Risk Factors of our most recent Annual Report on Form 10-K. Most of these factors are beyond our ability to predict or control. Other unpredictable or unknown factors not discussed in this presentation could also have material adverse effects on forward-looking statements. Forward-looking statements speak only as of the date on which they are made. We disclaim any obligation to update any forward-looking statements, except as required by law. Readers are cautioned not to put undue reliance on forward-looking statements. References to Years: All references in this presentation to years are to the twelve months ended or ending December 31 of the referenced year, unless otherwise noted. Statement Regarding Third-Party Information: Certain information provided in this presentation, including information about mineral resources and reserves, historical production, production estimates, property descriptions, and property developments, has been provided to us by the operators of the relevant properties or is publicly available information filed by these operators with applicable securities regulatory bodies, in certain cases including the Securities and Exchange Commission. Royal Gold has not verified, and is not in a position to verify, and expressly disclaims any responsibility for the accuracy, completeness or fairness of any such third-party information and refers the reader to the public reports filed by the operators for information regarding those properties .
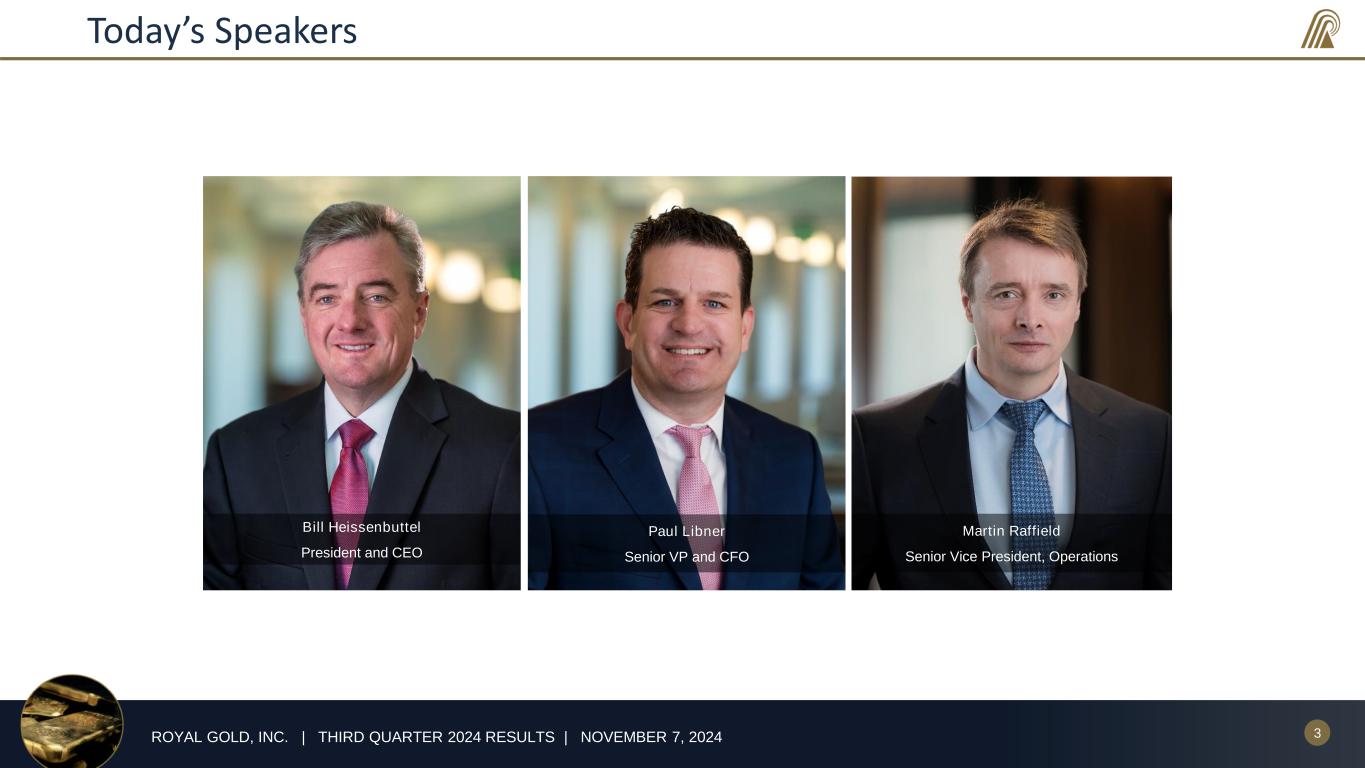
3ROYAL GOLD, INC. | THIRD QUARTER 2024 RESULTS | NOVEMBER 7, 2024 Today’s Speakers Bill Heissenbuttel President and CEO Paul Libner Senior VP and CFO Martin Raffield Senior Vice President, Operations
4ROYAL GOLD, INC. | THIRD QUARTER 2024 RESULTS | NOVEMBER 7, 2024 Q3 2024 Overview • Highlights • Record revenue of $193.8M • Cash flow from operations of $136.7M • Net income of $96.2M, or $1.46/share • After adjustments,1 record net income of $96.6M, or $1.47/share • $26.3M dividends paid • $50M repaid on revolving credit facility • $0 debt outstanding • Available liquidity of approximately $1.1B • Other notable developments • First royalty revenue recognized from Manh Choh and Côté Gold mines • Change to reserve and resource disclosure due to regulation SK 1300
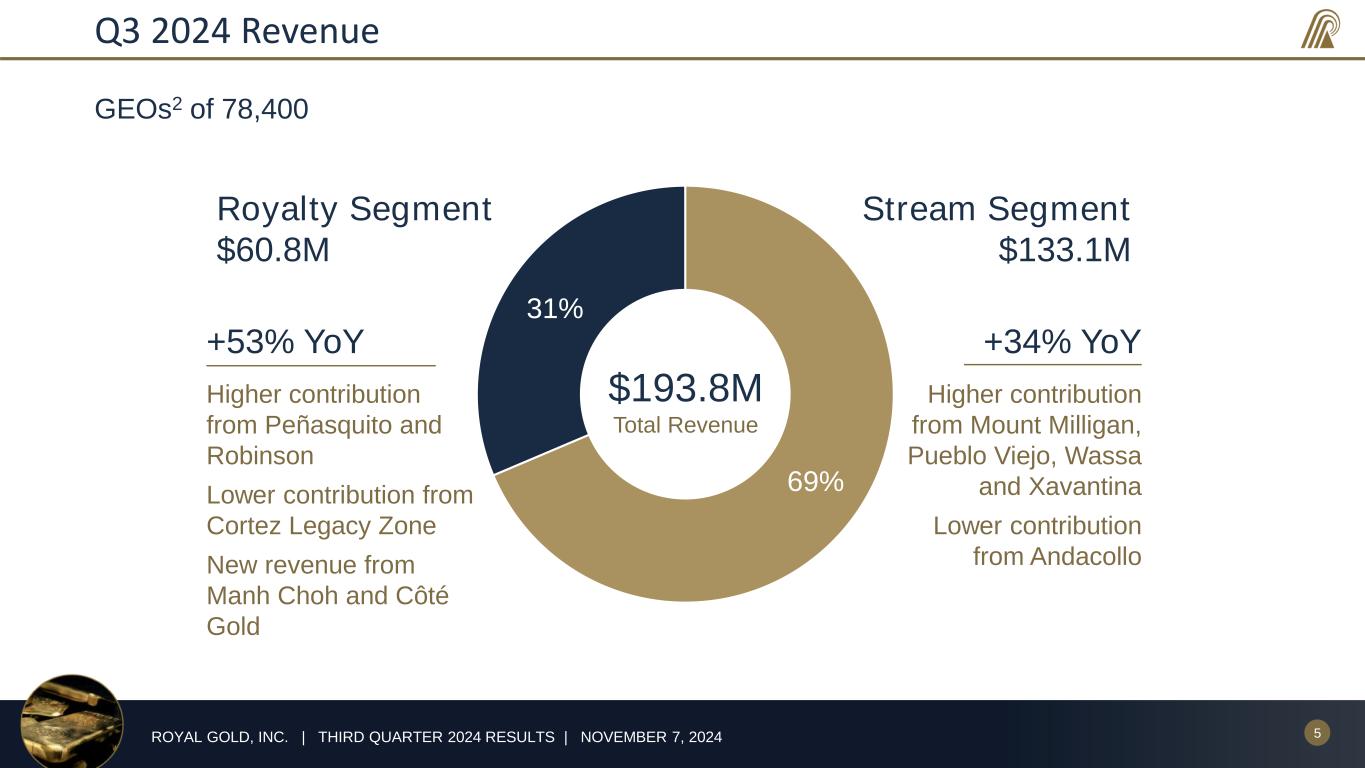
5ROYAL GOLD, INC. | THIRD QUARTER 2024 RESULTS | NOVEMBER 7, 2024 69% 31% Q3 2024 Revenue GEOs2 of 78,400 $193.8M Total Revenue Royalty Segment $60.8M Stream Segment $133.1M +53% YoY Higher contribution from Peñasquito and Robinson Lower contribution from Cortez Legacy Zone New revenue from Manh Choh and Côté Gold +34% YoY Higher contribution from Mount Milligan, Pueblo Viejo, Wassa and Xavantina Lower contribution from Andacollo

6ROYAL GOLD, INC. | THIRD QUARTER 2024 RESULTS | NOVEMBER 7, 2024 Operator Updates3 Mount Milligan • Site-wide optimization program continuing • Preliminary Economic Assessment advancing • Targeted for late H1 2025 completion • 2024 guidance unchanged: 180,000 – 200,000 oz gold, 55 – 65M lb copper • Gold production trending towards lower end of range Andacollo • Improved mill throughput • Water availability increased after restrictions earlier in 2024 • Q3 gold production of 6,300 oz; up 17% over last year

7ROYAL GOLD, INC. | THIRD QUARTER 2024 RESULTS | NOVEMBER 7, 2024 Operator Updates3 Peñasquito • New labor agreement for 2024-2026 • Transition to Peñasco pit starting ahead of plan • Higher gold grade expected to increase gold production in Q4 and into 2025 Khoemacau • Improved mining/milling volumes and higher ore grades in Q3 • Development ongoing to increase mining fronts, operational flexibility and access to higher-grade areas • Expansion to 130kt/year • Feasibility study to start by the end of 2024, with first concentrate produced in 2028 • Royal Gold area of interest includes expanded production from operating Zone 5 mine and Mango NE deposit
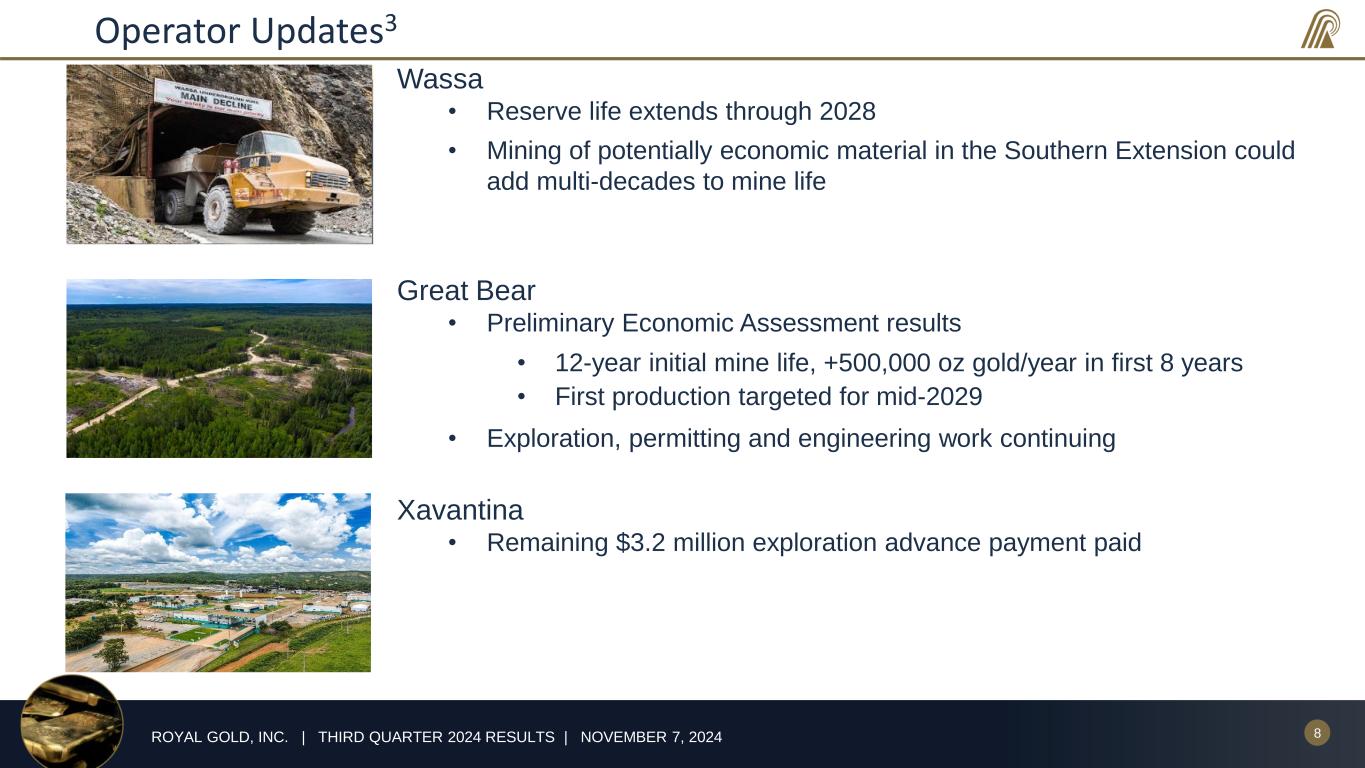
8ROYAL GOLD, INC. | THIRD QUARTER 2024 RESULTS | NOVEMBER 7, 2024 Operator Updates3 Wassa • Reserve life extends through 2028 • Mining of potentially economic material in the Southern Extension could add multi-decades to mine life Great Bear • Preliminary Economic Assessment results • 12-year initial mine life, +500,000 oz gold/year in first 8 years • First production targeted for mid-2029 • Exploration, permitting and engineering work continuing Xavantina • Remaining $3.2 million exploration advance payment paid
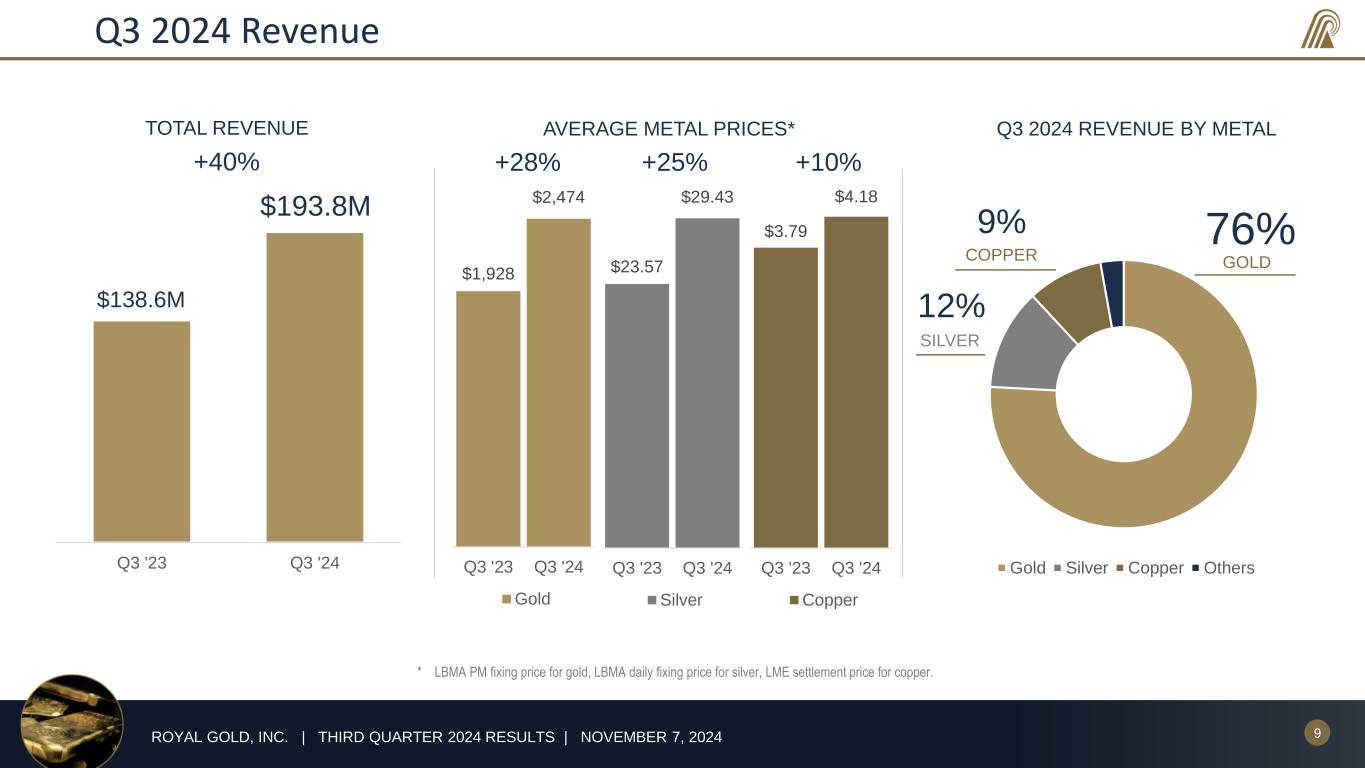
9ROYAL GOLD, INC. | THIRD QUARTER 2024 RESULTS | NOVEMBER 7, 2024 Q3 2024 Revenue * LBMA PM fixing price for gold, LBMA daily fixing price for silver, LME settlement price for copper. Gold Silver Copper Others AVERAGE METAL PRICES* $1,928 $2,474 Q3 '23 Q3 '24 Gold $23.57 $29.43 Q3 '23 Q3 '24 Silver $3.79 $4.18 Q3 '23 Q3 '24 Copper +28% +10%+25% TOTAL REVENUE Q3 '23 Q3 '24 GOLD 76% Q3 2024 REVENUE BY METAL $193.8M $138.6M 9% 12% SILVER COPPER +40%

10ROYAL GOLD, INC. | THIRD QUARTER 2024 RESULTS | NOVEMBER 7, 2024 Q3 2024 Financial Results • $193.8M revenue • $10.1M G&A • $36.2M DD&A, or $462/GEO2 • $1.2M interest expense • 18.3% effective tax rate • $96.2M net income, or $1.46/share • $96.6M net income, or $1.47/share, adjusted1 to exclude: • $(0.4)M, or $(0.01)/share – fair value change in equity securities • $136.7M operating cash flow

11ROYAL GOLD, INC. | THIRD QUARTER 2024 RESULTS | NOVEMBER 7, 2024 September 30, 2024 Liquidity • $0M debt at September 30, 2024 • $50M repayment made during Q3 • Approximately $1.1B of liquidity available: • No material financial commitments September 30, 2024 Amount (US$ M) Undrawn revolving credit facility 1,000 Working capital 116 Total available liquidity $1,116
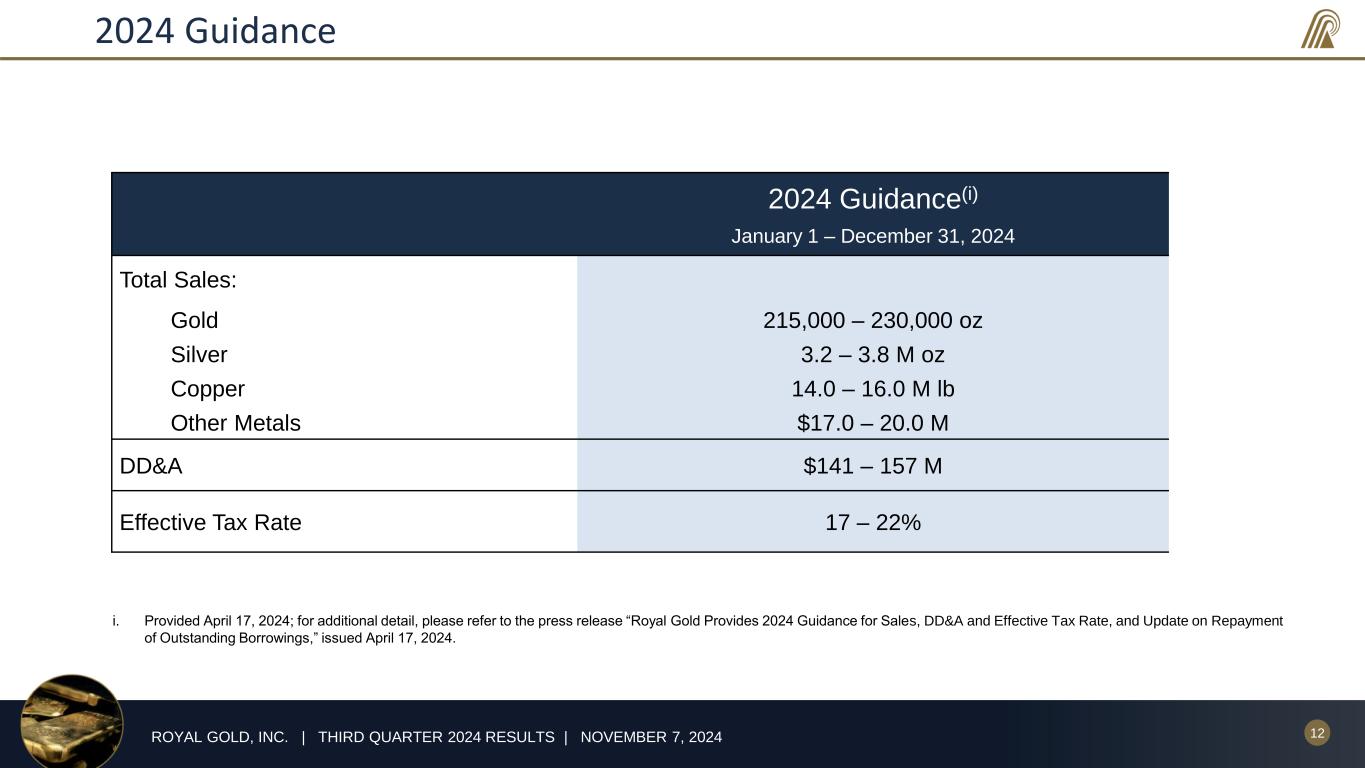
12ROYAL GOLD, INC. | THIRD QUARTER 2024 RESULTS | NOVEMBER 7, 2024 2024 Guidance 2024 Guidance(i) January 1 – December 31, 2024 Total Sales: Gold 215,000 – 230,000 oz Silver 3.2 – 3.8 M oz Copper 14.0 – 16.0 M lb Other Metals $17.0 – 20.0 M DD&A $141 – 157 M Effective Tax Rate 17 – 22% i. Provided April 17, 2024; for additional detail, please refer to the press release “Royal Gold Provides 2024 Guidance for Sales, DD&A and Effective Tax Rate, and Update on Repayment of Outstanding Borrowings,” issued April 17, 2024.
13ROYAL GOLD, INC. | THIRD QUARTER 2024 RESULTS | NOVEMBER 7, 2024 Endnotes 1. Adjusted net income and adjusted net income per share are non-GAAP financial measures. See Schedule A to the accompanying press release dated November 6, 2024, for more information. 2. Gold Equivalent Ounces (“GEOs”) are calculated as reported revenue (in total or by reportable segment) for a period divided by the average LBMA PM fixing price for gold for that same period. 3. Certain information on this slide has been provided by the operators of these properties or is publicly available information disclosed by the operators.

Tel. 303.573.1660 investorrelations@royalgold.com www.royalgold.com


