UNITED STATES
SECURITIES AND EXCHANGE COMMISSION
Washington, D.C. 20549
Form 10-K
| | | | | |
| (Mark One) | |
| x | ANNUAL REPORT PURSUANT TO SECTION 13 OR 15(d) OF THE SECURITIES EXCHANGE ACT OF 1934 |
For the Fiscal Year Ended December 31, 2024
or
| | | | | |
| o | TRANSITION REPORT PURSUANT TO SECTION 13 OR 15(d) OF THE SECURITIES EXCHANGE ACT OF 1934 |
Commission File Number 001-13357
Royal Gold, Inc.
(Exact Name of Registrant as Specified in Its Charter)
| | | | | |
Delaware (State or Other Jurisdiction of Incorporation or Organization) | 84-0835164 (I.R.S. Employer Identification No.) |
| |
1144 15th Street, Suite 2500 Denver, Colorado (Address of Principal Executive Offices) | 80202 (Zip Code) |
Registrant’s telephone number, including area code (303) 573-1660
Securities registered pursuant to Section 12(b) of the Act:
| | | | | | | | | | | | | | |
| Title of Each Class | | Trading Symbol | | Name of the Exchange on which Registered |
| Common Stock, $0.01 par value | | RGLD | | Nasdaq Global Select Market |
Securities registered pursuant to Section 12(g) of the Act: None
________________________________________________________________
Indicate by check mark if the registrant is a well-known seasoned issuer, as defined in Rule 405 of the Securities Act. Yes x No o
Indicate by check mark if the registrant is not required to file reports pursuant to Section 13 or Section 15(d) of the Exchange Act. Yes o No x
Indicate by check mark whether the registrant (1) has filed all reports required to be filed by Section 13 or 15(d) of the Securities Exchange Act of 1934 during the preceding 12 months (or for such shorter period that the registrant was required to file such reports), and (2) has been subject to such filing requirements for the past 90 days. Yes x No o
Indicate by check mark whether the registrant has submitted electronically every Interactive Data File required to be submitted pursuant to Rule 405 of Regulation S-T (§ 232.405 of this chapter) during the preceding 12 months (or for such shorter period that the registrant was required to submit such files). Yes x No o
Indicate by check mark whether the registrant is a large accelerated filer, an accelerated filer, a non-accelerated filer, a smaller reporting company, or an emerging growth company. See the definitions of “large accelerated filer,” “accelerated filer,” “smaller reporting company,” and “emerging growth company” in Rule 12b-2 of the Exchange Act.
| | | | | |
Large accelerated filer x | Accelerated filer o |
| |
Non-accelerated filer o | Smaller reporting company o |
| |
Emerging growth company o | |
If an emerging growth company, indicate by check mark if the registrant has elected not to use the extended transition period for complying with any new or revised financial accounting standards provided pursuant to Section 13(a) of the Exchange Act. o
Indicate by check mark whether the registrant has filed a report on and attestation to its management’s assessment of the effectiveness of its internal control over financial reporting under Section 404(b) of the Sarbanes-Oxley Act (15 U.S.C. 7262(b)) by the registered public accounting firm that prepared or issued its audit report. x
If securities are registered pursuant to Section 12(b) of the Act, indicate by check mark whether the financial statements of the registrant included in the filing reflect the correction of an error to previously issued financial statements. o
Indicate by check mark whether any of those error corrections are restatements that required a recovery analysis of incentive-based compensation received by any of the registrant’s executive officers during the relevant recovery period pursuant to §240.10D-1(b). o
Indicate by check mark whether the registrant is a shell company (as defined in Rule 12b-2 of the Exchange Act). Yes o No x
The aggregate market value of Royal Gold common stock held by non-affiliates of the registrant, based on the closing sale price of Royal Gold common stock on June 28, 2024, as reported on the Nasdaq Global Select Market was $8.2 billion.
There were 65,758,616 shares of Royal Gold common stock outstanding as of February 3, 2025.
DOCUMENTS INCORPORATED BY REFERENCE
Certain information required by Items 10, 11, 12, 13, and 14 of Part III of Form 10-K is incorporated by reference from portions of Royal Gold’s definitive proxy statement relating to its 2025 annual meeting of stockholders to be filed within 120 days after December 31, 2024.
INDEX
This report contains and incorporates by reference “forward-looking statements” within the meaning of U.S. federal securities laws. Forward-looking statements are made based on management’s current expectations and beliefs concerning future developments. Actual results may differ, possibly materially, from forward-looking statements due to various factors. For a discussion of some of these factors, see Item 1A, Risk Factors, and Item 7, Management’s Discussion and Analysis of Financial Condition and Results of Operations, of this report.
Royal Gold does not own, develop, or mine the properties on which it holds stream or royalty interests. Certain information provided in this report about operating properties in which we hold interests, including information about historical production, property descriptions, and property developments, was provided to us by the operators of those properties or is publicly available information filed by these operators with applicable securities regulatory bodies, including the Securities and Exchange Commission (the “SEC”). Royal Gold has not verified, and is not in a position to verify, and expressly disclaims any responsibility for the accuracy, completeness, or fairness of, this third-party information and refers the reader to the public disclosure of the operators for information regarding those properties.
Unless the context otherwise requires, references to “Royal Gold,” the “Company,” “we,” “us,” and “our” refer to Royal Gold, Inc. and its consolidated subsidiaries.
PART I
ITEM 1. BUSINESS
Overview
We acquire and manage precious metal streams, royalties, and similar interests. We seek to acquire existing stream and royalty interests or to finance projects that are in production, development or in the exploration stage in exchange for stream or royalty interests. We do not conduct mining operations on the properties in which we hold stream and royalty interests and are generally not required to contribute to capital costs, environmental costs, or other operating costs on the properties. Please refer to Item 2, Properties, for a discussion of the developments at our principal properties.
We are continually reviewing opportunities to grow our portfolio, whether through the creation or acquisition of new or existing stream or royalty interests or other acquisition activity. We generally have acquisition opportunities in various stages of review. Our review process may include, for example, engaging consultants and advisors to analyze an opportunity; analysis of financial, legal (including corporate governance) and technical (including environmental issues concerning air, water and biodiversity and social impacts) and other confidential information regarding an opportunity; submission of indications of interest and term sheets; participation in preliminary discussions and negotiations; and involvement as a bidder in competitive processes.
As discussed in further detail throughout this report, some key business highlights and developments for the year ended December 31, 2024 were as follows:
•During calendar year 2024 we repaid the remaining $250 million outstanding under our $1 billion revolving credit facility, resulting in the revolving credit facility being fully undrawn and available as of December 31, 2024.
•We had record revenue of $719.4 million for the year ended December 31, 2024, compared to $605.7 million for the comparable prior year period, representing a 19% increase.
•We generated a record $529.5 million of net operating cash flow for the year ended December 31, 2024, compared to $415.8 million for the comparable prior year period, representing a 27% increase.
•We increased our calendar year dividend to $1.80 per basic share, which is paid in quarterly installments throughout calendar year 2025. This represents a 13% increase compared with the dividend paid during calendar year 2024.
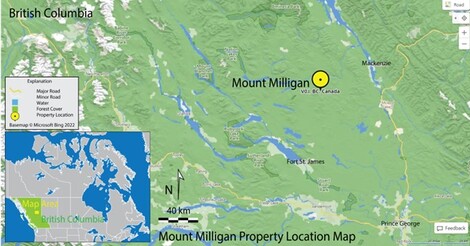
•On February 13, 2024, we entered into a Cost Support Agreement with Centerra Gold Inc. ("Centerra") to incentivize Centerra to continue to invest and maximize the value of the large mineral endowment at Mount Milligan. The Cost Support Agreement provided a basis for a reserve increase and extension of the Mount Milligan mine life to 2035 and may provide a basis for further extension of the mine life beyond 2035.
•We acquired royalty interests for total cash consideration of $106 million on the Back River Gold District in Nunavut, Canada, and the Cactus Project in Arizona, U.S.A.
Certain Definitions
Development stage property: A property that has mineral reserves disclosed but no material extraction.
Dollar or “$”: Refers to U.S. dollars. We refer to Canadian dollars as C$.
Exploration stage property: A property that has no mineral reserves disclosed.
Gold equivalent ounces (GEOs): GEOs are calculated as Royal Gold’s revenue divided by the average gold price for the period, with the gold price determined based on the LBMA Price.
Gross smelter return (GSR) royalty: A defined percentage of the gross revenue from a mineral resource extraction operation, less, if applicable, certain contract-defined costs paid by or charged to the operator.
Indicated mineral resource: That part of a mineral resource for which quantity and grade or quality are estimated on the basis of adequate geological evidence and sampling. The level of geological certainty associated with an indicated mineral resource is sufficient to allow a qualified person to apply modifying factors in sufficient detail to support mine planning and evaluation of the economic viability of the deposit. Because an indicated mineral resource has a lower level of confidence than the level of confidence of a measured mineral resource, an indicated mineral resource may only be converted to a probable mineral reserve.
Inferred mineral resource: That part of a mineral resource for which quantity and grade or quality are estimated on the basis of limited geological evidence and sampling. The level of geological uncertainty associated with an inferred mineral resource is too high to apply relevant technical and economic factors likely to influence the prospects of economic extraction in a manner useful for evaluation of economic viability. Because an inferred mineral resource has the lowest level of geological confidence of all mineral resources, which prevents the application of the modifying factors in a manner useful for evaluation of economic viability, an inferred mineral resource may not be considered when assessing the economic viability of a mining project, and may not be converted to a mineral reserve.
LBMA Price: The London Bullion Market Association PM fixing prices in U.S. dollars for gold and daily fixing prices in U.S. dollars for silver.
LME Price: The London Metals Exchange settlement price for copper and other metals, as applicable.
Measured mineral resource: That part of a mineral resource for which quantity and grade or quality are estimated on the basis of conclusive geological evidence and sampling. The level of geological certainty associated with a measured mineral resource is sufficient to allow a qualified person to apply modifying factors, as defined in Subpart 1300 of Regulation S-K (“S-K 1300”), in sufficient detail to support detailed mine planning and final evaluation of the economic viability of the deposit. Because a measured mineral resource has a higher level of confidence than the level of confidence of either an indicated mineral resource or an inferred mineral resource, a measured mineral resource may be converted to a proven mineral reserve or to a probable mineral reserve.
Metal stream: A purchase agreement that provides, in exchange for an upfront deposit payment, the right to purchase all or a portion of one or more metals produced from a mine, at a price determined for the life of the transaction by the purchase agreement.
Mineral reserve: An estimate of tonnage and grade or quality of indicated and measured mineral resources that, in the opinion of the qualified person, can be the basis of an economically viable project. More specifically, it is the economically mineable part of a measured or indicated mineral resource, which includes diluting materials and allowances for losses that may occur when the material is mined or extracted.
Mineral resource: A concentration or occurrence of material of economic interest in or on the Earth's crust in such form, grade or quality, and quantity that there are reasonable prospects for economic extraction. A mineral resource is a reasonable estimate of mineralization, taking into account relevant factors such as cut-off grade, likely mining dimensions,
location or continuity, that, with the assumed and justifiable technical and economic conditions, is likely to, in whole or in part, become economically extractable. It is not merely an inventory of all mineralization drilled or sampled.
Net smelter return (NSR) royalty: A defined percentage of the gross revenue from a resource extraction operation less a proportionate share of incidental transportation, insurance, refining and smelting costs.
Net value royalty (NVR): A defined percentage of the gross revenue from a resource extraction operation less certain contract-defined costs.
Payable metal: Ounces or pounds of metal in concentrate after deduction of a percentage of metal in concentrate by a third-party smelter pursuant to smelting contracts.
Probable mineral reserve: The economically mineable part of an indicated and, in some cases, a measured mineral resource.
Production stage property: A property with material extraction of mineral reserves.
Proven mineral reserve: The economically mineable part of a measured mineral resource that can only result from conversion of a measured mineral resource.
Royalty: The right to receive a percentage or other denomination of mineral production from a mining operation.
Ton: A unit of weight equal to 2,000 pounds or 907.2 kilograms.
Tonne: A unit of weight equal to 2,204.6 pounds or 1,000 kilograms.
Our Operational Information
We manage our business under two reportable segments:
•Acquisition and Management of Stream Interests — A metal stream is a purchase agreement that provides, in exchange for an upfront deposit payment, the right to purchase all or a portion of one or more metals produced from a mine, at a price determined for the life of the transaction by the purchase agreement. As of December 31, 2024 we owned nine stream interests, which are on seven production stage properties and two development stage properties. Stream interests accounted for 67% and 69% of our total revenue for the years ended December 31, 2024 and 2023, respectively. We expect stream interests to continue representing a significant portion of our total revenue.
•Acquisition and Management of Royalty Interests — Royalties are non-operating interests in mining projects that provide the right to revenue or metals produced from the project after deducting specified costs, if any. As of December 31, 2024, we owned royalty interests on 35 production stage properties, 16 development stage properties and 115 exploration stage properties, of which we consider 50 to be evaluation stage projects. We use “evaluation stage” to describe exploration stage properties that contain mineral resources and on which operators are engaged in the search for reserves. Royalty interests accounted for 33% and 31% of our total revenue for the years ended December 31, 2024 and 2023, respectively.
Our long-lived assets (stream and royalty interests, net) for the years ended December 31, 2024 and 2023 are geographically distributed as shown in the following table (amounts are in thousands):
| | | | | | | | | | | | | | | | | | | | | | | | | | | | | | | | | | | |
| As of December 31, 2024 | | As of December 31, 2023 |
| Stream
interest | | Royalty
interest | | Total stream
and royalty
interests, net | | Stream
interest | | Royalty
interest | | Total stream
and royalty
interests, net |
| Canada | $ | 417,643 | | | $ | 659,070 | | | $ | 1,076,713 | | | $ | 461,398 | | | $ | 614,900 | | | $ | 1,076,298 | |
| Dominican Republic | 302,122 | | | — | | | 302,122 | | | 311,050 | | | — | | | 311,050 | |
| Africa | 237,028 | | | 321 | | | 237,349 | | | 264,529 | | | 321 | | | 264,850 | |
| Chile | 211,123 | | | 224,116 | | | 435,239 | | | 222,629 | | | 224,116 | | | 446,745 | |
| United States | — | | | 827,277 | | | 827,277 | | | — | | | 794,891 | | | 794,891 | |
| Mexico | — | | | 33,800 | | | 33,800 | | | — | | | 41,803 | | | 41,803 | |
| Australia | — | | | 19,265 | | | 19,265 | | | — | | | 21,288 | | | 21,288 | |
| Rest of world | 85,254 | | | 25,785 | | | 111,039 | | | 92,010 | | | 26,639 | | | 118,649 | |
| Total | $ | 1,253,170 | | | $ | 1,789,634 | | | $ | 3,042,804 | | | $ | 1,351,616 | | | $ | 1,723,958 | | | $ | 3,075,574 | |
Our reportable segments for purposes of assessing performance for the years ended December 31, 2024, 2023 and 2022, respectively, are shown below (amounts are in thousands):
| | | | | | | | | | | | | | | | | | | | | | | | | | | | | |
| Year Ended December 31, 2024 |
| Revenue | | Cost of sales(1) | | Production taxes | | Depletion(2) | | Segment gross profit(3) |
| Stream interests | | | | | | | | | |
| Canada | $ | 231,801 | | | $ | 43,262 | | | $ | — | | | $ | 43,755 | | | $ | 144,784 | |
| Dominican Republic | 83,059 | | | 23,620 | | | — | | | 8,929 | | | 50,510 | |
| Africa | 82,132 | | | 16,069 | | | — | | | 27,501 | | | 38,562 | |
| Chile | 47,531 | | | 6,951 | | | — | | | 11,506 | | | 29,074 | |
| Rest of the world | 38,771 | | | 7,612 | | | — | | | 11,109 | | | 20,050 | |
| Total stream interests | 483,294 | | | 97,514 | | | — | | | 102,800 | | | 282,980 | |
| | | | | | | | | |
| Royalty interests | | | | | | | | | |
| United States | $ | 121,212 | | | $ | — | | | $ | 5,419 | | | $ | 22,902 | | | $ | 92,891 | |
| Mexico | 52,842 | | | — | | | — | | | 8,003 | | | 44,839 | |
| Australia | 28,966 | | | — | | | — | | | 2,023 | | | 26,943 | |
| Canada | 18,945 | | | — | | | 1,203 | | | 7,502 | | | 10,240 | |
| Rest of the world | 14,136 | | | — | | | — | | | 855 | | | 13,281 | |
| Total royalty interests | 236,101 | | | — | | | 6,622 | | | 41,285 | | | 188,194 | |
| Total | $ | 719,395 | | | $ | 97,514 | | | $ | 6,622 | | | $ | 144,085 | | | $ | 471,174 | |
| | | | | | | | | |
| | | | | | | | | | | | | | | | | | | | | | | | | | | | | |
| Year Ended December 31, 2023 |
| Revenue | | Cost of sales(1) | | Production taxes | | Depletion(2) | | Segment gross profit(3) |
| Stream interests | | | | | | | | | |
| Canada | $ | 196,961 | | | $ | 41,624 | | | $ | — | | | $ | 50,559 | | | $ | 104,778 | |
| Dominican Republic | 76,247 | | | 22,339 | | | — | | | 9,817 | | | 44,091 | |
| Africa | 70,757 | | | 14,319 | | | — | | | 35,193 | | | 21,245 | |
| Chile | 48,920 | | | 7,225 | | | — | | | 13,683 | | | 28,012 | |
| Rest of the world | 25,395 | | | 5,016 | | | — | | | 11,869 | | | 8,510 | |
| Total stream interests | 418,280 | | | 90,523 | | | — | | | 121,121 | | | 206,636 | |
| | | | | | | | | |
| Royalty interests | | | | | | | | | |
| United States | $ | 123,690 | | | $ | — | | | $ | 6,232 | | | $ | 28,551 | | | $ | 88,907 | |
| Mexico | 25,754 | | | — | | | — | | | 8,353 | | | 17,401 | |
| Australia | 19,011 | | | — | | | — | | | 831 | | | 18,180 | |
| Canada | 12,712 | | | — | | | 1,062 | | | 5,650 | | | 6,000 | |
| Rest of the world | 6,270 | | | — | | | — | | | — | | | 6,270 | |
| Total royalty interests | 187,437 | | | — | | | 7,294 | | | 43,385 | | | 136,758 | |
| Total | $ | 605,717 | | | $ | 90,523 | | | $ | 7,294 | | | $ | 164,506 | | | $ | 343,394 | |
| | | | | | | | | | | | | | | | | | | | | | | | | | | | | |
| Year Ended December 31, 2022 |
| Revenue | | Cost of sales(1) | | Production taxes | | Depletion(2) | | Segment gross profit(3) |
| Stream interests | | | | | | | | | |
| Canada | $ | 212,369 | | | $ | 46,438 | | | $ | — | | | $ | 67,368 | | | $ | 98,563 | |
| Dominican Republic | 85,863 | | | 26,211 | | | — | | | 29,216 | | | 30,436 | |
| Africa | 53,787 | | | 11,135 | | | — | | | 24,348 | | | 18,304 | |
| Chile | 47,347 | | | 7,165 | | | — | | | 12,835 | | | 27,347 | |
| Rest of the world | 18,427 | | | 3,693 | | | — | | | 9,759 | | | 4,975 | |
| Total stream interests | 417,793 | | | 94,642 | | | — | | | 143,526 | | | 179,625 | |
| | | | | | | | | |
| Royalty interests | | | | | | | | | |
| United States | $ | 81,642 | | | $ | — | | | $ | 4,131 | | | $ | 13,966 | | | $ | 63,545 | |
| Mexico | 52,388 | | | — | | | — | | | 10,822 | | | 41,566 | |
| Canada | 27,210 | | | — | | | 2,890 | | | 9,039 | | | 15,281 | |
| Australia | 15,672 | | | — | | | — | | | 1,089 | | | 14,583 | |
| Rest of the world | 8,501 | | | — | | | — | | | — | | | 8,501 | |
| Total royalty interests | 185,413 | | | — | | | 7,021 | | | 34,916 | | | 143,476 | |
| Total | $ | 603,206 | | | $ | 94,642 | | | $ | 7,021 | | | $ | 178,442 | | | $ | 323,101 | |
_______________________________________________________
(1)Excludes depreciation, depletion and amortization.
(2)Depletion amounts are included within Depreciation, depletion and amortization on our consolidated statements of operations and comprehensive income.
(3)Refer to Note 15 of our notes to consolidated financial statements for a reconciliation of total segment gross profit to consolidated income before income taxes.
Our financial results are primarily tied to the price of gold and, to a lesser extent, the prices of silver and copper, together with the amounts of production from our production stage stream and royalty interests. During the year ended December 31, 2024, we derived approximately 88% of our revenue from precious metals (including 76% from gold and
12% from silver), 9% from copper, and 3% from other minerals. The prices of gold, silver, copper, and other metals have fluctuated widely in recent years. The marketability and the price of metals are influenced by numerous factors beyond our control. Significant declines in the prices of gold, silver, or copper could have a material adverse effect on our results of operations and financial condition.
Competition
The mining industry in general, and stream and royalty segments in particular, are very competitive. We compete with other stream and royalty companies, mine operators, and financial buyers in efforts to acquire existing stream and royalty interests. We also compete with lenders, equity investors, and stream and royalty companies providing financing to operators of mineral properties in our efforts to create new stream and royalty interests. Our competitors may be larger than we are and may have greater resources and access to capital than we have. Key competitive factors in the stream and royalty acquisition and financing business include the ability to identify and evaluate potential opportunities, transaction structure and consideration, and access to capital.
Regulation
Operators of the mines that are subject to our stream and royalty interests must comply with numerous environmental, mine safety, land use, waste disposal, remediation and public health laws and regulations promulgated by federal, state, provincial and local governments in the United States, Canada, Chile, the Dominican Republic and other countries where we hold interests. Although we, as a stream or royalty interest owner, are not responsible for ensuring compliance with these laws and regulations, failure by the operators to comply with applicable laws, regulations and permits can result in injunctive action, orders to suspend or cease operations, damages, and civil and criminal penalties on the operators, which could have a material adverse effect on our results of operations and financial condition.
Human Capital Resources
Employees
We currently have 30 employees that work out of our offices in Denver, Colorado, Lucerne, Switzerland, Vancouver, Canada, and Toronto, Canada. Our employees are not subject to a labor contract or collective bargaining agreement.
Human Capital Management Strategy
The continued growth and success of our business depends on our people, and our people are our most important resource. Management is responsible for ensuring that our policies and practices support our desired corporate culture and employee development. Our human capital management strategy is built on attracting the best talent and developing and retaining talent. We have benefited from a very low voluntary turnover rate, with many of the current staff still with the Company after 10 years of employment.
Human Rights
We are committed to respecting human rights in the jurisdictions where we operate and affirm our commitment to comply with all applicable laws concerning human rights through our Human Rights Policy.
Compensation and Benefits
We offer competitive compensation and benefits to attract and retain top talent. We provide competitive medical and other insurance coverage for employees and eligible dependents and provide for sick leave in the case of illness or absence due to the sickness of the employee or an immediate family member.
Development
We support the continued professional development of our employees by underwriting or subsidizing education and professional development programs for our employees.
Host Community Commitment
We actively seek opportunities to advance sustainability initiatives with the goal of supporting communities that host the operations in which we hold stream and royalty interests during our operators’ mining operations. Many of our operators also actively and positively impact the communities where they mine. We encourage their sustainability initiatives and other efforts and often make our own financial contributions in support of their programs.
Local Community Support
We also believe in supporting the communities where we live and work. Our annual charitable giving is administered by a committee of employees, including members of senior management, that selects donation targets and recipients in our local communities. We are proud to partner with leading charities in Denver, Lucerne, Toronto, and Vancouver that are actively responding to community needs with respect to medical supplies, food availability and security, elder care, and education.
SEC Filings
We file periodic and current reports, proxy statements, and other information with the SEC. This includes our Annual Reports on Form 10-K, Quarterly Reports on Form 10-Q, Current Reports on Form 8-K, and any amendments to those forms. These reports are available free of charge on our website at www.royalgold.com as soon as reasonably practicable after they are electronically filed with or furnished to the SEC. These reports also can be obtained on the SEC’s website at www.sec.gov. The information on our website is not part of this or any other report filed with or furnished to the SEC.
ITEM 1A. RISK FACTORS
You should carefully consider the risks described in this section. Our future performance is subject to risks and uncertainties that could have a material adverse effect on our business, results of operations, and financial condition and the trading price of our common stock. We may be subject to other risks and uncertainties not presently known to us or that we currently deem immaterial. In addition, please see our note about forward-looking statements included in Item 7, Management’s Discussion and Analysis of Financial Condition and Results of Operations.
Risks Relating to Our Business
Our revenue is subject to volatility in metal prices, which could adversely affect our results of operations and cash flow.
Market prices for gold, silver, copper, and other metals fluctuate widely over time and are affected by numerous factors beyond our control. These factors include metal supply and demand, industrial and jewelry fabrication, investment demand, central banking actions, inflation and interest rates, currency values, forward sales by metal producers, and legal, political, social, trade, economic, and banking conditions.
Our revenue is directly tied to metal prices and is particularly sensitive to changes in the price of gold, as we derive most of our revenue from gold stream and royalty interests. Under our stream agreements, we purchase metal at a fixed price or a stated percentage of the market price and then sell the metal in the open market during the term of the contract. If market prices decline, our revenue and cash flow from metal sales could also decline. A price decline could also adversely affect our revenue from certain sliding-scale royalty agreements, under which price decreases below specified thresholds result in lower royalty rates. In addition, revenue under some of our royalty agreements is based on the operator’s concentrate sales to smelters and may be adversely affected by price adjustments based on changes in metals prices between the date an operator ships concentrate to its offtake customer and the date the sale of concentrate is finally settled (typically a period of three to five months). These price adjustments can decrease our revenue in future periods if metal prices decline following shipment.
Metal price declines could cause an operator to reduce, suspend, or terminate production or development at a project, which could decrease or delay our future revenue or revenue expectations from the project. Also, many of our stream and royalty interests relate to metals that are not the primary metal produced at a project, and an operator’s production and development decisions may be influenced by changes in the price of the primary metal. These production or development decisions could prevent us from recovering our investment in the project or result in an impairment to the value of our investment.
We own nonoperating interests in mining properties and cannot ensure properties are developed or operated in our best interests.
Our revenue is derived from stream and royalty interests in properties owned and operated by third parties. In general, we have no decision-making authority regarding the development or operation of the mineral properties underlying our stream and royalty interests. Operators make all or substantially all development and operating decisions, including decisions about permitting, feasibility analysis, mine design and operation, processing, plant and equipment matters, temporary or permanent suspension of operations, estimates of mineral resources and mineral reserves, and the marketing of products from the property. The operators of the properties in which we hold stream and royalty interests may make decisions that are adverse to our interests, and in some cases, the impact of our stream and royalty interests on operator economics may heighten the risk that operators make development or operating decisions adverse to our interests. For example, the cost of servicing the burden of our stream or royalty interest may deter operators from seeking to replace current mineral reserves as they are consumed or identify new mineral resources.
The operators of the projects in which we hold interests may from time to time announce transactions, including the sale or transfer of the projects in which we hold stream or royalty interests or of the operator itself, over which we have little or no control. If such transactions are completed, it may result in a new operator controlling the project, who may not have comparable skills to, and whose interests may differ from, the operator in place at the time of our acquisition, any of which could adversely affect our interests.
We have limited access to the properties in which we hold stream or royalty interests and to information concerning the properties, which makes it more difficult for us to project or assess the performance of our stream and royalty interests and confirm information provided by the operators concerning the properties including mineral resources and mineral reserves, and our ability to disclose mineral resources and mineral reserves for the properties is limited by the SEC.
Our stream and royalty agreements provide us with limited access and information rights concerning the properties in which we hold stream or royalty interests. Operators generally provide us with limited information on mine production relating to the properties that are subject to our interests. Our access to additional property information depends upon the terms of the contracts that underlay our stream and royalty interests, which terms vary significantly among properties. In circumstances where we do receive additional property information, we do not have access to drilling, metallurgical, permitting, development, production, operating, or other data in sufficient detail, nor do we have access to properties, sufficient to confirm disclosure from the operators, including verifying mineral resources and mineral reserves disclosed by the operators. As a result, we generally rely on the operators’ disclosures and/or limited information provided to us by the operators for the information we use in monitoring our interests and in preparing our public disclosure.
Because we have limited information concerning the properties in which we hold stream or royalty interests, it may be difficult for us to project or assess the performance of a stream or royalty interest. Also, we generally are unable to evaluate the accuracy, completeness, or fairness of the information provided to us, or disclosed, by operators and that we use in monitoring our interests and preparing our public disclosure. Any actions we take based on inaccurate or incomplete information from operators could adversely affect our business, financial condition, or results of operations. The correction of inaccurate or incomplete information from operators could also cause the price of our common stock to decline.
In addition, because of our limited access to and information regarding the properties in which we hold stream and royalty interests, qualified persons acting on behalf of the Company are not able to arrive at sufficient findings and conclusions, or prepare adequate supporting documentation, for us to disclose mineral resources or mineral reserves under S-K 1300 in our SEC filings. See Item 2, Properties – Introduction – Mineral Resources and Mineral Reserves, for additional information. While we provide fulsome disclosure of the mineral resources and mineral reserves attributable to our stream and royalty interests on our website and in other public disclosure outside of our SEC filings, the absence of disclosure of mineral resources and mineral reserves in our SEC filings may make it more difficult for investors to evaluate our business and may impair our ability to raise capital or complete transactions involving a registered offering of securities.
Our stream and royalty interests may not result in anticipated returns or may not otherwise ultimately benefit our business.
We are continually reviewing opportunities to acquire new stream and royalty interests, and we have acquisition opportunities at various stages of review. Any acquisition could be material to us. At times, we also may consider ways to restructure our existing stream or royalty interests where we believe the restructuring would provide a long-term benefit to us, even though it could reduce near-term revenues or result in the incurrence of transaction-related costs, including
accounting charges. The success of our stream and royalty interests is based in part on our ability to make accurate assumptions at the time of acquisition or restructuring about the amount and timing of revenue to be derived from those interests. These assumptions are based on a variety of factors, including the geological, geotechnical, hydrogeological, hydrological, metallurgical, legal, permitting, environmental, social, and other aspects of the projects. For development projects, we also make assumptions about the cost, timing, and conduct of development. If an operator fails to bring a project into production as expected or if actual performance otherwise falls short of our assumptions, our revenue derived from the project may not be sufficient to yield an adequate, or any, return on our investment. In addition, we could be required to decrease the carrying value of our investment, which could adversely affect our results of operations or financial condition. We cannot ensure that any acquisition or other transaction will ultimately benefit Royal Gold.
Our future success depends on our ability to acquire additional stream or royalty interests at appropriate valuations.
Our future success depends largely on our ability to acquire additional stream or royalty interests at appropriate valuations. We may not adequately assess technical, operational, legal, environmental, or social risks in connection with new acquisitions, which could adversely affect our expected investment returns or future results of operations. We may not be able to identify and complete acquisitions of additional interests at appropriate prices or terms. We may not have sufficient liquidity or may not be able to obtain debt or equity financing at an acceptable cost of capital in order to fund acquisitions due to economic volatility, credit crises, changes in metal prices, or changes in legal, political, social or other conditions. In addition, certain of our competitors are larger and have greater financial resources than we do, and we may not be able to compete effectively against them. Further, there has been significant growth in the number and relative size of stream and royalty companies over the last several years, and some of these companies may have different investment criteria and costs of capital than we do, or may be subject to different tax and accounting rules than we are, and we may not be able to compete effectively against them. Changes to tax rules, accounting policies, or the treatment of stream interests by debt ratings agencies could make streams or royalties less attractive to operators or render us less able to compete with other stream and royalty companies that are organized in countries with more favorable tax, accounting, and regulatory regimes.
For some properties, we may not realize all of the expected benefits of our investments if operators are unable to replace current mineral reserves as they are consumed or identify new mineral resources, which could adversely affect our future results of operations.
For some properties, our return on investment depends in part on the operators’ ability to replace mineral reserves as they are consumed in the ordinary course of mining. If current mineral reserves are not replaced as they are mined through conversion of mineral resources to new mineral reserves, or new mineral resources are not identified through expansion of known deposits, exploration, or otherwise, our expected investment returns or future results of operations could be adversely affected.
A significant portion of our revenue comes from a small number of operating properties, and adverse developments at these properties could have a more significant or lasting effect on our results of operations than if our revenue were less concentrated.
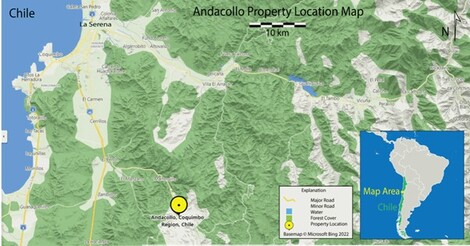
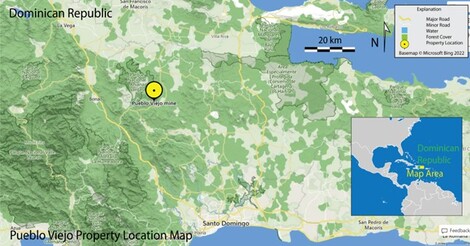
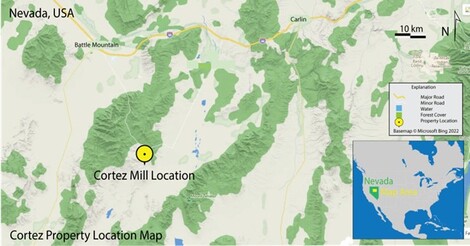
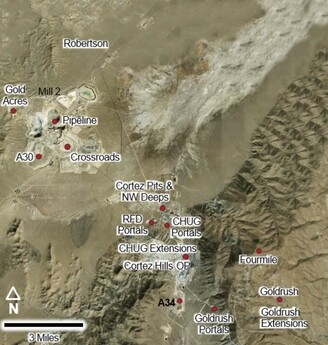
Approximately 55% of our revenue for the year ended December 31, 2024, came from four properties: Mount Milligan (26%), Pueblo Viejo (12%), Cortez (10%), and Andacollo (7%). We expect these properties to continue to represent a significant portion of our revenue going forward. This concentration of revenue could mean that adverse developments, including any adverse decisions made by the operators, at one or more of these properties could have a more significant or longer-term effect on our results of operations than if our revenue were less concentrated.
A significant disruption to our information technology systems or those of our third-party service providers could adversely affect our business and operating results.
We rely on a variety of information technology systems to manage and support our operations. For example, we depend on our information technology systems for financial reporting, operational and investment management, and email. These systems contain, among other information, our proprietary business information and personally identifiable information of our employees and others. The proper functioning of these systems and the security of such data is critical to the efficient operation and management of our business, and these functions are outsourced by us to third-party service providers on whom we rely for the proper functioning and security of these systems. In addition, these systems could require modifications or upgrades from time to time as a result of technological changes or growth in our business, and we may change the third-party service providers with whom we contract to maintain the functioning or security of these systems from time to time, which modifications, upgrades, or changes could be costly and disruptive to our operations and could
impose substantial demands on management’s time. Our systems, and those of our third-party service providers, could be vulnerable to damage or disruption caused by catastrophic events, power outages, natural disasters, computer system or network failures, viruses, ransomware or malware, physical or electronic break-ins, unauthorized access, or cyber-attacks.
Any security breach could compromise our networks, and the information stored on them could be improperly accessed, disclosed, lost, stolen, or restricted. Because techniques used to sabotage systems, obtain unauthorized access to systems, or prohibit authorized access to systems change frequently and generally are not detected until successfully launched against a target, we or our third-party service providers may be unable to anticipate these techniques, and the cybersecurity processes, technologies, and controls that we or our third-party service providers have implemented to secure our systems and electronic information may not be adequate to prevent a disruption or attack or to timely assess, identify, and manage a cyber-attack. To the extent artificial intelligence and deepfake technologies capabilities improve and are increasingly adopted by threat actors, they may be used to craft increasingly sophisticated cybersecurity attacks against us or the third-party service providers upon which we are dependent.
Actions taken by us or third-party service providers in response to a cyber-attack may not be adequate. Any unauthorized activities could disrupt our operations or those of our third-party service providers on which we are dependent; result in the misappropriation or compromise of assets or confidential information; result in extortion or fraud; harm our employees or counterparties; cause us to violate privacy or security laws; or result in legal claims or proceedings, any of which could adversely affect our business, reputation, or operating results.
We depend on the services of our executives and other key employees, and the loss of one or more of these individuals could harm our business.
We believe that our success depends on retaining qualified executives and other key employees, especially in light of our limited number of personnel and the specialized nature of our business. These individuals have significant industry and Company-specific experience. If we are unsuccessful at retaining or attracting qualified personnel, our business could be disrupted and our reputation could be harmed, adversely affecting our ability to achieve our business objectives. We do not currently maintain key person life insurance on any of these individuals or our directors.
We face various risks related to health epidemics, pandemics, and similar outbreaks, which could adversely affect our business, results of operations, financial position, and/or the trading price of our stock.
Health epidemics, pandemics, and similar outbreaks could cause significant volatility and uncertainty in the global economy and financial markets, supply chain issues, labor shortages, and adverse changes in metal prices, and such events could adversely affect our ability to obtain future debt or equity financing for acquisitions on acceptable terms, or at all, and could require temporary curtailments of operations at the properties subject to our stream and royalty interests, as occurred at Mount Milligan and Pueblo Viejo in response to the COVID-19 pandemic. In addition, health epidemics, pandemics, and similar outbreaks, and their resulting impacts, may make it difficult for the operators of the properties subject to our stream and royalty interests to forecast expected production amounts. The effects of health epidemics, pandemics, and similar outbreaks will ultimately depend on many factors that are outside of our control, including the severity and duration of such events and government and operator actions in response to such events, and could adversely affect our business, results of operations, financial position, and/or the trading price of our stock.
Risks Relating to Our Stream and Royalty Interests
Our revenue is subject to operational and other risks faced by operators of the properties in which we hold stream or royalty interests.
We generally are not required to pay capital or operating costs on projects in which we hold stream or royalty interests. However, our revenue and the value of our investments are indirectly subject to hazards and risks normally associated with developing and operating mining properties, including the following hazards and risks faced by the operators of the properties in which we hold stream or royalty interests:
•insufficient ore reserves
•increased capital or operating costs
•declines in the price of gold, silver, copper, or other metals
•declines in metallurgical recoveries
•inability to replace or increase mineral reserves and/or mineral resources as properties are mined
•construction or development delays
•operational disruptions, including those caused by pandemics or other global or local health crises
•inability to assess and manage project technical risks
•inability to obtain or maintain necessary permits
•inability to maintain, or challenges to, exploration or mining rights
•changes in mining taxes and royalties payable to governments and political environments in general
•changes to environmental, permitting, or other legal or regulatory requirements or the enforcement of such requirements, or other adverse government or court actions
•challenges to operations, permits, or mining rights by local communities, indigenous populations, non-government organizations, or others and ineffective management of stakeholder communications and relations
•litigation between operators and third parties relating to the properties
•community or civil unrest, including protests and blockades
•labor shortages, increased labor costs, labor disputes, strikes, or work stoppages, or inability to access sufficient experienced and trained personnel
•unavailability of mining, drilling, or other equipment
•unanticipated geological conditions or metallurgical characteristics
•inadequate supplies of power or other raw materials
•pit wall, tailings dam, or heap leach pad failures or underground stability issues
•fires, explosions, major mechanical or electrical equipment failures, other industrial accidents or other property damage
•challenges managing land disturbances, reclamation requirements, tailing and waste storage, heap leach operations, release of contaminants, or other environmental incidents or damage
•failure to operate in accordance with industry standard safety practices or government regulations
•occurrence of safety events, including lost time incidents and/or fatalities
•natural catastrophes and environmental hazards such as unanticipated groundwater or surface water conditions, earthquakes or hurricanes
•physical effects of climate change, such as extreme changes in temperature, extreme precipitation events, flooding, longer wet or dry seasons, increased temperatures and drought, increased or decreased precipitation and snowfall, wildfires, or more severe storms, any of which may result in costs and other adverse effects to operators
•regulatory changes designed to reduce the effects of climate change, including regulations designed to curtail greenhouse gas emissions, which may lead to increased costs for operators
•market risks associated with the perception of operators’ environmental, social and governance (“ESG”) performance and their ability to deliver on ESG commitments and expectations
•market conditions, including prolonged periods of inflation and supply-chain disruptions and increased interest rates
•uncertain political and economic environments, including economic downturns
•insufficient financing or inability to obtain financing at all or at an acceptable cost of capital
•default by an operator on its obligations to us or its other creditors and counterparties
•insolvency, bankruptcy, or other financial difficulty of the operator
•risk of disruption, damage or failure of information technology systems, and risk of loss and operational delays due to impacts to operational technology systems, such as due to cyber-attacks, malicious software, computer viruses, security breaches, design failures and natural disasters
The occurrence of any of these events could adversely affect operations at the properties in which we hold stream or royalty interests, which in turn could adversely affect our revenue, cash flow and financial condition.
Most of our revenue is derived from properties outside the United States, and risks associated with conducting business in foreign countries or other sovereign jurisdictions could adversely affect our business, results of operations, financial condition, or the trading price of our common stock.
Approximately 83% of our revenue for the year ended December 31, 2024, came from properties outside of the United States, and many of the operators of such properties are organized outside of the United States. Our principal production stage stream and royalty interests on properties outside of the United States are located in Canada, the Dominican Republic, and Chile. In the United States and other countries, indigenous people may be recognized as sovereign entities and may enforce or seek to enforce their own laws and regulations on projects within their sovereign territories. Our activities and
operators’ activities are subject to the risks associated with conducting business in foreign countries or other sovereign jurisdictions, including the following:
•expropriation or nationalization of mining property or other government takings
•seizure of mineral production
•exchange and currency controls and fluctuations
•limitations on foreign exchange or repatriation of earnings
•restrictions on mineral production or price controls
•governmental regulations relating to foreign investment and the mining business or changes in the interpretation of such regulations
•import or export regulations, including trade wars and sanctions and restrictions on metal exports
•changes in government taxation, royalties, tariffs, or duties
•changes in economic, trade, diplomatic, or other relationships between countries or the effects on global and economic conditions, the stability of global financial markets, or the ability of key market participants to operate in certain financial markets, including the imposition of sanctions on doing business with certain governments, companies, or individuals
•high rates of inflation
•unfamiliar or uncertain foreign real estate, mineral tenure, safety, or environmental laws or rules
•war, crime, terrorism, sabotage, blockades, hostage taking, or other forms of civil unrest
•uncertain political or economic environments, including economic downturns
•corruption, fraud, lack of transparency, or underdeveloped laws, courts, or rule of law
•exposure to liabilities or increased compliance costs under anti-corruption, anti-money laundering, child labor, or forced labor laws
•involvement in operations by state-owned or state-controlled entities
•suspension of the enforcement of creditors’ or stockholders’ rights
•loss of access to government-controlled infrastructure, such as roads, bridges, rails, ports, power sources, and water supplies
In addition, because many of our operators are organized outside of the United States, our stream and royalty interests may be subject to the application of foreign laws to our operators, and their stockholders, including laws relating to taxation, foreign ownership structures, corporate transactions, creditors’ rights, bankruptcy, and liquidation. Foreign operations also could be adversely affected by laws and policies of the United States relating to foreign trade, investment, and taxation.
These risks may limit or disrupt the development or operation of properties in which we hold stream and royalty interests or impair our rights or interests in these properties, which could adversely affect our results of operations or financial condition.
If the assumptions underlying operators’ production, mineral reserve, or mineral resource estimates are inaccurate or if future events cause operators to negatively adjust their previous estimates, our future revenue or the value of our investments could be adversely affected.
The operators of the properties in which we hold stream and royalty interests generally prepare production, mineral reserve, and mineral resource estimates for the properties. We do not independently prepare or verify this information and generally lack sufficient information and access to properties to do so. There are numerous uncertainties inherent in these estimates, many of which are outside the operators’ control. As a result, production, mineral reserve, and mineral resource estimates are subjective and necessarily depend upon a number of assumptions, including, among others, reliability of historical data; geological interpretation; geotechnical, geologic and mining conditions; metallurgical recovery; metal prices; operating costs; capital expenditures; development and reclamation costs; mining technology improvements; and the effects of government regulation. If any of the assumptions that the operators make in connection with production, mineral reserve and mineral resource estimates are incorrect, actual production could be significantly lower than the production, mineral reserve, and mineral resource estimates, which could adversely affect our future revenue and the value of our investments. In addition, if the operators’ estimates with respect to the timing of production are incorrect, we could experience variances in expected revenue from period to period.
Further, conversion of operators’ estimates of mineral resources to mineral reserves is subject to future exploration and development and associated risks, and estimated mineral resources may never convert to future mineral reserves. In addition, estimates of mineral resources are subject to similar uncertainties and assumptions as discussed above with respect to mineral reserves.
The operators of properties subject to our interests may be subject to growing environmental risks, including risks associated with climate change, which could adversely affect us, our financial condition, or the value of our interests or of our common stock.
Mining operations are subject to extensive laws and regulations governing land use and the protection of the environment. In addition, many countries have implemented laws and regulations designed to address the effects of climate change, including rules to disclose and reduce industrial emissions and other environmental impacts to which operators or we may be subject. These laws and regulations are constantly evolving in a manner generally expected to result in stricter standards, more liability, and increased costs. Compliance with these laws and regulations can impose substantial costs and burdens on the operators of the properties subject to our interests and perhaps on us as well. In addition, an operator’s failure to comply with these laws and regulations could result in injunctive action, orders to suspend or cease operations, damages, or civil or criminal penalties on the operator. If any of these events were to occur, our revenue or the value of our interests could be adversely affected.
Climate change may also pose physical risks to the properties in which we hold an interest. This could include adverse effects on operations as a result of increasing occurrences of extreme weather events, flooding, water shortages, changes in rainfall and storm patterns, changes in sea levels, heat stress, wildfires, and other negative weather and climate patterns. For example, Andacollo experienced flooding due to a significant rainfall event in July 2022, which caused operations to shut down for five days and negatively affected production over the following six months. In 2023 and 2024, Andacollo faced drought conditions, causing water restrictions that impacted production. These events could damage assets, adversely affect production, harm human life, halt mining operations, temporarily close supporting infrastructure or reduce labor productivity, among other effects.
Market impacts due to climate change and the transition to a low-carbon economy will be varied and complex. Supply and demand for certain commodities, products and services may shift in connection with evolving consumer and investor sentiments. Market perceptions of the mining sector, and, in particular, the role that certain metals will or will not play in the transition to a low-carbon economy, remain uncertain. Potential financial impacts may include increased production costs due to changing input prices, re-pricing of land and assets, increased global competition for key materials needed for new technologies, potential cost increases by insurers and lenders, and potential increases in taxation of the mining and metals sector.
In addition, governments and investors are increasingly seeking enhanced disclosures on the risks, challenges, governance implications, and financial impacts of climate change faced by companies and demanding that companies take a proactive approach to addressing and reducing perceived environmental risks, including the physical, transition, and liability risks associated with climate change, relating to their operations. Adverse publicity or climate-related litigation that affects any of the operators of the principal properties in which we hold interests could adversely affect our business. As a holder of stream and royalty interests, we generally will not have any influence on litigation such as this or access to non-public information concerning such litigation. In addition, we may not have access to sufficient information on the operations in respect of which we hold stream and royalty interests in order to adequately comply with climate change regulations or meet stockholder expectations on adequate disclosure or to quantify the potential effects of climate change on our business.
Challenges relating to climate change could limit the ability of operators to access the capital markets, and such limitations could have a corresponding adverse effect on their business and operations. Although we do not conduct mining operations on the properties in which we hold stream and royalty interests and are not legally required to contribute to environmental or other operating costs on the properties, our own governmental regulators and stockholders may nonetheless demand that we assist the operators of the properties with addressing these environmental risks. If this were to occur, the value of our interests or of our common stock could be adversely affected.
Further, due to expansive environmental laws, it is possible that we could become subject to environmental liabilities for historic periods during which we owned or operated properties or relative to our current ownership interests in mining claims or leases. These liabilities could adversely affect our results of operations or financial condition.
Finally, lenders may be unwilling to provide financing to the mining industry, including companies like Royal Gold that acquire stream and royalty interests in mining projects, due to such lenders’ concerns regarding market perceptions of the mining sector and lender commitments to net-zero emissions targets. If we encounter difficulties in accessing the commercial debt market, our ability to finance new acquisitions of stream and royalty interests could be adversely affected. In addition, if we have to rely on issuing equity to finance transactions, our stock price could be adversely affected, and our stockholders’ ownership could be diluted.
Evolving expectations regarding ESG matters may adversely affect our business, including as a result of additional costs, reputational damage, and/or litigation.
Companies across industries are facing increasing scrutiny from a variety of stakeholders related to their ESG practices. As a passive investor in mining operations, our ESG initiatives and disclosures are often based on information from the operators of the properties in which we hold stream and royalty interests and other third parties, and we generally lack sufficient data or access to properties to verify such information. Evolving expectations regarding ESG initiatives and disclosures may result in increased costs for the operators and us, enhanced compliance or disclosure obligations, or other effects on our business. In addition, our ESG practices and disclosures may subject us to other adverse effects, including reputational damage and/or litigation.
Financing Risks
Future indebtedness or difficulties in accessing the commercial debt market could adversely affect our financial condition and impair our ability to operate our business.
As of December 31, 2024, we had $1 billion available under our revolving credit facility, none of which was drawn. Historically, we have used borrowings under our credit facility to finance investments and acquisitions, and we may incur indebtedness for investments, acquisitions or other purposes in future periods.
Our credit facility expires in June 2028. In the future, we may be unable to obtain new financing or refinance indebtedness on acceptable terms or in amounts sufficient for our business objectives. Our ability to obtain financing, our borrowing costs, and the terms of any financings depend, in part, on prevailing market conditions at the time we seek financing, which may vary based on factors such as market interest rates and ancillary fees, acceptable return targets for lenders, changes in strategy among lenders, and lenders’ willingness to provide financing to the mining industry. Weakness in financial markets or economic conditions, or depressed market prices for gold, silver, copper, or other metals, may also increase the interest rates that lenders require us to pay or adversely affect our ability to obtain financing. Further, financial institutions are facing increasingly rigorous regulation, including more stringent capital and leverage requirements, which may decrease their ability or willingness to lend to us in amounts and on terms comparable to our current credit facility, or at all.
Higher borrowing costs, future increases in our level of indebtedness, or difficulties in accessing the commercial debt market could adversely affect us as follows:
•require us to dedicate a substantial portion of our cash flow from operations to service indebtedness, thereby reducing the availability of cash flow to fund acquisitions, working capital, or dividends
•limit our flexibility in planning for, or reacting to, changes in our business
•restrict us from exploiting business opportunities
•make us more vulnerable to a downturn in our business or the economy
•place us at a competitive disadvantage compared to our competitors with less indebtedness or greater access to financing
•require the consent of our existing lenders to incur additional indebtedness
•limit our ability to borrow additional funds for acquisitions, working capital, or debt-service requirements
•increase our cost of capital, including as a result of higher interest rates and the effects of exchange rates
•decrease our future earnings
•increase our exposure to the credit risks of bank group lenders or those institutions with which we maintain deposits
Our credit agreement contains financial and other restrictive covenants. For example, the agreement includes financial covenants that require us to maintain a maximum leverage ratio and a minimum interest coverage ratio (as these terms are defined under the agreement). These covenants could limit our ability to engage in activities that are in our long-term best interests. Our failure to comply with these covenants could result in an event of default that, if not waived, could result in the acceleration of all outstanding indebtedness.
Legal Risks
Defects in our stream or royalty interests or the bankruptcy or insolvency of an operator could adversely affect the value of our investments.
Despite our due diligence practices, it is possible that defects or problems will exist relating to the existence, validity, enforceability, terms, or geographic extent of our stream and royalty interests. Similarly, stream interests and, in many jurisdictions, royalty interests, are or can be contractual in nature, rather than interests in land. As a result, these interests may not survive a bankruptcy or insolvency of an operator. We often do not have the protection of security interests or similar rights that could help us sustain or recover all or part of our investment in a stream or royalty interest in the event of an operator’s bankruptcy or insolvency. In addition, the contracts governing our stream and royalty interests, including intercreditor agreements with other providers of capital, may not have sufficient legal protections or a court could impose restrictions on enforcement of our rights. If our stream or royalty interests were set aside through judicial or administrative proceedings or if we are unable to enforce our contractual rights, our results of operations and the value of our investments could be adversely affected.
Some of the agreements governing our stream and royalty interests contain terms that could adversely affect the revenues generated from those interests.
Revenue from some of our stream and royalty interests decreases or stops after threshold production, delivery, or payment milestones are achieved or other events occur. For example, our stream interests at Pueblo Viejo and Andacollo, and certain of our royalty interests at other properties, contain provisions for rate reductions and/or cash price increases. As a result, past production and revenue relating to these interests may not be indicative of future results. In addition, some of our stream and royalty interests do not cover all of the mineral reserves or mineral resources at certain properties, which could mean that overall performance reported by the operators may not correlate to the performance of our interests in the properties.
Operators may fail to comply with their contractual arrangements with us or may interpret their obligations in a manner adverse to us, which could decrease our revenue or increase our costs.
At times, operators may be unable or unwilling to fulfill their contractual obligations to us. In addition, we often rely on the operators for the calculation of our stream deliveries or royalty payments. There may be errors in the calculations of payments. Payments to us may be delayed by restrictions imposed by the operators’ lenders, financial distress and related events affecting the operators, delays in the sale or delivery of products, or the ability or willingness of smelters and refiners to process mine products. Our rights to payment under our stream and royalty agreements must, in most cases, be enforced by contract. When we enter into new stream or royalty agreements, we attempt to secure contractual rights that allow us to monitor operators’ compliance with their obligations to us, such as audit or access rights. However, these rights may not be sufficient to ensure compliance. In addition, our stream and royalty agreements are often complex and may be subject to interpretation or uncertainties. Operators and other counterparties may interpret our interests in a manner adverse to us. For these or other reasons, we could be forced to expend resources or take legal action to enforce our contractual rights. We may not be successful in enforcing our contractual rights. As a result, our revenue relating to the disputed interests could be adversely affected. We may also need to expend significant monetary and human resources to defend our position, which could adversely affect our results of operations. In addition, we may be required to make retroactive revenue adjustments as a result of information that we learn through audit or access rights or otherwise from operators and other counterparties.
Changes to U.S. and foreign tax laws could adversely affect our results of operations.
We are subject to taxation in the U.S. and other foreign jurisdictions. Current economic and political conditions make tax laws and their interpretation subject to a significant change in any jurisdiction. We cannot predict the timing or significance of future tax law changes in the U.S. or other countries in which we do business. If material tax law changes are enacted, our future effective tax rate, results of operations, and cash flows could be adversely affected.
Anti-corruption laws and regulations could subject us to liability and require us to incur costs.
We are subject to the U.S. Foreign Corrupt Practices Act (the "FCPA") and other anticorruption laws that prohibit improper payments or offers of payments to third parties, including foreign governments and their officials, for the purpose of obtaining or retaining business. In some cases, we invest in mining operations in certain jurisdictions where corruption may
be more common. Our international investment activities create the risk of unauthorized payments or offers of payments in violation of the FCPA or other anti-corruption laws by one of our employees or agents in violation of our policies. In addition, the operators of the properties in which we hold stream and royalty interests may fail to comply with anti-corruption laws and regulations. Although we do not operate these properties, enforcement authorities could deem us to have some culpability for the operators’ actions. Any violations of the FCPA or other anti-corruption laws could result in significant civil or criminal penalties to us and could adversely affect our reputation.
Risks Related to Our Common Stock
Our stock price may continue to be volatile, and you could lose all or part of your investment.
The market price of our common stock has fluctuated in the past and may continue to do so in the future. For example, during the year ended December 31, 2024, the market price of our common stock ranged from a low of $100.55 to a high of $155.10. Many factors unrelated to operating performance can contribute to volatility in the market price of our common stock, including the following:
•economic, market, political, social, or public health conditions
•market prices of gold, silver, copper, and other metals
•developments relating to properties on which we hold stream or royalty interests
•interest and inflation rates and expectations about both
•currency values
•credit market conditions
Market fluctuations, regardless of cause, may adversely affect our stock price. As a result, you could lose all or part of your investment.
We may issue additional equity securities, which would dilute our existing stockholders and reduce our per-share financial measures and could reduce the market price of our common stock.
We may issue additional equity in the future in connection with acquisitions, strategic transactions, or for other purposes. If we issue additional equity securities, our existing stockholders could be diluted and our per-share financial measures could be reduced. In addition, shares of common stock that we issue in connection with an acquisition may not be subject to resale restrictions. The market price of our common stock could decline if our stockholders sell substantial amounts of our common stock or are perceived by the market as intending to sell these shares other than in an orderly manner.
We may change our practice of paying dividends, which could reduce the value of your investment.
We have paid a cash dividend on our common stock since calendar year 2000. Our Board of Directors has discretion in determining whether to declare a dividend based on a number of factors, including metal prices, economic or market conditions, earnings, cash flow, financial condition, and funding requirements for future opportunities or operations. In addition, corporate law limitations or future contractual restrictions could limit our ability to pay dividends in the future. If our Board of Directors reduces or eliminates future dividends, our stock price could fall, and the success of your investment would depend largely on any future stock price appreciation. We have increased our dividend in prior years. There can be no assurance, however, that we will continue to do so or that we will pay any dividends.
Provisions of Delaware law and our organizational documents could delay or prevent a third party from acquiring us.
The anti-takeover provisions of Delaware law impose barriers to the ability of a third party to acquire control of us, even if a change of control would be beneficial to our existing stockholders. In addition, our certificate of incorporation and bylaws contain provisions that may make it more difficult for a third party to acquire control of us without the approval of our Board of Directors. These provisions may make it more difficult or expensive for a third party to acquire a majority of our outstanding common stock. Among other things, these provisions provide for the following:
•our Board of Directors may approve the issuance of shares of common stock and preferred stock without stockholder approval, except as may be required by Nasdaq rules
•our Board of Directors may establish the rights and preferences of authorized and unissued preferred stock
•our Board of Directors is divided into three classes of directors serving staggered three-year terms
•stockholders may not call special meetings of stockholders
•stockholders must provide advance notice of stockholder proposals and related information
•vacancies and newly created directorships on the Board of Directors may be filled by affirmative vote of a majority of the directors then serving on the Board
These provisions could increase the cost of acquiring us or discourage a third party from acquiring us or removing incumbent management, which could decrease the value of your investment.
ITEM 1B. UNRESOLVED STAFF COMMENTS
None.
ITEM 1C. CYBERSECURITY
To identify and assess material risks from cybersecurity threats, our enterprise risk management program considers cybersecurity threat risks alongside other Company risks as part of our overall risk assessment process. We describe how risks from identified cybersecurity threats have materially affected or are reasonably likely to materially affect us, including our results of operations and financial condition, in the risk factor entitled “A significant disruption to our information technology systems or those of our third-party service providers could adversely affect our business and operating results” under Item 1A, Risk Factors, of this report.
The Senior Vice President and Chief Financial Officer, with assistance from other members of management and contracted information technology and cybersecurity consultants (including consultants with decades of experience in information technology and cybersecurity roles), is responsible for managing our cybersecurity program, policies and strategy. Under its Charter, the Audit and Finance Committee (“AFC”) of our Board of Directors is responsible for oversight of our cybersecurity program. Quarterly and annual reports are provided to our AFC and Board of Directors, respectively, on the cyber risks, threats and projects impacting our cybersecurity program. As part of our continuing effort to evaluate and enhance our cybersecurity program, including risks associated with using third-party service providers, we regularly evaluate the effectiveness of our cybersecurity policies and procedures and provide our employees with cybersecurity training on current and evolving cybersecurity threats.
ITEM 2. PROPERTIES
Introduction
This Item 2 provides summary information about our portfolio of stream and royalty interests, as well as more detailed information about our material stream and royalty interests.
Principal Properties
Royal Gold management periodically reviews the materiality of individual stream and royalty interests within our portfolio. As of December 31, 2024, we determined that four of our stream and royalty interests are material to our business or financial condition: Andacollo, Cortez, Mount Milligan, and Pueblo Viejo. We sometimes refer to these properties as our material, or principal, properties. In making this determination, management considers primarily the relative contribution of estimated future revenue and, to a lesser extent, historical revenue to our portfolio from each property. Estimated future revenue is based on several factors, including mineral resources and mineral reserves subject to our stream and royalty interests, production estimates, feasibility studies, technical reports, metal prices, and mine life assumptions.
Mineral Resources and Mineral Reserves
Under S-K 1300, disclosure of mineral resources and mineral reserves must be based on and accurately reflect information and supporting documentation prepared by a “qualified person,” as such term is defined in S-K 1300. A registrant is responsible for determining that a person meets the qualifications specified under the definition of qualified person and that the disclosure in the registrant’s filing accurately reflects the information provided by the qualified person.
As a stream and royalty company, we have limited access to and information regarding the properties in which we hold interests, and because of these limitations, qualified persons acting on behalf of the Company are not able to arrive at sufficient findings and conclusions, or prepare adequate supporting documentation, for us to disclose mineral resources or mineral reserves under the standards for disclosure established by S-K 1300 for any of the properties in which we hold
interests. In addition, based on guidance from the staff of the SEC, we are not able to rely on disclosure of mineral resources and mineral reserves by the operators of the properties as a basis for our disclosure of mineral resources and mineral reserves under S-K 1300 because such disclosure does not constitute “required information” within the meaning of Item 1303(a)(3)(iii) or Item 1304(a)(2)(iii) of Regulation S-K, and the staff of the SEC further interprets S-K 1300 to preclude in SEC filings the supplemental disclosure of mineral resources and mineral reserves that do not satisfy the standards for disclosure established by S-K 1300. As a result, we are unable to disclose mineral resources and mineral reserves for the properties in which we hold stream and royalty interests in our filings with the SEC. However, we provide disclosure of resources and reserves for the properties in which we hold such interests, as provided to us by the operators or publicly disclosed by the operators, on our website at www.royalgold.com. The information on our website is not part of this or any other report filed with or furnished to the SEC.
Sources of Information
Our disclosures in this Item 2 are based on information provided to us by the operators of the properties or disclosed by the operators in their public filings with the SEC or Canadian securities regulators, including technical reports filed with Canadian securities administrators pursuant to National Instrument 43-101 (“NI 43-101”), and the 2014 Canadian Institute of Mining, Metallurgy and Petroleum Definition Standards and 2019 Best Practice Guideline (“CIM Standards”). We are providing this information because it represents information that we have in our possession and that we believe is responsive to the disclosure obligations set forth in S-K 1300. In some cases, we refer to information for our principal properties as of periods earlier than December 31, 2024 because the operators did not yet disclose more current information by the time we finalized this report.
Newmont Corporation (“Newmont”), a party to joint ventures with Barrick Gold Corporation (“Barrick”) on each of Pueblo Viejo and the mining operations operated by Nevada Gold Mines LLC, a joint venture between Barrick and Newmont with respect to their Nevada operations, which includes Cortez, has filed technical report summaries prepared under S-K 1300 for each of Pueblo Viejo and the Nevada Gold Mines operations. Such technical report summaries, while providing important information about the properties, do not provide information sufficient for qualified persons acting on behalf of the Company to be able to arrive at sufficient findings and conclusions, or prepare adequate supporting documentation, for us to disclose mineral resources or mineral reserves for such properties under the standards for disclosure established by S-K 1300 (see “Mineral Resources and Mineral Reserves” above). Pueblo Viejo and Cortez are our only principal properties for which technical report summaries have been prepared by the operators under S-K 1300. For our other principal properties, we requested that the operators prepare technical report summaries under S-K 1300 or permit us the access and information necessary for us to prepare our own technical report summaries for filing with the SEC. In each case, the operator denied our request. None of the operators is an affiliate of Royal Gold.
Any references in this report to the technical reports, technical report summaries, or other information publicly disclosed by the operators of the properties subject to our stream and royalty interests shall not be deemed to incorporate such information by reference into this report or any future filing under the Securities Act of 1933, as amended, or Securities Exchange Act of 1934, as amended, except to the extent that the Company specifically incorporates such information by reference.
Omission of Certain Information
While S-K 1300 generally requires registrants that hold royalty, streaming, or other similar rights to provide the same disclosure regarding properties as the operators of the properties, S-K 1300 also provides certain accommodations to registrants that hold royalty, streaming, or other similar rights. We rely on the accommodations set forth in Item 1303(a)(3) and Item 1304(a)(2) of Regulation S-K to omit information required under Items 1303 and 1304 to which we lack access, and in accordance with Item 1303(a)(3) and Item 1304(a)(2) of Regulation S-K, we (i) specify the information to which we lack access, (ii) explain that we do not have access to the required information because obtaining the information would result in an unreasonable burden or expense or we requested the information from the applicable operator and our request was denied, and (iii) provide all required information that we do possess or can acquire without incurring an unreasonable burden or expense.
Absent an exemption, a registrant must obtain a dated and signed technical report summary from a qualified person identifying and summarizing the information reviewed and conclusions reached by the qualified person about the mineral resources or mineral reserves determined to be on each material property. As noted above, we do not have sufficient access and information for qualified persons acting on behalf of the Company to arrive at sufficient findings and conclusions, or prepare adequate supporting documentation, for us to disclose mineral resources or mineral reserves under the standards for
disclosure established by S-K 1300 for any of the principal or other properties in which we hold stream or royalty interests, and accordingly, we have not sought to obtain dated and signed technical report summaries from qualified persons pursuant to Item 1302(b)(1) of Regulation S-K.
Applicable Internal Controls
We have in place procedures to gather certain limited information from operators concerning the properties over which we hold stream and royalty interests, including reviewing operator reports (mostly consisting of public filings by the operators, in most cases under foreign reporting regimes and not pursuant to S-K 1300), reviewing information provided to us by the operators under the terms of our stream or royalty agreements, and, in some cases, discussing the properties with operator personnel and reviewing information gained from site visits.
As noted above under “Mineral Resources and Mineral Reserves,” we do not disclose mineral resources and mineral reserves pursuant to S-K 1300 for the properties with respect to which we hold stream and royalty interests. In addition, we do not engage in exploration efforts on those or any other properties. As such, we do not use internal controls in any exploration and mineral resource and reserve estimation efforts within the meaning of Item 1305 of Regulation S-K.
Summary
We own a large portfolio of stream and royalty interests on properties at various stages of review and development.
The following map shows the approximate geographic distribution of all properties on which we hold stream or royalty interests. In many cases, properties shown on the map are in close proximity and the individual properties are not separately identifiable.
Aggregate annual production for all properties on which we hold interests during the years ended December 31, 2024, 2023 and 2022, is shown in the table below. The reported production relates to the amount of stream metal sales and sales
attributable to our royalty interests and may differ from the operators' public reporting due to a number of factors, including timing of the operator's concentrate shipments, the delivery of metal to us and our subsequent sale of the delivered metal.
| | | | | | | | | | | | | | | | | | | | | | | | | | | | | | | | |
| | | | | | Years Ended |
| Stream | | | | Metal | | December 31,
2024 | | December 31,
2023 | | December 31,
2022 |
| | Mount Milligan | | Gold (oz) | | 164,248 | | | 165,844 | | | 193,696 | |
| | | | Copper (lb) | | 63,066,689 | | | 62,985,699 | | | 78,742,419 | |
| | Andacollo | | Gold (oz) | | 20,049 | | | 25,455 | | | 26,150 | |
| | Pueblo Viejo | | Gold (oz) | | 332,184 | | | 360,931 | | | 442,592 | |
| | | | Silver (oz) | | 1,151,253 | | | 1,362,568 | | | 1,622,221 | |
| | Other | | Gold (oz) | | 495,446 | | | 503,390 | | | 470,167 | |
| | Other | | Silver (oz) | | 1,751,266 | | | 1,937,089 | | | 1,322,674 | |
| | | | | | | | | | |
| Royalty | | | | | | | | | | |
| | Cortez | | Gold (oz) | | 720,135 | | | 890,702 | | | 414,117 | |
| | | | Silver (oz) | | 87,690 | | | 105,836 | | | 126,792 | |
| | Other | | Gold (oz) | | 2,428,155 | | | 1,905,190 | | | 2,549,930 | |
| | Other | | Silver (oz) | | 35,152,754 | | | 19,538,810 | | | 32,554,090 | |
| | Other | | Copper (lb) | | 203,990,454 | | | 173,165,799 | | | 207,707,394 | |
| | Other | | Nickel (lb) | | 37,912,955 | | | 27,753,538 | | | 50,797,143 | |
| | Other | | Lead (lb) | | 212,854,866 | | | 106,938,075 | | | 146,789,281 | |
| | Other | | Zinc (lb) | | 544,744,965 | | | 222,457,704 | | | 373,148,732 | |
Location of the Properties
Approximately 83% of our revenue for the year ended December 31, 2024 came from properties outside of the United States, and most of our operators are organized outside of the United States. Our material properties are located in Canada, Chile, the Dominican Republic, and the United States.
Type and Amount of Ownership Interests
A metal stream is a purchase agreement that provides, in exchange for an upfront deposit payment, the right to purchase all or a portion of one or more metals produced from a mine, at a price determined for the life of the transaction by the purchase agreement. See “Certain Definitions” in Item 1, Business, for more information.
Royalties are non-operating interests in mining projects that provide the right to a percentage of revenue or metals produced from the project after deducting specified costs, if any. See “Certain Definitions” in Item 1, Business, for more information.
As of December 31, 2024, we owned nine stream interests and 166 royalty interests.
Identity of Operator or Operators
We work with 132 different operators among our stream and royalty properties; of these 65 are headquartered in Canada, 21 are headquartered in the United States, and 46 are headquartered outside of Canada and the United States. In general, our operators are domiciled in the countries in which they operate. For further information about the operators of our material properties, refer to the section entitled “Material Properties” below.
Titles, Mineral Rights, Leases, or Options and Acreage Involved
The titles, mineral rights, leases, and options involved with our stream and royalty interests vary depending on the country and include exploitation concessions, unpatented and patented mining claims, fee lands, mining leases and prospecting and
mining licenses. For information about the specific titles, mineral rights, leases, options and acreages involved at our material properties, refer to the section entitled “Material Properties” below.
We have an undeterminable number of acres relating to our stream and royalty interests because our interests do not always cover 100% of each property, in some cases our interests extend to an area of interest beyond the original property boundaries, and because the operators will, from time to time, add or subtract acreage from individual properties, which can, in some cases, modify the land position covered by a stream or royalty.
Stage of the Properties (Exploration, Development, or Production)
S-K 1300 subdivides mineral properties into three stages.
1.Production stage properties
2.Development stage properties
3.Exploration stage properties. Royal Gold further subdivides exploration stage properties into two categories:
a.Evaluation stage properties, for which mineral resources have been declared, supported by an appropriate technical report, and
b.Exploration stage properties, for which no mineral resources have been declared.
As of December 31, 2024, we owned stream interests on seven production stage properties and two development stage properties.
As of December 31, 2024, we owned royalty interests on 35 production stage properties, 16 development stage properties, and 115 exploration stage properties, of which we consider 50 to be evaluation stage properties.
Key Permit Conditions
Operators of the mines that are subject to our stream and royalty interests must comply with environmental, mine safety, land use, water use, waste disposal, remediation and public health laws and regulations promulgated by federal, state, provincial and local governments in the United States, Canada, Chile, the Dominican Republic, and other countries where we hold interests. Although we, as a stream or royalty interest owner, are not responsible for ensuring compliance with these laws and regulations, failure by the operators to comply with applicable laws, regulations and permits can result in injunctive action, orders to suspend or cease operations, damages, and civil and criminal penalties on the operators, which could have a material adverse effect on our results of operations and financial condition.
In general, we have no decision-making authority regarding the development or operation of the mineral properties underlying our stream and royalty interests. Operators make all or substantially all development and operating decisions, including decisions about permitting, feasibility analysis, mine design and operation, processing, tailings storage facility (“TSF”) design and operation, plant and equipment matters, and temporary or permanent suspension of operations, as well as estimates of resources and reserves.
Mine Types and Mineralization Styles
Our operating stream and royalty interests cover all types of mineralization styles in a number of primary commodities. Table 1 shows mine types and mineralization styles at our principal properties.
Table 1 Mine Type and Mineralization Style for Principal Properties
| | | | | | | | |
| Property | Mine Type | Mineralization styles |
| Andacollo | Open Pit | Porphyry copper-gold |
| Cortez | Open Pit & Underground | Carlin-Type Sediment-Hosted gold |
| Mount Milligan | Open Pit | Porphyry copper-gold |
| Pueblo Viejo | Open Pit | High-Sulfidation Epithermal gold-silver |
Additional specific information on the Principal Properties is available in the section entitled “Material Properties”, below.
Processing Plants and Other Available Facilities
Facilities and infrastructure for our properties vary widely based on the stage of each property.
Our Principal Properties are all production stage properties. As such, each of our Principal Properties has infrastructure and facilities appropriate to conduct mining and processing operations. A summary of key processing infrastructure is shown in Table 2.
Table 2 Key Process Infrastructure for Principal Properties
| | | | | | | | |
| , | | |
| Property | | Processing |
| Andacollo | | 20.1 million tonne per annum (“Mtpa”) sulfide flotation mill producing a copper-gold concentrate |
| Cortez | | 4.90 Mtpa cyanide leaching mill along with heap leaching facilities for lower-grade, oxide gold ores and offsite processing of refractory ores, producing a gold-silver doré |
| Mount Milligan | | 21.9 Mtpa sulfide flotation mill producing a single concentrate containing copper, gold and silver |
| Pueblo Viejo | | 14 Mtpa whole ore and flotation pressure oxidation and cyanide leaching plant producing a gold and silver doré |
Measurement units presented in this report are generally metric units, with the exception that gold and silver quantities are reported in troy ounces and the content for copper is presented in pounds. There may be small rounding differences due to unit conversions.
Summary of All Mineral Resources and Mineral Reserves
As noted above under “Introduction—Mineral Resources and Mineral Reserves,” we have limited access to, and limited information regarding, the properties in which we hold interests, and because of these limitations, qualified persons acting on behalf of the Company are not able to arrive at sufficient findings and conclusions, or prepare adequate supporting documentation, for us to disclose mineral resources or mineral reserves under the standards for disclosure established by S-K 1300 for any of the properties in which we hold stream or royalty interests. We have requested that the operators of our Principal Properties prepare technical report summaries that we may file with the SEC or permit us the access and information necessary for qualified persons acting on behalf of the Company to be able to arrive at sufficient findings and conclusions, and prepare adequate supporting documentation, for us to disclose mineral resources or mineral reserves and prepare the related technical report summaries. In each case, the operator denied our request, and as a result, we are omitting disclosure of mineral resources and mineral reserves from our summary disclosure and individual material property disclosure because we cannot provide such disclosure without incurring an unreasonable burden or expense.
Material Properties
The disclosures below regarding our Principal Properties are derived from publicly available reports of the operators and/or other reports provided to Royal Gold under the terms of Royal Gold's stream or royalty agreements with the respective operators and have generally been prepared pursuant to the mining disclosure regime of the applicable jurisdiction in which the operator reports. We do not independently prepare or verify this information and, as the holder of the stream or royalty interest, we do not have access to the properties or operations or to sufficient data to do so. We are dependent on the operators of the properties to provide information to us. There can be no assurance, and we cannot verify, that such third-party information is complete or accurate. We often refer to these material properties as “Principal Properties” in this report.
Andacollo
The disclosures below regarding Carmen de Andacollo (“Andacollo”) are derived from the Technical Report dated July 12, 2006, pursuant to NI 43-101, as well as the Annual Information Form, dated February 23, 2024, of Teck Resources Limited (“Teck”), attached as Exhibit 99.1 to Teck’s Annual Report on Form 40-F for the year ended December 31, 2023. Teck presents mineral resource and mineral reserve updates pursuant to CIM Standards. Royal Gold requested information prepared in accordance with S-K 1300 or access to underlying technical data sufficient to prepare its own technical report summary, and the operator denied the request.
Location
Andacollo is an open pit mine and milling operation located in central Chile, Coquimbo Region at 30.25°S latitude and 71.10°W longitude and is operated by Compañía Minera Teck Carmen de Andacollo (“CMCA”), a 90% owned subsidiary of Teck. The Andacollo mine is located in the foothills of the Andes Mountains approximately 2 kilometers (“km”) southwest of the town of Carmen de Andacollo, 55 km southeast from the regional capital of La Serena, and 350 km north of Santiago.
The mine property lies at the southern limit of the Atacama Desert at a mean elevation of 1,050 meters (“m”) above sea level. Geomorphologically, it is characterized by northerly trending valleys bounded by low rolling foothills of the Andes. The average annual temperature is 18.8°C with a range from -5°C in the winter to 32°C in the summer. Average annual rainfall is low (less than 100 millimeters (“mm”)) and concentrated within the months of May to August.
Infrastructure
Infrastructure to support the mining and processing operation is in place and fully supports the operation.
Access to the mine is provided by Route 43 (“R-43”) south from La Serena to El Peñon. From El Peñon, D-51 is followed east and eventually curves to the south to Andacollo. Both R-43 and D-51 are paved roads.
The mine is along a 2 km section of paved road from the town of Carmen de Andacollo. Airport facilities are available in La Serena with connections to Santiago and other cities located in the northern portion of the country. Port facilities are available at Coquimbo.
Andacollo is supplied with electric power by a 110 kilovolt (“kV”) line from El Peñon. In August 2020, Teck entered into a long-term power purchase agreement to provide 100% renewable power for Andacollo’s operations, which went into effect in September 2020 and will run through the end of 2031.
Process water is currently pumped to the site via a 30-centimeter (“cm”) diameter pipeline, primarily sourced from groundwater extracted near La Serena, approximately 50 km from the site.
Several mines operate within the same geographical area and, as such, supplies, material, and experienced mine labor are readily available. The majority of mine personnel live in the town of Carmen de Andacollo or in the nearby cities of Coquimbo and La Serena. These cities have a combined population of about 350,000 inhabitants.
Area of Interest
The stream interest of our wholly owned subsidiary, RGLD Gold AG (“RGLD Gold”), at Andacollo covers 1,225 exploitation mining concessions, including 1,174 concessions termed the “Mining Properties” and 51 concessions termed the “Dayton Concessions.” RGLD Gold’s interest also covers any additional claims held before the effective date of the stream agreement, as described below, or acquired after the effective date which are wholly or partially located within an approximately 1.5 km radius from the external boundary of the “Mining Properties,” any mining concessions held by CMCA or acquired following the effective date of the agreement which are wholly or partially located within approximately 1 km radius from certain boundaries laid out in the agreement, and any Dayton Concession held by CMCA as of the effective date of the agreement, or acquired after the effective date.
Stream Agreement
Under the Long Term Offtake Agreement, dated July 9, 2015, between CMCA and RGLD Gold, RGLD Gold owns the right to purchase 100% of the gold produced from the Andacollo copper-gold mine until 900,000 ounces of payable gold have been delivered, and 50% thereafter. The cash purchase price equals 15% of the monthly average gold price for the month preceding the delivery date for all gold purchased. As of December 31, 2024, approximately 368,500 ounces of payable gold have been delivered to RGLD Gold.
Although Andacollo is primarily a copper mine, RGLD Gold’s stream agreement covers only gold and does not cover copper production. We provide certain information on copper production methods in order to provide a better understanding of the operation.
Property Description
The Andacollo operation consists of an open pit mine, sulfide concentrator, and an inactive copper heap leach facility.
The open pit mine is designed with a 10m bench height and an average overall pit slope of 53 degrees. A conventional owner operated and maintained truck and shovel mining operation is used for exploiting the hypogene reserve. See “Property Geology” below. Mining is carried out with 26 cubic meter (“m3”) hydraulic shovels and 19 m3 front-end loaders loading 180-tonne capacity haul trucks.
The life of mine waste to ore ratio was 0.35:1 at the start of the mine life and has reduced over time. With the majority of the mining activity, ore is delivered to stockpiles or the primary crusher and approximately 95% of the waste rock is used for the tailings dam construction.
Copper concentrate is produced by processing hypogene ore through semi-autogenous grinding and a flotation plant with the capacity to process up to 55,000 tonnes per day (“tpd”), depending on ore hardness.
Copper concentrates produced by the operation are sold under long-term contracts to smelters in Asia and Europe, using the LME Price as the basis for copper pricing, and with treatment and refining charges negotiated on an annual basis.
Tailings from the ore processing operation are stored in a single facility that has been used since the sulfide concentrator processing was initiated in 2010. The facility consists of five retention structures and high natural topography. The full facility is designed with six downstream embankment raises, which has a design capacity sufficient for the current ore reserve.
Age and Condition of Infrastructure
The sulfide concentrator was commissioned in 2010.
Royal Gold does not have specific information as to the physical condition or age of the equipment and infrastructure.
Book Value
Royal Gold is not permitted to disclose the operator’s book value or total cost detail for the property and associated plant and equipment.
Property History
A predecessor to CMCA began mining the oxide and supergene enrichment zone of the Andacollo copper deposit in January 1996. Supergene and oxide ores were processed by heap leaching and production of copper cathode in a solvent extraction-electrowinning plant. Beginning in 2010, the mine began processing hypogene ore (which underlies the supergene ore) through a mill and concentration plant at site producing concentrates for third-party offtake.
Permitting and Encumbrances
In December 1994, CMCA prepared an environmental impact study for the Andacollo mine with the terms of reference of the study established by CMCA and the Comité Regional de Medio Ambiente (“COREMA”). The results of this study were presented before COREMA for approval. On July 13, 1995, COREMA granted CMCA an environmental permit to operate the existing Andacollo mine.
According to the operator, all major permits for current operations are in place and the operation is in material compliance with those permits. However, the operator discloses that the current life of mine for Andacollo is expected to continue until 2036 and that additional permitting or amendments will be required to execute the life of mine plan beyond 2031.
Property Geology
The Andacollo orebody is a porphyry copper deposit consisting of disseminated and fracture-controlled copper mineralization contained within a gently dipping sequence of andesitic to trachytic volcanic rocks and sub-volcanic intrusions. The mineralization is spatially related to a feldspar porphyry intrusion and a series of deeply-rooted fault structures. A primary copper-gold sulfide deposit (the “hypogene deposit”) containing principally disseminated and quartz vein-hosted chalcopyrite mineralization lies beneath the supergene deposit. The hypogene deposit was subjected to surface weathering processes resulting in the formation of a barren leached zone with a thickness of 10 to 60 m. The original copper sulfides leached from this zone were re-deposited below the barren leached zone as a copper-rich zone comprised of copper silicates (chrysocolla) and supergene copper sulfides (chalcocite with lesser covellite).
Recent Developments
Stream deliveries from Andacollo were approximately 19,300 ounces of gold during the year ended December 31, 2024, compared to approximately 22,500 ounces of gold during the year ended December 31, 2023. The decrease in deliveries resulted primarily from Andacollo experiencing lower gold grades and lower tonnage milled as a result of water restrictions caused by extreme drought conditions which impacted production. Stream deliveries typically occur approximately six months after mine production and are based on a fixed payability factor of 89%.
On January 21, 2025, Teck reported that Andacollo continues to operate in extreme drought conditions, and that risk mitigation plans to increase water availability through increased well field capacity were implemented in 2024, enabling mill throughput rates consistent with the mine plan through the second half of 2024.
Further, Teck provided copper production guidance, and expects copper production to increase from approximately 39,700 tonnes in 2024 to a range of 45,000 and 55,000 tonnes per year in each of 2025, 2026 and 2027, before declining to a range of 35,000 to 45,000 tonnes in 2028. According to Teck, the annual production guidance reflects ongoing drought conditions that remain a risk to production. Gold and copper grades have been relatively well correlated at Andacollo and gold production has tended to track copper production, although there can be no assurance that these correlations will continue in the future.
Production at Andacollo has trended lower since the beginning of 2021 due to lower ore grades, as anticipated in the mine plan. Teck has reported that the current life of mine for Andacollo is expected to continue until 2036 although additional permits or amendments will be required to execute the life of mine plan beyond 2031.
Mount Milligan
The disclosures below regarding Mount Milligan are derived from the Technical Report on the Mount Milligan Mine in North-Central British Columbia filed November 7, 2022, effective December 31, 2021, pursuant to NI 43-101 and CIM Standards, and from news releases, dated February 14, 2024, issued by Centerra Gold Inc. (“Centerra”). Royal Gold requested information prepared in accordance with S-K 1300 or access to underlying technical data sufficient to prepare its own disclosure, and the operator denied the request.
Location
Mount Milligan is an open pit mine and is located within the Omenica Mining Division in North Central British Columbia, at 55.12°N latitude and 124.01°W longitude, approximately 155 km northwest of Prince George, 85 km north of Fort St. James, and 95 km west of Mackenzie.
Infrastructure
Infrastructure to support the mining and processing operation is in place and fully supports the operation.
The Mount Milligan mine is accessible by commercial air carrier to Prince George, British Columbia, then by vehicle from the east via Mackenzie on the Finlay Philip Forest Service Road and the North Philip Forest Service Road, and from the west via Fort St. James on the North Road and Rainbow Forest Service Road. Road travel to the Mount Milligan property site is 775 km from Prince Rupert and 254 km from Prince George. These roads are maintained in good condition by the various user groups.
Electric power is accessed from the BC Hydro Kennedy Substation, located 35 km southeast of Mackenzie, and connected to the Mount Milligan mine via a 92 km, 230 kV transmission line. The system is fed from the Peace River hydro generation facilities.
Stored water inventory at the Mount Milligan mine is critical to the ability to process ore through the process plant on a sustainable basis. Water supply and make-up sources for the project include precipitation runoff, recycling of water from the TSF supernatant pond, pit dewatering, groundwater wells, fresh water from Meadows Creek, Rainbow Creek, and Philip Lake.
Water required for ore processing operations is reclaimed from the TSF by a barge-mounted pump station and booster pump station. Water sourced from the TSF is supernatant from the settled tailings.
The communities of Mackenzie and Fort St. James are within daily commuting distance of the Mount Milligan mine, and both communities are serviced by rail, which connects to the major western and eastern rail routes.
Concentrate is transported by truck from the mine site to Mackenzie, transferred onto railcars of the Canadian National Railway to port storage facilities of Vancouver Wharves in North Vancouver, and loaded into bulk ore carriers. Concentrate is then shipped to customers via ocean transport.
Labor and services are readily available from the surrounding towns of Prince George, Fort St. James, Mackenzie, Vanderhoof, Smithers, and Fraser Lake.
Area of Interest
At Mount Milligan, RGLD Gold’s stream interest covers Mining Lease 631503 and 110 mineral claims covering 51,078.2 hectares.
Stream Agreement
Under the Amended and Restated Purchase and Sale Agreement dated December 14, 2011, between Thompson Creek Metals Company Inc. (“TCM”), an indirect subsidiary of Centerra, and RGLD Gold (as amended, the “Milligan Stream Agreement”), RGLD Gold owns the right to purchase 35% of the payable gold and 18.75% of the payable copper produced from the Mount Milligan mine. The cash purchase price for gold is equal to the lesser of $435 per ounce, with no inflation adjustment, or the prevailing market price when purchased. The cash purchase price for copper is 15% of the spot price. On February 13, 2024, TCM, Centerra, and RGLD Gold entered into a Processing Cost Support Agreement (the “Cost Support Agreement”), whereby subject to certain conditions, RGLD Gold will provide cost support payments for gold and copper deliveries under the Milligan Stream Agreement in exchange for cash consideration of $24.5 million, 50,000 ounces of gold to be delivered in the future, and a free cash flow interest in Mount Milligan. Through approximately 2029, RGLD Gold will only provide cost support payments when the gold price is at or below $1,600 per ounce and the copper price is at or below $3.50 per pound. In such case, and only at Centerra’s election, RGLD Gold will provide cost support payments, in the case of gold, equal to the lower of either $415 or 66% of the gold spot price less $435 for each ounce of gold delivered, and in the case of copper, equal to 35% of the spot copper price for each pound of copper delivered. RGLD Gold will have the right to recover any such payments from future cash support payments beginning in approximately 2030 when metal prices are above $1,600 per ounce of gold and $3.50 per pound of copper. In addition, starting in approximately 2030, RGLD Gold will provide cost support payments, in the case of gold, equal to the lower of either $415 or 50% of the gold spot price less $435 for each ounce of gold delivered, and in the case of copper, equal to 35% of the spot copper price for each pound of copper delivered. Finally, starting in approximately 2036, RGLD Gold will provide cost support payments, in the case of gold, equal to the lower of either $615 or 66% of the gold spot price less $435 for each ounce of gold delivered, and in the case of copper, equal to 51% of the spot copper price for each pound of copper delivered. The Milligan Stream Agreement remains in place and is unaffected by the Cost Support Agreement. As of December 31, 2024, approximately 791,200 ounces of payable gold and 95.4 million pounds of payable copper have been delivered to RGLD Gold.
Property Description
Mount Milligan is a copper-gold porphyry deposit, consisting of two principal zones, the Main Zone and the Southern Star (SS) Zone. The Main Zone includes four contiguous sub-zones: MBX, WBX, DWBX and 66 (low-copper and high-gold grades, southeast of the MBX sub-zone). These geologic zones are the basis for the metallurgical test work.
Open pit operations are designed and scheduled to deliver peak annual production of 54 Mtpa, with a life-of-mine (“LOM”) stripping ratio of 0.92 tonnes of waste to 1 tonne ore. All waste material is used in the construction of the TSF or in the case of the material being classified as potentially acid producing, stored within the TSF.
The mining operation’s equipment fleet comprises two 30 cm electric blast hole drills, two 41 m3 electric cable shovels, one 22 m3 hydraulic excavator and two 19 m3 front end loaders and thirteen 229-tonne capacity haul trucks and two 181-tonne capacity haul trucks. These major units are supplemented with a back-up equipment fleet of graders, track and rubber-tired dozers, backhoes, and water trucks. A 15m bench height is used for mining both ore and waste.
The Mount Milligan sulfide flotation concentrator was designed to process ore at a nominal rate of 60,000 tpd, producing a marketable concentrate of copper, gold, and silver. A secondary crushing circuit, installed in 2016, together with process plant optimization projects, increased the capacity to a nominal rate of 62,500 tpd. It consists of the following unit operations:
•primary crushing;
•coarse ore stockpile;
•semi-autogenous/ball mill/pebble crushing (“SABC”) grinding circuit;
•rougher/scavenger flotation;
•concentrate regrinding;
•cleaner flotation;
•gravity concentration;
•concentrate dewatering; and
•tailings disposal.
The run of mine (“ROM”) ore is crushed to 80% passing 15 cm, and then ground to 80% passing 200 micron prior to flotation. The rougher-scavenger flotation circuit includes two trains of five 200 m3 flotation cells. Each train has two rougher and three scavenger flotation cells. The concentrates from the first two cells of each train (rougher concentrate) and the concentrates from the last three cells of each train (scavenger concentrate) are reground separately. The rougher concentrate is reground to P80 30-50 μm in the vertically stirred mill using steel ball media while the rougher-scavenger concentrate together with the first cleaner, second cleaner, and third cleaner flotation tailings are reground to P80 18-25 μm in the horizontal stirred mills using ceramic ball media. To recover coarse metallic gold particles, approximately 20% of the rougher concentrate regrind hydrocyclone underflow is diverted to a centrifugal gravity concentrator. The reground concentrates undergo three stages of cleaning flotation to produce a final copper concentrate containing approximately 21.5% copper and 30 to 40 g/t gold.
The infrastructure at Mount Milligan includes a TSF and reclaim water ponds, an administrative building and change house, a workshop/warehouse, a permanent operations residence, a first aid station, an emergency vehicle storage, a laboratory, and sewage and water treatment facilities.
Age and Condition of Infrastructure
The mine was commissioned in 2013.
Royal Gold does not have specific information about the physical condition of equipment and infrastructure at site.
Book Value
The operator does not provide us with the operator’s book value or total cost detail for the property and associated plant and equipment.
Property History
Limited exploration activity was first recorded in 1937. In 1984, prospector Richard Haslinger (“Haslinger”) and BP Resources Canada Limited (“BP Resources”) located claims on the current site.
In 1986, Lincoln Resources Inc. (“Lincoln”) optioned the claims and in 1987 completed a diamond drilling program that led to the discovery of significant copper-gold mineralization. In the late 1980s, Lincoln reorganized, amalgamated with Continental Gold Corp. (“Continental Gold”) and continued ongoing drilling in a joint venture with BP Resources.
In 1991, Placer Dome Inc. (“Placer Dome”) acquired the project from the joint-venture partners, resumed exploration drilling and completed a pre-feasibility study for the development of a 60,000 tpd open pit mine and flotation process plant.
Barrick purchased Placer Dome in 2006 and sold its Canadian assets to Goldcorp Inc. (“Goldcorp”), who then in turn sold the project to Atlas Cromwell Ltd. (“Atlas Cromwell”). Atlas Cromwell changed its name to Terrane Metals Corp. (“Terrane”) and initiated a comprehensive work program.
In October 2010, TCM acquired the project through its acquisition of Terrane, entered a stream agreement with us and subsequently constructed the Mount Milligan mine, which commenced commercial production in February 2014.
In October 2016, TCM was acquired by a subsidiary of Centerra and, in connection with that acquisition, Terrane and certain other subsidiary entities of TCM were amalgamated into TCM. The Mount Milligan mine is now fully owned by TCM, an indirect subsidiary of Centerra.
Our interest in Mount Milligan evolved over time as a result of adapting the stream to address the needs of the operating partner. Our original 52.25% gold stream was acquired in three transactions from TCM, as part of the financing for the initial project acquisition and construction:
1.On July 15, 2010, we announced the acquisition of a 25% gold stream interest on the Mount Milligan project from TCM for $311.5 million and cash payments equal to the lesser of $400 or the prevailing market price for each payable ounce of gold until the delivery of 550,000 ounces to us, and the lesser of $450 or the prevailing market price for each additional ounce thereafter.
2.On December 15, 2011, we increased our gold stream interest on the Mount Milligan project by an additional 15% for $270 million and cash payments equal to the lesser of $435 or the prevailing market price for each payable ounce of gold delivered to us (replacing the payment structure of the July 15, 2010 transaction).
3.On August 9, 2012, we increased our gold stream interest in the Mount Milligan project by an additional 12.25% for $200 million and cash payments equal to the lesser of $435 or the prevailing market price for each payable ounce of gold delivered to us.
Subsequently, on October 20, 2016, after the first few years of operations, Centerra acquired all of the issued and outstanding common shares of TCM. Our stream interest at Mount Milligan was amended as part of this transaction to facilitate the acquisition and provide more gold exposure to Centerra. Under the terms of the amendment, our 52.25% gold stream at Mount Milligan was amended to a 35% gold stream with a purchase price equal to the lesser of $435 per ounce, or the prevailing market price, and an 18.75% copper stream with a 15% of spot cash price.
Permitting and Encumbrances
As of the 2022 Technical Report, TCM held or was in the process of obtaining all permits required for the operation of Mount Milligan for the defined LOM.
Mount Milligan was designed to use surface water and groundwater sources for processing. Stored water inventory is critical to the ability to process ore through the mill on a sustainable basis. In the winter months of 2018 and 2019, due to sustained periods of low precipitation in the preceding months and corresponding low levels of stored water inventory, Mount Milligan experienced a lack of sufficient water resources that caused temporary suspensions and reductions of processing operations. In February 2019, the British Columbia Environmental Assessment Office approved an amendment to the Mount Milligan environmental assessment certificate (EAC #M09-1) to permit access to additional sources of surface water and groundwater until November 30, 2021, which was subsequently extended in early 2021 to November 2023.
In addition to accessing water from Rainbow Creek and Meadows Creek, Mount Milligan received approvals to pump water from Philip Lake during a portion of the spring run-off period. Mount Milligan continues to access groundwater from the Lower Rainbow Valley wellfield as well as other groundwater wells near the TSF. The operation has received approval to draw groundwater from within a 6 km radius of the operation for the LOM.
On January 6, 2022, TCM received the approval of an amendment to EAC #M09-01 to utilize LOM surface water withdrawals external to the TSF during the open water season (April 1 to November 30) from either the Nation River as a single surface water source or Rainbow Creek and Philip Lake 1 as a combined surface water source.
Property Geology
The Mount Milligan deposits are categorized as silica-saturated alkalic copper-gold porphyry deposits associated with alkaline monzodioritic-to-syenitic igneous rocks. Two styles of mineralization have been identified.
•Early-stage porphyry gold-copper mineralization (and early-stage vein types) associated with composite monzonite porphyry stocks and related hydrothermal breccia, and narrower dyke and breccia complexes.
•Late-stage structurally controlled high-gold low-copper mineralization (and intermediate- to late-stage vein types) that is associated with faults and fault breccias, crosscuts/overprints the earlier stage porphyry mineralization and is more spatially widespread.
Recent Developments
Gold stream deliveries from Mount Milligan were approximately 58,000 ounces during the year ended December 31, 2024, compared to approximately 56,800 ounces for the year ended December 31, 2023. Copper stream deliveries from Mount Milligan were approximately 11.8 million pounds during the year ended December 31, 2024, compared to approximately 10.9 million pounds during the year ended December 31, 2023. Gold and copper stream deliveries for the year ended December 31, 2024, relate to mine production during the approximate period August 2023 to July 2024. During this period Centerra reported the increase in production was primarily attributed to higher head grades and higher mill throughput. The increase in deliveries was primarily due to higher gold grade. Gold stream deliveries are based on a fixed payability factor of 97% and copper stream deliveries are based on a minimum payability factor of 95%.
On February 13, 2024, we entered into the Cost Support Agreement described above to incentivize Centerra to continue to invest and maximize the value of the large mineral endowment at Mount Milligan. The Cost Support Agreement provided a basis for a reserve increase and extension of the Mount Milligan mine life to 2035 and may provide a basis for further extension of the mine life beyond 2035.
On October 31, 2024, Centerra reported that work continued on the site-wide optimization program, and notable achievements during the first nine months of 2024 include an improved safety record, increased availability and utilization of the haul fleet, and consistent ore supply which has led to increased mill throughput per operating day. In addition, Centerra is progressing work on a preliminary economic assessment (“PEA”) to evaluate the substantial mineral resources at Mount Milligan with a goal to unlock additional value beyond its current 2035 mine life. Centerra expects the PEA to be completed towards the end of the first half of 2025.
Pueblo Viejo
The disclosures below regarding Pueblo Viejo are derived from the Technical Report on the Pueblo Viejo Mine, Sánchez Ramírez Province, Dominican Republic dated March 17, 2023 in accordance with NI 43-101 and CIM Standards. Royal Gold requested information prepared pursuant to S-K 1300 or access to the underlying technical data sufficient to prepare its own technical report summary, and the operator denied the request.
Location
The Pueblo Viejo mine is located in the province of Sánchez Ramírez, Dominican Republic, at 18.94°N latitude and 70.17°W longitude, approximately 100 km northwest of Santo Domingo, and is owned by a joint venture in which Barrick holds a 60% interest and is responsible for operations, and in which Newmont holds a 40% interest. Pueblo Viejo is accessed from Santo Domingo by traveling northwest on Autopista Duarte, Highway #1, approximately 77 km to Piedra Blanca and proceeding east for approximately 22.5 km on Highway #17 to the gatehouse for Pueblo Viejo. Both Highway #1 and Highway #17 are paved.
Elevation at the mine site ranges from 565 m at Loma Cuaba to approximately 65 m at the Hatillo Reservoir. The site is characterized by rugged and hilly terrain covered with subtropical wet forest and scrub cover. The region has a tropical climate with little fluctuation in seasonal temperatures. The heaviest rainfall occurs between May and October.
Infrastructure
Infrastructure to support the mining and processing operation is in place.
The main road from Santo Domingo to within about 22.5 km of the mine site is a paved, four-lane, divided highway that is generally in good condition. Access from the divided highway to the site is via a two-lane, paved highway. Gravel surfaced internal access roads provide access to the mine site facilities.
The Pueblo Viejo mine is supplied with electric power from two sources via two independent 230 kV transmission circuits. In 2013, Pueblo Viejo Dominicana Corporation (“PVDC”) commissioned a 218-megawatt (“MW”) Wartsila combined cycle reciprocating engine power plant, together with an approximately 72 km transmission line connecting the plant to the minesite. The power plant is located near the port city of San Pedro de Macoris on the south coast and provides the long-term power supply for the Pueblo Viejo mine. The plant is dual fuel and was converted to natural gas from heavy fuel oil in 2020. In 2019, PVDC signed a 10-year natural gas supply contract with AES Andres DR, S.A. (“AES”) in the Dominican Republic. AES also completed a new gas pipeline to the facility. The power plant began supplying power to the mine using natural gas in the first quarter of 2020.
In addition to the existing access roads, the site infrastructure includes accommodations, offices, a truck shop, a medical clinic and other buildings, water supply, the TSF, and water treatment facilities. A double and single fence system protects the process plant site. Within the plant site area, the freshwater system, potable water system, fire water system, sanitary sewage system, storm drains, and fuel lines are buried underground. Process piping is typically left above ground on pipe racks or in pipe corridors.
A TSF is operating in the El Llagal valley approximately 3 km south of the plant site and the progressive raising of a large rock-filled dam with an impermeable saprolite core is underway.
The site has sufficient access, surface rights, and suitable sources of power, water, and personnel to maintain an efficient mining operation.
The city of Santo Domingo is the principal source of supply for the mine. It is a port city with a population of over three million with daily air service to the USA and other countries. Most non-technical staff positions and labor requirements are filled from local communities. The mine operates year round.
Area of Interest
At Pueblo Viejo, our stream interest covers a Special Lease Agreement of Mining Rights (“SLA”), as amended in November 2009 and in October 2013. The Lease has a term of 25 years with one extension by right for 25 years and a second 25 year extension at the mutual agreement of Barrick and the Dominican state, allowing a possible total term of 75 years.
Under the SLA, PVDC is obligated to make the following payments to the Dominican Republic: a net smelter return royalty of 3.2% based on gross revenues less some deductible costs (royalties do not apply to copper or zinc); a net profits interest of 28.75% based on an adjusted taxable cash flow; a corporate income tax of 25% based on adjusted net income; a withholding tax on interest paid on loans and on payments abroad; and other general tax obligations. The SLA tax regime includes a stability clause.
Stream Agreement
Under the Precious Metals Purchase and Sale Agreement dated August 5, 2015 between RGLD Gold and BGC Holdings Ltd., and Barrick, as amended, RGLD Gold owns the right to purchase 7.5% of Barrick’s interest in the gold produced from the Pueblo Viejo mine until 990,000 ounces of gold have been delivered, and 3.75% thereafter. The cash purchase price for gold is 30% of the spot price of gold per ounce delivered until 550,000 ounces of gold have been delivered, and 60% of the spot price of gold per ounce delivered thereafter. RGLD Gold also owns the right to purchase 75% of Barrick’s interest in the silver produced from the Pueblo Viejo mine, subject to a fixed silver recovery of 70%, until 50 million ounces of silver have been delivered, and 37.5% thereafter. The cash purchase price for silver is 30% of the spot price of silver per ounce delivered until 23.1 million ounces of silver have been delivered, and 60% of the spot price of silver per ounce delivered thereafter. As of December 31, 2024, approximately 369,300 ounces of payable gold and 13.1 million ounces of payable silver have been delivered to RGLD Gold. As noted above, Barrick holds a 60% interest in the Pueblo Viejo mine, and RGLD Gold does not have the right to purchase gold or silver attributable to the remaining 40% not held by Barrick.
Property Description
Pueblo Viejo is a production stage property consisting of a conventional open pit surface mine and a complex processing circuit designed to process refractory gold-silver ore through pressure oxidation. Gold and silver are recovered through a carbon-in-leach (CIL) circuit and electrowinning. Barrick is ramping up production after completing a plant expansion project designed to increase throughput from 9 Mtpa to 14 Mtpa and allow the mine to maintain average annual gold production of approximately 800,000 ounces (100% basis, including the 40% interest not held by Barrick). Barrick is also working on a mine life extension that will extend the mine life to 2046.
The pit stages have been chosen to facilitate the early extraction of the most profitable ore. The driver of the mine schedule is the sulphur blending requirement. Sulphur grade is important because the metallurgical aspects of the processing operation, the recoveries achieved, and the processing costs, all strongly depend on a very consistent, low-variability sulphur content in the plant feed.
The Pueblo Viejo mine operates a conventional open pit, utilizing a truck and shovel mining operation mining on 10 m high benches. It achieved commercial production in January 2013 and completed its ramp-up to full design capacity in 2014. Current mining operations supplement fresh ore from the Monte Negro and Moore pits with stockpiled ore to achieve the required ore blend for ore processing.
Equipment planning has considered mine design production of approximately 57 to 63 Mtpa total material movement, including limestone. This includes mill feed, reclamation from stockpiles, and simultaneous mining in the limestone quarries and several operating pit phases. Loading is carried out with 20 m3 hydraulic shovels and 22 m3 front-end loaders, loading 175-tonne haul trucks.
Gold and silver are recovered through pressure oxidation (autoclave) of whole ore and flotation concentrate, followed by hot cure and hot lime boil, prior to cyanidation of gold and silver in a CIL circuit. The autoclave circuit was initially designed to oxidize approximately 1,750 tonnes of sulfide per day, which is equivalent to about 24,000 tonnes of run-of-mine ore at 7.5% of sulfide. The process plant expansion flowsheet includes an additional primary crusher, coarse ore stockpile and ore reclaim delivering to a new single stage semi-autogenous (SAG) mill, and a new flotation circuit that concentrates the bulk of the sulfide ore prior to oxidation. The concentrate is blended with fresh milled ore to feed the modified autoclave circuit, which has additional oxygen supplied from a new 3,000 tonnes per day facility. The existing autoclaves have been upgraded to increase the sulfur processing capacity of each autoclave through additional high-pressure cooling water and recycle flash capability using additional slurry pumping and thickening.
The currently-operating Lower Llagal TSF, comprised of one main dam and three saddle dams, is located in the El Llagal valley, approximately 4 km south of the plant site. In conjunction with the plant expansion project, Barrick is currently advancing work on the new El Naranjo TSF. Barrick’s timeline for commissioning of the El Naranjo TSF is by late 2029, and Barrick expects the facility to provide storage capacity for 8 additional years beyond the current mine life, which is expected to be to 2046.
Age and Condition of Infrastructure
The mine initiated pre-stripping in 2010 and the mill was commissioned in 2012. The plant expansion project was substantially completed in 2024. However, various optimization projects remain ongoing to achieve the expected throughput and recovery rates.
Royal Gold does not have specific information about the physical condition of equipment and infrastructure at site.
Book Value
The operator does not provide us with the operator’s book value or total cost detail for the property and associated plant and equipment.
Property History
Early mining activity at the site dates back to the 1500s. Subsequent to that early mining activity, Rosario Resources commenced mining operations on the property in 1975. In 1979, the Central Bank of the Dominican Republic purchased all foreign-held shares in Rosario Resources and the Dominican Government continued operations as Rosario Dominicana S.A. Gold and silver production from oxide, transitional, and sulfide ores occurred from 1975 to 1999. The mine ceased operations in 1999. In 2000, the Dominican Republic invited international bids for the leasing and mineral exploitation of the Pueblo Viejo mine site. In July 2001, PVDC (then known as Placer Dome Dominicana Corporation), an affiliate of Placer Dome, was awarded the bid. PVDC and the Dominican Republic subsequently negotiated the SLA for the Montenegro Fiscal Reserve, which was ratified by the Dominican Republic National Congress and became effective on July 29, 2003. In March 2006, Barrick acquired Placer Dome and in May 2006 amalgamated the companies. At the same time, Barrick sold a 40% stake in the Pueblo Viejo project to Goldcorp (acquired by Newmont in 2019). On February 26, 2008, PVDC delivered the Project Notice to the Government of the Dominican Republic pursuant to the SLA and delivered the Pueblo Viejo Feasibility Study to the Government. In 2009, the Dominican Republic and PVDC agreed to amend the terms of the SLA. The amendment became effective on November 13, 2009 following its ratification by the Dominican Republic National Congress. The Pueblo Viejo mine achieved commercial production in January 2013. A second amendment to the SLA became effective on October 5, 2013, and has resulted in additional and accelerated tax revenues to the government of the Dominican Republic.
Permitting and Encumbrances
PVDC has acquired all of the permits necessary to operate the mine at the present time. General Environmental and Natural Resources Law No. 64-00 (“Law 64-00”) of August 18, 2000, and its complementary regulations, governs all environmental related issues, including those applicable to mining, in the Dominican Republic. Law 64-00 sets out the general rules of conservation, protection, improvement, and restoration of the environment and natural resources by unifying segregated rules concerning environmental protection and creating a governmental body (the Ministry of Environment and Natural Resources) with wide authority to oversee and regulate its application. The Ministry of Environment and Natural Resources enforces Law 64-00 and establishes the process of obtaining environmental permits.
PVDC completed a Feasibility Study on the Mine in September 2005 and presented an Environmental Impact Assessment (“EIA”) to the Dominican state in November of the same year. The terms of reference for the Mine were approved by the Environmental Authority on May 30, 2005, and the Ministry of Environment approved the EIA in December 2006 and granted the Environmental License 101-06. Other changes have been submitted to the authorities for additional facilities. The last amendment to the Environmental License was issued on June 29, 2017, which authorized the construction of an emulsion plant. Requirements of the Environmental License included submission of detailed design of tailings dams, installation of monitoring stations, and submission for review of the waste management plan and incineration plant.
An environmental evaluation report was submitted in 2008 to address an increase in the planned processing rate to 24,000 tpd and in September 2010 the Ministry of Environment and Natural Resources issued the Environmental License 101-06 Modified.
When the former Rosario mine shut down its operations in 1999, proper closure and reclamation was not undertaken. The result has been a legacy of polluted soil and water and contaminated infrastructure. Responsibility for the clean-up is now shared jointly between PVDC and the Dominican government. Terms have been set for both parties in the SLA that governs the development and operation of the mine.
In November 2009, following approval by the Dominican Republic National Congress, President Leonel Fernandez ratified the first amendment to the SLA for Pueblo Viejo. The amended SLA better reflected the scope and scale of the project since its acquisition by Barrick in 2006. The amendments set out revised fiscal terms and clarified various administrative and operational matters to the mutual benefit of PVDC and the Dominican state. In particular, the agreement stipulates that environmental remediation within the development area is the responsibility of the company with the exception of the hazardous substances; the Dominican government is responsible for historic impacts outside the mine development area and hazardous substances at the plant site.
In the second half of 2016, PVDC was contracted to act as an agent of the Dominican State to carry out activities for which the Dominican State is responsible under the SLA pursuant to the Environmental Management Plan of the State (Plan de Administración del Estado). The requisite environmental permits were received in November 2016 to carry out the first stage of the closure plan, and work has progressed since then on dewatering, buttressing, and covering the old Mejita TSF.
In addition to the mine operations, by means of the Second Amendment to the SLA, the Dominican government granted PVDC a power concession to generate electricity for consumption by the mine and the right to sell excess power. Also, in March 2012, PVDC obtained an environmental permit for the Quisqueya 1 power plant and a power transmission line from San Pedro where the power plant is situated to the mine site.
Barrick is currently advancing work on the new El Naranjo TSF, and permitting activities are underway.
Property Geology
The Pueblo Viejo deposit consists of high sulfidation or acid sulfate epithermal gold, silver, copper, and zinc mineralization that was formed during the Cretaceous Age island arc volcanism. Pueblo Viejo is hosted by the Lower Cretaceous Los Ranchos Formation, a series of volcanic and volcaniclastic rocks that extend across the eastern half of the Dominican Republic, generally striking northwest and dipping southwest. The Los Ranchos Formation consists of a lower complex of pillowed basalt, basaltic andesite flows, dacitic flows, tuffs and intrusions, overlain by volcaniclastic sedimentary rocks and interpreted to be a Lower Cretaceous intra-oceanic island arc, one of several bimodal volcanic piles that form the base of the Greater Antilles Caribbean islands. The unit has undergone extensive seawater metamorphism (spilitization) and lithologies have been referred to as spilite (basaltic-andesite) and keratophyre (dacite).
The Pueblo Viejo Member of the Los Ranchos Formation is confined to a restricted, sedimentary basin measuring approximately 3.2 km north-south by 1.9 km east-west. The basin is interpreted to be either due to volcanic dome collapse forming a lake, or a maar-diatreme complex that cut through lower members of the Los Ranchos Formation. The basin is filled with lacustrine deposits that range from coarse conglomerate deposited at the edge of the basin to thinly bedded carbonaceous sandstone, siltstone, and mudstone deposited further from the paleo-shoreline. In addition, there are pyroclastic rocks, dacitic domes, and diorite dikes within the basin. The sedimentary basin and volcanic debris flows are considered to be of Neocomian age (121 Ma to 144 Ma). The Pueblo Viejo Member is bounded to the east by volcaniclastic rocks and to the north and west by Platanal Member basaltic-andesite (spilite) flows and dacitic domes.
To the south, the Pueblo Viejo Member is overthrust by the Hatillo Limestone Formation, thought to be Cenomanian (93 Ma to 99 Ma), or possibly Albian (99 Ma to 112 Ma), in age.
Recent Developments
Gold stream deliveries from Pueblo Viejo were approximately 26,500 ounces for the year ended December 31, 2024, compared to approximately 25,400 ounces for the year ended December 31, 2023. The increase in gold production was primarily a result of increased throughput. Deliveries are quarterly and typically occur 1 to 3 months after mine production. Gold stream deliveries are based on a fixed payability factor of 99.9%.
Silver stream deliveries were approximately 859,900 ounces for the year ended December 31, 2024, compared to 907,000 ounces for the year ended December 31, 2023. Silver stream deliveries are based on a fixed payability factor of 99.0%. Deliveries are quarterly and typically occur 1 to 3 months after mine production. During the year ended December 31, 2024, an additional 816,500 ounces of silver deliveries were deferred. As of December 31, 2024, approximately 1.67 million ounces remain deferred. The deferred ounces are the result of a mechanism in the stream agreement that allows for the deferral of deliveries in a period if Barrick’s share of silver production is insufficient to cover its stream delivery obligations. The stream agreement terms include a fixed 70% silver recovery rate but permits the deferral of ounces if recovery rates fall below 52.5%.
On November 22, 2024, Barrick provided an update on the ramp-up of the plant expansion and a production outlook for Pueblo Viejo. Barrick outlined several projects that are intended to achieve planned throughput and recoveries, and Barrick expects plant throughput to increase steadily from 2024 and reach the expanded 14 million tonne per year capacity in 2028. As part of this throughput optimization, Barrick noted a planned 35-day impact to production in the first quarter of 2025 to complete a thickener optimization. Barrick expects gold recovery to increase from approximately 80% at the end of 2024 to 90% by the end of 2026, and Barrick reported that a project to improve silver recovery is expected to be complete by the fourth quarter of 2025.
Barrick further reported that gold production is expected to increase steadily from approximately 600,000 ounces in 2024 to over 800,000 ounces in 2026 (100% basis). Barrick did not provide forecasts for silver production.
In conjunction with the plant expansion project, Barrick reported that it is currently advancing the construction of the new El Naranjo TSF. Barrick also reported that the timeline for commissioning the El Naranjo TSF is by late 2029, with the facility expected to provide storage capacity for eight additional years beyond the current mine life, which is expected to be to 2046.
On February 12, 2025, Barrick announced 2025 gold production guidance of 370,000 to 410,000 ounces for its 60% share of Pueblo Viejo.
Cortez
The disclosures below regarding Cortez are derived from the Technical Report on the Cortez Complex dated March 18, 2022 pursuant to NI 43-101 and CIM Standards, and from Barrick’s Annual Information Form, dated March 15, 2024, and Management’s Discussion and Analysis, dated February 13, 2024, pursuant to NI 43-101. Royal Gold requested information prepared pursuant to S-K 1300 or access to underlying technical data sufficient to prepare its own technical report summary, and the operator denied the request.
Location
Cortez is a series of large open pit and underground mines, utilizing mill and heap leach processing, which are operated by Nevada Gold Mines LLC (“NGM”), a joint venture between Barrick and Newmont with respect to their Nevada operations. We refer to the Cortez property and its multiple mines and projects as the Cortez Complex, and the terms “Cortez” and “Cortez Complex” are used interchangeably. The operation is located approximately 95 km southwest of Elko, in Lander County, Nevada, at 40.24°N latitude and 116.71°W longitude at an elevation of approximately 1,525 m (mill and administration facility).
Cortez is located in the high desert region of the Basin and Range physiographic province. The mean annual temperature is 11°C. Precipitation averages 15 cm per year, primarily derived from snow and summer thunderstorms.
Infrastructure
Infrastructure to support the mining and processing operation is in place and well established.
The site is accessed by driving west from Elko on Interstate 80 approximately 75 km, and proceeding south on State Highway 306 approximately 56 km. Both US Interstate 80 and State Highway 306 are paved roads.
The Union Pacific Rail line runs parallel to US Interstate 80 to the north of Cortez. Elko, the closest city to Cortez, is serviced by daily commercial airline flights to Salt Lake City, Utah.
Electric power is provided to the Cortez site by NV Energy by an approximately 80 km long radial transmission line originating at its Falcon substation. The incoming NV Energy line terminates at the Barrick owned Pipeline Substation. Two 120 kV lines that tap onto the NV Energy power line feed Barrick owned 120 kV power lines: an approximately 15 km extension to serve the Cortez Hills development and an approximately 5 km extension to serve the South Pipeline and Crossroads pits. Wells Rural Electric Company provides power to Goldrush via a separate 120 kV power line.
Water for process use at Cortez Mill No. 2 is supplied from the Pipeline open pit dewatering system. Approximately 6,600 liters per minute of the pit dewatering volume is diverted for plant use. Additional water can be sourced as needed from wells at Mill No. 1.
Cortez is located in a major mining region and labor, contractors and suppliers are well established resources. The majority of the workforce lives in the nearby towns of Elko, Spring Creek, Carlin, and Battle Mountain and travel daily to the mine.
Area of Interest
At Cortez, NGM directly controls approximately 124,000 hectares of mineral rights with ownership of mining claims and fee lands. There are 10,869 claims consisting of: 10,012 unpatented lode claims; 575 unpatented mill-site claims; 129 patented lode claims; 125 patented mill-site claims; and 28 unpatented placer claims.
We own multiple royalty interests at the Cortez Complex that have been acquired over time. Table 1 below summarizes those royalty interests for each of the deposits at the Cortez Complex. To simplify the overlapping royalties that cover each of the deposits, Table 1 also provides approximate blended royalty rates.
For purposes of simplified disclosure, we have divided our royalty interests at the Cortez Complex into two zones: the Legacy Zone and the Cortez Complex Zone ("CC Zone"). The Legacy Zone is our largest royalty exposure at the Cortez Complex, representing an equivalent 9.4% GSR royalty rate over the Pipeline and Crossroads deposits. The CC Zone includes an equivalent 1.6% GSR royalty over the Cortez Hills, Cortez Pits, Fourmile, and Goldrush deposits, a 2.2% GSR royalty rate over the Goldrush SE deposit, and a 0.45% GSR royalty rate over the Robertson deposit.
NGM does not provide guidance or production results for the individual mines within the Cortez Complex, and both of the NGM partners provide consolidated guidance and results for their respective interests. We have typically provided, and subject to approval by Barrick, expect to continue to provide, annual guidance for the total gold production subject to the Legacy Zone royalty interest. This guidance includes overlapping contributions from the Pipeline and Crossroads deposits in certain areas and is not directly comparable to actual production from these deposits.
Table 1 Cortez Complex – Royal Gold Royalty Interests
| | | | | | | | | | | | | | | | | | | | | | | | | | | | | | | | | | | | | | |
| Mine/Deposit/Area | Mine Type | Ore Process | | Simplified Royalty Rates | | Detailed Royal Gold Royalty Coverage and Rates |
| Approximate Blended GSR Rate1 | | Legacy Royalties2 | Rio Tinto Royalty | Idaho
Royalty |
| | Royalty Applicable | Royalty Rate | Royalty Rate | Royalty Rate8 |
| | Royalty Rate | Approximate Blended Rate3 |
| Producing | Pipeline | Open Pit | Heap leach, oxide mill, roaster, autoclave | | Legacy Zone | 9.4% | | GSR1, GSR2 | 5% GSR4 | 8% GSR | 1.2% GVR7 | 0.24% GSR |
| | GSR3 | 0.7125% GSR |
| | NVR1 | 4.91% NVR |
| Crossroads | Open Pit | Heap leach, oxide mill, roaster | | | GSR2 | 5% GSR4 |
| | GSR3 | 0.7125% GSR |
| | NVR1C | 4.52% NVR5 |
| Cortez Hills | Underground | Oxide mill, roaster, autoclave | | CC Zone | 1.6% | | | | | 0.45% GSR |
| Cortez Pits | Open Pit | Oxide mill, heap leach, roaster | | | | | |
| Development | Fourmile | Underground | Roaster, autoclave | | | | | |
| Goldrush | Underground | Roaster, autoclave | | | | | |
| Goldrush SE | Underground | Roaster, autoclave | | 2.2% | | NVR2 | 1.0% NVR6 | |
| Robertson | Open Pit | Oxide mill, heap leach | | 0.5% | | | | | |
_______________________________
| | | | | | | | | | | | | | | | | | | | | | | | | | | | | | | | |
| | | | | | | | | | |
| (1) | Approximate equivalent royalty after blending the detailed royalty rates. Assumes total deduction to the Rio Tinto Royalty of 3% for the Legacy Royalties and the Idaho Royalty, and a 60% conversion from NVR to GSR rates. |
| (2) | Legacy Royalties are those royalties held by Royal Gold prior to August 2, 2022, and consist of overlapping royalties on the Pipeline and Crossroads deposits, with additional royalties covering a portion of the Goldrush deposit and other exploration areas. |
| (3) | The overlapping royalties in the Legacy Zone are equivalent to an approximate 8% GSR royalty on production subject to this interest. |
| (4) | GSR1 and GSR2 are sliding-scale gross value royalties that vary from a rate of 0.4% at gold prices less than $210/oz to 5.0% at gold prices greater than $470/oz. |
| (5) | A small portion of the Crossroads deposit has a royalty rate of 4.91%. |
| (6) | NVR2 covers the south-east extension of the Goldrush Project on the Flying T Ranch. |
| (7) | The Rio Tinto Royalty is a sliding-scale gross value royalty that varies from a rate of 0.0% at gold prices less than $400/oz to 3.0% at gold prices greater than $900/oz on 40% of the production from the undivided Cortez Complex, excluding the existing Robertson deposits. Deductions from the royalty payment are limited to third party royalties that existed prior to January 1, 2008, which include the Legacy Royalties and the Idaho Royalty. The Rio Tinto Royalty calculation is: |
| 1.2% x {[(gold produced from all areas excluding Robertson) x (gold price)] LESS [(gold produced from Pipeline and Crossroads) x (gold price) x (8% GSR approximate royalty rate) + (gold produced from Goldrush SE) x (gold price) x (1.4167% NVR) + (gold produced from Pipeline and Crossroads) x (gold price) x (0.689% GSR) + (gold produced from Cortez Hills, Cortez Pits, Goldrush, Fourmile and Robertson) x (gold price) x (1.2859% GSR)]} The total third-party royalty deduction for the Legacy Royalties and the Idaho Royalty can be approximated as 3% through 2032 and 1.4% thereafter. |
| (8) | Idaho Royalty rates are rounded. | | | | | | | | | |
We also own two additional royalties in the Cortez area where there is currently no attributable production.
Royalty Agreements
Cortez GSR1 and GSR2 - Royalty Agreement dated April 1, 1999 between The Cortez Joint Venture (“Cortez JV”), Placer Dome U.S. Inc., and Royal Crescent Valley Inc. (“Royal Crescent”); as amended by that First Amended Memorandum of Grant of Royalty dated April 1, 1999 between Cortez JV, Placer Dome U.S. Inc., Royal Gold and Royal Crescent; that Second Amended Memorandum of Grant of Royalty dated December 8, 2000 between Cortez JV, Placer Dome U.S. Inc., Royal Gold and Royal Crescent; that Third Amended Memorandum of Grant of Royalty dated December 17, 2001 between Cortez JV, Placer Dome U.S. Inc., Royal Gold and Royal Crescent; that Fourth Amended Memorandum of Grant of Royalty dated October 1, 2008 between Cortez JV, Royal Gold and Royal Crescent; and subject to that Royalty Deed and Assignment dated October 1, 2008 from Royal Gold to Barrick Gold Finance Inc.
Cortez GSR3 - Special Warranty Deed Conveying Overriding Royalty Interest dated June 30, 1993, recorded in Book 396, commencing at Page 23 in Lander County and Book 248, commencing at Page 284 in Eureka County, as corrected by Correction Special Warranty Deed Conveying Overriding Royalty Interest dated August 9, 1993, recorded in Book 400, commencing at Page 328 in Lander County, and in Book 253, commencing at Page 405 in Eureka County.; Special Warranty Deed and Bill of Sale dated June 30, 1993, recorded in Book 396, commencing at Page 160 in Lander County, and in Book 248, commencing at Page 422 in Eureka County, as corrected by Correction Special Warranty Deed and Bill of Sale dated August 9, 1993, recorded in Book 400, commencing at Page 599 in Lander County, and in Book 254, commencing at Page 142 in Eureka County; Special Warranty Deed Conveying Interest in Overriding Royalty dated June 30, 1993, recorded in Book 396, commencing at Page 276 in Lander County, and in Book 249, commencing at Page 1 in Eureka County, as corrected by Correction Special Warranty Deed Conveying Interest in Overriding Royalty dated August 9, 1993, recorded in Book 400, commencing at Page 458 in Lander County, and in Book 254, commencing at Page 001 of the Official Records of Eureka County; Memorandum of Surviving Provisions of the Exchange Agreement dated June 30, 1993, recorded in Book 396, commencing at Page 151 in Lander County, and in Book 248, commencing at Page 412 in Eureka County, as corrected by Corrected Memorandum of Surviving Provisions of Exchange Agreement dated August 9, 1993, recorded in Book 400, commencing at Page 589 in Lander County, and in Book 254, commencing at Page 132 in Eureka County; Exchange Agreement dated June 30, 1993 as amended by First Amendment of Exchange Agreement dated August 9, 1993; Clarification Agreement dated August 11, 1995 between Cortez Joint Venture, Cortez Gold Mines, Placer Dome U.S. Inc., Kennecott Exploration (Australia), Ltd., Idaho Resources Corporation and the Idaho Group of royalty holders, recorded in Book 421, commencing at Page 205 in Lander County, and in Book 287, commencing at Page 552, in Eureka County; subject to certain special warranty deeds dated September 1, 1999; and subject to that Royalty Deed and Assignment dated October 1, 2008 between Royal Gold, Inc. and Barrick Gold Finance Inc.
Cortez NVR1 and Cortez NVR1C - Mining Lease dated April 15, 1991 between ECM, Inc. and Placer Dome U.S. Inc., as assigned by that Assignment and Quitclaim Deed dated August 14, 1991 from Placer Dome U.S. Inc. to Cortez Gold Mines, as amended by that First Amendment to Mining Lease dated December 22, 1992 between ECM, Inc. and Placer Dome U.S. Inc., that Second Amendment to Mining Lease dated May 26, 1994 between ECM, Inc. and Cortez Gold Mines, that Third Amendment to Mining Lease dated December 13, 1999 between ECM, Inc. and Cortez Gold Mines, that Fourth Amendment to Mining Lease dated March 23, 2001 between ECM, Inc. and Cortez Joint Venture, dba Cortez Gold Mines, that Fifth Amendment to Mining Lease dated December 6, 2001 between ECM, Inc. and Cortez Joint Venture, dba Cortez Gold Mines, and that Sixth Amendment to Mining Lease dated December 6, 2002 between ECM, Inc. and Cortez Joint Venture, dba Cortez Gold Mines; that Royalty Deed and Agreement dated April 15, 1991 between Royal Crescent and ECM, Inc., as assigned by that Assignment dated April 16, 1992 from Royal Crescent to Crescent Valley Partners, L.P.; as assigned by that Royalty Deed and Assignment dated October 1, 2008 between Crescent Valley Partners, L.P., and Barrick Gold Finance Inc., and that Deed and Assignment dated September 19, 2016 between ECM, Inc. and Denver Mining Finance Company, Inc.
Cortez NVR2 - North Mining Lease dated October 16, 2002 between Tom and Volina Connolly, and the Jeannette L. Baumann Trust, and Barrick Gold U.S. Inc., successor to Placer Dome U.S. Inc. (“Barrick Gold U.S.”); South Mining Lease dated October 16, 2002 between Tom and Volina Connolly, and the Jeannette L. Baumann Trust, and Barrick Gold U.S.; North Option Agreement dated October 16, 2002 between Tom and Volina Connolly, and Barrick Gold U.S.; South Option Agreement dated October 16, 2002 between Tom and Volina Connolly, and Barrick; as assigned by that Assignment of Lease dated November 2, 2004 from Tom and Volina Connolly to The Thomas and Volina Connolly Family Trust, assigning its interest in the North Mining Lease; that Assignment of Lease dated November 2, 2004 from Tom and Volina Connolly to The Thomas and Volina Connolly Family Trust; that General Warranty Deed with Reservation of Royalty (North) dated December 11, 2007 from The Thomas and Volina Connolly Family Trust to Barrick Gold U.S., recorded as Document No. 2007-211323 in Eureka County; that General Warranty Deed with Reservation of Royalty (South) dated December 11, 2007 from The Thomas and Volina Connolly Family Trust to Barrick Gold U.S.,
recorded as Document No. 2007-211324 in Eureka County; as assigned by that Assignment of Mining Leases and Option Agreements dated January 7, 2014 between The Thomas and Volina Connolly Family Trust and Royal Gold, Inc., recorded as Document No. 2014-226564 in Eureka County; as assigned by that Deed of Royalty and Assignment of Rights dated January 7, 2014 between The Thomas and Volina Connolly Family Trust and Royal Gold, Inc., recorded as Document No. 2014-226563 in Eureka County; and assigned by that Deed of Mineral Rights dated January 7, 2014 between The Thomas and Volina Connolly Family Trust and Royal Gold, Inc., recorded as Document No. 2014-226562 in Eureka County.
Rio Tinto Royalty - Rio Tinto Production Royalty Deed dated March 5, 2008 between Kennecott Royalty Company, successor to Kennecott Explorations (Australia) Ltd., and Barrick Gold Finance, Inc., recorded as Document No. 2008-211704 in Eureka County, and as Document No. 250801 in Lander County; as assigned by that Assignment of Production Royalty (Cortez Royalty; Lander and Eureka Counties, Nevada) between Kennecott Royalty Company and RG Royalties, LLC, recorded as Document No. 2022-248598 in Eureka County, and as Document No. 306208 in Lander County.
Idaho Royalty - Special Warranty Deed Conveying Overriding Royalty Interest dated June 30, 1993, recorded in Book 396, commencing at Page 23 in Lander County and Book 248, commencing at Page 284 in Eureka County, as corrected by Correction Special Warranty Deed Conveying Overriding Royalty Interest dated August 9, 1993, recorded in Book 400, commencing at Page 328 in Lander County, and in Book 253, commencing at Page 405 in Eureka County.; Special Warranty Deed and Bill of Sale dated June 30, 1993, recorded in Book 396, commencing at Page 160 in Lander County, and in Book 248, commencing at Page 422 in Eureka County, as corrected by Correction Special Warranty Deed and Bill of Sale dated August 9, 1993, recorded in Book 400, commencing at Page 599 in Lander County, and in Book 254, commencing at Page 142 in Eureka County; Special Warranty Deed Conveying Interest in Overriding Royalty dated June 30, 1993, recorded in Book 396, commencing at Page 276 in Lander County, and in Book 249, commencing at Page 1 in Eureka County, as corrected by Correction Special Warranty Deed Conveying Interest in Overriding Royalty dated August 9, 1993, recorded in Book 400, commencing at Page 458 in Lander County, and in Book 254, commencing at Page 001 of the Official Records of Eureka County; Memorandum of Surviving Provisions of the Exchange Agreement dated June 30, 1993, recorded in Book 396, commencing at Page 151 in Lander County, and in Book 248, commencing at Page 412 in Eureka County, as corrected by Corrected Memorandum of Surviving Provisions of Exchange Agreement dated August 9, 1993, recorded in Book 400, commencing at Page 589 in Lander County, and in Book 254, commencing at Page 132 in Eureka County; Exchange Agreement dated June 30, 1993 as amended by First Amendment of Exchange Agreement dated August 9, 1993; Clarification Agreement dated August 11, 1995 between Cortez Joint Venture, Cortez Gold Mines, Placer Dome U.S. Inc., Kennecott Exploration (Australia), Ltd., Idaho Resources Corporation and the Idaho Group of royalty holders, recorded in Book 421, commencing at Page 205 in Lander County, and in Book 287, commencing at Page 552, in Eureka County; subject to certain special warranty deeds dated effective December 30, 2022.
Property Description
The Cortez Complex is a combination of open pit and underground mining operations and projects owned and operated by NGM. NGM combined Newmont and Barrick assets across Nevada in 2019 to allow for operational integration between projects held by Newmont and Barrick. NGM is operated by Barrick.
The Cortez Complex comprises the Pipeline, Crossroads, Cortez Hills, Cortez Pits and Gold Acres open pit operations, the Cortez Hills and Goldrush underground mining operations, and the Fourmile and Robertson development projects. The Fourmile project is 100% owned by Barrick and is not currently included in the NGM joint venture, but may be contributed to the joint venture if certain criteria are met in the future.
Deposits within the Pipeline/Crossroads complex and Cortez Pits are mined by conventional open pit methods. Open pit operations moved 115 million tonnes of combined ore and waste in 2023. Two different mining methods are used at the underground operations, long-hole open stoping and drift-and-fill. Underground operations at the Cortez Hills and Goldrush mines are based on ore production rates of 3,500 tpd and 6,000 tpd, respectively.
The gold-recovery process used at the Cortez Complex is determined by considering the grade and metallurgical character of the particular ore: lower grade ROM oxide ore is heap leached at existing facilities; higher-grade non-refractory ore is treated in a conventional mill using cyanidation and the CIL process; and refractory ore is stockpiled on site in designated areas and trucked to the nearby Carlin Complex for processing. Gold recovered from the ore is processed into doré on site and shipped to outside refineries for processing into gold bullion.
The active heap leach facilities are located at the Pipeline and Cortez Hills complexes. Milling activities at Cortez are conducted at the Pipeline complex, which includes crushing and grinding facilities, CIL circuits, reagent storage areas and a recovery/refining circuit. Plant throughput can reach up to 16,300 tpd depending on the hardness of the ore being processed.
The Goldrush underground mine is currently ramping up to full production levels after officially opening in early 2024. The primary access is a set of twin declines and the primary method of extraction at the Goldrush mine is longhole open stoping. The basic mining unit is a stope with the dimensions of 15 m (width) by 15 m (strike length) by 20 m (height). The stopes are extracted on a transverse primary/secondary system with (where possible), a continuous mining front. Broken material is hauled from the mine using 63-tonne capacity haul trucks out of the mine declines. Void space is then filled with cemented rock fill. A paste plant is expected to be constructed to provide backfill.
Most of the Goldrush deposit contains typical double refractory roast-type ore (gold locked in sulfides and organic preg-robbing carbon present). Both the Carlin and Gold Quarry roasters at NGM’s Carlin Complex are capable of generating high gold recoveries from the Goldrush ore, and ore is trucked and processed at both facilities.
Barrick has reported that development of the Robertson open pit project is proposed to be in alignment with the Cortez Complex open pit operations, using conventional drill and blast techniques and truck and shovel fleet. Material is expected to be drilled, blasted and mined on 12 m benches. All mineralization is anticipated to be oxide and is currently planned to be processed at the Pipeline mill or on a future leach pad that will be constructed at the Robertson complex.
Source: Barrick, 2022
Age and Condition of Infrastructure
Construction of Mill #2 and associated infrastructure was completed in 1997 with the initial mining of the Pipeline deposit.
Royal Gold does not have current specific information on the physical condition of the equipment, facilities, infrastructure, or underground development of the Cortez complex mining operations.
Book Value
The operator does not provide Royal Gold with the operator’s book value or total cost detail for the property and associated plant and equipment.
Property History
In 1964, a joint venture was formed to explore the Cortez area. In 1969, the original Cortez mine went into production. From 1969 to 1997, gold ore was sourced from open pits at Cortez, Gold Acres, Horse Canyon and Crescent. In 1991, the Pipeline and South Pipeline deposits were discovered, with development approval received in 1996. In 1998, the Cortez Pediment deposit was discovered, with the Cortez Hills discovery announced in April 2003. The Cortez Hills development was approved by Placer Dome and Kennecott, then joint venturers, in September 2005 and confirmed by Barrick in 2006. Barrick obtained an interest in the Cortez property through its acquisition of Placer Dome in 2006. Barrick consolidated its 100% interest in the property following its purchase of the Kennecott interest in 2008. On July 1, 2019, Barrick’s interest in Cortez was contributed to NGM.
Barrick purchased the Robertson property from Coral Gold Resources Ltd. in June 2017. The property is located 10 km due north of the Pipeline mill and administration complex. Robertson is the subject of a feasibility study based on open pit mining and ore processing at the Pipeline mill and heap leach facilities.
Permitting and Encumbrances
A number of federal and state permits are required to operate the Cortez mine. Cortez adheres to permitting guidelines from the U.S. Bureau of Land Management (“BLM”), the Nevada Revised Statutes, the Nevada Administrative Code, and additional federal government requirements.
The Cortez Operations are predominantly located on public lands administered by the BLM with a small portion on private lands owned by Barrick Cortez Inc. The operations are located in Eureka and Lander Counties with BLM jurisdiction from the Battle Mountain and Elko field offices. No facilities are located in Eureka County, however, the Cortez boundary extends onto BLM-administered lands in Eureka County to accommodate a portion of the Cortez Hills Open Pit and ancillary facilities.
The major permits required for operating on public lands are the approval of the Plan of Operation (“POO”) by the BLM and a Reclamation Permit from the BLM and Nevada Division of Environmental Protection (“NDEP”). The Cortez property has received approval for a number of POOs and reclamation permits since the early 1980s. Permits were issued to allow mining and processing of ore from the East Pit, Horse Canyon Pit, Gold Acres, South Extension Pit, Cortez Canyon, and other areas that are no longer actively mined. The major environmental analysis documents (e.g. Environmental Assessment, EIS, Supplemental Environmental Impact Statement, Record of Decision (“ROD”), Finding of No Significant Impact and POOs) have been issued for the currently active areas of Cortez (i.e., Crossroads, Pipeline, Goldrush and Cortez Hills). The ROD for the Robertson project was received in November, 2024.
Reclamation of disturbed areas resulting from mining activities will follow the approved Reclamation Plan and will be completed in accordance with BLM and NDEP regulations that are intended to prevent unnecessary or undue degradation of public lands by operators authorized by the mining laws. The state of Nevada requires a reclamation bond based on the disturbed areas. The surety amount is reviewed every three years or whenever a POO amendment is submitted for review and approval to determine if the current bond is still adequate to execute the approved Reclamation Plan. The permit is valid for the life of the mine unless it is modified, suspended, or revoked by NDEP.
The State of Nevada imposes a 5% Net Proceeds of Minerals tax on the value of all minerals severed in the State. This tax is calculated and paid based on a prescribed net income formula which is different from book income.
Property Geology
The Cortez property is situated along the Cortez/Battle Mountain trend. The principal gold deposits and mining operations are located in the southern portion of Crescent Valley, which was formed by basin and range extensional tectonism.
Mineralization is sedimentary rock-hosted and consists of submicron to micrometer-sized gold particles and gold in solid solution in pyrite. Mineralization is disseminated throughout the host rock matrix in zones of silicified, decarbonatized, and/or argillized, silty calcareous rocks.
The Cortez Hills deposit consists of the Breccia Zone, Middle Zone, Lower Zone, Renegade Zone and the Pediment deposit. The maximum strike length of mineralization in the Cortez Hills deposit is approximately 1,300 m, and the maximum width is approximately 420 m. The mineralized zone starts at approximately 120 m below surface and continues to more than 600 m below surface. Select areas of the underground mineral resource have expansion potential. Exploration to fully delineate the extent of the Cortez Hills deposit is ongoing.
Ore at the Pipeline complex deposit is hosted within silty carbonates associated with the Roberts Mountain and Wenban formations. The maximum strike length of mineralization in the Pipeline deposit is approximately 2,400 m and the maximum width is approximately 1,500 m. The mineralized zone starts approximately 60 m below surface and continues to 600 m below surface.
The Goldrush deposit has a maximum thickness of 76 m, a width of about 425 m, and extends along strike for approximately 5,275 m. The deepest significant intercept is currently at 1,435 m. The Goldrush system remains open to the north into Fourmile, to the southeast, and in multiple directions in the Ken Balleweg (KB) Domain.
Robertson is an igneous related gold system. Gold mineralization is found in Upper Plate siliciclastics of the Devonian Slaven and Silurian Elder formations, as well as inside Eocene intermediate composition igneous rocks, primarily diorite and granodiorite. Mineralization is primarily concentrated around the Tenabo Stock in three main areas: Gold Pan in the northwest, Porphyry in the east to northeast, and Altenburg Hill in the southeast. Gold is associated with bismuth and tellurium and is commonly found in association with arsenopyrite and loellingite (FeAsS). Gold at Robertson is present as native gold, with minor electrum, and all gold present is free-milling.
Recent Developments
Production attributable to our royalty interests at the Cortez Complex for the year ended December 31, 2024, was approximately 720,200 ounces of gold, of which 209,200 ounces were attributable to the Legacy Zone, and 511,000 ounces were attributable to the CC Zone, compared to approximately 890,700 ounces of gold for the year ended December 31, 2023, of which 396,000 ounces were attributable to the Legacy Zone, and 494,700 ounces were attributable to the CC Zone.
In its 2023 Annual Information Form issued in March 2024, Barrick reported that the Cortez open pit operation is expected to continue until 2034 and the underground operation until 2042, and the planned conversion of existing resources to reserves at Cortez has the potential to extend open pit and underground mining operations to at least 2038 and 2052, respectively.
On November 22, 2024, Barrick provided an update on various projects currently underway, as well as a production outlook for the Cortez Complex. With respect to the near term, Barrick is expecting overall gold production from within the Cortez Complex to increase with the mining of ore in the Crossroads pit following waste stripping, as well as the continued ramp-up at the Goldrush underground mine, which is expected to produce 400,000 ounces of gold per year at full production levels. Barrick is forecasting production from the Cortez Complex of over one million ounces in 2027, largely driven by these increases.
Relating to the longer-term potential within the Cortez Complex, Barrick reported several developments, including the receipt of the Record Of Decision for the Robertson Project in mid-November 2024, a significant increase in gold resources at the Fourmile Project after incorporating recent results from recent drilling, and further exploration progress at the Hanson target at Cortez Hills Underground and the Swift target to the west of the Pipeline deposit. According to Barrick, a PEA for the Fourmile Project, which covers approximately one-third of the known orebody as defined by drilling to date, indicates the potential for gold production levels exceeding 500,000 ounces per year. Barrick indicated that it intends to advance these projects with feasibility work ongoing for the Robertson open pit project, a pre-feasibility study planned to begin in 2025 at the Fourmile Project, and continued exploration at the Hanson and Swift targets.
On February 12, 2025, Barrick announced 2025 gold production guidance of approximately 680,000 to 765,000 ounces (100% basis) at the Cortez Complex.
ITEM 3. LEGAL PROCEEDINGS
None.
ITEM 4. MINE SAFETY DISCLOSURE
Not applicable.
INFORMATION ABOUT OUR EXECUTIVE OFFICERS
The executive officers of the Company and their ages as of February 1, 2025, are as follows:
William Heissenbuttel, 59, has more than 37 years of corporate finance experience, including almost 31 years in project and corporate finance in the metals and mining industry. Mr. Heissenbuttel was appointed our President and Chief Executive Officer and a Class I director, effective January 2020. Previously, he served as our Chief Financial Officer and Vice President Strategy from June 2018 to January 2020, Vice President Corporate Development from 2007 to June 2018, Vice President Operations from 2015 to June 2016, and Manager Corporate Development from 2006 to 2007. Prior to joining Royal Gold, Mr. Heissenbuttel served as Senior Vice President from 2000 to 2006 and Vice President from 1999 to 2000 at N M Rothschild & Sons (Denver) Inc. From 1994 to 1999, he served as Vice President and then Group Vice President at ABN AMRO Bank N.V. From 1987 to 1994, he was a Senior Credit Analyst and an Associate at Chemical Bank Manufacturers Hanover. Mr. Heissenbuttel holds a Master of Business Administration degree from the University of Chicago and a Bachelor of Arts degree from Northwestern University.
Daniel Breeze, 52, has more than 27 years of technical and commercial experience across international markets. Mr. Breeze has served as Senior Vice President, Corporate Development of our wholly owned subsidiary, RGLD Gold AG, since March 2024 and is a member of the Board of Directors of RGLD Gold. Mr. Breeze previously served as Vice President, Corporate Development of RGLD Gold from January 2019 to February 2024. Before joining Royal Gold, Mr. Breeze worked for Bank of Montreal from 2010 to December 2018, serving most recently as Managing Director, Equities, for BMO Capital Markets, based in Zürich, Switzerland, where he was focused primarily on the mining sector. Previously, Mr. Breeze was a member of the Equities Group at UBS Investment Bank where he worked extensively with North American and European mining companies across the commodity spectrum. Prior to his banking career, Mr. Breeze was a member of the geotechnical and mining team at Golder Associates. Mr. Breeze holds Master of Engineering and Master of Business Administration degrees from the University of Toronto and a Bachelor of Science degree in Civil Engineering from the University of Manitoba. Mr. Breeze is also a registered Professional Engineer.
Paul Libner, 51, has more than 28 years of finance and accounting experience. Mr. Libner has served as our Senior Vice President and Chief Financial Officer since March 2024. Previously, he served as our Chief Financial Officer and Treasurer from January 2020 to February 2024, Controller and Treasurer from June 2018 to January 2020, and Controller from 2004 to May 2018. Mr. Libner began his career with Ernst & Young where he provided audit and business advisory services, primarily for the financial services and healthcare industries, and later held various finance and accounting roles within the financial services industry. Mr. Libner holds a Bachelor of Science degree and Master of Accountancy degree from the University of Denver.
Martin Raffield, 56, has over 31 years of underground and open pit mining experience in operational, corporate, construction and consulting roles in North and South America, Africa and Europe. Dr. Raffield has served as Senior Vice President, Operations since March 2024. Dr. Raffield previously served as Vice President, Operations from January 2022 to February 2024. Prior to joining Royal Gold, Dr. Raffield operated an independent consulting company during 2021. From November 2019 to September 2020, he was the Executive Vice President and Chief Operating Officer of Harte Gold Corp. Dr. Raffield served Golden Star Resources as Executive Vice President and Chief Technical Officer in 2019 and Senior Vice President, Project Development and Technical Services from 2011 to 2018. From 2007 to 2010 he was engaged by SRK Consulting (USA) as Principal Consultant and Practice Leader. Prior to 2007 he held various operational positions in Canada and South Africa with Breakwater Resources, Placer Dome and Johannesburg Consolidated Investments, including Mining Manager at Myra Falls Mine, Mine Superintendent and Chief Engineer at Campbell Mine and Manager Rock Engineering at South Deep Mine. Dr. Raffield holds a Ph.D. in geotechnical engineering and a B.Sc. in mining geology from Cardiff University in the United Kingdom.
Randy Shefman, 52, has more than 25 years of legal experience in international transactions across the mining, oil and gas, and power sectors. Mr. Shefman has served as our Senior Vice President and General Counsel since March 2024.
Previously, he served as our Vice President and General Counsel from January 2020 to February 2024 and Associate General Counsel from 2011 to January 2020. Prior to Royal Gold, Mr. Shefman was in private legal practice with regional and international law firms, including LeBouef Lamb Greene & MacRae, Holland & Hart, and Hogan Lovells. Mr. Shefman holds an LL.M. degree in Environmental and Natural Resources Law and Policy from the University of Denver, a J.D. degree from the University of Colorado, and a Bachelor of Arts degree in history from the University of Michigan.
David Crandall, 42, has advised companies regarding corporate governance, SEC reporting, capital markets, and transactional matters for over 17 years. He joined Royal Gold as Vice President, Corporate Secretary and Chief Compliance Officer in February 2024. Before joining Royal Gold, Mr. Crandall was in private legal practice, most recently as a partner at Hogan Lovells since 2017 and previously in other roles at Hogan Lovells and other international law firms. Mr. Crandall holds a J.D. degree from Stanford Law School and a Bachelor of Arts degree from Johns Hopkins University.
PART II
ITEM 5. MARKET FOR REGISTRANT’S COMMON EQUITY, RELATED STOCKHOLDER MATTERS AND ISSUER PURCHASES OF EQUITY SECURITIES
Market Information and Holders
Our common stock is listed and trades on the Nasdaq Global Select Market under the symbol “RGLD.” As of February 3, 2025, we had 772 holders of record of our common stock. This figure does not reflect the beneficial ownership of shares held in nominee name.
Dividends
On November 19, 2024, we announced an increase in our annual dividend for calendar year 2025 from $1.60 to $1.80 per share, payable on a quarterly basis of $0.45 per share. The newly declared dividend is 13% higher than the dividend paid during calendar year 2024. We have steadily increased our annual dividend for 24 years, or since calendar year 2001. We expect to pay our annual dividend using cash on hand.
ITEM 6. RESERVED
ITEM 7. MANAGEMENT’S DISCUSSION AND ANALYSIS OF FINANCIAL CONDITION AND RESULTS OF OPERATIONS
General Presentation
This Item 7, Management’s Discussion and Analysis of Financial Condition and Results of Operations, generally discusses year-to-year comparisons between the year ended December 31, 2024 and the year ended December 31, 2023. A discussion of the changes in our financial condition and results of operations for the year ended December 31, 2022 has been omitted from this report, but may be found in Item 7 of our Annual Report on Form 10-K for the year ended December 31, 2023, filed with the SEC on February 15, 2024, which is available free of charge on the SEC’s website at www.sec.gov and our website at www.royalgold.com.
Overview of Our Business
We acquire and manage precious metal streams, royalties, and similar interests. We seek to acquire existing stream and royalty interests or finance projects that are in production, development or exploration stage in exchange for stream or royalty interests.
We manage our business under two segments:
•Acquisition and Management of Stream Interests — A metal stream is a purchase agreement that provides, in exchange for an upfront deposit payment, the right to purchase all or a portion of one or more metals produced from a mine, at a price determined for the life of the transaction by the purchase agreement. As of December 31, 2024, we owned nine stream interests, which are on seven production stage properties and two development stage properties. Stream interests accounted for 67% and 69% of our total revenue for the years ended December 31, 2024 and 2023, respectively. We expect stream interests to continue representing a significant portion of our total revenue.
•Acquisition and Management of Royalty Interests — Royalties are non-operating interests in mining projects that provide the right to revenue or metals produced from the project after deducting specified costs, if any. As of December 31, 2024, we owned royalty interests on 35 production stage properties, 16 development stage properties and 115 exploration stage properties, of which we consider 50 to be evaluation stage properties. We use “evaluation stage” to describe exploration stage properties that contain mineral resources and on which operators are engaged in the search for mineral reserves. Royalty interests accounted for 33% and 31% of our total revenue for the years ended December 31, 2024 and 2023, respectively.
We do not conduct mining operations on the properties in which we hold stream and royalty interests, and we generally are not required to contribute to capital costs, exploration costs, environmental costs or other operating costs on those properties.
We are continually reviewing opportunities to grow our portfolio, whether through the creation or acquisition of new or existing stream or royalty interests or other acquisition activity. We generally have acquisition opportunities in various stages of review. Our review process may include, for example, engaging consultants and advisors to analyze an opportunity; analysis of technical, financial, legal, and other confidential information of an opportunity; submission of indications of interest and term sheets; participation in preliminary discussions and negotiations; and involvement as a bidder in competitive processes.
Business Trends and Uncertainties
Acquisition of Cactus Project Royalty
On December 31, 2024, RG Royalties, LLC, a wholly-owned subsidiary of Royal Gold, acquired two royalties for cash consideration of $55 million that constitute an aggregate 2.5% net smelter return ("NSR") royalty (the “Cactus Royalty”) on the Cactus Project from a private seller. The Cactus Project is being developed by Arizona Sonoran Copper Company Inc. (“ASCU”), and is located in Arizona. The Cactus Royalty covers the Cactus East and Cactus West deposits as well as portions of the Parks/Salyer deposit and is subject to a right in favor of ASCU, until July 10, 2025, to buy back 0.5% of the aggregate 2.5% royalty for $7 million. The purchase price was funded with available cash on hand. Please refer to Note 3 of the Notes to Consolidated Financial Statements for more information on the acquisition of the Cactus Royalty.
Acquisition of Back River Royalties
On June 26, 2024, International Royalty Corporation, a wholly-owned subsidiary of Royal Gold, acquired a 0.7% NSR royalty (the "Hill Royalty") that declines by 50% after $5 million Canadian dollars in royalty revenue is received, and a 26.25% interest in a 5% gross smelter return royalty (the "KM Royalty") that is payable after approximately 780,000 ounces have been produced on the Back River Gold Project ("Back River") for aggregate cash consideration of $51 million. Payments for the Hill Royalty are deductible from the KM Royalty. Back River is operated by B2Gold Corporation and is located in Western Nunavut, Canada. The purchase price was funded with available cash on hand. Please refer to Note 3 of the Notes to Consolidated Financial Statements for more information on the acquisition of the Back River royalties.
Metal Prices
Our financial results are primarily tied to the price of gold, silver, copper, and other metals. Metal prices have fluctuated widely in recent years, and we expect this volatility to continue. The marketability and price of metals are influenced by numerous factors beyond our control, and significant changes in metal prices can have a material effect on our revenue.
For the years ended December 31, 2024, and 2023, the average prices and percentages of revenue by metal were as follows:
| | | | | | | | | | | | | | | | | | | | | | | | | | |
| | Year Ended |
| | December 31, 2024 | | December 31, 2023 |
| Metal | | Average
Price | | Percentage
of Revenue | | Average
Price | | Percentage
of Revenue |
Gold ($/ounce)(1) | | $ | 2,386 | | | 76% | | $ | 1,941 | | | 76% |
Silver ($/ounce)(1) | | $ | 28.27 | | | 12% | | $ | 23.35 | | | 12% |
Copper ($/pound)(2) | | $ | 4.15 | | | 9% | | $ | 3.85 | | | 9% |
| Other | | N/A | | 3% | | N/A | | 3% |
(1)Based on the average LBMA Price for the period.
(2)Based on the average LME Price for the period.
Cost Support Agreement for Mount Milligan
On February 13, 2024, we entered into a Cost Support Agreement with Centerra Gold Inc. ("Centerra") to incentivize Centerra to continue to invest and maximize the value of the large mineral endowment at Mount Milligan. The Cost Support Agreement provided a basis for a reserve increase and extension of the Mount Milligan mine life to 2035 and may provide a basis for further extension of the mine life beyond 2035. Please refer to Note 7 of the Notes to Consolidated Financial Statements of this report for additional information regarding the Cost Support Agreement.
Results of Operations
Year Ended December 31, 2024, Compared with Year Ended December 31, 2023
For the year ended December 31, 2024, we recorded net income attributable to Royal Gold stockholders of $332.0 million, or $5.04 per basic and diluted share, as compared to net income attributable to Royal Gold stockholders of $239.4 million, or $3.64 per basic and $3.63 per diluted share, for the year ended December 31, 2023.
For the year ended December 31, 2024, we recognized total revenue of $719.4 million, which is comprised of stream revenue of $483.3 million and royalty revenue of $236.1 million, at an average gold price of $2,386 per ounce, an average silver price of $28.27 per ounce and an average copper price of $4.15 per pound, compared to total revenue of $605.7 million, which is comprised of stream revenue of $418.3 million and royalty revenue of $187.4 million, at an average gold price of $1,941 per ounce, an average silver price of $23.35 per ounce and an average copper price of $3.85 per pound, for the year ended December 31, 2023.
Revenue and the corresponding production attributable to our stream and royalty interests, for the year ended December 31, 2024, compared to the year ended December 31, 2023, is as follows:
Revenue and Reported Production Subject to our Stream and Royalty Interests
Year Ended December 31, 2024 and 2023
(In thousands, except reported production in oz. and lbs.)
| | | | | | | | | | | | | | | | | | | | | | | | | | | | | | | | | | | | | | |
| | | | Year Ended December 31, 2024 | | Year Ended December 31, 2023 |
| Stream/Royalty | | Metal(s) | | Revenue | | Reported Production(1) | | Revenue | | Reported Production(1) |
Stream(2): | | | | | | | | | | | | |
| Mount Milligan | | | | $ | 186,039 | | | | | | $ | 158,167 | | | | |
| | Gold | | | | 57,500 | | oz. | | | | 58,000 | | oz. |
| | Copper | | | | 11.8 | | Mlbs. | | | | 11.8 | | Mlbs. |
| Pueblo Viejo | | | | $ | 83,059 | | | | | | $ | 76,247 | | | | |
| | Gold | | | | 24,900 | | oz. | | | | 27,100 | oz. |
| | Silver | | | | 863,400 | | oz. | | | | 1.0 | | Moz. |
| Andacollo | | Gold | | $ | 47,531 | | | 20,000 | | oz. | | $ | 48,920 | | | 25,500 | | oz. |
Other(3) | | | | $ | 166,665 | | | | | | $ | 134,946 | | | | |
| | Gold | | | | 52,200 | | oz. | | | | 48,500 | | oz. |
| | Silver | | | | 1.5 | | Moz. | | | | 1.8 | | Moz. |
| Total stream revenue | | | | $ | 483,294 | | | | | | $ | 418,280 | | | | |
| | | | | | | | | | | | |
Royalty(2): | | | | | | | | | | | | |
| Cortez Legacy Zone | | Gold | | $ | 58,183 | | | 209,200 | | oz. | | $ | 79,920 | | | 396,000 | | oz. |
| Cortez CC Zone | | Gold | | 11,611 | | | 511,000 | | oz. | | 14,626 | | | 494,700 | | oz. |
Other(3) | | Various | | $ | 166,307 | | | N/A | | | $ | 92,891 | | | N/A | |
| Total royalty revenue | | | | $ | 236,101 | | | | | | $ | 187,437 | | | | |
| Total Revenue | | $ | 719,395 | | | | | | $ | 605,717 | | | | |
________________________________________________
(1)Reported production relates to the amount of stream metal sales and the metal sales attributable to our royalty interests for the years ended December 31, 2024 and 2023, and may differ from the operators’ public reporting due to a number of factors, including the timing of the operator’s concentrate shipments, the delivery of metal to us and our subsequent sale of the delivered metal.
(2)Refer to Item 2, Properties, for further discussion on our principal stream and royalty interests.
(3)Individually, with the exception of the Wassa stream (6.7% for the year ended December 31, 2024 and 5.4% for the year ended December 31, 2023), Rainy River stream (6.4% for the year ended December 31, 2024 and 6.4% for the year ended December 31, 2023), Peñasquito royalty (6.4% for the year ended December 31, 2024), Xavantina stream (5.4% for the year ended December 31, 2024), and Khoemacau stream (5.7% for the year ended December 31, 2023), no stream or royalty included within the “Other” category contributed greater than 5% of our total revenue for either period.
The increase in our total revenue for the year ended December 31, 2024, compared with the year ended December 31, 2023, resulted primarily from higher average gold, silver and copper prices, higher production from Peñasquito, and higher gold sales at Xavantina and Wassa which are included in other stream revenue in the table above. The increase was partially offset by lower production from the Cortez Legacy Zone, lower gold sales from Andacollo, and lower silver sales from Khoemacau when compared to the prior year.
Gold and silver ounces and copper pounds purchased and sold during the year ended December 31, 2024 and 2023, as well as gold, silver and copper in inventory as of December 31, 2024 and 2023, for our stream interests were as follows:
| | | | | | | | | | | | | | | | | | | | | | | | | | | | | | | | | | | | | | |
| | Year Ended December 31, 2024 | | Year Ended December 31, 2023 | | As of December 31, 2024 | | As of December 31, 2023 |
| Gold Stream | | Purchases (oz.) | | Sales (oz.) | | Purchases (oz.) | | Sales (oz.) | | Inventory (oz.) | | Inventory (oz.) |
| Mount Milligan | | 58,000 | | | 57,500 | | | 56,800 | | | 58,000 | | | 4,500 | | | 4,000 | |
| Pueblo Viejo | | 26,500 | | | 24,900 | | | 25,400 | | | 27,100 | | | 7,700 | | | 6,200 | |
| Andacollo | | 19,300 | | | 20,000 | | | 22,500 | | | 25,500 | | | — | | | 800 | |
| Other | | 51,100 | | | 52,200 | | | 48,600 | | | 48,500 | | | 3,300 | | | 4,200 | |
| Total | | 154,900 | | | 154,600 | | | 153,300 | | | 159,100 | | | 15,500 | | | 15,200 | |
| | | | | | | | | | | | | | | | | | | | | | | | | | | | | | | | | | | | | | |
| | Year Ended December 31, 2024 | | Year Ended December 31, 2023 | | As of December 31, 2024 | | As of December 31, 2023 |
| Silver Stream | | Purchases (oz.) | | Sales (oz.) | | Purchases (oz.) | | Sales (oz.) | | Inventory (oz.) | | Inventory (oz.) |
Pueblo Viejo(1) | | 859,900 | | | 863,400 | | | 907,000 | | | 1,021,900 | | | 219,400 | | | 223,000 | |
| Other | | 1,490,700 | | | 1,531,900 | | | 1,793,900 | | | 1,757,100 | | | 119,000 | | | 160,100 | |
| Total | | 2,350,600 | | | 2,395,300 | | | 2,700,900 | | | 2,779,000 | | | 338,400 | | | 383,100 | |
| | | | | | | | | | | | | | | | | | | | | | | | | | | | | | | | | | | | | | |
| | Year Ended December 31, 2024 | | Year Ended December 31, 2023 | | As of December 31, 2024 | | As of December 31, 2023 |
| Copper Stream | | Purchases (Mlbs.) | | Sales (Mlbs.) | | Purchases (Mlbs.) | | Sales (Mlbs.) | | Inventory (Mlbs.) | | Inventory (Mlbs.) |
| Mount Milligan | | 11.8 | | | 11.8 | | | 10.9 | | | 11.8 | | | — | | | — | |
_______________________________________________
(1) Pueblo Viejo silver purchases for the year ended December 31, 2024 do not include 816,500 ounces of silver permitted to be deferred based on the terms of the Pueblo Viejo silver stream agreement. Total deferred silver ounces were 1.7 million ounces at December 31, 2024, and the timing for the delivery of this deferred amount is uncertain.
Cost of sales, which excludes depreciation, depletion, and amortization, increased to $97.5 million for the year ended December 31, 2024, from $90.5 million for the year ended December 31, 2023. The increase was primarily due to higher average gold, silver and copper prices and higher gold sales from Xavantina and Wassa, partially offset by lower gold sales from Andacollo and lower silver sales from Khoemacau when compared to the prior year. Cost of sales is specific to our stream agreements and, except for Mount Milligan, is the result of our purchase of metal for a cash payment that is a set contractual percentage of the spot price for that metal near the date of metal delivery. For Mount Milligan, the cash payments under the existing stream agreement are the lesser of $435 per ounce or the prevailing market price of gold when purchased and 15% of the spot price for copper near the date of metal delivery. Separately, and in addition to the cash payments under the existing stream agreement, the Mount Milligan Cost Support Agreement detailed in Note 7 of our Notes to Consolidated Financial Statements provides for cash payments on gold and copper deliveries that are expected to begin after certain thresholds are met, or earlier, if metal prices are below certain thresholds and if requested by Centerra.
General and administrative costs increased to $40.9 million for the year ended December 31, 2024, from $39.8 million for the year ended December 31, 2023. The increase was primarily due to higher non-cash stock compensation expense when compared to the prior year.
Depreciation, depletion and amortization decreased to $144.4 million for the year ended December 31, 2024, from $164.9 million for the year ended December 31, 2023. The decrease was primarily due to lower stream depletion rates, as a result of proven and probable mineral reserve increases by our operators, lower gold sales from Andacollo, lower silver sales from Khoemacau and lower gold production from the Cortez Legacy Zone when compared to the prior year. The decrease was partially offset by higher production from Peñasquito when compared to the prior year.
Interest and other expense decreased to $9.7 million for the year ended December 31, 2024, from $30.9 million for the year ended December 31, 2023. The decrease was primarily due to lower interest expense as a result of lower average amounts outstanding under our revolving credit facility compared to the prior year. For the year ended December 31, 2024, amounts outstanding under our revolving credit facility averaged $82.0 million at an average all-in borrowing rate of 6.5%,
compared to average amounts outstanding of $391.4 million at an average all-in borrowing rate of 6.4% for the year ended December 31, 2023.
Income tax expense was $93.6 million for the year ended December 31, 2024, as compared to $42.0 million for the year ended December 31, 2023, which resulted in an effective tax rate of 22.0% in the current period and 14.9% in the prior year. The year ended December 31, 2024 included a $13.0 million U.S. GILTI income tax expense related to consideration received from the Mount Milligan Cost Support Agreement. The year ended December 31, 2023 included a release of valuation allowances on certain foreign deferred tax assets.
Liquidity and Capital Resources
We use our liquidity and capital resources to fund dividends and for the acquisition of stream and royalty interests, including any conditional funding schedules. Our short-term and long-term capital requirements are primarily affected by our ongoing acquisition activities. We currently, and generally at any time, have acquisition opportunities in various stages of active review. In the event of one or more substantial stream or royalty interest or other acquisitions, we may seek additional debt or equity financing as necessary. We occasionally borrow and repay amounts under our revolving credit facility and may do so in the future. We believe that our current liquidity and capital resources will be adequate to cover our operating needs for the foreseeable future.
At December 31, 2024, we had working capital of $190.1 million, including $195.5 million of cash and equivalents. This compares to working capital of $95.0 million, including $104.2 million of cash and equivalents at December 31, 2023. The increase in our working capital was primarily due to an increase in our available cash, which primarily resulted from higher net cash proceeds from our stream and royalty interests and cash proceeds received for the Mount Milligan Cost Support Agreement, partially offset by the Cactus and Back River royalty acquisitions during the current year.
During the year ended December 31, 2024, liquidity needs were met from $529.5 million in net cash provided by operating activities and our available cash resources. Working capital, combined with available capacity under our revolving credit facility, resulted in approximately $1.2 billion of total liquidity at December 31, 2024. As of December 31, 2024, we had $1.0 billion available under our revolving credit facility. We were in compliance with each financial covenant under the revolving credit facility as of December 31, 2024. Refer to Note 5 of our Notes to Consolidated Financial Statements and below under Recent Liquidity and Capital Resource Developments for further discussion on our debt.
At December 31, 2024, our contractual cash obligations were solely comprised of operating leases. We believe we will be able to fund all current cash obligations from net cash provided by operating activities. For additional information on our operating leases, see Note 6 of our Notes to Consolidated Financial Statements.
Please refer to our risk factors included in Item 1A of this report for a discussion of certain risks that may impact our liquidity and capital resources.
Recent Liquidity and Capital Resource Developments
Revolving Credit Facility Repayment
During the year ended December 31, 2024, we repaid the remaining $250 million of outstanding borrowings on our revolving credit facility, making the entire $1 billion revolving credit facility available as of December 31, 2024.
Dividend Increase
On November 19, 2024, we announced an increase in our annual dividend for calendar year 2025 from $1.60 to $1.80 per share, payable on a quarterly basis of $0.45 per share. The newly declared dividend is 13% higher than the dividend paid during calendar year 2024. We have steadily increased our annual dividend for 24 years, or since calendar year 2001. We expect to pay our annual dividend using cash on hand.
Summary of Cash Flows
Operating Activities
Net cash provided by operating activities totaled $529.5 million for the year ended December 31, 2024, compared to $415.8 million for the year ended December 31, 2023. The increase, when compared to the prior year, was primarily due to higher net cash proceeds received from our stream and royalty interests of $80.3 million, cash proceeds of $24.5 million received from the Mount Milligan Cost Support Agreement, lower debt cash interest payments of $21.5 million and $12.0 million of interest from the repayment of the Khoemacau subordinated debt facility. This increase was partially offset by higher cash taxes of $21.8 million when compared to the prior year.
Investing Activities
Net cash used in investing activities totaled $77.7 million for the year ended December 31, 2024, compared to net cash used in investing activities of $2.8 million for the year ended December 31, 2023. The increase was primarily due to the acquisition of the Back River and Cactus royalties offset by the $25 million principal repayment received on the Khoemacau subordinated debt facility when compared to the prior year.
Financing Activities
Net cash used in financing activities totaled $360.5 million for the year ended December 31, 2024, compared to net cash used in financing activities of $427.4 million for the year ended December 31, 2023. The decrease, when compared to the prior year, was primarily due to lower debt repayments.
Critical Accounting Estimates
Use of Estimates
The preparation of our financial statements, in conformity with U.S. generally accepted accounting principles (“U.S. GAAP”), requires management to make estimates and assumptions. These estimates and assumptions have a significant effect on reported amounts of assets and liabilities, revenue and expenses because they result primarily from the need to make estimates and assumptions on matters that are inherently uncertain.
We rely on mineral reserve and mineral resource estimates reported by the operators of the properties on which we hold stream and royalty interests. These estimates and the underlying assumptions affect the potential impairments of long-lived assets and the ability to realize income tax benefits associated with deferred tax assets. These estimates and assumptions also affect the rate at which we recognize revenue or charge depreciation, depletion and amortization to earnings. On an ongoing basis, management evaluates these estimates and assumptions; however, actual amounts could differ from these estimates and assumptions. Differences between estimates and actual amounts are adjusted and recorded in the period that the actual amounts are known.
Stream and Royalty Interests in Mineral Properties and Related Depletion
Stream and royalty interests include acquired stream and royalty interests in production, development and exploration stage properties. The costs of acquired stream and royalty interests are capitalized as tangible assets as such interests do not meet the definition of a financial asset.
Production stage stream and royalty interests are depleted using the units of production method over the life of the mineral property (as stream sales occur or royalty payments are recognized), which are estimated using proven and probable mineral reserves as provided by the operator. Development stage mineral properties, which are not yet in production, are not depleted until the property begins production. Exploration stage mineral properties, where there are no proven and probable mineral reserves, are not depleted. When the associated exploration stage mineral interests are converted to proven and probable mineral reserves, the mineral property becomes a development stage mineral property.
Asset Impairment
We evaluate long-lived assets for impairment whenever events or changes in circumstances indicate that the related carrying amounts of an asset or group of assets may not be recoverable. The recoverability of the carrying value of stream
and royalty interests in production and development stage mineral properties is evaluated based upon estimated future undiscounted net cash flows from each stream and royalty interest using estimates of proven and probable mineral reserves, mineral resources and other relevant information received from the operators. We evaluate the recoverability of the carrying value of royalty interests in exploration stage mineral properties in the event of significant decreases in the price of gold, silver, copper and other metals, and whenever new information regarding the mineral properties is obtained from the operator indicating that production will not likely occur or may be reduced in the future, thus potentially affecting the future recoverability of our stream or royalty interests. Impairments in the carrying value of each property are measured and recorded to the extent that the carrying value in each property exceeds its estimated fair value, which is generally calculated using estimated future discounted cash flows.
Estimates of gold, silver, copper, and other metal prices, and operators’ estimates of proven and probable mineral reserves or mineral resources related to our stream or royalty properties are subject to certain risks and uncertainties which may affect the recoverability of our investment in these stream and royalty interests in mineral properties. It is possible that changes could occur to these estimates, which could adversely affect the net cash flows expected to be generated from these stream and royalty interests.
Revenue
A performance obligation is a promise in a contract to transfer control of a distinct good or service (or integrated package of goods and/or services) to a customer. A contract’s transaction price is allocated to each distinct performance obligation and recognized as revenue when, or as, a performance obligation is satisfied. In accordance with this guidance, revenue attributable to our stream and royalty interests is generally recognized at the point in time that control of the related metal production transfers to our customers, as described below. The amount of revenue we recognize further reflects the consideration to which we are entitled under the respective stream or royalty agreement. A more detailed summary of our revenue recognition policies for our stream and royalty interests is discussed below.
Stream Interests
A metal stream is a purchase agreement that provides, in exchange for an upfront deposit payment, the right to purchase all or a portion of one or more of the metals produced from a mine, at a price determined for the life of the transaction by the purchase agreement. Gold, silver and copper received under our metal stream agreements are taken into inventory, and then sold primarily using average spot rate gold, silver and copper forward contracts. The sales price for these average spot rate forward contracts is determined by the average daily gold, silver or copper spot prices during the term of the contract, typically a consecutive number of trading days between ten days and three months (typically depending on the frequency of deliveries under the respective stream agreement and our sales policy in effect at the time) commencing shortly after receipt and purchase of the metal. We settle our forward sales contracts via physical delivery of the metal to the purchaser (our customer) on the settlement date specified in the contract. Under our forward sales contracts, there is a single performance obligation to sell a contractually specified volume of metal to the purchaser, and we satisfy this obligation at the point in time of physical delivery. Accordingly, revenue from our metal sales is recognized on the date of settlement, which is the date that control, custody and title to the metal transfer to the purchaser.
Royalty Interests
Royalties are non-operating interests in mining projects that provide the right to a percentage of revenue or metals produced from the project after deducting specified costs, if any. We are entitled to payment for our royalty interest in a mining project based on a contractually specified commodity price (for example, a monthly or quarterly average spot price) for the period in which metal production occurred. As a royalty holder, we act as a passive entity in the production and operations of the mining project, and the third-party operator of the mining project is responsible for all mining activities, including subsequent marketing and delivery of all metal production to their ultimate customer. In all of our most significant royalty interest arrangements, we have concluded that we transfer control of our interest in the metal production to the operator at the point at which production occurs, and thus, the operator is our customer. We have further determined that the transfer of each unit of metal production, comprising our royalty interest, to the operator represents a separate performance obligation under the contract, and each performance obligation is satisfied at the point in time of metal production by the operator. Accordingly, we recognize revenue attributable to our royalty interests in the period in which metal production occurs at the specified commodity price per the agreement, net of any contractually allowable offsite treatment, refining, transportation and, if applicable, other contractually permitted costs.
Income Taxes
Our annual tax rate is based on income, statutory tax rates in effect and tax planning opportunities available to us in the various jurisdictions in which the Company operates. Significant judgment is required in determining the annual tax expense, current tax assets and liabilities, deferred tax assets and liabilities, and our future taxable income, both as a whole and in various tax jurisdictions, for purposes of assessing our ability to realize future benefit from our deferred tax assets. Actual income taxes could vary from these estimates due to future changes in income tax law, significant changes in the jurisdictions in which we operate or unpredicted results from the final determination of each year’s liability by taxing authorities.
We treat global intangible low-taxed income (“GILTI”) as a period cost and therefore do not record deferred tax impacts of GILTI in our consolidated financial statements. Our deferred income taxes reflect the impact of temporary differences between the reported amounts of assets and liabilities for financial reporting purposes and such amounts measured by tax laws and regulations. In evaluating the realizability of the deferred tax assets, management considers both positive and negative evidence that may exist, such as earnings history, reversal of taxable temporary differences, forecasted operating earnings and available tax planning strategies in each tax jurisdiction. A valuation allowance may be established to reduce our deferred tax assets to the amount that is considered more likely than not to be realized through the generation of future taxable income and other tax planning strategies.
Our operations may involve dealing with uncertainties and judgments in the application of complex tax regulations in multiple jurisdictions. The final taxes paid are dependent upon many factors, including negotiations with taxing authorities in various jurisdictions and resolution of disputes arising from federal, state, and international tax audits. We recognize potential liabilities and record tax liabilities for anticipated tax audit issues in the United States and other tax jurisdictions based on our estimate of whether, and the extent to which, additional taxes will be due. We adjust these reserves in light of changing facts and circumstances, such as the progress of a tax audit; however, due to the complexity of some of these uncertainties, the ultimate resolution could result in a payment that is materially different from our current estimate of the tax liabilities. These differences will be reflected as increases or decreases to income tax expense in the period which they are determined. We recognize interest and penalties, if any, related to unrecognized tax benefits in income tax expense.
Forward-Looking Statements
This report and our other public communications include “forward-looking statements” within the meaning of U.S. federal securities laws. Forward-looking statements are any statements other than statements of historical fact. Forward-looking statements are not guarantees of future performance, and actual results may differ materially from these statements.
Forward-looking statements are often identified by words like “will,” “may,” “could,” “should,” “would,” “believe,” “estimate,” “expect,” “anticipate,” “plan,” “forecast,” “potential,” “intend,” “continue,” “project,” or negatives of these words or similar expressions. Forward-looking statements include, among others, statements regarding the following: our expected financial performance and outlook, including sales volume, revenue, expenses, tax rates, earnings, and cash flows; operators’ expected operating and financial performance and other anticipated developments relating to their properties and operations, including production, deliveries, estimates of mineral resources and mineral reserves, environmental and feasibility studies, technical reports, mine plans, capital requirements, liquidity, and capital expenditures; opportunities for investments, acquisitions and other transactions; anticipated benefits from investments, acquisitions and other transactions; receipt and timing of future metal deliveries, including deferred amounts at Pueblo Viejo; the timing and amount of future benefits and obligations in connection with the Mount Milligan Cost Support Agreement; anticipated liquidity, capital resources, financing, and stockholder returns; borrowings and repayments under our revolving credit facility; the materiality of properties within our portfolio; macroeconomic and market conditions; the anticipated effects of climate change; returns on investments; sufficiency of contractual protections; adoption of new accounting standards; valuation allowances; potential impairments; tax changes; assumptions related to fair value of equity awards; and prices for gold, silver, copper, and other metals.
Factors that could cause actual results to differ materially from these forward-looking statements include, among others, the following: changes in the price of gold, silver, copper, or other metals; operating activities or financial performance of properties on which we hold stream or royalty interests, including variations between actual and forecasted performance, operators’ ability to complete projects on schedule and as planned, operators’ changes to mine plans and mineral reserves and mineral resources (including updated mineral reserve and mineral resource information), liquidity needs, mining and environmental hazards, labor disputes, distribution and supply chain disruptions, permitting and licensing issues, other adverse government or court actions, or operational disruptions; changes of control of properties or operators; contractual
issues involving our stream or royalty agreements; the timing of deliveries of metals from operators and our subsequent sales of metal; risks associated with doing business in foreign countries; increased competition for stream and royalty interests; environmental risks, including those caused by climate change; potential cyber-attacks, including ransomware; our ability to identify, finance, value, and complete investments, acquisitions or other transactions; adverse economic and market conditions; effects of health epidemics and pandemics; changes in laws or regulations governing us, operators, or operating properties; changes in management and key employees; and other factors described elsewhere in this report, including in Item 1A, Risk Factors. Most of these factors are beyond our ability to predict or control. Other unpredictable or unknown factors not discussed in this report could also have material adverse effects on forward-looking statements.
Forward-looking statements speak only as of the date on which they are made. We disclaim any obligation to update any forward-looking statements, except as required by law. Readers are cautioned not to put undue reliance on forward-looking statements.
ITEM 7A. QUANTITATIVE AND QUALITATIVE DISCLOSURE ABOUT MARKET RISK
Our earnings and cash flows are significantly impacted by changes in the market price of gold and other metals. Gold, silver, copper, and other metal prices can fluctuate significantly and are affected by numerous factors, such as demand, production levels, economic policies of central banks, producer hedging, world political and economic events, and the strength of the U.S. dollar relative to other currencies. Please see the risk factor entitled “Our revenue is subject to volatility in metal prices, which could adversely affect our results of operations and cash flow” under Item 1A, Risk Factors, of this report for more information about risks associated with metal price volatility.
During the year ended December 31, 2024, we reported revenue of $719.4 million, with an average gold price for the period of $2,386 per ounce (based on the LBMA Price), an average silver price of $28.27 per ounce (based on the LBMA Price), and an average copper price of $4.15 per pound (based on the LME Price). The table below shows the impact that a 10% increase or decrease in the average price of the specified metal would have had on our total reported revenue for the year ended December 31, 2024:
| | | | | | | | | | | |
| Metal | Percentage of Total Reported Revenue Associated with Specified Metal | | Amount by Which Total Reported Revenue Would Have Increased or Decreased If Price of Specified Metal
Had Averaged 10% Higher or Lower in Period |
| Gold | 76% | | $53.0 million |
| Silver | 12% | | $5.3 million |
| Copper | 9% | | $11.6 million |
ITEM 8. FINANCIAL STATEMENTS AND SUPPLEMENTARY DATA
Index to Financial Statements
Report of Independent Registered Public Accounting Firm
To the Stockholders and the Board of Directors of Royal Gold, Inc.
Opinion on the Financial Statements
We have audited the accompanying consolidated balance sheets of Royal Gold, Inc. (the Company) as of December 31, 2024 and 2023, the related consolidated statements of operations and comprehensive income, changes in equity and cash flows for each of the three years in the period ended December 31, 2024, and the related notes (collectively referred to as the “consolidated financial statements”). In our opinion, the consolidated financial statements present fairly, in all material respects, the financial position of the Company at December 31, 2024 and 2023, and the results of its operations and its cash flows for each of the three years in the period ended December 31, 2024, in conformity with U.S. generally accepted accounting principles.
We also have audited, in accordance with the standards of the Public Company Accounting Oversight Board (United States) (PCAOB), the Company's internal control over financial reporting as of December 31, 2024, based on criteria established in Internal Control—Integrated Framework issued by the Committee of Sponsoring Organizations of the Treadway Commission (2013 framework), and our report dated February 12, 2025 expressed an unqualified opinion thereon.
Basis for Opinion
These financial statements are the responsibility of the Company's management. Our responsibility is to express an opinion on the Company’s financial statements based on our audits. We are a public accounting firm registered with the PCAOB and are required to be independent with respect to the Company in accordance with the U.S. federal securities laws and the applicable rules and regulations of the Securities and Exchange Commission and the PCAOB.
We conducted our audits in accordance with the standards of the PCAOB. Those standards require that we plan and perform the audit to obtain reasonable assurance about whether the financial statements are free of material misstatement, whether due to error or fraud. Our audits included performing procedures to assess the risks of material misstatement of the financial statements, whether due to error or fraud, and performing procedures that respond to those risks. Such procedures included examining, on a test basis, evidence regarding the amounts and disclosures in the financial statements. Our audits also included evaluating the accounting principles used and significant estimates made by management, as well as evaluating the overall presentation of the financial statements. We believe that our audits provide a reasonable basis for our opinion.
Critical Audit Matter
The critical audit matter communicated below is a matter arising from the current period audit of the financial statements that was communicated or required to be communicated to the audit committee and that: (1) relates to accounts or disclosures that are material to the financial statements and (2) involved our especially challenging, subjective or complex judgments. The communication of the critical audit matter does not alter in any way our opinion on the consolidated financial statements, taken as a whole, and we are not, by communicating the critical audit matter below, providing a separate opinion on the critical audit matter or on the accounts or disclosures to which it relates.
Impairment Assessment of Stream and Royalty Interests in Mineral Properties
| | | | | | | | |
| Description of the Matter | | At December 31, 2024, the Company’s stream and royalty interest balance totaled $3 billion. As more fully described in Note 2 to the consolidated financial statements, the Company evaluates its stream and royalty interests for impairment whenever events or changes in circumstances indicate that the carrying amounts of the asset or group of assets may not be recoverable (“triggering events”). Management evaluates various qualitative factors in determining whether or not events or changes in circumstances indicate that the carrying amount of an asset or group of assets may not be recoverable. The factors considered include, among others, significant changes in estimates of forecasted gold, silver and copper prices, significant changes in operators’ estimates of proven and probable reserves and/or mineral resources and other relevant information received from the operators, which may include operational or legal information that indicates production from mineral interests may not occur or may be significantly reduced in the future or otherwise that the Company's stream and royalty interest balance may not be recoverable. |
| |
| Auditing the Company’s impairment assessment involved our subjective judgment because, in determining whether a triggering event occurred, management uses assumptions that include, among others, assumptions about forecasted gold, silver and copper prices and total future production using reserve or other relevant information reported by the operators. Significant uncertainty exists with these assumptions. Further, management’s evaluation of any new information indicating that production will likely not occur or may be significantly reduced in the future, or otherwise that the Company's stream and royalty interest balance may not be recoverable, requires significant judgment. |
| | |
| How We Addressed the Matter in Our Audit | | We obtained an understanding, evaluated the design and tested the operating effectiveness of controls over the Company’s process over the impairment assessment. For example, we tested controls over the Company’s process for identifying and evaluating potential impairment triggers and related significant assumptions and judgments. To test the Company’s impairment assessment, our audit procedures included, among others, evaluating the significant assumptions, judgments and operating data used in the Company’s analysis. Specifically, we compared forecasted gold, silver and copper prices to available market information, and we corroborated reserve information to available operator or publicly available information. We searched for and evaluated other publicly available information that corroborates or contradicts the reserve estimates or indicates that production from mineral interests will not likely occur or may be significantly reduced in the future. We also considered the reputation of the third-party operators. Further, we evaluated the reason for changes to estimated proven and probable reserves declarations of operators |
/s/ Ernst & Young LLP
We have served as the Company’s auditor since 2010.
Denver, Colorado
February 12, 2025
ROYAL GOLD, INC.
Consolidated Balance Sheets
(In thousands, except share data)
| | | | | | | | | | | |
| December 31,
2024 | | December 31,
2023 |
| ASSETS | | | |
| Cash and equivalents | $ | 195,498 | | | $ | 104,167 | |
| Royalty receivables | 63,460 | | | 48,884 | |
| Income tax receivable | 1,139 | | | 2,676 | |
| Stream inventory | 12,973 | | | 9,788 | |
| Prepaid expenses and other | 2,217 | | | 1,911 | |
| Total current assets | 275,287 | | | 167,426 | |
| Stream and royalty interests, net (Note 4) | 3,042,804 | | | 3,075,574 | |
| Other assets | 74,039 | | | 118,057 | |
| Total assets | $ | 3,392,130 | | | $ | 3,361,057 | |
| LIABILITIES | | | |
| Accounts payable | $ | 10,578 | | | $ | 11,441 | |
| Dividends payable | 29,611 | | | 26,292 | |
| Income tax payable | 23,177 | | | 15,557 | |
| Other current liabilities | 21,785 | | | 19,132 | |
| Total current liabilities | 85,151 | | | 72,422 | |
| Debt (Note 5) | — | | | 245,967 | |
| Deferred tax liabilities | 132,308 | | | 134,299 | |
| Mount Milligan deferred liability (Note 7) | 25,000 | | | — | |
| Other liabilities | 18,465 | | | 7,728 | |
| Total liabilities | 260,924 | | | 460,416 | |
| Commitments and contingencies (Note 16) | | | |
| EQUITY | | | |
| Preferred stock, $.01 par value, 10,000,000 shares authorized; and 0 shares issued | — | | | — | |
| Common stock, $.01 par value, 200,000,000 shares authorized; and 65,691,151 and 65,631,760 shares outstanding, respectively | 657 | | | 656 | |
| Additional paid-in capital | 2,228,311 | | | 2,221,039 | |
| Accumulated earnings | 889,989 | | | 666,522 | |
| Total Royal Gold stockholders’ equity | 3,118,957 | | | 2,888,217 | |
| Non-controlling interests | 12,249 | | | 12,424 | |
| Total equity | 3,131,206 | | | 2,900,641 | |
| Total liabilities and equity | $ | 3,392,130 | | | $ | 3,361,057 | |
The accompanying notes are an integral part of these consolidated financial statements.
ROYAL GOLD, INC.
Consolidated Statements of Operations and Comprehensive Income
(In thousands, except share data)
| | | | | | | | | | | | | | | | | |
| Years Ended |
| December 31,
2024 | | December 31,
2023 | | December 31,
2022 |
| Revenue (Note 8) | $ | 719,395 | | | $ | 605,717 | | | $ | 603,206 | |
| | | | | |
| Costs and expenses | | | | | |
| Cost of sales (excludes depreciation, depletion and amortization) | 97,514 | | | 90,523 | | | 94,642 | |
| General and administrative | 40,934 | | | 39,761 | | | 34,612 | |
| Production taxes | 6,622 | | | 7,294 | | | 7,021 | |
| Depreciation, depletion and amortization | 144,426 | | | 164,937 | | | 178,935 | |
| Impairment of royalty interests | — | | | — | | | 4,287 | |
| Total costs and expenses | 289,496 | | | 302,515 | | | 319,497 | |
| | | | | |
| Operating income | 429,899 | | | 303,202 | | | 283,709 | |
| | | | | |
| Fair value changes in equity securities | (66) | | | (147) | | | (1,503) | |
| Interest and other income | 6,008 | | | 9,952 | | | 7,832 | |
| Interest and other expense | (9,749) | | | (30,867) | | | (17,170) | |
| Income before income taxes | 426,092 | | | 282,140 | | | 272,868 | |
| | | | | |
| Income tax expense (Note 11) | (93,613) | | | (42,008) | | | (32,926) | |
| Net income and comprehensive income | 332,479 | | | 240,132 | | | 239,942 | |
| Net income and comprehensive income attributable to non-controlling interests | (456) | | | (692) | | | (960) | |
| Net income and comprehensive income attributable to Royal Gold common stockholders | $ | 332,023 | | | $ | 239,440 | | | $ | 238,982 | |
| Net income per share attributable to Royal Gold common stockholders: | | | | | |
| Basic earnings per share | $ | 5.04 | | | $ | 3.64 | | | $ | 3.64 | |
| Basic weighted average shares outstanding | 65,662,185 | | 65,613,002 | | 65,576,995 |
| Diluted earnings per share | $ | 5.04 | | | $ | 3.63 | | | $ | 3.63 | |
| Diluted weighted average shares outstanding | 65,776,834 | | 65,739,110 | | 65,661,748 |
| Cash dividends declared per common share | $ | 1.650 | | | $ | 1.525 | | | $ | 1.425 | |
The accompanying notes are an integral part of these consolidated financial statements.
ROYAL GOLD, INC.
Consolidated Statements of Changes in Equity
(In thousands, except share data)
| | | | | | | | | | | | | | | | | | | | | | | | | | | | | | | | | | | |
| Royal Gold Stockholders | | | | |
| | | | | | | | | | | |
| Common Shares | | Additional
Paid-In
Capital | | Accumulated
Earnings | | Non-controlling
Interests | | Total
Equity |
| Shares | | Amount | | | | |
| Balance at December 31, 2021 | 65,564,364 | | $ | 656 | | | $ | 2,206,159 | | | $ | 381,929 | | | $ | 12,467 | | | $ | 2,601,211 | |
| Stock-based compensation and related share issuances | 28,233 | | — | | | 6,964 | | | — | | | — | | | 6,964 | |
| Distributions to non-controlling interests | — | | — | | | — | | | — | | | (1,051) | | | (1,051) | |
| Net income | — | | — | | | — | | | 238,982 | | | 960 | | | 239,942 | |
| Dividends declared | — | | — | | | — | | | (93,597) | | | — | | | (93,597) | |
| Balance at December 31, 2022 | 65,592,597 | | $ | 656 | | | $ | 2,213,123 | | | $ | 527,314 | | | $ | 12,376 | | | $ | 2,753,469 | |
| Stock-based compensation and related share issuances | 39,163 | | — | | | 7,916 | | | — | | | — | | | 7,916 | |
| Distributions to non-controlling interests | — | | — | | | — | | | — | | | (644) | | | (644) | |
| Net income | — | | — | | | — | | | 239,440 | | | 692 | | | 240,132 | |
| Dividends declared | — | | — | | | — | | | (100,232) | | | — | | | (100,232) | |
| Balance at December 31, 2023 | 65,631,760 | | $ | 656 | | | $ | 2,221,039 | | | $ | 666,522 | | | $ | 12,424 | | | $ | 2,900,641 | |
| Stock-based compensation and related share issuances | 59,391 | | 1 | | | 7,272 | | | — | | | — | | | 7,273 | |
| Distributions to non-controlling interests | — | | — | | | — | | | — | | | (631) | | | (631) | |
| Net income | — | | — | | | — | | | 332,023 | | | 456 | | | 332,479 | |
| Dividends declared | — | | — | | | — | | | (108,556) | | | — | | | (108,556) | |
| Balance at December 31, 2024 | 65,691,151 | | $ | 657 | | | $ | 2,228,311 | | | $ | 889,989 | | | $ | 12,249 | | | $ | 3,131,206 | |
The accompanying notes are an integral part of these consolidated financial statements.
ROYAL GOLD, INC.
Consolidated Statements of Cash Flows
(In thousands)
| | | | | | | | | | | | | | | | | |
| Years Ended |
| December 31,
2024 | | December 31,
2023 | | December 31,
2022 |
| Cash flows from operating activities: | | | | | |
| Net income and comprehensive income | $ | 332,479 | | | $ | 240,132 | | | $ | 239,942 | |
| Adjustments to reconcile net income and comprehensive income to net cash provided by operating activities: | | | | | |
| Depreciation, depletion and amortization | 144,426 | | | 164,937 | | | 178,935 | |
| Non-cash employee stock compensation expense | 11,892 | | | 9,696 | | | 8,411 | |
| Fair value changes in equity securities | 66 | | | 147 | | | 1,503 | |
| Deferred tax expense (benefit) | 8,354 | | | (6,469) | | | (19,836) | |
| Impairment of royalty interests | — | | | — | | | 4,287 | |
| Other | 945 | | | 779 | | | 979 | |
| Changes in assets and liabilities: | | | | | |
| Royalty receivables | (14,577) | | | 521 | | | 4,683 | |
| Stream inventory | (3,186) | | | 2,868 | | | (1,049) | |
| Income tax receivable | 1,537 | | | 390 | | | 1,849 | |
| Prepaid expenses and other assets | 11,168 | | | (4,369) | | | (3,908) | |
| Accounts payable | (9,113) | | | 4,756 | | | 211 | |
| Income tax payable | 7,620 | | | (508) | | | (3,005) | |
| Mount Milligan deferred liability | 25,000 | | | — | | | — | |
| Other liabilities | 12,892 | | | 2,912 | | | 4,343 | |
| Net cash provided by operating activities | $ | 529,503 | | | $ | 415,792 | | | $ | 417,345 | |
| | | | | |
| Cash flows from investing activities: | | | | | |
| Acquisition of stream and royalty interests | (102,564) | | | (2,678) | | | (922,155) | |
Proceeds from Khoemacau debt facility | 25,000 | | | — | | | — | |
| Other | (116) | | | (151) | | | (721) | |
| Net cash used in investing activities | $ | (77,680) | | | $ | (2,829) | | | $ | (922,876) | |
| | | | | |
| Cash flows from financing activities: | | | | | |
| Repayment of debt | (250,000) | | | (325,000) | | | (125,000) | |
| Borrowings from revolving credit facility | — | | | — | | | 700,000 | |
| Net payments from issuance of common stock | (4,620) | | | (1,383) | | | (1,447) | |
| Common stock dividends | (105,237) | | | (98,567) | | | (91,925) | |
| Other | (635) | | | (2,432) | | | (1,062) | |
| Net cash (used in) provided by financing activities | $ | (360,492) | | | $ | (427,382) | | | $ | 480,566 | |
| Net increase (decrease) in cash and equivalents | 91,331 | | | (14,419) | | | (24,965) | |
| Cash and equivalents at beginning of period | 104,167 | | | 118,586 | | | 143,551 | |
| Cash and equivalents at end of period | $ | 195,498 | | | $ | 104,167 | | | $ | 118,586 | |
_____________________________________________
See Note 12 for supplemental cash flow information.
The accompanying notes are an integral part of these consolidated financial statements.
ROYAL GOLD, INC.
NOTES TO CONSOLIDATED FINANCIAL STATEMENTS
1. THE COMPANY
Royal Gold, Inc. (“Royal Gold”, the “Company”, “we”, “us”, or “our”), together with its subsidiaries, is engaged in the business of acquiring and managing precious metals streams, royalties and similar interests. We seek to acquire existing stream and royalty interests or to finance projects that are in production or in the development (and exploration) stage in exchange for stream or royalty interests. A metal stream is a purchase agreement that provides, in exchange for an upfront deposit payment, the right to purchase all or a portion of one or more metals produced from a mine at a price determined for the life of the transaction by the purchase agreement. Royalties are non-operating interests in mining projects that provide the right to revenue or metals produced from the project after deducting specified costs, if any.
2. SUMMARY OF SIGNIFICANT ACCOUNTING POLICIES AND RECENTLY ADOPTED AND RECENTLY ISSUED ACCOUNTING PRONOUNCEMENTS
Summary of Significant Accounting Policies
Use of Estimates
The preparation of our financial statements in conformity with U.S. generally accepted accounting principles (“U.S. GAAP”) requires us to make estimates and assumptions that affect the reported amounts of assets and liabilities, and disclosure of contingent assets and liabilities at the dates of the financial statements, and the reported amounts of revenues and expenses during the reporting periods. Actual results could differ significantly from those estimates.
We rely on mineral reserve and mineral resource estimates reported by the operators of properties on which we hold stream and royalty interests. These estimates and the underlying assumptions affect the potential impairments of long-lived assets and the ability to realize income tax benefits associated with deferred tax assets. These estimates and assumptions also affect the rate at which we recognize revenue or charge depreciation, depletion and amortization to earnings. On an ongoing basis, management evaluates these estimates and assumptions; however, actual amounts could differ from these estimates and assumptions. Differences between estimates and actual amounts are adjusted and recorded in the period that the actual amounts are known.
Basis of Consolidation
The consolidated financial statements include the accounts of Royal Gold, Inc. and its majority owned or controlled subsidiaries. All intercompany accounts, transactions, income and expenses, and profits or losses have been eliminated on consolidation.
Cash and Equivalents
Cash and equivalents consist of all cash balances and highly liquid investments with an original maturity of three months or less. Cash and equivalents were primarily held in cash deposit accounts as of December 31, 2024 and 2023.
Stream and Royalty Interests in Mineral Properties and Related Depletion
Stream and royalty interests include acquired stream and royalty interests in production, development and exploration stage properties. The costs of acquired stream and royalty interests are capitalized as tangible assets as such interests do not meet the definition of a financial asset.
Production stage stream and royalty interests are depleted using the units of production method over the life of the mineral property (as stream sales occur or royalty payments are recognized), which are estimated using proven and probable reserves as provided by the operator. Development stage mineral properties, which are not yet in production, are not depleted until the property begins production. Exploration stage mineral properties, where there are no proven and probable reserves, are not depleted. At such time as the associated exploration stage mineral interests are converted to proven and probable reserves, and there is no production, the mineral property becomes a development stage mineral property. Exploration costs are expensed when incurred.
ROYAL GOLD, INC.
NOTES TO CONSOLIDATED FINANCIAL STATEMENTS (Continued)
Asset Impairment
We evaluate long-lived assets for impairment whenever events or changes in circumstances indicate that the related carrying amounts of an asset or group of assets may not be recoverable. When impairment indicators are identified, the recoverability of the carrying value of stream and royalty interests in production and development stage mineral properties is evaluated based upon estimated future undiscounted net cash flows from each stream and royalty interest using estimates of proven and probable mineral reserves, mineral resources and other relevant information received from the operators. We evaluate the recoverability of the carrying value of royalty interests in exploration stage mineral properties in the event of significant decreases in the price of gold, silver, copper and other metals, and whenever new information regarding the mineral properties is obtained from the operator indicating that production will not likely occur or may be reduced in the future, thus potentially affecting the future recoverability of our stream or royalty interests. Impairments in the carrying value of each property are measured and recorded to the extent that the carrying value in each property exceeds its estimated fair value, which is generally calculated using estimated future discounted cash flows.
Estimates of gold, silver, copper, and other metal prices, and operators’ estimates of proven and probable mineral reserves or mineral resources related to our stream or royalty properties are subject to certain risks and uncertainties which may affect the recoverability of our investment in these stream and royalty interests in mineral properties. It is possible that changes could occur to these estimates, which could adversely affect the net cash flows expected to be generated from these stream and royalty interests.
Revenue
A performance obligation is a promise in a contract to transfer control of a distinct good or service (or integrated package of goods and/or services) to a customer. A contract’s transaction price is allocated to each distinct performance obligation and recognized as revenue when, or as, a performance obligation is satisfied. In accordance with this guidance, revenue attributable to our stream interests and royalty interests is generally recognized at the point in time that control of the related metal production transfers to our customers. The amount of revenue we recognize further reflects the consideration to which we are entitled under the respective stream or royalty agreement. A more detailed summary of our revenue recognition policies for our stream and royalty interests is discussed in Note 8.
Metal Sales
Gold, silver and copper received under our metal stream agreements are taken into inventory, and then sold primarily using average spot rate gold, silver and copper forward contracts. The sales price for these average spot rate forward contracts is determined by the average daily gold, silver or copper spot prices during the term of the contract, typically a consecutive number of trading days between ten days and three months (typically depending on the frequency of deliveries under the respective stream agreement and our sales activity in effect at the time) commencing shortly after receipt and purchase of the metal. Revenue from gold, silver and copper sales is recognized on the date of the settlement, which is also the date that title to the metal passes to the purchaser.
Cost of Sales
Cost of sales, which excludes depreciation, depletion and amortization, is specific to our stream agreements and is the result of our purchase of gold, silver and copper for a cash payment. The cash payment for gold from Mount Milligan is the lesser of $435 per ounce or the prevailing market price of gold when purchased, while the cash payment for our other streams is a set contractual percentage of the gold, silver or copper spot price near the date of metal delivery.
Production Taxes
Certain royalty payments are subject to production taxes (or mining proceeds taxes), which are recognized at the time of revenue recognition. Production taxes are not income taxes and are included within the costs and expenses section in our consolidated statements of operations and comprehensive income.
ROYAL GOLD, INC.
NOTES TO CONSOLIDATED FINANCIAL STATEMENTS (Continued)
Stock-Based Compensation
We recognize all share-based payments to employees, including grants of employee stock options, stock-settled stock appreciation rights (“SSARs”), restricted stock and performance shares, in our financial statements based upon their fair values.
Income Taxes
Our annual tax rate is based on income, statutory tax rates in effect, and tax planning opportunities available to us in the various jurisdictions in which we operate. Significant judgment is required in determining the annual tax expense, current tax assets and liabilities, deferred tax assets and liabilities, and our future taxable income, both as a whole and in various tax jurisdictions, for purposes of assessing our ability to realize future benefit from our deferred tax assets. Actual income taxes could vary from these estimates due to future changes in income tax law, significant changes in the jurisdictions in which we operate or unpredicted results from the final determination of each year’s liability by taxing authorities.
We treat global intangible low-taxed income (“GILTI”) as a period cost and therefore do not record deferred tax impacts of GILTI in our consolidated financial statements. Our deferred income taxes reflect the impact of temporary differences between the reported amounts of assets and liabilities for financial reporting purposes and such amounts measured by tax laws and regulations. In evaluating the realizability of the deferred tax assets, management considers both positive and negative evidence that may exist, such as earnings history, reversal of taxable temporary differences, forecasted operating earnings and available tax planning strategies in each tax jurisdiction. A valuation allowance may be established to reduce our deferred tax assets to the amount that is considered more likely than not to be realized through the generation of future taxable income and other tax planning strategies.
Our operations may involve dealing with uncertainties and judgments in the application of complex tax regulations in multiple jurisdictions. The final taxes paid are dependent upon many factors, including negotiations with taxing authorities in various jurisdictions and resolution of disputes arising from federal, state, and international tax audits. We recognize potential liabilities and record tax liabilities for anticipated tax audit issues in the United States and other tax jurisdictions based on our estimate of whether, and the extent to which, additional taxes will be due. We adjust these reserves in light of changing facts and circumstances, such as the progress of a tax audit; however, due to the complexity of some of these uncertainties, the ultimate resolution could result in a payment that is materially different from our current estimate of the tax liabilities. These differences will be reflected as increases or decreases to income tax expense in the period which they are determined. We recognize interest and penalties, if any, related to unrecognized tax benefits in income tax expense.
Earnings per Share
Basic earnings per share is computed by dividing net income available to Royal Gold common stockholders by the weighted average number of outstanding common shares for the period, considering the effect of participating securities. Diluted earnings per share reflect the potential dilution that could occur if securities or other contracts that may require issuance of common shares were converted. Diluted earnings per share is computed by dividing net income available to common stockholders by the diluted weighted average number of common shares outstanding during each period.
Recent Accounting Pronouncements
In November 2024, the Financial Accounting Standards Board ("FASB") issued Accounting Standard Update ("ASU") No. 2024-03, Income Statement - Reporting Comprehensive Income - Expense Disaggregation Disclosures (Subtopic 220-40): Disaggregation of Income Statement Expenses. This ASU requires an entity to disclose the amounts of purchases of inventory, employee compensation, depreciation, and intangible asset amortization included in each relevant expense caption. It also requires an entity to include certain amounts that are already required to be disclosed under current GAAP in the same disclosure. Additionally, it requires an entity to disclose a qualitative description of the amounts remaining in relevant expense captions that are not separately disaggregated quantitatively, and to disclose the total amount of selling expenses and, in annual reporting periods, an entity’s definition of selling expenses. The amendments in the ASU are effective for annual reporting periods beginning after December 15, 2026 and interim reporting periods beginning after December 15, 2027, with early adoption permitted. We are currently evaluating the potential effect that the updated standard will have on our financial statement disclosures.
ROYAL GOLD, INC.
NOTES TO CONSOLIDATED FINANCIAL STATEMENTS (Continued)
In December 2023, the FASB issued ASU 2023-09 “Income Taxes (Topic 740): Improvements to Income Tax Disclosures” to expand the disclosure requirements for income taxes, specifically related to the rate reconciliation and income taxes paid. ASU 2023-09 is effective for our annual periods beginning January 1, 2025, with early adoption permitted. We will adopt this ASU prospectively for the period ending December 31, 2025, and it will only impact our disclosures with no impacts to our financial condition or results of operations.
In November 2023, the FASB issued ASU 2023-07 “Segment Reporting (Topic 280): Improvements to Reportable Segment Disclosures” which expands annual and interim disclosure requirements for reportable segments, primarily through enhanced disclosures about significant segment expenses. ASU 2023-07 is effective for our annual periods beginning January 1, 2024, and for interim periods beginning January 1, 2025, with early adoption permitted. The adoption of this ASU only affects our disclosures and has no impacts to our financial condition or results from operations.
3. ACQUISITIONS
Acquisition of Cactus Project Royalty
On December 31, 2024, RG Royalties, LLC, a wholly-owned subsidiary of Royal Gold, acquired two royalties for cash consideration of $55 million that constitute an aggregate 2.5% net smelter return ("NSR") royalty (the “Cactus Royalty”) on the Cactus Project from a private seller. The Cactus Project is being developed by Arizona Sonoran Copper Company Inc. (“ASCU”), and is located in Arizona. The Cactus Royalty covers the Cactus East and Cactus West deposits as well as portions of the Parks/Salyer deposit and is subject to a right in favor of ASCU, until July 10, 2025, to buy back 0.5% of the aggregate 2.5% royalty for $7 million.
The Cactus Royalty acquisition has been accounted for as an asset acquisition. The $55 million cash consideration, plus direct acquisition costs, have been recorded as a development stage royalty interest within Stream and royalty interests, net on our consolidated balance sheets. The purchase price was funded with available cash on hand.
Acquisition of Back River Royalties
On June 26, 2024, International Royalty Corporation, a wholly-owned subsidiary of Royal Gold, acquired a 0.7% NSR royalty (the "Hill Royalty") that declines by 50% after $5 million Canadian dollars in royalty revenue is received, and a 26.25% interest in a 5% gross smelter return royalty (the "KM Royalty") that is payable after approximately 780,000 ounces have been produced on the Back River Gold Project ("Back River") for aggregate cash consideration of $51 million. Payments for the Hill Royalty are deductible from the KM Royalty. Back River is operated by B2Gold Corporation and is located in Western Nunavut, Canada.
The Back River royalties have been accounted for as an asset acquisition and the $51 million cash consideration, plus direct transaction costs, have been allocated to development ($42 million) and exploration ($9 million) stage royalty interests within Stream and royalty interests, net on our consolidated balance sheets. The purchase price was funded with available cash on hand.
ROYAL GOLD, INC.
NOTES TO CONSOLIDATED FINANCIAL STATEMENTS (Continued)
4. STREAM AND ROYALTY INTERESTS, NET
The following summarizes our stream and royalty interests as of December 31, 2024 and 2023:
| | | | | | | | | | | | | | | | | | | | | | | | | |
| As of December 31, 2024 (Amounts in thousands): | | Cost | | Accumulated Depletion | | Net | | | | | |
| Production stage stream interests: | | | | | | | | | | | |
| Mount Milligan | | $ | 790,635 | | | $ | (462,412) | | | $ | 328,223 | | | | | | |
| Pueblo Viejo | | 610,404 | | | (308,283) | | | 302,121 | | | | | | |
| Andacollo | | 388,182 | | | (177,059) | | | 211,123 | | | | | | |
Khoemacau | | 265,911 | | | (58,043) | | | 207,868 | | | | | | |
| Rainy River | | 175,727 | | | (86,307) | | | 89,420 | | | | | | |
| Other | | 241,830 | | | (154,245) | | | 87,585 | | | | | | |
| Total production stage stream interests | | 2,472,689 | | | (1,246,349) | | | 1,226,340 | | | | | | |
| | | | | | | | | | | |
| Production stage royalty interests: | | | | | | | | | | | |
| Cortez (Legacy Zone and CC Zone) | | 353,850 | | | (81,845) | | | 272,005 | | | | | | |
| Voisey's Bay | | 205,724 | | | (124,526) | | | 81,198 | | | | | | |
| Red Chris | | 116,187 | | | (5,966) | | | 110,221 | | | | | | |
| Peñasquito | | 99,172 | | | (65,372) | | | 33,800 | | | | | | |
| Other | | 519,491 | | | (418,648) | | | 100,843 | | | | | | |
| Total production stage royalty interests | | 1,294,424 | | | (696,357) | | | 598,067 | | | | | | |
| Total production stage stream and royalty interests | | 3,767,113 | | | (1,942,706) | | | 1,824,407 | | | | | | |
| | | | | | | | | | | |
| Development stage stream interests: | | | | | | | | | | | |
| Ilovica | | 12,038 | | | — | | | 12,038 | | | | | | |
| Development stage royalty interests: | | | | | | | | | | | |
| Cactus | | 55,128 | | | — | | | 55,128 | | | | | | |
| Back River | | 42,948 | | | — | | | 42,948 | | | | | | |
| La Fortuna | | 35,140 | | | — | | | 35,140 | | | | | | |
| Other | | 21,133 | | | — | | | 21,133 | | | | | | |
| Total development stage stream and royalty interests | | 166,387 | | | — | | | 166,387 | | | | | | |
| | | | | | | | | | | |
| Exploration stage stream interests: | | | | | | | | | | | |
| Xavantina | | 14,792 | | | — | | | 14,792 | | | | | | |
| Exploration stage royalty interests: | | | | | | | | | | | |
| Cortez (Legacy Zone and CC Zone) | | 456,479 | | | — | | | 456,479 | | | | | | |
| Great Bear | | 209,106 | | | — | | | 209,106 | | | | | | |
| Pascua-Lama | | 177,690 | | | — | | | 177,690 | | | | | | |
| Red Chris | | 48,895 | | | — | | | 48,895 | | | | | | |
| Côté | | 29,610 | | | — | | | 29,610 | | | | | | |
| Other | | 115,438 | | | — | | | 115,438 | | | | | | |
| Total exploration stage stream and royalty interests | | 1,052,010 | | | — | | | 1,052,010 | | | | | | |
| Total stream and royalty interests, net | | $ | 4,985,510 | | | $ | (1,942,706) | | | $ | 3,042,804 | | | | | | |
ROYAL GOLD, INC.
NOTES TO CONSOLIDATED FINANCIAL STATEMENTS (Continued)
| | | | | | | | | | | | | | | | | | | | | | |
| As of December 31, 2023 (Amounts in thousands): | | Cost | | Accumulated Depletion | | | | Net |
| Production stage stream interests: | | | | | | | | |
| Mount Milligan | | $ | 790,635 | | | $ | (430,106) | | | | | $ | 360,529 | |
| Pueblo Viejo | | 610,404 | | | (299,354) | | | | | 311,050 | |
| Andacollo | | 388,182 | | | (165,553) | | | | | 222,629 | |
Khoemacau | | 265,911 | | | (41,635) | | | | | 224,276 | |
| Rainy River | | 175,727 | | | (74,858) | | | | | 100,869 | |
| Other | | 232,703 | | | (132,043) | | | | | 100,660 | |
| Total production stage stream interests | | 2,463,562 | | | (1,143,549) | | | | | 1,320,013 | |
| | | | | | | | |
| Production stage royalty interests: | | | | | | | | |
| Cortez (Legacy Zone and CC Zone) | | 353,850 | | | (61,891) | | | | | 291,959 | |
| Voisey's Bay | | 205,724 | | | (121,000) | | | | | 84,724 | |
| Red Chris | | 116,187 | | | (3,758) | | | | | 112,429 | |
| Peñasquito | | 99,172 | | | (59,900) | | | | | 39,272 | |
| Other | | 448,899 | | | (408,522) | | | | | 40,377 | |
| Total production stage royalty interests | | 1,223,832 | | | (655,071) | | | | | 568,761 | |
| Total production stage stream and royalty interests | | 3,687,394 | | | (1,798,620) | | | | | 1,888,774 | |
| | | | | | | | |
| Development stage stream interests: | | | | | | | | |
| Ilovica | | 12,038 | | | — | | | | | 12,038 | |
| Development stage royalty interests: | | | | | | | | |
| Côté | | 45,421 | | | — | | | | | 45,421 | |
| La Fortuna | | 35,140 | | | — | | | | | 35,140 | |
| Other | | 45,992 | | | — | | | | | 45,992 | |
| Total development stage stream and royalty interests | | 138,591 | | | — | | | | | 138,591 | |
| | | | | | | | |
| Exploration stage stream interests: | | | | | | | | |
| Xavantina | | 19,565 | | | — | | | | | 19,565 | |
| Exploration stage royalty interests: | | | | | | | | |
| Cortez (Legacy Zone and CC Zone) | | 456,479 | | | — | | | | | 456,479 | |
| Great Bear | | 209,106 | | | — | | | | | 209,106�� | |
| Pascua-Lama | | 177,690 | | | — | | | | | 177,690 | |
| Red Chris | | 48,895 | | | — | | | | | 48,895 | |
| Côté | | 29,610 | | | — | | | | | 29,610 | |
| Other | | 106,864 | | | — | | | | | 106,864 | |
| Total exploration stage stream and royalty interests | | 1,048,209 | | | — | | | | | 1,048,209 | |
| Total stream and royalty interests, net | | $ | 4,874,194 | | | $ | (1,798,620) | | | | | $ | 3,075,574 | |
ROYAL GOLD, INC.
NOTES TO CONSOLIDATED FINANCIAL STATEMENTS (Continued)
5. DEBT
The Company’s debt for the years ended December 31, 2024 and 2023, consists of the following (amounts in thousands):
| | | | | | | | | | | | | | | | | | | | | | | | | | | | | | | | | | | |
| As of December 31, 2024 | | As of December 31, 2023 |
| Principal | | Debt Issuance Costs (1) | | Total | | Principal | | Debt Issuance Costs | | Total |
| | | |
| Revolving credit facility | $ | — | | | $ | — | | | $ | — | | | $ | 250,000 | | | $ | (4,033) | | | $ | 245,967 | |
| Total debt | $ | — | | | $ | — | | | $ | — | | | $ | 250,000 | | | $ | (4,033) | | | $ | 245,967 | |
_______________________________________________
(1)Debt issuance costs of $3.1 million are included within Other assets on our consolidated balance sheets.
Revolving Credit Facility
During the year ended December 31, 2024, we repaid the remaining $250 million of outstanding borrowings on our revolving credit facility, making the entire $1 billion revolving credit facility available as of December 31, 2024.
On June 28, 2023, we entered into a fifth amendment to our revolving credit facility dated as of June 2, 2017, as amended. The fifth amendment extended the scheduled maturity date from July 7, 2026 to June 28, 2028, replaced LIBOR with Secured Overnight Financing Rate (Term SOFR”) as a benchmark interest rate and made certain other administrative changes to the existing revolving credit facility.
Interest expense recognized on the revolving credit facility for the years ended December 31, 2024, 2023, and 2022 was approximately $6.3 million, $28.4 million, and $10.0 million, respectively, and included interest on the outstanding borrowings and the amortization of the debt issuance costs. We were in compliance with each financial covenant (leverage ratio and interest coverage ratio) under the revolving credit facility as of December 31, 2024.
We may repay any borrowings under our revolving credit facility at any time without premium or penalty.
6. LEASES
Our significant lease arrangements relate to our office spaces. These arrangements are for leases of assets such as corporate office space and office equipment. We lease office space and office equipment under operating leases expiring at various dates through the year ending December 31, 2030. The following amounts were recorded in the consolidated balance sheets at December 31, 2024 (amounts in thousands):
| | | | | | | | | | | |
| Classification | | December 31, 2024 |
| Operating Leases | | | |
| Right-of-use assets - current | Prepaid expenses and other | | $ | 855 | |
| Right-of-use assets - non-current | Other assets | | 3,463 | |
| Total right-of-use assets | | | $ | 4,318 | |
| | | |
| Lease liabilities - current | Other current liabilities | | $ | 965 | |
| Lease liabilities - non-current | Other long-term liabilities | | 4,003 | |
| Total operating lease liabilities | | | $ | 4,968 | |
ROYAL GOLD, INC.
NOTES TO CONSOLIDATED FINANCIAL STATEMENTS (Continued)
Maturities of operating lease liabilities at December 31, 2024 were as follows (amounts in thousands):
| | | | | |
| Fiscal Years: | Operating Leases |
| 2025 | $ | 1,086 | |
| 2026 | 1,086 | |
| 2027 | 1,086 | |
| 2028 | 867 | |
| 2029 | 824 | |
| Thereafter | 371 | |
| Total lease payments | $ | 5,320 | |
| Less imputed interest | (352) | |
| Total | $ | 4,968 | |
Other information pertaining to leases consists of the following:
| | | | | |
| December 31, 2024 |
| Operating Lease Term and Discount Rate | |
| Weighted average remaining lease term in years | 5.1 |
| Weighted average discount rate | 2.7 | % |
We did not have any finance leases as of December 31, 2024.
7. MOUNT MILLIGAN DEFERRED LIABILITY
On February 13, 2024, RGLD Gold AG, a subsidiary of the Company, entered into a Processing Cost Support Agreement (the "Mount Milligan Cost Support Agreement") with Centerra Gold Inc. ("Centerra") with respect to the Mount Milligan Mine ("Mount Milligan") for cash consideration of $24.5 million, 50,000 ounces ("Deferred Gold Consideration") of gold to be delivered in the future and a free cash flow interest. The cost support allowed for the extension of the mine from 2032 to 2035 and the potential to extend the mine life beyond 2035.
The value of the cash consideration and free cash flow interest received from Centerra is recorded as a deferred liability in our consolidated balance sheets as of December 31, 2024. This amount will be amortized as we provide future cost support to Centerra under the Mount Milligan Cost Support Agreement on a units of production basis over the Mount Milligan mine life beginning with the first cost support payment made after the First Threshold (defined below) is met.
The key features of the Mount Milligan Cost Support Agreement are discussed below.
Deferred Gold Consideration
The Deferred Gold Consideration will be delivered in equal installments of 2,500 ounces for a period of 20 quarters commencing on the earlier of June 30, 2030, or the delivery of 375,000 ounces of gold or 30,000 tonnes of copper from metal deliveries referenced by the Mount Milligan Cost Support Agreement with a bill of lading date on or after January 1, 2024. As part of the Deferred Gold Consideration, we are entitled to receive three tranches of 11,111 ounces each (the "Greenstone Deliveries"), with the last delivery expected before year end 2027. Each of the Greenstone Deliveries received shall reduce the number of ounces in any remaining Deferred Gold Consideration delivery on a pro-rata basis. The Deferred Gold Consideration deliveries require no cash payment from the Company, and will be made irrespective of the operating status of Mount Milligan as long as we comply with the terms of the Mount Milligan Cost Support Agreement and existing stream agreement. Each of the Greenstone Deliveries will be delivered to Royal Gold within 30 days of such delivery to Centerra.
ROYAL GOLD, INC.
NOTES TO CONSOLIDATED FINANCIAL STATEMENTS (Continued)
When the Deferred Gold Consideration is received and subsequently sold, we anticipate the value of the gold ounces sold will be recorded as a deferred liability and amortized on a units of production basis over the mine life of Mount Milligan as we provide future cost support.
Cost Support
Metal deliveries referenced in the Mount Milligan Cost Support Agreement are those with a bill of lading date on or after January 1, 2024 (the "Reference Date"). Delivery thresholds used to define the periods of cost support are the earlier deliveries of:
a.375,000 ounces of gold or 30,000 tonnes of copper from the Reference Date (the “First Threshold”).
b.665,000 ounces of gold or 60,000 tonnes of copper from the Reference Date (the “Second Threshold”).
Near-Term Cost Support Through Approximately 2029
At Centerra’s request, in the event that both the gold price is at or below $1,600 per ounce and the copper price is at or below $3.50 per pound, for each delivery under the existing Mount Milligan stream agreement, we will pay the lower of either $415 per ounce of gold, or 66% of the spot gold price less $435 per ounce, and 35% of the spot copper price for each pound of copper delivered (the “Pre-Threshold Support”). This near-term cost support will be made available from the Reference Date through to the First Threshold, which is expected to be through approximately 2029.
Any Pre-Threshold Support we provide will be recoverable from any cost support calculated after the First Threshold at metal prices above $1,600 per ounce of gold and $3.50 per pound of copper. For gold, any cost support payment will be reduced by the difference between the gold price and $1,600 per ounce. For copper, any cost support payment will be reduced by the difference between the copper price and $3.50 per pound.
Cost Support from Approximately 2030 Through Approximately 2035
We will provide Centerra cost support payments from the First Threshold until the Second Threshold as follows:
a.With respect to gold, the lower of either $415 per ounce, or 50% of the spot gold price less $435 per ounce, for each ounce of gold delivered under the existing Mount Milligan stream agreement.
b.With respect to copper, 35% of the spot copper price for each pound of copper delivered under the existing Mount Milligan stream agreement.
Cost Support After Approximately 2036
We will provide Centerra cost support payments after the Second Threshold as follows:
a.With respect to gold, the lower of either $615 per ounce, or 66% of the spot gold price less $435 per ounce, for each ounce of gold delivered under the existing Mount Milligan stream agreement.
b.With respect to copper, 51% of the spot copper price, for each pound of copper delivered.
Suspension of Cost Support
Our obligation to make long-term cost support payments will be suspended if (and for so long as) Centerra discloses reserve tonnage which, when combined with mining depletion from the Reference Date to the date of such disclosure, is less than the current reserves expected to be processed through to 2035. Suspension of cost support payments will not impact the Deferred Gold Consideration and free cash flow interest, and the cash consideration is not refundable as long as we comply with the terms of the Mount Milligan Cost Support Agreement and the existing stream agreement.
Nothing in the Mount Milligan Cost Support Agreement modifies the existing stream agreement, including the payment of $435 for each gold ounce delivered and 15% of the spot price for each pound of copper delivered.
ROYAL GOLD, INC.
NOTES TO CONSOLIDATED FINANCIAL STATEMENTS (Continued)
8. REVENUE
Revenue Recognition
A performance obligation is a promise in a contract to transfer control of a distinct good or service (or integrated package of goods and/or services) to a customer. A contract’s transaction price is allocated to each distinct performance obligation and recognized as revenue when, or as, a performance obligation is satisfied. In accordance with this guidance, revenue attributable to our stream interests and royalty interests is generally recognized at the point in time that control of the related metal production transfers to our customers. The amount of revenue we recognize further reflects the consideration to which we are entitled under the respective stream or royalty agreement. A more detailed summary of our revenue recognition policies for our stream and royalty interests is discussed below.
Stream Interests
A metal stream is a purchase agreement that provides, in exchange for an upfront deposit payment, the right to purchase all or a portion of one or more of the metals produced from a mine, at a price determined for the life of the transaction by the purchase agreement. Gold, silver and copper received under our metal stream agreements are taken into inventory, and then sold primarily using average spot rate gold, silver and copper forward contracts. The sales price for these average spot rate forward contracts is determined by the average daily gold, silver or copper spot prices during the term of the contract, typically a consecutive number of trading days between ten days and three months (typically depending on the frequency of deliveries under the respective stream agreement and our sales policy in effect at the time) commencing shortly after receipt and purchase of the metal. We settle our forward sales contracts via physical delivery of the metal to the purchaser (our customer) on the settlement date specified in the contract. Under our forward sales contracts, there is a single performance obligation to sell a contractually specified volume of metal to the purchaser, and we satisfy this obligation at the point in time of physical delivery. Accordingly, revenue from our metal sales is recognized on the date of settlement, which is the date that control, custody and title to the metal transfer to the purchaser.
Royalty Interests
Royalties are non-operating interests in mining projects that provide the right to a percentage of revenue or metals produced from the project after deducting specified costs, if any. We are entitled to payment for our royalty interest in a mining project based on a contractually specified commodity price (for example, a monthly or quarterly average spot price) for the period in which metal production occurred. As a royalty holder, we act as a passive entity in the production and operations of the mining project, and the third-party operator of the mining project is responsible for all mining activities, including subsequent marketing and delivery of all metal production to their ultimate customer. In all of our most significant royalty interest arrangements, we have concluded that we transfer control of our interest in the metal production to the operator at the point at which production occurs, and thus, the operator is our customer. We have further determined that the transfer of each unit of metal production, comprising our royalty interest, to the operator represents a separate performance obligation under the contract, and each performance obligation is satisfied at the point in time of metal production by the operator. Accordingly, we recognize revenue attributable to our royalty interests in the period in which metal production occurs at the specified commodity price per the agreement, net of any contractually allowable offsite treatment, refining, transportation and, if applicable, other contractually permitted costs.
Royalty Revenue Estimates
For a small number of our royalty interests, we may not receive, or be entitled to receive, payment information, including production information from the operator, for the period in which metal production occurred prior to issuance of our financial statements. As a result, we may estimate revenue for these royalties based on available information, including public information, from the operator. If adequate information is not available from the operator or from other public sources before we issue our financial statements, we will recognize royalty revenue during the period in which the necessary payment information is received. Differences between estimates and actual amounts could differ significantly and are recorded in the period that the actual amounts are known. Please also refer to our “Use of Estimates” accounting policy discussed in Note 2. Royalty revenue and the attributable metal production that was estimated for the period was not material.
ROYAL GOLD, INC.
NOTES TO CONSOLIDATED FINANCIAL STATEMENTS (Continued)
Disaggregation of Revenue
We have identified two material revenue sources in our business: stream interests and royalty interests. These identified revenue sources are consistent with our reportable segments as discussed in Note 15.
Revenue by metal type attributable to each of our revenue sources is disaggregated as follows (amounts in thousands):
| | | | | | | | | | | | | | | | | |
| Years Ended |
| December 31,
2024 | | December 31,
2023 | | December 31,
2022 |
| Stream revenue: | | | | | |
| Gold | $ | 367,492 | | | $ | 307,797 | | | $ | 308,302 | |
| Silver | 66,812 | | | 64,851 | | | 50,591 | |
| Copper | 48,990 | | | 45,632 | | | 58,900 | |
| Total stream revenue | $ | 483,294 | | | $ | 418,280 | | | $ | 417,793 | |
| Royalty revenue: | | | | | |
| Gold | 176,888 | | | $ | 154,327 | | | $ | 131,014 | |
| Silver | 18,702 | | | 8,554 | | | 13,690 | |
| Copper | 17,776 | | | 11,792 | | | 15,019 | |
| Other | 22,735 | | | 12,764 | | | 25,690 | |
| Total royalty revenue | $ | 236,101 | | | $ | 187,437 | | | $ | 185,413 | |
| Total revenue | $ | 719,395 | | | $ | 605,717 | | | $ | 603,206 | |
Revenue by metal type attributable to each of our principal property revenue sources is disaggregated as follows (amounts in thousands):
| | | | | | | | | | | | | | | | | | | | | | | |
| | | Years Ended |
| Metal(s) | | December 31,
2024 | | December 31,
2023 | | December 31,
2022 |
| Stream revenue: | | | | | | | |
| Mount Milligan | Gold & Copper | | $ | 186,039 | | | $ | 158,167 | | | $ | 180,543 | |
| Pueblo Viejo | Gold & Silver | | 83,059 | | | 76,247 | | | 85,863 | |
| Andacollo | Gold | | 47,531 | | | 48,920 | | | 47,347 | |
| Other | Gold & Silver | | 166,665 | | | 134,946 | | | 104,040 | |
| Total stream revenue | | | $ | 483,294 | | | $ | 418,280 | | | $ | 417,793 | |
| Royalty revenue: | | | | | | | |
| Cortez Legacy Zone | Gold | | $ | 58,183 | | | $ | 79,920 | | | $ | 47,769 | |
| Cortez CC Zone | Gold | | 11,611 | | | 14,626 | | | 2,790 | |
| Other | Various | | 166,307 | | | 92,891 | | | 134,854 | |
| Total royalty revenue | | | $ | 236,101 | | | $ | 187,437 | | | $ | 185,413 | |
| Total revenue | | | $ | 719,395 | | | $ | 605,717 | | | $ | 603,206 | |
Refer to Note 15 for the geographical distribution of our revenue by reportable segment.
9. STOCK-BASED COMPENSATION
In November 2015, our stockholders approved the 2015 Omnibus Long-Term Incentive Plan (“2015 LTIP”). Under the 2015 LTIP, 2,500,000 shares of common stock have been authorized for future grants to officers, directors, key employees and other persons. The 2015 LTIP provides for the grant of stock options, unrestricted stock, restricted stock, dividend
ROYAL GOLD, INC.
NOTES TO CONSOLIDATED FINANCIAL STATEMENTS (Continued)
equivalent rights, SSARs and cash awards. Any of these awards may, but need not, be made as performance incentives. Stock options granted under the 2015 LTIP may be non-qualified stock options or incentive stock options.
We recognized stock-based compensation expense as follows (amounts in thousands):
| | | | | | | | | | | | | | | | | |
| Years Ended |
| December 31,
2024 | | December 31,
2023 | | December 31,
2022 |
| Restricted stock | $ | 7,049 | | | $ | 6,191 | | | $ | 4,515 | |
| Performance stock | 4,843 | | | 2,953 | | | 2,685 | |
| Stock appreciation rights | — | | | 533 | | | 1,179 | |
| Stock options | — | | | 19 | | | 32 | |
| Total stock-based compensation expense | $ | 11,892 | | | $ | 9,696 | | | $ | 8,411 | |
Stock-based compensation expense is included within General and administrative expense on the consolidated statements of operations and comprehensive income.
Stock Options and Stock Appreciation Rights
Stock option and SSARs awards are granted with an exercise price equal to the closing market price of our stock at the date of grant. Stock option and SSARs awards granted to officers, key employees and other persons vest based on one to three years of continuous service. Stock option and SSARs awards have 10-year contractual terms. There were no stock options or SSARs awards granted during the years ended December 31, 2024, 2023, and 2022.
Stock Options
A summary of stock option activity for the year ended December 31, 2024, is presented below.
| | | | | | | | | | | | | | | | | | | | | | | |
| Number of
Shares | | Weighted-
Average
Exercise
Price | | Weighted-
Average
Remaining
Contractual
Life (Years) | | Aggregate
Intrinsic Value
(in thousands) |
| Outstanding at January 1, 2024 | 11,344 | | $ | 86.80 | | | | | |
| Exercised | (3,283) | | $ | 79.36 | | | | | |
| Forfeited | — | | $ | — | | | | | |
| Granted | — | | $ | — | | | | | |
| Outstanding at December 31, 2024 | 8,061 | | $ | 89.83 | | | 2.8 | | $ | 350 | |
| Exercisable at December 31, 2024 | 8,061 | | $ | 89.83 | | | 2.8 | | $ | 350 | |
The total intrinsic value of options exercised during the years ended December 31, 2024, and 2023, and 2022 was $0.2 million, $0.5 million and $0.2 million, respectively.
As of December 31, 2024, there was no unrecognized stock-based compensation expense related to unvested stock options.
ROYAL GOLD, INC.
NOTES TO CONSOLIDATED FINANCIAL STATEMENTS (Continued)
SSARs
A summary of SSARs activity for the year ended December 31, 2024, is presented below:
| | | | | | | | | | | | | | | | | | | | | | | |
| Number of
Shares | | Weighted-
Average
Exercise
Price | | Weighted-
Average
Remaining
Contractual
Life (Years) | | Aggregate
Intrinsic Value
(in thousands) |
| Outstanding at January 1, 2024 | 157,279 | | $ | 113.03 | | | | | |
| Exercised | (28,893) | | $ | 86.21 | | | | | |
| Forfeited | — | | $ | — | | | | | |
| Granted | — | | $ | — | | | | | |
| Outstanding at December 31, 2024 | 128,386 | | $ | 119.06 | | | 4.6 | | $ | 2,083 | |
| Exercisable at December 31, 2024 | 128,386 | | $ | 119.06 | | | 4.6 | | $ | 2,083 | |
The total intrinsic value of SSARs exercised during the years ended December 31, 2024, 2023 and 2022 was $1.4 million, $0.7 million and $0.2 million, respectively.
As of December 31, 2024, there was no unrecognized stock-based compensation expense related to unvested SSARs.
Other Stock-based Compensation
Performance Shares
During the years ended December 31, 2024, 2023 and 2022, officers and certain employees were granted shares of restricted common stock that may vest based on our total shareholder return (“TSR”) compared to the TSRs of certain defined peer companies. The Granted TSRs may vest by linear interpolation in a range between zero shares if neither threshold TSR metric is met; to 100% of the Granted TSRs awarded if the target TSR metric is met; to 200% of Granted TSRs awarded if the maximum TSR metric is met. The Granted TSRs will expire in three years from the date of grant if the TSR market condition and a three-year service condition are not met.
During the fiscal year ended June 30, 2021, officers and certain employees were granted shares of restricted common stock that can only be earned upon the achievement of certain pre-defined performance measures. Specifically, for performance shares granted during the fiscal year ended June 30, 2021, one-half of the shares awarded may vest upon our achievement of annual growth in Net Gold Equivalent Ounces (“Net GEOs”) (“GEO Shares”). The second half of performance shares granted during the fiscal year ended June 30, 2021 may vest based on our TSR compared to the TSRs of all members of the VanEck Gold Miners ETF (“Prior TSR Shares”). GEO Shares and Prior TSR Shares may vest by linear interpolation in a range between zero shares if neither threshold Net GEO and TSR metric is met; to 100% of GEO Shares and Prior TSR Shares awarded if both target Net GEO and TSR metrics are met; to 200% of the Net GEO and Prior TSR Shares awarded if both the maximum Net GEO and TSR metrics are met. The GEO Shares will expire in five years from the date of grant if the performance measure is not met, while the Prior TSR Shares will expire in three years from the date of grant if the TSR market condition and three-year service condition are not met.
We measured the grant date fair value of the Granted TSRs and Prior TSR Shares using a Monte Carlo valuation model. The fair value of our TSR awards is multiplied by the target number (100%) of TSR awards granted to determine total stock-based compensation expense. Total stock-based compensation expense of the TSR awards is amortized on a straight-line basis over the requisite service period, or three years.
We measured the fair value of the GEO Shares based upon the market price of our common stock as of the date of grant. The measurement date for the GEO Shares will be determined at such time that the performance goals are attained or that it is probable they will be attained. GEO Shares granted in August 2020 remain outstanding as of December 31, 2024 and the Company will continue to measure these awards for vesting until each awards expiration or performance attainment, whichever date is first.
ROYAL GOLD, INC.
NOTES TO CONSOLIDATED FINANCIAL STATEMENTS (Continued)
A summary of the status of our unvested Performance Shares at maximum (200%) attainment for the year ended December 31, 2024, is presented below:
| | | | | | | | | | | |
| Number of
Shares | | Weighted-
Average
Grant Date
Fair Value |
| Outstanding at January 1, 2024 | 216,191 | | $ | 135.11 | |
| Granted | 93,840 | | $ | 99.75 | |
| Exercised | (30,290) | | $ | 123.35 | |
| Non-attainment | (56,303) | | $ | 124.69 | |
| Forfeited | (1,980) | | $ | 148.89 | |
| Outstanding at December 31, 2024 | 221,458 | | $ | 124.26 | |
As of December 31, 2024, total unrecognized stock-based compensation expense related to Performance Shares was approximately $5.2 million, which is expected to be recognized over the average remaining vesting period of 1.7 years.
Restricted Stock
Officers, non-executive directors and certain employees may be granted shares of restricted stock that vest on continued service alone (“Restricted Stock”). During the year ended December 31, 2024, officers and certain employees were granted 57,330 shares of Restricted Stock. Restricted Stock granted to officers and certain employees during the years ended December 31, 2024, 2023 and 2022, vest ratably over three years from the date of grant. Also, our non-executive directors were granted 8,520 shares of Restricted Stock during the year ended December 31, 2024. The non-executive directors’ shares of Restricted Stock vest 50% immediately and 50% one year after the date of grant.
We measure the fair value of the Restricted Stock based upon the market price of our common stock as of the date of grant. Restricted Stock is amortized over the applicable vesting period using the straight-line method. Unvested shares of Restricted Stock are subject to forfeiture upon termination of employment or service.
A summary of the status of our unvested Restricted Stock for the year ended December 31, 2024, is presented below:
| | | | | | | | | | | |
| Number of
Shares | | Weighted-
Average
Grant Date
Fair Value |
| Outstanding at January 1, 2024 | 136,113 | | $ | 118.84 | |
| Granted | 65,850 | | $ | 105.65 | |
| Vested | (51,110) | | $ | 121.05 | |
| Forfeited | (4,907) | | $ | 118.53 | |
| Outstanding at December 31, 2024 | 145,946 | | $ | 112.13 | |
As of December 31, 2024, total unrecognized stock-based compensation expense related to Restricted Stock was approximately $6.6 million, which is expected to be recognized over the weighted-average vesting period of 1.7 years.
10. EARNINGS PER SHARE (“EPS”)
Basic earnings per common share were computed using the weighted average number of shares of common stock outstanding during the period, considering the effect of participating securities. Unvested stock-based compensation awards that contain non-forfeitable rights to dividends or dividend equivalents are considered participating securities and are included in the computation of earnings per share pursuant to the two-class method. Our unvested restricted stock awards contain non-forfeitable dividend rights and participate equally with common stock with respect to dividends issued or declared. Our unexercised stock options, unexercised SSARs and unvested performance stock do not contain rights to dividends. Under the two-class method, the earnings used to determine basic earnings per common share are reduced by an
ROYAL GOLD, INC.
NOTES TO CONSOLIDATED FINANCIAL STATEMENTS (Continued)
amount allocated to participating securities. Use of the two-class method has an immaterial impact on the calculation of basic and diluted earnings per common share.
The following table summarizes the effects of dilutive securities on diluted EPS for the period (amounts in thousands, except share data):
| | | | | | | | | | | | | | | | | |
| Years Ended |
| December 31,
2024 | | December 31,
2023 | | December 31,
2022 |
| Net income attributable to Royal Gold common stockholders | $ | 332,023 | | | $ | 239,440 | | | $ | 238,982 | |
| Weighted-average shares for basic EPS | 65,662,185 | | 65,613,002 | | 65,576,995 |
| Effect of other dilutive securities | 114,649 | | 126,108 | | 84,753 |
| Weighted-average shares for diluted EPS | 65,776,834 | | 65,739,110 | | 65,661,748 |
| Basic EPS | $ | 5.04 | | | $ | 3.64 | | | $ | 3.64 | |
| Diluted EPS | $ | 5.04 | | | $ | 3.63 | | | $ | 3.63 | |
11. INCOME TAXES
For financial reporting purposes, Income before income taxes includes the following components (amounts in thousands):
| | | | | | | | | | | | | | | | | |
| Years Ended |
| December 31,
2024 | | December 31,
2023 | | December 31,
2022 |
| United States | $ | 127,366 | | | $ | 64,105 | | | $ | 86,321 | |
| Foreign | 298,726 | | | 218,035 | | | 186,547 | |
| $ | 426,092 | | | $ | 282,140 | | | $ | 272,868 | |
Our Income tax expense consisted of (amounts in thousands):
| | | | | | | | | | | | | | | | | |
| Years Ended |
| December 31,
2024 | | December 31,
2023 | | December 31,
2022 |
| Current: | | | | | |
| Federal | $ | 51,643 | | | $ | 24,046 | | | $ | 29,228 | |
| State | 715 | | | (68) | | | 467 | |
| Foreign | 32,901 | | | 24,499 | | | 23,067 | |
| $ | 85,259 | | | $ | 48,477 | | | $ | 52,762 | |
| Deferred and others: | | | | | |
| Federal | $ | (92) | | | $ | (763) | | | $ | (957) | |
| State | (2) | | | (14) | | | (18) | |
| Foreign | 8,448 | | | (5,692) | | | (18,861) | |
| $ | 8,354 | | | $ | (6,469) | | | $ | (19,836) | |
| Total income tax expense | $ | 93,613 | | | $ | 42,008 | | | $ | 32,926 | |
The provision for income taxes for the years ended December 31, 2024, 2023, and 2022 differs from the amount of income tax determined by applying the applicable United States statutory federal income tax rate to pre-tax income (net of non-
ROYAL GOLD, INC.
NOTES TO CONSOLIDATED FINANCIAL STATEMENTS (Continued)
controlling interest in income of consolidated subsidiary and loss from equity investment) from operations as a result of the following differences (amounts in thousands):
| | | | | | | | | | | | | | | | | |
| Years Ended |
| December 31,
2024 | | December 31,
2023 | | December 31,
2022 |
| Total expense computed by applying federal rates | $ | 89,480 | | | $ | 59,249 | | | $ | 57,303 | |
| State and provincial income taxes, net of federal benefit | 914 | | | 625 | | | 545 | |
| Excess depletion | (2,473) | | | (2,259) | | | (1,907) | |
| Statutory tax attributable to non-controlling interest | (195) | | | (224) | | | (363) | |
| Effect of foreign earnings | (887) | | | (10,116) | | | (8,846) | |
| Unrealized foreign exchange gains | 896 | | | (988) | | | 853 | |
| Rate adjustment | 1,279 | | | (6) | | | — | |
| Changes in estimates | (1,062) | | | 11 | | | 119 | |
| Valuation allowance | 3,842 | | | (6,030) | | | (15,877) | |
| Other | 1,819 | | | 1,746 | | | 1,099 | |
| Total income tax expense | $ | 93,613 | | | $ | 42,008 | | | $ | 32,926 | |
The effective tax rate for the year ended December 31, 2024, was 22% which included a $13.0 million U.S. GILTI income tax expense related to the consideration from the Mount Milligan Cost Support Agreement. The effective tax rates for the years ended December 31, 2023 and 2022, were 14.9% and 12.1%, respectively, which included income tax benefits attributable to the release of a valuation allowance on certain foreign deferred tax assets.
The tax effects of temporary differences and carryforwards, which give rise to our deferred tax assets and liabilities on December 31, 2024 and 2023 are as follows (amounts in thousands):
| | | | | | | | | | | |
| December 31,
2024 | | December 31,
2023 |
| Deferred tax assets: | | | |
| Stock-based compensation | $ | 1,989 | | | $ | 1,952 | |
| Net operating losses | 5,863 | | | 4,683 | |
| Foreign tax credits | 39,748 | | | 35,751 | |
| Amortizable tax goodwill | 37,672 | | | 46,821 | |
| Other | 6,487 | | | 5,044 | |
| Total deferred tax assets | 91,759 | | | 94,251 | |
| Valuation allowance | (44,656) | | | (40,814) | |
| Net deferred tax assets | $ | 47,103 | | | $ | 53,437 | |
| Deferred tax liabilities: | | | |
| Mineral property basis | $ | (123,482) | | | $ | (122,543) | |
| Unrealized foreign exchange gains | (582) | | | (582) | |
| Other | (1,179) | | | (97) | |
| Total deferred tax liabilities | (125,243) | | | (123,222) | |
| Total net deferred taxes | $ | (78,140) | | | $ | (69,785) | |
We review the measurement of our deferred tax assets at each balance sheet date. Considering all available positive and negative evidence, including but not limited to recent earnings history and forecasted future results, the Company believes it is more likely-than-not that all net deferred tax assets not currently burdened with a valuation allowance will be fully realized. As of December 31, 2024 and 2023, we recorded a valuation allowance of $44.7 million and $40.8 million, respectively. The valuation allowance remaining at December 31, 2024 is attributable to US foreign tax credits of
ROYAL GOLD, INC.
NOTES TO CONSOLIDATED FINANCIAL STATEMENTS (Continued)
$39.7 million and capital losses of $1.9 million, net operating losses of $2.2 million, and other tax attribute carryforwards of $0.9 million in non-US subsidiaries.
As of December 31, 2024 and 2023, we had $5.9 million and $4.7 million of net operating loss carryforwards offset by a valuation allowance of $2.2 million and $1.7 million, respectively. The majority of the tax loss carryforwards are in jurisdictions that allow a twenty-year carry-forward period. These losses do not begin to expire until the 2038 tax year, and the Company anticipates utilizing $3.7 million of the net operating loss carryforwards as of December 31, 2024.
As of December 31, 2024 and 2023, we had zero unrecognized tax benefits. We file income tax returns in the U.S. federal jurisdiction, and various state and foreign jurisdictions. With few exceptions, the Company is no longer subject to U.S. Federal, state and local, and non-U.S. income tax examinations by tax authorities for fiscal years before 2021.
Our continuing practice is to recognize interest and/or penalties related to unrecognized tax benefits as part of our income tax expense. For the years ended December 31, 2024, 2023, and 2022, we had zero accrued income-tax-related interest and penalties.
12. SUPPLEMENTAL CASH FLOW INFORMATION
Our supplemental cash flow information for the years ended December 31, 2024, 2023, and 2022 is as follows (amounts in thousands):
| | | | | | | | | | | | | | | | | |
| Years Ended |
| December 31,
2024 | | December 31,
2023 | | December 31,
2022 |
| Cash paid during the period for: | | | | | |
| Interest | $ | 6,593 | | | $ | 28,054 | | | $ | 7,218 | |
| Income taxes, net of refunds | $ | 72,108 | | | $ | 50,303 | | | $ | 54,804 | |
| Non-cash investing and financing activities: | | | | | |
| Dividends declared | $ | 108,556 | | | $ | 100,232 | | | $ | 93,597 | |
13. FAIR VALUE MEASUREMENTS
Fair value is an exit price, representing the amount that would be received to sell an asset or paid to transfer a liability in an orderly transaction between market participants. As such, fair value is a market-based measurement that should be determined based on assumptions that market participants would use in pricing an asset or liability. As a basis for considering such assumptions, we utilize a three-tier fair value hierarchy, which prioritizes the inputs used in measuring fair value as follows:
Level 1: Quoted prices for identical instruments in active markets;
Level 2: Quoted prices for similar instruments in active markets; quoted prices for identical or similar instruments in markets that are not active; and model-derived valuations in which all significant inputs and significant value drivers are observable in active markets; and
Level 3: Prices or valuation techniques requiring inputs that are both significant to the fair value measurement and unobservable (supported by little or no market activity).
As of December 31, 2024 and December 31, 2023, we had financial assets in the form of marketable securities which are measured at fair value on a recurring basis; however, the carrying value of such financial assets is not material.
The carrying value of our revolving credit facility (Note 5) approximates fair value as of December 31, 2024.
As of December 31, 2024, we had assets that, under certain conditions, are subject to measurement at fair value on a non-recurring basis like those associated with stream and royalty interests, intangible assets and other long-lived assets. For
ROYAL GOLD, INC.
NOTES TO CONSOLIDATED FINANCIAL STATEMENTS (Continued)
these assets, measurement at fair value in periods subsequent to their initial recognition is applicable if any of these assets are determined to be impaired. If recognition of these assets at their fair value becomes necessary, such measurements will be determined utilizing Level 3 inputs.
14. MAJOR SOURCES OF REVENUE
Operators that contributed greater than 10% of our total revenue for the years ended December 31, 2024, 2023, and 2022 were as follows (revenue amounts in thousands):
| | | | | | | | | | | | | | | | | | | | | | | | | | | | | | | | | | | | | | |
| | Years Ended |
| | December 31,
2024 | | December 31,
2023 | | December 31,
2022 |
| Operator | | Revenue | | Percentage of total
revenue | | Revenue | | Percentage of total
revenue | | Revenue | | Percentage of total
revenue |
| Centerra | | $ | 186,039 | | | 25.9 | % | | $ | 158,167 | | | 26.1 | % | | $ | 180,543 | | | 30.0 | % |
| Barrick | | 84,961 | | | 11.8 | % | | 75,259 | | | 12.4 | % | | 140,421 | | | 23.3 | % |
| Nevada Gold Mines | | 79,473 | | | 11.0 | % | | 101,870 | | | 16.8 | % | | 57,730 | | | 9.6 | % |
15. SEGMENT INFORMATION
We manage our business under two reportable segments, consisting of the acquisition and management of stream interests and the acquisition and management of royalty interests. Our President and Chief Executive Officer serves as our Chief Operating Decision Maker ("CODM") and is responsible for reviewing segment performance and making decisions regarding resource allocation. In addition to revenue, our CODM regularly reviews cost of sales, production taxes and depletion for each of our reportable segments. Royal Gold’s long-lived assets (stream and royalty interests, net) as of December 31, 2024 and 2023 are geographically distributed as shown in the following table (amounts in thousands):
| | | | | | | | | | | | | | | | | | | | | | | | | | | | | | | | | | | |
| As of December 31, 2024 | | As of December 31, 2023 |
| Stream
interest | | Royalty
interest | | Total stream
and royalty
interests, net | | Stream
interest | | Royalty
interest | | Total stream
and royalty
interests, net |
| Canada | $ | 417,643 | | | $ | 659,070 | | | $ | 1,076,713 | | | $ | 461,398 | | | $ | 614,900 | | | $ | 1,076,298 | |
| Dominican Republic | 302,122 | | | — | | | 302,122 | | | 311,050 | | | — | | | 311,050 | |
| Africa | 237,028 | | | 321 | | | 237,349 | | | 264,529 | | | 321 | | | 264,850 | |
| Chile | 211,123 | | | 224,116 | | | 435,239 | | | 222,629 | | | 224,116 | | | 446,745 | |
| United States | — | | | 827,277 | | | 827,277 | | | — | | | 794,891 | | | 794,891 | |
| Mexico | — | | | 33,800 | | | 33,800 | | | — | | | 41,803 | | | 41,803 | |
| Australia | — | | | 19,265 | | | 19,265 | | | — | | | 21,288 | | | 21,288 | |
| Rest of world | 85,254 | | | 25,785 | | | 111,039 | | | 92,010 | | | 26,639 | | | 118,649 | |
| Total | $ | 1,253,170 | | | $ | 1,789,634 | | | $ | 3,042,804 | | | $ | 1,351,616 | | | $ | 1,723,958 | | | $ | 3,075,574 | |
Our reportable segments for purposes of assessing performance are shown below (amounts in thousands):
| | | | | | | | | | | | | | | | | | | | | | | | | | | | | |
| Year Ended December 31, 2024 |
| Revenue | | Cost of sales(1) | | Production taxes | | Depletion (2) | | Segment gross profit |
| Stream interests | $ | 483,294 | | | $ | 97,514 | | | $ | — | | | $ | 102,800 | | | $ | 282,980 | |
| Royalty interests | 236,101 | | | — | | | 6,622 | | | 41,285 | | | 188,194 | |
| Total | $ | 719,395 | | | $ | 97,514 | | | $ | 6,622 | | | $ | 144,085 | | | $ | 471,174 | |
ROYAL GOLD, INC.
NOTES TO CONSOLIDATED FINANCIAL STATEMENTS (Continued)
| | | | | | | | | | | | | | | | | | | | | | | | | | | | | |
| Year Ended December 31, 2023 |
| Revenue | | Cost of sales(1) | | Production taxes | | Depletion (2) | | Segment gross profit |
| Stream interests | $ | 418,280 | | | $ | 90,523 | | | $ | — | | | $ | 121,121 | | | $ | 206,636 | |
| Royalty interests | 187,437 | | | — | | | 7,294 | | | 43,385 | | | 136,758 | |
| Total | $ | 605,717 | | | $ | 90,523 | | | $ | 7,294 | | | $ | 164,506 | | | $ | 343,394 | |
| | | | | | | | | | | | | | | | | | | | | | | | | | | | | |
| Year Ended December 31, 2022 |
| Revenue | | Cost of sales(1) | | Production taxes | | Depletion (2) | | Segment gross profit |
| Stream interests | $ | 417,793 | | | $ | 94,642 | | | $ | — | | | $ | 143,526 | | | $ | 179,625 | |
| Royalty interests | 185,413 | | | — | | | 7,021 | | | 34,916 | | | 143,476 | |
| Total | $ | 603,206 | | | $ | 94,642 | | | $ | 7,021 | | | $ | 178,442 | | | $ | 323,101 | |
_______________________________________________________
(1)Excludes depreciation, depletion and amortization
(2)Depletion amounts are included within Depreciation, depletion and amortization on our consolidated statements of operations and comprehensive income
A reconciliation of total segment gross profit to the consolidated Income before income taxes is shown below (amounts in thousands):
| | | | | | | | | | | | | | | | | |
| Years Ended |
| December 31,
2024 | | December 31,
2023 | | December 31,
2022 |
| Total segment gross profit | $ | 471,174 | | | $ | 343,394 | | | $ | 323,101 | |
| | | | | |
| Costs and expenses | | | | | |
| General and administrative expenses | 40,934 | | | 39,761 | | | 34,612 | |
| Depreciation and amortization | 341 | | | 431 | | | 493 | |
| Impairment of royalty interests | — | | | — | | | 4,287 | |
| Operating income | 429,899 | | | 303,202 | | | 283,709 | |
| Fair value changes in equity securities | (66) | | | (147) | | | (1,503) | |
| Interest and other income | 6,008 | | | 9,952 | | | 7,832 | |
| Interest and other expense | (9,749) | | | (30,867) | | | (17,170) | |
| Income before income taxes | $ | 426,092 | | | $ | 282,140 | | | $ | 272,868 | |
ROYAL GOLD, INC.
NOTES TO CONSOLIDATED FINANCIAL STATEMENTS (Continued)
Our revenue by reportable segment for the years ended December 31, 2024, 2023, and 2022 is geographically distributed as shown in the following table (amounts in thousands):
| | | | | | | | | | | | | | | | | |
| Years Ended |
| December 31,
2024 | | December 31,
2023 | | December 31,
2022 |
| Stream interests: | | | | | |
| Canada | $ | 231,801 | | | $ | 196,961 | | | $ | 212,369 | |
| Dominican Republic | 83,059 | | | 76,247 | | | 85,863 | |
| Africa | 82,132 | | | 70,757 | | | 53,787 | |
| Chile | 47,531 | | | 48,920 | | | 47,347 | |
| Rest of world | 38,771 | | | 25,395 | | | 18,427 | |
| Total stream interests | $ | 483,294 | | | $ | 418,280 | | | $ | 417,793 | |
| | | | | |
| Royalty interests: | | | | | |
| United States | $ | 121,212 | | | $ | 123,690 | | | $ | 81,642 | |
| Mexico | 52,842 | | | 25,754 | | | 52,388 | |
| Australia | 28,966 | | | 19,011 | | | 15,672 | |
| Canada | 18,945 | | | 12,712 | | | 27,210 | |
| Rest of world | 14,136 | | | 6,270 | | | 8,501 | |
| Total royalty interests | $ | 236,101 | | | $ | 187,437 | | | $ | 185,413 | |
| Total revenue | $ | 719,395 | | | $ | 605,717 | | | $ | 603,206 | |
16. COMMITMENTS AND CONTINGENCIES
Ilovica Gold Stream Acquisition
As of December 31, 2024, our conditional funding schedule of $163.75 million, as part of the Ilovica gold stream acquisition entered into in October 2014, remains subject to certain conditions.
ITEM 9. CHANGES IN AND DISAGREEMENTS WITH ACCOUNTANTS ON ACCOUNTING AND FINANCIAL DISCLOSURE
None.
ITEM 9A. CONTROLS AND PROCEDURES
Evaluation of Disclosure Controls and Procedures
Under the supervision and with the participation of our management, including our Chief Executive Officer (our principal executive officer) and Chief Financial Officer (our principal financial and accounting officer), we evaluated the effectiveness of the design and operation of our disclosure controls and procedures (as defined in Rules 13a-15(e) and 15d-15(e) under the Securities Exchange Act of 1934, as amended) as of December 31, 2024. Based on this evaluation, our Chief Executive Officer and Chief Financial Officer have concluded that our disclosure controls and procedures were effective as of December 31, 2024, at the reasonable assurance level.
Management’s Report on Internal Control over Financial Reporting
Our management is responsible for establishing and maintaining adequate internal control over financial reporting (as defined in Rules 13a-15(f) and 15d-15(f) under the Securities Exchange Act of 1934, as amended). Our internal control over financial reporting is designed to provide reasonable assurance regarding the reliability of financial reporting and the preparation of financial statements for external purposes in accordance with generally accepted accounting principles.
Management assessed the effectiveness of our internal control over financial reporting as of December 31, 2024. In making this assessment, management used the criteria set forth by the Committee of Sponsoring Organizations of the Treadway Commission (COSO) in Internal Control—Integrated Framework (2013 Framework). Based on management’s assessment and those criteria, management concluded that our internal control over financial reporting was effective as of December 31, 2024.
Our independent registered public accounting firm, Ernst & Young LLP, has issued an attestation report on our internal control over financial reporting as of December 31, 2024.
Changes in Internal Control over Financial Reporting
There were no changes in our internal control over financial reporting during the quarter ended December 31, 2024, that materially affected, or are reasonably likely to materially affect, our internal control over financial reporting.
Inherent Limitations on Effectiveness of Controls
Our management, including our Chief Executive Officer and Chief Financial Officer, does not expect that our disclosure controls and procedures or our internal controls will prevent all error and all fraud. A control system, no matter how well conceived and operated, can provide only reasonable, not absolute, assurance that the objectives of the control system are met. Further, the design of a control system must reflect the fact that there are resource constraints and the benefits of controls must be considered relative to their costs. Because of the inherent limitations in all control systems, no evaluation of controls can provide absolute assurance that all control issues and instances of fraud, if any, within Royal Gold have been detected.
Report of Independent Registered Public Accounting Firm
To the Stockholders and the Board of Directors of Royal Gold, Inc.
Opinion on Internal Control Over Financial Reporting
We have audited Royal Gold, Inc.’s internal control over financial reporting as of December 31, 2024, based on criteria established in Internal Control—Integrated Framework issued by the Committee of Sponsoring Organizations of the Treadway Commission (2013 framework) (the COSO criteria). In our opinion, Royal Gold, Inc. (the Company) maintained, in all material respects, effective internal control over financial reporting as of December 31, 2024, based on the COSO criteria.
We also have audited, in accordance with the standards of the Public Company Accounting Oversight Board (United States) (PCAOB), the consolidated balance sheets of the Company as of December 31, 2024 and 2023, the related consolidated statements of operations and comprehensive income, changes in equity and cash flows for each of the three years in the period ended December 31, 2024, and the related notes, and our report dated February 12, 2025 expressed an unqualified opinion thereon.
Basis for Opinion
The Company’s management is responsible for maintaining effective internal control over financial reporting and for its assessment of the effectiveness of internal control over financial reporting included in the accompanying Management’s Report on Internal Control over Financial Reporting. Our responsibility is to express an opinion on the Company’s internal control over financial reporting based on our audit. We are a public accounting firm registered with the PCAOB and are required to be independent with respect to the Company in accordance with the U.S. federal securities laws and the applicable rules and regulations of the Securities and Exchange Commission and the PCAOB.
We conducted our audit in accordance with the standards of the PCAOB. Those standards require that we plan and perform the audit to obtain reasonable assurance about whether effective internal control over financial reporting was maintained in all material respects.
Our audit included obtaining an understanding of internal control over financial reporting, assessing the risk that a material weakness exists, testing and evaluating the design and operating effectiveness of internal control based on the assessed risk, and performing such other procedures as we considered necessary in the circumstances. We believe that our audit provides a reasonable basis for our opinion.
Definition and Limitations of Internal Control Over Financial Reporting
A company’s internal control over financial reporting is a process designed to provide reasonable assurance regarding the reliability of financial reporting and the preparation of financial statements for external purposes in accordance with generally accepted accounting principles. A company’s internal control over financial reporting includes those policies and procedures that (1) pertain to the maintenance of records that, in reasonable detail, accurately and fairly reflect the transactions and dispositions of the assets of the company; (2) provide reasonable assurance that transactions are recorded as necessary to permit preparation of financial statements in accordance with generally accepted accounting principles, and that receipts and expenditures of the company are being made only in accordance with authorizations of management and directors of the company; and (3) provide reasonable assurance regarding prevention or timely detection of unauthorized acquisition, use, or disposition of the company’s assets that could have a material effect on the financial statements.
Because of its inherent limitations, internal control over financial reporting may not prevent or detect misstatements. Also, projections of any evaluation of effectiveness to future periods are subject to the risk that controls may become inadequate because of changes in conditions, or that the degree of compliance with the policies or procedures may deteriorate.
/s/ Ernst & Young LLP
Denver, Colorado
February 12, 2025
ITEM 9B. OTHER INFORMATION
During the three months ended December 31, 2024, no director or officer of the Company adopted or terminated a Rule 10b5-1 trading arrangement or non-Rule 10b5-1 trading arrangement, as each term is defined in Item 408(a) of Regulation S-K.
ITEM 9C. DISCLOSURE REGARDING FOREIGN JURISDICTIONS THAT PREVENT INSPECTIONS
None.
PART III
ITEM 10. DIRECTORS, EXECUTIVE OFFICERS AND CORPORATE GOVERNANCE
Information about our executive officers is reported under the caption “Information about our Executive Officers” in Part I of this report. The other information required by this item will be included in our proxy statement for our 2025 stockholders’ meeting to be filed with the SEC within 120 days after December 31, 2024, and is incorporated by reference into this report.
ITEM 11. EXECUTIVE COMPENSATION
The information required by this item will be included in our proxy statement for our 2025 stockholders’ meeting to be filed with the SEC within 120 days after December 31, 2024, and is incorporated by reference into this report.
ITEM 12. SECURITY OWNERSHIP OF CERTAIN BENEFICIAL OWNERS AND MANAGEMENT AND RELATED STOCKHOLDER MATTERS
The information required by this item will be included in our proxy statement for our 2025 stockholders’ meeting to be filed with the SEC within 120 days after December 31, 2024, and is incorporated by reference into this report.
ITEM 13. CERTAIN RELATIONSHIPS AND RELATED TRANSACTIONS AND DIRECTOR INDEPENDENCE
The information required by this item will be included in our proxy statement for our 2025 stockholders’ meeting to be filed with the SEC within 120 days after December 31, 2024, and is incorporated by reference into this report.
ITEM 14. PRINCIPAL ACCOUNTANT FEES AND SERVICES
The information required by this item will be included in our proxy statement for our 2025 stockholders’ meeting to be filed with the SEC within 120 days after December 31, 2024, and is incorporated by reference into this report.
PART IV
ITEM 15. EXHIBITS AND FINANCIAL STATEMENT SCHEDULES
(a)Financial Statements
Index to Financial Statements
(b)Exhibits
| | | | | | | | | | | | | | | | | |
| Exhibit No. | Exhibit Description | Form | File No. | Exhibit | Filing Date |
| 3.1 | | 10-Q | 001-13357 | 3.1 | 11/2/2023 |
| 3.2* | | | | | |
| 4.1* | | | | | |
| 10.1 | Revolving Facility Credit Agreement, dated June 2, 2017, among Royal Gold, Inc., RG Mexico, Inc., the lenders from time to time party thereto, and HSBC Bank USA, National Association, as administrative agent for the lenders | 8-K | 001-13357 | 10.1 | 6/6/2017 |
| 10.2 | | 10-K | 001-13357 | 10.38 | 8/9/2018 |
| 10.3 | | 8-K | 001-13357 | 10.1 | 6/6/2019 |
| 10.4 | | 10-Q | 001-13357 | 10.1 | 11/7/2019 |
| 10.5 | | 8-K | 001-13357 | 10.1 | 7/12/2021 |
| 10.6 | | 8-K | 001-13357 | 10.1 | 6/30/2023 |
| 10.7▲ | | S-8 | 333-219378 | 4.1 | 7/20/2017 |
| 10.8▲ | | 8-K/A | 001-13357 | 10.1 | 1/3/2020 |
| 10.9▲ | | 8-K | 001-13357 | 10.1 | 1/7/2019 |
| 10.10▲ | | 8-K | 001-13357 | 10.1 | 3/8/2021 |
| 10.11▲ | | 8-K | 001-13357 | 10.1 | 4/11/2022 |
| | | | | | | | | | | | | | | | | |
| Exhibit No. | Exhibit Description | Form | File No. | Exhibit | Filing Date |
| 10.12▲ | | 8-K | 001-13357 | 10.1 | 5/25/2022 |
| 10.13▲ | | 10-Q | 001-13357 | 10.1 | 8/8/2024 |
| 10.14▲ | | 8-K | 001-13357 | 10.2 | 9/18/2023 |
| 10.15▲ | | 10-Q | 001-13357 | 10.1 | 11/7/2024 |
| 10.16▲ | | 8-K | 001-13357 | 10.1 | 2/16/2023 |
| 10.17▲ | | S-8 | 333-219378 | 4.2 | 7/20/2017 |
| 10.18▲ | | 10-Q | 001-13357 | 10.3 | 11/1/2018 |
| 10.19▲ | | 10-Q | 001-13357 | 10.1 | 5/5/2022 |
| 10.20▲ | | 10-Q | 001-13357 | 10.4 | 11/1/2018 |
| 10.21▲ | | 10-Q | 001-13357 | 10.2 | 5/5/2022 |
| 10.22▲ | | 8-K | 001-13357 | 10.2 | 3/8/2023 |
| 10.23▲ | | 8-K | 001-13357 | 10.4 | 3/8/2023 |
| 10.24▲ | | 10-Q | 001-13357 | 10.7 | 11/1/2018 |
| 10.25▲ | | 10-Q | 001-13357 | 10.3 | 5/5/2022 |
| 10.26▲ | | 10-Q | 001-13357 | 10.1 | 11/1/2018 |
| 10.27▲ | | 10-Q | 001-13357 | 10.2 | 11/1/2018 |
| 19.1* | | | | | |
| 21.1* | | | | | |
| 23.1* | | | | | |
| 31.1* | | | | | |
| 31.2* | | | | | |
| 32.1* | | | | | |
| 32.2* | | | | | |
| 97.1 | | 10-K | 001-13357 | 97.1 | 2/15/2024 |
| | | | | | | | | | | | | | | | | |
| Exhibit No. | Exhibit Description | Form | File No. | Exhibit | Filing Date |
| 101* | The following financial statements from Royal Gold, Inc.’s Annual Report on Form 10-K for the year ended December 31, 2024, formatted in Inline XBRL: (a) Consolidated Statements of Cash Flows, (b) Consolidated Statements of Operations, (c) Consolidated Statements of Comprehensive Income, (d) Consolidated Balance Sheets, and (e) Notes to Consolidated Financial Statements, tagged as blocks of text and including detailed tags | | | | |
| 104* | Cover Page Interactive Data File (formatted as Inline XBRL and contained in Exhibit 101) | | | | |
| | | | | |
| * | Filed or furnished herewith. |
| ▲ | Identifies a management contract or compensation plan or arrangement. |
ITEM 16. FORM 10-K SUMMARY
Registrants may voluntarily include a summary of information required by Form 10-K under this Item 16. We have elected not to include this summary information.
SIGNATURES
Pursuant to the requirements of Section 13 or 15 (d) of the Securities Exchange Act of 1934, the registrant has duly caused this report to be signed on its behalf by the undersigned, thereunto duly authorized.
| | | | | | | | |
| ROYAL GOLD, INC. |
| | |
| Date: February 13, 2025 | By: | /s/ William Heissenbuttel |
| | William Heissenbuttel |
| | President, Chief Executive Officer and Director |
Pursuant to the requirements of the Securities Exchange Act of 1934, this report has been signed below by the following persons on behalf of the registrant and in the capacities and on the dates indicated.
| | | | | | | | |
| Date: February 13, 2025 | By: | /s/ William Heissenbuttel |
| | William Heissenbuttel |
| | President, Chief Executive Officer and Director (Principal Executive Officer) |
| | |
| Date: February 13, 2025 | By: | /s/ Paul Libner |
| | Paul Libner |
| | Senior Vice President and Chief Financial Officer (Principal Financial and Accounting Officer) |
| | |
| Date: February 13, 2025 | By: | /s/ William Hayes |
| | William Hayes |
| | Chairman |
| | |
| Date: February 13, 2025 | By: | /s/ Fabiana Chubbs |
| | Fabiana Chubbs |
| | Director |
| | |
| Date: February 13, 2025 | By: | /s/ Kevin McArthur |
| | Kevin McArthur |
| | Director |
| | |
| Date: February 13, 2025 | By: | /s/ Jamie Sokalsky |
| | Jamie Sokalsky |
| | Director |
| | |
| Date: February 13, 2025 | By: | /s/ Ronald Vance |
| | Ronald Vance |
| | Director |
| | |
| Date: February 13, 2025 | By: | /s/ Sybil Veenman |
| | Sybil Veenman |
| | Director |