UNITED STATES
SECURITIES AND EXCHANGE COMMISSION
Washington, DC 20549
FORM 10-K
| x | ANNUAL REPORT PURSUANT TO SECTION 13 OR 15(d) OF THE SECURITIES EXCHANGE ACT OF 1934 |
For the fiscal year ended December 31, 2006
OR
| ¨ | TRANSITION REPORT PURSUANT TO SECTION 13 OR 15(d) OF THE SECURITIES EXCHANGE ACT OF 1934 |
For the transition period from to
Commission File Number: 0-18392
AMERIANA BANCORP
(Exact name of registrant as specified in its charter)
| | |
| Indiana | | 35-1782688 |
(State or other jurisdiction of incorporation or organization) | | (I.R.S. Employer Identification No.) |
| | |
| 2118 Bundy Avenue, New Castle, Indiana | | 47362-1048 |
| (Address of principal executive offices) | | (Zip Code) |
Registrant’s telephone number, including area code: (765) 529-2230
Securities registered pursuant to Section 12(b) of the Act:
| | |
| Title of each class | | Name of each exchange on which registered |
| Common Stock, par value $0.01 per share | | The NASDAQ Stock Market LLC |
Securities registered pursuant to Section 12(g) of the Act: None
Indicate by check mark if the registrant is a well-known seasoned issuer, as defined in Rule 405 of the Securities Act. YES ¨ NO x
Indicate by check mark if the registrant is not required to file reports pursuant to Section 13 or 15(d) of the Act. YES ¨ NO x
Indicate by check mark whether the registrant (l) has filed all reports required to be filed by Section 13 or 15(d) of the Securities Exchange Act of 1934 during the preceding 12 months (or for such shorter period that the registrant was required to file such reports), and (2) has been subject to such filing requirements for the past 90 days. YES x NO ¨
Indicate by check mark if disclosure of delinquent filers pursuant to Item 405 of Regulation S-K is not contained herein, and will not be contained, to the best of registrant’s knowledge, in definitive proxy or information statements incorporated by reference in Part III of this Form 10-K or any amendment to this Form 10-K. x
Indicate by check mark whether the registrant is a large accelerated, an accelerated filer or a non-accelerated filer. See definition of “accelerated filer and large accelerated filer” in Rule 12b-2 of the Exchange Act. (Check one):
Large Accelerated Filer ¨ Accelerated Filer ¨ Non-accelerated Filer x
Indicate by check mark whether the registrant is a shell company (as defined in Rule 12b-2 of the Exchange Act). YES ¨ NO x
The aggregate market value of the registrant’s common stock held by nonaffiliates of the registrant at June 30, 2006 was approximately $39.1 million. For purposes of this calculation, shares held by the directors and executive officers of the registrant are deemed to be held by affiliates.
At March 28, 2007, the registrant had 2,988,952 shares of its common stock outstanding.
DOCUMENTS INCORPORATED BY REFERENCE
Portions of Proxy Statement for the 2007 Annual Meeting of Shareholders are incorporated by reference in Part III of this Form 10-K
INDEX
ii
Forward-Looking Statements
This report contains certain “forward-looking statements” within the meaning of the federal securities laws. These statements are not historical facts, rather statements based on Ameriana Bancorp’s current expectations regarding its business strategies, intended results and future performance. Forward-looking statements are preceded by terms such as “expects,” “believes,” “anticipates,” “intends” and similar expressions.Such statements are subject to certain risks and uncertainties including changes in economic conditions in the Company’s market area, changes in policies by regulatory agencies, the outcome of litigation, fluctuations in interest rates, demand for loans in the Company’s market area, and competition that could cause actual results to differ materially from historical earnings and those presently anticipated or projected. Additional factors that may affect our results are discussed in this annual report on Form 10-K under “Item 1A. Risk Factors.” The Company cautions readers not to place undue reliance on any such forward-looking statements, which speak only as of the date made. The Company advises readers that the factors listed above could affect the Company’s financial performance and could cause the Company’s actual results for future periods to differ materially from any opinions or statements expressed with respect to future periods in any current statements.
The Company does not undertake, and specifically disclaims any obligation, to publicly release the result of any revisions, which may be made to any forward-looking statements to reflect events or circumstances after the date of such statements or to reflect the occurrence of anticipated or unanticipated events.
PART I
General
The Company. Ameriana Bancorp (the “Company”) is an Indiana chartered bank holding company subject to regulation and supervision by the Board of Governors of the Federal Reserve System (the “Federal Reserve Board”) under the Bank Holding Company Act of 1956 (the “BHCA”). The Company became the holding company for Ameriana Bank, SB, an Indiana chartered savings bank headquartered in New Castle, Indiana (the “Bank”), in 1990. The Company also holds a minority interest in a limited partnership organized to acquire and manage real estate investments, which qualify for federal tax credits.
The Bank. The Bank began operations in 1890. Since 1935, the Bank has been a member of the Federal Home Loan Bank (the “FHLB”) System. Its deposits are insured to applicable limits by the Deposit Insurance Fund, administered by the Federal Deposit Insurance Corporation (the “FDIC”). On June 29, 2002, the Bank converted to an Indiana savings bank and adopted the name “Ameriana Bank and Trust, SB. In August 2006, the Bank closed its Trust Department and adopted its present name. As a result of the conversion in 2002, the Bank became subject to regulation by the Indiana Department of Financial Institutions (the “DFI”) and the FDIC. The Bank conducts business through its main office at 2118 Bundy Avenue, New Castle, Indiana and through nine branch offices located in New Castle, Middletown, Knightstown, Morristown, Greenfield, Anderson, Avon, McCordsville and New Palestine, Indiana. The Bank offers a wide range of consumer and commercial banking services, including: (i) accepting deposits; (ii) making commercial, mortgage and consumer loans; and through its subsidiaries, (iii) providing investment and brokerage services and (iv) providing insurance services.
The Bank has three wholly-owned subsidiaries, Ameriana Insurance Agency (“AIA”), Ameriana Financial Services, Inc. (“AFS”) and Ameriana Investment Management, Inc. (“AIMI”). AIA provides insurance sales from offices in New Castle, Greenfield and Avon, Indiana. AFS offers insurance products through its ownership of an interest in Family Financial Life Insurance Company, New Orleans, Louisiana, which offers a full line of credit-related insurance products. In 2002, AFS acquired a 20.9% ownership interest in Indiana Title Insurance Company, LLC through which it offers title insurance. AFS also operates a brokerage facility in conjunction with Linsco/Private Ledger. AIMI manages the Company’s investment portfolio.
1
The principal sources of funds for the Bank’s lending activities include deposits received from the general public, funds borrowed from the FHLB, principal amortization and prepayment of loans. The Bank’s primary sources of income are interest and fees on loans and interest on investments. The Bank has from time to time purchased loans and loan participations in the secondary market. The Bank also invests in various federal and government agency obligations and other investment securities permitted by applicable laws and regulations, including mortgage-backed, municipal and equity securities. The Bank’s principal expenses are interest paid on deposit accounts and borrowed funds and operating expenses incurred in the operation of the Bank.
Recent Developments. On January 23, 2007, the Company announced that John J. Letter has been named Senior Vice President, Treasurer and Chief Financial Officer of the Company, replacing Bradley Smith, who had resigned to pursue other interests.
The Board of Directors approved a plan for expansion and remodeling of its Greenfield Banking Center in Hancock County. The expansion will provide better customer access to the Bank’s drive-in and ATM, as well as offices for the Company’s brokerage and insurance operations and other additional customer amenities.
The Company also announced the opening of a commercial loan production office in the city of Carmel in Hamilton County. The office is expected to open in mid-April, 2007.
Regulatory Actions. During the second quarter of 2002, the Bank entered into a memorandum of understanding (“MOU”) with the FDIC and the DFI. Among other things, the MOU required the Bank to adopt written action plans with respect to certain classified assets, revise its lending policies, require greater financial information from borrowers, establish a loan review program and certain other internal controls. The FDIC and the DFI released the Bank from the MOU in the third quarter of 2005. The release of the MOU was contingent on the Bank’s adoption of a resolution that required the Bank to continue reducing the level of assets classified as substandard, formulate and implement a written Profit Plan, abstain from purchasing additional Bank Owned Life Insurance policies, formalize policies for leveraging strategies and maintain Tier 1 capital at or above 7% of assets. In June 2006, the Bank was released from the Board resolution adopted by the Board on June 27, 2005 and it is no longer in effect.
Competition.The Bank experiences substantial competition both in attracting and retaining savings deposits and in the making of mortgage and other loans. Direct competition for savings deposits comes from other savings institutions, commercial banks, insurance companies, and credit unions located in the Bank’s market area. Additional significant competition for savings deposits comes from money market mutual funds and corporate and government debt securities.
The primary factors in competing for loans are interest rates and loan origination fees and the range of services offered by the various financial institutions. Competition for origination of real estate loans normally comes from other thrift institutions, commercial banks, mortgage bankers, mortgage brokers and insurance companies. The Bank has been able to compete effectively in its market area.
The Bank has branch offices in Henry, Hancock, Hendricks, Shelby and Madison Counties in Indiana. In addition to savings banks with offices in these counties, the Bank competes with several commercial banks and savings institutions in surrounding counties, many of which have assets that are substantially larger than the Bank.
The Company expects competition to increase in the future as a result of legislative, regulatory and technological changes and the continuing trend of consolidation in the financial services industry. Technological advances, for example, have lowered barriers to entry into the industry, allowed banks to expand their geographic reach by providing services over the Internet and made it possible for non-depository institutions to offer products and services that traditionally have been provided by banks. Changes in federal law permit affiliation among banks, securities firms and insurance companies, which promotes a competitive environment in the financial services industry. Competition for deposits and the origination of loans could limit the Company’s growth in the future.
Available Information
The Company’s annual report on Form 10-K, quarterly reports on Form 10-Q, current reports on Form 8-K, and any amendments to such reports filed or furnished pursuant to Section 13(a) or 15(d) of the Securities Exchange Act of 1934, as amended, are made available free of charge on the Company’s website,www.ameriana.com, as soon
2
as reasonably practicable after such reports are electronically filed with, or furnished to, the Securities and Exchange Commission. Information on the Company’s website should not be considered a part of this Form 10-K.
Lending Activities
General. The principal lending activity of the Bank has been the origination of conventional first mortgage loans secured by residential property and commercial real estate, and commercial loans and consumer loans. The residential mortgage loans have been predominantly secured by single-family homes and have included construction loans.
The Bank may originate or purchase whole loans or loan participations secured by real estate located in any part of the United States. Notwithstanding this nationwide lending authority, the majority of the Bank’s mortgage loan portfolio is secured by real estate located in Henry, Hancock, Hamilton, Hendricks, Madison, Shelby, Delaware and Marion counties in the State of Indiana.
3
The following table sets forth information concerning the Bank’s loans by type of loan at the dates indicated.
| | | | | | | | | | | | | | | | | | | | | | | | | | | | | | |
| | | At December 31, | |
| | | 2006 | | | 2005 | | | 2004 | | | 2003 | | | 2002 | |
| | | Amount | | % | | | Amount | | % | | | Amount | | % | | | Amount | | % | | | Amount | | % | |
| | | (Dollars in thousands) | |
Real estate loans: | | | | | | | | | | | | | | | | | | | | | | | | | | | | | | |
Commercial | | $ | 62,112 | | 24.48 | % | | $ | 68,484 | | 30.58 | % | | $ | 76,222 | | 37.76 | % | | $ | 76,033 | | 36.12 | % | | $ | 84,974 | | 26.72 | % |
Residential loans | | | 125,424 | | 49.43 | | | | 98,495 | | 43.99 | | | | 93,544 | | 46.35 | | | | 100,865 | | 47.92 | | | | 157,622 | | 49.57 | |
Construction loans | | | 47,984 | | 18.91 | | | | 44,803 | | 20.01 | | | | 13,339 | | 6.61 | | | | 18,035 | | 8.57 | | | | 42,714 | | 13.43 | |
Commercial loans | | | 12,446 | | 4.90 | | | | 7,962 | | 3.56 | | | | 14,334 | | 7.10 | | | | 7,672 | | 3.64 | | | | 19,192 | | 6.03 | |
Consumer loans: | | | | | | | | | | | | | | | | | | | | | | | | | | | | | | |
Mobile home and auto loans | | | 3,354 | | 1.32 | | | | 3,098 | | 1.38 | | | | 3,656 | | 1.81 | | | | 5,191 | | 2.47 | | | | 10,092 | | 3.17 | |
Loans secured by deposits | | | 637 | | 0.25 | | | | 582 | | 0.26 | | | | 506 | | 0.25 | | | | 811 | | 0.39 | | | | 1,130 | | 0.36 | |
Home improvement loans | | | 48 | | 0.02 | | | | 218 | | 0.10 | | | | 113 | | 0.06 | | | | 206 | | 0.10 | | | | 248 | | 0.08 | |
Other | | | 1,750 | | 0.69 | | | | 276 | | 0.12 | | | | 129 | | 0.06 | | | | 1,661 | | 0.79 | | | | 2,043 | | 0.64 | |
| | | | | | | | | | | | | | | | | | | | | | | | | | | | | | |
Total | | | 253,755 | | 100.00 | % | | | 223,918 | | 100.00 | % | | | 201,843 | | 100.00 | % | | | 210,474 | | 100.00 | % | | | 318,015 | | 100.00 | % |
| | | | | | | | | | | | | | | | | | | | | | | | | | | | | | |
Less: | | | | | | | | | | | | | | | | | | | | | | | | | | | | | | |
Loans in process | | | 1,769 | | | | | | 2,485 | | | | | | 1,966 | | | | | | 2,271 | | | | | | 4,401 | | | |
Deferred loan fees | | | 98 | | | | | | 307 | | | | | | 405 | | | | | | 318 | | | | | | 362 | | | |
Loan loss reserve | | | 2,616 | | | | | | 2,835 | | | | | | 3,128 | | | | | | 3,744 | | | | | | 8,666 | | | |
| | | | | | | | | | | | | | | | | | | | | | | | | | | | | | |
Subtotal | | | 4,483 | | | | | | 5,627 | | | | | | 5,499 | | | | | | 6,333 | | | | | | 13,429 | | | |
| | | | | | | | | | | | | | | | | | | | | | | | | | | | | | |
Total | | $ | 249,272 | | | | | $ | 218,291 | | | | | $ | 196,344 | | | | | $ | 204,141 | | | | | $ | 304,586 | | | |
| | | | | | | | | | | | | | | | | | | | | | | | | | | | | | |
4
The following table shows, at December 31, 2006, the Bank’s loans based on their contractual terms to maturity. Demand loans, loans having no stated schedule of repayments and no stated maturity and overdrafts are reported as due in one year or less. Contractual principal repayments of loans do not necessarily reflect the actual term of the loan portfolio. The average life of mortgage loans is substantially less than their contractual terms because of loan prepayments and because of enforcement of due-on-sale clauses, which give the Bank the right to declare a loan immediately due and payable if, among other things, the borrower sells the real property subject to the mortgage and the loan is not repaid. The average life of mortgage loans tends to increase, however, when current mortgage loan rates substantially exceed rates on existing mortgage loans.
| | | | | | | | | | | | |
| | | Amounts of Loans Which Mature in |
| | | 2007 | | 2008 - 2011 | | 2012 and Thereafter | | Total |
| | | (In thousands) |
Type of Loan: | | | | | | | | | | | | |
Residential and commercial real estate mortgage | | $ | 4,507 | | $ | 7,782 | | $ | 175,248 | | $ | 187,537 |
Real estate construction | | | 30,801 | | | 4,047 | | | 13,135 | | | 47,983 |
Other | | | 6,629 | | | 9,903 | | | 1,703 | | | 18,235 |
| | | | | | | | | | | | |
Total | | $ | 41,937 | | $ | 21,732 | | $ | 190,086 | | $ | 253,755 |
| | | | | | | | | | | | |
The following table sets forth the dollar amount of the Company’s aggregate loans due after one year from December 31, 2006, which have predetermined interest rates and which have floating or adjustable interest rates.
| | | | | | | | | |
| | | Fixed Rate | | Adjustable Rate | | Total |
| | | (In thousands) |
Residential and commercial real estate mortgage | | $ | 57,158 | | $ | 124,871 | | $ | 182,029 |
Real estate construction | | | 3,812 | | | 13,370 | | | 17,182 |
Other loans | | | 11,920 | | | 687 | | | 12,607 |
| | | | | | | | | |
Total | | $ | 72,890 | | $ | 138,928 | | $ | 211,818 |
| | | | | | | | | |
Residential Real Estate and Residential Construction Lending. The Bank originates loans on one-to four-family residences The original contractual loan payment period for residential mortgage loans originated by the Bank generally ranges from ten to 30 years. Because borrowers may refinance or prepay their loans, they normally remain outstanding for a substantially shorter period. The Bank generally sells fixed-rate mortgage loans in the secondary market and retains adjustable-rate loans in its portfolio. Some fixed-rate mortgage loans, primarily those with contractual maturities of fifteen years or less, may be retained by the Bank. The Bank also originates hybrid mortgage loans. Hybrid mortgage loans carry a fixed-rate for the first three to ten years, and then convert to an adjustable-rate thereafter. Most of the residential mortgage loans originated and retained by the Bank in 2006 were hybrid loans with a fixed-rate for five or seven years, and adjust annually to the one-year constant maturity treasury rate thereafter. The overall strategy is to maintain a low risk mortgage portfolio that helps to diversify the Bank’s overall asset mix.
The Bank makes construction/permanent loans to borrowers to build one-to four-family owner-occupied residences with terms of up to 30 years. These loans are made as interest-only loans for a period typically of 12 months, at which time the loan converts to an amortized loan for the remaining term. The loans are made typically as adjustable-rate mortgages, which may be converted to a fixed-rate loan for sale in the secondary market at the request of the borrower if secondary market guidelines have been met. Residential real estate construction loans were $6.4 million of the construction loan portfolio at December 31, 2006 compared to $5.3 million at December 31, 2005.
Loans involving construction financing present a greater level of risk than loans for the purchase of existing homes since collateral value and construction costs can only be estimated at the time the loan is approved. The Bank has sought to minimize this risk by limiting construction lending to qualified borrowers in its market area and by limiting the number of construction loans outstanding at any time to individual builders. In addition, most of the Bank’s construction loans are made on homes that are pre-sold, for which permanent financing is already arranged.
5
In 2006, the Bank originated $16.2 million in adjustable-rate residential mortgage loans, including hybrids, and $13.9 million in fixed-rate mortgage loans. In 2005, the Bank originated $19.5 million in adjustable-rate residential mortgage loans, and $18.0 million in fixed-rate mortgage loans. Sales of fixed-rate residential mortgage loans into the secondary market in 2006 and 2005 were $3.6 million and $8.8 million, respectively. Gains on residential loan sales in 2006 were $89,000 compared with $176,000 in 2005.
Commercial Real Estate and Commercial Real Estate Construction Lending. The Bank originates loans secured by both owner-occupied and non-owner occupied properties. The Bank originates commercial real estate loans and purchases loan participations from other financial institutions. These participations are reviewed and approved based upon the same credit standards as commercial real estate loans originated by the Bank. The Bank’s commercial real estate loans range from $100,000 to $5.0 million. The commercial real estate loans generated may have a fixed or variable interest rate.
Loans secured by commercial real estate properties are generally larger and involve a greater degree of credit risk than one-to four-family residential mortgage loans. Because payments on loans secured by commercial real estate properties are often dependent on the successful operation or management of the properties, repayment of such loans may be subject to adverse conditions in the real estate market or by general economic conditions. If the cash flow from the project is reduced (for example, if leases are not obtained or renewed), the borrower’s ability to repay the loan may be impaired. To minimize the risks involved in originating such loans, the Bank considers, among other things, the creditworthiness of the borrower, the location of the real estate, the condition and occupancy levels of the security, the projected cash flows of the business, the borrower’s ability to service the debt and the quality of the organization managing the property.
Commercial real estate construction loans are made to developers for the construction of commercial properties, owner-occupied facilities, non-owner occupied facilities and for speculative purposes. These construction loans are granted based on a reasonable estimate of the time to complete the projects. Commercial real estate construction loans made up $41.5 million or 86.5% of the construction loan portfolio at December 31, 2006 compared to $39.5 million or 88.3% at December 31, 2005. As these loans mature they will either pay-off or roll to a permanent commercial real estate loan.
The Bank’s underwriting criteria are designed to evaluate and minimize the risks of each construction loan. Among other things, the Bank considers evidence of the availability of permanent financing or a takeout commitment to the borrower; the reputation of the borrower and his or her financial condition; the amount of the borrower’s equity in the project; independent appraisal and review of cost estimates; pre-construction sale and leasing information; and cash flow projections of the borrower.
At December 31, 2006, the largest outstanding commercial real estate or commercial real estate construction loan had an outstanding balance of $4.5 million and is secured by a commercial office building. This loan was performing according to its original terms at December 31, 2006.
Consumer Lending. The consumer lending portfolio includes automobile loans, home equity lines, and other consumer products. The collateral is generally the asset defined in the purpose of the request. The policies of the Bank are adhered to in our underwriting of consumer loans.
Management believes that the shorter terms and the normally higher interest rates available on various types of consumer loans have been helpful in maintaining profitable spreads between average loan yields and costs of funds. Consumer loans may entail greater risk than do residential mortgage loans, particularly in the case of consumer loans that are unsecured or secured by assets that depreciate rapidly. In such cases, repossessed collateral for a defaulted consumer loan may not provide an adequate source of repayment for the outstanding loan and the remaining deficiency often does not warrant further substantial collection efforts against the borrower. In addition, consumer loan collections depend on the borrower’s continuing financial stability, and therefore are more likely to be adversely affected by job loss, divorce, illness or personal bankruptcy. Furthermore, the application of various federal and state laws, including federal and state bankruptcy and insolvency laws, may limit the amount that can be recovered on such loans. The Bank has sought to reduce this risk by primarily granting secured consumer loans.
6
Commercial Lending. The Bank lends to business entities for the purposes of short-term working capital, inventory financing, equipment purchases and other business financing needs. These can be in the form of revolving lines of credit, commercial lines of credit, or term debt. The Bank also matches the term of the debt to the estimated useful life of the assets.
At December 31, 2006, the largest outstanding commercial and industrial loan had an outstanding balance of $655,000 and is secured by business assets. This loan was performing according to its terms at December 31, 2006.
Unlike residential mortgage loans, which generally are made on the basis of the borrower’s ability to make repayment from his or her employment or other income, and which are secured by real property the value of which tends to be more easily ascertainable, commercial loans are of higher risk and typically are made on the basis of the borrower’s ability to make repayment from the cash flow of the borrower’s business. As a result, the availability of funds for the repayment of commercial loans may depend substantially on the success of the business itself. Further, any collateral securing such loans may depreciate over time, may be difficult to appraise and may fluctuate in value.
Originations, Purchases and Sales. Historically, most residential and commercial real estate loans have been originated directly by the Bank through salaried and commissioned loan officers. Residential loan originations have been attributable to referrals from real estate brokers and builders, depositors and walk-in customers, and commissioned loan agents. The Bank also obtains consumer and commercial loans from paid brokers. The Bank obtained $29.3 million of loans from brokers and other financial institutions through loan participations in 2006. Commercial real estate and construction loan originations have also been obtained by direct solicitation. Consumer loan originations are attributable to walk-in customers who have been made aware of the Bank’s programs by advertising as well as direct solicitation.
The Bank has previously sold whole loans to other financial institutions and institutional investors. Sales of loans generate income (or loss) at the time of sale, produce future servicing income and provide funds for additional lending and other purposes. When the Bank retains the servicing of loans it sells, the Bank retains responsibility for collecting and remitting loan payments, inspecting the properties, making certain insurance and tax payments on behalf of borrowers and otherwise servicing those loans. The Bank typically receives a fee of between 0.25% and 0.375% per annum of the loan’s principal amount for performing these services. The right to service a loan has economic value and the Bank carries capitalized servicing rights on its books based on comparable market values and expected cash flows. At December 31, 2006, the Bank was servicing $145.0 million of loans for others. The aggregate book value of capitalized servicing rights at December 31, 2006 was $1.0 million.
Management believes that purchases of loans and loan participations are desirable when local mortgage demand is less than the local supply of funds available for mortgage originations or when loan terms available outside the Bank’s local lending areas are favorable to those available locally. Additionally, purchases of loans may be made to diversify the Bank’s lending portfolio. The Bank’s loan purchasing activities fluctuate significantly. The seller generally performs the servicing of purchased loans. To cover servicing costs, the service provider retains a portion of the interest being paid by the borrower. In addition to whole loan purchases, the Bank also purchases participation interests in loans. Both whole loans and participations are purchased on a yield basis.
For additional information, see “Management’s Discussion and Analysis of Financial Condition and Results of Operations” included in Item 7 of this Form 10-K.
Loan Underwriting.During the loan approval process, the Bank assesses both the borrower’s ability to repay the loan and the adequacy of the underlying security. Potential residential borrowers complete an application that is submitted to a commissioned loan originator. As part of the loan application process, the Bank obtains information concerning the income, financial condition, employment and credit history of the applicant. In addition, qualified appraisers inspect and appraise the property that is offered to secure the loan.
The Bank’s vice president of mortgage banking or the Bank’s loan committee will analyze the loan application and the property to be used as collateral and subsequently approve or deny the loan request. The Loan Committee, consisting of members of the Board or management appointed by the Board of Directors, must approve loans between $1,000,000 and $4,500,000. The Board of Directors approves all loans in excess of $4,500,000. If an expedient approval is necessary for requests over $1,000,000 but less than $4,500,000, approval may be obtained by two of the following individuals: Chief Executive Officer, Chief Operating Officer and Chief Credit Officer. In connection with the origination
7
of single-family, residential adjustable-rate loans, borrowers are qualified at a rate of interest equal to the second year rate, assuming the maximum increase. It is the policy of management to make loans to borrowers who not only qualify at the low initial rate of interest, but who would also qualify following an upward interest rate adjustment.
Loan Fee and Servicing Income. In addition to interest earned on loans, the Bank receives income through servicing of loans and fees in connection with loan originations, loan modifications, late payments, and changes of property ownership and for miscellaneous services related to the loan. Income from these activities is volatile and varies from period to period with the volume and type of loans made.
When possible, the Bank charges loan origination fees on commercial loans that are calculated as a percentage of the amount borrowed and are charged to the borrower at the time of origination of the loan. These fees generally range from none to one point (one point being equivalent to 1% of the principal amount of the loan). In accordance with Statement of Financial Accounting Standard No. 91, loan origination and commitment fees and certain direct loan origination costs are deferred and the net amount amortized as an adjustment of yield over the contractual life of the related loans.
For additional information, see Note 4 to the “Consolidated Financial Statements” included under Item 8 of this Form 10-K.
Delinquencies. When a borrower defaults upon a required payment on a non-commercial loan, the Bank contacts the borrower and attempts to induce the borrower to cure the default. A late payment notice is mailed to the borrower and a telephone contact is made after a payment is fifteen days past due. If the delinquency on a mortgage loan exceeds 90 days and is not cured through the Bank’s normal collection procedures or an acceptable arrangement is not worked out with the borrower, the Bank will institute measures to remedy the default, including commencing foreclosure action. In the case of default related to a commercial loan, the contact is initiated by the commercial lender after a payment is ten days past due. The Bank’s loan committee reviews delinquency reports weekly and monthly.
The Bank follows the collection processes required by Freddie Mac and Fannie Mae to manage residential loans underwritten for the secondary market. The collection practices for all other loans adhere with the Bank’s loan policies and regulatory requirements. It is the Bank’s intention to be proactive in its collection of delinquent accounts while adhering to state and federal guidelines.
Non-Performing Assets and Asset Classification. Loans are reviewed regularly and are placed on non-accrual status when, in the opinion of management, the collection of additional interest is doubtful. Residential mortgage loans are placed on non-accrual status when either principal or interest is 90 days or more past due unless it is adequately secured and there is reasonable assurance of full collection of principal and interest. Consumer loans generally are charged off when the loan becomes over 120 days delinquent. Commercial business and real estate loans are placed on non-accrual status when the loan is 90 days or more past due. Interest accrued and unpaid at the time a loan is placed on non-accrual status is charged against interest income. Subsequent payments are applied to the outstanding principal balance.
Real estate acquired by the Bank as a result of foreclosure or by deed-in-lieu of foreclosure is classified as real estate owned until such time as it is sold. When such property is acquired, it is recorded at the lower of the unpaid principal balance of the related loan or its fair value. Any subsequent deterioration of the property is charged off directly to income, reducing the value of the asset.
8
The following table sets forth information with respect to the Company’s aggregate non-performing assets at the dates indicated.
| | | | | | | | | | | | | | | | | | | | |
| | | At December 31, | |
| | | 2006 | | | 2005 | | | 2004 | | | 2003 | | | 2002 | |
| | | (Dollars in thousands) | |
Loans accounted for on a non-accrual basis: | | | | | | | | | | | | | | | | | | | | |
Real Estate: | | | | | | | | | | | | | | | | | | | | |
Residential | | $ | 657 | | | $ | 494 | | | $ | 1,083 | | | $ | 1,691 | | | $ | 3,281 | |
Commercial | | | — | | | | — | | | | 3,032 | | | | 3,390 | | | | 2,269 | |
Construction | | | 2,616 | | | | 1,960 | | | | 1,604 | | | | 3,217 | | | | — | |
Commercial | | | — | | | | 14 | | | | 10 | | | | 85 | | | | 12,500 | |
Consumer | | | 53 | | | | — | | | | 7 | | | | — | | | | 257 | |
| | | | | | | | | | | | | | | | | | | | |
Total | | | 3,326 | | | | 2,468 | | | | 5,736 | | | | 8,383 | | | | 18,307 | |
| | | | | | | | | | | | | | | | | | | | |
Accruing loans contractually past due 90 days or more: | | | | | | | | | | | | | | | | | | | | |
Real Estate: | | | | | | | | | | | | | | | | | | | | |
Residential | | | 71 | | | | 90 | | | | 143 | | | | 74 | | | | 103 | |
Commercial | | | — | | | | — | | | | — | | | | — | | | | 28 | |
Consumer | | | 13 | | | | — | | | | 1 | | | | — | | | | 4 | |
| | | | | | | | | | | | | | | | | | | | |
Total | | | 84 | | | | 90 | | | | 144 | | | | 74 | | | | 135 | |
| | | | | | | | | | | | | | | | | | | | |
Total of non-accrual and 90 days past due loans (1) | | $ | 3,410 | | | $ | 2,558 | | | $ | 5,880 | | | $ | 8,457 | | | $ | 18,442 | |
| | | | | | | | | | | | | | | | | | | | |
Percentage of total loans | | | 1.35 | % | | | 1.16 | % | | | 2.95 | % | | | 4.07 | % | | | 5.89 | % |
| | | | | | | | | | | | | | | | | | | | |
Other non-performing assets (2) | | $ | 610 | | | $ | 1,413 | | | $ | 572 | | | $ | 623 | | | $ | 525 | |
| | | | | | | | | | | | | | | | | | | | |
| (1) | The Company had no troubled debt restructurings at the dates indicated. |
| (2) | Other non-performing assets represent property acquired through foreclosure or repossession. This property is carried at the lower of its fair market value or the principal balance of the related loan. |
The Company’s non-performing loans increased $857,000 for the year ended December 31, 2006. The increase was related to a contractor being unable to complete a residential building project on a loan totaling $682,000, and the purchase of a judgment as part of a work-out strategy on a multi-family construction project in the amount of $185,000.
During 2006, the Bank would have recorded gross interest income of $209,000 on the loans set forth above as accounted for on a non-accrual basis, if such loans had been current in accordance with their terms. Instead, the Bank did not record any interest income on these loans for the year.
For additional information regarding the Bank’s problem assets and loss provisions recorded thereon, see “Management’s Discussion and Analysis of Financial Condition and Results of Operations” in Item 7 of this Form 10-K.
Reserves for Losses on Loans and Real Estate
In making loans, management recognizes that credit losses will be experienced and that the risk of loss will vary with, among other things, the type of loan being made, the creditworthiness of the borrower over the term of the loan and, in the case of a secured loan, the quality of the security for the loan.
It is management’s policy to maintain reserves for estimated losses on loans. The Bank’s management establishes general loan loss reserves based on, among other things, historical loan loss experience, evaluation of economic conditions in general and in various sectors of the Bank’s customer base, and periodic reviews of loan portfolio quality. Specific reserves are provided for individual loans where the ultimate collection is considered questionable by management after reviewing the current status of loans that are contractually past due and considering the net realizable value of the security of the loan or guarantees, if applicable. It is management’s policy to establish specific reserves for
9
estimated losses on delinquent loans when it determines that losses are anticipated to be incurred on the underlying properties. At December 31, 2006, the Bank’s allowance for loan losses amounted to $2.6 million.
Future reserves may be necessary if economic conditions or other circumstances differ substantially from the assumptions used in making the initial determinations. There can be no assurance that regulators, in reviewing the Bank’s loan portfolio in the future, will not ask the Bank to increase its allowance for loan losses, thereby negatively affecting its financial condition and earnings.
The following table sets forth an analysis of the Bank’s aggregate allowance for loan losses for the periods indicated.
| | | | | | | | | | | | | | | | | | | | |
| | | Year Ended December 31, | |
| | | 2006 | | | 2005 | | | 2004 | | | 2003 | | | 2002 | |
| | | (Dollars in thousands) | |
Balance at Beginning of Period | | $ | 2,835 | | | $ | 3,128 | | | $ | 3,744 | | | $ | 8,666 | | | $ | 1,730 | |
Charge-Offs: | | | | | | | | | | | | | | | | | | | | |
Real estate loans: | | | | | | | | | | | | | | | | | | | | |
Commercial | | | 540 | | | | 34 | | | | 674 | | | | 68 | | | | — | |
Residential | | | 36 | | | | 237 | | | | 208 | | | | 182 | | | | 202 | |
Construction | | | — | | | | 1,165 | | | | 20 | | | | — | | | | 24 | |
Commercial loans | | | 16 | | | | 31 | | | | 16 | | | | 10,902 | | | | — | |
Consumer loans | | | 87 | | | | 65 | | | | 216 | | | | 242 | | | | 162 | |
| | | | | | | | | | | | | | | | | | | | |
| | | 679 | | | | 1,532 | | | | 1,134 | | | | 11,394 | | | | 388 | |
| | | | | | | | | | | | | | | | | | | | |
Recoveries: | | | | | | | | | | | | | | | | | | | | |
Real estate loans: | | | | | | | | | | | | | | | | | | | | |
Construction | | | — | | | | — | | | | — | | | | — | | | | — | |
Residential | | | 9 | | | | 97 | | | | — | | | | 1 | | | | — | |
Commercial | | | 4 | | | | 552 | | | | — | | | | — | | | | — | |
Construction | | | — | | | | — | | | | — | | | | — | | | | — | |
Commercial loans | | | 108 | | | | 3,515 | | | | — | | | | — | | | | — | |
Consumer loans | | | 39 | | | | 43 | | | | 126 | | | | 31 | | | | 24 | |
| | | | | | | | | | | | | | | | | | | | |
| | | 160 | | | | 4,207 | | | | 126 | | | | 32 | | | | 24 | |
| | | | | | | | | | | | | | | | | | | | |
Net recoveries (charge-offs) | | | (519 | ) | | | 2,675 | | | | (1,008 | ) | | | (11,362 | ) | | | (364 | ) |
Transfer to allowance for unfunded commitments | | | — | | | | (116 | ) | | | — | | | | — | | | | — | |
Provision (adjustment) for loan losses | | | 300 | | | | (2,852 | ) | | | 392 | | | | 6,440 | | | | 7,300 | |
| | | | | | | | | | | | | | | | | | | | |
Balance at end of period | | $ | 2,616 | | | $ | 2,835 | | | $ | 3,128 | | | $ | 3,744 | | | $ | 8,666 | |
| | | | | | | | | | | | | | | | | | | | |
Ratio of net charge-offs (recoveries) to average loans outstanding during the period | | | 0.22 | % | | | (1.30 | )% | | | 0.52 | % | | | 4.25 | % | | | 0.11 | % |
| | | | | | | | | | | | | | | | | | | | |
Allowance for loan losses to loans | | | 1.04 | % | | | 1.28 | % | | | 1.57 | % | | | 1.80 | % | | | 2.77 | % |
| | | | | | | | | | | | | | | | | | | | |
The Company had a provision expense of $300,000 for 2006 compared to a provision adjustment of $2.9 million in 2005. The 2006 expense reflected normal provisions resulting from increased loan growth and an increase in nonperforming loans, offset by a decrease in charge-offs. Loans to a builder/developer group and its related parties being worked out had reserves of $734,000, $30,000, $261,000 and $831,000 at December 31, 2006, 2005, 2004 and 2003, respectively. The remaining reserves were necessary to reflect management’s view on the risk in the loan portfolio due to
10
the change in the portfolio mix and other problem loans. See also “Item 7. Management’s Discussion and Analysis of Financial Condition and Results of Operations – Loans – Credit Quality.”
The Company had a provision adjustment of $2.9 million for 2005 compared to a provision expense of $392,000 in 2004. The 2005 provision adjustment reflected net recoveries of $2.7 million. The 2005 recoveries of $4.2 million included settlements related to the CMC lease pools and full recovery of a $509,000 commercial real estate loan that was fully charged off in 2004. The two lease pools purchased from CMC totaling $10.9 million had 50% reserves at year-end 2002 due to an expected lengthy litigation process, and the remaining 50% was charged off in 2003 due to continuing uncertainty surrounding the prospects for eventual recovery from the sureties (see Item 3 — “Legal Proceedings” for more information on the CMC leases).
The following table sets forth a breakdown of the Company’s aggregate allowance for loan losses by loan category at the dates indicated. Management believes that the allowance can be allocated by category only on an approximate basis. The allocation of the allowance to each category is not necessarily indicative of future losses and does not restrict the use of the allowance to absorb losses in any category.
| | | | | | | | | | | | | | | | | | |
| | | At December 31, | |
| | | 2006 | | | 2005 | | | 2004 | |
| | | Amount | | Percent of Loans in Each Category to Total Loans | | | Amount | | Percent of Loans in Each Category to Total Loans | | | Amount | | Percent of Loans in Each Category to Total Loans | |
| | | (Dollars in thousands) | |
Real estate loans: | | | | | | | | | | | | | | | | | | |
Commercial | | $ | 716 | | 24.48 | % | | $ | 1,545 | | 30.58 | % | | $ | 2,013 | | 37.76 | % |
Residential | | | 245 | | 49.43 | | | | 502 | | 43.99 | | | | 462 | | 46.35 | |
Construction | | | 1,524 | | 18.91 | | | | 697 | | 20.01 | | | | 247 | | 6.61 | |
Commercial loans | | | 75 | | 4.90 | | | | 27 | | 3.56 | | | | 319 | | 7.10 | |
Consumer loans | | | 56 | | 2.28 | | | | 64 | | 1.86 | | | | 87 | | 2.18 | |
| | | | | | | | | | | | | | | | | | |
Total allowance for loan losses | | $ | 2,616 | | 100.00 | % | | $ | 2,835 | | 100.00 | % | | $ | 3,128 | | 100.00 | % |
| | | | | | | | | | | | | | | | | | |
| | | |
| | | At December 31, | | | | | | |
| | | 2003 | | | 2002 | | | | | | |
| | | Amount | | Percent of Loans in Each Category to Total Loans | | | Amount | | Percent of Loans in Each Category to Total Loans | | | | | | |
| | | (Dollars in thousands) | | | | | | |
Real estate loans: | | | | | | | | | | | | | | | | | | |
Commercial | | $ | 1,686 | | 36.12 | % | | $ | 1,414 | | 26.72 | % | | | | | | |
Residential | | | 620 | | 47.92 | | | | 772 | | 49.57 | | | | | | | |
Construction | | | 1095 | | 8.57 | | | | 539 | | 13.43 | | | | | | | |
Commercial loans | | | 192 | | 3.64 | | | | 5,618 | | 6.03 | | | | | | | |
Consumer loans | | | 151 | | 3.75 | | | | 323 | | 4.25 | | | | | | | |
| | | | | | | | | | | | | | | | | | |
Total allowance for loan losses | | $ | 3,744 | | 100.00 | % | | $ | 8,666 | | 100.00 | % | | | | | | |
| | | | | | | | | | | | | | | | | | |
Investment Activities
Interest and dividends on investment securities, mortgage-backed securities, collateralized mortgage obligations, FHLB stock and other investments provide the second largest source of income for the Bank (after interest on loans), constituting 28.3% of the Bank’s total interest income (and dividends) for fiscal 2006. The Bank maintains its liquid assets at levels believed adequate to meet requirements of normal banking activities and potential savings outflows.
As an Indiana savings bank, the Bank is authorized to invest without limitation in direct or indirect obligations of the United States, direct obligations of a United States territory, and direct obligations of the state or a municipal corporation or taxing district in Indiana. The Bank is also permitted to invest in bonds or other securities of a national mortgage association and the stock and obligations of a Federal Home Loan Bank. Indiana savings banks may also invest in collateralized mortgage obligations to the same extent as national banks. An Indiana savings bank may also purchase
11
for its own account other investment securities under such limits as the Department of Financial Institutions prescribes by rule, provided that the savings bank may not invest more than 10% of its equity capital in the investment securities of any one issuer. An Indiana savings bank may not invest in speculative bonds, notes or other indebtedness that are defined as securities and that are rated below the first four rating categories by a generally recognized rating service, or are in default. An Indiana savings bank may purchase an unrated security if it obtains financial information adequate to document the investment quality of the security.
The Bank’s investment portfolio consists primarily of obligations issued by federal agencies such as Fannie Mae, the FHLB and the Federal Farm Credit Banks System, mortgage-backed securities issued by Ginnie Mae and Freddie Mac. The Bank has also invested in trust-preferred securities, municipal securities and mutual funds and maintains interest-bearing deposits in other financial institutions (primarily the FHLBs). As a member of the FHLB System, the Bank is also required to hold stock in the FHLBs of Indianapolis and Cincinnati. At December 31, 2006, the Bank owned mutual funds issued by Shay Financial Services, Inc. with a book value of $12.9 million and a market value of $12.8 million. The Bank did not own any other security of a single issuer that had an aggregate book value in excess of 10% of its equity at December 31, 2006.
The following table sets forth the carrying value of the Bank’s investments in federal agency obligations and mortgage-backed securities, collaterized mortgage obligations and other investments at the dates indicated. All of these investments were available for sale.
| | | | | | |
| | | At December 31, |
| | | Available For Sale |
| | | 2006 | | 2005 |
| | | (In thousands) |
Federal agencies | | $ | 44,751 | | $ | 89,412 |
Mortgage-backed securities and collateral mortgage obligations | | | 37,207 | | | 45,715 |
Equity securities | | | 12,831 | | | 12,290 |
Municipal securities | | | 34,486 | | | 19,769 |
Other investment securities | | | 501 | | | 1,500 |
| | | | | | |
Total investments | | $ | 129,776 | | $ | 168,686 |
| | | | | | |
The following table sets forth information regarding maturity distribution and average yields for the Bank’s investment securities portfolio at December 31, 2006. The Bank’s federal agencies investment portfolio consists of obligations issued by Freddie Mac, FHLB, Fannie Mae and the Federal Farm Credit Banks System.
| | | | | | | | | | | | | | | | | | | | | | | | | | | | | | |
| | | Within 1 Year | | | 1-5 Years | | | 5-10 Years | | | Over 10 Years | | | Total | |
| | | Amount | | Yield | | | Amount | | Yield | | | Amount | | Yield | | | Amount | | Yield | | | Amount | | Yield | |
| | | (Dollars in thousands) | |
Federal agencies | | $ | 38,841 | | 2.77 | % | | $ | 5,910 | | 5.26 | % | | | — | | — | | | | — | | — | | | $ | 44,751 | | 3.10 | % |
Municipal securities (1) | | | — | | — | | | | 776 | | 3.70 | | | $ | 23,817 | | 3.56 | % | | $ | 9,893 | | 4.02 | % | | | 34,486 | | 3.70 | |
Equity securities (2) | | | 12,831 | | 4.86 | | | | — | | — | | | | — | | — | | | | — | | — | | | | 12,831 | | 4.86 | |
Trust preferred securities | | | — | | — | | | | — | | — | | | | — | | — | | | $ | 501 | | 8.60 | % | | | 501 | | 8.60 | |
| (1) | Presented on a tax equivalent basis using a tax rate of 34% |
| (2) | Equity securities have no stated maturity date |
12
The Bank’s mortgage-backed securities include both fixed and adjustable-rate securities. At December 31, 2006, the Bank’s mortgage-backed securities consisted of the following:
| | | | | | |
| | | Carrying | | Average | |
| | | Amount | | Rate | |
| | | (Dollars in thousands) | |
Variable-rate: | | | | | | |
Repricing in one year or less | | $ | 128 | | 5.44 | % |
Repricing in one to five years | | | 11,779 | | 4.20 | |
Repricing in five to ten years | | | 3,570 | | 4.61 | |
Repricing in more than ten years | | | 3,891 | | 5.66 | |
Fixed-rate: | | | | | | |
Maturing in five years or less | | | 13,532 | | 4.73 | |
Maturing in five to ten years | | | 4,307 | | 5.65 | |
Maturing in more than ten years | | | — | | — | |
| | | | | | |
Total | | $ | 37,207 | | | |
| | | | | | |
Sources of Funds
General. Savings accounts and other types of deposits have traditionally been an important source of the Bank’s funds for use in lending and for other general business purposes. In addition to deposit accounts, the Bank derives funds from loan repayments, loan sales, borrowings and operations. The availability of funds from loan sales and repayments is influenced by general interest rates and other market conditions. Borrowings may be used on a short-term basis to compensate for reductions in deposits or deposit inflows at less than projected levels and may be used on a longer-term basis to support expanded lending activities.
Deposits. The Bank attracts both short-term and long-term retail deposits from the general public by offering a wide assortment of deposit accounts and interest rates. The Bank offers regular savings accounts, NOW accounts, money market accounts, fixed interest rate certificates with varying maturities and negotiated rate jumbo certificates with various maturities. The Bank also offers tax-deferred individual retirement, Keogh retirement and simplified employer plan retirement accounts.
As of December 31, 2006, approximately 41.6%, or $134.2 million, of the Bank’s aggregate retail deposits consisted of various savings and demand deposit accounts from which customers are permitted to withdraw funds at any time without penalty.
Interest earned on passbook and statement accounts is paid from the date of deposit to the date of withdrawal and compounded semi-annually for the Bank. Interest earned on NOW and money market deposit accounts is paid from the date of deposit to the date of withdrawal and compounded and credited monthly. Management establishes the interest rate on these accounts weekly.
The Bank also makes available to its depositors a number of certificates of deposit with various terms and interest rates to be competitive in its market area. These certificates have minimum deposit requirements as well.
In addition to retail deposits, the Bank may obtain deposits from the brokered market. At December 31, 2006, the Bank held no brokered certificates. The Bank held a brokered certificate for $10.0 million at 4.80% at December 31, 2005.
13
The following table sets forth the change in dollar amount of deposits in the various types of deposit accounts offered by the Bank between the dates indicated.
| | | | | | | | | | | | | | | | | | | | |
| | | Balance at December 31, 2006 | | | Increase (Decrease) from Prior Year | | | Balance at December 31, 2005 | | | Increase (Decrease) From Prior Year | |
| | | | | | | | | | | (Dollars in thousands) | | | | |
Savings deposits | | $ | 22,637 | | 7.02 | % | | $ | (2,397 | ) | | $ | 25,034 | | 7.38 | % | | $ | (2,462 | ) |
NOW accounts | | | 47,489 | | 14.73 | | | | (4,444 | ) | | | 51,933 | | 15.30 | | | | (2,190 | ) |
Super NOW accounts | | | 36,577 | | 11.35 | | | | (11,961 | ) | | | 48,538 | | 14.30 | | | | (10,952 | ) |
Money market deposit accounts | | | 27,483 | | 8.52 | | | | 5,473 | | | | 22,010 | | 6.48 | | | | (8,833 | ) |
Certificate accounts: | | | | | | | | | | | | | | | | | | | | |
Certificates of $100,000 and more | | | 39,033 | | 12.11 | | | | (7,955 | ) | | | 46,988 | | 13.85 | | | | 19,445 | |
Fixed-rate certificates: | | | | | | | | | | | | | | | | | | | | |
12 months or less | | | 66,660 | | 20.67 | | | | (25,069 | ) | | | 91,729 | | 27.03 | | | | 9,936 | |
13-24 months | | | 46,249 | | 14.34 | | | | 18,637 | | | | 27,612 | | 8.14 | | | | 893 | |
25-36 months | | | 7,129 | | 2.21 | | | | (2,788 | ) | | | 9,917 | | 2.92 | | | | (5,345 | ) |
37 months or greater | | | 28,094 | | 8.71 | | | | 13,683 | | | | 14,411 | | 4.25 | | | | (4,881 | ) |
Variable-rate certificates: | | | | | | | | | | | | | | | | | | | | |
18 months | | | 1,083 | | 0.34 | | | | (96 | ) | | | 1,179 | | 0.35 | | | | (307 | ) |
| | | | | | | | | | | | | | | | | | | | |
Total | | $ | 322,434 | | 100.00 | % | | $ | (16,917 | ) | | $ | 339,351 | | 100.00 | % | | $ | (4,696 | ) |
| | | | | | | | | | | | | | | | | | | | |
14
The variety of deposit accounts offered by the Bank has permitted it to be competitive in obtaining funds and has allowed it to respond with flexibility to, but not eliminate, disintermediation (the flow of funds away from depository institutions such as savings institutions into direct investment vehicles such as government and corporate securities). In addition, the Bank has become much more subject to short-term fluctuation in deposit flows, as customers have become more interest rate conscious. The ability of the Bank to attract and maintain deposits and its costs of funds have been, and will continue to be, significantly affected by money market conditions. The Bank currently offers a variety of deposit products to the customer. They include noninterest-bearing and interest-bearing NOW accounts, interest-bearing Super NOW accounts, savings accounts, money market deposit accounts (“MMDA”) and certificates of deposit ranging in terms from three months to seven years. The Bank’s Super NOW account, which was introduced in 2003 and pays tiered premium money market rates with unlimited check writing privileges, had a portfolio balance of $36.6 million at December 31, 2006.
The following table sets forth the Bank’s average aggregate balances and interest rates. Average balances in 2006, 2005 and 2004 are calculated from actual daily balances.
| | | | | | | | | | | | | | | | | | |
| | | For the Year Ended December 31, | |
| | | 2006 | | | 2005 | | | 2004 | |
| | | | | Average | | | | | Average | | | | | Average | |
| | | Average | | Rate | | | Average | | Rate | | | Average | | Rate | |
| | | Balance | | Paid | | | Balance | | Paid | | | Balance | | Paid | |
| | | (Dollars in thousands) | |
Interest-bearing demand deposits | | $ | 69,990 | | 2.55 | % | | $ | 93,066 | | 2.29 | % | | $ | 76,804 | | 1.66 | % |
Money market deposit accounts | | | 22,460 | | 1.99 | | | | 27,140 | | 1.33 | | | | 39,703 | | 0.95 | |
Savings deposits | | | 23,867 | | 0.40 | | | | 26,657 | | 0.45 | | | | 29,796 | | 0.27 | |
Time deposits | | | 199,934 | | 4.13 | | | | 176,173 | | 3.11 | | | | 179,053 | | 2.55 | |
| | | | | | | | | | | | | | | | | | |
Total interest bearing deposits | | | 316,251 | | 3.35 | | | | 323,036 | | 2.50 | | | | 325,356 | | 1.94 | |
Non-interest-bearing demand and savings deposits | | | 19,719 | | | | | | 18,226 | | | | | | 21,704 | | | |
| | | | | | | | | | | | | | | | | | |
Total deposits | | $ | 335,970 | | | | | $ | 341,262 | | | | | $ | 347,060 | | | |
| | | | | | | | | | | | | | | | | | |
The following table sets forth the aggregate time deposits in the Bank classified by rates as of the dates indicated.
| | | | | | | | | |
| | | At December 31, |
| | | 2006 | | 2005 | | 2004 |
| | | (In thousands) |
Less than 2.00% | | $ | 144 | | $ | 2,774 | | $ | 60,372 |
2.00% - 3.99% | | | 41,879 | | | 113,290 | | | 79,172 |
4.00% - 5.99% | | | 146,180 | | | 75,678 | | | 31,696 |
6.00% - 7.99% | | | 45 | | | 94 | | | 855 |
| | | | | | | | | |
| | $ | 188,248 | | $ | 191,836 | | $ | 172,095 |
| | | | | | | | | |
The following table sets forth the amount and maturities of the Bank’s time deposits at December 31, 2006.
| | | | | | | | | | | | | | | |
| | | Amount Due |
| | | Less Than | | | | | | More Than | | |
Rate | | One Year | | 1-2 Years | | 2-3 Years | | 3 Years | | Total |
| | | (In thousands) |
Less than 2.00% | | $ | 144 | | | — | | | — | | | — | | $ | 144 |
2.00% - 3.99% | | | 25,949 | | $ | 10,954 | | $ | 3,548 | | $ | 1,428 | | | 41,879 |
4.00% - 5.99% | | | 133,726 | | | 817 | | | 3,353 | | | 8,284 | | | 146,180 |
6.00% - 7.99% | | | — | | | 4 | | | 12 | | | 29 | | | 45 |
| | | | | | | | | | | | | | | |
| | $ | 159,819 | | $ | 11,775 | | $ | 6,913 | | $ | 9,741 | | $ | 188,248 |
| | | | | | | | | | | | | | | |
15
The following table indicates the amount of the Bank’s certificates of deposit of $100,000 or more by time remaining until maturity at December 31, 2006.
| | | |
Maturity Period | | Certificates of Deposit |
| | | (In thousands) |
Three months or less | | $ | 6,929 |
Over three through six months | | | 6,294 |
Over six through twelve months | | | 20,923 |
Over twelve months | | | 4,887 |
| | | |
Total | | $ | 39,033 |
| | | |
Borrowings. Deposits are the primary sources of funds for the Bank’s lending and investment activities and for its general business purposes. The Bank also uses advances from the FHLB to supplement its supply of lendable funds, to meet deposit withdrawal requirements and to extend the terms of its liabilities. FHLB advances are typically secured by the Bank’s FHLB stock, a portion of first mortgage loans, investment securities and overnight deposits. At December 31, 2006, the Bank had $64.4 million of FHLB advances outstanding.
The Federal Home Loan Banks function as central reserve banks providing credit for savings institutions and certain other member financial institutions. As a member, the Bank is required to own capital stock in the FHLB and is authorized to apply for advances on the security of such stock and certain of its home mortgages and other assets (principally, securities which are obligations of, or guaranteed by, the United States) provided certain standards related to creditworthiness have been met.
On March 8, 2006, a trust established by the Company issued $10,000,000 in trust preferred securities. As part of this transaction, the Company issued $10,310,000 in subordinated debentures that mature on March 15, 2036 to the trust. The subordinated debentures bear a rate equal to the average of 6.71% and the three-month London Interbank Offered Rate (“LIBOR”) plus 150 basis points for the first five years following the offering. After the first five years, the subordinated debentures will bear a rate equal to 150 basis points over the three-month LIBOR rate.
The Company repaid a note payable to a third party financial institution, which had a balance of $300,000 during 2006. The proceeds of such note were used to finance stock repurchases during 1999.
The following table sets forth certain information regarding borrowings from the FHLBs at the dates and for the periods indicated.
| | | | | | | | | | | | |
| | | At or for the Year | |
| | | Year Ended December 31, | |
| | | 2006 | | | 2005 | | | 2004 | |
| | | (Dollars in thousands) | |
Amounts outstanding at end of period: | | | | | | | | | | | | |
FHLB advances | | $ | 64,373 | | | $ | 66,589 | | | $ | 40,040 | |
Subordinated debentures | | | 10,310 | | | | — | | | | — | |
Weighted average rate paid on | | | | | | | | | | | | |
FHLB advances at end of period | | | 4.60 | % | | | 3.93 | % | | | 3.70 | % |
Subordinated debentures | | | 6.79 | | | | — | | | | — | |
Maximum amount of borrowings outstanding at any month end: | | | | | | | | | | | | |
FHLB advances | | $ | 91,414 | | | $ | 73,729 | | | $ | 50,769 | |
Subordinated debentures | | | 10,310 | | | | — | | | | — | |
Approximate average amounts outstanding: | | | | | | | | | | | | |
FHLB advances | | $ | 58,707 | | | $ | 49,045 | | | $ | 32,672 | |
Subordinated debentures | | | 8,474 | | | | — | | | | — | |
Approximate weighted average rate paid on | | | | | | | | | | | | |
FHLB advances during the period | | | 4.48 | % | | | 3.86 | % | | | 3.81 | % |
Subordinated debentures | | | 6.79 | | | | — | | | | — | |
16
Average Balance Sheet
The following table sets forth certain information relating to the Bank’s average yield on assets and average cost of liabilities for the periods indicated. Such yields and costs are derived by dividing income or expenses by the average balance of assets or liabilities, respectively, for the periods presented. Interest/dividends from short-term investments and other interest-earning assets have been increased by $442,000, $367,000 and $344,000 for 2006, 2005, and 2004, respectively, from the amount listed on the income statement to reflect interest income on a tax-equivalent basis. Average balances for 2006, 2005 and 2004 are calculated from actual daily balances.
| | | | | | | | | | | | | | | | | | | | | | | | | | | |
| | | For the Year Ended December 31, | |
| | | 2006 | | | 2005 | | | 2004 | |
| | | | | | | Average | | | | | | | Average | | | | | | | Average | |
| | | Average | | Interest/ | | Yield/ | | | Average | | Interest/ | | Yield/ | | | Average | | Interest/ | | Yield/ | |
| | | Balance | | Dividends | | Cost | | | Balance | | Dividends | | Cost | | | Balance | | Dividends | | Cost | |
| | | (Dollars in thousands) | |
Interest-earning assets: | | | | | | | | | | | | | | | | | | | | | | | | | | | |
Loan portfolio | | $ | 232,479 | | $ | 16,212 | | 6.97 | % | | $ | 205,231 | | $ | 13,395 | | 6.53 | % | | $ | 194,826 | | $ | 12,760 | | 6.55 | % |
Mortgage-backed securities | | | 43,081 | | | 1,906 | | 4.42 | | | | 49,505 | | | 2,004 | | 4.05 | | | | 39,583 | | | 1,471 | | 3.72 | |
Securities | | | | | | | | | | | | | | | | | | | | | | | | | | | |
Taxable | | | 78,466 | | | 2,935 | | 3.74 | | | | 91,773 | | | 2,529 | | 2.76 | | | | 87,941 | | | 2,478 | | 2.82 | |
Tax-exempt | | | 23,393 | | | 1,300 | | 5.56 | | | | 19,966 | | | 1,079 | | 5.40 | | | | 20,231 | | | 1,011 | | 5.00 | |
Short-term investments and other interest-earning assets (1) | | | 26,029 | | | 693 | | 2.66 | | | | 28,317 | | | 1,142 | | 4.03 | | | | 33,849 | | | 955 | | 2.82 | |
| | | | | | | | | | | | | | | | | | | | | | | | | | | |
Total interest-earning assets | | | 403,448 | | | 23,046 | | 5.71 | | | | 394,792 | | | 20,149 | | 5.10 | | | | 376,430 | | | 18,675 | | 4.96 | |
Noninterest-earning assets | | | 42,399 | | | | | | | | | 39,918 | | | | | | | | | 47,988 | | | | | | |
| | | | | | | | | | | | | | | | | | | | | | | | | | | |
Total assets | | $ | 445,847 | | | | | | | | $ | 434,710 | | | | | | | | $ | 424,418 | | | | | | |
| | | | | | | | | | | | | | | | | | | | | | | | | | | |
Interest-bearing liabilities: | | | | | | | | | | | | | | | | | | | | | | | | | | | |
Demand deposits and savings | | $ | 116,317 | | | 2,327 | | 2.00 | | | $ | 146,863 | | | 2,616 | | 1.78 | | | $ | 146,303 | | | 1,733 | | 1.18 | |
Certificates of deposits | | | 199,934 | | | 8,264 | | 4.13 | | | | 176,173 | | | 5,472 | | 3.11 | | | | 179,053 | | | 4,572 | | 2.55 | |
| | | | | | | | | | | | | | | | | | | | | | | | | | | |
Total interest-bearing deposits | | | 316,251 | | | 10,591 | | 3.35 | | | | 323,036 | | | 8,088 | | 2.50 | | | | 325,356 | | | 6,305 | | 1.94 | |
Borrowings | | | 77,584 | | | 3,212 | | 4.14 | | | | 49,276 | | | 1,907 | | 3.87 | | | | 33,031 | | | 1,261 | | 3.82 | |
| | | | | | | | | | | | | | | | | | | | | | | | | | | |
Total interest-bearing liabilities | | | 393,835 | | | 13,803 | | 3.50 | | | | 372,312 | | | 9,995 | | 2.68 | | | | 358,387 | | | 7,566 | | 2.11 | |
| | | | | | | | | | | | | | | | | | | | | | | | | | | |
Noninterest-bearing liabilities | | | 17,927 | | | | | | | | | 24,279 | | | | | | | | | 27,370 | | | | | | |
| | | | | | | | | | | | | | | | | | | | | | | | | | | |
Total liabilities | | | 411,762 | | | | | | | | | 396,591 | | | | | | | | | 385,757 | | | | | | |
Shareholders’ equity | | | 34,085 | | | | | | | | | 38,119 | | | | | | | | | 38,661 | | | | | | |
| | | | | | | | | | | | | | | | | | | | | | | | | | | |
Total liabilities and shareholders’ equity | | $ | 445,847 | | | | | | | | $ | 434,710 | | | | | | | | $ | 424,418 | | | | | | |
| | | | | | | | | | | | | | | | | | | | | | | | | | | |
Net interest income | | | | | $ | 9,243 | | | | | | | | $ | 10,154 | | | | | | | | $ | 11,109 | | | |
| | | | | | | | | | | | | | | | | | | | | | | | | | | |
Interest rate spread | | | | | | | | 2.21 | % | | | | | | | | 2.42 | % | | | | | | | | 2.85 | % |
Net tax equivalent yield on interest-earning assets | | | | | | | | 2.29 | % | | | | | | | | 2.57 | % | | | | | | | | 2.95 | % |
Ratio of average interest-earning assets to average interest-bearing liabilities | | | | | | | | 104.65 | % | | | | | | | | 106.04 | % | | | | | | | | 105.03 | % |
| (1) | Includes interest-bearing deposits in other financial institutions, mutual funds, trust preferred securities, and FHLB stock. Presented on a tax equivalent basis using a tax rate of 34%. |
17
Trust Activities
During 1999, the Bank began offering trust, investment and estate planning services through its Ameriana Trust and Investment Management Services Division. Trust services consisted of personal trusts, testamentary trusts, investment agency accounts (discretionary and directed), guardianships, rollover IRAs (discretionary and directed) and estates (personal representative). These accounts were offered to customers within the Bank’s service areas in Indiana. In August 2006, the Bank closed the Trust Department.
Subsidiary Activities
The Company maintains two wholly-owned subsidiaries, the Bank and Ameriana Capital Trust I. The Company also holds a minority interest in a limited partnership organized to acquire and manage real estate-investments, which qualify for federal tax credits. The Bank has three wholly-owned subsidiaries: AFS, AIS and AIMI. At December 31, 2006, the Bank’s investments in its subsidiaries were approximately $5.5 million, consisting of direct equity investments.
Indiana savings banks may acquire or establish subsidiaries that engage in activities permitted to be performed by the savings bank itself, or permitted to operating subsidiaries of national banks. Under FDIC regulations, a subsidiary of a state bank may not engage as principal in any activity that is not of a type permissible for a subsidiary of a national bank unless the FDIC determines that the activity does not impose a significant risk to the affected insurance fund.
REGULATION AND SUPERVISION
The Company expects competition to increase in the future as a result of legislative, regulatory and technological changes and the continuing trend of consolidation in the financial services industry. Technological advances, for example, have lowered barriers to entry, allowed banks to expand their geographic reach by providing services over the Internet and made it possible for non-depository institutions to offer products and services that traditionally have been provided by banks. Changes in federal law permit affiliation among banks, securities firms and insurance companies, which promotes a competitive environment in the financial services industry. Competition for deposits and the origination of loans could limit the Company’s growth in the future.
Regulation and Supervision of the Company
General.The Company is a public company registered with the Securities and Exchange Commission (the “SEC”), whose common stock trades on the Nasdaq Stock Market, Inc. (“Nasdaq”) and is a bank holding company subject to regulation by the Federal Reserve Board under the BHCA. As a result, the activities of the Company are subject to certain requirements and limitations, which are described below. As a public reporting company, the Company is required to file annual, quarterly and current reports with the SEC. As a bank holding company, the Company is required to file annual and quarterly reports with the Federal Reserve Board and to furnish such additional information as the Federal Reserve Board may require pursuant to the BHCA. The Company is also subject to regular examination by the Federal Reserve Board.
Dividends.The Federal Reserve Board has the power to prohibit dividends by bank holding companies if their actions constitute unsafe or unsound practices. The Federal Reserve Board has issued a policy statement on the payment of cash dividends by bank holding companies, which expresses the Federal Reserve Board’s view that a bank holding company should pay cash dividends only to the extent that the company’s net income for the past year is sufficient to cover both the cash dividends and a rate of earnings retention that is consistent with the company’s capital needs, asset quality and overall financial condition. The Federal Reserve Board also indicated that it would be inappropriate for a bank holding company experiencing serious financial problems to borrow funds to pay dividends. Under the prompt corrective action regulations adopted by the Federal Reserve Board, the Federal Reserve Board may prohibit a bank holding company from paying any dividends if the holding company’s bank subsidiary is classified as “undercapitalized.” See “Regulation and Supervision of the Bank — Prompt Corrective Regulatory Action.”
18
Stock Repurchases.As a bank holding company, the Company is required to give the Federal Reserve Board prior written notice of any purchase or redemption of its outstanding equity securities if the gross consideration for the purchase or redemption, when combined with the net consideration paid for all such purchases or redemptions during the preceding 12 months, is equal to 10% or more of the Company’s consolidated net worth. The Federal Reserve Board may disapprove such a purchase or redemption if it determines that the proposal would violate any law, regulation, Federal Reserve Board order, directive, or any condition imposed by, or written agreement with, the Federal Reserve Board. This requirement does not apply to bank holding companies that are “well-capitalized,” “well-managed” and are not the subject of any unresolved supervisory issues.
Acquisitions. The Company is required to obtain the prior approval of the Federal Reserve Board to acquire all, or substantially all, of the assets of any bank or bank holding company or merge with another bank holding company. Prior Federal Reserve Board approval will also be required for the Company to acquire direct or indirect ownership or control of any voting securities of any bank or bank holding company if, after giving effect to such acquisition, the Company would, directly or indirectly, own or control more than 5% of any class of voting shares of such bank or bank holding company. In evaluating such transactions, the Federal Reserve Board considers such matters as the financial and managerial resources of and future prospects of the companies involved, competitive factors and the convenience and needs of the communities to be served. Bank holding companies may acquire additional banks in any state, subject to certain restrictions such as deposit concentration limits. With certain exceptions, the BHCA prohibits a bank holding company from acquiring direct or indirect ownership or control of more than 5% of the voting shares of a company that is not a bank or a bank holding company, or from engaging directly or indirectly in activities other than those of banking, managing or controlling banks, or providing services for its subsidiaries. The principal exceptions to these prohibitions involve certain non-bank activities, which, by statute or by Federal Reserve Board regulation or order, have been identified as activities closely related to the business of banking. The activities of the Company are subject to these legal and regulatory limitations under the BHCA and the related Federal Reserve Board regulations. The Gramm-Leach-Bliley Act of 1999 authorized a bank holding company that meets specified conditions, including being well-capitalized and well managed, to opt to become a “financial holding company,” and thereby engage in a broader array of financial activities than previously permitted. Such activities can include insurance underwriting and investment banking. The Federal Reserve Board has the power to order a holding company or its subsidiaries to terminate any activity, or to terminate its ownership or control of any subsidiary, when it has reasonable cause to believe that the continuation of such activity or such ownership or control constitutes a serious risk to the financial safety, soundness or stability of any bank subsidiary of that holding company.
Under the Change in Bank Control Act of 1978 (the “CBCA”), a 60-day prior written notice must be submitted to the Federal Reserve Board if any person (including a company), or any group acting in concert, seeks to acquire 10% of any class of the Company’s outstanding voting securities, unless the Federal Reserve Board determines that such acquisition will not result in a change of control of the bank. Under the CBCA, the Federal Reserve Board has 60 days within which to act on such notice taking into consideration certain factors, including the financial and managerial resources of the proposed acquiror, the convenience and needs of the community served by the bank and the antitrust effects of an acquisition.
Under the BHCA, any company would be required to obtain prior approval from the Federal Reserve Board before it may obtain “control” of the Company within the meaning of the BHCA. Control for BHCA purposes generally is defined to mean the ownership or power to vote 25 percent or more of any class of the Company’s voting securities or the ability to control in any manner the election of a majority of the Company’s directors. An existing bank holding company would be required to obtain the Federal Reserve Board’s prior approval under the BHCA before acquiring more than 5% of the Company’s voting stock.
Under Indiana banking law, prior approval of the Indiana Department of Financial Institutions is also required before any person may acquire control of an Indiana stock savings bank, bank or bank holding company. The Department will issue a notice approving the transaction if it determines that the persons proposing to acquire the savings bank, bank or bank holding company are qualified in character, experience and financial responsibility, and the transaction does not jeopardize the interests of the public.
Capital Requirements. The Federal Reserve Board has adopted guidelines regarding the capital adequacy of bank holding companies, which require bank holding companies to maintain specified minimum ratios of capital
19
to total assets and capital to risk-weighted assets. These requirements are substantially similar to those applicable to the Bank. See “— Regulation and Supervision of the Bank — Capital Requirements.”
Regulation and Supervision of the Bank
General. The Bank is subject to extensive regulation by the Indiana Department of Financial Institutions and the FDIC. The lending activities and other investments of the Bank must comply with various regulatory requirements. The Indiana Department of Financial Institutions and FDIC periodically examine the Bank for compliance with various regulatory requirements. The Bank must file reports with the Indiana Department of Financial Institutions and the FDIC describing its activities and financial condition. The Bank is also subject to certain reserve requirements promulgated by the Federal Reserve Board. This supervision and regulation is intended primarily for the protection of depositors. Certain of these regulatory requirements are referred to below or appear elsewhere in this Form 10-K. The regulatory discussion, however, does not purport to be an exhaustive treatment of applicable laws and regulations and is qualified in its entirety be reference to the actual statutes and regulations.
Federal Banking Law
Capital Requirements. Under FDIC regulations, state chartered banks that are not members of the Federal Reserve System are required to maintain a minimum leverage capital requirement consisting of a ratio of Tier 1 capital to total assets of 3% if the FDIC determines that the institution is not anticipating or experiencing significant growth and has well-diversified risk, including no undue interest rate risk exposure, excellent asset quality, high liquidity, good earnings, and in general, a strong banking organization, rated composite 1 under the Uniform Financial Institutions Rating System (the CAMELS rating system) established by the Federal Financial Institutions Examination Council. For all but the most highly rated institutions meeting the conditions set forth above, the minimum leverage capital ratio is 4%. Tier 1 capital is the sum of common stockholders’ equity, noncumulative perpetual preferred stock (including any related surplus) and minority interests in consolidated subsidiaries, minus all intangible assets (other than certain mortgage servicing assets, purchased credit card relationships, credit-enhancing interest-only strips and certain deferred tax assets), identified losses, investments in certain financial subsidiaries and non-financial equity investments.
In addition to the leverage capital ratio (the ratio of Tier I capital to total assets), state chartered nonmember banks must maintain a minimum ratio of qualifying total capital to risk-weighted assets of at least 8%, of which at least half must be Tier 1 capital. Qualifying total capital consists of Tier 1 capital plus Tier 2 capital (also referred to as supplementary capital) items. Tier 2 capital items include allowances for loan losses in an amount of up to 1.25% of risk-weighted assets, cumulative preferred stock and preferred stock with a maturity of over 20 years, certain other capital instruments and up to 45% of pre-tax net unrealized holding gains on equity securities. The includable amount of Tier 2 capital cannot exceed the institution’s Tier 1 capital. Qualifying total capital is further reduced by the amount of the bank’s investments in banking and finance subsidiaries that are not consolidated for regulatory capital purposes, reciprocal cross-holdings of capital securities issued by other banks, most intangible assets and certain other deductions. Under the FDIC risk-weighted system, all of a bank’s balance sheet assets and the credit equivalent amounts of certain off-balance sheet items are assigned to one of four broad risk-weight categories from 0% to 100%, based on the risks inherent in the type of assets or item. The aggregate dollar amount of each category is multiplied by the risk weight assigned to that category. The sum of these weighted values equals the bank’s risk-weighted assets.
At December 31, 2006, the Bank’s ratio of Tier 1 capital to total assets was 8.57%, its ratio of Tier 1 capital to risk-weighted assets was 14.46% and its ratio of total risk-based capital to risk-weighted assets was 15.49%.
During the second quarter of 2002, the Bank entered into a memorandum of understanding (“MOU”) with the FDIC and the DFI. Among other things, the MOU required the Bank to adopt written action plans with respect to certain classified assets, revise its lending policies, require greater financial information from borrowers, establish a loan review program and certain other internal controls. The FDIC and the DFI released the Bank from the MOU during the third quarter of 2005. The release of the MOU was contingent on the Bank’s adoption of a resolution that required the Bank to continue reducing the level of assets as substandard, formulate and implement a written Profit Plan, abstain from purchasing additional Bank Owned Life Insurance policies, formalize policies for leveraging strategies and maintain Tier 1 capital at or above 7% of assets. The Bank adopted the resolution on June 27, 2005.
20
On June 9, 2006, the Bank was released from the provisions of the Board resolution. Accordingly, the resolution is no longer in effect.
Investment Activities. Since the enactment of Federal Deposit Insurance Corporation Improvement Act, all state-chartered FDIC-insured banks, including savings banks, have generally been limited in their investment activities to principal and equity investments of the type and in the amount authorized for national banks, notwithstanding state law. The Federal Deposit Insurance Corporation Improvement Act and the FDIC regulations permit exceptions to these limitations. The FDIC is authorized to permit such institutions to engage in state authorized activities or investments not permissible for national banks (other than non-subsidiary equity investments) if they meet all applicable capital requirements and it is determined that such activities or investments do not pose a significant risk to the Bank Insurance Fund. The FDIC has adopted regulations governing the procedures for institutions seeking approval to engage in such activities or investments. The Gramm-Leach-Bliley Act of 1999 specifies that a non-member bank may control a subsidiary that engages in activities as principal that would only be permitted for a national bank to conduct in a “financial subsidiary” if a bank meets specified conditions and deducts its investment in the subsidiary for regulatory capital purposes.
Interstate Banking and Branching. The Riegle-Neal Interstate Banking and Branching Efficiency Act of 1994, permits adequately capitalized bank holding companies to acquire banks in any state subject to specified concentration limits and other conditions. The Interstate Banking Act also authorizes the interstate merger of banks. In addition, among other things, the Interstate Banking Act permits banks to establish new branches on an interstate basis provided that such action is specifically authorized by the law of the host state.
Dividend Limitations. The Bank may not pay dividends on its capital stock if its regulatory capital would thereby be reduced below the amount then required for the liquidation account established for the benefit of certain depositors of the Bank at the time of its conversion to stock form. In addition, the Bank may not pay dividends that exceed retained net income for the applicable calendar year to date, plus retained net income for the preceding two years without prior approval from the Indiana Department of Financial Institutions. At December 31, 2006, the shareholder’s equity of the Bank was $40.9 million.
Earnings of the Bank appropriated to bad debt reserves and deducted for federal income tax purposes are not available for payment of cash dividends or other distributions to stockholders without payment of taxes at the then current tax rate by the Bank on the amount of earnings removed from the reserves for such distributions. See “Federal and State Taxation.”
Under FDIC regulations, the Bank is prohibited from making any capital distributions if, after making the distribution, the Bank would have: (i) a total risk-based capital ratio of less than 8.0%; (ii) a Tier 1 risk-based capital ratio of less than 4.0%; or (iii) a leverage ratio of less than 4.0%. For additional information about dividend limitations see Note 15 in the Consolidated Financial Statements.
Insurance of Deposit Accounts. The Bank’s deposits are insured up to applicable limits by the Deposit Insurance Fund of the FDIC. The Deposit Insurance Fund is the successor to the Bank Insurance Fund and the Savings Association Insurance Fund, which were merged in 2006. The FDIC recently amended its risk-based assessment system for 2007 to implement authority granted by the Federal Deposit Insurance Reform Act of 2005 (“Reform Act”). Under the revised system, insured institutions are assigned to one of four risk categories based on supervisory evaluations, regulatory capital levels and certain other factors. An institution’s assessment rate depends upon the category to which it is assigned. Risk category I, which contains the least risky depository institutions, is expected to include more than 90% of all institutions. Unlike the other categories, Risk Category I contains further risk differentiation based on the FDIC’s analysis of financial ratios, examination component ratings and other information. Assessment rates are determined by the FDIC and currently range from five to seven basis points for the healthiest institutions (Risk Category I) to 43 basis points of assessable deposits for the riskiest (Risk Category IV). The FDIC may adjust rates uniformly from one quarter to the next, except that no single adjustment can exceed three basis points. No institution may pay a dividend if in default of the FDIC assessment.
The Reform Act also provided for a one-time credit for eligible institutions based on their assessment base as of December 31, 1996. Subject to certain limitations with respect to institutions that are exhibiting weaknesses, credits can be used to offset assessments until exhausted. The Bank’s one-time credit is expected to approximate
21
$482,628. The Reform Act also provided for the possibility that the FDIC may pay dividends to insured institutions once the Deposit Insurance fund reserve ratio equals or exceeds 1.35% of estimated insured deposits.
In addition to the assessment for deposit insurance, institutions are required to make payments on bonds issued in the late 1980s by the Financing Corporation to recapitalize a predecessor deposit insurance fund. This payment is established quarterly and during the calendar year ending December 31, 2006 averaged 1.28 basis points of assessable deposits.
The Reform Act provided the FDIC with authority to adjust the Deposit Insurance Fund ratio to insured deposits within a range of 1.15% and 1.50%, in contrast to the prior statutorily fixed ratio of 1.25%. The ratio, which is viewed by the FDIC as the level that the fund should achieve, was established by the agency at 1.25% for 2007.
The FDIC has authority to increase insurance assessments. A significant increase in insurance premiums would likely have an adverse effect on the operating expenses and results of operations of the Bank. Management cannot predict what insurance assessment rates will be in the future.
Insurance of deposits may be terminated by the FDIC upon a finding that the institution has engaged in unsafe or unsound practices, is in an unsafe or unsound condition to continue operations or has violated any applicable law, regulation, rule, order or condition imposed by the FDIC. The management of the Bank does not know of any practice, condition or violation that might lead to termination of deposit insurance.
Prompt Corrective Regulatory Action.The federal banking regulators are required to take prompt corrective action if an insured depository institution fails to satisfy certain minimum capital requirements, including a leverage limit, a risk-based capital requirement and any other measure deemed appropriate by the federal banking regulators for measuring the capital adequacy of an insured depository institution. All institutions, regardless of their capital levels, are restricted from making any capital distribution or paying any management fees if the institution would thereafter fail to satisfy the minimum levels for any of its capital requirements. An institution that fails to meet the minimum level for any relevant capital measure (an “undercapitalized institution”) may be: (i) subject to increased monitoring by the appropriate federal banking regulator; (ii) required to submit an acceptable capital restoration plan within 45 days; (iii) subject to asset growth limits; and (iv) required to obtain prior regulatory approval for acquisitions, branching and new lines of businesses. The capital restoration plan must include a guarantee by the institution’s holding company that the institution will comply with the plan until it has been adequately capitalized on average for four consecutive quarters, under which the holding company would be liable up to the lesser of 5% of the institution’s total assets or the amount necessary to bring the institution into capital compliance as of the date it failed to comply with its capital restoration plan. A “significantly undercapitalized” institution, as well as any undercapitalized institution that does not submit an acceptable capital restoration plan, may be subject to regulatory demands for recapitalization, broader application of restrictions on transactions with affiliates, limitations on interest rates paid on deposits, asset growth and other activities, possible replacement of directors and officers, and restrictions on capital distributions by any bank holding company controlling the institution. Any company controlling the institution may also be required to divest the institution or the institution could be required to divest subsidiaries. The senior executive officers of a significantly undercapitalized institution may not receive bonuses or increases in compensation without prior approval and the institution is prohibited from making payments of principal or interest on its subordinated debt. At their discretion, the federal banking regulators may also impose the foregoing sanctions on an undercapitalized institution if the regulators determine that such actions are necessary to carry out the purposes of the prompt corrective provisions. If an institution’s ratio of tangible capital to total assets falls below the “critically undercapitalized level” established by law,i.e., a ratio of tangible equity to total assets of 2% or less, the institution will be subject to conservatorship or receivership within specified time periods. Tangible equity is defined as core capital plus cumulative perpetual preferred stock (and related surplus) less all intangible assets other than qualifying supervisory goodwill and certain purchased mortgage servicing rights.
22
Under the implementing regulations, the federal banking regulators generally measure an institution’s capital adequacy on the basis of its total risk-based capital ratio (the ratio of its total capital to risk-weighted assets), Tier 1 risk-based capital ratio (the ratio of its core capital to risk-weighted assets) and leverage ratio (the ratio of its core capital to adjusted total assets). The following table shows the capital ratios required for the various prompt corrective action categories.
| | | | | | | | |
| | | Well Capitalized | | Adequately Capitalized | | Undercapitalized | | Significantly
Undercapitalized |
| | | | |
Total risk-based capital ratio | |
10.0% or more | | 8.0% or more | | Less than 8.0% | | Less than 6.0% |
| | | | |
Tier 1 risk-based capital ratio | |
6.0% or more | | 4.0% or more | | Less than 4.0% | | Less than 3.0% |
| | | | |
Leverage ratio | | 5.0% or more | | 4.0% or more * | | Less than 4.0% * | | Less than 3.0% |
| * | 3.0% if institution has a composite 1 CAMELS rating. |
The FDIC may reclassify a well-capitalized depository institution as adequately capitalized and may require an adequately capitalized or undercapitalized institution to comply with the supervisory actions applicable to institutions in the next lower capital category (but may not reclassify a significantly undercapitalized institution as critically undercapitalized) if the FDIC determines, after notice and an opportunity for a hearing, that the savings institution is in an unsafe or unsound condition or that the institution has received and not corrected a less-than-satisfactory rating for any CAMELS rating category.
Safety and Soundness Guidelines. Each federal banking agency was required to establish safety and soundness standards for the depository institutions under its authority. The interagency guidelines require depository institutions to maintain internal controls and information systems and internal audit systems that are appropriate for the size, nature and scope of the institution’s business. The guidelines also establish certain basic standards for loan documentation, credit underwriting, interest rate risk exposure and asset growth. The guidelines further provide that depository institutions should maintain safeguards to prevent the payment of compensation, fees and benefits that are excessive or that could lead to material financial loss, and should take into account factors such as compensation practices at comparable institutions. If the appropriate federal banking agency determines that a depository institution is not in compliance with the safety and soundness guidelines, it may require the institution to submit an acceptable plan to achieve compliance with the guidelines. A depository institution must submit an acceptable compliance plan to its primary federal regulator within 30 days of receipt of a request for such a plan. Failure to submit or implement a compliance plan may subject the institution to regulatory sanctions. Management believes that the Bank meets all the standards adopted in the interagency guidelines.
Enforcement. The FDIC has extensive enforcement authority over insured state savings banks, including the Bank. This enforcement authority includes, among other things, the ability to assess civil money penalties, issue cease and desist orders and remove directors and officers. In general, these enforcement actions may be initiated in response to violations of laws and regulations and unsafe or unsound practices. The FDIC has authority under federal law to appoint a conservator or receiver for an insured bank under limited circumstances. The FDIC is required, with certain exceptions, to appoint a receiver or conservator for an insured state non-member bank if that banks was “critically undercapitalized” on average during the calendar quarter beginning 270 days after the date on which the institution became “critically undercapitalized.” The FDIC may also appoint itself as conservator or receiver for an insured state non-member institution under specific circumstances on the basis of the institution’s financial condition or upon the occurrence of other events, including (1) insolvency; (2) substantial dissipation of assets or earnings through violations of law or unsafe or unsound practices; (3) existence of an unsafe or unsound condition to transact business; and (4) insufficient capital, or the incurring of losses that will deplete substantially all of the institution’s capital with no reasonable prospect of replenishment without federal assistance.
Reserve Requirements. Under Federal Reserve Board regulations, the Bank currently must maintain average daily reserves equal to 3% of net transaction accounts over $8.5 million up to $45.8 million, plus 10% on the remainder. This percentage is subject to adjustment by the Federal Reserve Board. Because required reserves must be maintained in the form of vault cash or in a noninterest-bearing account at a Federal Reserve Bank, the effect of the reserve requirement is to reduce the amount of the institution’s interest-earning assets. At December 31, 2006, the Bank met applicable Federal Reserve Board reserve requirements.
23
Federal Home Loan Bank System.The Bank is a member of the Federal Home Loan Bank System, which consists of 12 regional Federal Home Loan Banks governed and regulated by the Federal Housing Finance Board (“FHFB”). As a member, the Bank is required to purchase and hold stock in the FHLB of Indianapolis. As of December 31, 2006, the Bank held stock in the FHLB of Indianapolis in the amount $5.6 million and was in compliance with the above requirement.
The FHLB of Indianapolis serves as a reserve or central bank for the member institutions within its assigned region. It is funded primarily from proceeds derived from the sale of consolidated obligations of FHLB System. It makes loans (i.e., advances) to members in accordance with policies and procedures established by the FHLB System and the Board of Directors of the FHLB of Indianapolis.
The Bank is also a member of the FHLB of Cincinnati due to remaining borrowings after the merger of Ameriana-Ohio and the Bank. As of December 31, 2006, the Bank held stock in the FHLB of Cincinnati in the amount of $17,000 and was in compliance with requirements of membership.
Loans to Executive Officers, Directors and Principal Stockholders.Loans to directors, executive officers and principal stockholders of a state nonmember bank like the Bank must be made on substantially the same terms as those prevailing for comparable transactions with persons who are not executive officers, directors, principal stockholders or employees of the Bank unless the loan is made pursuant to a compensation or benefit plan that is widely available to employees and does not favor insiders. Loans to any executive officer, director and principal stockholder together with all other outstanding loans to such person and affiliated interests generally may not exceed 15% of the Bank’s unimpaired capital and surplus and all loans to such persons may not exceed the institution’s unimpaired capital and unimpaired surplus. Loans to directors, executive officers and principal stockholders, and their respective affiliates, in excess of the greater of $25,000 or 5% of capital and surplus (up to $500,000) must be approved in advance by a majority of the Board of Directors of the Bank with any “interested” director not participating in the voting. State nonmember banks are prohibited from paying the overdrafts of any of their executive officers or directors unless payment is made pursuant to a written, pre-authorized interest-bearing extension of credit plan that specifies a method of repayment or transfer of funds from another account at the bank. Loans to executive officers may not be made on terms more favorable than those afforded other borrowers and are restricted as to type, amount and terms of credit. In addition, Section 106 of the BHCA prohibits extensions of credit to executive officers, directors, and greater than 10% stockholders of a depository institution by any other institution which has a correspondent banking relationship with the institution, unless such extension of credit is on substantially the same terms as those prevailing at the time for comparable transactions with other persons and does not involve more than the normal risk of repayment or present other unfavorable features.
Transactions with Affiliates. A state nonmember bank or its subsidiaries may not engage in “covered transactions” with any one affiliate in an amount greater than 10% of such bank’s capital stock and surplus, and for all such transactions with all affiliates, a state non-member bank is limited to an amount equal to 20% of capital stock and surplus. All such transactions must also be on terms substantially the same, or at least as favorable, to the bank or subsidiary as those provided to a nonaffiliate. Certain covered transactions must meet prescribed collateralization requirements. The term “covered transaction” includes the making of loans, purchase of assets, issuance of a guarantee and similar other types of transactions. An affiliate of a state non-member bank is any company or entity which controls or is under common control with the state non-member bank and, for purposes of the aggregate limit on transactions with affiliates, any subsidiary that would be deemed a financial subsidiary of a national bank. In a holding company context, the parent holding company of a state non-member bank (such as the Company) and any companies which are controlled by such parent holding company are affiliates of the state non-member bank. The BHCA further prohibits a depository institution from extending credit to or offering any other services, or fixing or varying the consideration for such extension of credit or service, on the condition that the customer obtain some additional service from the institution or certain of its affiliates or not obtain services of a competitor of the institution, subject to certain limited exceptions.
Patriot Act. The Patriot Act is intended to strengthen U.S. law enforcement’s and the intelligence communities’ abilities to work cohesively to combat terrorism on a variety of fronts. The potential impact of the Patriot Act on financial institutions of all kinds is significant and wide ranging. The Patriot Act contains sweeping anti-money laundering and financial transparency laws and imposes various regulations including standards for verifying client identification at account opening, and rules to promote cooperation among financial institutions, regulators and law enforcement entities in identifying parties that may be involved in terrorism or money laundering.
24
Indiana Banking Law
Branching. An Indiana savings bank is entitled to establish one or more branchesde novo or by acquisition in any location or locations in Indiana. The savings bank is required to file an application with the Department of Financial Institutions. Approval of the application is contingent upon the Department’s determination that after the establishment of the branch, the savings bank will have adequate capital, sound management and adequate future earnings. An application to branch must also be approved by the FDIC.
Lending Limits. Indiana savings banks are not subject to percentage of asset or capital limits on their commercial, consumer and non-residential mortgage lending, and accordingly, have more flexibility in structuring their portfolios than federally chartered savings banks. Indiana law provides that a savings bank may not make a loan or extend credit to a borrower or group of borrowers in excess of 15% of its unimpaired capital and surplus. An additional 10% of capital and surplus may be lent if secured by specified readily marketable collateral.
Enforcement. The Department has authority to take enforcement action against an Indiana savings bank in appropriate cases, including the issuance of cease and desist orders, removal of directors or officers, issuance of civil money penalties and appointment of a conservator or receiver.
Other Activities. The Bank is authorized to engage in a variety of agency and fiduciary activities including acting as executors of an estate, transfer agent and in other fiduciary capacities. On approval from the Department of Financial Institutions, the Bank would be permitted to exercise any right granted to national banks.
Federal and State Taxation
Federal Taxation. The Company and its subsidiaries file a consolidated federal income tax return on a calendar year end. Saving banks are subject to the provisions of the Internal Revenue Code of 1986 (the “Code”) in the same general manner as other corporations. However, institutions, such as the Bank, which met certain definitional tests and other conditions prescribed by the Code benefited from certain favorable provisions regarding their deductions from taxable income for annual additions to their bad debt reserve.
The Company’s federal income tax returns have not been audited in the past five years.
State Taxation. The State of Indiana imposes a franchise tax which is assessed on qualifying financial institutions, such as the Bank. The tax is based upon federal taxable income before net operating loss carryforward deductions (adjusted for certain Indiana modifications) and is levied at a rate of 8.5% of apportioned adjusted taxable income.
The Company’s state income tax returns have not been audited in the past five years.
25
EXECUTIVE OFFICERS OF THE REGISTRANT
| | | | |
Name | | Age at December 31, 2006 | | Principal Position |
Jerome J. Gassen | | 56 | | President and Chief Executive Officer of the Bank and the Company |
Timothy G. Clark | | 56 | | Executive Vice President and Chief Operating Officer of the Bank and the Company |
John J. Letter | | 61 | | Senior Vice President, Treasurer and Chief Financial Officer of the Bank and the Company |
James A. Freeman | | 57 | | Senior Vice President – Head of Commercial Lending of the Bank |
Matthew Branstetter | | 39 | | Senior Vice President - Chief Credit Officer |
Unless otherwise noted, all officers have held the position described below for at least the past five years.
Jerome J. Gassenwas appointed President and Chief Executive Officer and director of the Company and the Bank on June 1, 2005. Prior to joining the Company, Mr. Gassen served as Executive Vice President of Banking of Old National Bank, Evansville, Indiana from August 2003 until January 2005. Before serving as Executive Vice President, Mr. Gassen was the Northern Region President of Old National Bank from January 2000 to August 2003. Mr. Gassen also served on Old National Bank’s Board of Directors from January 2000 until January 2005. Mr. Gassen served as President and Chief Operating Officer of American National Bank and Trust Company, Muncie, Indiana from 1997 until January 2000, when American National was acquired by Old National Bank.
Timothy G. Clark joined the Bank as Executive Vice President and Chief Operating Officer on September 2, 1997. He was elected Executive Vice President and Chief Operating Officer of the Company on October 23, 2000. He previously held the position of Regional Executive and Area President at National City Bank of Indiana in Seymour, Indiana for 5 years and prior to that held senior management positions with Central National Bank in Greencastle, Indiana for 5 years and Hancock Bank & Trust in Greenfield, Indiana for 13 years.
John J. Letter was appointed Senior Vice President, Treasurer and Chief Financial Officer of the Company and the Bank on January 22, 2007. Prior to joining the Company, Mr. Letter served as Regional President with Old National Bank in Muncie, Indiana from September 2004 to April 2005. Prior to being named Regional President, Mr. Letter also served as District President with Old National Bank from November 2003 to September 2004 and Regional Chief Financial Officer – Old National Bank from August 2000 to November 2003. Mr. Letter was also Chief Financial Officer and Controller with American National Bank in Muncie from March 1997 to August 2000.
James A. Freeman was named Senior Vice President–Head of Commercial Lending in September 2005. Prior to joining Ameriana, Mr. Freeman was Regional Senior Credit Officer (Small Business Division) for National City Bank from September 2002 to September 2005, where he managed the credit underwriting process for a four state region. Mr. Freeman also served as Credit Department Manager/Vice President for Fifth Third Bank, Indiana from January 2000 to August 2002.
Matthew Branstetterwas appointed as Senior Vice President–Chief Credit Officer in March 2006. Prior to joining Ameriana, Mr. Branstetter was Senior Vice President, Credit Administrator for Old National Bank in Indianapolis from 2000 to 2006, where he managed the credit underwriting process for a four-state region. During his banking career, Mr. Branstetter also served as Vice President-Comptroller and Corporate Treasurer for FCN Bank in Brookville, Indiana from 1989 to 2000.
26
An investment in shares of our common stock involves various risks. Before deciding to invest in our common stock, you should carefully consider the risks described below in conjunction with the other information in this Form 10-K, including the items included as exhibits. Our business, financial condition and results of operations could be harmed by any of the following risks or by other risks that have not been identified or that we may believe are immaterial or unlikely. The value or market price of our common stock could decline due to any of these risks. The risks discussed below also include forward-looking statements, and our actual results may differ substantially from those discussed in these forward-looking statements.
A significant percentage of our assets are invested in lower yielding investments, which has contributed to our low profitability. Our results of operations are substantially dependent on our net interest income, which is the difference between the interest income earned on our interest-earning assets and the interest expense paid on our interest-bearing liabilities. The low interest-rate environment that existed in 2001 through mid-2004 led to the refinancing of a substantial portion of our one- to four-family loans. These loans were subsequently sold to minimize the potential interest rate risk associated with maintaining such long-term low-interest loans in portfolio. The proceeds from such loans sales were invested in government agency securities. Additionally, during such period, our residential loan production decreased due to reduced demand in our market area. Accordingly, at December 31, 2006, 29.7% of our assets were invested in investment and mortgage-backed securities. These investments yield substantially less than the loans we hold in our portfolio. To counteract this, in 2004, we devoted more resources towards loan production, specifically residential and commercial real estate lending, with the goal of investing a greater proportion of our assets in loans. We have also made efforts to reduce our cost of funds, through more disciplined and effective pricing strategies, and to reduce our operating expenses, by reducing staffing levels and freezing our pension plan in June 2004. During the fourth quarter of 2006, we sold approximately $34.0 million of available for sale investment securities in order to reduce the Company’s interest rate risk and reduce the overall level of investments as a percent of total assets to more reasonable levels. Together, these efforts are designed to increase our net interest income. There can be no assurance, however, that we will be able to increase the origination of loans, successfully reduce our cost of funds or operating expenses or that we will be able to successfully implement this strategy.
Certain interest rate movements may hurt our earnings.Between June 30, 2004 and June 30, 2006, the U.S. Federal Reserve increased its target for the federal funds rate in 25 basis point increments from 1.00% to 5.25%. The increase in the federal funds rate has had the affect of increasing short-term market interest rates. While short-term market interest rates (which we use as a guide to price our deposits) have increased, longer-term market interest rates (which we use as a guide to price our longer-term loans) have not. This “flattening” and inversion of the market yield curve has had a negative impact on our interest rate spread and net interest margin, which has reduced our profitability. If short-term interest rates continue to rise, and if rates on our deposits continue to reprice upwards faster than the rates on our long-term loans and investments, we could continue to experience compression of our interest rate spread and net interest margin, which would have a negative effect on our profitability.
Our increased emphasis on commercial and construction lending may expose us to increased lending risks.At December 31, 2006, our loan portfolio consisted of $62.1 million, or 24.7% of commercial real estate loans, $48.0 million, or 19.0% of construction loans and $12.4 million, or 4.9% of commercial and industrial loans. We intend to continue to increase our emphasis on the origination of commercial and construction lending. However, these types of loans generally expose a lender to greater risk of non-payment and loss than one- to four-family residential mortgage loans because repayment of the loans often depends on the successful operation of the property, the income stream of the borrowers and, for construction loans, the accuracy of the estimate of the property’s value at completion of construction and the estimated cost of construction. Such loans typically involve larger loan balances to single borrowers or groups of related borrowers compared to one- to four-family residential mortgage loans. Commercial and industrial loans expose us to additional risks since they typically are made on the basis of the borrower’s ability to make repayments from the cash flow of the borrower’s business and are secured by non-real estate collateral that may depreciate over time. In addition, since such loans generally entail greater risk than one- to four-family residential mortgage loans, we may need to increase our allowance for loan losses in the future to account for the likely increase in probable incurred credit losses associated with the
27
growth of such loans. Also, many of our commercial and construction borrowers have more than one loan outstanding with us. Consequently, an adverse development with respect to one loan or one credit relationship can expose us to a significantly greater risk of loss compared to an adverse development with respect to a one- to four-family residential mortgage loan.
Our level of non-performing loans and classified assets expose us to increased lending risks. Further, our allowance for loan losses may prove to be insufficient to absorb losses in our loan portfolio.At December 31, 2006, our non-performing loans totaled $3.4 million, representing 1.4% of total loans. In addition, loans that we have classified as either substandard, doubtful or loss totaled $9.9 million, representing 3.9% of total loans. If these loans do not perform according to their terms and the collateral is insufficient to pay any remaining loan balance, we may experience loan losses, which could have a material effect on our operating results. Like all financial institutions, we maintain an allowance for loan losses to provide for loans in our portfolio that may not be repaid in their entirety. We believe that our allowance for loan losses is maintained at a level adequate to absorb probable losses inherent in our loan portfolio as of the corresponding balance sheet date. However, our allowance for loan losses may not be sufficient to cover actual loan losses, and future provisions for loan losses could materially adversely affect our operating results.
In evaluating the adequacy of our allowance for loan losses, we consider numerous quantitative factors, including our historical charge-off experience, growth of our loan portfolio, changes in the composition of our loan portfolio and the volume of delinquent and classified loans. In addition, we use information about specific borrower situations, including their financial position and estimated collateral values, to estimate the risk and amount of loss for those borrowers. Finally, we also consider many qualitative factors, including general and economic business conditions, current general market collateral valuations, trends apparent in any of the factors we take into account and other matters, which are by nature more subjective and fluid. Our estimates of the risk of loss and amount of loss on any loan are complicated by the significant uncertainties surrounding our borrowers’ abilities to successfully execute their business models through changing economic environments, competitive challenges and other factors. Because of the degree of uncertainty and susceptibility of these factors to change, our actual losses may vary from our current estimates.
At December 31, 2006, our allowance for loan losses as a percentage of total loans was 1.04%. Our regulators, as an integral part of their examination process, periodically review our allowance for loan losses and may require us to increase our allowance for loan losses by recognizing additional provisions for loan losses charged to expense, or to decrease our allowance for loan losses by recognizing loan charge-offs, net of recoveries. Any such additional provisions for loan losses or charge-offs, as required by these regulatory agencies, could have a material adverse effect on our financial condition and results of operations.
Our cost of operations is high relative to our assets. Our failure to maintain or reduce our operating expenses costs could hurt our profits. Our operating expenses, which consist primarily of salaries and employee benefits, occupancy, furniture and equipment expense, professional fees and data processing expense, totaled $13.4 million for the year ended December 31, 2006 compared to $14.5 million for the year ended December 31, 2005. Our efficiency ratio totaled 102.5% for the year ended December 31, 2006 compared to 104.40% for the year ended December 31, 2005. We have made a concerted effort to control our expenses and operate more efficiently, through such actions as reducing personnel and freezing of our pension plan. However, the failure to reduce our expenses could hurt our profits.
Strong competition within our market area could hurt our profits and slow growth.We face intense competition both in making loans and attracting deposits. This competition has made it more difficult for us to make new loans and has occasionally forced us to offer higher deposit rates. Price competition for loans and deposits might result in us earning less on our loans and paying more on our deposits, which reduces net interest income. According to the FDIC, as of June 30, 2006, we held 37.8% of the deposits in Henry County, Indiana, which was the largest market share of deposits out of the four financial institutions that held deposits in this county. We also held 9.73% of the deposits in Hancock County, Indiana, which was the 4th largest market share of deposits out of the ten financial institutions that held deposits in this county. Some of the institutions with which we compete have substantially greater resources and lending limits than we have and may offer services that we do not provide. We expect competition to increase in the future as a result of legislative, regulatory and technological changes and
28
the continuing trend of consolidation in the financial services industry. Our profitability depends upon our continued ability to compete successfully in our market area.
If we do not achieve profitability on our new offices, it may negatively impact our earnings. We opened our McCordsville office in February 2004 and plan to open a new loan production office in Carmel in mid-April 2006. Numerous factors contribute to the performance of a new office, such as a suitable location, qualified personnel and an effective marketing strategy. Additionally, it takes time for a new office to generate significant deposits and make sufficient loans to produce enough income to offset expenses, some of which, like salaries and occupancy expense, are relatively fixed costs. We expect that it may take a period of time before the new office can become profitable. During this period, operating this new office may negatively impact our net income.
If the value of real estate in central Indiana were to decline materially, a significant portion of our loan portfolio could become under-collateralized, which could have a material adverse effect on us.With most of our loans concentrated in central Indiana, a decline in local economic conditions could adversely affect the value of the real estate collateral securing our loans. A decline in property values would diminish our ability to recover on defaulted loans by selling the real estate collateral, making it more likely that we would suffer losses on defaulted loans. Additionally, a decrease in asset quality could require additions to our allowance for loan losses through increased provisions for loan losses, which would hurt our profits. Also, a decline in local economic conditions may have a greater effect on our earnings and capital than on the earnings and capital of larger financial institutions whose real estate loan portfolios are more geographically diverse. Real estate values are affected by various factors in addition to local economic conditions, including, among other things, changes in general or regional economic conditions, governmental rules or policies and natural disasters.
Our business is subject to the success of the local economy in which we operate.Because the majority of our borrowers and depositors are individuals and businesses located and doing business in central Indiana our success significantly depends to a significant extent upon economic conditions in central Indiana. Adverse economic conditions in our market area could reduce our growth rate, affect the ability of our customers to repay their loans and generally affect our financial condition and results of operations. Conditions such as inflation, recession, unemployment, high interest rates, short money supply, scarce natural resources, international disorders, terrorism and other factors beyond our control may adversely affect our profitability. We are less able than a larger institution to spread the risks of unfavorable local economic conditions across a large number of diversified economies. Any sustained period of increased payment delinquencies, foreclosures or losses caused by adverse market or economic conditions in Indiana could adversely affect the value of our assets, revenues, results of operations and financial condition. Moreover, we cannot give any assurance we will benefit from any market growth or favorable economic conditions in our primary market areas if they do occur.
The trading history of our common stock is characterized by low trading volume. Our common stock may be subject to sudden decreases.Although our common stock trades on Nasdaq Global Market, it has not been regularly traded. We cannot predict whether a more active trading market in our common stock will occur or how liquid that market might become. A public trading market having the desired characteristics of depth, liquidity and orderliness depends upon the presence in the marketplace of willing buyers and sellers of our common stock at any given time, which presence is dependent upon the individual decisions of investors, over which we have no control.
The market price of our common stock may be highly volatile and subject to wide fluctuations in response to numerous factors, including, but not limited to, the factors discussed in other risk factors and the following:
| | • | | actual or anticipated fluctuations in our operating results; |
| | • | | changes in interest rates; |
| | • | | changes in the legal or regulatory environment in which we operate; |
| | • | | press releases, announcements or publicity relating to us or our competitors or relating to trends in our industry; |
29
| | • | | changes in expectations as to our future financial performance, including financial estimates or recommendations by securities analysts and investors; |
| | • | | future sales of our common stock; |
| | • | | changes in economic conditions in our marketplace, general conditions in the U.S. economy, financial markets or the banking industry; and |
| | • | | other developments affecting our competitors or us. |
These factors may adversely affect the trading price of our common stock, regardless of our actual operating performance, and could prevent you from selling your common stock at or above the price you desire. In addition, the stock markets, from time to time, experience extreme price and volume fluctuations that may be unrelated or disproportionate to the operating performance of companies. These broad fluctuations may adversely affect the market price of our common stock, regardless of our trading performance.
We operate in a highly regulated environment and we may be adversely affected by changes in laws and regulations.Ameriana Bank, SB is subject to extensive regulation, supervision and examination by the Indiana Department of Financial Institutions, its chartering authority, and by the FDIC, as insurer of its deposits. Ameriana Bancorp is subject to regulation and supervision by the Federal Reserve Board. Such regulation and supervision govern the activities in which an institution and its holding company may engage, and are intended primarily for the protection of the insurance fund and for the depositors and borrowers of Ameriana Bank, SB. The regulation and supervision by the Indiana Department of Financial Institutions and the FDIC are not intended to protect the interests of investors in Ameriana Bancorp common stock. Regulatory authorities have extensive discretion in their supervisory and enforcement activities, including the imposition of restrictions on our operations, the classification of our assets and determination of the level of our allowance for loan losses. Any change in such regulation and oversight, whether in the form of regulatory policy, regulations, legislation or supervisory action, may have a material impact on our operations.
Provisions of our articles of incorporation, bylaws and Indiana law, as well as state and federal banking regulations, could delay or prevent a takeover of us by a third party.Provisions in our articles of incorporation and bylaws and the corporate law of the State of Indiana could delay, defer or prevent a third party from acquiring us, despite the possible benefit to our shareholders, or otherwise adversely affect the price of our common stock. These provisions include: supermajority voting requirements for certain business combinations; the election of directors to staggered terms of three years; and advance notice requirements for nominations for election to our board of directors and for proposing matters that shareholders may act on at shareholder meetings. In addition, we are subject to Indiana laws, including one that prohibits us from engaging in a business combination with any interested shareholder for a period of five years from the date the person became an interested shareholder unless certain conditions are met. These provisions may discourage potential takeover attempts, discourage bids for our common stock at a premium over market price or adversely affect the market price of, and the voting and other rights of the holders of, our common stock. These provisions could also discourage proxy contests and make it more difficult for you and other shareholders to elect directors other than the candidates nominated by our Board.
| Item 1B. | Unresolved Staff Comments |
Not applicable.
30
The following table sets forth the location of the Company’s office facilities at December 31, 2006, and certain other information relating to these properties at that date.
| | | | | | | | | | | | |
| | | Year Acquired | | Total Investment | | Net Book
Value | | Owned/ Leased | | Square Feet |
| | | | | |
| | | (Dollar amounts in thousands) |
Main Office: | | | | | | | | | | | | |
2118 Bundy Avenue | | | | | | | | | | | | |
New Castle, Indiana | | 1958 | | $ | 1,704 | | $ | 377 | | Owned | | 20,500 |
| | | | | |
Branch Offices: | | | | | | | | | | | | |
1311 Broad Street | | | | | | | | | | | | |
New Castle, Indiana | | 1890 | | | 1,136 | | | 252 | | Owned | | 18,000 |
| | | | | |
956 North Beechwood Street | | | | | | | | | | | | |
Middletown, Indiana | | 1971 | | | 334 | | | 50 | | Owned | | 5,500 |
| | | | | |
22 North Jefferson Street | | | | | | | | | | | | |
Knightstown, Indiana | | 1979 | | | 401 | | | 145 | | Owned | | 3,400 |
| | | | | |
1810 North State Street | | | | | | | | | | | | |
Greenfield, Indiana | | 1995 | | | 1,161 | | | 867 | | Owned | | 5,800 |
| | | | | |
99 Dan Jones Road | | | | | | | | | | | | |
Avon, Indiana | | 1995 | | | 1,560 | | | 1,213 | | Owned | | 12,600 |
| | | | | |
1724 East 53rd Street | | | | | | | | | | | | |
Anderson, Indiana | | 1993 | | | 734 | | | 606 | | Owned | | 4,900 |
| | | | | |
488 West Main Street | | | | | | | | | | | | |
Morristown, Indiana | | 1998 | | | 359 | | | 286 | | Owned | | 2,600 |
| | | | | |
7435 West U.S. 52 | | | | | | | | | | | | |
New Palestine, Indiana | | 1999 | | | 944 | | | 755 | | Owned | | 3,300 |
| | | | | |
6653 West Broadway | | | | | | | | | | | | |
McCordsville, Indiana | | 2004 | | | 1,140 | | | 1,091 | | Owned | | 3,400 |
| | | | | |
Ameriana Insurance | | | | | | | | | | | | |
Agency, Inc | | | | | | | | | | | | |
1908 Bundy Avenue | | | | | | | | | | | | |
New Castle, Indiana | | 1999 | | | 384 | | | 325 | | Owned | | 5,000 |
| | | | | | | | | | | | |
Total | | | | $ | 9,857 | | $ | 5,967 | | | | |
| | | | | | | | | | | | |
The total net book value of $5,967,000 shown above for the Company’s office facilities is $1,379,000 less than the total of $7,346,000 shown for premises and equipment shown on the consolidated balance sheet on Page 13. This difference represents the net book value as of December 31, 2006 for furniture, equipment, and automobiles.
The Bank purchased land in 2003 in the amount of $236,000 for future bank use. In 2006, it was determined that the land was not located in an area consistent with our strategic plan for future growth. Accordingly, it was sold in February 2006 for $238,000.
31
As previously reported, the Bank has been involved in litigation relating to its interests in the two pools of equipment leases originated by Commercial Money Center, Inc. (“CMC”), a California-based equipment leasing company that is now in bankruptcy.
In June and September, 2001, the Bank purchased the income streams from two separate pools of commercial leases totaling $12,003,000. Each lease within each pool was supported by a surety bond issued by one of two insurance companies rated “A” or better by A.M. Best Company, Inc. The bonds guaranteed payment of all amounts due under the leases in the event of default by the lessee. Each pool was sold by the terms of a Sales and Servicing Agreement, which provided that the insurers will service the leases. In each case, the insurers assigned their servicing rights and responsibilities to Commercial Servicing Corporation (“CSC”), a Company which is in bankruptcy proceedings.
When the lease pools went into default, notice was given to each insurer. American Motorists Insurance Company made payments for a few months under a reservation of rights. RLI Insurance Company paid nothing. We have now settled our claims against American Motorists Insurance Company for $2.3 million plus the retention of all payments made prior to the settlement.
We continue to litigate against RLI Insurance Company. The principal balance due on the pool for which RLI issued bonds is approximately $4.2 million. During the litigation, RLI employed U.S. Bancorp to service the leases. The Bank has now received in excess of $180,000 in monies collected by the servicer.
There are approximately 17 banks with claims against 5 insurance companies stemming from the CMC lease bond cases. All of the cases are currently pending in Cleveland, Ohio pursuant to a multi-district litigation order. Discovery proceedings have nearly concluded. Expert discovery is scheduled for completion by April 25, 2007.
The Bank believes the surety bonds are enforceable against RLI –- there are 53 lease bonds at issue. Additionally, the Bank believes the terms of the Sale and Servicing Agreement pursuant to which the bonds were issued is enforceable.
The Bank has filed a request for permission to file a motion for summary judgment. Once the discovery proceedings have concluded, it is hoped the Court will grant permission to file the motion for summary judgment. The Bank is optimistic about its prospects for recovery by means of summary judgment or trial. It is the Bank’s intent to continue to aggressively pursue its claims against RLI for the principal and interest owed, plus attorney fees, litigation expenses, damages, and other costs. It is unlikely that the RLI litigation will be resolved in 2007.
| Item 4. | Submission of Matters to a Vote of Security Holders |
No matter was submitted to a vote of security holders during the fourth quarter of the fiscal year covered by this Report.
32
PART II
| Item 5. | Market for the Registrant’s Common Equity, Related Stockholder Matters and Issuer Purchasers of Equity Securities |
Market for Common Equity and Related Stockholder Matters
The Company’s common stock, par value $1.00 per share, is traded on the Nasdaq Global Market under the symbol “ASBI.” On March 28, 2007, there were 503 holders of record of the Company’s common stock. The Company began paying quarterly dividends during the fourth quarter of fiscal year 1987. The Company’s ability to pay dividends depends on a number of factors including our capital requirements, our financial condition and results of operations, tax considerations, statutory and regulatory limitations and general economic conditions. No assurance can be given that we will continue to pay dividends or that they will not be reduced in the future. See Note 11 to the “Consolidated Financial Statements” included under Item 8 of this Annual Report for a discussion of the restrictions on the payment of cash dividends by the Company.
The following table sets forth the high and low sales prices for the common stock as reported on the Nasdaq Global Market and the cash dividends declared on the common stock for each full quarterly period during the last two fiscal years.
| | | | | | | | | | | | | | | | | | |
| | | 2006 | | 2005 |
Quarter Ended: | | High | | Low | | Dividends Declared | | High | | Low | | Dividends Declared |
March 31 | | $ | 13.28 | | $ | 12.02 | | $ | 0.16 | | $ | 16.04 | | $ | 13.30 | | $ | 0.16 |
June 30 | | | 14.50 | | | 12.84 | | | 0.16 | | | 15.35 | | | 12.90 | | | 0.16 |
September 30 | | | 14.25 | | | 12.51 | | | 0.16 | | | 14.64 | | | 12.75 | | | 0.16 |
December 31 | | | 14.24 | | | 12.00 | | | 0.04 | | | 14.00 | | | 11.93 | | | 0.16 |
33
Stock Performance Graph
The following graph compares the cumulative total return of the Company common stock with the cumulative total return of the Nasdaq index for stocks of savings institutions (U.S. Companies, SIC 6030-39) and the Index for the Nasdaq Stock Market (U.S. Companies, all SIC). The graph assumes that $100 was invested on December 31, 2001. Cumulative total return assumes reinvestment of all dividends.
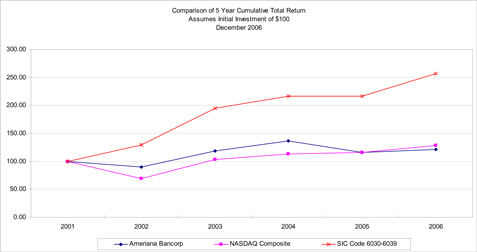
| | | | | | | | | | | | | | | | | | |
| | | 2001 | | 2002 | | 2003 | | 2004 | | 2005 | | 2006 |
Ameriana Bancorp | | $ | 100.00 | | $ | 89.85 | | $ | 118.77 | | $ | 136.80 | | $ | 115.75 | | $ | 121.44 |
Nasdaq Stock Market US | | | 100.00 | | | 68.76 | | | 103.68 | | | 113.18 | | | 115.57 | | | 128.38 |
Savings Institutions Index | | | 100.00 | | | 129.38 | | | 194.93 | | | 216.73 | | | 216.03 | | | 257.24 |
34
Purchases of Equity Securities
The following table presents information regarding the Company’s stock repurchases during the three months ended December 31, 2006.
| | | | | | | | | |
Period | | Total Number of Shares Purchased | | Average Price
Paid per Share | | Total Number of
Shares Purchased as
Part of Publicly
Announced Plans or
Programs | | Maximum Number
of Shares that May
Yet Be Purchased
Under the Plans or
Programs |
October | | — | | | — | | — | | 138,016 |
November | | 13,300 | | $ | 13.75 | | 13,300 | | 124,716 |
December | | 61,720 | | | 13.05 | | 61,720 | | 62,996 |
| | | | | | | | | |
Total | | 75,020 | | | 13.17 | | 75,020 | | |
| | | | | | | | | |
On May 2, 2006, the Company announced that the Board of Directors authorized the Company to repurchase up to 225,000 shares, or approximately 7.1%, of the of the outstanding shares of the Company’s common stock. The repurchases will be conducted through open-market purchases or privately negotiated transactions and will be made from time to time depending on market conditions and other factors. No time limit was placed on the duration of the share repurchase program. Any repurchased shares will be held as treasury stock and will be available for general corporate purposes.
| Item 6. | Selected Financial Data |
| | | | | | | | | | | | | | | |
| | | (Dollars in thousands, except per share data) At December 31, |
Summary of Financial Condition | | 2006 | | 2005 | | 2004 | | 2003 | | 2002 |
Cash | | $ | 7,986 | | $ | 8,318 | | $ | 8,645 | | $ | 9,275 | | $ | 7,481 |
Investment securities | | | 129,776 | | | 168,686 | | | 170,354 | | | 137,788 | | | 58,155 |
Loans net of allowances for loan losses | | | 249,272 | | | 218,291 | | | 196,344 | | | 204,141 | | | 304,586 |
Interest-bearing deposits and stock in Federal Home Loan Bank | | | 9,730 | | | 13,401 | | | 15,673 | | | 12,222 | | | 44,974 |
Other assets | | | 40,482 | | | 40,673 | | | 37,537 | | | 39,027 | | | 41,611 |
| | | | | | | | | | | | | | | |
Total assets | | $ | 437,246 | | $ | 449,369 | | $ | 428,553 | | $ | 402,453 | | $ | 456,807 |
| | | | | | | | | | | | | | | |
| | | | | |
Deposits noninterest-bearing | | $ | 19,905 | | $ | 18,788 | | $ | 19,649 | | $ | 19,039 | | $ | 19,124 |
Deposits interest-bearing | | | 302,529 | | | 320,563 | | | 324,398 | | | 326,705 | | | 383,063 |
Borrowings | | | 74,683 | | | 66,889 | | | 40,390 | | | 10,230 | | | 6,432 |
Other liabilities | | | 7,005 | | | 7,472 | | | 5,473 | | | 7,605 | | | 9,148 |
| | | | | | | | | | | | | | | |
Total liabilities | | | 404,122 | | | 413,712 | | | 389,910 | | | 363,579 | | | 417,767 |
Shareholders’ equity | | | 33,124 | | | 35,657 | | | 38,643 | | | 38,874 | | | 39,040 |
| | | | | | | | | | | | | | | |
Total liabilities and shareholders’ equity | | $ | 437,246 | | $ | 449,369 | | $ | 428,553 | | $ | 402,453 | | $ | 456,807 |
| | | | | | | | | | | | | | | |
35
| | | | | | | | | | | | | | | | | | | |
| | | Year Ended December 31, | |
Summary of Earnings | | 2006 | | | 2005 | | | 2004 | | | 2003 | | 2002 | |
Interest income | | $ | 22,604 | | | $ | 19,782 | | | $ | 18,331 | | | $ | 23,096 | | $ | 29,973 | |
Interest expense | | | 13,803 | | | | 9,995 | | | | 7,566 | | | | 10,066 | | | 17,541 | |
| | | | | | | | | | | | | | | | | | | |
Net interest income | | | 8,801 | | | | 9,787 | | | | 10,765 | | | | 13,030 | | | 12,432 | |
Provision (adjustment) for loan losses | | | 300 | | | | (2,852 | ) | | | 392 | | | | 6,440 | | | 7,300 | |
Other income | | | 2,462 | | | | 4,115 | | | | 3,961 | | | | 10,540 | | | 2,949 | |
Other expense | | | 13,366 | | | | 14,513 | | | | 13,381 | | | | 13,602 | | | 13,675 | |
| | | | | | | | | | | | | | | | | | | |
Income (loss) before taxes | | | (2,403 | ) | | | 2,241 | | | | 953 | | | | 3,528 | | | (5,594 | ) |
Income taxes (benefit) | | | (1,433 | ) | | | 183 | | | | (473 | ) | | | 1,110 | | | (2,519 | ) |
| | | | | | | | | | | | | | | | | | | |
Net income (loss) | | $ | (970 | ) | | $ | 2,058 | | | $ | 1,426 | | | $ | 2,418 | | $ | (3,075 | ) |
| | | | | | | | | | | | | | | | | | | |
Basic earnings (loss) per share | | $ | (0.31 | ) | | $ | 0.65 | | | $ | 0.45 | | | $ | 0.77 | | $ | (0.98 | ) |
Diluted earnings (loss) per share | | $ | (0.31 | ) | | $ | 0.65 | | | $ | 0.45 | | | $ | 0.77 | | $ | (0.98 | ) |
| | | | | | | | | | | | | | | | | | | |
Dividends declared per share | | $ | 0.52 | | | $ | 0.64 | | | $ | 0.64 | | | $ | 0.64 | | $ | 0.64 | |
| | | | | | | | | | | | | | | | | | | |
Book value per share | | $ | 10.85 | | | $ | 11.23 | | | $ | 12.26 | | | $ | 12.35 | | $ | 12.40 | |
| | | | | | | | | | | | | | | | | | | |
| | | | | | | | | | | | | | | |
| | | Year Ended December 31, | |
Other Selected Data | | 2006 | | | 2005 | | | 2004 | | | 2003 | | | 2002 | |
Return on average assets | | (0.22 | )% | | 0.47 | % | | 0.34 | % | | 0.53 | % | | (0.60 | )% |
Return on average equity | | (2.85 | ) | | 5.40 | | | 3.69 | | | 6.20 | | | (7.32 | ) |
Ratio of average equity to average assets | | 7.65 | | | 8.77 | | | 9.11 | | | 8.62 | | | 8.18 | |
Dividend payout ratio (1) | | NM | (2) | | 98.46 | | | 142.22 | | | 83.12 | | | NM | (2) |
Number of full-service bank offices | | 10 | | | 10 | | | 10 | | | 9 | | | 11 | |
(1) | Dividends per share declared divided by net income per share. |
36
| Item 7. | Management’s Discussion and Analysis of Financial Condition and Results of Operations |
Who We Are
Ameriana Bancorp (the “Company”) is an Indiana chartered bank holding company organized in 1987 by Ameriana Savings Bank, FSB (the “Bank”). The Company is subject to regulation and supervision by the Federal Reserve Bank. The Bank began banking operations in 1890. On June 29, 2002, the Bank converted to an Indiana savings bank and adopted the name, Ameriana Bank and Trust, SB. In August 2006, the Bank closed its Trust Department and adopted its present name. The Bank is subject to regulation and supervision by the Federal Deposit Insurance Corporation (the “FDIC”), and the Indiana Department of Financial Institutions (the “DFI”). Our deposits are insured to applicable limits by the Savings Association Insurance Fund administered by the FDIC. References in this Form 10-K to “we,” “us,” and “our” refer to Ameriana Bancorp and/or the Bank, as appropriate.
We are headquartered in New Castle, Indiana. We conduct business through our main office at 2118 Bundy Avenue, New Castle, Indiana and through nine branch offices located in New Castle, Middletown, Knightstown, Morristown, Greenfield, Anderson, Avon, McCordsville and New Palestine, Indiana.
The Bank has three wholly owned subsidiaries, Ameriana Insurance Agency (“AIA”), Ameriana Financial Services, Inc. (“AFS”) and Ameriana Investment Management, Inc. (“AIMI”). AIA provides insurance sales from offices in New Castle, Greenfield and Avon, Indiana. AFS offers debt protection products through its ownership of an interest in Family Financial Holdings, Incorporated, Columbus, Indiana. In 2002, AFS acquired a 20.9% ownership interest in Indiana Title Insurance Company, LLC (“ITIC”) through which it offers title insurance. AFS also operates a brokerage facility in conjunction with Linsco/Private Ledger. AIMI manages the Bank’s investment portfolio. The Company holds a minority interest in a limited partnership, House Investments, organized to acquire and manage real estate investments which qualify for federal tax credits.
What We Do
The Bank is a community-oriented financial institution. Our principal business consists of attracting deposits from the general public and investing those funds primarily in mortgage loans on single-family residences, multi-family, construction loans, commercial real estate loans, and, to a lesser extent, commercial and industrial loans, small business lending, home improvement, and consumer loans. We have from time to time purchased loans and loan participations in the secondary market. We also invest in various federal and government agency obligations and other investment securities permitted by applicable laws and regulations, including mortgage-backed, municipal and equity securities. We offer customers in our market area time deposits with terms from three months to seven years, interest-bearing and non interest-bearing checking accounts, savings accounts and money market accounts. Our primary source of borrowings is Federal Home Loan Bank (“FHLB”) advances. Through our subsidiaries, we engage in insurance and brokerage activities.
Our primary source of income is net interest income, which is the difference between the interest income earned on our loan and investment portfolios and the interest expense incurred on our deposits and borrowing portfolios. Our loan portfolio typically earns more interest than the investment portfolio, and our deposits typically have a lower average rate than FHLB advances. Several factors affect our net interest income. These factors include the loan, investment, deposit, and borrowing portfolio balances, their composition, the length of their maturity, re-pricing characteristics, liquidity, credit, and interest rate risk, as well as market and competitive conditions.
Financial Challenges in Recent Years
Since 2001, when we posted net income of $3.8 million, our Company has faced several significant financial challenges.
In 2002, we posted a net loss of $3.1 million. This loss was due primarily to security losses and large loan provision expenses. We disposed of $137 million in securities for a pre-tax loss of $3.2 million. The securities were sold to address a considerable increase in the Bank’s interest rate risk primarily due to volatile collateralized mortgage obligations. We also experienced a decline in credit quality of our loan portfolio which resulted in provision for loan loss of $7.3 million. Non-performing loans grew substantially in 2002 to $18.4 million at
37
December 31, 2002 compared to $2.6 million at December 31, 2001. The main cause for the increase was related to the two lease pools originated by Commercial Money Center (“CMC”), a now bankrupt company, totaling $10.9 million, which both went into default. The Bank became involved in a variety of litigation related to these lease pools. Each lease within each pool is supported by a surety bond issued by one of two insurance companies. Both insurance companies denied responsibility for payment. In addition to the leases, non-performing assets included loans to a builder/development group and its related parties totaling $3.6 million.
In 2003, we posted net income of $2.4 million. Net income during this period included charges totaling $5.9 million, taken primarily to write off the remainder of the troubled lease portfolio. These charges were offset to some extent by a gain of $5.5 million from the sale of two branches in Ohio. Unfavorable market conditions since 2000 reduced earnings in the employee pension fund and accordingly caused a significant increase in the contribution required by the Company. Nonperforming loans were $8.5 million at December 31, 2003 and consisted primarily of commercial real estate.
In 2004, we posted net income of $1.4 million. A decline in net interest income and gains on sale of loans were major factors in the results. Heavy mortgage loan refinancing from 2001 to 2003 shifted a major portion of our earning assets from loans to lower earning investments. Short-term interest rates grew rapidly in the last six months of the year leading to a flattening of the yield curve. The combination of these two events squeezed our net interest margin. The slowdown in mortgage loan refinancing resulted in the decline in gains on sale of loans. We froze the defined-benefit pension plan on June 30, 2004 to discontinue accruing benefits to plan participants beyond what was already earned to date and to prevent new participants from entering the plan. The change was made in an effort to control and reduce pension plan expense in the future. Nonperforming loans were $5.9 million at December 31, 2004 and consisted primarily of commercial real estate.
Our net income was $2.1 million in 2005, which included significant recoveries from leases charged off in prior periods, offset by a one-time large payment towards our pension liability. We had significant recoveries in 2005, primarily from the two equipment lease pools originated by CMC, a now bankrupt company, that were charged off for $10.9 million during 2002 and 2003. The lease recoveries included a $2.3 million settlement against one of the two sureties for the lease pools and a payment of $1.1 million received in settlement of the CMC bankruptcy. The litigation against RLI Insurance Company (“RLI”), the other surety for the lease pools, continues. We also made a $1.1 million voluntary payment to fund a portion of our pension liability in 2005. Short-term interest rates continued to rise in 2005 which led to a flattening yield curve. As a result, our net interest margin declined to 2.57% in 2005 from 2.95% in 2004. We experienced solid loan growth in 2005, with net loans increasing 11% for the year. Credit quality improved in 2005 with a decline in non-performing loans of over 50%.
Overview of 2006
| | • | Net loss for 2006 of $970,000 represented a $3.0 million decrease from 2005 net income of $2.1 million. |
| | • | A flat and inverted yield curve further squeezed our net interest margin. |
| | • | We achieved 14% loan growth, primarily in commercial construction real estate loans. |
| | • | Non-performing loans increased by $857,000 largely due to a residential building project and the purchase of a judgment as part of a work-out strategy on a multi-family complex. |
2006 proved to be a challenging year for the Company because of the difficult economic environment and due to issues related to prior years that required resolution. Management made decisions that in some cases had a negative impact on current earnings, but were part of an overall strategic plan that is expected to result in meaningful earnings improvement in 2007 and subsequent years.
The substantial decrease to a net loss of $970,000 in 2006 from 2005 net income of $2.1 million was due primarily to four factors:
| | 1) | A decline in the net interest margin, resulting mostly from the flattening of the U.S. Treasury yield curve and its impact on other market interest rates; |
| | 2) | Management’s balance sheet restructuring strategy involving the sale of $34.0 million of low-yielding U.S. Government Agency securities resulting in a loss of $821,000; |
| | 3) | $514,000 recorded in 2006 as a loss related to the classification of $13.3 million in investment securities being permanently impaired; and |
38
| | 4) | $2.9 million in recoveries recorded in 2005 related to leases charged off in prior periods. |
Strategic Summary
Overall credit quality in the organization has improved during 2006. While non-accruals increased, the level of classified loans has declined $6.7 million or 39% over the prior year end. The percentage of classified loans to total risk-based capital is now just under 25%. The decline was a result of improved work-out strategies undertaken by the Bank. Significant focus on underwriting, and a portfolio risk approach should allow the Bank to manage credit risk effectively.
Our net interest margin, which was 2.29% in 2006, will continue to be impacted by actions of the Federal Reserve. The Federal Reserve raised the Federal funds target rate four times in 25 basis point increments during the first six months of 2006, and then held the rate at 5.25% for the balance of the year. The U.S. Treasury yield curve remained relatively flat throughout the entire year, which created issues for most financial institutions. Our projections for 2007 are based on the Federal Reserve leaving short-term interest rates unchanged for the remainder of the year. Our interest-bearing liabilities re-price to current market conditions faster than our interest-earning assets. Most of the variable-rate mortgage loans in our portfolio lag the market 45 days when they are scheduled to re-price. A stabilized short-term interest rate environment in the second half of 2007 would provide interest-earning assets an opportunity to catch-up, leading to an expected improvement in the net interest margin. We also expect an improvement in the mix of interest-earning assets in 2007 that may further improve the net interest margin.
The proceeds from the November 2006 sale of $34.0 million in low-yielding U.S. Government Agency securities was used primarily to pay off borrowings from the Federal Home Loan Bank, which had increased to $88.4 million at October 31, 2006. Future cash flows from maturing securities will be used to pay down short-term borrowings and fund new loan volume. The steady redeployment of cash flows from the investment portfolio into higher-yielding assets should improve the net interest margin.
As part of the corporate plan, the Company’s short and long-term action plans include:
| | • | Recruiting seasoned commercial lenders, credit analysts and key risk managers. |
| | • | Diversifying the loan portfolio by reducing the concentration in commercial real estate and expanding commercial, residential real estate and consumer lending. |
| | • | Focusing on retail banking activities including emphasizing transactional deposit growth, expanding customer relationships as measured by products per household and acquisition of new customer relationships. |
| | • | Reducing the operating expenses of the Company. |
| | • | Reducing the size of the investment portfolio as a percent of total assets. |
We will continue to focus on these strategies in 2007 in order to continue the improvements realized in 2006.
We believe the continued success of the Company is dependent on its ability to provide its customers with financial advice and solutions that assist them in achieving their goals. We will accomplish this mission by:
| | • | being our customer’s first choice for financial advice and solutions; |
| | • | informing and educating customers on the basics of money management; and |
| | • | understanding and meeting customer’s financial needs throughout their life cycle. |
Serving customers requires the commitment of all Ameriana associates to provide exceptional service and sound advice. We believe these qualities will differentiate us from our competitors and increase profitability and shareholder value.
39
In order to meet our goals, we have undertaken the following strategies:
Build Relationships With Our Customers.Banking is essentially a transaction business. Nevertheless, numerous industry studies have shown that customers want a relationship with their bank and banker based on trust and sound advice. Based on this information, we are focusing our efforts on building relationships and improving our products per household.
Achieve Superior Customer Service.We continually measure customer satisfaction through post-transaction surveys. Our evaluations include in-person customer surveys, mystery shoppers and other in-store performance metrics.
Develop and Deliver Fully Integrated Financial Advice and Comprehensive Solutions to Meet Customer Life Events.We are re-packaging our products around customer “life events” such as planning for retirement, buying a home and saving for college education rather than traditional transaction accounts, savings and loan products.
Establish Strong Brand Awareness.We believe it is important to create a value proposition that is understood and appreciated by our customers. Accordingly, we are undertaking an effort through our marketing, customer communications and design of our Banking Centers to create the “Ameriana Bank” brand.
Use Technology to Expand Our Customer Base.We continue to enhance our electronic delivery of products and services to our customers. Our technology-based services will include business interest banking and cash management services, business remote item capture and on-line loan and account opening. These services will allow us to reach more customers effectively and conveniently.
Develop an Innovative Delivery System.We believe our bank branches must evolve into “Financial Stores” that showcase our financial products and offer our customers an environment that is conducive to interacting with knowledgeable Ameriana associates and with our technology based products.
Increase Market Share in Existing Markets and Expand into New Markets.We believe there is significant opportunity to increase our products per household with existing customers and attract new customers in our existing markets. Longer term, we would like to “fill-in” our existing franchise in Central Indiana as our profitability improves.
Critical Accounting Policies
The accounting and reporting policies of the Company are maintained in accordance with accounting principles generally accepted in the United States and conform to general practices within the banking industry. The Company’s significant accounting policies are described in detail in the Notes to the Company’s Consolidated Financial Statements. The preparation of financial statements in conformity with generally accepted accounting principles (“GAAP”) requires management to make estimates and assumptions. The financial position and results of operations can be affected by these estimates and assumptions, and such estimates and assumptions are integral to the understanding of reported results. Critical accounting policies are those policies that management believes are the most important to the portrayal of the Company’s financial condition and results, and they require management to make estimates that are difficult, subjective or complex.
Allowance for Loan Losses. The allowance for loan losses provides coverage for probable losses in the Company’s loan portfolio. Management evaluates the adequacy of the allowance for credit losses each quarter based on changes, if any, in underwriting activities, the loan portfolio composition (including product mix and geographic, industry or customer-specific concentrations), trends in loan performance, regulatory guidance and economic factors. This evaluation is inherently subjective, as it requires the use of significant management estimates. Many factors can affect management’s estimates of specific and expected losses, including volatility of default probabilities, rating migrations, loss severity and economic and political conditions. The allowance is increased through provisions charged to operating earnings and reduced by net charge-offs.
The Company determines the amount of the allowance based on relative risk characteristics of the loan portfolio. The allowance recorded for commercial loans is based on reviews of individual credit relationships and an
40
analysis of the migration of commercial loans and actual loss experience. The allowance recorded for non-commercial loans is based on an analysis of loan mix, risk characteristics of the portfolio, fraud loss and bankruptcy experiences and historical losses, adjusted for current trends, for each loan category or group of loans. The allowance for loan losses relating to impaired loans is based on the loan’s observable market price, the collateral for certain collateral-dependent loans, or the discounted cash flows using the loan’s effective interest rate.
Regardless of the extent of the Company’s analysis of customer performance, portfolio trends or risk management processes, certain inherent but undetected losses are probable within the loan and lease portfolio. This is due to several factors, including inherent delays in obtaining information regarding a customer’s financial condition or changes in their unique business conditions, the judgmental nature of individual loan evaluations, collateral assessments and the interpretation of economic trends. Volatility of economic or customer-specific conditions affecting the identification and estimation of losses for larger, non-homogeneous credits and the sensitivity of assumptions utilized to establish allowances for homogenous groups of loans are among other factors. The Company estimates a range of inherent losses related to the existence of these exposures. The estimates are based upon the Company’s evaluation of risk associated with the commercial and consumer allowance levels and the estimated impact of the current economic environment.
Mortgage Servicing Rights. Mortgage servicing rights (“MSRs”) associated with loans originated and sold, where servicing is retained, are capitalized and included in other intangible assets in the consolidated balance sheet. The value of the capitalized servicing rights represents the present value of the future servicing fees arising from the right to service loans in the portfolio. Critical accounting policies for MSRs relate to the initial valuation and subsequent impairment tests. The methodology used to determine the valuation of MSRs requires the development and use of a number of estimates, including anticipated principal amortization and prepayments of that principal balance. Events that may significantly affect the estimates used are changes in interest rates, mortgage loan prepayment speeds and the payment performance of the underlying loans. The carrying value of the MSRs is periodically reviewed for impairment based on a determination of fair value. Impairment, if any, is recognized through a valuation allowance and is recorded as amortization of intangible assets.
FINANCIAL CONDITION
Total assets decreased $12.2 million or 2.7% to $437.2 million at December 31, 2006 from $449.4 million at December 31, 2005. The decrease was primarily due to the strategy employed by management in November 2006 to sell low-yielding U.S. Government Agency securities and use the proceeds mostly to pay down borrowed money.
Cash and Cash Equivalents
Total cash and cash equivalents decreased $2.2 million to $12.1 million at December 31, 2006 from $14.3 million at December 31, 2005. Cash on hand and in other institutions decreased $332,000, or 4.0%, to $8.0 million at December 31, 2006. Interest-bearing deposits decreased $1.9 million, or 31.4%, to $4.1 million at December 31, 2006. The decrease in cash and cash equivalents was primarily due to the reduction of interest-bearing demand deposits, as those funds were needed to fund loan growth.
Securities
Investment securities decreased $38.9 million to $129.8 million at December 31, 2006, from $168.7 million at December 31, 2005, primarily as a result of the strategy employed in November 2006 that involved the sale of $34.0 million in low-yielding securities, offset by an increase in municipal securities, which may provide the Company with additional tax benefits.
Investments held to maturity were all reclassified as available for sale in the third quarter of 2005, which resulted in a $158.3 million reduction of investments held to maturity and a $156.6 million increase in investments available for sale at December 31, 2005. This reclassification provided us with more flexibility to address changes in interest rate risk or capitalize on opportunities to generate higher interest earnings. The change had no effect on our earnings but did reduce shareholders’ equity due to the recording of unrealized net losses in other comprehensive income. All of our investments are evaluated for other-than-temporary impairment, and such impairment, if any, is recognized as a charge to earnings.
41
The following table identifies changes in the investment securities carrying values:
| | | | | | | | | | | | | |
| (Dollars in thousands) | |
| | | 2006 | | | 2005 | | | $ Change | | | %
Change |
|
December 31: | | | | | | | | | | | | | |
Mortgage-backed and collateralized mortgage obligations | | $ | 37,207 | | $ | 45,715 | | $ | (8,508 | ) | | (18.61 | )% |
Federal agencies | | | 44,751 | | | 89,412 | | | (44,661 | ) | | (49.95 | ) |
Municipal securities | | | 34,486 | | | 19,769 | | | 14,717 | | | 74.44 | |
Equity securities | | | 12,831 | | | 12,290 | | | 541 | | | 4.40 | |
Trust preferred | | | 501 | | | 1,500 | | | (999 | ) | | (66.60 | ) |
| | | | | | | | | | | | | |
Totals | | $ | 129,776 | | $ | 168,686 | | $ | (38,910 | ) | | (23.07 | )% |
| | | | | | | | | | | | | |
The following table identifies the percentage composition of the investment securities:
| | | | | | | | | |
| | | 2006 | | | 2005 | | | 2004 | |
December 31: | | | | | | | | | |
Mortgage-backed and collateralized mortgage obligations | | 28.9 | % | | 27.1 | % | | 25.9 | % |
Federal agencies | | 34.4 | | | 53.0 | | | 54.1 | |
Municipal securities | | 26.5 | | | 11.7 | | | 12.0 | |
Equity securities | | 9.8 | | | 7.3 | | | 7.0 | |
Trust preferred | | 0.4 | | | 0.9 | | | 1.0 | |
| | | | | | | | | |
Totals | | 100.0 | % | | 100.0 | % | | 100.0 | % |
| | | | | | | | | |
See Note 3 to the “Consolidated Financial Statements” for more information on investment securities.
Loans
Net loans receivable totaled $249,272 at December 31, 2006, an increase of $31.0 million, or 14.2%, from $218.3 million at December 31, 2005. The increase was primarily due to increased commercial loans, a strategy to retain fixed-rate mortgage loans in portfolio, and lease purchases.
Residential loans increased $26.9 million to $125.4 million at December 31, 2006, from $98.5 million at December 31, 2005. The increase was due to purchasing $12.1 million in fixed-rate mortgage loans and retaining fixed-rate mortgage loans in portfolio. We generally retain loan servicing on loans sold. Loans we serviced for investors, primarily Freddie Mac, Fannie Mae and the FHLB, totaled approximately $145.0 million at December 31, 2006 compared to $161.5 million at December 31, 2005. Loans sold and that we subsequently service generate a steady source of fee income, with servicing fees ranging from 0.25% to 0.375%. Construction loans increased $3.2 million to $48.0 million at December 31, 2006 from $44.8 million at December 31, 2005. The increase was primarily due to the origination of commercial construction loans.
Commercial and industrial loans increased $4.5 million to $12.4 million at December 31, 2006 from $8.0 million at December 31, 2005. The increase was due to increased penetration by our lenders in the local market areas. Consumer loans increased $1.6 million to $5.8 million at December 31, 2006 from $4.2 million at December 31, 2005.
New loan production was $119.2 million in 2006 compared to $121.0 million in 2005. Residential loan production increased to $43.3 million in 2006 from $37.5 million in 2005. Originations decreased but were supplemented by the purchase of fixed-rate mortgage pools. Commercial real estate and construction loan production decreased to $63.4 million in 2006 from $65.5 million in 2005.
42
Credit Quality
Non-performing loans increased $700,000 to $3.4 million at December 31, 2006 from $2.6 million at December 31, 2005. The increase was primarily related to one residential construction loan and a judgment purchased as part of a work-out strategy on a multi-family complex.
We recorded net charge-offs of $519,000 in 2006 and net recoveries of $2.7 million in 2005. Loan charge-offs were $680,000 in 2006 and $1.5 million in 2005, while recoveries were $160,000 and $4.2 million in the same periods.
The allowance for loan losses as a percent of loans was 1.04% at December 31, 2006 and 1.28% at December 31, 2005. The decrease reflects amounts charged off related to a sale of two classified loans.
Cash Value of Life Insurance
We have investments in life insurance on employees and directors, with a balance or cash surrender value of $21.9 million and $21.1 million, respectively, at December 31, 2006 and 2005. The majority of these policies were purchased in 1999. The nontaxable increase in cash surrender value of life insurance was $758,000 in 2006, compared to $708,000 in 2005.
Deposits
The following table shows deposit changes by category:
| | | | | | | | | | | | | |
| (Dollars in thousands) | |
| | | 2006 | | 2005 | | $ Change | | | %
Change | |
December 31, | | | | | | | | | | | | | |
Noninterest-bearing accounts | | $ | 19,905 | | $ | 18,788 | | $ | 1,117 | | | 5.9 | % |
Savings deposits | | | 22,637 | | | 25,003 | | | (2,366 | ) | | (9.5 | ) |
NOW and Super NOW accounts | | | 64,161 | | | 81,714 | | | (17,553 | ) | | (21.5 | ) |
Money market accounts | | | 27,483 | | | 22,010 | | | 5,473 | | | 24.9 | |
Certificates $100,000 and more | | | 39,033 | | | 46,988 | | | (7,955 | ) | | (16.9 | ) |
Other certificates | | | 149,215 | | | 144,848 | | | 4,367 | | | 3.0 | |
| | | | | | | | | | | | | |
Totals | | $ | 322,434 | | $ | 339,351 | | $ | (16,917 | ) | | (5.0 | )% |
| | | | | | | | | | | | | |
Non-maturity deposits decreased $13.3 million, or 9.0%, to $134.2 million at December 31, 2006 from $147.5 million at December 31, 2005, reflecting customers’ preference for fixed-rate deposit accounts. Money market account balances increased as a result of a rate promotion in selected markets of the Bank.
Certificates of deposit decreased $3.6 million due to the maturity of a $10.0 million brokered certificate issued by the Bank in 2005.
Borrowings
Borrowings increased $7.8 million to $74.7 million at December 31, 2006 from $66.9 million at December 31, 2005. At December 31, 2006, our borrowings consisted of FHLB advances totaling $64.4 million and subordinated debentures in the amount of $10.3 million. The subordinated debentures were issued on March 7, 2006, and mature on March 7, 2036. A note payable in the amount of $300,000 outstanding at December 31, 2005, was paid off in 2006.
Interest Rate Risk
Interest Rate Risk (“IRR”) is the risk to earnings and capital arising from movements in interest rates. IRR can result from:
| | • | | timing differences in the maturity/repricing of an institution’s assets, liabilities, and off balance sheet contracts; |
43
| | • | | the effect of embedded options, such as call or convertible options, loan prepayments, interest rate caps, and deposit withdrawals; |
| | • | | unexpected shifts of the yield curve that affect both the slope and shape of the yield curve and; |
| | • | | differences in the behavior of lending and funding rates, sometimes referred to as basis risk. An example would occur if floating rate assets and liabilities, with otherwise identical repricing characteristics, were based on market indexes that were imperfectly correlated. |
The Asset-Liability Committee and the Board of Directors review our exposure to interest rate changes and market risk quarterly. This review is accomplished by the use of a cash flow simulation model using detailed securities, loan, deposit, borrowings and market information to estimate fair values of assets and liabilities using discounted cash flows. We monitor IRR from two perspectives:
| | • | | Economic value at risk – long term exposure |
The difference between the Bank’s estimated fair value of assets and the estimated fair value of liabilities is the fair value of equity, also referred to as net present value of equity (“NPV”). The change in the NPV is calculated at different interest rate intervals. This measures our IRR exposure from movements in interest rates and the resulting change in the NPV.
| | • | | Earnings at risk – near term exposure |
The model also tests the impact various interest rate scenarios have on net interest income over a stated period of time (one year, for example).
We recognize that effective management of IRR includes an understanding of when potential adverse changes in interest rates will flow through the profit and loss statement. Accordingly, we will manage our position so that exposure to net interest income is monitored over both a one year planning horizon (accounting perspective) and a longer term strategic horizon (economic perspective).
Our objective is to manage our exposure to interest rate risk, bearing in mind that we will always be in the business of taking on rate risk and that rate risk immunization is not possible. Also, it is recognized that as exposure to interest rate risk is reduced, so too may the net interest margin be reduced.
Change in IRR Calculation
We changed our emphasis on what we monitor for IRR in 2005. The NPV method was our primary IRR measurement in the past. The NPV method uses a liquidation model by simulating a mark-to-market of the entire balance sheet. The liquidation model identifies mismatched risk both for the near-term and long-term. Our primary concern going forward is our IRR exposure in the near term by focusing on earnings at risk.
We also changed to a different modeling program which uses similar methodologies and assumptions as the previous model. The primary difference between the two models is the reinvestment of cash flows. The old model assumed cash flows were reinvested in the same type of financial instrument where the new model directs cash flows to specific loan types, primarily hybrid adjustable-rate mortgages and commercial loans.
Position Assessment as of December 31, 2006
Total loans increased $30.9 million to $249.3 million at December 31, 2006. Loan demand centered on commercial construction, hybrid residential adjustable-rate mortgages, and home equity lines of credit draws. Balance sheet spreads remained under pressure for most of 2006 with funding costs increasing at a pace faster than asset yields. During the fourth quarter, we restructured the investment portfolio, selling $34 million of securities and using some of the proceeds to reduce FHLB advances. As a result, the net balance sheet spread increased 18 basis points (bp) during the fourth quarter. Changes in replacement assumptions, higher expected replacement rates on loans and in the rates and terms of FHLB advances, the net interest income simulations show higher levels of income in the first year of all scenarios reviewed. The balance sheet is structurally asset sensitive over the long-term with a slight asset bias in the first 2 years. All potential exposures remain within policy limits.
44
Interest Rate Scenarios
Base Case – Projected net interest income in first year assuming current rates remain unchanged.
NII is projected to gradually increase over the simulation period as existing asset cash flows are assumed to be replaced with higher yielding products. The continued, upward repricing/replacement of loan products at today’s higher rate levels enable asset yields to stay ahead of funding cost increases. Should the Bank not be able to replace assets at the rates modeled, or deposit rates need to be increased more than assumed to retain balances, NII will be materially lower than projected.
Falling Rates -200 BP –Projected net interest income declines 1.39% in first year and increases 2.58% in second year when compared to base case scenario.
NII is initially projected to trend slightly below the results shown in the base scenario, as the large short-term funding base reflects the rate reductions faster than the asset base. Beyond the first year, pressure on NII is exacerbated as accelerated cash flow from mortgage-based assets continues to be reinvested at lower rates, driving asset yields lower while funding costs reach their floors. Should the yield curve steepen as rates fall, potential NII exposure may be eliminated.
Rising Rates +200 BP – Projected net interest income increases 0.80% in first year and increases 5.92% in second year when compared to base case scenario.
Should rates continue to rise, NII levels are expected to trend with current rate scenario over the first 2 1/2 years of the simulation period, with income climbing steadily throughout the remaining modeled timeframe. Funding cost increases related to the short-term time deposit portfolio are mitigated by increasing asset yields. Late in the second year, the repricing/replacement of assets gains momentum and begins to offset funding cost pressures. Thereafter, the asset sensitive balance sheet asserts itself and asset yields continue to improve while funding costs stabilize, widening balance sheet margin and increasing NII.
45
Yields Earned and Rates Paid
The following tables set forth the weighted average yields earned on interest-earning assets and the weighted average interest rates paid on the interest-bearing liabilities, together with the net yield on interest-earning assets. Yields are calculated on a tax-equivalent basis.
| | | | | | | | | |
| | | Year Ended December 31, | |
| | | 2006 | | | 2005 | | | 2004 | |
Weighted Average Yield: | | | | | | | | | |
Loans | | 6.97 | % | | 6.53 | % | | 6.55 | % |
Mortgage-backed and collateralized mortgage obligations | | 4.42 | | | 4.05 | | | 3.72 | |
Securities — taxable | | 3.74 | | | 2.76 | | | 2.82 | |
Securities — tax-exempt | | 5.56 | | | 5.40 | | | 5.00 | |
Other interest-earning assets | | 2.66 | | | 4.03 | | | 2.82 | |
All interest-earning assets | | 5.71 | | | 5.10 | | | 4.96 | |
| | | |
Weighted Average Cost: | | | | | | | | | |
Demand deposits, money market deposit accounts, and savings | | 2.00 | | | 1.78 | | | 1.18 | |
Certificates of deposit | | 4.13 | | | 3.11 | | | 2.55 | |
Federal Home Loan Bank advances and note payable | | 4.14 | | | 3.87 | | | 3.82 | |
All interest-bearing liabilities | | 3.50 | | | 2.68 | | | 2.11 | |
Interest Rate Spread (spread between weighted average yield on all interest-earning assets and all interest-bearing liabilities) | | 2.21 | | | 2.42 | | | 2.85 | |
Net Tax Equivalent Yield (net interest income as a percentage of average interest-earning assets) | | 2.29 | | | 2.57 | | | 2.95 | |
| | | | | | | | | |
| | | At December 31, | |
| | | 2006 | | | 2005 | | | 2004 | |
Weighted Average Interest Rates: | | | | | | | | | |
Loans | | 6.93 | % | | 6.65 | % | | 6.10 | % |
Mortgage-backed and collateralized mortgage obligations | | 4.76 | | | 4.09 | | | 3.56 | |
Securities — taxable | | 3.11 | | | 2.76 | | | 2.76 | |
Securities — tax-exempt | | 5.61 | | | 5.32 | | | 5.32 | |
Other earning assets | | 4.79 | | | 4.54 | | | 3.61 | |
Total interest-earning assets | | 6.04 | | | 5.28 | | | 4.77 | |
Demand deposits, money market deposit accounts, and savings | | 1.62 | | | 1.96 | | | 1.58 | |
Certificates of deposit | | 4.43 | | | 3.57 | | | 2.65 | |
Federal Home Loan Bank advances, note payable, and subordinated debentures | | 4.87 | | | 3.93 | | | 3.70 | |
Total interest-bearing liabilities | | 3.67 | | | 3.10 | | | 2.32 | |
Interest rate spread | | 2.37 | | | 2.18 | | | 2.45 | |
46
Rate/Volume Analysis
The following table sets forth certain information regarding changes in interest income, interest expense and net interest income for the periods indicated. For each category of interest-earning assets and interest-bearing liabilities, information is provided on changes attributable to: (1) changes in volume (changes in volume multiplied by old rate) and (2) changes in rate (changes in rate multiplied by old volume). For purposes of this table, changes attributable to changes in both rate and volume that cannot be segregated have been allocated proportionally based on the changes due to the rate and the changes due to volume. No material amounts of loan fees or out-of-period interest are included in the table. Non-accrual loans were not excluded in the calculations. The information shown below was adjusted for the tax-equivalent benefit of bank qualified non-taxable municipal securities. The tax equivalent adjustment was $442,000, $367,000 and $344,000 for the years ended December 31, 2006, 2005 and 2004, respectively.
| | | | | | | | | | | | | | | | | | | | | | | | |
| | | Year Ended December 31, | |
| | | 2006 vs. 2005 | | | 2005 vs. 2004 | |
| | | Increase (Decrease) Due to Changes in | | | Increase (Decrease) Due to Changes in | |
| | | Volume | | | Rate | | | Net Change | | | Volume | | | Rate | | | Net Change | |
| | | (In thousands) | |
Interest income: | | | | | | | | | | | | | | | | | | | | | | | | |
Loans | | $ | 1,859 | | | $ | 958 | | | $ | 2,817 | | | $ | 679 | | | $ | (44 | ) | | $ | 635 | |
Mortgage-backed securities | | | (281 | ) | | | 183 | | | | (98 | ) | | | 393 | | | | 140 | | | | 533 | |
Securities — taxable | | | (366 | ) | | | 772 | | | | 406 | | | | 106 | | | | (55 | ) | | | 51 | |
Securities — tax-exempt | | | 189 | | | | 32 | | | | 221 | | | | (13 | ) | | | 81 | | | | 68 | |
Other interest-earning assets | | | (92 | ) | | | (357 | ) | | | (449 | ) | | | (175 | ) | | | 362 | | | | 187 | |
| | | | | | | | | | | | | | | | | | | | | | | | |
Total interest-earning assets | | | 1,309 | | | | 1,588 | | | | 2,897 | | | | 990 | | | | 484 | | | | 1,474 | |
| | | | | | | | | | | | | | | | | | | | | | | | |
Interest Expense: | | | | | | | | | | | | | | | | | | | | | | | | |
Demand deposits and savings | | | (586 | ) | | | 297 | | | | (289 | ) | | | 7 | | | | 876 | | | | 883 | |
Certificates of deposits | | | 809 | | | | 1,983 | | | | 2,792 | | | | (75 | ) | | | 975 | | | | 900 | |
FHLB advances, note payable, and subordinated debentures | | | 1,172 | | | | 133 | | | | 1,305 | | | | 628 | | | | 18 | | | | 646 | |
| | | | | | | | | | | | | | | | | | | | | | | | |
Total interest-bearing liabilities | | | 1,395 | | | | 2,413 | | | | 3,808 | | | | 560 | | | | 1,869 | | | | 2,429 | |
| | | | | | | | | | | | | | | | | | | | | | | | |
Change in net interest income | | $ | (86 | ) | | $ | (825 | ) | | $ | (911 | ) | | $ | 430 | | | $ | (1,385 | ) | | $ | (955 | ) |
| | | | | | | | | | | | | | | | | | | | | | | | |
47
RESULTS OF OPERATIONS
2006 Compared to 2005
Net Income
The Company experienced a net loss of $970,000 for 2006, or $(0.31) per diluted share, compared to net income of $2.1 million, or $0.65 per diluted share, for 2005. The decrease was primarily the result of the following factors:
1) A decline in the net interest margin, resulting mostly from the flat U.S. Treasury yield curve and its impact on other market interest rates;
2) Management’s balance sheet restructuring strategy involving the sale of $34.0 million of low-yielding U.S. Government Agency securities resulting in a loss of $821,000;
3) $514,000 recorded in 2006 as a loss related to the classification of $13.3 million in investment securities being permanently impaired; and
4) $2.9 million in recoveries recorded in 2005 related to leases charged off in prior periods.
See “Net Interest Income,” “Provision for Loan Losses,” “Other Income,” “Other Expenses,” and “Income Taxes” for more information regarding the changes in net income for 2006 compared to 2005. For a quarterly breakdown of earnings, see Note 18 to the “Consolidated Financial Statements.”
Net Interest Income
We derive the majority of our income from net interest income. The following table shows a breakdown of net interest income on a tax equivalent basis for 2006 compared to 2005. The tax equivalent adjustment was $442,000 and $367,000 for the years ended December 31, 2006 and 2005, respectively, based on a tax rate of 34%.
| | | | | | | | | | | | | | | | |
| | | (Dollars in thousands) | |
Years ended December 31, | | 2006 | | | 2005 | | | Change | |
| | | Interest | | Yield/Rate | | | Interest | | Yield/Rate | | |
Interest and fees on loans | | $ | 16,212 | | 6.97 | % | | $ | 13,395 | | 6.53 | % | | $ | 2,817 | |
Other interest income | | | 6,834 | | 4.00 | | | | 6,754 | | 3.56 | | | | 80 | |
| | | | | | | | | | | | | | | | |
Total interest income | | | 23,046 | | 5.71 | | | | 20,149 | | 5.10 | | | | 2,897 | |
| | | | | | | | | | | | | | | | |
Interest on deposits | | | 10,591 | | 3.35 | | | | 8,088 | | 2.50 | | | | 2,503 | |
Interest on borrowings | | | 3,212 | | 4.14 | | | | 1,907 | | 3.87 | | | | 1,305 | |
| | | | | | | | | | | | | | | | |
Total interest expense | | | 13,803 | | 3.50 | | | | 9,995 | | 2.68 | | | | 3,808 | |
| | | | | | | | | | | | | | | | |
Net interest income | | $ | 9,243 | | — | | | $ | 10,154 | | — | | | $ | (911 | ) |
| | | | | | | | | | | | | | | | |
Net interest spread | | | — | | 2.21 | % | | | — | | 2.42 | % | | | — | |
Net interest margin | | | — | | 2.29 | | | | — | | 2.57 | | | | — | |
The decline in net interest income, as shown in the table above, was primarily due to rising interest rates in a flat yield curve environment. Our interest-bearing liabilities have shorter overall maturities and reprice more frequently to market conditions than our interest-earning assets and, thus, our cost of funds rose quicker than our yield on assets. For a discussion on interest rate risk see “Item 3 – Quantitative and Qualitative Disclosure About Market Risk.”
Tax-exempt interest for 2006 was $858,000 compared to $712,000 for 2005. Tax-exempt interest is from bank-qualified municipal securities. Total interest income on a tax equivalent basis for 2006 increased $2.9 million compared to the same period of the prior year. This increase was the result of an increase in yield on interest-earning assets of 61 basis points due to higher market interest rates and an $8.4 million increase in average interest-earning assets. Total interest expense for 2006 increased $3.8 million compared to the same period of the prior year. This increase was the result of an increase in the cost of interest-bearing liabilities of 90 basis points and a $10.5 million increase in average interest-bearing liabilities. For a further discussion see “Financial Condition – Rate/Volume Analysis.”
48
Provision for Loan Losses
The provision for loan losses represents the current period credit or cost associated with maintaining an appropriate allowance for loan losses. Periodic fluctuations in the provision for loan losses result from management’s assessment of the adequacy of the allowance for loan losses. The allowance for loan losses is dependent upon many factors, including loan growth, net charge-offs, changes in the composition of the loan portfolio, delinquencies, assessment by management, third parties and banking regulators of the quality of the loan portfolio, the value of the underlying collateral on problem loans and the general economic conditions in our market areas. We believe the allowance for loan losses is adequate to cover losses inherent in the loan portfolio as calculated in accordance with generally accepted accounting principles.
We had a provision of $300,000 for 2006 compared to a provision adjustment of $2.9 million in 2005. The provision in 2006 is largely a result of increased loan growth. The 2005 provision adjustment reflected total recoveries of $4.2 million due to recoveries on leases. We recorded net charge-offs of $519,000 in 2006 and net recoveries of $2.7 million in 2005.
Other Income
The $1.7 million decrease in other income in 2006 as compared to 2005 resulted primarily from 2006 activities related to investment securities:
| | • | | The balance sheet restructuring strategy involving the sale of $34.0 million of investment securities at a loss of $819,000; and |
| | • | | $514,000 recorded as a loss related to the classification of $13.3 million in investment securities being permanently impaired. |
Other Expense
The $1.1 million decrease in other expense in 2006 as compared to 2005 resulted primarily from:
| | • | | Management’s decision in 2005 to make a voluntary payment of $1.1 million to fund a portion of the company’s pension liability. |
| | • | | Professional fees paid in 2005 that included significant recruiting fees and consulting fees related to a major operational efficiencies project. |
Income Tax Expense
The decrease in income taxes in 2006 as compared to 2005 resulted primarily from the operating loss sustained in 2006. We recorded an income tax benefit of $1.4 million in 2006, compared to an income tax expense of $183,000 in 2005.
| | • | | We have a deferred state tax asset that is primarily the result of operating losses sustained since 2003 for state tax purposes. We started recording a valuation allowance against our current period state income tax benefit in 2005 due to our concern that we may not be able to use more than the tax asset already recorded on the books without modifying the use of AIMI, our investment subsidiary. Operating income from AIMI is not subject to state income taxes under current state law, and is the primary reason for the tax asset. The valuation allowance was $32,000 at December 31, 2006. |
| | • | | The effective tax rate was (59.7)% in 2006 and 8.2% in 2005. The primary difference between the effective tax rates and the statutory tax rates in 2006 relates to tax credits, cash value of life insurance and municipal securities income. The primary difference in the effective tax rate and the statutory tax rates in 2005 relates to tax credits, cash value of life insurance, municipal security income, and state income tax credits. |
See Note 9 to the “Consolidated Financial Statements” for more information relating to income taxes.
49
2005 Compared to 2004
Net Income
Net income for 2005 increased 44.3% to $2.1 million, or $0.65 per diluted share, compared to net income of $1.4 million, or $0.45 per diluted share, for 2004. The $632,000 increase in net income and the $0.20 increase in diluted earnings per share for the year ended December 31, 2005, compared to the same period a year ago, was the result of the following factors:
| | • | | A $978,000 decrease in net interest income, reflecting the cost of interest-bearing liabilities which increased higher than earnings on interest-earning assets; |
| | • | | A credit to the allowance for loan losses of $2.9 million in 2005 compared to a provision of $392,000 in 2004; |
| | • | | A $154,000 increase in other income primarily due to increases of $236,000 in other fees and service charges, and $197,000 in other income. These increases were partially offset by decreases of $133,000 in gain on sale of loans and servicing rights, $87,000 in brokerage and insurance commissions and $59,000 in increase on cash surrender value of life insurance; |
| | • | | A $1.1 million increase in other expense. The major components of this increase were increases of $694,000 in salaries and employee benefits primarily due to additional pension expense less a decline in salary expense from reduced staffing levels, $41,000 in occupancy and equipment expense, $275,000 in legal and professional fees, $46,000 in advertising and marketing expense and $156,000 in other expenses. These increases were partially offset by decreases of $43,000 in printing and office supplies and $37,000 in data processing expense; and, |
| | • | | A $656,000 increase in income taxes. |
See “Net Interest Income”, “Provision for Loan Losses”, “Other Income”, “Other Expenses” , and “Income Taxes”, for more information regarding the changes in net income for 2005 compared to 2004. For a quarterly breakdown of earnings, see Note 18 to the “Consolidated Financial Statements.”
Net Interest Income
We derive the majority of our income from net interest income. The following table shows a breakdown of net interest income on a tax equivalent basis for 2005 compared to 2004. The tax equivalent adjustment was $367,000 and $344,000 for the years ended December 31, 2005 and 2004, respectively.
| | | | | | | | | | | | | | | | |
| | | (Dollars in thousands) | |
Years ended December 31, | | 2005 | | | 2004 | | | | |
| | | Interest | | Yield/Rate | | | Interest | | Yield/Rate | | | Change | |
Interest and fees on loans | | $ | 13,395 | | 6.53 | % | | $ | 12,760 | | 6.55 | % | | $ | 635 | |
Other interest income | | | 6,754 | | 3.56 | | | | 5,915 | | 3.26 | | | | 839 | |
| | | | | | | | | | | | | | | | |
Total interest income | | | 20,149 | | 5.10 | | | | 18,675 | | 4.96 | | | | 1,474 | |
| | | | | | | | | | | | | | | | |
Interest on deposits | | | 8,088 | | 2.50 | | | | 6,305 | | 1.94 | | | | 1,783 | |
Interest on borrowings | | | 1,907 | | 3.87 | | | | 1,261 | | 3.82 | | | | 646 | |
| | | | | | | | | | | | | | | | |
Total interest expense | | | 9,995 | | 2.68 | | | | 7,566 | | 2.11 | | | | 2,429 | |
| | | | | | | | | | | | | | | | |
Net interest income | | $ | 10,154 | | — | | | $ | 11,109 | | — | | | $ | (955 | ) |
| | | | | | | | | | | | | | | | |
Net interest spread | | | — | | 2.42 | % | | | — | | 2.85 | % | | | — | |
Net interest margin | | | — | | 2.57 | | | | — | | 2.95 | | | | — | |
The decline in net interest income, as shown in the table above, was primarily due to the flattening yield curve, which resulted in short-term interest rates rising faster than longer-term interest rates. Our interest-bearing liabilities have shorter overall maturities and reprice more frequently to market conditions than our interest-earning assets and, thus, our cost of funds rose quicker than our yield on assets. For a discussion on interest rate risk see
50
“Item 3 – Quantitative and Qualitative Disclosure About Market Risk.”
Tax-exempt interest for 2005 was $712,000 compared to $667,000 for 2004. Tax-exempt interest is from bank-qualified municipal securities. Total interest income on a tax equivalent basis for 2005 increased $1.5 million compared to the same period of the prior year. This increase was the result of an increase in yield on interest-earning assets of 14 basis points due to higher market interest rates and an $18.4 million increase in average interest-earning assets. Total interest expense for the 2005 increased $2.4 million compared to the same period of the prior year. This increase was the result of an increase in cost of interest-bearing liabilities of 57 basis points and a $13.6 million increase in average interest-bearing liabilities. For a further discussion see “Financial Condition – Rate/Volume Analysis.”
Provision for Loan Losses
We had a provision adjustment of $2.9 million for 2005 compared to a provision of $392,000 in 2004. The 2005 provision adjustment reflected total recoveries of $4.2 million primarily due to recoveries on the leases. We recorded net recoveries of $2.7 million in 2005 and net charge-offs of $1.0 million in 2004.
Other Income
The increase in other income in 2005 as compared to 2004 resulted primarily from increases in other fees and service charges, and other income, which was partially offset by decreases in gain on sale of loans and servicing rights, brokerage and insurance commissions, and increase on cash surrender value of life insurance.
| | • | | The increase in other fees and service charges was primarily due to an increase in deposit service charge fees mainly from the Overdraft Honors program, which began in late 2004. |
| | • | | The increase in other income was mainly from a $177,000 gain on sale of land we owned which was adjacent to our branch lot in Greenfield, Indiana and which was not needed for expansion purposes. |
| | • | | The decrease in gain on sale of loans and servicing rights was due to a decline in mortgage loans sold during the period. Loans originated for sale were $8.8 million in 2005 compared to $21.2 million in 2004. Although residential mortgage loan production was comparable in 2005 and 2004, we retained a greater portion of our loans in 2005 because we originated more adjustable-rate loans. We sold most of our fixed-rate mortgage loan production in 2004. However, in 2005, we retained most of the fifteen-year fixed-rate mortgage loans we produced. Fifteen year fixed-rate mortgage loans generally pose lower interest rate risk than thirty-year fixed-rate mortgage loans because of their shorter average life. |
| | • | | The decrease in brokerage and insurance commissions was mainly due to a decline in sales because of an extended medical leave by one of our two brokers in 2005. |
| | • | | The decline in increase on cash surrender value of life insurance was due to lower investment rates. |
Other Expense
The increase in other expense in 2005 as compared to 2004 resulted primarily from increases in salaries and employee benefits, occupancy and equipment expense, legal and professional fees, advertising and marketing, and other expenses, which was partially offset by decreases in printing and office supplies and data processing expense.
| | • | | The increase in salaries and employee benefits was primarily due to an increase in pension expense offset by a reduction in salary expense. In addition to the increase in pension expense, we also incurred an additional $93,000 in health insurance premiums to reimburse our health insurance provider for claims in past plan years that were in excess of the annual cap. The decline in salary expense was due to reduced staffing levels as a result of improved efficiencies. |
51
| | • | | The increase in occupancy and equipment expense was primarily due to increased depreciation expense related to our McCordsville branch that opened in 2004. Other occupancy expense categories that contributed to the increase included utilities and repairs and maintenance. |
| | • | | The increase in legal and professional fees was due to consulting fees paid to Profit Resources for a consulting engagement to improve operational efficiencies and recruiting fees for the Chief Executive Officer, Chief Lending Officer and a commercial loan officer. |
| | • | | The increase in advertising and marketing expense was due to an increase in loan promotions which led to higher advertising and direct mail costs. |
| | • | | The increase in other expenses was in part due to a large donation of $70,000 to the city of Anderson, Indiana for its downtown revitalization project. The donation was part of an agreement between the city and a group of banks, including us, where the city paid off loans secured by commercial buildings in downtown Anderson. |
| | • | | The decrease in printing and office supplies and data processing expenses were due to general expense reductions mainly due to improved operating efficiencies. |
Income Tax Expense
The increase in income taxes in 2005 as compared to 2004 resulted primarily from higher net operating earnings and a valuation allowance against our current period state income taxes. We recorded an income tax expense of $183,000 in 2005, compared to an income tax benefit of $473,000 in 2004.
| | • | | We have a deferred state tax asset that is primarily the result of operating losses sustained since 2003 for state tax purposes. We started recording a valuation allowance against our current period state income tax benefit in 2005 due to our concern that we may not be able to use more than the tax asset already recorded on the books without modifying the use of AIMI, our investment subsidiary. Operating income from AIMI is not subject to state income taxes under current state law, and is the primary reason for the tax asset. The valuation allowance was $284,000 at December 31, 2005. |
| | • | | The effective tax rate was 8.2% in 2005 and (49.6)% in 2004. The primary difference between the effective tax rates and the statutory tax rates in 2005 relates to tax credits, cash value of life insurance and municipal securities income. The primary difference in the effective tax rate and the statutory tax rates in 2004 relates to tax credits, cash value of life insurance, municipal security income, and state income tax credits. |
See Note 9 to the “Consolidated Financial Statements” for more information.
Liquidity and Capital Resources
Liquidity is the ability to meet current and future obligations of a short-term nature. Historically, funds provided by operations, loan repayments and new deposits have been our principal sources of liquid funds. In addition, we have the ability to obtain funds through the sale of new mortgage loans, through borrowings from the FHLB system, and through the brokered certificates market. We regularly adjust the investments in liquid assets based upon our assessment of (1) expected loan demand, (2) expected deposit flows, (3) yields available on interest-earning deposits and securities and (4) the objectives of our asset/liability program.
At December 31, 2006, we had $8.3 million in loan commitments outstanding and $34.1 million of additional commitments for line of credit receivables. Retail certificates of deposit due within one year of December 31, 2006 totaled $100.8 million, or 31.3% of total deposits. If these maturing certificates of deposit do not remain with us, other sources of funds must be used, including other certificates of deposit, brokered CDs, and borrowings. Depending on market conditions, we may be required to pay higher rates on such deposits or other borrowings than currently paid on the certificates of deposit due on or before December 31, 2007. However, based on past experiences we believe that a significant portion of the certificates of deposit will remain. We have the ability to
52
attract and retain deposits by adjusting the interest rates offered. We held no brokered CDs at December 31, 2006. We held a brokered CD for $10.0 million at December 31, 2005.
Our primary investing activities are the origination of loans and purchase of securities. In 2006, our loan originations totaled $89.9 million, and we also purchased $11.1 million of loans from brokers and $18.2 million of loans from other financial institutions or through participations. We also purchased $29.0 million of securities. In 2005, we originated $121.0 million of loans and purchased $14.9 million of securities.
Financing activities consist primarily of activity in retail deposit accounts, brokered certificates, and FHLB advances. Deposit flows are affected by the overall level of interest rates, the interest rates and products we offer, and our local competitors and other factors. Retail deposits decreased $16.9 million in 2006. We had FHLB advances of $64.4 million and $66.6 million at December 31, 2006 and 2005, respectively.
The Bank is subject to various regulatory capital requirements set by the FDIC, including a risk-based capital measure. The Company is also subject to similar capital requirements set by the Federal Reserve Bank. The risk-based capital guidelines include both a definition of capital and a framework for calculating risk-weighted assets by assigning balance sheet assets and off-balance sheet items to broad risk categories. At December 31, 2006, both the Company and the Bank exceeded all of regulatory capital requirements and are considered “well capitalized” under regulatory guidelines.
Off-Balance-Sheet Arrangements
In the normal course of operations, we engage in a variety of financial transactions that, in accordance with generally accepted accounting principles, are not recorded on our financial statements. These transactions involve, to varying degrees, elements of credit, interest rate and liquidity risk. Such transactions are used primarily to manage customers’ requests for funding and take the form of loan commitments and lines of credit. See Note 4 to the “Consolidated Financial Statements.”
We do not have any off-balance-sheet arrangements that have or are reasonably likely to have a current or future effect on our financial condition, changes in financial condition, revenues or expenses, results of operations, liquidity, capital expenditures or capital resources that is material to investors.
Contractual Obligations
Either the Company or the Bank has the following known contractual obligations as of December 31, 2006:
| | | | | | | | | | | | | | | |
| | | Payment due by period |
Contractual Obligations | | Total | | Less than 1 year | | 1-3 years | | 3-5 years | | More than 5 years |
| | | (Dollars in thousands) |
Long-Term Debt Obligations (1) | | $ | 74,683 | | $ | 39,000 | | $ | 4,998 | | $ | 375 | | $ | 30,310 |
Operating Lease Obligations | | | 529 | | | 162 | | | 236 | | | 126 | | | 5 |
Purchase Obligations (2) | | | 125 | | | 73 | | | 34 | | | 18 | | | — |
| | | | | | | | | | | | | | | |
Total | | $ | 75,337 | | $ | 39,235 | | $ | 5,268 | | $ | 519 | | $ | 30,315 |
| | | | | | | | | | | | | | | |
| (1) | FHLB advances and subordinated debentures |
| (2) | Data processing, maintenance, and telephone agreements |
Impact of Inflation and Changing Prices
The consolidated financial statements and related data presented in this report have been prepared in accordance with generally accepted accounting principles. This requires the measurement of financial position and operating results in terms of historical dollars without consideration of changes in the relative purchasing power of money over time due to inflation.
Virtually all of the assets and liabilities of a financial institution are monetary in nature. As a result, interest rates have a more significant impact on a financial institution’s performance than the effects of general levels of inflation. Interest rates do not necessarily move in the same direction or at the same rate as changes in the
53
prices of goods and services, which are directly affected by inflation, although interest rates may fluctuate in response to perceived changes in the rate of inflation.
Current Accounting Issues
Servicing of Financial Assets
In March 2006, the FASB issued Statement of Financial Accounting Standards No. 156 (SFAS No. 156), Accounting for Servicing of Financial Assets, an amendment of FASB Statement No. 140, Accounting for Transfers and Servicing of Financial Assets and Extinguishments of Liabilities, which requires that all separately recognized servicing assets and servicing liabilities be initially measured at fair value, if practicable and permits the entities to elect either fair value measurement with changes in fair value reflected in earnings or the amortization and impairment requirements of SFAS No. 140 for subsequent measurement. The subsequent measurement of separately recognized servicing assets and servicing liabilities at fair value eliminates the necessity for entities that manage the risks inherent in servicing assets and servicing liabilities with derivatives to qualify for hedge accounting treatment and eliminates the characterization of declines in fair value as impairments or direct write–downs. SFAS No. 156 is effective for the Company beginning January 1, 2007. We have evaluated the requirements of SFAS No. 156 and determined that it will not have a material effect on our financial condition or results of operations.
Fair Value Measurements
In September 2006, the FASB issued SFAS No. 157, Fair Value Measurements. SFAS No. 157 defines fair value, establishes a framework for measuring fair value in generally accepted accounting standards, and expands disclosures about fair value measurements. SFAS No. 157 is effective for financial statements issued for fiscal years beginning after November 15, 2007, and interim periods within those fiscal years. We do not expect that the adoption of SFAS No. 157 will have a material impact on our financial condition or results of operations.
Accounting for Uncertainty in Income taxes
In June 2006, the FASB issued Interpretation No. 48, Accounting for Uncertainty in Income Taxes, an interpretation of SFAS No. 109, Accounting for Income Taxes (Interpretation No. 48). Interpretation No. 48 clarifies the accounting for uncertainty in income taxes in financial statements and prescribes a recognition threshold and measurement attribute for financial statement recognition and measurement of a tax position taken or expected to be taken. It also provides guidance on de-recognition, classification, interest and penalties, accounting in interim periods, disclosure and transition. Interpretation No. 48 is effective for the Company beginning January 1, 2007. We have evaluated the requirements of Interpretation No. 48 and determined that it will not have a material effect on our financial condition or results of operations.
Prior Year Misstatements
In September 2006, the SEC Staff issued Staff Accounting Bulletin (“SAB”) No. 108, Considering the Effects of Prior Year Misstatements when Quantifying Misstatements in Current Year Financial Statements, which addresses how the effects of prior year uncorrected misstatements should be considered when quantifying misstatements in current year financial statements. SAB No. 108 will require registrants to quantify misstatements using both the balance sheet and income–statement approaches and to evaluate whether either approach results in quantifying an error that is material in light of relevant quantitative and qualitative factors. When the effect of initial adoption is determined to be material, SAB No. 108 allows registrants to record that effect as a cumulative effect adjustment to beginning retained earnings. The requirements are effective for the Company beginning January 1, 2007. We have evaluated the requirements of SAB No. 108 and determined that it will not have a material effect on our financial condition or results of operations.
Split-dollar life insurance agreements
In September 2006, the Emerging Issues Task Force Issue 06–4 (EITF 06-4), Accounting for Deferred Compensation and Postretirement Benefit Aspects of Endorsement Split–Dollar Life Insurance Arrangements, was ratified. EITF 06-4 addresses accounting for separate agreements which split life insurance policy benefits between an employer and employee. The Issue requires the employer to recognize a liability for future benefits payable to the
54
employee under these agreements. The effects of applying EITF 06-4 must be recognized through either a change in accounting principle through an adjustment to equity or through the retrospective application to all prior periods. For calendar year companies, EITF 06-4 is effective beginning January 1, 2008. Early adoption is permitted as of January 1, 2007. We do not expect the adoption of EITF 06-4 to have a material effect on our consolidated financial statements.
Fair Value Option for Financial Assets and Financial Liabilities
On February 15, 2007, the FASB issued its Statement No. 159,The Fair Value Option for Financial Assets and Financial Liabilities—Including an Amendment of FASB Statement No. 115. FAS 159 permits entities to elect to report most financial assets and liabilities at their fair value with changes in fair value included in net income. The fair value option may be applied on an instrument-by-instrument or instrument class-by-class basis. The option is not available for deposits withdrawable on demand, pension plan assets and obligations, leases, instruments classified as stockholders’ equity, investments in consolidated subsidiaries and variable interest entities and certain insurance policies. The new standard is effective at the beginning of the Company’s fiscal year beginning January 1, 2008, and early application may be elected in certain circumstances. The Company expects to first apply the new standard at the beginning of its 2008 fiscal year. The Company is currently evaluating and has not yet determined the impact the new standard is expected to have on its financial position, results of operations or cash flows.
| Item 7A. | Quantitative and Qualitative Disclosures About Market Risk |
The information required by this item is incorporated herein by reference to the section captioned “Interest Rate Risk” in Item 7 of this annual report on Form 10-K.
55
| Item 8. | Financial Statements and Supplementary Data |
INDEX TO CONSOLIDATED FINANCIAL STATEMENTS
56
Report of Independent Registered Public Accounting Firm
Audit Committee, Board of Directors and Shareholders
Ameriana Bancorp
New Castle, Indiana
We have audited the accompanying consolidated balance sheets of Ameriana Bancorp as of December 31, 2006 and 2005, and the related consolidated statements of income, shareholders’ equity and cash flows for each of the three years in the period ended December 31, 2006. These financial statements are the responsibility of the Company’s management. Our responsibility is to express an opinion on these financial statements based on our audits.
We conducted our audits in accordance with the standards of the Public Company Accounting Oversight Board (United States). Those standards require that we plan and perform the audit to obtain reasonable assurance about whether the financial statements are free of material misstatement. An audit includes examining, on a test basis, evidence supporting the amounts and disclosures in the financial statements. An audit also includes assessing the accounting principles used and significant estimates made by management, as well as evaluating the overall financial statement presentation. We believe that our audits provide a reasonable basis for our opinion.
In our opinion, the consolidated financial statements referred to above present fairly, in all material respects, the financial position of Ameriana Bancorp as of December 31, 2006 and 2005, and the results of its operations and its cash flows for each of the three years in the period ended December 31, 2006, in conformity with accounting principles generally accepted in the United States of America.
|
| /s/ BKD, LLP |
|
| |
| Indianapolis, Indiana |
| March 28, 2007 |
57
Ameriana Bancorp
Consolidated Balance Sheets
(in thousands, except share data)
| | | | | | | | |
| | | December 31 | |
| | | 2006 | | | 2005 | |
Assets | | | | | | | | |
Cash on hand and in other institutions | | $ | 7,986 | | | $ | 8,318 | |
Interest-bearing demand deposits | | | 4,084 | | | | 5,952 | |
| | | | | | | | |
Cash and cash equivalents | | | 12,070 | | | | 14,270 | |
Investment securities available for sale | | | 129,776 | | | | 168,686 | |
Loans, net of allowance for loan losses of $2,616 and $2,835 | | | 249,272 | | | | 218,291 | |
Premises and equipment | | | 7,346 | | | | 7,676 | |
Stock in Federal Home Loan Bank | | | 5,646 | | | | 7,449 | |
Goodwill | | | 564 | | | | 564 | |
Cash value of life insurance | | | 21,937 | | | | 21,180 | |
Other assets | | | 10,635 | | | | 11,253 | |
| | | | | | | | |
Total assets | | $ | 437,246 | | | $ | 449,369 | |
| | | | | | | | |
Liabilities and Shareholders’ Equity | | | | | | | | |
Liabilities | | | | | | | | |
Deposits | | | | | | | | |
Noninterest-bearing | | $ | 19,905 | | | $ | 18,788 | |
Interest-bearing | | | 302,529 | | | | 320,563 | |
| | | | | | | | |
Total deposits | | | 322,434 | | | | 339,351 | |
Borrowings | | | 74,683 | | | | 66,889 | |
Drafts payable | | | 2,097 | | | | 2,763 | |
Other liabilities | | | 4,908 | | | | 4,709 | |
| | | | | | | | |
Total liabilities | | | 404,122 | | | | 413,712 | |
| | | | | | | | |
Commitments and contingencies | | | | | | | | |
Shareholders’ equity | | | | | | | | |
Preferred stock - 5,000,000 shares authorized and unissued | | | — | | | | — | |
Common stock, $1.00 par value
Authorized 15,000,000 shares
Issued and outstanding – 3,213,952 and 3,174,397 shares | | | 3,214 | | | | 3,174 | |
Additional paid-in capital | | | 1,039 | | | | 708 | |
Retained earnings | | | 32,152 | | | | 34,731 | |
Accumulated other comprehensive loss | | | (1,090 | ) | | | (2,956 | ) |
Treasury stock – 162,004 and 0 shares | | | (2,191 | ) | | | — | |
| | | | | | | | |
Total shareholders’ equity | | | 33,124 | | | | 35,657 | |
| | | | | | | | |
Total liabilities and shareholders’ equity | | $ | 437,246 | | | $ | 449,369 | |
| | | | | | | | |
See notes to consolidated financial statements.
58
Ameriana Bancorp
Consolidated Statements of Income
(in thousands, except share data)
| | | | | | | | | | | | |
| | | Year Ended December 31 | |
| | | 2006 | | | 2005 | | | 2004 | |
Interest Income | | | | | | | | | | | | |
Interest and fees on loans | | $ | 16,212 | | | $ | 13,395 | | | $ | 12,760 | |
Interest on mortgage-backed securities | | | 1,906 | | | | 2,004 | | | | 1,471 | |
Interest on investment securities | | | 3,793 | | | | 3,718 | | | | 3,518 | |
Other interest and dividend income | | | 693 | | | | 665 | | | | 582 | |
| | | | | | | | | | | | |
Total interest income | | | 22,604 | | | | 19,782 | | | | 18,331 | |
| | | | | | | | | | | | |
Interest Expense | | | | | | | | | | | | |
Interest on deposits | | | 10,591 | | | | 8,088 | | | | 6,305 | |
Interest on borrowings | | | 3,212 | | | | 1,907 | | | | 1,261 | |
| | | | | | | | | | | | |
Total interest expense | | | 13,803 | | | | 9,995 | | | | 7,566 | |
| | | | | | | | | | | | |
Net Interest Income | | | 8,801 | | | | 9,787 | | | | 10,765 | |
Provision (adjustment) for loan losses | | | 300 | | | | (2,852 | ) | | | 392 | |
| | | | | | | | | | | | |
Net Interest Income After Provision (Adjustment) for Loan Losses | | | 8,501 | | | | 12,639 | | | | 10,373 | |
| | | | | | | | | | | | |
Other Income | | | | | | | | | | | | |
Other fees and service charges | | | 1,719 | | | | 1,708 | | | | 1,472 | |
Brokerage and insurance commissions | | | 944 | | | | 999 | | | | 1,086 | |
Net realized and recognized losses on available-for-sale securities | | | (1,335 | ) | | | — | | | | — | |
Gains on sales of loans and servicing rights | | | 89 | | | | 176 | | | | 309 | |
Increase in cash value of life insurance | | | 758 | | | | 708 | | | | 767 | |
Other | | | 287 | | | | 524 | | | | 327 | |
| | | | | | | | | | | | |
Total other income | | | 2,462 | | | | 4,115 | | | | 3,961 | |
| | | | | | | | | | | | |
Other Expense | | | | | | | | | | | | |
Salaries and employee benefits | | | 8,100 | | | | 8,787 | | | | 8,093 | |
Net occupancy expense | | | 836 | | | | 846 | | | | 796 | |
Furniture and equipment expense | | | 715 | | | | 808 | | | | 817 | |
Legal and professional fees | | | 736 | | | | 1,042 | | | | 767 | |
Data processing expense | | | 534 | | | | 542 | | | | 579 | |
Printing and office supplies | | | 255 | | | | 231 | | | | 274 | |
Advertising and marketing expense | | | 261 | | | | 253 | | | | 207 | |
Other | | | 1,929 | | | | 2,004 | | | | 1,848 | |
| | | | | | | | | | | | |
Total other expense | | | 13,366 | | | | 14,513 | | | | 13,381 | |
| | | | | | | | | | | | |
Income Before Income Taxes | | | (2,403 | ) | | | 2,241 | | | | 953 | |
Income taxes (benefit) | | | (1,433 | ) | | | 183 | | | | (473 | ) |
| | | | | | | | | | | | |
Net Income (Loss) | | $ | (970 | ) | | $ | 2,058 | | | $ | 1,426 | |
| | | | | | | | | | | | |
Basic and Diluted Earnings (Loss) Per Share | | $ | (0.31 | ) | | $ | 0.65 | | | $ | 0.45 | |
| | | | | | | | | | | | |
See notes to consolidated financial statements.
59
Ameriana Bancorp
Consolidated Statements of Shareholders’ Equity
(in thousands, except per share data)
| | | | | | | | | | | | | | | | | | | | | | |
| | | Common
Stock | | Additional
Paid-in
Capital | | Retained
Earnings | | | Accumulated
Other
Comprehensive
Income (Loss) | | | Treasury
Stock | | | Total | |
Balance at January 1, 2004 | | $ | 3,148 | | $ | 506 | | $ | 35,259 | | | $ | (39 | ) | | $ | — | | | $ | 38,874 | |
Net income | | | — | | | — | | | 1,426 | | | | — | | | | | | | | 1,426 | |
Change in unrealized gain on available-for-sale securities, net of income tax expense of $173 | | | — | | | — | | | — | | | | 324 | | | | | | | | 324 | |
| | | | | | | | | | | | | | | | | | | | | | |
Comprehensive income | | | | | | | | | | | | | | | | | | | | | 1,750 | |
Exercise of stock options | | | 3 | | | 31 | | | — | | | | — | | | | | | | | 34 | |
Tax benefit related to exercise of non-qualified stock options | | | — | | | — | | | 1 | | | | — | | | | | | | | 1 | |
Dividends declared ($0.64 per share) | | | — | | | — | | | (2,016 | ) | | | — | | | | | | | | (2,016 | ) |
| | | | | | | | | | | | | | | | | | | | | | |
Balance at December 31, 2004 | | | 3,151 | | | 537 | | | 34,670 | | | | 285 | | | | — | | | | 38,643 | |
Net income | | | — | | | — | | | 2,058 | | | | — | | | | | | | | 2,058 | |
Change in the excess of additional pension liability over unrecognized prior service cost, net of income tax benefit of $178 | | | | | | | | | | | | | (346 | ) | | | | | | | (346 | ) |
Change in unrealized gain on available-for-sale securities, net of income tax benefit of $1,579 | | | | | | | | | | | | | (2,895 | ) | | | | | | | (2,895 | ) |
| | | | | | | | | | | | | | | | | | | | | | |
Comprehensive loss | | | | | | | | | | | | | | | | | | | | | (1,183 | ) |
Exercise of stock options | | | 23 | | | 171 | | | | | | | | | | | | | | | 194 | |
Tax benefit related to exercise of non-qualified stock options | | | | | | | | | 27 | | | | | | | | | | | | 27 | |
Dividends declared ($0.64 per share) | | | | | | | | | (2,024 | ) | | | | | | | | | | | (2,024 | ) |
| | | | | | | | | | | | | | | | | | | | | | |
Balance at December 31, 2005 | | | 3,174 | | | 708 | | | 34,731 | | | | (2,956 | ) | | | — | | | | 35,657 | |
Net loss | | | — | | | — | | | (970 | ) | | | — | | | | | | | | (970 | ) |
Change in unrealized gain on available-for-sale securities, net of income tax benefit of $(904) | | | | | | | | | | | | | 1,687 | | | | | | | | 1,687 | |
| | | | | | | | | | | | | | | | | | | | | | |
Comprehensive income | | | | | | | | | | | | | | | | | | | | | 717 | |
Exercise of stock options | | | 40 | | | 331 | | | | | | | | | | | | | | | 371 | |
Tax benefit related to exercise of non-qualified stock options | | | | | | | | | 43 | | | | | | | | | | | | 43 | |
Adjustment to initially apply FASB Statement No. 158, net of tax | | | | | | | | | | | | | 179 | | | | | | | | 179 | |
Common stock purchased | | | | | | | | | | | | | | | | | (2,191 | ) | | | (2,191 | ) |
Dividends declared ($0.52 per share) | | | | | | | | | (1,652 | ) | | | | | | | | | | | (1,652 | ) |
| | | | | | | | | | | | | | | | | | | | | | |
Balance at December 31, 2006 | | $ | 3,214 | | $ | 1,039 | | $ | 32,152 | | | $ | (1,090 | ) | | $ | (2,191 | ) | | $ | 33,124 | |
| | | | | | | | | | | | | | | | | | | | | | |
See notes to consolidated financial statements.
60
Ameriana Bancorp
Consolidated Statements of Cash Flows
(in thousands)
| | | | | | | | | | | | |
| | | Year Ended December 31 | |
| | | 2006 | | | 2005 | | | 2004 | |
Operating Activities | | | | | | | | | | | | |
Net income (loss) | | $ | (970 | ) | | $ | 2,058 | | | $ | 1,426 | |
Items not requiring (providing) cash | | | | | | | | | | | | |
Provision (adjustment) for losses on loans | | | 300 | | | | (2,852 | ) | | | 392 | |
Depreciation and amortization | | | 1,139 | | | | 1,435 | | | | 1,441 | |
Increase in cash value of life insurance | | | (757 | ) | | | (708 | ) | | | (767 | ) |
Loss on sale of investments | | | 821 | | | | — | | | | — | |
Impairment loss on equity securities | | | 514 | | | | — | | | | — | |
Mortgage loans originated for sale | | | (3,562 | ) | | | (8,830 | ) | | | (21,165 | ) |
Proceeds from sale of mortgage loans | | | 3,618 | | | | 9,259 | | | | 21,708 | |
Gains on sale of loans and servicing rights | | | (89 | ) | | | (176 | ) | | | (309 | ) |
Deferred income taxes | | | (81 | ) | | | (507 | ) | | | (708 | ) |
Increase (decrease) in drafts payable | | | (666 | ) | | | 436 | | | | (1,150 | ) |
Tax benefit related to exercise of stock options | | | 43 | | | | — | | | | — | |
Other adjustments | | | (211 | ) | | | 764 | | | | 3,179 | |
| | | | | | | | | | | | |
Net cash provided by operating activities | | | 99 | | | | 879 | | | | 4,047 | |
| | | | | | | | | | | | |
Investing Activities | | | | | | | | | | | | |
Purchase of securities | | | (28,979 | ) | | | (15,389 | ) | | | (75,913 | ) |
Proceeds/principal from sale of securities | | | 34,201 | | | | — | | | | — | |
Proceeds/principal from maturity of securities | | | 34,380 | | | | 11,896 | | | | 41,647 | |
Net change in loans | | | (31,914 | ) | | | (20,580 | ) | | | 6,189 | |
Net purchases of premises and equipment | | | (616 | ) | | | (661 | ) | | | (802 | ) |
Redemption/(purchase) of Federal Home Loan Bank stock | | | 1,803 | | | | (184 | ) | | | (317 | ) |
Other investing activities | | | 1,302 | | | | 1,053 | | | | 1,215 | |
| | | | | | | | | | | | |
Net cash provided by (used in) investing activities | | | 10,177 | | | | (23,865 | ) | | | (27,981 | ) |
| | | | | | | | | | | | |
Financing Activities | | | | | | | | | | | | |
Net change in demand and savings deposits | | | (20,482 | ) | | | (24,439 | ) | | | 13,464 | |
Net change in certificates of deposit | | | 3,588 | | | | 19,742 | | | | (15,161 | ) |
Net change in short-term borrowings | | | (6,000 | ) | | | 27,000 | | | | 5,000 | |
Proceeds from borrowings | | | 10,000 | | | | 6,750 | | | | 26,325 | |
Repayment of borrowings | | | (6,516 | ) | | | (7,251 | ) | | | (1,165 | ) |
Proceeds from issuance of subordinated debt | | | 10,310 | | | | — | | | | — | |
Purchase of common stock | | | (2,191 | ) | | | — | | | | — | |
Exercise of stock options | | | 371 | | | | 194 | | | | 34 | |
Tax benefit related to nonqualified stock options | | | 43 | | | | 27 | | | | 1 | |
Net change in advances by borrowers for taxes and insurance | | | 53 | | | | 204 | | | | (43 | ) |
Cash dividends paid | | | (1,652 | ) | | | (2,024 | ) | | | (2,016 | ) |
| | | | | | | | | | | | |
Net cash provided by (used in) financing activities | | | (12,476 | ) | | | 20,203 | | | | 26,438 | |
| | | | | | | | | | | | |
Change in Cash and Cash Equivalents | | | (2,200 | ) | | | (2,783 | ) | | | 2,504 | |
Cash and Cash Equivalents at Beginning of Year | | | 14,270 | | | | 17,053 | | | | 14,549 | |
| | | | | | | | | | | | |
Cash and Cash Equivalents at End of Year | | $ | 12,070 | | | $ | 14,270 | | | $ | 17,053 | |
| | | | | | | | | | | | |
See notes to consolidated financial statements.
61
Ameriana Bancorp
Notes to Consolidated Financial Statements
(table dollar amounts in thousands, except share data)
1. Nature of Operations and Summary of Significant Accounting Policies
Principles of Consolidation: The consolidated financial statements include the accounts of Ameriana Bancorp (the “Company”) and its wholly-owned subsidiary, Ameriana Bank, SB (the “Bank”), and the Bank’s wholly-owned subsidiaries, Ameriana Investment Management, Inc. (“AIMI”), Ameriana Financial Services, Inc., and Ameriana Insurance Agency, Inc. All significant intercompany accounts and transactions have been eliminated.
The preparation of financial statements in conformity with accounting principles generally accepted in the United States of America requires management to make estimates and assumptions that affect the reported amounts of assets and liabilities and disclosure of contingent assets and liabilities at the date of the financial statements and the reported amounts of revenues and expenses during the reporting period. Actual results could differ from those estimates.
The Company is a bank holding company whose principal activity is the ownership and management of the Bank and its subsidiaries. The Bank provides various banking services and engages in loan servicing activities for investors and operates in a single significant business segment. The Bank is subject to the regulation of the Indiana Department of Financial Institutions (the “DFI”) and the Federal Deposit Insurance Corporation (the “FDIC”). The Company’s gross revenues are substantially earned from the various banking services provided by the Bank. The Company also earns brokerage and insurance commissions from the services provided by the other subsidiaries. AIMI manages the Company’s investment portfolio.
The Bank generates loans and receives deposits from customers located primarily in east central Indiana. Loans are generally secured by specific items of collateral including real property and consumer assets. The Company has sold various loans to investors while retaining the servicing rights.
Cash and Cash Equivalents consist of cash on hand and in other institutions and interest-bearing demand deposits.
Investment Securities:Debt securities are classified as held to maturity when the Company has the positive intent and ability to hold the securities to maturity. Securities held to maturity are carried at amortized cost. Debt securities not classified as held to maturity are classified as available for sale. Securities available for sale are carried at fair value with unrealized gains and losses reported separately in accumulated other comprehensive income (loss), net of tax.
Amortization of premiums and accretion of discounts are recorded using the interest method as interest income from securities. Realized gains and losses are recorded as net security gains (losses). Gains and losses on sales of securities are determined on the specific-identification method.
Stock in Federal Home Loan Bank is stated at cost and the amount of stock the Company is required to own is determined by regulation.
Loansare carried at the principal amount outstanding. A loan is impaired when, based on current information or events, it is probable that the Company will be unable to collect all amounts due (principal and interest) according to the contractual terms of the loan agreement. Payments with insignificant delays not exceeding 90 days outstanding are not considered impaired. Certain nonaccrual and substantially delinquent loans may be considered to be impaired. Generally, loans are placed on non-accrual status at 90 days past due and interest is considered a loss, unless the loan is well-secured and in the process of collection. The Company considers its investment in one-to-four family residential loans and consumer loans to be homogeneous and, therefore, excluded from separate identification of evaluation of impairment. Interest income is accrued on the principal
62
Ameriana Bancorp
Notes to Consolidated Financial Statements
(table dollar amounts in thousands, except share data)
balances of loans. The accrual of interest on impaired and nonaccrual loans is discontinued when, in management’s opinion, the borrower may be unable to meet payments as they become due. When interest accrual is discontinued, all unpaid accrued interest is reversed when considered uncollectible. Interest income is subsequently recognized only to the extent cash payments are received. Certain loan fees and direct costs are being deferred and amortized as an adjustment of yield on the loans over the contractual lives of the loans. When a loan is paid off or sold, any unamortized loan origination fee balance is credited to income.
Allowance for Loan Losses is maintained at a level believed adequate by management to absorb inherent losses in the loan portfolio. Management’s determination of the adequacy of the allowance is based on an evaluation of the portfolio including consideration of past loan loss experience, current economic conditions, size, growth and composition of the loan portfolio, the probability of collecting all amounts due, and other relevant factors. Impaired loans are measured by the present value of expected future cash flows, or the fair value of the collateral of the loan, if collateral dependent. The allowance is increased by provisions for loan losses charged against income. Loan losses are charged against the allowance when management believes the uncollectibility of a loan balance is confirmed. Subsequent recoveries, if any, are credited to the allowance.
The determination of the adequacy of the allowance for loan losses is based on estimates that are particularly susceptible to significant changes in the economic environment and market conditions. Management believes that as of December 31, 2006, the allowance for loan losses was adequate based on information then available. A worsening or protracted economic decline in the areas within which the Company operates would increase the likelihood of additional losses due to credit and market risks and could create the need for additional loss reserves.
Premises and Equipmentare stated at cost less accumulated depreciation. Depreciation is computed principally by the straight-line method over the estimated useful lives of the related assets. Maintenance and repairs are expensed as incurred while major additions and improvements are capitalized.
Goodwillis annually tested for impairment. If the implied fair value of goodwill is lower than its carrying amount, goodwill impairment is indicated and goodwill is written down to its implied fair value. Subsequent increases in goodwill value are not recognized in the financial statements. There was no impairment of goodwill recognized in 2006, 2005 or 2004.
Earnings per Share is computed by dividing net income by the weighted-average number of common and potential common shares outstanding during each year.
Mortgage Servicing Rightson originated loans are capitalized by estimating the fair value of the streams of net servicing revenues that will occur over the estimated life of the servicing arrangement. Capitalized servicing rights, which include purchased servicing rights, are amortized in proportion to and over the period of estimated servicing revenues.
Stock Options—The Company has a stock option plan, which is described more fully in Note 10. Prior to 2006, the Company accounted for this plan under the recognition and measurement principles of APB Opinion No. 25, Accounting for Stock Issued to Employees, and related Interpretations. Accordingly, in 2005, no stock-based employee compensation cost is reflected in net income, as all options granted under this plan had an exercise price equal to the market value of the underlying common stock at the grant date.
Effective January 1, 2006, the Company adopted the fair value recognition provisions of Statement of Financial Accounting Standards (SFAS) No. 123R, Share-Based Payment. The Company selected the
63
Ameriana Bancorp
Notes to Consolidated Financial Statements
(table dollar amounts in thousands, except share data)
modified prospective application. Accordingly, after January 1, 2006, the Company was required to begin expensing the fair value of stock options granted, modified, repurchased or cancelled.
The following table illustrates the effect on net income and earnings per share if the Company had applied the fair value provisions of FASB Statement No. 123,Accounting for Stock-Based Compensation, to stock-based employee compensation in 2005 and 2004.
| | | | | | |
| | | 2005 | | 2004 |
Net income, as reported | | $ | 2,058 | | $ | 1,426 |
Less: Total stock-based employee compensation cost determined under the fair value based method, net of income taxes | | | 371 | | | 380 |
| | | | | | |
Pro forma net income | | $ | 1,687 | | $ | 1,046 |
| | | | | | |
| | |
Basic and diluted earnings per share, as reported | | $ | 0.65 | | $ | 0.45 |
Basic and diluted earnings per share, pro forma | | | 0.53 | | | 0.33 |
On December 29, 2005, the Company accelerated the vesting of all 50,000 outstanding stock options granted under the 1996 Stock Option and Incentive Plan. These stock options, which otherwise would have vested from time to time through August 2009, became exercisable immediately. The acceleration affected options held by employees of the Company and the Bank, including 28,500 options held by executive officers.
Income Taxin the consolidated statements of income includes deferred income tax provisions or benefits for all significant temporary differences in recognizing income and expenses for financial reporting and income tax purposes. The Company and its subsidiaries file consolidated tax returns. The parent company and subsidiaries are charged or given credit for income taxes as though separate returns were filed.
Reclassificationsof certain amounts in the 2005 and 2004 consolidated financial statements have been made to conform to the 2006 presentation.
2. Restriction on Cash and Due From Banks
The Bank is required to maintain reserve funds in cash and/or on deposit with the Federal Reserve Bank. The reserve required at December 31, 2006 was $300,000.
64
Ameriana Bancorp
Notes to Consolidated Financial Statements
(table dollar amounts in thousands, except share data)
3. Investment Securities
| | | | | | | | | | | | |
| | | Amortized
Cost | | Gross
Unrealized
Gains | | Gross
Unrealized
Losses | | Fair Value |
Available for sale at December 31, 2006 | | | | | | | | | | | | |
Mortgage-backed securities | | $ | 37,874 | | $ | 37 | | $ | 704 | | $ | 37,207 |
Federal agencies | | | 45,167 | | | 15 | | | 431 | | | 44,751 |
Municipal securities | | | 34,829 | | | 23 | | | 366 | | | 34,486 |
Other investment securities | | | 500 | | | 1 | | | — | | | 501 |
Equity securities | | | 12,853 | | | — | | | 22 | | | 12,831 |
| | | | | | | | | | | | |
| | $ | 131,223 | | $ | 76 | | $ | 1,523 | | $ | 129,776 |
| | | | | | | | | | | | |
| | | | | | | | | | | | |
| | | Amortized
Cost | | Gross
Unrealized
Gains | | Gross
Unrealized
Losses | | Fair Value |
Available for sale at December 31, 2005 | | | | | | | | | | | | |
Mortgage-backed securities | | $ | 46,580 | | $ | 45 | | $ | 910 | | $ | 45,715 |
Federal agencies | | | 91,567 | | | — | | | 2,155 | | | 89,412 |
Municipal securities | | | 20,288 | | | 1 | | | 520 | | | 19,769 |
Other investment securities | | | 1,500 | | | — | | | — | | | 1,500 |
Equity securities | | | 12,789 | | | — | | | 499 | | | 12,290 |
| | | | | | | | | | | | |
| | $ | 172,724 | | $ | 46 | | $ | 4,084 | | $ | 168,686 |
| | | | | | | | | | | | |
The amortized cost and fair value of securities available for sale at December 31, 2006, by contractual maturity, are shown below. Expected maturities will differ from contractual maturities because issuers may have the right to call or prepay obligations with or without call or prepayment penalties.
| | | | | | |
| | | Available for Sale |
| | | Amortized
Cost | | Fair Value |
Within one year | | $ | 39,271 | | $ | 38,840 |
One to five years | | | 6,678 | | | 6,687 |
Five to ten years | | | 24,041 | | | 23,817 |
After ten years | | | 10,006 | | | 9,893 |
| | | | | | |
| | | 79,996 | | | 79,237 |
Mortgage-backed securities | | | 37,874 | | | 37,207 |
Equity securities | | | 13,353 | | | 13,332 |
| | | | | | |
| | $ | 131,223 | | $ | 129,776 |
| | | | | | |
65
Ameriana Bancorp
Notes to Consolidated Financial Statements
(table dollar amounts in thousands, except share data)
Certain investment securities are reported in the financial statements at an amount less than their historical cost. Total fair value of these investments at December 31, 2006 and 2005 were $113,236,000 and $161,079,000, which is approximately 87.3% and 95.5% of the Company’s investment portfolio.
Mortgage-backed securities: The unrealized losses on the Company’s investment in mortgage-backed securities were caused by interest rate increases. The contractual cash flows of those investments are guaranteed by agencies of the U. S. Government. Accordingly, it is expected that the securities would not be settled at a price less than the amortized cost of the Company’s investment. Because the decline in market value was attributable to changes in interest rates and not credit quality, and because the Company has the ability and intent to hold those investments until a recovery of fair value, which may be maturity, the Company does not consider those investments to be other-than-temporarily impaired at December 31, 2006.
Federal agencies: The unrealized losses on the Company’s investment in federal agencies were caused by interest rate increases. The contractual terms of those investments do not permit the issuer to settle the securities at a price less than the amortized cost of the investment. Because the Company has the ability and intent to hold those investments until a recovery of fair value, which may be maturity, the Company does not consider those investments to be other-than-temporarily impaired at December 31, 2006.
Municipal securities: The unrealized losses on the Company’s investment in municipal securities were caused by interest rate increases. All municipal securities in the Company’s investment portfolio at December 31, 2006 have a credit rating of Aaa by Moody’s Investors Service. The contractual terms of those investments do not permit the issuer to settle the securities at a price less than the amortized cost of the investment. Because the Company has the ability and intent to hold those investments until a recovery of fair value, which may be maturity, the Company does not consider those investments to be other-than-temporarily impaired at December 31, 2006.
Equity securities: The unrealized losses on the Company’s investment in equity securities were caused by interest rate increases. Those equity securities consist of mutual funds whose portfolio compositions are primarily investments in debt securities with an average credit quality rating of AAA by Standard and Poor’s. Because the decline in market value was attributable to changes in interest rates and not credit quality, and because the Company has the ability and intent to hold these investments until a projected recovery of fair value, the Company does not consider those investments to be other-than-temporarily impaired at December 31, 2006.
Should the impairment of any of these securities become other than temporary, the cost basis of the investment will be reduced and the resulting loss recognized in net income in the period the other-than-temporary impairment is identified.
66
Ameriana Bancorp
Notes to Consolidated Financial Statements
(table dollar amounts in thousands, except share data)
The following table shows the Company’s investments’ gross unrealized losses and fair value, aggregated by investment category and length of time that individual securities have been in a continuous unrealized loss position at December 31, 2006 and 2005:
| | | | | | | | | | | | | | | | | | |
At December 31, 2006 | | Less Than 12 Months | | 12 Months or Longer | | Total |
| | | Fair
Value | | Unrealized
Losses | | Fair
Value | | Unrealized
Losses | | Fair Value | | Unrealized
Losses |
Mortgage-backed securities | | $ | 6,934 | | $ | 40 | | $ | 25,211 | | $ | 664 | | $ | 32,145 | | $ | 704 |
Federal agencies | | | — | | | — | | | 38,840 | | | 431 | | | 38,840 | | | 431 |
Municipal securities | | | 18,195 | | | 166 | | | 11,225 | | | 200 | | | 29,420 | | | 366 |
Equity securities | | | — | | | — | | | 12,831 | | | 22 | | | 12,831 | | | 22 |
| | | | | | | | | | | | | | | | | | |
| | $ | 25,129 | | $ | 206 | | $ | 88,107 | | $ | 1,317 | | $ | 113,236 | | $ | 1,523 |
| | | | | | | | | | | | | | | | | | |
| | | | | | | | | | | | | | | | | | |
At December 31, 2005 | | Less Than 12 Months | | 12 Months or Longer | | Total |
| | | Fair
Value | | Unrealized
Losses | | Fair Value | | Unrealized
Losses | | Fair Value | | Unrealized
Losses |
Mortgage-backed securities | | $ | 20,493 | | $ | 295 | | $ | 19,767 | | $ | 615 | | $ | 40,260 | | $ | 910 |
Federal agencies | | | 5,777 | | | 96 | | | 83,635 | | | 2,059 | | | 89,412 | | | 2,155 |
Municipal securities | | | 10,431 | | | 174 | �� | | 8,686 | | | 346 | | | 19,117 | | | 520 |
Equity securities | | | — | | | — | | | 12,290 | | | 499 | | | 12,290 | | | 499 |
| | | | | | | | | | | | | | | | | | |
| | $ | 36,701 | | $ | 565 | | $ | 124,378 | | $ | 3,519 | | $ | 161,079 | | $ | 4,084 |
| | | | | | | | | | | | | | | | | | |
Investment securities with a total carrying value of $36,715,000 and $53,933,000 were pledged at December 31, 2006 and 2005 to secure FHLB advances and a letter of credit.
A gross loss of $821,000 resulting from sale of available for sale securities was realized for 2006. A gross loss of $514,000 was recognized in 2006 on other than temporary impairment of available for sale equity securities. No investment securities were sold during 2005 and 2004.
All held-to-maturity debt securities were transferred to available-for-sale during 2005. On the date of transfer, these investments had a book value of $163.3 million, a market value of $160.2 million, and an unrealized net loss of $3.2 million on that date. This reclassification provides the Company with more flexibility to address changes in interest rate risk. The change had no effect on earnings, but did reduce shareholders’ equity due to the recording of unrealized net losses in other comprehensive income.
All available-for-sale debt securities were transferred to held-to-maturity during 2004. The transfer was made to reflect management’s intent at that time. The net unrealized gains on the securities at the date of transfer to the held-to-maturity classification will be amortized over the remaining terms of the securities. The unamortized portion of these net unrealized gains totaled $716,000 at December 31, 2004 and is included in accumulated comprehensive income.
67
Ameriana Bancorp
Notes to Consolidated Financial Statements
(table dollar amounts in thousands, except share data)
4. Loans
| | | | | | |
| | | December 31 |
| | | 2006 | | 2005 |
Residential mortgage loans | | $ | 125,424 | | $ | 98,495 |
Commercial mortgage loans | | | 62,112 | | | 68,484 |
Construction mortgage loans | | | 47,984 | | | 44,803 |
Consumer loans | | | 5,152 | | | 3,592 |
Commercial loans | | | 12,446 | | | 7,962 |
Loans secured by deposits | | | 637 | | | 582 |
| | | | | | |
| | | 253,755 | | | 223,918 |
| | | | | | |
Deduct | | | | | | |
Undisbursed loan proceeds | | | 1,769 | | | 2,485 |
Deferred loan costs, net | | | 98 | | | 307 |
Allowance for loan losses | | | 2,616 | | | 2,835 |
| | | | | | |
| | | 4,483 | | | 5,627 |
| | | | | | |
| | $ | 249,272 | | $ | 218,291 |
| | | | | | |
Loans being serviced by the Company for investors, primarily the Federal Home Loan Mortgage Corporation and Federal National Mortgage Association, totaled approximately $145,033,000, $161,463,000 and $179,596,000 as of December 31, 2006, 2005 and 2004, respectively. Such loans are not included in the preceding table.
The aggregate fair value of capitalized mortgage servicing rights at December 31, 2006 and 2005 is based on comparable market values and expected cash flows, with impairment assessed based on portfolio characteristics including product type, investor type and interest rates. No valuation allowance was necessary at December 31, 2006 and 2005.
| | | | | | | | | | | | |
| | | Year Ended December 31 | |
| | | 2006 | | | 2005 | | | 2004 | |
Mortgage servicing rights | | | | | | | | | | | | |
Balance at beginning of year | | $ | 1,091 | | | $ | 1,219 | | | $ | 1,313 | |
Servicing rights capitalized | | | 33 | | | | 86 | | | | 157 | |
Amortization of servicing rights | | | (157 | ) | | | (214 | ) | | | (251 | ) |
| | | | | | | | | | | | |
Balance at end of year | | $ | 967 | | | $ | 1,091 | | | $ | 1,219 | |
| | | | | | | | | | | | |
At December 31, 2006 and 2005, the Company had outstanding commitments to originate loans of approximately $8,320,000 and $9,459,000. The outstanding commitments for 2006 were primarily for commercial real estate loan and the outstanding commitments for 2005 were primarily for adjustable-rate mortgages with rates that were determined just prior to closing or fixed-rate mortgage loans with rates locked in at the time of loan commitment. In addition, the Company had $34,103,000 and $33,089,000 of conditional commitments for lines of credit receivables at December 31, 2006 and 2005. Exposure to credit loss in the event of nonperformance by the other party to the financial instruments for commitments to extend credit is represented by the contractual or notional amount of those instruments. The same credit policies are used in making such commitments as are used for instruments that are included in the consolidated balance sheets. Commitments to extend credit are
68
Ameriana Bancorp
Notes to Consolidated Financial Statements
(table dollar amounts in thousands, except share data)
agreements to lend to a customer as long as there is no violation of any condition established in the contract. Commitments generally have fixed expiration dates or other termination clauses and may require payment of a fee. Since many of the commitments are expected to expire without being drawn upon, the total commitment amounts do not necessarily represent future cash requirements. Each customer’s credit worthiness is evaluated on a case-by-case basis. The amount of collateral obtained, if deemed necessary upon extension of credit, is based on management’s credit evaluation. Collateral held varies but may include accounts receivable, inventory, real estate, equipment, and income-producing commercial properties. In addition, the Company had $5,122,000 and $4,842,000 of letters of credit outstanding at December 31, 2006 and 2005. Letters of credit are conditional commitments issued by the Company to guarantee the performance of a customer to a third party. The credit risk involved in issuing letters of credit is essentially the same as that involved in extending loans to customers.
5. Allowance for Loan Losses
| | | | | | | | | | | | |
| | | Year Ended December 31 | |
| | | 2006 | | | 2005 | | | 2004 | |
Balance at beginning of year | | $ | 2,835 | | | $ | 3,128 | | | $ | 3,744 | |
Transfer of allowance for unfunded commitments | | | — | | | | (116 | ) | | | — | |
Provision (adjustment) for losses | | | 300 | | | | (2,852 | ) | | | 392 | |
Charge-offs | | | (679 | ) | | | (1,532 | ) | | | (1,134 | ) |
Recoveries | | | 160 | | | | 4,207 | | | | 126 | |
| | | | | | | | | | | | |
Net recoveries (charge-offs) | | | (519 | ) | | | 2,675 | | | | (1,008 | ) |
| | | | | | | | | | | | |
Balance at end of year | | $ | 2,616 | | | $ | 2,835 | | | $ | 3,128 | |
| | | | | | | | | | | | |
At December 31, 2006 and 2005, impaired loans totaled $4,581,000 and $3,922,000 with an allocation of the allowance for loan losses of $882,000 and $724,000.
Interest income of $63,000, $128,000, and $77,000 was recognized on average impaired loans of $4,692,000, $5,305,000, and $5,437,000 for 2006, 2005, and 2004, respectively.
Cash basis interest on impaired loans included above was $63,000, $123,000 and $77,000 for 2006, 2005, and 2004, respectively.
At December 31, 2006 and 2005, accruing loans delinquent 90 days or more totaled $84,000 and $90,000. Non-accruing loans at December 31, 2006 and 2005 were $3,326,000 and $2,468,000.
69
Ameriana Bancorp
Notes to Consolidated Financial Statements
(table dollar amounts in thousands, except share data)
6. Premises and Equipment
| | | | | | |
| | | December 31 |
| | | 2006 | | 2005 |
Land | | $ | 1,477 | | $ | 1,714 |
Land improvements | | | 497 | | | 497 |
Office buildings | | | 7,883 | | | 7,818 |
Furniture and equipment | | | 4,310 | | | 4,658 |
Automobiles | | | 147 | | | 148 |
| | | | | | |
| | | 14,314 | | | 14,835 |
Less accumulated depreciation | | | 6,968 | | | 7,159 |
| | | | | | |
| | $ | 7,346 | | $ | 7,676 |
| | | | | | |
7. Deposits
| | | | | | |
| | | December 31 |
| | | 2006 | | 2005 |
Demand | | $ | 111,549 | | $ | 122,481 |
Savings | | | 22,637 | | | 25,034 |
Certificates of $100,000 or more | | | 39,033 | | | 46,988 |
Other certificates | | | 149,215 | | | 144,848 |
| | | | | | |
| | $ | 322,434 | | $ | 339,351 |
| | | | | | |
The Company held no brokered certificates at December 31, 2006. At December 31, 2005, the Company held a brokered certificate for $9,977,000.
Certificates maturing in years ending after December 31, 2006:
| | | |
2007 | | $ | 159,819 |
2008 | | | 11,775 |
2009 | | | 6,913 |
2010 | | | 4,184 |
2011 | | | 1,411 |
Thereafter | | | 4,146 |
| | | |
| | $ | 188,248 |
| | | |
Interest paid on deposits approximated deposit interest expense in 2006, 2005 and 2004.
70
Ameriana Bancorp
Notes to Consolidated Financial Statements
(table dollar amounts in thousands, except share data)
8. Borrowings
Borrowings at December 31, 2006 and 2005 include Federal Home Loan Bank advances totaling $64,373,000 and $66,589,000 with a weighted-average rate of 4.60% and 3.93%. The advances are secured by a combination of first mortgage loans, investment securities and overnight deposits. Some advances are subject to restrictions or penalties in the event of prepayment.
Borrowings at December 31, 2006 also include subordinated debentures in the amount of $10,310,000 at a rate equal to the average of 6.71% and the three-month London Interbank Offered Rate (“LIBOR”) plus 150 basis points for the first five years following the offering. After the first five years, the securities will bear a rate equal to 150 basis points over the three-month LIBOR. At December 31, 2006 the interest rate was 6.79%. These subordinated debentures mature on March 15, 2036.
Borrowings at December 31, 2005 also include a note payable for $300,000 to another financial institution with a rate of 5.75%. The note is secured by the outstanding common stock of the Bank. The note outstanding at December 31, 2005 was due at January 24, 2006 and was renewed at that date to July 24, 2006. The note was paid off in 2006.
Interest paid on borrowings was $3,168,000, $1,908,000 and $1,221,000 for 2006, 2005 and 2004, respectively.
Aggregate annual maturities of borrowings at December 31, 2006 are:
| | | |
Maturities in years ending December 31 | | | |
2007 | | $ | 39,000 |
2008 | | | 2,448 |
2009 | | | 2,550 |
2010 | | | 375 |
2011 | | | — |
Thereafter | | | 30,310 |
| | | |
| | $ | 74,683 |
| | | |
71
Ameriana Bancorp
Notes to Consolidated Financial Statements
(table dollar amounts in thousands, except share data)
9. Income Taxes
| | | | | | | | |
| | | December 31 | |
| | | 2006 | | | 2005 | |
Deferred tax assets | | | | | | | | |
Deferred compensation | | $ | 841 | | | $ | 599 | |
General loan loss reserves | | | 1,052 | | | | 1,149 | |
Net unrealized loss on securities available for sale | | | 525 | | | | 1,428 | |
Reserve for uncollected interest | | | 268 | | | | 204 | |
State and federal net operating loss carryfoward and tax credits carryfoward | | | 3,066 | | | | 2,171 | |
Benefit plans | | | 124 | | | | 300 | |
| | | | | | | | |
| | | 5,876 | | | | 5,851 | |
| | | | | | | | |
Deferred tax liabilities | | | | | | | | |
FHLB stock dividends | | | (313 | ) | | | (828 | ) |
Tax bad debt reserves | | | (23 | ) | | | (23 | ) |
Deferred loan fees | | | (232 | ) | | | (140 | ) |
Mortgage servicing rights | | | (398 | ) | | | (450 | ) |
Deferred state tax | | | (218 | ) | | | (234 | ) |
Depreciation | | | (212 | ) | | | (214 | ) |
Prepaid expenses | | | (231 | ) | | | (140 | ) |
Other | | | — | | | | (2 | ) |
| | | | | | | | |
| | | (1,627 | ) | | | (2,031 | ) |
| | | | | | | | |
Net deferred tax asset before valuation allowance | | | 4,249 | | | | 3,820 | |
| | | | | | | | |
Valuation allowance | | | | | | | | |
Beginning balance | | | (284 | ) | | | — | |
Increase during the period | | | (102 | ) | | | (284 | ) |
| | | | | | | | |
Ending balance | | | (386 | ) | | | (284 | ) |
| | | | | | | | |
Net deferred tax asset | | $ | 3,863 | | | $ | 3,536 | |
| | | | | | | | |
As of December 31, 2006, the Company had approximately $14,300,000 of state tax loss carryforward available to offset future franchise tax. As of December 31, 2006, the Company had approximately $2,500,000 of federal tax loss carryforward available to offset future federal tax. Also, at December 31, 2006, the Company had approximately $1,080,000 of tax credits available to offset future federal income tax. The state loss carryforward begins to expire in 2023. The federal loss carryforward expires in 2024. The tax credits begin to expire in 2023. Included in the $1,080,000 of tax credits available to offset future federal income tax are approximately $373,000 of alternative minimum tax credits which have no expiration date. Management believes that the Company will be able to utilize the benefits recorded for loss carryforwards and credits within the allotted time periods.
Retained earnings at December 31, 2006, includes an allocation of income to bad debt deductions of approximately $11,883,000 for which no provision for federal income taxes has been made. If, in the future, this portion of retained earnings is used for any purpose other than to absorb bad debt losses, including redemption of bank stock or excess dividends, or loss of “bank” status, federal income taxes may be imposed at the then applicable rates. The unrecorded deferred income tax liability on the above amount was approximately $4,000,000.
72
Ameriana Bancorp
Notes to Consolidated Financial Statements
(table dollar amounts in thousands, except share data)
The effective income tax rate on income from continuing operations is reconciled to the statutory corporate tax rate as follows:
| | | | | | | | | |
| | | Year Ended December 31 | |
| | | 2006 | | | 2005 | | | 2004 | |
Statutory federal tax rate | | (34.0 | )% | | 34.0 | % | | 34.0 | % |
State income taxes, net of federal tax benefit | | 0.0 | | | 0.6 | | | (18.4 | ) |
Tax credits | | (3.2 | ) | | (5.8 | ) | | (17.2 | ) |
Cash value of life insurance | | (10.7 | ) | | (10.7 | ) | | (27.3 | ) |
Municipal securities | | (12.2 | ) | | (10.9 | ) | | (23.7 | ) |
Other | | 0.4 | | | 1.0 | | | 3.0 | |
| | | | | | | | | |
Effective tax rate | | (59.7 | )% | | 8.2 | % | | (49.6 | )% |
| | | | | | | | | |
The provision (credit) for income taxes consists of the following:
| | | | | | | | | | | | |
| | | Year Ended December 31 | |
| | | 2006 | | | 2005 | | | 2004 | |
Federal | | | | | | | | | | | | |
Current | | $ | (1,414 | ) | | $ | 634 | | | $ | 235 | |
Deferred | | | (19 | ) | | | (473 | ) | | | (443 | ) |
| | | | | | | | | | | | |
| | | (1,433 | ) | | | 161 | | | | (208 | ) |
| | | | | | | | | | | | |
State | | | | | | | | | | | | |
Current | | | 62 | | | | 56 | | | | — | |
Deferred | | | (62 | ) | | | (34 | ) | | | (265 | ) |
| | | | | | | | | | | | |
| | | — | | | | 22 | | | | (265 | ) |
| | | | | | | | | | | | |
Tax expense (benefit) | | $ | (1,433 | ) | | $ | 183 | | | $ | (473 | ) |
| | | | | | | | | | | | |
The Company received a federal refund of $400,000 in 2006 and paid $550,000 of state and federal income taxes in 2005. The Company paid no state and federal taxes in 2004.
10. Employee Benefits
The Company is a participating employer in a multi-employer defined benefit pension plan and a 401(k) plan. The plans cover substantially all full-time employees of the Company. The Company matches employees’ contributions to the 401(k) plan at the rate of 100% for the first 4% of base salary contributed by participants. Since the defined benefit pension plan is a multi-employer plan, no separate actuarial valuations are made with respect to each participating employer. The Company froze the defined benefit pension plan on June 30, 2004 to stop accruing benefits to plan participants beyond what was already earned to that date and to prevent new participants from entering the plan. The change was made in an effort to control and reduce pension plan expense in the future. The Company made a voluntary payment of $1.1 million to the defined-benefit pension plan in 2005 to fund a portion of the liability. The payment was made to improve our funded status, which is expected to reduce the overall normal cost under the plan and provide greater flexibility in meeting minimum funding requirements in future periods. The Company will continue to make contributions to meet required
73
Ameriana Bancorp
Notes to Consolidated Financial Statements
(table dollar amounts in thousands, except share data)
funding obligations. Pension expense for the plans totaled $ 589,000, $1,504,000 and $932,000 in 2006, 2005 and 2004, respectively.
The Company has arrangements that provide retirement and death benefits to certain officers and directors.
The Company uses a December 31 measurement date for the plan. Information about the plans’ funded status and pension cost follows:
| | | | | | | | |
| | | 2006 | | | 2005 | |
Change in benefit obligation | | | | | | | | |
Beginning of year | | $ | 2,191 | | | $ | 1,582 | |
Service cost | | | 29 | | | | 82 | |
Interest cost | | | 126 | | | | 94 | |
Actuarial gain | | | (195 | ) | | | 507 | |
Benefits paid | | | (116 | ) | | | (74 | ) |
| | | | | | | | |
End of year | | $ | 2,035 | | | $ | 2,191 | |
| | | | | | | | |
Funded status at end of year | | $ | (2,035 | ) | | $ | (2,191 | ) |
| | | | | | | | |
Amounts recognized in the balance sheets
| | | | | | |
| | | 2006 | | 2005 |
Assets | | $ | 304 | | $ | 456 |
| | | | | | |
Liabilities | | $ | 2,035 | | $ | 2,243 |
| | | | | | |
Amounts recognized in accumulated other comprehensive income consist of net loss and prior service cost, net of tax.
Information for pension plans with an accumulated benefit obligation in excess of plan assets:
| | | | | | | | |
| | | 2006 | | | 2005 | |
Projected benefit obligation | | $ | (2,035 | ) | | $ | (2,191 | ) |
| | | | | | | | |
Accumulated benefit obligation | | $ | (2,035 | ) | | $ | (2,191 | ) |
| | | | | | | | |
| | |
Components of net periodic benefit cost | | | | | | | | |
Service cost | | $ | 29 | | | $ | 82 | |
Interest cost | | | 126 | | | | 94 | |
Amortization of prior service cost | | | 137 | | | | 65 | |
| | | | | | | | |
Net periodic benefit cost | | $ | 292 | | | $ | 241 | |
| | | | | | | | |
74
Ameriana Bancorp
Notes to Consolidated Financial Statements
(table dollar amounts in thousands, except share data)
The estimated net loss, prior service cost and transition obligation for the defined benefit pension plans that will be amortized from accumulated other comprehensive income into net periodic benefit cost over the next fiscal year are $11,000, $61,000 and $0, respectively.
Significant assumptions include:
| | | | | | |
| | | 2006 | | | 2005 | |
Weighted-average assumptions used to determine benefit obligation | | | | | | |
Discount rate | | 6.0 | % | | 6.0 | % |
Rate of compensation increase | | N/A | | | N/A | |
| | |
Weighted-average assumptions used to determine benefit cost | | | | | | |
Discount rate | | 6.0 | % | | 6.0 | % |
Expected return on plan assets | | N/A | | | N/A | |
Rate of compensation increase | | N/A | | | N/A | |
The following benefit payments, which reflect expected future service, as appropriate, are expected to be paid as of December 31, 2006:
| | | |
2007 | | $ | 161 |
2008 | | | 165 |
2009 | | | 169 |
2010 | | | 172 |
2011 | | | 176 |
2012-2016 | | | 1,009 |
The following table reflects the adjustments recorded in accordance with the adoption of the recognition and disclosure requirement of SFAS No. 158.
| | | | | | | | | | | | |
| | | Before
application of
Statement
No. 158 | | | Adjustments | | | After
application of
Statement
No. 158 | |
Other assets | | $ | 10,342 | | | $ | (293 | ) | | $ | 10,635 | |
Total assets | | | 436,953 | | | | (293 | ) | | | 437,246 | |
Other liabilities | | | 4,436 | | | | (472 | ) | | | 4,908 | |
Total liabilities | | | 403,650 | | | | (472 | ) | | | 404,122 | |
Accumulated other comprehensive loss | | | (1,269 | ) | | | (179 | ) | | | (1,090 | ) |
Total shareholders’ equity | | | 33,303 | | | | (179 | ) | | | 33,124 | |
75
Ameriana Bancorp
Notes to Consolidated Financial Statements
(table dollar amounts in thousands, except share data)
The Company has entered into employment or change in control agreements with certain officers that provide for the continuation of salary and certain benefits for a specified period of time under certain conditions. Under the terms of the agreements, these payments could occur in the event of a change in control of the Company, as defined, along with other specific conditions. The contingent liability under these agreements is generally three times the annual salary of the officer.
Under the 1996 Stock Option and Incentive Plan (“1996 Plan”) and the 2006 Long-Term Incentive Plan (“2006 Plan”), the Company has granted options to individuals to purchase common stock at a price equal to the fair market value at the date of grant, subject to the terms and conditions of the plans. The 1996 Plan and the 2006 Plan required that options be granted at the fair market value of the stock on the date of the grant. Options vest and are fully exercisable when granted or over an extended period subject to continuous employment or under other conditions set forth in the plans. The period for exercising options shall not exceed ten years from the date of grant. The plans also permit grants of stock appreciation rights. An amendment of the 1996 Plan extended the plan’s term by five years and increased the number of shares reserved under the plan from 176,000 to 352,000 shares. During 2005, an adjustment was made to the number of options outstanding due to a previous stock split not reflected in certain awards. The 2006 Plan permits the granting of up to 225,000 shares. The 1996 Plan and 2006 Plan were approved by the stockholders of the Company.
The fair value of each option award is estimated on the date of grant using a binomial option valuation model that uses the assumptions noted in the following table. Expected volatility is based on historical volatility of the Company’s stock and other factors. The Company uses historical volatility of the Company’s stock and other factors. The expected term of options granted is derived from the output of the option valuation model and represents the period of time that options granted are expected to be outstanding. The risk-free rate for periods within the contractual life of the option is based on the U.S. Treasury yield curve in effect at the time of the grant.
The following is a summary of the status of the Company’s stock option plans and changes in those plans as of and for the years ended December 31, 2006, 2005 and 2004.
| | | | | | |
| | | 2006 | | 2005 | | 2004 |
Expected volatility | | 34.0%-36.0% | | 34.9%-35.6 % | | 34.5%-35.6% |
Weighted-average volatility | | 34.0%-36.0% | | 34.9%-35.6 % | | 34.5%-35.6% |
Expected dividends | | 4.9% | | 4.3% | | 4.1-4.2% |
Expected term (in years) | | 8.0 | | 8.5 | | 8.0 |
Risk-free rate | | 4.6% | | 4.1%-4.6% | | 3.4%-4.1% |
76
Ameriana Bancorp
Notes to Consolidated Financial Statements
(table dollar amounts in thousands, except share data)
A summary of option activity under the Plan as of December 31, 2006, and changes during the year then ended, is presented below.
| | | | | | | | | | | |
| | | Shares | | | Weighted-
Average
Exercise Price | | Weighted-
Average
Remaining
Contractual
Term | | Aggregate
Intrinsic Value |
Outstanding, beginning of year | | 383,162 | | | $ | 14.00 | | | | | |
Granted | | 1,000 | | | | 13.79 | | | | | |
Exercised | | (39,555 | ) | | | 12.65 | | | | | |
Forfeited | | (23,260 | ) | | | 14.20 | | | | | |
| | | | | | | | | | | |
Outstanding, end of year | | 321,347 | | | $ | 14.55 | | 4.94 | | $ | 36,000 |
| | | | | | | | | | | |
Exercisable, end of year | | 320,547 | | | $ | 14.55 | | 4.94 | | $ | 36,000 |
| | | | | | | | | | | |
The weighted-average grant-date fair value of options granted during the years 2006, 2005, and 2004 was $2.70, $2.38 and $2.13, respectively. The total intrinsic value of options exercised during the years ended December 31, 2006, 2005 and 2004 was $129,000, $83,000 and $657,000, respectively.
As of December 31, 2006, there was $2,000 of total unrecognized compensation cost related to nonvested share-based compensation arrangements granted under the Plan. That cost is expected to be recognized over a weighted-average period of 4 years.
During 2006, the Company recognized $1,000 of share-based compensation expense.
11. Dividend and Capital Restrictions
The payment of dividends by the Company depends substantially upon receipt of dividends from the Bank, which is subject to various regulatory restrictions on the payment of dividends. Under current regulations, the Bank may not declare or pay a cash dividend or repurchase any of its capital stock if the effect thereof would cause its net worth to be reduced below regulatory capital requirements or the amount required for its liquidation accounts.
In addition, without prior approval, current regulations allow the Bank to pay dividends to the Company not exceeding retained net income for the applicable calendar year to date, plus retained net income for the preceding two years. Application is required by the Bank to pay dividends in excess of this restriction. At December 31, 2006, the shareholders’ equity of the Bank was $40,405,000.
77
Ameriana Bancorp
Notes to Consolidated Financial Statements
(table dollar amounts in thousands, except share data)
12. Earnings Per Share
| | | | | | | | | | | | | | | | | | | | | | | | | | |
| | | Year Ended December 31 |
| | | 2006 | | | 2005 | | 2004 |
| | | Net
Loss | | | Weighted-
Average
Shares | | Per
Share
Amount | | | Income | | Weighted-
Average
Shares | | Per
Share
Amount | | Income | | Weighted-
Average
Shares | | Per
Share
Amount |
Basic Earnings Per Share | | | | | | | | | | | | | | | | | | | | | | | | | | |
Income available to common shareholders | | $ | (970 | ) | | 3,213,952 | | $ | (0.31 | ) | | $ | 2,058 | | 3,160,392 | | $ | 0.65 | | $ | 1,426 | | 3,149,384 | | $ | 0.45 |
| | | | | | | | | | | | | | | | | | | | | | | | | | |
Effect of Dilutive Stock Options | | | — | | | — | | | | | | | — | | 12,911 | | | | | | — | | 31,766 | | | |
| | | | | | | | | | | | | | | | | | | | | | | | | | |
Diluted Earnings Per Share | | | | | | | | | | | | | | | | | | | | | | | | | | |
Income available to common shareholders and assumed conversions | | $ | (970 | ) | | 3,213,952 | | $ | (0.31 | ) | | $ | 2,058 | | 3,173,303 | | $ | 0.65 | | $ | 1,426 | | 3,181,150 | | $ | 0.45 |
| | | | | | | | | | | | | | | | | | | | | | | | | | |
Options to purchase 240,306, 276,857 and 34,100 shares of common stock at exercise prices of $12.43 to $18.30, $14.25 to $18.30 and $16.75 to $18.30 per share were outstanding at December 31, 2006, 2005 and 2004, respectively, but were not included in the computation of diluted earnings per share because the options were anti-dilutive.
13. Other Comprehensive Income (Loss)
Other comprehensive income (loss) components and related taxes were as follows:
| | | | | | | | | | | | |
| | | 2006 | | | 2005 | | | 2004 | |
Unrealized losses on securities available for sale | | $ | 2,591 | | | $ | (4,474 | ) | | $ | (219 | ) |
Unrealized gains on securities transferred from available for sale to held to maturity | | | — | | | | — | | | | 896 | |
Amortization of unrealized gains on securities transferred from available for sale to held to maturity | | | — | | | | — | | | | (180 | ) |
Excess of additional pension liability over unrecognized prior service cost | | | — | | | | (524 | ) | | | — | |
| | | | | | | | | | | | |
Other comprehensive income (loss), before tax effect | | | 2,591 | | | | (4,998 | ) | | | 497 | |
Tax expense (benefit) | | | (904 | ) | | | (1,757 | ) | | | 173 | |
| | | | | | | | | | | | |
Other comprehensive income (loss) | | $ | 1,687 | | | $ | (3,241 | ) | | $ | 324 | |
| | | | | | | | | | | | |
14. Accumulated other comprehensive loss
| | | | | | | | |
| | | 2006 | | | 2005 | |
Net unrealized loss on available-for-sale securities, net of income tax benefit | | $ | (923 | ) | | $ | (2,609 | ) |
Pension liability not yet recognized in net periodic cost, net of income tax benefit | | | (167 | ) | | | (347 | ) |
| | | | | | | | |
| | $ | (1,090 | ) | | $ | (2,956 | ) |
| | | | | | | | |
78
Ameriana Bancorp
Notes to Consolidated Financial Statements
(table dollar amounts in thousands, except share data)
15. Regulatory Matters
The Bank is subject to various regulatory capital requirements administered by the federal banking agencies and is assigned to a capital category. The assigned capital category is largely determined by three ratios that are calculated according to the regulations. The ratios are intended to measure capital relative to assets and credit risk associated with those assets and off-balance sheet exposures. The capital category assigned can also be affected by qualitative judgments made by regulatory agencies about the risk inherent in the entity’s activities that are not part of the calculated ratios.
There are five capital categories defined in the regulations, ranging from well capitalized to critically undercapitalized. Classification in any of the undercapitalized categories can result in actions by regulators that could have a material effect on a bank’s operations. At December 31, 2006 and 2005, the Bank is categorized as well capitalized and met all subject capital adequacy requirements. There are no conditions or events since December 31, 2006, that management believes have changed this classification.
Actual and required capital amounts and ratios for the Bank and the Company are as follows:
| | | | | | | | | | | | |
| | | December 31, 2006 |
| | | Required For
Adequate Capital | | Actual Capital |
| | | Ratio | | | Amount | | Ratio | | | Amount |
Total risk-based capital (to risk-weighted assets) | | 8.0 | % | | $ | 21,474 | | 15.49 | % | | $ | 41,572 |
Tier 1 capital (to risk-weighted assets) | | 4.0 | | | | 10,737 | | 14.46 | | | | 38,824 |
Core capital (to adjusted total assets) | | 3.0 | | | | 13,585 | | 8.57 | | | | 38,824 |
Core capital (to adjusted tangible assets) | | 2.0 | | | | 9,057 | | 8.57 | | | | 38,824 |
Tangible capital (to adjusted total assets) | | 1.5 | | | | 6,793 | | 8.57 | | | | 38,824 |
| | | | | | | | | | | | |
| | | December 31, 2005 |
| | | Required For
Adequate Capital | | Actual Capital |
| | | Ratio | | | Amount | | Ratio | | | Amount |
Total risk-based capital (to risk-weighted assets) | | 8.0 | % | | $ | 21,781 | | 13.94 | % | | $ | 37,925 |
Tier 1 capital (to risk-weighted assets) | | 4.0 | | | | 10,890 | | 12.85 | | | | 34,958 |
Core capital (to adjusted total assets) | | 3.0 | | | | 13,187 | | 7.95 | | | | 34,958 |
Core capital (to adjusted tangible assets) | | 2.0 | | | | 8,791 | | 7.95 | | | | 34,958 |
Tangible capital (to adjusted total assets) | | 1.5 | | | | 6,593 | | 7.95 | | | | 34,958 |
During the third quarter of 2005, the Indiana Department of Financial Institutions (“DFI”) and the Federal Deposit Insurance Corporation (“FDIC”) released the Bank from a memorandum of understanding (“MOU”) dated May 23, 2002. The MOU required the Bank to adopt written action plans with respect to certain classified assets, revise its lending policies in accordance with examiner recommendations, required greater financial information from borrowers, establish a loan review program, document Board review of the adequacy of loan losses, formulate a plan for improving the Bank’s profitability, review staffing needs with particular emphasis on loan administration, strengthen certain internal controls and audit coverage and address other regulatory compliance issues raised in an examination report by the FDIC and DFI. The release of the
79
Ameriana Bancorp
Notes to Consolidated Financial Statements
(table dollar amounts in thousands, except share data)
MOU was contingent on the Bank’s adoption of a resolution that required the Bank to continue reducing the level of assets classified as substandard, formulate and implement a written Profit Plan, abstain from purchasing additional Bank Owned Life Insurance policies, formalize policies for leveraging strategies, and maintain Tier 1 capital at or above 7% of assets. The Bank adopted the resolution on June 23, 2005.
On June 9, 2006 the Bank was released from the provisions of the Board resolution. Accordingly, the resolution is no longer in effect.
16. Fair Value of Financial Instruments
Fair values are based on estimates using present value and other valuation techniques in instances where quoted market prices are not available. These techniques are significantly affected by the assumptions used, including discount rates and estimates of future cash flows. As such, the derived fair value estimates cannot be compared to independent markets and, further, may not be realizable in an immediate settlement of the instruments. Accordingly, the aggregate fair value amounts presented do not represent, and should not be construed to represent, the underlying value of the Company.
The following table presents the estimates of fair value of financial instruments:
| | | | | | | | | | | | |
| | | December 31 |
| | | 2006 | | 2005 |
| | | Carrying
Value | | Fair Value | | Carrying
Value | | Fair Value |
Assets | | | | | | | | | | | | |
Cash and cash equivalents | | $ | 12,070 | | $ | 12,070 | | $ | 14,270 | | $ | 14,270 |
Investment securities available for sale | | | 129,776 | | | 129,776 | | | 168,686 | | | 168,686 |
Loans | | | 249,272 | | | 250,634 | | | 218,291 | | | 219,627 |
Interest receivable | | | 2,311 | | | 2,311 | | | 2,321 | | | 2,321 |
Stock in FHLB | | | 5,646 | | | 5,646 | | | 7,449 | | | 7,449 |
Liabilities | | | | | | | | | | | | |
Deposits | | | 322,434 | | | 321,293 | | | 339,351 | | | 337,651 |
Borrowings | | | 74,683 | | | 73,176 | | | 66,889 | | | 65,529 |
Interest payable | | | 1,037 | | | 1,037 | | | 589 | | | 589 |
Drafts payable | | | 2,097 | | | 2,097 | | | 2,763 | | | 2,763 |
The following methods and assumptions were used to estimate the fair value of each class of financial instrument:
Cash and Cash Equivalents and Stock in FHLB: The carrying amounts reported in the consolidated balance sheets approximate those assets’ fair values.
Investment Securities:Fair values are based on quoted market prices.
Loans: The fair values for loans are estimated using a discounted cash flow calculation that applies interest rates used to price new similar loans to a schedule of aggregated expected monthly maturities on loans.
Interest Receivable/Payable: The fair value of accrued interest receivable/payable approximates carrying values.
80
Ameriana Bancorp
Notes to Consolidated Financial Statements
(table dollar amounts in thousands, except share data)
Deposits: The fair values of interest-bearing demand and savings accounts are equal to the amount payable on demand at the balance sheet date. Fair values for certificates of deposit are estimated using a discounted cash flow calculation that applies interest rates currently being offered on deposits to a schedule of aggregated expected monthly maturities on deposits.
Borrowings: The fair value of borrowings is estimated using a discounted cash flow calculation, based on borrowing rates for periods comparable to the remaining terms to maturity of the borrowings.
Drafts Payable: The fair value approximates carrying value.
17. Parent Company Financial Information
The following are condensed financial statements for the parent company, Ameriana Bancorp, only:
| | | | | | |
| | | December 31 |
Balance Sheets | | 2006 | | 2005 |
Assets | | | | | | |
Cash | | $ | 1,927 | | $ | 765 |
Investment in Bank | | | 40,405 | | | 35,238 |
Investments in affiliates | | | 649 | | | 349 |
Other assets | | | 640 | | | 165 |
| | | | | | |
| | $ | 43,621 | | $ | 36,517 |
| | | | | | |
Liabilities and shareholders’ equity | | | | | | |
Notes payable, other | | $ | 10,310 | | $ | 300 |
Other liabilities | | | 187 | | | 560 |
Shareholders’ equity | | | 33,124 | | | 35,657 |
| | | | | | |
| | $ | 43,621 | | $ | 36,517 |
| | | | | | |
| | | | | | | | | | | |
| | | Year Ended December 31 |
Statements of Operations | | 2006 | | | 2005 | | | 2004 |
Dividends from Bank | | $ | 1,400 | | | $ | 2,675 | | | $ | 1,400 |
Interest income | | | 17 | | | | — | | | | 3 |
| | | | | | | | | | | |
| | | 1,417 | | | | 2,675 | | | | 1,403 |
Operating expense | | | 1,140 | | | | 589 | | | | 500 |
| | | | | | | | | | | |
Income before income tax benefit and equity in undistributed income of Bank | | | (277 | ) | | | 2,086 | | | | 903 |
Income tax benefit | | | 462 | | | | 335 | | | | 363 |
| | | | | | | | | | | |
| | | 739 | | | | 2,421 | | | | 1,266 |
Equity in undistributed income of Bank and affiliates (distributions in excess of equity in income) | | | (1,709 | ) | | | (363 | ) | | | 160 |
| | | | | | | | | | | |
Net Income (Loss) | | $ | (970 | ) | | $ | 2,058 | | | $ | 1,426 |
| | | | | | | | | | | |
81
Ameriana Bancorp
Notes to Consolidated Financial Statements
(table dollar amounts in thousands, except share data)
| | | | | | | | | | | | |
| | | Year Ended December 31 | |
Statements of Cash Flows | | 2006 | | | 2005 | | | 2004 | |
Operating Activities | | | | | | | | | | | | |
Net income | | $ | (970 | ) | | $ | 2,058 | | | $ | 1,426 | |
Items not requiring (providing) cash | | | | | | | | | | | | |
Equity in undistributed income of subsidiaries and affiliates | | | 1,709 | | | | 363 | | | | (160 | ) |
Tax benefit related to nonqualified stock options | | | 43 | | | | | | | | | |
Other adjustments | | | (891 | ) | | | (338 | ) | | | (240 | ) |
| | | | | | | | | | | | |
Net cash provided by operating activities | | | (109 | ) | | | 2,083 | | | | 1,026 | |
| | | | | | | | | | | | |
Investing Activities | | | | | | | — | | | | | |
| | | | | | | | | | | | |
Additional investment in Ameriana Bank | | | (5,000 | ) | | | — | | | | — | |
Investment in Ameriana Capital Trust I | | | (310 | ) | | | — | | | | — | |
Change in advances to subsidiaries | | | — | | | | — | | | | 1,746 | |
| | | | | | | | | | | | |
Net cash provided by (used in) operating activities | | | (5,310 | ) | | | — | | | | 1,746 | |
| | | | | | | | | | | | |
Financing Activities | | | | | | | | | | | | |
Proceeds from subordinated debt | | | 10,310 | | | | — | | | | — | |
Repayment of other borrowings | | | (300 | ) | | | (50 | ) | | | (250 | ) |
Purchase of common stock | | | (2,191 | ) | | | — | | | | — | |
Tax benefit on nonqualified stock options | | | 43 | | | | — | | | | — | |
Cash dividends paid | | | (1,652 | ) | | | (2,024 | ) | | | (2,016 | ) |
Proceeds from exercise of stock options | | | 371 | | | | 194 | | | | 34 | |
| | | | | | | | | | | | |
Net cash used in financing activities | | | 6,581 | | | | (1,880 | ) | | | (2,232 | ) |
| | | | | | | | | | | | |
Change in cash | | | 1,162 | | | | 203 | | | | 540 | |
Cash at beginning of year | | | 765 | | | | 562 | | | | 22 | |
| | | | | | | | | | | | |
Cash at end of year | | $ | 1,927 | | | $ | 765 | | | $ | 562 | |
| | | | | | | | | | | | |
82
Ameriana Bancorp
Notes to Consolidated Financial Statements
(table dollar amounts in thousands, except share data)
18. Quarterly Data (unaudited)
| | | | | | | | | | | | | | | | |
| | | First
Quarter | | | Second
Quarter | | | Third
Quarter | | | Fourth
Quarter | |
2006 | | | | | | | | | | | | | | | | |
Total interest income | | $ | 5,333 | | | $ | 5,474 | | | $ | 5,718 | | | $ | 6,079 | |
Total interest expense | | | 3,089 | | | | 3,270 | | | | 3,561 | | | | 3,883 | |
Net interest income | | | 2,244 | | | | 2,204 | | | | 2,157 | | | | 2,196 | |
Provision for loan losses | | | 75 | | | | 75 | | | | 75 | | | | 75 | |
Net income | | | 218 | | | | 5 | | | | (92 | ) | | | (1,101 | ) |
| | | | | | | | | | | | | | | | |
Basic earnings (loss) per share | | | 0.07 | | | | 0.00 | | | | (0.03 | ) | | | (0.35 | ) |
| | | | | | | | | | | | | | | | |
Diluted earnings (loss) per share | | | 0.07 | | | | 0.00 | | | | (0.03 | ) | | | (0.35 | ) |
| | | | | | | | | | | | | | | | |
Dividends declared per share | | | 0.16 | | | | 0.16 | | | | 0.16 | | | | 0.04 | |
| | | | | | | | | | | | | | | | |
Stock price range | | | | | | | | | | | | | | | | |
High | | | 13.28 | | | | 14.50 | | | | 14.25 | | | | 14.24 | |
Low | | | 12.02 | | | | 12.84 | | | | 12.51 | | | | 12.00 | |
| | | | | | | | | | | | | | | | |
2005 | | | | | | | | | | | | | | | | |
Total interest income | | $ | 4,657 | | | $ | 4,837 | | | $ | 5,056 | | | $ | 5,232 | |
Total interest expense | | | 2,231 | | | | 2,360 | | | | 2,530 | | | | 2,874 | |
Net interest income | | | 2,426 | | | | 2,477 | | | | 2,526 | | | | 2,358 | |
Provision (adjustment) for loan losses | | | (2,050 | ) | | | (982 | ) | | | 35 | | | | 145 | |
Net income | | | 760 | | | | 730 | | | | 396 | | | | 172 | |
| | | | | | | | | | | | | | | | |
Basic earnings per share | | | 0.24 | | | | 0.23 | | | | 0.13 | | | | 0.05 | |
| | | | | | | | | | | | | | | | |
Diluted earnings per share | | | 0.24 | | | | 0.23 | | | | 0.12 | | | | 0.05 | |
| | | | | | | | | | | | | | | | |
Dividends declared per share | | | 0.16 | | | | 0.16 | | | | 0.16 | | | | 0.16 | |
| | | | | | | | | | | | | | | | |
Stock price range | | | | | | | | | | | | | | | | |
High | | | 16.04 | | | | 15.35 | | | | 14.64 | | | | 14.00 | |
Low | | | 13.30 | | | | 12.90 | | | | 12.75 | | | | 11.93 | |
| | | | | | | | | | | | | | | | |
19. Future Accounting Matters
Servicing of Financial Assets
In March 2006, the FASB issued Statement of Financial Accounting Standards No. 156 (SFAS No. 156), Accounting for Servicing of Financial Assets, an amendment of FASB Statement No. 140, Accounting for Transfers and Servicing of Financial Assets and Extinguishments of Liabilities, which requires that all separately recognized servicing assets and servicing liabilities be initially measured at fair value, if practicable and permits the entities to elect either fair value measurement with changes in fair value reflected in earnings or the amortization and impairment requirements of SFAS No. 140 for subsequent measurement. The subsequent measurement of separately recognized servicing assets and servicing liabilities at fair value eliminates the necessity for entities that manage the risks inherent in servicing assets and servicing liabilities with derivatives to qualify for hedge accounting treatment and eliminates the characterization of declines in fair value as impairments or direct write-downs. SFAS No. 156 is effective for the Company beginning January 1, 2007. We
83
Ameriana Bancorp
Notes to Consolidated Financial Statements
(table dollar amounts in thousands, except share data)
have evaluated the requirements of SFAS No. 156 and determined that it will not have a material effect on our financial condition or results of operations.
Fair Value Measurements
In September 2006, the FASB issued SFAS No. 157, Fair Value Measurements. SFAS No. 157 defines fair value, establishes a framework for measuring fair value in generally accepted accounting standards, and expands disclosures about fair value measurements. SFAS No. 157 is effective for financial statements issued for fiscal years beginning after November 15, 2007, and interim periods within those fiscal years. We do not expect that the adoption of SFAS No. 157 will have a material impact on our financial condition or results of operations.
Accounting for Uncertainty in Income taxes
In June 2006, the FASB issued Interpretation No. 48, Accounting for Uncertainty in Income Taxes, an interpretation of SFAS No. 109, Accounting for Income Taxes (Interpretation No. 48). Interpretation No. 48 clarifies the accounting for uncertainty in income taxes in financial statements and prescribes a recognition threshold and measurement attribute for financial statement recognition and measurement of a tax position taken or expected to be taken. It also provides guidance on de-recognition, classification, interest and penalties, accounting in interim periods, disclosure and transition. Interpretation No. 48 is effective for the Company beginning January 1, 2007. We have evaluated the requirements of Interpretation No. 48 and determined that it will not have a material effect on our financial condition or results of operations.
Prior Year Misstatements
In September 2006, the SEC Staff issued Staff Accounting Bulletin (“SAB”) No. 108, Considering the Effects of Prior Year Misstatements when Quantifying Misstatements in Current Year Financial Statements, which addresses how the effects of prior year uncorrected misstatements should be considered when quantifying misstatements in current year financial statements. SAB No. 108 will require registrants to quantify misstatements using both the balance sheet and income-statement approaches and to evaluate whether either approach results in quantifying an error that is material in light of relevant quantitative and qualitative factors. When the effect of initial adoption is determined to be material, SAB No. 108 allows registrants to record that effect as a cumulative effect adjustment to beginning retained earnings. The requirements are effective for the Company beginning January 1, 2007. We have evaluated the requirements of SAB No. 108 and determined that it will not have a material effect on our financial condition or results of operations.
Split-dollar life insurance agreements
In September 2006, the Emerging Issues Task Force Issue 06-4 (EITF 06-4), Accounting for Deferred Compensation and Postretirement Benefit Aspects of Endorsement Split-Dollar Life Insurance Arrangements, was ratified. EITF 06-4 addresses accounting for separate agreements which split life insurance policy benefits between an employer and employee. The Issue requires the employer to recognize a liability for future benefits payable to the employee under these agreements. The effects of applying EITF 06-4 must be recognized through either a change in accounting principle through an adjustment to equity or through the retrospective application to all prior periods. For calendar year companies, EITF 06-4 is effective beginning January 1, 2008. Early adoption is permitted as of January 1, 2007. We do not expect the adoption of EITF 06-4 to have a material effect on our consolidated financial statements.
84
Ameriana Bancorp
Notes to Consolidated Financial Statements
(table dollar amounts in thousands, except share data)
Fair Value Option for Financial Assets and Financial Liabilities
On February 15, 2007, the FASB issued its Statement No. 159,The Fair Value Option for Financial Assets and Financial Liabilities—Including an Amendment of FASB Statement No. 115. FAS 159 permits entities to elect to report most financial assets and liabilities at their fair value with changes in fair value included in net income. The fair value option may be applied on an instrument-by-instrument or instrument class-by-class basis. The option is not available for deposits withdrawable on demand, pension plan assets and obligations, leases, instruments classified as stockholders’ equity, investments in consolidated subsidiaries and variable interest entities and certain insurance policies. The new standard is effective at the beginning of the Company’s fiscal year beginning January 1, 2008, and early application may be elected in certain circumstances. The Company expects to first apply the new standard at the beginning of its 2008 fiscal year. The Company is currently evaluating and has not yet determined the impact the new standard is expected to have on its financial position, results of operations or cash flows.
20. Significant Estimates and Concentrations
The Company is subject to claims and lawsuits that arise primarily in the ordinary course of business. It is the opinion of management that the disposition or ultimate resolution of such claims and lawsuits will not have a material adverse effect on the consolidated financial position, results of operations and cash flows of the Company.
85
Item 9. Changes in and Disagreements with Accountants on Accounting and Financial Disclosure
Not applicable.
Item 9A. Controls and Procedures
As of the end of the period covered by this report, management of the Company carried out an evaluation, under the supervision and with the participation of the Company’s principal executive officer and principal financial officer, of the effectiveness of the Company’s disclosure controls and procedures. Based on this evaluation, the Company’s principal executive officer and principal financial officer concluded that the Company’s disclosure controls and procedures are effective in ensuring that information required to be disclosed by the Company in reports that it files or submits under the Securities Exchange Act of 1934, as amended, (1) is recorded, processed, summarized and reported, within the time periods specified in the Securities and Exchange Commission’s rules and forms, and (2) is accumulated and communicated to the Company’s management, including its principal executive and principal financial officers, as appropriate, to allow timely decisions regarding required disclosure. It should be noted that the design of the Company’s disclosure controls and procedures is based in part upon certain reasonable assumptions about the likelihood of future events, and there can be no reasonable assurance that any design of disclosure controls and procedures will succeed in achieving its stated goals under all potential future conditions, regardless of how remote, but the Company’s principal executive and financial officers have concluded that the Company’s disclosure controls and procedures are, in fact, effective at a reasonable assurance level.
Item 9B. Other Information
Not applicable.
PART III
Item 10. Directors, Executive Officers and Corporate Governance
Information concerning the directors of the Company is incorporated herein by reference to the section captioned “Proposal 1 — Election of Directors” in the Proxy Statement for the 2006 Annual Meeting of Shareholders (the “Proxy Statement”).
Information concerning the executive officers of the Company is incorporated herein by reference to “Item 1. Business — Executive Officers” in Part I of this Annual Report on Form 10-K.
Information concerning compliance with Section 16(a) of the Exchange Act required by this item is incorporated herein by reference to the cover page of this Form 10-K and the section titled “Section 16(a) Beneficial Ownership Reporting Compliance” in the Proxy Statement.
The Company has adopted a Code of Ethics that applies to the Company’s principal executive officer, principal accounting and financial officer and senior executive officers. For information concerning the Code of Ethics, see the section titled “Corporate Governance – Code of Ethics” in the Proxy Statement. The Code of Ethics is posted on the Company’s Internet Web site atwww.ameriana.com. The Company intends to satisfy the disclosure requirement under Item 5.5 of Form 8-K regarding an amendment to or waiver from a provision of the Company’s Code of Ethics by posting such information on its Internet Web site atwww.ameriana.com.
Information concerning the audit committee and its composition and the audit committee financial expert and other corporate governance matters is incorporated by reference to the section titled “Corporate Governance” in the Proxy Statement.
Item 11. Executive Compensation
The information required by this item is incorporated herein by reference to the sections captioned “Director Compensation” and “Executive Compensation” in the Proxy Statement.
86
Information concerning the compensation committee report is incorporated by reference to the section titled “Compensation Committee Report” in the Proxy Statement.
Item 12. Security Ownership of Certain Beneficial Owners and Management and Related Stockholder Matters
Information required by this item is incorporated herein by reference to the sections captioned “Security Ownership” in the Proxy Statement.
| | (a) | Security Ownership of Certain Beneficial Owners |
Information required by this item is incorporated herein by reference to the section captioned “Stock Ownership” in the Proxy Statement.
| | (b) | Security Ownership of Management |
Information required by this item is incorporated herein by reference to the section captioned “Stock Ownership” in the Proxy Statement.
Management of Ameriana Bancorp knows of no arrangements, including any pledge by any person or securities of Ameriana Bancorp, the operation of which may at a subsequent date result in a change in control of the registrant.
| | (d) | Equity Compensation Plan Information |
The following table sets forth information about Company common stock that may be issued under the Company’s equity compensation plans as of December 31, 2006. The Company does not maintain any equity compensation plans that have not been approved by shareholders.
| | | | | | |
Plan Category | | Number of securities to be issued upon the exercise of outstanding options, warrants and rights | | Weighted-average exercise price of outstanding options, warrants and rights | | Number of securities remaining available for future issuance
under equity
compensation plans
(excluding securities
reflected in the first
column) |
Equity compensation plans approved by security holders | | 320,547 | | 14.5504 | | 224,000 |
Equity compensation plans not approved by security holders | | n/a | | n/a | | n/a |
Total | | 320,547 | | 14.5504 | | 224,000 |
Item 13. Certain Relationships and Related Transactions, and Director Independence
The information concerning certain relationships and related transactions is incorporated herein by reference to the section captioned “Transactions with Management” in the Proxy Statement.
Information concerning director independence is incorporated by reference to the section titled “Proposal 1 – Election of Directors” in the Proxy Statement.
87
Item 14. Principal Accountant Fees and Services
The information required by this item is incorporated herein by reference to the section captioned “Proposal 2 – Ratification of Appointment of Auditors” in the Proxy Statement.
PART IV
Item 15. Exhibits and Financial Statement Schedules
List of Documents Filed as Part of This Report
(1)Financial Statements. The following consolidated financial statements are filed under Item 8 hereof:
Report of Independent Registered Public Accounting Firm
Consolidated Balance Sheets at December 31, 2006 and 2005
Consolidated Statements of Income for Each of the Three Years in the Period Ended December 31, 2006
Consolidated Statements of Shareholders’ Equity for Each of the Three Years in the Period Ended December 31, 2006
Consolidated Statements of Cash Flows for Each of the Three Years in the Period Ended December 31, 2006
Notes to Consolidated Financial Statements
(2)Financial Statement Schedules.All schedules for which provision is made in the applicable accounting regulations are either not required under the related instructions or are inapplicable, and therefore have been omitted.
(3)Exhibits. The following is a list of exhibits as part of this Annual Report on Form 10-K and is also the Exhibit Index.
| | |
| No. | | Description |
| 3.1 | | Ameriana Bancorp Amended and Restated Articles of Incorporation (incorporated herein by reference to the Company’s Registration Statement on Form S-4 filed with the SEC on September 18, 1989) |
| |
| 3.2 | | Amended and Restated Bylaws (incorporated herein by reference to the Company’s Annual Report on Form 10-K filed with the SEC on March 29, 2004) |
| |
| 4.1 | | No long-term debt instrument issued by the Registrant exceeds 10% of consolidated assets or is registered. In accordance with paragraph 4 (iii) of Item 601 (b) of Regulation S-K, the Registrant will furnish the SEC copies of long-term debt instruments and related agreements upon request. |
| |
| 10.1* | | Ameriana Bancorp 1987 Stock Option Plan (incorporated herein by reference to the Company’s Registration Statement on Form S-8 filed with the SEC on March 30, 1990 and May 17, 1996) |
| |
| 10.2* | | Employment Agreement, dated June 1, 2005, between Ameriana Bank and Trust and Jerome J. Gassen (incorporated herein by reference to the Company’s Quarterly Report on Form 10-Q for the quarter ended June 30, 2005 filed with the SEC on August 11, 2005) |
| |
| 10.3* | | Employment Agreement, dated February 26, 2001, between Ameriana Bank and Trust and Timothy G. Clark (incorporated herein by reference to the Company’s Annual Report on Form 10-K filed with the SEC on March 29, 2001) |
| |
| 10.4* | | Ameriana Bank of Indiana, F.S.B. Director Supplemental Retirement Program Director Agreement (incorporated herein by reference to the Company’s Annual Report on Form 10-K filed with the SEC on March 30, 2000) |
| |
| 10.5* | | Ameriana Bank of Indiana, F.S.B. Director Supplemental Retirement Program Director Agreement, dated June 4, 1999, between Ameriana Bank of Indiana, F.S.B. and Paul W. Prior (incorporated herein by reference to the Company’s Annual Report on Form 10-K filed with the SEC on March 30, 2000) |
88
| | |
| 10.6* | | Executive Supplemental Retirement Plan Agreement, dated May 6, 1999, between Ameriana Bank of Indiana, F.S.B. and Timothy G. Clark (incorporated herein by reference to the Company’s Annual Report on Form 10-K filed with the SEC on March 29, 2001) |
| |
| 10.7* | | Executive Supplemental Retirement Plan Agreement Amendment, dated December 5, 2003, between Ameriana Bank of Indiana, F.S.B. and Timothy G. Clark (incorporated herein by reference to the Company’s Annual Report on Form 10-K filed with the SEC on March 29, 2004) |
| |
| 10.8* | | Ameriana Bancorp Amended and Restated 1996 Stock Option and Incentive Plan (incorporated herein by reference to the Company’s Registration Statement on Form S-8 filed with the SEC on May 9, 2003) |
| |
| 10.9* | | Change in Control Severance Agreement, dated September 20, 2005, by and between Ameriana Bank and Trust, SB and James A. Freeman (incorporated herein by reference to the Company’s Quarterly Report on Form 10-Q for the quarter ended September 30, 2005 filed with the SEC on November 14, 2005) |
| |
| 10.10* | | Change in Control Severance Agreement dated March 6, 2006, by and between Ameriana Bank and Trust and Matthew Branstetter (incorporated herein by reference to the Company’s Quarterly Report on Form 10-Q for the quarter ended March 31, 2006 filed with the SEC on May 12, 2006) |
| |
| 10.11 | | Employment Agreement, effective January 22, 2007, between Ameriana Bank, SB and John J. Letter |
| |
| 21 | | Subsidiaries |
| |
| 23 | | Consent of BKD, LLP |
| |
| 31.1 | | Rule 13(a)-14(a) Certification of Chief Executive Officer |
| |
| 31.2 | | Rule 13(a)-14(a) Certification of Chief Financial Officer |
| |
| 32 | | Certification Pursuant to 18 U.S.C. Section 1350 |
| * | Management contract or compensation plan or arrangement. |
89
SIGNATURES
Pursuant to the requirements of Section 13 or 15(d) of the Securities Exchange Act of 1934, the registrant has duly caused this report to be signed on its behalf by the undersigned, thereunto duly authorized.
| | | | |
| | AMERIANA BANCORP |
| | |
Date: March 28, 2007 | | By: | | /s/ Jerome J. Gassen |
| | | | Jerome J. Gassen |
| | | | President and Chief Executive Officer |
| | | | (Duly Authorized Representative) |
Pursuant to the requirements of the Securities Exchange Act of 1934, this report has been signed by the following persons on behalf of the registrant in the capacities and on the dates indicated.
| | | | | | |
By: | | /s/ Jerome J. Gassen | | | | March 28, 2007 |
| | Jerome J. Gassen | | | | |
| | President, Chief Executive Officer and Director | | | | |
| | (Principal Executive Officer) | | | | |
| | | |
By: | | /s/ John J. Letter | | | | March 28, 2007 |
| | John J. Letter | | | | |
| | Senior Vice President, Treasurer and Chief Financial Officer | | | | |
| | (Principal Financial and Accounting Officer) | | | | |
| | | |
By: | | /s/ Donald C. Danielson | | | | March 28, 2007 |
| | Donald C. Danielson | | | | |
| | Director | | | | |
| | | |
By: | | /s/ Charles M. Drackett, Jr. | | | | March 28, 2007 |
| | Charles M. Drackett, Jr. | | | | |
| | Director | | | | |
| | | |
By: | | /s/ R. Scott Hayes | | | | March 28, 2007 |
| | R. Scott Hayes | | | | |
| | Director | | | | |
| | | |
By: | | /s/ Richard E. Hennessey | | | | March 28, 2007 |
| | Richard E. Hennessey | | | | |
| | Director | | | | |
| | | |
By: | | /s/ Michael E. Kent | | | | March 28, 2007 |
| | Michael E. Kent | | | | |
| | Director | | | | |
| | | |
By: | | /s/ Ronald R. Pritzke | | | | March 28, 2007 |
| | Ronald R. Pritzke | | | | |
| | Director | | | | |