Exhibit 99.1
Ameriana Bancorp Annual Meeting May 16, 2013
CEO Presentation
1

Forward-Looking Statement
This presentation contains forward-looking statements, which include statements about Ameriana’s future financial performance, business plans and strategies. Forward-looking statements involve future risks and uncertainties, because of factors that could cause actual results to differ materially from those expressed or implied. Specific risk factors and other uncertainties that could affect the accuracy of forward-looking statements are included in Ameriana’s Form 10-K for the year ended December 31, 2012.
2
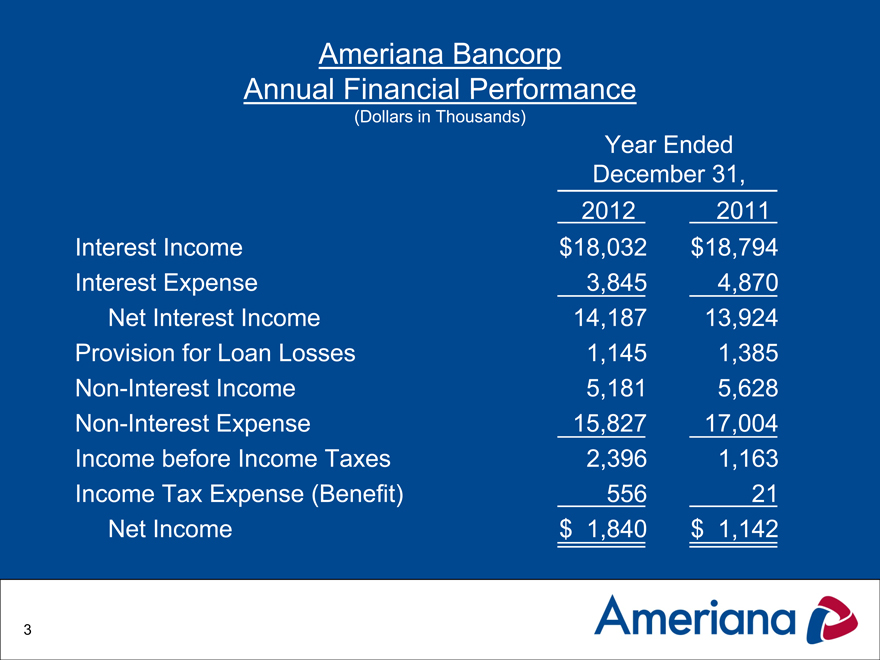
Ameriana Bancorp Annual Financial Performance
(Dollars in Thousands)
Year Ended
December 31,
2012 2011
Interest Income $ 18,032 $ 18,794
Interest Expense 3,845 4,870
Net Interest Income 14,187 13,924
Provision for Loan Losses 1,145 1,385
Non-Interest Income 5,181 5,628
Non-Interest Expense 15,827 17,004
Income before Income Taxes 2,396 1,163
Income Tax Expense (Benefit) 556 21
Net Income $ 1,840 $ 1,142
3

Ameriana Bancorp Quarterly Financial Performance
(Dollars in Thousands)
Three Months
Ended March 31,
2013 2012
Interest Income $ 4,291 $ 4,559
Interest Expense 762 1,042
Net Interest Income 3,529 3,517
Provision for Loan Losses 255 255
Non-Interest Income 1,512 1,280
Non-Interest Expense 3,960 4,119
Income before Income Taxes 826 423
Income Tax Expense 212 78
Net Income $ 614 $ 345
4
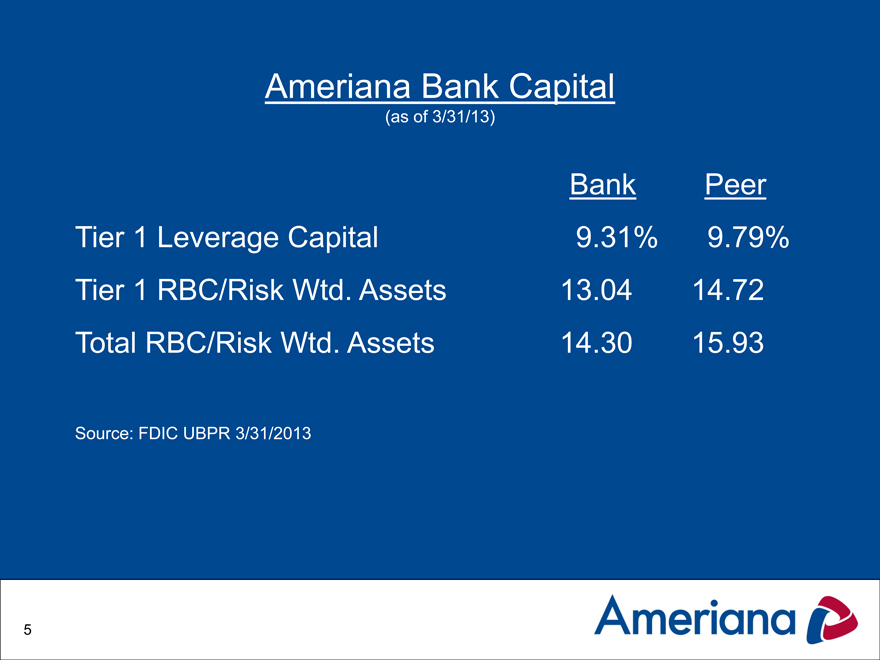
Ameriana Bank Capital
(as of 3/31/13)
Bank Peer
Tier 1 Leverage Capital 9.31% 9.79%
Tier 1 RBC/Risk Wtd. Assets 13.04 14.72
Total RBC/Risk Wtd. Assets 14.30 15.93
Source: FDIC UBPR 3/31/2013
5
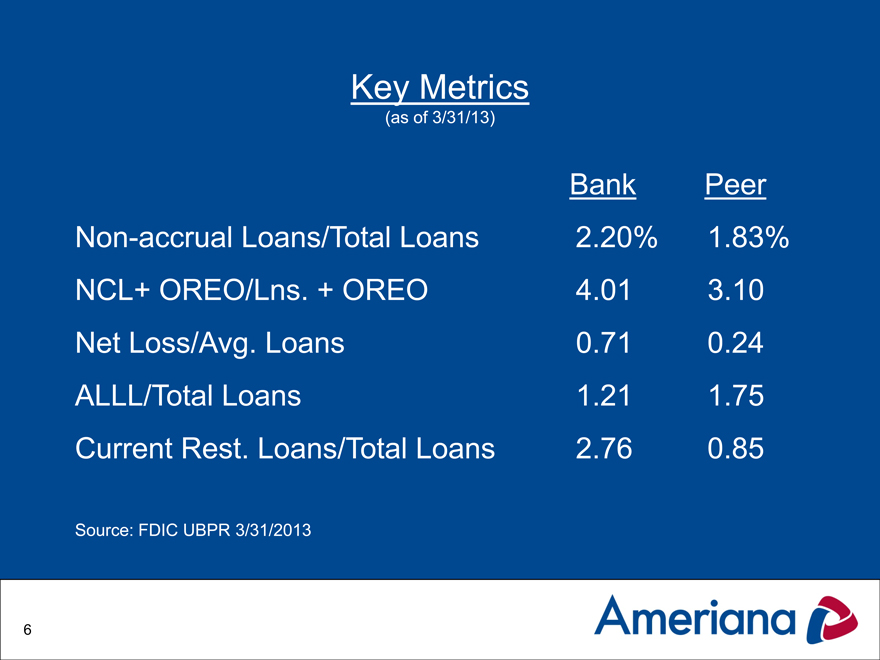
Key Metrics
(as of 3/31/13)
Bank Peer
Non-accrual Loans/Total Loans 2.20% 1.83%
NCL+ OREO/Lns. + OREO 4.01 3.10
Net Loss/Avg. Loans 0.71 0.24
ALLL/Total Loans 1.21 1.75
Current Rest. Loans/Total Loans 2.76 0.85
Source: FDIC UBPR 3/31/2013
6
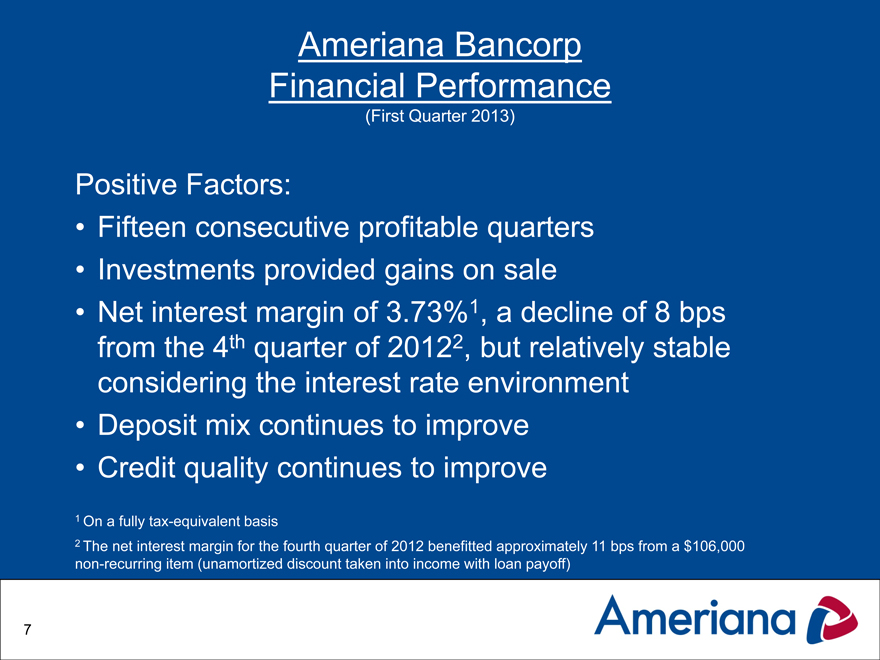
Ameriana Bancorp Financial Performance
(First Quarter 2013)
Positive Factors:
• Fifteen consecutive profitable quarters
• Investments provided gains on sale
• Net interest margin of 3.73%1, a decline of 8 bps
from the 4th quarter of 20122, but relatively stable
considering the interest rate environment
• Deposit mix continues to improve
• Credit quality continues to improve
1 On a fully tax-equivalent basis
2 The net interest margin for the fourth quarter of 2012 benefitted approximately 11 bps from a $106,000
non-recurring item (unamortized discount taken into income with loan payoff)
7
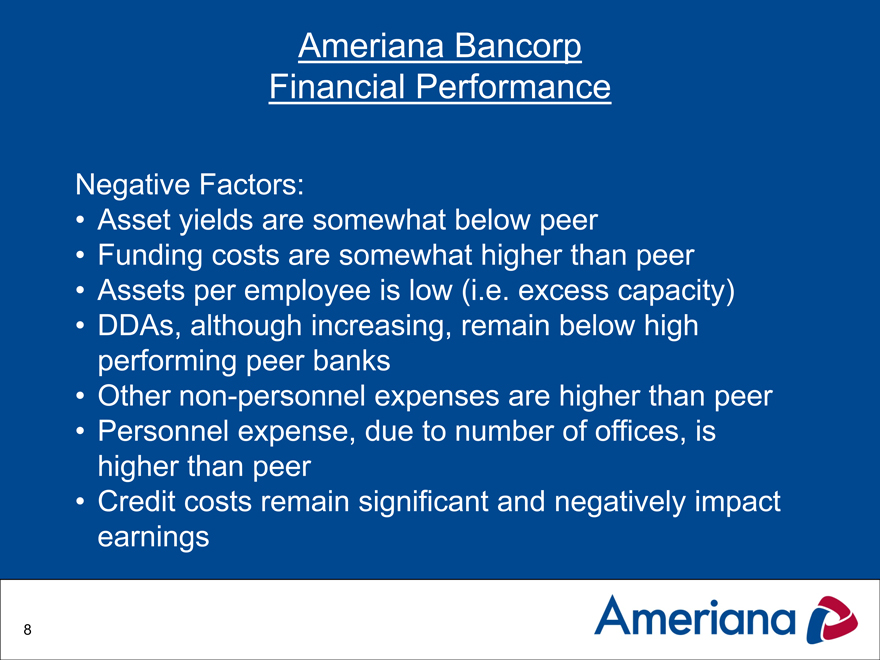
Ameriana Bancorp Financial Performance
Negative Factors:
• Asset yields are somewhat below peer
• Funding costs are somewhat higher than peer
• Assets per employee is low (i.e. excess capacity)
• DDAs, although increasing, remain below high performing peer banks
• Other non-personnel expenses are higher than peer
• Personnel expense, due to number of offices, is higher than peer
• Credit costs remain significant and negatively impact earnings
8
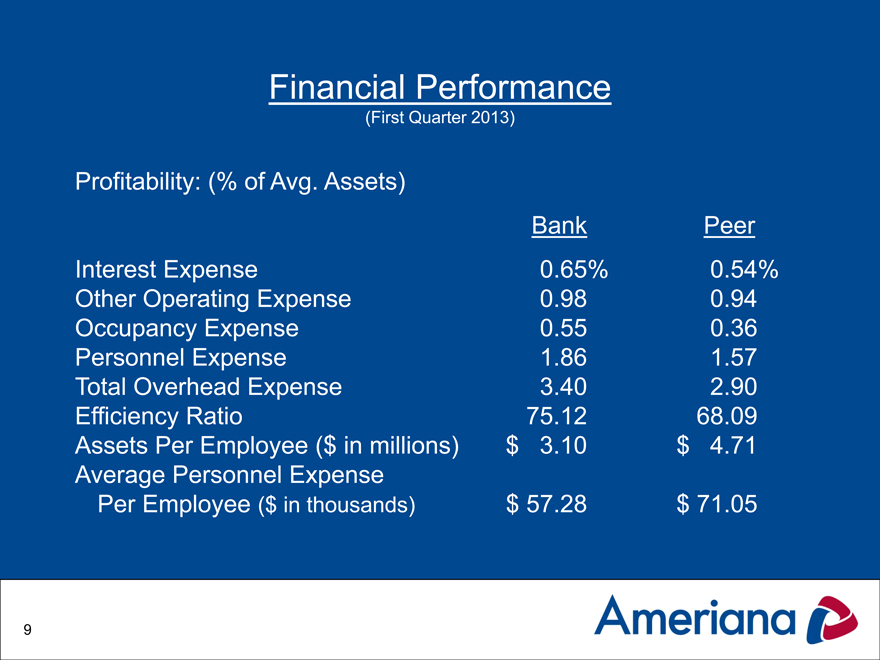
Financial Performance
(First Quarter 2013)
Profitability: (% of Avg. Assets)
Bank Peer
Interest Expense 0.65% 0.54%
Other Operating Expense 0.98 0.94
Occupancy Expense 0.55 0.36
Personnel Expense 1.86 1.57
Total Overhead Expense 3.40 2.90
Efficiency Ratio 75.12 68.09
Assets Per Employee ($ in millions) $ 3.10 $ 4.71
Average Personnel Expense
Per Employee ($ in thousands) $ 57.28 $ 71.05
9
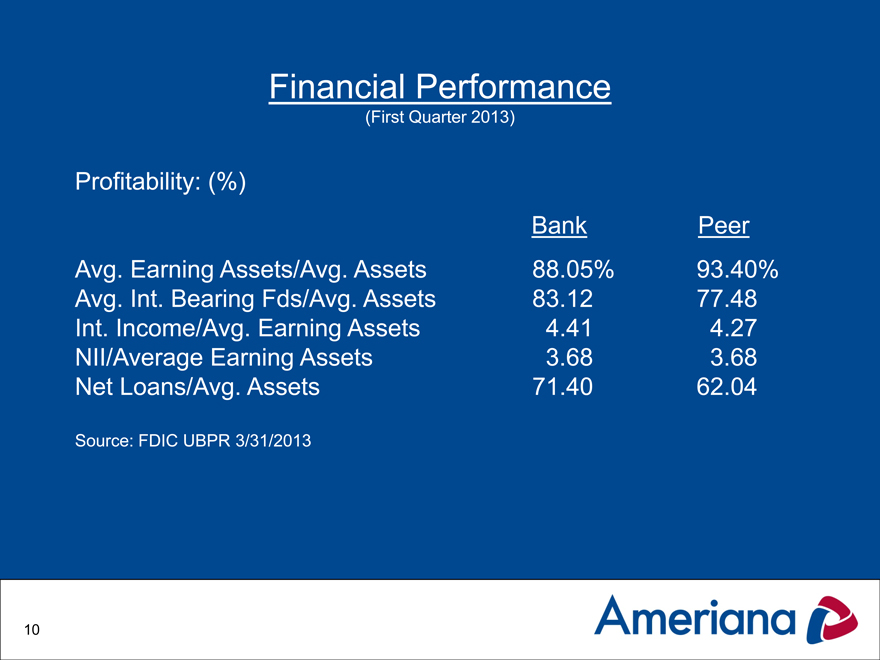
Financial Performance
(First Quarter 2013)
Profitability: (%)
Bank Peer
Avg. Earning Assets/Avg. Assets 88.05% 93.40%
Avg. Int. Bearing Fds/Avg. Assets 83.12 77.48
Int. Income/Avg. Earning Assets 4.41 4.27
NII/Average Earning Assets 3.68 3.68
Net Loans/Avg. Assets 71.40 62.04
Source: FDIC UBPR 3/31/2013
10
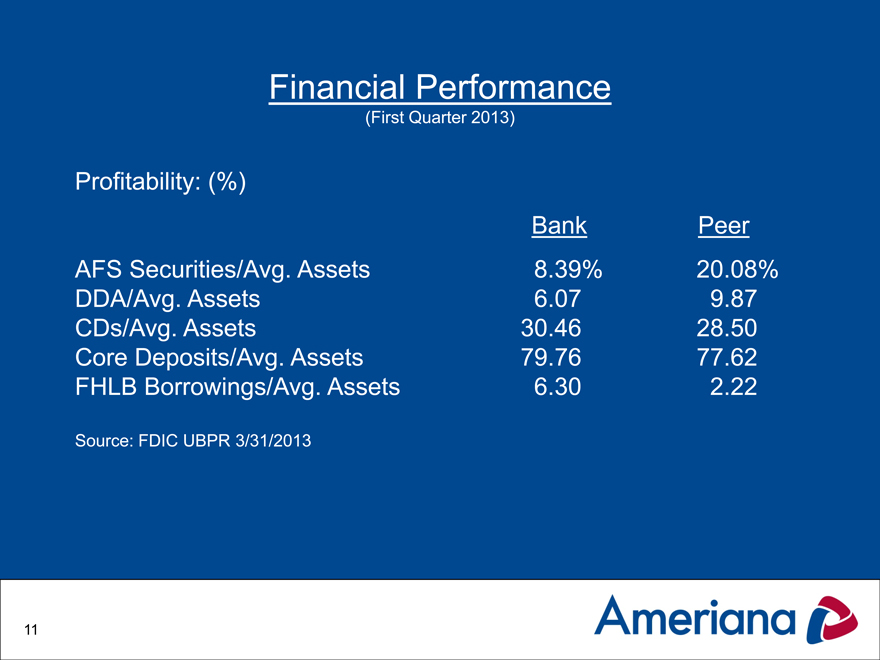
Financial Performance
(First Quarter 2013)
Profitability: (%)
Bank Peer
AFS Securities/Avg. Assets 8.39% 20.08%
DDA/Avg. Assets 6.07 9.87
CDs/Avg. Assets 30.46 28.50
Core Deposits/Avg. Assets 79.76 77.62
FHLB Borrowings/Avg. Assets 6.30 2.22
Source: FDIC UBPR 3/31/2013
11
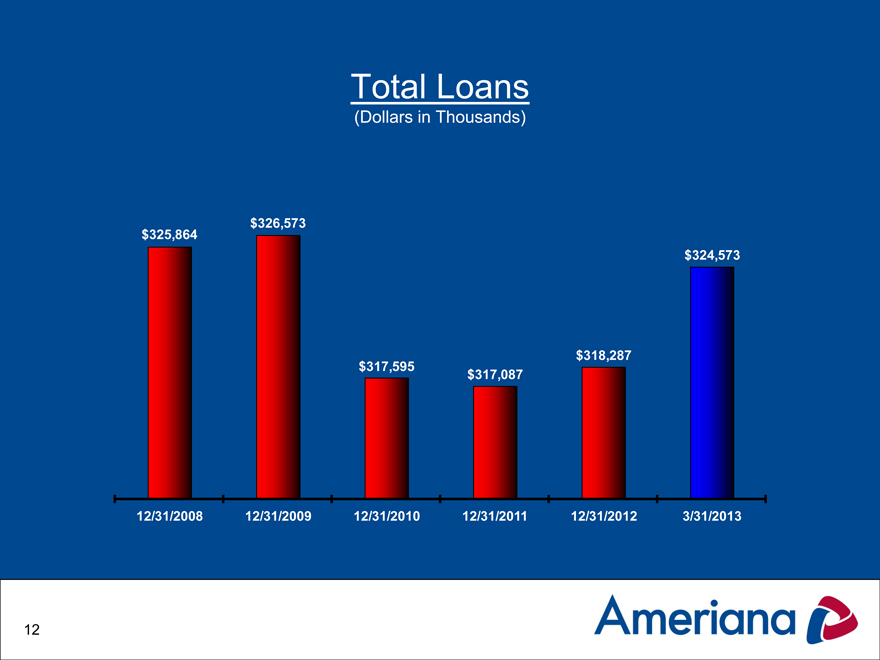
Total Loans
(Dollars in Thousands)
$326,573 $325,864 $324,573
$318,287 $317,595 $317,087
12/31/2008 12/31/2009 12/31/2010 12/31/2011 12/31/2012 3/31/2013
12
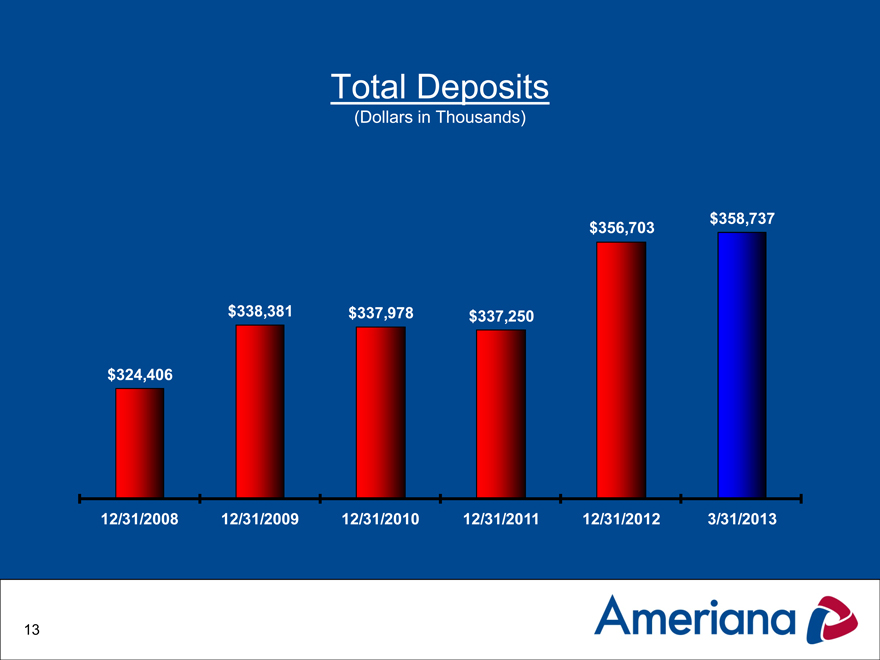
Total Deposits
(Dollars in Thousands)
$358,737 $356,703
$338,381 $337,978 $337,250
$324,406
12/31/2008 12/31/2009 12/31/2010 12/31/2011 12/31/2012 3/31/2013
13
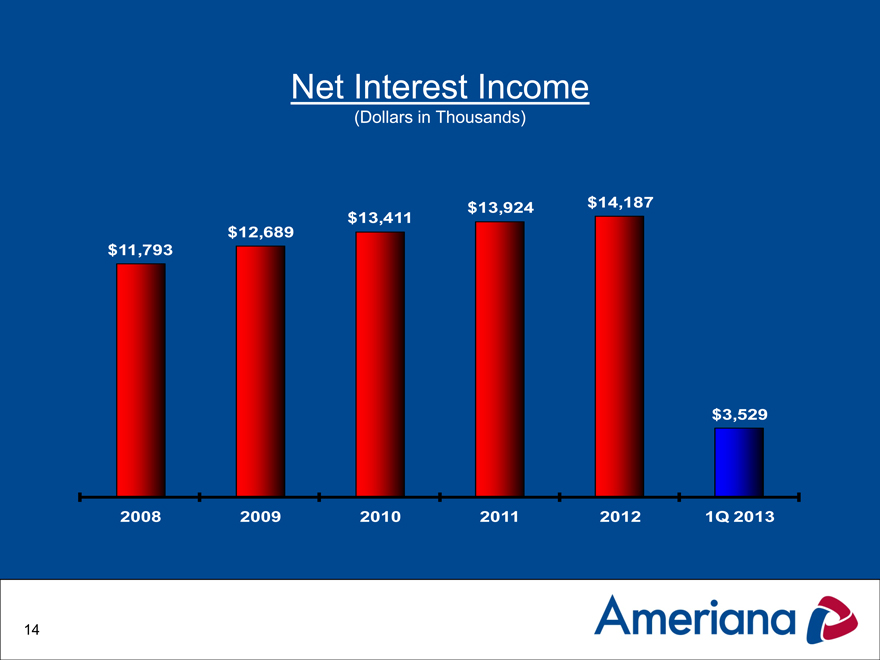
Net Interest Income
(Dollars in Thousands)
$13,924 $14,187 $13,411 $12,689 $11,793
$3,529
2008 2009 2010 2011 2012 1Q 2013
14
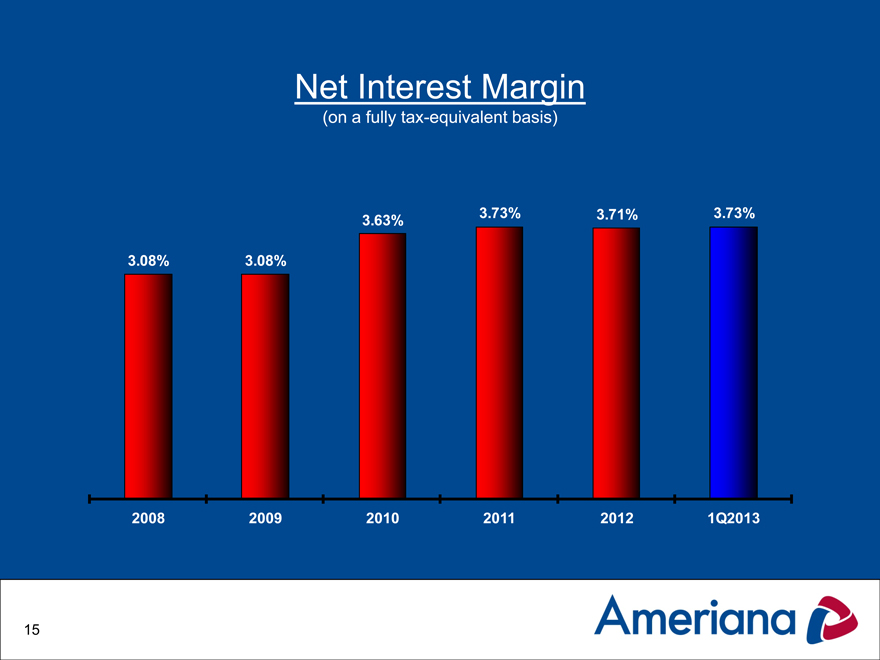
Net Interest Margin
(on a fully tax-equivalent basis)
3.73% 3.71% 3.73%
3.63%
3.08% 3.08%
2008 2009 2010 2011 2012 1Q2013
15
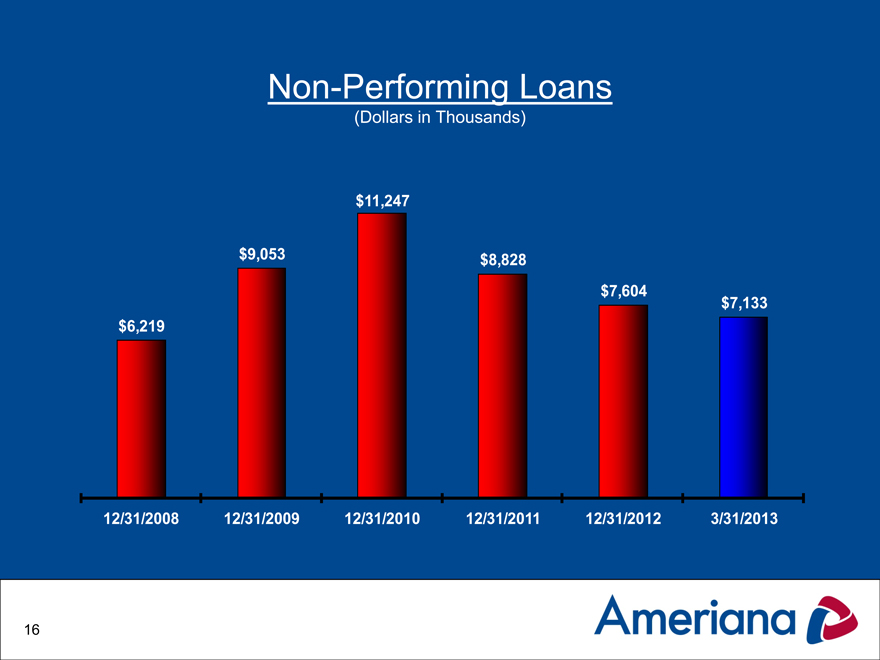
Non-Performing Loans
(Dollars in Thousands)
$11,247
$9,053 $8,828 $7,604 $7,133 $6,219
12/31/2008 12/31/2009 12/31/2010 12/31/2011 12/31/2012 3/31/2013
16
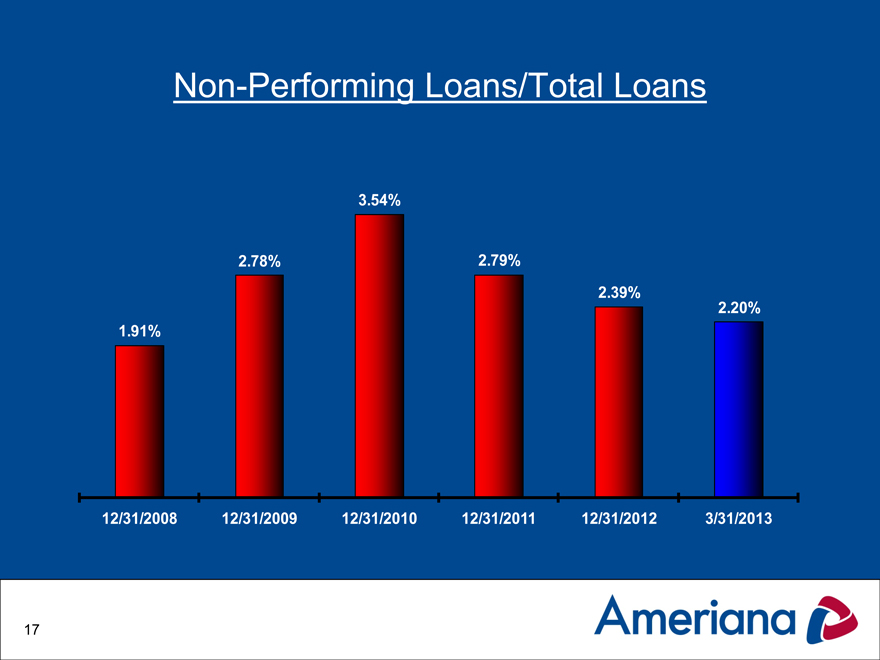
Non-Performing Loans/Total Loans
3.54%
2.78% 2.79%
2.39%
2.20%
1.91%
12/31/2008 12/31/2009 12/31/2010 12/31/2011 12/31/2012 3/31/2013
17
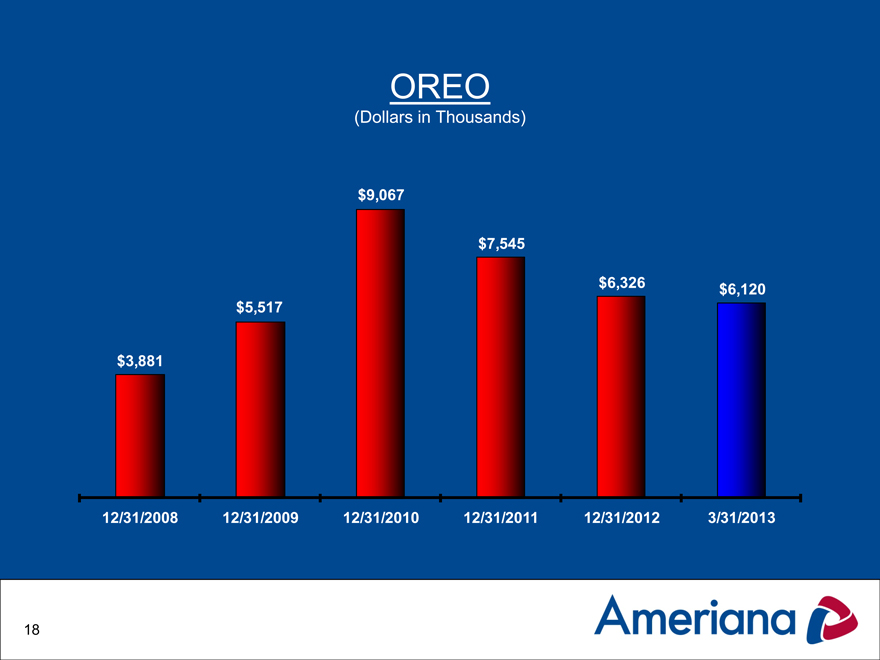
OREO
(Dollars in Thousands)
$9,067
$7,545
$6,326 $6,120 $5,517
$3,881
12/31/2008 12/31/2009 12/31/2010 12/31/2011 12/31/2012 3/31/2013
18
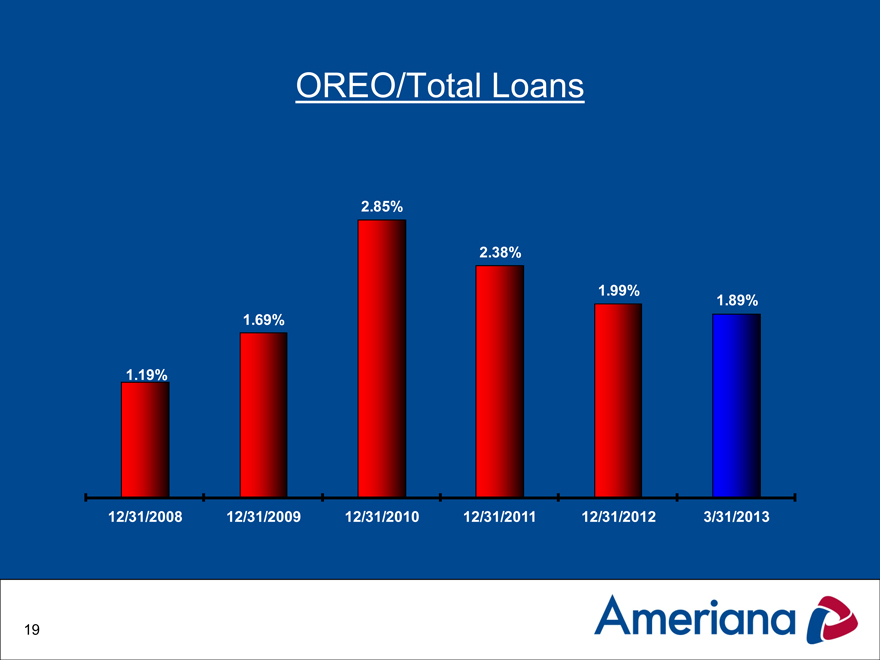
OREO/Total Loans
2.85%
2.38%
1.99%
1.89%
1.69%
1.19%
12/31/2008 12/31/2009 12/31/2010 12/31/2011 12/31/2012 3/31/2013
19
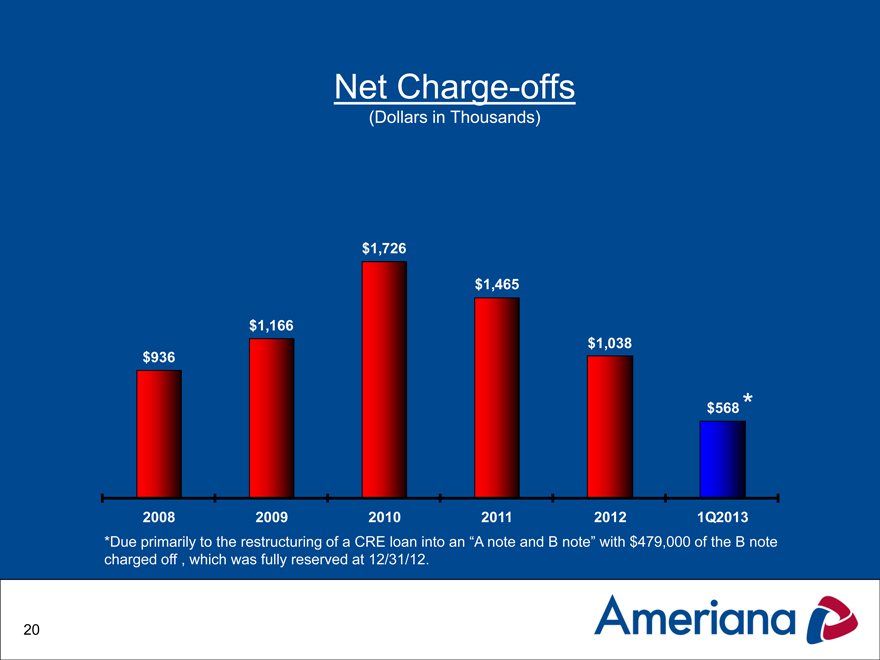
Net Charge-offs
(Dollars in Thousands)
$1,726
$1,465
$1,166 $1,038 $936
$568 *
2008 2009 2010 2011 2012 1Q2013
*Due primarily to the restructuring of a CRE loan into an “A note and B note” with $479,000 of the B note charged off , which was fully reserved at 12/31/12.
20
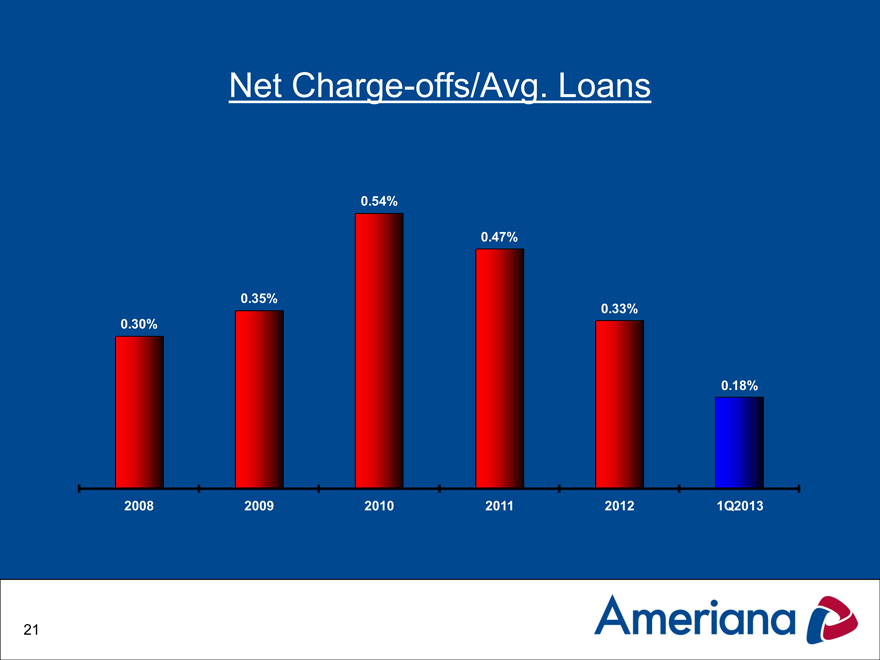
Net Charge-offs/Avg. Loans
0.54%
0.47%
0.35%
0.33%
0.30%
0.18%
2008 2009 2010 2011 2012 1Q2013
21
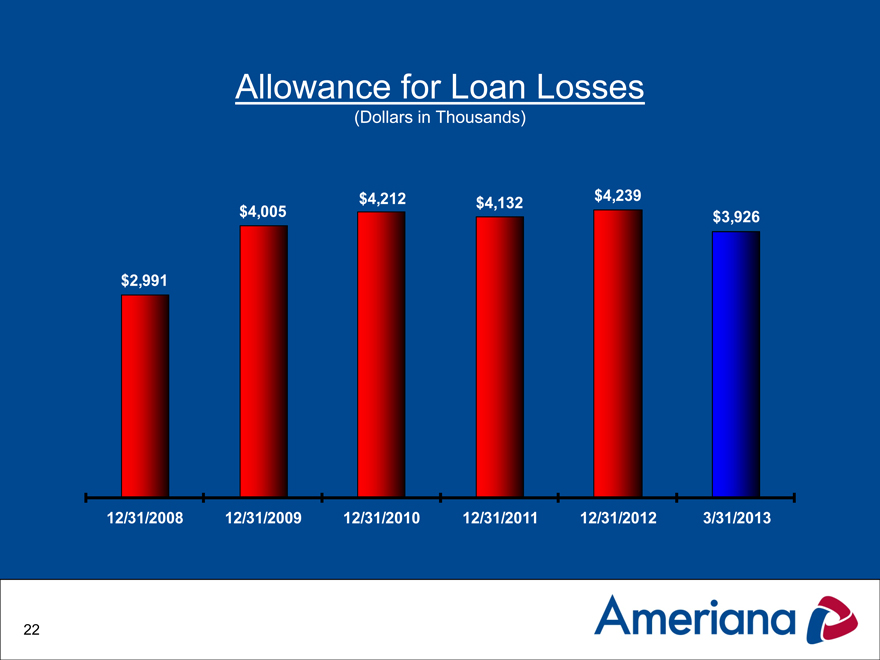
Allowance for Loan Losses
(Dollars in Thousands)
$4,212 $4,239 $4,132 $4,005 $3,926
$2,991
12/31/2008 12/31/2009 12/31/2010 12/31/2011 12/31/2012 3/31/2013
22
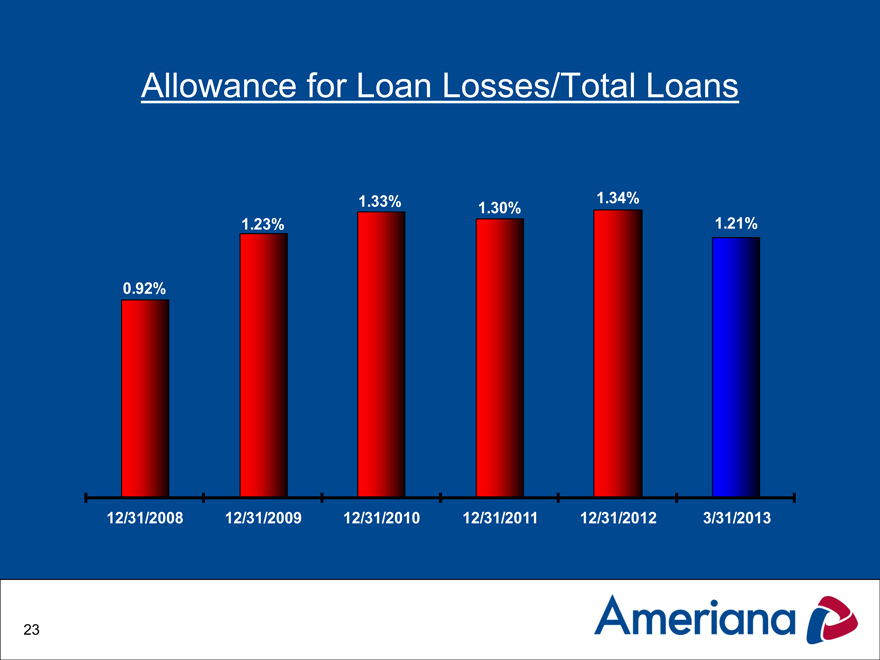
Allowance for Loan Losses/Total Loans
1.33% 1.34%
1.30%
1.23% 1.21%
0.92%
12/31/2008 12/31/2009 12/31/2010 12/31/2011 12/31/2012 3/31/2013
23
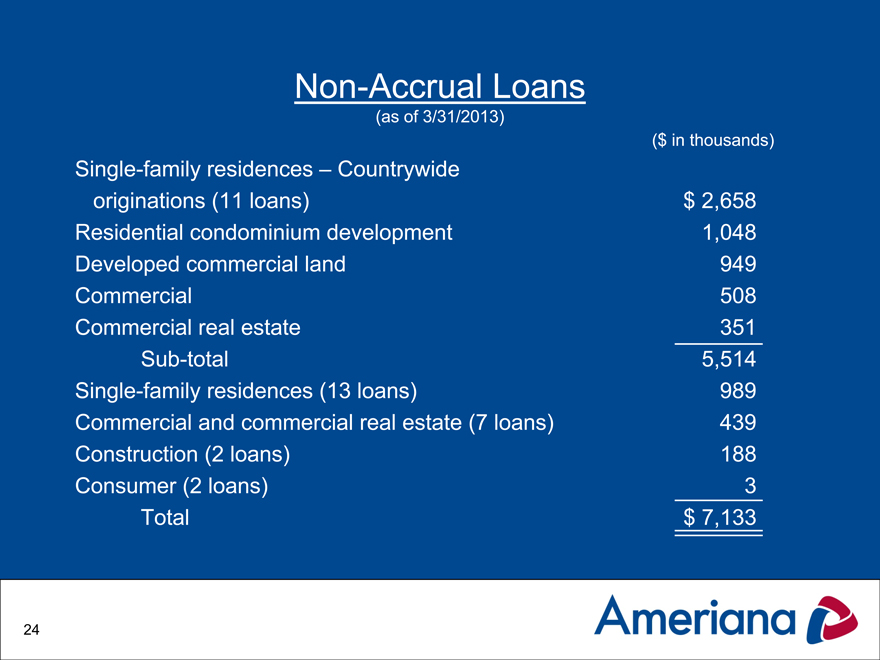
Non-Accrual Loans
(as of 3/31/2013)
($ in thousands)
Single-family residences – Countrywide
originations (11 loans)
$ 2,658
Residential condominium development
1,048
Developed commercial land
949
Commercial
508
Commercial real estate
351
Sub-total
5,514
Single-family residences (13 loans)
989
Commercial and commercial real estate (7 loans)
439
Construction (2 loans)
188
Consumer (2 loans)
Total
$ 7,133
24
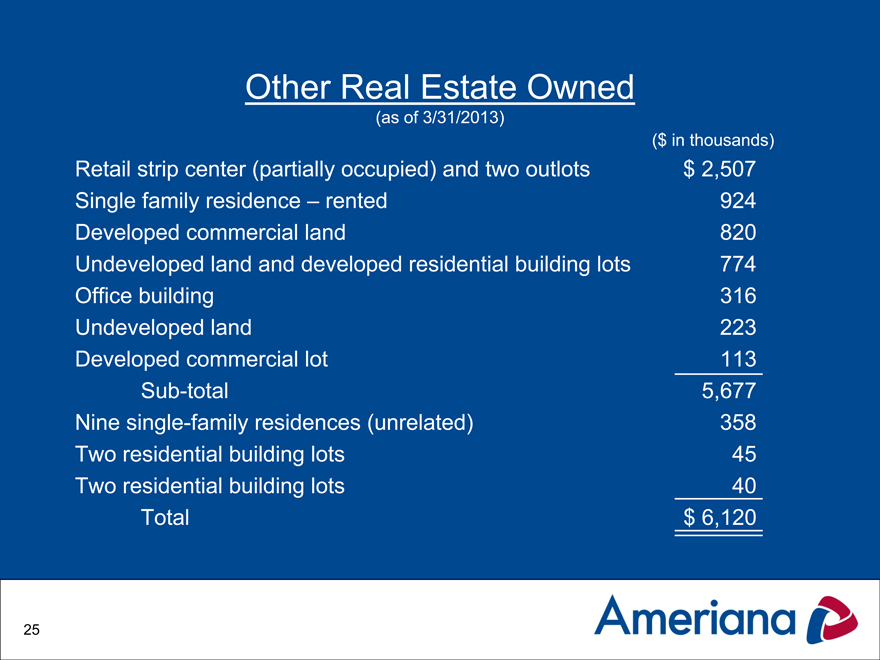
Other Real Estate Owned
(as of 3/31/2013)
($ in thousands)
Retail strip center (partially occupied) and two outlots $ 2,507
Single family residence – rented 924
Developed commercial land 820
Undeveloped land and developed residential building lots 774
Office building 316
Undeveloped land 223
Developed commercial lot 113
Sub-total 5,677
Nine single-family residences (unrelated) 358
Two residential building lots 45
Two residential building lots 40
Total $ 6,120
25
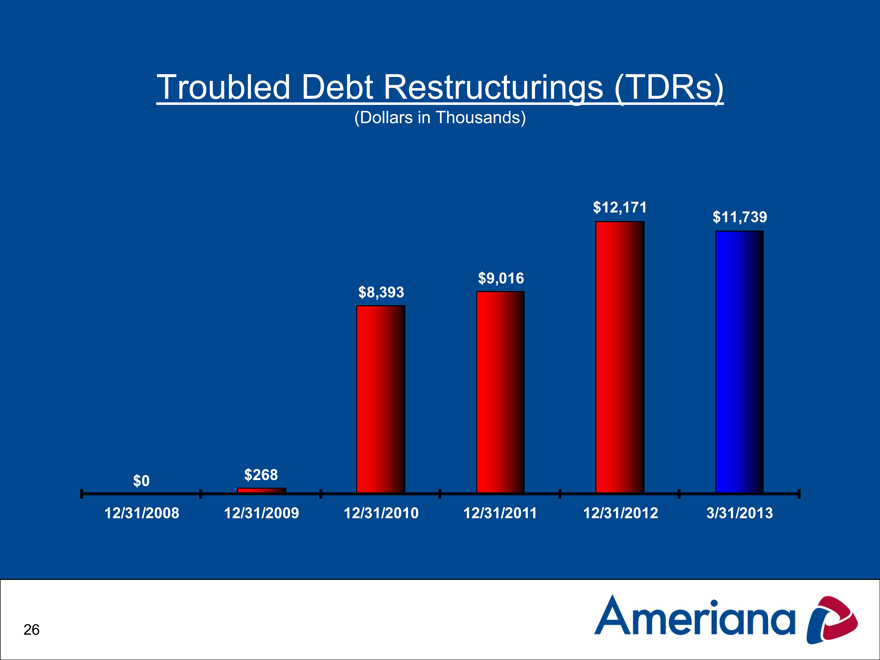
Troubled Debt Restructurings (TDRs)
(Dollars in Thousands)
$12,171 $11,739
$9,016
$8,393
$0 $268
12/31/2008 12/31/2009 12/31/2010 12/31/2011 12/31/2012 3/31/2013
26
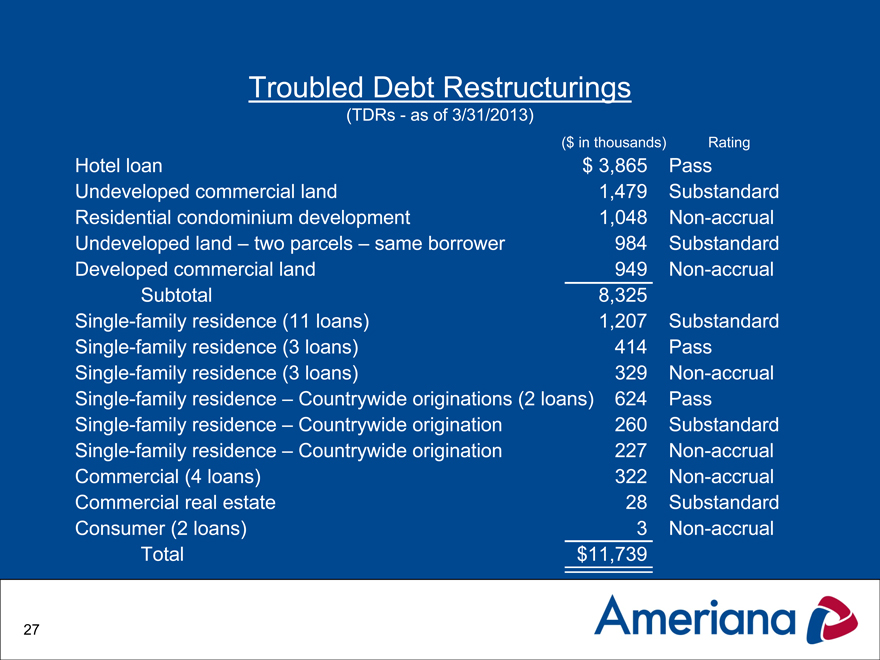
Troubled Debt Restructurings
(TDRs—as of 3/31/2013)
($ in thousands) Rating
Hotel loan $ 3,865 Pass
Undeveloped commercial land 1,479 Substandard
Residential condominium development 1,048 Non-accrual
Undeveloped land – two parcels – same borrower 984 Substandard
Developed commercial land 949 Non-accrual
Subtotal 8,325
Single-family residence(11 loans) 1,207 Substandard
Single-family residence(3 loans) 414 Pass
Single-family residence(3 loans) 329 Non-accrual
Single-family residence – Countrywide originations (2 loans) 624 Pass
Single-family residence – Countrywide origination 260 Substandard
Single-family residence – Countrywide origination 227 Non-accrual
Commercial (4 loans) 322 Non-accrual
Commercial real estate 28 Substandard
Consumer (2 loans) 3 Non-accrual
Total $11,739
27
Key Challenges for 2013
Margin Compression is likely
Low short-term interest rates, steep yield curve
Lack of viable investment alternatives
Deposit pricing is at all-time lows
Extremely competitive loan pricing
Consumers preference for short-term money market accounts
Regulatory and accounting environment
Dodd—Frank
Basel III
FASB pronouncements
28
Industry Challenges for 2013
Economic Conditions
Current economic conditions slowly improving
Resurgent U.S. auto industry and regional impact
Gradual price increase in residential housing market
Residential foreclosures decreasing
Unemployment levels slowly decreasing
Uncertainty of the future of the GSEs
Competition
Capital
Liquidity
Global unrest and sovereign risk
29
Key Objectives for 2013
Asset Quality
Earnings
Capital
Liquidity
People
30
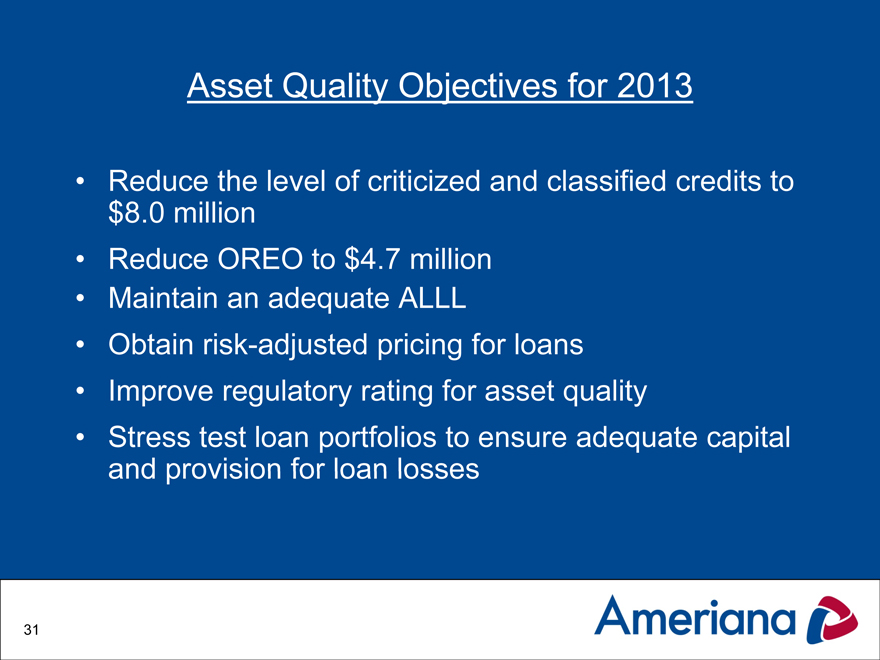
Asset Quality Objectives for 2013
Reduce the level of criticized and classified credits to $8.0 million
Reduce OREO to $4.7 million
Maintain an adequate ALLL
Obtain risk-adjusted pricing for loans
Improve regulatory rating for asset quality
Stress test loan portfolios to ensure adequate capital and provision for loan losses
31
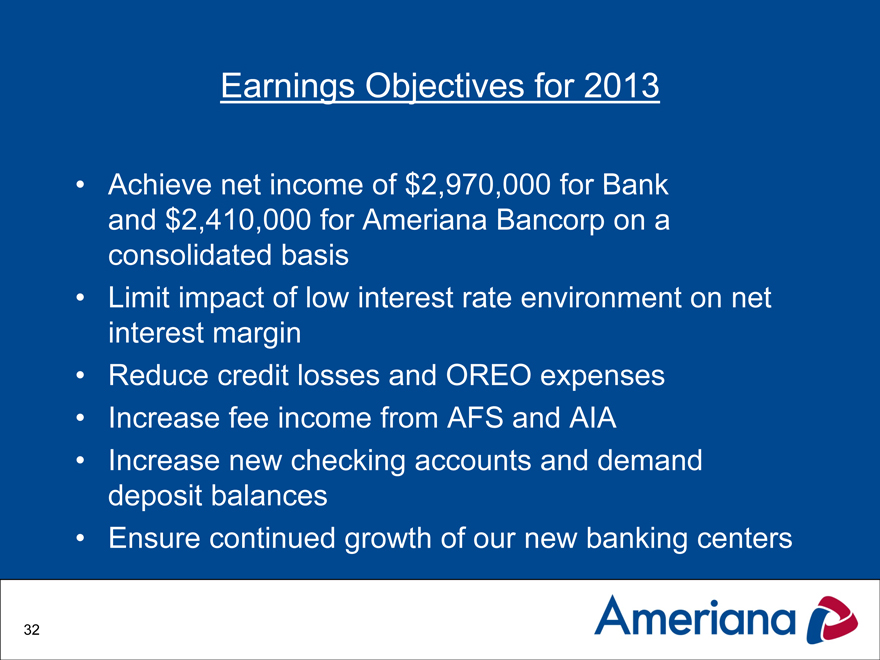
Earnings Objectives for 2013
Achieve net income of $2,970,000 for Bank and $2,410,000 for Ameriana Bancorp on a consolidated basis
Limit impact of low interest rate environment on net interest margin
Reduce credit losses and OREO expenses
Increase fee income from AFS and AIA
Increase new checking accounts and demand deposit balances
Ensure continued growth of our new banking centers
32
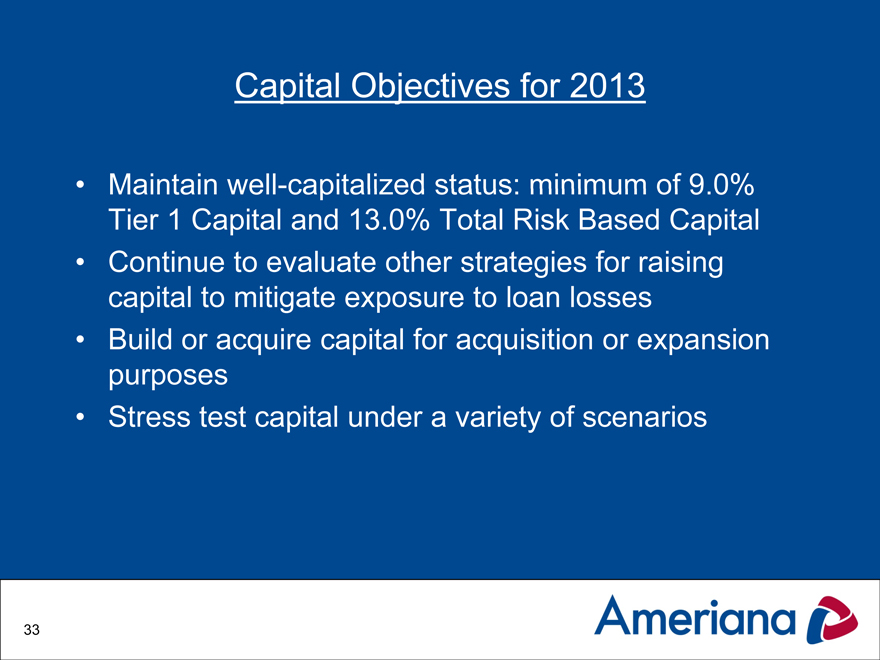
Capital Objectives for 2013
Maintain well-capitalized status: minimum of 9.0% Tier 1 Capital and 13.0% Total Risk Based Capital
Continue to evaluate other strategies for raising capital to mitigate exposure to loan losses
Build or acquire capital for acquisition or expansion purposes
Stress test capital under a variety of scenarios
33
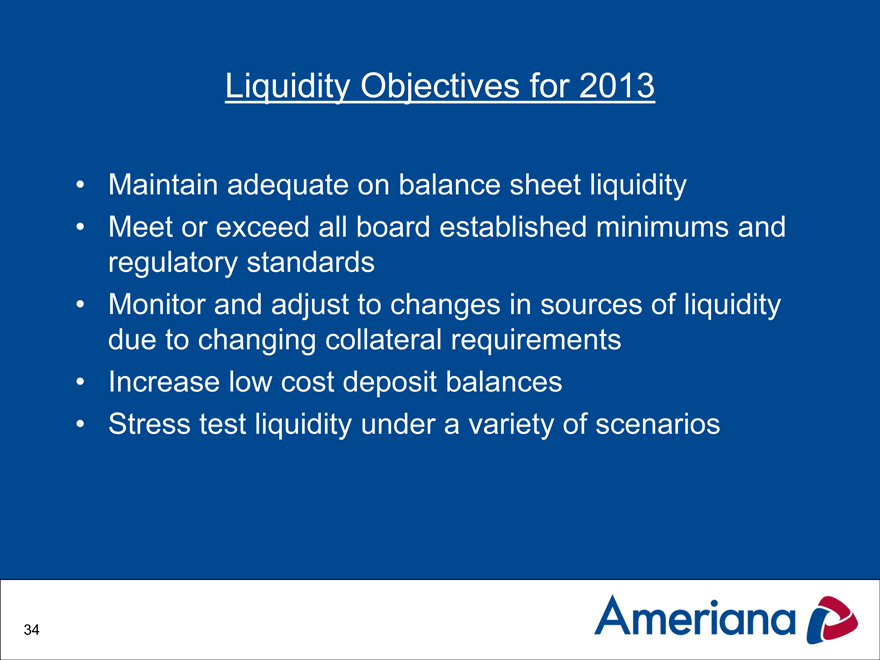
Liquidity Objectives for 2013
Maintain adequate on balance sheet liquidity
Meet or exceed all board established minimums and regulatory standards
Monitor and adjust to changes in sources of liquidity due to changing collateral requirements
Increase low cost deposit balances
Stress test liquidity under a variety of scenarios
34

People Plan for 2013
Improve career pathing
Be an employer of choice and be recognized as a “best place” to work
Implement on-line time card record keeping system
Implement new LMS training systems
Implement wellness program
35
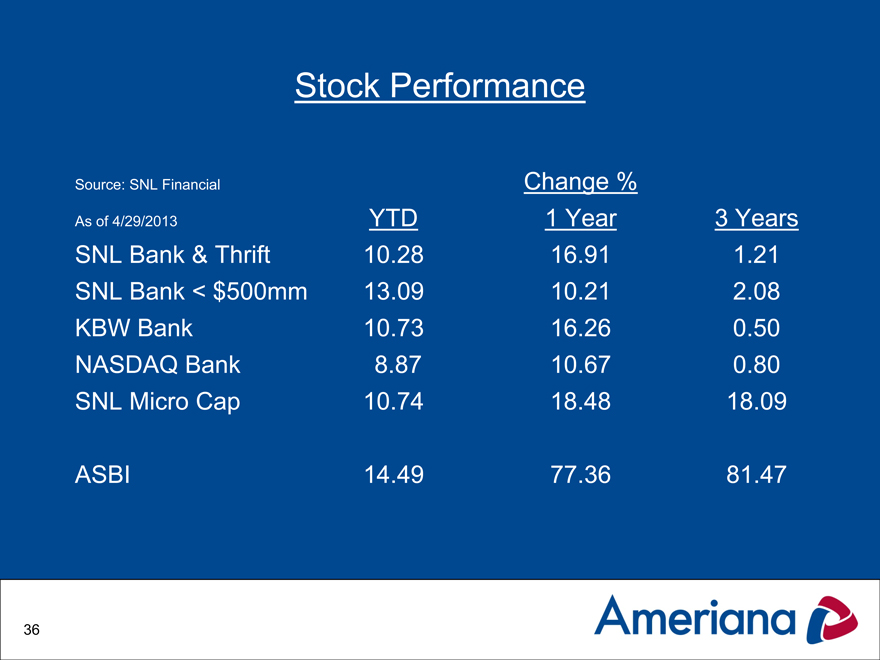
Stock Performance
Source: SNL Financial Change %
As of 4/29/2013 YTD 1 Year 3 Years
SNL Bank & Thrift 10.28 16.91 1.21
SNL Bank < $500mm 13.09 10.21 2.08
KBW Bank 10.73 16.26 0.50
NASDAQ Bank 8.87 10.67 0.80
SNL Micro Cap 10.74 18.48 18.09
ASBI 14.49 77.36 81.47
36

Questions?
37