EXHIBIT 13
ANNUAL REPORT TO STOCKHOLDERS
Message from the chairman of the Board
Dear Shareholder:
I am pleased to report to you the results of operations of Tri-County Financial Corporation and its banking subsidiary, Community Bank of Tri-County for the year ended December 31, 2006. Net income increased to $4,441,257 compared to $3,979,343 for the year ended December 31, 2005. Basic earnings per share increased to $1.68 compared to $1.53 for the same period while diluted earnings per share were $1.58 compared to $1.44 for 2005. The per share numbers have been adjusted for the three for two stock split paid in December 2006.
During 2006, the Company increased its total assets by 6.32% to $575,496,014. This was achieved through growth in the loan portfolio and was funded by proceeds from the investment portfolio cash flow, as well as continued strong growth in retail deposits. The total deposits of the Bank increased by 15% to $418,013,402. As a result of the continued deposit growth, the Bank has moved from fourth to third position in total deposit market share for Southern Maryland.
As we look forward to 2007, several initiatives are underway and completion during the year is possible. The small branch facility at Leonardtown, Maryland will be replaced with a 13,500 square foot regional office and branch facility. Also, construction is expected to commence on the tenth branch to be located in Lusby, Maryland.
In 2006, the company declared and executed a three for two stock split for the third year in a row. It increased the cash dividend per share in 2007 to $0.40 or approximately 8.30%. Your management and Board of Directors appreciate the support of our shareholders and continue their commitment to enhancing share value while serving the needs of our many communities.
Yours truly,

Michael L. Middleton
Chairman of the Board
Chairman of the Board
1
Tri-County Financial Corporation
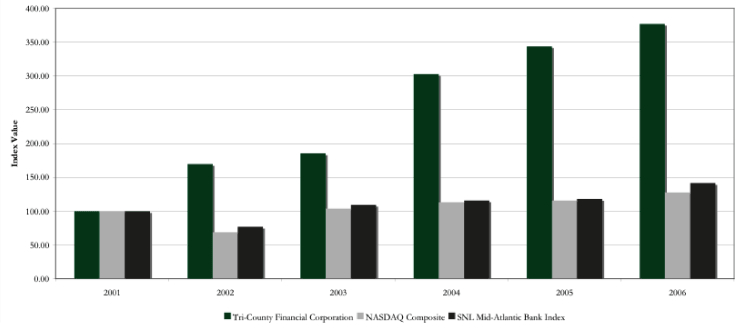
COMPARISON OF FIVE-YEAR CUMULATIVE TOTAL RETURN
The table below shows the total return performance, for the year ended December 31, for each of the last five years for Tri-County Financial Corporation common stock compared to the NASDAQ Composite and the SNL Mid-Atlantic Bank Index. The table below the chart provides the corresponding data points.
TOTAL RETURN PERFORMANCE
| Period Ending | ||||||||||||||||||||||||||||||||
| Index | 12/31/01 | 12/31/02 | 12/31/03 | 12/31/04 | 12/31/05 | 12/31/06 | ||||||||||||||||||||||||||
| Tri-County Financial Corporation | 100.00 | 169.70 | 185.33 | 302.59 | 343.72 | 376.92 | ||||||||||||||||||||||||||
| NASDAQ Composite | 100.00 | 68.76 | 103.67 | 113.16 | 115.57 | 127.58 | ||||||||||||||||||||||||||
| SNL Mid-Atlantic Bank Index | 100.00 | 76.91 | 109.35 | 115.82 | 117.87 | 141.46 | ||||||||||||||||||||||||||
2
Management’s Discussion and Analysis
FORWARD-LOOKING STATEMENTS
This annual report contains forward-looking statements that are based on assumptions and may describe future plans, strategies, and expectations of Tri-County Financial Corporation (the “Company”) and Community Bank of Tri-County (the “Bank”). These forward-looking statements are generally identified by use of the words “believe,” “expect,” “intend,” “anticipate,” “estimate,” “project,” or similar expressions.
The Company and the Bank’s ability to predict results or the actual effect of future plans or strategies is inherently uncertain. Factors that could have a material adverse effect on the operations of the Company and its subsidiaries include, but are not limited to, changes in interest rates, national and regional economic conditions, legislative and regulatory changes, monetary, and fiscal policies of the U.S. government, including policies of the U.S. Treasury and the Federal Reserve Board, the quality and composition of the loan or investment portfolios, demand for loan products, deposit flows, competition, demand for financial services in the Company and the Bank’s market area, changes in real estate market values in the Company and the Bank’s market area, and changes in relevant accounting principles and guidelines.
These risks and uncertainties should be considered in evaluating forward-looking statements and undue reliance should not be placed on such statements. Except as required by applicable law or regulation, the Company does not undertake, and specifically disclaims any obligation, to release publicly the result of any revisions that may be made to any forward-looking statements to reflect events or circumstances.
MANAGEMENT’S DISCUSSION AND ANALYSIS OF FINANCIAL CONDITION AND RESULTS OF
OPERATIONS
OPERATIONS
OVERVIEW
Since its conversion to a commercial bank charter in 1997, the Bank has rapidly increased assets and market share by concentrating on building on its strength as a local bank. In particular, the Bank has sought to increase its portfolio of commercial business, commercial real estate, and construction loans as well as increasing its share of the local deposit market, particularly commercial and consumer transaction accounts. The Bank feels that its ability to offer fast, flexible, and local decision making make it attractive to many customers. The Bank has also increased its share of the local deposit market by emphasizing convenient service and attractive rates. This strategy to focus on commercial and consumer transaction accounts tends to decrease our reliance on time deposits to fund loans and increase net interest income. Also, the additions of these products will increase non-interest expense and the Bank’s credit risk profile.
During the last few years the banking industry has also continued to consolidate. Several of our competitors in the southern Maryland market have been acquired by larger national and regional banks. In addition, several major national and regional institutions have entered the market through de novo branch openings. The Bank recognizes that these existing and future competitors will continue to offer stiff competition for our local market. The Bank will continue to aggressively market its products and services throughout its market area and will add new products and services to meet the challenges of increased competition.
The Corporation has sought to increase shareholder value through the stock splits declared in December 2004, 2005, and 2006. These three-for-two stock splits in the form of a dividend are retroactively applied throughout this document to all per share numbers.
CRITICAL ACCOUNTING POLICIES
The Company’s consolidated financial statements are prepared in accordance with accounting principles generally accepted in the United States of America and the general practices of the United States banking industry. Application of these principles requires management to make estimates, assumptions, and judgments that affect the amounts reported in the financial statements and accompanying notes. These estimates, assumptions, and judgments are based on information available as of the date of the financial statements. Accordingly, as this information changes, the financial statements could reflect different estimates, assumptions, and judgments. Certain policies inherently have a greater reliance on the use of estimates, assumptions, and judgments and, as such, have a greater possibility of producing results that could be materially different than originally reported. The Company considers its determination of the allowance for loan losses and the valuation allowance on its foreclosed real estate to be critical accounting policies. Estimates, assumptions, and judgments are necessary when assets and liabilities are required to be recorded at fair value, when a decline in the value of an asset not carried on the financial statements at fair value warrants an impairment write-down or valuation reserve to be
3
Tri-County Financial Corporation
established, or when an asset or liability needs to be recorded contingent upon a future event. Carrying assets and liabilities at fair value inherently results in more financial statement volatility. The fair values and the information used to record valuation adjustments for certain assets and liabilities are based either on quoted market prices or are provided by other third-party sources, when available. When these sources are not available, management makes estimates based upon what it considers to be the best available information.
The allowance for loan losses is an estimate of the losses that may be sustained in the loan portfolio. The allowance is based on two principles of accounting: (a) Statement on Financial Accounting Standards (“SFAS”) No. 5, “Accounting for Contingencies,” which requires that losses be accrued when they are probable of occurring and are estimable and (b) SFAS No. 114, “Accounting by Creditors for Impairment of a Loan,” which requires that losses be accrued when it is probable that the Company will not collect all principal and interest payments according to the contractual terms of the loan. The loss, if any, is determined by the difference between the loan balance and the value of collateral, the present value of expected future cash flows, or values observable in the secondary markets.
The loan loss allowance balance is an estimate based upon management’s evaluation of the loan portfolio. Generally, the allowance is comprised of a specific and a general component. The specific component consists of management’s evaluation of certain classified loans and their underlying collateral. Loans are examined to determine a specific allowance based upon the borrower’s payment history, economic conditions specific to the loan or borrower, or other factors that would impact the borrower’s ability to repay the loan on its contractual basis. Management assesses the ability of the borrower to repay the loan based upon any information available. Depending on the assessment of the borrower’s ability to pay the loan as well as the type, condition, and amount of collateral, management will establish an allowance amount specific to the loan.
In establishing the general component of the allowance, management analyzes non-classified and non-impaired loans in the portfolio including changes in the amount and type of loans. Management also examines the Bank’s history of write-offs and recoveries within each loan category. The state of the local and national economy is also considered. Based upon these factors, the Bank’s loan portfolio is categorized and a loss factor is applied to each category. These loss factors may be higher or lower than the Bank’s actual recent average losses in any particular loan category, particularly in loan categories where the Bank is rapidly increasing the size of its portfolio. Based upon these factors, the Bank will adjust the loan loss allowance by increasing or decreasing the provision for loan losses.
Management has significant discretion in making the judgments inherent in the determination of the provision and allowance for loan losses, including in connection with the valuation of collateral, a borrower’s prospects of repayment and in establishing allowance factors on the general component of the allowance. Changes in allowance factors will have a direct impact on the amount of the provision and a corresponding effect on net income. Errors in management’s perception and assessment of the global factors and their impact on the portfolio could result in the allowance not being adequate to cover losses in the portfolio, and may result in additional provisions or charge-offs. For additional information regarding the allowance for loan losses, refer to Notes 1 and 4 to the Consolidated Financial Statements and the discussion under the caption “Provision for Loan Losses” below.
In addition to the loan loss allowance, the Company also maintains a valuation allowance on its foreclosed real estate. As with the allowance for loan losses, the valuation allowance on foreclosed real estate is based on SFAS No. 5, “Accounting for Contingencies,” as well as SFAS No. 144 “Accounting for the Impairment or Disposal of Long-Lived Assets.” These statements require that the Company establish a valuation allowance when it has determined that the carrying amount of a foreclosed asset exceeds its fair value. Fair value of a foreclosed asset is measured by the cash flows expected to be realized from its subsequent disposition. These cash flows should be reduced for the costs of selling or otherwise disposing of the asset.
In estimating the cash flows from the sale of foreclosed real estate, management must make significant assumptions regarding the timing and amount of cash flows. In cases where the real estate acquired is undeveloped land, management must gather the best available evidence regarding the market value of the property, including appraisals, cost estimates of development, and broker opinions. Due to the highly subjective nature of this evidence, as well as the limited market, long time periods involved, and substantial risks, cash flow estimates are highly subjective and subject to change. Errors regarding any aspect of the costs or proceeds of developing, selling, or otherwise disposing of foreclosed real estate could result in the allowance being inadequate to reduce carrying costs to fair value and may require an additional provision for valuation allowances.
4
Management’s Discussion and Analysis
COMPARISON OF RESULTS OF OPERATIONS FOR THE YEARS ENDED DECEMBER 31, 2006, 2005, AND 2004
General. For the year ended December 31, 2006, the Company reported consolidated net income of $4,441,257 ($1.68 basic and $1.58 diluted earnings per share) compared to consolidated net income of $3,979,343 ($1.53 basic and $1.44 diluted earnings per share) for the year ended December 31, 2005. The increase in net income for 2006 was primarily attributable to increases in net interest income and noninterest income, which was partially offset by increases in the provision for loan losses and noninterest expenses. The Bank also substantially increased its loan portfolio and deposit balances. In 2006, the Bank used increases in deposit balances and proceeds from maturing securities to fund loan growth and reduce wholesale borrowings. The provision for loan losses increased in 2006 from 2005 levels due to increases in the loan portfolio, particularly in commercial real estate and commercial and construction lending. These loan types carry a greater risk of default than one- to four-family lending. The amount of increase was moderated by the Bank’s excellent record in loan quality. Noninterest income increased in 2006 due to increases in loan appraisal, credit, and miscellaneous charges, income from bank owned life insurance, increases in service charges, and recognition of a gain on the sale of certain investment securities compared to a loss on such sales in 2005. Noninterest expenses increased primarily due to increases in personnel, occupancy, data processing, and professional fees. Income tax expenses increased by $112,471, or 5.48%, in 2006.
For the year ended December 31, 2005, the Company reported consolidated net income of $3,979,343 ($1.53 basic and $1.44 diluted earnings per share) compared to consolidated net income of $3,719,834 ($1.44 basic and $1.38 diluted earnings per share) for the year ended December 31, 2004. The increase in net income for 2005 was primarily attributable to an increase in net interest income, a decline in provision for loan losses, and a small increase in noninterest income which was partially offset by increases in noninterest expenses. The Bank also substantially increased its loan portfolio and deposit balances. In 2005, the Bank used increases in loan and deposit balances to reduce investment securities and wholesale borrowings. In 2005, the Bank also used funds from the issuance of $5.0 million in trust preferred securities to further increase assets. These changes led to increases in net interest income in 2005. Provision for loan losses declined in 2005 from 2004 levels as loan growth in certain areas declined and the Bank maintained an excellent record in loan quality. Noninterest income increased in 2005 because the Bank had recognized a decline in the value of certain securities in 2004 while no recognition was required in 2005. Noninterest expenses increased primarily due to increases in personnel, occupancy, data processing, and professional fees. Income tax expenses increased by $610,950, or 42.40%, in 2005.
Net Interest Income. The primary component of the Company’s net income is its net interest income, which is the difference between income earned on assets and interest paid on the deposits and borrowings used to fund them. Net interest income is determined by the spread between the yields earned on the Company’s interest-earning assets and the rates paid on interest-bearing liabilities as well as the relative amounts of such assets and liabilities. Net interest income, divided by average interest-earning assets, represents the Company’s net interest margin.
Net interest income for the year ended December 31, 2006 was $17,326,808 compared to $15,571,081 for the year ended December 31, 2005 and $13,799,929 for the year ended December 31, 2004. The $1,755,727 increase in the most recent year was due to an increase in interest income of $6,531,024, partially offset by the increase in interest expense of $4,775,297. For the year ended December 31, 2005, the $1,771,152 increase was due to an increase of $7,541,373 in interest income offset by an increase of $5,770,221 in interest expense for the same period. Changes in the components of net interest income due to changes in average balances of assets and liabilities and to changes caused by changes in interest rates are presented in the rate volume analysis below.
During 2006, the Company’s interest rate spread increased because the Bank’s yield on interest-earning assets increased at a faster rate than the increase in the cost of the Company’s interest-bearing liabilities. The Bank’s yield on loans increased as rates on certain loan types, particularly those based on the prime rate, increased as the Federal Reserve increased short-term interest rates. The Bank’s investment securities yields also increased. The cost of both wholesale borrowings and deposits increased from 2005 due to the Federal Reserve increase in interest rates and because the largest increase in deposits was from certificates of deposit. However, the Company’s average balances of investments, which tend to have lower interest rates than loans, decreased in 2006 from 2005, while the Company’s average balances of loans increased. The Company’s average balances of short-term borrowings, which tend to increase in cost faster than other liabilities, declined during 2006. Deposits, which tend to increase in cost more slowly than other liabilities, increased during the same time. These changes in the average balance sheet of the company from 2005 to 2006 tended to increase interest rate spread and the net yield on interest-earning assets.
During 2005, the Company’s interest-rate spread declined because the Bank’s yield on interest-earning assets increased at a slower rate
5
Tri-County Financial Corporation
than the increase in costs for interest-bearing liabilities. The Bank’s yield on loans increased as rates on certain loan types, particularly those based on the prime rate, increased as the Federal Reserve increased short-term interest rates. The Company’s investment securities yields increased at a much slower rate than loans, as most of the investments are fixed rate, and the Company did not make significant purchases of investments after the first quarter of 2005. The cost of both wholesale borrowings and deposits increased from 2004 due to the Federal Reserve increasing interest rates.
The following table presents information on the average balances of the Company’s interest-earning assets and interest-bearing liabilities and interest earned or paid thereon for the past three fiscal years.
| 2006 | 2005 | 2004 | ||||||||||||||||||||||||||||||||||
| Average | Average | Average | ||||||||||||||||||||||||||||||||||
| Average | Yield/ | Average | Yield/ | Average | Yield/ | |||||||||||||||||||||||||||||||
| dollars in thousands | Balance | Interest | Cost | Balance | Interest | Cost | Balance | Interest | Cost | |||||||||||||||||||||||||||
Assets | ||||||||||||||||||||||||||||||||||||
| Interest-earning assets | ||||||||||||||||||||||||||||||||||||
Loan portfolio1 | $ | 398,381 | $ | 29,292 | 7.35 | % | $ | 332,348 | $ | 22,358 | 6.73 | % | $ | 254,605 | $ | 16,033 | 6.30 | % | ||||||||||||||||||
| Investment securities, federal funds sold and interest-bearing deposits | 135,824 | 6,394 | 4.71 | % | 178,095 | 6,797 | 3.82 | % | 147,274 | 5,580 | 3.79 | % | ||||||||||||||||||||||||
| Total interest-earning assets | 534,205 | 35,686 | 6.68 | % | 510,443 | 29,155 | 5.71 | % | 401,879 | 21,613 | 5.38 | % | ||||||||||||||||||||||||
| Cash and cash equivalents | 4,072 | 5,437 | 2,937 | |||||||||||||||||||||||||||||||||
| Other assets | 20,133 | 19,262 | 17,807 | |||||||||||||||||||||||||||||||||
Total Assets | $ | 558,410 | $ | 535,142 | $ | 422,623 | ||||||||||||||||||||||||||||||
Liabilities and Stockholders’ Equity | ||||||||||||||||||||||||||||||||||||
| Interest-bearing liabilities | ||||||||||||||||||||||||||||||||||||
| Savings | 34,570 | 409 | 1.18 | % | 36,696 | 216 | 0.59 | % | 37,776 | 176 | 0.47 | % | ||||||||||||||||||||||||
| Interest-bearing demand and money market accounts | 104,410 | 3,053 | 2.92 | % | 89,394 | 1,387 | 1.55 | % | 85,212 | 755 | 0.89 | % | ||||||||||||||||||||||||
| Certificates of deposit | 204,675 | 8,609 | 4.21 | % | 146,512 | 4,869 | 3.32 | % | 93,267 | 2,298 | 2.46 | % | ||||||||||||||||||||||||
| Long-term debt | 101,520 | 4,491 | 4.42 | % | 93,409 | 3,966 | 4.25 | % | 73,830 | 3,280 | 4.44 | % | ||||||||||||||||||||||||
| Short-term debt | 18,129 | 905 | 4.99 | % | 82,665 | 2,565 | 3.10 | % | 64,736 | 1,164 | 1.80 | % | ||||||||||||||||||||||||
| Guaranteed preferred beneficial interest in junior subordinated debentures | 12,000 | 892 | 7.43 | % | 9,916 | 581 | 5.86 | % | 3,255 | 140 | 4.31 | % | ||||||||||||||||||||||||
Total Interest-Bearing Liabilities | 475,304 | 18,359 | 3.86 | % | 458,592 | 13,584 | 2.96 | % | 358,076 | 7,813 | 2.18 | % | ||||||||||||||||||||||||
| Noninterest-bearing demand deposits | 42,030 | 39,855 | 32,909 | |||||||||||||||||||||||||||||||||
| Other liabilities | 4,444 | 4,474 | 3,178 | |||||||||||||||||||||||||||||||||
| Stockholders’ equity | 36,632 | 32,221 | 28,460 | |||||||||||||||||||||||||||||||||
Total Liabilities and Stockholders’ Equity | $ | 558,410 | $ | 535,142 | $ | 422,623 | ||||||||||||||||||||||||||||||
| Net interest income | $ | 17,327 | $ | 15,571 | $ | 13,800 | ||||||||||||||||||||||||||||||
| Interest rate spread | 2.82 | % | 2.75 | % | 3.20 | % | ||||||||||||||||||||||||||||||
| Net yield on interest-earning assets | 3.24 | % | 3.05 | % | 3.43 | % | ||||||||||||||||||||||||||||||
| Ratio of average interest-earning assets to average interest bearing liabilities | 112.39 | % | 111.31 | % | 112.23 | % | ||||||||||||||||||||||||||||||
| 1 | Average balance includes non-accrual loans. |
6
Management’s Discussion and Analysis
The table below sets forth certain information regarding changes in interest income and interest expense of the Bank for the periods indicated. For each category of interest-earning asset and interest-bearing liability, information is provided on changes attributable to (1) changes in volume (changes in volume multiplied by old rate); and (2) changes in rate (changes in rate multiplied by old volume). Changes in rate volume (changes in rate multiplied by the change in volume) have been allocated to changes due to volume.
| Year ended December 31, 2006 | Year ended December 31, 2005 | |||||||||||||||||||||||
| compared to December 31, 2005 | compared to December 31, 2004 | |||||||||||||||||||||||
| dollars in thousands | Volume | Due to Rate | Total | Volume | Due to Rate | Total | ||||||||||||||||||
Interest Income | ||||||||||||||||||||||||
| Loan portfolio | $ | 4,855 | $ | 2,079 | $ | 6,934 | $ | 5,231 | $ | 1,094 | $ | 6,325 | ||||||||||||
| Investment securities, federal funds sold and interest-bearing deposits | (1,989 | ) | 1,586 | (403 | ) | 1,176 | 41 | 1,217 | ||||||||||||||||
Total Interest-Earning Assets | 2,866 | 3,665 | 6,531 | 6,407 | 1,135 | 7,542 | ||||||||||||||||||
Interest-Bearing Liabilities | ||||||||||||||||||||||||
| Savings | (25 | ) | 219 | 193 | (7 | ) | 47 | 40 | ||||||||||||||||
| Interest-bearing demand and money market accounts | 439 | 1,227 | 1,666 | 65 | 567 | 632 | ||||||||||||||||||
| Certificates of deposit | 2,446 | 1,293 | 3,740 | 1,770 | 801 | 2,571 | ||||||||||||||||||
| Long-term debt | 359 | 166 | 525 | 831 | (145 | ) | 686 | |||||||||||||||||
| Short-term debt | (3,222 | ) | 1,562 | (1,660 | ) | 556 | 845 | 1,401 | ||||||||||||||||
| Guaranteed preferred beneficial interest in junior subordinated debentures | 155 | 156 | 311 | 391 | 50 | 441 | ||||||||||||||||||
Total Interest-Bearing Liabilities | 152 | 4,623 | 4,775 | 3,606 | 2,165 | 5,771 | ||||||||||||||||||
Net Change in Net Interest Income | $ | 2,714 | $ | (958 | ) | $ | 1,756 | $ | 2,801 | $ | (1,030 | ) | $ | 1,771 | ||||||||||
Provision for Loan Losses.The provision for loan losses for the year ended December 31, 2006 was $405,809, compared to $329,467 and $452,998 for the years ended December 31, 2005 and 2004, respectively. The loan loss provision increased in 2006 as the Bank continued to add loans to its portfolio particularly in the commercial and commercial equipment categories. The need to increase the loan loss provision was moderated by the Bank’s continued excellent credit quality and low level of charge-offs. In 2006, the Bank recorded net charge-offs of $5,422 (.00% of average loans). For the year ended December 31, 2005, the Company recorded net charge-offs of $4,000 (.00% of average loans) compared to net recoveries of $32,000 (.01% of average loans) in 2004. The loan loss allowance and the provision for loan losses is determined based upon an analysis of individual loans and the application of certain loss factors to different loan categories. Individual loans are analyzed for impairment as the facts and circumstances warrant. In addition, a general component of the loan loss allowance is added based on a review of the portfolio’s size and composition. At December 31, 2006, the allowance for loan losses equaled 362% of non-accrual and past due loans compared to 573% and 453% at December 31, 2005 and 2004, respectively.
Noninterest Income.
| Years Ended December 31, | % change | % change | ||||||||||||||||||
| 2006 | 2005 | 2004 | 2006 vs. 2005 | 2005 vs. 2004 | ||||||||||||||||
| Loan appraisal, credit, and miscellaneous charges | $ | 362,145 | $ | 178,424 | $ | 229,125 | 102.97 | % | (22.13 | %) | ||||||||||
| Net gain on sale of loans held for sale | — | — | 21,404 | na | (100.00 | %) | ||||||||||||||
| Income from bank owned life insurance | 328,586 | 251,220 | 261,411 | 30.80 | % | (3.90 | %) | |||||||||||||
| Service charges | 1,359,409 | 1,186,184 | 1,189,001 | 14.60 | % | (0.24 | %) | |||||||||||||
| Gain on sale of asset | — | 39,756 | 8,250 | (100.00 | %) | 381.89 | % | |||||||||||||
| Gain (loss) on the sale of investment securities | 197,001 | (14,581 | ) | (61,875 | ) | 1451.08 | % | (76.43 | %) | |||||||||||
| Recognition of other than temporary decline in value of marketable securities | — | — | (65,000 | ) | na | (100.00 | %) | |||||||||||||
| Total noninterest income | $ | 2,247,141 | $ | 1,641,003 | $ | 1,582,316 | 36.94 | % | 3.71 | % | ||||||||||
7
Tri-County Financial Corporation
Changes in noninterest income over the past three years have been the result of fluctuations in certain noninterest income categories, including gain on sale of loans, other income, service charges, and loan fees. Loan appraisal, credit, and miscellaneous charges are highly variable. Increases and decreases in this category reflect changes in lending volumes and patterns as well as competitive pressures. The absence of a gain on sale of loans held for sale in 2006 or 2005 reflects the Bank’s desire to keep more of its loan production in portfolio rather than selling it. Income from bank owned life insurance (BOLI) has increased in the last year as the Bank purchased an additional $2.0 million in BOLI in 2006. Service charges and fees are primarily generated by the Bank’s ability to attract and retain transaction-based deposit accounts and by loan-servicing fees net of amortization of and valuation allowances on mortgage servicing rights. In 2006, service charges increased over the prior year as the Bank increased its average transaction account balances during the year. The Bank also increased certain service fees on accounts during 2006. In 2005 and 2004, gains on sales of assets were recorded which were not present in 2006. In 2006, the Bank recorded a net gain on the sale of investment securities compared to losses in the two prior years as the Company sold $423,200 in investments compared to sales of $1,350,000 and $17,313,000 in 2005 and 2004, respectively.
Noninterest Expenses.
| Years Ended December 31, | % change | % change | ||||||||||||||||||
| 2006 | 2005 | 2004 | 2006 vs. 2005 | 2005 vs. 2004 | ||||||||||||||||
| Salary and employee benefits | $ | 7,006,369 | $ | 5,849,226 | $ | 5,432,898 | 19.78 | % | 7.66 | % | ||||||||||
| Occupancy expense | 1,316,261 | 1,156,775 | 858,891 | 13.79 | % | 34.68 | % | |||||||||||||
| Advertising | 474,554 | 411,811 | 539,715 | 15.24 | % | (23.70 | %) | |||||||||||||
| Data processing expense | 821,392 | 665,981 | 550,781 | 23.34 | % | 20.92 | % | |||||||||||||
| Depreciation of furniture, fixtures, and equipment | 513,348 | 452,037 | 372,237 | 13.56 | % | 21.44 | % | |||||||||||||
| Telephone communications | 93,319 | 85,436 | 103,421 | 9.23 | % | (17.39 | %) | |||||||||||||
| Valuation allowance on foreclosed real estate | — | — | 114,606 | na | (100.00 | %) | ||||||||||||||
| ATM expenses | 274,403 | 277,566 | 345,454 | (1.14 | %) | (19.65 | %) | |||||||||||||
| Office supplies | 141,144 | 138,407 | 151,862 | 1.98 | % | (8.86 | %) | |||||||||||||
| Professional fees | 655,503 | 629,126 | 261,458 | 4.19 | % | 140.62 | % | |||||||||||||
| Office equipment expenses | 49,816 | 50,318 | 90,520 | (1.00 | %) | (44.41 | %) | |||||||||||||
| Other | 1,216,359 | 1,134,647 | 946,576 | 7.20 | % | 19.87 | % | |||||||||||||
| $ | 12,562,468 | $ | 10,851,330 | $ | 9,768,419 | 15.77 | % | 11.09 | % | |||||||||||
The increases reflect growth in the Bank’s workforce to fully staff branches, an increasing need for highly skilled employees due to the higher complexity level of the Bank’s business, and continued increases in the Bank’s benefit and incentive costs. Expenses also included certain supplemental retirement benefits, which were funded by the BOLI income. In 2006, occupancy expenses reflected the opening of a new branch in 2005 as well as the write-down of a facility which will be replaced in 2007. In 2005, these expenses also reflected an additional branch. Advertising expenses have fluctuated during the three-year period. In 2006, advertising included several large scale campaigns to increase deposit market share. In 2005, advertising expenses declined from the prior year as certain advertising campaigns were curtailed. In 2004, advertising costs reflected several major advertising campaigns and marketing efforts. The increases in data processing costs are reflective of the Bank’s increased size of the loan and deposit portfolios as well as increases in certain third party processing costs related to data processing. These costs also reflect the increasing complexity of the Bank’s product line including the introduction of more sophisticated products for business customers. In 2006, depreciation expenses increased as the Bank continued to expand its branch network. In 2005, depreciation of furniture, fixtures, and equipment increased as the Bank opened a new branch requiring major purchases adding to the amount of assets being depreciated. Telephone communications expenses increased in 2006 as the Bank increased its usage of these services. The same expenses decreased in 2005 compared to 2004 reflecting changes in vendors and renegotiation of vendor contracts. In 2004, ATM expenses included costs relating to a systems conversion, which were nonrecurring. These costs declined in 2005 and 2006. Professional fees increased substantially from 2004 to 2005 as the Company incurred expenses to prepare for Sarbanes-Oxley Act certifications. These costs were steady from 2005 to 2006. Office equipment expenses decreased as a result of declining needs for certain specialized equipment, which is no longer needed after our systems conversion. Other noninterest expense increased due to the growing size of the Bank.
8
Management’s Discussion and Analysis
Income Tax Expense.During the year ended December 31, 2006, the Company recorded income tax expense of $2,164,415 compared to expenses of $2,051,944 and $1,440,994 in the two prior years. The Company’s effective tax rates for the years ended December 31, 2006, 2005, and 2004 were 32.76%, 34.02%, and 27.92%, respectively. The 2005 effective tax rate increased as the 2004 effective rate reflected a large donation of property made in 2004.
COMPARISON OF FINANCIAL CONDITION AT DECEMBER 31, 2006 AND 2005
| December 31, | % change | |||||||||||
| 2006 | 2005 | 2006 vs. 2005 | ||||||||||
Assets | ||||||||||||
| Cash and due from banks | $ | 3,157,595 | $ | 7,262,547 | (56.52 | %) | ||||||
| Fed Funds sold | 772,351 | 640,818 | 20.53 | % | ||||||||
| Interest-bearing deposits with banks | 14,260,560 | 14,671,875 | (2.80 | %) | ||||||||
| Securities available for sale | 9,301,676 | 7,178,894 | 29.57 | % | ||||||||
| Securities held to maturity | 97,804,849 | 116,486,685 | (16.04 | %) | ||||||||
| Federal Home Loan Bank and Federal Reserve Bank stock | 6,100,400 | 7,190,300 | (15.16 | %) | ||||||||
| Loans receivable, net | 422,479,799 | 369,592,253 | 14.31 | % | ||||||||
| Premises and equipment, net | 6,822,461 | 6,460,545 | 5.60 | % | ||||||||
| Foreclosed real estate | 460,884 | 475,561 | (3.09 | %) | ||||||||
| Accrued interest receivable | 2,837,413 | 2,406,542 | 17.90 | % | ||||||||
| Investment in bank owned life insurance | 8,762,761 | 6,434,175 | 36.19 | % | ||||||||
| Other assets | 2,735,265 | 2,487,280 | 9.97 | % | ||||||||
Total Assets | $ | 575,496,014 | $ | 541,287,475 | 6.32 | % | ||||||
Liabilities | ||||||||||||
| Deposits | ||||||||||||
| Noninterest-bearing | $ | 43,723,436 | $ | 44,325,083 | (1.36 | %) | ||||||
| Interest-bearing | 374,289,966 | 319,048,657 | 17.31 | % | ||||||||
| Total deposits | 418,013,402 | 363,373,740 | 15.04 | % | ||||||||
| Short-term borrowings | 6,567,702 | 20,074,975 | (67.28 | %) | ||||||||
| Long-term debt | 96,045,936 | 107,823,759 | (10.92 | %) | ||||||||
| Guaranteed preferred beneficial interest in junior subordinated debentures | 12,000,000 | 12,000,000 | — | |||||||||
| Accrued expenses and other liabilities | 5,139,637 | 3,436,845 | 49.55 | % | ||||||||
Total Liabilities | 537,766,677 | 506,709,319 | 6.13 | % | ||||||||
Stockholders’ equity | ||||||||||||
| Common stock | 26,423 | 17,610 | 50.05 | % | ||||||||
| Additional paid in capital | 9,499,946 | 9,057,805 | 4.88 | % | ||||||||
| Retained earnings | 28,353,792 | 25,580,634 | 10.84 | % | ||||||||
| Accumulated other comprehensive (loss) income | (53,822 | ) | 49,362 | (209.04 | %) | |||||||
| Unearned ESOP shares | (97,002 | ) | (127,255 | ) | (23.77 | %) | ||||||
Total Stockholders’ Equity | 37,729,337 | 34,578,156 | 9.11 | % | ||||||||
Total Liabilities and Stockholders’ Equity | $ | 575,496,014 | $ | 541,287,475 | 6.32 | % | ||||||
9
Tri-County Financial Corporation
In 2006, the Bank used the payments received from the maturation and repayment of its investment securities portfolio to make loans. The Bank also increased retail deposits and used the funds to pay down short-term wholesale borrowings as well as to increase earning assets. In 2006, cash and due from banks decreased as the Bank reduced its cash reserve needs through a process of reclassifying certain deposit accounts. Securities available for sale increased as the Bank purchased securities whose purpose included fulfilling CRA investment requirements. Securities held to maturity decreased due to continued principal repayments on the portfolio, which were used to fund loan growth. Federal Home Loan Bank and Federal Reserve Bank stock declined as the level of borrowings from the Federal Home Loan Bank system declined. Loans receivable increased as the Bank continued to add to its loan portfolio, primarily in the commercial business and commercial real estate product lines. The Bank has continued to use its ability to offer fast, flexible service to attract loan customers. Other lending products such as consumer lending have not been emphasized due to declining margins brought about by competitors such as captive finance companies. Accrued interest receivable increased due to higher levels of earning asset balances. Other assets increased due to an increase in certain prepaid tax accounts.
Deposits increased during 2006 as the Bank increased its market share through marketing campaigns and the introduction of additional deposit products. The Bank has attempted to increase all deposit types, but the largest increase was in certificates of deposit. Short- and long-term borrowings declined, as the Bank replaced borrowings with deposits.
Total equity increased during the year. In 2006, the Company earned net income of $4,441,257. The Company also sold additional shares of stock for $177,500. Other additions to stockholders’ equity were the result of the exercise of stock options ($156,122), tax benefits from the payment of common stock dividends to its ESOP, the exercise of non-incentive stock options ($23,111 and $42,315, respectively), and other changes in the unearned ESOP shares ($73,554). These additions to stockholders’ equity were partially offset by the payment of dividends of $972,966, the repurchase of common stock for $686,528, and a change in the accumulated other comprehensive loss account of $103,184.
ASSET/LIABILITY RISK MANAGEMENT
Net interest income (“NII”), the primary component of the Company’s net income, arises from the difference between the yield on interest-earning assets and the cost of interest-bearing liabilities and the relative amounts of such assets and liabilities. As interest rates change, the yield on interest-earning assets and the cost of interest-bearing liabilities will also change. These changes can have a negative impact on net interest income as costs may rise faster than interest income. The variance in future financial performance caused by changes in interest rates can be broadly termed interest rate risk. Elements of interest rate risk include a mismatch between expected lives of current assets and liabilities (asset/liability mismatch), the ability of borrowers to prepay loans without penalty (prepayment risk), periodic and interest rate caps built into various loan types which limit interest rate adjustments, and adjustable rate liabilities and assets pricing based upon different indices (basis risk).
The Company attempts to measure these risks through various tools including financial modeling of current and projected balance sheets. Financial modeling simulates the effects on the Company’s financial position and net interest income of various interest rate scenarios. The Company uses several measures to gauge its interest rate risk including measuring the effect on NII of various interest rate scenarios, measuring the “gap” or mismatch in assets and liabilities repricing during a particular time period, and measuring the amount that the estimated market value of assets and liabilities would change given specific changes in interest rates. The table below sets forth an approximation of our exposure as a percentage of estimated net interest income for the next twelve months using interest income simulation. The simulation uses projected repricing of assets and liabilities at December 31, 2006 on the basis of contractual maturities, anticipated repayments and schedule rate adjustments. Prepayment rates can have a significant impact on interest income simulation. Because of the large percentage of loans and securities we hold, rising or falling interest rates have a significant impact on the prepayment speeds of our earning assets that in turn affect the rate sensitivity position. When interest rates rise, prepayments tend to slow. When interest rates fall, prepayments tend to rise. Our asset sensitivity would be reduced if prepayments slow and vice versa. While we believe such assumptions to be reasonable, there can be no assurance that assumed prepayment rates will approximate actual future security and loan repayment activity. The 200 and 100 basis point changes in rates in the following table are assumed to occur immediately.
10
Management’s Discussion and Analysis
Projected Percentage change in Net Interest Income at December 31, 2006
| +200 | +100 | -100 | -200 | |||||||||||||||
| Basis points | Basis points | No Change | Basis points | Basis points | ||||||||||||||
| -2.27 | % | -0.89 | % | 0.00 | % | -2.05 | % | -7.36 | % | |||||||||
The rate scenarios noted above shows that the Company’s interest rate risk to its NII assuming no growth in the balance sheet and all interest rates moving in the same amounts is about -7.36%. The Company’s one-year-forward earnings will show a relative decline under both positive and negative parallel interest rate movements. These declines are small relative to the Company’s net income and primarily result from the projected actions of customers and others taking advantage of the optionality built into the various financial instruments which make up the Company’s assets and liabilities.
Management will continue to analyze, simulate, and control interest rate risk as the Company grows. The Company may from time to time determine that the use of different financial instruments including interest rate caps, floors, swaps, long-term borrowings, or other arrangements may be prudent. It is management’s belief that the changes in the Company’s balance sheet, including the increased emphasis on commercial lines of credit and certain other loans which tend to rapidly adjust to interest rate changes, and the declining importance of certain liabilities such as short-term borrowings including reverse repurchase agreements and other short-term liabilities will decrease the negative effects of changing interest rates on NII. However these loans carry an increased risk of default, and increases in retail deposits will tend to increase non-interest expenses.
LIQUIDITY AND CAPITAL RESOURCES
The Company currently has no business other than holding the stock of the Bank and engaging in certain passive investments and does not currently have any material funding requirements, except for payment of interest on subordinated debentures, the payment of dividends, and the repurchase of stock. The Company’s principal sources of liquidity are cash on hand and dividends received from the Bank. The Bank is subject to various regulatory restrictions on the payment of dividends.
The Bank’s principal sources of funds for investment and operations are net income, deposits from its primary market area, borrowings, principal and interest payments on loans, principal and interest received on investment securities, and proceeds from the maturity and sale of investment securities. Its principal funding commitments are for the origination or purchase of loans, the purchase of securities, and the payment of maturing deposits. Deposits are considered the primary source of funds supporting the Bank’s lending and investment activities. The Bank also uses borrowings from the FHLB of Atlanta to supplement its funding activities. The amount of FHLB advances available to the Bank is limited to the lower of 40% of Bank assets or the amount supportable by eligible collateral such as FHLB stock, loans, and securities.
The Bank’s most liquid assets are cash, cash equivalents, and federal funds sold. The levels of such assets are dependent on the Bank’s operating, financing and investment activities at any given time. The variations in levels of cash and cash equivalents are influenced by deposit flows and anticipated future deposit flows.
Cash, cash equivalents, and interest-bearing deposits as of December 31, 2006 totaled $18,190,506, a decrease of $4,384,734 or 19.42% from the December 31, 2005 total of $22,575,240. This decrease was due to the Bank’s reduced needs for cash reserves after reclassi-fying certain deposit accounts as noted above.
The Bank’s principal sources of cash flows are its financing activities including deposits and borrowings. During 2006, all financing activities provided $28,167,675 in cash compared to $30,894,663 during 2005 and $149,495,361 during 2004. The decrease in cash flows from financing activities during the most recent period was principally due to a decline in the level of net increase of deposits. The net increase in deposits in 2005 was $96,619,236 compared to $54,639,662 in 2006. The decline in cash flows provided by deposits was offset by a significantly smaller use of cash in reducing net short-term borrowings. In 2006, short-term borrowings declined by $13,507,273 compared to a decline of $95,229,235 in 2005. By contrast, in 2004, short-term borrowing provided a net increase in cash of $84,112,925. Other significant cash flows from financing activities included the proceeds of long-term debt totaling $15,260,000, $30,000,000, and $30,000,000 during 2006, 2005, and 2004 respectively. In 2006, the Company had significantly more repayments of
11
Tri-County Financial Corporation
long-term debt than in the prior two years, $27,037,822 compared to $5,107,354 and $10,120,063 in 2006, 2005, and 2004 respectively. The Bank also receives cash from its operating activities which provided $6,314,581 in 2006 compared to cash flows of $5,242,895 and $6,290,408 during 2005 and 2004, respectively.
The Bank’s principal use of cash has been in investing activities including investments in loans for its portfolio, investment securities, and other assets. In 2006, the level of investing activity increased after a significant decline in 2005. In 2006, total net cash flow invested was $38,866,990 compared to $31,278,097 and $150,239,788 in 2005 and 2004. The principal reasons for the changes in invested cash are the fluctuations in the amount of funds used to buy investments, the funds provided by maturities and principal payments on investments, funds used for the origination of loans, and the cash provided by principal collected on loans.
Federal banking regulations require the Company and the Bank to maintain specified levels of capital. At December 31, 2006, the Company was in compliance with these requirements with a leverage ratio of 8.74%, a Tier 1 risk-based capital ratio of 11.12% and total risk-based capital ratio of 11.98%. At December 31, 2006, the Bank met the criteria for designation as a well-capitalized depository institution under Federal Reserve Board regulations. See Note 14 of the consolidated financial statements.
OFF BALANCE SHEET ARRANGEMENTS
In the normal course of its business, the Bank has committed to make credit available to its borrowers under various loan and other agreements provided that certain terms and conditions are met. For a discussion of these agreements including collateral and other arrangements see Note 11 to the consolidated financial statements.
CONTRACTUAL OBLIGATIONS
In the normal course of its business, the Bank commits to make future payments to others to satisfy contractual obligations. These commitments include commitments to repay short and long-term borrowings, and commitments incurred under operating lease agreements. These commitments are summarized below:
| Less Than 1 | More Than 5 | |||||||||||||||||||
| Total | Year | 1 to 3 Years | 3 to 5 Years | Years | ||||||||||||||||
| Long-term debt obligations | $ | 96,046 | $ | 5,000 | $ | 30,000 | $ | 25,000 | $ | 36,046 | ||||||||||
| Short-term debt obligations | 6,567 | 6,567 | — | — | — | |||||||||||||||
| Deposits | 418,014 | 382,194 | 34,120 | 1,701 | — | |||||||||||||||
| Data processing servicing contracts | 999 | 481 | 518 | — | — | |||||||||||||||
| Operating lease obligations | 5,715 | 342 | 831 | 615 | 3,927 | |||||||||||||||
| Commitments to purchase or replace branches | 4,400 | 4,400 | — | — | — | |||||||||||||||
| $ | 531,741 | $ | 398,984 | $ | 65,469 | $ | 27,315 | $ | 39,973 | |||||||||||
IMPACT OF INFLATION AND CHANGING PRICES
The consolidated financial statements and notes thereto presented herein have been prepared in accordance with accounting principles generally accepted in the United States of America, which require the measurement of financial position and operating results in terms of historical dollars without considering the changes in the relative purchasing power of money over time due to inflation. Unlike most industrial companies, nearly all of the Company’s assets and liabilities are monetary in nature. As a result, interest rates have a greater impact on the Company’s performance than do the effects of general levels of inflation. Interest rates do not necessarily move in the same direction or to the same extent as the prices of goods and services.
12
Management’s Discussion and Analysis
SELECTED FINANCIAL DATA
| Year Ended December 31, | ||||||||||||||||||||
| dollars in thousands except per share data | 2006 | 2005 | 2004 | 2003 | 2002 | |||||||||||||||
Operations Data | ||||||||||||||||||||
| Net interest income | $ | 17,327 | $ | 15,571 | $ | 13,800 | $ | 10,469 | $ | 10,745 | ||||||||||
| Provision for loan losses | 406 | 329 | 453 | 317 | 160 | |||||||||||||||
| Noninterest income | 2,247 | 1,641 | 1,582 | 1,755 | 1,847 | |||||||||||||||
| Noninterest expense | 12,562 | 10,851 | 9,768 | 8,428 | 9,398 | |||||||||||||||
| Net income | $ | 4,441 | $ | 3,979 | $ | 3,720 | $ | 2,446 | $ | 1,968 | ||||||||||
Share Data | ||||||||||||||||||||
| Basic net income per common share | $ | 1.68 | $ | 1.53 | $ | 1.44 | $ | 0.96 | $ | 0.77 | ||||||||||
| Diluted net income per common share | $ | 1.58 | $ | 1.44 | $ | 1.38 | $ | 0.91 | $ | 0.73 | ||||||||||
| Cash dividends paid per common share | $ | 0.37 | $ | 0.35 | $ | 0.21 | $ | 0.16 | $ | 0.15 | ||||||||||
| Weighted average common shares outstanding | ||||||||||||||||||||
| Basic | 2,637,531 | 2,597,806 | 2,579,264 | 2,544,899 | 2,569,782 | |||||||||||||||
| Diluted | 2,815,985 | 2,763,616 | 2,697,030 | 2,686,571 | 2,713,913 | |||||||||||||||
Financial Condition Data | ||||||||||||||||||||
| Total assets | $ | 575,496 | $ | 541,287 | $ | 505,767 | $ | 351,730 | $ | 282,128 | ||||||||||
| Loans receivable, net | 422,480 | 369,592 | 289,325 | 217,740 | 197,449 | |||||||||||||||
| Total deposits | 418,013 | 363,374 | 266,755 | 227,555 | 203,025 | |||||||||||||||
| Long and short term debt | 102,614 | 127,899 | 198,235 | 94,242 | 48,922 | |||||||||||||||
| Total stockholders’ equity | $ | 37,729 | $ | 34,578 | $ | 31,124 | $ | 27,912 | $ | 26,873 | ||||||||||
Performance Ratios | ||||||||||||||||||||
| Return on average assets | 0.80 | % | 0.74 | % | 0.87 | % | 0.78 | % | 0.72 | % | ||||||||||
| Return on average equity | 12.12 | % | 12.11 | % | 12.89 | % | 8.99 | % | 7.50 | % | ||||||||||
| Net interest margin | 3.24 | % | 3.05 | % | 3.43 | % | 3.55 | % | 4.20 | % | ||||||||||
| Efficiency ratio | 64.18 | % | 63.04 | % | 63.50 | % | 68.95 | % | 74.73 | % | ||||||||||
| Dividend payout ratio | 21.91 | % | 23.39 | % | 14.56 | % | 17.27 | % | 20.04 | % | ||||||||||
Capital Ratios | ||||||||||||||||||||
| Average equity to average assets | 8.74 | % | 8.55 | % | 9.29 | % | 8.04 | % | 9.53 | % | ||||||||||
| Leverage ratio | 8.74 | % | 8.55 | % | 9.29 | % | 8.04 | % | 9.53 | % | ||||||||||
| Total risk-based capital ratio | 11.98 | % | 11.84 | % | 11.89 | % | 12.20 | % | 13.77 | % | ||||||||||
Asset Quality Ratios | ||||||||||||||||||||
| Allowance for loan losses to total loans | 0.89 | % | 0.91 | % | 1.04 | % | 1.16 | % | 1.15 | % | ||||||||||
| Nonperforming loans to total loans | 0.25 | % | 0.16 | % | 0.23 | % | 0.17 | % | 0.30 | % | ||||||||||
| Allowance for loan losses to nonperforming loans | 361.59 | % | 572.96 | % | 452.97 | % | 678.30 | % | 387.60 | % | ||||||||||
| Net charge-offs to average loans | 0.00 | % | 0.00 | % | -0.01 | % | 0.03 | % | 0.06 | % | ||||||||||
All per share amounts have been adjusted for the three for two stock splits which were effected in December 2004, 2005 and 2006.
13
Tri-County Financial Corporation
MARKET FOR THE REGISTRANT’S COMMON STOCK AND RELATED SECURITY HOLDER MATTERS
Market Information.The following table sets forth high and low bid quotations reported on the OTC Bulletin for the Company’s common stock for each quarter during 2006 and 2005. These quotes reflect inter-dealer prices without retail mark-up, mark-down or commission and may not necessarily reflect actual transactions. All per share amounts have been adjusted to reflect the three for two stock dividends effected in December 2005 and December 2006.
| High | Low | |||||||
2005 | ||||||||
| Fourth Quarter | $ | 22.29 | $ | 20.09 | ||||
| Third Quarter | $ | 22.22 | $ | 19.11 | ||||
| Second Quarter | $ | 19.11 | $ | 18.22 | ||||
| First Quarter | $ | 18.67 | $ | 17.37 | ||||
| High | Low | |||||||
2006 | ||||||||
| Fourth Quarter | $ | 26.67 | $ | 23.43 | ||||
| Third Quarter | $ | 24.33 | $ | 23.67 | ||||
| Second Quarter | $ | 25.67 | $ | 22.88 | ||||
| First Quarter | $ | 22.67 | $ | 21.53 | ||||
Holders.The number of stockholders of record of the Company at February 20, 2007 was 529.
Dividends.The Company has paid annual cash dividends since 1994. During fiscal years 2006 and 2005, the Company paid annual cash dividend of $0.37 and $0.35, respectively.
The Company’s ability to pay dividends is governed by the policies and regulations of the Federal Reserve Board (the “FRB”), which prohibits the payment of dividends under certain circumstances dependent on the Company’s financial condition and capital adequacy. The Company’s ability to pay dividends is also depending on the receipt of dividends from the Bank.
Federal regulations impose certain limitations on the payment of dividends and other capital distributions by the Bank. The Bank’s ability to pay dividends is governed by the Maryland Financial Institutions Code and the regulations of the FRB. Under the Maryland Financial Institutions Code, a Maryland bank (1) may only pay dividends from undivided profits or, with prior regulatory approval, its surplus in excess of 100% of required capital stock and (2) may not declare dividends on its common stock until its surplus funds equals the amount of required capital stock, or if the surplus fund does not equal the amount of capital stock, in an amount in excess of 90% of net earnings.
Without the approval of the FRB, a state member bank may not declare or pay a dividend if the total of all dividends declared during the year exceeds its net income during the current calendar year and retained net income for the prior two years. The Bank is further prohibited from making a capital distribution if it would not be adequately capitalized thereafter. In addition, the Bank may not make a capital distribution that would reduce its net worth below the amount required to maintain the liquidation account established for the benefit of its depositors at the time of its conversion to stock form.
14
Tri-County Financial Corporation
BOARD OF DIRECTORS

(seated left to right): C. Marie Brown, Executive Vice President, Chief Operating Officer; Michael L. Middleton, President and Chariman of the Board; Louis P. Jenkins, Jr., Jenkins Law Firm, LLC. (standing left to right): Herbert N. Redmond, Jr., President, D.H. Steffens Company; H. Beaman Smith, Secretary/Treasurer, President, Accoware Systems; James R. Shepherd, Business Development Specialist, Calvert County Department of Economic Development; Philip T. Goldstein, Owner, Philip T. Goldstein Real Estate Appraisals; Joseph V. Stone, Owner; Joseph Stone Insurance Agency; A. Joseph Slater, Jr., President, Southern Maryland Electric Cooperative.
15
Community Bank of Tri-County
EXECUTIVE OFFICERS

(seated): C. Marie Brown, Executive Vice President, Chief Operating Officer; Michael L. Middleton, President and Chief Executive Officer. (standing left to right): William J. Pasenelli, Executive Vice President, Chieft Financial Officer; Gregory C. Cockerham, Executive Vice President, Chief Lending Officer; James M. Burke, Executive Vice President, Credit Officer; James F. DiMisa, Executive Vice President, Operations.
BANK RISK ASSESSMENT TEAM

(seated): C. Marie Brown, Executive Vice President, Chief Operating Officer; Michael L. Middleton, President and Chief Executive Officer; Paige L. Watkins, Senior Vice President, Credit Administrator. (standing left to right): William J. Pasenelli, Executive Vice President, Chief Financial Officer; David D. Vaira, Senior Vice President, Treasurer/Cashier; Hillary P. Theriault, Assistant Vice President, Marketing Manager; James M. Burke, Executive Vice President, Credit Officer; Nancy C. Hayden, Vice President, Director of Information Technology; Rebecca J. Henderson, Vice President, Director of Branch Operations; James F. DiMisa, Executive Vice President, Operations; Gregory C. Cockerham, Executive Vice President, Chief Lending Officer.
16
Tri-County Financial Corporation
REPORT ON AUDITS OF CONSOLIDATED FINANCIAL STATEMENTS
For the Years Ended
December 31, 2006, 2005, and 2004
December 31, 2006, 2005, and 2004
17
Tri-County Financial Corporation
This Page Left Blank Intentionally
18
Tri-County Financial Corporation
TABLE OF CONTENTS
Report of Independent Registered Public Accounting Firm | 20 | |||
Consolidated Financial Statements | ||||
| Balance Sheets | 21 | |||
| Statements of Income | 22 | |||
| Statements of Changes in Stockholders’ Equity | 23 | |||
| Statement of Cash Flows | 24 | |||
Notes to Consolidated Financial Statements | 26 |
19
Tri-County Financial Corporation

REPORT OF INDEPENDENT REGISTERED PUBLIC ACCOUNTING FIRM
Board of Directors and Stockholders
Tri-County Financial Corporation
Tri-County Financial Corporation
We have audited the accompanying consolidated balance sheets of Tri-County Financial Corporation as of December 31, 2006 and 2005, and the related consolidated statements of income, changes in stockholders’ equity and cash flows for each of the three years in the period ended December 31, 2006. These consolidated financial statements are the responsibility of the Company’s management. Our responsibility is to express an opinion on these consolidated financial statements based on our audits.
We conducted our audits in accordance with the standards of the Public Company Accounting Oversight Board (United States). Those standards require that we plan and perform the audit to obtain reasonable assurance about whether the financial statements are free of material misstatement. An audit includes examining, on a test basis, evidence supporting the amounts and disclosures in the financial statements. An audit also includes assessing the accounting principles used and significant estimates made by management, as well as evaluating the overall financial statement presentation. We believe that our audits provide a reasonable basis for our opinion.
In our opinion, the consolidated financial statements referred to above present fairly, in all material respects, the consolidated financial position of Tri-County Financial Corporation as of December 31, 2006 and 2005, and the results of its consolidated operations and cash flows for each of the three years in the period ended December 31, 2006, in conformity with accounting principles generally accepted in the United States of America.

Baltimore, Maryland
March 14, 2007
March 14, 2007
20
Tri-County Financial Corporation
CONSOLIDATED BALANCE SHEETS
| December 31, | ||||||||
| 2006 | 2005 | |||||||
Assets | ||||||||
| Cash and due from banks | $ | 3,157,595 | $ | 7,262,547 | ||||
| Federal Funds sold | 772,351 | 640,818 | ||||||
| Interest-bearing deposits with banks at fair value | 14,260,560 | 14,671,875 | ||||||
| Securities available for sale | 9,301,676 | 7,178,894 | ||||||
| Securities held to maturity at amortized cost (fair value approximates $96,148,156 and $114,271,786, respectively) | 97,804,849 | 116,486,685 | ||||||
| Federal Home Loan Bank and Federal Reserve Bank stock- at cost | 6,100,400 | 7,190,300 | ||||||
| Loans receivable — net of allowance for loan losses of $3,783,721 and $3,383,334 | 422,479,799 | 369,592,253 | ||||||
| Premises and equipment, net | 6,822,461 | 6,460,545 | ||||||
| Foreclosed real estate | 460,884 | 475,561 | ||||||
| Accrued interest receivable | 2,837,413 | 2,406,542 | ||||||
| Investment in bank owned life insurance | 8,762,761 | 6,434,175 | ||||||
| Other assets | 2,735,265 | 2,487,280 | ||||||
Total Assets | $ | 575,496,014 | $ | 541,287,475 | ||||
Liabilities | ||||||||
| Deposits | ||||||||
| Noninterest- bearing | $ | 43,723,436 | $ | 44,325,083 | ||||
| Interest-bearing | 374,289,966 | 319,048,657 | ||||||
| Total deposits | 418,013,402 | 363,373,740 | ||||||
| Short-term borrowings | 6,567,702 | 20,074,975 | ||||||
| Long-term debt | 96,045,936 | 107,823,759 | ||||||
| Guaranteed preferred beneficial interest in junior subordinated debentures | 12,000,000 | 12,000,000 | ||||||
| Accrued expenses and other liabilities | 5,139,637 | 3,436,845 | ||||||
Total Liabilities | 537,766,677 | 506,709,319 | ||||||
| Commitments and contingencies (Note 11) | ||||||||
Stockholders’ equity | ||||||||
| Common stock — par value $.01; authorized - 15,000,000 shares; issued 2,642,288 and 1,760,991 shares, respectively | 26,423 | 17,610 | ||||||
| Additional paid in capital | 9,499,946 | 9,057,805 | ||||||
| Retained earnings | 28,353,792 | 25,580,634 | ||||||
| Accumulated other comprehensive (loss) income | (53,822 | ) | 49,362 | |||||
| Unearned ESOP shares | (97,002 | ) | (127,255 | ) | ||||
Total Stockholders’ Equity | 37,729,337 | 34,578,156 | ||||||
Total Liabilities and Stockholders’ Equity | $ | 575,496,014 | $ | 541,287,475 | ||||
See notes to consolidated financial statements.
21
Tri-County Financial Corporation
CONSOLIDATED STATEMENTS OF INCOME
| Years Ended December 31, | ||||||||||||
| 2006 | 2005 | 2004 | ||||||||||
Interest and Dividend Income | ||||||||||||
| Loans, including fees | $ | 29,292,419 | $ | 22,357,616 | $ | 16,033,239 | ||||||
| Taxable interest and dividends on investment securities | 6,211,393 | 6,707,913 | 5,551,943 | |||||||||
| Interest on deposits with banks | 181,924 | 89,183 | 28,157 | |||||||||
Total Interest and Dividend Income | 35,685,736 | 29,154,712 | 21,613,339 | |||||||||
Interest expense | ||||||||||||
| Deposits | 12,062,016 | 6,472,032 | 3,229,502 | |||||||||
| Short-term borrowings | 921,934 | 2,564,550 | 1,163,647 | |||||||||
| Long-term debt | 5,374,978 | 4,547,049 | 3,420,261 | |||||||||
Total Interest Expenses | 18,358,928 | 13,583,631 | 7,813,410 | |||||||||
Net interest income | 17,326,808 | 15,571,081 | 13,799,929 | |||||||||
| Provision for loan losses | 405,809 | 329,467 | 452,998 | |||||||||
Net Interest Income After Provision For Loan Losses | 16,920,999 | 15,241,614 | 13,346,931 | |||||||||
Noninterest income | ||||||||||||
| Loan appraisal, credit, and miscellaneous charges | 362,145 | 178,424 | 229,125 | |||||||||
| Net gain on sale of loans held for sale | — | — | 21,404 | |||||||||
| Income from bank owned life insurance | 328,586 | 251,220 | 261,411 | |||||||||
| Service charges | 1,359,409 | 1,186,184 | 1,189,001 | |||||||||
| Gain on sale of asset | — | 39,756 | 8,250 | |||||||||
| Gain (loss) on the sale of investment securities | 197,001 | (14,581 | ) | (61,875 | ) | |||||||
| Recognition of other than temporary decline in value of marketable securities | — | — | (65,000 | ) | ||||||||
Total Noninterest Income | 2,247,141 | 1,641,003 | 1,582,316 | |||||||||
Noninterest expenses | ||||||||||||
| Salary and employee benefits | 7,006,369 | 5,849,226 | 5,432,898 | |||||||||
| Occupancy expense | 1,316,261 | 1,156,775 | 858,891 | |||||||||
| Advertising | 474,554 | 411,811 | 539,715 | |||||||||
| Data processing expense | 821,392 | 665,981 | 550,781 | |||||||||
| Depreciation of furniture, fixtures, and equipment | 513,348 | 452,037 | 372,237 | |||||||||
| Telephone communications | 93,319 | 85,436 | 103,421 | |||||||||
| Valuation allowance on foreclosed real estate | — | — | 114,606 | |||||||||
| ATM expenses | 274,403 | 277,566 | 345,454 | |||||||||
| Office supplies | 141,144 | 138,407 | 151,862 | |||||||||
| Professional fees | 655,503 | 629,126 | 261,458 | |||||||||
| Office equipment expenses | 49,816 | 50,318 | 90,520 | |||||||||
| Other | 1,216,359 | 1,134,647 | 946,576 | |||||||||
Total Noninterest Expenses | 12,562,468 | 10,851,330 | 9,768,419 | |||||||||
| Income before income taxes | 6,605,672 | 6,031,287 | 5,160,828 | |||||||||
| Income tax expense | 2,164,415 | 2,051,944 | 1,440,994 | |||||||||
Net Income | $ | 4,441,257 | $ | 3,979,343 | $ | 3,719,834 | ||||||
Earnings per share* | ||||||||||||
| Basic | $ | 1.68 | $ | 1.53 | $ | 1.44 | ||||||
| Diluted | $ | 1.58 | $ | 1.44 | $ | 1.38 | ||||||
See notes to consolidated financial statements.
| * | Share and per share data have been retroactively adjusted to effect the three-for-two common stock splits of December 2004, 2005, and 2006 as if they had occurred January 1, 2004. |
22
Tri-County Financial Corporation
Consolidated Statements of Changes in Stockholders’ Equity
Years Ended December 31, 2006, 2005, and 2004
Years Ended December 31, 2006, 2005, and 2004
| Accumulated | ||||||||||||||||||||||||
| Other | ||||||||||||||||||||||||
| Common | Paid in | Retained | Comprehensive | Unearned | ||||||||||||||||||||
| Stock | Capital | Earnings | Income (Loss) | ESOP Shares | Total | |||||||||||||||||||
Balance at January 1, 2004 | $ | 7,533 | $ | 7,975,035 | $ | 20,071,630 | $ | (3,130 | ) | $ | (139,159 | ) | $ | 27,911,909 | ||||||||||
| Comprehensive Income | ||||||||||||||||||||||||
| Net income | 3,719,834 | 3,719,834 | ||||||||||||||||||||||
| Change in unrealized gains on investment securities net of tax of $97,503 | 189,270 | 189,270 | ||||||||||||||||||||||
Total Comprehensive Income | 3,909,104 | |||||||||||||||||||||||
| Cash dividend $0.21 per share | (541,633 | ) | (541,633 | ) | ||||||||||||||||||||
| Excess of fair market value over cost of leveraged ESOP shares released | 28,670 | 28,670 | ||||||||||||||||||||||
| Exercise of stock options | 214 | 241,261 | 241,475 | |||||||||||||||||||||
| Repurchase of common stock | (93 | ) | (412,880 | ) | (412,973 | ) | ||||||||||||||||||
| Net change in unearned ESOP shares | (24 | ) | (20,139 | ) | (20,163 | ) | ||||||||||||||||||
| 3 for 2 stock split in the form of a dividend | 3,839 | (3,839 | ) | — | ||||||||||||||||||||
| Tax effect of the exercise of non-ISO stock options | — | 7,186 | — | — | — | 7,186 | ||||||||||||||||||
Balance at December 31, 2004 | 11,469 | 8,252,152 | 22,833,112 | 186,140 | (159,298 | ) | 31,123,575 | |||||||||||||||||
| Comprehensive Income | ||||||||||||||||||||||||
| Net income | 3,979,343 | 3,979,343 | ||||||||||||||||||||||
| Change in unrealized losses on investment securities net of tax of $70,460 | (136,778 | ) | (136,778 | ) | ||||||||||||||||||||
Total Comprehensive Income | 3,842,565 | |||||||||||||||||||||||
| Cash dividend $0.35 per share | (930,669 | ) | (930,669 | ) | ||||||||||||||||||||
| Excess of fair market value over cost of leveraged ESOP shares released | 28,354 | 28,354 | ||||||||||||||||||||||
| Exercise of stock options | 231 | 259,755 | 259,986 | |||||||||||||||||||||
| Proceeds of private placement | 158 | 472,882 | 473,040 | |||||||||||||||||||||
| Net change in unearned ESOP shares | (7 | ) | 32,043 | 32,036 | ||||||||||||||||||||
| Repurchase of common stock | (60 | ) | (295,333 | ) | (295,393 | ) | ||||||||||||||||||
| 3 for 2 stock split in the form of a dividend | 5,819 | (5,819 | ) | — | ||||||||||||||||||||
| Tax effect of the exercise of non-ISO stock options | — | 44,662 | — | — | — | 44,662 | ||||||||||||||||||
Balance at December 31, 2005 | 17,610 | 9,057,805 | 25,580,634 | 49,362 | (127,255 | ) | 34,578,156 | |||||||||||||||||
| Comprehensive Income | ||||||||||||||||||||||||
| Net income | 4,441,257 | 4,441,257 | ||||||||||||||||||||||
| Change in unrealized losses on investment securities net of tax of $64,841 | (103,184 | ) | (103,184 | ) | ||||||||||||||||||||
Total Comprehensive Income | 4,338,073 | |||||||||||||||||||||||
| Cash dividend $0,37 per share | (972,966 | ) | (972,966 | ) | ||||||||||||||||||||
| Excess of fair market value over cost of leveraged ESOP shares released | 43,306 | 43,306 | ||||||||||||||||||||||
| Exercise of stock options | 163 | 155,959 | 156,122 | |||||||||||||||||||||
| Proceeds of private placement | 50 | 177,450 | 177,500 | |||||||||||||||||||||
| Net change in unearned ESOP shares | (5 | ) | 30,253 | 30,248 | ||||||||||||||||||||
| Repurchase of common stock | (200 | ) | (686,328 | ) | (686,528 | ) | ||||||||||||||||||
| 3 for 2 stock split in the form of a dividend | 8,805 | (8,805 | ) | — | ||||||||||||||||||||
| Tax effect of the ESOP dividend | 23,111 | 23,111 | ||||||||||||||||||||||
| Tax effect of the exercise of non-ISO stock options | — | 42,315 | — | — | — | 42,315 | ||||||||||||||||||
Balance at December 31, 2006 | $ | 26,423 | $ | 9,499,946 | $ | 28,353,792 | $ | (53,822 | ) | $ | (97,002 | ) | $ | 37,729,337 | ||||||||||
All per share amounts have been adjusted for the three for two stock splits, which were effected in December 2004, 2005, and 2006.
23
Tri-County Financial Corporation
CONSOLIDATED STATEMENTS OF CASH FLOWS
FOR THE YEARS ENDED DECEMBER 31, 2006, 2005, AND 2004
| 2006 | 2005 | 2004 | ||||||||||
Cash Flows From Operating Activities | ||||||||||||
| Net income | $ | 4,441,257 | $ | 3,979,343 | $ | 3,719,834 | ||||||
| Adjustments to reconcile net income to net cash provided by operating activities: | ||||||||||||
| Valuation allowance on foreclosed real estate | — | — | 114,606 | |||||||||
| Provision for loan losses | 405,809 | 329,467 | 452,998 | |||||||||
| (Gain) loss on sales of investment securities | (197,000 | ) | 14,581 | 61,875 | ||||||||
| Recognition of other than temporary decline in value of marketable securities | — | — | 65,000 | |||||||||
| Depreciation and amortization | 1,001,638 | 811,866 | 636,711 | |||||||||
| Net amortization of premium/discount on mortgage backed securities and investments | 27,749 | 341,858 | 116,256 | |||||||||
| Excess tax benefits on stock-based compensation | (42,315 | ) | — | — | ||||||||
| Increase in cash surrender of bank owned life insurance | (328,586 | ) | (251,220 | ) | (261,411 | ) | ||||||
| Deferred income tax (benefit) expense | (412,681 | ) | (452,351 | ) | 65,850 | |||||||
| Increase in accrued interest receivable | (430,871 | ) | (536,407 | ) | (551,817 | ) | ||||||
| (Increase) decrease in deferred loan fees | (113,379 | ) | (160,660 | ) | 114,618 | |||||||
| Increase in accrued expenses and other liabilities | 1,801,223 | 783,124 | 349,818 | |||||||||
| Decrease in other assets | 161,737 | 386,834 | 906,843 | |||||||||
| Loss (gain) on disposal of premises and equipment | — | 36,216 | (8,250 | ) | ||||||||
| Proceeds from sale of loans held for sale | — | — | 496,284 | |||||||||
| Loss (gain) on sale of other real estate owned | — | (39,756 | ) | 32,597 | ||||||||
| Gain on sales of loans held for sale | — | — | (21,404 | ) | ||||||||
Net Cash Provided by Operating Activities | 6,314,581 | 5,242,895 | 6,290,408 | |||||||||
Cash Flows From Investing Activities | ||||||||||||
| Purchase of investment securities available for sale | (3,127,695 | ) | (9,655 | ) | (27,944,571 | ) | ||||||
| Proceeds from sale, redemption or principal payments of investment securities available for sale | 1,033,358 | 5,540,515 | 53,031,692 | |||||||||
| Purchase of investment securities held to maturity | (5,100,000 | ) | (25,749,248 | ) | (143,349,900 | ) | ||||||
| Proceeds from maturities or principal payments of investment securities held to maturity | 23,766,300 | 71,679,258 | 42,511,543 | |||||||||
| Net sale (purchase) of FHLB and Federal Reserve stock | 1,089,900 | (1,046,000 | ) | (1,367,450 | ) | |||||||
| Loans originated or acquired | (181,343,309 | ) | (202,475,708 | ) | (192,785,961 | ) | ||||||
| Principal collected on loans | 128,163,333 | 122,039,699 | 120,633,447 | |||||||||
| Purchase of premises and equipment | (1,363,554 | ) | (1,296,714 | ) | (1,068,435 | ) | ||||||
| Proceeds from disposal of premises and equipment | — | — | 8,250 | |||||||||
| Purchase of bank owned life insurance policies | (2,000,000 | ) | — | — | ||||||||
| Proceeds of sale of foreclosed real estate | 14,677 | 39,756 | 91,597 | |||||||||
Net Cash Used in Investing Activities | (38,866,990 | ) | (31,278,097 | ) | (150,239,788 | ) | ||||||
24
Tri-County Financial Corporation
CONSOLIDATED STATEMENTS OF CASH FLOWS
FOR THE YEARS ENDED DECEMBER 31, 2006, 2005, AND 2004
FOR THE YEARS ENDED DECEMBER 31, 2006, 2005, AND 2004
| 2006 | 2005 | 2004 | ||||||||||
Cash Flows From Financing Activities | ||||||||||||
| Net increase in deposits | 54,639,662 | 96,619,236 | 39,199,936 | |||||||||
| Net increase (decrease) in short-term borrowings | (13,507,273 | ) | (95,229,235 | ) | 84,112,925 | |||||||
| Dividends paid | (972,966 | ) | (930,669 | ) | (541,633 | ) | ||||||
| Exercise of stock options | 156,122 | 304,648 | 248,661 | |||||||||
| Excess tax benefits on stock-based compensation | 42,315 | — | — | |||||||||
| Proceeds from private placement | 177,500 | 473,040 | — | |||||||||
| Net change in unearned ESOP shares | 96,665 | 60,390 | 8,508 | |||||||||
| Repurchase of common stock | (686,528 | ) | (295,393 | ) | (412,973 | ) | ||||||
| Proceeds from long-term borrowings | 15,260,000 | 30,000,000 | 30,000,000 | |||||||||
| Payments of long-term borrowings | (27,037,822 | ) | (5,107,354 | ) | (10,120,063 | ) | ||||||
| Trust preferred debentures | — | 5,000,000 | 7,000,000 | |||||||||
Net Cash Provided by Financing Activities | 28,167,675 | 30,894,663 | 149,495,361 | |||||||||
(Decrease) Increase in Cash and Cash Equivalents | (4,384,734 | ) | 4,859,461 | 5,545,981 | ||||||||
Cash and Cash Equivalents at Beginning of Year | 22,575,240 | 17,715,779 | 12,169,798 | |||||||||
Cash and Cash Equivalents at End of Year | $ | 18,190,506 | $ | 22,575,240 | $ | 17,715,779 | ||||||
Supplementary Cash Flow Information | ||||||||||||
| Cash paid during the year for | ||||||||||||
| Interest | $ | 18,057,377 | $ | 13,503,581 | $ | 7,784,244 | ||||||
| Income taxes | 2,567,400 | 2,032,500 | 1,232,500 | |||||||||
See notes to consolidated statements.
25
Notes To Consolidated Financial Statements
NOTE 1 — SUMMARY OF SIGNIFICANT ACCOUNTING POLICIES
Principles of Consolidation
The consolidated financial statements include the accounts of Tri-County Financial Corporation and its wholly owned subsidiaries, Community Bank of Tri-County (the “Bank”), Tri-County Capital Trust I, and Tri-County Capital Trust II, and the Bank’s wholly owned subsidiaries, Tri-County Investment Corporation and Community Mortgage Corporation of Tri-County (collectively, the “Company”). All significant intercompany balances and transactions have been eliminated in consolidation. The accounting and reporting policies of the Company conform with accounting principles generally accepted in the United States of America and to general practices within the banking industry. Certain reclassifications have been made to amounts previously reported to conform with classifications made in 2006.
Nature of Operations
The Company provides a variety of financial services to individuals and small businesses through its offices in southern Maryland. Its primary deposit products are demand, savings, and time deposits and its primary lending products are consumer and commercial mortgage loans, construction loans, and commercial loans.
Use of Estimates
In preparing consolidated financial statements in conformity with accounting principles generally accepted in the United States of America, management is required to make estimates and assumptions that affect the reported amounts of assets and liabilities as of the date of the balance sheet and reported amounts of revenues and expenses during the reporting period. Actual results could differ from those estimates. Material estimates that are particularly susceptible to significant change in the near term relate to the determination of the allowance for loan losses, the valuation of foreclosed real estate, and deferred tax assets.
Significant Group Concentrations of Credit Risk
Most of the company’s activities are with customers located in the Southern Maryland area comprising St. Mary’s, Charles, and Calvert counties. Note 3 discusses the types of securities held by the Company. Note 4 discusses the type of lending in which the Company is engaged. The Company does not have any significant concentration to any one customer or industry.
Cast and Cash Equivalents
For purposes of the consolidated statements of cash flows, the Company considers all highly liquid debt instruments with original maturities of three months or less when purchased to be cash equivalents.
Securities
Debt securities that management has the positive intent and ability to hold to maturity are classified as “held to maturity” and recorded at amortized cost. Securities not classified as held to maturity or trading, including equity securities with readily determinable fair values are classified as “available for sale” and recorded at estimated fair value, with unrealized gains and losses excluded from earnings and reported in other comprehensive income.
Purchase premiums and discounts are recognized in interest income using the interest method over the terms of the securities. Declines in the estimated fair value of held to maturity and available for sale securities below their cost that are deemed to be other than temporary are reflected in earnings as realized losses. In estimating other than temporary impairment losses, management considers (1) the length of time and the extent to which the fair value has been less than cost, (2) the financial condition and near term prospects of the issuer, and (3) the intent and ability of the Company to retain its investment in the issuer for a period of time sufficient to allow for any anticipated recovery in fair value. Gains and losses on the sale of securities are recorded on the trade date and are determined using the specific identification method. Investment in Federal Reserve Bank and Federal Home Loan Bank of Atlanta stock are recorded at cost and are considered restricted as to marketability. The Bank is required to maintain investments in the Federal Reserve Bank and Federal Home Loan Bank based upon levels of financial activity.
Loans Held for Sale
Loans originated and intended for sale in the secondary market are carried at the lower of cost or estimated fair value, in the aggregate. Net unrealized losses, if any, are recognized through a valuation allowance by charges to income.
26
Tri-County Financial Corporation
Mortgage loans held for sale are generally sold with the mortgage servicing rights retained by the Company. The carrying value of mortgage loans sold is reduced by the cost allocated to the associated servicing rights. Gains or losses on sales of mortgage loans are recognized based on the difference between the selling price and the carrying value of the related mortgage loans sold, using the specific identification method.
Loans Receivable
The Company originates mortgage, commercial, and consumer loans to customers. A substantial portion of the loan portfolio is represented by loans throughout southern Maryland. The ability of the Company’s debtors to honor their contracts is dependent upon the real estate and general economic conditions in this area.
Loans that management has the intent and ability to hold for the foreseeable future or until maturity or payoff are reported at their outstanding unpaid principal balances adjusted for the allowance for loan losses and any deferred fees or costs on originated loans. Interest income is accrued on the unpaid principal balance. Loan origination fees, net of certain direct origination costs, are deferred and recognized as an adjustment of the related loan yield using the interest method.
The accrual of interest on mortgage and commercial loans is discontinued at the time the loan is 90 days delinquent unless the credit is well secured and in the process of collection. Consumer loans are charged-off no later than 180 days past due. In all cases, loans are placed on non-accrual or charged-off at an earlier date if collection of principal or interest is considered doubtful.
All interest accrued but not collected from loans that are placed on non-accrual or charged-off is reversed against interest income. The interest on these loans is accounted for on the cash-basis or cost-recovery method, until qualifying for return to accrual. Loans are returned to accrual status when all principal and interest amounts contractually due are brought current and future payments are reasonably assured.
Allowance for Loan Losses
The allowance for loan losses is established as losses are estimated to have occurred through a provision for loan losses charged to earnings. Loan losses are charged against the allowance when management believes that the uncollectibility of a loan balance is confirmed. Subsequent recoveries, if any, are credited to the allowance.
The allowance for loan losses is evaluated on a regular basis by management and is based upon management’s periodic review of the collectibility of the loans in light of historical experience, the size and composition of the loan portfolio, adverse situations that may affect the borrower’s ability to repay, estimated value of any underlying collateral, and prevailing economic conditions. This evaluation is inherently subjective as it requires estimates that are susceptible to significant revision as more information becomes available.
The allowance for loan losses consists of a specific component and a general component. The specific component relates to loans that are classified as either doubtful, substandard, or special mention. For such loans that are also classified as impaired, an allowance is established when the discounted cash flows (or collateral value or observable market price) of the impaired loan is lower than carrying value of that loan. The general component covers the non-classified loans and is based on historical loss experience, peer group comparisons, industry data and loss percentages used for similarly graded loans adjusted for qualitative factors.
A loan is considered impaired when, based on current information and events, it is probable that the Company will be unable to collect the scheduled payments of principal or interest when due according to the contractual terms of the loan agreement. Factors considered by management in determining impairment include payment status, collateral value, and the probability of collecting scheduled principal and interest payments when due. Loans that experience insignificant payment delays and payment shortfalls generally are not classified as impaired. Management determines the significance of payment delays and payment shortfalls on a case-by-case basis, taking into consideration all of the circumstances surrounding the loan and the borrower, including the length of the delay, the reasons for the delay, the borrower’s prior payment record, and the amount of the shortfall in relation to the principal and interest owed. Impairment is measured on a loan by loan basis for commercial and construction loans by either the present value of expected future cash flows discounted at the loan’s effective interest rate, the loan’s observable market price, or the fair value of the collateral if the loan is collateral dependent.
27
Notes To Consolidated Financial Statements
Large groups of smaller homogeneous loans are collectively evaluated for impairment. Accordingly, the Company does not separately identify individual consumer and residential loans for impairment disclosures, unless such loans are the subject of a restructuring agreement.
Servicing
Servicing assets are recognized as separate assets when rights are acquired through purchase or through the sale of financial assets. Generally, purchased servicing rights are capitalized at the cost to acquire the rights. For sales of mortgage loans, a portion of the cost of originating the loan is allocated to the servicing based on relative estimated fair value. Estimated fair value is based on market prices for comparable mortgage servicing contracts, when available, or alternatively, is based on a valuation model that calculates the present value of estimated future net servicing. The valuation model incorporates assumptions that market participants would use in estimating future net servicing income, such as the cost to service, the discount rate, an inflation rate, ancillary income, prepayment speeds, and default rates and losses. Capitalized servicing rights are reported in other assets and are amortized into noninterest income in proportion to, and over the period of, the estimated future net servicing income of the underlying financial assets.
Servicing assets are evaluated for impairment based upon the estimated fair value of the rights as compared to amortized cost. Impairment is determined by stratifying rights into tranches based on predominant risk characteristics, such as interest rate, loan type, and investor type. Impairment is recognized through a valuation allowance for an individual tranche, to the extent that fair value is less than the capitalized amount for the tranche. If the Company later determines that all or a portion of the impairment no longer exists for a particular tranche, a reduction of the allowance may be recorded as an increase to income.
Servicing fee income is recorded for fees earned for servicing loans. The fees are based on a contractual percentage of the outstanding principal; or a fixed amount per loan and recorded as income when earned. The amortization of mortgage servicing rights is netted against loan servicing fee income.
Premises and Equipment
Land is carried at cost. Premises and improvements and equipment are carried at cost, less accumulated depreciation and amortization computed by the straight-line method over the estimated useful lives of the assets, which are as follows
| Buildings and improvements | 10 - 50 years | |
| Furniture and equipment | 3-15 years | |
| Automobiles | 5 years |
Maintenance and repairs are charged to expense as incurred while improvements that extend the useful life of premises and equipment are capitalized.
Foreclosed Real Estate
Assets acquired through, or in lieu of, loan foreclosure are held for sale and are initially recorded at the lower of cost or estimated fair value at the date of foreclosure, establishing a new cost basis. Subsequent to foreclosure, valuations are periodically performed by management and the assets are carried at the lower of carrying amount or estimated fair value less cost to sell. Revenue and expenses from operations and changes in the valuation allowance are included in noninterest expense.
Transfers of Financial Assets
Transfers of financial assets are accounted for as sales, when control over the assets has been surrendered. Control over transferred assets is deemed to be surrendered when (1) the assets have been isolated from the Company, (2) the transferee obtains the right (free of conditions that constrain it from taking advantage of that right) to pledge or exchange the transferred assets, and (3) the Company does not maintain effective control over the transferred assets through an agreement to repurchase them before their maturity.
Advertising Costs
The Company expenses advertising costs as incurred.
28
Tri-County Financial Corporation
Income Taxes
The Company files a consolidated federal income tax return with its subsidiaries. Deferred tax assets and liabilities are determined using the liability (or balance sheet) method. Under this method, the net deferred tax asset or liability is determined based on the tax effects of the temporary differences between the book and tax bases of the various balance sheet assets and liabilities and gives current recognition to changes in tax rates and laws.
Off Balance Sheet Credit Related Financial Instruments
In the ordinary course of business, the Company has entered into commitments to extend credit, including commitments under commercial lines of credit, letters of credit, and standby letters of credit. Such financial instruments are recorded when they are funded.
Stock-Based Compensation
The Company has stock option and incentive plans to attract and retain key personnel in order to promote the success of the business. These plans are more fully described in Note 12.
Effective January 1, 2006, the Company adopted SFAS No. 123(R), “Share-Based Payment” (“SFAS No. 123(R)”). This statement replaced SFAS No. 123, “Accounting for Stock-based Compensation” and superseded APB No. 25. SFAS No. 123(R) requires that all stock-based compensation be recognized as an expense in the financial statements and that such cost be measured at the fair value of the award. This statement was adopted using the modified prospective method of application, which requires the Company to recognize compensation expense on a prospective basis. Therefore, prior period financial statements have not been restated. Under this method, in addition to reflecting compensation expense for new share-based awards, expense is also recognized to reflect the remaining service period of outstanding awards that had been included in pro forma disclosures in prior periods. As of December 31, 2005, all outstanding options were fully vested, so no expense will be recognized for options outstanding as of that date. SFAS No. 123(R). Prior to 2006, the Company applied the intrinsic value method as outlined in Accounting Principles Board Opinion No. 25, “Accounting for Stock Issued to Employees” (“APB No. 25”) and related interpretations in accounting for stock options granted. Under the intrinsic value method, no compensation expense was recognized if the exercise price of the Company’s employee stock options equaled the market price of the underlying stock on the date of the grant. Accordingly, no compensation cost was recognized in the accompanying consolidated statements of earnings prior to 2006 on stock options granted to employees or directors, since all options granted under the Company’s incentive programs had an exercise price equal to the market value of the underlying common stock on the date of grant.
The Company and the Bank currently maintain incentive plans which provide for payments to be made in either cash or stock options. The Company has accrued the full amounts due under these plans, but currently it is not possible to identify the portion that will be paid out in the form of stock options.
Earnings Per Common Share
Basic earnings per common share represents income available to common stockholders divided by the weighted average number of common shares outstanding during the period. Diluted earnings per share reflects additional common shares that would have been outstanding if dilutive potential common shares had been issued, as well as any adjustment to income that would result from the assumed issuance. Potential common shares that may be issued by the Company relate solely to outstanding stock options and are determined using the treasury stock method. In 2005 and 2004 there were 59,526 and 69,407 options with an exercise price that exceeded the respective market price, which were excluded from the calculation as their effect would be anti-dilutive. No options were anti-dilutive as of December 31, 2006.
Earnings per common share have been computed based on the following:
| Years Ended December 31, | ||||||||||||
| 2006 | 2005 | 2004 | ||||||||||
| Net income | $ | 4,441,256 | $ | 3,979,343 | $ | 3,719,834 | ||||||
| Average number of common shares outstanding | 2,637,531 | 2,597,807 | 2,579,264 | |||||||||
| Effect of dilutive options | 178,454 | 165,809 | 117,768 | |||||||||
| Average number of shares used to calculate earnings per share outstanding | 2,815,985 | 2,763,616 | 2,697,032 | |||||||||
29
Notes to Consolidated Financial Statements
The numbers of common shares outstanding have been adjusted to give retroactive effect to the three for two stock splits in December 2004, 2005, and 2006.
Comprehensive Income
Accounting principles generally require that recognized revenue, expenses, gains, and losses be included in net income. Although certain changes in assets and liabilities, such as unrealized gains and losses on available for sale securities, are reported as a separate component of the equity section of the balance sheet, such items, along with net income, are components of comprehensive income.
The components of other comprehensive income and related tax effects are as follows
| Years Ended December 31, | |||||||||||||
| 2006 | 2005 | 2004 | |||||||||||
| Net income | $ | 4,441,257 | $ | 3,979,343 | $ | 3,719,834 | |||||||
| Other comprehensive income items | |||||||||||||
| Unrealized holding gains (losses) on available for sale securities net of tax expense (benefit) of $9,136, $(75,419), and $74,465, respectively | 17,735 | (146,110 | ) | 148,473 | |||||||||
| Plus: Reclassification adjustment for (gains) losses net of tax (provision) benefit of ($76,082), $5,249 and $21,038, respectively | (120,919 | ) | 9,332 | 40,797 | |||||||||
| Total other comprehensive income | (103,184 | ) | (136,778 | ) | 189,270 | ||||||||
Total Comprehensive Income | $ | 4,338,073 | $ | 3,842,565 | $ | 3,909,104 | |||||||
Recent Accounting Pronouncements
In February 2006, the Financial Accounting Standards Board (FASB) issued SFAS No. 155, “Accounting for Certain Hybrid Financial Instruments” which amends SFAS No. 133 “Accounting for Derivative Instruments and Hedging Activities” and SFAS No. 140, “Accounting for Transfers and Servicing of Financial Assets and Extinguishments of Liabilities.” SFAS 155 simplifies the accounting for certain derivative embedded in other financial instruments by allowing them to be accounted for as a whole if the holder elects to account for the whole instrument on a fair value basis. SFAS 155 also clarifies and amends certain other provisions of SFAS 133 and SFAS 140. SFAS 155 is effective for all financial instruments acquired, issued or subject to a re-measurement event occurring in fiscal years beginning after September 15, 2006. Earlier adoption is permitted, provided the Company has not yet issued financial statements, including for interim periods, for that fiscal year. Management does not expect the adoption of SFAS 155 to have a material impact on the consolidated financial statements.
In March 2006, the FASB issued SFAS No. 156, “Accounting for Servicing of Financial Assets- an amendment of FASB Statement No. 140.” This statement amends Statement No. 140 with respect to the accounting for separately recognized servicing assets and servicing liabilities. It requires an entity to recognize a servicing asset or servicing liability each time an obligation is undertaken to service a financial asset by entering into a servicing contract in certain situations and requires all separately recognized servicing assets and liabilities to be initially measured at fair value, if practicable. The statement permits the choice between the “amortization method” and the “fair value measurement method” for subsequent measurement of the servicing assets or liabilities and allows for a one-time reclassification of available-for-sale securities to trading securities at initial adoption. The statement also requires separate presentation of servicing assets and servicing liabilities subsequently measured at fair value in the statement of financial position and additional disclosures for all separately recognized servicing assets and servicing liabilities. The statement is effective for fiscal years beginning after September 15, 2006. The adoption of this statnadard is not anticipated to have a material impact on our financial condition, results of operations, or liquidity.
In June 2006, the Financial Accounting Standards Board (“FASB”) issued Interpretation (“FIN”) No. 48, “Accounting for Uncertainty in Income Taxes — an interpretation of FASB Statement No. 109.” This Interpretation prescribes a recognition threshold and measurement attribute for the financial statement recognition and measurement of a tax position taken, or expects to be taken in a tax return, and provides guidance on derecognition, classification, interest and penalties, accounting in interim periods, disclosure, and transition. This Interpretation is effective for fiscal years beginning after December 15, 2006. Management does not expect the adoption of (“FIN”) No. 48 to have a material impact on the consolidated financial statements.
In June 2006, the FASB ratified Emerging Issues Task Force (“EITF) No. 06-2, “Accounting for Sabbatical Leave and Other Similar
30
Tri-County Financial Corporation
Benefits Pursuant to FASB Statement No. 43, Accounting for Compensated Absences (‘SAFS 43’) (“EITF 06-2”). EITF 06-2 provides guidelines under which sabbatical leave or other similar benefits provided to an employee are considered to accumulate, as defined in SFAS 43. If such benefits are deemed to accumulate, then the compensation cost associated with a sabbatical or other similar benefit arrangement should be accrued over the requisite service period. The provisions of the EITF are effective for fiscal years beginning after December 15, 2006 and allow for either retrospective application or a cumulative effect adjustment approach upon adoption. Management does not expect the adoption of (“EITF 06—2”) to have a material impact on the consolidated financial statements.
In September 2006, the FASB issued SFAS 157, Fair Value Measurements. SFAS 157 defines fair value, establishes a framework for measuring fair value in generally accepted accounting principles, and expands disclosures about fair value measurements. SFAS 157 applies to existing accounting pronouncements that require or permit fair value measurements in which FASB had previously concluded fair value is the most relevant measurement attribute. Accordingly, SFAS 157 does not require any new fair value measurements. SFAS 157 is effective for financial statements issued for fiscal years beginning after November 15, 2007, with early adoption encouraged. The Company is currently evaluating the impact the adoption of this interpretation will have on its financial condition and results of operations.
In September 2006, the FASB issued SFAS 158, Employers’ Accounting for Defined Benefit Pension and Other Postretirement Plans — an amendment of FASB Statements No. 87, 88, 106 and 132(R). SFAS 158 requires an employer to recognize the funded status of a defined benefit postretirement plan as an asset or liability in its statement of financial position and to recognize changes in that funded status in the year in which the changes occur through comprehensive income. A public entity is required to initially recognize the funded status of a defined benefit postretirement plan and to provide the required disclosures as of the end of the first fiscal year ending after December 15, 2006. Management does not believe the adoption of this standard will have a material impact on the financial condition or the results of operations of the Company.
In September 2006, the FASB ratified the consensus reached by the EITF on Issue No. 06-4,Accounting for Deferred Compensation and Postretirement Benefit Aspects of Endorsement Split-Dollar Life Insurance Arrangements.EITF 06-4 requires the recognition of a liability and related compensation costs for endorsement split-dollar life insurance policies that provide a benefit to an employee that extends to postretirement periods as defined in SFAS No. 106,Employers’ Accounting for Postretirement Benefits Other Than Pensions. The EITF reached a consensus that Bank Owned Life Insurance policies purchased for this purpose do not effectively settle the entity’s obligation to the employee in this regard and, thus, the entity must record compensation costs and a related liability. Entities should recognize the effects of applying this Issue through either, (a) a change in accounting principle through a cumulative-effective adjustment to retained earnings or to other components of equity or net assets in the balance sheet as of the beginning of the year of adoption, or (b) a change in accuonting principle through retrospective application to all prior periods. This Issue is effective for fiscal years beginning after December 15, 2007. Management is currently evaluating the impact of adopting this Issue on the Company’s financial statements.
Staff Accounting Bulletin (SAB) 108, Considering the Effects of Prior Year Misstatements when Quantifying Misstatements in Current Year Financial Statements. SAB 108 addresses how the effects of prior year uncorrected errors must be considered in quantifying misstatements in the current year financial statements. The effects of prior year uncorrected errors include the potential accumulation of improper amounts that may result in a material misstatement on the balance sheet or the reversal of prior period errors in the current period that result in a material misstatement of the current period income statement amounts. Adjustments to current or prior period financial statements would be required in the event that after application of various approaches for assessing materiality of a misstatement in current period financial statements and consideration of all relevant quantitative and qualitative factors, a misstatement is determined to be material. SAB 108 is applicable to all financial statements issued by the Corporation after November 15, 2006.
NOTE 2 — RESTRICTIONS ON CASH AND AMOUNTS DUE FROM BANK
The Bank is required to maintain average balances on hand or with the Federal Reserve Bank. At December 31, 2006 and 2005, these reserve balances amounted to $847,000 and $4,359,000, respectively.
31
Notes to Consolidated Financial Statements
NOTE 3 — INVESTMENT SECURITIES
| December 31, 2006 | ||||||||||||||||
| Gross | Gross | |||||||||||||||
| Amortized | Unrealized | Unrealized | Estimated Fair | |||||||||||||
| Cost | Gains | Losses | Value | |||||||||||||
Securities Available for Sale | ||||||||||||||||
| Asset-backed securities issued by GSEs | $ | 5,882,361 | $ | 22,429 | $ | 206,930 | $ | 5,697,860 | ||||||||
| Corporate equity securities | 254,810 | 86,873 | — | 341,683 | ||||||||||||
| Bond mutual funds | 3,246,054 | 18,173 | 2,094 | 3,262,133 | ||||||||||||
Total Securities Available for Sale | $ | 9,383,225 | $ | 127,475 | $ | 209,024 | $ | 9,301,676 | ||||||||
Securities Held-to-Maturity | ||||||||||||||||
| Asset-backed securities issued by | ||||||||||||||||
| GSEs | $ | 66,904,325 | $ | 208,890 | $ | 1,716,038 | $ | 65,397,177 | ||||||||
| Other | 29,955,894 | 211,181 | 360,726 | 29,806,349 | ||||||||||||
Total Debt Securities Held-to-Maturity | 96,860,219 | 420,071 | 2,076,764 | 95,203,526 | ||||||||||||
| U.S. government obligations | 800,000 | — | — | 800,000 | ||||||||||||
| Other investments | 144,630 | — | — | 144,630 | ||||||||||||
Total Securities Held-to-Maturity | $ | 97,804,849 | $ | 420,071 | $ | 2,076,764 | $ | 96,148,156 | ||||||||
| December 31, 2005 | ||||||||||||||||
| Gross | Gross | |||||||||||||||
| Amortized | Unrealized | Unrealized | Estimated Fair | |||||||||||||
| Cost | Gains | Losses | Value | |||||||||||||
Securities Available for Sale | ||||||||||||||||
| Asset-backed securities issued by GSEs | $ | 6,494,335 | $ | 42,077 | $ | 203,717 | $ | 6,332,695 | ||||||||
| Corporate equity securities | 481,010 | 239,338 | 1,000 | 719,348 | ||||||||||||
| Bond mutual funds | 128,756 | — | 1,905 | 126,851 | ||||||||||||
Total Securities Available for Sale | $ | 7,104,101 | $ | 281,415 | $ | 206,622 | $ | 7,178,894 | ||||||||
Securities Held-to-Maturity | ||||||||||||||||
| Asset-backed securities issued by | ||||||||||||||||
| GSEs | $ | 78,001,293 | $ | 182,831 | $ | 1,777,533 | $ | 76,406,591 | ||||||||
| Other | 37,382,662 | 53,007 | 673,204 | 36,762,465 | ||||||||||||
| Total Debt Securities Held-to-Maturity | 115,383,955 | 235,838 | 2,450,737 | 113,169,056 | ||||||||||||
| U.S. government obligations | 499,091 | — | — | 499,091 | ||||||||||||
| Other investments | 603,639 | — | — | 603,639 | ||||||||||||
Total Securities Held-to-Maturity | $ | 116,486,685 | $ | 235,838 | $ | 2,450,737 | $ | 114,271,786 | ||||||||
Other investments consist of certain certificate of deposit strip instruments whose fair value is based on market returns on similar risk and maturity instruments because no active market exists for these instruments. At December 31, 2006, U.S. government obligations with a carrying value of $800,000 were pledged to secure municipal deposits. In addition, at December 31, 2006, certain other securities with a carrying value of $7,100,000 were pledged to secure certain deposits. At December 31, 2006, securities with a carrying value of $92,911,006 were pledged as collateral for advances from the Federal Home Loan Bank of Atlanta.
32
Tri-County Financial Corporation
Gross unrealized losses and estimated fair value by length of time that the individual, available-for-sale securities have been in a continuous unrealized loss position at December 31, 2006 are as follows
| Continuous unrealized losses existing for | ||||||||||||||||
| Total | ||||||||||||||||
| Less Than | More Than | unrealized | ||||||||||||||
| Fair Value | 12 Months | 12 Months | Losses | |||||||||||||
| Asset-backed securities issued by GSEs | $ | 5,150,991 | $ | — | $ | 206,930 | $ | 206,930 | ||||||||
| Bond mutual funds | 94,893 | — | 2,094 | 2,094 | ||||||||||||
| $ | 5,245,884 | $ | — | $ | 209,024 | $ | 209,024 | |||||||||
The available-for-sale investment portfolio has a fair value of $9,301,676 of which $5,245,884 of the securities have some unrealized losses from their amortized cost. Of these securities, $5,150,991, or 98%, are mortgage-backed securities issued by GSEs and $94,893, or 2%, are short duration mutual fund shares. The unrealized losses that exist in the mortgage-backed securities and mutual fund shares are the result of market changes in interest rates since the original purchase.
The mutual fund shares have a modest duration and are backed by one year adjustable-rate mortgage-backed securities. The asset-backed securities have an average duration of 3.3 years and are guaranteed by their issuer as to credit risk. Total unrealized losses on these investments are small (approximately 4%). Persistent losses may require a re-evaluation of these losses. These factors coupled with the fact the Company has both the intent and ability to hold these investments for a period of time sufficient to allow for any anticipated recovery in fair value substantiates that the unrealized losses in the available-for-sale portfolio are temporary.
Gross unrealized losses and estimated fair value by length of time that the individual held-to-maturity securities have been in a continuous unrealized loss position at December 31, 2006 are as follows
| Continuous unrealized losses existing for | ||||||||||||||||
| Total | ||||||||||||||||
| Less Than | More Than | unrealized | ||||||||||||||
| Fair Value | 12 Months | 12 Months | Losses | |||||||||||||
| Asset-backed securities issued by GSEs | $ | 49,193,723 | $ | 1,450 | $ | 1,714,588 | $ | 1,716,038 | ||||||||
| Asset-backed securities issued by other | 16,072,622 | — | 360,726 | 360,726 | ||||||||||||
| $ | 65,266,345 | $ | 1,450 | $ | 2,075,314 | $ | 2,076,764 | |||||||||
The held-to-maturity investment portfolio has an estimated fair value of $96,148,156 of which $65,266,345 of the securities have some unrealized losses from their purchase price. Of these securities, $49,193,723 or 75%, are mortgage-backed securities issued by GSEs and the remainder, or $16,072,622, are mortgage-backed securities issued by others. The asset-backed securities have a duration of approximately four years, are guaranteed as to payment by the issuer, and have minimal losses compared to carrying value (approximately 3%). The unrealized losses that exist are the result of market changes in interest rates since the original purchase. These factors coupled with the Company’s intent and ability to hold these investments for a period of time sufficient to allow for any anticipated recovery in fair value substantiates that the unrealized losses in the held-to-maturity portfolio are temporary.
The amortized cost and estimated fair value of debt securities at December 31, 2006, by contractual maturity, are shown below. Expected maturities will differ from contractual maturities because the issuers of the securities may have the right to prepay obligations without prepayment penalties.
33
Notes to Consolidated Financial Statements
| Available for Sale | Held to Maturity | |||||||||||||||
| Amortized | Estimated | Amortized | Estimated | |||||||||||||
| Cost | Fair Value | Cost | Fair Value | |||||||||||||
| Within one year | $ | 3,246,054 | $ | 3,262,133 | $ | 811,078 | $ | 811,078 | ||||||||
| Over one year through five years | — | — | 133,552 | 133,552 | ||||||||||||
| Over five years through ten years | — | — | — | — | ||||||||||||
| 3,246,054 | 3,262,133 | 944,630 | 944,630 | |||||||||||||
| Mortgage-backed securities | 6,137,171 | 6,039,543 | 96,860,219 | 95,203,526 | ||||||||||||
| $ | 9,383,225 | $ | 9,301,676 | $ | 97,804,849 | $ | 96,148,156 | |||||||||
Total sales of investments available for sale during 2006, 2005, and 2004 were $226,199, $1,350,000, and $36,900,000, these sales produced a net gain (loss) of $197,001, $(14,582), and $(61,875). Asset-backed securities are comprised of mortgage-backed securities as well as mortgage-derivative securities such as collateralized mortgage obligations and real estate mortgage investment conduits.
NOTE 4 — LOANS RECEIVABLE AND ALLOWANCE FOR LOAN LOSSES
A summary of the balances of loans are as follows
| 2006 | 2005 | |||||||
| Commercial real estate | $ | 177,923,349 | $ | 166,850,838 | ||||
| Residential first mortgages | 80,781,271 | 73,627,717 | ||||||
| Construction and land development | 42,746,306 | 32,608,002 | ||||||
| Home equity and second mortgage | 24,572,235 | 25,884,406 | ||||||
| Commercial loans | 79,629,910 | 54,737,693 | ||||||
| Consumer loans | 2,812,945 | 3,128,425 | ||||||
| Commercial equipment | 18,287,840 | 16,742,220 | ||||||
| 426,753,855 | 373,579,301 | |||||||
| Less: | ||||||||
| Deferred loan fees | 490,335 | 603,714 | ||||||
| Allowance for loan loss | 3,783,721 | 3,383,334 | ||||||
| 4,274,056 | 3,987,048 | |||||||
| $ | 422,479,799 | $ | 369,592,253 | |||||
An analysis of the allowance for loan losses follows
| 2006 | 2005 | 2004 | ||||||||||
Balance January 1, | $ | 3,383,334 | $ | 3,057,558 | $ | 2,572,799 | ||||||
| Add: | ||||||||||||
| Provision charged to operations | 405,809 | 329,467 | 452,998 | |||||||||
| Recoveries | 2,759 | 5,184 | 49,083 | |||||||||
| Less: | ||||||||||||
| Charge-offs | 8,181 | 8,875 | 17,322 | |||||||||
Balance, December 31 | $ | 3,783,721 | $ | 3,383,334 | $ | 3,057,558 | ||||||
No loans included within the scope of SFAS No. 114 were identified as being impaired at December 31, 2006, 2005, or 2004 and for the years then ended.
Loans on which the recognition of interest has been discontinued, which were not included within the scope of SFAS No. 114, amounted to approximately $1,046,000, $591,000, and $675,000 at December 31, 2006, 2005, and 2004, respectively. If interest income had been recognized on nonaccrual loans at their stated rates during 2006, 2005, and 2004, interest income would have been increased by $75,480, $67,558, and $44,391, respectively. Income in the amount of $18,121, $7,763, and $21,955 was recognized on these loans in 2006, 2005, and 2004, respectively.
34
Tri-County Financial Corporation
Included in loans receivable at December 31, 2006 and 2005 is $3,179,142 and $1,682,994 due from officers and directors of the Bank. These loans are made in the ordinary course of business at substantially the same terms and conditions as those prevailing at the time for comparable transactions with outsiders and are not considered to involve more than the normal risk of collectibility. For the years ended December 31, 2006 and 2005, all loans to directors and officers of the Bank were performing according to the original loan terms. Activity in loans outstanding to officers and directors is summarized as follows
| 2006 | 2005 | |||||||
| Balance, beginning of year | $ | 1,682,994 | $ | 1,268,353 | ||||
| New loans made during year | 1,967,257 | 524,708 | ||||||
| Repayments made during year | (991,108 | ) | (110,067 | ) | ||||
| Changes due to changes in directors and officers | 520,000 | — | ||||||
| Balance, end of year | $ | 3,179,142 | $ | 1,682,994 | ||||
NOTE 5 — LOAN SERVICING
Loans serviced for others are not reflected in the accompanying balance sheets. The unpaid principal balances of mortgages serviced for others were $29,313,135 and $34,530,296 at December 31, 2006 and 2005, respectively.
Servicing loans for others generally consists of collecting mortgage payments, maintaining escrow accounts, disbursing payments to investors and foreclosure processing. Loan servicing income is recorded on the accrual basis and includes servicing fees from investors and certain charges collected from borrowers, such as late payment fees. The following table presents the activity of the mortgage servicing rights.
| Year Ended December 31, | ||||||||||||
| 2006 | 2005 | 2004 | ||||||||||
| Balance at beginning of the year | $ | 326,061 | $ | 477,202 | $ | 676,940 | ||||||
| Additions | — | — | 7,861 | |||||||||
| Amortization | (111,102 | ) | (151,141 | ) | (207,599 | ) | ||||||
| $ | 214,959 | $ | 326,061 | $ | 477,202 | |||||||
NOTE 6 — FORECLOSED REAL ESTATE
Foreclosed assets are presented net of an allowance for losses. An analysis of the allowance for losses on foreclosed assets is as follows
| Years ended December 31, | ||||||||||||
| 2006 | 2005 | 2004 | ||||||||||
| Balance at beginning of year | $ | 671,740 | $ | 671,740 | $ | 972,899 | ||||||
| Provision for losses | — | — | 114,606 | |||||||||
| Charge-offs | — | — | (415,765 | ) | ||||||||
| Balance at end of year | $ | 671,740 | $ | 671,740 | $ | 671,740 | ||||||
Expenses applicable to foreclosed assets include the following
| Years ended December 31, | ||||||||||||
| 2006 | 2005 | 2004 | ||||||||||
| Net gain on sale of foreclosed real estate | $ | — | $ | — | $ | — | ||||||
| Donation of property | — | — | 25,000 | |||||||||
| Provision for losses | — | — | 114,606 | |||||||||
| Operating expenses | 3,632 | 3,083 | 6,278 | |||||||||
| $ | 3,632 | $ | 3,083 | $ | 145,884 | |||||||
35
Notes to Consolidated Financial Statements
NOTE 7 — PREMISES AND EQUIPMENT
A summary of the cost and accumulated depreciation of premises and equipment follows
| 2006 | 2005 | |||||||
| Land | $ | 2,096,381 | $ | 1,368,077 | ||||
| Building and improvements | 5,856,357 | 5,579,868 | ||||||
| Furniture and equipment | 3,021,560 | 2,662,799 | ||||||
| Automobiles | 168,426 | 168,426 | ||||||
| Total cost | 11,142,724 | 9,779,170 | ||||||
| Less accumulated depreciation | 4,320,263 | 3,318,625 | ||||||
| Premises and equipment, net | $ | 6,822,461 | $ | 6,460,545 | ||||
Certain bank facilities are leased under various operating leases. Rent expense was $292,196, $238,573, and $190,306 in 2006, 2005, and 2004, respectively. Future minimum rental commitments under non-cancellable operating leases are as follows:
| 2007 | $ | 342,150 | ||
| 2008 | 456,021 | |||
| 2009 | 374,705 | |||
| 2010 | 305,252 | |||
| 2011 | 309,533 | |||
| Thereafter | 3,926,918 | |||
| Total | $ | 5,714,579 | ||
In addition to the premises and equipment balances noted above, the Company has agreed to purchase additional land, and plans to rebuild one branch office and construct a new branch office in 2007. Total amounts to be purchased under these commitments are approximately $4.4 million.
NOTE 8 — DEPOSITS
Deposits at December 31 consist of the following:
| 2006 | 2005 | |||||||
| Noninterest-bearing demand | $ | 43,723,436 | $ | 44,325,083 | ||||
| Interest-bearing demand | 41,117,213 | 48,666,460 | ||||||
| Money market deposits | 91,072,187 | 40,195,630 | ||||||
| Savings | 30,187,404 | 34,800,535 | ||||||
| Certificates of deposit | 211,913,163 | 195,386,032 | ||||||
| Total interest-bearing | 374,289,966 | 319,048,657 | ||||||
| Total deposits | $ | 418,013,403 | $ | 363,373,740 | ||||
The aggregate amount of time deposits in denominations of $100,000 or more at December 31, 2006 and 2005 was $62,996,094 and $64,722,620, respectively.
36
Tri-County Financial Corporation
At December 31, 2006, the scheduled maturities of time deposits are as follows
| 2007 | $ | 176,092,518 | ||
| 2008 | 22,507,476 | |||
| 2009 | 5,906,963 | |||
| 2010 | 5,705,602 | |||
| 2011 | 1,700,605 | |||
| $ | 211,913,163 | |||
NOTE 9 — SHORT-TERM BORROWINGS AND LONG-TERM DEBT
The Bank’s long-term debt consists of advances from the Federal Home Loan Bank of Atlanta. The Bank classifies debt based upon original maturity and does not reclassify debt to short term status during its life. These include fixed-rate, adjustable-rate, fixed convertible, and variable convertible advances. Rates and maturities on these advances are as follows
| Fixed Rate | Variable | |||||||||||
| Fixed Rate | Convertible | Convertible | ||||||||||
2006 | ||||||||||||
| Highest rate | 5.15 | % | 6.25 | % | 4.91 | % | ||||||
| Lowest rate | 1.00 | % | 3.27 | % | 4.17 | % | ||||||
| Weighted average rate | 4.29 | % | 4.70 | % | 4.65 | % | ||||||
| Matures through | 2036 | 2014 | 2020 | |||||||||
2005 | ||||||||||||
| Highest rate | 5.43 | % | 6.25 | % | 3.88 | % | ||||||
| Lowest rate | 1.13 | % | 3.27 | % | 3.88 | % | ||||||
| Weighted average rate | 3.99 | % | 4.54 | % | 3.88 | % | ||||||
| Matures through | 2022 | 2014 | 2020 | |||||||||
Average rates of long and short-term debt were as follows
| At or for the Year Ended December 31, | ||||||||||||
| dollars in thousands | 2006 | 2005 | 2004 | |||||||||
Long-term debt | ||||||||||||
| Maximum outstanding long-term debt of any month end | $ | 108,078 | $ | 107,826 | $ | 82,931 | ||||||
| Average outstanding long-term debt | 101,520 | 93,409 | 73,830 | |||||||||
| Approximate average rate paid on long-term debt | 4.42 | % | 4.25 | % | 4.44 | % | ||||||
Short-term borrowing | ||||||||||||
| Maximum outstanding short-term debt at any month end | $ | 37,590 | $ | 123,968 | $ | 122,693 | ||||||
| Average outstanding short-term debt | 18,129 | 82,665 | 64,736 | |||||||||
| Approximate average rate paid on short-term debt | 4.99 | % | 3.10 | % | 1.80 | % | ||||||
The Bank’s fixed-rate debt generally consists of advances with monthly interest payments and principal due at maturity.
The Bank’s fixed-rate, convertible, long-term debt is callable by the issuer, after an initial period ranging from six months to five years. Advances become callable on dates ranging from 2007 to 2009. Depending on the specific instrument, the instrument is callable either continuously after the initial period (Bermuda option) or only at the date ending the initial period (European). All advances have a prepayment penalty, determined based upon prevailing interest rates. Variable convertible advances have an initial variable rate based on a discount to LIBOR. Depending on the specific instrument, the debt has a discount to LIBOR ranging from 43 to 50 basis points. After an initial period of two to five years, the advance will convert at the issuer’s option to a fixed-rate advance at a rate of 4.0% to 4.21% and a term of five to ten years. The contractual maturities of long-term debt are as follows
37
Notes to Consolidated Financial Statements
December 31, 2006
| Fixed Rate | Variable | |||||||||||||||
| Fixed Rate | Convertible | Convertible | Total | |||||||||||||
| Due in 2007 | $ | 5,000,000 | $ | — | $ | — | $ | 5,000,000 | ||||||||
| Due in 2008 | — | — | — | — | ||||||||||||
| Due in 2009 | 30,000,000 | — | — | 30,000,000 | ||||||||||||
| Due in 2010 | 5,000,000 | 10,000,000 | — | 15,000,000 | ||||||||||||
| Due in 2011 | — | — | 10,000,000 | 10,000,000 | ||||||||||||
| Thereafter | 1,045,936 | 15,000,000 | 20,000,000 | 36,045,936 | ||||||||||||
| $ | 41,045,936 | $ | 25,000,000 | $ | 30,000,000 | $ | 96,045,936 | |||||||||
From time to time, the Bank also has daily advances outstanding, which are classified as short-term borrowings. These advances are repayable at the Bank’s option at any time and reprice daily. These advances totaled $5,500,000 and $19,500,000 at December 31, 2006 and 2005, respectively. The rates on the short-term debt at December 31, 2006 and 2005 were 5.5% and 4.58% respectively.
Under the terms of an Agreement for Advances and Security Agreement with Blanket Floating Lien (the “Agreement”), the Company maintained eligible collateral consisting of one- to four-residential first mortgage loans, discounted at 80% of the unpaid principal balance, equal to 100% of its total outstanding long and short-term Federal Home Loan Bank advances. During 2003 and 2004, the Bank entered into addendums to the Agreement that expanded the types of eligible collateral under the Agreement to include certain commercial real estate and second mortgage loans. These loans are subject to eligibility rules, and collateral values are discounted at 50% of the unpaid loan principal balance. In addition, only 50% of total collateral for Federal Home Loan Bank advances may consist of commercial real estate loans. In addition, the Bank has pledged its Federal Home Loan Bank stock of $5,650,400 and securities with a carrying value of $92,911,006 as additional collateral for its advances. The Bank is limited to total advances of up to 40% of assets or $230,000,000. At December 31, 2006, the Bank had filed collateral statements identifying collateral sufficient to borrow $101,000,000 in addition to amounts already outstanding.
In addition, the Bank had outstanding notes payable to the U.S. Treasury, which are federal treasury tax and loan deposits accepted by the Bank and remitted on demand to the Federal Reserve Bank. At December 31, 2006 and 2005, such short-term borrowings were $1,067,702 and $574,975, respectively. The Bank pays interest on these balances at a slight discount to the federal funds rate. The notes are secured by investment securities with an amortized cost of approximately $1,759,000 and $624,000 at December 31, 2006 and 2005, respectively.
NOTE 10 — INCOME TAXES
Allocation of federal and state income taxes between current and deferred portions is as follows
| 2006 | 2005 | 2004 | ||||||||||
Current | ||||||||||||
| Federal | $ | 2,014,469 | $ | 2,219,558 | $ | 1,284,026 | ||||||
| State | 562,627 | 284,737 | 91,118 | |||||||||
| 2,577,096 | 2,504,295 | 1,375,144 | ||||||||||
Deferred | ||||||||||||
| Federal | (347,874 | ) | (398,238 | ) | 57,973 | |||||||
| State | (64,807 | ) | (54,113 | ) | 7,877 | |||||||
| (412,681 | ) | (452,351 | ) | 65,850 | ||||||||
Total Income Tax Expense | $ | 2,164,415 | $ | 2,051,944 | $ | 1,440,994 | ||||||
38
Tri-County Financial Corporation
The reasons for the differences between the statutory federal income tax rate and the effective tax rates are summarized as follows
| 2006 | 2005 | 2004 | ||||||||||||||||||||||
| Percent of | Percent of | Percent of | ||||||||||||||||||||||
| Pre Tax | Pre Tax | Pre Tax | ||||||||||||||||||||||
| Amount | Income | Amount | Income | Amount | Income | |||||||||||||||||||
| Expected income tax expense at federal tax rate | $ | 2,245,928 | 34.00 | % | $ | 2,050,638 | 34.00 | % | $ | 1,754,682 | 34.00 | % | ||||||||||||
| State taxes net of federal benefit | 328,561 | 4.97 | % | 152,212 | 2.52 | % | 65,337 | 1.27 | % | |||||||||||||||
| Nondeductible expenses | 4,779 | 0.07 | % | 3,124 | 0.05 | % | 2,527 | 0.05 | % | |||||||||||||||
| Nontaxable income | (196,225 | ) | (2.97 | %) | (154,337 | ) | (2.56 | %) | (179,442 | ) | -3.48 | % | ||||||||||||
| Donation of property | — | — | — | — | (202,109 | ) | -3.92 | % | ||||||||||||||||
| Other | (218,628 | ) | (3.31 | %) | 307 | — | — | — | ||||||||||||||||
| $ | 2,164,415 | 32.77 | % | $ | 2,051,944 | 34.02 | % | $ | 1,440,994 | 27.92 | % | |||||||||||||
The net deferred tax assets in the accompanying balance sheets include the following components:
| 2006 | 2005 | |||||||
Deferred tax assets | ||||||||
| Deferred fees | $ | 3,298 | $ | 4,583 | ||||
| Allowance for loan losses | 1,431,675 | 1,277,020 | ||||||
| Deferred compensation | 704,417 | 471,786 | ||||||
| Valuation allowance on foreclosed real estate | 259,991 | 259,991 | ||||||
| Unrealized loss on investment securities available for sale | 27,726 | — | ||||||
| 2,427,107 | 2,013,380 | |||||||
Deferred tax liabilities | ||||||||
| FHLB stock dividends | 152,896 | 152,896 | ||||||
| Depreciation | 362,946 | 389,626 | ||||||
| Unrealized gain on investment securities available for sale | — | 25,431 | ||||||
| 515,842 | 567,953 | |||||||
| $ | 1,911,265 | $ | 1,445,427 | |||||
Retained earnings at December 31, 2006, included approximately $1.2 million of bad debt deductions allowed for federal income tax purposes (the “base year tax reserve”) for which no deferred income tax has been recognized. If, in the future, this portion of retained earnings is used for any purpose other than to absorb bad debt losses, it would create income for tax purposes only and income taxes would be imposed at the then prevailing rates. The unrecorded income tax liability on the above amount was approximately $463,000 at December 31, 2006.
Prior to January 1, 1996, the Bank computed its tax bad debt deduction based upon the percentage of taxable income method as defined by the Internal Revenue Code. The bad debt deduction allowable under this method equaled 8% of taxable income determined without regard to the bad debt deduction and with certain adjustments. The tax bad debt deduction differed from the bad debt expense used for financial accounting purposes.
In August 1996, the Small Business Job Protection Act (the “Act”) repealed the percentage of taxable income method of accounting for bad debts effective for years beginning after December 31, 1995. The Act required the Bank to change its method of computing reserves for bad debts to the experience method. This method is available to banks with assets less than $500 million and allows the Bank to maintain a tax reserve for bad debts and to take bad debt deductions for reasonable additions to the reserve. As a result of this change, the Bank has to recapture into income a portion of its existing tax bad debt reserve. This recapture occurs ratably over a six-taxable year period, beginning with the 1998 tax year. For financial reporting purposes, this recapture does not result in additional tax expense as the Bank adequately provided deferred taxes in prior years. Furthermore, this change does not require the Bank to recapture its base-year tax reserve.
39
Notes to Consolidated Financial Statements
NOTE 11 — COMMITMENTS AND CONTINGENCIES
The Bank is party to financial instruments with off-balance-sheet risk in the normal course of business to meet the financing needs of its customers. These financial instruments are commitments to extend credit. These instruments may, but do not necessarily, involve, to varying degrees, elements of credit and interest rate risk in excess of the amount recognized in the balance sheets. The Bank’s exposure to credit loss in the event of nonperformance by the other party to the financial instrument is represented by the contractual amount of those instruments. The Bank uses the same credit policies in making commitments as it does for on-balance-sheet loans receivable.
As of December 31, 2006 and 2005, in addition to the undisbursed portion of loans receivable of approximately $17,897,673 and $23,051,485, respectively, the Bank had outstanding loan commitments approximating $12,824,000 and $5,537,000, respectively.
Standby letters of credit written are conditional commitments issued by the Bank to guarantee the performance of a customer to a third party. These guarantees are issued primarily to support construction borrowing arrangements. The credit risk involved in issuing letters of credit is essentially the same as that involved in extending loan facilities to customers. The Bank holds cash or a secured interest in real estate as collateral to support those commitments for which collateral is deemed necessary. Standby letters of credit outstanding amounted to $8,382,853 and $8,183,000 at December 31, 2006 and 2005, respectively. In addition to the commitments noted above, customers had approximately $62,845,000 and $48,001,000 available under lines of credit at December 31, 2006 and 2005, respectively.
NOTE 12 — STOCK OPTION AND INCENTIVE PLAN
The Company has stock option and incentive plans to attract and retain personnel and provide incentive to employees to promote the success of the business. On January 31, 2005, the Company’s 1995 Stock Option and Incentive Plan and 1995 Stock Option Plan for Non-Employee Directors each expired. All shares authorized and available under this plan were awarded as of December 31, 2004. In May 2005, the 2005 Equity Compensation Plan was approved by the shareholders. The exercise price for options granted under this plan is set at the discretion of the committee administering this plan, but is not less than the market value of the shares as of the date of grant. An option’s maximum term is ten years and the options vest at the discretion of the committee administering this plan. All outstanding options were fully vested at December 31, 2005
The company has authorized 247,500 shares for stock options. Currently 158,211 shares are available for options. The total intrinsic value of outstanding and exercisable options at December 31, 2006 is $4,250,000.
The following table summarizes activity in the plans:
| 2006 | 2005 | 2004 | ||||||||||||||||||||||
| Weighted | Weighted | Weighted | ||||||||||||||||||||||
| Average | Average | Average | ||||||||||||||||||||||
| Exercise | Exercise | Exercise | ||||||||||||||||||||||
| Shares | Price | Shares | Price | Shares | Price | |||||||||||||||||||
| Outstanding at beginning of year | 444,753 | $ | 13.59 | 403,382 | $ | 10.72 | 346,937 | $ | 7.47 | |||||||||||||||
| Granted | — | 89,289 | 22.29 | 130,434 | 15.34 | |||||||||||||||||||
| Exercised | (19,585 | ) | 7.97 | (46,980 | ) | 5.53 | (69,311 | ) | 3.31 | |||||||||||||||
| Forfeitures | (8,072 | ) | 13.24 | (938 | ) | 11.99 | (4,679 | ) | 8.57 | |||||||||||||||
| Outstanding at end of year | 417,097 | 13.86 | 444,753 | 13.59 | 403,382 | 10.72 | ||||||||||||||||||
40
Tri-County Financial Corporation
Option amounts and exercise prices have been adjusted retroactively to give effect to the three for two stock splits. Options outstanding are all currently exercisable and are summarized as follows
| Number Outstanding | Weighted Average Remaining | Weighted Average | ||||
| December 31, 2006 | Contractual Life | Exercise Price | ||||
| 33,193 | 2 years | $ | 7.16 | |||
| 23,126 | 3 years | 7.88 | ||||
| 37,639 | 4 years | 7.90 | ||||
| 40,851 | 5 years | 7.90 | ||||
| 22,822 | 6 years | 11.56 | ||||
| 71,088 | 7 years | 12.91 | ||||
| 99,878 | 8 years | 15.89 | ||||
| 88,502 | 9 years | 22.29 | ||||
| 417,097 | 13.86 | |||||
The following table illustrates the effect on the net earnings per common share if the fair value method had been applied to all outstanding awards for the years ended December 31, 2005 and 2004, respectively:
| December 31, | ||||||||
| 2005 | 2004 | |||||||
| Net income, as reported | $ | 3,979,343 | $ | 3,719,834 | ||||
| Additional expense had the Company adopted SFAS 123R | (942,297 | ) | (735,180 | ) | ||||
| Pro forma net income | $ | 3,037,046 | $ | 2,984,654 | ||||
| Earnings per share as reported | ||||||||
| Basic | $ | 1.53 | $ | 1.44 | ||||
| Diluted | $ | 1.44 | $ | 1.38 | ||||
| Pro forma earnings per share | ||||||||
| Basic | $ | 1.17 | $ | 1.15 | ||||
| Diluted | $ | 1.10 | $ | 1.11 | ||||
Per share amounts have been adjusted retroactively to reflect the three for two stock splits in December 2004, December 2005, and December 2006.
For the purpose of computing the pro forma amounts indicated above, the fair value of each option on the date of grant is estimated using the Black-Scholes option pricing model with the following weighted-average assumptions used for the grants:
| 2005 | 2004 | |||||||
| Dividend yield | 1.02 | % | 1.80 | % | ||||
| Expected volatility | 34.89 | 25.51 | ||||||
| Risk-free interest rate | 4.66 | 4.31 | ||||||
| Expected lives (in years) | 10 | 10 | ||||||
| Weighted average fair value | $ | 10.55 | $ | 5.63 | ||||
NOTE 13—EMPLOYEE BENEFIT PLANS
The Bank has an Employee Stock Ownership Plan (“ESOP”) which covers substantially all its employees. The ESOP acquires stock of Tri-County Financial Corporation. The Company accounts for its ESOP in accordance with AICPA Statement of Position 93-6, “Employers’ Accounting for Employee Stock Onwership Plans”. Accordingly, unencumbered shares held by the ESOP are treated as outstanding in computing earnings per share. Shares issued to the ESOP but pledged as collateral for loans obtained to provide funds to acquire the shares are not treated as outstanding in computing earnings per share. Dividends on ESOP shares are recorded as a reduction of retained earnings. Contributions are made at the discretion of the Board of Directors. Expense recognized for the years
41
Notes to Consolidated Financial Statements
ending 2006, 2005, and 2004 totaled $76,842, $64,837, and $78,421 respectively. As of December 31, 2006, the ESOP plan held 180,156 allocated and 8,020 unallocated shares with an approximate market value of $4,332,750 and $192,883, respectively.
The Company also has a 401 (k) plan. The Company matches a portion of the employee contributions. This ratio is determined annually by the Board of Directors. In 2006, 2005, and 2004, the Company matched one-half of the employee’s first 8% deferral. All employees who have completed six months of service and have reached the age of 21 are covered under this defined contribution plan. Contributions are determined at the discretion of the Board of Directors. For the years ended December 31, 2006, 2005, and 2004, the Company charged $129,027, $92,000, and $89,000, respectively, against earnings to fund the plan.
The Bank has a separate nonqualified retirement plan for non-employee directors. Directors are eligible for a maximum benefit of $3,500 a year for ten years following retirement from the Board of Community Bank of Tri-County. The maximum benefit is earned at 15 years of service as a non-employee director. Full vesting occurs after two years of service. Expense recorded for this plan was $7,193, $5,173, and $18,000 for the years ended December 31, 2006, 2005, and 2004, respectively.
In addition, the Bank has established a separate supplemental retirement plan for certain of the Bank’s key executives. This plan provides a retirement income payment for 15 years from the date of the employee’s expected retirement date. The payments are set at the discretion of the Board of Directors and vesting occurs ratably from the date of employment to the expected retirement date. Expense recorded for this plan totaled $341,000, $286,000, and $316,000 for 2006, 2005, and 2004 respectively.
NOTE 14—REGULATORY MATTERS
The Company and the Bank are subject to various regulatory capital requirements administered by the federal and state banking agencies. Failure to meet minimum capital requirements can initiate certain mandatory and possible additional discretionary actions by regulators that, if undertaken, could have a direct material effect on the Company’s financial statements. Under capital adequacy guidelines and the regulatory framework for prompt corrective action, the Bank must meet specific capital guidelines that involve quantitative measures of the Bank’s assets, liabilities, and certain off-balance-sheet items as calculated under regulatory accounting practices. The Bank’s capital amounts and classification are also subject to qualitative judgments by the regulators about components, risk weightings, and other factors.
Quantitative measures established by regulation to ensure capital adequacy require the Company and the Bank to maintain minimum amounts and ratios (set forth in the table below) of tangible and core capital (as defined in the regulations) to total adjusted assets (as defined), and of risk-based capital (as defined) to risk-weighted assets (as defined). Management believes, as of December 31, 2006, that the Company and the Bank meet all capital adequacy requirements to which they are subject.
As of December 31, 2006, the most recent notification from the Federal Reserve categorized the Bank as well-capitalized under the regulatory framework for prompt corrective action. To be categorized as well-capitalized, the Bank must maintain minimum total risk-based, Tier 1 risk-based, and Tier 1 leverage ratios as set forth in the table. There are no conditions or events since that notification that management believes have changed the Company’s or the Bank’s category. The Company’s and the Bank’s actual capital amounts and ratios for 2006 and 2005 are presented in the tables below.
42
Tri-County Financial Corporation
| To Be Considered Well | ||||||||||||||||||||||||
| Required for Capital | Capitalized Under | |||||||||||||||||||||||
| Actual | Adequacy Purposes | Prompt Corrective Action | ||||||||||||||||||||||
At December 31, 2006 | ||||||||||||||||||||||||
| Total capital (to risk weighted assets) | ||||||||||||||||||||||||
| The Company | $ | 53,504 | 11.98 | % | $ | 35,723 | 8.00 | % | ||||||||||||||||
| The Bank | $ | 52,388 | 11.78 | % | $ | 35,648 | 8.00 | % | $ | 44,560 | 10.00 | % | ||||||||||||
| Tier 1 capital (to risk weighted assets) | ||||||||||||||||||||||||
| The Company | $ | 49,675 | 11.12 | % | $ | 17,862 | 4.00 | % | ||||||||||||||||
| The Bank | $ | 48,559 | 10.92 | % | $ | 17,824 | 4.00 | % | $ | 26,736 | 6.00 | % | ||||||||||||
| Tier 1 capital (to average assets) | ||||||||||||||||||||||||
| The Company | $ | 49,675 | 8.74 | % | $ | 22,722 | 4.00 | % | ||||||||||||||||
| The Bank | $ | 48,559 | 8.58 | % | $ | 22,682 | 4.00 | % | $ | 28,353 | 5.00 | % | ||||||||||||
At December 31, 2005 | ||||||||||||||||||||||||
| Total capital (to risk weighted assets) | ||||||||||||||||||||||||
| The Company | $ | 49,544 | 11.84 | % | $ | 33,463 | 8.00 | % | ||||||||||||||||
| The Bank | $ | 48,753 | 11.67 | % | $ | 33,391 | 8.00 | % | $ | 41,739 | 10.00 | % | ||||||||||||
| Tier 1 capital (to risk weighted assets) | ||||||||||||||||||||||||
| The Company | $ | 46,161 | 11.04 | % | $ | 16,731 | 4.00 | % | ||||||||||||||||
| The Bank | $ | 45,370 | 10.87 | % | $ | 16,696 | 4.00 | % | $ | 25,044 | 6.00 | % | ||||||||||||
| Tier 1 capital (to average assets) | ||||||||||||||||||||||||
| The Company | $ | 46,161 | 8.55 | % | $ | 21,590 | 4.00 | % | ||||||||||||||||
| The Bank | $ | 45,370 | 8.42 | % | $ | 21,550 | 4.00 | % | $ | 26,937 | 5.00 | % | ||||||||||||
NOTE 15—FAIR VALUE OF FINANCIAL INSTRUMENTS
The estimated fair value amounts have been determined by the Company using available market information and appropriate valuation methodologies. However, considerable judgment is necessarily required to interpret market data to develop the estimates of fair value. Accordingly, the estimates presented herein are not necessarily indicative of the amounts the Company could realize in a current market exchange. The use of different market assumptions and/or estimation methodologies may have a material effect on the estimated fair value amounts. Therefore, any aggregate unrealized gains or losses should not be interpreted as a forecast of future earnings or cash flows. Furthermore, the fair values disclosed should not be interpreted as the aggregate current value of the Company.
| December 31, 2006 | December 31, 2005 | |||||||||||||||
| Carrying | Estimated | Carrying | Estimated | |||||||||||||
| Amount | Fair Value | Amount | Fair Value | |||||||||||||
Assets | ||||||||||||||||
| Cash and cash equivalents | $ | 18,190,506 | $ | 18,190,506 | $ | 22,575,240 | $ | 22,575,240 | ||||||||
| Investment securities and stock in FHLB and FRB | 113,206,926 | 111,550,233 | 130,855,879 | 128.640.980 | ||||||||||||
| Loans receivable, net | 422,479,799 | 425,336,840 | 369,592,253 | 370,164,000 | ||||||||||||
Liabilities | ||||||||||||||||
| Savings, checking, and money market accounts | 206,100,240 | 206,100,240 | 167,987,707 | 167,987,707 | ||||||||||||
| Time certificates | 211,913,163 | 211,025,358 | 195,386,032 | 189,574,936 | ||||||||||||
| Long-term debt and other borrowed funds | 102,613,638 | 101,093,038 | 127,898,734 | 126,788,777 | ||||||||||||
| Guaranteed preferred beneficial interest in junior subordinated securities | $ | 12,000,000 | $ | 12,000,000 | $ | 12,000,000 | $ | 12,000,000 | ||||||||
At December 31, 2006 and 2005, the Company had outstanding loan commitments and standby letters of credit of $21 million and $14 million, respectively. Based on the short-term lives of these instruments, the Company does not believe that the fair value of these
43
Notes to Consolidated Financial Statements
instruments differs significantly from their carrying values.
Valuation Methodology
Cash and Cash Equivalents —For cash and cash equivalents, the carrying amount is a reasonable estimate of fair value.
Investment Securities —Fair values are based on quoted market prices or dealer quotes. If a quoted market price is not available, fair value is estimated using quoted market prices for similar securities.
Loans Receivable —For conforming residential first-mortgage loans, the market price for loans with similar coupons and maturities was used. For nonconforming loans with maturities similar to conforming loans, the coupon was adjusted for credit risk. Loans which did not have quoted market prices were priced using the discounted cash flow method. The discount rate used was the rate currently offered on similar products. Loans priced using the discounted cash flow method included residential construction loans, commercial real estate loans, and consumer loans. The estimated fair value of loans held for sale is based on the terms of the related sale commitments.
Deposits —The fair value of checking accounts, saving accounts, and money market accounts was the amount payable on demand at the reporting date.
Time Certificates —The fair value was determined using the discounted cash flow method. The discount rate was equal to the rate currently offered on similar products.
Long-Term Debt and Other Borrowed Funds —These were valued using the discounted cash flow method. The discount rate was equal to the rate currently offered on similar borrowings.
Guaranteed Preferred Beneficial Interest in Junior Subordinated Securities —These were valued using discounted cash flows. The discount rate was equal to the rate currently offered on similar borrowings.
Off-Balance Sheet Instruments —The Company charges fees for commitments to extend credit. Interest rates on loans for which these commitments are extended are normally committed for periods of less than one month. Fees charged on standby letters of credit and other financial guarantees are deemed to be immaterial and these guarantees are expected to be settled at face amount or expire unused. It is impractical to assign any fair value to these commitments.
The fair value estimates presented herein are based on pertinent information available to management as of December 31, 2006 and 2005. Although management is not aware of any factors that would significantly affect the estimated fair value amounts, such amounts have not been comprehensively revalued for purposes of these financial statements since that date and, therefore, current estimates of fair value may differ significantly from the amount presented herein.
NOTE 16 — GUARANTEED PREFERRED BENEFICIAL INTEREST IN JUNIOR SUBORDINATED DEBENTURES
On June 15, 2005, Tri-County Capital Trust II (“Capital Trust II”), a Delaware business trust was formed as a wholly owned subsidiary of the Company to issue $5,000,000 of variable-rate capital securities with an interest rate of 5.07% in a private pooled transaction. The variable rate is based on the 90-day LIBOR rate plus 1.70%. The Trust used the proceeds from this issuance to purchase $5,155,000 of the Company’s junior subordinated debentures. The interest rate on the debentures and the trust-preferred securities is variable and adjusts quarterly. The Company has, through various contractual arrangements, fully and unconditionally guaranteed all of Capital Trust II’s obligations with respect to the capital securities. These capital securities qualify as Tier I capital and are presented in the Consolidated Balance Sheets as “Guaranteed Preferred Beneficial Interests in Junior Subordinated Debentures.” Both the capital securities of Capital Trust II and the junior-subordinated debentures are scheduled to mature on June 15, 2035, unless called by the Company not earlier than June 15, 2010.
On July 22, 2004, Tri-County Capital Trust I (“Capital Trust I”), a Delaware business trust was formed as a wholly owned subsidiary
44
Tri-County Financial Corporation
of the Company to issue $7,000,000 of variable-rate capital securities with an interest rate of 4.22% in a private pooled transaction. The variable rate is based on the 90-day LIBOR rate plus 2.60%. The Trust used the proceeds from this issuance, along with the Company’s $217,000 capital contribution for Capital Trust I’s common securities, to purchase $7,217,000 of the Company’s junior subordinated debentures. The interest rate on the debentures and the trust-preferred securities is variable and adjusts quarterly. The Company has, through various contractual arrangements, fully and unconditionally guaranteed all of Capital Trust I’s obligations with respect to the capital securities. These debentures qualify as Tier I capital and are presented in the Consolidated Balance Sheets as “Guaranteed Preferred Beneficial Interests in Junior Subordinated Debentures.” Both the capital securities of Capital Trust I and the junior subordinated debentures are scheduled to mature on July 22, 2034, unless called by the Company not earlier than July 22, 2009.
Costs associated with the issuance of the trust-preferred securities were less than $10,000 and were expensed as period costs.
NOTE 17 — PRIVATE PLACEMENTS
On December 30, 2005, the Company completed a private placement of securities in an offering exempt from registration under the Securities Act. The seven investors were officers, directors, and counsel for the Company. The offering was for 23,652 shares at $20.00 per share and raised $473,040. The costs of the offering were less than $5,000 and were expensed.
During 2006, the Company sold securities at the then current market value to new directors. The amount of total shares issued in this manner during 2006 was 7,500 shares at an average price of $23.67. All share and per share amounts have been adjusted for the three for two stock splits effected in December 2006, 2005, and 2004.
45
Notes to Consolidated Financial Statements
NOTE 18 — CONDENSED FINANCIAL STATEMENTS — PARENT COMPANY ONLY
Financial information pertaining only to Tri-County Financial Corporation is as follows
BALANCE SHEETS
| December 31, | ||||||||
| 2006 | 2005 | |||||||
Assets | ||||||||
| Cash — noninterest bearing | $ | 799,984 | $ | 881,185 | ||||
| Cash — interest bearing | 155,244 | 167,830 | ||||||
| Investment securities available for sale | 37,475 | 35,838 | ||||||
| Investment in wholly owned subsidiaries | 48,985,298 | 45,791,231 | ||||||
| Other assets | 565,881 | 853,740 | ||||||
Total Assets | $ | 50,543,882 | $ | 47,729,824 | ||||
Liabilities | ||||||||
| Current liabilities | $ | 442,545 | $ | 779,668 | ||||
| Guaranteed preferred beneficial interest in junior subordinated debentures | 12,372,000 | 12,372,000 | ||||||
Total Liabilities | 12,814,545 | 13,151,668 | ||||||
Stockholders’ Equity | ||||||||
| Common stock | 26,423 | 17,610 | ||||||
| Surplus | 9,499,946 | 9,057,805 | ||||||
| Retained earnings | 28,353,792 | 25,580,634 | ||||||
| Total accumulated other comprehensive (loss) income | (53,822 | ) | 49,363 | |||||
| Unearned ESOP shares | (97,002 | ) | (127,256 | ) | ||||
Total Stockholders’ Equity | 37,729,337 | 34,578,156 | ||||||
Total Liabilities and Stockholders’ Equity | $ | 50,543,882 | $ | 47,729,824 | ||||
46
Tri-County Financial Corporation
CONDENSED STATEMENTS OF INCOME
| Year Ended December 31, | ||||||||||||
| 2006 | 2005 | 2004 | ||||||||||
| Dividends from subsidiary | $ | 2,000,000 | $ | 17,00,000 | $ | — | ||||||
| Interest income | 16,220 | 16,059 | 6,349 | |||||||||
| Interest expense | 891,891 | 580,584 | 140,341 | |||||||||
Net Interest Income | 1,124,330 | 1,135,475 | (133,992 | ) | ||||||||
| Miscellaneous expenses | (420,129 | ) | ( 257,031 | ) | (166,364 | ) | ||||||
| Income before income taxes and equity in undistributed net income of subsidiary | 704,201 | 878,444 | (300,356 | ) | ||||||||
| Federal and state income tax benefit | 439,804 | 279,328 | 102,120 | |||||||||
| Equity in undistributed net income of subsidiary | 3,297,252 | 2,821,571 | 3,918,070 | |||||||||
Net Income | $ | 4,441,257 | $ | 3,979,343 | $ | 3,719,834 | ||||||
CONDENSED STATEMENTS OF CASH FLOWS
| Year Ended December 31, | ||||||||||||
| 2006 | 2005 | 2004 | ||||||||||
Cash Flows from Operating Activities | ||||||||||||
| Net in come | $ | 4,441,257 | $ | 3,979,343 | $ | 3,719,834 | ||||||
| Adjustments to reconcile net income to net cash provided by operating activities | ||||||||||||
| Equity in undistributed earnings of subsidiary | (3,297,251 | ) | (2,821,571 | ) | (3,918,070 | ) | ||||||
| Excess tax benefits on stock-based compensation | (42,315 | ) | — | — | ||||||||
| ( Decrease) increase in other assets | (28,023 | ) | (659,666 | ) | 763,470 | |||||||
| Deferred income tax benefit | (56,117 | ) | ||||||||||
| Increase in current liabilities | 77,191 | 489,477 | 30,835 | |||||||||
Net Cash Provided by Operating Activities | 1,094,742 | 987,583 | 596,069 | |||||||||
Cash Flows from Investing Activities | ||||||||||||
| Purchase of investment securities available for sale | (1,637 | ) | (1,172 | ) | (1,514 | ) | ||||||
| Net cash used by in vesting activities | (1,637 | ) | (1,172 | ) | (1,514 | ) | ||||||
Cash Flows from Financing Activities | ||||||||||||
| Sale of guaranteed preferred beneficial interests in junior subordinated securities | — | 5,155,000 | 7,217,000 | |||||||||
| Downstream of capital to subsidiary | — | (5,000,000 | ) | (7,000,000 | ) | |||||||
| Investment in trust subsidiary | — | (155,000 | ) | (217,000 | ) | |||||||
| Dividends paid | (972,966 | ) | (930,669 | ) | (541,633 | ) | ||||||
| Proceeds from private placement | 177,500 | 473,040 | — | |||||||||
| Exercise of stock options | 156,122 | 304,648 | 248,661 | |||||||||
| Excess tax benefits on stock-based compensation | (42,315 | ) | — | — | ||||||||
| Net change in ESOP loan | 96,665 | 60,390 | 8,506 | |||||||||
| Redemption of common stock | (686,528 | ) | (295,393 | ) | (412,973 | ) | ||||||
Net Cash Used in Financing Activities | (1,186,892 | ) | (387,984 | ) | (697,439 | ) | ||||||
Increase (Decrease) in Cash | (93,787 | ) | 598,427 | (102,884 | ) | |||||||
Cash at Beginning of Year | 1,049,015 | 450,588 | 553,472 | |||||||||
Cash at End of Year | $ | 955,228 | $ | 1,049,015 | $ | 450,588 | ||||||
47
Notes to Consolidated Financial Statements
NOTE 19 — QUARTERLY FINANCIAL RESULTS (UNAUDITED)
| 2006 | 2006 | 2006 | 2006 | 2005 | 2005 | 2005 | 2005 | |||||||||||||||||||||||||
| Fourth | Third | Second | First | Fourth | Third | Second | First | |||||||||||||||||||||||||
| Quarter | Quarter | Quarter | Quarter | Quarter | Quarter | Quarter | Quarter | |||||||||||||||||||||||||
| Interest and dividend income | $ | 9,371,065 | $ | 9,186,802 | $ | 8,827,910 | $ | 8,299,959 | $ | 7,872,103 | $ | 7,433,702 | $ | 7,284,039 | $ | 6,564,868 | ||||||||||||||||
| Interest Expense | 4,995,112 | 4,844,077 | 4,473,923 | 4,045,816 | 3,838,465 | 3,566,630 | 3,369,456 | 2,809,080 | ||||||||||||||||||||||||
| Net interest income | 4,375,953 | 4,342,725 | 4,353,987 | 4,254,143 | 4,033,638 | 3,867,072 | 3,914,583 | 3,755,788 | ||||||||||||||||||||||||
| Provision for loan loss | 116,674 | 116,563 | 86,087 | 86,485 | 129,160 | 11,183 | 126,097 | 63,027 | ||||||||||||||||||||||||
| Net interest income after provision | 4,259,279 | 4,226,162 | 4,267,900 | 4,167,658 | 3,904,478 | 3,855,889 | 3,788,486 | 3,692,761 | ||||||||||||||||||||||||
| Noninterest income | 744,359 | 519,452 | 505,612 | 477,718 | 339,218 | 466,650 | 433,806 | 401,329 | ||||||||||||||||||||||||
| Noninterest expense | 3,162,634 | 3,071,666 | 3,197,613 | 3,130,555 | 2,943,137 | 2,769,564 | 2,589,915 | 2,548,714 | ||||||||||||||||||||||||
| Income before income taxes | 1,841,004 | 1,673,948 | 1,575,899 | 1,514,821 | 1,300,559 | 1,552,975 | 1,632,377 | 1,545,376 | ||||||||||||||||||||||||
| Provision for income taxes | 534,872 | 570,895 | 516,964 | 541,684 | 414,733 | 562,908 | 553,288 | 521,015 | ||||||||||||||||||||||||
Net Income | $ | 1,306,132 | $ | 1,103,053 | $ | 1,058,935 | $ | 973,137 | $ | 885,826 | $ | 990,067 | $ | 1,079,089 | $ | 1,024,361 | ||||||||||||||||
Earnings per common share | ||||||||||||||||||||||||||||||||
| Basic | $ | 0.50 | $ | 0.42 | $ | 0.40 | $ | 0.37 | $ | 0.34 | $ | 0.38 | $ | 0.41 | $ | 0.39 | ||||||||||||||||
| Diluted | $ | 0.46 | $ | 0.39 | $ | 0.37 | $ | 0.35 | $ | 0.32 | $ | 0.35 | $ | 0.39 | $ | 0.37 | ||||||||||||||||
| Dividends paid | $ | 0.00 | $ | 0.00 | $ | 0.37 | $ | 0.00 | $ | 0.00 | $ | 0.00 | $ | 0.35 | $ | 0.00 | ||||||||||||||||
1 All per amounts have been adjusted for the three for two stock splits effected in December 2006, 2005, and 2004.
2 Earnings per share are based upon quarterly results and may not be additive to the annual earnings per share amounts.
48