Exhibit 99.1
Key Drivers of Future Revenue Growth Annual Financial Institution Investors Conference
Ryan Beck & Co
October 27, 2004
Forward Looking Statement
This presentation contains forward-looking statements relating to the financial condition, results of operations and business of Sky Financial Group, Inc. Actual results could differ materially from those indicated. Among the important factors that could cause actual results to differ materially are interest rates, the success of the integration of acquisitions, changes in the mix of the company’s business, competitive pressures, general economic conditions and the risk factors detailed in the Company’s periodic reports and registration statements filed with the Securities and Exchange Commission. Sky Financial Group undertakes no obligation to release revisions to these forward-looking statements or reflect events or circumstances after the date of this presentation.
This presentation contains financial information adjusted to exclude the results of certain significant transactions or events not representative of ongoing operations (“non-operating items”). A reconciliation of these non-GAAP disclosures will be filed in a form 8-K.
2
Sky Profile
$14.6 billion in total assets
Eight regions consolidated under Sky name
286 financial centers serving communities in Ohio, Michigan, Pennsylvania, Indiana and West Virginia
Headquarters located in Bowling Green, Ohio
40th largest publicly-owned holding company in U.S.
$2.7 billion market cap
www.skyfi.com
3
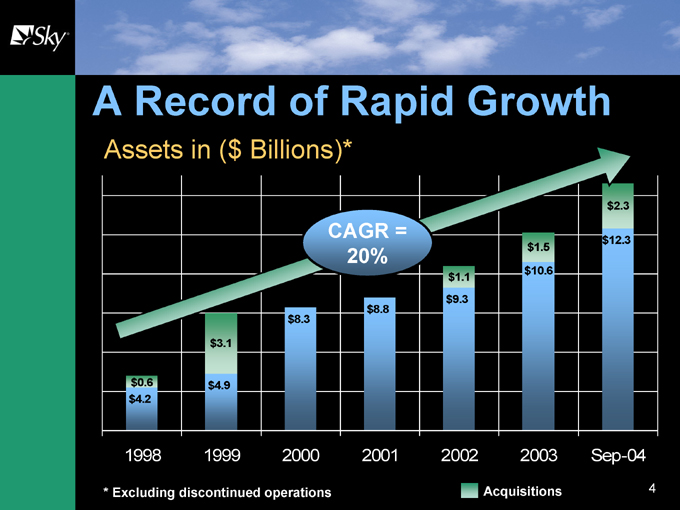
A Record of Rapid Growth
Assets in ($ Billions)*
CAGR = 20%
$4.2 $0.6
$4.9 $3.1
$8.3
$8.8
$9.3 $1.1
$12.3 $2.3
$10.6 $1.5
1998 1999 2000 2001 2002 2003 Sep-04
Acquisitions
* Excluding discontinued operations
4
Sky Performance Goals
Operating EPS growth of 10-12%
Committed to perform among the top 25% of the 100 largest banks in the U.S. in terms of:
ROE
ROA
Efficiency ratio
Sound asset quality
5
Sky Priorities
One Company ~ One Culture
Organic growth
Growth of fee-based businesses
Organizational synergies
Sound asset quality
Acquisitions
6
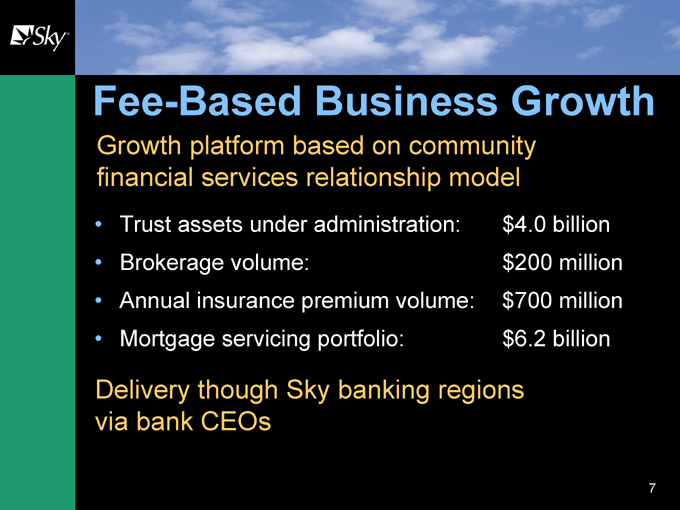
Fee-Based Business Growth
Trust assets under administration: $4.0 billion
Brokerage volume: $200 million
Annual insurance premium volume: $700 million
Mortgage servicing portfolio: $6.2 billion
Growth platform based on community financial services relationship model
Delivery though Sky banking regions
via bank CEOs
7
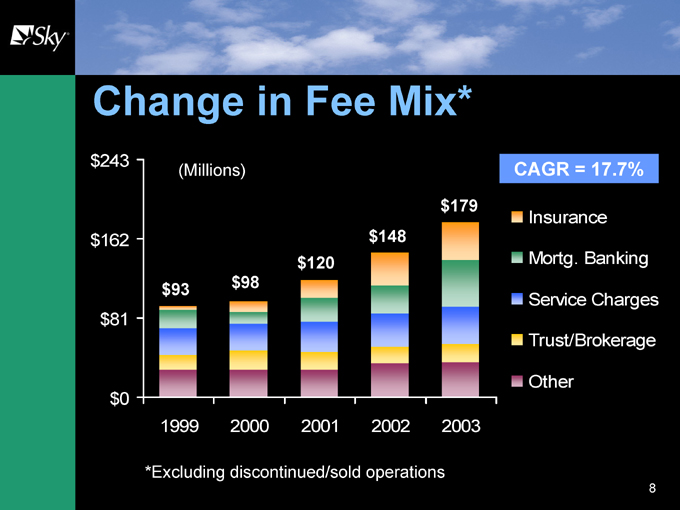
Change in Fee Mix*
(Millions)
CAGR = 17.7%
$93 $120 $148 $179 $98
$0 $81 $162 $243
1999 2000 2001 2002 2003
Insurance
Mortg. Banking
Service Charges
Trust/Brokerage
Other
*Excluding discontinued/sold operations
8
Sky Insurance – Profile
One of the top 50 insurance agencies in the United States
Represent over $700 million in annualized premiums
350+ employees
19 office locations in Sky’s footprint
Client base of 10,000 and growing
Over $50 million in revenue
9
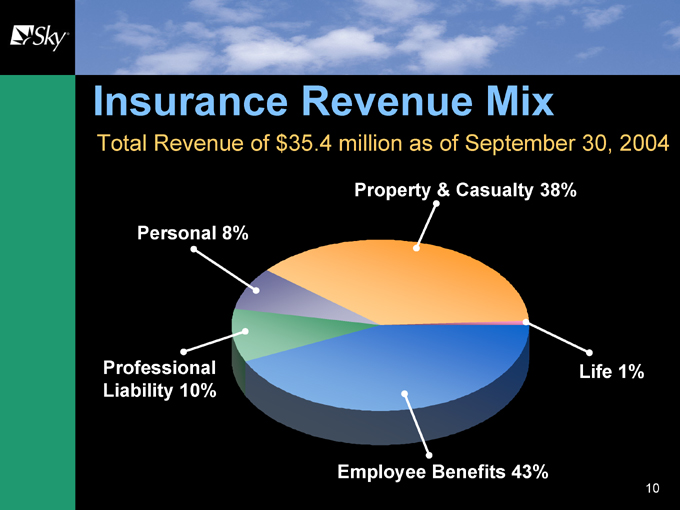
Insurance Revenue Mix
Total Revenue of $35.4 million as of September 30, 2004
Life 1%
Property & Casualty 38%
Professional Liability 10%
Employee Benefits 43%
Personal 8%
10
Sky Insurance – Growth Strategies
Aggressive acquisition strategy to consolidate multiple agencies under Sky Brand
Agency integration process to strengthen selling potential and operational efficiencies
Ability to cross-sell insurance products through bank delivery channel
Market clout – provides for better pricing to clients
Talented team with strong knowledge base
Additional specialized talent added through acquisitions
Represent the industry’s best A-rated insurance companies
11
Sky Insurance – Growth
Acquisitions
Picton Cavanaugh – May 1999
Meyer & Eckenrode – July 2000
Celaris Group – January 2002
Value Added Benefits – April 2002
Insurance Buyers Service Agency – July 2003
Spencer Patterson Insurance – January 2004
EOB, Inc. – April 2004
Stouffer-Herzog – July 2004
12
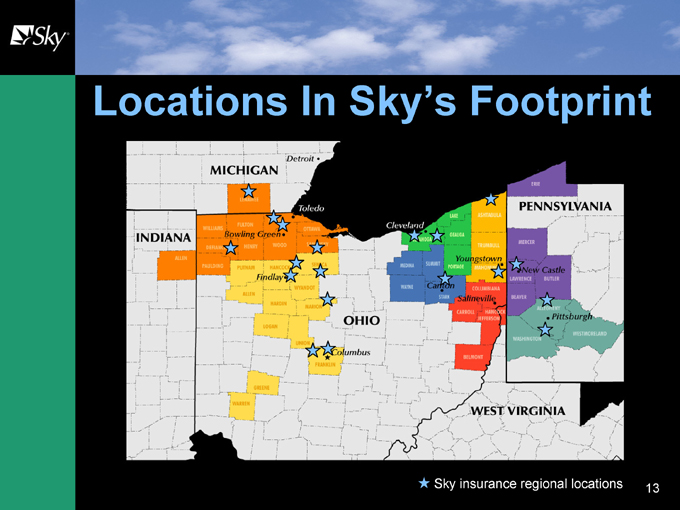
Locations In Sky’s Footprint
Sky insurance regional locations
13
Sky Insurance – Strategic Goals
$80-$90 million business by end of year 2007
Successful growth in all product lines
Continued acquisitions
Market expansion
Add new product lines
Maximize opportunities for cross-sell through Sky Financial Group and business units
Provide superior level of client service
Growth in net income contribution over 15%
14
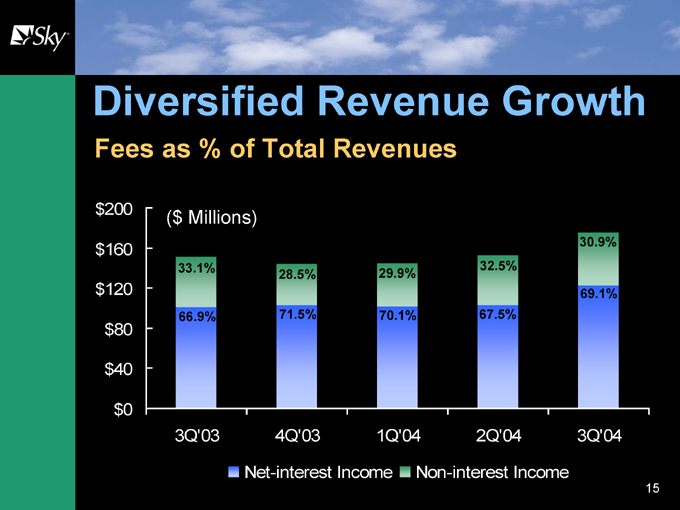
Diversified Revenue Growth
Fees as % of Total Revenues
($ Millions)
33.1% 66.9%
28.5% 71.5%
29.9% 70.1%
32.5% 67.5%
30.9% 69.1%
$0 $40 $80 $120 $160 $200 3Q’03 4Q’03 1Q’04 2Q’04 3Q’04
Net-interest Income
Non-interest Income
15
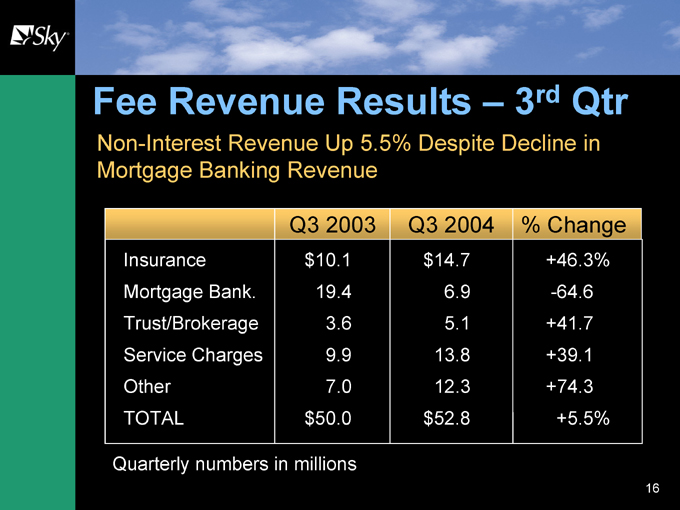
Fee Revenue Results – 3rd Qtr
Non-Interest Revenue Up 5.5% Despite Decline in Mortgage Banking Revenue
Q3 2003 Q3 2004 % Change
Insurance $10.1 $14.7 +46.3%
Mortgage Bank. 19.4 6.9 -64.6
Trust/Brokerage 3.6 5.1 +41.7
Service Charges 9.9 13.8 +39.1
Other 7.0 12.3 +74.3
TOTAL $50.0 $52.8 +5.5%
Quarterly numbers in millions
16
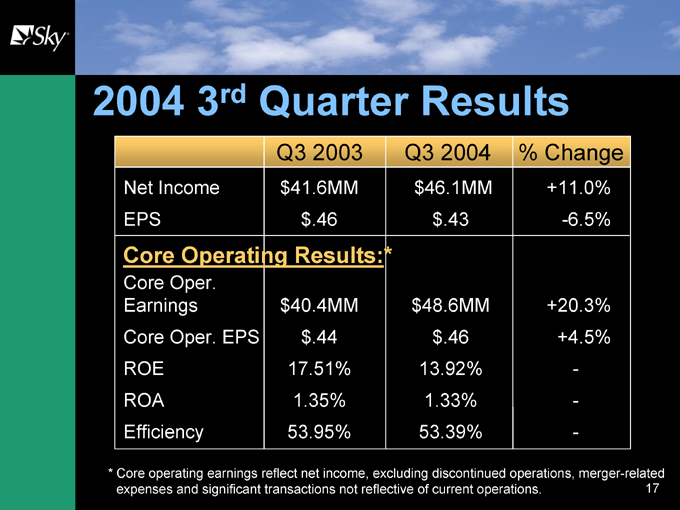
2004 3rd Quarter Results
Q3 2003 Q3 2004 % Change
Net Income $41.6MM $46.1MM +11.0%
EPS $.46 $.43 -6.5%
Core Operating Results:*
Core Oper. Earnings $40.4MM $48.6MM +20.3%
Core Oper. EPS $.44 $.46 +4.5%
ROE 17.51% 13.92% -
ROA 1.35% 1.33% -
Efficiency 53.95% 53.39% -
* Core operating earnings reflect net income, excluding discontinued operations, merger-related expenses and significant transactions not reflective of current operations.
17
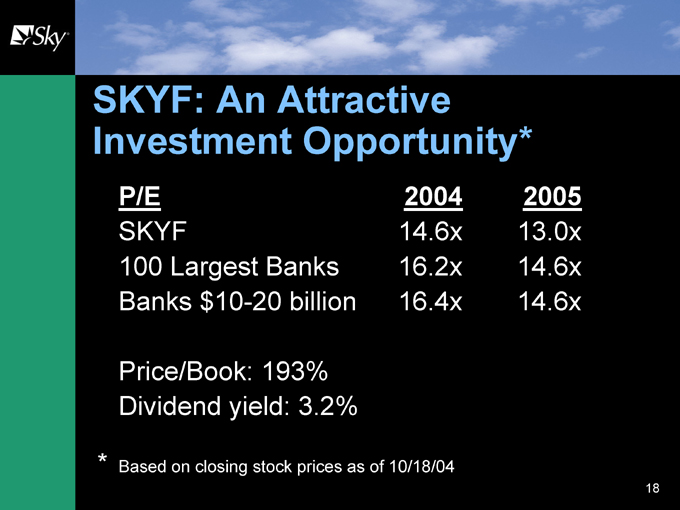
SKYF: An Attractive Investment Opportunity*
P/E 2004 2005
SKYF 14.6x 13.0x
100 Largest Banks 16.2x 14.6x
Banks $10-20 billion 16.4x 14.6x
Price/Book: 193%
Dividend yield: 3.2%
* Based on closing stock prices as of 10/18/04
18
Why Buy Sky
Solid operating performance
Balance sheet strength
Aggressive performance goals
Strong growth profile
19
Under One Sky
www.skyfi.com