Exhibit 99.1
Lehman Brothers
2005 Financial Services Conference September 13-15, 2005
Expanding Horizons
Forward Looking Statement
This presentation contains forward-looking statements relating to the financial condition, results of operations and business of Sky Financial Group, Inc. Actual results could differ materially from those indicated. Among the important factors that could cause actual results to differ materially are interest rates, the success of the integration of acquisitions, changes in the mix of the company’s business, competitive pressures, general economic conditions and the risk factors detailed in the Company’s periodic reports and registration statements filed with the Securities and Exchange Commission. Sky Financial Group undertakes no obligation to release revisions to these forward-looking statements or reflect events or circumstances after the date of this presentation.
This presentation contains financial information adjusted to exclude the results of certain significant transactions or events not representative of ongoing operations (“non-operating items”). A reconciliation of these non-GAAP disclosures can be found within this presentation.
2
Sky Profile $15.2 billion in total assets Eight regions consolidated under Sky name Over 280 financial centers serving communities in OH, MI, PA, IN and WV
Headquarters located in Bowling Green, OH 36th largest publicly-owned holding company in U.S. $3.0 billion market cap
3
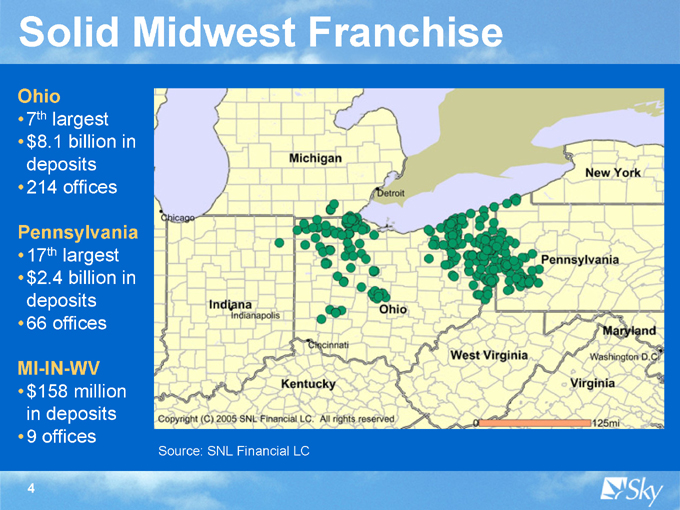
Solid Midwest Franchise
Ohio 7th largest $8.1 billion in deposits
214 offices
Pennsylvania 17th largest $2.4 billion in deposits 66 offices
MI-IN-WV
$158 million in deposits
9 offices
Source: SNL Financial LC
4
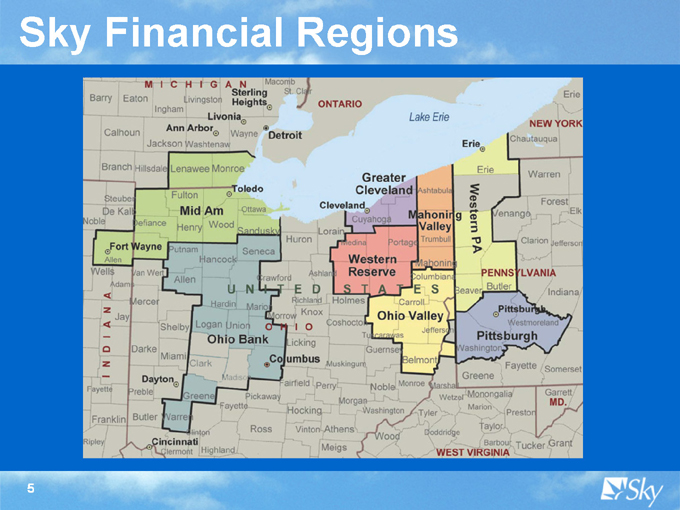
Sky Financial Regions
5
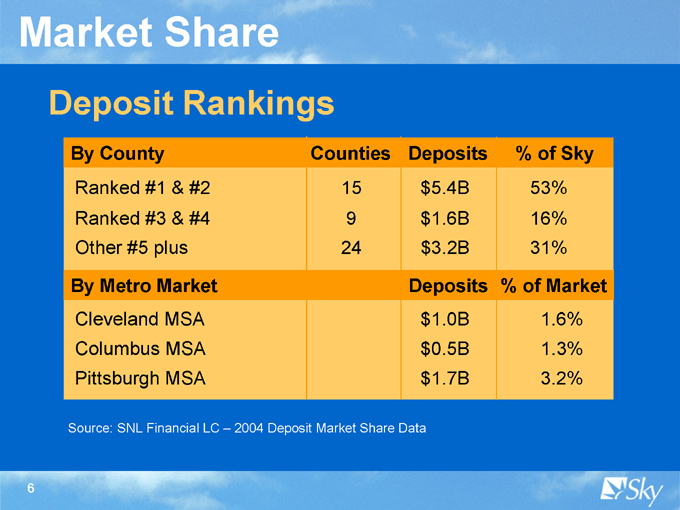
Market Share
Deposit Rankings
By County Counties Deposits % of Sky
Ranked #1 & #2 15 $5.4B 53%
Ranked #3 & #4 9 $1.6B 16%
Other #5 plus 24 $3.2B 31%
By Metro Market Deposits % of Market
Cleveland MSA $1.0B 1.6%
Columbus MSA $0.5B 1.3%
Pittsburgh MSA $1.7B 3.2%
Source: SNL Financial LC – 2004 Deposit Market Share Data
6

Sky Priorities
One Company ~ One Culture
Organic Growth
Growth of Fee-Based Businesses Organizational Synergies Sound Asset Quality Acquisitions
7
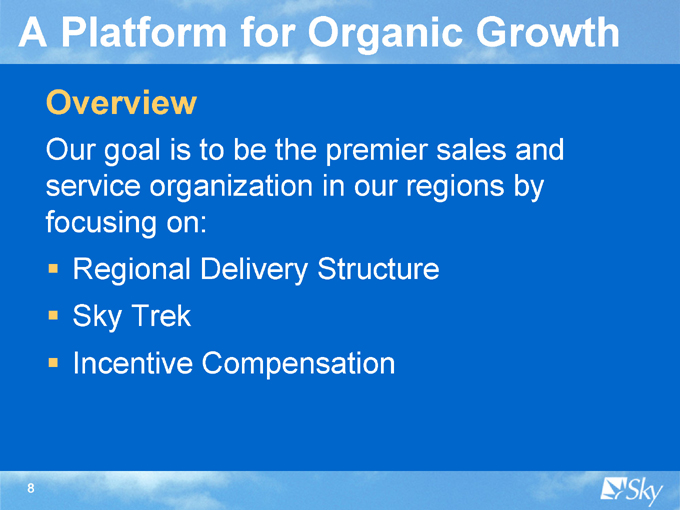
A Platform for Organic Growth
Overview
Our goal is to be the premier sales and service organization in our regions by focusing on: ?Regional Delivery Structure ?Sky Trek ?Incentive Compensation
8
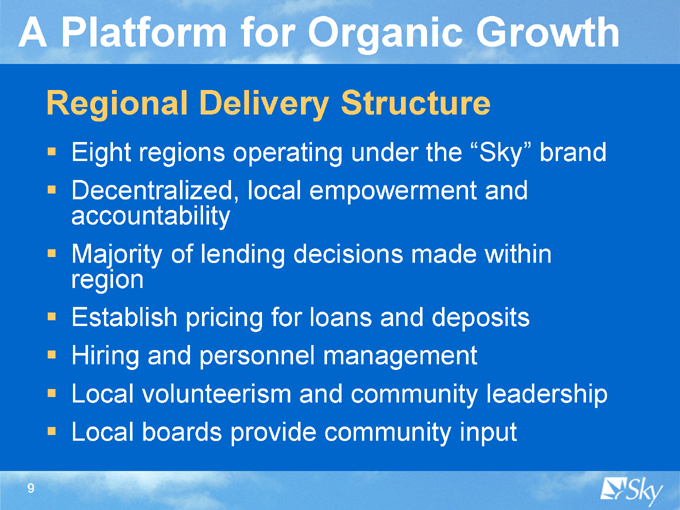
A Platform for Organic Growth
Regional Delivery Structure
Eight regions operating under the “Sky” brand Decentralized, local empowerment and accountability Majority of lending decisions made within region Establish pricing for loans and deposits Hiring and personnel management Local volunteerism and community leadership Local boards provide community input
9
A Platform for Organic Growth
Regional Delivery Structure
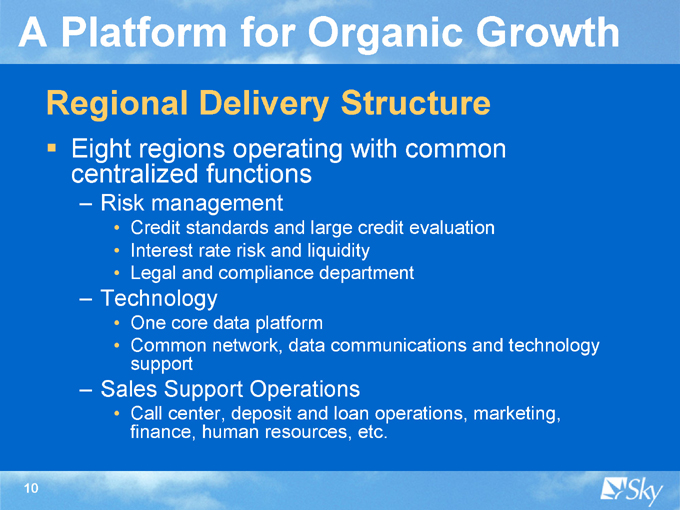
Eight regions operating with common centralized functions
Risk management
Credit standards and large credit evaluation Interest rate risk and liquidity Legal and compliance department
Technology
One core data platform
Common network, data communications and technology support
Sales Support Operations
Call center, deposit and loan operations, marketing, finance, human resources, etc.
10
A Platform for Organic Growth
Sky Trek—Process
Providing the highest level of quality client service is our distinctive strength Sky employees sell products based on understanding the needs of our clients and fulfilling those needs
Employees are empowered to make decisions that help clients meet their needs Weekly sales meetings Ranking/tracking performance
11
A Platform for Organic Growth
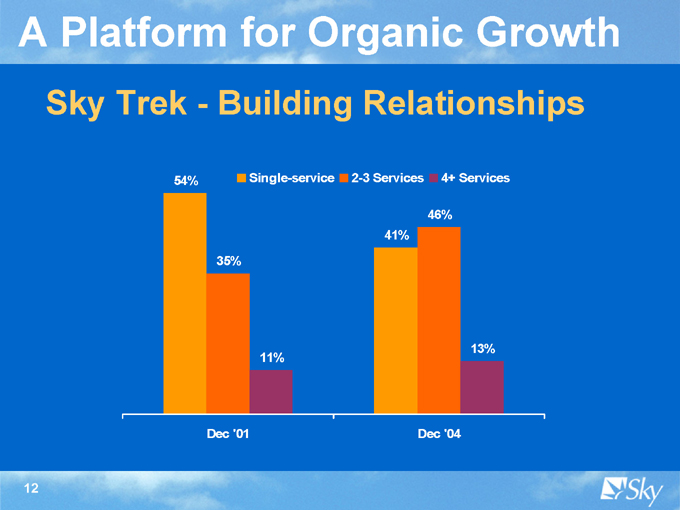
Sky Trek—Building Relationships
54% Single-service 2-3 Services 4+ Services
46% 41%
35%
13% 11%
Dec ‘01 Dec ‘04
12
A Platform for Organic Growth
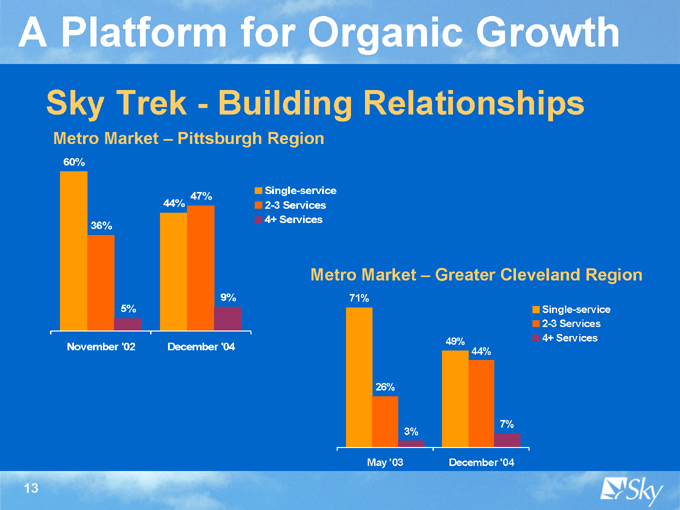
Sky Trek—Building Relationships
Metro Market – Pittsburgh Region
60%
47% 44%
36%
9% 5%
November ‘02 December ‘04
Single-service 2-3 Services 4+ Services
Metro Market – Greater Cleveland Region
71%
49% 44%
26%
7% 3%
May ‘03 December ‘04
Single-service 2-3 Services 4+ Services
13
A Platform for Organic Growth
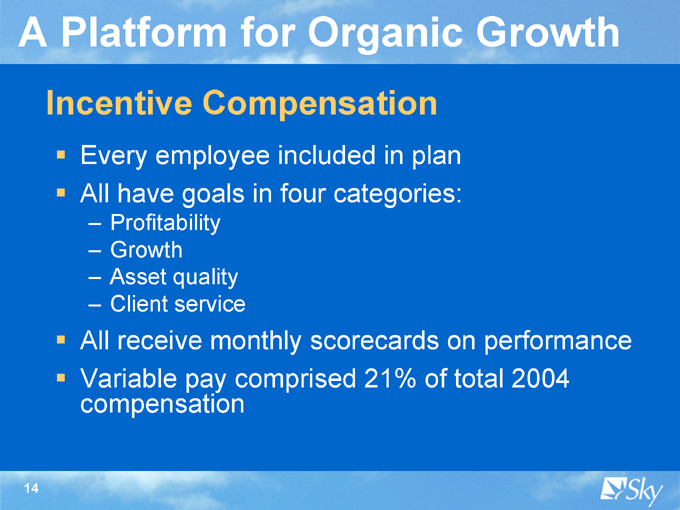
Incentive Compensation
Every employee included in plan All have goals in four categories:
Profitability Growth Asset quality Client service
All receive monthly scorecards on performance Variable pay comprised 21% of total 2004 compensation
14
Fee-Based Business Growth
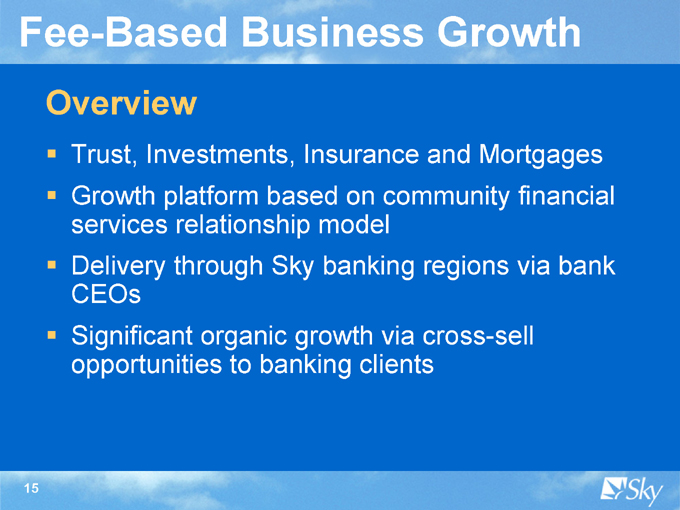
Overview
Trust, Investments, Insurance and Mortgages Growth platform based on community financial services relationship model Delivery through Sky banking regions via bank CEOs Significant organic growth via cross-sell opportunities to banking clients
15
Fee-Based Business Growth
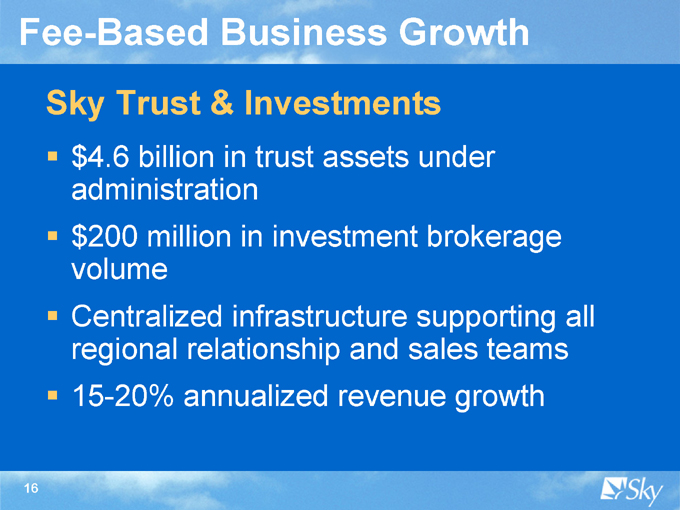
Sky Trust & Investments $4.6 billion in trust assets under administration $200 million in investment brokerage volume Centralized infrastructure supporting all regional relationship and sales teams 15-20% annualized revenue growth
16
Fee-Based Business Growth
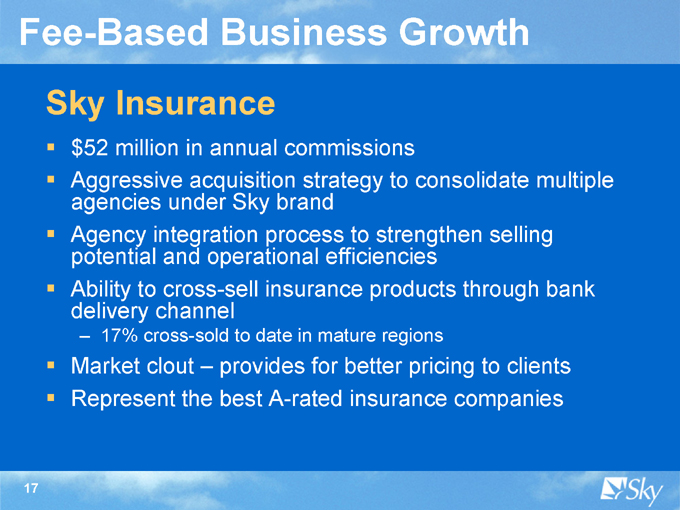
Sky Insurance $52 million in annual commissions
Aggressive acquisition strategy to consolidate multiple agencies under Sky brand Agency integration process to strengthen selling potential and operational efficiencies Ability to cross-sell insurance products through bank delivery channel
17% cross-sold to date in mature regions
Market clout
provides for better pricing to clients Represent the best A-rated insurance companies
17
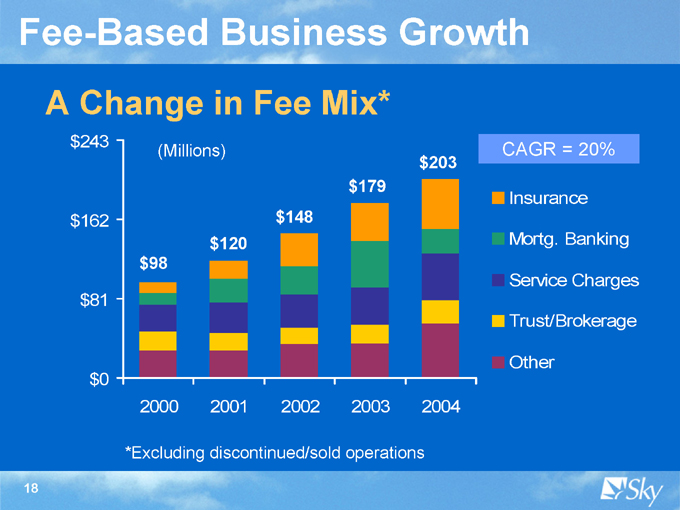
Fee-Based Business Growth
A Change in Fee Mix* $243 $162 $81 $0
(Millions) $98 $120 $148 $179 $203
2000 2001 2002 2003 2004
CAGR = 20%
Insurance Mortg. Banking Service Charges Trust/Brokerage Other
*Excluding discontinued/sold operations
18
Organizational Synergies
Overview
Scalable Common Processes
Dedicated change management team Consistent Level of Efficiency
19
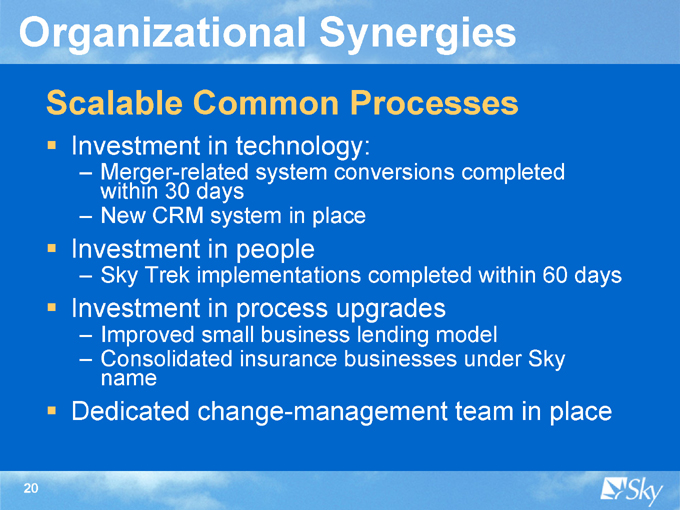
Organizational Synergies
Scalable Common Processes
Investment in technology:
Merger-related system conversions completedwithin 30 days New CRM system in place
Investment in people
Sky Trek implementations completed within 60 days
Investment in process upgrades
Improved small business lending model
Consolidated insurance businesses under Skyname
Dedicated change-management team in place
20
Organization Synergies
Dedicated Change Management
Coordinate monitoring and management of Sky’s strategic plan Manage the successful integration of acquired companies into Sky Facilitate major new technology introductions with technology/ops group Guide functional reorganization and process changes
21
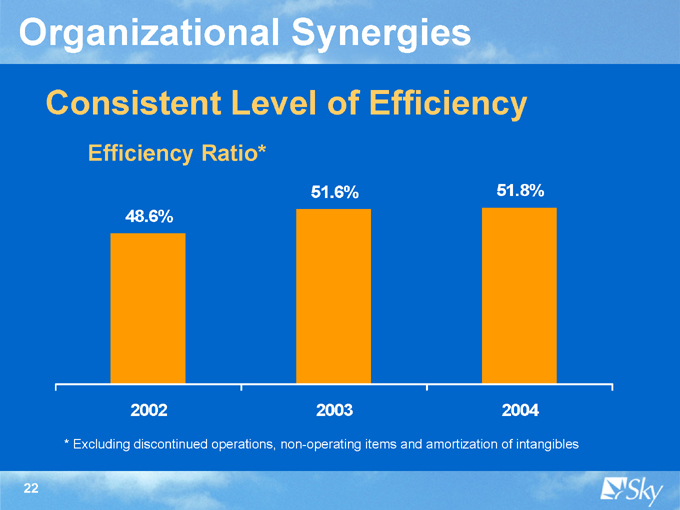
Organizational Synergies
Consistent Level of Efficiency
Efficiency Ratio*
48.6%
51.6%
51.8%
2002
2003
2004
* Excluding discontinued operations, non-operating items and amortization of intangibles
22

Sound Asset Quality
Overview
Conservative credit culture ?Disciplined lending practices ?History of low charge-offs
23
Sound Asset Quality
Conservative Credit Culture
Chief credit officer in place 17 years ?Centrally-managed credit analysis ?Focus on small business lending ?74% of loan portfolio collateralized by real estate
24
Sound Asset Quality
Disciplined Lending Practices
Regional lender authorities up to $3 million ?Shared regional loan committees –approvals up to $6 million ?Corporate loan committee approval over $6 million ?Largest 20 credit commitments range from $23 to $35 million
25
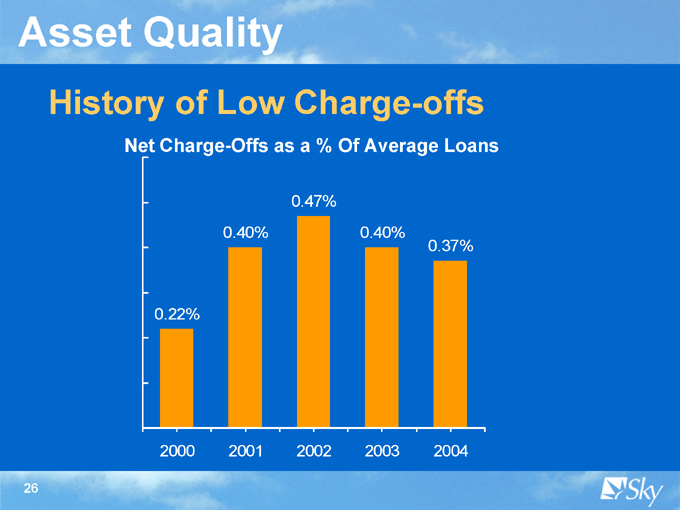
Asset Quality
History of Low Charge-offs
Net Charge-Offs as a% Of Average Loans
0.47%
0.40% 0.40%
0.37%
0.22%
2000 2001 2002 2003 2004
26
Acquisitions
Overview
A Successful Strategy Focus on Metro Markets A Core Competency
27
Acquisitions
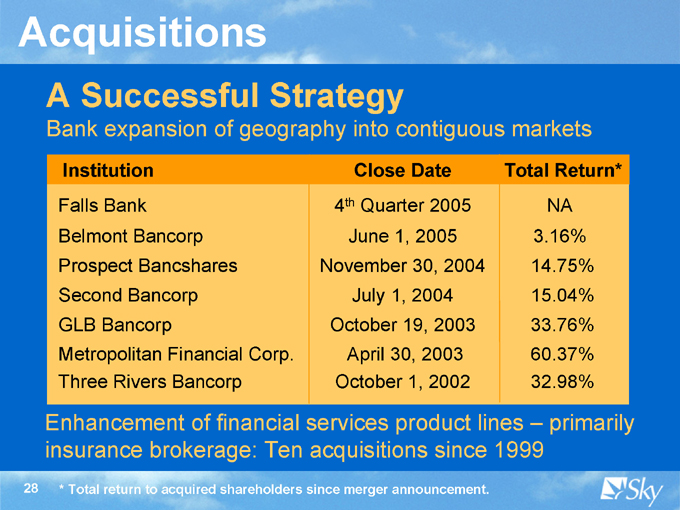
A Successful Strategy
Bank expansion of geography into contiguous markets
Institution Close Date Total Return*
Falls Bank 4th Quarter 2005 NA
Belmont Bancorp June 1, 2005 3.16%
Prospect Bancshares November 30, 2004 14.75%
Second Bancorp July 1, 2004 15.04%
GLB Bancorp October 19, 2003 33.76%
Metropolitan Financial Corp. April 30, 2003 60.37%
Three Rivers Bancorp October 1, 2002 32.98%
Enhancement of financial services product lines – primarily insurance brokerage: Ten acquisitions since 1999
* Total return to acquired shareholders since merger announcement.
28
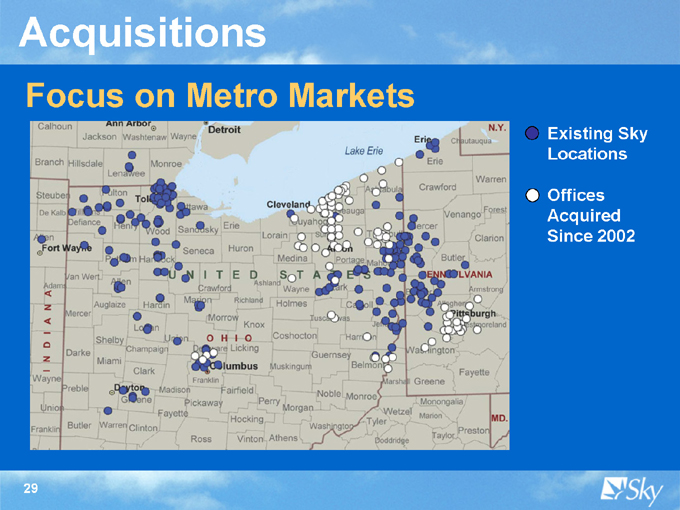
Acquisitions
Focus on Metro Markets
Existing Sky Locations
Offices Acquired Since 2002
29
Acquisitions
A Core Competency
?Experienced team to manage processes ?Conservative discipline ?Accretive in year one – cost saves only ?Must meet financial expectations ?Proven integration tactics
All Sky acquisitions have met financial expectations
30

Maximizing Shareholder Value
Overview
1. Aggressive Performance Goals
2. Solid Operating Performance
3. Balance Sheet Strength
4. Well-managed Interest Rate Risk
5. Strong Growth Profile
31
Aggressive Performance Goals
Strategic Vision
A community-based, integrated financial services company
Led by strong regional presidents who “own” the delivery channels ?Driven by aggressive sales and service process Characterized by high-quality operations/ technology and product/business line experts
32
Aggressive Performance Goals
Operating EPS Growth of 10-12%
Committed to perform among the top 25% of the 100 largest banks in the U.S. in terms of:
ROTE ROTA
Efficiency Ratio Sound Asset Quality
33
Aggressive Performance Goals
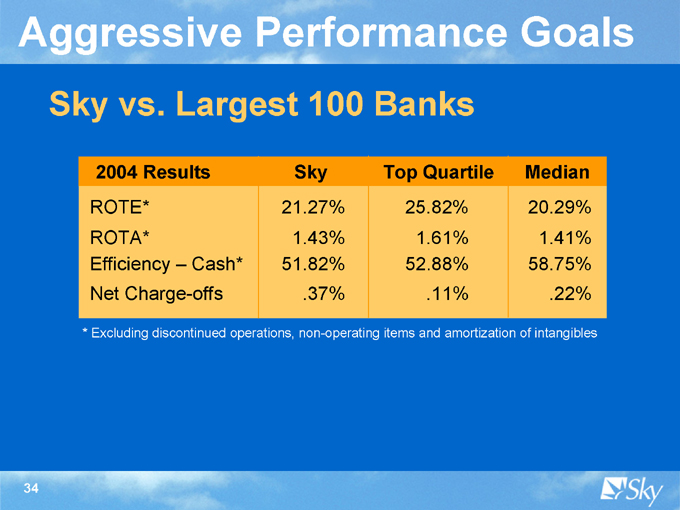
Sky vs. Largest 100 Banks
2004 Results Sky Top Quartile Median
ROTE* 21.27% 25.82% 20.29%
ROTA* 1.43% 1.61% 1.41%
Efficiency – Cash* 51.82% 52.88% 58.75%
Net Charge-offs .37% .11% .22%
* Excluding discontinued operations, non-operating items and amortization of intangibles
34
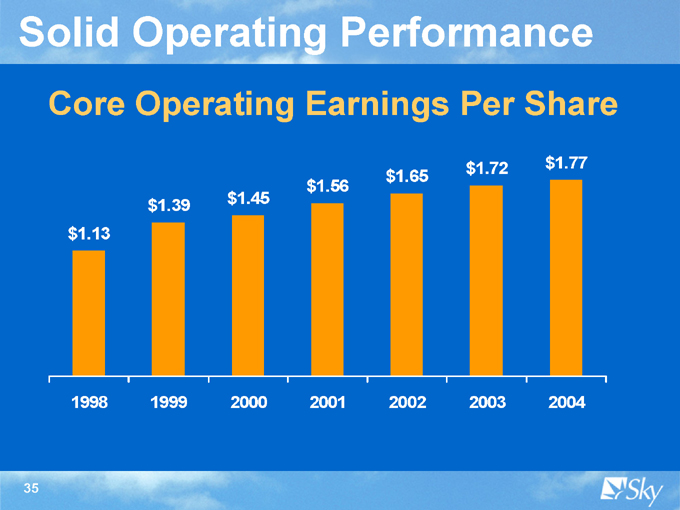
Solid Operating Performance
Core Operating Earnings Per Share $1.13 $1.39 $1.45 $1.56 $1.65 $1.72 $1.77
1998 1999 2000 2001 2002 2003 2004
35
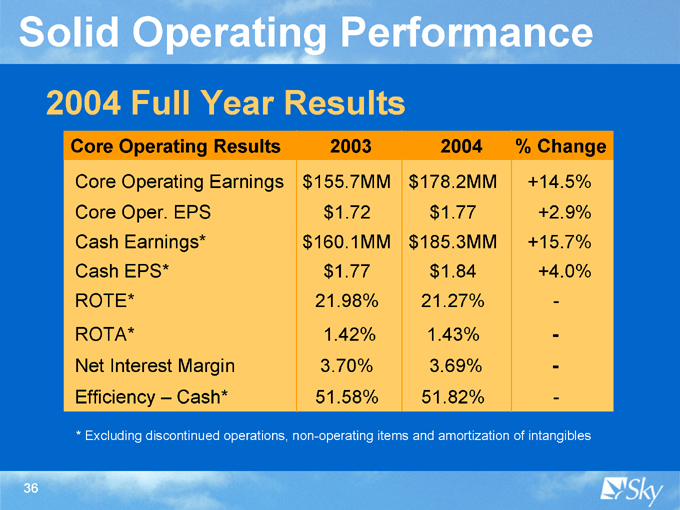
Solid Operating Performance
2004 Full Year Results
Core Operating Results 2003 2004 % Change
Core Operating Earnings $155.7MM $178.2MM +14.5%
Core Oper. EPS $1.72 $1.77 +2.9%
Cash Earnings* $160.1MM $185.3MM +15.7%
Cash EPS* $1.77 $1.84 +4.0%
ROTE* 21.98% 21.27% -
ROTA* 1.42% 1.43% -
Net Interest Margin 3.70% 3.69% -
Efficiency – Cash* 51.58% 51.82% -
* Excluding discontinued operations, non-operating items and amortization of intangibles
36
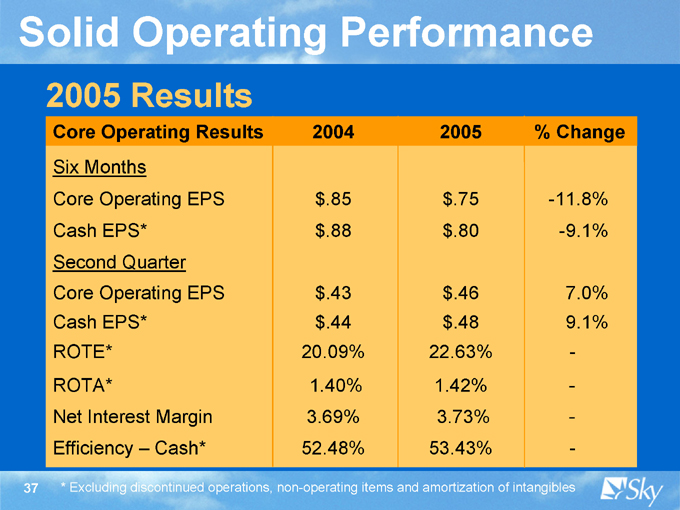
Solid Operating Performance
2005 Results
Core Operating Results 2004 2005 % Change
Six Months
Core Operating EPS $.85 $.75 -11.8%
Cash EPS* $.88 $.80 -9.1%
Second Quarter
Core Operating EPS $.43 $.46 7.0%
Cash EPS* $.44 $.48 9.1%
ROTE* 20.09% 22.63% -
ROTA* 1.40% 1.42% -
Net Interest Margin 3.69% 3.73% -
Efficiency – Cash* 52.48% 53.43% -
* Excluding discontinued operations, non-operating items and amortization of intangibles
37
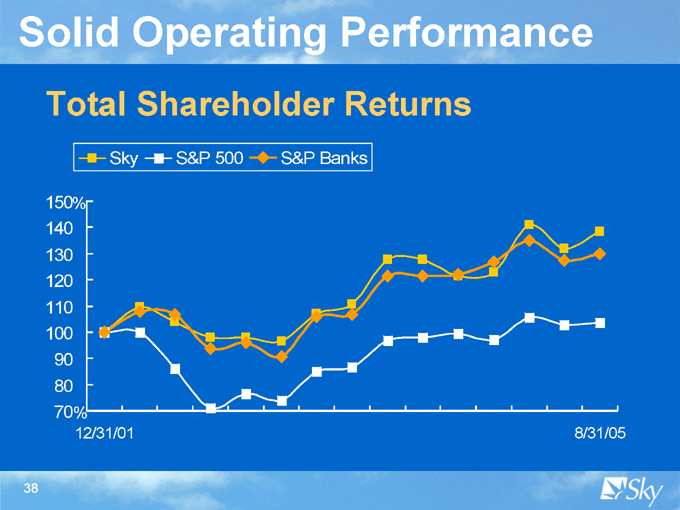
Solid Operating Performance
Total Shareholder Returns
Sky S&P 500 S&P Banks
150% 140 130 120 110 100 90 80
70 %
12/31/01
8/31/05
38
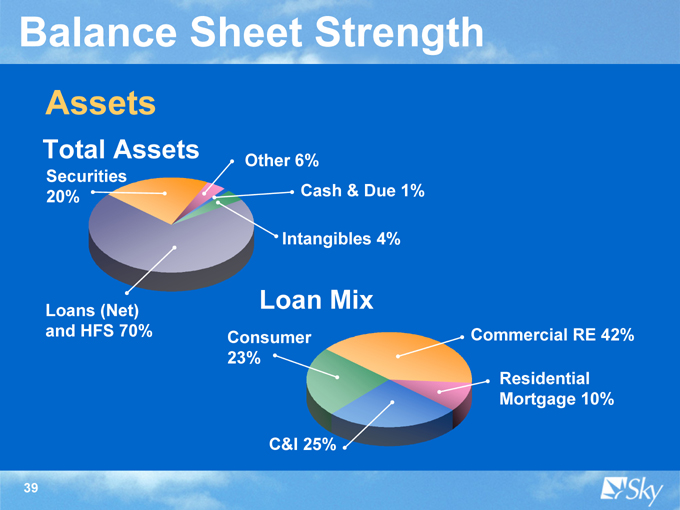
Balance Sheet Strength
Assets
Total Assets
Securities 20%
Other 6%
Cash & Due 1%
Intangibles 4%
Loans (Net) and HFS 70%
Loan Mix
Consumer 23%
Commercial RE 42%
Residential Mortgage 10%
C&I 25%
39
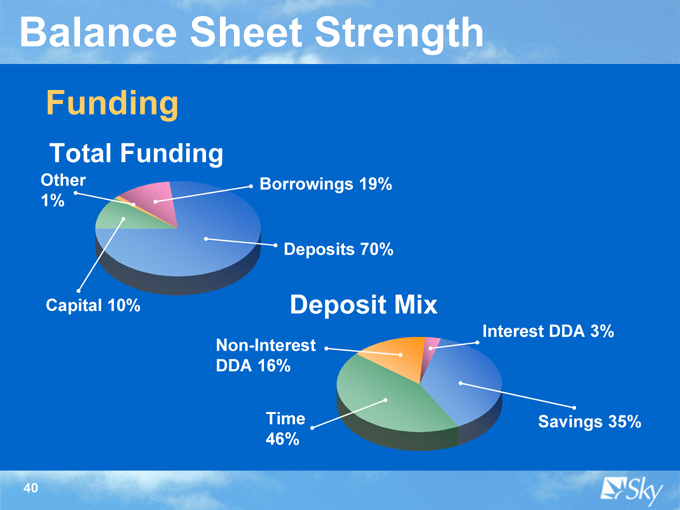
Balance Sheet Strength
Funding
Total Funding
Other 1%
Borrowings 19%
Deposits 70%
Capital 10%
Deposit Mix
Non-Interest DDA 16%
Time 46%
Interest DDA 3%
Savings 35%
40
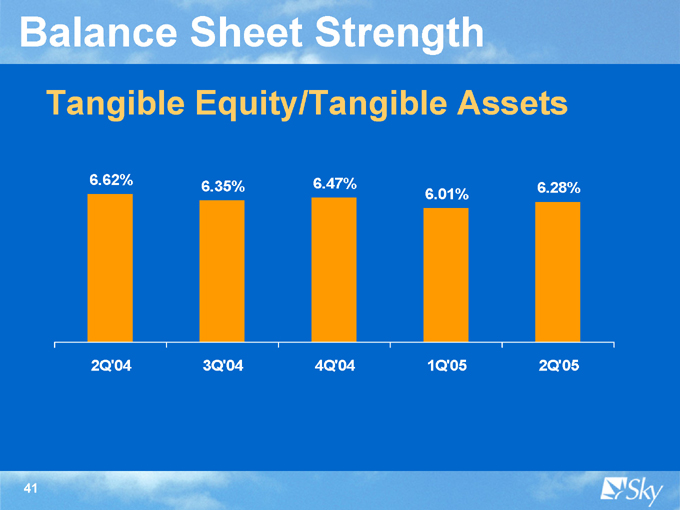
Balance Sheet Strength
Tangible Equity/Tangible Assets
6.62% 6.35% 6.47%
6.01% 6.28%
2Q’04 3Q’04 4Q’04 1Q’05 2Q’05
41
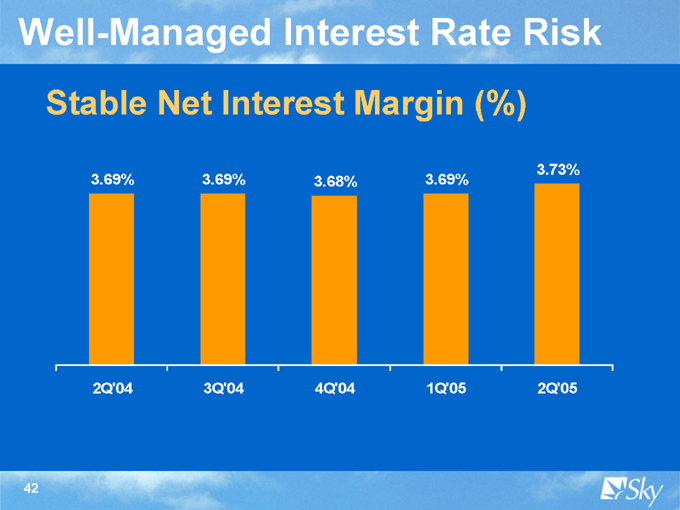
Well-Managed Interest Rate Risk
Stable Net Interest Margin (%)
3.73% 3.69% 3.69% 3.68% 3.69%
2Q’04 3Q’04 4Q’04 1Q’05 2Q’05
42
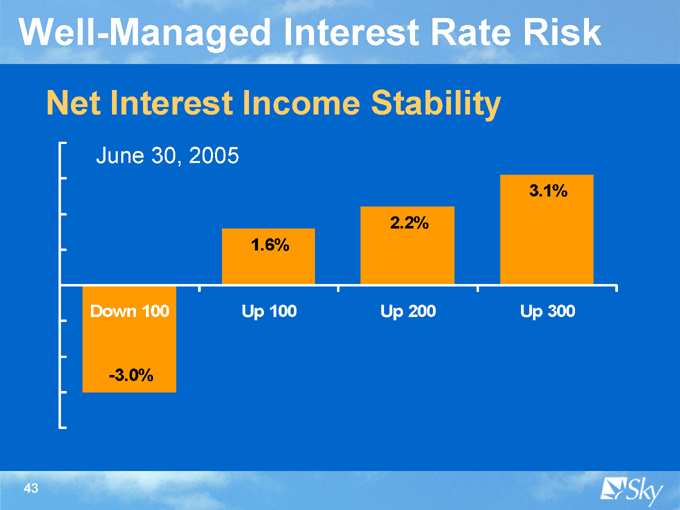
Well-Managed Interest Rate Risk
Net Interest Income Stability
June 30, 2005
3.1% 2.2% 1.6%
Down 100
-3.0%
Up 100
Up 200
Up 300
43
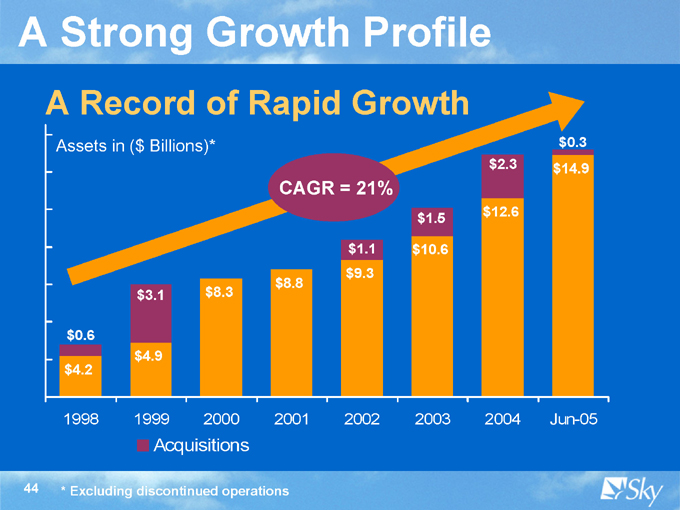
A Strong Growth Profile
A Record of Rapid Growth
Assets in ($Billions)*
CAGR = 21% $0.6
$4.2 $3.1
$4.9 $8.3 $8.8 $1.1 $9.3 $1.5
$10.6 $2.3
$12.6 $0.3 $14.9
1998 1999 2000 2001 2002 2003 2004 Jun-05
Acquisitions
* Excluding discontinued operations
44
Strong Growth Profile
Earnings Outlook
Core operating earnings for 3rd quarter estimated to be $.47 to $.48 per fully-diluted share
Full-year estimate = $1.69 to $1.72
Driven by:
Solid core growth Focus on DDA Growth
Margin improvement from rising rates Accelerating fee businesses Net charge-offs being well controlled Disciplined expense control
45
Maximizing Shareholder Value
1. Aggressive Performance Goals
2. Solid Operating Performance
3. Balance Sheet Strength
4. Well-managed Interest Rate Risk
5. Strong Growth Profile
46
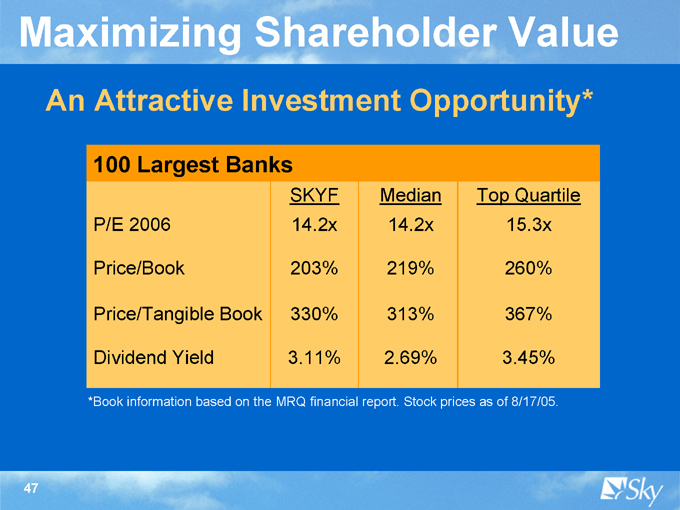
Maximizing Shareholder Value
An Attractive Investment Opportunity*
100 Largest Banks
SKYF Median Top Quartile
P/E 2006 14.2x 14.2x 15.3x
Price/Book 203% 219% 260%
Price/Tangible Book 330% 313% 367%
Dividend Yield 3.11% 2.69% 3.45%
*Book information based on the MRQ financial report. Stock prices as of 8/17/05.
47

Lehman Brothers
2005 Financial Services Conference September 13-15, 2005
Expanding Horizons
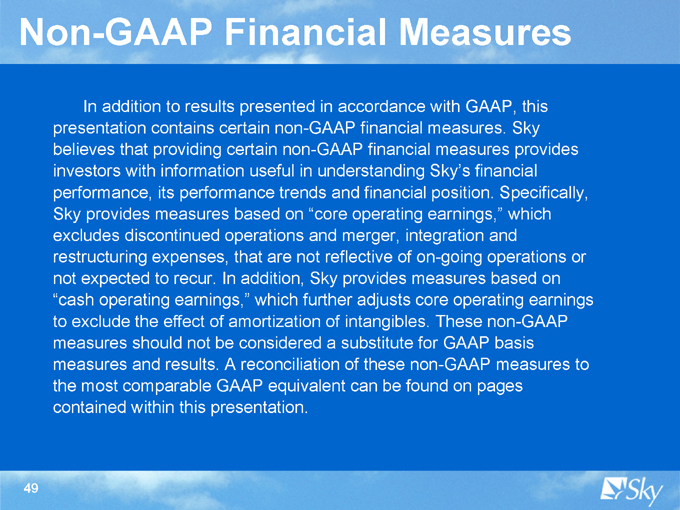
Non-GAAP Financial Measures
In addition to results presented in accordance with GAAP, this presentation contains certain non-GAAP financial measures. Sky believes that providing certain non-GAAP financial measures provides investors with information useful in understanding Sky’s financial performance, its performance trends and financial position. Specifically, Sky provides measures based on “core operating earnings,” which excludes discontinued operations and merger, integration and restructuring expenses, that are not reflective of on-going operations or not expected to recur. In addition, Sky provides measures based on “cash operating earnings,” which further adjusts core operating earnings to exclude the effect of amortization of intangibles. These non-GAAP measures should not be considered a substitute for GAAP basis measures and results. A reconciliation of these non-GAAP measures to the most comparable GAAP equivalent can be found on pages contained within this presentation.
49
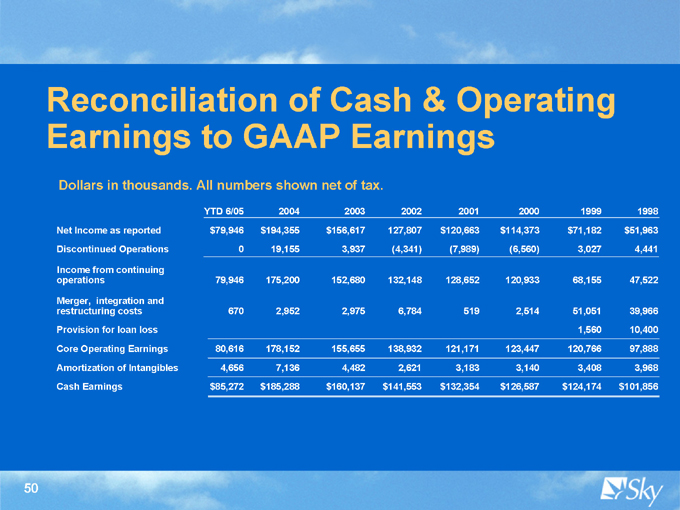
Reconciliation of Cash & Operating Earnings to GAAP Earnings
Dollars in thousands. All numbers shown net of tax.
YTD 6/05 2004 2003 2002 2001 2000 1999 1998
Net Income as reported $ 79,946 $ 194,355 $ 156,617 127,807 $ 120,663 $ 114,373 $ 71,182 $ 51,963
Discontinued Operations 0 19,155 3,937 (4,341) (7,989) (6,560) 3,027 4,441
Income from continuing
operations 79,946 175,200 152,680 132,148 128,652 120,933 68,155 47,522
Merger, integration and restructuring costs 670 2,952 2,975 6,784 519 2,514 51,051 39,966
Provision for loan loss 1,560 10,400
Core Operating Earnings 80,616 178,152 155,655 138,932 121,171 123,447 120,766 97,888
Amortization of Intangibles 4,656 7,136 4,482 2,621 3,183 3,140 3,408 3,968
Cash Earnings $ 85,272 $ 185,288 $ 160,137 $ 141,553 $ 132,354 $ 126,587 $ 124,174 $ 101,856
50
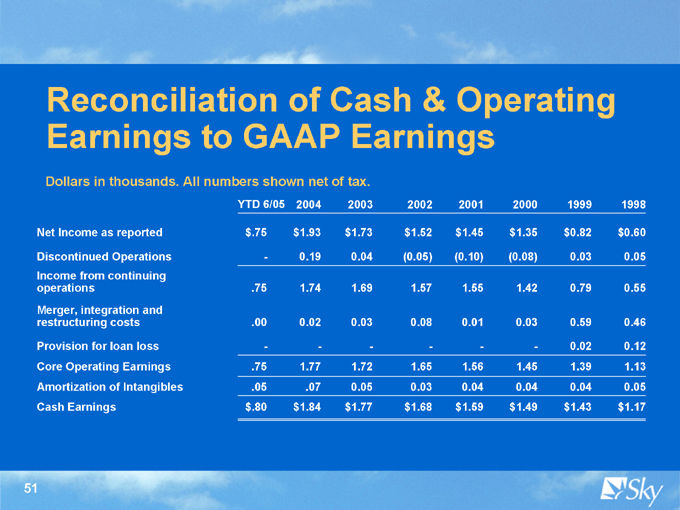
Reconciliation of Cash & Operating Earnings to GAAP Earnings
Dollars in thousands. All numbers shown net of tax.
YTD 6/05 2004 2003 2002 2001 2000 1999 1998 Net Income as reported $ .75 $ 1.93 $ 1.73 $ 1.52 $ 1.45 $ 1.35 $ 0.82 $ 0.60 Discontinued Operations - 0.19 0.04 (0.05) (0.10) (0.08) 0.03 0.05 Income from continuingoperations .75 1.74 1.69 1.57 1.55 1.42 0.79 0.55 Merger, integration andrestructuring costs .00 0.02 0.03 0.08 0.01 0.03 0.59 0.46 Provision for loan loss — — — — — — 0.02 0.12 Core Operating Earnings .75 1.77 1.72 1.65 1.56 1.45 1.39 1.13 Amortization of Intangibles .05 .07 0.05 0.03 0.04 0.04 0.04 0.05 Cash Earnings $.80 $1.84 $1.77 $1.68 $1.59 $1.49 $1.43 $1.17
51