2005 Annual Report
Sky Financial Group, Inc.


Financial Highlights
(Dollars in thousands, except per share data)
| | | | | | | | | | | | | | | | |
| | | | 2005 | | | 2004 | | | Percent Change |
| | For the Year | | | | | | | | | | | | | | |
| | Income from continuing operations | | $ | 182,191 | | | $ | 175,200 | | | | 4.0% |
| | Net income | | | 182,563 | | | | 194,355 | | | | (6.1) |
| | From Continuing Operations | | | | | | | | | | |
| | Return on average assets | | | 1.20 | % | | | 1.31 | % | | | – |
| | Return on average common equity | | | 12.25 | % | | | 14.24 | % | | | – |
| | Per Common Share Data | | | | | | | | | | | | | | |
| | Basic | | | | | | | | | | | | | | |
| | Income from continuing operations | | $ | 1.71 | | | $ | 1.76 | | | | (2.8)% |
| | Net income | | | 1.71 | | | | 1.95 | | | | (12.3) |
| | Diluted | | | | | | | | | | |
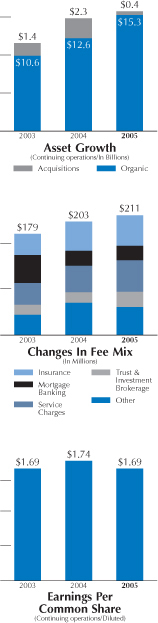
| | Income from continuing operations | | $ | 1.69 | | | $ | 1.74 | | | | (2.9)% |
| | Net income | | | 1.69 | | | | 1.93 | | | | (12.4) |
| | Dividends | | | 0.89 | | | | 0.85 | | | | 4.7% |
| | Book value at year end | | | 14.35 | | | | 13.77 | | | | 4.2 |
| | At Year End | | | | | | | | | | | | | | |
| | Assets | | $ | 15,683,291 | | | $ | 14,944,423 | | | | 4.9% |
| | Loans | | | 11,149,222 | | | | 10,616,118 | | | | 5.0 |
| | Deposits | | | 10,755,676 | | | | 10,351,591 | | | | 3.9 |
| | Shareholders’ equity | | | 1,553,877 | | | | 1,470,955 | | | | 5.6 |
| | | | | | | | | | | | | |
| | Quarterly Financial Highlights | | | | | | | | | | | | | | |
| | | | | First | | | | Second | | | | Third | | | Fourth |
| | 2005 | | | | | | | | | | | | | | |
| | Net interest income | | $ | 124,007 | | | $ | 128,000 | | | $ | 130,419 | | $ | 132,226 |
| | Provision for credit losses | | | 30,823 | | | | 5,894 | | | | 8,725 | | | 6,807 |
| | Income from continuing operations | | | 30,719 | | | | 47,786 | | | | 50,345 | | | 53,341 |
| | Income from discontinuing operations | | | – | | | | – | | | | – | | | 372 |
| | Net income | | | 30,719 | | | | 47,786 | | | | 50,345 | | | 53,713 |
| | Basic per share | | | | | | | | | | | | | | |
| | Income from continuing operations | | | 0.29 | | | | 0.45 | | | | 0.47 | | | 0.49 |
| | Net income | | | 0.29 | | | | 0.45 | | | | 0.47 | | | 0.50 |
| | Diluted per share | | | | | | | | | | | | | | |
| | Income from continuing operations | | | 0.29 | | | | 0.45 | | | | 0.46 | | | 0.49 |
| | Net income | | | 0.29 | | | | 0.45 | | | | 0.46 | | | 0.49 |
| | 2004 | | | | | | | | | | | | | | |
| | Net interest income | | $ | 101,803 | | | $ | 102,687 | | | $ | 122,516 | | $ | 124,305 |
| | Provision for credit losses | | | 6,665 | | | | 11,020 | | | | 8,360 | | | 11,615 |
| | Income from continuing operations | | | 39,952 | | | | 40,201 | | | | 46,148 | | | 48,899 |
| | Net income | | | 58,677 | | | | 40,201 | | | | 46,148 | | | 49,329 |
| | Basic per share | | | | | | | | | | | | | | |
| | Income from continuing operations | | | 0.43 | | | | 0.43 | | | | 0.44 | | | 0.46 |
| | Net income | | | 0.63 | | | | 0.43 | | | | 0.44 | | | 0.47 |
| | Diluted per share | | | | | | | | | | | | | | |
| | Income from continuing operations | | | 0.42 | | | | 0.43 | | | | 0.43 | | | 0.46 |
| | Net income | | | 0.62 | | | | 0.43 | | | | 0.43 | | | 0.46 |
| | | | |
| | |  | | | | | | | | | | | |

| | |
| Dear Fellow Shareholder: |

| | n 2005, Sky Financial Group demonstrated its strength by rising to meet challenges. With our disciplined approach and focus on our strategic priorities, we again produced solid financial results, despite a rising interest rate environment and uncharacteristically higher credit costs. This was accomplished by emphasizing expense control and strengthening our credit management to supplement our revenue growth strategies. |
Looking toward our growth in 2006 and beyond, we are extremely excited about the opportunity to expand our franchise into the Indianapolis, Indiana, market with our pending acquisition of Union Federal Bank. Indianapolis is a growing city that fits well within our footprint and metro market strategy. As we expand into new markets, we further enhance the Sky franchise by upholding our proven model of regional decision making driven by our five strategic priorities: organic growth, fee-based income, organizational synergies, sound asset quality and prudent acquisitions. Using the Sky Trek sales and service process, our regionally-empowered professionals attract, cultivate and retain more clients than ever before, putting us in prime position to realize our vision of Sky becoming the premier financial institution in the Midwest. |
| | |
 | | 2005 Performance Our commitment to profitable growth and high performance was clearly reflected in our 2005 results. Sky’s growth generated total revenues of $726 million for the year - up 11% - - with $11.1 billion in loans and $10.8 billion in deposits by year-end. Despite rising rates and a flat yield curve, our net interest margin improved to 3.73% for the year compared to 3.69% in 2004. As for our fee-based businesses, Sky Trust revenues grew 20%, and our investment sales gained 26%. Despite a soft insurance market, Sky Insurance had a solid year with commissions increasing by 5%. Mortgage banking revenues held steady on originations of $1.3 billion, despite continuing economic challenges on regional and national levels. |
| | |
| Even while growing, Sky upheld our disciplined practices surrounding efficiency and asset quality. Our operating efficiency ratio, including the integration costs of two bank mergers, remained superior to peers at 54.85%, demonstrating our strong expense control culture. While the ratio of net credit losses to average total loans rose to .57% in 2005 – versus .37% last year – the level of non-performing loans was significantly reduced during the year, declining from 1.35% of total loans to 1.07% at year-end 2005. |
1
| | |
 | | ur 2005 net income was $1.69 per share, reflecting a strong finish to the year after the impact of atypical credit losses in the first quarter, but not reaching the level achieved in 2004, which was bolstered by a gain from Sky’s sale of its dental finance unit, Sky Financial Solutions. Importantly, our 2005 earnings results also included the first-time expense of stock options due to our adoption of the accounting standard FAS No. 123(R) Share-Based Payment. |
Most importantly, Sky’s three-year total return to shareholders of 54% has outperformed our peers and is a clear indicator of the validity of our goals, strategies and decisions. Cultivating Our Client Base At Sky, our highest priority remains that of organic growth. The catalyst for that growth lies in our sales and service model, Sky Trek, which empowers our professionals, tracks their progress and rewards their achievements. Regional management teams make lending decisions, set competitive pricing and implement service initiatives based upon the needs of their markets, while sales professionals make referrals for fee-based products and services. The result is superior client service by the most efficient means possible. It is this service excellence that enables us to retain and cultivate existing clients while attracting new business. The 2005 Sky Trek campaign “Under One Sky” emphasized internal referrals among sales and support units to match client needs with Sky’s products and services. This integration and partnership leveraged the full force of the Sky organization to deliver more than 762,000 referrals, representing a 12% increase from 2004. The success of “Under One Sky” was also driven by our increase in proactive sales and service techniques. During 2005, our regional sales force initiated and completed more than 738,000 tele-consulting contacts with clients – a 30% increase from the previous year. Sky professionals employed another proven sales tool, the financial needs analysis profile (FiNAP), to identify our clients’ current and future needs for Sky’s financial services. In 2005, our staff increased the number of completed FiNAPs by 26%. The Sky Trek philosophy stresses growth not only by serving more clients, but also by serving existing clients more. This year, the number of households new to Sky grew 17%, and the number of net, new checking accounts increased by 10%. Likewise, our sales team increased the number of households with 2 to 3 services by 7%, and the number of households with four or more services grew by more than 16%. “Under One Sky” also prompted fee-based growth in the areas of trust, investment sales and commercial fee revenue. Notably, Sky Trust reported $4.8 billion in assets in 2005 and a 20% annualized growth in revenue. In August 2005, John S. Gulas became president and CEO for Sky’s wealth management business. John and his team will be focused on increasing client relationships within private banking, asset management, trust administration, retirement planning and retail brokerage services in order to continue their growth. Sky Insurance products presented yet another area of organic growth opportunity, as referrals to and from our insurance and bank units alone posted an increase of more than 400% in 2005. Sky Insurance continues its targeted acquisition strategy to consolidate multiple agencies under the Sky brand and grow its franchise. During 2005, Sky Insurance earned $55 million in commissions and acquired three new agencies, which will support and expand this division’s expertise and marketability. |
2
|
Driving Growth In 2005, Sky grew to $15.7 billion in assets and expanded our delivery channels to 290 financial centers and more than 300 ATMs in Ohio, Pennsylvania, Michigan, Indiana and West Virginia. In June, we completed the acquisition of Belmont Bancorp (Bridgeport, Ohio). This acquisition included Belmont National Bank, a $297 million commercial bank with 12 full-service branches located in Belmont, Harrison and Tuscarawas counties in Ohio and Ohio County in West Virginia. Belmont complemented our presence in the Ohio Valley Region and allowed Sky to expand in the Wheeling, West Virginia, market. In December, Sky acquired Falls Bank (Stow, Ohio), gaining $83.6 million in assets and adding two full-service branches to our Western Reserve Region. The acquisition of Falls Bank was strategically aligned with our expansion into the growth market of Akron/Canton. Falls Bank also enhanced our focus on superior client service and local decision-making. In early February 2006, Sky announced its pending acquisition of Union Federal Bank of Indianapolis and its parent company, Waterfield Mortgage Company, in Ft. Wayne, Indiana. Union Federal is the fourth largest bank in Indianapolis and operates 44 full-service banking centers. Sky will acquire only Waterfield’s retail and commercial banking business, which is conducted primarily through Union Federal Bank. Indianapolis - much like Columbus - is a growing Midwestern metropolitan market that offers a wealth of opportunity for our company. Union Federal fits well with Sky’s regional philosophy and culture of service. Upon completion of the merger, the Union Federal banking structure will become Sky’s ninth region with its own regional board, regional president and leadership team. Waterfield’s insurance affiliate, Waterfield Insurance Agency, will later be integrated with Sky Insurance. After the closing of this transaction, 40% of Sky’s deposits will be held in the major metro markets in our footprint. During 2005, Sky Insurance acquired three companies, adding to our presence in target markets, our expertise and our client base. In August, B.K.M.’s Benefit Design Agency of Ohio, Inc. (Findlay, Ohio) merged into Sky Insurance and added valuable expertise about employee benefits that complemented and enhanced our existing business in Northwest Ohio. In October, Sky Insurance acquired two agencies in Wooster, Ohio, both of which helped bolster our presence near the Akron/Canton market - a target growth area for Sky Insurance. Becker-McDowell Agency, Inc., a well respected employee benefits agency, was one of the region’s top insurers, and Steiner Insurance Agency’s expertise included property and casualty insurance, which coordinated with our expanding opportunities for commercial clients. In January 2006, Sky Insurance acquired the Peter B. Burke Insurance Agency in Pittsburgh, Pennsylvania, which added property, casualty and surety services to our existing presence in that metro market. Each of these acquisitions is a result of our established growth strategy. They have all met the high standards set forth to ensure a strong fit of philosophies and services. We will continue to build the Sky franchise by seeking similar opportunities in the growing metropolitan areas of the Midwest, while maintaining our financial discipline. |
3
| | |
| Maximizing Efficiencies |
 | | ky is dedicated to providing the highest quality services and products to our clients, while maximizing our efficiency and profitability. Technological tools can help us accomplish both goals, and 2005 held several major technological consolidations and advancements for the company. The first of these was the establishment of a new processing platform for all of Sky’s Automated Teller Machines (ATMs). Not only did this consolidation reduce expenses in core information processing, but our ATMs now have a standard screen presentation and transaction processing capabilities for all clients. As a part of this installation, we also consolidated all ATM and CheckCard processing under one system. This provides enhanced fraud protection, management reporting improvements and improved client service capabilities. |
In the second quarter of 2005, Sky opened a centralized item processing facility in Brecksville, Ohio, which enhanced our client service and improved our processing efficiencies. Through the upgraded platform, we completely integrated item processing and image archive capabilities and improved our fraud detection features. Brecksville is now the primary site for our item and remittance processing services, which allows us to offer our clients a broader range of image-based services, including the new Check 21 check image technology. The facility also provides enhanced processing capabilities including positive pay, controlled disbursement, a more robust image archive to support client needs, and integrated wholesale and retail lockbox processing. In the summer of 2005, we introduced a new suite of business online banking products with extensive cash management features. With this new online platform, Sky is able to focus on new potential online commercial banking clients from small businesses to large corporations. For our small to mid-market business segment - our core commercial client base - our new online product provides real-time views of financial position, tools to maximize cash flow, online lockbox images, positive pay, bill pay and online ACH tax payments. For our larger corporate clients, we can now offer a powerful payment engine, advanced entitlements, an extended wire payments module and reporting tools for managing the cash position of even the most complex operation. These technology improvements were among Sky’s organizational synergy initiatives and expense control measures that were vital to improving our financial performance throughout the year. Helping to lead these technological implementations is our change management office. This area uses disciplined approaches and standard practices to assure the successful completion of our strategic initiatives. In addition, all employees at Sky are encouraged to provide process improvement plans and to examine areas in which their departments or offices can save money. This past year, literally hundreds of expense control initiatives were implemented throughout the company. Efforts at every level of the organization contributed to our superior efficiency ratio, even as we expanded through organic growth and acquisitions. Maintaining Asset Quality At Sky, strong asset quality has always been one of our strategic priorities and a characteristic strength of our company. While our net charge-offs for the year increased due to first quarter credit losses; primarily from two large commercial credits and the sale of a group of non-performing real estate loans; our credit management remains strong and focused. |
4
|
We were pleased with the significant reduction in non-performing loans accomplished during the year, and we are confident that our conservative credit culture and prudent lending procedures that have historically led to sound asset quality will continue to support our growth strategies in 2006 and beyond. Refining Strategic Priorities While Sky’s focus on our five strategic priorities has been a proven catalyst for success since Sky’s formation, our vision and strategy requires regular review and refinement to help us improve and grow. In 2006, to enhance our strong position, we are committed to improving client satisfaction, organizational talent and internal efficiency. To maximize our client base, Sky must not only increase the number of clients who are satisfied with our service, but also decrease the number of clients who leave the organization. To achieve our goal of superior levels of client satisfaction, we will improve our already successful Sky Trek sales and service model. New initiatives will focus on extensive training and strong support for all Sky employees, as well as improved measurement tools. With Sky Trek, our staff will be more equipped and motivated to provide the excellent client service that attracts and retains clients, thus driving our organic growth. Highly talented employees at all levels of the organization are integral to achieving our strategic goals and performance commitments. In order to maintain excellence among our staff, we continue to develop a competitive, rewarding and effective work environment. This includes aggressive recruitment, internal advancement opportunities and effective staffing levels. These initiatives - in collaboration with our commitment to superior client service - make Sky distinctive among our peers. As we continue to grow and evolve as a Midwest financial services leader, we must constantly evaluate and advance our organizational structure and processes to optimize efficiency and growth. To meet these complex challenges, Sky is evaluating how organizational effectiveness can be improved through the clear definition of roles, responsibilities and accountabilities; through new risk management systems; and through the strategic allocation of resources and technologies. With these initiatives, we are striving to enhance revenue growth and profitability by establishing organizational consistency while maintaining the flexibility to respond to different market circumstances and opportunities. Moving Forward With a strong finish to 2005 and a new opportunity in a pivotal market, we are primed for new growth. In 2006, we look forward to expanding our successful regional financial services model by continuing to improve the things we do well and creating value for our clients, employees and shareholders. |
 |
| Marty E. Adams |
| Chairman, President and CEO |
5
Sky Financial Group Board of Directors
| | | | | | |
 | |  | |  | |  |
| | | |
Marty E. Adams1 Chairman, President & CEO Sky Financial Group, Inc. | | George N. Chandler II5 Retired VP Cleveland Cliffs, Inc. | | Robert C. Duvall2 Retired | | Marylouise Fennell, RSM4 Partner Higher Education Services |
| | | |
 | |  | |  | |  |
| | | |
D. James Hilliker4 Vice President Better Food Systems, Inc. | | Fred H. “Sam” Johnson III2 President & CEO Summitcrest, Inc. Treasurer, Origen, Inc. | | Jonathan A. Levy1 Lead Director Sky Financial Group, Inc. Partner/Redstone Investments | | Gerard P. Mastroianni1, 4 President Alliance Ventures |
| | | |
 | |  | |  | | |
| | | |
Thomas J. O’Shane5 Retired Senior Executive Vice President Sky Financial Group, Inc. | | Gregory L. Ridler1, 5 Retired Chairman Mahoning Valley Region of Sky Bank | | Emerson J. Ross, Jr.1, 3 Retired Manager, Corporate Community Relations Owens Corning | | |
| | | |
 | |  | |  | | Committees 1 Executive 2 Audit 3 Governance &
Nominating 4 Compensation 5 Risk Management |
| | | |
C. Gregory Spangler1, 2 Chairman Spangler Candy Company | | Joseph N. Tosh II3 Retired Chairman Western Pennsylvania Region of Sky Bank | | R. John Wean III3 Co-owner & President of Specialties la Cote Basque Finance Committee, Grantmakers of Western Pennsylvania | | |
6
Sky Boards of Directors and Management
| | | | | | |
Sky Bank Regional Boards Greater Cleveland Region Robert M. Biggar Ralph M. Della Ratta, Jr. Richard R. Hollington III Norman J. Kotoch Bracy E. Lewis Richard M. Osborne, Jr. * Ernesto J. Poza Mahoning Valley Region Randall P. Baker William J. Bresnahan Raymond J. Briya Lee Burdman Rex A. Ferry * Frank Hierro Chander M. Kohli, M.D. Edward W. Muransky John L. Pogue Ben Z. Post Mid Am Region Joel S. Beren Paul C. Betz David A. Bryan Floyd D. Craft Ralph W. Gallagher Kathleen S. Hanley Patrick J. Johnson * G. Ray Medlin, Jr. Dane C. Nelson Sharon S. Speyer Ohio Bank Region Jon C. Ballinger Timothy R. Clark John A. Cole John C. Fergus II Ronald L. Geese Samuel J. Kiehl III * Thomas J. Weissling Doug E. Zimmerman Ohio Valley Region Keith D. Burgett * Paul P. Carapellotti David E. D’Anniballe Carl N. Frankovitch John H. Goodman Terrence A. Lee James C. McBane Carl M. Noretto Brian L. Schambach William C. Shivers Jayson M. Zatta | | Pittsburgh Region Paul F. Lackner Vincent W. Locher Demetrios (Jim) T. Patrinos * Mary Pat Soltis Charles A. Warden Robert T. Woodings III Western Reserve Region Louis M. Altman Dr. David A. Bitonte Fred J. Haupt * Rick L. Hull Paul T. Schumacher Lester S. Sherman Paul J. Testa Western Pennsylvania Region Del E. Goedeker Thomas E. Libeg Floyd H. McElwain * Barbara Bateman McNees Roger W. Richards Stephen R. Sant Steven C. Warner Sky Trust Board Marty E. Adams * John S. Gulas David L. Hayes Richard R. Hollington III Randall C. Hunt Harold F. Reed, Jr. Gregory L. Ridler Karl B. Schroedel II Patrick A. Sebastiano Richard E. White Sky Insurance Board Marty E. Adams Jerry J. Batt George N. Chandler II Charles I. Homan Edward J. Reiter George Rumman Samuel E. Smiley D.D.S. Scott C. Smith *Also serves on Sky Bank Corporate Board of Directors along with Thomas J. O’Shane. | | Sky Financial Group Executive Management Marty E. Adams Chairman, President & CEO Perry C. Atwood SVP/Director of Sales Caren L. Cantrell EVP/Chief Operations Officer of Sky Bank Phillip C. Clinard SVP/Director of Change
Management Office John S. Gulas President & CEO of Sky Trust Richard R. Hollington III Greater Cleveland Region
Regional President Frank J. Koch EVP/Senior Credit Officer Thomas A. Sciorilli SVP/Chief Human Resources Officer Curtis E. Shepherd SVP/Director of Marketing and Product Development W. Granger Souder, Jr. EVP/General Counsel Les Starr EVP/Operations and
Information Technology Kevin T. Thompson EVP/Chief Financial Officer | | Sky Bank Regional Presidents Frank Hierro Mahoning Valley Region Richard R. Hollington III Greater Cleveland Region Vincent W. Locher Pittsburgh Region Stephen R. Sant Western PA Region Sharon S. Speyer Mid Am Region Rick L. Hull Western Reserve Region Thomas J. Weissling Ohio Bank Region Jayson M. Zatta Ohio Valley Region Sky Insurance Jerry J. Batt President & CEO Edward D. Rawlings Regional President/Pennsylvania Sky Trust John S. Gulas President & CEO |
7

SEC FORM 10-K
UNITED STATES
SECURITIES AND EXCHANGE COMMISSION
WASHINGTON, D.C. 20549
FORM 10-K
| x | ANNUAL REPORT PURSUANT TO SECTION 13 OR 15(d) OF THE SECURITIES EXCHANGE ACT OF 1934 |
For the fiscal year ended December 31, 2005
Commission File No. 1-14473

Sky Financial Group, Inc.
(Exact Name of Registrant as Specified in its Charter)
| | |
| Ohio | | 34-1372535 |
(State of Other Jurisdiction of Incorporation or Organization) | | (IRS Employer Identification Number) |
| |
| 221 South Church Street, Bowling Green, Ohio | | 43402 |
| (Address of Principal Executive Office) | | (Zip Code) |
(419) 327-6300
(Registrant’s Telephone Number)
Securities registered pursuant to Section 12 (b) of the Act: None
Securities registered pursuant to Section 12 (g) of the Act:
Common Stock, without par value
(Title of class)
Indicate by check mark if the registrant is a well-known seasoned issuer, as defined in Rule 405 of the Securities Act. Yes x No ¨
Indicate by check mark if the registrant is not required to file reports pursuant to Section 13 or Section 15(d) of
the Act. Yes ¨ No x
Indicate by check mark whether the registrant (1) has filed all reports required to be filed by Section 13 or 15 (d) of the Securities Exchange Act of 1934 during the preceding 12 months (or for such shorter period that the registrant was required to file such reports), and (2) has been subject to such filing requirements for the past 90 days. Yes x No ¨
Indicate by check mark if disclosure of delinquent filers pursuant to Item 405 of Regulation S-K is not contained herein, and will not be contained, to the best of registrant’s knowledge, in definitive proxy or information statements incorporated by reference in Part III of the Form 10-K or any amendment to this Form 10-K.x
Indicate by check mark whether the registrant is large accelerated filer, an accelerated filer, or a non-accelerated filer. See definition of “accelerated filer and large accelerated filer” in Rule 12b-2 of the Exchange Act. (Check one):
Large accelerated filer x Accelerated filer ¨ Non-accelerated filer ¨
Indicate by check mark whether the registrant is a shell company (as defined in Rule 12b-2 of the Act). Yes ¨ No x
State the aggregate market value of the voting and non-voting common equity held by non-affiliates of the registrant as of June 30, 2005, the last business day of the registrant’s most recently completed second fiscal quarter: $2,759,260,424.
The number of shares outstanding of the Registrant’s common stock, without par value was 108,433,993 at February 10, 2006.
Certain specifically designated portions of Sky Financial Group, Inc.’s definitive Proxy Statement dated March 6, 2006 for its 2006 Annual Meeting of Shareholders are incorporated by reference into Part III of this Form 10-K.
2
PART I
Item 1.Business
Sky Financial Group, Inc. (Sky Financial) is a $15.7 billion financial holding company located in Bowling Green, Ohio that owns one commercial bank primarily engaged in commercial and consumer banking business at over 290 financial centers and 300 ATMs located in Ohio, western Pennsylvania, southern Michigan, eastern Indiana and northern West Virginia. Sky Financial also operates businesses relating to insurance, trust and other related financial services. Since 2004, Sky Financial completed the following acquisitions and divestitures and announced the following pending acquisition:
| n | | On February 3, 2006, Sky Financial announced the execution of a definitive agreement to acquire Union Federal Bank of Indianapolis (Union Federal) and its parent company, Waterfield Mortgage Company, Incorporated (Waterfield), Ft. Wayne, Indiana. |
| n | | On January 3, 2006, Sky Financial acquired the Peter B. Burke Agency, Inc. located in Pittsburgh, Pennsylvania. |
| n | | On November 29, 2005, Sky Financial acquired Falls Bank, an $80 million bank that operated two full-service branches in the Akron, Ohio market. |
| n | | On October 4, 2005, Sky Financial acquired Becker-McDowell Agency, Inc. and Steiner Insurance Agency, Inc., both located in Wooster, Ohio. |
| n | | On August 1, 2005, Sky acquired B.K.M.’s Benefit Design Agency of Ohio, Inc., located in Findlay, Ohio. |
| n | | On June 1, 2005, Sky Financial acquired Belmont Bancorp, a $297 million bank holding company headquartered in St. Clairsville, Ohio, and its wholly-owned subsidiary, Belmont National Bank. |
| n | | On November 30, 2004, Sky Financial acquired Prospect Bancshares and its wholly-owned subsidiary Prospect Bank, a $202 million savings bank located in Worthington, Ohio. |
| n | | On July 1, 2004, Sky Financial acquired Second Bancorp, Inc. and its wholly-owned subsidiaries, The Second National Bank of Warren and Stouffer-Herzog Insurance Agency, Inc. Second National Bank was a $2.0 billion commercial bank located in Warren, Ohio. |
| n | | On March 31, 2004, Sky Financial sold Sky Financial Solutions, Inc., its specialized medical/dental financing unit located in Columbus, Ohio. |
The Holding Company
Sky Financial’s corporate philosophy is to operate as a locally-oriented, community-based financial service organization, augmented by centralized support in select critical areas. This local market orientation is reflected in its financial centers and regional advisory boards comprised of local business persons, professionals and other community representatives that assist the bank in responding to local banking needs. Sky Financial’s bank subsidiary concentrates on client service and business development, while relying upon the support of Sky Financial for operational functions that are not readily visible to clients and those that are critical to risk management. Asset quality review, mortgage banking activities, financial reporting, investment activities, internal audit, compliance and funds management are among the functions that are overseen at the holding company level.
Sky Financial’s market area is economically diverse, with a base of manufacturing, service, transportation and agriculture industries, and thus Sky Financial is not dependent upon any single industry or employer. Similarly, Sky Financial’s client base is diverse, and Sky Financial and its subsidiaries are not dependent upon any single industry or upon any single client.
Sky Financial’s strategic plan includes organically growing loans and deposits from a focused sales and service culture, increasing fee-based income, strengthening organizational synergies to manage operating costs, maintaining strong asset quality and acquiring financial institutions, branches and financial service businesses. Sky Financial seeks acquisition partners, which have experienced management, and possess either significant market presence or have potential for improved profitability through financial management, economies of scale and expanded services.
There is significant competition among commercial banks in Sky Financial’s market area. As a result of the deregulation of the financial services industry, Sky Financial also competes with other providers of financial services such as savings and loan associations, credit unions, consumer finance companies, securities firms, insurance companies, insurance agencies, commercial finance and leasing companies, the mutual funds industry, full-service brokerage firms and discount brokerage firms. Some of Sky Financial’s competitors, including certain regional bank holding companies, which have made acquisitions in Sky Financial’s market area, have greater resources than those of Sky Financial, and as such, may have higher lending limits and may offer other services not available through Sky Financial’s bank and non-bank subsidiaries. The bank and non-bank subsidiaries compete on the basis of rates of interest charged on loans, the rates of interest paid for funds, the availability of services and the responsiveness to the needs of its clients.
Sky Financial’s executive offices are located at 221 South Church Street, P.O. Box 428, Bowling Green, Ohio, and its telephone number is 419-327-6300.
The Bank Subsidiary
Sky Bank, headquartered in Salineville, Ohio, had total assets of $15.5 billion at December 31, 2005, and operates financial centers in Ohio, western Pennsylvania, southern Michigan, eastern Indiana and northern West Virginia. Sky Bank engages in commercial and consumer banking, including the acceptance of a variety of demand, savings and time deposits and the extension of commercial and consumer loans. Falls Bank merged with Sky Bank on December 3, 2005, and Belmont National Bank was merged into Sky Bank on June 3, 2005.
The Financial Services Subsidiaries
Sky Trust, National Association (Sky Trust), a wholly-owned subsidiary of Sky Financial, is headquartered in Pepper Pike, Ohio, and provides a full range of trust and employee benefit services to its commercial and consumer clients.
Sky Insurance, Inc. (Sky Insurance), Maumee, Ohio, is Sky Financial’s full service insurance agency offering a variety of insurance products and services to its clients. On August 1, 2005, B.K.M.’s Benefit Design Agency of Ohio, Inc. was acquired and merged into Sky Insurance. On October 4, 2005, Becker-McDowell Agency, Inc. and Steiner Insurance Agency, Inc. were acquired and merged into Sky Insurance.
Sky Financial has various other subsidiaries that are not significant to the consolidated entity.
3
Competition
The financial services industry is highly competitive. Sky Financial and its subsidiaries compete with other local, regional and national financial service providers, such as other financial holding companies, commercial banks, savings associations, credit unions, finance companies, leasing companies, and brokerage and insurance firms. The financial services industry is likely to become more competitive as further technological advances enable more companies to provide financial services on a more efficient and convenient basis.
Supervision and Regulation
Introduction
Sky Financial, its banking subsidiary and many of its non-banking subsidiaries are subject to extensive regulation by federal and state agencies. The regulation of bank holding companies and their subsidiaries is intended primarily for the protection of depositors, federal deposit insurance funds and the banking system as a whole and not for the protection of security holders. Although Sky Financial is recognized as a financial holding company, most regulations pertaining to bank holding companies also apply to it. As discussed in more detail below, this regulatory environment, among other things, may restrict Sky Financial’s ability to diversify into certain areas of financial services, acquire depository institutions in certain states and pay dividends on its capital stock. It may also require Sky Financial to provide financial support to its banking subsidiary, maintain capital balances in excess of those desired by management and pay higher deposit insurance premiums as a result of the deterioration in the financial condition of depository institutions in general.
Regulatory Agencies
Holding Company. Sky Financial is a financial holding company subject to regulation under the Bank Holding Company Act of 1956 (BHCA), as amended, and to inspection, examination and supervision by the Board of Governors of the Federal Reserve System under the BHCA.
Subsidiary Bank. Sky Financial’s banking subsidiary is subject to regulation and examination primarily by the Ohio Division of Financial Institutions and the Federal Reserve Board and secondarily by the Federal Deposit Insurance Corporation (FDIC).
Financial Services Subsidiaries. Many of Sky Financial’s financial services subsidiaries also are subject to regulation by the Federal Reserve Board and other applicable federal and state agencies. Sky Financial’s insurance subsidiaries are subject to regulation by applicable state insurance regulatory agencies. Other non-bank subsidiaries of Sky Financial are subject to the laws and regulations of both the federal government and the various states in which they conduct business. Sky Trust, Sky Financial’s trust services affiliate, is regulated by the Office of the Comptroller of the Currency (OCC).
Securities and Exchange Commission (SEC) and NASDAQ. Sky Financial is also under the jurisdiction of the SEC and certain state securities commissions for matters relating to the offering and sale of its securities. Sky Financial is subject to the disclosure and regulatory requirements of the Securities Act of 1933, as amended, and the Securities Exchange Act of 1934, as amended, as administered by the SEC. Sky Financial is listed on the NASDAQ Stock Market under the trading symbol “SKYF,” and is subject to the rules of NASDAQ for listed companies.
Bank Holding Company Activities
Interstate Banking. Under the Riegle-Neal Interstate Banking and Branching Efficiency Act of 1994 (“Riegle-Neal Act”), as amended, a bank holding company may acquire banks in states other than its home state, subject to certain limitations. The Riegle-Neal Act also authorizes banks to merge across state lines, thereby creating interstate branches. Banks are also permitted to acquire and to establish de novo branches in other states where authorized under the laws of those states.
Regulatory Approval. Under the BHCA, prior approval of the Federal Reserve Board is required for the acquisition of more than 5% of the voting stock of any bank. In determining whether to approve a proposed bank acquisition, federal banking regulators will consider, among other factors, the effect of the acquisition on competition, the public benefits expected to be received from the acquisition, the projected capital ratios and levels on a post-acquisition basis, and the acquiring institution’s record of addressing the credit needs of the communities it serves, including the needs of low and moderate income neighborhoods, consistent with the safe and sound operation of the bank, under the Community Reinvestment Act of 1977.
Dividend Restrictions
Sky Financial is a legal entity separate and distinct from its subsidiary bank and other subsidiaries. Its principal source of funds to pay dividends on its common stock and service its debt is from dividends from its subsidiaries, primarily Sky Bank. Various federal and state statutory provisions and regulations limit the amount of dividends that Sky Bank may pay without regulatory approval. Dividends payable by a state chartered bank are limited to the lesser of the bank’s undivided profits and the bank’s retained net income for the current year plus its retained net income for the preceding two years (less any required transfers to capital surplus) up to the date of any dividend declaration in the current calendar year. As of December 31, 2005, $227,309 was available for distribution to Sky Financial as dividends without prior regulatory approval.
Federal bank regulatory agencies have the authority to prohibit Sky Bank from engaging in unsafe or unsound practices in conducting its business. The payment of dividends, depending on the financial condition of the bank, could be deemed an unsafe or unsound practice. The ability of Sky Bank to pay dividends in the future is currently influenced, and could be further influenced, by bank regulatory policies and capital guidelines.
Holding Company Structure
Transfer of Funds from Banking Subsidiary. Sky Financial’s banking subsidiary is subject to restrictions under federal law that limit the transfer of funds or other items of value from this subsidiary to Sky Financial and its non-banking subsidiaries, including affiliates, whether in the form of loans and other extensions of credit, investments and asset purchases or as other transactions involving the transfer of value from a
4
subsidiary to an affiliate or for the benefit of an affiliate. Unless an exemption applies, these transactions by a banking subsidiary with a single affiliate are limited to 10% of the subsidiary bank’s capital and surplus and, with respect to all covered transactions with affiliates in the aggregate, to 20% of the subsidiary bank’s capital and surplus. Moreover, loans and extensions of credit to affiliates generally are required to be secured in specified amounts. A bank’s transactions with its non-bank affiliates are also generally required to be on arm’s-length terms.
Source of Strength Doctrine. Under current Federal Reserve Board policy, Sky Financial is expected to act as a source of financial and managerial strength to its subsidiary bank and, under appropriate circumstances, to commit resources to support such subsidiary bank. This support could be required at times when Sky Financial might not have the resources to provide it.
Capital loans from Sky Financial to its subsidiary bank are subordinate in right of payment to deposits and certain other indebtedness of the subsidiary bank. In the event of Sky Financial’s bankruptcy, any commitment by Sky Financial to a federal bank regulatory agency to maintain the capital of a subsidiary bank will be assumed by the bankruptcy trustee and entitled to a priority of payment.
Depositor Preference. The Federal Deposit Insurance Act provides that, in the event of the “liquidation or other resolution” of an insured depository institution, the claims of depositors of the institution, including the claims of the FDIC as subrogee of insured depositors, and certain claims for administrative expenses of the FDIC as a receiver, will have priority over other general unsecured claims against the institution. If an insured depository institution fails, insured and uninsured depositors, along with the FDIC, will have priority in payment ahead of unsecured, non-deposit creditors, including Sky Financial, with respect to any extensions of credit they have made to such insured depository institution.
Liability of Commonly Controlled Institutions. The deposits of Sky Bank are insured by the FDIC. FDIC-insured depository institutions can be held liable for any loss incurred, or reasonably expected to be incurred, by the FDIC due to the default of an FDIC-insured depository institution controlled by the same bank holding company, or for any assistance provided by the FDIC to an FDIC-insured depository institution controlled by the same bank holding company that is in danger of default. “Default” means generally the appointment of a conservator or receiver. “In danger of default” means generally the existence of certain conditions indicating that a default is likely to occur in the absence of regulatory assistance.
Capital Requirements
Sky Financial is subject to risk-based capital requirements and guidelines imposed by the Federal Reserve Board. These are substantially similar to the capital requirements and guidelines imposed by the OCC and the FDIC on the depository institutions under their jurisdictions. For this purpose, a depository institution’s or holding company’s assets, and some of its specified off-balance sheet commitments and obligations, are assigned to various risk categories. A depository institution’s or holding company’s capital, in turn, is classified in one of three depending on type:
| | | | |
| Core (“Tier 1”) Capital tiers, | | Supplementary (“Tier 2”) Capital | | Market Risk (“Tier 3”) Capital |
| | |
- Common equity - Retained earnings | | - Perpetual preferred stock not meeting the Tier 1 definition | | - Qualifying unsecured subordinated debt |
- Qualifying non-cumulative perpetual | | - Qualifying mandatory convertible | | |
preferred stock | | Securities | | |
- A limited amount of qualifying | | - Qualifying subordinated debt | | |
cumulative perpetual stock at the holding company level | | - Allowances for loan and lease losses, subject to limitations | | |
- Minority interests in equity accounts of | | - Recourse obligation on sold loan | | |
consolidated subsidiaries | | portfolios | | |
- Less goodwill, most intangible assets and certain other assets | | | | |
Sky Financial, like other bank holding companies, currently is required to maintain Tier 1 capital and “total capital” (the sum of Tier 1, Tier 2 and Tier 3 capital) equal to at least 4% and 8%, respectively, of its total risk-weighted assets (including various off-balance-sheet items, such as standby letters of credit). For a holding company to be considered “well capitalized” for regulatory purposes, its Tier 1 and total capital ratios must be 6% and 10% on a risk-adjusted basis, respectively. At December 31, 2005, Sky Financial met both requirements, with Tier 1 and total capital equal to 9.3% and 11.5% of its respective total risk-weighted assets.
Federal Reserve Board, FDIC and state rules require Sky Financial to incorporate market and interest rate risk components into its risk-based capital standards. Under these market risk requirements, capital is allocated to support the amount of market risk related to a financial institution’s ongoing trading activities.
The Federal Reserve Board also requires bank holding companies to maintain a minimum “leverage ratio” (Tier 1 capital to adjusted total assets) of 3% if the holding company has the highest regulatory rating and meets other requirements, or of 3% plus an additional “cushion” of at least 100 to 200 basis points (one to two percentage points) if the holding company does not meet these requirements. Sky Financial’s leverage ratio at December 31, 2005 was 8.0%.
The Federal Reserve Board may set capital requirements higher than the minimums described above for holding companies whose circumstances warrant it. For example, holding companies experiencing or anticipating significant growth may be expected to maintain capital positions substantially above the minimum supervisory levels without significant reliance on intangible assets. The Federal Reserve Board has also indicated that it will consider a “tangible Tier 1 capital leverage ratio” (deducting all intangibles) and other indications of capital strength in evaluating proposals for expansion or new activities.
Sky Bank is subject to similar risk-based and leverage capital requirements adopted by the Federal Reserve Board. Sky Financial’s management believes that Sky Bank meets all capital requirements to which it is subject.
Failure to meet capital requirements could subject a bank to a variety of enforcement remedies, including the termination of deposit insurance by the FDIC, and to restrictions on its business, which are described under the next paragraph.
Federal Deposit Insurance Corporation Improvement Act of 1991. The Federal Deposit Insurance Corporation Improvement Act of 1991 (the “FDICIA”), among other things, identifies five capital categories for insured depository institutions: well capitalized, adequately capitalized, undercapitalized, significantly undercapitalized and critically undercapitalized. It requires U.S. federal bank regulatory agencies to implement systems for “prompt corrective action” for insured depository institutions that do not meet minimum capital requirements based on these categories. The FDICIA imposes progressively more restrictive constraints on operations, management and capital distributions, depending on the category in which an institution is classified. Unless a bank is well capitalized, it is subject to restrictions on its
5
ability to offer brokered deposits and on other aspects of its operations. The FDICIA generally prohibits a bank from paying any dividend or making any capital distribution or paying any management fee to its holding company if the bank would thereafter be undercapitalized. An undercapitalized bank must develop a capital restoration plan, and its parent holding company must guarantee the bank’s compliance with the plan up to the lesser of 5% of the bank’s assets at the time it became undercapitalized and the amount needed to comply with the plan.
As of December 31, 2005, Sky Financial believes that its bank subsidiary was well capitalized, based on the prompt corrective action ratios and guidelines described above. A bank’s capital category is determined solely for the purpose of applying the prompt corrective action regulations, and the capital category may not constitute an accurate representation of the bank’s overall financial condition or prospects for other purposes.
Deposit Insurance Assessments
The FDIC insures the deposits of Sky Financial’s depository institution subsidiary up to prescribed limits for each depositor. The amount of FDIC assessments paid by each Bank Insurance Fund (BIF) member institution is based on its relative risk of default as measured by regulatory capital ratios and other factors. Specifically, the assessment rate is based on the institution’s capitalization risk category and supervisory subgroup category. An institution’s capitalization risk category is based on the FDIC’s determination of whether the institution is well capitalized, adequately capitalized or less than adequately capitalized. An institution’s supervisory subgroup category is based on the FDIC’s assessment of the financial condition of the institution and the probability that FDIC intervention or other corrective action will be required.
The FDIC may increase or decrease the assessment rate schedule on a semi-annual basis. An increase in the assessment rate could have a material adverse effect on Sky Financial’s earnings, depending on the amount of the increase. The FDIC is authorized to terminate a depository institution’s deposit insurance upon a finding by the FDIC that the institution’s financial condition is unsafe or unsound or that the institution has engaged in unsafe or unsound practices or has violated any applicable rule, regulation, order or condition enacted or imposed by the institution’s regulatory agency. The termination of deposit insurance for Sky Bank could have a material adverse effect on Sky Financial’s earnings.
Fiscal and Monetary Policies
Sky Financial’s business and earnings are affected significantly by the fiscal and monetary policies of the federal government and its agencies. Sky Financial is particularly affected by the policies of the Federal Reserve Board, which regulates the supply of money and credit in the United States. Among the instruments of monetary policy available to the Federal Reserve are (a) conducting open market operations in United States government securities, (b) changing the discount rates of borrowings of depository institutions, (c) imposing or changing reserve requirements against depository institutions’ deposits, and (d) imposing or changing reserve requirements against certain borrowing by banks and their affiliates. These methods are used in varying degrees and combinations to affect directly the availability of bank loans and deposits, as well as the interest rates charged on loans and paid on deposits. For that reason alone, the policies of the Federal Reserve Board have a material effect on the earnings of Sky Financial.
Privacy Provisions of Gramm-Leach-Bliley Act
Under Gramm-Leach-Bliley Act (GLB Act), federal banking regulators adopted rules that limit the ability of banks and other financial institutions to disclose non-public information about consumers to non-affiliated third parties. These limitations require disclosure of privacy policies to consumers and, in some circumstances, allow consumers to prevent disclosure of certain personal information to non-affiliated third parties. The privacy provisions of the GLB Act affect how consumer information is transmitted through diversified financial companies and conveyed to outside vendors.
Sarbanes-Oxley Act of 2002
The Sarbanes-Oxley Act of 2002 contains important requirements for public companies in the area of financial disclosure and corporate governance. In accordance with section 302(a) of the Sarbanes-Oxley Act, written certifications by Sky Financial’s chief executive officer and chief financial officer are required. These certifications attest that Sky Financial’s quarterly and annual reports filed with the SEC do not contain any untrue statement of a material fact. Sky Financial has also implemented a program designed to comply with Section 404 of the Sarbanes-Oxley Act, which includes the identification of significant processes and accounts, documentation of the design of control effectiveness over process and entity level controls, and testing of the operating effectiveness of key controls. Also, in response to the Sarbanes-Oxley Act, Sky Financial adopted a series of procedures to improve its corporate governance practices. One of these actions included the formation of a Financial Disclosure Committee whose members include the chief executive officer, the chief financial officer and other Sky Financial officers. Sky Financial also requires signed certifications from managers who are responsible for internal controls throughout Sky Financial as to the integrity of the information they prepare. These procedures supplement Sky Financial’s Code of Ethics policies and procedures that have previously been in place. See Item 9A “Controls and Procedures” for Sky Financial’s evaluation of its disclosure controls and procedures.
Future Legislation
Various legislation, including proposals to change substantially the financial institution regulatory system and to expand or contract the powers of banking institutions and bank holding companies, is from time to time introduced in Congress. This legislation may change banking statutes and the operating environment of Sky Financial and its subsidiaries in substantial and unpredictable ways. If enacted, such legislation could increase or decrease the cost of doing business, limit or expand permissible activities or affect the competitive balance among banks, savings associations, credit unions and other financial institutions. Sky Financial cannot predict whether any of this potential legislation will be enacted, and if enacted, the effect that it, or any implemented regulations, would have on the financial condition or results of operations of Sky Financial or any of its subsidiaries.
To the extent that the previous information describes statutory and regulatory provisions, it is qualified in its entirety by reference to the full text of those provisions. Also, such statutes, regulations and policies are continually under review by Congress and state legislatures and federal and state regulatory agencies. A change in statutes, regulations or regulatory policies applicable to Sky Financial could have a material effect on the business of Sky Financial.
In addition, see the information contained in Note 21 “Regulatory Matters” in this Form 10-K.
6
Employees
As of December 31, 2005, Sky Financial and its subsidiaries had approximately 4,117 full-time equivalent employees. Sky Financial and its subsidiaries consider their employee relations to be good. None of the employees are covered by a collective bargaining agreement.
Available Information
Sky Financials’ Internet address is www.skyfi.com. We have made available free of charge on or through our website, our annual report on Form 10-K, quarterly reports on Form 10-Q, current reports on Form 8-K, and amendments to those reports filed or furnished pursuant to Section 13(a) or 15(d) of the Exchange Act as soon as reasonably practicable after such material was electronically filed with, or furnished to the SEC. Materials that Sky Financial files with the SEC may be read and copied at the SEC’s Public Reference Room at 450 Fifth Street, NW, Washington, D.C. 20549. This information may also be obtained by calling the SEC at 1-800-SEC-0330. The SEC also maintains an Internet website that contains reports, proxy and information statements and other information regarding issuers that file electronically with the SEC at www.sec.gov. Sky Financial will provide a copy of any of the foregoing documents to stockholders upon request.
Certain Statistical Information Regarding Sky Financial
Certain financial and statistical information relative to Sky Financial as required under the SEC’s Industry Guide 3, “Statistical Disclosure By Bank Holding Companies,” and related discussion is incorporated by specific references from the indicated pages of this Form 10-K.
Item 1A.Risk Factors
Interest Rate Risk
Changes in interest rates could adversely affect our earnings and financial condition.
Our earnings and financial condition are dependent to a large degree upon net interest income, which is the difference between interest earned from loans and investments and interest paid on deposits and borrowings. The narrowing of interest-rate spreads, meaning the difference between the interest rates earned on loans and investments and the interest rates paid on deposits and borrowings, could adversely affect our earnings and financial condition.
Interest rates are highly sensitive to many factors, including:
| n | | The rate of economic growth; |
| n | | Instability in domestic and foreign financial markets. |
Changes in market interest rates will also affect the level of voluntary prepayments on our loans and the receipt of payments on our mortgage-backed securities resulting in the receipt of proceeds that may be reinvested at a lower rate than the loan or mortgage-backed security being prepaid.
We originate residential loans for sale and for our portfolio. The origination of loans for sale is designed to meet client financing needs and earn fee income. The origination of loans for sale is highly dependent upon the local real estate market and the level and trend of interest rates. Increasing interest rates may reduce the origination of loans for sale and consequently the fee income we earn. While our commercial banking, construction and income property business lines are an increasing portion of our activities, high interest rates may reduce our mortgage-banking activities and thereby our income. In contrast, decreasing interest rates have the effect of causing clients to refinance mortgage loans faster than anticipated. This causes the value of assets related to the servicing rights on loans sold to be lower than originally anticipated. If this happens, we may need to write down our servicing assets faster, which would accelerate our expense and lower our earnings.
Government Policies
Our business may be adversely affected by changes in government policies.
The earnings of banks and bank holding companies such as Sky Financial are affected by the policies of regulatory authorities, including the Federal Reserve Board, which regulates the money supply. Among the methods employed by the Federal Reserve Board are open market operations in U.S. Government securities, changes in the discount rate on member bank borrowings, and changes in reserve requirements against member bank deposits. These methods are used in varying combinations to influence overall growth and distribution of bank loans, investments and deposits, and their use may also affect interest rates charged on loans or paid on deposits. The monetary policies of the Federal Reserve Board have had a significant effect on the operating results of commercial and savings banks in the past and are expected to continue to do so in the future.
7
The banking industry is highly regulated and changes in federal and state banking regulations as well as policies and administration guidelines may affect Sky Financial’s practices and growth prospects.
Credit Risk
Our earnings and reputation may be adversely affected if we fail to effectively manage our credit risk.
Originating and underwriting loans are integral to the success of our business. This business requires us to take “credit risk,” which is the risk of losing principal and interest income because borrowers fail to repay loans.
Collateral values and the ability of borrowers to repay their loans may be affected at any time by factors such as:
| n | | A downturn in the local economies in which we operate or the national economy; |
| n | | A downturn in one or more of the business sectors in which our customers operate; or |
| n | | A rapid increase in interest rates. |
Competition
Strong competition within our market area may reduce our ability to attract and retain deposits and originate loans.
We face competition both in originating loans and in attracting deposits. Competition in the financial services industry is intense. We compete for clients by offering excellent service and competitive rates on our loans and deposit products. The type of institutions we compete with include commercial banks, savings institutions, mortgage banking firms, credit unions, finance companies, mutual funds, insurance companies and brokerage and investment banking firms. As a result of their size and ability to achieve economies of scale, certain of our competitors offer a broader range of products and services than we offer. In addition, to stay competitive in our markets we may need to adjust the interest rates on our products to match the rates offered by our competitors, which could adversely affect our net interest margin. As a result, our profitability depends upon our continued ability to successfully compete in our market areas while achieving our investment objectives.
Economy
Our business may be adversely affected by downturns in the local economies on which we depend.
Our loan portfolio is concentrated primarily in the northern and central Ohio regions, the southeast Michigan region, the eastern Indiana region, the western Pennsylvania region and the northern West Virginia region. Our profits depend on providing products and services to clients in these local regions. An increase in unemployment, a decrease in real estate values or continued increases in interest rates could weaken the local economies in which we operate. Weakness in our market area could depress our earnings and consequently our financial condition because:
| n | | Clients may not want or need our products and services; |
| n | | Borrowers may not be able to repay their loans; |
| n | | The value of the collateral securing our loans to borrowers may decline; and |
| n | | The quality of our loan portfolio may decline. |
Integration Risk
We may not be able to achieve the expected integration and cost savings from our ongoing bank acquisition activities.
We have a long history of acquiring financial institutions and we expect this acquisition activity to continue in the future. Difficulties may arise in the integration of the business and operations of the financial institutions that agree to merge with and into Sky Financial and its affiliates and, as a result, we may not be able to achieve the cost savings and synergies that we expect will result from the merger activities. Achieving cost savings is dependent on consolidating certain operational and functional areas, eliminating duplicative positions and terminating certain agreements for outside services. Additional operational savings are dependent upon the integration of the banking businesses of the acquired financial institution with that of Sky Financial, including the conversion of the acquired entity’s core operating systems, data systems and products to those of Sky Financial and the standardization of business practices. Complications or difficulties in the conversion of the core operating systems, data systems and products of these other banks to those of Sky Financial may result in the loss of clients, damage to our reputation within the financial services industry, operational problems, one-time costs currently not anticipated by us and/or reduced cost savings resulting from the merger activities.
Acquisition Risk
We may have difficulty in the future to continue to grow through acquisitions.
Any future acquisitions or mergers by Sky Financial or its banking subsidiaries are subject to approval by the appropriate federal and state banking regulators. The banking regulators evaluate a number of criteria in making their approval decisions, such as:
| n | | Safety and soundness guidelines; |
| n | | Compliance with all laws including the USA Patriot Act of 2001, the International Money Laundering Abatement and Anti-Terrorist Financing Act of 2001, the Sarbanes-Oxley Act of 2002 and the related rules and regulations promulgated under such Act or the Exchange Act, the Equal Credit Opportunity Act, the Fair Housing Act, the Community Reinvestment Act, the Home Mortgage Disclosure Act and all other applicable fair lending laws and other laws relating to discriminatory business practices; and |
| n | | Anti-competitive concerns with the proposed transaction. |
8
If the banking regulators or a commenter on our regulatory application raise concerns about any of these criteria at the time a regulatory application is filed, the banking regulators may deny, delay or condition their approval of a proposed transaction.
We have grown, and intend to continue to grow, through acquisitions of banks and other financial institutions. After these acquisitions, we may experience adverse changes in results of operations of acquired entities, unforeseen liabilities, asset quality problems of acquired entities, loss of key personnel, loss of clients because of change of identity, difficulties in integrating data processing and operational procedures and deterioration in local economic conditions. These various acquisition risks can be heightened in larger transactions.
Item 1B.Unresolved Staff Comments
None.
Item 2.Properties
Sky Financial’s executive offices are located in Bowling Green, Ohio. Sky Bank operates over 290 financial centers, of which substantially all are owned. Also, the information contained in Note 5 “Premises and Equipment” on page 45 of this Form 10-K is incorporated herein by reference in response to this item.
Item 3.Legal Proceedings
In re Commercial Money Center, Inc. Equipment Lease Litigation in the U. S. District Court for the Northern District of Ohio, Eastern Division, MDL Case No. 1:02-CV-16000
Between August 2000 and December 2001, Sky Bank and two of its predecessor banks provided financing to a commercial borrower and its affiliated entities for the purchase of six separate portfolios of commercial lease pools, and a warehouse line of credit to finance lease pools. These loans are secured by assignments of the payment streams from the underlying leases, surety bonds or insurance policies, and a limited guarantee from the sole member of the commercial borrower.
Upon default of these commercial loans, Sky Bank (and its predecessors) made demand for payment from Illinois Union Insurance Company (“IU”), RLI Insurance Company (“RLI”), and Royal Indemnity Company (“Royal”) under the relevant surety bonds and insurance policies. IU, RLI, and Royal (collectively, the “Sureties”) have failed to make the payments required under the surety bonds and insurance policies. As a result, in the spring of 2002, Sky and its predecessors filed suit against each of the Sureties seeking to enforce Sky Bank’s rights under the surety bonds and insurance policies issued by the Sureties in connection with the commercial lease pools. Sky’s complaints claim breach of contract, bad faith and allege that the Sureties are liable for the payments due to Sky under the terms of the bonds and are estopped from asserting fraud as a defense to paying any claims under the bonds. In October, 2002, the suits were consolidated for pretrial purposes with more than 35 other lawsuits involving similar claims in the United States District Court for the Northern District of Ohio, Eastern Division, under the Federal Multi-district Litigation (“MDL”) Rules.
The key defense of the Sureties in denying Sky Bank’s claims under the surety bonds is that they were fraudulently induced by the originator of the commercial leases to issue the surety bonds in the first instance. The Sureties have also asserted related defenses that the underlying equipment leases are invalid, usurious, or otherwise unenforceable. Sky Bank believes that none of these defenses can defeat Sky Bank’s claims under the surety bonds, which, in the view of Sky Bank, provide for absolute and unconditional guarantees of payment. Moreover, Sky Bank believes that the Sureties are responsible to Sky Bank, as the Obligee or Named Insured under the bonds, for the underwriting of the lessees and leases, including all issues of fraud, and that the Sureties waived any defense of fraud to claims under the bonds.
On January 31, 2003, Sky Bank and the other Claimants in the MDL Proceeding (MDL 02CV16000, Docket No. 1490) filed a consolidated Motion for Judgment on the Pleadings (the “Motion”) seeking a determination that the Sureties are liable, as a matter of law, under the relevant surety bonds and insurance policies. On August 19, 2005, the MDL Court issued two orders relating to the Motions. The first order granted the Motion with respect to Sky Bank’s insurance policies with IU, finding that the bank is the obligee under the contracts and that IU is precluded from asserting the defense of fraudulent inducement. The second order denied the banks Motion with respect to the surety bonds issued by Royal and RLI, indicating that the resolution of the claims requires examination of evidence beyond the limited materials the MDL Court is permitted to consider in the Motion.
On December 21, 2005, Sky sold and assigned to a third party, without recourse, all of its rights and interests in three loans secured by commercial lease pools and surety bonds issued by Royal. On January 24, 2006, in conjunction with mediation proceedings ordered by the MDL court, Sky and IU agreed to settle its litigation pertaining to two loans secured by pools of leases and insurance policies issued by IU. The aggregate principal balance of the three loans sold to a third party and the two loans, which were settled, was $14.2 million, and the aggregate proceeds received by Sky in the sale and settlement was $14.9 million. Sky considers the matter with Royal as concluded, and has no further litigation pending against Royal relating to these loans.
With respect to the remaining pool and the warehouse line of credit secured by surety bonds issued by RLI, which has a remaining principal balance of $15.4 million, Sky expects to proceed with amending its complaint and preparing for trial.
Sky Financial has reviewed the relevant matters of fact and law with its special counsel and believes that it has substantial and meritorious claims against the Sureties. Sky Financial has and will continue to vigorously assert all the rights and remedies available to it to obtain payment under the bonds. While the ultimate outcome of this matter cannot be determined at this time, Sky Financial management does not believe that the outcome of these pending legal proceedings will materially affect the consolidated financial position or results of operations of Sky Financial.
9
Item 4.Submission of Matters to a Vote of Security Holders
None
Executive Officers of the Registrant
The following table sets forth the names and ages and business experience of each of the executive officers of Sky Financial. Each executive officer of Sky Financial is appointed by the Board of Directors on an annual basis and serves at the pleasure of the Board.
| | | | | | |
Executive Officer | | Age | | Position With Company or Subsidiary and Experience | | Officer Since* |
| | | |
Marty E. Adams | | 53 | | Chairman, President and Chief Executive Officer of Sky Financial; formerly President and Chief Operating Officer of Sky Financial and President and Chief Executive Officer of Sky Bank. | | 1977 |
| | | |
Frank J. Koch | | 52 | | Executive Vice President and Senior Credit Officer of Sky Financial, and Senior Credit Officer of Sky Bank. | | 1988 |
| | | |
W. Granger Souder, Jr. | | 45 | | Executive Vice President, General Counsel and Secretary of Sky Financial and Secretary of Sky Bank. | | 1989 |
| | | |
Les Starr | | 54 | | Executive Vice President/Operations and Information Technology; formerly Senior Vice President and Director/Information Technology for Michigan National Bank. | | 2002 |
| | | |
Kevin T. Thompson | | 52 | | Executive Vice President and Chief Financial Officer of Sky Financial and Treasurer of Sky Bank. | | 1998 |
| | | |
Caren L. Cantrell | | 50 | | Division Executive Vice President and Chief Operations Officer; formerly Senior Vice President of Operations and Information Technology at Commercial Federal Bank; formerly Division EVP/Financial Services Operations of Sky Bank. | | 2005 |
| | | |
Perry C. Atwood | | 51 | | Senior Vice President, Director of Sales of Sky Financial; formerly Director of Sales of Sky Bank. | | 2000 |
| | | |
Phillip C. Clinard | | 56 | | Senior Vice President/Change Management Officer of Sky Financial; formerly Senior Vice President of Mid Am Bank. | | 1975 |
| | | |
Thomas A. Sciorilli | | 58 | | Chief Human Resources Officer of Sky Financial; formerly Senior Vice | | 2001 |
| | | | | President/Human Resources and Administration of Penn National Insurance. | | |
| | | |
Curtis E. Shepherd | | 40 | | Senior Vice President/Marketing and Product Development of Sky Financial; formerly Executive Vice President, Retail and Marketing of Sky Bank–Ohio Bank Region; formerly Senior Vice President of Marketing of Ohio Bank. | | 1997 |
| | | |
Richard R. Hollington III | | 42 | | Regional President, Greater Cleveland Region; formerly Executive Vice President, Chief Executive Officer of Sky Trust and Corporate Director of Financial Services; formerly Senior Vice President/Integration Manager of Sky Financial. | | 1996 |
| | | |
John S. Gulas | | 47 | | President and Chief Executive Officer of Sky Trust; formerly Executive Vice President with UMB Financial Corporation; formerly Regional Managing Director of First Union Corporation. | | 2005 |
| * | Includes period in which executive officer was an officer of a subsidiary or acquired company. |
10
PART II
Item 5.Market for the Registrant’s Common Equity, Related Stockholder Matters and Issuer Purchases of Equity Securities
The information contained in Note 2 on page 41 and Note 18 “Stock Options” on page 56 of this Form 10-K is incorporated herein by reference in response to this item. There were no repurchases of shares of Sky Financial stock during the fourth quarter of 2005.
Quarterly Common Stock Prices, Dividends and Yields
| | | | | | | | | | | |
| | | High | | Low | | Book
Value per
Share | | Dividend
per
Share | | Dividend
Yield* | |
2005 | | | | | | | | | | | |
Fourth quarter | | $29.87 | | $26.05 | | $14.35 | | $0.23 | | 3.26 | % |
Third quarter | | 29.20 | | 27.38 | | 14.12 | | 0.22 | | 3.10 | |
Second quarter | | 29.06 | | 25.45 | | 13.97 | | 0.22 | | 3.19 | |
First quarter | | 28.95 | | 25.50 | | 13.31 | | 0.22 | | 3.17 | |
2004 | | | | | | | | | | | |
Fourth quarter | | $29.25 | | $24.90 | | $13.77 | | $0.22 | | 3.21 | % |
Third quarter | | 25.55 | | 23.13 | | 13.44 | | 0.21 | | 3.43 | |
Second quarter | | 26.23 | | 23.00 | | 11.13 | | 0.21 | | 3.40 | |
First quarter | | 27.81 | | 24.35 | | 11.46 | | 0.21 | | 3.16 | |
Stock Information at December 31, 2005
| | |
| | | Common Stock |
| |
Shares authorized | | 350,000,000 |
Shares issued | | 110,206,647 |
Treasury shares | | 1,899,046 |
Number of shareholders of record | | 20,599 |
Closing market price per share | | $27.82 |
Book value per share | | $14.35 |
Stock exchange | | NASDAQ |
Stock symbol | | SKYF |
* Calculated on average traded price for the quarter.
Purchases of Equity Securities by the Issuer and Affiliated Purchasers
| | | | | | | | |
| | | Total Number
of Shares
Purchased | | Average Price
Paid Per share | | Total Number of
Shares Purchased as
Part of Publicly
Announced Plans
or Programs* | | Maximum Number of Shares that
May Yet Be Purchased
Under the Plans or Programs |
February 1, 2005 - February 28, 2005 | | 998,300 | | $27.57 | | 998,300 | | 1,001,700 |
March 1, 2005 - March 31, 2005 | | 373,700 | | 27.46 | | 373,700 | | 628,000 |
April 1, 2005 - April 30, 2005 | | 538,500 | | 27.15 | | 538,500 | | 89,500 |
Total | | 1,910,500 | | $27.43 | | 1,910,500 | | – |
* During September 2004, the Board of Directors of Sky Financial Group, Inc. authorized the company to purchase up to two million shares of common stock in the open market for a period of twelve months.
Dividend Restrictions
Sky Financial is a legal entity separate and distinct from its subsidiary bank and other subsidiaries. Its principal source of funds to pay dividends on its common stock and service its debt is from dividends from its subsidiaries, primarily Sky Bank. Various federal and state statutory provisions and regulations limit the amount of dividends that Sky Bank may pay without regulatory approval. Dividends payable by a state chartered bank are limited to the lesser of the bank’s undivided profits and the bank’s retained net income for the current year plus its retained net income for the preceding two years (less any required transfers to capital surplus) up to the date of any dividend declaration in the current calendar year. As of December 31, 2005, $227,309 was available for distribution to Sky Financial as dividends without prior regulatory approval.
11
Item 6.Selected Financial Data
(Dollars and shares in thousands, except per share data)
| | | | | | | | | | | | | | | | | | | | |
| December 31, | | 2005 | | | 2004 | | | 2003 | | | 2002 | | | 2001 | |
Consolidated Statements of Income(1) | | | | | | | | | | | | | | | | | | | | |
Interest income | | $ | 830,224 | | | $ | 661,943 | | | $ | 594,063 | | | $ | 576,397 | | | $ | 619,873 | |
Interest expense | | | 315,572 | | | | 210,632 | | | | 202,820 | | | | 235,162 | | | | 302,988 | |
Net interest income | | | 514,652 | | | | 451,311 | | | | 391,243 | | | | 341,235 | | | | 316,885 | |
Provision for credit losses | | | 52,249 | | | | 37,660 | | | | 34,125 | | | | 37,659 | | | | 27,384 | |
Net interest income after provision for credit losses | | | 426,403 | | | | 413,651 | | | | 357,118 | | | | 303,576 | | | | 289,501 | |
Non-interest income | | | 211,382 | | | | 203,417 | | | | 178,898 | | | | 147,984 | | | | 124,388 | |
Non-interest expenses | | | 400,047 | | | | 356,524 | | | | 307,186 | | | | 253,700 | | | | 221,523 | |
Income from continuing operations before income taxes | | | 273,738 | | | | 260,544 | | | | 228,830 | | | | 197,860 | | | | 192,366 | |
Income taxes | | | 91,547 | | | | 85,344 | | | | 76,150 | | | | 65,712 | | | | 63,714 | |
Income from continuing operations | | | 182,191 | | | | 175,200 | | | | 152,680 | | | | 132,148 | | | | 128,652 | |
Income (loss) from discontinued operations (net of tax)(2) | | | 372 | | | | 19,155 | | | | 3,937 | | | | (4,341 | ) | | | (7,989 | ) |
Net income | | | 182,563 | | | | 194,355 | | | | 156,617 | | | | 127,807 | | | | 120,663 | |
Net income available to common shareholders | | | 182,563 | | | | 194,355 | | | | 156,617 | | | | 127,807 | | | | 120,663 | |
Per Common Share | | | | | | | | | | | | | | | | | | | | |
Basic income from continuing operations | | $ | 1.71 | | | $ | 1.76 | | | $ | 1.70 | | | $ | 1.58 | | | $ | 1.56 | |
Basic income (loss) from discontinued operations | | | 0.00 | | | | 0.19 | | | | 0.05 | | | | (0.05 | ) | | | (0.10 | ) |
Basic net income | | | 1.71 | | | | 1.95 | | | | 1.75 | | | | 1.53 | | | | 1.46 | |
Diluted income from continuing operations | | | 1.69 | | | | 1.74 | | | | 1.69 | | | | 1.57 | | | | 1.55 | |
Diluted income (loss) from discontinued operations | | | 0.00 | | | | 0.19 | | | | 0.04 | | | | (0.05 | ) | | | (0.10 | ) |
Diluted net income | | | 1.69 | | | | 1.93 | | | | 1.73 | | | | 1.52 | | | | 1.45 | |
Cash dividends declared | | | 0.89 | | | | 0.85 | | | | 0.81 | | | | 0.77 | | | | 0.74 | |
Book value at year end | | | 14.35 | | | | 13.77 | | | | 10.80 | | | | 9.54 | | | | 7.92 | |
Weighted average shares outstanding – basic | | | 106,796 | | | | 99,461 | | | | 89,630 | | | | 83,439 | | | | 82,449 | |
Weighted average shares outstanding – diluted | | | 107,973 | | | | 100,568 | | | | 90,404 | | | | 84,096 | | | | 83,028 | |
Consolidated Balance Sheets (Year End) | | | | | | | | | | | | | | | | | | | | |
Total assets | | $ | 15,683,291 | | | $ | 14,944,423 | | | $ | 12,946,978 | | | $ | 11,050,120 | | | $ | 9,252,228 | |
Securities available for sale | | | 3,097,472 | | | | 3,091,813 | | | | 2,511,369 | | | | 2,247,181 | | | | 1,996,843 | |
Loans held for sale | | | 24,184 | | | | 9,433 | | | | 28,062 | | | | 77,458 | | | | 85,740 | |
Loans | | | 11,149,222 | | | | 10,616,118 | | | | 8,644,645 | | | | 7,347,988 | | | | 6,182,998 | |
Allowance for credit losses | | | (144,461 | ) | | | (151,389 | ) | | | (124,943 | ) | | | (106,675 | ) | | | (92,831 | ) |
Deposits | | | 10,755,676 | | | | 10,351,591 | | | | 8,515,533 | | | | 7,617,472 | | | | 6,545,177 | |
Debt and FHLB advances | | | 2,125,788 | | | | 1,924,840 | | | | 1,476,564 | | | | 1,065,254 | | | | 894,103 | |
Total shareholders’ equity | | | 1,553,877 | | | | 1,470,955 | | | | 998,576 | | | | 832,433 | | | | 648,444 | |
Selected Financial Ratios | | | | | | | | | | | | | | | | | | | | |
Return on average assets | | | 1.21 | % | | | 1.43 | % | | | 1.29 | % | | | 1.29 | % | | | 1.39 | % |
Return on average shareholders’ equity | | | 12.27 | | | | 15.75 | | | | 17.23 | | | | 17.67 | | | | 19.11 | |
Dividend payout ratio | | | 52.08 | | | | 43.64 | | | | 46.59 | | | | 50.43 | | | | 50.61 | |
Net interest margin, fully-taxable equivalent | | | 3.73 | | | | 3.69 | | | | 3.70 | | | | 3.90 | | | | 3.96 | |
Average loans to average deposits | | | 101.32 | | | | 99.56 | | | | 96.46 | | | | 93.53 | | | | 100.44 | |
Average equity to average assets | | | 9.82 | | | | 9.09 | | | | 7.47 | | | | 7.30 | | | | 7.26 | |
Allowance for credit losses to period-end loans | | | 1.30 | | | | 1.43 | | | | 1.45 | | | | 1.45 | | | | 1.50 | |
Allowance for credit losses to total non-performing loans | | | 120.88 | | | | 105.32 | | | | 151.30 | | | | 154.07 | | | | 272.20 | |
Non-performing loans to period-end loans | | | 1.07 | | | | 1.35 | | | | 0.96 | | | | 0.94 | | | | 0.55 | |
Net charge-offs to average loans | | | 0.57 | | | | 0.37 | | | | 0.40 | | | | 0.47 | | | | 0.40 | |
| (1) | The results of operations and financial condition have been affected by the completed acquisitions discussed further in Item 7. Management’s Discussion and Analysis of Financial Condition and Results of Operation. |
| (2) | The results of operations for the years ended December 31, 2004, 2003, 2002, and 2001 are presented to reflect discontinued operations. See the Discontinued Operations caption in Item 7. Management’s Discussion and Analysis of Financial Condition and Results of Operation. |
12
Item 7.Management’s Discussion and Analysis of
Financial Condition and Results of Operation
(Dollars and shares in thousands, except per share data)
The following discussion and analysis represents a review of Sky Financial Group, Inc.’s (Sky Financial) consolidated financial condition and results of operations. This review should be read in conjunction with the consolidated financial statements presented elsewhere in this report.
Business Summary
Sky Financial Group is a diversified financial holding company with its headquarters located in Bowling Green, Ohio. Sky Financial operates over 290 financial centers and over 300 ATMs serving communities in Ohio, Pennsylvania, Michigan, Indiana and West Virginia. Sky Financial Group’s financial service affiliates include: Sky Bank, commercial and retail banking; Sky Trust, asset management services; and Sky Insurance, retail and commercial insurance agency services.
Sky Financial has a specific strategic plan for delivering profitable growth. Sky Financial’s success is the result of five strategic priorities that guide decisions and focus corporate resources. These are: 1) Organic Growth; 2) Fee Income; 3) Organizational Synergies; 4) Asset Quality; and 5) Acquisitions.
The primary source of Sky Financial’s revenue is net interest income from loans and deposits, and fee income. Full year average balance sheet growth was again strong in 2005. This growth is a direct result of Sky Financial’s organic growth strategy and acquisitions. The 2005 interest rate environment continued with increases in market rates; however, Sky Financial was able to continue to grow its net interest margin over the 2004 margin. The net interest margin performance reflected the benefits from rising short-term interest rates and prudent spread and interest rate risk management practices, despite the effects of the flattened yield curve and increasingly competitive markets. While higher interest rates continued to limit Sky’s mortgage banking business, fee income rose overall due particularly to increases in trust services income, service charges and brokerage and insurance commissions.
Discontinued Operations
On March 31, 2004, Sky Financial completed the sale of its dental financing affiliate, Sky Financial Solutions. Sky Financial Solutions is reported as a discontinued operation. For the year ended December 31, 2005, Sky Financial recorded additional pretax gain of $572 for the adjustment of certain contingencies related to the sale. This gain was recorded as after tax income from discontinued operations.
The consolidated financial statements for the periods ended December 31, 2004 and 2003 reflect the presentation of Sky Financial Solutions as a discontinued operation. Sky Financial Solutions results of operations included revenues of $39,356 and $32,969 and pre-tax net income of $29,503 and $6,242 for 2004 and 2003, respectively
Completed Acquisitions
On November 29, 2005, Sky Financial completed its acquisition of Falls Bank, an $80 million bank that operates two full-service branches in the Akron, Ohio market. The aggregate purchase price was approximately $12,271, including direct acquisition costs of $33. The acquisition of Falls Bank expands Sky Financial’s community banking business further into the Akron market. Falls Bank shareholders received approximately 350 shares of Sky Financial common stock and cash of $2,348.
On June 1, 2005, Sky Financial completed its acquisition of Belmont Bancorp, a $297 million bank holding company headquartered in St. Clairsville, Ohio, and its wholly-owned subsidiary, Belmont National Bank. The aggregate purchase price was approximately $68,450, including direct acquisition costs of $56. Belmont has offices located in Belmont, Harrison and Tuscarawas counties in Ohio, and Ohio County in West Virginia.
Belmont Bancorp shareholders received approximately 1,765 shares of Sky Financial common stock and cash of $18,705.
On October 4, 2005, Sky Financial acquired Becker-McDowell Agency, Inc. and Steiner Insurance Agency, Inc., both located in Wooster, Ohio. Becker-McDowell was acquired for 222 shares of Sky Financial common stock and $580 in cash. Steiner Insurance Agency was acquired for 111 shares of Sky Financial common stock and $288 in cash.
On August 1, 2005, Sky acquired B.K.M.’s Benefit Design Agency of Ohio, Inc., located in Findlay, Ohio for 137 shares of Sky Financial common stock and $661 in cash.
On November 30, 2004, Sky Financial acquired Prospect Bancshares, Inc. and its wholly-owned subsidiary Prospect Bank, a $202 million savings bank headquartered in Worthington, Ohio, for 1,139 shares of Sky Financial common stock and $17,600 in cash.
On July 1, 2004, Sky Financial acquired Second Bancorp Incorporated, a $2.0 billion bank holding company, and its wholly-owned subsidiaries including The Second National Bank of Warren and the Stouffer-Herzog Insurance Agency, Inc., for 11,953 shares of Sky Financial common stock. Second National Bank was a commercial bank headquartered in Warren, Ohio and Stouffer-Herzog, a full-service insurance agency, was headquartered in Ashtabula, Ohio.
On April 1, 2004, Sky Financial acquired EOB, Inc. for 177 shares of Sky Financial common stock and $516 in cash. Headquartered in Canton, Ohio, this insurance company specialized in the sales and service of group benefits.
On January 5, 2004, Sky Financial acquired Spencer-Patterson Insurance Agency, Inc. a professional liability, personal and commercial insurance agency headquartered in Findlay, Ohio, for 297 shares of Sky Financial common stock and $793 in cash.
On October 19, 2003, Sky Financial acquired GLB Bancorp, Inc. (GLB), a $225 million bank holding company, and its wholly-owned subsidiary Great Lakes Bank, a state member bank headquartered in Mentor, Ohio, for an aggregate purchase price of $43,263 payable in Sky Financial common stock. GLB shareholders received 1,717 shares of Sky Financial common stock.
On July 8, 2003, Sky Financial acquired Insurance Buyers’ Service Agency, Inc., (IBS) a professional liability, personal and commercial insurance agency headquartered in Boardman, Ohio, for 164 shares of Sky Financial common stock.
On April 30, 2003, Sky Financial acquired the outstanding capital stock of Metropolitan Financial Corp (Metropolitan), a $1.5 billion savings and loan holding company headquartered in Highland Hills, Ohio, and its wholly-owned subsidiary, Metropolitan Bank and Trust Company for a purchase price of $81,294, including direct acquisition costs of $673. Metropolitan shareholders received 2,887 shares of Sky Financial common stock and $25,327 in cash.
All of these acquisitions were accounted for under the purchase method of accounting and their results of operation have been included in Sky Financial’s results of operation from the dates of the acquisition
Overview
Sky Financial’s 2005 results from continuing operations continued to show improvement with a strong increase in net interest income associated with balance sheet growth, net interest margin improvement, and increases in trust income and service fees on deposit accounts despite a higher provision for credit losses. Earnings per diluted share from continuing operations for 2005 were lower than 2004 due to higher average shares outstanding as a result of recent acquisitions. Expenses increased associated with organic and acquisition growth, and a focused regional client-service profile.
13
Management’s Discussion and Analysis of
Financial Condition and Results of Operation
(Dollars and shares in thousands, except per share data)
Growth in loans and deposits, the development of fee-based revenues, and discipline in expense controls all contributed to the earnings improvement. Earnings for 2005 were negatively affected by higher provision for credit losses during the year, primarily the result of charging off two large commercial credits and the sale of a group of non-performing loans in the first quarter of 2005. However, reductions to non-performing assets by the end of 2005 improved Sky Financial’s overall asset quality and Sky Financial’s management does not believe that 2005’s higher credit losses are indicitive of future credit losses.
The results for the years 2004 and 2003 reflected continued earnings improvement and significant expansion from the combination of acquisitions and organic growth, despite the challenges from a slow economy and competitive industry. In 2004, earnings growth overcame a significant reduction in mortgage banking revenues from 2003, when lower market interest rates led to record levels in mortgage loan originations and gains on the sales of mortgage loans.
In 2005, net income for Sky Financial was $182,563, or $1.69 per diluted share, down from $194,355, or $1.93 per diluted share in 2004, which was up from $156,617, or $1.73 per diluted share in 2003. Net income for 2005 included $372 of after-tax income from discontinued operations. Net income for 2004 was increased by after-tax income from discontinued operations of $19,155, or $.19 per diluted share. Net income for 2003 included after-tax income from discontinued operations of $3,937, or $.04 per diluted share. In 2004, Sky Financial completed the sale of its dental finance business for an after tax gain of $20,306, or $.20 per diluted share, which strengthened its liquidity and capital positions and provided greater focus on its core regional financial services businesses. The dental financing business had grown significantly and, in 2003, had returned to profitability after operating at a loss since its restructure in 2000.
Income from continuing operations for 2005 was $182,191 or $1.69 per diluted share, compared with $175,200 or $1.74 per diluted share in 2004, and $152,680 or $1.69 per diluted share in 2003. During 2005, Sky Financial recorded expense for stock options for the full year of 2005 in accordance with Financial Accounting Standards (FAS) No. 123(R), Share-Based Payment, reducing earnings by $.03 per diluted share, with no restatement of prior periods. In addition, Sky Financial’s results include the impacts of mergers and acquisitions, which added assets of $0.4 billion in 2005, $2.2 billion in 2004, and $1.7 billion in 2003 as detailed in Note 2 of the financial statements. Completing the acquisitions and divestitures as well as other organizational changes resulted in merger, integration and restructuring charges of $1,771 in 2005, $4,542 in 2004 and $4,577 in 2003, as detailed in Note 16 of the financial statements.
Net interest income increased $63,341 in 2005, in part due to the growth in assets as well as an increase in the net interest margin from 3.69% to 3.73% as the benefits from rising short-term rates were partially offset by the flattening of the yield curve. Non-interest income increased $7,965 or 3.9% in 2005. The growth in 2005 was driven by increases in service charges and fees on deposit accounts, trust service income, brokerage and insurance commission and transaction fees partially offset by a decline of $10,907 in net securities gains. Provision for credit losses increased $14,589 primarily due to an increase in net credit losses as a percent of average loans to .57% in 2005 from .37% in 2004. Non-interest expenses increased in 2005 by $43,523 in part due the adoption of FAS 123(R) and to the acquisitions of Belmont and Falls Banks in 2005 as well as the full year impact of the 2004 merger transactions partially offset by lower merger, integration and restructuring expenses.
In 2004, net interest income increased $60,068 over 2003 due to the growth in assets, while the net interest margin remained basically stable throughout the year, as the benefits from rising short-term rates were offset by the flattening of the yield curve and the incremental effect of acquisitions. With the expansion
from acquisitions, growth of fee-based businesses and greater gains on the sales of securities in 2004, non-interest income rose $24,519, despite a reduction in mortgage banking revenues of $22,988, as mortgage loan originations of $1.3 billion in 2004 decreased from record levels of $2.3 billion in 2003. The provision for credit losses increased $3,535 primarily due to growth as net credit losses as a percent of average loans improved to .37% in 2004 from .40% in 2003. Non-interest expenses increased in 2004 by $49,338 mainly due to acquisitions.
Business Line Results
Sky Financial’s continuing operations is managed along two primary business lines: community banking and financial service affiliates. The community banking group is comprised of Sky Financial’s commercial bank, Sky Bank, which services businesses and consumers through a regional structure. As previously discussed, Sky Financial acquired Falls Bank and Belmont Bancorp in 2005, Second Bancorp and Prospect in 2004 and Metropolitan and GLB during 2003. Substantially all of the assets of these acquisitions became part of the community banking segment.
The financial service affiliates include Sky Financial’s current businesses relating to trust and investment management, insurance agency operations and other financial-related services. During 2005, Sky Financial acquired Becker-McDowell Agency, Inc., an agency that specializes in employee benefits, Steiner Insurance Agency, Inc., an agency that focuses on property and casualty insurance, and Benefit Design Agency of Ohio, Inc., an agency that specializes in the development, implementation and on-going service of employee benefit programs. During 2004, Sky Financial acquired Spencer-Patterson, an agency that sells professional liability, personal and commercial insurance, and EOB, Inc., a group benefit insurance agency. During 2003, Sky Financial acquired IBS, an agency that sells professional liability, personal and commercial insurance.
Additional information regarding Sky Financial’s business lines and the financial measurement methodologies is provided in Note 22 of the consolidated financial statements. Table 1 summarizes Sky Financial’s business line results for each of the last three years.
| | | | | | | | | | | |
| Table 1 Business Line Results | | | | |
| | | Net Income (Loss) | |
| Year ended December 31, | | 2005 | | | 2004 | | 2003 | |
Community banking | | $ | 178,099 | | | $ | 164,266 | | $ | 154,290 | |
Financial service affiliates | | | 9,890 | | | | 9,774 | | | 5,283 | |
Parent and other | | | (5,798 | ) | | | 1,160 | | | (6,893 | ) |
Continuing operations | | $ | 182,191 | | | $ | 175,200 | | $ | 152,680 | |
Community banking net income in 2005 reflected the benefit of the Belmont Bancorp and Falls Bank acquisitions, as well as the full year affect of acquisitions completed in 2004. The higher community banking net income in 2005 as compared to the previous year is primarily due to higher net interest income as a result of the impact of the acquisitions and organic growth and a higher net interest margin, partially offset by higher provision for credit losses. Higher non-interest income over 2004 was primarily the result of higher service charges and fees on deposits and increased other income as mortgage banking income was basically unchanged from the prior year. The increases were partially offset by a decrease in gains on sales of securities. Operating expenses increased over the prior year period as a result of the acquisitions.
Community banking net income in 2004 reflected the benefit of the Second Bancorp and Prospect acquisitions, as well as the full year affect of acquisitions completed in 2003. Additionally, higher revenues from solid organic growth in loans and targeted deposit
14
| | | | |
products help to mitigate reduced mortgage banking revenues from 2003, as well as higher expenses and provisions for credit losses, both increasing with the strong growth. The community banking performance ratios remain solid, although impacted mainly by higher credit losses in 2005 versus 2004 and lower mortgage banking revenues in 2004 versus 2003. For 2005, community banking generated a return on assets of 1.19% and efficiency ratio of 50.85% compared to 1.25% and 50.48%, respectively, in 2004 and 1.36% and 48.79%, respectively, in 2003. The efficiency ratio is defined as non-interest expense divided by the sum of fully taxable equivalent net interest income plus non-interest income. The financial service affiliates improved earnings by 1% in 2005 after increasing 85% in 2004. In 2005, revenues grew 8%, but were offset by higher expenses, both mostly due to three acquisitions in 2005. The 2004 increase was mainly due to the robust growth in both the insurance agency and wealth management businesses, in addition to eliminating the impact of an under-performing company. The significant growth resulted from the combination of acquisitions and organic growth. Parent and other includes the net funding costs of the parent company and all significant shared items of income and | | | | expense, including all merger, integration and restructuring charges and net securities gains and losses from the parent’s investment portfolio. The 2005 net loss for parent and other results of operations compared to net income for 2004 relate primarily to higher interest expenses retained by the parent, additional expenses related to stock compensation and lower gains on the sale of securities. In 2004, gains on the sale of securities, in addition to reduced non-interest expenses, more than offset the impact of rising rates, increasing the net funding costs of the parent over 2003. Net Interest Income Net interest income, the difference between interest income earned on interest-earning assets and interest expense incurred on interest-bearing liabilities, is the most significant component of Sky Financial’s earnings. Net interest income is affected by changes in the volumes, rates and composition of interest-earning assets and interest-bearing liabilities. Table 2 summarizes net interest income and net interest margin for each of the three years ended December 31, 2005, 2004 and 2003. |
| | | | | | | | | | | | |
| Table 2 Net Interest Income | | | | | | | | | | | | |
| Year ended December 31, | | 2005 | | | 2004 | | | 2003 | |
Net interest income | | $ | 514,652 | | | $ | 451,311 | | | $ | 391,243 | |
Taxable equivalent adjustments to net interest income | | | 3,263 | | | | 3,372 | | | | 3,118 | |
Net interest income, fully taxable equivalent | | $ | 517,915 | | | $ | 454,683 | | | $ | 394,361 | |
Net interest margin | | | 3.71 | % | | | 3.66 | % | | | 3.67 | % |
Taxable equivalent adjustment | | | 0.02 | | | | 0.03 | | | | 0.03 | |
Net interest margin, fully taxable equivalent | | | 3.73 | % | | | 3.69 | % | | | 3.70 | % |
| | | | |
Sky Financial’s net interest income, on a fully tax-equivalent basis, of $517,915 in 2005 increased from $454,683 in 2004, which was up from $394,361 in 2003. The growth in net interest income was mainly due to the increase in average earning assets up 12.6% in 2005 after growing 15.7% in 2004 and due to the higher net interest margin in 2005 over 2004. The increase in average earning assets in both 2005 and 2004 was mostly in loans and reflected solid organic growth in addition to the earning assets acquired through mergers. In 2005, loans, which are Sky Financial’s highest yielding assets, comprised 78% of average earning assets, up from 77% in 2004 and 2003. In funding asset growth, Sky Financial has successfully emphasized growth in non-interest-bearing sources. As a percent of earning assets, interest-bearing liabilities declined to 85.5% in 2005 from 86.0% in 2004 and 87.6% in 2003. The net interest margin, on a fully tax-equivalent basis, was 3.73% in 2005, up 4 basis points compared to 3.69% in 2004, which was down from 3.70% in 2003. The higher net interest margin performance in 2005 reflected the benefits from rising short-term interest rates and prudent spread and interest rate risk management practices, despite the effects of the flattened yield curve and increasingly competitive markets. For 2004, while short-term rates rose in the second half of 2004, overall, the yield curve flattened. This combination, along with the lower incremental net interest margins from acquisitions, had the effect of basically neutralizing the potential benefit to the margin from the rising rates compared to the 2003 margin. | | | | In 2006, Sky Financial expects to continue improving both its earning asset and funding mix through targeted organic growth strategies, which should contribute to Sky Financial’s continued growth in net interest income. Table 3 reflects the components of Sky Financial’s net interest income for each of the three years ended December 31, 2005, setting forth: (i) average assets, liabilities and shareholders’ equity (ii) interest income earned on interest-earning assets and interest expense incurred on interest-bearing liabilities; (iii) average yields earned on interest-earning assets and average rates incurred on interest-bearing liabilities; (iv) the net interest rate spread (e.g., the average yield earned on interest-earning assets less the average rate incurred on interest-bearing liabilities); and (v) the net interest margin (e.g., net interest income divided by average interest-earning assets). Rates are computed on a tax-equivalent basis. Non-accrual loans have been included in the average loan balances. |
15
Management’s Discussion and Analysis of
Financial Condition and Results of Operation
(Dollars and shares in thousands, except per share data)
| | | | | | | | | | | | | | | | | | | | | | | | | | | |
| Table 3 Three-Year Average Balance Sheet and Net Interest Margin | | | | | | | | |
| Year ended December 31, | | 2005 | | | 2004 | | | 2003 | |
| | | Average
Balance | | Interest | | Rate | | | Average
Balance | | Interest | | Rate | | | Average
Balance | | Interest | | Rate | |
Interest-earning assets | | | | | | | | | | | | | | | | | | | | | | | | | | | |
Interest-earning deposits | | $ | 29,957 | | $ | 680 | | 2.27 | % | | $ | 37,187 | | $ | 472 | | 1.27 | % | | $ | 33,534 | | $ | 293 | | 0.87 | % |
Federal funds sold and other | | | 1,284 | | | 24 | | 1.84 | | | | 2,573 | | | 30 | | 1.17 | | | | 3,200 | | | 72 | | 2.25 | |
Securities | | | 3,055,905 | | | 133,677 | | 4.37 | | | | 2,795,189 | | | 121,728 | | 4.35 | | | | 2,440,986 | | | 103,769 | | 4.25 | |
Loans and loans held for sale | | | 10,789,169 | | | 699,106 | | 6.48 | | | | 9,493,005 | | | 543,085 | | 5.72 | | | | 8,175,286 | | | 493,047 | | 6.03 | |
Total interest-earning assets | | $ | 13,876,315 | | $ | 833,487 | | 6.01 | | | $ | 12,327,954 | | $ | 665,315 | | 5.40 | | | $ | 10,653,006 | | $ | 597,181 | | 5.61 | |
Assets of discontinued operations | | | – | | | | | | | | | 215,013 | | | | | | | | | 737,476 | | | | | | |
Non-earning assets | | | 1,269,383 | | | | | | | | | 1,028,949 | | | | | | | | | 776,265 | | | | | | |
Total assets | | $ | 15,145,698 | | | | | | | | $ | 13,571,916 | | | | | | | | $ | 12,166,747 | | | | | | |
Interest-bearing liabilities | | | | | | | | | | | | | | | | | | | | | | | | | | | |
Demand deposits | | $ | 365,825 | | $ | 5,227 | | 1.43 | % | | $ | 298,742 | | $ | 2,350 | | 0.79 | % | | $ | 220,891 | | $ | 1,344 | | 0.61 | % |
Savings deposits | | | 3,703,527 | | | 46,665 | | 1.26 | | | | 3,767,873 | | | 28,755 | | 0.76 | | | | 3,343,474 | | | 30,383 | | 0.91 | |
Time deposits | | | 4,915,602 | | | 157,394 | | 3.20 | | | | 4,035,606 | | | 110,659 | | 2.75 | | | | 3,728,437 | | | 111,478 | | 2.99 | |
Total interest-bearing deposits | | | 8,984,954 | | | 209,286 | | 2.33 | | | | 8,102,221 | | | 141,764 | | 1.75 | | | | 7,292,802 | | | 143,205 | | 1.96 | |
Short-term borrowings | | | 857,472 | | | 26,687 | | 3.11 | | | | 897,438 | | | 18,685 | | 2.08 | | | | 849,464 | | | 18,472 | | 2.17 | |
Junior subordinated debentures | | | 188,734 | | | 12,166 | | 6.45 | | | | 174,385 | | | 8,695 | | 4.99 | | | | 150,001 | | | 7,528 | | 5.02 | |
Debt and FHLB advances | | | 1,836,233 | | | 67,433 | | 3.67 | | | | 1,427,547 | | | 41,488 | | 2.91 | | | | 1,041,429 | | | 33,615 | | 3.23 | |
Total interest-bearing liabilities | | | 11,867,393 | | | 315,572 | | 2.66 | | | | 10,601,591 | | | 210,632 | | 1.99 | | | | 9,333,696 | | | 202,820 | | 2.17 | |
Liabilities of discontinued operations | | | – | | | | | | | | | 201,842 | | | | | | | | | 694,010 | | | | | | |
Non-interest-bearing liabilities | | | 1,790,681 | | | | | | | | | 1,538,550 | | | | | | | | | 1,230,285 | | | | | | |
Shareholders’ equity | | | 1,487,624 | | | | | | | | | 1,229,933 | | | | | | | | | 908,756 | | | | | | |
Total liabilities and equity | | $ | 15,145,698 | | | | | | | | $ | 13,571,916 | | | | | | | | $ | 12,166,747 | | | | | | |
Net interest income, fully taxable equivalent | | | | | $ | 517,915 | | | | | | | | $ | 454,683 | | | | | | | | $ | 394,361 | | | |
Net interest spread | | | | | | | | 3.35 | % | | | | | | | | 3.41 | % | | | | | | | | 3.44 | % |
Net interest income, fully taxable equivalent to earning assets | | | | | | | | 3.73 | % | | | | | | | | 3.69 | % | | | | | | | | 3.70 | % |
- Loan fees are included in interest income.
16
| | | | |
| Net interest income may also be analyzed by segregating the volume and rate components of interest income and interest expense. Table 4 presents an analysis of increases and decreases | | | | in interest income and expense in terms of changes in volume and interest rates during the three years ended December 31, 2005. The table is presented on a tax-equivalent basis. |
| | | | | | | | | | | | | | | | | | | | | | | |
| Table 4 Net Interest Income - Rate/Volume Analysis | | | | | | | | | | | | | | | |
| Year ended December 31, | | 2005 | | | 2004 | |
| | | Change from 2004 in interest income or expense due to | | | Change from 2003 in interest income or expense due to | |
| | | Volume | | | Rate | | Total | | | Volume | | | Rate | | | Total | |
Interest income attributable to: | | | | | | | | | | | | | | | | | | | | | | | |
Interest-bearing deposits | | $ | (92 | ) | | $ | 300 | | $ | 208 | | | $ | 32 | | | $ | 147 | | | $ | 179 | |
Federal funds sold | | | (15 | ) | | | 9 | | | (6 | ) | | | (14 | ) | | | (28 | ) | | | (42 | ) |
Securities | | | 11,354 | | | | 595 | | | 11,949 | | | | 15,059 | | | | 2,900 | | | | 17,959 | |
Loans, net | | | 74,152 | | | | 81,869 | | | 156,021 | | | | 79,471 | | | | (29,433 | ) | | | 50,038 | |
Total interest income | | | 85,399 | | | | 82,773 | | | 168,172 | | | | 94,548 | | | | (26,414 | ) | | | 68,134 | |
Interest expense attributable to: | | | | | | | | | | | | | | | | | | | | | | | |
Deposits: | | | | | | | | | | | | | | | | | | | | | | | |
Interest-bearing demand | | | 528 | | | | 2,349 | | | 2,877 | | | | 474 | | | | 532 | | | | 1,006 | |
Savings | | | (491 | ) | | | 18,401 | | | 17,910 | | | | 3,857 | | | | (5,485 | ) | | | (1,628 | ) |
Time | | | 24,130 | | | | 22,605 | | | 46,735 | | | | 9,184 | | | | (10,003 | ) | | | (819 | ) |
Total deposits | | | 24,167 | | | | 43,355 | | | 67,522 | | | | 13,515 | | | | (14,956 | ) | | | (1,441 | ) |
Short-term borrowings | | | (832 | ) | | | 8,834 | | | 8,002 | | | | 1,043 | | | | (830 | ) | | | 213 | |
Trust preferred securities/junior subordinated debentures | | | 715 | | | | 2,756 | | | 3,471 | | | | 1,223 | | | | (56 | ) | | | 1,167 | |
Debt and FHLB advances | | | 11,878 | | | | 14,067 | | | 25,945 | | | | 12,462 | | | | (4,589 | ) | | | 7,873 | |
Total interest expense | | | 35,928 | | | | 69,012 | | | 104,940 | | | | 28,243 | | | | (20,431 | ) | | | 7,812 | |
Net interest income | | $ | 49,471 | | | $ | 13,761 | | $ | 63,232 | | | $ | 66,305 | | | $ | (5,983 | ) | | $ | 60,322 | |
| | | | |
Non-Interest Income Total non-interest income in 2005 increased $7,965 from 2004 which was $24,519 higher than in 2003. The 2005 overall growth was achieved by overcoming a decline in net securities gains of $10,907 and a decline in merchant income. The 2005 growth was driven by increases in service charge and deposit fee income, trust income, transaction fee and brokerage commissions. Continued growth reflects Sky Financial’s focus on growing its fee-based businesses, in addition to contributions from acquisitions. | | | | One of Sky Financial’s five strategic priorities is to increase its fee-based revenue. A component of this is to increase total non-interest income as a percentage of total revenue (net interest income, fully-tax equivalent plus non-interest income). In 2005, despite solid increases in other fee-based revenues, Sky Financial was unable to overcome the decline in net securities gains as the contribution of non-interest income declined slightly to 29% in 2005 from 31% for 2004 and 2003. |
| | | | | | | | | | | | | | | |
| Table 5Non-Interest Income | | | | | | | | | | | | | | | |
| Year ended December 31, | | 2005 | | 2004 | | 2003 | | 2005 Vs. 2004 | | | 2004 Vs. 2003 | |
Trust services income | | $ | 21,918 | | $ | 18,281 | | $ | 14,348 | | 20 | % | | 27 | % |
Service charges and fees on deposit accounts | | | 55,570 | | | 47,964 | | | 38,207 | | 16 | | | 26 | |
Mortgage banking income | | | 24,991 | | | 24,844 | | | 47,832 | | 1 | | | (48 | ) |
Brokerage and insurance commissions | | | 59,172 | | | 55,820 | | | 42,686 | | 6 | | | 31 | |
Net securities gains | | | 3,662 | | | 14,569 | | | 871 | | (75 | ) | | 1,573 | |
Transaction fees | | | 16,361 | | | 13,246 | | | 10,506 | | 24 | | | 26 | |
Merchant income | | | 6,024 | | | 6,929 | | | 4,572 | | (13 | ) | | 52 | |
Income from bank-owned life insurance | | | 7,569 | | | 6,249 | | | 6,484 | | 21 | | | (4 | ) |
International fees | | | 2,366 | | | 1,829 | | | 1,685 | | 29 | | | 9 | |
Other | | | 13,749 | | | 13,686 | | | 11,707 | | – | | | 17 | |
Total non-interest income | | $ | 211,382 | | $ | 203,417 | | $ | 178,898 | | 4 | % | | 14 | % |
17
Management’s Discussion and Analysis of
Financial Condition and Results of Operation
(Dollars and shares in thousands, except per share data)
| | | | | | | | | | | | |
Table 6Mortgage Banking Income | | | | | | | | | | | | |
| Year Ended December 31 | | 2005 | | | 2004 | | | 2003 | |
Origination and sales revenue | | $ | 22,246 | | | $ | 27,168 | | | $ | 54,280 | |
Mortgage loan servicing income | | | 15,326 | | | | 13,784 | | | | 10,768 | |
Amortization expense | | | (13,600 | ) | | | (15,265 | ) | | | (19,495 | ) |
Impairment recapture (charges) | | | 1,019 | | | | (843 | ) | | | 2,279 | |
Total | | $ | 24,991 | | | $ | 24,844 | | | $ | 47,832 | |
| | | | |
Mortgage banking income increased $147 in 2005 after decreasing $22,988 in 2004. On a component basis, in 2005 origination and sales revenue decreased $4,922, mortgage loan servicing income increased $1,542 and amortization and impairment charges decreased $3,527. The overall stable mortgage banking income in 2005 versus 2004 related to a slight decrease in volume but a shift from origination and sales revenue to increased servicing income and a decrease in amortization expense along with an net improvement of $1,862 in impairment recapture (charges) over 2004. The decrease in 2004 was primarily due to an unfavorable change in interest rates that impacted the volume of refinance business. Total volume of loans sold in 2005 was $1,101,314, a decrease of $27,463 or 2% from 2004 after decreasing $1,136,904 or 50% from 2003 to 2004. The overall increase in mortgage interest rates in 2005 led to an anticipated slow down in prepayment rates on mortgages which add to the value of the servicing rights and generated the impairment recapture. An uneven trend in the overall rise in mortgage rates in 2004 in combination with the impact of mortgage servicing rights acquired in acquisitions led to increased impairment reserves on the mortgage servicing rights. During 2005, Sky Financial recorded impairment recapture of $1,019 as compared to a charge of $843 in 2004. Brokerage and insurance commissions increased $3,352 or 6% in 2005 and $13,134 or 31% in 2004. Commissions on insurance products were up 5% in 2005 and 33% in 2004 from organic growth of the core business and acquisitions. Property and Casualty revenue was up over 8% year over year and revenue for Employee Benefits and Life Insurance products increased just under 6% for the same period. Sky Financial acquired Becker-McDowell Agency, Inc., Steiner Insurance | | | | Agency, Inc. and B.K.M.’s Benefit Design Agency of Ohio, Inc. in 2005. In 2004, Sky Financial acquired Spencer-Patterson Insurance Agency, Inc., EOB, Inc. and Stouffer-Herzog Insurance Agency. Service charges and fees on deposit accounts increased $7,606 in 2005 and $9,757 in 2004. The increase in both years reflected the benefits from growth in deposit accounts, both organic and through acquisition, and fee structure modifications. The organic growth in deposit accounts was largely driven by Sky Financial’s sales and service process, successful sales campaigns targeted to grow retail and commercial deposits and continued emphasis on cross-selling to broaden client relationships. Trust income, which continued to be impacted by changes in the equity markets as well as growth from acquisitions and new business, increased $3,637 or 20% in 2005 after increasing $3,933 or 27% in 2004. Trust assets under management rose to $4.8 billion at year-end 2005, up from $4.3 billion at year end 2004 and $3.4 billion at the end of 2003. The 2005 growth was primarily organic with approximately $90 million coming with the Belmont acquisition. For the year 2005, Sky Financial realized net gains on the sales of securities of $3,662 compared with net gains of $14,569 in 2004 and $871 in 2003. In 2005, the gains included $1,523 from the liquidation of approximately $10.3 million of impaired investments. The gains in 2004 included $9,278 from the sale of bank equity holdings. Other income for 2005 included $3,500 of insurance proceeds from the settlement of an insurance claim related to a portfolio of loans, which was substantially offset by lower gains on the sale of certain loans. |
| | | | | |
| | | | |
Non-Interest Expense Total non-interest expense increased $43,523 or 12% in 2005 compared with an increase of $49,338 or 16% in 2004. In 2005, the acquisitions of Belmont and Falls Banks as well as the full year impact of the 2004 merger transactions contributed to the increase in non-interest expenses partially offset by lower merger, integration and restructuring expenses. In addition, the adoption of FAS 123(R) for stock compensation increased expense in 2005 over 2004. In 2004, the acquisitions of Second National and Prospect and other current and prior year acquisitions contributed to the rise in expenses somewhat offset by lower state franchise taxes. The efficiency ratio, which measures total non-interest expenses, including merger, integration and restructuring charges, as a percent of total revenues, was 54.85% in 2005, 54.17% in 2004 and 51.52% in 2003. The efficiency ratio is defined as non-interest expense divided by the sum of fully taxable equivalent net interest income plus non-interest income. | | | | As an active acquirer over the last three years, Sky Financial’s expenses have increased each year for expenses to complete and integrate the new mergers into Sky Financial’s regional financial services delivery structure. These expenses are included in merger, integration and restructuring expenses and are more thoroughly described in Note 16 to the financial statements. In addition, acquisitions have increased Sky Financial’s intangible assets and amortization of intangible assets expense. Non-interest expense includes costs, other than interest, that are incurred in the operations of Sky Financial. Table 7 summarizes the components of Sky Financial’s non-interest expense. |
18
| | | | | | | | | | | | | | | |
| Table 7Non-Interest Expense | | | | | | | | | | | | | | | |
| Year ended December 31, | | 2005 | | 2004 | | 2003 | | 2005
Vs.
2004 | | | 2004
Vs.
2003 | |
Salaries and employee benefits | | $ | 214,555 | | $ | 193,611 | | $ | 165,363 | | 11 | % | | 17 | % |
Occupancy and equipment expense | | | 68,402 | | | 59,096 | | | 50,025 | | 16 | | | 18 | |
Merger, integration and restructuring expense | | | 1,771 | | | 4,542 | | | 4,577 | | (61 | ) | | (1 | ) |
State franchise taxes | | | 3,981 | | | 3,255 | | | 8,550 | | 22 | | | (62 | ) |
Printing and supplies | | | 6,734 | | | 6,054 | | | 5,834 | | 11 | | | 4 | |
Legal and other professional fees | | | 11,644 | | | 9,426 | | | 8,192 | | 24 | | | 17 | |
Telephone | | | 8,401 | | | 7,608 | | | 6,452 | | 10 | | | 18 | |
Loan costs | | | 8,837 | | | 7,827 | | | 7,106 | | 13 | | | 10 | |
Marketing | | | 12,818 | | | 11,269 | | | 9,034 | | 14 | | | 25 | |
Amortization of intangible assets | | | 14,887 | | | 10,979 | | | 6,896 | | 36 | | | 59 | |
Other | | | 48,017 | | | 42,857 | | | 35,157 | | 12 | | | 21 | |
Total non-interest expense | | $ | 400,047 | | $ | 356,524 | | $ | 307,186 | | 12 | % | | 16 | % |
| | | | |
Salaries and employee benefits increased $20,944 or 11% in 2005 and $28,248 or 17% in 2004. The increases in 2005 and 2004 were primarily due to higher staffing levels, mainly from acquisitions, annual merit increases and rising costs for health and retirement benefits and the adoption of FAS 123 (R) for stock options. Sky Financial supports performance-based compensation and maintains commission and incentive plans, which cover all employees, with incentives related to profitability, growth, asset quality and client service. The 2005 increase included $5,238 of stock based compensation expense related to the granting of restricted stock in 2005 and the expensing of stock options related to the adoption of FAS 123(R). The impacts are further discussed in Note 1 to the consolidated financial statements. Performance-based compensation declined in 2005 from 2004. Sky Financial’s full-time equivalent employees were 4,117 at December 31, 2005, up from 4,001 at December 31, 2004 and 3,546 at December 31, 2003. In 2005, salaries, wages and incentives increased $13,513 or 9% and employee benefits rose $7,430 or 17%. In 2004, the increases were $20,180 or 16% and $8,068 or 23%, respectively. Occupancy and equipment expenses increased $9,306 or 16% in 2005 and $9,071 or 18% in 2004. Occupancy expenses increased $6,324 or 24% in 2005 and $5,060 or 24% in 2004 as Sky Financial increased the number of financial centers to 290 at December 31, 2005 from 280 at December 31, 2004 and 260 at year-end 2003. The additional offices resulted from Sky Financial’s acquisitions and the opening of four new offices in 2005 and five in 2004. In addition, higher building rental expenses, higher real estate taxes, higher utility cost and higher repairs and maintenance cost all contributed to the increase. | | | | Equipment expenses grew $2,982 or 9% in 2005 and $4,011 or 14% in 2004 to support Sky Financial’s expansion of its item processing capabilities and as a result of a new ATM technology. Merger, integration and restructuring charges were $1,771 in 2005, $4,542 in 2004 and $4,577 in 2003. The 2005 restructuring charge included $1,168 related to the Belmont acquisition and $224 for the Falls Bank transaction. Additional charges of $379 were recorded for costs associated with the pending acquisition of Union Federal. In 2004, restructuring charges included $3,597 related to the acquisition of Second National, $786 related to the acquisition of Prospect, and $159 of costs primarily associated with the divestiture of Sky Financial Solutions. In 2003, restructuring charges included $1,091 related to the acquisition of Great Lakes Bank and $3,486 related to the Metropolitan Bank acquisition. State franchise taxes increased $726 or 22% in 2005 after decreasing $5,295 or 62% in 2004 primarily as a result of mergers and changes in Sky Financial’s tax bases. Legal and other professional fees were up $2,218 in 2005 over 2004 due to higher legal fees in connection with aggressive loan collection efforts. Amortization of intangible assets increased $3,908 in 2005 from the 2004 amounts due to the addition of $7.9 million in core deposit intangibles and $4.2 million in customer relationship intangibles in 2005. Amortization in 2004 increased $4,083 over 2003 due to the addition of $31.3 million in core deposit intangibles as the results of acquisitions. The increase in other non-interest expense is primarily due to acquisitions. |
| | | | | |
| | | | |
Loan Portfolio Sky Financial’s loan portfolio at December 31, 2005 totaled $11.1 billion, up from $10.6 billion at December 31, 2004 and $8.6 billion at December 31, 2003. The growth in total loans of 5% in 2005 and 23% in 2004 included the impact from acquisitions, which added loans of $.2 billion and $1.5 billion in 2005 and 2004, respectively, and from Sky Financial’s emphasis on organic loan growth, which has focused on commercial lending, non-residential mortgages and home equity loans within residential mortgages. Commercial, financial and agricultural loans comprised 27% of the total loan portfolio at December 31, 2005. This loan category includes loans to a wide variety of businesses, small and large, across many industries and regions. Sky Financial’s commercial lending policy requires each loan to have viable repayment sources. Commercial loans are evaluated for the adequacy of repay- | | | | ment sources at the time of approval and are regularly reviewed for any possible deterioration in the ability of the borrower to repay the loan. In certain instances, collateral is required to provide an additional source of repayment in the event of default by a commercial borrower. The structure of the collateral package, including the type and amount of the collateral, varies from loan to loan depending on the financial strength of the borrower, the amount and terms of the loan, and the collateral available to be pledged by the borrower. Credit risk for commercial loans arises from borrowers lacking the ability or willingness to repay the loan, and in the case of secured loans, by a shortfall in the collateral value in relation to the outstanding loan balance in the event of a default and subsequent liquidation of collateral. Residential mortgage loans were 26% of the total loan portfolio at December 31, 2005. The residential mortgage portfolio contains loans to consumers secured by residential mortgages. |
19
Management’s Discussion and Analysis of
Financial Condition and Results of Operation
(Dollars and shares in thousands, except per share data)
| | | | |
Sky Financial’s residential mortgage lending policy requires each loan to have viable repayment sources. Residential mortgage loans are evaluated for the adequacy of these repayment sources at the time of approval, including credit scores, debt-to-income ratios, and collateral values. Credit risk for residential mortgage loans arises from borrowers lacking the ability or willingness to repay the loan, and by a shortfall in the value of the residential mortgages in relation to the outstanding loan balance in the event of a default and subsequent liquidation of the real estate collateral. The residential mortgage portfolio includes both conforming and nonconforming mortgage loans. Conforming mortgage loans represent loans originated in accordance with underwriting standards set forth by the government-sponsored entities (GSEs) of Federal National Mortgage Association (FNMA), the Federal Home Loan Mortgage Corporation (Freddie Mac), and the Government National Mortgage Association (GNMA), who serve as the primary purchasers of loans sold in the secondary mortgage market by mortgage lenders. These loans are generally collateralized by one-to-four-family residential real estate, have loan-to-collateral value ratios of 80% or less, and are made to borrowers in good credit standing. The right to service the loans and receive servicing fee income is generally retained when conforming loans are sold. Included in the residential mortgage portfolio are home equity loans, which consist mainly of revolving lines of credit to consumers which are secured by residential real estate. Home equity lines are generally governed by the same lending policies and subject to credit risk as described above for residential real estate loans. Construction loans totaled 9% of Sky Financial’s total loans at December 31, 2005. Construction loans are mainly to individuals for the construction of their residences and, from time to time, to established builders and developers for the construction of residential homes without an underlying sales contract. Construction loans to individuals are structured to be converted to permanent loans at the end of the construction phase, which typically runs from six months to one year. Substantially all of these loans are in Sky Financial’s local markets. Residential construction loans are generally under-written pursuant to the same guidelines used for originating permanent residential mortgage loans. Terms and rates typically match residential mortgage loans, except that during the construction phase the borrower pays interest only. The application process for construction loans includes a submission of the plans and costs of the project to be constructed. Non-residential mortgage loans comprised 32% of total loans at December 31, 2005. The non-residential real estate portfolio contains mortgage loans to developers and owners of commer- | | | | cial real estate. Development lending activities in commercial real estate are based primarily on relationships with developers who are active in Sky Financial’s local markets. Commercial real estate loans are governed by the same lending policies and subject to credit risk as described for commercial loans. Installment and credit cards loans were 6% of the total loans at December 31, 2005. This portfolio includes installment loans used by clients to purchase automobiles, boats, recreational vehicles, automobile leases and student loans. These consumer loans are generally governed by the same lending policies as described for residential real estate. Credit risk for installment loans arises from borrowers lacking the ability or willingness to repay the loan, and in the case of secured loans, by a shortfall in the value of the collateral in relation to the outstanding loan balance in the event of a default and subsequent liquidation of collateral. Credit cards includes the outstanding balances on open-ended credit card accounts and unsecured personal and business lines of credit. Credit card loans are typically unsecured and are generally governed by the same lending policies and subject to credit risk as described for residential real estate and consumer loans. Real estate loans, including construction and mortgage loans, approximated 67% of total loans at December 31, 2005, down from 68% at year-end 2004. Commercial loans comprise 27% and 24% of the total loan portfolio for 2005 and 2004, respectively. The change in mix reflects growth in this portfolio due to new business development in existing regional markets. As part of its commercial loan portfolio, Sky Financial engages in financing pools of loans with a specialty consumer finance company. This relationship has currently over 300 pools in this portfolio type. These pools are made up of almost exclusively 1-4 family residential mortgage loans located throughout the country that have some type of impairment associated with them. In addition, Sky Financial participated in a small portfolio of shared national credits. These individual credit relationships total less than one-half of one percent of the total loan portfolio with the businesses located in our current market area. The remaining portion of Sky Financial’s loan portfolio is installment loans, credit card loans and other loans, which decreased to 6% of the loan portfolio from 8% in the prior year. The decrease is due to a reduced emphasis on indirect auto loans and a change in consumer patterns to greater use of home equity lending. As of December 31, 2005, Sky Financial did not have any loan concentrations that exceeded 10% of total loans. Sky Financial monitors the levels of market segments contained in the loan portfolio. |
| | | | | | | | | | | | | | | | | | | | |
| Table 8Loan Portfolio | | | | | | | | | | | | | | | | | | | | |
| December 31, | | 2005 | | | 2004 | | | 2003 | | | 2002 | | | 2001 | |
Real estate loans: | | | | | | | | | | | | | | | | | | | | |
Construction | | $ | 1,012,745 | | | $ | 848,072 | | | $ | 491,086 | | | $ | 410,955 | | | $ | 295,154 | |
Residential mortgage | | | 2,916,248 | | | | 2,898,875 | | | | 2,045,317 | | | | 1,614,048 | | | | 1,464,572 | |
Non-residential mortgage | | | 3,488,684 | | | | 3,498,746 | | | | 2,896,116 | | | | 2,290,053 | | | | 1,719,074 | |
Commercial, financial and agricultural loans | | | 3,024,337 | | | | 2,562,738 | | | | 2,441,225 | | | | 2,168,545 | | | | 1,853,855 | |
Installment and credit card loans | | | 707,208 | | | | 807,687 | | | | 770,901 | | | | 864,387 | | | | 850,343 | |
Total loans | | $ | 11,149,222 | | | $ | 10,616,118 | | | $ | 8,644,645 | | | $ | 7,347,988 | | | $ | 6,182,998 | |
Real estate loans: | | | | | | | | | | | | | | | | | | | | |
Construction | | | 9.1 | % | | | 8.0 | % | | | 5.7 | % | | | 5.6 | % | | | 4.8 | % |
Residential mortgage | | | 26.2 | | | | 27.3 | | | | 23.7 | | | | 22.0 | | | | 23.7 | |
Non-residential mortgage | | | 31.3 | | | | 33.0 | | | | 33.5 | | | | 31.2 | | | | 27.7 | |
Commercial, financial and agricultural loans | | | 27.1 | | | | 24.1 | | | | 28.2 | | | | 29.5 | | | | 30.0 | |
Installment and credit card loans | | | 6.3 | | | | 7.6 | | | | 8.9 | | | | 11.7 | | | | 13.8 | |
Total loans | | | 100.0 | % | | | 100.0 | % | | | 100.0 | % | | | 100.0 | % | | | 100.0 | % |
20
Table 9 shows the amount of commercial, financial and agricultural loans and real estate construction loans outstanding as of December 31, 2005, which based on the remaining scheduled
repayments of principal, are due in the periods indicated. Also, the amounts due after one year are classified according to their sensitivity to changes in interest rates.
| | | | | | | | | | | | |
| Table 9 Loan Maturity and Price Sensitivity |
December 31, 2005 | |
| Due In
1 Year | |
| Due In
1 Year -
5 Years | |
| Due After
5 Years | | | Total |
Commercial, financial and agricultural | | $ | 1,715,394 | | $ | 1,156,631 | | $ | 152,312 | | $ | 3,024,337 |
Construction | | | 256,422 | | | 688,407 | | | 67,916 | | | 1,012,745 |
Total | | $ | 1,971,816 | | $ | 1,845,038 | | $ | 220,228 | | $ | 4,037,082 |
Total due after one year: | | | | | | | | | | | | |
Fixed rate commercial, financial, agricultural and construction | | | | | $ | 184,374 | | $ | 10,585 | | $ | 194,959 |
Variable rate commercial, financial, agricultural and construction | | | | | | 1,660,664 | | | 209,643 | | | 1,870,307 |
Total | | | | | $ | 1,845,038 | | $ | 220,228 | | $ | 2,065,266 |
Actual maturities of loans will differ from the contractual maturities presented in the table above because of prepayments, rollovers and renegotiation of payment terms, among other factors. |
Under-Performing Assets
Residential mortgage, installment and other consumer loans are collectively evaluated for impairment. Individual commercial loans exceeding size thresholds established by management are evaluated for impairment. Impaired loans are recorded at the loan’s fair value by the establishment of a specific allowance where necessary. The fair value of the collateral-dependent loans is determined by the fair value of the underlying collateral. The fair value of noncollateral-dependent loans is determined by discounting expected future interest and principal payments at the loan’s effective interest rate. At December 31, 2005, impaired loans were $75,955 compared with $80,757 at December 31, 2004, the decrease was due primarily to improved asset quality at the end of 2005 due to on-going efforts to reduce problem loans.
Non-accrual loans are comprised principally of loans 90 days past due as well as certain loans, which are current but where serious doubt exists as to the ability of the borrower to comply with the repayment terms. Interest previously accrued and not yet paid on non-accrual loans is reversed or charged against the allowance for credit losses during the period in which the loan is placed in a non-accrual status, except where Sky Financial has determined that such loans are adequately secured as to principal and interest. Interest earned thereafter is included in income only to the extent that it is received in cash. In certain cases, interest received may be credited against principal outstanding under the cost recovery method.
Non-accrual loans decreased $24,177 from $143,207 at December 31, 2004 to $119,030 at year-end 2005. The decrease in non-accrual loans in 2005 included a $14,000 decrease in non-accrual loans secured by pools of commercial leases guaranteed by surety bonds as well as additional reductions and charge-offs. For the year ended December 31, 2005, the amount of interest income that would have been recorded under the original loan terms for total loans classified as non-accrual and restructured was $10,172. The amount actually collected and recorded, as interest income for these loans, was $1,609.
At December 31, 2005, loans secured by pools of commercial leases on non-accrual status was $20,400 down from $34,400 at year end 2004. The reduction in these loans is due to cash collections on the loans during the year and the sale of $9.2 million of these non-accrual loans for $8.9 million in cash proceeds. These loans are guaranteed by surety bonds or insurance policies issued by two creditworthy insurance companies.
Sky is engaged in litigation with these insurance companies to enforce their payment obligations, as are a number of other banks nationwide. These non-accrual loans are currently reflected in the consolidated balance sheet at the amount of the unpaid balance, under contractual terms. After consultation with its counsel as to the strength of its position, Sky Financial believes that the credits are well secured and that the prospects for recovery of its unpaid balance are probable.
At December 31, 2005, non-performing assets were $136,985, a decrease from $165,508 at the prior year-end. The decrease was primarily in non-performing loans, which at yearend 2005, totaled $119,509 or 1.07% of total loans outstanding, compared with $143,748 or 1.35%, of total loans outstanding at year-end 2004. In addition, all $11,705 of non-performing investments outstanding at year-end 2004 were settled or sold during 2005. The non-performing investments consisted of two securities that were on non-accrual, a Franklin County, Ohio revenue bond with a net outstanding balance of $9.4 million and a pooled commercial loan package in partial default with a net outstanding balance of $2.3 million.
Loans now performing, but where some concerns exist as to the ability of the borrower to comply with present loan repayment terms (defined as loans rated substandard or worse, but excluding non-accrual and restructured loans), approximated $140,220 and $159,157 at December 31, 2005 and 2004, respectively, and are being closely monitored by management and the boards of directors of Sky Financial and its subsidiaries. The classification of these loans, however, does not imply that management expects losses on each of these loans, but believes that a higher level of scrutiny is prudent under the circumstances.
The decrease in loans where some concern exists is indicative of the increased focus on credit quality and stricter credit standards in loan categories. These loans require close monitoring despite the fact that they are performing according to their terms. Such classifications relate to specific concerns relating to each individual borrower and do not relate to any concentrated risk elements common to all loans in this group.
21
Management’s Discussion and Analysis of
Financial Condition and Results of Operation
(Dollars and shares in thousands, except per share data)
| | | | | | | | | | | | | | | | | | | | |
Table 10 Under-Performing Assets | | | | | | | | | | | | | | | | | | | | |
| December 31, | | 2005 | | | 2004 | | | 2003 | | | 2002 | | | 2001 | |
Non-accrual loans | | $ | 119,030 | | | $ | 143,207 | | | $ | 81,979 | | | $ | 66,034 | | | $ | 33,319 | |
Restructured loans | | | 479 | | | | 541 | | | | 599 | | | | 3,203 | | | | 785 | |
Total non-performing loans | | | 119,509 | | | | 143,748 | | | | 82,578 | | | | 69,237 | | | | 34,104 | |
Other real estate owned | | | 17,476 | | | | 10,055 | | | | 10,441 | | | | 4,178 | | | | 2,467 | |
Non-performing investments | | | – | | | | 11,705 | | | | – | | | | – | | | | – | |
Total non-performing assets | | $ | 136,985 | | | $ | 165,508 | | | $ | 93,019 | | | $ | 73,415 | | | $ | 36,571 | |
Loans 90 days or more past due and still accruing interest | | $ | 27,987 | | | $ | 16,243 | | | $ | 13,841 | | | $ | 12,458 | | | $ | 15,897 | |
Non-performing loans to total loans | | | 1.07 | % | | | 1.35 | % | | | 0.96 | % | | | 0.94 | % | | | 0.55 | % |
Non-performing assets to total loans plus other real estate owned | | | 1.23 | | | | 1.56 | | | | 1.07 | | | | 1.00 | | | | 0.59 | |
Allowance for credit losses to total non-performing loans | | | 120.88 | | | | 105.32 | | | | 151.30 | | | | 154.07 | | | | 272.20 | |
Loans 90 days or more past due and not on non-accrual to total loans | | | 0.25 | | | | 0.15 | | | | 0.16 | | | | 0.16 | | | | 0.26 | |
| | |
| Provision and Allowance for Credit Losses | | |
The provision for credit losses represents the charge to income necessary to adjust the allowance for credit losses to an amount that represents management’s assessment of the estimated probable credit losses inherent in Sky Financial’s loan portfolio that have been incurred at each balance sheet date. All lending activity contains associated risks of loan losses. Sky Financial recognizes these credit risks as a necessary element of its business activity. To assist in identifying and managing potential loan losses, Sky Financial maintains a loan review function that continuously evaluates individual credit relationships as well as overall loan portfolio conditions. One of the primary objectives of this loan review function is to make recommendations to management as to both specific loss reserves and overall portfolio loss reserves. | | The provision for credit losses for 2005 was $52,249 compared with $37,660 for 2004 and $34,125 in 2003. The 2005 change in the provision for credit losses was attributable to higher levels of net charge-offs mostly related to several large commercial relationships and growth in the loan portfolio, partially offset by an overall reduction in the credit risk profile facilitated by a reduction in non-accrual loans. The 2004 change in the provision for credit losses was attributable to higher net charge-offs and growth in the loan portfolio. |
| | | | | | | | | | | | | | | | | | | | |
| Table 11Allowance for Credit Losses | | | | | | | | | | | | | | | | | | | | |
| Year Ended December 31, | | 2005 | | | 2004 | | | 2003 | | | 2002 | | | 2001 | |
Balance at beginning of the year | | $ | 151,389 | | | $ | 124,943 | | | $ | 106,675 | | | $ | 92,831 | | | $ | 92,089 | |
Loans charged-off: | | | | | | | | | | | | | | | | | | | | |
Real estate | | | (21,612 | ) | | | (9,534 | ) | | | (10,021 | ) | | | (7,898 | ) | | | (2,926 | ) |
Commercial, financial and agricultural loans | | | (26,786 | ) | | | (15,293 | ) | | | (9,615 | ) | | | (9,042 | ) | | | (10,826 | ) |
Installment and credit card | | | (22,480 | ) | | | (18,750 | ) | | | (21,554 | ) | | | (19,700 | ) | | | (17,467 | ) |
Other loans | | | (248 | ) | | | (58 | ) | | | (373 | ) | | | (860 | ) | | | – | |
Total charge-offs | | | (71,126 | ) | | | (43,635 | ) | | | (41,563 | ) | | | (37,500 | ) | | | (31,219 | ) |
Recoveries: | | | | | | | | | | | | | | | | | | | | |
Real estate | | | 1,983 | | | | 2,649 | | | | 1,320 | | | | 1,011 | | | | 376 | |
Commercial, financial and agricultural loans | | | 1,860 | | | | 1,646 | | | | 2,197 | | | | 995 | | | | 1,226 | |
Installment and credit card | | | 5,189 | | | | 4,403 | | | | 5,126 | | | | 4,795 | | | | 2,943 | |
Other loans | | | 309 | | | | – | | | | 4 | | | | 2 | | | | 32 | |
Total recoveries | | | 9,341 | | | | 8,698 | | | | 8,647 | | | | 6,803 | | | | 4,577 | |
Net loans charged-off | | | (61,785 | ) | | | (34,937 | ) | | | (32,916 | ) | | | (30,697 | ) | | | (26,642 | ) |
Provision charged to operating expense | | | 52,249 | | | | 37,660 | | | | 34,125 | | | | 37,659 | | | | 27,384 | |
Allowance for acquired institutions / sold portfolio | | | 2,887 | | | | 23,723 | | | | 17,059 | | | | 6,882 | | | | – | |
Transfer to allowance for unfunded commitments and letters of credit | | | (279 | ) | | | – | | | | – | | | | – | | | | – | |
Balance at the end of the year | | $ | 144,461 | | | $ | 151,389 | | | $ | 124,943 | | | $ | 106,675 | | | $ | 92,831 | |
Net charge-offs to average loans outstanding | | | 0.57 | % | | | 0.37 | % | | | 0.40 | % | | | 0.47 | % | | | 0.40 | % |
Allowance for credit losses to total loans | | | 1.30 | | | | 1.43 | | | | 1.45 | | | | 1.45 | | | | 1.50 | |
Allowance for credit losses to total non-performing loans | | | 120.88 | | | | 105.32 | | | | 151.30 | | | | 154.07 | | | | 272.20 | |
| | |
| At December 31, 2005, an allowance for unfunded commitments and letters of credit of $279 was included in accrued interest payable and other liabilities. | | As a result of the Belmont Bancorp and Falls Bank acquisitions, Sky Financial transferred $2,361 and $526 of allowance for credit losses, respectively. |
22
| | |
Sky Financial maintains an allowance for credit losses at a level adequate to absorb management’s estimate of probable losses inherent in the loan portfolio. The allowance is comprised of a general allowance, a specific allowance for identified problem loans and an unallocated allowance. The general allowance is determined by applying estimated loss factors to the credit exposures from outstanding loans. For construction, commercial and commercial real estate loans, loss factors are applied based on internal risk grades of these loans. For residential real estate, installment, credit card and other loans, loss factors are applied on a portfolio basis. Loss factors are based on Sky Financial’s historical loss experience and are reviewed for modification on a quarterly basis, along with other | | factors affecting the collectibility of the loan portfolio. Specific allowances are established for all classified loans, where management has determined that, due to identified significant conditions, it is probable that Sky Financial will be unable to collect all amounts due according to the contractual terms of the loan agreement. The unallocated allowance recognizes the estimation risk associated with the allocated general and specific allowances and incorporates management’s evaluation of existing conditions that are not included in the allocated allowance determinations. These conditions are reviewed quarterly by management and include general economic conditions, credit quality trends, and internal loan review and regulatory examination findings. |
| | | | | | | | | | | | | | | | | | | | |
| Table 12Allocation of the Allowance for Credit Losses | |
| December 31, | | 2005 | | | 2004 | | | 2003 | | | 2002 | | | 2001 | |
Specific | | | | | | | | | | | | | | | | | | | | |
Real estate | | $ | 2,541 | | | $ | 3,860 | | | $ | 4,185 | | | $ | 2,689 | | | $ | 1,427 | |
Commercial, financial and agricultural | | | 5,122 | | | | 4,054 | | | | 2,738 | | | | 3,468 | | | | 1,032 | |
Sub-total | | | 7,663 | | | | 7,914 | | | | 6,923 | | | | 6,157 | | | | 2,459 | |
General | | | | | | | | | | | | | | | | | | | | |
Construction | | | 5,605 | | | | 4,720 | | | | 2,295 | | | | 2,257 | | | | 2,387 | |
Real estate | | | 54,238 | | | | 54,833 | | | | 42,485 | | | | 33,382 | | | | 27,904 | |
Commercial, financial and agricultural | | | 43,922 | | | | 46,441 | | | | 37,229 | | | | 29,052 | | | | 21,745 | |
Installment and credit card | | | 21,846 | | | | 26,936 | | | | 26,519 | | | | 25,754 | | | | 26,855 | |
Sub-total | | | 125,611 | | | | 132,930 | | | | 108,528 | | | | 90,445 | | | | 78,891 | |
Total allocated | | | 133,274 | | | | 140,844 | | | | 115,451 | | | | 96,602 | | | | 81,350 | |
Unallocated | | | 11,187 | | | | 10,545 | | | | 9,492 | | | | 10,073 | | | | 11,481 | |
Total | | $ | 144,461 | | | $ | 151,389 | | | $ | 124,943 | | | $ | 106,675 | | | $ | 92,831 | |
Percent of loans in each category to total loans | | | | | | | | | | | | | | | | | | | | |
Construction | | | 9.1 | % | | | 8.0 | % | | | 5.7 | % | | | 5.6 | % | | | 4.8 | % |
Real estate | | | 57.5 | | | | 60.3 | | | | 57.2 | | | | 53.2 | | | | 51.4 | |
Commercial, financial and agricultural | | | 27.1 | | | | 24.1 | | | | 28.2 | | | | 29.5 | | | | 30.0 | |
Installment and credit card | | | 6.3 | | | | 7.6 | | | | 8.9 | | | | 11.7 | | | | 13.8 | |
Total | | | 100.0 | % | | | 100.0 | % | | | 100.0 | % | | | 100.0 | % | | | 100.0 | % |
| | |
At December 31, 2005, the allowance for credit losses was $144,461 or 1.30% of total loans outstanding, and 121% of total non-performing loans compared to an allowance at December 31, 2004 of $151,389 or 1.43% of total loans outstanding, and 105% of total non-performing loans. At year-end 2005, the allocated portion of the allowance for credit losses was $133,274 compared with $140,844 at year-end 2004. The decrease in the allowance in 2005 was attributable to an overall reduction in the credit risk profile facilitated by a reduction in non-accrual loans and loans requiring a specific reserve allocation. The increase to the allowance in 2004 was due primarily to the overall growth in total loans of 23% and the adjustment of loss factors for components of certain segments within the loan portfolio. The allowance allocated to the loans secured by pools of commercial leases and guaranteed by surety bonds or insurance policies decreased in 2005 due a reduction in loan balances to $20,400 as well as receiving a court judgment relating to $5,100 of the portfolio. The allowance allocated to the loans secured by pools of commercial leases and guaranteed by surety bonds or insurance policies increased in 2004 and 2003 due to the increase in loan balances to $34,400 in 2004 and $26,637 in 2003 from $22,800 in 2002 as a result of additional loans acquired from the mergers of Second Bancorp and Metropolitan. At year-end 2005, the unallocated portion of the allowance for credit losses was $11,187 compared with $10,545 at year-end 2004 and $9,492 at year-end 2003. | | The increase in the allowance in 2004 and 2003 included the addition of the allowance of acquired institutions of $23,723 and $17,059, respectively. Net charge-offs increased to $61,785 compared with $34,937 in 2004 and $32,916 in 2003, mainly due to higher charge-offs in the first quarter of 2005 related to several large commercial relationships, a loss on the sale of a pool of non-performing real estate loans and the increased size of the loan portfolio. Net charge-offs as a percentage of average loans outstanding increased in 2005 to .57% from .37% in 2004 and .40% in 2003. Securities The investment portfolio at Sky Financial is used as a management tool to maintain acceptable levels of liquidity and exposure to changes in market interest rates. The portfolio yield is maximized once these criteria are satisfied. In recent years, the portfolio has shifted to include a greater percentage of mortgage-backed securities. Mortgage-backed securities offer monthly principal and interest and may be used as collateral in a variety of financial transactions to secure sources of wholesale funding. The market for agency mortgage-backed securities is large and liquid. It is the practice of Sky Financial to purchase mortgage-backed securities with average expected lives of two to five years. Because this type of security may extend or contract, a pre-purchase analysis is completed. Most securities purchased have structures that limit changes to duration as market rates change. The following table documents the fair value of the available for sale portfolio by product. |
23
Management’s Discussion and Analysis of
Financial Condition and Results of Operation
(Dollars and shares in thousands, except per share data)
| | | | | | | | | |
Table 13Securities | | | | | | | | | |
| | | Estimated Fair Value |
| December 31, | | 2005 | | 2004 | | 2003 |
U.S. Treasury | | $ | 301 | | $ | 207 | | $ | 211 |
U.S. government agencies and corporations | | | 191,273 | | | 152,266 | | | 325,947 |
Obligations of states and political subdivisions | | | 7,690 | | | 16,561 | | | 22,337 |
Corporate and other securities | | | 24,111 | | | 51,699 | | | 69,446 |
Mortgage-backed securities | | | 2,698,074 | | | 2,706,552 | | | 1,955,606 |
Total debt securities available for sale | | | 2,921,449 | | | 2,927,285 | | | 2,373,547 |
Marketable equity securities available for sale | | | 31,459 | | | 29,865 | | | 45,862 |
FHLB, FRB & Bankers’ Bank stock(1) | | | 144,564 | | | 134,663 | | | 91,960 |
Total securities | | $ | 3,097,472 | | $ | 3,091,813 | | $ | 2,511,369 |
| (1) | Certain securities such as FHLB, FRB, and Bankers’ Bank stock are carried at amortized cost. |
| | |
In 2005, total securities increased by only $5,659 as the impact of growth was not significant and liquidity and interset rate risk management factors were mostly stable throughout the year. During the year, Sky purchased $722,371 in securities. Maturities, calls and principal repayments totaled $627,290 and sales of investments totaled $127,667 that resulted in a net gain of $3,662. In order to achieve liquidity and interest rate risk management objectives, the available for sale investment portfolio along with wholesale funding and interest rate derivatives (e.g., interest rate swaps, caps and floors) provides the company with the ability to manage liquidity and interest rate risk as the broader balance sheet and market conditions warrant. From time to time adjustments in holdings of various types of investments may be necessary to maintain prudent positioning of the total balance sheet. The management team through the Asset Liability Committee reviews potential adjustments monthly. Out of the securities sold, $10,054 were corporate trust preferred issues that were sold due to management’s decision to minimize risk by liquidating these investments. A net gain of $1,116 was recognized on these sales. Securities sold totaling $25,412 were mortgage-backed securities that had paid down significantly from the original purchase amount. Among the issues considered by management in the decision to sell mortgage-backed securities that have paid down significantly included the market value of the investment, the current book yield, the remaining expected life of the investment, the cost of administration of the security, the stability of the expected remaining life and the likely reinvestment rate. Portfolio management is enhanced by maintaining the number of bonds in the portfolio to a reasonable number. The sale of these securities resulted in a $456 net gain for the year. During the fourth quarter, the Franklin County Multi-Family Housing Revenue Bond was sold to a third party for $9,500. A net gain of $79 was realized on the sale. This investment had been written down as other than temporarily impaired as part of the merger with Metropolitan Bank in 2003. In addition, the BPA Commercial Capital LLC commercial mortgage pass-through certificate was called at $14,998 by the servicer in conjunction with the settlement of an insurance claim. This bond had also been determined to have an other than temporarily impairment as part of the Metropolitan Bank transaction. The resulting gain from the call was $1,452. In addition, $3,231 of other investments consisting of equities and corporate debt issued by financial institutions and government-sponsored enterprises were sold during the year at a net gain of $559. | | In addition to the securities sold above, a combined total of $79,471 in securities, were sold during the integration of Belmont Bancorp and Falls Bank into Sky Financial. These investments were liquidated because they did not conform to the extension risk parameters of the broader securities portfolio. To complete the restructuring process, proceeds from the sales were used to reinvest in securities that better fit the parameters of the current portfolio. In 2004, total securities available for sale increased $580,444 primarily as a result of the acquisitions of Second Bancorp and Prospect. During 2004, $1,052,584 in securities were purchased, while principal from maturities, calls and payments totaled $754,932 and sales totaled $225,923. The portfolio contains mortgage-backed securities and, to a limited extent, other securities, that have uncertain cash flow characteristics. The variable cash flows present additional risk to Sky Financial in the form of prepayment or extension risk primarily caused by changes in market interest rates. This additional risk is generally rewarded in the form of higher yields. Sky Financial utilizes a variety of tools to monitor and minimize this risk. All securities must pass a stress test at the time of purchase estimating how the security would perform in various interest rate environments. Additionally, the corporate investment policy defines certain types of high-risk securities ineligible for purchase, including securities that may not return full principal to Sky Financial. It is also the practice of Sky Financial to minimize premiums paid on mortgage securities to avoid yield reduction if prepayments accelerate. The total premium on mortgage securities was .30% as of December 2005 compared to .43% in December 2004. These policies help to ensure that there will be no material impact from these investments to the financial statements due to changes in market interest rates, which may shorten the average life of the portfolio. Expected maturities of individual securities will differ from contractual maturities because issuers may have the right to call or prepay obligations with or without call or prepayment penalties. Mortgage-backed securities are presented in the table based on current prepayment assumptions. The weighted average yields on income from tax-exempt obligations of state and political subdivisions have been adjusted to a tax equivalent basis. Table 14 shows (at amortized cost) the contractual maturities and weighted average yields of Sky Financial’s securities as of December 31, 2005. |
24
| | | | | | | | | | | | | | | | | | | | | | | | |
| Table 14Maturity Distribution of Debt Securities Portfolio (At Amortized Cost) | |
| | | Within 1 Year | | | 1-5 Years | | | 5-10 Years | | | Over 10 Years | |
| December 31, 2005 | | Amount | | Yield | | | Amount | | Yield | | | Amount | | Yield | | | Amount | | Yield | |
U.S. Treasury | | $ | 199 | | 3.80 | % | | $ | 100 | | 5.48 | % | | $ | – | | – | | | $ | – | | – | |
U.S. government agencies and corporations | | | 34,920 | | 3.65 | | | | 159,069 | | 3.83 | | | | – | | – | | | | 1,348 | | 5.12 | % |
Obligations of states and political subdivisions | | | 630 | | 5.81 | | | | 2,122 | | 6.90 | | | | 878 | | 8.64 | % | | | 3,978 | | 7.20 | |
Corporate and other securities | | | 100 | | 5.49 | | | | 1,200 | | 4.26 | | | | – | | – | | | | 22,263 | | 8.12 | |
Mortgage-backed securities | | | 579,602 | | 4.29 | | | | 1,569,815 | | 4.42 | | | | 517,514 | | 4.57 | | | | 96,384 | | 4.67 | |
Total debt securities available for sale | | $ | 615,451 | | 4.26 | % | | $ | 1,732,306 | | 4.37 | % | | $ | 518,392 | | 4.58 | % | | $ | 123,973 | | 5.38 | % |
| | |
| Sky Financial evaluates its securities portfolio for other than temporary impairment throughout the year. Each investment, which has an indicative market value less than the book value is reviewed on a monthly basis by management. Management considers at a minimum the following factors that, both individually or in combination, could indicate that the decline is other-than-temporary: 1) the length of time and extent to which the market value has been less than book value; 2) the financial condition and near-term prospects of the issuer; or 3) the intent and ability of Sky Financial to retain the investment in the issuer for a period of time sufficient to allow for any anticipated recovery in market value. Among the factors that are considered in determining intent and ability is a review of capital adequacy, interest rate risk profile and liquidity at Sky Financial. | | An impairment is recorded against individual securities if the review described above concludes that the decline in value is other than temporary. The securities portfolio as of December 31, 2005 contains no other-than-temporary impaired investments. The following table documents the amount of securities by type that are currently carried above the fair market value. It also indicates the amount of securities that have been below market value for more than one year. In addition, the table indicates the anticipated recovery period that represents the market consensus on the duration of the investments based on market assumptions. |
| | | | | | | | | | | | | | | | | | | | | | |
Table 15Securities (Gross Unrealized Losses) |
| | | Total | | Greater than one year |
| December 31, 2005 | | Book Value | | Fair Market | | Gross
Unrealized
Losses | | | Book Value | | Fair Market | | Gross
Unrealized
Losses | | | Anticipated
Recovery
Period in years |
U. S. Treasury | | $ | 198 | | $ | 198 | | $ | – | | | $ | – | | $ | – | | $ | – | | | – |
U. S. government agencies and corporations | | | 175,417 | | | 171,340 | | | (4,077 | ) | | | 111,621 | | | 108,375 | | | (3,246 | ) | | 2.3 |
Obligations of states and political subdivisions | | | 480 | | | 478 | | | (2 | ) | | | – | | | – | | | – | | | – |
Corporate and other securities | | | 5,535 | | | 5,500 | | | (35 | ) | | | 5,535 | | | 5,500 | | | (35 | ) | | 5.5 |
Mortgage-backed securities | | | 2,564,139 | | | 2,498,132 | | | (66,007 | ) | | | 1,252,110 | | | 1,205,736 | | | (46,374 | ) | | 3.2 |
Total debt securities for sale | | | 2,745,769 | | | 2,675,648 | | | (70,121 | ) | | | 1,369,266 | | | 1,319,611 | | | (49,655 | ) | | 3.1 |
Marketable equity securities available for sale | | | 8,579 | | | 7,451 | | | (1,128 | ) | | | – | | | – | | | – | | | – |
Total securities | | $ | 2,754,348 | | $ | 2,683,099 | | $ | (71,249 | ) | | $ | 1,369,266 | | $ | 1,319,611 | | $ | (49,655 | ) | | 3.1 |
| | |
| There are no securities of any single issuer where the aggregate carrying value of such securities exceed 10% of shareholders’ equity, except those of the U.S. Treasury, U.S. Government agencies and substantially all mortgage-backed securities issued by Federal Home Loan Mortgage Corporation, Federal National Mortgage Association and Government National Mortgage Association. | | Funding Sources Sky Financial obtains its funding through a variety of sources. Retail deposits are gathered from individuals and businesses within the local communities served by the banking affiliate. Deposits encompass the full range of banking products including checking, savings and time deposits. In addition, Sky Financial obtains funds under a number of borrowing arrangements. The banking affiliate is a member of the Federal Home Loan Bank and may obtain both overnight and term advances. The banking affiliate also obtains funds through securities sold under repurchase agreements and federal funds lines. The parent company maintains a line of credit with a group of non-affiliated banks. |
25
Management’s Discussion and Analysis of
Financial Condition and Results of Operation
(Dollars and shares in thousands, except per share data)
| | | | | | | | | | | | | | | | | | |
Table 16Funding Sources | | | | | | |
| | | Average Amounts Outstanding | | Average Rate Paid | |
| Year Ended December 31, | | 2005 | | 2004 | | 2003 | | 2005 | | | 2004 | | | 2003 | |
Non-interest-bearing demand deposits | | $ | 1,641,264 | | $ | 1,402,627 | | $ | 1,113,236 | | | | | | | | | |
Interest-bearing demand deposits | | | 365,825 | | | 298,742 | | | 220,891 | | 1.43 | % | | 0.79 | % | | 0.61 | % |
Savings deposits | | | 3,703,527 | | | 3,767,873 | | | 3,343,474 | | 1.26 | | | 0.76 | | | 0.91 | |
Time deposits | | | 4,915,602 | | | 4,035,606 | | | 3,728,437 | | 3.20 | | | 2.75 | | | 2.99 | |
Total deposits | | | 10,626,218 | | | 9,504,848 | | | 8,406,038 | | | | | | | | | |
Short-term borrowings | | | 857,472 | | | 897,438 | | | 849,464 | | 3.11 | | | 2.08 | | | 2.17 | |
Trust preferred securities/Junior subordinated debentures | | | 188,734 | | | 174,385 | | | 150,001 | | 6.45 | | | 4.99 | | | 5.02 | |
Debt and FHLB advances | | | 1,836,233 | | | 1,427,547 | | | 1,041,429 | | 3.67 | | | 2.91 | | | 3.23 | |
Total funding sources | | $ | 13,508,657 | | $ | 12,004,218 | | $ | 10,446,932 | | | | | | | | | |
Table 17 is a schedule of maturities of time deposits in denominations of $100,000 or more as of December 31, 2005 and 2004:
| | | | | | |
| Table 17Maturity of Time Deposits of $100,000 or More | | | | | | |
| December 31, | | 2005 | | 2004 |
Three months or less | | $ | 486,086 | | $ | 358,600 |
Three through six months | | | 381,298 | | | 213,830 |
Six through twelve months | | | 287,970 | | | 336,278 |
Over twelve months | | | 431,845 | | | 671,250 |
Total | | $ | 1,587,199 | | $ | 1,579,958 |
| | |
Short-Term Borrowings Table 18 sets forth certain information relative to borrowed funds with original maturities of less than one year. Included in these borrowed funds are federal funds purchased, advances from the | | FHLB, securities sold under agreements to repurchase and bank lines of credit. |
| | | | | | | | | | | | |
| Table 18 Short-Term Borrowings | | | | | | | | | | | | |
| December 31, | | 2005 | | | 2004 | | | 2003 | |
Balance at period-end | | $ | 1,396,660 | | | $ | 1,282,644 | | | $ | 1,397,128 | |
Weighted average interest rate at period-end | | | 3.63 | % | | | 2.01 | % | | | 0.94 | % |
Maximum outstanding at any month-end during the year | | $ | 1,396,660 | | | $ | 1,286,337 | | | $ | 1,397,128 | |
Average amount outstanding | | | 1,220,694 | | | | 1,109,910 | | | | 952,831 | |
Weighted average rates during the year | | | 2.82 | % | | | 1.25 | % | | | 1.10 | % |
| For further information on the securities sold under agreements to repurchase, see Note 8 of the Consolidated Financial Statements. | |
26
Contractual Obligations and Commitments
Table 19 presents, as of December 31, 2005, Sky Financial’s significant fixed and determinable contractual obligations by payment date. The payment amounts represent those amounts due to the recipient and do not include any unamortized premiums or discounts or other similar carrying amount adjustments.
Deposits without a stated maturity have been placed in the one year and less category for this presentation based on the clients’ ability to withdraw on a daily basis. However, from a practical standpoint, these deposits provide a stable long-term source of funding.
| | | | | | | | | | | | | | | |
| Table 19 Contractual Obligations(1) |
Note | |
| One Year
or Less | |
| One to
Three Years | |
| Three to
Five Years | |
| Over Five
Years | | | Total |
Deposits without a stated maturity | | $ | 5,484,186 | | $ | – | | $ | – | | $ | – | | $ | 5,484,186 |
Certificates of deposit | | | 3,630,855 | | | 1,361,769 | | | 233,157 | | | 42,994 | | | 5,268,775 |
Federal funds purchased and securities sold under repurchase agreements | | | 741,660 | | | 280,000 | | | – | | | 30,000 | | | 1,051,660 |
Debt and FHLB borrowings | | | 968,569 | | | 374,608 | | | 419,520 | | | 151,291 | | | 1,913,988 |
Operating leases | | | 10,003 | | | 15,000 | | | 10,544 | | | 17,494 | | | 53,041 |
Junior subordinated debentures | | | – | | | – | | | – | | | 182,185 | | | 182,185 |
Total | | $ | 10,835,273 | | $ | 2,031,377 | | $ | 663,221 | | $ | 423,964 | | $ | 13,953,835 |
| (1) | In the banking industry, interest-bearing obligations are principally utilized to fund interest-bearing assets. As such, interest charges on related contractual obligations were excluded from reported amounts as the potential cash outflows would have corresponding cash inflows from interest-bearing assets. |
Sky Financial obtains its funding from a variety of sources including retail and commercial deposits, securities sold under agreement to repurchase, federal funds purchased, FHLB advances, and debt securities offered by Sky Financial. By utilizing a mixture of these funding sources, Sky Financial is able to manage its contractual repayment dates.
Sky Financial also enters into derivative contracts under which it is required to either receive cash or pay cash to counterparties depending on changes in interest rates. Derivative contracts are carried at their fair value on the consolidated balance sheet with the fair value representing the net present value of expected future cash receipts or payments based on market interest rates as of the balance sheet date. The contracts are primarily interest rate swaps and cash is settled quarterly. Because the derivative contracts recorded on the balance sheet at December 31, 2005, do not represent amounts that will ultimately be received or paid under these contracts, they are excluded from the table above.
A schedule of significant off-balance sheet commitments at December 31, 2005, is included in Table 20.
| | | | | | |
Table 20Significant Commitments |
| | | | 2005 | | | 2004 |
Commitments to extend credit | | $ | 3,498,243 | | $ | 2,981,831 |
Standby letters of credit | | | 299,427 | | | 343,130 |
Letters of credit | | | 1,704 | | | 7,173 |
These commitments are extended to clients in the normal course of business and are subject to the same credit policies as making on-balance commitments. Because many of the commitments are expected to expire without being drawn upon, the total amounts do not represent future cash flow requirements.
Liquidity Management
Management of liquidity is of continuing importance to the banking industry. The liquidity of a financial institution reflects its ability to meet loan requests, to accommodate possible outflows of deposits and to take advantage of interest rate market opportunities. The ability of a financial institution to meet its current financial obligations is a function of balance sheet structure, the ability to liquidate assets and the availability of alternative sources of funds. To meet the needs of the clients and manage the risk of the bank, financial institutions have developed innovative ways to meet clients needs while at the same time managing both liquidity and interest rate risk. This is being done primarily through liquidity management and the balance of deposit growth and alternative sources of borrowing.
Certificates of deposit provide Sky Financial with a dependable source of funding. However, market pricing can be highly competitive and this source of funds must be prudently managed. As of December 31, 2005, a total of $3,632,330 of time deposits mature in the next twelve months. The maturities are reasonably disbursed across the year and there are no unusual concentrations of individual clients. At Sky Financial, time deposit maturities are monitored through the corporate Asset/ Liability Committee (ALCO). Maturing balances are summarized by month, as well as original term and current rate. Heavy maturity periods are monitored closely and proactive marketing plans are created that address both the client and Sky Financial’s needs
and preferences. Regional management along with funds management meets weekly to discuss general economic and market conditions. During this meeting, each region reports the results of the prior week’s pricing and promotional efforts. Each region then determines its rates for the coming week. Regional pricing allows Sky Financial to attract deposits at the most efficient cost available. Time deposit maturities are monitored and the percent retained is reported monthly to ALCO.
Management of Sky Financial is confident that a significant portion of the scheduled maturities will be retained in 2006. In the unlikely event that these are not retained by Sky Financial, a minimum liquidity ratio has been established at 10% of non-collateralized liabilities. This 10% ratio consists of readily marketable securities and unused borrowing capacity. At least 8% of the assets must be in unencumbered marketable assets. In addition, Sky Financial has a standing contingent liquidity management plan that prioritizes the steps needed to compensate for temporary disruptions in liquidity.
In addition to maintaining a stable core deposit base, Sky Financial’s banking subsidiary maintains adequate liquidity primarily through the use of investment securities, unused borrowing capacity, security repurchase agreements and federal funds purchased.
27
Management’s Discussion and Analysis of
Financial Condition and Results of Operation
(Dollars and shares in thousands, except per share data)
| | | | |
At December 31, 2005, securities with maturities of one year or less totaled $35,581. In addition, the mortgage-backed securities provide an estimated cash flow of approximately $579,602 over a twelve-month timeframe. The banking subsidiary is a member of the Federal Home Loan Bank (FHLB). The FHLB provides a reliable source of funds with a wide variety of terms and structures. As of December 31, 2005, the banking subsidiary had total credit availability with the FHLB of $1,913,376, of which, $1,775,583 was outstanding. At the end of 2004, Sky Financial’s share repurchase program had two million shares remaining. During 2005, 1,911 shares were repurchased under this program. Sky Financial is a holding company and does not conduct operations. Its primary sources of liquidity are borrowings from outside sources and dividends received from its subsidiaries. For the banking subsidiary, regulatory approval is required in order to pay dividends in excess of the subsidiary’s earnings retained for the current year plus retained net profits for the prior two years. At December 31, 2005, $227,309 was available for distribution to Sky Financial as dividends without prior regulatory approval. Sky Financial maintains a $100,000 line of credit with a group of unaffiliated banks that expires May 26, 2006. It is anticipated that the line will be renewed. As of December 31, 2005, Sky Financial had no outstanding balance on the line of credit. The corporation manages liquidity risk in accordance with established policies primarily through the ALCO. Management has increased its monitoring of liquidity levels and has implemented strategies to increase liquidity. Strategies implemented in 2004 and 2005 include new retail, deposit retention and growth initiatives, an increased portfolio of a laddered maturity of brokered CDs and additional federal funds lines. Capital Resources Shareholders’ equity at year-end 2005 totaled $1,553,877 compared to $1,470,955 at December 31, 2004, an increase of 6%. The increase was primarily due to net retained earnings (net income less dividends) of $87,493 and the issuance of stock for acquisitions and for the exercise of stock options. These increases were partially offset by the reduction in shareholders equity from the repurchase of shares. The Federal Reserve Board has established risk-based capital guidelines that must be observed by financial holding companies and banks. Sky Financial has consistently maintained the regulatory capital ratios of the corporation and its bank above “well capitalized” requirements. Under capital adequacy guidelines, Sky Financial and Sky Bank must meet specific quantitative measures of their assets, liabilities and certain off-balance sheet items as determined under regulatory accounting practices. Sky Financial’s and Sky Bank’s capital amounts and classifications are subject to qualitative judgments by the regulators about components, risk weighting and other factors. Management believes, as of December 31, 2005, Sky Financial and Sky Bank meet all capital adequacy requirements for which they are subject. At December 31, 2005, Sky Financial’s and Sky Bank’s ratio of total capital to risk-weighted assets as defined by the regulatory framework for prompt corrective action were 11.5% and 11.2%. The capital position is managed through changes to balance sheet size and composition, issuance of debt and equity instruments, treasury stock activities, dividend policies and retention of earnings. In late 2005, the four federal banking agencies-the Office of the Comptroller of the Currency, the Board of Governors of the Federal Reserve System, the Federal Deposit Insurance Corporation, and the Office of Thrift Supervision published an interagency advance notice of proposed rulemaking regarding potential revisions to the existing risk-based capital framework. These changes would apply to banks, bank holding companies, and savings associations. | | | | The potential modifications to the U.S. risk-based capital standards including: n Increasing the number of risk weight categories to which credit exposures may be assigned; n Expanding the use of external credit ratings as an indicator of credit risk for externally-rated exposures; n Expanding the range of collateral and guarantors that may qualify an exposure for lower risk weights; n Using loan-to-value ratios, credit assessments, and other broad measures of credit risk for assigning risk-weights to residential mortgages; n Modifying the credit conversion factor for various commitments, including those with an original maturity of under one year; n Requiring that certain loans 90 days or more past due or in a non-accrual status be assigned to a higher risk weight category; n Modifying the risk-based capital requirements for certain commercial real estate exposures; n Increasing the risk sensitivity of capital requirements for other types of retail, multifamily, small business, and commercial exposures; and n Assessing a risk-based capital charge to reflect the risks in securitizations with early amortization provisions that are backed by revolving retail exposures. Sky Financial will continue to monitor these potential changes to the risk-based capital standards and will make the necessary changes to ensure that it remains well-capitalized. Sky Financial’s strategic plans include continued growth through acquisitions, which can potentially impact Sky Financial’s capital position. Sky Financial may issue additional common stock in conjunction with future acquisitions in order maintain its well capitalized status. In September 2004, Sky Financial’s Board of Directors authorized the repurchase of up to 2,068 shares of common stock over the next twelve months, of which 68 shares were repurchased during 2004. During 2005 Sky Financial repurchased 1,911 shares under the authorization. Sky Financial does not currently intend to repurchase additional shares in 2006. Shares repurchased by Sky Financial were used in its stock option plans and for general corporate purposes. As of December 31, 2005, Sky Financial has $184,799 of capital securities with wholly-owned unconsolidated subsidiaries, which are considered to be Tier I capital for regulatory purposes. Under the Federal Reserve Board’s regulatory framework, certain capital securities offered by wholly-owned unconsolidated trust preferred entities of Sky Financial are currently included as “Tier I” regulatory capital. The Federal Reserve Board issued their final regulations on March 30, 2005 after evaluating whether these capital securities will continue as Tier I capital as a result of their deconsolidation under generally accepted accounting principals. The Federal Reserve Board has determined that these securities will continue to qualify as Tier I capital with specific limitations. The management of Sky Financial has evaluated these limitations and does not believe they will have a material effect on Sky Financial or Sky Bank’s Tier I capital. Sky Financial anticipates issuing approximately $150,000 of capital securities to coincide with the acquisition of Union Federal in the third quarter of 2006. Market Risk Management Market risk is the risk that a financial institution’s earnings and capital, or its ability to meet its business objectives, will be adversely affected by movements in market rates or prices such as interest rates, foreign exchange rates, equity prices, credit spreads and/or commodity prices. Within Sky Financial, the dominant market risk exposure is changes in interest rates. |
28
The negative effect of this exposure is felt through the net interest spread, mortgage banking revenues and the market values of various assets and liabilities.
Sky Financial manages market risk through its ALCO at both the subsidiary and consolidated levels. The committee assesses interest rate risk exposure through three primary measurements: rate sensitive assets divided by rate sensitive liabilities (or “Gap ratios”), interest rate shock simulations of net interest income at risk, and economic value of equity risk simulation.
Sky Financial also utilizes interest rate swaps and caps to effectively modify its liability interest rate repricing to more effectively match the repricing characteristics of its assets. At December 31, 2005, the fair value of Sky Financial’s derivative arrangements aggregated $(2,813) on contracts with notional amounts of $411,015. Sky Financial monitors and manages its rate sensitivity position to maximize net interest income, while minimizing the risk due to changes in interest rates.
Sky Financial also uses a rate sensitivity gap analysis to manage its interest rate risk. The difference between a financial institution’s interest rate sensitive assets (e.g., assets that will mature or reprice within a specific time period) and interest rate sensitive liabilities (i.e. liabilities that will mature or reprice within the same time period) is commonly referred to as its “interest rate sensitivity gap” or “gap.” An institution having more interest rate sensitive assets than interest rate sensitive liabilities within a given time period is said to have a “positive gap,” which generally means that if interest rates increase, a company’s net interest income will increase and if interest rates decrease, its net interest income will decrease. An institution having more interest rate sensitive liabilities than interest rate assets within a given time period is said to have a “negative gap,” which generally means that if interest rates increase, a company’s net interest income will decrease and if interest rates decrease, its net interest income will increase.
The current policy imposes limits at the six-month and 12- month time periods that is measured in terms of the ratio of cumulative rate sensitive assets divided by rate sensitive liabilities. Table 21 presents the gap position of Sky Financial at December 31, 2005 and 2004.
| | | | | | | | | | | | |
| Table 21Gap Position | |
| | | Year-end | | | Year-end | | | ALCO Guidelines | |
| | | 2005 | | | 2004 | | | Max | | | Min | |
Six month | | 102.5 | % | | 108.2 | % | | 125 | % | | 95 | % |
One year | | 98.2 | % | | 105.9 | % | | 125 | % | | 95 | % |
The interest rate shock simulation analysis measures the potential effect on earnings that an instantaneous parallel change in general interest rates could have on net interest income and economic value of equity. Sky Financial applies hypothetical interest rate shocks up 300, 200 and 100 basis points and down 100 basis points to its financial instruments based on the assumed cash flows. Under the interest rate environment as of December 31, 2004, a declining 200 basis point or greater scenario was improbable and therefore provided no meaningful results. The economic value of equity measures the price risk of the entire balance sheet by discounting expected cash flows of all assets and liabilities and netting the result. This provides a longer-term view of the interest rate risk profile of the company that is focused on the current economic value of assets and liabilities that make up the balance sheet at a static point in time. The shock then examines how the economic value of the company would change if market rates were different. As demonstrated in Table 22, as of December 31, 2005, the projected volatility of net interest income and economic value of equity due to the hypothetical changes in market rates are within ALCO guidelines. While transitioning out of a historically
low rate environment, Sky Financial is monitoring the effect of a 300 basis point up scenario. A policy limit for a 300 basis point up scenario has not been proposed by management as of December 31, 2005.
| | | | | | | | | |
| Table 22Rate Shock Analysis | |
| | | Year-end
2005 |
| | Year-end
2004 |
| | ALCO
Guidelines |
|
One year net interest income change | | | | | | | | | |
+300 Basis points | | 2.2 | % | | 3.3 | % | | N/A | |
+200 Basis points | | 1.8 | | | 2.6 | | | (10.0 | )% |
+100 Basis points | | 1.0 | | | 1.4 | | | (5.0 | ) |
-100 Basis points | | (2.0 | ) | | (2.3 | ) | | (5.0 | ) |
-200 Basis points | | (5.8 | ) | | N/M | | | (10.0 | ) |
Net present value of equity change | | | | | | | | | |
+300 Basis points | | (17.7 | )% | | (14.6 | )% | | N/A | |
+200 Basis points | | (11.3 | ) | | (8.7 | ) | | (15.0 | )% |
+100 Basis points | | (5.2 | ) | | (3.8 | ) | | (10.0 | ) |
-100 Basis points | | 3.2 | | | 1.1 | | | (10.0 | ) |
-200 Basis points | | 3.6 | | | N/M | | | (15.0 | ) |
N/M – Not Meaningful
The preceding analysis is based on numerous assumptions, including relative levels of market interest rates, instantaneous and parallel shifts in the yield curve, loan prepayments and reactions of depositors to changes in interest rates, and should not be relied upon as being indicative of actual or future results. Further, the analysis does not necessarily contemplate all actions Sky Financial may undertake in response to changes in interest rates.
Effects of Inflation
The assets and liabilities of Sky Financial are primarily monetary in nature and are more directly affected by the fluctuation in interest rates than inflation. Movement in interest rates is a result of the perceived changes in inflation as well as monetary and fiscal policies. Interest rates and inflation do not necessarily move with the same velocity or within the same period; therefore, a direct relationship to the inflation rate cannot be shown. The financial information presented in this report has been prepared in accordance with generally accepted accounting principles, which require that Sky Financial measure financial position and operating results primarily in terms of historical dollars.
Pending Acquisition
On February 3, 2006, Sky Financial announced the execution of a definitive agreement to acquire Union Federal Bank of Indianapolis, and its parent company, Waterfield Mortgage Company, Incorporated, Ft. Wayne, Indiana. Sky Financial’s transaction is for the acquisition of Waterfield’s retail and commercial banking business conducted primarily through Union Federal Bank, which had approximately $2.7 billion in assets at the date of the agreement.
Under the terms of the agreement, shareholders of Waterfield will be entitled to receive $80.07 in cash plus 4.38 shares of Sky Financial common stock for each Waterfield share and Sky Financial will issue 7.5 million shares and pay $136.5 million in cash to complete the transaction. The transaction is valued at $330 million, based upon Sky Financial’s closing stock price as of February 2, 2006 and is expected to close in the third quarter of 2006. The exchange is expected to qualify as a tax-free transaction to the Waterfield shareholders. Following the merger, and
29
Management’s Discussion and Analysis of
Financial Condition and Results of Operation
(Dollars and shares in thousands, except per share data)
upon receipt of all necessary regulatory approvals, Union Federal Bank will be merged with and into Sky Bank.
Not considering the merger-related charges discussed below, the merger is expected to be accretive to earnings per share by approximately $.02 or 1% in the first full year of operations (2007), due to the expected cost-saving benefits achieved through the integration of systems and support functions, improved branch efficiencies and increased alternative delivery channels for financial products and services. As a result of cost saving efforts, Sky Financial expects to reduce approximately 14% of Union Federal Bank’s non-interest expenses. After-tax merger-related costs of approximately $6 – $8 million will be incurred to complete the merger.
Critical Accounting Policies and Estimates
The accounting and reporting policies of Sky Financial are in accordance with accounting principles generally accepted within the United States of America and conform to general practices within the banking industry. Accounting and reporting policies for the allowance for credit losses and mortgage servicing rights are deemed critical because they involve the use of estimates and require significant management judgments. Application of assumptions different from those used by management could result in material changes in Sky Financial’s financial position or results of operations.
Account - Allowance for Credit Losses
Balance Sheet Reference - Allowance for Credit Losses
Income Statement Reference - Provision for Credit Losses
Description
The allowance for credit losses is an amount that management believes will be adequate to absorb probable incurred losses in existing loans taking into consideration such factors as past loss experience, changes in the nature and volume of the portfolio, overall portfolio quality, loan concentrations, specific problem loans and current economic conditions that affect the borrower’s ability to pay. Determination of the allowance is inherently subjective due to the aforementioned reasons. Loan losses are charged-off against the allowance when management believes that the full collectibility of the loan is unlikely. Recoveries of amounts previously charged-off are credited to the allowance. Allowances established to provide for losses under commitments to extend credit, or recourse provisions under loan sales agreements or servicing agreements are classified with other liabilities.
A loan is considered impaired when it is probable that not all principal and interest amounts will be collected according to the loan contract. Residential mortgage, installment and other consumer loans are collectively evaluated for impairment. Individual commercial loans exceeding size thresholds established by management are evaluated for impairment. Impaired loans are recorded at the loan’s fair value by the establishment of a specific allowance where necessary. The fair value of collateral-dependent loans is determined by the fair value of the underlying collateral. The fair value of noncollateral-dependent loans is determined by discounting expected future interest and principal payments at the loan’s effective interest rate.
Sky Financial maintains the allowance for credit losses at a level adequate to absorb management’s estimate of probable losses inherent in the loan portfolio. The allowance is comprised of a general allowance, a specific allowance for identified problem loans and an unallocated allowance, which represent estimations done pursuant to either FAS No. 5Accounting for Contingencies, or FAS No. 114,Accounting by Creditors for Impairment of a Loan.
The general allowance is determined by applying estimated loss factors to the credit exposures from outstanding loans. For construction, commercial and commercial real estate loans loss factors are applied based on internal risk grades of these loans. Many factors are considered when these grades are assigned to individual loans such as current and past delinquency, financial statements of the borrower, current net realizable value of collateral and the general economic environment and specific economic trends affecting the portfolio. For residential real estate, installment, credit card and other loans, loss factors are applied on a portfolio basis. Loss factors are based on Sky Financial’s historical loss experience and are reviewed for modification on a quarterly basis, along with other factors affecting the collectibility of the loan portfolio.
Specific allowances are established for all classified loans, where management has determined that, due to identified significant conditions, it is probable that Sky Financial will be unable to collect all amounts due according to the contractual terms of the loan agreement. The unallocated allowance recognizes the estimation risk associated with the allocated general and specific allowances and incorporates management’s evaluation of existing conditions that are not included in the allocated allowance determinations. These conditions are reviewed quarterly by management and include general economic conditions, credit quality trends and internal loan review and regulatory examination findings.
Management believes that it uses the best information available to determine the adequacy of the allowance for loan losses. However, future adjustments to the allowance may be necessary and the results of operations could be significantly and adversely affected if circumstances differ substantially from the assumptions used in making the determinations.
Account - Mortgage Servicing Rights
Balance Sheet Reference - Other Assets
Income Statement Reference - Mortgage Banking Income
Description
The cost of mortgage loans sold or securitized is allocated between the mortgage servicing rights and the mortgage loans based on the relative fair values of each. The fair value of the mortgage servicing rights is determined by using a discounted cash flow model, which estimates the present value of the future net cash flows of the servicing portfolio based on various factors, such as servicing costs, expected prepayment speeds and discount rates, about which management must make assumptions based on future expectations.
Mortgage servicing rights are amortized in proportion to, and over the period of, estimated net servicing income. Management periodically evaluates mortgage servicing rights for impairment by stratifying the loans in the servicing portfolio primarily based on loan type, interest rate and region of origination. Impairment is measured by estimating the fair value of each stratum, taking into consideration the estimated level of prepayments based upon current industry expectations. An impairment allowance for a stratum is recorded when, and in an amount which, its fair value is less than its carrying value.
The value of mortgage servicing rights is subject to prepayment risk. Future expected net cash flows from servicing a loan in our servicing portfolio will not be realized if the loan pays off earlier than anticipated. Moreover, because most loans within our servicing portfolio do not contain penalty provisions for early payoff, we will not receive a corresponding economic benefit if the loan pays off earlier than expected. Mortgage servicing rights represent the discounted present value of the future net cash flows we expect to receive from our servicing portfolio.
30
| | | | |
New Accounting Pronouncements In November 2005, the Financial Accounting Standards Board (FASB) issued FASB Staff Position (FSP) 115-1/124-1.The Meaning of Other-Than-Temporary Impairment and its Application to Certain Investments. This FSP provides additional guidance on when an investment in a debt or equity security should be considered impaired and when that impairment should be considered other-than-temporary and recognized as a loss in earnings. Specifically, the guidance clarifies that an investor should recognize an impairment loss no later than when the impairment is deemed other-than-temporary, even if a decision to sell has not been made. The FSP also requires certain disclosures about unrealized losses that have not been recognized as other-than-temporary impairments. Sky financial applied the guidance in this FSP in 2005 and there was no material affect to the results of operations or the statement of financial position In December 2003, the Accounting Standards Executive Committee of the American Institute of Certified Public Accountants issued AICPA Statement of Position No. 03-3,Accounting for Certain Loans or Debt Securities Acquired in a Transfer(SOP 03-3), to address accounting for differences between the contractual cash flows of certain loans and debt securities and the cash flows expected to be collected when loans or debt securities are acquired in a transfer and those cash flow differences are attributable, at least in part, to credit quality. As such, SOP 03-3 applies to such loans and debt securities purchased or acquired in purchase business combinations and does not apply to originated loans. The application of SOP 03-3 limits the interest income, including accretion of purchase price discounts that may be recognized for certain loans and debt securities. Additionally, SOP 03-3 requires that the excess of contractual cash flows over cash flows expected to be collected (nonaccretable difference) not be recognized as an adjustment of yield or valuation allowance, such as the allowance for loan losses. Subsequent to the initial investment, increases in expected cash flows generally should be recognized prospectively through adjustment of the yield on the loan or debt security over its remaining life. Decreases in expected cash flows should be recognized as impairment. Sky Financial adopted SOP 03-3 on January 1, 2005. This SOP had no material affect to either of Sky Financial’s two acquisitions of banks during 2005. | | | | Forward Looking Statements This report includes forward-looking statements by Sky Financial relating to such matters as anticipated operating results, credit quality expectations, prospects for new lines of business, technological developments, economic trends (including interest rates), acquisition, reorganization and divestiture transactions and similar matters. Such statements are based upon the current beliefs and expectations of Sky Financial’s management and are subject to risks and uncertainties. While Sky Financial believes that the assumptions underlying the forward-looking statements contained herein are reasonable, any of the assumptions could prove to be inaccurate, and accordingly, actual results and experience could differ materially from the anticipated results or other expectations expressed by Sky Financial in its forward-looking statements. Factors that could cause actual results or experience to differ from results discussed in the forward-looking statements include, but are not limited to: economic conditions; volatility and direction of market interest rates; capital investment in and operating results of non-banking business ventures of Sky Financial; governmental legislation and regulation; material unforeseen changes in the financial condition or results of operations of Sky Financial’s customers; customer reaction to and unforeseen complications with respect to Sky Financial’s integration of acquisitions; difficulties in realizing expected cost savings from acquisitions; difficulties associated with data conversions in acquisitions; and other risks identified from time-to- time in Sky Financial’s other public documents on file with the Securities and Exchange Commission. The Private Securities Litigation Reform Act of 1995 provides a safe harbor for forward-looking statements, and the purpose of this paragraph is to secure the use of the safe harbor provisions. |
| | | | | |
| | | | |
Item 7A.Quantitative and Qualitative Disclosures About Market Risk The information contained under the caption “Management’s Discussion and Analysis of Financial Condition and Results of | | | | Operations - Market Risk Management” on page 28 of this Form 10-K is incorporated herein by reference in response to this item. |
31
Item 8.Financial Statements and Supplementary Data
Report of Independent Registered
Public Accounting Firm
To the Board of Directors and Shareholders of
Sky Financial Group, Inc.
Bowling Green, Ohio
| | | | |
We have audited the accompanying consolidated balance sheets of Sky Financial Group, Inc. and subsidiaries (the “Company”) as of December 31, 2005 and 2004, and the related consolidated statements of income, changes in shareholders’ equity, and cash flows for each of the three years in the period ended December 31, 2005. These financial statements are the responsibility of the Company’s management. Our responsibility is to express an opinion on these financial statements based on our audits. We conducted our audits in accordance with the standards of the Public Company Accounting Oversight Board (United States). Those standards require that we plan and perform the audit to obtain reasonable assurance about whether the financial statements are free of material misstatement. An audit includes examining, on a test basis, evidence supporting the amounts and disclosures in the financial statements. An audit also includes assessing the accounting principles used and significant estimates made by management, as well as evaluating the overall financial statement presentation. We believe that our audits provide a reasonable basis for our opinion. In our opinion, such consolidated financial statements present fairly, in all material respects, the financial position of Sky Financial Group, Inc. and subsidiaries at December 31, 2005 and 2004, and the results of their operations and their cash flows for each of the three years in the period ended December 31, 2005 in conformity with accounting principles generally accepted in the United States of America. As discussed in Note 1 to the consolidated financial statements, the Company adopted Statement of Financial Accounting Standards No. 123(R),Share-Based Payment, in 2005. | | | | We have also audited, in accordance with the standards of the Public Company Accounting Oversight Board (United States), the effectiveness of the Company’s internal control over financial reporting as of December 31, 2005, based on the criteria established inInternal Control-Integrated Frameworkissued by the Committee of Sponsoring Organizations of the Treadway Commission and our report dated February 21, 2006 expressed an unqualified opinion on management’s assessment of the effectiveness of the Company’s internal control over financial reporting and an unqualified opinion on the effectiveness of the Company’s internal control over financial reporting. 
Deloitte & Touche LLP Cleveland, Ohio February 21, 2006 |
32
Consolidated Balance Sheets
(Dollars and shares in thousands, except per share data)
| | | | | | | | |
| December 31, | | 2005 | | | 2004 | |
Assets | | | | | | | | |
Cash and due from banks | | $ | 318,114 | | | $ | 232,407 | |
Interest-earning deposits with financial institutions | | | 15,037 | | | | 32,919 | |
Loans held for sale | | | 24,184 | | | | 9,433 | |
Securities | | | 3,097,472 | | | | 3,091,813 | |
| | |
Total loans | | | 11,149,222 | | | | 10,616,118 | |
Less allowance for credit losses | | | (144,461 | ) | | | (151,389 | ) |
Net loans | | | 11,004,761 | | | | 10,464,729 | |
| | |
Premises and equipment, net | | | 166,797 | | | | 155,466 | |
Goodwill | | | 521,862 | | | | 475,258 | |
Core deposit and other intangibles, net | | | 67,077 | | | | 71,674 | |
Accrued interest receivable and other assets | | | 467,987 | | | | 410,724 | |
Total assets | | $ | 15,683,291 | | | $ | 14,944,423 | |
Liabilities | | | | | | | | |
Deposits | | | | | | | | |
Non-interest-bearing deposits | | $ | 1,734,113 | | | $ | 1,592,510 | |
Interest-bearing deposits | | | 9,021,563 | | | | 8,759,081 | |
| | |
Total deposits | | | 10,755,676 | | | | 10,351,591 | |
Securities sold under repurchase agreements and federal funds purchased | | | 1,053,244 | | | | 1,041,361 | |
Debt and Federal Home Loan Bank advances | | | 1,940,989 | | | | 1,735,282 | |
Junior subordinated debentures owed to unconsolidated subsidiary trusts | | | 184,799 | | | | 189,558 | |
Accrued interest payable and other liabilities | | | 194,706 | | | | 155,676 | |
Total liabilities | | $ | 14,129,414 | | | $ | 13,473,468 | |
Shareholders’ Equity | | | | | | | | |
Common stock, no par value; 350,000 shares authorized; 110,207 and 106,952 shares issued in 2005 and 2004 | | | 1,221,571 | | | | 1,136,681 | |
Retained earnings | | | 430,710 | | | | 343,541 | |
Treasury stock; 1,899 and 113 shares in 2005 and 2004 | | | (51,418 | ) | | | (2,330 | ) |
Accumulated other comprehensive loss | | | (46,986 | ) | | | (6,937 | ) |
Total shareholders’ equity | | | 1,553,877 | | | | 1,470,955 | |
Total liabilities and shareholders’ equity | | $ | 15,683,291 | | | $ | 14,944,423 | |
The accompanying notes are an integral part of the consolidated financial statements.
33
Consolidated Statements of Income
(Dollars in thousands, except per share data)
| | | | | | | | | |
| For The Years Ended December 31, | | 2005 | | 2004 | | 2003 |
Interest Income | | | | | | | | | |
Loans, including fees | | $ | 695,969 | | $ | 543,085 | | $ | 493,047 |
Securities | | | | | | | | | |
Taxable | | | 133,317 | | | 118,035 | | | 99,998 |
Nontaxable | | | 234 | | | 321 | | | 653 |
Federal funds sold and other | | | 704 | | | 502 | | | 365 |
Total interest income | | | 830,224 | | | 661,943 | | | 594,063 |
Interest Expense | | | | | | | | | |
Deposits | | | 209,286 | | | 141,764 | | | 143,205 |
Borrowed funds | | | 106,286 | | | 68,868 | | | 59,615 |
Total interest expense | | | 315,572 | | | 210,632 | | | 202,820 |
Net interest income | | | 514,652 | | | 451,311 | | | 391,243 |
Provision for credit losses | | | 52,249 | | | 37,660 | | | 34,125 |
Net interest income after provision for credit losses | | | 462,403 | | | 413,651 | | | 357,118 |
Non-Interest Income | | | | | | | | | |
Trust services income | | | 21,918 | | | 18,281 | | | 14,348 |
Service charges and fees on deposit accounts | | | 55,570 | | | 47,964 | | | 38,207 |
Mortgage banking income | | | 24,991 | | | 24,844 | | | 47,832 |
Brokerage and insurance commissions | | | 59,172 | | | 55,820 | | | 42,686 |
Net securities gains | | | 3,662 | | | 14,569 | | | 871 |
Other income | | | 46,069 | | | 41,939 | | | 34,954 |
Total non-interest income | | | 211,382 | | | 203,417 | | | 178,898 |
Non-Interest Expenses | | | | | | | | | |
Salaries and employee benefits | | | 214,555 | | | 193,611 | | | 165,363 |
Occupancy and equipment expense | | | 68,402 | | | 59,096 | | | 50,025 |
Merger, integration and restructuring expense | | | 1,771 | | | 4,542 | | | 4,577 |
Amortization expense | | | 14,887 | | | 10,979 | | | 6,896 |
Other operating expense | | | 100,432 | | | 88,296 | | | 80,325 |
Total non-interest expenses | | | 400,047 | | | 356,524 | | | 307,186 |
Income from continuing operations before income taxes | | | 273,738 | | | 260,544 | | | 228,830 |
Income taxes | | | 91,547 | | | 85,344 | | | 76,150 |
Income from continuing operations | | | 182,191 | | | 175,200 | | | 152,680 |
Income from discontinued operations (net of tax of $200, $10,348 and $2,305, respectively) | | | 372 | | | 19,155 | | | 3,937 |
Net Income | | $ | 182,563 | | $ | 194,355 | | $ | 156,617 |
Basic Earnings Per Common Share | | | | | | | | | |
Income from continuing operations | | $ | 1.71 | | $ | 1.76 | | $ | 1.70 |
Income from discontinued operations | | | 0.00 | | | 0.19 | | | 0.05 |
Net Income | | $ | 1.71 | | $ | 1.95 | | $ | 1.75 |
Diluted Earnings Per Common Share | | | | | | | | | |
Income from continuing operations | | $ | 1.69 | | $ | 1.74 | | $ | 1.69 |
Income from discontinued operations | | | 0.00 | | | 0.19 | | | 0.04 |
Net Income | | $ | 1.69 | | $ | 1.93 | | $ | 1.73 |
The accompanying notes are an integral part of the consolidated financial statements.
34
Consolidated Statements of Changes in Shareholders’ Equity
(Dollars and shares in thousands, except per share data)
| | | | | | | | | | | | | | | | | | | | | | | | | |
| | | Common
Shares | | Treasury
Shares | | | Common
Stock | | | Retained
Earnings | | | Treasury
Stock | | | Accumulated
Other
Comprehensive
Income (Loss) | | | Total | |
Balance, December 31, 2002 | | 87,277 | | 221 | | | $ | 658,767 | | | $ | 149,543 | | | $ | (3,965 | ) | | $ | 28,088 | | | $ | 832,433 | |
Comprehensive income | | | | | | | | | | | | | | | | | | | | | | | | | |
Net income | | | | | | | | | | | | 156,617 | | | | | | | | | | | | 156,617 | |
Other comprehensive loss | | | | | | | | | | | | | | | | | | | | (27,630 | ) | | | (27,630 | ) |
Total comprehensive income | | | | | | | | | | | | | | | | | | | | | | | | 128,987 | |
Cash dividends ($.81 per share) | | | | | | | | | | | | (72,968 | ) | | | | | | | | | | | (72,968 | ) |
Shares issued for stock option exercises | | 604 | | | | | | 10,869 | | | | | | | | | | | | | | | | 10,869 | |
Shares issued to acquire Metropolitan Financial Corp | | 2,887 | | | | | | 55,294 | | | | | | | | | | | | | | | | 55,294 | |
Shares issued to acquire Great Lakes Bancorp | | 1,717 | | | | | | 39,195 | | | | | | | | | | | | | | | | 39,195 | |
Shares issued to acquire Insurance Buyers Services Agency, Inc. | | | | (164 | ) | | | 735 | | | | | | | | 2,963 | | | | | | | | 3,698 | |
Fractional shares and other items | | | | (15 | ) | | | | | | | 808 | | | | 260 | | | | | | | | 1,068 | |
Balance, December 31, 2003 | | 92,485 | | 42 | | | | 764,860 | | | | 234,000 | | | | (742 | ) | | | 458 | | | | 998,576 | |
Comprehensive income | | | | | | | | | | | | | | | | | | | | | | | | | |
Net income | | | | | | | | | | | | 194,355 | | | | | | | | | | | | 194,355 | |
Other comprehensive loss | | | | | | | | | | | | | | | | | | | | (7,395 | ) | | | (7,395 | ) |
Total comprehensive income | | | | | | | | | | | | | | | | | | | | | | | | 186,960 | |
Cash dividends ($.85 per share) | | | | | | | | | | | | (84,814 | ) | | | | | | | | | | | (84,814 | ) |
Treasury shares acquired | | | | 68 | | | | | | | | | | | | (1,588 | ) | | | | | | | (1,588 | ) |
Shares issued for stock option exercises | | 872 | | | | | | 19,929 | | | | | | | | | | | | | | | | 19,929 | |
Shares issued to acquire EOB, Inc. | | 177 | | | | | | 4,558 | | | | | | | | | | | | | | | | 4,558 | |
Shares issued to acquire Second Bancorp | | 11,953 | | | | | | 310,645 | | | | | | | | | | | | | | | | 310,645 | |
Shares issued to acquire Spencer-Patterson Insurance Agency | | 297 | | | | | | 7,637 | | | | | | | | | | | | | | | | 7,637 | |
Shares issued to acquire Prospect Bancshares | | 1,139 | | | | | | 29,052 | | | | | | | | | | | | | | | | 29,052 | |
Fractional shares and other items | | 29 | | 3 | | | | | | | | | | | | | | | | | | | | – | |
Balance, December 31, 2004 | | 106,952 | | 113 | | | | 1,136,681 | | | | 343,541 | | | | (2,330 | ) | | | (6,937 | ) | | | 1,470,955 | |
Comprehensive income | | | | | | | | | | | | | | | | | | | | | | | | | |
Net income | | | | | | | | | | | | 182,563 | | | | | | | | | | | | 182,563 | |
Other comprehensive loss | | | | | | | | | | | | | | | | | | | | (40,049 | ) | | | (40,049 | ) |
Total comprehensive income | | | | | | | | | | | | | | | | | | | | | | | | 142,514 | |
Cash dividends ($.89 per share) | | | | | | | | | | | | (95,070 | ) | | | | | | | | | | | (95,070 | ) |
Treasury shares acquired | | | | 1,911 | | | | | | | | | | | | (52,407 | ) | | | | | | | (52,407 | ) |
Treasury shares issued for restricted stock awards | | | | (133 | ) | | | (3,531 | ) | | | | | | | 3,531 | | | | | | | | – | |
Restricted stock forfeited | | | | 5 | | | | | | | | | | | | (127 | ) | | | | | | | (127 | ) |
Restricted stock expense | | | | | | | | 1,130 | | | | | | | | | | | | | | | | 1,130 | |
Shares issued for stock option exercises | | 657 | | | | | | 13,773 | | | | | | | | | | | | | | | | 13,773 | |
Stock option expense | | | | | | | | 4,107 | | | | | | | | | | | | | | | | 4,107 | |
Shares issued to acquire Belmont Bancorp | | 1,765 | | | | | | 49,689 | | | | | | | | | | | | | | | | 49,689 | |
Shares issued to acquire EOB, Inc. | | 13 | | | | | | 336 | | | | | | | | | | | | | | | | 336 | |
Shares issued to acquire Benefits Design Agency | | 137 | | | | | | 3,902 | | | | | | | | | | | | | | | | 3,902 | |
Shares issued to acquire Steiner Insurance Agency | | 111 | | | | | | 3,178 | | | | | | | | | | | | | | | | 3,178 | |
Shares issued to acquire Becker-McDowell Agency | | 222 | | | | | | 6,351 | | | | | | | | | | | | | | | | 6,351 | |
Shares issued to acquire Falls Bank | | 350 | | | | | | 9,890 | | | | | | | | | | | | | | | | 9,890 | |
Fractional shares and other items | | | | 3 | | | | (3,935 | ) | | | (324 | ) | | | (85 | ) | | | | | | | (4,344 | ) |
Balance, December 31, 2005 | | 110,207 | | 1,899 | | | $ | 1,221,571 | | | $ | 430,710 | | | $ | (51,418 | ) | | $ | (46,986 | ) | | $ | 1,553,877 | |
The accompanying notes are an integral part of the consolidated financial statements.
35
Consolidated Statements of Cash Flows
(Dollars in thousands)
| | | | | | | | | | | | |
| For The Years Ended December 31, | | 2005 | | | 2004 | | | 2003 | |
Operating Activities | | | | | | | | | | | | |
Income from continuing operations | | $ | 182,191 | | | $ | 175,200 | | | $ | 152,680 | |
Adjustments to reconcile income from continuing operations to net cash from operating activities: | | | | | | | | | | | | |
Depreciation, amortization and accretion | | | 28,578 | | | | 22,633 | | | | 30,614 | |
Stock-based compensation expense | | | 5,237 | | | | – | | | | – | |
Net gains on sales of assets | | | (16,715 | ) | | | (14,751 | ) | | | (721 | ) |
Provision for credit losses | | | 52,249 | | | | 37,660 | | | | 34,125 | |
Proceeds from sales of loans held for sale | | | 1,101,314 | | | | 1,128,777 | | | | 2,265,681 | |
Disbursements on originations of loans held for sale | | | (1,080,056 | ) | | | (1,110,148 | ) | | | (2,190,064 | ) |
Net change in other assets and liabilities | | | 4,062 | | | | 635 | | | | (68,797 | ) |
Net cash provided from operating activities of continuing operations | | | 276,860 | | | | 240,036 | | | | 223,518 | |
Net cash (used for) provided from operating activities of discontinued operations | | | – | | | | (3,560 | ) | | | 46,867 | |
Investing Activities | | | | | | | | | | | | |
Net (increase) decrease in interest-earning deposits with financial institutions | | | 20,745 | | | | (3,232 | ) | | | 12,726 | |
Net decrease in federal funds sold | | | 13,480 | | | | – | | | | 44,860 | |
Securities: | | | | | | | | | | | | |
Proceeds from maturities and payments | | | 627,290 | | | | 754,932 | | | | 1,499,132 | |
Proceeds from sales | | | 127,667 | | | | 225,923 | | | | 416,526 | |
Purchases | | | (722,371 | ) | | | (1,052,584 | ) | | | (2,051,780 | ) |
Proceeds from sales of non-mortgage loans | | | 255,560 | | | | 99,115 | | | | 25,344 | |
Net increase in loans | | | (672,758 | ) | | | (608,005 | ) | | | (235,529 | ) |
Purchases of premises and equipment | | | (27,485 | ) | | | (20,401 | ) | | | (19,032 | ) |
Proceeds from sales of premises and equipment | | | 5,466 | | | | 20,053 | | | | 22,634 | |
Proceeds from sales of other real estate | | | 15,300 | | | | 12,975 | | | | 4,111 | |
Proceeds from sale of discontinued operations, net of cash sold | | | – | | | | 68,207 | | | | – | |
Net cash received (paid) in acquisitions | | | (7,358 | ) | | | 23,170 | | | | 58,721 | |
Other items | | | – | | | | – | | | | (154 | ) |
Net cash used for investing activities of continuing operations | | | (364,464 | ) | | | (479,847 | ) | | | (222,441 | ) |
Net cash used for investing activities of discontinued operations | | | – | | | | (26,126 | ) | | | (264,871 | ) |
Financing Activities | | | | | | | | | | | | |
Net increase (decrease) in deposit accounts | | | 124,940 | | | | 336,125 | | | | (231,892 | ) |
Net increase (decrease) in federal funds and repurchase agreements | | | 12,361 | | | | (49,874 | ) | | | 150,180 | |
Net increase (decrease) in short-term FHLB advances | | | 200,000 | | | | (106,500 | ) | | | 280,000 | |
Net decrease in borrowings under bank lines of credit | | | – | | | | (61,000 | ) | | | (4,000 | ) |
Proceeds from junior subordinated debt to unconsolidated subsidiary trust | | | – | | | | – | | | | 30,000 | |
Repayment of junior subordinated debt to unconsolidated subsidiary trust | | | – | | | | (16,000 | ) | | | (27,750 | ) |
Proceeds from issuance of debt and long-term FHLB advances | | | 218,775 | | | | 265,723 | | | | 54,590 | |
Repayment of debt and long-term FHLB advances | | | (253,140 | ) | | | (100,087 | ) | | | (180,359 | ) |
Cash dividends and fractional shares paid | | | (93,659 | ) | | | (80,731 | ) | | | (71,008 | ) |
Proceeds from issuance of common stock | | | 13,773 | | | | 19,929 | | | | 10,869 | |
Treasury stock purchases | | | (52,407 | ) | | | (1,588 | ) | | | – | |
Tax benefits from tax deductions in excess of the compensation cost recognized | | | 2,643 | | | | – | | | | – | |
Other items | | | 25 | | | | – | | | | 1,068 | |
Net cash provided from financing activities of continuing operations | | | 173,311 | | | | 205,997 | | | | 11,698 | |
Net cash provided from financing activities of discontinued operations | | | – | | | | 31,129 | | | | 216,835 | |
Net increase (decrease) in cash and due from banks | | | 85,707 | | | | (32,371 | ) | | | 11,606 | |
Cash and due from banks at beginning of year | | | 232,407 | | | | 264,778 | | | | 253,172 | |
Cash and due from banks at end of year | | | 318,114 | | | | 232,407 | | | | 264,778 | |
Less cash at discontinued operations | | | – | | | | – | | | | (13,414 | ) |
Cash and due from banks at end of year, net of discontinued operations | | $ | 318,114 | | | $ | 232,407 | | | $ | 251,364 | |
Supplemental Disclosures | | | | | | | | | | | | |
Interest paid | | $ | 315,455 | | | $ | 206,023 | | | $ | 242,765 | |
Income taxes paid | | | 76,216 | | | | 70,220 | | | | 86,138 | |
Value of shares issued for acquisitions | | | 73,346 | | | | 351,892 | | | | 98,187 | |
Transfer of loans to other real estate | | | 22,091 | | | | 11,172 | | | | 6,848 | |
Non-cash activity related to the acquisitions included the purchase of assets with a fair value of $438,505 and the assumption of liabilities of $342,622 in 2005; the purchase of assets with a fair value of $2,494,497 and the assumption of liabilities of $2,135,005 in 2004; and the purchase of assets with a fair value of $1,625,525 and the assumption of liabilities of $1,500,968 in 2003.
The accompanying notes are an integral part of the consolidated financial statements.
36
Notes to Consolidated Financial Statements
(Dollars and shares in thousands, except per share data)
Note 1Summary of Significant Accounting Policies
| | | | |
Sky Financial Group, Inc. (Sky Financial) is a financial holding company headquartered in Bowling Green, Ohio that owns and operates Sky Bank, which is primarily engaged in the commercial and consumer banking business in Ohio, Pennsylvania, Indiana, Michigan and West Virginia. Sky Financial also operates businesses relating to insurance, brokerage, trust and other financial-related services. Basis of Presentation The accounting and reporting policies followed by Sky Financial conform to accounting principles generally accepted in the United States of America (U.S. GAAP) and to general practices within the financial services industry. The preparation of financial statements requires management to make estimates and assumptions that affect the reported amounts of assets and liabilities and disclosure of contingent assets and liabilities at the date of the financial statements. Actual results could differ from those estimates. The allowance for credit losses, fair values of financial instruments, mortgage servicing rights and status of contingencies are particularly subject to change. Consolidation The consolidated financial statements of Sky Financial include the accounts of Sky Bank, Sky Trust, N.A. (Sky Trust), Sky Insurance, Inc. (Sky Insurance), and various other insignificant subsidiaries. On March 31, 2004, Sky Financial Solutions, Inc. (SFS) was sold and is included in the consolidated financial statements and related notes as discontinued operations. All significant intercompany transactions and accounts have been eliminated in consolidation. Securities Sky Financial classifies its securities as held to maturity, trading or available for sale. Securities classified as available for sale are those that management intends to sell or that could be sold for liquidity, investment management or similar reasons, even if there is not a present intention to make such a sale. Equity securities that have a readily determinable fair value are also classified as available for sale. Securities classified as available for sale are carried at estimated fair value with unrealized appreciation or depreciation recorded, net of tax, in other comprehensive income. Securities classified as held to maturity are stated at cost, adjusted for amortization of premiums and accretion of discounts. Securities classified as held to maturity are those that management has the positive intent and ability to hold to maturity. Trading securities are acquired for sale in the near term and are carried at fair value, with unrealized holding gains and losses reflected in earnings. Sky Financial held no trading securities or securities classified as held to maturity during any period presented. Certain restricted equity securities, such as stock of the Federal Home Loan Bank of Cincinnati, are carried at cost. Amortization of premiums and accretion of discounts are recorded in interest income using the interest method over the period to maturity, which is sometimes estimated. Gains and losses on security sales are calculated using the specific identification method to determine the security’s cost. Purchases and sales of securities are recognized on a trade-date basis. Derivative Financial Instruments Sky Financial’s hedging policies permit the use of interest rate swaps, caps and floors to manage interest rate risk or to hedge specified assets and liabilities. Sky Financial does not use derivative financial instruments for trading purposes. Interest rate swaps were entered into as cash flow and fair value hedges for the purpose of modifying the interest rate characteristics of certain borrowings. The interest rate swaps involve no exchange of principal | | | | either at inception or upon maturity; rather, it involves the periodic exchange of interest payments arising from an underlying notional value. Interest rate caps were entered into as cash flow hedges for purposes of modifying the interest rate characteristics of federal funds purchased. Derivative instruments are recorded at their fair values. If derivative instruments are designated as hedges of fair values, both the change in the fair value of the hedge and the hedged item are included in current earnings. Fair value adjustments related to cash flow hedges are recorded in other comprehensive income (loss), net of tax and reclassified to earnings when the hedged transaction is reflected in earnings. Ineffective portions of hedges are reflected in earnings as they occur. During 2005, Sky Financial began a program to provide clients the ability to swap from variable to fixed interest rates on commercial loans. Under these agreements, Sky Financial enters into a variable rate loan agreement with a client in addition to a swap agreement. This swap agreement effectively swaps the client’s variable rate loan into a fixed rate loan. Sky Financial then enters into a corresponding swap agreement with a third party in order to offset its exposure on the variable to fixed rate swap on the commercial loan. These arrangements are not designated as hedges under Financial Accounting Standards (FAS) No.133Accounting for Derivatives and Hedging Activities, as amended. Accordingly, the interest rate swaps with both the clients and third parties are carried at fair value while the changes in fair value offset each other in the income statement. Loans Loans that management has the intent and ability to hold for the foreseeable future or until maturity or payoff are carried at the outstanding principal amount, net of any loan origination and commitment fees and costs, and any premiums or discounts arising at the time of purchase or business acquisition. Interest is recorded when earned and includes amortization of any deferred loan origination fees, commitment fees, costs, premiums and discounts. When collection of the loan or interest becomes doubtful, the loan is placed on nonaccrual status and all accrued and unpaid interest relating to previous years and any remaining fees are charged against the allowance for credit losses. Current year’s accrued and unpaid interest is reversed against interest income. Payments on nonaccrual loans are recorded as principal reductions until repayment of the loan and interest is reasonably assured and the loan is returned to accrual status. Loan origination, commitment fees and costs and premium and discounts are amortized over the contractual life of the loan as an adjustment to the related loan’s yield using the interest method. Loans Held for Sale Certain residential mortgage loans are originated for sale in the secondary mortgage loan market. Additionally, certain other loans are periodically identified to be sold. These loans are classified as loans held for sale and carried at the lower of cost or estimated fair value. Fair value is determined on the basis of rates quoted in the respective secondary market for the type of loan held for sale. Loans are generally sold at a premium or discount from the carrying amount of the loans. Such premium or discount is recognized at the date of sale. Fixed commitments may be used at the time loans are originated or identified for sale to mitigate interest rate risk. The fair value of fixed commitments to originate and sell loans held for sale was not material. Mortgage Servicing Rights Mortgage servicing rights (MSRs) are stated at cost less accumulated amortization. The cost of mortgage loans sold or securitized is allocated between the mortgage servicing rights and the cost |
37
Notes to Consolidated Financial Statements
(Dollars and shares in thousands, except per share data)
Note 1Summary of Significant Accounting Policies (continued)
| | | | |
of the mortgage based on the relative fair values of each. The fair value of the mortgage servicing rights is determined by using a discounted cash flow model, which estimates the present value of the future net cash flows of the servicing portfolio based on various factors, such as servicing costs, expected prepayment speeds and discount rates, about which management must make assumptions based on future expectations. MSRs are amortized in proportion to, and over the period of, estimated net servicing income. Management periodically evaluates MSRs for impairment by stratifying the loans in the servicing portfolio primarily based on loan type, coupon rate and region. Impairment is measured by estimating the fair value of each stratum, taking into consideration the estimated level of prepayments based upon current market expectations. An impairment allowance for a stratum is recorded when its fair value is less than its carrying value, and the impairment is deemed by management to be temporary. Amortization and impairments are charged to mortgage banking income. Recoveries of impairment reduce the allowance and increase income. MSRs are also reviewed for other-than-temporary impairment. Other-than-temporary impairment exists when the recoverability of a recorded valuation allowance is determined to be remote taking into consideration historical and projected interest rates and loan pay-off activity. When this situation occurs, the unrecoverable portion of the valuation allowance is applied as a direct write-down to the carrying value of the MSRs. Unlike a valuation allowance, a direct write-down permanently reduces the carrying value of the MSR and the valuation allowance, precluding subsequent recoveries. Allowance for Credit Losses The allowance for credit losses is an amount that management believes will be adequate to absorb probable incurred losses in existing loans taking into consideration such factors as past loss experience, changes in the nature and volume of the portfolio, overall portfolio quality, loan concentrations, specific problem loans and current economic conditions that affect the borrower’s ability to pay. Determination of the allowance is inherently subjective due to the aforementioned reasons. Changes in estimates are recorded currently through provision for credit losses. Loan losses are charged-off against the allowance when management believes that the full collectibility of the loan is unlikely. Recoveries of amounts previously charged-off are credited to the allowance. Allowances established to provide for losses under commitments to extend credit or recourse provisions under loan sales agreements or servicing agreements are classified within other liabilities. A loan is considered impaired when it is probable that not all principal and interest amounts will be collected according to the loan contract. Residential mortgage, installment and other consumer loans are evaluated by portfolio for impairment. Individual commercial loans exceeding size thresholds established by management are evaluated for impairment, while the balance of the portfolio is evaluated collectively. Impaired loans are recorded at the loan’s fair value by the establishment of a specific allowance where necessary. The fair value of collateral-dependent loans is generally determined by the fair value of the underlying collateral. The fair value of noncollateral-dependent loans is determined by discounting expected future interest and principal payments at the loan’s effective interest rate. Sky Financial maintains the allowance for credit losses at a level adequate to absorb management’s estimate of probable losses inherent in the loan portfolio. The allowance is comprised of a general allowance, a specific allowance for identified problem loans and an unallocated allowance representing estimations done pursuant to either FAS No. 5Accounting for | | | | Contingencies, or FAS No. 114, Accounting by Creditors for Impairment of a Loan. The general allowance is determined by applying estimated loss factors to the credit exposures from outstanding loans. For construction, commercial and commercial real estate loans, loss factors are applied based on internal risk grades of these loans. Many factors are considered when these grades are assigned to individual loans such as current and past delinquency, financial statements of the borrower, current net realizable value of collateral and the general economic environment and specific economic trends affecting the portfolio. For residential real estate, installment, credit card and other loans, loss factors are applied on a portfolio basis. Loss factors are based on Sky Financial’s historical loss experience and are reviewed for modification on a quarterly basis, along with other factors affecting the collectibility of the loan portfolio. Specific allowances are established for all classified loans, where management has determined that, due to identified significant conditions, it is probable that Sky Financial will be unable to collect all amounts due according to the contractual terms of the loan agreement. The unallocated allowance recognizes the estimation risk associated with the allocated general and specific allowances and incorporates management’s evaluation of existing conditions that are not included in the allocated allowance determinations. These conditions are reviewed quarterly by management and include general economic conditions, credit quality trends and internal loan review and regulatory examination findings. Foreclosed Assets Assets acquired through or instead of loan foreclosure are initially recorded in other assets at the lower of the loan balance or fair value less estimated selling costs when acquired, establishing a new cost basis. If fair value declines, a valuation allowance is recorded through expense. Costs related to the development and improvement of foreclosed assets are capitalized. Costs related to holding and maintaining the property are charged to expense. Premises and Equipment Premises and equipment are stated at cost less accumulated depreciation, which is computed primarily using the straight-line method over the estimated useful life of the owned asset and, for leasehold improvements, generally over the lesser of the remaining term of the lease facility or the estimated economic life of the improvement. The useful lives range from 3 to 10 years for equipment, furniture and fixtures and 10 to 40 years for buildings and improvements. Maintenance and repairs are charged to expense as incurred, while major improvements are capitalized and amortized to operating expense over the identified useful life. The adjusted cost of the specific assets sold or disposed of is used to compute gains or losses on disposal. These assets are reviewed for impairment when events indicate their carrying value may not be recoverable. If management determines an impairment exists, the asset is reduced with an offsetting charge to expense. Bank-Owned Life Insurance Sky Financial has purchased life insurance polices on certain key employees. These policies are recorded in other assets at their cash surrender value, or the amount that can be realized. Income from these policies and changes in the cash surrender value are recorded in other income. Resell and Repurchase Agreements Securities purchased under agreements to resell and securities sold under agreements to repurchase are generally treated as collateralized financing transactions and are recorded at the amounts at which the securities were acquired or sold plus accrued interest. |
38
| | | | |
The fair value of collateral either received from or provided to a third party is continually monitored and additional collateral is obtained or is requested to be returned to Sky Financial as deemed appropriate. Intangible Assets Core deposit intangible assets are amortized on an accelerated basis over their estimated useful lives, which average 10 to 12 years. Goodwill is not amortized, but rather reviewed for impairment on an annual basis or more frequently if impairment indicators exist. Customer relationship intangibles are recorded for Sky Financial’s acquisitions of insurance agencies. These customer relationship intangibles are generally amortized on an accelerated basis over their estimated useful life, which average 8 to 12 years. Merger, Integration and Restructuring Expense Merger, integration and restructuring expenses primarily represent professional fees, severance and other personnel related costs, lease terminations, valuation adjustments for certain premises, equipment and other assets and integration costs related to mergers, acquisitions and corporate restructuring. (See Note 16.) Income Taxes Sky Financial utilizes an asset and liability approach for financial accounting and reporting of income taxes. The provision for income taxes is the sum of taxes currently payable and the change in deferred tax assets and liabilities, net of amounts recorded through acquisitions and amounts recorded in accumulated other comprehensive income. Deferred income taxes are provided using the current tax rate for differences between the tax basis of assets and liabilities and their carrying amounts for financial reporting purposes. | | | | Stock Dividends and Treasury Stock Shares of Sky Financial stock may be acquired for reissuance in connection with stock option plans, for stock dividend declarations and for general corporate purposes. The treasury shares acquired are recorded at cost. The fair value of shares issued in stock dividends is transferred from retained earnings to common stock, to the extent of available retained earnings. Any excess of fair value over available retained earnings is considered a return of capital and thus is transferred from paid-in capital. Stock-Based Compensation During the fourth quarter of 2005, Sky Financial adopted FAS No. 123(R)Share-Based Payment. Sky adopted FAS 123(R) using the modified retrospective method for interim periods and restated the first three quarters of 2005 for stock option expense using the pro forma expense originally disclosed; 2004 and previous years have not been restated. The compensation cost for the stock option expense recognized in 2005 was calculated for all grants based on the grant date’s fair value, estimated in accordance with the original provisions of FAS No. 123 as these grants were all issued prior to the adoption of FAS 123 (R). Sky Financial adopted a restricted stock plan in 2004. In 2005, 133 shares were issued under this plan. Compensation expense for restricted share awards is recognized ratably over the period of service, usually the restricted period, based upon the fair value of the stock on the date of grant. The following table illustrates the total stock compensation expense recorded in salaries and employee benefits expense for each quarter of 2005: |
| | | | | | | | | | | | | | | |
| | | First | | Second | | Third | | Fourth | | Total |
Stock option expense | | $ | 1,156 | | $ | 1,060 | | $ | 1,042 | | $ | 849 | | $ | 4,107 |
Restricted stock expense | | | 92 | | | 409 | | | 314 | | | 315 | | | 1,130 |
Total expense | | $ | 1,248 | | $ | 1,469 | | $ | 1,356 | | $ | 1,164 | | $ | 5,237 |
Tax benefit | | $ | 437 | | $ | 514 | | $ | 474 | | $ | 408 | | $ | 1,833 |
| | | | |
Sky Financial has used the Black-Scholes option pricing model for all grant date estimations of fair value under FAS 123 and will continue to use this model as Sky Financial believes that its stock options have characteristics for which the Black-Scholes model provides an acceptable measure of fair value. For all of Sky Financial’s option plans, options are issued to employees and directors at-the-money. The expected term of an option represents the period of time that Sky Financial expects the options granted to be outstanding. Sky Financial bases this estimate on a number of factors including vesting period, historical data, expected volatility and blackout periods. The expected volatility used in the option pricing calculation is estimated considering both historical and implied volatility. Sky Financial believes that historical volatility alone is not a good predictor of the expected volatility. Given the absence of traded options in | | | | Sky Financial shares and the effects of significant merger activity on the historical volatility, the expected volatility assumption for Sky Financial options incorporates both the historical volatility and an estimated implied volatility. The expected dividend yield represents the expected dividend rate that will be paid out on the underlying shares during the expected term of the option, taking into account any expected dividend increases. Sky Financial’s options do not permit option holders to receive dividends and therefore the expected dividend yield was factored into the calculation. The risk-free rate is assumed to be a short-term treasury rate on the date of grant such as a U.S. Treasury zero-coupon issue with a term equal to the expected term of the option. The stock option expense was computed with the following weighted average assumptions as of the grant dates: |
| | | | | | | | | |
| | | 2005 | | | 2004 | | | 2003 | |
Risk-free interest rate | | 3.70 | % | | 3.20 | % | | 3.41 | % |
Expected option life (years) | | 6.00 | | | 7.00 | | | 7.00 | |
Expected stock price volatility | | 22 | % | | 23 | % | | 24 | % |
Dividend yield | | 3.17 | % | | 3.34 | % | | 3.50 | % |
| | | | |
| Prior to the adoption of FAS 123(R), forfeitures were recognized as they occurred. The cumulative effect of adopting FAS 123(R), which includes the impact of changing from the prior | | | | method of recognizing forfeitures as they occur to estimating forfeitures at the grant date, was not material. |
39
Notes to Consolidated Financial Statements
(Dollars and shares in thousands, except per share data)
Note 1Summary of Significant Accounting Policies (continued)
| | | | |
| In accordance with Sky Financial’s stock option and restricted shares plans, participants that are 55 or older are eligible to retire, which has the effect of immediately vesting all non-vested options and restricted shares. Prior to the adoption of FAS 123(R), Sky Financial recognized compensation cost over the contractual vesting period. As part of adopting FAS 123(R), for all future grants, Sky Financial will recognize compensation cost for individual participants that are retirement eligible at the date of grant. Participants that will become eligible for retirement prior to the contractual vesting period of the grant will have the recognition of their compensation costs accelerated. If Sky Financial had applied this policy to its 2005 stock option and restricted | | | | stock awards, the 2005 expense recognized would have been increased by $1,022 ($664 after tax). Prior to the adoption of FAS 123(R), employee compensation expense under stock option plans was reported under the intrinsic value method. No stock-based compensation cost was reflected in net income, as all options granted had an exercise price equal to or greater than the market price of the underlying common stock at grant date. The following table illustrates the effect on 2004 and 2003 net income and earnings per share if expense was measured using the fair value recognition provisions of FAS No. 123,Accounting for Stock Options. |
| | | | | | | | |
| | | 2004 | | | 2003 | |
Net income as reported | | $ | 194,355 | | | $ | 156,617 | |
Deduct: total stock-based compensation expense determined under fair-value-based method for all awards, net of tax benefit | | | (3,514 | ) | | | (2,403 | ) |
Pro forma net income | | $ | 190,841 | | | $ | 154,214 | |
| | | | | | | | | |
Basic earnings per share as reported | | $ | 1.95 | | | $ | 1.75 | |
Pro forma basic earnings per share | | | 1.92 | | | | 1.72 | |
Diluted earnings per share as reported | | | 1.93 | | | | 1.73 | |
Pro forma diluted earnings per share | | | 1.90 | | | | 1.71 | |
| | | | |
Statement of Cash Flows Sky Financial considers cash on hand, deposits maintained with the Federal Reserve Bank and cash due from other banks, all of which are included in the caption “cash and due from banks,” as cash for purposes of the Statement of Cash Flows. Sky Financial reports net cash flows for federal funds sold and purchased, interest-bearing deposits with other financial institutions, client loan transactions, deposit transactions, repurchase agreements and short-term borrowings. Comprehensive Income Comprehensive income consists of net income and other comprehensive income. Other comprehensive income (loss) includes unrealized gains and losses on securities available for sale, adjustments related to cash flow hedges and adjustments to minimum pension liabilities that are also recognized as separate components of equity. Non-bank Revenue Recognition Trust service revenues include fees for services such as asset management, record keeping, retirement services and estate management. Income is recognized on an accrual basis at the time the related services are performed. Brokerage and insurance revenues include commission and fees relating to the sales of policies and investments as well as fees for related insurance services. Commission income is recognized as of the effective date of the insurance policy with a reserve established for policy cancellations. Contingent performance-based commissions from insurance companies are recognized when earned and no contingencies remain. New Accounting Pronouncements In November 2005, the Financial Accounting Standards Board (FASB) issued FASB Staff Position (FSP) 115-1/124-1.The Meaning of Other-Than-Temporary Impairment and its Application to Certain Investments. This FSP provides additional guidance on when an investment in a debt or equity security should be considered impaired and when that impairment | | | | should be considered other-than-temporary and recognized as a loss in earnings. Specifically, the guidance clarifies that an investor should recognize an impairment loss no later than when the impairment is deemed other-than-temporary, even if a decision to sell has not been made. The FSP also requires certain disclosures about unrealized losses that have not been recognized as other-than-temporary impairments. Sky financial applied the guidance in this FSP in 2005 and there was no material affect to the results of operations or the statement of financial position In December 2003, the Accounting Standards Executive Committee of the American Institute of Certified Public Accountants issued AICPA Statement of Position No. 03-3, “Accounting for Certain Loans or Debt Securities Acquired in a Transfer” (SOP 03-3), to address accounting for differences between the contractual cash flows of certain loans and debt securities and the cash flows expected to be collected when loans or debt securities are acquired in a transfer and those cash flow differences are attributable, at least in part, to credit quality. As such, SOP 03-3 applies to such loans and debt securities purchased or acquired in purchase business combinations and does not apply to originated loans. The application of SOP 03-3 limits the interest income, including accretion of purchase price discounts that may be recognized for certain loans and debt securities. Additionally, SOP 03-3 requires that the excess of contractual cash flows over cash flows expected to be collected (nonaccretable difference) not be recognized as an adjustment of yield or valuation allowance, such as the allowance for loan losses. Subsequent to the initial investment, increases in expected cash flows generally should be recognized prospectively through adjustment of the yield on the loan or debt security over its remaining life. Decreases in expected cash flows should be recognized as impairment. Sky Financial adopted SOP 03-3 on January 1, 2005. This SOP had no material affect to either of Sky Financial’s two banking acquisitions during 2005. |
40
Note 2Mergers, Acquisitions, Business Formations and Divestitures
| | | | |
Community Banking Acquisitions On February 3, 2006, Sky Financial announced the execution of a definitive agreement to acquire Union Federal Bank of Indianapolis and its parent company, Waterfield Mortgage Company, Incorporated, Ft. Wayne, Indiana. Sky Financial’s transaction is for the acquisition of Waterfield’s retail and commercial banking business conducted primarily through Union Federal Bank, which had approximately $2.7 billion in assets at the date of the agreement. Under the terms of the agreement, shareholders of Waterfield will be entitled to receive $80.07 in cash plus 4.38 shares of Sky Financial common stock for each Waterfield share, and Sky Financial will issue 7.5 million shares and pay $136.5 million in cash to complete the transaction. The transaction is valued at $330 million, based upon Sky Financial’s closing stock price as of February 2, 2006 and is expected to close in the third quarter of 2006. The exchange is expected to qualify as a tax-free transaction to the Waterfield shareholders. Following the merger, and upon receipt of all necessary regulatory approvals, Union Federal Bank will be merged with and into Sky Bank. On November 29, 2005, Sky Financial completed its acquisition of Falls Bank, an $80 million bank that operates two full-service branches in the Akron, Ohio market. The aggregate purchase price was approximately $12,271, including direct acquisition costs of $33. The acquisition of Falls Bank expands Sky Financial’s community banking business further into the Akron market. Falls Bank shareholders received 350 shares of Sky Financial common stock and cash of $2,348. The total purchase price for Falls Bank has been allocated to the tangible and identifiable intangible assets and liabilities based upon their respective fair values. Such allocations have not been finalized and as such, the allocation of the purchase consideration included in the accompanying Consolidated Balance Sheet at December 31, 2005, is preliminary. On June 1, 2005, Sky Financial completed its acquisition of Belmont Bancorp (Belmont), a $297 million bank holding company headquartered in St. Clairsville, Ohio, and its wholly-owned subsidiary, Belmont National Bank. The aggregate purchase price was approximately $68,450, including direct acquisition costs of $56. Belmont has offices located in Belmont, Harrison and Tuscarawas counties in Ohio, and Ohio County in West Virginia and expands Sky Financial’s community banking business further into these markets. Belmont Bancorp shareholders received approximately 1,765 shares of Sky Financial common stock and cash of $18,705. The total purchase price for Belmont has been allocated to the tangible and identifiable intangible assets and liabilities based upon their respective fair | | | | values. Such allocations have not been finalized and as such, the allocation of the purchase consideration included in the accompanying Consolidated Balance Sheet at December 31, 2005, is preliminary. On November 30, 2004, Sky Financial acquired Prospect Bancshares, Inc. (Prospect), a $202 million bank holding company headquartered in Worthington, Ohio, and its wholly-owned subsidiary Prospect Bank by acquiring all of the outstanding capital stock of Prospect Bancshares for an aggregate purchase price of $46,754, including direct acquisition costs of $77. Prospect Bancshares shareholders received approximately 1,139 shares of Sky Financial common stock and cash of $17,600. On July 1, 2004, Sky Financial acquired Second Bancorp Incorporated (Second Bancorp), a $2.0 billion bank holding company headquartered in Warren, Ohio, and its wholly-owned subsidiary Second National Bank of Warren by acquiring all of the outstanding capital stock of Second Bancorp for an aggregate purchase price of $312,738, including direct acquisition costs of $2,093. Second Bancorp shareholders received approximately 11,953 shares of Sky Financial common stock. On October 19, 2003, Sky Financial acquired GLB Bancorp, Inc. (GLB), a $225 million bank holding company headquartered in Mentor, Ohio, and its wholly-owned subsidiary Great Lakes Bank, by acquiring all of the outstanding capital stock of GLB for an aggregate purchase price of $43,263, including direct acquisition costs of $191. GLB shareholders received 1,717 shares of Sky Financial common stock. On April 30, 2003, Sky Financial acquired the outstanding capital stock of Metropolitan Financial Corp (Metropolitan), a $1.5 billion savings and loan holding company headquartered in Highland Hills, Ohio, and its wholly-owned subsidiary, Metropolitan Bank and Trust Company, for a purchase price of $81,294, including direct acquisition costs of $673. Metropolitan shareholders received 2,887 shares of Sky Financial common stock and $25,327 in cash. The acquisitions complement Sky Financial’s operations in its regional banking structure by enhancing its presence in these areas. The value of the common stock issued for each of the acquisitions was determined based on the market price of Sky Financial’s common stock on the date that the final terms of the acquisitions were agreed to and announced. The results of operations for the acquired institutions have been included in the consolidated financial statements since the date of acquisition. The following table presents the allocation of the purchase price, including direct acquisition costs, for the Falls Bank, Belmont, Prospect and Second acquisitions to assets acquired and liabilities assumed, based on their fair values: |
| | | | | | | | | | | | |
| | | | Falls | | | Belmont | | | Prospect | | | Second |
Cash and interest-earning deposits | | $ | 1,764 | | $ | 13,540 | | $ | 3,985 | | $ | 44,683 |
Loans | | | 65,381 | | | 161,955 | | | 196,533 | | | 1,293,733 |
Securities available for sale | | | 4,233 | | | 92,640 | | | 1,105 | | | 519,029 |
Premises and equipment | | | 3,394 | | | 8,784 | | | 4,134 | | | 18,955 |
Core deposit intangible assets | | | 778 | | | 7,155 | | | 2,140 | | | 31,449 |
Goodwill | | | 6,252 | | | 33,608 | | | 31,082 | | | 245,120 |
Other assets | | | 4,441 | | | 19,418 | | | 4,032 | | | 98,440 |
Total assets acquired | | | 86,243 | | | 337,100 | | | 243,011 | | | 2,251,409 |
Deposits | | | 53,496 | | | 229,135 | | | 169,986 | | | 1,251,801 |
Debt | | | 17,551 | | | 34,961 | | | 15,790 | | | 646,315 |
Other liabilities | | | 2,925 | | | 4,554 | | | 10,558 | | | 40,555 |
Total liabilities acquired | | | 73,972 | | | 268,650 | | | 196,334 | | | 1,938,671 |
Net assets acquired | | $ | 12,271 | | $ | 68,450 | | $ | 46,677 | | $ | 312,738 |
41
Notes to Consolidated Financial Statements
(Dollars and shares in thousands, except per share data)
Note 2Mergers, Acquisitions, Business Formations and Divestitures (continued)
The following (unaudited) pro forma consolidated results of operations have been prepared as if the acquisitions of Falls Bank and Belmont occurred as of the beginning of each period presented, with Second and Prospect being presented as of January 1, 2004:
| | | | | | |
December 31, | | | 2005 | | | 2004 |
Net interest income | | $ | 519,993 | | $ | 493,577 |
Income from continuing operations | | | 182,025 | | | 158,745 |
Income from continuing operations per share - Basic | | | 1.69 | | | 1.46 |
Income from continuing operations per share - Diluted | | | 1.67 | | | 1.45 |
Net income | | | 182,397 | | | 177,900 |
Net income per share – Basic | | | 1.69 | | | 1.64 |
Net income per share – Diluted | | | 1.67 | | | 1.62 |
| | | | |
The pro forma results for Belmont include approximately $800 of merger costs recorded in the second quarter of 2005. The pro forma information for 2004 includes impairment charges related to Second’s marine portfolio of $19.1 million ($12.4 million after tax) as well as merger costs of approximately $16 million ($10.4 million after tax) recorded in the second quarter of 2004. Sky Financial recorded merger, integration and restructuring charges totaling $1,151, $2,952 and $2,975 after tax during 2005, 2004 and 2003, respectively, related to the acquisitions noted above and the pending acquisition of Union Federal. See Note 16 for additional discussion. The pro forma information presented is for informational purposes only and is not indicative of the results of operations that actually would have been achieved had the acquisitions been consummated as of that time, nor is it intended to be a projection. Financial Service Affiliate Acquisitions On October 4, 2005, Sky Financial acquired Becker-McDowell Agency, Inc. and Steiner Insurance Agency, Inc., both located in Wooster, Ohio. Becker-McDowell was acquired for 222 shares of Sky Financial common stock and $580 in cash. Steiner | | | | Insurance Agency was acquired for 111 shares of Sky Financial common stock and $288 in cash. On August 1, 2005, Sky acquired B.K.M.’s Benefit Design Agency of Ohio, Inc., located in Findlay, Ohio for 137 shares of Sky Financial common stock and $661 in cash. On July 1, 2004, Sky Financial acquired Stouffer-Herzog Insurance Agency in conjunction with the purchase of Second Bancorp, as previously discussed. On April 1, 2004, Sky Financial acquired EOB, Inc., a group benefit insurance agency headquartered in Canton, Ohio, for 177 shares of Sky Financial common stock and $516 in cash. On January 5, 2004, Sky Financial acquired Spencer-Patterson Insurance Agency, a full-service professional liability, personal and commercial agency headquartered in Findlay, Ohio, for 297 shares of Sky Financial common stock and $793 in cash. On July 8, 2003, Sky Financial acquired Insurance Buyers Service Agency, Inc., a professional liability, personal and commercial insurance agency headquartered in Boardman, Ohio, for 164 shares of Sky Financial common stock. Disclosure of pro forma results of the acquisitions of the financial services affiliates is immaterial to Sky Financial’s consolidated financial statements. |
| | | | | | | | | | | | |
Entity | | Location | | Date | | | Total Assets | | | Cash Paid | | Shares Issued |
Becker-McDowell Agency, Inc. | | Wooster, OH | | October 4, 2005 | | $ | 0.4 million | | $ | 0.58 million | | 0.2 million |
Steiner Insurance Agency, Inc. | | Wooster, OH | | October 4, 2005 | | | 0.5 million | | | 0.29 million | | 0.1 million |
Falls Bank | | Stow, OH | | November 29, 2005 | | | 80.3 million | | | 2.3 million | | 0.4 million |
Benefit Design Agency, Inc. | | Findlay, OH | | August 1, 2005 | | | - | | | 0.66 million | | 0.1 million |
Belmont Bancorp | | St. Clairsville, OH | | June 1, 2005 | | | 0.3 billion | | | 18.7 million | | 1.7 million |
Prospect Bancshares, Inc. | | Worthington, OH | | November 30, 2004 | | | 0.2 billion | | | 17.6 million | | 1.1 million |
Second Bancorp Incorporated | | Warren, OH | | July 1, 2004 | | | 2.0 billion | | | - | | 12.0 million |
EOB, Inc. | | Canton, OH | | April 1, 2004 | | | 0.2 million | | | 0.52 million | | 0.2 million |
Spencer Patterson Insurance Agency | | Findlay, OH | | January 5, 2004 | | | 0.3 million | | | 0.79 million | | 0.3 million |
Great Lakes Bancorp | | Mentor, OH | | October 19, 2003 | | | 0.2 billion | | | - | | 1.7 million |
Insurance Buyers Service Agency, Inc. | | Boardman, OH | | July 8, 2003 | | | 4.0 million | | | - | | 0.2 million |
Metropolitan Financial Corp | | Highland Hills, OH | | April 30, 2003 | | | 1.5 billion | | | 25.3 million | | 2.9 million |
| | | | |
Business Divestitures On March 31, 2004, Sky Financial completed the sale of Sky Financial Solutions, its dental financing affiliate. The sale resulted in a $31.2 million pre-tax gain. See Note 26. | | | | |
42
Note 3 Securities
The estimated fair values and unrealized gains and losses of securities at year-end are as follows:
| | | | | | | | | | |
| | | Estimated Fair Value | | Gross
Unrealized Gains | | Gross
Unrealized Losses | |
2005 | | | | | | | | | | |
U.S. Treasury | | $ | 301 | | $ | 2 | | $ | – | |
U.S. government agencies and corporations | | | 191,273 | | | 13 | | | (4,077 | ) |
Obligations of states and political subdivisions | | | 7,690 | | | 83 | | | (2 | ) |
Corporate and other securities | | | 24,111 | | | 584 | | | (35 | ) |
Mortgage-backed securities | | | 2,698,074 | | | 766 | | | (66,007 | ) |
Total debt securities available for sale | | | 2,921,449 | | | 1,448 | | | (70,121 | ) |
Marketable equity securities available for sale | | | 31,459 | | | 748 | | | (1,128 | ) |
FHLB, FRB & Bankers’ Bank stock(1) | | | 144,564 | | | – | | | – | |
Total securities | | $ | 3,097,472 | | $ | 2,196 | | $ | (71,249 | ) |
2004 | | | | | | | | | | |
U.S. Treasury | | $ | 207 | | $ | 7 | | $ | – | |
U.S. government agencies and corporations | | | 152,266 | | | 565 | | | (1,068 | ) |
Obligations of states and political subdivisions | | | 16,561 | | | 128 | | | (12 | ) |
Corporate and other securities | | | 51,699 | | | 1,776 | | | (205 | ) |
Mortgage-backed securities | | | 2,706,552 | | | 10,331 | | | (23,200 | ) |
Total debt securities available for sale | | | 2,927,285 | | | 12,807 | | | (24,485 | ) |
Marketable equity securities available for sale | | | 29,865 | | | 1,420 | | | (78 | ) |
FHLB, FRB & Bankers’ Bank stock | | | 134,663 | | | – | | | – | |
Total securities | | $ | 3,091,813 | | $ | 14,227 | | $ | (24,563 | ) |
| (1) | Certain securities such as FHLB, FRB, and Bankers’ Bank stock are carried at amortized cost. |
| | |
| Sky Financial evaluates its securities portfolio for other than temporary impairment throughout the year. Each investment, which has an indicative market value less than the book value is reviewed on a monthly basis by management. Management considers at a minimum the following factors that, both individually or in combination, could indicate that the decline is other-than-temporary: 1) the length of time and extent to which the market value has been less than book value; 2) the financial condition and near-term prospects of the issuer; or 3) the intent and ability of Sky Financial to retain the investment in the issuer for a period of time sufficient to allow for any anticipated recovery in market | | value. Among the factors that are considered in determining intent and ability is a review of capital adequacy, interest rate risk profile and liquidity at Sky Financial. An impairment is recorded against individual securities if the review described above concludes that the decline in value is other than temporary. The securities portfolio as of December 31, 2005 contains no other-than-temporary impaired investments. The fair values of investments with an amortized cost in excess of their fair value at December 31, 2005 and 2004 are as follows: |
| | | | | | | | | | | | | | | | | | | | | |
| | | Less than 1 year | | | More than 1 year | | | Total | |
| | |
| Aggregate Fair
Value | |
| Gross
Unrealized
Losses |
| |
| Aggregate Fair
Value | |
| Gross
Unrealized
Losses |
| |
| Aggregate Fair
Value | |
| Gross
Unrealized
Losses |
|
December 31, 2005 | | | | | | | | | | | | | | | | | | | | | |
U.S. Treasury | | $ | 198 | | $ | – | | | $ | – | | $ | – | | | $ | 198 | | $ | – | |
U.S. government agencies and corporations | | | 62,965 | | | (831 | ) | | | 108,375 | | | (3,246 | ) | | | 171,340 | | | (4,077 | ) |
Obligations of states and political subdivisions | | | 478 | | | (2 | ) | | | – | | | – | | | | 478 | | | (2 | ) |
Corporate and other securities | | | – | | | – | | | | 5,500 | | | (35 | ) | | | 5,500 | | | (35 | ) |
Mortgage-backed securities | | | 1,292,396 | | | (19,633 | ) | | | 1,205,736 | | | (46,374 | ) | | | 2,498,132 | | | (66,007 | ) |
Total debt securities available for sale | | | 1,356,037 | | | (20,466 | ) | | | 1,319,611 | | | (49,655 | ) | | | 2,675,648 | | | (70,121 | ) |
Marketable equity securities available for sale | | | 7,451 | | | (1,128 | ) | | | – | | | – | | | | 7,451 | | | (1,128 | ) |
Total securities | | $ | 1,363,488 | | $ | (21,594 | ) | | $ | 1,319,611 | | $ | (49,655 | ) | | $ | 2,683,099 | | $ | (71,249 | ) |
December 31, 2004 | | | | | | | | | | | | | | | | | | | | | |
U.S. Treasury | | $ | 100 | | $ | – | | | $ | – | | $ | – | | | $ | 100 | | $ | – | |
U.S. government agencies and corporations | | | 111,866 | | | (1,068 | ) | | | – | | | – | | | | 111,866 | | | (1,068 | ) |
Obligations of states and political subdivisions | | | –– | | | – | | | | 1,224 | | | (12 | ) | | | 1,224 | | | (12 | ) |
Corporate and other securities | | | 7,433 | | | (205 | ) | | | – | | | – | | | | 7,433 | | | (205 | ) |
Mortgage-backed securities | | | 1,303,719 | | | (14,687 | ) | | | 320,305 | | | (8,513 | ) | | | 1,624,024 | | | (23,200 | ) |
Total debt securities available for sale | | | 1,423,118 | | | (15,960 | ) | | | 321,529 | | | (8,525 | ) | | | 1,744,647 | | | (24,485 | ) |
Marketable equity securities available for sale | | | 7,378 | | | (70 | ) | | | 492 | | | (8 | ) | | | 7,870 | | | (78 | ) |
Total securities | | $ | 1,430,496 | | $ | (16,030 | ) | | $ | 322,021 | | $ | (8,533 | ) | | $ | 1,752,517 | | $ | (24,563 | ) |
43
Notes to Consolidated Financial Statements
(Dollars and shares in thousands, except per share data)
Note 3Securities (continued)
The estimated fair value of debt securities at December 31, 2005, by contractual maturity, are shown in the accompanying table. Expected maturities will likely differ from contractual maturities because some issuers have the right to call or prepay obligations with or without call or prepayment penalties.
| | |
| | | Estimated Fair Value |
Due in one year or less | | $ 35,581 |
Due after one year through five years | | 358,697 |
Due after five years through ten years | | 480,974 |
Due after ten years through fifteen years | | 924,826 |
Due after fifteen years through twenty years | | 326,666 |
Due after twenty years | | 794,705 |
Total debt securities available for sale | | $2,921,449 |
The gross realized gains and losses from the sales of securities are as follows:
| | | | | | | | | |
| | | 2005 | | 2004 | | 2003 |
Gross realized gains on sales | | $ | 5,002 | | $ | 16,866 | | $ | 4,746 |
Gross realized losses on sales | | | 1,340 | | | 2,297 | | | 3,875 |
Securities pledged to secure public deposits and repurchase agreements totaled $2,080,838 and $2,067,482 at December 31, 2005 and 2004, respectively
Note 4Loans and Allowance for Credit Losses
The loan portfolio at year-end was as follows:
| | | | | | |
| | | 2005 | | 2004 |
Real estate loans: | | | | | | |
Construction | | $ | 1,012,745 | | $ | 848,072 |
Residential mortgage | | | 2,916,248 | | | 2,898,875 |
Non-residential mortgage | | | 3,488,684 | | | 3,498,746 |
Commercial, financial and agricultural | | | 3,024,337 | | | 2,562,738 |
Installment and credit card loans | | | 707,208 | | | 807,687 |
Total loans | | $ | 11,149,222 | | $ | 10,616,118 |
Most of Sky Financial’s business activity is conducted through Sky Bank with clients in the respective local areas of the bank. These areas encompass parts of eastern Ohio, western Ohio, eastern Indiana, southeastern Michigan, western Pennsylvania and northern West Virginia. Sky Bank’s loan portfolio is diversified, consisting of commercial, residential, agribusiness, consumer and small business loans. In Sky Bank’s loan portfolio, no significant industry concentrations exist and amounts related to highly-leveraged transactions are not significant. Total loans include overdrafts of $5,596 and $6,743 at December 31, 2005 and 2004, respectively.
Sky Financial evaluates each client’s creditworthiness on a case-by-case basis. The amount of collateral obtained is based on management’s evaluation of the client. Collateral held relating to commercial, financial, agricultural and commercial mortgages varies, but may include accounts receivable, inventory, property, plant and equipment, and income-producing commercial properties. Loans on which the accrual of interest has been discontinued totaled $119,030 and $143,207 at December 31, 2005 and 2004, respectively.
In conjunction with the Belmont acquisition on June 1, 2005, Sky Financial acquired loans approximating $165,018. Belmont’s allowance for credit losses at the acquisition date of June 1, 2005 was approximately $2,694. Sky Financial determined that certain loans acquired in the Belmont acquisition had evidence of deterioration of credit quality and it was probable that all contractual required payments would not be collected on these loans. Sky Financial determined that eleven loans with a book value totaling approximately $1,960 and with a fair value of $1,627 were within the guidelines set forth under SOP 03-3. These loans have been recorded by Sky Financial at their fair value and the allowance for credit losses was reduced by $333. Accordingly, Sky Financial recorded $2,361 of allowance for credit losses on loans not subject to SOP 03-3 for the Belmont acquisition.
In conjunction with the Falls Bank acquisition on November 29, 2005, Sky Financial acquired loans approximating $65,381 and determined that the entire $526 of allowance for credit losses was not subject to SOP 03-3.
In the normal course of business, Sky Financial has made loans to certain directors, executive officers and their affiliates. Loan activity relating to these individuals for 2005 is as follows:
| | | | |
Aggregate balance - December 31, 2004 | | $ | 22,897 | |
New loans | | | 68,673 | |
Repayments | | | (47,437 | ) |
Other changes | | | (2,410 | ) |
Aggregate balance - December 31, 2005 | | $ | 41,723 | |
Activity in the allowance for credit losses was as follows:
| | | | | | | | | | | | |
| | | 2005 | | | 2004 | | | 2003 | |
Balance at beginning of year | | $ | 151,389 | | | $ | 124,943 | | | $ | 106,675 | |
Provision for credit losses | | | 52,249 | | | | 37,660 | | | | 34,125 | |
Loans charged-off | | | (71,126 | ) | | | (43,635 | ) | | | (41,563 | ) |
Recoveries | | | 9,341 | | | | 8,698 | | | | 8,647 | |
Allowance for acquired institutions/sold portfolio | | | 2,887 | | | | 23,723 | | | | 17,059 | |
Transfer to allowance for unfunded commitments and letters of credit | | | (279 | ) | | | – | | | | – | |
Balance at end of year | | $ | 144,461 | | | $ | 151,389 | | | $ | 124,943 | |
44
Note 4Loans and Allowance for Credit Losses (continued)
Information regarding impaired loans is as follows:
| | | | | | |
| For The Years Ended December 31, | | 2005 | | 2004 |
Year-end impaired loans with no allowance for credit losses allocated | | $ | 24,303 | | $ | – |
Year-end impaired loans with allowance for credit losses allocated | | | 51,652 | | | 80,757 |
Year-end allowance for credit losses allocated to impaired loans | | | 9,044 | | | 19,994 |
Average investment in impaired loans during the year | | | 84,168 | | | 84,076 |
Cash-basis interest income recognized during the year | | | 1,459 | | | 1,189 |
| | | | | | | |
Note 5Premises and Equipment
Premises and equipment as of year end are summarized as follows:
| | | | | | | | |
| | | | 2005 | | | | 2004 | |
Land, buildings and improvements | | $ | 186,154 | | | $ | 171,145 | |
Equipment, furniture and fixtures | | | 163,840 | | | | 157,896 | |
Construction in process | | | 3,662 | | | | 5,112 | |
Total premises and equipment | | | 353,656 | | | | 334,153 | |
Less accumulated depreciation and amortization | | | (186,859 | ) | | | (178,687 | ) |
Premises and equipment, net | | $ | 166,797 | | | $ | 155,466 | |
| | |
Included in premises and equipment are buildings, land and land improvements that secure capitalized leases with a cost of $3,368 and $3,690, less accumulated amortization and depreciation of $3,194 and $3,380 at December 31, 2005 and 2004, respectively. Depreciation expense was $20,647 in 2005, $20,967 in 2004 and $19,575 in 2003. Rental payments for land | | and buildings are accounted for as operating lease expense. Total rent expense amounted to $15,347 in 2005, $11,217 in 2004 and $7,628 in 2003. Minimum future rentals under operating leases are as follows: 2006, $10,003; 2007, $8,539; 2008, $6,461; 2009, $5,551; 2010, $4,993; 2011 and thereafter, $17,494 |
| | | |
Note 6Goodwill and Intangible Assets
Net goodwill activity by segment was as follows:
| | | | | | |
| | | Community Banking | | Financial Services Affiliates | | Total |
Balance at December 31, 2002 | | $ 79,119 | | $29,657 | | $108,776 |
Net change | | 73,163 | | 3,920 | | 77,083 |
Balance at December 31, 2003 | | $152,282 | | $33,577 | | $185,859 |
| Net change | | 276,220 | | 13,179 | | 289,399 |
Balance at December 31, 2004 | | $428,502 | | $46,756 | | $475,258 |
Net change | | 33,069 | | 13,535 | | 46,604 |
Balance at December 31, 2005 | | $461,571 | | $60,291 | | $521,862 |
| | |
Goodwill is reviewed annually for impairment or more frequently if impairment indicators exist. Sky Financial completed this review during the second quarter of 2005 and determined that goodwill was not impaired. Other intangible assets at December 31, 2005 and 2004 were $67,077 and $71,674, respectively, net of accumulated amortization of $15,885 and $11,053, respectively. These assets consist primarily of core deposits intangibles and customer relationship intangibles. The core deposit intangibles at December 31, 2005 and 2004 were $63,335 and $70,958, respectively, and net of accumulated amortization of $15,583 and $10,981, respectively. The customer relationship intangibles at December 31, 2005 and 2004 were $3,742 and $716, respectively, and net of accumulated amortization of $302 and $72, respectively. | | During 2005, Sky Financial recorded additional intangible assets of $11,669 related to core deposit intangibles and customer relationships. This total amount will be amortized over a weighted average period of approximately eleven years. Of this total, $7,927 related to core deposit intangibles that will be amortized over a weighted average period of approximately twelve years. Also included in this total is $3,026 of customer relationship intangibles that will be amortized over a weighted-average period of approximately eight years. Amortization expense related to the intangible assets was $14,887, $10,979 and $6,896 during 2005, 2004 and 2003, respectively. For the years ending 2006 through 2010, the estimated future amortization expense will be approximately $14,601, $13,450, $12,299, $10,000 and $8,390, respectively. |
45
Notes to Consolidated Financial Statements
(Dollars and shares in thousands, except per share data)
Note 7Interest-Bearing Deposits
Total interest-bearing deposits as presented on the balance sheet are comprised of the following classifications at year-end:
| | | | | | |
| | | 2005 | | 2004 |
Interest-bearing demand | | $ | 333,491 | | $ | 325,751 |
Savings, including MMDA | | | 3,416,583 | | | 3,874,943 |
Time | | | | | | |
In denominations under
$100,000 | | | 3,684,290 | | | 2,978,429 |
In denominations of
$100,000 or more | | | 1,587,199 | | | 1,579,958 |
Total interest-bearing deposits | | $ | 9,021,563 | | $ | 8,759,081 |
At December 31, 2005, the scheduled maturities of time deposits are as follows:
| | | |
2006 | | $ | 3,632,330 |
2007 | | | 1,119,135 |
2008 | | | 243,645 |
2009 | | | 160,428 |
2010 | | | 72,856 |
Thereafter | | | 43,095 |
| | | $ | 5,271,489 |
Note 8Securities Sold Under Repurchase Agreements and Federal Funds Purchased
| | |
| Sky Financial has retail repurchase agreements with clients within its local market areas, as well as federal funds purchased from other banks. These borrowings are collateralized with securities owned by Sky Bank and held in its safekeeping accounts at independent correspondent banks. | | Sky Financial also has repurchase agreements with brokerage firms that are in possession of the underlying securities. The securities are returned to Sky Financial at the maturity of the agreements. The following table summarizes certain information relative to these borrowings: |
| | | | | | | | |
| | | 2005 | | | 2004 | |
Outstanding at year-end | | $ | 1,053,244 | | | $ | 1,041,361 | |
Weighted average interest rate at year-end | | | 3.96 | % | | | 2.55 | % |
Maximum amount outstanding as of any month-end | | $ | 1,053,244 | | | $ | 1,041,361 | |
Average amount outstanding | | | 857,472 | | | | 897,438 | |
Approximate weighted average interest rate during the year | | | 3.09 | % | | | 2.08 | % |
Included in the above as of December 31, 2005, are repurchase agreements in excess of one year as summarized below:
| | | | | | | |
| | | | | Weighted Average Life in Years
Based on Stated Maturity | | Weighted Average
Life in Years
Based on Call Dates |
Stated maturity in 2007 | | $ | 142,806 | | 1.5 | | 1.0 |
Stated maturity in 2008 | | | 139,000 | | 2.5 | | 2.5 |
Stated maturity in 2009 | | | 30,000 | | 5.1 | | 5.1 |
Total repurchase agreements in excess of one year | | $ | 311,806 | | 2.3 | | 2.1 |
| | |
The weighted average rate on repurchase agreements in excess of one year was 5.57% at December 31, 2005 and 4.52% at December 31, 2004. | | At December 31, 2004, repurchase agreements in excess of one year were $258,717 with a weighted average life based on stated maturity of 3.3 years and a weighted average life based on call dates of 3 years. |
Note 9Debt and Federal Home Loan Bank Advances
Sky Financial’s debt and Federal Home Loan Bank (“FHLB”) advances are comprised of the following at December 31:
| | | | | | |
| | | 2005 | | 2004 |
Borrowings under FHLB line of credit at weighted interest rate of 4.38% for 2005 | | $ | 1,775,583 | | $ | 1,569,556 |
Subordinated note at 7.08%, due January 2008 | | | 50,000 | | | 50,000 |
Subordinated note at 6.125%, due October 2012 | | | 65,000 | | | 65,000 |
Subordinated note at 5.35%, due April 2013 | | | 50,000 | | | 50,000 |
Junior subordinated debentures owed to unconsolidated subsidiary trusts | | | 184,799 | | | 189,558 |
Capital lease obligation | | | 302 | | | 726 |
Other items | | | 104 | | | – |
Total | | $ | 2,125,788 | | $ | 1,924,840 |
46
Note 9Debt and Federal Home Loan Bank Advances (continued)
| | |
Lines of Credit Sky Financial maintains a credit facility with a group of financial institutions in the form of a short-term line of credit. This line of credit is subject to renewal on an annual basis. The commitment on the line was $100,000 in 2005 and 2004. Interest on advances taken on the facility is accrued at either a formula based on the London Interbank Offering Rate (LIBOR), or a formula based on the federal funds rate. Sky Financial may elect the interest rate method to be applied to amounts outstanding. The agreement provides for a quarterly fee of .150% on the commitment amount of the credit facility. The agreement contains covenants that require Sky Financial, among other things, to maintain an acceptable level of capital and asset quality as defined by the agreement. The average amount outstanding in 2005 was $578 with an average cost of 3.56%, compared to $14,158, with an average cost of 1.80% in 2004. FHLB Advances FHLB advances are collateralized by all shares of FHLB stock owned by the subsidiary bank and by 100% of the subsidiary bank’s qualified residential mortgage loans. The subsidiary bank may increase its borrowing capacity by pledging securities. Based on the carrying amount of FHLB stock owned by the subsidiary bank, total FHLB advances are limited to approximately $1,913,376, subject to the availability of qualified residential mortgage loans for pledging. Subordinated Notes During March 2003, Sky Financial sold $50,000 in subordinated note arrangements in a private transaction pursuant to an applicable exemption from registration under the Securities Act of 1933. Sky Financial used these proceeds to pay Metropolitan’s shareholders who elected to receive cash as merger consideration in exchange for their common shares (see Note 2). The remaining proceeds were used to pay down $13,960 of Metropolitan subordinated debt and other working capital purposes. Junior Subordinated Debentures Owed to Unconsolidated Subsidiary Trusts Beginning in 1997, Sky Financial has issued obligated mandatorily redeemable capital securities through fully-consolidated subsidiaries. The trust preferred entities were formed for the purpose | | of issuing capital securities to third parties and investing the proceeds from the sale of such securities solely in junior subordinated debentures of Sky Financial. The debentures held by each trust are the sole assets of that trust. Distributions on the capital securities issued by each trust are payable semi-annually or quarterly at a rate per annum equal to the interest rate being earned by the trust on the debentures held by that trust. The amounts of these capital securities represent the par value adjusted for any unamortized discount or other basis adjustments related to hedging the debt with derivative instruments. See Notes 1 and 10 for further discussion on derivative instruments. The borrowings are redeemable after a certain date at their stated face values or at a premium if redemption occurs before that date. On September 25, 2003, Sky Financial issued $10,000 in obligated mandatorily redeemable capital securities of subsidiary trusts. On October 14, 2003, Sky Financial received an additional $20,000 under the same issuance. The interest rate on the issuance is based on LIBOR plus 2.95%. The debt is redeemable beginning in October 2003 at 104.40% of its principal amount, with the redemption price decreasing every year thereafter until 2008, at which time it is redeemable at par. During October 2003, the proceeds of this issuance were used to call and settle $27,750 of obligated redeemable capital securities and related interest. During the fourth quarter of 2003, Sky Financial deconsolidat-ed the accounts of these trust-preferred entities in accordance with FASB Interpretation No. 46 (revised 2003). Under the Federal Reserve Board’s regulatory framework, the capital securities held by the unconsolidated trust preferred entities of Sky Financial are currently included as “Tier I” regulatory capital. The Federal Reserve Board issued their final regulations on March 30, 2005 after evaluating whether these capital securities will continue as Tier I capital as a result of their deconsolidation. The Federal Reserve Board has determined that these securities will continue to qualify as Tier I capital with specific limitations. The management of Sky Financial has evaluated these limitations and does not believe they will have a material effect on Sky Financial or Sky Bank’s Tier I capital. The following table summarizes the issuance date, par value, interest rate, redemption price, redemption date and hedged average rate for the junior subordinated debentures at December 31, 2005: |
| | | | | | | | | | | | | | | | |
| Unconsolidated Subsidiary Trusts | | Issuance Date | | Par Value | | Interest
Rate | | | Redemption
Price | | | Redemption Date | | Hedged
Average
Rate | |
Sky Financial Capital Trust II | | September 25, 2003 | | $ | 30,000 | | Variable | | | 100.00 | % | | October 8, 2008 | | N/A | |
Prospect Trust I | | March 27, 2003 | | | 6,000 | | Variable | | | 100.00 | | | April 7, 2008 | | N/A | |
Second Bancorp Capital Trust I | | September 28, 2001 | | | 32,000 | | 9.00 | % | | 100.00 | | | December 31, 2006 | | N/A | |
Sky Financial Capital Trust I | | March 31, 2000 | | | 60,000 | | 9.34 | | | 104.67 | | | May 1, 2010 | | 7.34 | % |
Mid Am Capital Trust | | June 30, 1997 | | | 23,600 | | 10.20 | | | 105.10 | | | June 1, 2007 | | 8.66 | |
First Western Capital Trust | | February 11, 1997 | | | 25,000 | | 9.88 | | | 104.94 | | | February 1, 2007 | | 7.51 | |
47
Notes to Consolidated Financial Statements
(Dollars and shares in thousands, except per share data)
Note 9Debt and Federal Home Loan Bank Advances (continued)
Debt obligations related to the unconsolidated subsidiary trusts follows:
| | | | | | |
| | | 2005 | | 2004 |
Interest at 9.88%, due February 2027 | | $ | 26,393 | | $ | 27,616 |
Interest at 10.20%, due June 2027 | | | 24,245 | | | 24,983 |
Interest at 9.34%, due May 2030 | | | 63,502 | | | 65,872 |
Interest at 9.00%, due December 2031 | | | 33,374 | | | 33,729 |
Interest at 7.40% (variable), due April 2033 | | | 6,357 | | | 6,430 |
Interest at 5.02% (variable), due October 2033 | | | 30,928 | | | 30,928 |
Total junior subordinated debentures owed to unconsolidated subsidiary trusts | | $ | 184,799 | | $ | 189,558 |
Other
At December 31, 2005, required annual principal payments on debt and FHLB advances are presented in the following table:
| | | |
2006 | | $ | 903,017 |
2007 | | | 330,242 |
2008 | | | 141,637 |
2009 | | | 112,852 |
2010 | | | 268,132 |
Thereafter | | | 369,908 |
Total | | $ | 2,125,788 |
Note 10Derivative Instruments and Hedging Activities
Sky Financial’s hedging policies permit the use of interest rate swaps, caps and floors to manage interest rate risk or to hedge specified assets and liabilities. Sky Financial uses derivative instruments, primarily interest rate swaps, to manage interest rate risk on certain liabilities by hedging the fair value of certain fixed-rate debt, which converts the debt to variable rates, and by hedging the cash flow variability associated with certain variable rate debt by converting the debt to fixed rates.
The derivative instruments and hedging relationships below, identified as fair value and cash flow hedges, have been designated and qualify as either fair value or cash flow hedges. To qualify for hedge accounting under SFAS No. 133, as amended, the effectiveness of each hedging relationship is assessed both at hedge inception and at each reporting period thereafter. Also at the end of each reporting period, ineffectiveness in the hedging relationships is measured as the difference between the change in fair value of the derivative instruments and the change in fair value of either the hedged items (fair value hedges) or expected cash flows (cash flow hedges). Ineffectiveness, if any, is recorded in interest expense.
Fair Value Hedges - Interest Rate Swaps
Sky Financial uses interest rate swap agreements to hedge a portion of its fixed rate borrowings. The interest rate swaps effectively convert the fixed rate of interest on $108,600 of the junior subordinated debentures owed to unconsolidated subsidiary trusts and $235,000 of advances to the Federal Home Loan Bank of Cincinnati to variable rates based on LIBOR plus a spread as defined in the agreements. Sky Financial also uses interest rate swap agreements to hedge long-term fixed rate commercial loans. At December 31, 2005, Sky Financial had $18,815 of such agreements. The commercial loan swaps effectively convert the fixed rate of interest on these commercial loans to a variable rate based on LIBOR plus a spread as defined in the agreements. The interest rate swaps involve no exchange of principal either at inception or maturity and have maturities and call options identical to the trust preferred security agreements, FHLB advance agreements or commercial loans. The arrangements have been designated as fair value hedges and
both the change in the fair value of the hedges and the hedged transactions are reflected in earnings. Because the hedging arrangements are considered highly effective, changes in the fair value of the interest rate swaps exactly offset the corresponding changes in the hedged items and, as a result, the changes in the fair value do not result in an impact on net income.
Cash Flow Hedges - Interest Rate Swaps
Sky Financial had entered into, through its merger with Metropolitan Bank, two interest rate swaps, whereby it pays a fixed rate of interest and receives a variable rate based on LIBOR. The interest rate swaps, along with the underlying FHLB advances matured during 2005. The first $20,000 matured in August and the second $20,000 in November. The swaps were considered to be highly effective. Accordingly, any change in the swaps’ fair value was recorded in other comprehensive income, net of tax. No ineffectiveness was recorded in income from continuing operations during 2005, 2004 or 2003.
Interest Rate Caps
During 2002, Sky Financial entered into two interest rate cap arrangements, and paid $1,456 to hedge its interest risk on $48,600 of federal funds purchased. The interest rate caps are designed to offset the impact of changes in the federal fund purchased rate above the weighted average stated rate of 5.90%, and, as such, are considered to be highly effective. Any changes in the intrinsic values are recorded in other comprehensive income. Changes in the time values of the interest rate caps, which are excluded from the assessment of hedge effectiveness, increased interest expense by $219 in 2005, $220 in 2004 and $219 in 2003.
No deferred gains or losses in accumulated other comprehensive income at December 31, 2005 are expected to be reclassified to income from continuing operations in 2006.
48
Note 10Derivative Instruments and Hedging Activities (continued)
The following table presents the contract/notional and fair value amounts of all derivative transactions at December 31, 2005 and 2004:
| | | | | | | | | | | | | | |
| | | Notional Amount | | Fair Value | | | Fixed Rate | | | Variable Rate | | | Maturity Years |
At December 31, 2005 | | | | | | | | | | | | | | |
Interest rate swaps | | | | | | | | | | | | | | |
Fair value hedges | | $362,415 | | $ | (2,981 | ) | | 6.94 | % | | 6.52 | % | | 9.64 |
Interest rate caps | | 48,600 | | | 168 | | | – | | | – | | | 2.92 |
Total derivative instruments | | $411,015 | | $ | (2,813 | ) | | | | | | | | |
At December 31, 2004 | | | | | | | | | | | | | | |
Interest rate swaps | | | | | | | | | | | | | | |
Fair value hedges | | $323,600 | | $ | 8,912 | | | 7.07 | % | | 4.54 | % | | 11.14 |
Cash flow hedges | | 40,000 | | | (1,186 | ) | | 6.36 | | | 2.29 | | | 0.73 |
Interest rate caps | | 48,600 | | | 263 | | | – | | | – | | | 3.91 |
Total derivative instruments | | $412,200 | | $ | 7,989 | | | | | | | | | |
| | |
Interest Rate Swaps on Behalf of Clients During 2005, Sky Financial entered into several commercial loan swaps in order to provide commercial loan clients the ability to swap from variable to fixed interest rates. Under these agreements, Sky Financial enters into a variable rate loan agreement with a client in addition to a swap agreement. This swap agreement effectively swaps the client’s variable rate loan into a fixed rate loan. Sky Financial then enters into a corresponding swap agreement with a third party in order to swap its exposure on the variable to fixed rate swap on the commercial loan. | | At December 31, 2005, Sky Financial had $65,138 of notional amount of such agreements. As the interest rate swaps with the clients and third parties are not designated as hedges under FAS No. 133, the instruments are marked to market in earnings. As the interest rate swaps are structured to offset each other, there was no net impact to earnings in 2005 related to these swaps. |
Note 11Income Taxes
Income taxes consisted of the following:
| | | | | | | | | |
| | | 2005 | | 2004 | | 2003 |
Current | | | | | | | | | |
Federal | | $ | 84,891 | | $ | 75,407 | | $ | 61,400 |
State and local | | | 390 | | | 541 | | | 78 |
| | | | 85,281 | | | 75,948 | | | 61,478 |
Deferred | | | | | | | | | |
Federal | | | 6,258 | | | 9,378 | | | 14,600 |
State and local | | | 8 | | | 18 | | | 72 |
| | | | 6,266 | | | 9,396 | | | 14,672 |
Total provision for income taxes | | $ | 91,547 | | $ | 85,344 | | $ | 76,150 |
49
Notes to Consolidated Financial Statements
(Dollars and shares in thousands, except per share data)
Note 11Income Taxes (continued)
The sources of gross deferred tax assets and liabilities were as follows at December 31:
| | | | | | | | | | | | |
| | | 2005 | | | 2004 | | | 2003 | |
Items giving rise to deferred tax assets: | | | | | | | | | | | | |
Allowance for loan losses in excess of tax reserve | | $ | 48,923 | | | $ | 52,949 | | | $ | 43,702 | |
Intangible assets | | | 4,846 | | | | 5,182 | | | | 6,974 | |
Deferred compensation | | | 11,412 | | | | 10,928 | | | | 9,110 | |
Net deferred loan fees and costs | | | 7,075 | | | | 5,737 | | | | 4,540 | |
Interest on non-accrual loans | | | 7,299 | | | | 5,220 | | | | 1,493 | |
Post-retirement benefits | | | 1,430 | | | | 1,592 | | | | 1,118 | |
Net operating loss carryforward | | | 12,128 | | | | 11,722 | | | | 622 | |
Cash flow hedge | | | 109 | | | | 604 | | | | 1,160 | |
Unrealized loss on securities available for sale | | | 23,806 | | | | 3,323 | | | | – | |
Minimum pension liability | | | 1,385 | | | | – | | | | – | |
Accrued stock-based compensation | | | 1,744 | | | | – | | | | – | |
Merger, integration and restructuring expense | | | – | | | | 863 | | | | 649 | |
Fixed asset depreciation | | | 440 | | | | – | | | | – | |
Other | | | 2,561 | | | | 2,249 | | | | 3,658 | |
| | | | 123,158 | | | | 100,369 | | | | 73,026 | |
Items giving rise to deferred tax liabilities: | | | | | | | | | | | | |
FHLB stock dividends | | | (16,529 | ) | | | (13,947 | ) | | | (9,757 | ) |
Mortgage servicing rights | | | (13,356 | ) | | | (14,218 | ) | | | (9,868 | ) |
Depreciation | | | – | | | | (3,621 | ) | | | (1,906 | ) |
Unrealized gain on securities available for sale | | | – | | | | – | | | | (4,349 | ) |
Purchase accounting adjustments | | | (9,678 | ) | | | (4,765 | ) | | | (1,884 | ) |
Other | | | (1,144 | ) | | | (914 | ) | | | (240 | ) |
| | | | (40,707 | ) | | | (37,465 | ) | | | (28,004 | ) |
Net deferred tax asset | | $ | 82,451 | | | $ | 62,904 | | | $ | 45,022 | |
| | |
Total federal income tax expense differs from the expected amounts computed by applying the statutory federal tax rate of | | 35% to income before taxes. The reasons for this difference are as follows: |
| | | | | | | | | | | | | | | | | | | | | |
| | | 2005 | | | 2004 | | | 2003 | |
| | | | Amount | | | Tax
Rate |
| | | Amount | | | Tax
Rate |
| | | Amount | | | Tax
Rate |
|
Income tax expense based upon the federal statutory rate on income before income taxes | | $ | 95,808 | | | 35.0 | % | | $ | 91,190 | | | 35.0 | % | | $ | 80,091 | | | 35.0 | % |
Bank-owned life insurance earnings | | | (2,610 | ) | | (1.0 | ) | | | (2,055 | ) | | (0.8 | ) | | | (2,147 | ) | | (0.9 | ) |
Tax exempt income | | | (1,911 | ) | | (0.7 | ) | | | (1,831 | ) | | (0.7 | ) | | | (1,587 | ) | | (0.7 | ) |
Deductible ESOP dividends | | | (1,074 | ) | | (0.4 | ) | | | (924 | ) | | (0.4 | ) | | | (524 | ) | | (0.2 | ) |
Dividend exclusions | | | (119 | ) | | (0.0 | ) | | | (494 | ) | | (0.2 | ) | | | (412 | ) | | (0.2 | ) |
Other, net | | | 1,453 | | | 0.5 | | | | (542 | ) | | (0.2 | ) | | | 729 | | | 0.3 | |
| | | $ | 91,547 | | | 33.4 | % | | $ | 85,344 | | | 32.7 | % | | $ | 76,150 | | | 33.3 | % |
| | |
Tax expense attributable to securities gains and losses totaled $1,281, $5,099 and $305 in 2005, 2004 and 2003, respectively. For the years ended 2005, 2004, and 2003, tax expense resulting from allocating the tax benefit associated with stock option exercises directly to paid in capital was $2,660, $3,175, and $1,522, respectively. | | At December 31, 2005, the Company had unused net operating losses and general business tax credits expiring from 2018 to 2024. Sky Financial anticipates all net operating losses and general business credits will be fully utilized. |
50
Note 12Other Comprehensive Income (Loss)
Other comprehensive income (loss) consisted of the following:
| | | | | | | | | | | | |
| | | 2005 | | | 2004 | | | 2003 | |
Other comprehensive income (loss) | | | | | | | | | | | | |
Securities available for sale: | | | | | | | | | | | | |
Unrealized (losses) gains arising during period | | $ | (55,055 | ) | | $ | (6,018 | ) | | $ | (40,269 | ) |
Reclassification adjustment for gains included in income | | | (3,662 | ) | | | (14,569 | ) | | | (871 | ) |
Cash flow hedge derivatives: | | | | | | | | | | | | |
Change in fair value on cash flow hedge derivatives | | | 380 | | | | 8,598 | | | | (4,857 | ) |
Amounts reclassified to income from discontinued operations | | | – | | | | 616 | | | | 3,489 | |
Minimum pension liability and other | | | (3,277 | ) | | | – | | | | – | |
Total | | | (61,614 | ) | | | (11,373 | ) | | | (42,508 | ) |
Tax effect | | | 21,565 | | | | 3,978 | | | | 14,878 | |
Total other comprehensive (loss) income | | $ | (40,049 | ) | | $ | (7,395 | ) | | $ | (27,630 | ) |
Accumulated other comprehensive income (loss) consisted of the following:
| | | | | | | | | | | | | | |
| | | Securities
Available
for Sale | | | Minimum
Pension Liability
And Other | | | Cash Flow
Hedges | | | Accumulated Other
Comprehensive
Income (Loss) | |
December 31, 2002 | | $ | 33,403 | | | $ – | | | $ | (5,315 | ) | | $ 28,088 | |
Other comprehensive income (loss) | | | | | | | | | | | | | | |
Pre-tax | | | (41,140 | ) | | – | | | | (1,368 | ) | | (42,508 | ) |
Tax effect | | | 14,399 | | | – | | | | 479 | | | 14,878 | |
Total | | | (26,741 | ) | | – | | | | (889 | ) | | (27,630 | ) |
December 31, 2003 | | | 6,662 | | | – | | | | (6,204 | ) | | 458 | |
Other comprehensive income (loss) | | | | | | | | | | | | | | |
Pre-tax | | | (20,587 | ) | | – | | | | 9,214 | | | (11,373 | ) |
Tax effect | | | 7,204 | | | – | | | | (3,226 | ) | | 3,978 | |
Total | | | (13,383 | ) | | – | | | | 5,988 | | | (7,395 | ) |
December 31, 2004 | | | (6,721 | ) | | – | | | | (216 | ) | | (6,937 | ) |
Other comprehensive income (loss) | | | | | | | | | | | | | | |
Pre-tax | | | (58,717 | ) | | (3,277 | ) | | | 380 | | | (61,614 | ) |
Tax effect | | | 20,551 | | | 1,147 | | | | (133 | ) | | 21,565 | |
Total | | | (38,166 | ) | | (2,130 | ) | | | 247 | | | (40,049 | ) |
December 31, 2005 | | $ | (44,887 | ) | | $(2,130 | ) | | $ | 31 | | | $(46,986 | ) |
51
Notes to Consolidated Financial Statements
(Dollars and shares in thousands, except per share data)
Note 13Earnings Per Common Share
| | |
| Basic earnings per share is computed by dividing net income by the weighted average number of shares outstanding during the period. Diluted earnings per share is computed using the weighted average number of shares determined for the basic computation | | plus the dilutive effect of potential common shares issuable under stock options and restricted shares. Basic and diluted earnings per share computations were as follows: |
| | | | | | | | | |
| | | 2005 | | 2004 | | 2003 |
Numerator | | | | | | | | | |
Income from continuing operations | | $ | 182,191 | | $ | 175,200 | | $ | 152,680 |
Income from discontinued operations | | | 372 | | | 19,155 | | | 3,937 |
Net income | | $ | 182,563 | | $ | 194,355 | | $ | 156,617 |
Denominator | | | | | | | | | |
Weighted-average common shares outstanding (basic) | | | 106,796 | | | 99,461 | | | 89,630 |
Dilutive effect of stock options and restricted shares | | | 1,177 | | | 1,107 | | | 774 |
Weighted-average common shares outstanding (diluted) | | | 107,973 | | | 100,568 | | | 90,404 |
Basic Earnings Per Common Share | | | | | | | | | |
Income from continuing operations | | $ | 1.71 | | $ | 1.76 | | $ | 1.70 |
Income from discontinued operations | | | 0.00 | | | 0.19 | | | 0.05 |
Net income | | $ | 1.71 | | $ | 1.95 | | $ | 1.75 |
Diluted Earnings Per Common Share | | | | | | | | | |
Income from continuing operations | | $ | 1.69 | | $ | 1.74 | | $ | 1.69 |
Income from discontinued operations | | | 0.00 | | | 0.19 | | | 0.04 |
Net income | | $ | 1.69 | | $ | 1.93 | | $ | 1.73 |
Weighted shares under option of 291 in 2005, 38 in 2004 and 856 in 2003 were excluded from the diluted earnings per share calculation as they were anti-dilutive.
Note 14Fair Values of Financial Instruments
The following table shows carrying values and the related estimated fair values of financial instruments at year end. Items that are not financial instruments are not included.
| | | | | | | | | | | | | | | | |
| | | 2005 | | | 2004 | |
| | |
| Carrying
Amounts |
| |
| Estimated
Fair Value |
| |
| Carrying
Amounts |
| |
| Estimated
Fair Value |
|
Financial Assets: | | | | | | | | | | | | | | | | |
Cash and due from banks | | $ | 318,114 | | | $ | 318,114 | | | $ | 232,407 | | | $ | 232,407 | |
Interest-bearing deposits with financial institutions | | | 15,037 | | | | 15,037 | | | | 32,919 | | | | 32,919 | |
Securities available for sale | | | 3,097,472 | | | | 3,097,472 | | | | 3,091,813 | | | | 3,091,813 | |
Loans held for sale and loans, net of the allowance for credit losses | | | 11,028,945 | | | | 10,933,216 | | | | 10,474,162 | | | | 10,413,983 | |
Interest receivable | | | 67,910 | | | | 67,910 | | | | 56,118 | | | | 56,118 | |
Financial Liabilities: | | | | | | | | | | | | | | | | |
Deposits | | | (10,755,676 | ) | | | (10,738,870 | ) | | | (10,351,591 | ) | | | (10,384,372 | ) |
Securities sold under repurchase agreements and federal funds purchased | | | (1,053,244 | ) | | | (1,048,656 | ) | | | (1,041,361 | ) | | | (1,040,071 | ) |
Debt, FHLB advances and junior subordinated debentures | | | (2,125,382 | ) | | | (2,157,825 | ) | | | (1,924,114 | ) | | | (1,926,177 | ) |
Interest payable | | | (28,804 | ) | | | (28,804 | ) | | | (28,686 | ) | | | (28,686 | ) |
Derivative Financial Instruments: | | | | | | | | | | | | | | | | |
Interest rate swaps | | | (2,981 | ) | | | (2,981 | ) | | | 7,726 | | | | 7,726 | |
Interest rate caps | | | 168 | | | | 168 | | | | 263 | | | | 263 | |
52
Note 14Fair Values of Financial Instruments (continued)
| | |
For purposes of the above disclosures of estimated fair value, the following assumptions were used: the carrying values for cash and due from banks and interest-bearing deposits with financial institutions were considered to approximate fair value; the estimated fair value for securities was based on quoted market values for the individual securities or for equivalent securities; the estimated fair value for loans was based on estimates of the rate Sky Financial would charge for similar loans at December 31, 2005 and 2004, applied over estimated payment periods; the estimated fair value for demand and savings deposits was based on their carrying value; the estimated fair value for certificates of deposit and borrowings was based on estimates of the rate Sky Financial would pay on such obligations at December 31, 2005 and 2004, applied for the time period until maturity. The fair value of interest rate swaps and caps represents the estimated amount the company would receive or pay to terminate the agreements, considering current interest rates, as well as the current creditworthiness of the counterparties. The capital lease obligations of $302 and $726 at December 31, 2005 and 2004 are not included in the carrying amounts or the estimated | | fair value. The estimated fair value of commitments was not material. While these estimates of fair values are based on management’s judgment of appropriate factors, there is no assurance that, if Sky Financial had disposed of such items at December 31, 2005 or 2004, the estimated fair values would necessarily have been achieved at that date, because market values may differ depending on various circumstances. The estimated fair values at December 31, 2005 and 2004 should not necessarily be considered to apply at subsequent dates. In addition, other assets and liabilities of Sky Financial that are not defined as financial instruments were excluded from the above disclosures, such as mortgage servicing rights and life insurance contracts. In addition, non-financial instruments typically not recognized in financial statements (but which may have value) were not included in the above disclosures. These include, among other items, the estimated earning power of core deposit accounts, the value of a trained work force, client goodwill and similar items. |
Note 15Other Income and Other Operating Expense
The following is a summary of other income and other operating expense:
| | | | | | | | | |
| | | 2005 | | 2004 | | 2003 |
Other Income | | | | | | | | | |
Transaction fees | | $ | 16,361 | | $ | 13,246 | | $ | 10,506 |
Merchant income | | | 6,024 | | | 6,929 | | | 4,572 |
Income from bank-owned life insurance | | | 7,569 | | | 6,249 | | | 6,484 |
International fees | | | 2,366 | | | 1,829 | | | 1,685 |
Other | | | 13,749 | | | 13,686 | | | 11,707 |
Total other income | | $ | 46,069 | | $ | 41,939 | | $ | 34,954 |
Other Operating Expense | | | | | | | | | |
Marketing | | $ | 12,818 | | $ | 11,269 | | $ | 9,034 |
Legal and other professional fees | | | 11,644 | | | 9,426 | | | 8,192 |
Loan costs | | | 8,837 | | | 7,827 | | | 7,106 |
Telephone | | | 8,401 | | | 7,608 | | | 6,452 |
Printing and supplies | | | 6,734 | | | 6,054 | | | 5,834 |
State franchise taxes | | | 3,981 | | | 3,255 | | | 8,550 |
Other | | | 48,017 | | | 42,857 | | | 35,157 |
Total other operating expense | | $ | 100,432 | | $ | 88,296 | | $ | 80,325 |
Note 16Merger, Integration and Restructuring Expenses
| | |
In 2005, Sky Financial recorded merger, integration and restructuring charges totaling $1,771 ($1,151 after tax or $.01 per diluted share). Merger, integration and restructuring charges of $1,168 ($759 after tax or $.01 per diluted share) related to the acquisition of Belmont Bancorp. Included were data processing and conversion costs of $222, severance and other related employee costs of $401, professional fees and other costs of $463 and lease and contract termination costs of $82. Costs of $224 ($146 after tax) were related to the Falls Bank acquisition. These charges consisted of data processing and conversion expense of $45 and professional fees and other costs of $179. In addition to the above costs for acquisitions, Sky Financial recorded $379 ($246 after tax) for professional and other costs related to the pending acquisition of Union Federal. During 2005, a total of 73 positions were eliminated as part of integrating the acquisitions, which involved 66 positions from Belmont Bancorp and seven positions from Falls Bank. Of this | | total, two Falls Bank employees accepted transfers to other positions. Additionally, 16 employees from Belmont Bancorp and two from Falls Bank accepted outside employment. The remaining 50 employees from Belmont Bancorp and three from Falls Bank were involuntarily terminated with severance. In 2004, Sky Financial recorded merger, integration and restructuring charges totaling $4,542 ($2,952 after tax or $.03 per diluted share). Merger, integration and restructuring charges of $3,597 ($2,338 after tax or $.02 per diluted share) related to the acquisition of Second Bancorp. Included were data processing and conversion costs of $669, severance and other related employee costs of $839, professional fees and other costs of $1,953 and lease and contract termination costs of $136. Costs of $786 ($511 after tax or $.01 per diluted share) were related to the Prospect Bancshares acquisition. These charges consisted of severance and other related employee costs of $89, data processing and conversion expense of $203, and professional fees |
53
Notes to Consolidated Financial Statements
(Dollars and shares in thousands, except per share data)
Note 16Merger, Integration and Restructuring Expenses (continued)
| | |
and other costs of $494. The remaining $159 ($103 after tax or $.00 per diluted share) of costs are primarily related to the divestiture of Sky Financial Solutions. During 2004, a total of 323 positions were eliminated as part of acquisitions, which involved 304 positions from Second Bancorp and 19 positions from Prospect Bancshares. Of this total, 139 employees accepted transfers to other positions, which consisted of 125 from Second Bancorp and 14 from Prospect Bancshares. Additionally, 40 employees from Second Bancorp and three from Prospect Bancshares accepted outside employment. The remaining 139 employees from Second Bancorp and two from Prospect Bancshares were involuntarily terminated with severance. In 2003, Sky Financial recorded merger, integration and restructuring charges totaling $4,577 ($2,975 after tax or $.03 per diluted share). Merger, integration and restructuring charges of $1,091 ($710 after tax or $.01 per diluted share) related to the acquisition of GLB. Included were data processing costs of $704, severance and other related employee costs of $287, and | | professional fees and other costs of $100. The remaining $3,486 ($2,265 after tax or $.02 per diluted share) of costs are related to the Metropolitan acquisition. These charges consisted of severance and other related employee costs of $1,930, data processing conversion expense of $13, lease and contract termination costs of $463, and professional fees and other costs of $1,080. The balance of these costs were paid in 2004. During 2003, a total of 206 positions were eliminated as part of acquisitions, which involved 28 positions from GLB and 178 positions from Metropolitan Bank. Of this total, 44 employees accepted transfers to other positions, which consisted of 13 employees from GLB and 31 employees from Metropolitan Bank. Additionally, 22 employees from Metropolitan accepted outside employment and 15 employees from GLB and 125 employees from Metropolitan were involuntarily terminated with severance. The following is a summary of category activity in the merger, integration and restructuring liabilities for 2005 and 2004. |
| | | | | | | | | | | | | | | | |
| | | Employee Severance
and Termination | | | Conversion
Costs | | | Lease/Contract
Termination | | | Professional Fees/ Other Costs | | | Total | |
Balance as of December 31, 2003 | | $ 1,207 | | | $ 58 | | | $ 620 | | | $ 638 | | | $ | 2,523 | |
Accruals charged to expense | | 1,300 | | | 872 | | | (290 | ) | | 2,660 | | | | 4,542 | |
Accruals from purchase accounting | | 3,914 | | | – | | | 1,469 | | | 1,382 | | | | 6,765 | |
Cash payments | | (3,917 | ) | | (930 | ) | | (1,109 | ) | | (4,550 | ) | | | (10,506 | ) |
Balance as of December 31, 2004 | | 2,504 | | | – | | | 690 | | | 130 | | | | 3,324 | |
Accruals charged to expense | | 401 | | | 267 | | | 82 | | | 1,021 | | | | 1,771 | |
Accruals from purchase accounting | | 1,852 | | | – | | | 835 | | | 15 | | | | 2,702 | |
Cash payments | | (3,810 | ) | | (225 | ) | | (419 | ) | | (1,034 | ) | | | (5,488 | ) |
Balance as of December 31, 2005 | | $ 947 | | | $ 42 | | | $ 1,188 | | | $ 132 | | | $ | 2,309 | |
Note 17Employee Benefits
| | |
Sky Financial Group, Inc. Profit Sharing, 401(k) and ESOP Plan Sky Financial’s qualified retirement plan is the Sky Financial Group, Inc. Profit Sharing, 401(k) and ESOP Plan. Sky Financial also has a non-qualified supplemental retirement plan for certain individuals. The Profit Sharing portion of the plan provides for contributions by Sky Financial as determined on a year-by-year basis. These contributions were 4.5%, 4% and 5% of eligible employee compensation in 2005, 2004 and 2003, respectively. Under the 401(k) portion of the plan, employees may contribute a percentage of their eligible compensation with a company match of such contributions up to a maximum match of 4%. Employees may contribute to this plan upon employment. Employer matching contributions commence immediately upon entering the 401(k) and are 100% vested at all times. Expenses related to this portion of the plan were $5,863, $3,981 and $4,788 in 2005, 2004 and 2003, respectively. The Sky Financial plan also has a portion of the plan that provides for an annual employer contribution equal to 3% of eligible employees’ annual compensation. Expenses related to this portion were $3,909, $2,986 and $2,873 in 2005, 2004 and 2003, respectively. Total shares of Sky Financial common stock held by the Profit Sharing, 401(k) and Employee Stock Ownership Plan as of December 31, 2005 were 3,332. | | Supplemental Retirement Plan This plan replaces retirement benefits eliminated under Sky Financial’s qualified retirement plans because of eligible statutory compensation limitations under current tax law. Sky Financial’s contribution under the plan is determined by multiplying the excess of employees’ eligible compensation over the established statutory limitation by the contribution level established by the Board of Directors for Sky Financial’s qualified plans. The collective contribution rates were 11.5%, 11% and 12% in 2005, 2004 and 2003, respectively. Expenses related to this plan were $243, $306 and $245 in 2005, 2004 and 2003, respectively. |
54
Note 17Employee Benefits (continued)
Frozen Pension Plans
| | |
| In connection with Sky Financial’s acquisition of Second National and Three Rivers, Sky Financial sponsors two funded, defined benefit pension plans for eligible employees who are 21 years of age with one or more years of service. The Second National plan was frozen during the fourth quarter of 2004. Because this was contemplated in the Second National acquisition, a curtailment gain was considered in arriving at the benefit obligation and prepaid pension cost recorded at the acquisition date. Sky Financial expects to make contributions of $179 to the plan in 2006. Benefits paid to retirees are based on age at retirement, | | years of credited service and average compensation. The Three Rivers’ plan was frozen during the fourth quarter of 2002. Because this was contemplated in the Three Rivers acquisition, a curtailment gain was considered in arriving at the benefit obligation and prepaid pension cost recorded at the acquisition date. Sky Financial does not expect to make any contributions to the plan in 2006. The following table sets forth the benefit obligation, fair value of plan assets and the funded status of Sky Financial’s plans; amounts recognized in Sky Financial’s financial statements; and the principal weighted average assumptions used at December 31, 2005 and 2004: |
| | | | | | | | | | | | |
| | | | | | 2005 | | | 2004 | |
Change in Benefit Obligation | | | | | | | | | | | | |
Benefit obligation at beginning of period | | | | | | $ | 25,100 | | | $ | 5,027 | |
Service cost | | | | | | | 123 | | | | 508 | |
Interest cost | | | | | | | 1,440 | | | | 864 | |
Acquisitions | | | | | | | – | | | | 18,073 | |
Benefits paid | | | | | | | (1,353 | ) | | | (996 | ) |
Expected expenses | | | | | | | (123 | ) | | | (39 | ) |
Actuarial loss | | | | | | | 1,374 | | | | 1,663 | |
Benefit obligation at end of period | | | | | | $ | 26,561 | | | $ | 25,100 | |
Change in Plan Assets | | | | | | | | | | | | |
Fair value of plan assets at beginning of period | | | | | | $ | 21,106 | | | $ | 5,363 | |
Actual return on plan assets, net of expenses | | | | | | | 909 | | | | 1,363 | |
Acquisitions | | | | | | | – | | | | 15,325 | |
Employer contributions | | | | | | | 179 | | | | 90 | |
Benefits paid | | | | | | | (1,353 | ) | | | (996 | ) |
Expected expenses | | | | | | | (123 | ) | | | (39 | ) |
Fair value of plan assets at end of period | | | | | | $ | 20,718 | | | $ | 21,106 | |
Reconciliation of funded status | | | | | | | | | | | | |
Funded Status | | | | | | $ | (5,843 | ) | | $ | (3,994 | ) |
Unrecognized actuarial loss | | | | | | | 3,957 | | | | 1,835 | |
Accrued benefit cost | | | | | | $ | (1,886 | ) | | $ | (2,159 | ) |
Amounts Recognized in the Consolidated Balance Sheet | | | | | | | | | | | | |
Prepaid benefit cost | | | | | | $ | – | | | $ | 826 | |
Accrued benefit liability | | | | | | | (5,843 | ) | | | (2,985 | ) |
Accumulated other comprehensive income (loss) | | | | | | | 3,957 | | | | – | |
Net amount recognized | | | | | | $ | (1,886 | ) | | $ | (2,159 | ) |
| | | | | | | | | | | | | |
| | | | 2005 | | | | 2004 | | | | 2003 | |
Components of Net Periodic Benefit Cost | | | | | | | | | | | | |
Service cost | | $ | 123 | | | $ | 508 | | | $ | – | |
Interest cost | | | 1,440 | | | | 864 | | | | 382 | |
Expected return on plan assets | | | (1,797 | ) | | | (1,105 | ) | | | (426 | ) |
Recognized actuarial loss (gain) | | | 41 | | | | (15 | ) | | | – | |
Net periodic benefit cost | | $ | (193 | ) | | $ | 252 | | | $ | (44 | ) |
Weighted-average assumptions at December 31 | | | | | | | | | | | | |
Discount rate | | | 5.60 | % | | | 5.90 | % | | | 6.25 | % |
Expected return on assets | | | 8.19 | | | | 8.00 | | | | 8.00 | |
55
Notes to Consolidated Financial Statements
(Dollars and shares in thousands, except per share data)
Note 17Employee Benefits (continued)
The accumulated benefit obligations were approximately $26,561 and $25,100 at December 31, 2005 and 2004, respectively.
The following table provides information for pension plans with an accumulated benefit obligation and projected benefit obligation in excess of plan assets:
| | | | | | |
| | | 2005 | | 2004 |
Projected benefit obligations | | $ | 26,561 | | $ | 19,682 |
Accumulated benefit obligations | | | 26,561 | | | 19,682 |
Fair value of plan assets at end of year | | | 20,718 | | | 15,835 |
Sky Financial expects to make the following benefit payments, which reflect expected future service:
| | |
| Year | | Pension Benefits |
2006 | | $ 930 |
2007 | | 1,076 |
2008 | | 1,191 |
2009 | | 1,139 |
2010 | | 1,263 |
2011 through 2015 | | 8,037 |
The expected long-term rate of return on the plans’ assets reflects the average rate of earnings expected on the funds invested by each plan to provide for plan benefits. Management considers the long-term historical returns of the assets within the portfolio and adjusts the rate, as necessary, for expected future returns on the assets in the plans in determining the rate.
The plans’ asset allocations at December 31, 2005 by asset category are as follows:
| | | | | | |
| | | Target
Allocation | | | Percent of Pension
Plan Assets | |
Equity securities | | 60 | % | | 66 | % |
Debt securities | | 40 | | | 27 | |
Cash | | – | | | 7 | |
Total | | 100 | % | | 100 | % |
Management’s investment allocation is managed to provide an acceptable level of return to fund future benefit payments as well as provide liquidity to pay current benefits while minimizing the overall market risk to the plans.
Management believes that its current investment allocation meets these goals and does not anticipate significant changes to the investment allocation in the near future. Management has provided the external investment managers with general guidelines for them to make decisions regarding the nature and timing of investment decisions. The investment policy does not allow for significant changes in previously approved investments or in the use of derivatives in the investment strategy.
Other Plans of Merged Affiliates
Sky Financial, as part of its overall employee benefits design, settles plans of merged affiliates through consolidation into existing plans or termination of the plan. On January 1, 2006, the following plans of acquired entities were merged into Sky’s Profit Sharing, 401(k) and Employee Stock Ownership Plan:
| n | | Belmont National Bank 401(k) Profit Sharing Plan |
| n | | Benefits Design Agency of Ohio 401(k) Retirement Savings Plan |
| n | | Becker-McDowell Agency, Inc. 401(k) Plan |
| n | | Steiner Insurance Agency, Inc. 401(k) Employee Savings Plan |
| n | | Falls Bank 401(k) Profit Sharing Plan |
Sky sponsored two 401(k) plans as the result of its 2004 acquisitions of Second National Bank and Prospect Bank. These plans were merged into Sky’s Profit Sharing, 401(k) and ESOP Plan on January 1, 2005. Sky also sponsored three 401(k) plans as a result of prior acquisitions of Pennsylvania Capital Bank, Eastern Ohio Benefits and Meyer and Eckenrode. Eastern Ohio Benefits and Meyer and Eckenrode were merged into Sky’s Profit Sharing, 401(k) and ESOP Plan on January 1, 2005. Pennsylvania Capital Bank 401(k) will be terminated in 2006. On April 1, 2004, Spencer-Patterson’s 401(k) plan was merged into Sky’s Profit Sharing, 401(k) and ESOP Plan. On January 1, 2004, Sky merged the Metropolitan and GLB 401(k) plans into Sky’s Profit Sharing, 401(k) and ESOP plan.
Sky Financial pays health insurance premiums for certain employees after retirement. Sky Financial accrues the costs of retirees’ health and other post-retirement benefits during the working career of active employees. The expense and liability under this plan are not material in any period presented.
Note 18Stock Options
Options to purchase Sky Financial’s stock have been granted to directors, officers and employees under various stock option plans. The Sky Financial Group, Inc. 2002 Stock Option and Stock Appreciation Rights Plan was approved by Sky Financial’s shareholders in 2002. Under the 2002 plan, options may be granted to purchase a maximum of 2.0 million common shares, or 2.5% of the number of issued and outstanding common shares at the time of adoption of the plan, adjusted for all subsequent stock dividends, splits and stock-for-stock acquisitions.
The Sky Financial Group, Inc. 1998 Stock Option Plan for Employees and the Amended and Restated Sky Financial Group, Inc. 1998 Stock Option Plan for Directors were approved by Sky Financial’s shareholders in 1998. Under these plans, options may be granted to purchase a maximum of 6.5 million common shares, or 7.5% of the number of issued and outstanding common shares at the time of the adoption of the plans, adjusted for all subsequent stock dividends, splits and stock-for-stock acquisitions.
Under both the 2002 and 1998 plans, options expire 10 years after the date of grant and are issued at an option price no less than the market price of Sky Financial’s stock on the date of grant. Certain individuals, including directors, may also elect to receive options, determined under a formula, in lieu of a portion of their salary or director fees, as applicable. Options granted to directors are fully vested and immediately exercisable at the time of grant. Options granted to officers and other key employees are generally exercisable at 40% after two years and in annual 20% increments thereafter, except for options received in lieu of salary, which are immediately exercisable.
The Sky Financial Group, Inc. 2004 Restricted Stock Plan was approved by Sky Financial’s shareholders in 2004. Under this plan, a total of 800 thousand of authorized, but unissued shares of common stock shall be available. Compensation expense for restricted share awards is recognized ratably over the period of service, usually the restricted period, based upon the fair value of the stock on the date of grant.
56
Note 18Stock Options (continued)
A summary of the activity in the plans is as follows:
| | | | | | | | | | | | | | | | | | |
| | | 2005 | | 2004 | | 2003 |
| | | Shares | | | Weighted
Average
Exercise
Price | | Shares | | | Weighted
Average
Exercise
Price | | Shares | | | Weighted
Average
Exercise
Price |
Outstanding at beginning of year | | 7,131 | | | $ | 20.45 | | 6,802 | | | $ | 18.82 | | 6,463 | | | $ | 18.47 |
Granted | | 764 | | | | 27.84 | | 1,344 | | | | 25.45 | | 1,155 | | | | 19.85 |
Exercised | | (762 | ) | | | 17.70 | | (907 | ) | | | 15.52 | | (650 | ) | | | 23.38 |
Forfeited | | (161 | ) | | | 24.37 | | (108 | ) | | | 21.52 | | (166 | ) | | | 20.46 |
Outstanding at end of year | | 6,972 | | | | 21.48 | | 7,131 | | | | 20.45 | | 6,802 | | | | 18.82 |
Options exercisable at end of year | | 4,963 | | | | 20.38 | | 4,870 | | | | 19.78 | | 4,818 | | | | 18.52 |
Weighted average fair value of options granted during year | | | | | $ | 5.24 | | | | | $ | 4.80 | | | | | $ | 3.49 |
The total intrinsic value of options exercised during the years ended December 31, 2005, 2004, and 2003, was $7,805, $9,920, and $4,319, respectively. The total fair value of shares
vested during 2005 was $3,413, $4,382 in 2004, and $3,086 in 2003.
Options outstanding at year-end 2005 were as follows:
| | | | | | | | | | |
| | | Outstanding | | Exercisable |
| Range of Exercise Prices | | Number | | Weighted Average
Remaining Contractual
Life (Years) | | Number | | Weighted Average
Exercise Price | | Weighted Average
Remaining Contractual
Life (Years) |
$10 to $ 15 | | 104 | | 1.45 | | 104 | | $ 14.29 | | 1.45 |
$15 to $ 20 | | 2,883 | | 5.45 | | 2,401 | | 17.71 | | 5.18 |
$20 to $ 25 | | 1,984 | | 4.61 | | 1,757 | | 22.05 | | 4.38 |
$25 to $ 30 | | 2,001 | | 8.33 | | 701 | | 26.22 | | 7.87 |
Outstanding at year-end | | 6,972 | | 5.99 | | 4,963 | | $ 20.38 | | 5.20 |
Aggregate intrinsic value | | $44,234 | | | | $36,940 | | | | |
A summary of Sky Financial’s nonvested restricted shares as of December 31, 2005 and changes during the year end December 31, 2005, were as follows:
| | | | | |
| | | Shares | | | Weighted Average
Grant Date
Fair Value |
Nonvested at January 1, 2005 | | – | | | $ – |
Granted | | 133 | | | 27.80 |
Vested | | (2 | ) | | 27.80 |
Forfeited | | (5 | ) | | 27.80 |
Nonvested at December 31, 2005 | | 126 | | | $ 27.80 |
As of December 31, 2005, there was $9,328 of total unrecognized compensation cost related to nonvested share-based compensation arrangements granted under the plans. That cost is expected to be recognized over a weighted-average period of 2.3 years.
Sky Financial maintains a Stock Appreciation Rights (SAR) plan under which SARs were granted in tandem with stock options until 1998. Expense (income) related to the SARs was $(40) in 2005, $72 in 2004 and $101 in 2003.
Note 19Other Financial Instruments
Credit Commitments and Letters of Credit
Sky Financial is a party to financial instruments with off-balance-sheet risk in the normal course of business to meet the financing needs of its clients located primarily within its local business areas. These instruments include commitments to extend credit, standby letters of credit and international commercial letters of credit.
Sky Financial’s exposure to credit loss in the event of non-performance by the other party to the financial instrument for commitments to extend credit, standby letters of credit and letters of credit is represented by the contractual amount of those instruments. Sky Financial uses the same credit policies in making commitments and conditional obligations as it does in extending loans to clients.
Financial instruments whose contract amounts represent credit risk at December 31 are presented below:
| | | | | | |
| | | 2005 | | 2004 |
Commitments to extend credit | | $ | 3,498,243 | | $ | 2,981,831 |
Standby letters of credit | | | 299,427 | | | 343,130 |
Letters of credit | | | 1,704 | | | 7,173 |
57
Notes to Consolidated Financial Statements
(Dollars and shares in thousands, except per share data)
Note 19Other Financial Instruments (continued)
The majority of the unfunded commitments at December 31, 2005 and 2004 are variable rate commitments, with approximately 20% or $755,000 and 22% or $721,000 having fixed rates in 2005 and 2004, respectively.
Commitments to extend credit are agreements to lend to a client as long as there is no violation of any condition established in the contract. Commitments generally have fixed expiration dates ranging from one to five years, variable interest rates tied to the prime rate and U.S. Treasury bill rates and may require payment of a fee. Because many of the commitments are expected to expire without being drawn upon, the total commitment amounts do not necessarily represent future cash requirements.
Standby letters of credit are conditional commitments issued by Sky Financial to guarantee the performance of a client to a third party. Those guarantees are primarily issued to support
public and private borrowing arrangements, including bond financing and similar transactions. The expiration date of substantially all standby letters of credit extend for a period ranging from thirty days to seven years.
The credit risk involved in issuing standby letters of credit is essentially the same as that involved in extending loan facilities to clients. Sky Financial holds marketable securities, certificates of deposits, real estate, inventory and equipment as collateral supporting those commitments for which collateral is deemed necessary.
Letters of credit are instruments used to facilitate trade, most commonly international trade, by substituting Sky Financial’s credit for that of a commercial importing company. The terms are generally one to three months. The letters of credit are primarily unsecured.
Note 20Mortgage Banking Activities
Sky Financial conducts mortgage banking operations through its banking subsidiary. The primary activity relates to the origination and sale of fixed and variable rate residential mortgages in the secondary market. Sky Financial normally retains the servicing of the loans it sells. Loans are primarily originated in Sky Financial’s community banking market areas of Ohio, Pennsylvania, Michigan, Indiana and West Virginia.
Mortgage banking income, a component of non-interest income, includes gain on sales of loans held for sale during 2005, 2004 and 2003 of $22,246, $25,572 and $54,280, respectively.
The following table summarizes information relating to Sky Financial’s mortgage banking activity as of December 31:
| | | | | | | | |
| | | 2005 | | | 2004 | |
Amounts held in agency accounts | | $ | 10,316 | | | $ | 14,569 | |
Amounts held in escrow accounts | | | 38,337 | | | | 35,188 | |
Mortgage banking receivables for advanced funds | | | 4,711 | | | | 4,202 | |
Unpaid mortgage loan principal for loans serviced for investors | | | 6,142,027 | | | | 6,069,286 | |
Mortgage servicing rights, net of accumulated amortization | | $ | 37,651 | | | $ | 40,680 | |
Allowance for impairment of capitalized mortgage servicing rights | | | (7 | ) | | | (1,026 | ) |
Net mortgage servicing rights | | $ | 37,644 | | | $ | 39,654 | |
In 2005, Sky Financial sold certain servicing rights on mortgages that had an outstanding principal balance of $25,599 and realized a net gain of approximately $22 on the sale. In 2004 and 2003, Sky Financial sold certain servicing rights on mortgages that had an outstanding principal balance of $388,398 and $20,682, respectively with a net gain of $1,020 in 2004 and no net gain or loss in 2003. At December 31, 2005, Sky Financial had firm commitments for the sale of approximately $48,257 of mortgage loans. The fair value of these commitments is not material.
Mortgage Servicing Rights:
| | | | | | | | |
| | | 2005 | | | 2004 | |
Balance at beginning of year | | $ | 39,654 | | | $ | 29,142 | |
Originations | | | 10,509 | | | | 16,673 | |
Acquired in acquisitions | | | 62 | | | | 9,947 | |
Amortization | | | (13,600 | ) | | | (15,265 | ) |
Impairment (charges) recoveries | | | 1,019 | | | | (843 | ) |
Carrying value at end of year | | $ | 37,644 | | | $ | 39,654 | |
Fair value at end of year | | $ | 58,679 | | | $ | 46,623 | |
| | | | | | | | | |
Impairment Reserve:
| | | | | | | |
| | | | 2005 | | | | 2004 |
Balance at beginning of year | | $ | 1,026 | | | $ | 183 |
Impairment charges (recoveries) | | | (1,019 | ) | | | 843 |
Balance at end of year | | $ | 7 | | | $ | 1,026 |
Key economic assumptions used to recognize mortgage servicing rights in 2005 and 2004 were as follows:
| | | | | | |
| | | 2005 | | | 2004 | |
Weighted-average constant prepayment rate | | 17.66 | % | | 17.61 | % |
Weighted-average life (in years) | | 6.3 | | | 6.3 | |
Weighted-average discount rate | | 11.00 | % | | 11.00 | % |
58
Note 21Regulatory Matters
Capital Maintenance Requirements
| | |
Sky Financial and Sky Bank must observe capital guidelines established by federal and state regulatory authorities. Failure to meet specified minimum capital requirements can result in certain mandatory actions by primary regulators of Sky Financial and Sky Bank that could have a material effect on Sky Financial’s financial condition or results of operations. Under capital adequacy guidelines, Sky Financial and Sky Bank must meet specific quantitative measures of their assets, liabilities and certain off-balance-sheet items as determined under regulatory accounting practices. Sky Financial’s and Sky Bank’s capital amounts and classification are also subject to qualitative judgments by the regulators about components, risk weightings and other factors. Management believes, as of December 31, 2005, that Sky Financial and Sky Bank meet all capital adequacy requirements to which they are subject. Sky Financial and Sky Bank have been notified by their respective regulators that, as of the most recent regulatory examinations, each is regarded as well-capitalized under the regulatory framework for prompt corrective action. Such determinations | | have been made evaluating Sky Financial and Sky Bank under Tier 1, total capital and leverage ratios. There are no conditions or events since these notifications that management believes have changed any of the well-capitalized categorizations of Sky Financial and Sky Bank. Under the Federal Reserve Board’s regulatory framework, certain capital securities offered by wholly-owned unconsolidated trust preferred entities of Sky Financial are currently included as “Tier I” regulatory capital. The Federal Reserve Board issued their final regulations on March 30, 2005 after evaluating whether these capital securities will continue as Tier I capital as a result of their deconsolidation under generally accepted accounting principals. The Federal Reserve Board has determined that these securities will continue to qualify as Tier I capital with specific limitations. The management of Sky Financial has evaluated these limitations and does not believe they will have a material effect on Sky Financial or Sky Bank’s Tier I capital. Sky Financial and Sky Bank’s capital ratios are presented in the following table: |
| | | | | | | | | | | | | | | |
| | | Actual | | | Minimum Required for
Capital Adequacy Purposes | | | Required to be Well-Capitalized
Under Prompt Corrective
Action Regulations | |
| | | Amount | | Ratio | | | Amount | | Ratio | | | Amount | | Ratio | |
December 31, 2005 | | | | | | | | | | | | | | | |
Total capital to risk-weighted assets | | | | | | | | | | | | | | | |
Sky Financial | | $1,461,147 | | 11.5 | % | | $ 1,013,831 | | 8.0 | % | | $ 1,267,289 | | 10.0 | % |
Sky Bank | | 1,376,814 | | 11.2 | | | 987,953 | | 8.0 | | | 1,234,942 | | 10.0 | |
| | | | | | |
Tier 1 capital to risk-weighted assets | | | | | | | | | | | | | | | |
Sky Financial | | $1,181,251 | | 9.3 | % | | $ 506,916 | | 4.0 | % | | $ 760,374 | | 6.0 | % |
Sky Bank | | 1,160,318 | | 9.4 | | | 493,977 | | 4.0 | | | 740,965 | | 6.0 | |
| | | | | | |
Tier 1 capital to average assets | | | | | | | | | | | | | | | |
Sky Financial | | $1,181,251 | | 8.0 | % | | $ 593,486 | | 4.0 | % | | $ 741,857 | | 5.0 | % |
Sky Bank | | 1,160,318 | | 7.9 | | | 587,832 | | 4.0 | | | 734,790 | | 5.0 | |
December 31, 2004 | | | | | | | | | | | | | | | |
Total capital to risk-weighted assets | | | | | | | | | | | | | | | |
Sky Financial | | $1,386,672 | | 11.7 | % | | $ 946,057 | | 8.0 | % | | $ 1,182,571 | | 10.0 | % |
Sky Bank | | 1,247,822 | | 10.8 | | | 920,487 | | 8.0 | | | 1,150,608 | | 10.0 | |
| | | | | | |
Tier 1 capital to risk-weighted assets | | | | | | | | | | | | | | | |
Sky Financial | | $1,096,089 | | 9.3 | % | | $ 473,028 | | 4.0 | % | | $ 709,542 | | 6.0 | % |
Sky Bank | | 1,027,903 | | 8.9 | | | 460,243 | | 4.0 | | | 690,365 | | 6.0 | |
| | | | | | |
Tier 1 capital to average assets | | | | | | | | | | | | | | | |
Sky Financial | | $1,096,089 | | 7.7 | % | | $ 567,992 | | 4.0 | % | | $ 709,991 | | 5.0 | % |
Sky Bank | | 1,027,903 | | 7.3 | | | 561,811 | | 4.0 | | | 702,264 | | 5.0 | |
| | |
Restrictions on Subsidiary Dividends Dividends paid by Sky Financial are mainly provided for by dividends from its subsidiaries. However, certain restrictions exist regarding the ability of Sky Bank to transfer funds to Sky Financial in the form of cash dividends, loans or advances. | | Regulatory approval is required in order to pay dividends in excess of Sky Bank’s earnings retained for the current year plus retained net profits since January 1, 2002. As of December 31, 2005, $227,309 was available for distribution to Sky Financial as dividends without prior regulatory approval. |
59
Notes to Consolidated Financial Statements
(Dollars and shares in thousands, except per share data)
Note 22Line of Business Reporting
| | |
Sky Financial manages and operates two major lines of business: community banking and financial service affiliates. Community banking includes lending and related services to businesses and consumers, mortgage banking and deposit-gathering. Other financial services consist of non-banking companies currently engaged in trust and wealth management, insurance and other financial-related services. The reported line of business results reflect the underlying operating performance within the business units. Parent and | | Other is comprised of the parent company and several smaller business units. It includes the net funding cost of the parent company and intercompany eliminations. Expenses for centrally-provided services and support are allocated based principally upon estimated usage of services. All merger, integration and restructuring charges company-wide are included in Parent and Other. Substantially all of Sky Financial’s assets are part of the community banking line of business. Selected segment information is included in the following table: |
| | | | | | | | | | | | | | | |
| | | Community
Banking | | | Financial Service
Affiliates | | | Parent and
Other | | | Consolidated
Total |
2005 | | | | | | | | | | | | | | | |
Net interest income | | $ | 522,011 | | | $ | 400 | | | $ | (7,759 | ) | | $ | 514,652 |
Provision for credit losses | | | 52,249 | | | | – | | | | – | | | | 52,249 |
Net interest income after provision | | | 469,762 | | | | 400 | | | | (7,759 | ) | | | 462,403 |
Non-interest income | | | 134,583 | | | | 75,750 | | | | 1,049 | | | | 211,382 |
Non-interest expense | | | 335,539 | | | | 58,543 | | | | 5,965 | | | | 400,047 |
| | | | |
Income (loss) from continuing operations before income taxes | | | 268,806 | | | | 17,607 | | | | (12,675 | ) | | | 273,738 |
Income tax expense (benefit) from continuing operations | | | 90,707 | | | | 7,717 | | | | (6,877 | ) | | | 91,547 |
Net income (loss) from continuing operations | | $ | 178,099 | | | $ | 9,890 | | | $ | (5,798 | ) | | $ | 182,191 |
Intersegment revenues (expense) | | $ | (22,873 | ) | | $ | (2,492 | ) | | $ | 25,365 | | | $ | – |
Average assets | | $ | 14,942,031 | | | $ | 88,376 | | | $ | 115,291 | | | $ | 15,145,698 |
Depreciation and amortization | | $ | 33,343 | | | $ | 1,120 | | | $ | 1,071 | | | $ | 35,534 |
2004 | | | | | | | | | | | | | | | |
Net interest income | | $ | 454,494 | | | $ | 567 | | | $ | (3,750 | ) | | $ | 451,311 |
Provision for credit losses | | | 37,425 | | | | 235 | | | | – | | | | 37,660 |
Net interest income after provision | | | 417,069 | | | | 332 | | | | (3,750 | ) | | | 413,651 |
Non-interest income | | | 124,277 | | | | 70,184 | | | | 8,956 | | | | 203,417 |
Non-interest expense | | | 293,884 | | | | 53,731 | | | | 8,909 | | | | 356,524 |
Income (loss) from continuing operations before income taxes | | | 247,462 | | | | 16,785 | | | | (3,703 | ) | | | 260,544 |
Income tax expense (benefit) from continuing operations | | | 83,196 | | | | 7,011 | | | | (4,863 | ) | | | 85,344 |
Net income from continuing operations | | $ | 164,266 | | | $ | 9,774 | | | $ | 1,160 | | | $ | 175,200 |
Intersegment revenues (expense) | | $ | (25,243 | ) | | $ | (2,360 | ) | | $ | 27,603 | | | $ | – |
Average assets | | $ | 13,132,668 | | | $ | 95,900 | | | $ | 131,988 | | | $ | 13,360,556 |
Depreciation and amortization | | $ | 29,861 | | | $ | 1,120 | | | $ | 965 | | | $ | 31,946 |
2003 | | | | | | | | | | | | | | | |
Net interest income | | $ | 393,307 | | | $ | 389 | | | $ | (2,453 | ) | | $ | 391,243 |
Provision for credit losses | | | 33,225 | | | | 900 | | | | – | | | | 34,125 |
Net interest income after provision | | | 360,082 | | | | (511 | ) | | | (2,453 | ) | | | 357,118 |
Non-interest income | | | 121,324 | | | | 53,637 | | | | 3,937 | | | | 178,898 |
Non-interest expense | | | 248,708 | | | | 43,416 | | | | 15,062 | | | | 307,186 |
Income (loss) from continuing operations before income taxes | | | 232,698 | | | | 9,710 | | | | (13,578 | ) | | | 228,830 |
Income tax expense (benefit) from continuing operations | | | 78,408 | | | | 4,427 | | | | (6,685 | ) | | | 76,150 |
Net income (loss) from continuing operations | | $ | 154,290 | | | $ | 5,283 | | | $ | (6,893 | ) | | $ | 152,680 |
Intersegment revenues (expense) | | $ | (13,892 | ) | | $ | (1,422 | ) | | $ | 15,314 | | | $ | – |
Average assets | | $ | 11,196,405 | | | $ | 76,005 | | | $ | 156,861 | | | $ | 11,429,271 |
Depreciation and amortization | | $ | 20,385 | | | $ | 878 | | | $ | 732 | | | $ | 21,995 |
60
Note 23Condensed Parent Company Financial Information
Condensed Parent Company Balance Sheets
| | | | | | |
| December 31, | | 2005 | | 2004 |
Assets | | | | | | |
Cash and due from banks | | $ | 44,160 | | $ | 94,920 |
Securities | | | 17,987 | | | 30,460 |
Investment in bank subsidiaries | | | 1,530,237 | | | 1,421,439 |
Investment in non-bank subsidiaries | | | 272,896 | | | 244,910 |
Receivable from subsidiaries | | | 25,725 | | | 18,208 |
Premises and equipment | | | 6,300 | | | 7,144 |
Other assets | | | 59,576 | | | 60,090 |
Total assets | | $ | 1,956,881 | | $ | 1,877,171 |
Liabilities | | | | | | |
Debt | | $ | 285,936 | | $ | 289,558 |
Other liabilities | | | 117,068 | | | 116,658 |
Total liabilities | | | 403,004 | | | 406,216 |
Shareholders’ Equity | | | 1,553,877 | | | 1,470,955 |
Total liabilities and shareholders’ equity | | $ | 1,956,881 | | $ | 1,877,171 |
Condensed Parent Company Statements of Income
| | | | | | | | | | | | |
For years ended December 31, | | | 2005 | | | | 2004 | | | | 2003 | |
Income | | | | | | | | | | | | |
Dividends from bank subsidiaries | | $ | 104,301 | | | $ | 88,000 | | | $ | 80,000 | |
Dividends from non-bank subsidiaries | | | 18,572 | | | | 14,055 | | | | 6,855 | |
Management fees | | | 25,630 | | | | 26,998 | | | | 14,252 | |
Other income | | | 2,799 | | | | 10,866 | | | | 7,227 | |
Total income | | | 151,302 | | | | 139,919 | | | | 108,334 | |
Expenses | | | | | | | | | | | | |
Interest expense | | | 18,762 | | | | 15,560 | | | | 20,784 | |
Salaries and employee benefits | | | 16,113 | | | | 18,243 | | | | 13,241 | |
Occupancy and equipment expense | | | 2,441 | | | | 2,457 | | | | 2,270 | |
Merger, integration and restructuring expense | | | 379 | | | | (21 | ) | | | 121 | |
Other operating expense | | | 11,293 | | | | 9,999 | | | | 9,509 | |
Total expenses | | | 48,988 | | | | 46,238 | | | | 45,925 | |
Income before income taxes and equity in undistributed net income of subsidiaries | | | 102,314 | | | | 93,681 | | | | 62,409 | |
Income tax benefit | | | (8,735 | ) | | | (375 | ) | | | (9,062 | ) |
Income before equity in undistributed net income of subsidiaries | | | 111,049 | | | | 94,056 | | | | 71,471 | |
Equity in undistributed net income of bank subsidiaries | | | 60,796 | | | | 80,396 | | | | 72,794 | |
Equity in undistributed net income of non-bank subsidiaries | | | 10,718 | | | | 19,903 | | | | 12,352 | |
Net Income | | $ | 182,563 | | | $ | 194,355 | | | $ | 156,617 | |
61
Notes to Consolidated Financial Statements
(Dollars and shares in thousands, except per share data)
Note 23Condensed Parent Company Financial Information (continued)
Condensed Parent Company Statements of Cash Flows
| | | | | | | | | | | | |
For years ended December 31, | | | 2005 | | | | 2004 | | | | 2003 | |
Operating Activities | | | | | | | | | | | | |
Net income | | $ | 182,563 | | | $ | 194,355 | | | $ | 156,617 | |
Adjustments to reconcile net income to net cash from operating activities: | | | | | | | | | | | | |
Equity in undistributed net income of bank subsidiaries | | | (60,796 | ) | | | (80,396 | ) | | | (72,794 | ) |
Equity in undistributed net income of non-bank subsidiaries | | | (10,718 | ) | | | (19,903 | ) | | | (12,352 | ) |
Depreciation and amortization | | | 1,108 | | | | 1,068 | | | | 969 | |
Stock-based compensation expense | | | 2,300 | | | | – | | | | – | |
Net gain on sales of assets | | | (1,039 | ) | | | (5,598 | ) | | | (535 | ) |
Net change in other assets and liabilities | | | (36,612 | ) | | | 8,779 | | | | (947 | ) |
Net cash from operating activities | | | 76,806 | | | | 98,305 | | | | 70,958 | |
Investing Activities | | | | | | | | | | | | |
Capital return (contributions) to non-bank subsidiaries | | | – | | | | 8,000 | | | | (6,520 | ) |
Loan to subsidiary | | | – | | | | (9,880 | ) | | | (27,065 | ) |
Collection of loans from subsidiaries | | | – | | | | 62,359 | | | | 11,901 | |
Securities: | | | | | | | | | | | | |
Proceeds from maturities and payments | | | 4,379 | | | | 9,000 | | | | 753 | |
Proceeds from sales | | | 9,941 | | | | 17,699 | | | | 12,427 | |
Purchases | | | (2,000 | ) | | | (6,881 | ) | | | (5,491 | ) |
Purchases of premises and equipment | | | (235 | ) | | | (867 | ) | | | (526 | ) |
Net cash paid in acquisitions | | | (7,358 | ) | | | (14,406 | ) | | | (7,970 | ) |
Net cash provided by (used in) investing activities | | | 4,727 | | | | 65,024 | | | | (22,491 | ) |
Financing Activities | | | | | | | | | | | | |
Proceeds from issuance of debt | | | – | | | | 63,550 | | | | 84,310 | |
Repayment of debt | | | – | | | | (40,059 | ) | | | (42,119 | ) |
Repayment of short-term line of credit | | | – | | | | (61,000 | ) | | | – | |
Proceeds from issuance of common stock | | | 13,773 | | | | 19,929 | | | | 10,869 | |
Cash dividends and fractional shares paid | | | (93,659 | ) | | | (80,731 | ) | | | (71,008 | ) |
Treasury stock purchases | | | (52,407 | ) | | | (1,588 | ) | | | – | |
Other items | | | – | | | | (1,214 | ) | | | 261 | |
Net cash used in financing activities | | | (132,293 | ) | | | (101,113 | ) | | | (17,687 | ) |
Net change in cash and due from banks | | | (50,760 | ) | | | 62,216 | | | | 30,780 | |
Cash and due from banks at beginning of year | | | 94,920 | | | | 32,704 | | | | 1,924 | |
Cash and due from banks at end of year | | $ | 44,160 | | | $ | 94,920 | | | $ | 32,704 | |
62
Note 24Other Matters
Legal Matters
In re Commercial Money Center, Inc. Equipment Lease Litigation in the U. S. District Court for the Northern District of Ohio, Eastern Division, MDL Case No. 1:02-CV-16000
Between August 2000 and December 2001, Sky Bank and two of its predecessor banks provided financing to a commercial borrower and its affiliated entities for the purchase of six separate portfolios of commercial lease pools, and a warehouse line of credit to finance lease pools. These loans are secured by assignments of the payment streams from the underlying leases, surety bonds or insurance policies, and a limited guarantee from the sole member of the commercial borrower.
Upon default of these commercial loans, Sky Bank (and its predecessors) made demand for payment from Illinois Union Insurance Company (“IU”), RLI Insurance Company (“RLI”), and Royal Indemnity Company (“Royal”) under the relevant surety bonds and insurance policies. IU, RLI, and Royal (collectively, the “Sureties”) have failed to make the payments required under the surety bonds and insurance policies. As a result, in the spring of 2002, Sky and its predecessors filed suit against each of the Sureties seeking to enforce Sky Bank’s rights under the surety bonds and insurance policies issued by the Sureties in connection with the commercial lease pools. Sky’s complaints claim breach of contract, bad faith and allege that the Sureties are liable for the payments due to Sky under the terms of the bonds and are estopped from asserting fraud as a defense to paying any claims under the bonds. In October, 2002, the suits were consolidated for pretrial purposes with more than 35 other lawsuits involving similar claims in the United States District Court for the Northern District of Ohio, Eastern Division, under the Federal Multi-district Litigation (“MDL”) Rules.
The key defense of the Sureties in denying Sky Bank’s claims under the surety bonds is that they were fraudulently induced by the originator of the commercial leases to issue the surety bonds in the first instance. The Sureties have also asserted related defenses that the underlying equipment leases are invalid, usurious, or otherwise unenforceable. Sky Bank believes that none of these defenses can defeat Sky Bank’s claims under the surety bonds, which, in the view of Sky Bank, provide for absolute and unconditional guarantees of payment. Moreover, Sky Bank believes that the Sureties are responsible to Sky Bank, as the Obligee or Named Insured under the bonds, for the underwriting of the lessees and leases, including all issues of fraud, and that the Sureties waived any defense of fraud to claims under the bonds.
On January 31, 2003, Sky Bank and the other Claimants in the MDL Proceeding (MDL 02CV16000, Docket No. 1490) filed a consolidated Motion for Judgment on the Pleadings (the “Motion”) seeking a determination that the Sureties are liable, as a matter of law, under the relevant surety bonds and insurance policies. On August 19, 2005, the MDL Court issued two orders relating to the Motions. The first order granted the Motion with respect to Sky Bank’s insurance policies with IU, finding that the bank is the obligee under the contracts and that IU is precluded from asserting the defense of fraudulent inducement. The second order denied the bank’s Motion with respect to the surety bonds issued by Royal and RLI, indicating that the resolution of the claims requires examination of evidence beyond the limited materials the MDL Court is permitted to consider in the Motion.
On December 21, 2005, Sky sold and assigned to a third party, without recourse, all of its rights and interests in three loans secured by commercial lease pools and surety bonds issued by Royal. Sky considers the matter with Royal as concluded, and has no further litigation pending against Royal relating to these loans. On January 24, 2006, in conjunction with mediation proceedings ordered by the MDL court, Sky and IU agreed to settle its litigation pertaining to two loans secured by pools of leases and insurance policies issued by IU. The aggregate principal balance of the three loans sold to a third party and the two loans, which were settled, was $14.2 million, and the aggregate proceeds received by Sky in the sale and settlement was $14.9 million.
With respect to the remaining pool and the warehouse line of credit secured by surety bonds issued by RLI, which has a remaining principal balance of $15.4 million, Sky expects to proceed with amending its complaint and preparing for trial.
Sky Financial has reviewed the relevant matters of fact and law with its special counsel and believes that it has substantial and meritorious claims against the Sureties. Sky Financial has and will continue to vigorously assert all the rights and remedies available to it to obtain payment under the bonds. While the ultimate outcome of this matter cannot be determined at this time, Sky Financial management does not believe that the outcome of these pending legal proceedings will materially affect the consolidated financial position or results of operations of Sky Financial.
Sky Financial and its affiliates are, from time to time, involved in various lawsuits and claims which arise in the normal course of business. Some of these proceedings seek relief or damages that are substantial, and in some instances are filed as class actions. Nonetheless, based upon the advice of counsel, management is of the opinion that any liabilities that may result from these lawsuits and claims will not have a material adverse effect on the consolidated financial position or results of operations of Sky Financial.
Cash and Due from Banks
Sky Financial’s subsidiary bank is required to have cash on hand or on deposit with the Federal Reserve Bank to meet its regulatory reserve requirements. The reserve requirements at December 31, 2005 and 2004 was $59,109 and $59,421, respectively. These balances do not earn interest.
Treasury Shares
Included in treasury shares at December 31, 2005 and 2004 are 11 and 18, respectively, of shares held in rabbi trusts for certain employees of Sky Financial.
63
Notes to Consolidated Financial Statements
(Dollars and shares in thousands, except per share data)
Note 25 Quarterly Financial Information (Unaudited)
| | | | | | | | | | | | |
| | | First | | Second | | Third | | Fourth |
2005(1) | | | | | | | | | | | | |
Total interest income | | $ | 191,594 | | $ | 203,029 | | $ | 212,358 | | $ | 223,243 |
Net interest income | | | 124,007 | | | 128,000 | | | 130,419 | | | 132,226 |
Provision for credit losses | | | 30,823 | | | 5,894 | | | 8,725 | | | 6,807 |
Income from continuing operations | | | 30,719 | | | 47,786 | | | 50,345 | | | 53,341 |
Income from discontinued operations | | | – | | | – | | | – | | | 372 |
Net income(2) | | | 30,719 | | | 47,786 | | | 50,345 | | | 53,713 |
Basic earnings per share: | | | | | | | | | | | | |
Income from continuing operations | | | 0.29 | | | 0.45 | | | 0.47 | | | 0.49 |
Income from discontinued operations | | | – | | | – | | | – | | | 0.00 |
Net income | | | 0.29 | | | 0.45 | | | 0.47 | | | 0.50 |
Diluted earnings per share: | | | | | | | | | | | | |
Income from continuing operations | | | 0.29 | | | 0.45 | | | 0.46 | | | 0.49 |
Income from discontinued operations | | | – | | | – | | | – | | | 0.00 |
Net income | | | 0.29 | | | 0.45 | | | 0.46 | | | 0.49 |
2004 | | | | | | | | | | | | |
Total interest income | | $ | 149,021 | | $ | 148,027 | | $ | 178,772 | | $ | 186,123 |
Net interest income | | | 101,803 | | | 102,687 | | | 122,516 | | | 124,305 |
Provision for credit losses | | | 6,665 | | | 11,020 | | | 8,360 | | | 11,615 |
Income from continuing operations | | | 39,952 | | | 40,201 | | | 46,148 | | | 48,899 |
Income from discontinued operations | | | 18,725 | | | – | | | – | | | 430 |
Net income(3) | | | 58,677 | | | 40,201 | | | 46,148 | | | 49,329 |
Basic earnings per share: | | | | | | | | | | | | |
Income from continuing operations | | | 0.43 | | | 0.43 | | | 0.44 | | | 0.46 |
Income from discontinued operations | | | 0.20 | | | – | | | – | | | 0.00 |
Net income | | | 0.63 | | | 0.43 | | | 0.44 | | | 0.47 |
Diluted earnings per share: | | | | | | | | | | | | |
Income from continuing operations | | | 0.42 | | | 0.43 | | | 0.43 | | | 0.46 |
Income from discontinued operations | | | 0.20 | | | – | | | – | | | 0.00 |
Net income | | | 0.62 | | | 0.43 | | | 0.43 | | | 0.46 |
| (1) | During the fourth quarter of 2005, Sky Financial adopted FAS 123(R). Sky Financial adopted FAS 123(R) using the modified retrospective method and restated the first three interim quarters of 2005 using the pro forma expense originally disclosed in those quarters; 2004 and previous years have not been restated on a GAAP basis. As such, the first three quarters presented above have been restated from the amounts originally reported to include expense related to stock options. The additional salary and employee benefits expense was recorded as follows: (1) first quarter - $1.2 million ($0.8 million after tax); (2) second quarter - $1.1 million ($0.7 million after tax); (3) third quarter - $1.0 million ($0.7 million after tax); and (4) fourth quarter - $0.8 million ($0.6 million after tax). |
| (2) | The second, third and fourth quarters of 2005 reflect the impact of merger, integration and restructuring charges after tax of $670, $79 and $402, respectively. |
| (3) | The first, third and fourth quarters of 2004 reflect the impact of merger, integration and restructuring charges after tax of $225, $2,490 and $237, respectively. |
64
Note 26Sale of Sky Financial Solutions, Inc. and Presentation as Discontinued Operations
| | |
On March 31, 2004, Sky Financial completed the sale of its dental financing affiliate, Sky Financial Solutions (SFS). SFS is reported as a discontinued operation. For the year ended December 31, 2005, Sky Financial recorded additional pretax gain of $572 for the adjustment of certain contingencies related to the sale. This gain was recorded as after tax income from discontinued operations. SFS results of operations included revenues of $39,356 and $32,969 and pre-tax net income of $29,503 and $6,242 for 2004 and 2003, respectively. SFS was sold to MBNA on March 31, 2004 for $84,716. The closing equity of SFS was $50,242, resulting in an initial gain of $34,474. Sky Financial incurred an additional $3,234 in professional fees and other contractual obligations related to the transaction for a final calculated pre-tax gain of $31,240. Separately, in 2004 Sky Financial recorded merger, integration and restructuring costs of $346 related primarily to employee costs. A separate asset transfer agreement included $115,975 in Sky Bank portfolio loans, which represent unique products offered by Sky Bank to accommodate SFS clients. These loans were sold to MBNA at par value. The SFS sales agreement contains a contingency based upon future charge-offs that may result in an adjustment to increase or decrease the sales price in future periods. Based on historical experience and expected future performance, management does not believe that this provision will have a significant impact on future earnings, cash flows or financial position. | | |
65
Item 9.Changes in and Disagreements with Accountants on Accounting and Financial Disclosure
None
Item 9A.Controls and Procedures
Sky Financial’s management carried out an evaluation, under the supervision and with the participation of the chief executive officer and the chief financial officer, of the effectiveness of the design and operation of Sky Financial’s disclosure controls and procedures (as such term is defined in Rules 13a-15(e) and 15d-15(e) under the Exchange Act) as of December 31, 2005, pursuant to Exchange Act Rule 13a-15. Based upon that evaluation, the chief executive officer along with the chief financial officer concluded that Sky Financial’s disclosure controls and procedures as of December 31, 2005, are effective in timely alerting them to material information relating to Sky Financial (including its consolidated subsidiaries) required to be included in Sky Financial’s periodic filings under the Exchange Act.
Management’s Report on Internal Control Over Financial Reporting
The management of Sky Financial Group is responsible for establishing and maintaining adequate internal control over financial reporting. Sky Financial’s internal control over financial reporting is a process designed under the supervision of the company’s chief executive officer and chief financial officer to provide reasonable assurance regarding the reliability of financial reporting and the preparation of the company’s financial statements for external reporting purposes in accordance with U.S. generally accepted accounting principles.
Sky Financial’s management assessed the effectiveness of the company’s internal control over financial reporting as of December 31, 2005 based on the criteria set forth by the Committee of Sponsoring Organizations of the Treadway Commission (COSO) in “Internal Control-Integrated Framework.” Based on the assessment, management determined that, as of December 31, 2005, the company’s internal control over financial reporting is effective, based on those criteria. Management’s assessment of the effectiveness of the company’s internal control over financial reporting as of December 31, 2005 has been audited by Deloitte & Touche LLP, an independent registered public accounting firm, as stated in their report appearing on page 67.
| | |
| |  |
| Marty E. Adams | | Kevin T. Thompson |
Chairman, President and Chief Executive Officer February 21, 2006 | | Executive Vice President and Chief Financial Officer
February 21, 2006 |
Changes in Internal Control over Financial Reporting
There have not been any changes in Sky Financial’s internal control over financial reporting (as defined in Exchange Act Rules 13a-15(f) that occurred during Sky Financial’s most recent fiscal quarter that have materially affected, or are reasonably likely to materially affect, Sky Financial’s internal control over financial reporting.
66
Report of Independent Registered Public Accounting Firm
To the Board of Directors and Shareholders of Sky Financial Group, Inc.
Bowling Green, Ohio
We have audited management’s assessment, included in the accompanying Management’s Report on Internal Control Over Financial Reporting, that Sky Financial Group, Inc. and subsidiaries (the “Company”) maintained effective internal control over financial reporting as of December 31, 2005, based on criteria established inInternal Control-Integrated Framework issued by the Committee of Sponsoring Organizations of the Treadway Commission. The Company’s management is responsible for maintaining effective internal control over financial reporting and for its assessment of the effectiveness of internal control over financial reporting. Our responsibility is to express an opinion on management’s assessment and an opinion on the effectiveness of the Company’s internal control over financial reporting based on our audit.
We conducted our audit in accordance with the standards of the Public Company Accounting Oversight Board (United States). Those standards require that we plan and perform the audit to obtain reasonable assurance about whether effective internal control over financial reporting was maintained in all material respects. Our audit included obtaining an understanding of internal control over financial reporting, evaluating management’s assessment, testing and evaluating the design and operating effectiveness of internal control, and performing such other procedures as we considered necessary in the circumstances. We believe that our audit provides a reasonable basis for our opinions.
A company’s internal control over financial reporting is a process designed by, or under the supervision of, the company’s principal executive and principal financial officers, or persons performing similar functions, and effected by the company’s board of directors, management, and other personnel to provide reasonable assurance regarding the reliability of financial reporting and the preparation of financial statements for external purposes in accordance with generally accepted accounting principles. A company’s internal control over financial reporting includes those policies and procedures that (1) pertain to the maintenance of records that, in reasonable detail, accurately and fairly reflect the transactions and dispositions of the assets of the company; (2) provide reasonable assurance that transactions are recorded as necessary to permit preparation of financial statements in accordance with generally accepted accounting principles, and that receipts and expenditures of the company are being made only in accordance with authorizations of management and directors of the company; and (3) provide reasonable assurance regarding prevention or timely detection of unauthorized acquisition, use, or disposition of the company’s assets that could have a material effect on the financial statements.
Because of the inherent limitations of internal control over financial reporting, including the possibility of collusion or improper management override of controls, material misstatements due to error or fraud may not be prevented or detected on a timely basis. Also, projections of any evaluation of the effectiveness of the internal control over financial reporting to future periods are subject to the risk that the controls may become inadequate because of changes in conditions, or that the degree of compliance with the policies or procedures may deteriorate.
In our opinion, management’s assessment that the Company maintained effective internal control over financial reporting as of December 31, 2005, is fairly stated, in all material respects, based on the criteria established inInternal Control-Integrated Frameworkissued by the Committee of Sponsoring Organizations of the Treadway Commission. Also in our opinion, the Company maintained, in all material respects, effective internal control over financial reporting as of December 31, 2005, based on the criteria established inInternal Control-Integrated Framework issued by the Committee of Sponsoring Organizations of the Treadway Commission.
We have also audited, in accordance with the standards of the Public Company Accounting Oversight Board (United States), the consolidated financial statements as of and for the year ended December 31, 2005 of the Company and our report dated February 21, 2006 expressed an unqualified opinion on those financial statements and included an explanatory paragraph regarding the adoption of Statement of Financial Accounting Standards No. 123(R),Share-Based Payment, in 2005.
Deloitte & Touche LLP
Cleveland, Ohio
February 21, 2006
67
Item 9B.Other Information
None
PART III
Item 10.Directors and Executive Officers of Registrant
The information contained under the captions “Election of Directors,” “Beneficial Ownership of the Company’s Common Stock,” and “Section 16(a) Beneficial Ownership Reporting Compliance” of Sky Financial’s 2006 Proxy Statement filed with the Securities and Exchange Commission is incorporated herein by reference in response to this item.
Ethics Policy and Code of Ethics
Sky Financial’s Ethics Policy, which is applicable to all directors, officers and employees of the company, and its Code of Ethics for Senior Financial Officers, which is applicable to the principal executive officer, the principal financial officer and the principal accounting officer, are each available on the Investor Relations section of the company’s website (www.skyfi.com). A copy of the Ethics Policy and Code of Ethics is also available in print to share owners upon request, addressed to the Corporate Secretary at Sky Financial Group, 221 South Church Street, Bowling Green, OH 43402. Sky Financial intends to post amendments to or waivers from its Code of Ethics on its website.
Item 11.Executive Compensation
The information contained under the captions “Executive Compensation” and “Compensation Committee Report on Executive Compensation” of Sky Financial’s 2006 Proxy Statement filed with the Securities and Exchange Commission is incorporated herein by reference in response to this item.
Item 12.Security Ownership of Certain Beneficial Owners and Management
The information contained under the captions “Election of Directors,” “Beneficial Ownership of the Company’s Common Stock” and “Executive Compensation” of Sky Financial’s 2006 Proxy Statement filed with the Securities and Exchange Commission is incorporated herein by reference in response to this item.
Securities Authorized for Issuance under Equity Compensation Plans
The following table provides information as of December 31, 2005, regarding compensation plans under which equity securities of Sky Financial are authorized for issuance:
| | | | | | |
| Equity Compensation Plan Information |
Plan Category | | Number of Securities to be
Issued upon Exercise of
Outstanding Options,
Warrants, and Rights(1) | | Weighted-Average
Exercise Price of
Outstanding Options
Warrants, and Rights | | Number of Securities
Remaining Available
for Future Issuance
Under Equity Compensation
Plans (Excluding Securities
Reflected in Column (a)) |
| | | (a) | | (b) | | (c) |
| | | (In thousands) | | | | (In thousands) |
Equity Compensation Plans Approved by Security Holders | | 6,982 | | $21.47 | | 2,424 |
Equity Compensation Plans not Approved by Security Holders | | – | | – | | – |
Total | | 6,982 | | $21.47 | | 2,424 |
(1) Represents options to purchase shares of Sky Financial common stock and stock appreciation rights. There are no outstanding warrants.
Item 13.Certain Relationships and Related Transactions
The information contained under the caption “Certain Transactions and Relationships” of Sky Financial’s 2006 Proxy Statement filed with the Securities and Exchange Commission is incorporated herein by reference in response to this item.
Item 14.Principal Accounting Fees and Services
The information contained under the caption “Audit Committee Report” of Sky Financial’s 2006 Proxy Statement filed with the Securities and Exchange Commission is incorporated herein by reference in response to this item.
68
PART IV
Item 15.Exhibits and Financial Statement Schedules
(a) The following documents are filed as part of this report:
(b) The following exhibits required by Item 601 of Regulation S-K are filed as part of this report:
FORM 10-K EXHIBIT INDEX
| | |
Exhibit
Number | | Exhibit |
| |
| 3.1 | | Sky Financial’s Seventh Amended and Restated Articles of Incorporation (incorporated by reference from Exhibit 3 of the Form 10-Q of Sky Financial for the quarterly period ended March 31, 2004 filed as of May 10, 2004) |
| 3.2 | | Sky Financial’s Amended and Restated Code of Regulations (incorporated by reference from Exhibit 3.2 of the Form 10-K of Sky Financial for the year ended December 31, 2001 filed as of March 27, 2002) |
| 4.1 | | Shareholder Rights Agreement dated as of July 21, 1998, between Sky Financial and The Citizens Banking Company, as Rights Agent (incorporated by reference from Exhibit 4 of Form S-4 Registration Statement No. 333-60741 of Sky Financial) |
| 10.1 | | Sky Financial’s Amended and Restated 1998 Stock Option Plan for Nonemployee Directors (incorporated by reference from Exhibit 4(d) of the Form S-8 Registration Statement No. 333-59312 of Sky Financial) |
| 10.2 | | Sky Financial’s 1998 Stock Option Plan for Employees (incorporated by reference from Appendix H of the Joint Proxy Statement/Prospectus in Form S-4 Registration Statement No. 333-60741 of Sky Financial) |
| 10.3 | | Sky Financial’s 2002 Stock Option and Stock Appreciation Rights Plan (incorporated by reference from Exhibit 10.3 of the Form 10-K of Sky Financial for the year ended December 31, 2002 filed as of March 3, 2003) |
| 10.4 | | Sky Financial’s 2004 Restricted Stock Plan (incorporated by reference from Appendix B of the Proxy Statement of Sky Financial for 2004 Annual Meeting of Shareholders filed as of March 4, 2004) |
| 10.5 | | Form of Indemnification Agreement between Sky Financial and individual directors and certain officers (incorporated by reference from Exhibits 99.1, 99.2 and 99.3 of Sky Financial’s Current Report on Form 8-K filed as of February 2, 2005) |
| 10.6 | | Employment Agreement between Sky Financial and Marty E. Adams dated March 1, 2004 (incorporated by reference from Exhibit 10.1 of Form 10-Q of Sky Financial for the quarterly period ended June 30, 2004 filed August 5, 2004) |
| 10.7 | | Employment Agreement by and among Sky Financial, The Citizens Banking Company and Frank J. Koch (incorporated by reference from Exhibit 10.11 to the Form 10-K of Sky Financial for the year ended December 31, 1998 filed as of March 16,1999) |
| 10.8 | | Form of Employment Agreement between Sky Financial and certain officers of Sky Financial, including Kevin T. Thompson, W. Granger Souder, Jr. and Les V. Starr. (incorporated by reference to Exhibit 10.10 to the Form 10-K of Sky Financial for the year ended December 31, 2002 filed as of March 3, 2003) and Amendment No 1 of the Employment Agreement dated November 25, 2005 (incorporated by reference from Item 1.01 of Sky Financial’s Current Report on Form 8-K filed as of November 25, 2005) |
| 10.9 | | Sky Financial’s Amended and Restated Profit Sharing, 401(k) and Employee Stock Ownership Pension Plan (incorporated by reference from Exhibit 10.9 to the Form 10-K of Sky Financial for the year ended December 31, 2004 filed as of February 22, 2005) |
| 10.10 | | First Amendment of the Sky Financial Group, Inc. Amended and Restated Profit Sharing and 401(k) Plan (incorporated by reference from Exhibit 10.10 to the Form 10-K of Sky Financial for the year ended December 31, 2004 filed as of February 22, 2005) |
| 10.11 | | Second Amendment of the Sky Financial Group, Inc. Amended and Restated Profit Sharing, 401(k) and Employee Stock Ownership Pension Plan (incorporated by reference from Exhibit 10.11 to the Form 10-K of Sky Financial for the year ended December 31, 2004 filed as of February 22, 2005) |
69
| | |
Exhibit
Number | | Exhibit |
| |
| 10.12 | | Third Amendment of the Sky Financial Group, Inc. Amended and Restated Profit Sharing, 401(k) and Employee Stock Ownership Pension Plan (incorporated by reference from Exhibit 10.12 to the Form 10-K of Sky Financial for the year ended December 31, 2004 filed as of February 22, 2005) |
| 10.13 | | Sky Financial’s Non-Qualified Retirement Plan (incorporated by reference from Exhibit 10.3 of the Form 10-K of Sky Financial for the year ended December 31, 2001 filed as of March 27, 2002) |
| 10.14 | | Fourth Amendment of the Sky Financial Group, Inc. Non-Qualified Retirement Plan (As Amended and Restated Effective January 1, 2001) (incorporated by reference from Exhibit 10.19 to the Form 10-K of Sky Financial for the year ended December 31, 2002 filed as of March 3, 2003) |
| 10.15 | | Fifth Amendment of the Sky Financial Group, Inc. Non-Qualified Retirement Plan (As Amended and Restated Effective January 1, 2001) (incorporated by reference from Exhibit 10.20 to the Form 10-K of Sky Financial for the year ended December 31, 2002 filed as of March 3, 2003) |
| 10.16 | | Sixth Amendment of the Sky Financial Group, Inc. Non-Qualified Retirement Plan (incorporated by reference from Exhibit 10.16 to the Form 10-K of Sky Financial for the year ended December 31, 2004 filed as of February 22, 2005) |
| 10.17 | | Three Rivers Bank and Trust Company Pension Trust (as Amended and Restated Effective January 1, 1997) - (incorporated by reference to Exhibit 10.21 from the Form 10-K of Sky Financial for the year ended December 31, 2002 filed as of March 3, 2003) |
| 10.18 | | Second Amendment to the Three Rivers Bank and Trust Company Pension Trust (as Amended and Restated Effective January 1, 1997) (incorporated by reference from Exhibit 10.22 to the Form 10-K of Sky Financial for the year ended December 31, 2002 filed as of March 3, 2003) |
| 10.19 | | Second National Bank Defined Benefit Plan (incorporated by reference from Exhibit 10.19 to the Form 10-K of Sky Financial for the year ended December 31, 2004 filed as of February 22, 2005) |
| 10.20 | | Pennsylvania Capital Bank 401(k) Plan (incorporated by reference from Exhibit 10.20 to the Form 10-K of Sky Financial for the year ended December 31, 2004 filed as of February 22, 2005) |
| 10.21 | | Sky Financial Group, Inc. Annual Incentive Compensation Program, Master Plan Description |
| 10.22 | | Form of Option Agreement, 1998 Stock Option Plan for Employees |
| 10.23 | | Form of Option Agreement, 1998 Stock Option Plan for Directors, as amended |
| 10.24 | | Form of Option Agreement, 2002 Stock Option Plan & Stock Appreciation Rights Plan |
| 10.25 | | Form of Restricted Stock Award Agreement, 2004 Restricted Stock Plan |
| 10.26 | | First Amendment of the Sky Financial Group, Inc. 2004 Restricted Stock Plan |
| 10.27 | | Second Amendment of the Sky Financial Group, Inc. 2004 Restricted Stock Plan |
| 10.28 | | Third Amendment of the Sky Financial Group, Inc. 2004 Restricted Stock Plan |
| 10.29 | | Fourth Amendment of the Sky Financial Group, Inc. Amended and Restated Profit Sharing, 401(k) and Employee Stock Ownership Plan |
| 10.30 | | Fifth Amendment of the Sky Financial Group, Inc. Amended and Restated Profit Sharing, 401(k) and Employee Stock Ownership Plan |
| 10.31 | | Sixth Amendment of the Sky Financial Group, Inc. Amended and Restated Profit Sharing, 401(k) and Employee Stock Ownership Plan |
| 10.32 | | Seventh Amendment of the Sky Financial Group, Inc. Amended and Restated Profit Sharing, 401(k) and Employee Stock Ownership Plan |
| 10.33 | | Seventh Amendment of the Sky Financial Group, Inc. Non-Qualified Retirement Plan |
| 10.34 | | First Amendment to the Sky Financial Group, Inc. 2002 Stock Option and Stock Appreciation Rights Plan |
| 11.1 | | Statement Re: Computation of Per Share Earnings (incorporated by reference from the information contained in Note 13 “Earnings Per Common Share” on page 52 of Sky Financial’s 2005 Annual Report on Form 10-K) |
| 14.1 | | Code of Ethics for Senior Financial Officers (filed as Exhibit 14.2 from Registrant’s Current Report on Form 8-K filed on July 31, 2003, and incorporated herein by reference) |
| 20.1 | | Sky Financial’s Proxy Statement for its 2006 Annual Meeting (incorporated by reference from the information contained in Sky Financial’s 2006 Proxy Statement) |
| 21.1 | | Subsidiaries of Sky Financial |
| 23.1 | | Consent of Deloitte & Touche LLP |
| 24.1 | | Power of Attorney |
| 31.1 | | Rule 13a-14(a)/15-d-14(a) Certification of Chief Executive Officer |
| 31.2 | | Rule 13a-14(a)/15-d-14(a) Certification of Chief Financial Officer |
| 32.1 | | Section 1350 Certification of Chief Executive Officer |
| 32.2 | | Section 1350 Certification of Chief Financial Officer |
70
Signatures
Pursuant to the requirements of Section 13 or 15(d) of the Securities Exchange Act of 1934, the registrant has duly caused this report to be signed on its behalf by the undersigned, thereunto duly authorized.
| | |
| SKY FINANCIAL GROUP, INC. |
| |
| By: | | /s/ Kevin T. Thompson |
| | | Kevin T. Thompson |
| | | Executive Vice President and Chief Financial Officer (Principal Financial Officer and Principal Accounting Officer) |
| | | February 21, 2006 |
Pursuant to the requirement of the Securities Exchange Act of 1934, this report has been signed below by the following persons on behalf of the Registrant and in the capacities and on the date indicated.
| | |
| Signatures | | |
| |
| Marty E. Adams* | | Gerard P. Mastroianni* |
| Director/Chairman/President/CEO | | Director |
| February 21, 2006 | | February 21, 2006 |
| |
| Kevin T. Thompson* | | Thomas J. O’Shane |
| Executive Vice President/CFO | | Director |
| February 21, 2006 | | February 21, 2006 |
| |
| George N. Chandler II* | | Gregory L. Ridler* |
| Director | | Director |
| February 21, 2006 | | February 21, 2006 |
| |
| Robert C. Duvall* | | Emerson J. Ross, Jr.* |
| Director | | Director |
| February 21, 2006 | | February 21, 2006 |
| |
| Marylouise Fennell* | | C. Gregory Spangler* |
| Director | | Director |
| February 21, 2006 | | February 21, 2006 |
| |
| D. James Hilliker* | | Joseph N. Tosh II* |
| Director | | Director |
| February 21, 2006 | | February 21, 2006 |
| |
| Fred H. “Sam” Johnson III* | | R. John Wean III* |
| Director | | Director |
| February 21, 2006 | | February 21, 2006 |
| |
| Jonathan A. Levy* | | |
| Director | | |
| February 21, 2006 | | |
* The undersigned attorney-in-fact, by signing his name below, does hereby sign this Report on Form 10-K on behalf of the above-named officers and directors pursuant to a power of attorney executed by such persons and filed with the Securities and Exchange Commission contemporaneously herewith.
| | |
| By: | | /s/ Kevin T. Thompson |
| | | Kevin T. Thompson |
| | | Attorney-In-Fact |
71
Shareholder Information and Acknowledgements
Quarterly Common Stock Prices, Dividends and Yields
| | | | | | | | | | | | | | | |
| | | | High | | | Low | |
| Book
Value per
Share | |
| Dividend
per Share | | Dividend
Yield |
* |
2005 | | | | | | | | | | | | | | | |
Fourth quarter | | $ | 29.87 | | $ | 26.05 | | $ | 14.35 | | $ | 0.23 | | 3.26 | % |
Third quarter | | | 29.20 | | | 27.38 | | | 14.12 | | | 0.22 | | 3.10 | |
Second quarter | | | 29.06 | | | 25.45 | | | 13.97 | | | 0.22 | | 3.19 | |
First quarter | | | 28.95 | | | 25.50 | | | 13.31 | | | 0.22 | | 3.17 | |
2004 | | | | | | | | | | | | | | | |
Fourth quarter | | $ | 29.25 | | $ | 24.90 | | $ | 13.77 | | $ | 0.22 | | 3.21 | % |
Third quarter | | | 25.55 | | | 23.13 | | | 13.44 | | | 0.21 | | 3.43 | |
Second quarter | | | 26.23 | | | 23.00 | | | 11.13 | | | 0.21 | | 3.40 | |
First quarter | | | 27.81 | | | 24.35 | | | 11.46 | | | 0.21 | | 3.16 | |
2003 | | | | | | | | | | | | | | | |
Fourth quarter | | $ | 26.10 | | $ | 22.51 | | $ | 10.80 | | $ | 0.21 | | 3.40 | % |
Third quarter | | | 23.93 | | | 21.30 | | | 10.31 | | | 0.20 | | 3.50 | |
Second quarter | | | 22.00 | | | 18.63 | | | 10.16 | | | 0.20 | | 3.89 | |
First quarter | | | 21.00 | | | 18.75 | | | 9.67 | | | 0.20 | | 3.99 | |
Stock Information at December 31, 2005
| | |
| | | Common Stock |
Shares authorized | | 350,000,000 |
Shares issued | | 110,206,647 |
Treasury shares | | 1,899,046 |
Number of shareholders of record | | 20,599 |
Closing market price per share | | $27.82 |
Book value per share | | $14.35 |
Stock exchange | | NASDAQ |
Stock symbol | | SKYF |
| * | Calculated on average traded price for the quarter. |
Dividend Reinvestment Plan
|
| Sky Financial offers a Dividend Reinvestment Plan that allows shareholders to reinvest their Sky Financial Group, Inc. dividends in additional Company stock at the prevailing market price. The plan has 10,359 participants, or 50.3 percent of our shareholders of record. Plan information may be obtained by calling the shareholder relations department at (800) 576-5007 or by writing: Sky Financial Group, Inc. Dividend Reinvestment Plan, 10 East Main Street, Salineville, Ohio 43945. |
Acknowledgements
A special thanks to the following employees who helped produce this report:
| | | | |
| Tim Allison | | Jon Hallack | | John Reisner |
| Perry Atwood | | Greg Harris | | Laura Seifert |
| Sharon Burden | | Don Hileman | | Kelly Semer |
| Phil Clinard | | Chris Hizer | | Curtis Shepherd |
| Norma Cozette | | Deborah Krzeminski | | James Sigafoose |
| Diane Critchet | | Bob Malehorn | | Terry Sobczak |
| Vicky Dielman | | Tony Mazurek | | Granger Souder |
| Tim Dirrim | | Mike Moore | | Eric Stachler |
| Tony Eramo | | Julie Myers | | Jordan Stevens |
| Miguel Every | | Leslie Oswald | | Kevin Thompson |
| | | Michelle Pruitt | | Dave Walter |
| | | Tracey Reeder | | |
| | |
| | | Corporate Information |
| | | Annual Meeting |
| | | Place: Cleveland Marriott East |
| | | Cleveland, Ohio |
| | | Date: April 19, 2006 |
| | | Time: 10 a.m. |
| |
| | | Headquarters |
| | | Write: |
| | | Sky Financial Group, Inc. |
| | | 221 South Church Street |
| | | P. O. Box 428 |
| | | Bowling Green, Ohio 43402 |
| | | Telephone: (419) 327-6300 |
| |
| | | Shareholder Relations and |
| | | Form 10-K |
| | | Write: |
| | | Sky Financial Group, Inc. |
| | | Shareholder Relations |
| | | 10 East Main Street |
| | | Salineville, Ohio 43945 |
| | | Contact: |
| | | Tracey L. Reeder |
| | | VP/Shareholder Relations |
| | | Telephone: (800) 576-5007 |
| |
| | | Transfer Agent |
| | | Write: |
| | | The Bank of New York |
| | | Receive and Deliver |
| | | P. O. Box 11002 |
| | | Church Street Station |
| | | New York, New York 10286 |
| | | Telephone: (888) 683-4901 |
| |
| | | Online Information |
| | | More information concerning Sky Financial and its affiliates can be found on our website at www.skyfi.com. |
| |
| | | The following clients, shareholders and organizations assisted in the completion of this year’s annual report: |
| |
| | | Lesniewicz Associates – |
| | | Design and Copywriting |
| | | Flying Colors Press – |
| | | Printing |
72
Regionally Positioned for Performance
| | | | | | |
| | | Banking Greater Cleveland Region 30100 Chagrin Blvd. Pepper Pike, OH 44124 (216) 206-6000 Mahoning Valley Region 23 Federal Plaza Youngstown, OH 44503 (330) 742-7000 Mid Am Region 519 Madison Ave. Toledo, OH 43604 (419) 249-3300 Ohio Bank Region 236 S. Main St. Findlay, OH 45840 (419) 424-4000 Ohio Valley Region 10 E. Main St. Salineville, OH 43945 (330) 679-2328 Pittsburgh Region 336 Fourth Ave. Pittsburgh, PA 15222 (412) 227-6500 | | Western Reserve Region 4767 Munson St. NW Canton, OH 44718 (330) 498-4623 Western Pennsylvania Region 101 E. Washington St. New Castle, PA 16101 (724) 652-5511 Investment & Trust Services Sky Trust 30050 Chagrin Blvd., Suite 150 Pepper Pike, OH 44124 (216) 378-2810 Insurance Sky Insurance 1695 Indian Wood Circle Maumee, OH 43537 (419) 720-7900 | | 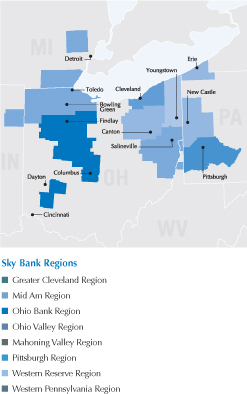
|
| | | 2005 Sky President’s Awards | |
| | | Each year Sky honors select employees for their outstanding and unselfish service to their community. Susie Bricker Agent Sky Insurance Rich Daugherty SVP/Commercial Lending Western Pennsylvania Region Ronald Earl SVP/Information Technology Kelly Faure Financial Center Manager Pittsburgh Region Lyndell Miller SVP/Business Development Sky Trust | | Brenda Mossing Financial Center Manager Mid Am Region Fran Riemer VP/Private Banking Greater Cleveland Region Doug Schaefer Financial Center Manager Ohio Valley Region Kim Sease Financial Center Manager Ohio Bank Region Patricia Shells Financial Center Manager Mahoning Valley Region Sheilah Smith Financial Center Manager Western Reserve Region | |
73
www.skyfi.com