the simple
truth
At PotashCorp, we believe accountability adds value
Our company has a critical role to play in meeting the growing global demand for food. But our opportunities and responsibilities don’t end there. They extend to our relationships with our customers, communities, employees and investors.
Each year, we set targets in line with our broader operating goals, then measure results and report our performance. By building accountability into our culture, we ensure our attention is focused on social, environmental and financial areas that are important to stakeholders.
Strong financial performance enables us to contribute to the long-term success of all our stakeholders. When we meet our broader responsibilities, we earn the support we need to grow our business and enhance our financial performance. It is a cycle of growth that benefits all.
Our 2009 Summary Accountability Report acknowledges these links, revealing the strategies and simple truths that drive our company.
Our Vision
Play a key role in the global food solution while building long-term value for all our stakeholders.
Profile
PotashCorp is the world’s largest fertilizer enterprise by capacity. We produce the three primary plant nutrients: potash, phosphate and nitrogen. Among these, potash – the main focus of our business – delivers the highest quality earnings. With large, low-cost operations, plans to significantly expand capacity, and strategic global investments, we believe we have an unmatched ability to meet the needs of North American and growing offshore potash markets.
Financial data in this report are stated in US dollars unless otherwise noted.
| | | |
02 | | 2009 financial highlights |
04 | | Factors that shaped our performance |
06 | | CEO letter |
10 | | Maximize shareholder value |
16 | | Be the supplier of choice |
20 | | Build strong relationships with our communities |
24 | | Attract and retain top talent |
28 | | Achieve no harm to people/environment |
32 | | Board of Directors |
33 | | Senior management |
34 | | Shareholder information |
2 2009 Summary Accountability Report
2009 Financial Performance Highlights
| | | | | | | | | | | | | | | | | | | | | |
| ($ millions, except per-share data and percentages) | | 2009 | | 2008 | | 2007 | | 2006 | | 2005 |
Financial Position | | | | | | | | | | | | | | | | | | | | |
| Current assets | | | 2,271.7 | | | | 2,267.2 | | | | 1,811.3 | | | | 1,310.2 | | | | 1,110.8 | |
| Property, plant & equipment | | | 6,413.3 | | | | 4,812.2 | | | | 3,887.4 | | | | 3,525.8 | | | | 3,262.8 | |
| Other long-term assets | | | 4,237.2 | | | | 3,169.4 | | | | 4,017.9 | | | | 1,381.0 | | | | 984.3 | |
| |
| Total assets | | | 12,922.2 | | | | 10,248.8 | | | | 9,716.6 | | | | 6,217.0 | | | | 5,357.9 | |
| |
| Current liabilities | | | 1,559.9 | | | | 2,615.8 | | | | 1,001.9 | | | | 1,103.5 | | | | 1,096.1 | |
| Long-term debt | | | 3,319.3 | | | | 1,739.5 | | | | 1,339.4 | | | | 1,357.1 | | | | 1,257.6 | |
| Other long-term liabilities | | | 1,542.3 | | | | 1,304.6 | | | | 1,356.6 | | | | 976.1 | | | | 871.7 | |
| Shareholders’ equity | | | 6,500.7 | | | | 4,588.9 | | | | 6,018.7 | | | | 2,780.3 | | | | 2,132.5 | |
| |
| Total liabilities & shareholders’ equity | | | 12,922.2 | | | | 10,248.8 | | | | 9,716.6 | | | | 6,217.0 | | | | 5,357.9 | |
| |
| | | | | | | | | | | | | | | | | | | | | |
Financial Results | | | | | | | | | | | | | | | | | | | | |
| Sales | | | 3,976.7 | | | | 9,446.5 | | | | 5,234.2 | | | | 3,766.7 | | | | 3,847.2 | |
| Gross margin – Potash | | | 730.4 | | | | 3,055.5 | | | | 912.3 | | | | 561.1 | | | | 707.4 | |
| Gross margin – Phosphate | | | 103.8 | | | | 1,114.5 | | | | 432.8 | | | | 125.3 | | | | 98.9 | |
| Gross margin – Nitrogen | | | 191.8 | | | | 737.4 | | | | 536.1 | | | | 315.6 | | | | 318.7 | |
| |
| Total gross margin | | | 1,026.0 | | | | 4,907.4 | | | | 1,881.2 | | | | 1,002.0 | | | | 1,125.0 | |
| |
| Net income | | | 987.8 | | | | 3,495.2 | | | | 1,103.6 | | | | 631.8 | | | | 542.9 | |
| Net income per share – diluted | | | 3.25 | | | | 11.01 | | | | 3.40 | | | | 1.98 | | | | 1.63 | |
| Cash provided by operating activities | | | 923.9 | | | | 3,013.2 | | | | 1,688.9 | | | | 696.8 | | | | 865.1 | |
| |
| Additions to property, plant & equipment | | | 1,763.8 | | | | 1,198.3 | | | | 607.2 | | | | 508.6 | | | | 382.7 | |
| |
Financial Performance Highlights 3
| | | |
 Potash leads gross margin despite historically low sales volumes Potash leads gross margin despite historically low sales volumesPotash continues to drive our results. Even in a year when volumes declined by 65 percent, potash accounted for 71 percent of our total gross margin. 1.76 $ billionOur continued commitment to growthIn 2009, we spent $1.76 billion on property, plant and equipment, primarily on our potash capacity expansion projects. Despite the global credit crisis, we successfully issued $2 billion of senior notes, demonstrating the value of our long-term financial strength and providing flexibility for our future performance. | | 988 $ million
Third-highest net income in year of severe global economic downturn
PotashCorp’s 2009 net income was $988 million, our third-strongest year ever despite significantly lower potash volumes and reduced margins in all three nutrients.
Steadfastly matching production to market demand
With an unprecedented drop in potash sales volumes in 2009, we produced at approximately 30 percent of operational capability — illustrating the depth of our strategic commitment to matching production to market demand, even in extreme conditions. |
Source: PotashCorp
4 2009 Summary Accountability Report
Factors That Shaped Our Performance
2009
A cautious start...
The financial turmoil of 2009 had a profound impact on all aspects of our business. As economies contracted and uncertainty increased worldwide, commodity markets grew more volatile amid a climate of extreme consumer caution.
| • | | Grain and fertilizer prices — particularly for nitrogen and phosphate — declined substantially. These price drops prompted farmers and fertilizer distributors to be more conservative about spending. |
| |
| • | | Potash use fell by more than 20 percent as farmers continued to grow crops, mining residual nutrients from the soil. Phosphate use dropped by about 10 percent. The decline in nitrogen was less dramatic, as nitrogen is not retained in the soil and must be replaced each season. |
| |
| • | | Farmer caution led potash buyers to withhold purchases, drawing down global distributor inventories and reducing potash sales to their lowest level in more than 35 years. The reduction in global demand led the potash industry to operate at roughly 50 percent of capacity, with curtailments estimated at more than 25 million tonnes. PotashCorp produced at approximately 30 percent of operational capability. |
...A promising finish
With lower global yields occurring in many developing regions, crop prices were supportive. Major fertilizer buyers, including Brazil, India and the United States, began purchasing late in the year, showing early signs of demand returning to higher levels. While US fall applications were reduced by a late harvest and poor weather, buyers appeared motivated to address their nutrient needs.
While prices for all fertilizer products fell, potash margins appeared to withstand the economic downturn considerably better than nitrogen and phosphate. We believe this reflects the strong long-term fundamentals of the potash business and explains why our investments in capacity make sense.
Factors That Shaped Our Performance 5
Future
Returning to a climate of demand growth
The need for more food — and the nutrients to produce it — is undeniable. Although fertilizer demand can be deferred on a short-term basis, as we saw in 2009, replenishing nutrients in the soil remains an imperative for farmers as pressure to be profitable and to produce more on less land per capita continues to mount.
As a result, we anticipate demand for fertilizer, especially potash, will return and strengthen in the years to come. Although factors such as crop prices and the timing of buyer engagement could affect the short-term pace of the rebound, the long-term prospects for the industry — and for our company — remain excellent.
We therefore view 2010 as a transitional year from the aberration of 2009 to higher-growth conditions in 2011 and beyond.
Global potash shipments are expected to rise in 2010 as buyers respond to the immediate needs of farmers. Longer term, growing demand and the need to restock the global supply chain are expected to bring consumption back to the historical growth trend line.
6 2009 Summary Accountability Report
CEO letter
William J. Doyle, President and Chief Executive Officer
In November 2009, PotashCorp celebrated 20 years as a publicly traded company. Over those two decades, we witnessed significant changes around the world and had the opportunity to validate our strategies and core values in diverse operating environments.
Our experience proved invaluable in 2009, a year shaped by a significant global economic downturn. We faced an unprecedented decline in demand that had an impact on almost every aspect of our performance, but we recognized this as an anomaly rather than a change in the trends that have shaped our industry over several decades.
The simple truth is that a sustainable business must operate with this kind of long-term view, an approach that has been a hallmark of our company for more than two decades. Even in one of the most challenging environments in our history, we followed our proven strategies and maintained our focus.
We were steadfast in our commitment to matching our potash production to market demand, a decision that resulted in significantly lower sales volumes and production levels. At the same time, we continued to invest in our operational capabilities, confident that demand for our essential nutrients will eventually return to its well-established growth trends.
Those who follow our company will recognize that our actions in 2009 were consistent with our approach of the past 20 years and will make us stronger for decades to come. We made decisions that will improve security of supply for customers, create lasting opportunities for our employees and communities and, ultimately, generate greater returns for our shareholders.
CEO Letter 7
Focusing on the Future
In 2009, fertilizer distributors and farmers deferred their purchases and applications, choosing to work from inventories in their warehouses or soils. As a result, we had the lowest potash sales volumes in our history and prices for all products, especially those in our phosphate and nitrogen segments, fell sharply from 2008 levels.
Our 2009 earnings of $3.25 per share were much lower than the record $11.01 per share earned in 2008. While this was still the third-highest total in our history, it was a measure of the dramatic shift in market conditions.
The events of 2009 should not be viewed in isolation however.
A growing population continued to eat and farmers around the world planted and harvested crops. Nutrients were drawn from the soil and the distribution chain, creating a void that must be filled to protect future food production. As the year progressed, prices for crop commodities rebounded, encouraging farmers to return their focus to optimizing production.
High-yield agricultural practices, including appropriate fertilizer application, are expected to be an ongoing global priority. We believe more of our products will be needed to increase crop yields and improve food quality. Farmers must replenish nutrients in the soil and fertilizer buyers must restock distribution channels.
We expect farmers to increase their application programs in 2010, which will require distributors to purchase fertilizer — especially potash — to meet the immediate needs of their customers. This will begin the transition from the cautious climate of 2009 to more normal demand levels, likely in 2011, as distributors start to address the need to restock the supply chain. As this unfolds in the years ahead, the potash industry is expected to be challenged to meet the world’s needs.
Understanding that potash capacity takes years to develop, we continued to work on expansions in Saskatchewan and New Brunswick in 2009. These projects are part of a long-term capacity-building program we initiated in 2005. Including projects already completed and work that is continuing, we will invest more than CDN $7 billion, which is having a substantial economic impact in our communities and will continue to generate jobs in and around our facilities for years to come. Once fully ramped up in 2015, as anticipated and provided market conditions warrant, we expect to have nearly doubled our 2005 operational capability, giving us a greater ability to meet the needs of global customers.
Accountable to All Stakeholders
Our commitment to managing with a long-term view is shaped by goals that reflect our financial, social and environmental responsibilities. Our strength as a company grows out of our mutually beneficial relationships with customers, employees, communities and investors.
5 truths in 2009
| 1 | | Global food consumption continued to grow |
| |
| 2 | | Our long-term capacity expansions continued |
| |
| 3 | | We increased spending in our communities |
| |
| 4 | | We reduced our injury frequency rate |
| |
| 5 | | Our employee engagement levels remained high |
8 2009 Summary Accountability Report
“...our actions in 2009 were consistent with our approach of the past 20 years and will make us stronger for decades to come.” Bill Doyle, CEO
To ensure accountability, we set annual targets that reflect the interests of our stakeholders. We then measure our performance and report our results. Continuous improvement is a core value for our company and this system challenges us to improve every area of our operations.
Safety is our top priority. Of all our achievements in 2009, the most significant was a 46 percent reduction in our lost-time injury rate, which reflects the commitment of people across the company. Still, our work in this area is far from complete. Sadly, we experienced a fatality at our New Brunswick potash operation, which had earlier in the year been awarded the highest safety honor in the Canadian mining industry, the James T. Ryan Trophy, for its 2008 performance.
Our commitment to employees also includes creating opportunities that are challenging and rewarding. While this was more difficult during a year of reduced production, we redeployed a number of our people to support work on our expansions. This helped many develop new skills that will benefit them as individuals and our company as a whole.
Building Trust and Support
At the heart of our goals and targets is our commitment to earning the trust and support of our stakeholders.
The benefit of our commitment was demonstrated in 2009, when we were granted an extension to our permit at Aurora, enabling us to mine phosphate rock in North Carolina for more than 30 years. The approval process – the result of our extensive consultations with communities, environmental experts and government agencies – took almost a decade to complete.
Our history of environmental stewardship in the Aurora region helped us earn the trust and support of the community, which were essential to gaining the new permit. With our renewed license to operate, we can continue to serve and grow value for our stakeholders.
The ongoing support of our stakeholders is a credit to our Board of Directors, who demand accountability from our people, our senior management team and one another. Our board is a big reason why PotashCorp has been ranked as a leader in corporate governance.
We will never be content to rest on our laurels. We have tremendous assets, strong leadership and an exceptional team of people who pursue excellence as they carry out their responsibilities. We set high standards and we will be accountable to our stakeholders for our performance. The simple truth is that our stakeholders deserve this from us.
William J. Doyle, President and Chief Executive Officer
February 19, 2010
SETTING GOALS,
MEASURING PERFORMANCE,
BEING ACCOUNTABLE
Five operating goals drive the strategies of our company:
| 1 | | Maximize long-term shareholder value |
| |
| 2 | | Be the supplier of choice to the markets we serve |
| |
| 3 | | Build strong relationships with and improve the socioeconomic well-being of our communities |
| |
| 4 | | Attract and retain talented, motivated and productive employees who are committed to our long-term goals |
| |
| 5 | | Achieve no harm to people and no damage to the environment |
10 2009 Summary Accountability Report
1 GOAL
Maximize long-term
shareholder value
Dean Lothammer, Mine Training Coordinator at our Lanigan SK potash facility, monitors a conveyor belt
Maximize shareholder value 11
truthfinancial strength empowers us to serve all stakeholders
Why this goal matters
Our investors – the owners of our company – provide the capital for PotashCorp to operate. To earn their trust and maintain their support, we must deliver greater long-term value than our peers, through stock appreciation and dividends.
Meeting the expectations of investors is important to all stakeholders, as strong financial performance is a catalyst for creating additional jobs and investing in our communities. We recognize the links among our financial, social and environmental responsibilities with our achievements in each area driving increased potential in the others.
More than most businesses, a potash operation must be managed with a long-term view. With resources measured in centuries, operating plans that span decades and development projects mapped out many years in advance, building shareholder value is the result of patience, planning and commitment.
Our approach to meeting this goal
| • | | Enhance our competitive strengths by investing in the people and resources needed to meet our organizational goals. |
| |
| • | | Devise and execute strategies that generate future earnings growth and reduce volatility in earnings across all business segments. |
| |
| • | | Develop and implement governance practices that minimize risks, maximize management performance and ensure we operate with integrity and transparency. |
2009 Performance
TARGET
Exceed total shareholder return for our sector* and the DAXglobal Agribusiness Index.
DID NOT ACHIEVE¡
Our total shareholder return (TSR) of 48.7 percent was below the 76.5 percent return of our sector and the 60.9 percent of the DAXglobal Agribusiness Index.
Total shareholder return is the amount investors receive in capital gains and dividends. Measuring our performance against our peers shows we can devise and execute strategies that differentiate our company and help maximize shareholder value.
For two decades, we have matched our potash production to market demand. In 2009, however, the global decline in potash demand disproportionately affected our sales volumes compared to peers, which impacted TSR. While our strategy can adversely affect our results in a weak market, we believe it maximizes long-term shareholder value.
TARGET
Exceed cash flow return on investment for our sector*.
DID NOT ACHIEVE¡
Cash flow return (CFR) was 13.6%, below that of our sector.
See reconciliation and description of non-GAAP financial measures on Page 36.
We strive to maximize long-term shareholder value by investing our cash flow wisely. By comparing PotashCorp to our peer group, we demonstrate the long-term value of our investment decisions. Our company felt the impact of declining potash sales more than our peer group in 2009, which resulted in lower CFR.
TARGET
Remain in the top quartile of governance practices as measured by predetermined external reviews.
ACHIEVEDl
We ranked in the top quartile in all predetermined reviews.
Good governance is important in managing risk and building stakeholder trust. By measuring our governance practices against our peers, we encourage best practices and provide checks and balances that protect shareholders’ interests.
| | |
| * | | Sector: Weighted average (based on market capitalization) for Agrium, APC, CF Industries, ICL, Intrepid, K+S, Mosaic, SQM, Terra, Uralkali and Yara for most recent four fiscal quarters available. |
12 2009 Summary Accountability Report
Understanding our performance
With our goal of maximizing long-term shareholder value, we balance the current needs of customers with our desire to utilize our assets when they can deliver the greatest return. Our long-term strategies shape our decisions, even as we respond to near-term fluctuations in our operating environment.
Focusing on potash earnings growth
We follow a Potash First strategy, focusing on decisions that maximize our competitive advantages in this key crop nutrient. We do this by:
| • | | Expanding our existing capacity and infrastructure to capture a higher percentage of anticipated demand growth than competitors, doing so at a lower cost and more quickly than a greenfield mine; and |
| |
| • | | Investing in global potash companies – Arab Potash Company (APC), Israel Chemicals Ltd. (ICL), Sociedad Quimica y Minera de Chile (SQM) and Sinofert Holdings Limited (Sinofert) – to participate in and develop insights about growing offshore markets. |
Keywords: Our business, Potash
Maximize shareholder value 13
Growing our value through five-way potash leverage
Price appreciation + volume growth = higher gross margin potential
The combination of higher potential volumes – the result of our unique brownfield capabilities – and the higher realized prices brought on by tight supply/demand fundamentals could push our annual potash gross margin to more than $10 billion.
331%
Increase in market value* of offshore investments compared to our acquisition costs
* Share prices as at February 2, 2010
Source: PotashCorp
| 1 | | Price appreciation |
| |
| | | Demand growth puts pressure on existing global potash supply, lifting per-tonne prices. |
| |
| 2 | | Volume growth |
| |
| | | Our ability and commitment to add more brownfield potash capacity than competitors should allow us to capture a disproportionate share of new demand in the coming years. |
| |
| 3 | | Cost savings |
| |
| | | The operational capability we are adding carries little additional fixed costs so, as volumes increase, per-tonne fixed costs decrease. |
| |
| 4 | | Tax benefits |
| |
| | | Since only the first 5.7 million tonnes of our potash sold from Saskatchewan are subject to provincial mining taxes, our profitability increases as volumes increase. |
| |
| 5 | | Offshore investments |
| |
| | | As global potash markets develop and benefit our company, they should also improve the performance and value of the potash-related companies we have invested in, adding to our bottom line. |
One of two headframes being constructed for our new 2-million-tonne potash mine at New Brunswick
Keywords: Financial
14 2009 Summary Accountability Report
Focusing on strengths in each nutrient that grow earnings with reduced volatility
Our strategies within each nutrient segment use our competitive strengths to minimize volatility while maximizing margins:
Potash –As we execute our growth strategy, we continue to match our potash production to market demand, using our resources when they are needed by our customers and when we can capture the greatest value for our shareholders.
Phosphate –Our high-quality phosphate rock enables us to economically produce fertilizer, animal feed and industrial products. We use this flexibility to shift our production to the areas with greatest potential gross margin and least volatility.
Nitrogen –In Trinidad, our long-term, lower-cost natural gas contracts provide an advantage in serving the US – the world’s largest nitrogen importer. We focus our US production on industrial products, which historically have been less cyclical than nitrogen fertilizers.
Our strategies continued to deliver shareholder value even in a global economic crisis. While we ran our potash operations at approximately 30 percent of their operational capability, our cash flow return still exceeded our cost of capital by 350 basis points.
See reconciliation and description of non-GAAP financial measures on Page 36.
Keywords: Potash, Nitrogen, Phosphate
Maximize shareholder value 15
Developing governance policies and practices that reward performance and reduce risk
We approach governance as a joint effort between management and our Board of Directors to serve our stakeholders. Driven by respect for the people affected by our business, we strive to listen and to be accountable and transparent.
Responding to shareholder sentiment in 2009, we became one of the first companies in North America to voluntarily adopt “say on pay”, a practice designed to give shareholders an advisory voice on our approach to executive compensation. Along with our existing practice of providing shareholders with a binding vote on the annual performance options grant, “say on pay” illustrates our commitment to listening to the owners of our company.
PotashCorp received the Canadian Institute of Chartered Accountants 2009 Overall Award of Excellence for Corporate Reporting.
Our commitment to transparency was recognized by the CICA which noted that our “continued high standard of financial reporting clearly integrates vision and goals with performance expectations.”
PotashCorp draglines mining phosphate ore at our Aurora NC facility
16 2009 Summary Accountability Report
2 GOAL
Be the supplier of choice to the markets we serve
Be the supplier of choice 17
truthquality, service and reliability are key benefits to customers
Why this goal matters
We look for ways to build mutually beneficial relationships with customers, since their success leads to our success. While being price-competitive is important, we also focus on our strengths in service, product quality and capability to deliver, creating long-term advantages in areas that add value.
Our efforts to be the supplier of choice make us aware of the needs of our customers and the farmers they serve. This helps us to plan production levels, product mix and, on a longer-term basis, facility expansions and staffing levels.
Our approach to meeting this goal
| • | | Build our potash capability to meet long-term growth in global demand. |
| |
| • | | Listen and respond to our customers to understand their concerns and better serve their needs. |
| |
| • | | Establish standards for customer service and product quality that set us apart from our competitors. |
2009 Performance
TARGET
Outperform competitors on quality and service as measured by independent customer surveys.
ACHIEVED l
We outperformed competitors in both quality and overall customer service in all four product groups surveyed.
We strive to build competitive advantages in areas that influence purchasing decisions. Our scores and feedback confirm that our product quality (specifications, uniformity, ease of handling) and our customer service (sales contact, responsiveness, industry and product knowledge) consistently exceed those of our competitors and add value for our customers.
Performance vs Competitors
Source: 2009 PotashCorp North American Customer Surveys
18 2009 Summary Accountability Report
Our potash projects are expected to increase our capacity to 18 million tonnes, giving us an annual operational capability of more than 17 million tonnes when ramped up to a 95 percent operating rate.
Understanding our performance
Building our capabilities
Outside of competitive pricing, North American fertilizer, feed and industrial customers all list reliability of supply as their primary concern. Offshore buyers have demonstrated a long-term pattern of demand growth that is expected to challenge the ability of producers to meet their future needs.
To address this growing need, we maintain our focus on our long-term production capabilities. In 2009, we continued to invest in our potash capacity expansion program, which began in 2005 and is designed to roughly double our annual operational capability to more than 17 million tonnes by 2015. In phosphate, we completed construction on a new sulfuric acid plant at Aurora NC that will increase our production capabilities at that facility.
These projects will help us better meet the needs of our customers now and for years to come.
Be the supplier of choice 19
Upgrading transportation and distribution systems
In agriculture, timing is everything. To get customers the product they need when they need it, we have continued to upgrade our North American and international transportation and distribution systems. These investments improve efficiency and reduce loading and unloading times.
With 251 distribution points in North America — up from 203 in 2008 — our products are closer to our customers than ever before. Our ability to transport potash to offshore markets has also improved, as Canpotex Limited, the offshore marketing company for Saskatchewan potash producers, purchased additional railcars and continued to invest in port facilities designed to increase shipping capacity.
Sharing information to build partnerships
Even as demand declined dramatically in 2009, we worked to increase meaningful contact with fertilizer distributors and other customers who are also our business partners.
Through PCS Sales, our internal sales organization, we focused on providing information to help customers understand economic conditions and their long-term impacts on our industry. We extended our commitment to education and outreach, connecting with customers through personal contact, trade shows and online communication.
Among North American fertilizer customers, 96 percent said we maintained the right level of contact, up from 87 percent the previous year. We believe building relationships is important to our customers and gives us an edge in a competitive market.
The Need For Potash
| | | | | |
| | | | | Significantly |
| | | 2009 | → | Recommended |
| China | | 7.4mmt | → | 26.2mmt |
| India | | 5.2mmt | → | 10.5mmt |
| Brazil | | 5.1mmt | → | 11.5mmt |
While long-term growth in potash consumption has improved agricultural production in many countries, much more is needed to reach scientifically recommended application levels.
Source: IPNI, Fertecon, PotashCorp
More Food Requires More Fertilizer — Especially Potash
With global population rising and economies improving in developing nations, demand for high-quality food is increasing. Even with the economic downturn of 2009, global grain demand rose 2 percent.
To keep pace, farmers need to prepare soils to produce more high-quality food, including more fruits and vegetables, and protein from grain-intensive animal sources.
Potash historically has been under-applied in developing countries and farmers need to increase applications to improve yields. There is a considerable gap to be filled to reach scientifically recommended application ratios and bring crop yields up to their potential.
Keywords: Our business, Customers
20 2009 Summary Accountability Report
3 GOAL
Build strong relationships with and improve the socioeconomic well-being of our communities
Why this goal matters
Earning the support of people in the communities where we work and live is integral to our success. We draw upon our communities for talented employees, strong suppliers and business partners and, above all, for the right to operate our facilities.
Developing relationships helps us understand what matters to our neighbors and keeps our focus aligned with their expectations. These relationships also help our communities better understand our core values and operating practices, as well as the benefits our operations bring to the region.
When our neighbors recognize our commitment to being a responsible corporate citizen, they are inclined to become advocates for our company, enabling us to operate with confidence and invest in further growth and development.
PotashCorp HR Senior Director Lee Knafelc with Principal Darryl Bazylak at St. Mary Community School in Saskatoon SK, discussing our donation to fund a future community wellness centre
Build strong relationships with our communities 21
truthwe need the support of our communities
Our approach to meeting this goal
| • | | Provide support to organizations and events that are important to our communities. |
| |
| • | | Encourage employees to be actively engaged in our communities through volunteer efforts. |
| |
| • | | Support economic growth through job creation, local purchasing and taxes. |
| |
| • | | Conduct surveys to measure perceptions of our performance and identify opportunities for improvement. |
2009 Performance
| | | |
| |
TARGET
Invest up to 1 percent of after-tax earnings (on a five-year rolling average) in communities and other philanthropic programs.
PARTIALLY ACHIEVED £
Our annual philanthropic donations were 0.6 percent of the rolling five-year average of after-tax earnings. | | Our community donations were $7.3 million in 2009, above the $6.6 million in 2008 but short of our target, which was based on record earnings over the past five years. Given the dramatic shift in our operating environment, we balanced our commitment to corporate giving with the need for caution in all areas of corporate spending. |
| | | |
| |
TARGET
Achieve a 10 percent increase in employee participation in the matching gift program and a 10 percent increase in matching gift donations from 2008 levels.
ACHIEVED l
Employee participation and matching gift donations exceeded 2008 levels by 10 percent and 25 percent. | | Despite the challenging economic climate that affected both businesses and individuals, more of our employees participated in our matching gift program and their 2009 donations were well above our target of a 10 percent increase from 2008 levels. |
| | | |
| |
TARGET
Achieve 4 (performing well) out of 5 on community leaders’ surveys.
ACHIEVEDl
We scored 4 or better on all community surveys. | | In 2009 surveys, we earned overall ratings (on a 1-5 scale) of 4.3 at Aurora, 4.1 at Cincinnati and 4.0 at Joplin. As in previous surveys, respondents assessed our company on our social and environmental responsibility and the degree to which we have a positive impact on the community. |
| | | |
| |
TARGET
Achieve a local spending level of 60 percent on competitive terms, excluding purchases for major expansions, energy, transportation and raw materials.
ACHIEVEDl
Local spending was 62 percent, excluding purchases for major expansions, energy, transportation and raw materials. | | By supporting local businesses in the supply chain, PotashCorp benefits from proximity of supply, contributes to local economies and helps attract additional investment to the area. All these factors can contribute to improved support for our operations. Our Purchasing Policy requires managers to consider accessibility of supply and potential contribution to the local economy, in addition to price and quality, when making supplier choices. |
| |
Keywords: Communities
22 2009 Summary Accountability Report
Understanding our performance
Building community support requires open communication and a commitment to delivering on our promises. Our reputation in the community is enhanced, which minimizes risks as we pursue growth or face challenging conditions.
Investing in Our Communities
Sharing our success helps develop strong relationships in our communities. We look for opportunities to invest in events and organizations that reflect PotashCorp’s goals and values and improve the quality of life where we work and live.
With a target to donate up to 1 percent of after-tax earnings (on a five-year rolling average), our contributions increase as we improve long-term financial performance — giving the community a shared interest in our success.
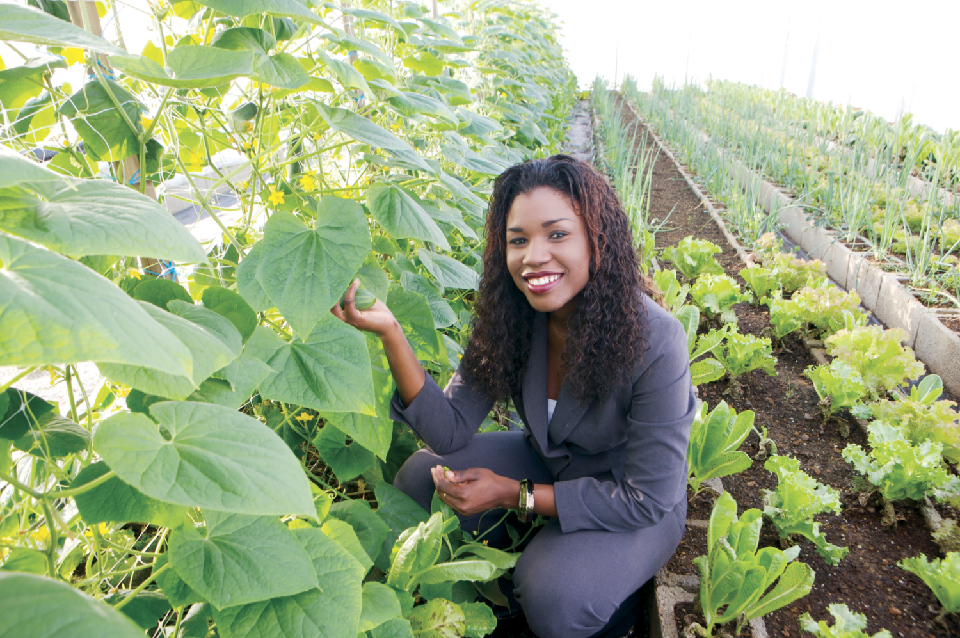
Some of our donation recipients in 2009 were the PCS Model Farm and Agricultural Resource Centre in Point Lisas, Trinidad, a multi-purpose fitness facility in Sussex, a wellness and education center in Saskatoon and a youth services center near our office in Northbrook.
Trinidad Model Farm
Dyan Nelson, Safety Health and Environment Specialist, admires some of the thriving vegetables growing at the 75-acre PCS Model Farm and Agricultural Resource Centre near our Trinidad nitrogen operation. The PotashCorp-funded education facility was created to help educate local residents about best practices in modern agriculture. Since it opened in February 2009, 250 farmers, students and agricultural professionals have visited. Training programs include farm economics, soil fertility and managing pests and diseases.
Build strong relationships with our communities 23
Building Networks of Support
With a workforce of more than 5,000 employees, we have ample opportunity to develop relationships with our communities, where employees serve as company ambassadors, volunteers and supporters.
To acknowledge their efforts, we match employee charitable donations up to $10,000 per person per year. This strengthens our relationship with employees and allows us to benefit from their assessment of what is important in our communities. Employees increased participation in and donations to the matching gift program in 2009, showing their sense of caring for their communities.
We also share our PotashCorp Matching Gift Toolkit with other businesses, providing step-by-step instructions on establishing similar programs. We believe this will help build relationships with other companies and encourage donations in our communities.
Contributing to Economic Development
Our company relies on local suppliers to provide timely access to materials and services. As we grow, these businesses and our communities benefit, with more jobs, more wealth and a larger potential tax base for local governments.
We strive to make 60 percent of our purchases — excluding major expansions, energy, transportation and raw materials — from local suppliers. In 2009, our total local spending was $606.7 million, 62 percent of the $978.5 million spent at our sites.
While spending on our major expansions is not included in this measure, the work underway in Saskatchewan and New Brunswick is also a significant driver of local economies (see sidebar).
Responding to Stakeholder Feedback
We engage our stakeholders throughout the year, formally and informally, to understand important issues and to develop a mutually beneficial relationship.
Our annual surveys gather insights and measure perceptions related to our business practices, community involvement and economic impact. This information helps us shape our future strategies and plans.
Recent feedback suggests that we need to better communicate our plans and our progress. In 2009, we produced our first “Report to the Community” to provide Saskatchewan residents with an overview of our activities and plans. Each of our facilities continues to look for additional ways to maintain active dialog with local communities.
$3.2 billion
New GDP in Saskatchewan from potash construction projects
According to an independent study, PotashCorp’s projects are expected to create CDN $3.2 billion in economic activity in Saskatchewan during construction and CDN $3.8 billion in new annual GDP when ramped up. This includes almost 15,000 direct and indirect jobs that will be sustained over the operating life of the mines.
24 2009 Summary Accountability Report
4 GOAL
Attract and retain talented, motivated and productive employees who are committed to our long-term goals
Why this goal matters
In a growing business, with some employees nearing retirement and competition for job applicants rising, the need to secure qualified personnel becomes ever more critical to meeting our company goals.
Retaining our talent is also key. By supporting and rewarding the people best able to meet the unique challenges of our business, we motivate employees to perform, preserve the continuity of our operations and reduce the costs associated with high turnover.
Shaft Supervisor Chris Hanson inspects the braking system on a potash ore hoisting system at our Lanigan SK mine
Attract/retain top talent 25
truthwe care about our people
Our approach to meeting this goal
| • | | Hire candidates who want to grow with the company. |
| |
| • | | Target key growth positions, looking for candidates with the skills and traits that are likely to result in long-term, productive employment. |
| |
| • | | Offer competitive compensation and benefits, including incentives that align employee performance and motivation with corporate goals. |
| |
| • | | Enable employees to move among departments and facilities to improve skills and maximize natural aptitudes and talents. |
| |
| • | | Fill most management positions internally. |
| |
| • | | Engage employees to learn how we can improve our culture and employee satisfaction. |
2009 Performance
| | | |
| |
TARGET
Achieve an average employee engagement score of at least 75 percent on the annual survey.
ACHIEVEDl
The average employee engagement score was 76 percent. | | Overall average score at the sites surveyed is up 10.9 percent since 2007, when they were last polled in the two-year rotation. Scores of our managers’ clarity of communication and feedback rose from 61 percent in 2007 to 65.9 percent in 2009.
In 2007, the lowest score — regarding the extent to which we help employees learn and grow in their jobs — was 49.6 percent. In 2009, we scored 65.5 percent, the result of company-wide initiatives that included efforts to improve bench skills for front-line supervisors. |
| | | |
| |
| | | We also developed universal core leadership competencies to bring consistency to training programs. |
| | | |
| |
TARGET
Fill at least 75 percent of senior staff openings with internal candidates.
ACHIEVEDl
We filled 89 percent of senior staff openings with internal candidates. | | Nearly 90 percent of senior staff openings in 2009 were filled with people promoted or transferred within the company (since 2006, we have averaged nearly 80 percent). We try to fill most positions internally because it motivates employees to succeed, broadens their knowledge base and provides continuity for our operations. |
| | | |
| |
| | | We also worked to improve our ability to identify and develop high-potential talent by enhancing our succession planning process. This included discussions with senior management on key talent, critical positions and development needs and opportunities. |
| | | |
| |
TARGET
Fill all staff-level job openings within an average of 30 days.
DID NOT ACHIEVE ¡
The average time required to fill staff-level job postings was 34 days. | | Measuring time to fill staff openings helps reveal the impact of our recruiting efforts and our desirability as an employer. It also allows us to monitor potential barriers to recruiting, such as geography or demographics, and to tailor our efforts accordingly. |
| |
Keywords: Employees
26 2009 Summary Accountability Report
Understanding our performance
Cultivating loyalty
Despite temporary potash layoffs in 2009 due to record-low production, we continued to invest in our people. We redeployed many workers to other operating areas or to our capital expansion projects, significantly minimizing turnover.
When it is necessary to make the difficult decision to reduce jobs (as it was in 2009 at White Springs, where we cut staff by 20 percent), we attempt to be direct, sensitive and helpful during the transition: our severance at White Springs included a cash payment equivalent to up to 52 weeks of pay, depending on job category and years of service, plus continuation of medical coverage and participation in incentive plans for the 2009 calendar year.
We strive to create a culture in which people feel they are valued as employees and as individuals, doing our best to retain our talent even in difficult times.
4.5%
Employee turnover in Canada was reduced from 7.8 percent in 2008, despite the need for production shutdowns and record temporary layoffs.
| | | | | |
 | |  | |  |
| |
Ann Lang, Engineer,
Technical Services Department, Aurora | | Stan Langley,
Training Coordinator, Rocanville | | Ken Tyll,
Plant Support Personnel, Lima |
Attract/retain top talent 27
Improving recruitment efforts and opportunities
Competition for top talent in the mining and resource sector is heavy, particularly in Western Canada where we have the greatest need to attract candidates as we expand our potash operations.
In recent years, we’ve enhanced our recruitment efforts to meet this challenge, stepping up our presence at career fairs and improving our Internet-based initiatives to target candidates in key employment categories.
We have also worked to raise awareness of unique opportunities for young recruits within our organization. For example, our Engineer-ln-Training (EIT) program — which was implemented in 2009 — enables recent graduates to cross-train at several facilities to build job skills.
Combined with competitive compensation and benefits, these efforts help us attract the talent we need now and in the future.
Travis McNally, 23
Established in mid-2009, PotashCorp’s Engineer-in-Training program gives recent graduates the opportunity to work at three potash facilities before being assigned to a specific location. The two-year program – created to address the growing challenge of hiring skilled young workers – has been a great experience for EIT Travis McNally. “I’ve already learned so much,” says the former PotashCorp Summer Student, who began as an EIT in July 2009. “By the time I’m finished, I’ll be much more well-rounded as an engineer.”
| | | | | |
 | |  | |  |
| |
Andre King, Production Foreman,
Mill Operations, Aurora | | Robert Hiss, Mechanical Integrity
Engineer, Lima | | Amber Grinstead, Buyer Coordinator,
White Springs |
28 2009 Summary Accountability Report
5 GOAL
Achieve no harm to people and no damage to the environment
Don Dahlgren, Senior Environmental Engineer, and his son Kyle walk through the 10-year-old reclamation project at White Springs FL
Achieve no harm to people/environment 29
truthwe protect our people and our planet
Why this goal matters
Our pursuit of excellent safety and environmental performance stems from our underlying respect for people and the planet. Protecting both is not only an organizational goal, it is one of our Core Values. Nothing we accomplish as a company is more important than returning our people home safely and preserving our planet for generations to come.
Recognizing that the long-term value of our company is in our people and our resources, we strive to create a culture that cares — one in which commitments to safety and the environment are taken seriously and, more important, personally.
Although acting responsibly has practical benefits — including lowering risk and operating costs — we pursue this primarily for one simple reason: it is the right thing to do.
Our approach to meeting this goal
| • | | Foster a culture of safety awareness and environmental responsibility that works proactively to reduce at-risk behaviors and hazards, enhance efficiency and minimize the impact of our operations on the environment. |
| • | | Measure the frequency and severity of workplace injuries to ensure accountability in our safety program. |
| • | | Closely monitor the environmental impact of our operations, making improvements to equipment and processes to reduce our environmental footprint. |
| |
| • | | Align executive and employee compensation with corporate goals by embedding safety and environmental performance metrics prominently in bonus programs. |
2009 Safety Performance
| | | |
| |
TARGET
Reduce total site* severity injury frequency rate** by 25 percent from 2008 levels by the end of 2011.
ACHIEVEDl
We met our three-year target in 2009, achieving a 25 percent reduction from 2008. | | Through increased training, heightened awareness and the vigilant application of our peer-based observation system (the Behavioral Accident Prevention Process, or BAPP™), we reached this three-year target in a single year. We responded by setting a new three-year target for 2010 with a further 10 percent reduction by the end of 2012. |
| | | |
| |
TARGET
Achieve zero life-altering injuries at our sites.*
DID NOT ACHIEVE ¡
There was a fatality at one of our potash facilities in 2009. | | Sadly, we did not reach this goal. We had a fatality at our New Brunswick facility in November when an underground pipefitter was struck by a pipe during installation. We responded by rigorously re-evaluating the safety commitment of all managers, supervisors, employees and contractors. We also continue to focus on training, particularly regarding performing tasks safely and consistently. |
| |
| | |
| * | | Total site includes PotashCorp employees, contract employees and all others on site. |
| |
| ** | | Severity injury frequency rate is the total of lost-time injuries and modified work injuries for every 200,000 hours worked. |
Keywords: Safety, Environment
30 2009 Summary Accountability Report
Understanding our performance
We strive to establish formal, meaningful, measurable safety and environmental targets, to monitor our performance against those targets and to identify and immediately address areas where we can improve our performance.
By focusing on important measures such as greenhouse gas emissions and releases, spills and excursions, we reduce operational risk while building goodwill among stakeholders and enhancing our reputation.
2009 Safety Performance Highlights
| • | | Established new record lows for PotashCorp in recordable and lost-time injury (LTI) rates. A 41 percent reduction in the LTI rate was achieved company-wide, along with a 27 percent decline in the Occupational Safety and Health Administration (OSHA) recordable rate. |
| |
| • | | Set new records in LTI and OSHA recordable rates in our phosphate division. Our increasing emphasis on contractor safety performance also yielded success. Total site recordable and LTI injury rates were down 20 percent and 37 percent, respectively, from 2008. |
| |
| • | | Achieved 8 million safe work hours at our Trinidad nitrogen facility, and 5 years without a lost-time injury at our Patience Lake potash facility and our Weeping Water phosphate feed plant. |
| |
| • | | Continued to seek ways to proactively assess program weaknesses, align tactics with corporate goals and share best practices within the company under the guidance of the Senior Safety Leadership Team. |
| |
| • | | Added a new position — Manager, Preparedness & Response — to support sites in our emergency response efforts. The improvements in this area helped our Trinidad emergency response crew successfully control a difficult hydrogen fire early in 2009. |
41%
Year-over-year reduction in lost-time injury rate
27%
Decline in OSHA recordable rate
Aurora Mining Permit Extension
Thanks in large part to a strong record of environmental stewardship, in 2009 we were granted an extension of more than 30 years to our mining permit at our phosphate operations near Aurora.
The permit requires PotashCorp to add two new acres of wetlands for every one impacted by mining, and to reclaim all land once mining is complete.
Our demonstrated commitment to the environment – illustrated by mitigation and reclamation successes in Whitehurst Creek and Parker Farm, among many other initiatives – contributed significantly to our ability to secure this permit and to continue operations far into the future.
Achieve no harm to people/environment 31
2009 Environmental Performance
| | | |
| |
TARGET
Reduce company-wide greenhouse gas emissions per tonne of product by 10 percent by the end of 2012, compared to 2007. | | While monitors establish an emission baseline at these two nitrogen facilities, we are evaluating the installation of GHG controls there. Further efforts to reduce greenhouse gases await clarification of legislation in the US, where much of our GHG emissions occur. |
| | | |
ACHIEVEDl
On schedule. We have installed greenhouse gas (GHG) monitoring equipment at two of our nitrogen facilities, and have plans in place to meet our 2012 target. | | |
| | | |
| |
TARGET
Reduce total reportable releases, permit excursions and spills by 15 percent from 2008 levels.
DID NOT ACHIEVE ¡
Total reportable releases, permit excursions and spills were 16 percent higher than in 2008. | | In the US, the number of Reportable Quantity Releases was down by 14 percent, but permit violations increased in number from four to seven — primarily as a result of excursions at Cincinnati that were quickly corrected through installation of new equipment. We had more spills in our potash division, mostly saltwater spills associated with disposal of water inflow at New Brunswick that was corrected through construction of a new pipeline. |
| |
Our award-winning Whitehurst Creek project has reclaimed large areas of North Carolina wetlands
32 2009 Summary Accountability Report
Board of Directors
| | | | | |
Top (L to R)
Christopher M. BurleyA,D
Calgary AB
Corporate Director and former Managing Director and Vice Chairman, Energy of
Merrill Lynch Canada Inc.
Elena Viyella de PalizaC
Dominican Republic
President of Inter-Quimica, S.A.,
Monte Rio Power Corp and
Indescorp, S.A.
William J. Doyle
Winnetka IL
President and CEO of PotashCorp
Keith G. MartellB,D
Saskatoon SK
Chairman and Chief Executive Officer
of First Nations Bank of Canada | | C. Steven HoffmanC,D
Lincolnshire IL
Former senior executive
of IMC Global Inc.
Alice D. LabergeA,D
Vancouver BC
Corporate Director and former President
and CEO of Fincentric Corporation
Bottom (L to R)
Jeffrey J. McCaigB,D
Calgary AB
Chairman and CEO of
Trimac Group of Companies
Mary MogfordA,B
Newcastle ON
Corporate Director and former
Ontario Deputy Minister of Finance
and of Natural Resources | | John W. EsteyB,C
Glenview IL
President and CEO of
S&C Electric Company
Dallas J. Howe (Chair)A
Calgary AB
Owner and CEO of DSTC Ltd.
E. Robert Stromberg, QCC
Jackfish Lake SK
Formerly associated with the law firm
Robertson Stromberg Pedersen
Paul J. SchoenhalsB,C
Calgary AB
Retired President and CEO of Enform and
Chairman of the PCS Crown Corporation from 1987 to 1989 |
Committees: ACorporate Governance and Nominating BCompensation CSafety, Health and Environment DAudit
Keywords: Board bios
33 2009 Summary Accountability Report
Senior Management
| | | | | |
Top (L to R)
Robert A. Jaspar
Senior Vice President
Information Technology
Barbara Jane Irwin
Senior Vice President
Administration
William J. Doyle
President and
Chief Executive Officer
Daphne J. Arnason
Vice President
Internal Audit
Garth W. Moore
President
PCS Potash | | John R. Hunt
Vice President
Safety, Health and Environment
Stephen F. Dowdle
Senior Vice President
Fertilizer Sales, PCS Sales
Bottom (L to R)
G. David Delaney
President
PCS Sales
Joseph A. Podwika
Senior Vice President
General Counsel and Secretary
Wayne R. Brownlee
Executive Vice President
and Chief Financial Officer | | Karen G. Chasez
Vice President
Procurement
Thomas J. Regan, Jr.
President
PCS Phosphate and PCS Nitrogen
Denis A. Sirois
Vice President
and Corporate Controller
James F. Dietz
Executive Vice President
and Chief Operating Officer
Denita C. Stann
Senior Director
Investor Relations |
Keywords: Mgmt bios
34 2009 Summary Accountability Report
Shareholder Information
Annual Meeting
The Annual Shareholders Meeting will be held at 10:30 a.m. Central Standard Time May 6, 2010 in the Grand Salon, TCU Place, 35 — 22nd Street East, Saskatoon, Saskatchewan.
It will be carried live on the company’s website, www.potashcorp.com.
Holders of common shares as of March 11, 2010 are entitled to vote at the meeting and are encouraged to participate.
Dividends
Dividend amounts paid to shareholders resident in Canada are adjusted by the exchange rate applicable on the dividend record date. Dividends are normally paid in February, May, August and November, with record dates normally set approximately three weeks earlier. Future cash dividends will be paid out of, and are conditioned upon, the company’s available earnings. Shareholders who wish to have their dividends deposited directly to their bank accounts should contact the transfer agent and registrar, CIBC Mellon Trust Company.
Registered shareholders can have dividends reinvested in newly issued common shares of PotashCorp at prevailing market rates.
Information for Shareholders Outside Canada
Dividends paid to residents in countries with which Canada has bilateral tax treaties are generally subject to the 15 percent Canadian non-resident withholding tax. Shareholders in the United States who have not filed a W-9 are also subject to the backup withholding tax (currently 28 percent). There is no Canadian tax on gains from the sale of shares (assuming ownership of less than 25 percent) or debt instruments of the company owned by non-residents not carrying on business in Canada. No government in Canada levies estate taxes or succession duties.
Investor Inquiries
Denita Stann, Senior Director, Investor Relations
Canada: (800) 667-0403 US: (800) 667-3930
email: ir@potashcorp.com
Visit us at www.potashcorp.com
Corporate Offices
| | | |
Canada: | | US: |
| Suite 500, 122 — 1st Ave S | | Suite 400, 1101 Skokie Blvd |
| Saskatoon SK S7K 7G3 | | Northbrook IL 60062 |
| Phone: (306) 933-8500 | | Phone: (847) 849-4200 |
2009 Summary Accountability Report 35
Common Share Transfer Agent
CIBC Mellon Trust Company
P.O. Box 7010
Adelaide Street Postal Station
Toronto ON M5C 2W9
Phone: (416) 643-5500 (800) 387-0825
inquiries@cibcmellon.com www.cibcmellon.com
BNY Mellon Shareholder Services
480 Washington Blvd — 27th floor
Jersey City NJ 07310
Shareholders with address changes or inquiries concerning their Potash Corporation of Saskatchewan Inc. stock are invited to contact CIBC Mellon Trust (address above), or Joseph A. Podwika, Corporate Secretary, PotashCorp (Canadian address on previous page).
Ownership
On February 19, 2010, there were 1,733 holders of record of the company’s common shares.
Shares Listed
Toronto Stock Exchange
New York Stock Exchange
Ticker Symbol: POT
Financial Reports and News Releases
Annual reports, interim reports and news releases are available on our website or by contacting the Investor Relations department.
NYSE Corporate Governance
Disclosure contemplated by 303A.11 of the NYSE’s listed company manual is available on our website at www.potashcorp.com. The company has filed annual written affirmations/certifications pursuant to the NYSE listing company manual. The certifications required by Section 302 of the Sarbanes-Oxley Act of 2002 are filed as exhibits to our 2009 Annual Report on Form 10-K.
Fahmy Bekhit, Senior Accounting Clerk, Saskatoon
Sharla Guinan, Senior HR Specialist, Saskatoon
Keywords: Shareholder info
36 2009 Summary Accountability Report
Forward-Looking Statements
This 2009 Summary Accountability Report contains forward-looking statements. These statements can be identified by expressions of belief, expectation or intention, as well as those statements that are not historical fact. These statements are based on certain factors and assumptions as set forth in this 2009 Summary Accountability Report, including foreign exchange rates, expected growth, results of operations, performance, business prospects and opportunities, and effective income tax rates. While the company considers these factors and assumptions to be reasonable based on information currently available, they may prove to be incorrect. Several factors could cause actual results to differ materially from those in the forward-looking statements, including, but not limited to: fluctuations in supply and demand in fertilizer, sulfur, transportation and petrochemical markets; changes in competitive pressures, including pricing pressures; the recent global financial crisis and conditions and changes in credit markets; the results of sales contract negotiations with China and India; timing and amount of capital expenditures; risks associated with natural gas and other hedging activities; changes in capital markets and corresponding effects on the company’s investments; changes in currency and exchange rates; unexpected geological or environmental conditions, including water inflow; strikes or other forms of work stoppage or slowdowns; changes in, and the effects of, government policy and regulations; and earnings, exchange rates and the decisions of taxing authorities, all of which could affect our effective tax rates. Additional risks and uncertainties can be found in our Form 10-K for the fiscal year ended December 31, 2009 under the captions “Forward-Looking Statements” and “Item 1A- Risk Factors” and in our filings with the US Securities and Exchange Commission and the Canadian provincial securities commissions. Forward-looking statements are given only as at the date of this report and the company disclaims any obligation to update or revise the forward-looking statements, whether as a result of new information, future events or otherwise, except as required by law.
Market and Industry Data Statement
Some of the market and industry data contained in this Summary Accountability Report are based on internal surveys, market research, independent industry publications or other publicly available information. Although we believe that the independent sources used by us are reliable, we have not independently verified and cannot guarantee the accuracy or completeness of this information. Similarly, we believe our internal research is reliable, but such research has not been verified by any independent sources.
Information in the preparation of this Summary Accountability Report is based on statistical data and other material available at February 19, 2010.
Sources, Abbreviations and Terms
| | | |
| APC | | Arab Potash Company Ltd. (Amman: ARPT), Jordan |
| Canpotex | | Canpotex Limited, Canada |
| Fertecon | | Fertecon Limited and Fertecon Research Centre Limited, UK |
| ICL | | Israel Chemicals Ltd. (Tel Aviv: ICL), Israel |
| IPNI | | International Plant Nutrition Institute, USA |
| MT | | Metric Tonne |
| MMT | | Million Tonnes |
| NYSE | | New York Stock Exchange, USA |
| Sinofert | | Sinofert Holdings Limited (HKSE, 0297.HK), China |
| SQM | | Sociedad Quimica y Minera de Chile S.A. (Santiago Bolsa de Comercio Exchange, NYSE: SQM), Chile |
| | |
| * Footnote to Reconciliation | | |
| |
| PotashCorp uses cash flow and cash flow return as supplemental measures to evaluate the performance of the company’s assets in terms of the cash flow they have generated. Calculated on the total cost basis of the company’s assets rather than on the depreciated value, these measures reflect cash returned on the total investment outlay. The company believes these measures are one of the best predictors of shareholder value. As such, management believes this information to be useful to investors. |
Reconciliation for Cash Flow Return*
| | | | | | | | | | | | | | | | | | | | | |
| (in millions of US dollars) | | 2009 | | | 2008 | | | 2007 | | | 2006 | | | 2005 | |
| |
| Net income | | | 987.8 | | | | 3,495.2 | | | | 1,103.6 | | | | 631.8 | | | | 542.9 | |
| Income taxes | | | 83.5 | | | | 1,077.1 | | | | 416.2 | | | | 158.1 | | | | 267.4 | |
| Change in unrealized (gain) loss on derivatives included in net income | | | (56.4 | ) | | | 68.8 | | | | (16.9 | ) | | | — | | | | — | |
| Interest expense | | | 120.9 | | | | 62.8 | | | | 68.7 | | | | 85.6 | | | | 82.3 | |
| Current income taxes | | | 119.7 | | | | (994.9 | ) | | | (296.6 | ) | | | (108.1 | ) | | | (227.3 | ) |
| Depreciation and amortization | | | 312.1 | | | | 327.5 | | | | 291.3 | | | | 242.4 | | | | 242.4 | |
| |
| Cash flow | | | 1,567.6 | | | | 4,036.5 | | | | 1,566.3 | | | | 1,009.8 | | | | 907.7 | |
| |
| Total assets | | | 12,922.2 | | | | 10,248.8 | | | | 9,716.6 | | | | 6,217.0 | | | | 5,357.9 | |
| Cash and cash equivalents | | | (385.4 | ) | | | (276.8 | ) | | | (719.5 | ) | | | (325.7 | ) | | | (93.9 | ) |
| Fair value of derivative assets | | | (9.0 | ) | | | (17.9 | ) | | | (135.0 | ) | | | — | | | | — | |
| Accumulated depreciation of property, plant and equipment | | | 2,711.7 | | | | 2,526.6 | | | | 2,280.7 | | | | 2,073.8 | | | | 1,927.7 | |
| Net unrealized gains on available-for-sale securities | | | (1,900.8 | ) | | | (885.7 | ) | | | (2,284.1 | ) | | | — | | | | — | |
| Accumulated amortization of other assets and intangible assets | | | 50.0 | | | | 73.4 | | | | 59.0 | | | | 72.6 | | | | 66.4 | |
| Accumulated amortization of goodwill | | | 7.3 | | | | 7.3 | | | | 7.3 | | | | 7.3 | | | | 7.3 | |
| Payables and accrued charges | | | (779.3 | ) | | | (1,183.6 | ) | | | (911.5 | ) | | | (545.2 | ) | | | (842.7 | ) |
| |
| Adjusted assets | | | 12,616.7 | | | | 10,492.1 | | | | 8,013.5 | | | | 7,499.8 | | | | 6,422.7 | |
| |
| Average adjusted assets | | | 11,554.4 | | | | 9,252.8 | | | | 7,756.7 | | | | 6,961.3 | | | | 6,159.0 | |
| |
| Cash flow return | | | 13.6 | % | | | 43.6 | % | | | 20.2 | % | | | 14.5 | % | | | 14.7 | % |
| |
truth
our accountability doesn’t end here
While our 2009 Summary Accountability Report offers a review of our goals, strategies and performance, it is only a snapshot of our long-term approach.
At PotashCorp, accountability is an ongoing process that has shaped our performance over the past two decades and will drive our success as we move forward.
We will continue to set challenging targets and report on our progress, using our financial strength to build a stronger company for all our stakeholders.
truth
there’s more online
PotashCorp2009AR.com